Disrupted Functional Brain Connectivity in Partial Epilepsy: A Resting-State fMRI Study Cheng Luo 1 , Chuan Qiu 1 , Zhiwei Guo 1 , Jiajia Fang 2 , Qifu Li 2,3 , Xu Lei 1,4 , Yang Xia 1 , Yongxiu Lai 1 , Qiyong Gong 5 , Dong Zhou 2 *, Dezhong Yao 1 * 1 Key Laboratory for NeuroInformation of Ministry of Education, School of Life Science and Technology, University of Electronic Science and Technology of China, Chengdu, China, 2 Department of Neurology, West China Hospital of Sichuan University, Chengdu, China, 3 Department of Neurology, The Affiliated Hospital of Hainan Medical College, Haikou, China, 4 Key Laboratory of Cognition and Personality, Ministry of Education, School of Psychology, Southwest University, Chongqing, China, 5 Department of Radiology, Huaxi MR Research Center (HMRRC), West China Hospital of Sichuan University, Chengdu, China Abstract Examining the spontaneous activity to understand the neural mechanism of brain disorder is a focus in recent resting-state fMRI. In the current study, to investigate the alteration of brain functional connectivity in partial epilepsy in a systematical way, two levels of analyses (functional connectivity analysis within resting state networks (RSNs) and functional network connectivity (FNC) analysis) were carried out on resting-state fMRI data acquired from the 30 participants including 14 healthy controls(HC) and 16 partial epilepsy patients. According to the etiology, all patients are subdivided into temporal lobe epilepsy group (TLE, included 7 patients) and mixed partial epilepsy group (MPE, 9 patients). Using group independent component analysis, eight RSNs were identified, and selected to evaluate functional connectivity and FNC between groups. Compared with the controls, decreased functional connectivity within all RSNs was found in both TLE and MPE. However, dissociating patterns were observed within the 8 RSNs between two patient groups, i.e, compared with TLE, we found decreased functional connectivity in 5 RSNs increased functional connectivity in 1 RSN, and no difference in the other 2 RSNs in MPE. Furthermore, the hierarchical disconnections of FNC was found in two patient groups, in which the intra- system connections were preserved for all three subsystems while the lost connections were confined to intersystem connections in patients with partial epilepsy. These findings may suggest that decreased resting state functional connectivity and disconnection of FNC are two remarkable characteristics of partial epilepsy. The selective impairment of FNC implicated that it is unsuitable to understand the partial epilepsy only from global or local perspective. We presumed that studying epilepsy in the multi-perspective based on RSNs may be a valuable means to assess the functional changes corresponding to specific RSN and may contribute to the understanding of the neuro-pathophysiological mechanism of epilepsy. Citation: Luo C, Qiu C, Guo Z, Fang J, Li Q, et al. (2012) Disrupted Functional Brain Connectivity in Partial Epilepsy: A Resting-State fMRI Study. PLoS ONE 7(1): e28196. doi:10.1371/journal.pone.0028196 Editor: Olaf Sporns, Indiana University, United States of America Received January 23, 2011; Accepted November 3, 2011; Published January 5, 2012 Copyright: ß 2012 Luo et al. This is an open-access article distributed under the terms of the Creative Commons Attribution License, which permits unrestricted use, distribution, and reproduction in any medium, provided the original author and source are credited. Funding: This project was funded by grants from the 973 project 2011CB707803, the National Nature Science Foundation of China #30870655, #81071222, #60736029, #81160166, #81100974, the 863 Project #2009AA02Z301, the PCSIRT project, the project of Hainan Provincial Department of Health (Qiongwei 2009-52). The funders had no role in study design, data collection and analysis, decision to publish, or preparation of the manuscript. Competing Interests: The authors have declared that no competing interests exist. * E-mail: [email protected] (DY); [email protected] (DZ) Introduction Epilepsy is a brain disorder characterized predominantly by recurrent and unpredictable interruption of normal function, and affects a variety of mental and physical functions [1-3]. There are many different types of epileptic seizures, and a patient may suffer one or several of them. The intention of seizures’ classification implicates etiology, approaches to diagnostic evaluation, treatment and prognosis. The division, which epileptic seizures fall into two broad categories: generalized seizures (GS) and partial seizures (PS) [4] depends on which part of the brain is affected by initial activation, was widely used in clinic. Scalp electroencephalogram (EEG) was used in the context of epileptic disorder soon after it was discovered. But its low spatial resolution precludes the acquisition of detailed localization information. Functional magnetic resonance imaging (fMRI) which measures local hemodynamical changes, provide a powerful technique to localize the brain regions during an experimental condition noninvasively. Applications of fMRI to epilepsy have received considerable attention [5–7]. Especially, the combining fMRI with EEG was widely used to detect abnormal epileptic activations in the brain [8–10]. The spontaneous low frequency BOLD fluctuation, derived from resting-state fMRI data has received increasing interest [11]. In contrast to task-driven approach, the resting-state scans is relatively simple and easy to execute, and it is important for patients with cognitive dysfunction or physical impairment, who was not capable of performing tasks accurately [12,13]. The spontaneous neuronal interaction were first investigated in motor cortices[14] and then extended to other cortical systems comprising visual and auditory networks, default mode network(DMN), attention and memory related regions [11,13,15–19]. These spatially segregated brain regions that exhibit spontaneous low frequency fluctuations were defined as ‘resting-state networks’ (RSN), and it implicated that the RSN may represent some underlying or intrinsic forms of brain functional connectivity in discrete neuroanatomical systems [11]. Up to now, it has been suggested that at least 10 to 12 PLoS ONE | www.plosone.org 1 January 2012 | Volume 7 | Issue 1 | e28196

Welcome message from author
This document is posted to help you gain knowledge. Please leave a comment to let me know what you think about it! Share it to your friends and learn new things together.
Transcript
Disrupted Functional Brain Connectivity in PartialEpilepsy: A Resting-State fMRI StudyCheng Luo1, Chuan Qiu1, Zhiwei Guo1, Jiajia Fang2, Qifu Li2,3, Xu Lei1,4, Yang Xia1, Yongxiu Lai1, Qiyong
Gong5, Dong Zhou2*, Dezhong Yao1*
1 Key Laboratory for NeuroInformation of Ministry of Education, School of Life Science and Technology, University of Electronic Science and Technology of China,
Chengdu, China, 2 Department of Neurology, West China Hospital of Sichuan University, Chengdu, China, 3 Department of Neurology, The Affiliated Hospital of Hainan
Medical College, Haikou, China, 4 Key Laboratory of Cognition and Personality, Ministry of Education, School of Psychology, Southwest University, Chongqing, China,
5 Department of Radiology, Huaxi MR Research Center (HMRRC), West China Hospital of Sichuan University, Chengdu, China
Abstract
Examining the spontaneous activity to understand the neural mechanism of brain disorder is a focus in recent resting-statefMRI. In the current study, to investigate the alteration of brain functional connectivity in partial epilepsy in a systematicalway, two levels of analyses (functional connectivity analysis within resting state networks (RSNs) and functional networkconnectivity (FNC) analysis) were carried out on resting-state fMRI data acquired from the 30 participants including 14healthy controls(HC) and 16 partial epilepsy patients. According to the etiology, all patients are subdivided into temporallobe epilepsy group (TLE, included 7 patients) and mixed partial epilepsy group (MPE, 9 patients). Using group independentcomponent analysis, eight RSNs were identified, and selected to evaluate functional connectivity and FNC between groups.Compared with the controls, decreased functional connectivity within all RSNs was found in both TLE and MPE. However,dissociating patterns were observed within the 8 RSNs between two patient groups, i.e, compared with TLE, we founddecreased functional connectivity in 5 RSNs increased functional connectivity in 1 RSN, and no difference in the other 2RSNs in MPE. Furthermore, the hierarchical disconnections of FNC was found in two patient groups, in which the intra-system connections were preserved for all three subsystems while the lost connections were confined to intersystemconnections in patients with partial epilepsy. These findings may suggest that decreased resting state functionalconnectivity and disconnection of FNC are two remarkable characteristics of partial epilepsy. The selective impairment ofFNC implicated that it is unsuitable to understand the partial epilepsy only from global or local perspective. We presumedthat studying epilepsy in the multi-perspective based on RSNs may be a valuable means to assess the functional changescorresponding to specific RSN and may contribute to the understanding of the neuro-pathophysiological mechanism ofepilepsy.
Citation: Luo C, Qiu C, Guo Z, Fang J, Li Q, et al. (2012) Disrupted Functional Brain Connectivity in Partial Epilepsy: A Resting-State fMRI Study. PLoS ONE 7(1):e28196. doi:10.1371/journal.pone.0028196
Editor: Olaf Sporns, Indiana University, United States of America
Received January 23, 2011; Accepted November 3, 2011; Published January 5, 2012
Copyright: � 2012 Luo et al. This is an open-access article distributed under the terms of the Creative Commons Attribution License, which permits unrestricteduse, distribution, and reproduction in any medium, provided the original author and source are credited.
Funding: This project was funded by grants from the 973 project 2011CB707803, the National Nature Science Foundation of China #30870655, #81071222,#60736029, #81160166, #81100974, the 863 Project #2009AA02Z301, the PCSIRT project, the project of Hainan Provincial Department of Health (Qiongwei2009-52). The funders had no role in study design, data collection and analysis, decision to publish, or preparation of the manuscript.
Competing Interests: The authors have declared that no competing interests exist.
* E-mail: [email protected] (DY); [email protected] (DZ)
Introduction
Epilepsy is a brain disorder characterized predominantly by
recurrent and unpredictable interruption of normal function, and
affects a variety of mental and physical functions [1-3]. There are
many different types of epileptic seizures, and a patient may suffer
one or several of them. The intention of seizures’ classification
implicates etiology, approaches to diagnostic evaluation, treatment
and prognosis. The division, which epileptic seizures fall into two
broad categories: generalized seizures (GS) and partial seizures
(PS) [4] depends on which part of the brain is affected by initial
activation, was widely used in clinic. Scalp electroencephalogram
(EEG) was used in the context of epileptic disorder soon after it was
discovered. But its low spatial resolution precludes the acquisition of
detailed localization information. Functional magnetic resonance
imaging (fMRI) which measures local hemodynamical changes,
provide a powerful technique to localize the brain regions during an
experimental condition noninvasively. Applications of fMRI to
epilepsy have received considerable attention [5–7]. Especially, the
combining fMRI with EEG was widely used to detect abnormal
epileptic activations in the brain [8–10].
The spontaneous low frequency BOLD fluctuation, derived
from resting-state fMRI data has received increasing interest [11].
In contrast to task-driven approach, the resting-state scans is
relatively simple and easy to execute, and it is important for
patients with cognitive dysfunction or physical impairment, who
was not capable of performing tasks accurately [12,13]. The
spontaneous neuronal interaction were first investigated in motor
cortices[14] and then extended to other cortical systems comprising
visual and auditory networks, default mode network(DMN),
attention and memory related regions [11,13,15–19]. These spatially
segregated brain regions that exhibit spontaneous low frequency
fluctuations were defined as ‘resting-state networks’ (RSN), and it
implicated that the RSN may represent some underlying or intrinsic
forms of brain functional connectivity in discrete neuroanatomical
systems [11]. Up to now, it has been suggested that at least 10 to 12
PLoS ONE | www.plosone.org 1 January 2012 | Volume 7 | Issue 1 | e28196
RSNs can be detected from the brain cortex in resting-state fMRI.
As a popular data analysis method of resting-state fMRI, functional
connectivity evaluating temporal correlations between spatially
discrete brain regions has been studied increasingly in healthy
individuals [11,14–16] as well as in patients with brain disorders
[20–24].
In previous studies focused on epilepsy, the pioneer work
reported the disturbance of language network in temporal lobe
epilepsy (TLE) [7]. Subsequently, many works have implicated ab-
normalities in perceptual networks (visual, auditory and sensorimo-
tor network) [25], DMN [26–28] and dorsal attention network
(DAN) [29] in TLE. Additionally, in our previous studies, we found
the abnormalities of DMN and basal ganglia network in patients
with idiopathic generalized epilepsy [30,31]. However, these studies
were all focused on single functional network, such as DMN,
perceptual network, few study investigated the interaction between
the RSNs in epilepsy, which was possible means to understand
globally the neuro-pathophysiological mechanism of epilepsy.
Recently, the dysfunctional connectivity among multiple brain
regions is considered as a central feature, and the International
League Against Epilepsy Commission on Classification and Ter-
minology uses the terminology ’distributed networks’ to descript
the epilepsy [32]. The abnormal functional connectivity within
RSNs or between them may be a feature of epilepsy from resting-
state fMRI.
An extension of functional connectivity, called functional
network connectivity (FNC), was developed [33]. FNC is powerful
to characterize distributed changes in the brain by examining the
interactions among different RSNs. Jafri and his colleagues
conducted FNC analysis in schizophrenia, and found significant
differences between patients and controls reflecting deficiencies in
cortical processing in patients [33]. In the present study, 16 partial
epilepsy patients were recruited to explore the functional connec-
tivity within RSNs and between. RSNs were isolated using group
ICA; then functional connectivity and FNC analysis were
conducted in TLE group (7 patients) and mixed partial epilepsy
group (MPE, 9 patients) to address the following questions: What is
the influence of the TLE imposed on the functional connectivity of
each RSNs and the FNC between RSNs? Is the influences identified
in 1) existed universally in various partial epilepsy?
Results
Identifications of the RSNs for HC and TLEAfter removing components which showed obviously artifactual
patterns or ventricle regions, eight components (RSN1–RSN8)
were selected for further analyses. The spatial maps of the eight
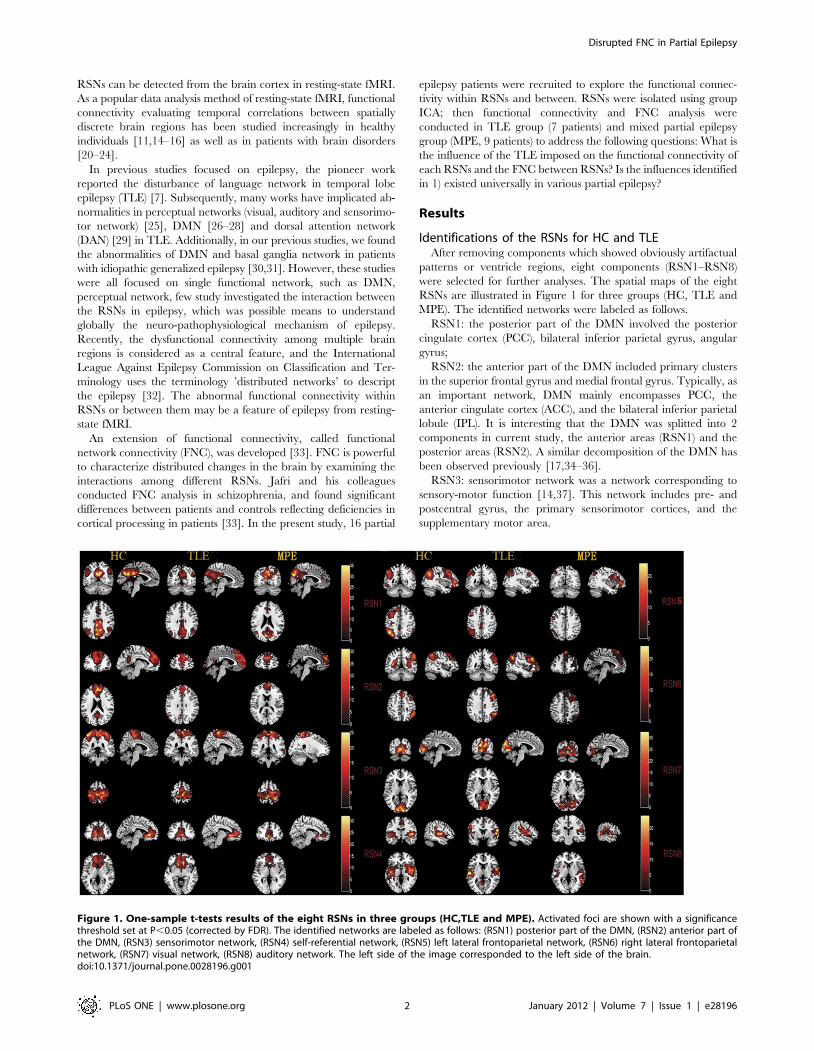
RSNs are illustrated in Figure 1 for three groups (HC, TLE and
MPE). The identified networks were labeled as follows.
RSN1: the posterior part of the DMN involved the posterior
cingulate cortex (PCC), bilateral inferior parietal gyrus, angular
gyrus;
RSN2: the anterior part of the DMN included primary clusters
in the superior frontal gyrus and medial frontal gyrus. Typically, as
an important network, DMN mainly encompasses PCC, the
anterior cingulate cortex (ACC), and the bilateral inferior parietal
lobule (IPL). It is interesting that the DMN was splitted into 2
components in current study, the anterior areas (RSN1) and the
posterior areas (RSN2). A similar decomposition of the DMN has
been observed previously [17,34–36].
RSN3: sensorimotor network was a network corresponding to
sensory-motor function [14,37]. This network includes pre- and
postcentral gyrus, the primary sensorimotor cortices, and the
supplementary motor area.
Figure 1. One-sample t-tests results of the eight RSNs in three groups (HC,TLE and MPE). Activated foci are shown with a significancethreshold set at P,0.05 (corrected by FDR). The identified networks are labeled as follows: (RSN1) posterior part of the DMN, (RSN2) anterior part ofthe DMN, (RSN3) sensorimotor network, (RSN4) self-referential network, (RSN5) left lateral frontoparietal network, (RSN6) right lateral frontoparietalnetwork, (RSN7) visual network, (RSN8) auditory network. The left side of the image corresponded to the left side of the brain.doi:10.1371/journal.pone.0028196.g001
Disrupted FNC in Partial Epilepsy
PLoS ONE | www.plosone.org 2 January 2012 | Volume 7 | Issue 1 | e28196

RSN4: self-referential network putatively related to self-
referential mental activity mainly including the medial-ventral
prefrontal cortex, the pregenual anterior cingulate [38].
RSN5: left lateral frontoparietal network along with right lateral
frontoparietal network showed the similar spatial patterns with
DAN consisting of regions previously known to be involved in
goal-directed top-down processing [39,40]. This network primarily
involved precuneus, inferior parietal lobule, middle frontal gyrus,
superior parietal lobule.
RSN6: right lateral frontoparietal network including clusters
lateralized to the right hemisphere putatively associated with DAN.
Left lateral frontoparietal network and right lateral frontoparietal
network were the only maps to be strongly lateralized, and were
largely left–right mirrors of each other.
RSN7: visual network showed spatial patterns consisting of the
middle temporal, superior temporal, insular and postcentral cortex
which were previously known to be involved in visual processing.
RSN8: auditory network primarily encompassed middle tempo-
ral gyrus, superior temporal gyrus, insular and temporal pole, and
corresponded to the auditory system.
Group comparisons of functional connectivity within RSNsBetween-group analysis of RSNs was performed using two-
sample t-test. Figure 2 revealed the difference between TLE and
HC in all the eight RSNs. We found that all the networks revealed
decreased functional connectivity within the regions of each
network in TLE. Among the eight RSNs, the visual network was
the network not only revealing reduced functional connectivity but
also increased functional connectivity in lingual gyrus, cuneus in
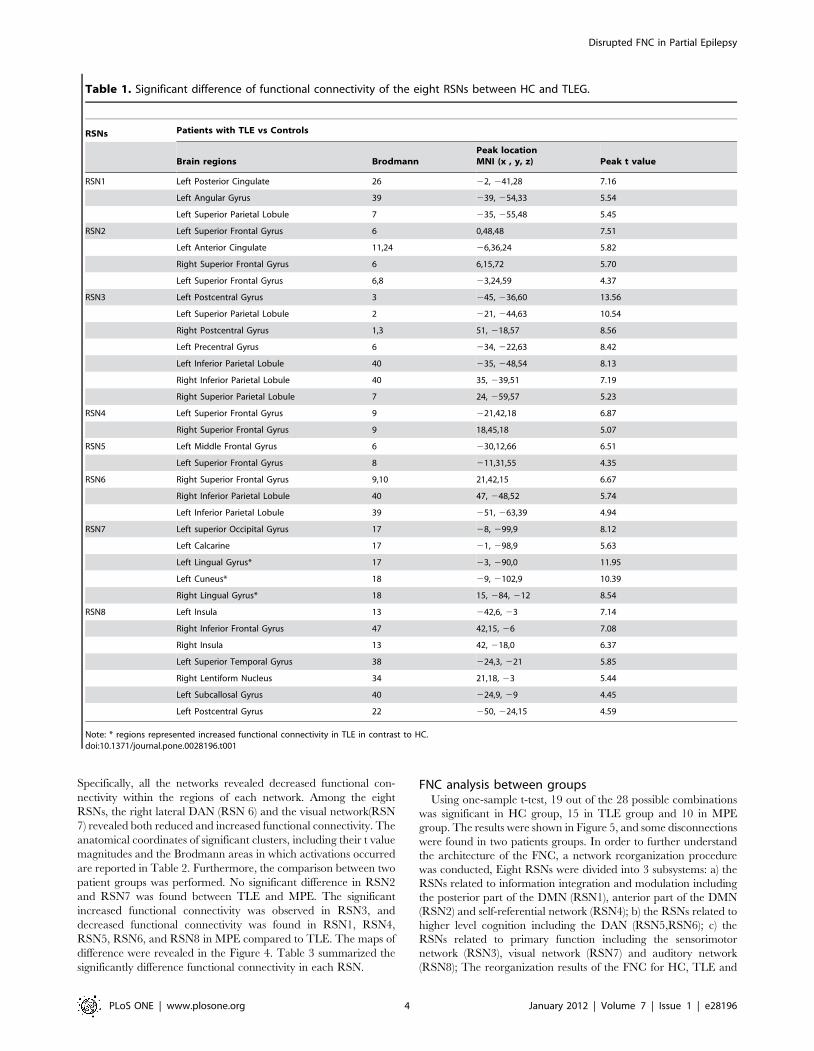
bilateral occipital lobe. Table 1 summarized the significantly
difference functional connectivity regions of each RSN with the
Brodmann areas in which activations occurred, peak location and
peak t value. Although previous studies have discussed the dif-
ferences of functional connectivity between patients with temporal
lobe epilepsy and healthy controls in DMN, perceptual and dorsal
attention networks [25,29], this work is the first to examine the
functional connectivity alteration in, self-referential network and the
frontoparietal networks which has been presumed to be related to
attention function in patients with TLE.
In order to examine whether the influences identified in TLE
universally existed in the partial epilepsy at least for partial epilepsy
recruited in current study, similar analyses were conducted in MPE.
The spatial maps of the eight RSNs for MPE are illustrated in
Figure 1. It can be seen that the spatial pattern of the RSNs in MPE
is similar to that identified in HC and TLE. The results of the group
comparisons of functional connectivity between controls and MPE
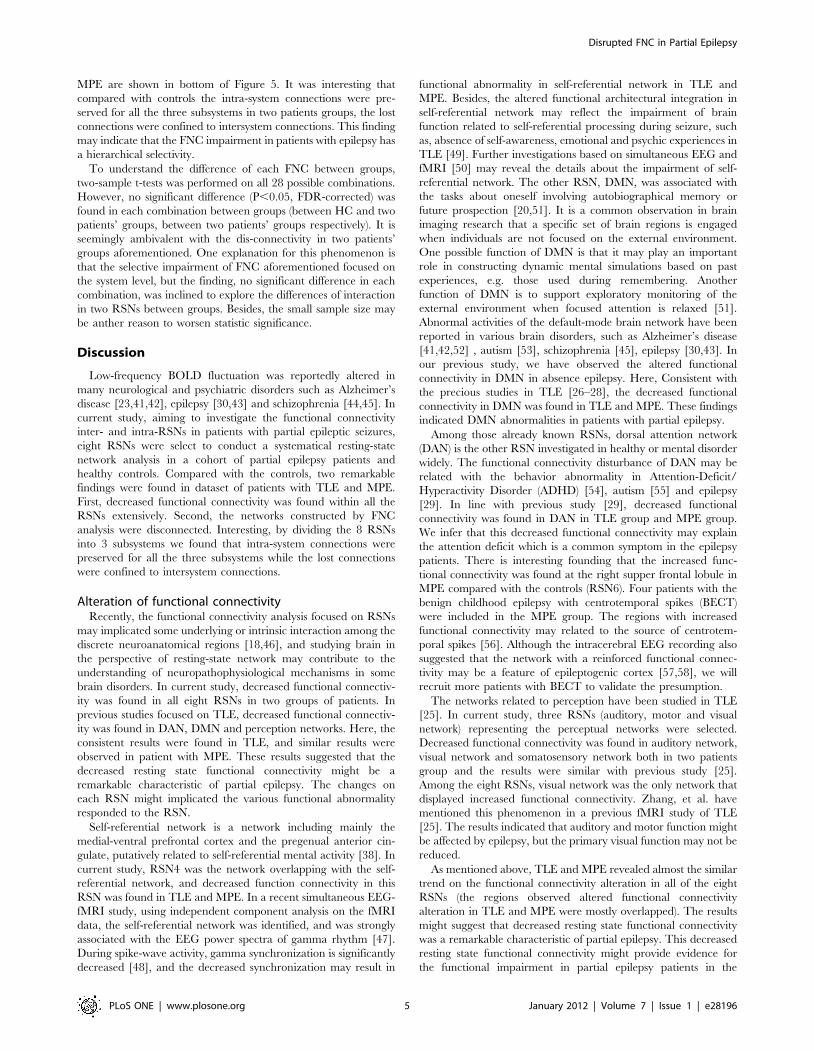
are shown in Figure 3. We found that MPE presented almost
the same trend as TLE in functional connectivity alterations.
Figure 2. Two-sample t-tests results of the eight RSNs between TLE and HC (P,0.05 corrected by FDR). The warm and cold colorsindicate the brain regions with significantly increased and decreased functional connectivity in TLE compared with HC, respectively. The left side ofthe image corresponds to the left side of the brain.doi:10.1371/journal.pone.0028196.g002
Disrupted FNC in Partial Epilepsy
PLoS ONE | www.plosone.org 3 January 2012 | Volume 7 | Issue 1 | e28196
Specifically, all the networks revealed decreased functional con-
nectivity within the regions of each network. Among the eight
RSNs, the right lateral DAN (RSN 6) and the visual network(RSN
7) revealed both reduced and increased functional connectivity. The
anatomical coordinates of significant clusters, including their t value
magnitudes and the Brodmann areas in which activations occurred
are reported in Table 2. Furthermore, the comparison between two
patient groups was performed. No significant difference in RSN2
and RSN7 was found between TLE and MPE. The significant
increased functional connectivity was observed in RSN3, and
decreased functional connectivity was found in RSN1, RSN4,
RSN5, RSN6, and RSN8 in MPE compared to TLE. The maps of
difference were revealed in the Figure 4. Table 3 summarized the
significantly difference functional connectivity in each RSN.
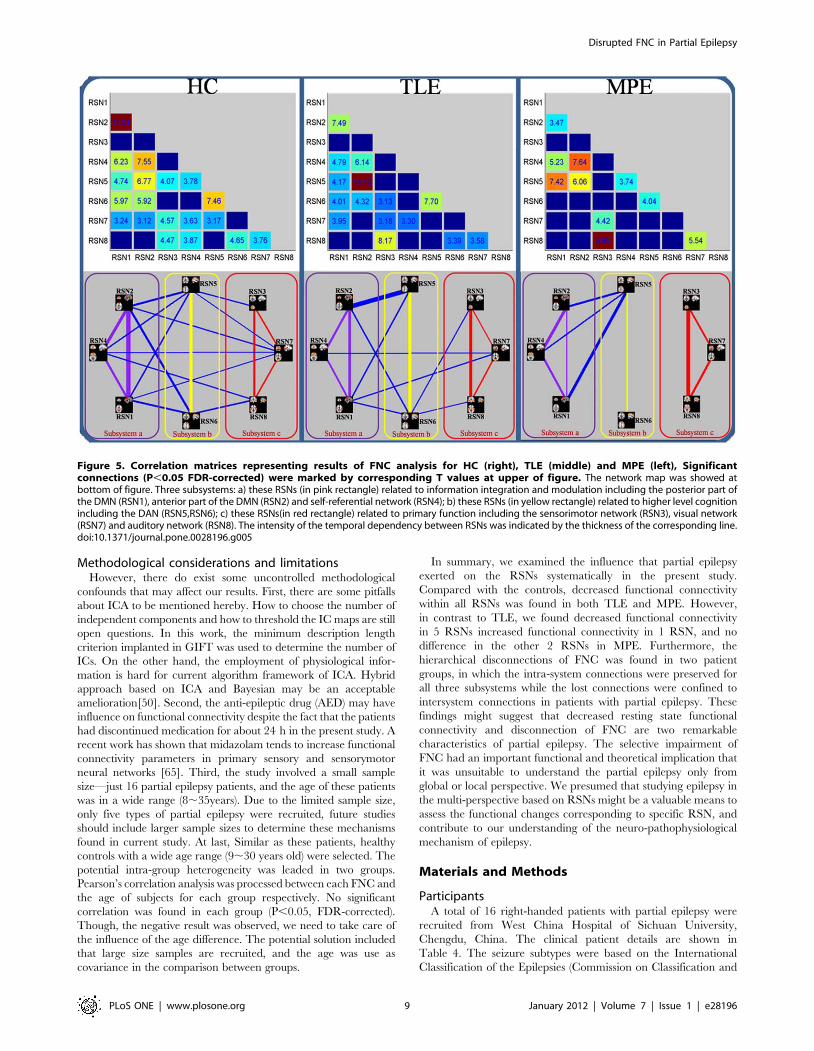
FNC analysis between groupsUsing one-sample t-test, 19 out of the 28 possible combinations
was significant in HC group, 15 in TLE group and 10 in MPE
group. The results were shown in Figure 5, and some disconnections
were found in two patients groups. In order to further understand
the architecture of the FNC, a network reorganization procedure
was conducted, Eight RSNs were divided into 3 subsystems: a) the
RSNs related to information integration and modulation including
the posterior part of the DMN (RSN1), anterior part of the DMN
(RSN2) and self-referential network (RSN4); b) the RSNs related to
higher level cognition including the DAN (RSN5,RSN6); c) the
RSNs related to primary function including the sensorimotor
network (RSN3), visual network (RSN7) and auditory network
(RSN8); The reorganization results of the FNC for HC, TLE and
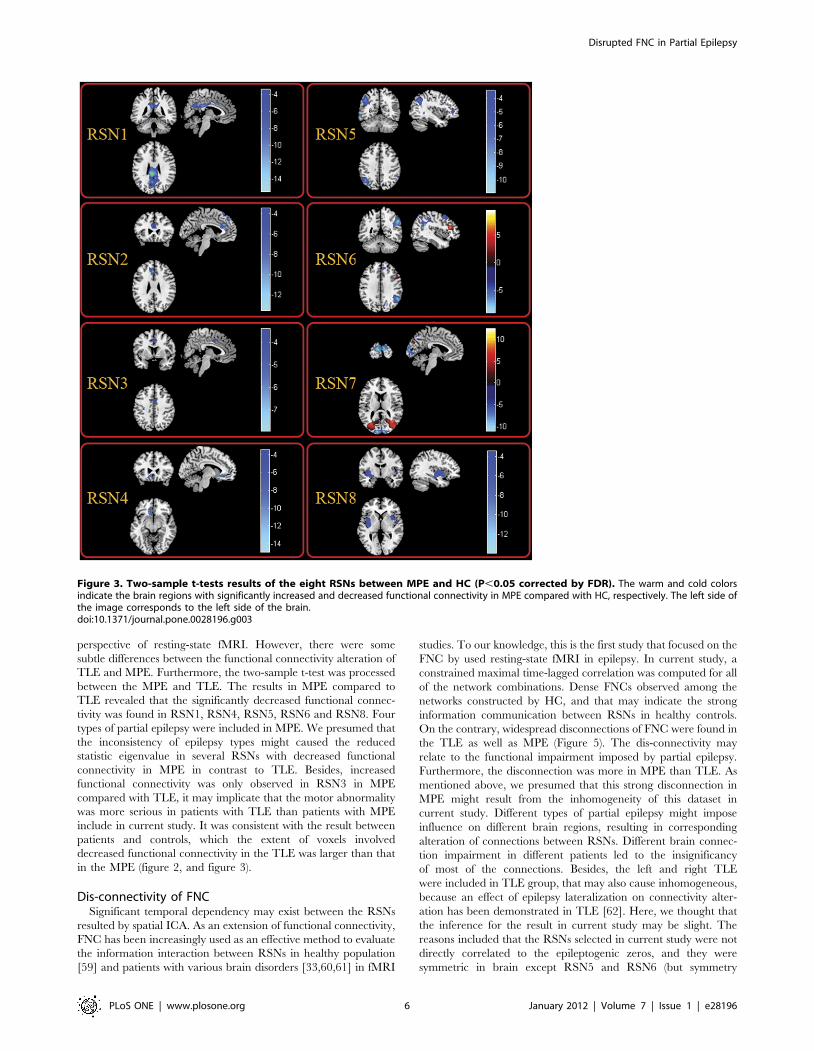
Table 1. Significant difference of functional connectivity of the eight RSNs between HC and TLEG.
RSNs Patients with TLE vs Controls
Brain regions BrodmannPeak locationMNI (x , y, z) Peak t value
RSN1 Left Posterior Cingulate 26 22, 241,28 7.16
Left Angular Gyrus 39 239, 254,33 5.54
Left Superior Parietal Lobule 7 235, 255,48 5.45
RSN2 Left Superior Frontal Gyrus 6 0,48,48 7.51
Left Anterior Cingulate 11,24 26,36,24 5.82
Right Superior Frontal Gyrus 6 6,15,72 5.70
Left Superior Frontal Gyrus 6,8 23,24,59 4.37
RSN3 Left Postcentral Gyrus 3 245, 236,60 13.56
Left Superior Parietal Lobule 2 221, 244,63 10.54
Right Postcentral Gyrus 1,3 51, 218,57 8.56
Left Precentral Gyrus 6 234, 222,63 8.42
Left Inferior Parietal Lobule 40 235, 248,54 8.13
Right Inferior Parietal Lobule 40 35, 239,51 7.19
Right Superior Parietal Lobule 7 24, 259,57 5.23
RSN4 Left Superior Frontal Gyrus 9 221,42,18 6.87
Right Superior Frontal Gyrus 9 18,45,18 5.07
RSN5 Left Middle Frontal Gyrus 6 230,12,66 6.51
Left Superior Frontal Gyrus 8 211,31,55 4.35
RSN6 Right Superior Frontal Gyrus 9,10 21,42,15 6.67
Right Inferior Parietal Lobule 40 47, 248,52 5.74
Left Inferior Parietal Lobule 39 251, 263,39 4.94
RSN7 Left superior Occipital Gyrus 17 28, 299,9 8.12
Left Calcarine 17 21, 298,9 5.63
Left Lingual Gyrus* 17 23, 290,0 11.95
Left Cuneus* 18 29, 2102,9 10.39
Right Lingual Gyrus* 18 15, 284, 212 8.54
RSN8 Left Insula 13 242,6, 23 7.14
Right Inferior Frontal Gyrus 47 42,15, 26 7.08
Right Insula 13 42, 218,0 6.37
Left Superior Temporal Gyrus 38 224,3, 221 5.85
Right Lentiform Nucleus 34 21,18, 23 5.44
Left Subcallosal Gyrus 40 224,9, 29 4.45
Left Postcentral Gyrus 22 250, 224,15 4.59
Note: * regions represented increased functional connectivity in TLE in contrast to HC.doi:10.1371/journal.pone.0028196.t001
Disrupted FNC in Partial Epilepsy
PLoS ONE | www.plosone.org 4 January 2012 | Volume 7 | Issue 1 | e28196
MPE are shown in bottom of Figure 5. It was interesting that
compared with controls the intra-system connections were pre-
served for all the three subsystems in two patients groups, the lost
connections were confined to intersystem connections. This finding
may indicate that the FNC impairment in patients with epilepsy has
a hierarchical selectivity.
To understand the difference of each FNC between groups,
two-sample t-tests was performed on all 28 possible combinations.
However, no significant difference (P,0.05, FDR-corrected) was
found in each combination between groups (between HC and two
patients’ groups, between two patients’ groups respectively). It is
seemingly ambivalent with the dis-connectivity in two patients’
groups aforementioned. One explanation for this phenomenon is
that the selective impairment of FNC aforementioned focused on
the system level, but the finding, no significant difference in each
combination, was inclined to explore the differences of interaction
in two RSNs between groups. Besides, the small sample size may
be anther reason to worsen statistic significance.
Discussion
Low-frequency BOLD fluctuation was reportedly altered in
many neurological and psychiatric disorders such as Alzheimer’s
disease [23,41,42], epilepsy [30,43] and schizophrenia [44,45]. In
current study, aiming to investigate the functional connectivity
inter- and intra-RSNs in patients with partial epileptic seizures,
eight RSNs were select to conduct a systematical resting-state
network analysis in a cohort of partial epilepsy patients and
healthy controls. Compared with the controls, two remarkable
findings were found in dataset of patients with TLE and MPE.
First, decreased functional connectivity was found within all the
RSNs extensively. Second, the networks constructed by FNC
analysis were disconnected. Interesting, by dividing the 8 RSNs
into 3 subsystems we found that intra-system connections were
preserved for all the three subsystems while the lost connections
were confined to intersystem connections.
Alteration of functional connectivityRecently, the functional connectivity analysis focused on RSNs
may implicated some underlying or intrinsic interaction among the
discrete neuroanatomical regions [18,46], and studying brain in
the perspective of resting-state network may contribute to the
understanding of neuropathophysiological mechanisms in some
brain disorders. In current study, decreased functional connectiv-
ity was found in all eight RSNs in two groups of patients. In
previous studies focused on TLE, decreased functional connectiv-
ity was found in DAN, DMN and perception networks. Here, the
consistent results were found in TLE, and similar results were
observed in patient with MPE. These results suggested that the
decreased resting state functional connectivity might be a
remarkable characteristic of partial epilepsy. The changes on
each RSN might implicated the various functional abnormality
responded to the RSN.
Self-referential network is a network including mainly the
medial-ventral prefrontal cortex and the pregenual anterior cin-
gulate, putatively related to self-referential mental activity [38]. In
current study, RSN4 was the network overlapping with the self-
referential network, and decreased function connectivity in this
RSN was found in TLE and MPE. In a recent simultaneous EEG-
fMRI study, using independent component analysis on the fMRI
data, the self-referential network was identified, and was strongly
associated with the EEG power spectra of gamma rhythm [47].
During spike-wave activity, gamma synchronization is significantly
decreased [48], and the decreased synchronization may result in
functional abnormality in self-referential network in TLE and
MPE. Besides, the altered functional architectural integration in
self-referential network may reflect the impairment of brain
function related to self-referential processing during seizure, such
as, absence of self-awareness, emotional and psychic experiences in
TLE [49]. Further investigations based on simultaneous EEG and
fMRI [50] may reveal the details about the impairment of self-
referential network. The other RSN, DMN, was associated with
the tasks about oneself involving autobiographical memory or
future prospection [20,51]. It is a common observation in brain
imaging research that a specific set of brain regions is engaged
when individuals are not focused on the external environment.
One possible function of DMN is that it may play an important
role in constructing dynamic mental simulations based on past
experiences, e.g. those used during remembering. Another
function of DMN is to support exploratory monitoring of the
external environment when focused attention is relaxed [51].
Abnormal activities of the default-mode brain network have been
reported in various brain disorders, such as Alzheimer’s disease
[41,42,52] , autism [53], schizophrenia [45], epilepsy [30,43]. In
our previous study, we have observed the altered functional
connectivity in DMN in absence epilepsy. Here, Consistent with
the precious studies in TLE [26–28], the decreased functional
connectivity in DMN was found in TLE and MPE. These findings
indicated DMN abnormalities in patients with partial epilepsy.
Among those already known RSNs, dorsal attention network
(DAN) is the other RSN investigated in healthy or mental disorder
widely. The functional connectivity disturbance of DAN may be
related with the behavior abnormality in Attention-Deficit/
Hyperactivity Disorder (ADHD) [54], autism [55] and epilepsy
[29]. In line with previous study [29], decreased functional
connectivity was found in DAN in TLE group and MPE group.
We infer that this decreased functional connectivity may explain
the attention deficit which is a common symptom in the epilepsy
patients. There is interesting founding that the increased func-
tional connectivity was found at the right supper frontal lobule in
MPE compared with the controls (RSN6). Four patients with the
benign childhood epilepsy with centrotemporal spikes (BECT)
were included in the MPE group. The regions with increased
functional connectivity may related to the source of centrotem-
poral spikes [56]. Although the intracerebral EEG recording also
suggested that the network with a reinforced functional connec-
tivity may be a feature of epileptogenic cortex [57,58], we will
recruit more patients with BECT to validate the presumption.
The networks related to perception have been studied in TLE
[25]. In current study, three RSNs (auditory, motor and visual
network) representing the perceptual networks were selected.
Decreased functional connectivity was found in auditory network,
visual network and somatosensory network both in two patients
group and the results were similar with previous study [25].
Among the eight RSNs, visual network was the only network that
displayed increased functional connectivity. Zhang, et al. have
mentioned this phenomenon in a previous fMRI study of TLE
[25]. The results indicated that auditory and motor function might
be affected by epilepsy, but the primary visual function may not be
reduced.
As mentioned above, TLE and MPE revealed almost the similar
trend on the functional connectivity alteration in all of the eight
RSNs (the regions observed altered functional connectivity
alteration in TLE and MPE were mostly overlapped). The results
might suggest that decreased resting state functional connectivity
was a remarkable characteristic of partial epilepsy. This decreased
resting state functional connectivity might provide evidence for
the functional impairment in partial epilepsy patients in the
Disrupted FNC in Partial Epilepsy
PLoS ONE | www.plosone.org 5 January 2012 | Volume 7 | Issue 1 | e28196
perspective of resting-state fMRI. However, there were some
subtle differences between the functional connectivity alteration of
TLE and MPE. Furthermore, the two-sample t-test was processed
between the MPE and TLE. The results in MPE compared to
TLE revealed that the significantly decreased functional connec-
tivity was found in RSN1, RSN4, RSN5, RSN6 and RSN8. Four
types of partial epilepsy were included in MPE. We presumed that
the inconsistency of epilepsy types might caused the reduced
statistic eigenvalue in several RSNs with decreased functional
connectivity in MPE in contrast to TLE. Besides, increased
functional connectivity was only observed in RSN3 in MPE
compared with TLE, it may implicate that the motor abnormality
was more serious in patients with TLE than patients with MPE
include in current study. It was consistent with the result between
patients and controls, which the extent of voxels involved
decreased functional connectivity in the TLE was larger than that
in the MPE (figure 2, and figure 3).
Dis-connectivity of FNCSignificant temporal dependency may exist between the RSNs
resulted by spatial ICA. As an extension of functional connectivity,
FNC has been increasingly used as an effective method to evaluate
the information interaction between RSNs in healthy population
[59] and patients with various brain disorders [33,60,61] in fMRI
studies. To our knowledge, this is the first study that focused on the
FNC by used resting-state fMRI in epilepsy. In current study, a
constrained maximal time-lagged correlation was computed for all
of the network combinations. Dense FNCs observed among the
networks constructed by HC, and that may indicate the strong
information communication between RSNs in healthy controls.
On the contrary, widespread disconnections of FNC were found in
the TLE as well as MPE (Figure 5). The dis-connectivity may
relate to the functional impairment imposed by partial epilepsy.
Furthermore, the disconnection was more in MPE than TLE. As
mentioned above, we presumed that this strong disconnection in
MPE might result from the inhomogeneity of this dataset in
current study. Different types of partial epilepsy might impose
influence on different brain regions, resulting in corresponding
alteration of connections between RSNs. Different brain connec-
tion impairment in different patients led to the insignificancy
of most of the connections. Besides, the left and right TLE
were included in TLE group, that may also cause inhomogeneous,
because an effect of epilepsy lateralization on connectivity alter-
ation has been demonstrated in TLE [62]. Here, we thought that
the inference for the result in current study may be slight. The
reasons included that the RSNs selected in current study were not
directly correlated to the epileptogenic zeros, and they were
symmetric in brain except RSN5 and RSN6 (but symmetry
Figure 3. Two-sample t-tests results of the eight RSNs between MPE and HC (P,0.05 corrected by FDR). The warm and cold colorsindicate the brain regions with significantly increased and decreased functional connectivity in MPE compared with HC, respectively. The left side ofthe image corresponds to the left side of the brain.doi:10.1371/journal.pone.0028196.g003
Disrupted FNC in Partial Epilepsy
PLoS ONE | www.plosone.org 6 January 2012 | Volume 7 | Issue 1 | e28196
between them). However, the deficiency should be considered in
future.
Additionally, conducting a reorganization procedure by divid-
ing the eight RSNs into three subsystems, we found that the intra-
system connections were preserved for all the there subsystems
in two groups of patients with partial epilepsy, while the lost
connections were confined to intersystem. The partition has
constructed a hierarchical structure with two levels in FNC. The
intersystem connections were in the high level of the hierarchy
while intra-system connections were in the low level of the
hierarchy. Obviously, the patients with partial epilepsy preferred
to impair the intersystem connections in highest level of the
hierarchy but not the intra-system connections. The lose
interaction among the intersystem might be associated with the
disturbance of the high level complex function which needed the
integrated multi-systems, such as learning [63], memory and
language processing [64]. The remained interaction among the
intra-system might be a basic condition to support the normal
behavior and function in interictal period. This phenomenon
might indicate that the FNC impairment in patients with epilepsy
had a hierarchical selectivity, and the selective impairment had an
important functional and theoretical implication that it was
unsuitable to understand the partial epilepsy only from global or
local perspective.
Table 2. Significant difference of functional connectivity of the eight RSNs between HC and MPEG.
RSNs Patients with MPE vs Controls
Brain regions BrodmannPeak locationMNI (x , y, z) Peak t value
RSN1 Left Posterior Cingulate 23 26, 244,27 15.21
Right Posterior Cingulate 23 7, 248,30 11.05
Left Precuneus Gyrus 23 24, 262,28 10.50
Right Precuneus Gyrus 31 5, 264,29 6.23
Left Angular 39 246, 266,29 4.56
RSN2 Left Superior Frontal Gyrus, 8 0,48,48 13.28
Left Anterior Cingulate 24 25,23,29 8.03
Right Anterior Cingulate 24,33 9,15,21 5.70
RSN3 Left Supplementary Motor Area 6 21, 215,53 7.60
Right Cingulate Gyrus 24,32 3,6,42 5.79
Left Cingulate Gyrus 24 25,3,35 5.43
Left Postcentral Gyrus 3 231, 236,55 4.72
RSN4 Left Anterior Cingulate 32 23,33, 23 14.77
Left Medial Frontal Gyrus 11 212,24, 29 11.72
Right Medial Frontal Gyrus 11 5,48, 212 8.80
RSN5 Left Inferior Parietal Lobule 39 245, 250,39 10.73
Left Inferior Frontal Gyrus 45 241,43,16 8.98
Left Middle Temporal Gyrus 37 242, 257,24 5.74
RSN6 Right Inferior Parietal Lobule 40 54, 254,39 9.76
Right Angular 39 56, 254,34 8.38
Right Anterior Cingulate 10,32 15,42,0 7.65
Right Superior Frontal Gyrus 8 9,42,45 7.00
Right Anterior Cingulate 32 18,27, 29 5.90
Right Inferior Frontal Gyrus* 44 49,15,34 8.94
RSN7 Left Superior Occipital Gyrus 17 28, 298,10 10.98
Right Superior Occipital Gyrus 17 21, 299,7 9.95
Left middle Occipital Gyrus* 18 231, 289,7 12.31
Right middle Occipital Gyrus* 19 39, 277,10 11.86
Right Lingual Gyrus* 17 8, 264,11 9.60
Left Cuneus* 18 212, 295,9 8.92
Right Cuneus* 17 9, 295,5 6.90
RSN8 Left Insula 13 242,9, 23 12.93
Left Parahippocampal Gyrus 28,34 224, 29, 212 8.99
Right Insula 13 36,12, 26 6.61
Right Superior Temporal Gyrus 22 51, 25,0 4.45
Note: * regions represented increased functional connectivity in MPE in contrast to HC.doi:10.1371/journal.pone.0028196.t002
Disrupted FNC in Partial Epilepsy
PLoS ONE | www.plosone.org 7 January 2012 | Volume 7 | Issue 1 | e28196
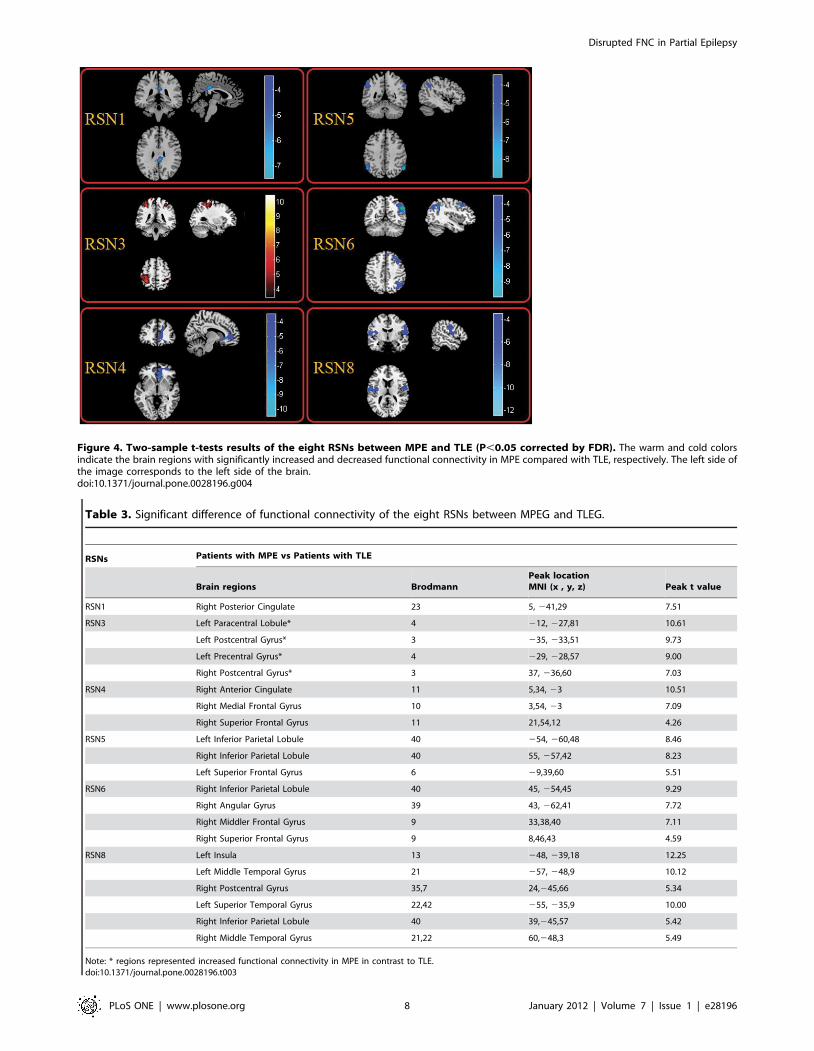
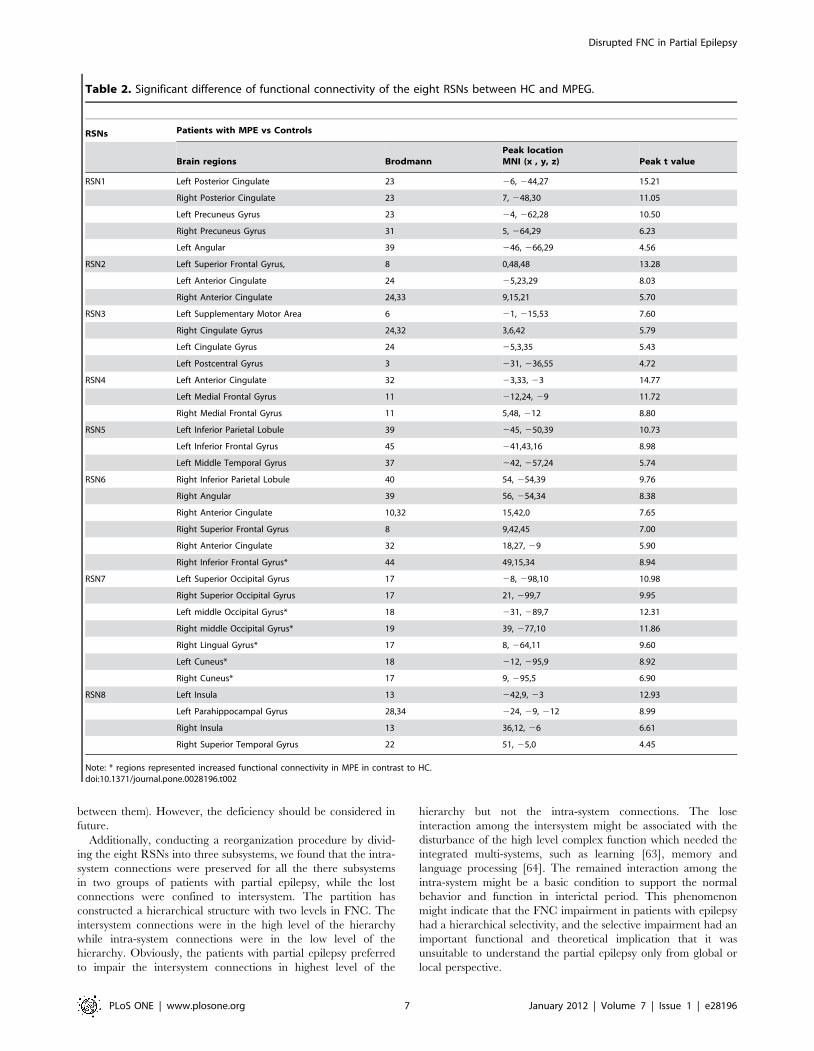
Figure 4. Two-sample t-tests results of the eight RSNs between MPE and TLE (P,0.05 corrected by FDR). The warm and cold colorsindicate the brain regions with significantly increased and decreased functional connectivity in MPE compared with TLE, respectively. The left side ofthe image corresponds to the left side of the brain.doi:10.1371/journal.pone.0028196.g004
Table 3. Significant difference of functional connectivity of the eight RSNs between MPEG and TLEG.
RSNs Patients with MPE vs Patients with TLE
Brain regions BrodmannPeak locationMNI (x , y, z) Peak t value
RSN1 Right Posterior Cingulate 23 5, 241,29 7.51
RSN3 Left Paracentral Lobule* 4 212, 227,81 10.61
Left Postcentral Gyrus* 3 235, 233,51 9.73
Left Precentral Gyrus* 4 229, 228,57 9.00
Right Postcentral Gyrus* 3 37, 236,60 7.03
RSN4 Right Anterior Cingulate 11 5,34, 23 10.51
Right Medial Frontal Gyrus 10 3,54, 23 7.09
Right Superior Frontal Gyrus 11 21,54,12 4.26
RSN5 Left Inferior Parietal Lobule 40 254, 260,48 8.46
Right Inferior Parietal Lobule 40 55, 257,42 8.23
Left Superior Frontal Gyrus 6 29,39,60 5.51
RSN6 Right Inferior Parietal Lobule 40 45, 254,45 9.29
Right Angular Gyrus 39 43, 262,41 7.72
Right Middler Frontal Gyrus 9 33,38,40 7.11
Right Superior Frontal Gyrus 9 8,46,43 4.59
RSN8 Left Insula 13 248, 239,18 12.25
Left Middle Temporal Gyrus 21 257, 248,9 10.12
Right Postcentral Gyrus 35,7 24,245,66 5.34
Left Superior Temporal Gyrus 22,42 255, 235,9 10.00
Right Inferior Parietal Lobule 40 39,245,57 5.42
Right Middle Temporal Gyrus 21,22 60,248,3 5.49
Note: * regions represented increased functional connectivity in MPE in contrast to TLE.doi:10.1371/journal.pone.0028196.t003
Disrupted FNC in Partial Epilepsy
PLoS ONE | www.plosone.org 8 January 2012 | Volume 7 | Issue 1 | e28196
Methodological considerations and limitationsHowever, there do exist some uncontrolled methodological
confounds that may affect our results. First, there are some pitfalls
about ICA to be mentioned hereby. How to choose the number of
independent components and how to threshold the IC maps are still
open questions. In this work, the minimum description length
criterion implanted in GIFT was used to determine the number of
ICs. On the other hand, the employment of physiological infor-
mation is hard for current algorithm framework of ICA. Hybrid
approach based on ICA and Bayesian may be an acceptable
amelioration[50]. Second, the anti-epileptic drug (AED) may have
influence on functional connectivity despite the fact that the patients
had discontinued medication for about 24 h in the present study. A
recent work has shown that midazolam tends to increase functional
connectivity parameters in primary sensory and sensorymotor
neural networks [65]. Third, the study involved a small sample
size—just 16 partial epilepsy patients, and the age of these patients
was in a wide range (8,35years). Due to the limited sample size,
only five types of partial epilepsy were recruited, future studies
should include larger sample sizes to determine these mechanisms
found in current study. At last, Similar as these patients, healthy
controls with a wide age range (9,30 years old) were selected. The
potential intra-group heterogeneity was leaded in two groups.
Pearson’s correlation analysis was processed between each FNC and
the age of subjects for each group respectively. No significant
correlation was found in each group (P,0.05, FDR-corrected).
Though, the negative result was observed, we need to take care of
the influence of the age difference. The potential solution included
that large size samples are recruited, and the age was use as
covariance in the comparison between groups.
In summary, we examined the influence that partial epilepsy
exerted on the RSNs systematically in the present study.
Compared with the controls, decreased functional connectivity
within all RSNs was found in both TLE and MPE. However,
in contrast to TLE, we found decreased functional connectivity
in 5 RSNs increased functional connectivity in 1 RSN, and no
difference in the other 2 RSNs in MPE. Furthermore, the
hierarchical disconnections of FNC was found in two patient
groups, in which the intra-system connections were preserved for
all three subsystems while the lost connections were confined to
intersystem connections in patients with partial epilepsy. These
findings might suggest that decreased resting state functional
connectivity and disconnection of FNC are two remarkable
characteristics of partial epilepsy. The selective impairment of
FNC had an important functional and theoretical implication that
it was unsuitable to understand the partial epilepsy only from
global or local perspective. We presumed that studying epilepsy in
the multi-perspective based on RSNs might be a valuable means to
assess the functional changes corresponding to specific RSN, and
contribute to our understanding of the neuro-pathophysiological
mechanism of epilepsy.
Materials and Methods
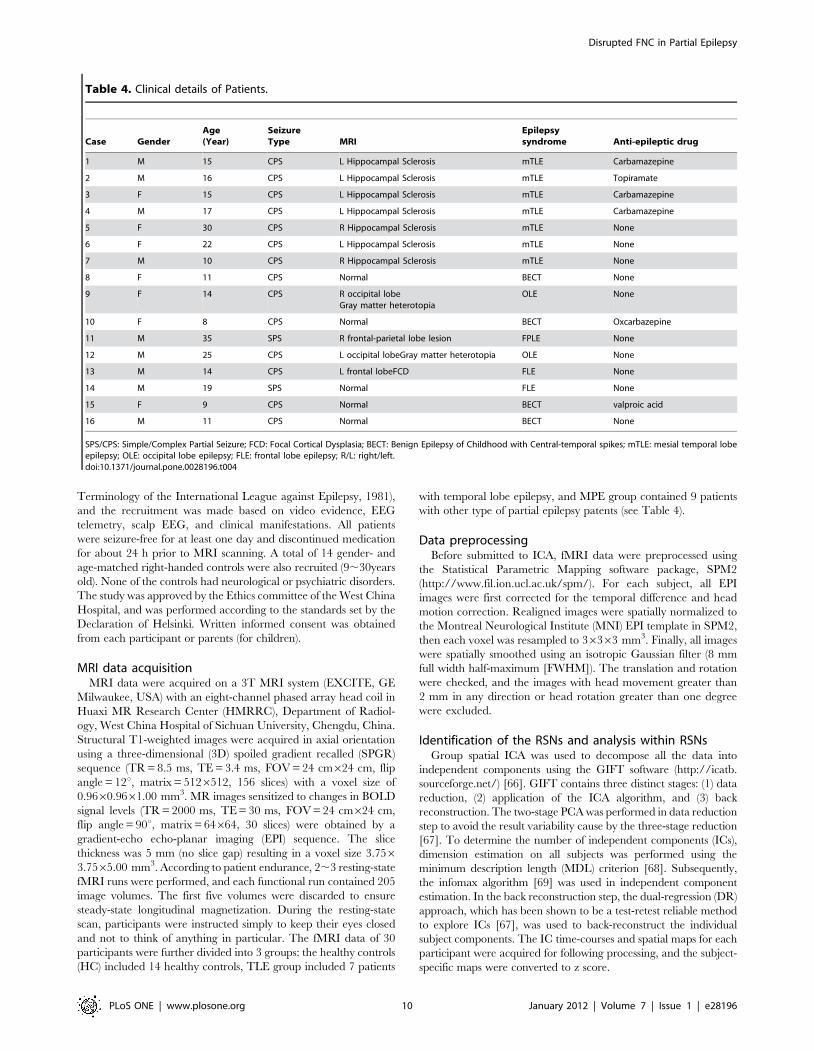
ParticipantsA total of 16 right-handed patients with partial epilepsy were
recruited from West China Hospital of Sichuan University,
Chengdu, China. The clinical patient details are shown in
Table 4. The seizure subtypes were based on the International
Classification of the Epilepsies (Commission on Classification and
Figure 5. Correlation matrices representing results of FNC analysis for HC (right), TLE (middle) and MPE (left), Significantconnections (P,0.05 FDR-corrected) were marked by corresponding T values at upper of figure. The network map was showed atbottom of figure. Three subsystems: a) these RSNs (in pink rectangle) related to information integration and modulation including the posterior part ofthe DMN (RSN1), anterior part of the DMN (RSN2) and self-referential network (RSN4); b) these RSNs (in yellow rectangle) related to higher level cognitionincluding the DAN (RSN5,RSN6); c) these RSNs(in red rectangle) related to primary function including the sensorimotor network (RSN3), visual network(RSN7) and auditory network (RSN8). The intensity of the temporal dependency between RSNs was indicated by the thickness of the corresponding line.doi:10.1371/journal.pone.0028196.g005
Disrupted FNC in Partial Epilepsy
PLoS ONE | www.plosone.org 9 January 2012 | Volume 7 | Issue 1 | e28196
Terminology of the International League against Epilepsy, 1981),
and the recruitment was made based on video evidence, EEG
telemetry, scalp EEG, and clinical manifestations. All patients
were seizure-free for at least one day and discontinued medication
for about 24 h prior to MRI scanning. A total of 14 gender- and
age-matched right-handed controls were also recruited (9,30years
old). None of the controls had neurological or psychiatric disorders.
The study was approved by the Ethics committee of the West China
Hospital, and was performed according to the standards set by the
Declaration of Helsinki. Written informed consent was obtained
from each participant or parents (for children).
MRI data acquisitionMRI data were acquired on a 3T MRI system (EXCITE, GE
Milwaukee, USA) with an eight-channel phased array head coil in
Huaxi MR Research Center (HMRRC), Department of Radiol-
ogy, West China Hospital of Sichuan University, Chengdu, China.
Structural T1-weighted images were acquired in axial orientation
using a three-dimensional (3D) spoiled gradient recalled (SPGR)
sequence (TR = 8.5 ms, TE = 3.4 ms, FOV = 24 cm624 cm, flip
angle = 12u, matrix = 5126512, 156 slices) with a voxel size of
0.9660.9661.00 mm3. MR images sensitized to changes in BOLD
signal levels (TR = 2000 ms, TE = 30 ms, FOV = 24 cm624 cm,
flip angle = 90u, matrix = 64664, 30 slices) were obtained by a
gradient-echo echo-planar imaging (EPI) sequence. The slice
thickness was 5 mm (no slice gap) resulting in a voxel size 3.7563.7565.00 mm3. According to patient endurance, 2,3 resting-state
fMRI runs were performed, and each functional run contained 205
image volumes. The first five volumes were discarded to ensure
steady-state longitudinal magnetization. During the resting-state
scan, participants were instructed simply to keep their eyes closed
and not to think of anything in particular. The fMRI data of 30
participants were further divided into 3 groups: the healthy controls
(HC) included 14 healthy controls, TLE group included 7 patients
with temporal lobe epilepsy, and MPE group contained 9 patients
with other type of partial epilepsy patents (see Table 4).
Data preprocessingBefore submitted to ICA, fMRI data were preprocessed using
the Statistical Parametric Mapping software package, SPM2
(http://www.fil.ion.ucl.ac.uk/spm/). For each subject, all EPI
images were first corrected for the temporal difference and head
motion correction. Realigned images were spatially normalized to
the Montreal Neurological Institute (MNI) EPI template in SPM2,
then each voxel was resampled to 36363 mm3. Finally, all images
were spatially smoothed using an isotropic Gaussian filter (8 mm
full width half-maximum [FWHM]). The translation and rotation
were checked, and the images with head movement greater than
2 mm in any direction or head rotation greater than one degree
were excluded.
Identification of the RSNs and analysis within RSNsGroup spatial ICA was used to decompose all the data into
independent components using the GIFT software (http://icatb.
sourceforge.net/) [66]. GIFT contains three distinct stages: (1) data
reduction, (2) application of the ICA algorithm, and (3) back
reconstruction. The two-stage PCA was performed in data reduction
step to avoid the result variability cause by the three-stage reduction
[67]. To determine the number of independent components (ICs),
dimension estimation on all subjects was performed using the
minimum description length (MDL) criterion [68]. Subsequently,
the infomax algorithm [69] was used in independent component
estimation. In the back reconstruction step, the dual-regression (DR)
approach, which has been shown to be a test-retest reliable method
to explore ICs [67], was used to back-reconstruct the individual
subject components. The IC time-courses and spatial maps for each
participant were acquired for following processing, and the subject-
specific maps were converted to z score.
Table 4. Clinical details of Patients.
Case GenderAge(Year)
SeizureType MRI
Epilepsysyndrome Anti-epileptic drug
1 M 15 CPS L Hippocampal Sclerosis mTLE Carbamazepine
2 M 16 CPS L Hippocampal Sclerosis mTLE Topiramate
3 F 15 CPS L Hippocampal Sclerosis mTLE Carbamazepine
4 M 17 CPS L Hippocampal Sclerosis mTLE Carbamazepine
5 F 30 CPS R Hippocampal Sclerosis mTLE None
6 F 22 CPS L Hippocampal Sclerosis mTLE None
7 M 10 CPS R Hippocampal Sclerosis mTLE None
8 F 11 CPS Normal BECT None
9 F 14 CPS R occipital lobeGray matter heterotopia
OLE None
10 F 8 CPS Normal BECT Oxcarbazepine
11 M 35 SPS R frontal-parietal lobe lesion FPLE None
12 M 25 CPS L occipital lobeGray matter heterotopia OLE None
13 M 14 CPS L frontal lobeFCD FLE None
14 M 19 SPS Normal FLE None
15 F 9 CPS Normal BECT valproic acid
16 M 11 CPS Normal BECT None
SPS/CPS: Simple/Complex Partial Seizure; FCD: Focal Cortical Dysplasia; BECT: Benign Epilepsy of Childhood with Central-temporal spikes; mTLE: mesial temporal lobeepilepsy; OLE: occipital lobe epilepsy; FLE: frontal lobe epilepsy; R/L: right/left.doi:10.1371/journal.pone.0028196.t004
Disrupted FNC in Partial Epilepsy
PLoS ONE | www.plosone.org 10 January 2012 | Volume 7 | Issue 1 | e28196
Both the spatial pattern and frequency spectra of each
component were visually inspected to determine their appearance
as potential RSNs or possible image artifacts. The IC time-courses
were transformed into frequency domain. If the proportion of
powers in .0.1 Hz was more than 50% of the total power, this
component would be discarded because the potential RSNs would
show dominant power in the expected ‘very low frequency’
domain. At last, eight components were selected as of interest for
further analyses. For each of the eight RSNs, z-maps in each group
were then gathered for a random-effect analysis using the one-
sample t-test in SPM2 respectively. The thresholds was set at
P,0.05 with a false discovery rate (FDR) criterion. Subsequently,
to investigate the functional connectivity changes in each RSN, the
z-maps of the RSN were compared between groups using two-
sample t-tests (P,0.05, corrected by FDR). Particularly, in each
RSN, we restricted the two-sample t-tests to only including the
voxels within a mask, which defined by the one-sample t-test of IC
result of the subjects in the control group.
FNC analysis between RSNsThe ICA algorithm assumes that the time courses of brain
regions within one component are synchronous [70]. Though the
components resulted by spatially ICA have optimized indepen-
dence in spatial domain, the spares of components in brain
fMRI is also considered as anther important feature in ICA algo-
rithm, such as infomax algorithm [71]. The significant temporal
dependency may exist between components. In order to examine
the possible interaction between the RSNs, a constrained maximal
time-lagged correlation method was adopted [33]. The time
courses of components for all subjects were first interpolated to
enlable detection of sub TR hemodynamic delay difference.
Subsequently, the time courses were filtered through a band-pass
filter, with frequencies between 0.01 Hz and 0.1 Hz. In the
present study, the time lag circularly shifted from25 to +5 s
resulting in 11 correlation coefficients for one combination of each
subject. As 8 components were identified, the number of pair-wise
combinations is 28 for each subject. The maximal lagged
correlation was then picked up from the 28 combinations. At last,
the temporal interaction between any 2 RSNs of the 8 total
components were examined by the one-sample t-test (P,0.05,
corrected by FDR). Statistically significant correlation combina-
tions from the 28 possible combinations were extracted for patients
and controls, resulting in maps of FNC for each group separately.
To understand the difference of each FNC between groups, two-
sample t-tests were performed on all 28 possible combinations, and
the statistical significance level was set to P,0.05 (FDR-corrected).
Author Contributions
Conceived and designed the experiments: CL QL XL YX YL DY.
Performed the experiments: CL QL JF DZ. Analyzed the data: CL CQ
ZG. Wrote the paper: CL CQ QG DY.
References
1. Berkovic SF, Mulley JC, Scheffer IE, Petrou S (2006) Human epilepsies:interaction of genetic and acquired factors. Trends Neurosci 29: 391–397.
2. Kwan P, Sander JW (2004) The natural history of epilepsy: an epidemiologicalview. J Neurol Neurosurg Psychiatry 75: 1376–1381.
3. Sander JW (2003) The epidemiology of epilepsy revisited. Curr Opin Neurol 16:
165–170.
4. Benbadis SR (2001) Epileptic seizures and syndromes. Neurol Clin 19: 251–270.
5. Laufs HDuncanJS (2007) Electroencephalography/functional MRI inhuman epilepsy: what it currently can and cannot do. Curr Opin Neurol 20:
417–423.
6. Qiao PF, Gao PY, Dai JP, Niu GM (2011) Research progress on resting state
fMRI of epilepsy. Brain Dev. In Press.
7. Waites AB, Briellmann RS, Saling MM, Abbott DF, Jackson GD (2006)Functional connectivity networks are disrupted in left temporal lobe epilepsy.
Ann Neurol 59: 335–343.
8. Gotman J (2008) Epileptic networks studied with EEG-fMRI. Epilepsia 49 Suppl
3: 42–51.
9. Lei X, Xu P, Luo C, Zhao J, Zhou D, et al. (2011) fMRI functional networks for
EEG source imaging. Hum Brain Mapp 32: 1141–1160.
10. Luo C, Yao Z, Li Q, Lei X, Zhou D, et al. (2010) Imaging foci of epileptic
discharges from simultaneous EEG and fMRI using the canonical HRF.Epilepsy Res 91: 133–142.
11. Fox MD, Raichle ME (2007) Spontaneous fluctuations in brain activity observed
with functional magnetic resonance imaging. Nat Rev Neurosci 8: 700–711.
12. Smith SM, Fox PT, Miller KL, Glahn DC, Fox PM, et al. (2009)
Correspondence of the brain’s functional architecture during activation andrest. Proc Natl Acad Sci U S A 106: 13040–13045.
13. Zhang D, Raichle ME (2010) Disease and the brain’s dark energy. Nat RevNeurol 6: 15–28.
14. Biswal B, Yetkin FZ, Haughton VM, Hyde JS (1995) Functional connectivity inthe motor cortex of resting human brain using echo-planar MRI. Magnetic
resonance in medicine 34: 537–541.
15. Cole DM, Smith SM, Beckmann CF (2010) Advances and pitfalls in the analysis
and interpretation of resting-state FMRI data. Front Syst Neurosci 4: 1–8.
16. Greicius MD, Krasnow B, Reiss AL, Menon V (2003) Functional connectivity inthe resting brain: a network analysis of the default mode hypothesis. Proc Natl
Acad Sci U S A 100: 253–258.
17. Damoiseaux JS, Rombouts SA, Barkhof F, Scheltens P, Stam CJ, et al. (2006)
Consistent resting-state networks across healthy subjects. Proc Natl Acad
Sci U S A 103: 13848–13853.
18. De Luca M, Beckmann CF, De Stefano N, Matthews PM, Smith SM (2006)fMRI resting state networks define distinct modes of long-distance interactions in
the human brain. Neuroimage 29: 1359–1367.
19. Fox MD, Corbetta M, Snyder AZ, Vincent JL, Raichle ME (2006) Spontaneous
neuronal activity distinguishes human dorsal and ventral attention systems. ProcNatl Acad Sci U S A 103: 10046–10051.
20. Broyd SJ, Demanuele C, Debener S, Helps SK, James CJ, et al. (2009) Default-
mode brain dysfunction in mental disorders: a systematic review. Neurosci
Biobehav Rev 33: 279–296.
21. Fornito A, Bullmore ET (2010) What can spontaneous fluctuations of the blood
oxygenation-level-dependent signal tell us about psychiatric disorders? Curr
Opin Psychiatry 23: 239–249.
22. Bluhm RL, Miller J, Lanius RA, Osuch EA, Boksman K, et al. (2007)
Spontaneous low-frequency fluctuations in the BOLD signal in schizophrenic
patients: anomalies in the default network. Schizophrenia bulletin 33: 1004–1012.
23. Greicius MD, Srivastava G, Reiss AL, Menon V (2004) Default-mode network
activity distinguishes Alzheimer’s disease from healthy aging: evidence from
functional MRI. Proc Natl Acad Sci U S A 101: 4637–4642.
24. Tian L, Jiang T, Wang Y, Zang Y, He Y, et al. (2006) Altered resting-state
functional connectivity patterns of anterior cingulate cortex in adolescents with
attention deficit hyperactivity disorder. Neurosci Lett 400: 39–43.
25. Zhang Z, Lu G, Zhong Y, Tan Q, Liao W, et al. (2009) Impaired perceptual
networks in temporal lobe epilepsy revealed by resting fMRI. J Neurol 256:
1705–1713.
26. Frings L, Schulze-Bonhage A, Spreer J, Wagner K (2009) Remote effects of
hippocampal damage on default network connectivity in the human brain.
J Neurol 256: 2021–2029.
27. Liao W, Zhang Z, Pan Z, Mantini D, Ding J, et al. (2011) Default mode network
abnormalities in mesial temporal lobe epilepsy: a study combining fMRI and
DTI. Hum Brain Mapp 32: 883–895.
28. Zhang Z, Lu G, Zhong Y, Tan Q, Liao W, et al. (2011) Altered spontaneous
neuronal activity of the default-mode network in mesial temporal lobe epilepsy.
Brain Res 1323: 152–160.
29. Zhang Z, Lu G, Zhong Y, Tan Q, Yang Z, et al. (2009) Impaired attention
network in temporal lobe epilepsy: a resting FMRI study. Neurosci Lett 458:
97–101.
30. Luo C, Li Q, Lai Y, Xia Y, Qin Y, et al. (2011) Altered functional connectivity in
default mode network in absence epilepsy: a resting-state fMRI study. Hum
Brain Mapp 32: 438–449.
31. Luo C, Li Q, Xia Y, Lei X, Xue K, et al. (2011) Resting state Basal Ganglia
Network in idiopathic generalized epilepsy. Hum Brain Mapp;DOI:10.1002/
hbm.21286.
32. Berg AT, Berkovic SF, Brodie MJ, Buchhalter J, Cross JH, et al. (2010) Revised
terminology and concepts for organization of seizures and epilepsies: report of
the ILAE Commission on Classification and Terminology, 2005-2009. Epilepsia51: 676–685.
33. Jafri MJ, Pearlson GD, Stevens M, Calhoun VD (2008) A method for functional
network connectivity among spatially independent resting-state components inschizophrenia. Neuroimage 39: 1666–1681.
34. Damoiseaux JS, Beckmann CF, Arigita EJ, Barkhof F, Scheltens P, et al. (2008)
Reduced resting-state brain activity in the default network in normal aging.Cerebral Cortex 18: 1856–1864.
Disrupted FNC in Partial Epilepsy
PLoS ONE | www.plosone.org 11 January 2012 | Volume 7 | Issue 1 | e28196
35. Rombouts SARB, Damoiseaux JS, Goekoop R, Barkhof F, Scheltens P, et al.
(2009) Model-free group analysis shows altered BOLD FMRI networks indementia. Hum Brain Mapp 30: 256–266.
36. Zuo XN, Kelly C, Adelstein JS, Klein DF, Castellanos FX, et al. (2010) Reliable
intrinsic connectivity networks: test-retest evaluation using ICA and dualregression approach. Neuroimage 49: 2163–2177.
37. Fox MD, Snyder AZ, Zacks JM, Raichle ME (2006) Coherent spontaneousactivity accounts for trial-to-trial variability in human evoked brain responses.
Nat Neurosci 9: 23–25.
38. D’Argembeau A, Collette F, Van der Linden M, Laureys S, Del Fiore G, et al.(2005) Self-referential reflective activity and its relationship with rest: a PET
study. Neuroimage 25: 616–624.39. Corbetta M, Shulman GL (2002) Control of goal-directed and stimulus-driven
attention in the brain. Nat Rev Neurosci 3: 201–215.40. Harrison BJ, Pujol J, Ortiz H, Fornito A, Pantelis C, et al. (2008) Modulation of
brain resting-state networks by sad mood induction. PLoS One 3: e1794.
41. He Y, Wang L, Zang Y, Tian L, Zhang X, et al. (2007) Regional coherencechanges in the early stages of Alzheimer’s disease: a combined structural and
resting-state functional MRI study. Neuroimage 35: 488–500.42. Sorg C, Riedl V, Muhlau M, Calhoun VD, Eichele T, et al. (2007) Selective
changes of resting-state networks in individuals at risk for Alzheimer’s disease.
Proc Natl Acad Sci U S A 104: 18760–18765.43. Lui S, Ouyang L, Chen Q, Huang X, Tang H, et al. (2008) Differential interictal
activity of the precuneus/posterior cingulate cortex revealed by resting statefunctional MRI at 3T in generalized vs. partial seizure. Journal of Magnetic
Resonance Imaging 27: 1214–1220.44. Garrity AG, Pearlson GD, McKiernan K, Lloyd D, Kiehl KA, et al. (2007)
Aberrant" default mode" functional connectivity in schizophrenia. American
Journal of Psychiatry 164: 450–459.45. Zhou Y, Liang M, Tian L, Wang K, Hao Y, et al. (2007) Functional
disintegration in paranoid schizophrenia using resting-state fMRI. Schizophre-nia research 97: 194–205.
46. Beckmann CF, DeLuca M, Devlin JT, Smith SM (2005) Investigations into
resting-state connectivity using independent component analysis. PhilosophicalTransactions of the Royal Society B: Biological Sciences 360: 1001–1013.
47. Mantini D, Perrucci MG, Del Gratta C, Romani GL, Corbetta M (2007)Electrophysiological signatures of resting state networks in the human brain.
Proc Natl Acad Sci U S A 104: 13170–13175.48. Medvedev AV (2001) Temporal binding at gamma frequencies in the brain:
paving the way to epilepsy? Australas Phys Eng Sci Med 24: 37–48.
49. Wieser HG (2004) ILAE Commission Report. Mesial temporal lobe epilepsywith hippocampal sclerosis. Epilepsia 45: 695–714.
50. Lei X, Qiu C, Xu P, Yao D (2010) A parallel framework for simultaneous EEG/fMRI analysis: methodology and simulation. Neuroimage 52: 1123–1134.
51. Buckner RL, Andrews-Hanna JR, Schacter DL (2008) The brain’s default
network: anatomy, function, and relevance to disease. Ann N Y Acad Sci 1124:1–38.
52. Bai F, Zhang Z, Yu H, Shi Y, Yuan Y, et al. (2008) Default-mode networkactivity distinguishes amnestic type mild cognitive impairment from healthy
aging: a combined structural and resting-state functional MRI study. NeurosciLett 438: 111–115.
53. Cherkassky VL, Kana RK, Keller TA, Just MA (2006) Functional connectivity
in a baseline resting-state network in autism. Neuroreport 17: 1687–1690.
54. Bush G (2010) Attention-deficit/hyperactivity disorder and attention networks.
Neuropsychopharmacology 35: 278–300.
55. Noonan SK, Haist F, Muller RA (2009) Aberrant functional connectivity in
autism: evidence from low-frequency BOLD signal fluctuations. Brain Res 1262:
48–63.
56. Masterton RA, Harvey AS, Archer JS, Lillywhite LM, Abbott DF, et al. (2010)
Focal epileptiform spikes do not show a canonical BOLD response in patients
with benign rolandic epilepsy (BECTS). Neuroimage 51: 252–260.
57. Bettus G, Wendling F, Guye M, Valton L, Regis J, et al. (2008) Enhanced EEG
functional connectivity in mesial temporal lobe epilepsy. Epilepsy Res 81: 58–68.
58. Schevon CA, Cappell J, Emerson R, Isler J, Grieve P, et al. (2007) Cortical
abnormalities in epilepsy revealed by local EEG synchrony. Neuroimage 35:
140–148.
59. Liao W, Mantini D, Zhang Z, Pan Z, Ding J, et al. (2010) Evaluating the
effective connectivity of resting state networks using conditional Granger
causality. Biological cybernetics 102: 57–69.
60. Demirci O, Stevens MC, Andreasen NC, Michael A, Liu J, et al. (2009)
Investigation of relationships between fMRI brain networks in the spectral
domain using ICA and Granger causality reveals distinct differences between
schizophrenia patients and healthy controls. Neuroimage 46: 419–431.
61. Sakoglu U, Pearlson GD, Kiehl KA, Wang YM, Michael AM, et al. (2010) A
method for evaluating dynamic functional network connectivity and task-
modulation: application to schizophrenia. MAGMA 23: 351–366.
62. Bettus G, Guedj E, Joyeux F, Confort-Gouny S, Soulier E, et al. (2009)
Decreased basal fMRI functional connectivity in epileptogenic networks and
contralateral compensatory mechanisms. Hum Brain Mapp 30: 1580–1591.
63. Pavlou E, Gkampeta A (2011) Learning disorders in children with epilepsy.
Childs Nerv Syst 27: 373–379.
64. Vlooswijk MC, Jansen JF, de Krom MC, Majoie HM, Hofman PA, et al. (2010)
Functional MRI in chronic epilepsy: associations with cognitive impairment.
Lancet Neurol 9: 1018–1027.
65. Kiviniemi VJ, Haanpaa H, Kantola JH, Jauhiainen J, Vainionpaa V, et al.
(2005) Midazolam sedation increases fluctuation and synchrony of the resting
brain BOLD signal. Magn Reson Imaging 23: 531–537.
66. Calhoun VD, Adali T, Pearlson GD, Pekar JJ (2001) A method for making
group inferences from functional MRI data using independent component
analysis. Hum Brain Mapp 14: 140–151.
67. Zhang H, Zuo XN, Ma SY, Zang YF, Milham MP, et al. (2010) Subject order-
independent group ICA (SOI-GICA) for functional MRI data analysis.
Neuroimage 51: 1414–1424.
68. Li YO, Adal T, Calhoun VD (2007) Estimating the number of independent
components for functional magnetic resonance imaging data. Hum Brain Mapp
28: 1251–1266.
69. Bell AJ, Sejnowski TJ (1995) An information-maximization approach to blind
separation and blind deconvolution. Neural Comput 7: 1129–1159.
70. Calhoun VD, Kiehl KA, Liddle PF, Pearlson GD (2004) Aberrant localization of
synchronous hemodynamic activity in auditory cortex reliably characterizes
schizophrenia. Biol Psychiatry 55: 842–849.
71. Daubechies I, Roussos E, Takerkart S, Benharrosh M, Golden C, et al. (2009)
Independent component analysis for brain fMRI does not select for
independence. Proc Natl Acad Sci U S A 106: 10415–10422.
Disrupted FNC in Partial Epilepsy
PLoS ONE | www.plosone.org 12 January 2012 | Volume 7 | Issue 1 | e28196
Related Documents