The Tale of Two Networks Video Driving Demand / M2M Driving Connections Implications for Europe 21 St Century Connectivity: Lessons for Europe November 2015

DWS15 - Future Networks Forum - The tale of two networks - Frederic Geraud De Lescazes - Cisco
Jan 23, 2017
Welcome message from author
This document is posted to help you gain knowledge. Please leave a comment to let me know what you think about it! Share it to your friends and learn new things together.
Transcript
The Tale of Two Networks Video Driving Demand / M2M Driving Connections Implications for Europe
21St Century Connectivity: Lessons for Europe
November 2015
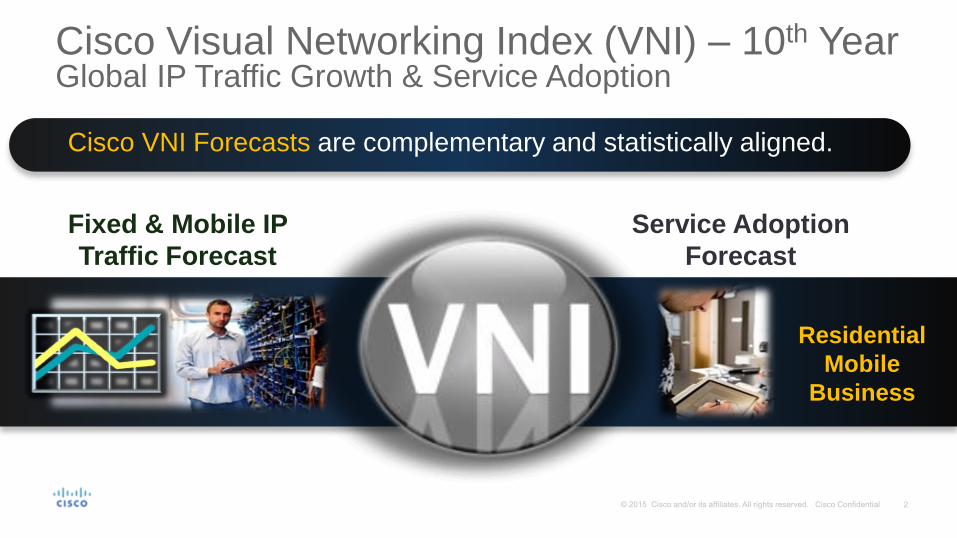
Service Adoption
Forecast
Cisco VNI Forecasts are complementary and statistically aligned.
Fixed & Mobile IP
Traffic Forecast
Cisco Visual Networking Index (VNI) – 10th Year Global IP Traffic Growth & Service Adoption
Residential
Mobile
Business
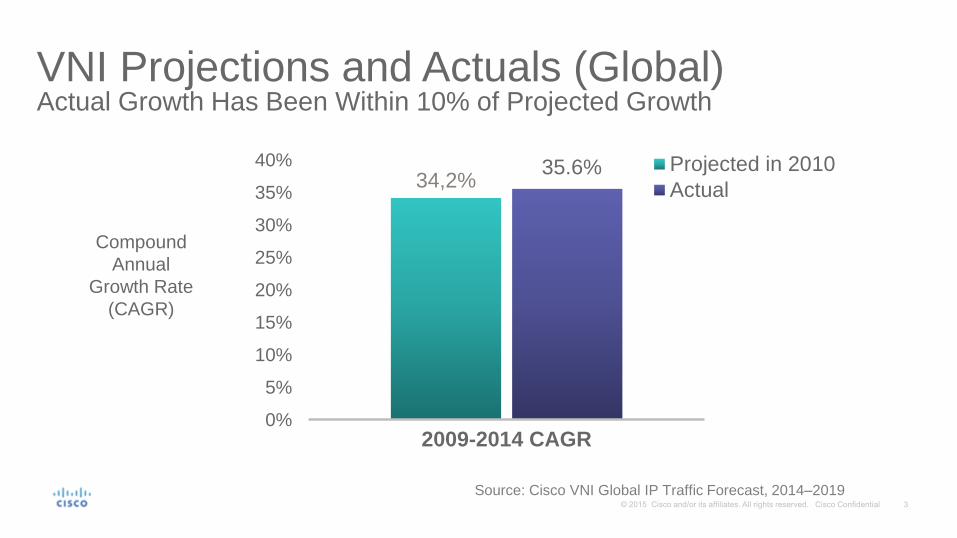
VNI Projections and Actuals (Global) Actual Growth Has Been Within 10% of Projected Growth
34,2%
0%
5%
10%
15%
20%
25%
30%
35%
40%
2009-2014 CAGR
Projected in 2010
Actual
Compound
Annual
Growth Rate
(CAGR)
Source: Cisco VNI Global IP Traffic Forecast, 2014–2019
35.6%
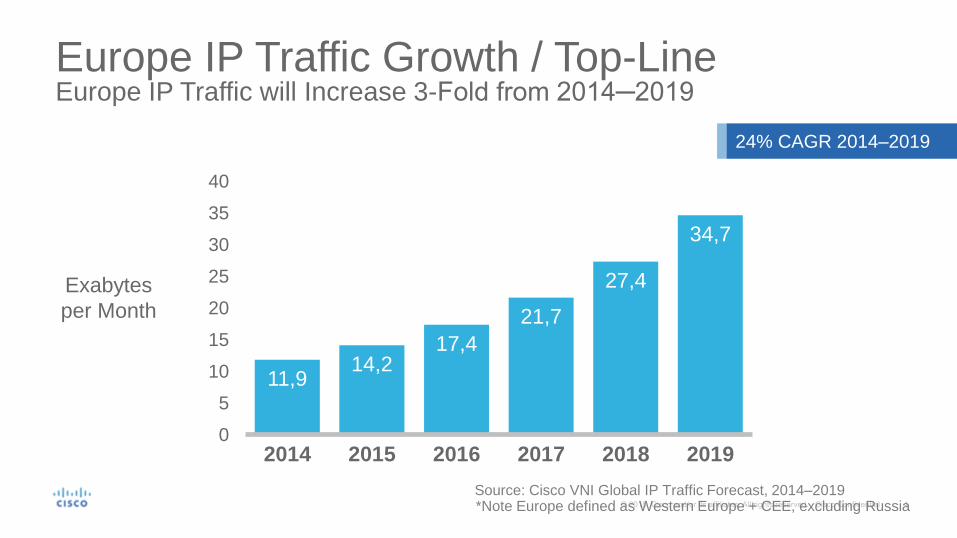
Europe IP Traffic Growth / Top-Line Europe IP Traffic will Increase 3-Fold from 2014─2019
Source: Cisco VNI Global IP Traffic Forecast, 2014–2019
24% CAGR 2014–2019
11,9 14,2
17,4
21,7
27,4
34,7
0
5
10
15
20
25
30
35
40
2014 2015 2016 2017 2018 2019
Exabytes
per Month
*Note Europe defined as Western Europe + CEE, excluding Russia
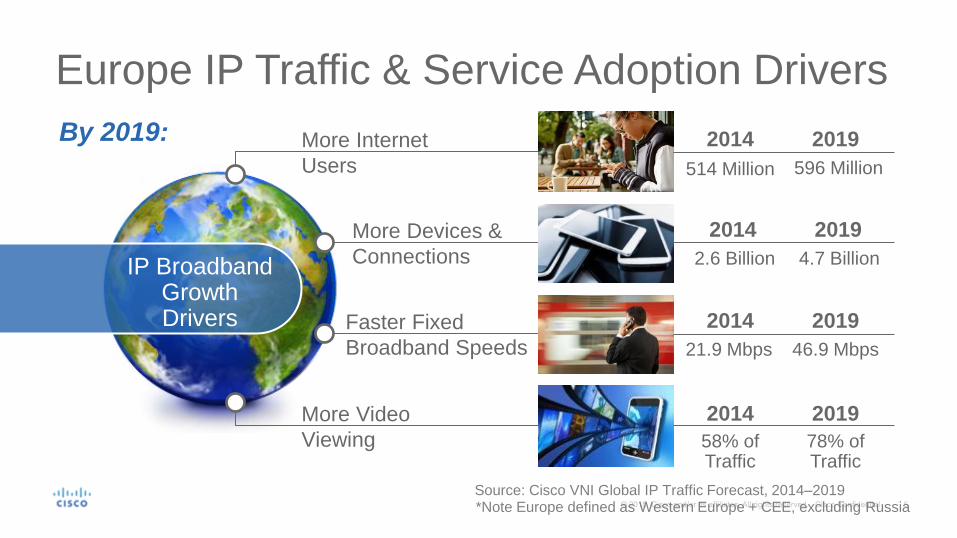
Europe IP Traffic & Service Adoption Drivers
More Devices &
Connections
More Internet
Users
Faster Fixed
Broadband Speeds
More Video
Viewing
Source: Cisco VNI Global IP Traffic Forecast, 2014–2019
By 2019:
2014 2019
2.6 Billion 4.7 Billion
2014 2019
21.9 Mbps 46.9 Mbps
2014 2019
514 Million 596 Million
2014 2019
58% of Traffic
78% of Traffic
IP Broadband Growth Drivers
*Note Europe defined as Western Europe + CEE, excluding Russia
0
5
10
15
20
25
30
35
40
2014 2015 2016 2017 2018 2019
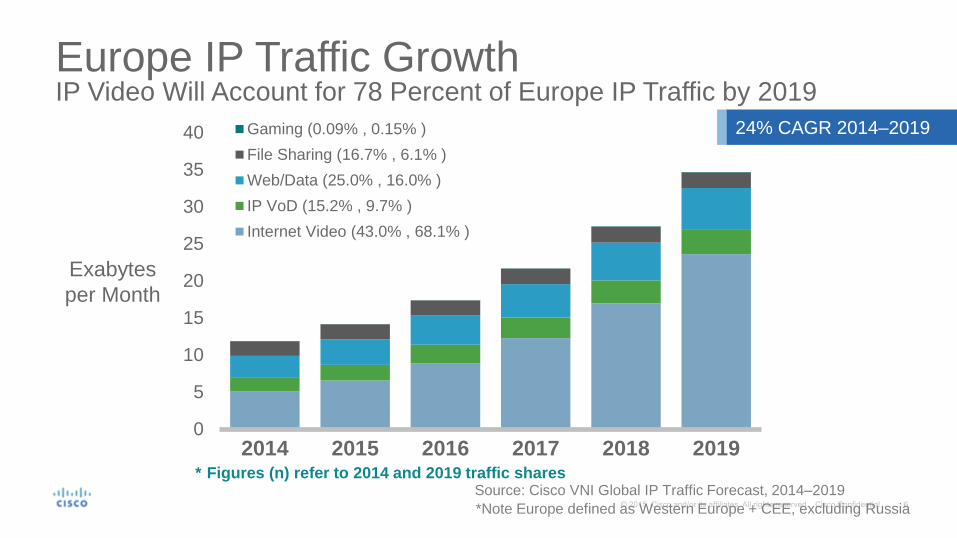
Gaming (0.09% , 0.15% )
File Sharing (16.7% , 6.1% )
Web/Data (25.0% , 16.0% )
IP VoD (15.2% , 9.7% )
Internet Video (43.0% , 68.1% )
Europe IP Traffic Growth IP Video Will Account for 78 Percent of Europe IP Traffic by 2019
24% CAGR 2014–2019
Source: Cisco VNI Global IP Traffic Forecast, 2014–2019
Exabytes
per Month
* Figures (n) refer to 2014 and 2019 traffic shares
*Note Europe defined as Western Europe + CEE, excluding Russia
0
1 000
2 000
3 000
4 000
5 000
6 000
7 000
2014 2015 2016 2017 2018 2019
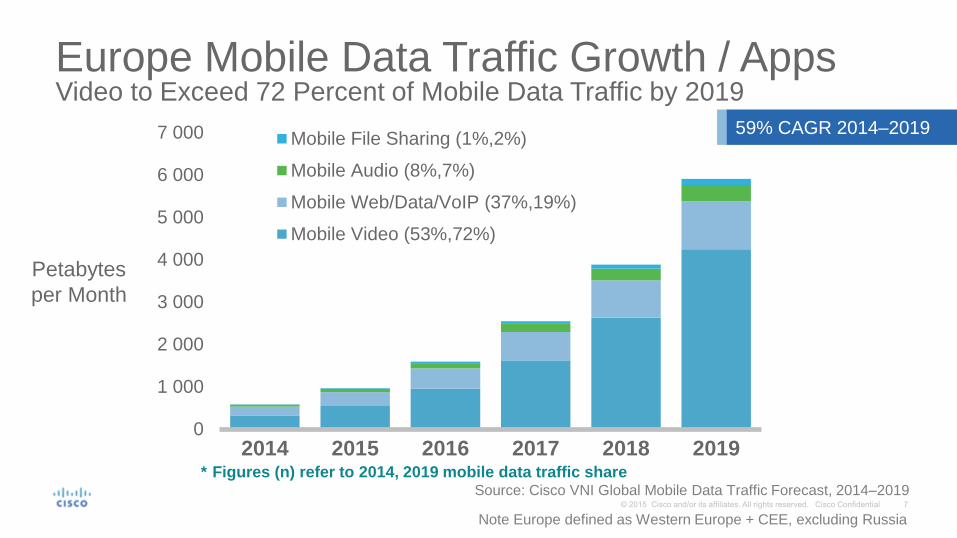
Mobile File Sharing (1%,2%)
Mobile Audio (8%,7%)
Mobile Web/Data/VoIP (37%,19%)
Mobile Video (53%,72%)
Europe Mobile Data Traffic Growth / Apps Video to Exceed 72 Percent of Mobile Data Traffic by 2019
59% CAGR 2014–2019
Source: Cisco VNI Global Mobile Data Traffic Forecast, 2014–2019
Petabytes
per Month
* Figures (n) refer to 2014, 2019 mobile data traffic share
Note Europe defined as Western Europe + CEE, excluding Russia
0
5
10
15
20
25
30
2014 2015 2016 2017 2018 2019
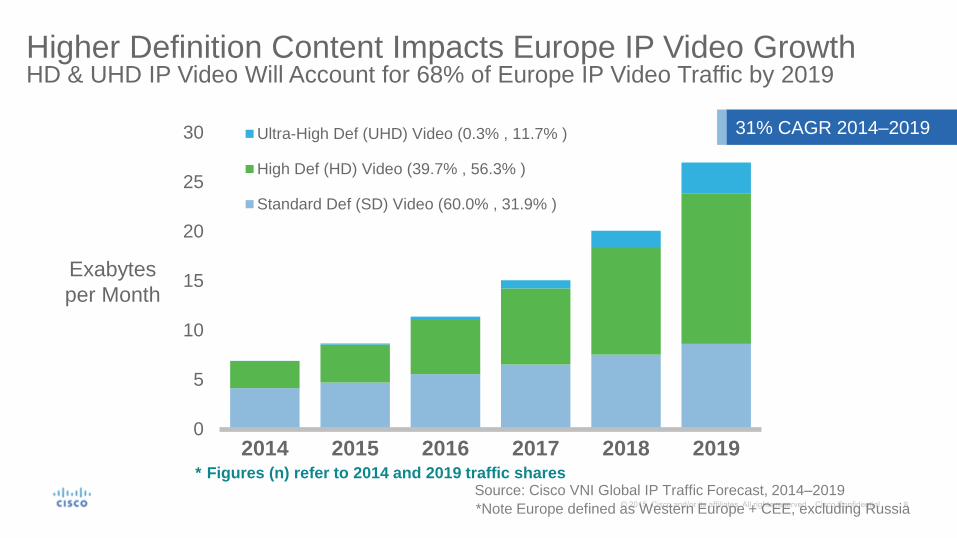
Ultra-High Def (UHD) Video (0.3% , 11.7% )
High Def (HD) Video (39.7% , 56.3% )
Standard Def (SD) Video (60.0% , 31.9% )
Higher Definition Content Impacts Europe IP Video Growth HD & UHD IP Video Will Account for 68% of Europe IP Video Traffic by 2019
31% CAGR 2014–2019
Source: Cisco VNI Global IP Traffic Forecast, 2014–2019
Exabytes
per Month
* Figures (n) refer to 2014 and 2019 traffic shares
*Note Europe defined as Western Europe + CEE, excluding Russia
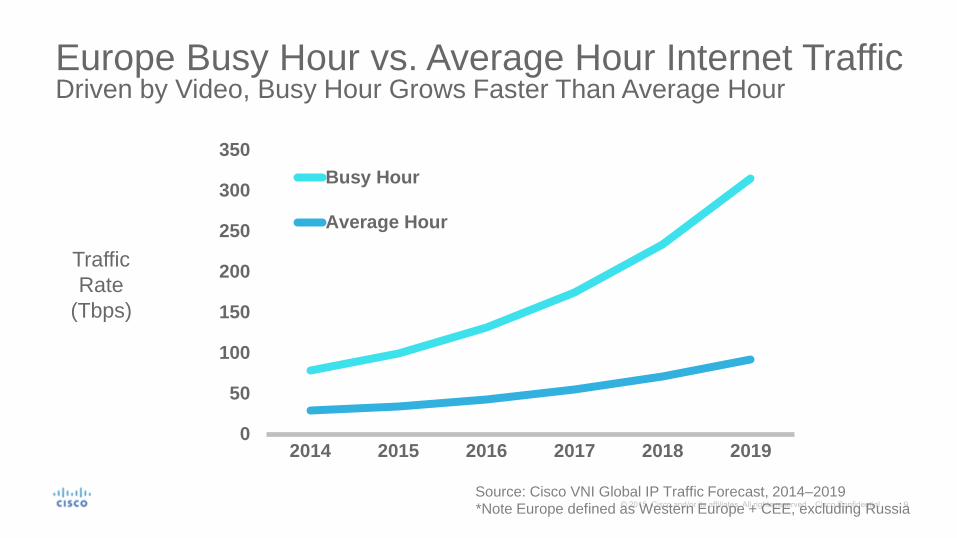
Europe Busy Hour vs. Average Hour Internet Traffic Driven by Video, Busy Hour Grows Faster Than Average Hour
0
50
100
150
200
250
300
350
2014 2015 2016 2017 2018 2019
Busy Hour
Average Hour
Traffic
Rate
(Tbps)
Source: Cisco VNI Global IP Traffic Forecast, 2014–2019 *Note Europe defined as Western Europe + CEE, excluding Russia
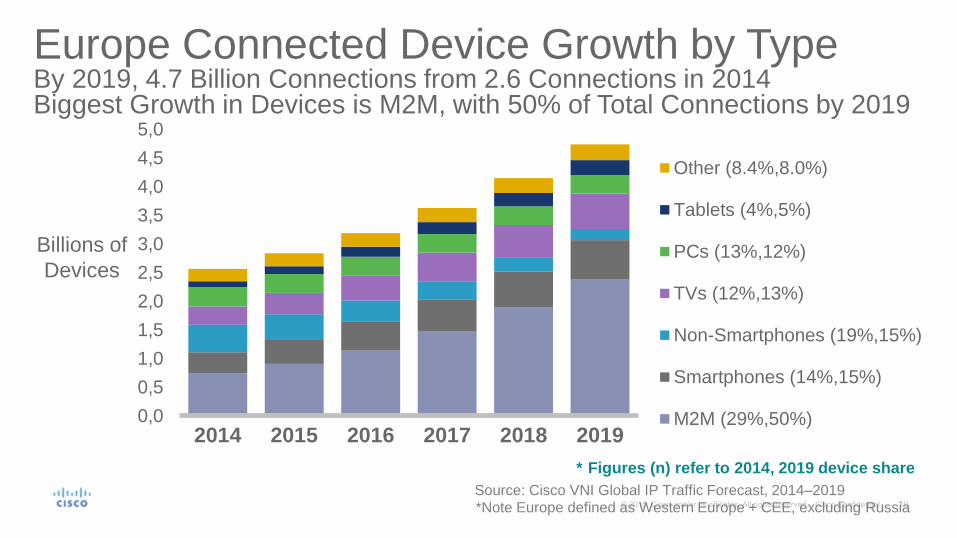
Europe Connected Device Growth by Type By 2019, 4.7 Billion Connections from 2.6 Connections in 2014 Biggest Growth in Devices is M2M, with 50% of Total Connections by 2019
0,0
0,5
1,0
1,5
2,0
2,5
3,0
3,5
4,0
4,5
5,0
2014 2015 2016 2017 2018 2019
Other (8.4%,8.0%)
Tablets (4%,5%)
PCs (13%,12%)
TVs (12%,13%)
Non-Smartphones (19%,15%)
Smartphones (14%,15%)
M2M (29%,50%)
Source: Cisco VNI Global IP Traffic Forecast, 2014–2019
Billions of
Devices
* Figures (n) refer to 2014, 2019 device share
*Note Europe defined as Western Europe + CEE, excluding Russia
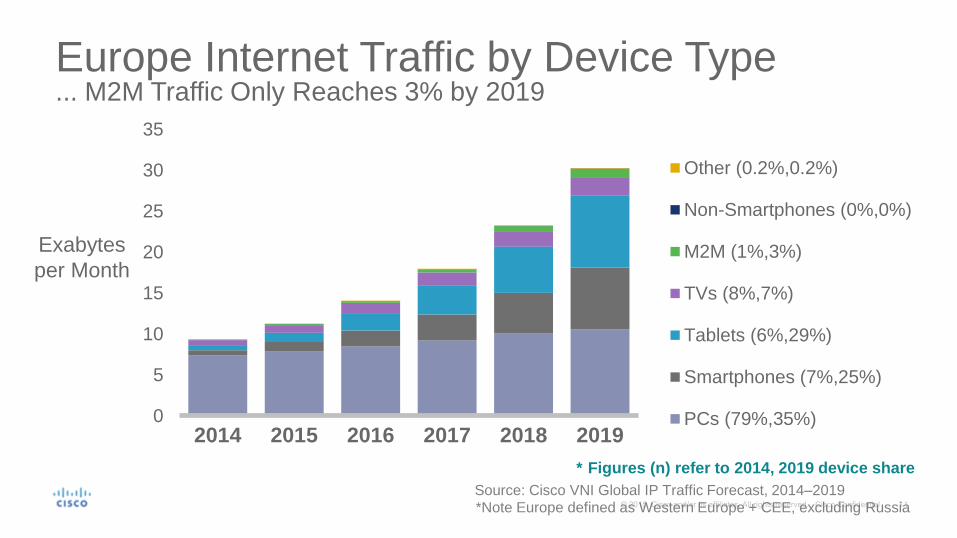
Europe Internet Traffic by Device Type ... M2M Traffic Only Reaches 3% by 2019
0
5
10
15
20
25
30
35
2014 2015 2016 2017 2018 2019
Other (0.2%,0.2%)
Non-Smartphones (0%,0%)
M2M (1%,3%)
TVs (8%,7%)
Tablets (6%,29%)
Smartphones (7%,25%)
PCs (79%,35%)
Source: Cisco VNI Global IP Traffic Forecast, 2014–2019
Exabytes
per Month
* Figures (n) refer to 2014, 2019 device share
*Note Europe defined as Western Europe + CEE, excluding Russia
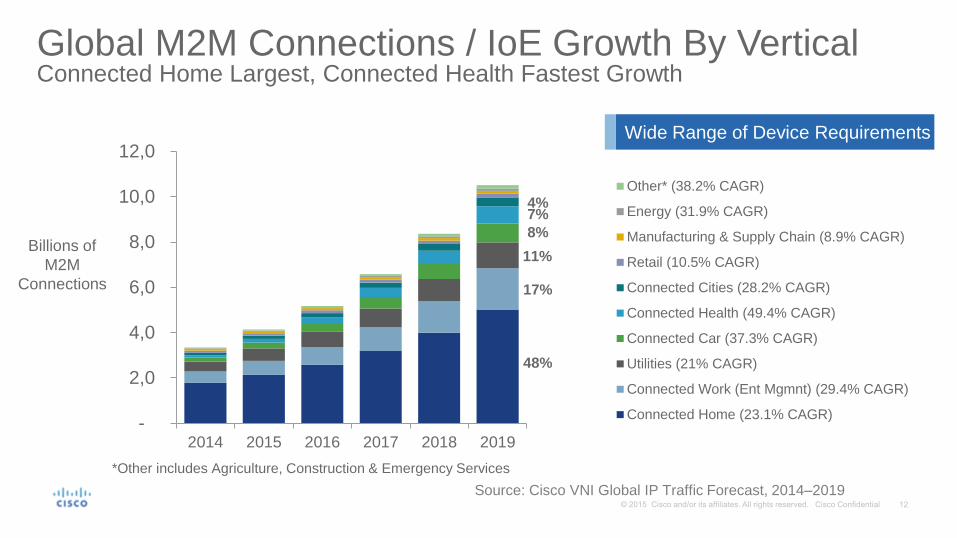
Global M2M Connections / IoE Growth By Vertical Connected Home Largest, Connected Health Fastest Growth
Wide Range of Device Requirements
Source: Cisco VNI Global IP Traffic Forecast, 2014–2019
-
2,0
4,0
6,0
8,0
10,0
12,0
2014 2015 2016 2017 2018 2019
Other* (38.2% CAGR)
Energy (31.9% CAGR)
Manufacturing & Supply Chain (8.9% CAGR)
Retail (10.5% CAGR)
Connected Cities (28.2% CAGR)
Connected Health (49.4% CAGR)
Connected Car (37.3% CAGR)
Utilities (21% CAGR)
Connected Work (Ent Mgmnt) (29.4% CAGR)
Connected Home (23.1% CAGR)
Billions of
M2M
Connections
*Other includes Agriculture, Construction & Emergency Services
48%
17%
11%
8%
7% 4%
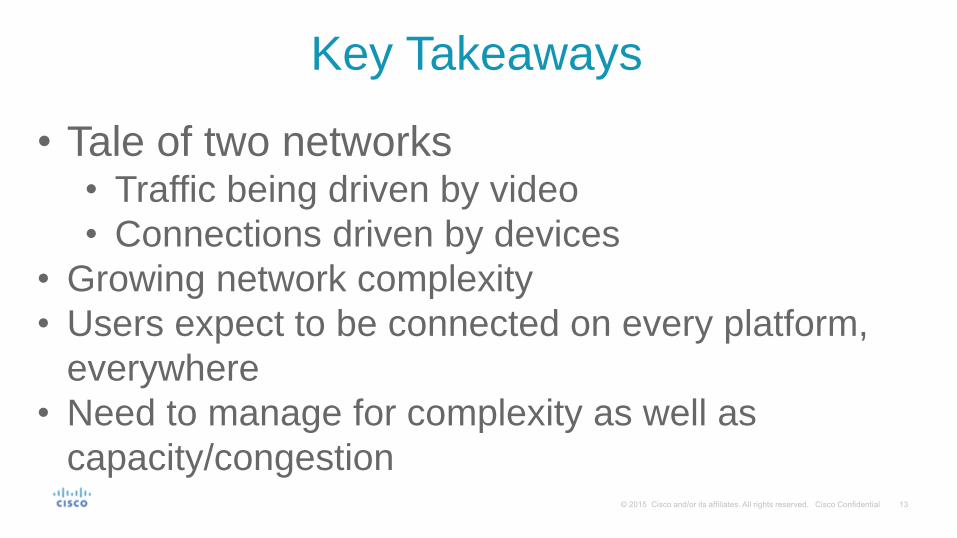
Key Takeaways
• Tale of two networks • Traffic being driven by video
• Connections driven by devices
• Growing network complexity
• Users expect to be connected on every platform,
everywhere
• Need to manage for complexity as well as
capacity/congestion

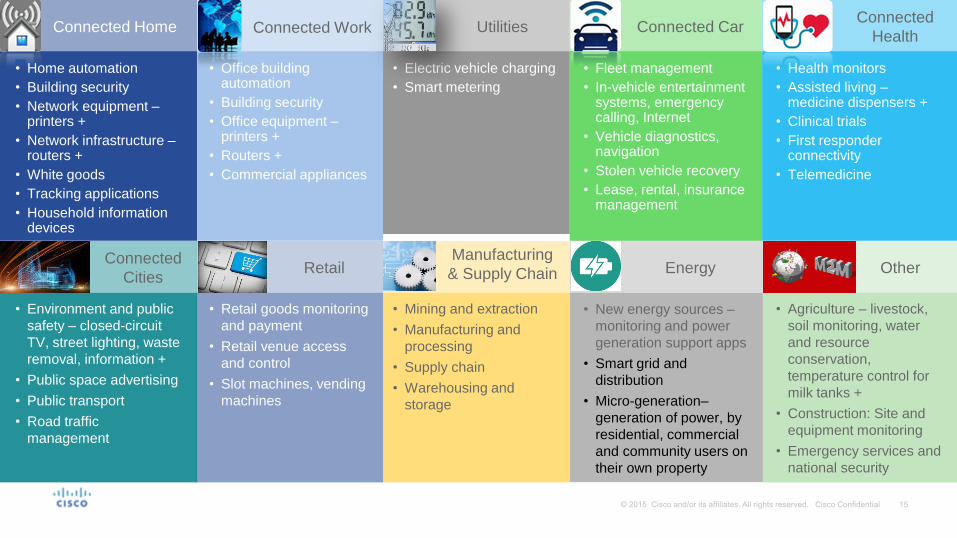
• Agriculture – livestock,
soil monitoring, water
and resource
conservation,
temperature control for
milk tanks +
• Construction: Site and
equipment monitoring
• Emergency services and
national security
• New energy sources –
monitoring and power
generation support apps
• Smart grid and
distribution
• Micro-generation–
generation of power, by
residential, commercial
and community users on
their own property
• Mining and extraction
• Manufacturing and
processing
• Supply chain
• Warehousing and
storage
• Retail goods monitoring
and payment
• Retail venue access
and control
• Slot machines, vending
machines
• Environment and public
safety – closed-circuit
TV, street lighting, waste
removal, information +
• Public space advertising
• Public transport
• Road traffic
management
• Health monitors
• Assisted living – medicine dispensers +
• Clinical trials
• First responder connectivity
• Telemedicine
• Fleet management
• In-vehicle entertainment systems, emergency calling, Internet
• Vehicle diagnostics, navigation
• Stolen vehicle recovery
• Lease, rental, insurance management
• Electric vehicle charging
• Smart metering
• Office building automation
• Building security
• Office equipment – printers +
• Routers +
• Commercial appliances
• Home automation
• Building security
• Network equipment – printers +
• Network infrastructure – routers +
• White goods
• Tracking applications
• Household information devices
Connected Car Connected Work Connected Home Connected
Health Utilities
Other Energy Retail Connected
Cities
Manufacturing
& Supply Chain
Related Documents