© DHS 2017 1 9757/H2 Economics Prelims/Paper 1 1DPH ,QGH[ 1XPEHU &ODVV '810$1 +,*+ 6&+22/ 3UHOLPLQDU\ ([DPLQDWLRQ <HDU (&2120,&6 +LJKHU 3DSHU 6HSWHPEHU KRXUV PLQXWHV SP ア SP Additional Materials: Writing Papers 2 strings 5($' 7+(6( ,16758&7,216 ),567 Answer DOO questions. Write your answers on the separate writing paper provided. Write your name and class on all pieces of work handed in. Write in dark blue or black pen on both sides of the paper. You may use a soft pencil for any diagrams, graphs or rough working. Do not use staples, paper clips, highlighters, glue or correction fluid. Please start on a IUHVK sheet of paper for a new question. The number of marks is given in brackets [ ] at the end of each question or part question. At the end of the examination, fasten all your work securely into WZR separate bundles (one for Question 1 and one for Question 2), using the strings provided. This document consists of printed pages including this cover page. >7XUQ RYHU

Welcome message from author
This document is posted to help you gain knowledge. Please leave a comment to let me know what you think about it! Share it to your friends and learn new things together.
Transcript

© DHS 2017 1 9757/H2 Economics Prelims/Paper 1
Additional Materials: Writing Papers 2 strings
Answer questions.
Write your answers on the separate writing paper provided.
Write your name and class on all pieces of work handed in.
Write in dark blue or black pen on both sides of the paper.
You may use a soft pencil for any diagrams, graphs or rough working.
Do not use staples, paper clips, highlighters, glue or correction fluid.
Please start on a sheet of paper for a new question.
The number of marks is given in brackets [ ] at the end of each question or part question.
At the end of the examination, fasten all your work securely into separate bundles (one for Question 1 and one for Question 2), using the strings provided.
This document consists of printed pages including this cover page.
© DHS 2017 9757/H2 Economics Prelims/Paper 1
Answer questions.
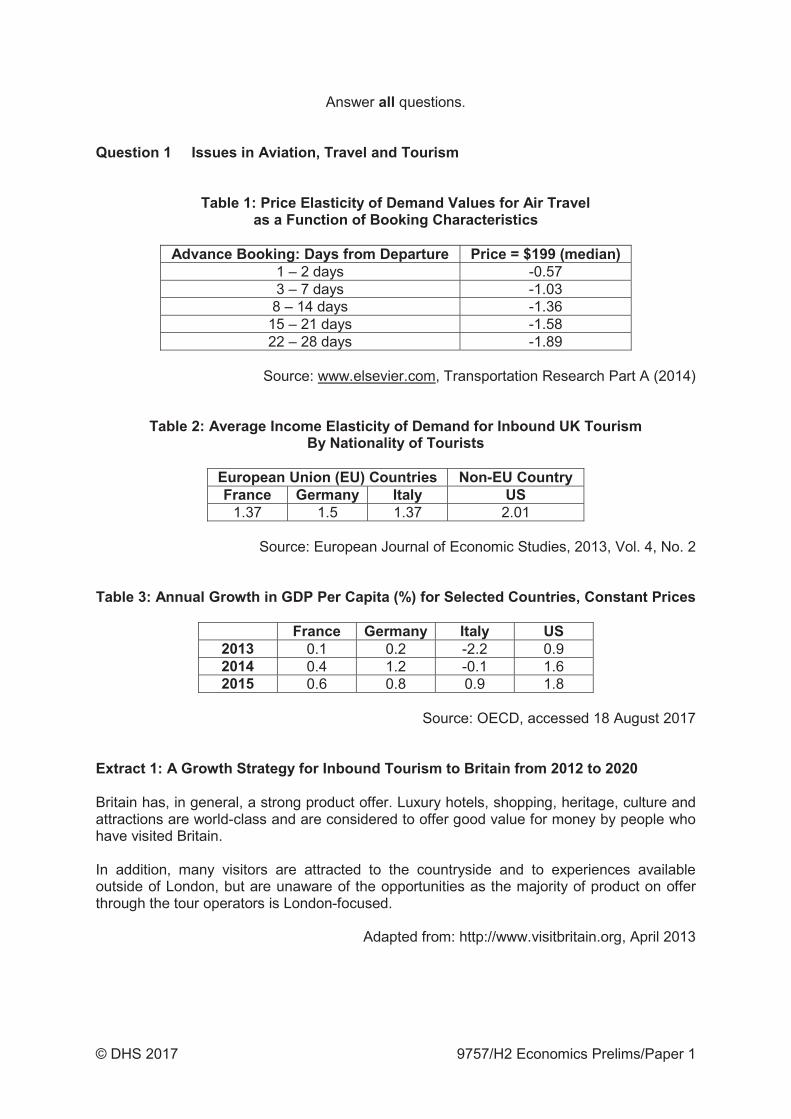
1 – 2 days -0.57 3 – 7 days -1.03 8 – 14 days -1.36
15 – 21 days -1.58 22 – 28 days -1.89
Source: www.elsevier.com, Transportation Research Part A (2014)
1.37 1.5 1.37 2.01
Source: European Journal of Economic Studies, 2013, Vol. 4, No. 2
0.1 0.2 -2.2 0.9 0.4 1.2 -0.1 1.6 0.6 0.8 0.9 1.8
Source: OECD, accessed 18 August 2017
Britain has, in general, a strong product offer. Luxury hotels, shopping, heritage, culture and attractions are world-class and are considered to offer good value for money by people who have visited Britain.
In addition, many visitors are attracted to the countryside and to experiences available outside of London, but are unaware of the opportunities as the majority of product on offer through the tour operators is London-focused.
Adapted from: http://www.visitbritain.org, April 2013
© DHS 2017 9757/H2 Economics Prelims/Paper 1
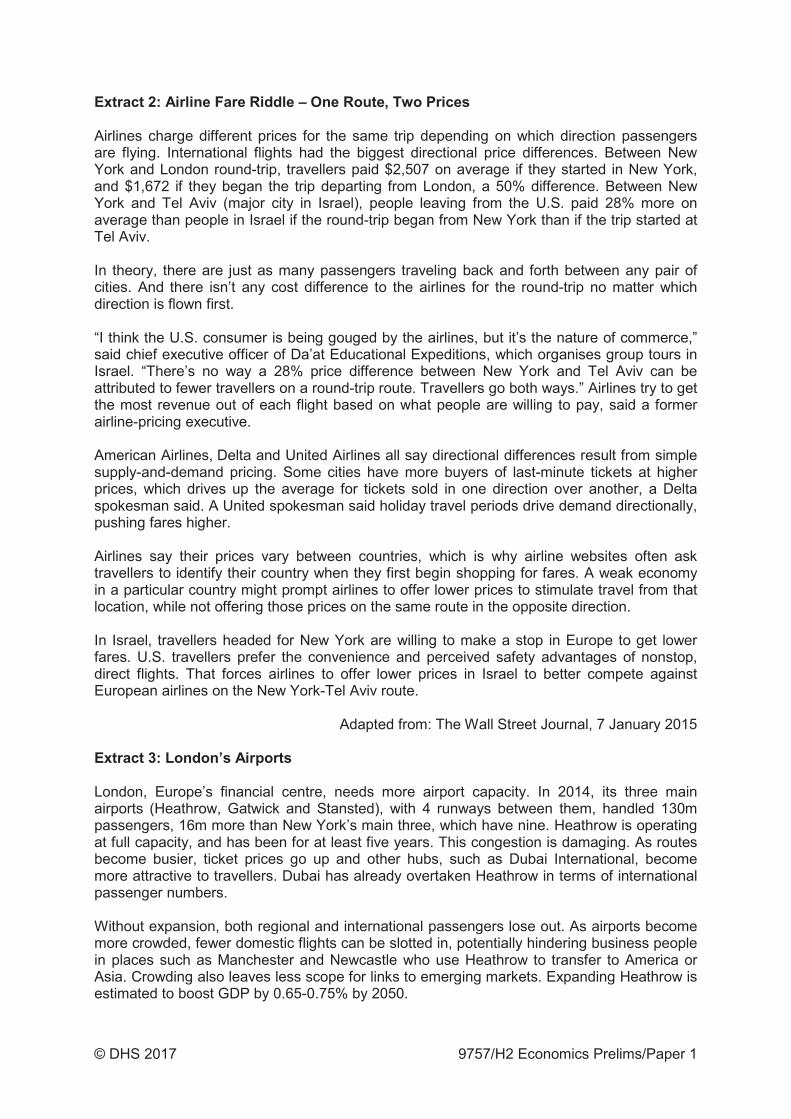
Airlines charge different prices for the same trip depending on which direction passengers are flying. International flights had the biggest directional price differences. Between New York and London round-trip, travellers paid $2,507 on average if they started in New York, and $1,672 if they began the trip departing from London, a 50% difference. Between New York and Tel Aviv (major city in Israel), people leaving from the U.S. paid 28% more on average than people in Israel if the round-trip began from New York than if the trip started at Tel Aviv.
In theory, there are just as many passengers traveling back and forth between any pair of cities. And there isn’t any cost difference to the airlines for the round-trip no matter which direction is flown first.
“I think the U.S. consumer is being gouged by the airlines, but it’s the nature of commerce,” said chief executive officer of Da’at Educational Expeditions, which organises group tours in Israel. “There’s no way a 28% price difference between New York and Tel Aviv can be attributed to fewer travellers on a round-trip route. Travellers go both ways.” Airlines try to get the most revenue out of each flight based on what people are willing to pay, said a former airline-pricing executive.
American Airlines, Delta and United Airlines all say directional differences result from simple supply-and-demand pricing. Some cities have more buyers of last-minute tickets at higher prices, which drives up the average for tickets sold in one direction over another, a Delta spokesman said. A United spokesman said holiday travel periods drive demand directionally, pushing fares higher.
Airlines say their prices vary between countries, which is why airline websites often ask travellers to identify their country when they first begin shopping for fares. A weak economy in a particular country might prompt airlines to offer lower prices to stimulate travel from that location, while not offering those prices on the same route in the opposite direction.
In Israel, travellers headed for New York are willing to make a stop in Europe to get lower fares. U.S. travellers prefer the convenience and perceived safety advantages of nonstop, direct flights. That forces airlines to offer lower prices in Israel to better compete against European airlines on the New York-Tel Aviv route.
Adapted from: The Wall Street Journal, 7 January 2015
London, Europe’s financial centre, needs more airport capacity. In 2014, its three main airports (Heathrow, Gatwick and Stansted), with 4 runways between them, handled 130m passengers, 16m more than New York’s main three, which have nine. Heathrow is operating at full capacity, and has been for at least five years. This congestion is damaging. As routes become busier, ticket prices go up and other hubs, such as Dubai International, become more attractive to travellers. Dubai has already overtaken Heathrow in terms of international passenger numbers.
Without expansion, both regional and international passengers lose out. As airports become more crowded, fewer domestic flights can be slotted in, potentially hindering business people in places such as Manchester and Newcastle who use Heathrow to transfer to America or Asia. Crowding also leaves less scope for links to emerging markets. Expanding Heathrow is estimated to boost GDP by 0.65-0.75% by 2050.
© DHS 2017 9757/H2 Economics Prelims/Paper 1
Although the number of residents affected by aircraft noise has fallen sharply over the past two decades as planes have become quieter, it still affects over 200,000 people. Air pollution, already high in areas near the airport, would increase and could blight up to 47,000 homes, unless a low-emission zone was put into place. However, the expansion is likely to be beneficial if Heathrow provides more generous compensation to those who are affected by noise or have to relocate their homes.
Adapted from: The Economist, 4 July 2015
The plan involves building a new 3,500m runway at an estimated cost of £18.6bn. The Heathrow scheme is predicted to create the most jobs and make the most money for the country, adding £147bn in economic growth and 70,000 jobs by 2050. Heathrow expansion is seen as the best short-term option to keep Britain competitive with its European rivals. Heathrow is a big employer and supporters cite a knock-on effect on businesses in the area.
A report by economist Sir Howard Davies said that the new runway should come with severe restrictions to reduce the environmental and noise effects. Night flights should be banned and the government should pledge not to build a fourth runway. The report also recommends an aviation noise levy to fund insulation for homes and schools, and says a legal commitment should be made on air quality.
Heathrow would become the biggest emitter of carbon dioxide in the country. Noise pollution would become even worse for the 760,000 people already living under the flight path – and nearly 800 homes would have to be demolished to build the new runway due to its location in a heavily built-up area.
No one really knows whether long-term aviation will continue growing as it has so far. Even those who are building the new generation of airports wonder if the trend will hold.
Adapted from: BBC, 29 June 2015 and 1 July 2015
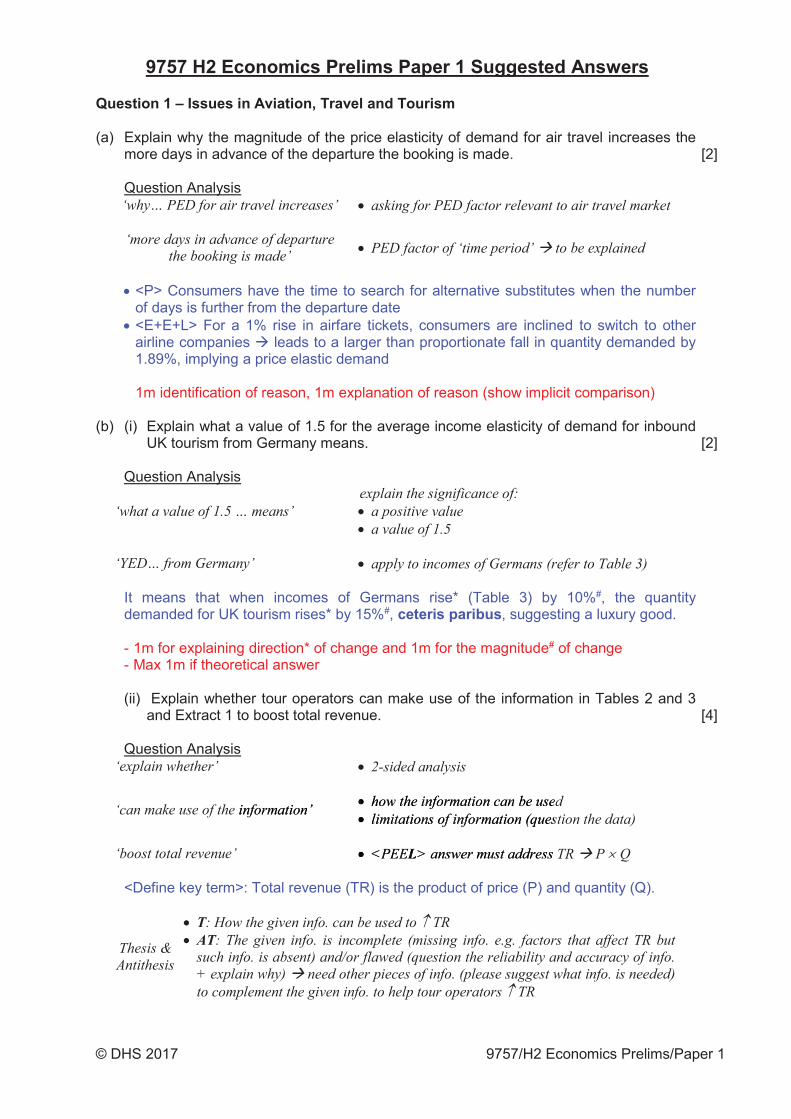
(a) Explain why the magnitude of the price elasticity of demand for air travel increases the more days in advance of the departure the booking is made. [2]
(b) (i) Explain what a value of 1.5 for the average income elasticity of demand for inbound UK tourism from Germany means. [2]
(ii) Explain whether tour operators can make use of the information in Tables 2 and 3 and Extract 1 to boost total revenue. [4]
(c) Discuss whether the ‘Airline Fare Riddle – One Route, Two Prices’ (Extract 2) is an example of price discrimination. [8]
(d) With the aid of a diagram, explain what determines whether consumers or producers would likely bear a greater tax burden when ‘an aviation noise levy’ (Extract 4) is imposed. [4]
(e) In view of the possible economic impact, assess whether the expansion of the Heathrow runway can ever be justified. [10]

© DHS 2017 9757/H2 Economics Prelims/Paper 1
© DHS 2017 9757/H2 Economics Prelims/Paper 1
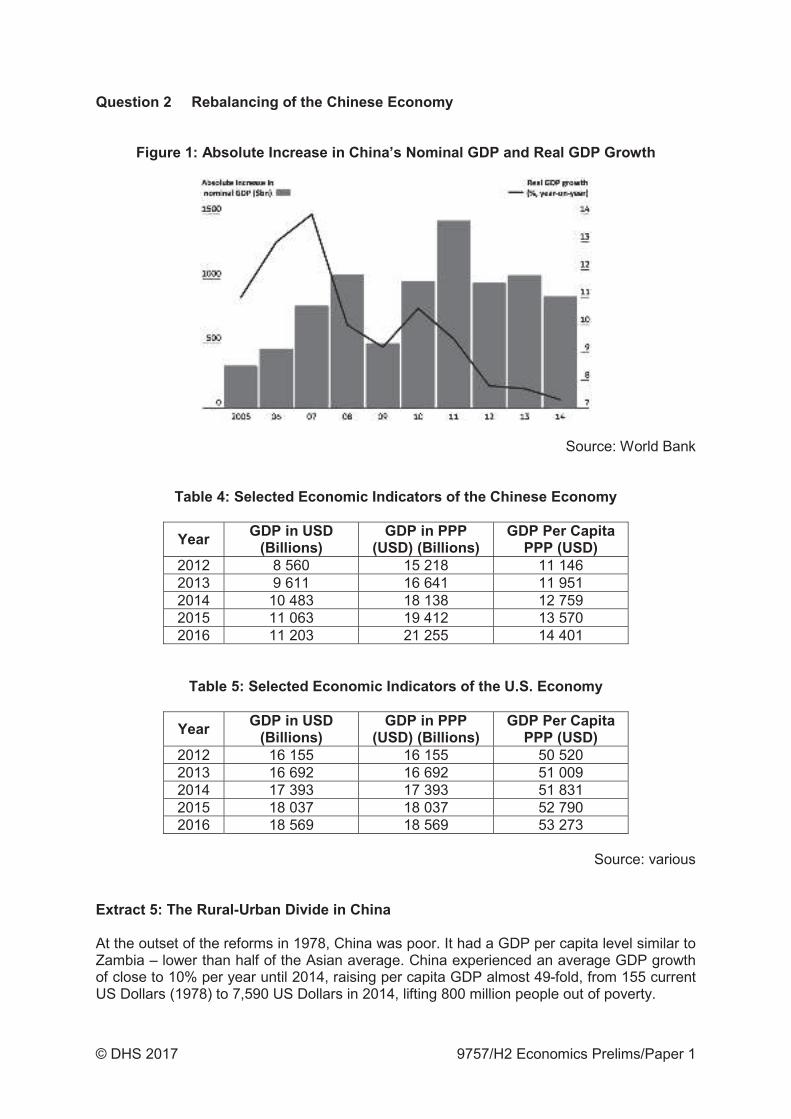
Source: World Bank
2012 8 560 15 218 11 146 2013 9 611 16 641 11 951 2014 10 483 18 138 12 759 2015 11 063 19 412 13 570 2016 11 203 21 255 14 401
2012 16 155 16 155 50 520 2013 16 692 16 692 51 009 2014 17 393 17 393 51 831 2015 18 037 18 037 52 790 2016 18 569 18 569 53 273
Source: various
At the outset of the reforms in 1978, China was poor. It had a GDP per capita level similar to Zambia – lower than half of the Asian average. China experienced an average GDP growth of close to 10% per year until 2014, raising per capita GDP almost 49-fold, from 155 current US Dollars (1978) to 7,590 US Dollars in 2014, lifting 800 million people out of poverty.
© DHS 2017 9757/H2 Economics Prelims/Paper 1
In urban cities in China, poverty has been virtually eliminated. However, China’s development has been driven by the coastal east, while the rural west is lagging behind. This difference in development within China sparked rural-urban migration, where rural dwellers sought jobs and the prospect of better lives in urban cities.
The average take-home pay of migrant workers, who are among China’s lowest paid, is often less than half the overall average wage in China’s major cities. One veteran employee in Chongqing explained: “The average pay for manual labourers at the enterprise was between 2,000 to 3,000 yuan per month while professionals usually got around 12,000 yuan a month.”
Adapted from: World Economic Forum, 23 June 2016 and China Labour Bulletin, 20 July 2016
Chinese investors are increasingly snatching up U.S.-based firms and assets. Until recently, three quarters of Chinese foreign investment was in energy, natural resources, and related transportation infrastructure. Now, with investment returns on commodities low, China has shifted its focus onto industries with higher rates of return, such as entertainment, real estate, insurance, and technology – industries where the U.S. is the dominant market. Since global commodity prices are likely to remain weak for the next two or three years, the table is set for much more Chinese investment in the U.S.
The eclectic pool of U.S. investments and holdings tied to the Chinese – including New York's Waldorf Astoria hotel, the national AMC Theatres cinema chain, Starwood Hotels, California-based tech firm Ingram Micro and Smithfield Foods, America's largest pork producer – also suggest that Chinese firms are attempting to buy up international assets in a less volatile economy like America's. By spreading out Chinese-owned assets, the country can better protect itself from an unexpected domestic crisis and the conservative consumption patterns of Chinese consumers. The shift to focus on outward foreign investment will do much good for China’s balance of payments and long run development.
On the other hand, it's important not to overlook the economic benefits foreign investment brings to the U.S. Although there has been evidence in recent years of American job losses related to the rise of China's industrial sector, Chinese foreign direct investment offers an interesting avenue to bring jobs back to the U.S.
"One of the biggest challenges I had was we had a lot of exports. But the exports were our children leaving our community because of the lack of manufacturing jobs, the lack of good jobs for our children," Sheldon Day, mayor of Thomasville, Alabama, said during a National Committee on U.S.-China Relations event in October.
Day's rural Alabama region recently became the site of Golden Dragon Precise Copper Tube Group's first U.S. plant in a move that was expected to bring hundreds of jobs to Americans while cutting down on steep transportation costs Golden Dragon would have faced if it tried to ship Chinese-made products into the U.S. marketplace.
Day said in October that the factory's opening made "a tremendous difference in our community and our economy. Now, we have a Chinese product that was previously made in China that's now being made by Alabamians," he said. "And it's being used here and being shipped to U.S. firms."
Adapted from: US News, 17 May 2016 and Forbes, 10 December 2015
© DHS 2017 9757/H2 Economics Prelims/Paper 1
China now embraces comprehensively deepened reforms to build a moderately prosperous society with slower, high-quality growth. China has still to substantially narrow the income gap between rural and urban residents, cut overcapacity and speed up industrial restructuring, and arrest environmental deterioration.
First, to reduce income disparity between rural and urban areas, China will press ahead with the ongoing course of urbanisation, not only to reap the productivity gains related to the migration of rural residents to cities, who are among the lowest paid. Booming Chinese cities will continue to drive inclusive growth as the government strives to expand equal access to public resources.
Second, to deal with overcapacity and accelerate the industrial upgrade. On one hand, the central government has reduced administrative approvals required to encourage markets to boost innovation and produce high value added goods. On the other hand, China announced plans to develop the “Internet Plus” plan in March, to upgrade the manufacturing powerhouse by riding the tide of internet-led innovation.
Third, never underestimate China’s sense of urgency to address environmental problems or its eagerness to explore opportunities from greener growth. As the world’s largest investor in low-carbon energy, with an investment of about $90 billion last year, China aims to cap CO2 emission by 2030. To this end, by 2020 the country plans to install 100 gigawatts of solar power – almost half the current global capacity – and 200 gigawatts of wind power. And as both theworld’s largest auto market and the largest automaker, one should not be that surprised to see China’s attempts to leap ahead of other competitors in the field of electric cars.
Adapted from: The Telegraph, 25 April 2015
(a) (i) What is the difference between real gross domestic product (GDP) and nominal GDP? [1]
(ii) Describe the trend of China’s real GDP between 2005 and 2014. [2]
(b) (i) Explain why China’s GDP in PPP (USD) (billions) is higher than China’s GDP in USD (billions) from 2012 to 2016. [2]
(ii) Comment on whether the data in Tables 4 and 5 is sufficient to conclude that in 2016, the
average U.S. citizen has a higher standard of living than the average Chinese citizen. [3]
(c) With the use of diagrams, explain the effect of rural-urban migration on wage differential between manual labourers and professionals in the urban cities. [4]
(d) Discuss whether China or U.S. has more to gain from the increased inflow of foreign direct investment from China into U.S. [8]
(e) As a consultant to China’s largest trade union, All-China Federation of Trade Unions (ACFTU), what options would you present and recommend to the government as possible responses to improve the welfare of Chinese workers? Justify your answer. [10]


© DHS 2017 1 9757/H2 Economics Prelims/Paper 2
Additional Materials: Writing Papers 3 Strings
Answer questions in total, of which must be from Section A, from Section B and from Section A or Section B.
Write your answers on the separate writing paper provided.
Write your name and civics class on all pieces of work handed in.
Write in dark blue or black pen on both sides of the paper.
You may use a soft pencil for any diagrams, graphs or rough working.
Do not use staples, paper clips, highlighters, glue or correction fluid.
Please start on a sheet of paper for a new question.
The number of marks is given in brackets [ ] at the end of each question or part question.
At the end of the examination, please securely fasten all essays , using the strings provided.
Please tick all questions attempted in the boxes below.
This document consists of printed pages including this cover page.
Answer questions in total.
© DHS 2017 9757/H2 Economics Prelims/Paper 2
of your three chosen questions must be from this section.
Sugarcane, a water-intensive crop that takes 10 to 18 months to harvest, has many uses. It can be made into sugar, a natural sweetener for food and fermented to produce sugarcane ethanol, a biofuel for the transport sector. In recent years, a number of developments have taken place in the Indian sugarcane market. In addition to rising fertiliser costs, sugarcane crop suffered from severe damage from a faltering monsoon in India. Amid India’s relatively strong economic growth that encourages higher food consumption, the Indian government has raised the minimum support price of sugarcane ethanol to ensure its adequate supply.
Discuss the impact these events are likely to have had on consumer expenditure on sugarcane and its related markets in India. [25]
Explain the cost savings that may arise from the expansion of firms and industries. [10]
A report by a German magazine claimed that car-makers had colluded for decades on prices to the detriment of foreign rivals. Some German car-makers however commented that it is more common for them to compete, although the smaller ones may cooperate in areas such as sourcing to negotiate better contracts with suppliers.
Discuss whether cooperation, collusion or competition is the best strategy to increase a firm’s profits. [15]
With reference to examples, explain why rational decision-making by consumers might not be aligned to the government. [10]
Discuss the extent that knowing the root cause of the misalignment is sufficient in determining the policy measure to adopt. [15]
of your three chosen questions must be from this section.
Using the circular flow of income, explain how a fall in exports might impact unemployment in an economy. [10]
Discuss whether the size of multiplier is the main factor in determining the choice of macroeconomic policies to reduce unemployment in Singapore. [15]
With the economy much closer to full employment now and a strong likelihood of a fiscal stimulus next year… we expect the US Federal Reserve to accelerate the pace of interest rate hikes next year.
Source: http://money.cnn.com, 15 Dec 2016
Explain the need for the US Federal Reserve to accelerate the pace of interest rates hikes. [10]
Discuss the view that price stability should always take priority over other macroeconomic objectives.[15]
Using examples, explain why comparative advantage of a country might change over time. [10]
To what extent should changing comparative advantage be used as a justification for protectionism?[15]
*********************
© DHS 2017 9757/H2 Economics Prelims/Paper 1
© DHS 2017 9757/H2 Economics Prelims/Paper 1
(a) Explain why the magnitude of the price elasticity of demand for air travel increases themore days in advance of the departure the booking is made. [2]
Question Analysis
<P> Consumers have the time to search for alternative substitutes when the numberof days is further from the departure date<E+E+L> For a 1% rise in airfare tickets, consumers are inclined to switch to otherairline companies leads to a larger than proportionate fall in quantity demanded by1.89%, implying a price elastic demand
1m identification of reason, 1m explanation of reason (show implicit comparison)
(b) (i) Explain what a value of 1.5 for the average income elasticity of demand for inboundUK tourism from Germany means. [2]
Question Analysis
It means that when incomes of Germans rise* (Table 3) by 10%#, the quantity demanded for UK tourism rises* by 15%#, , suggesting a luxury good.
- 1m for explaining direction* of change and 1m for the magnitude# of change- Max 1m if theoretical answer
(ii) Explain whether tour operators can make use of the information in Tables 2 and 3and Extract 1 to boost total revenue. [4]
Question Analysis
<Define key term>: Total revenue (TR) is the product of price (P) and quantity (Q).
© DHS 2017 9757/H2 Economics Prelims/Paper 1
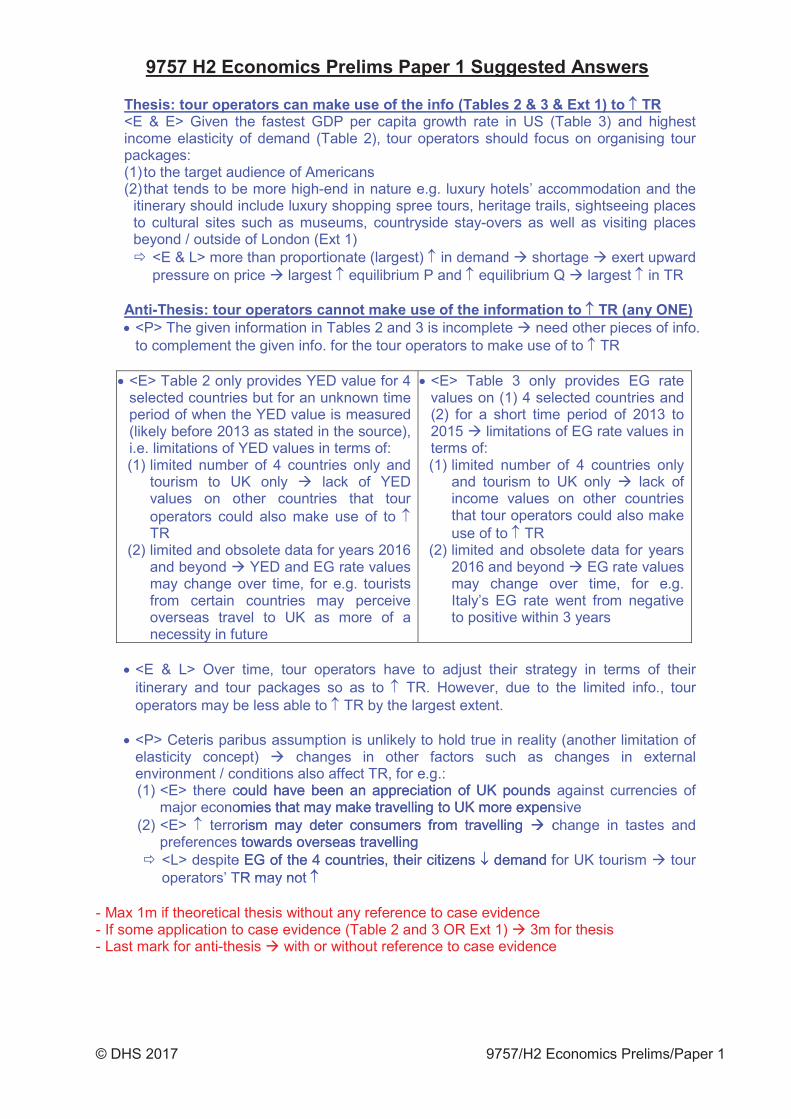
<E & E> Given the fastest GDP per capita growth rate in US (Table 3) and highest income elasticity of demand (Table 2), tour operators should focus on organising tour packages: (1) to the target audience of Americans (2) that tends to be more high-end in nature e.g. luxury hotels’ accommodation and the
itinerary should include luxury shopping spree tours, heritage trails, sightseeing places to cultural sites such as museums, countryside stay-overs as well as visiting places beyond / outside of London (Ext 1)
<E & L> more than proportionate (largest) in demand shortage exert upward pressure on price largest equilibrium P and equilibrium Q largest in TR
<P> The given information in Tables 2 and 3 is incomplete need other pieces of info. to complement the given info. for the tour operators to make use of to TR
<E> Table 2 only provides YED value for 4 selected countries but for an unknown time period of when the YED value is measured (likely before 2013 as stated in the source), i.e. limitations of YED values in terms of: (1) limited number of 4 countries only and
tourism to UK only lack of YED values on other countries that tour operators could also make use of to TR
(2) limited and obsolete data for years 2016 and beyond YED and EG rate values may change over time, for e.g. tourists from certain countries may perceive overseas travel to UK as more of a necessity in future
<E> Table 3 only provides EG rate values on (1) 4 selected countries and (2) for a short time period of 2013 to 2015 limitations of EG rate values in terms of: (1) limited number of 4 countries only
and tourism to UK only lack of income values on other countries that tour operators could also make use of to TR
(2) limited and obsolete data for years 2016 and beyond EG rate values may change over time, for e.g. Italy’s EG rate went from negative to positive within 3 years
<E & L> Over time, tour operators have to adjust their strategy in terms of their itinerary and tour packages so as to TR. However, due to the limited info., tour operators may be less able to TR by the largest extent.
<P> Ceteris paribus assumption is unlikely to hold true in reality (another limitation of elasticity concept) changes in other factors such as changes in external environment / conditions also affect TR, for e.g.: (1) <E> there could have been an appreciation of UK pounds against currencies of
major economies that may make travelling to UK more expensive (2) <E> terrorism may deter consumers from travelling change in tastes and
preferences towards overseas travelling <L> despite EG of the 4 countries, their citizens demand for UK tourism tour operators’ TR may not
- Max 1m if theoretical thesis without any reference to case evidence - If some application to case evidence (Table 2 and 3 OR Ext 1) 3m for thesis - Last mark for anti-thesis with or without reference to case evidence
, gcould have been an appreciation of UK popopoununundsddomies that may make travelling tttttttto oo o o ooooooo o UKUKKUKUKUKUK mmmorororeee exexexpepp norism may deter consumers from mmm m mmmmmm trtrtrtrt aaavavavaa elliingngng c
towards overseas travelling e EG of the 4 countries, their citizeeensnsns dddemememand fTR may not
© DHS 2017 9757/H2 Economics Prelims/Paper 1
(c) Discuss whether the ‘Airline Fare Riddle – One Route, Two Prices’ (Extract 2) is an example of price discrimination. [8]
Question Analysis
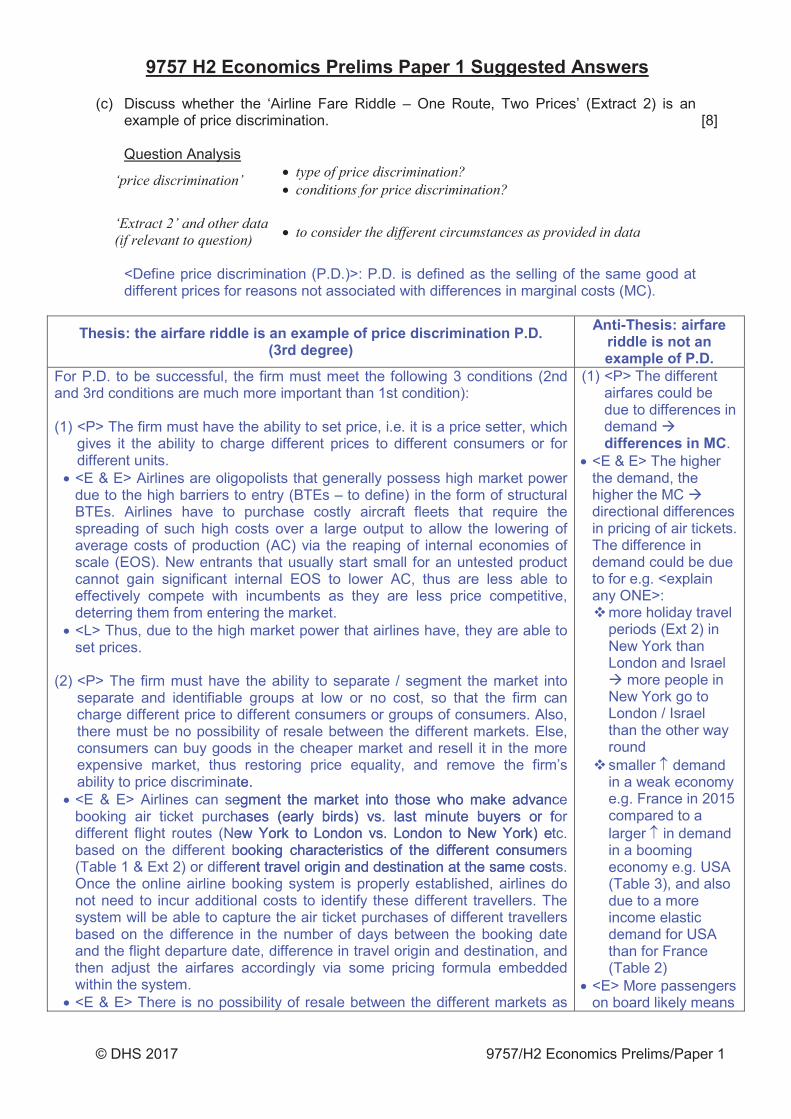
<Define price discrimination (P.D.)>: P.D. is defined as the selling of the same good at different prices for reasons not associated with differences in marginal costs (MC).
For P.D. to be successful, the firm must meet the following 3 conditions (2nd and 3rd conditions are much more important than 1st condition):
(1) <P> The firm must have the ability to set price, i.e. it is a price setter, which gives it the ability to charge different prices to different consumers or for different units.
<E & E> Airlines are oligopolists that generally possess high market power due to the high barriers to entry (BTEs – to define) in the form of structural BTEs. Airlines have to purchase costly aircraft fleets that require the spreading of such high costs over a large output to allow the lowering of average costs of production (AC) via the reaping of internal economies of scale (EOS). New entrants that usually start small for an untested product cannot gain significant internal EOS to lower AC, thus are less able to effectively compete with incumbents as they are less price competitive, deterring them from entering the market.
<L> Thus, due to the high market power that airlines have, they are able to set prices.
(2) <P> The firm must have the ability to separate / segment the market into separate and identifiable groups at low or no cost, so that the firm can charge different price to different consumers or groups of consumers. Also, there must be no possibility of resale between the different markets. Else, consumers can buy goods in the cheaper market and resell it in the more expensive market, thus restoring price equality, and remove the firm’s ability to price discriminate.
<E & E> Airlines can segment the market into those who make advance booking air ticket purchases (early birds) vs. last minute buyers or for different flight routes (New York to London vs. London to New York) etc. based on the different booking characteristics of the different consumers (Table 1 & Ext 2) or different travel origin and destination at the same costs. Once the online airline booking system is properly established, airlines do not need to incur additional costs to identify these different travellers. The system will be able to capture the air ticket purchases of different travellers based on the difference in the number of days between the booking date and the flight departure date, difference in travel origin and destination, and then adjust the airfares accordingly via some pricing formula embedded within the system.
<E & E> There is no possibility of resale between the different markets as
(1) <P> The different airfares could be due to differences in demand
. <E & E> The higher the demand, the higher the MC directional differences in pricing of air tickets. The difference in demand could be due to for e.g. <explain any ONE>:
more holiday travel periods (Ext 2) in New York than London and Israel
more people in New York go to London / Israel than the other way round smaller demand in a weak economy e.g. France in 2015 compared to a larger in demand in a booming economy e.g. USA (Table 3), and also due to a more income elastic demand for USA than for France (Table 2)
<E> More passengers on board likely means
te. egment the market into those whwhhooo mamam kekee aaadvdvdvanaa cases (early birds) vs. last miiim nunununununununuuun tetetetete bbbbbbbbbbuuyuyuuyu errss s or f
ew York to London vs. London ttttttoo NNNeNeNeNNN w w YoYoYorkrk))) etbooking characteristics of the differererenenent cococonnsn umerent travel origin and destination aat tt ttht e sassame costb ki t i l t bli h d i li d
© DHS 2017 9757/H2 Economics Prelims/Paper 1
different passengers have different flight departure timings and dates, different flight origin and destination, different luggage requirements, different needs (e.g. wheelchair-bound passengers or those with children). Also, air tickets are non-transferrable and thus resalable, as each air ticket bears the name of the flying passenger.
<L> Hence, airlines are able to segment the market into separate and identifiable groups at no cost, as well as prevent the resale of air tickets between markets.
(3) <P> The price elasticity of demand (PED) must differ between different consumers and / or groups of consumers so that the firm is able to charge a higher price in the market where demand is more price inelastic and a lower price where the demand is more price elastic. <Explain any ONE>.
Different PED due to differences in proportion of income spent on the good likely because of differing economic conditions between different countries
<P> Based on the difference in the proportion of income spent on air tickets, the magnitude of PED is much higher for lower-income consumers.
<E & E> Ext 2 Travellers pay a difference of up to 50% due to a for an average citizen living in
London / Israel (lower-income countries relative to New York) compared to an average citizen living in New York. Passengers (New Yorkers) who are relatively higher-income earners than lower-income earners (Londoners and Israelis) spend a small % of income on air tickets. They are likely to be indifferent even if airfares were to rise, hence face a relatively price inelastic demand compared to Londoners and Israelis.
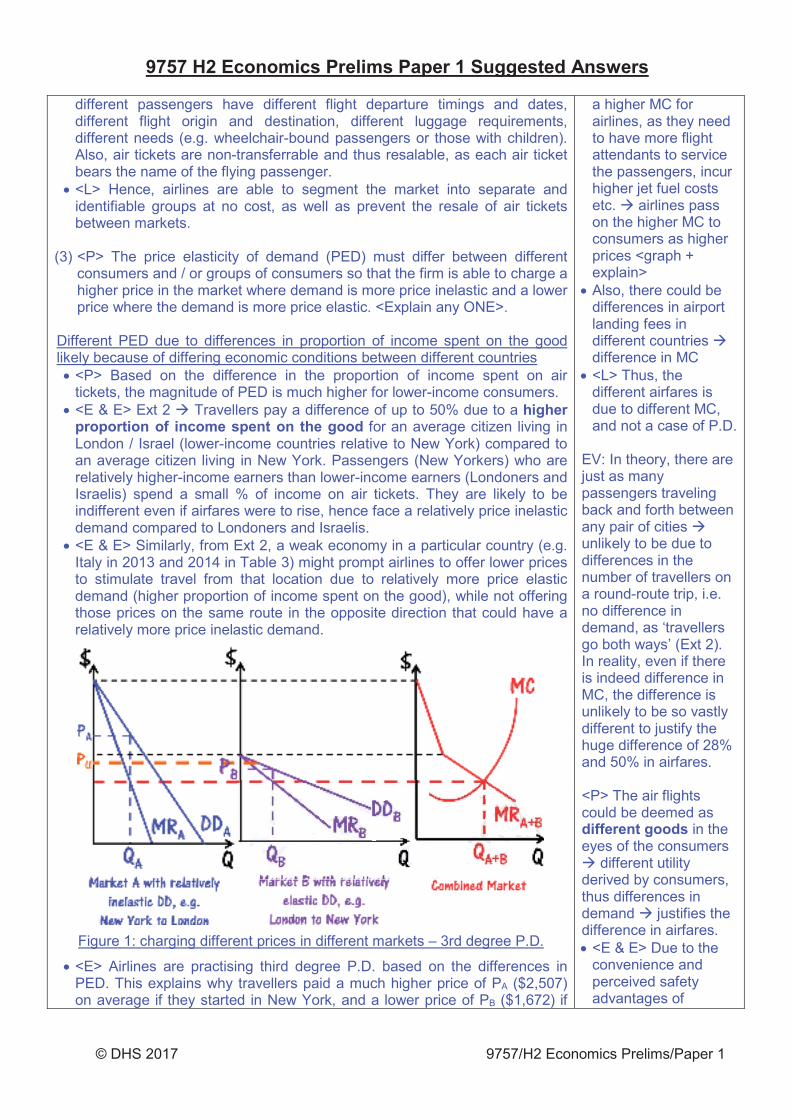
<E & E> Similarly, from Ext 2, a weak economy in a particular country (e.g. Italy in 2013 and 2014 in Table 3) might prompt airlines to offer lower prices to stimulate travel from that location due to relatively more price elastic demand (higher proportion of income spent on the good), while not offering those prices on the same route in the opposite direction that could have a relatively more price inelastic demand.
Figure 1: charging different prices in different markets – 3rd degree P.D.
<E> Airlines are practising third degree P.D. based on the differences in PED. This explains why travellers paid a much higher price of PA ($2,507) on average if they started in New York, and a lower price of PB ($1,672) if
a higher MC for airlines, as they need to have more flight attendants to service the passengers, incur higher jet fuel costs etc. airlines pass on the higher MC to consumers as higher prices <graph + explain>
Also, there could be differences in airport landing fees in different countries difference in MC
<L> Thus, the different airfares is due to different MC, and not a case of P.D.
EV: In theory, there are just as many passengers traveling back and forth between any pair of cities unlikely to be due to differences in the number of travellers on a round-route trip, i.e. no difference in demand, as ‘travellers go both ways’ (Ext 2). In reality, even if there is indeed difference in MC, the difference is unlikely to be so vastly different to justify the huge difference of 28% and 50% in airfares.
<P> The air flights could be deemed as
in the eyes of the consumers
different utility derived by consumers, thus differences in demand justifies the difference in airfares. <E & E> Due to the convenience and perceived safety advantages of
© DHS 2017 9757/H2 Economics Prelims/Paper 1
they began the trip departing from London, a 50% difference; and people leaving from the U.S. paid 28% more on average than people in Israel if the round-trip began from New York than if the trip started at Tel Aviv (Ext 2). By charging those with a relatively price inelastic demand a higher price and those with a relatively price elastic demand a lower price, airlines are able to generate higher total revenue (TR), since quantity demanded falls less than proportionately for the former and rises more than proportionately for the latter. In contrast, uniform pricing at PU does not allow airlines to maximise profits, since TR can be by shifting output from Market A to Market B as the TR in Market A (given the lower MRA) is more than compensated by the TR in Market B (given the higher MRB).
<L> Given ‘no cost difference to the airlines for the round-trip no matter which direction is flown first’ (Ext 2), airlines are able to profits that is in line with their profit-maximising aim, incentivising them to practise third degree P.D.
Different PED due to differing degree of necessity <P> Based on the different booking characteristics of the different consumers, the magnitude of the PED value increases the more days in advance of the departure the booking is made.
<E & E> Ext 2 for the same round-trip, (usually business travellers who may have to travel
urgently / close to departure date) usually have a very price inelastic demand (Table 1) as they may not have sufficient time to search for other alternatives as explained in part (a). Also, due to the high degree of necessity in terms of having to fly on a specific date to clinch business deals overseas unlike leisure travellers who can fly on another date.
<E & L> Thus, last-minute ticket buyers (usually business travellers) face a very price inelastic demand as they are not very responsive to airfare increase, compared to early birds. From Ext 2, airlines usually charge last-minute buyers more expensive airfares due to the higher willingness to pay, and charge early birds lower airfares to ‘try to get the most revenue out of each flight based on what people are willing to pay’ due to differences in PED.
nonstop direct flights from New-York to Tel-Aviv (Ext 2), the flight experience is smoother than making a stopover In Europe first (different service) from Tel-Aviv to New York. Thus, the utility derived from such nonstop direct flights is higher (different good). Also, the MC could be higher since the airlines may have to offer more frills on board e.g. more food and beverage for direct flights compared to stopover flights.
<L> Thus, the case of non-stop direct flights vs. stopover flights is not an example of P.D. since they are different goods, with higher cost differences that justify the difference in airfares.
- Vested interests of airline companies to account for the difference in airfares by justifying the differences in demand and supply in different countries need to conduct more research / have accurate information on the MC of round-trips that depart from New York to London / Israel and then compare against the MC of round-trips that depart from London / Israel to New York fly help to determine if the difference in airfares is largely due to differences in MC or airlines’ attempt to gouge consumers because of different PED. If there is indeed MC difference, the airfare riddle may not be an example of P.D. However, even if there is MC difference, it is unlikely to result in a 28% and 50% difference in airfares, thus the airfare riddle is likely to be an example of 3rd degree P.D.
- Depends on the type of air flights stopover flights vs direct flights could be perceived as different services with different MC not an example of 3rd degree P.D.
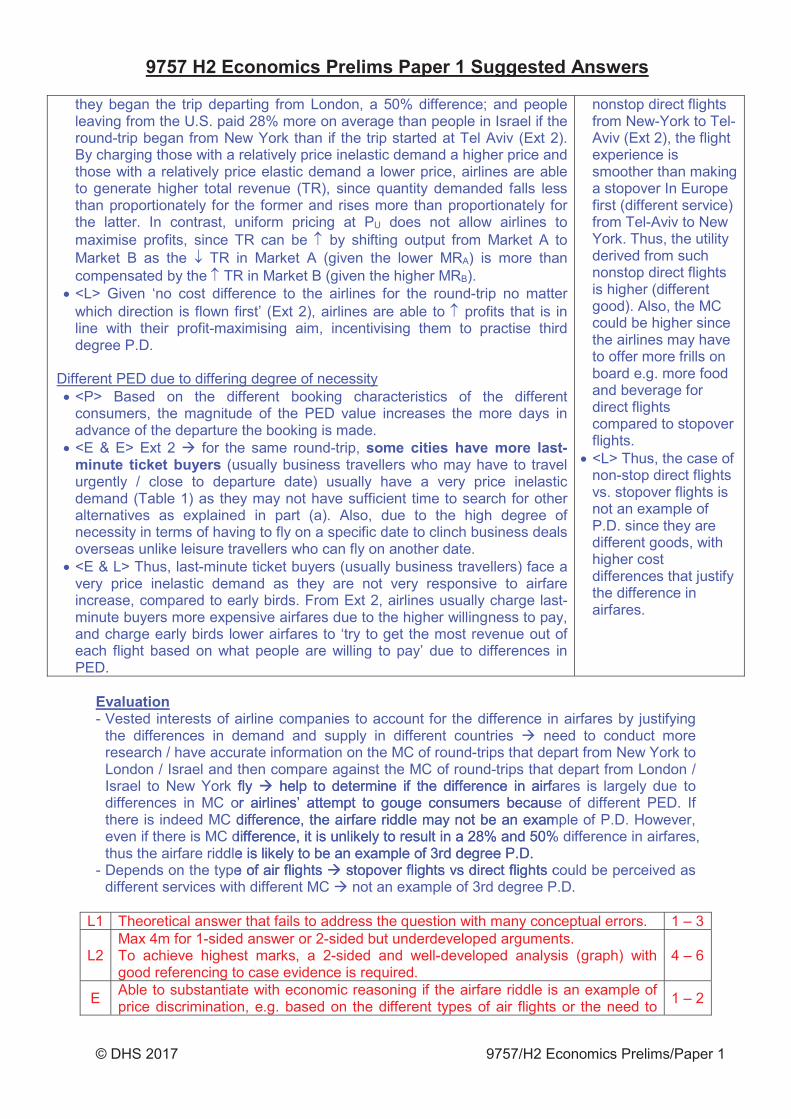
L1 Theoretical answer that fails to address the question with many conceptual errors. 1 – 3
L2 Max 4m for 1-sided answer or 2-sided but underdeveloped arguments. To achieve highest marks, a 2-sided and well-developed analysis (graph) with good referencing to case evidence is required.
4 – 6
E Able to substantiate with economic reasoning if the airfare riddle is an example ofprice discrimination, e.g. based on the different types of air flights or the need to 1 – 2
fly help to determine if the difference in n n aiaa rfaor airlines’ attempt to gouge cocoooooooonsnsnsnnsnsnsumumumumumummererers s s bebebecacacauusudifference, the airfare riddle mam y yy y yy yy yy nononoononottttt bbebebbebb annn exe am
difference, it is unlikely to result in a 282828%%% anananddd 505050%e is likely to be an example of 3rd dededeggreeeeee PPP.D.e of air flights stopover flights vsvss direcece t flights c
© DHS 2017 9757/H2 Economics Prelims/Paper 1
conduct more research to gather more information.
(d) With the aid of a diagram, explain what determines whether consumers or producers would likely bear a greater tax burden when ‘an aviation noise levy’ (Extract 4) is imposed.
[4]
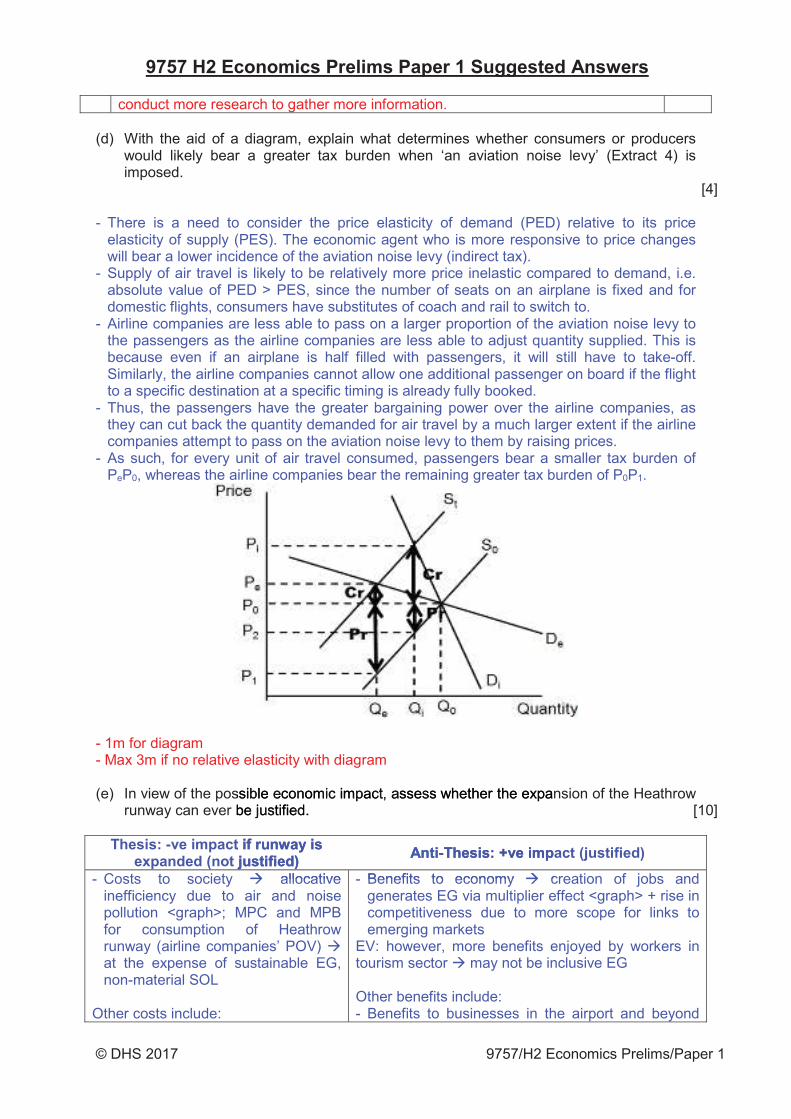
- There is a need to consider the price elasticity of demand (PED) relative to its price elasticity of supply (PES). The economic agent who is more responsive to price changes will bear a lower incidence of the aviation noise levy (indirect tax).
- Supply of air travel is likely to be relatively more price inelastic compared to demand, i.e. absolute value of PED > PES, since the number of seats on an airplane is fixed and for domestic flights, consumers have substitutes of coach and rail to switch to.
- Airline companies are less able to pass on a larger proportion of the aviation noise levy to the passengers as the airline companies are less able to adjust quantity supplied. This is because even if an airplane is half filled with passengers, it will still have to take-off. Similarly, the airline companies cannot allow one additional passenger on board if the flight to a specific destination at a specific timing is already fully booked.
- Thus, the passengers have the greater bargaining power over the airline companies, as they can cut back the quantity demanded for air travel by a much larger extent if the airline companies attempt to pass on the aviation noise levy to them by raising prices.
- As such, for every unit of air travel consumed, passengers bear a smaller tax burden of PeP0, whereas the airline companies bear the remaining greater tax burden of P0P1.
- 1m for diagram - Max 3m if no relative elasticity with diagram
(e) In view of the possible economic impact, assess whether the expansion of the Heathrow runway can ever be justified. [10]
- Costs to society allocative inefficiency due to air and noise pollution <graph>; MPC and MPB for consumption of Heathrow runway (airline companies’ POV) at the expense of sustainable EG, non-material SOL
Other costs include:
- Benefits to economy creation of jobs and generates EG via multiplier effect <graph> + rise in competitiveness due to more scope for links to emerging markets
EV: however, more benefits enjoyed by workers in tourism sector may not be inclusive EG
Other benefits include: - Benefits to businesses in the airport and beyond
ssiblbbb e ee ee ecececececececonoonnnommmmmmmmicicicicicicc impmpmpmpmpmpm acacacacacacact,t,t,t,t,t aaasssseseesss whetheherr ththe e exexpapbeee jjjjjjusususususustitt fiedeedd.
allocative - Benefits to economy c
© DHS 2017 9757/H2 Economics Prelims/Paper 1
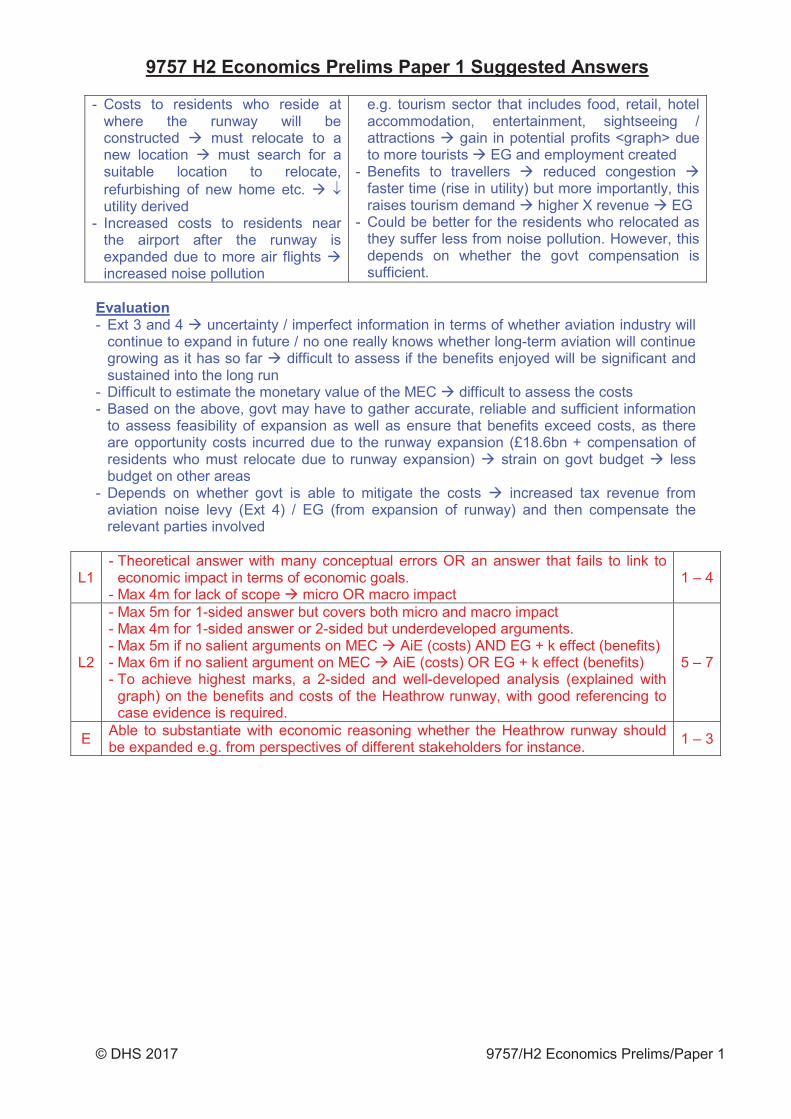
- Costs to residents who reside at where the runway will be constructed must relocate to a new location must search for a suitable location to relocate, refurbishing of new home etc. utility derived
- Increased costs to residents near the airport after the runway is expanded due to more air flights increased noise pollution
e.g. tourism sector that includes food, retail, hotel accommodation, entertainment, sightseeing / attractions gain in potential profits <graph> due to more tourists EG and employment created
- Benefits to travellers reduced congestion faster time (rise in utility) but more importantly, this raises tourism demand higher X revenue EG
- Could be better for the residents who relocated as they suffer less from noise pollution. However, this depends on whether the govt compensation is sufficient.
- Ext 3 and 4 uncertainty / imperfect information in terms of whether aviation industry will continue to expand in future / no one really knows whether long-term aviation will continue growing as it has so far difficult to assess if the benefits enjoyed will be significant and sustained into the long run
- Difficult to estimate the monetary value of the MEC difficult to assess the costs - Based on the above, govt may have to gather accurate, reliable and sufficient information
to assess feasibility of expansion as well as ensure that benefits exceed costs, as there are opportunity costs incurred due to the runway expansion (£18.6bn + compensation of residents who must relocate due to runway expansion) strain on govt budget less budget on other areas
- Depends on whether govt is able to mitigate the costs increased tax revenue from aviation noise levy (Ext 4) / EG (from expansion of runway) and then compensate the relevant parties involved
L1- Theoretical answer with many conceptual errors OR an answer that fails to link to
economic impact in terms of economic goals. - Max 4m for lack of scope micro OR macro impact
1 – 4
L2
- Max 5m for 1-sided answer but covers both micro and macro impact - Max 4m for 1-sided answer or 2-sided but underdeveloped arguments. - Max 5m if no salient arguments on MEC AiE (costs) AND EG + k effect (benefits) - Max 6m if no salient argument on MEC AiE (costs) OR EG + k effect (benefits) - To achieve highest marks, a 2-sided and well-developed analysis (explained with
graph) on the benefits and costs of the Heathrow runway, with good referencing to case evidence is required.
5 – 7
E Able to substantiate with economic reasoning whether the Heathrow runway should be expanded e.g. from perspectives of different stakeholders for instance. 1 – 3
© DHS 2017 9757/H2 Economics Prelims/Paper 1
(a) (i) What is the difference between real gross domestic product (GDP) and nominal GDP?
Define GDP: value of all final goods and services produced in an economy usually in a year.
Real GDP is where the effect of inflation (price increases of G&S) has been eliminated in relation to prices in a selected base year while nominal GDP is GDP recorded at current market prices.
[1]
(ii) Describe the trend of China’s real gross domestic product between 2005 and 2014.
Increasing at a decreasing rate. [2]
(b) (i) Explain why China’s GDP in PPP (USD) (billions) is higher than China’s GDP in USD (billions) from 2012-2016.
China’s GDP in PPP measures the purchasing power of per dollar USD in China itself, i.e. the value of goods and services 1 USD can purchase in China. If the cost of living is cheaper in China as compared to US, 1 USD should buy more goods in China than is US itself. Thus China’s GDP in PPP is higher than China’s GDP in USD to reflect the difference in cost of living between the China and US.
[2]
(ii) Comment whether the data in Table 1 and 2 is sufficient to conclude that in 2016, the average U.S. citizen has a higher standard of living than the average Chinese citizen.
Define SOL: material (quantity of goods and services) and non-material (quality of life environment, health, social aspects)
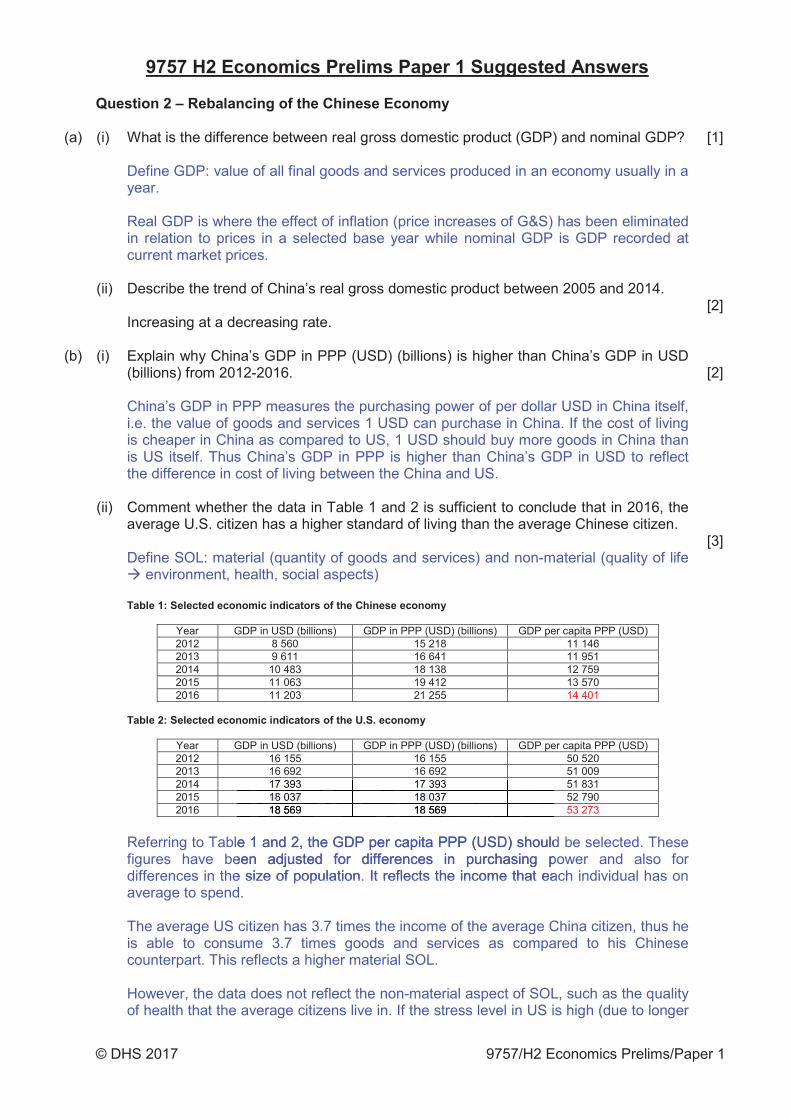
Year GDP in USD (billions) GDP in PPP (USD) (billions) GDP per capita PPP (USD) 2012 8 560 15 218 11 146 2013 9 611 16 641 11 951 2014 10 483 18 138 12 759 2015 11 063 19 412 13 570 2016 11 203 21 255 14 401
Year GDP in USD (billions) GDP in PPP (USD) (billions) GDP per capita PPP (USD) 2012 16 155 16 155 50 520 2013 16 692 16 692 51 009 2014 17 393 17 393 51 831 2015 18 037 18 037 52 790 2016 18 569 18 569 53 273
Referring to Table 1 and 2, the GDP per capita PPP (USD) should be selected. These figures have been adjusted for differences in purchasing power and also for differences in the size of population. It reflects the income that each individual has on average to spend.
The average US citizen has 3.7 times the income of the average China citizen, thus he is able to consume 3.7 times goods and services as compared to his Chinese counterpart. This reflects a higher material SOL.
However, the data does not reflect the non-material aspect of SOL, such as the quality of health that the average citizens live in. If the stress level in US is high (due to longer
[3]
17 393 17 393 18181818188 03337 1888 037 1811111 56669 1888 5696969696969969
e 1 and 2, the GDP per capita PPPP (((UUUSDSDSD)) hshouldeen adjusted for differences innn pupp rcrcrchahahasiss ng pe size of population. It reflects the income that ea
© DHS 2017 9757/H2 Economics Prelims/Paper 1
working hours) and life expectancy lower than China, the data would have overstated the actual overall SOL of the average US citizen.
In conclusion, it is likely that the average US citizen had a higher SOL than the average Chinese citizen after accounting for non-material factors since the average US citizen has a much higher material SOL than the average Chinese.
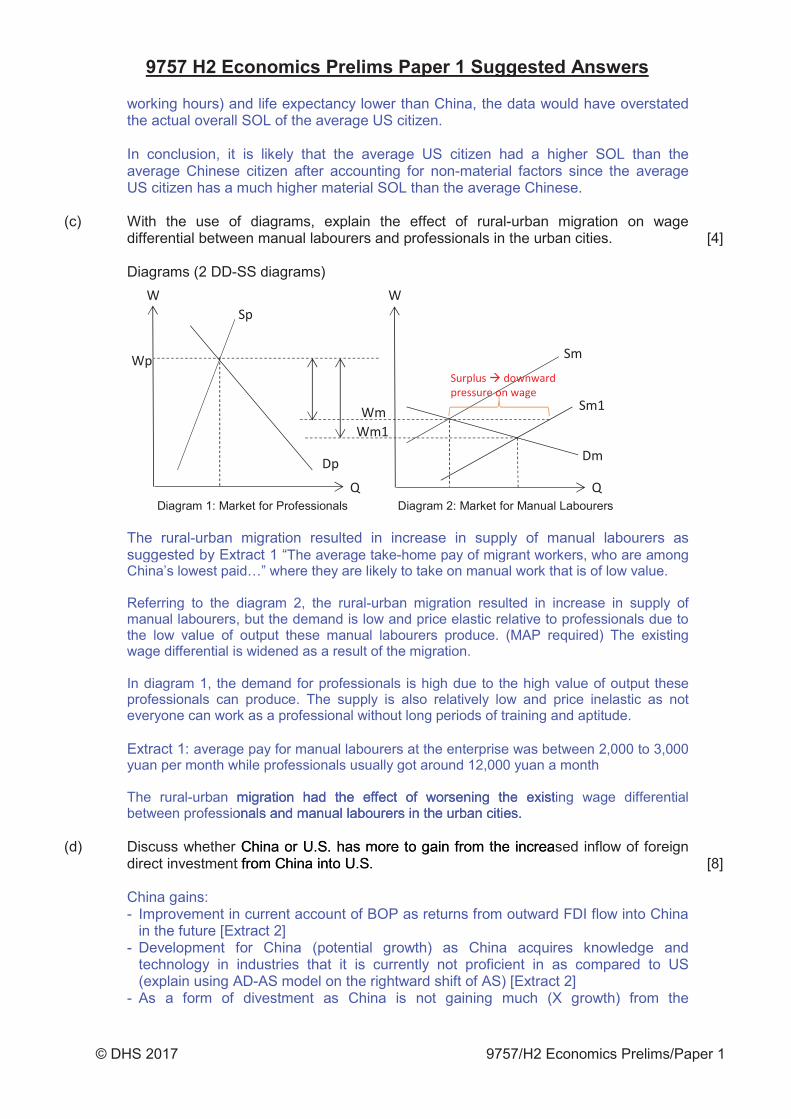
(c) With the use of diagrams, explain the effect of rural-urban migration on wage differential between manual labourers and professionals in the urban cities.
Diagrams (2 DD-SS diagrams)
Diagram 1: Market for Professionals Diagram 2: Market for Manual Labourers
The rural-urban migration resulted in increase in supply of manual labourers as suggested by Extract 1 “The average take-home pay of migrant workers, who are among China’s lowest paid…” where they are likely to take on manual work that is of low value.
Referring to the diagram 2, the rural-urban migration resulted in increase in supply of manual labourers, but the demand is low and price elastic relative to professionals due to the low value of output these manual labourers produce. (MAP required) The existing wage differential is widened as a result of the migration.
In diagram 1, the demand for professionals is high due to the high value of output these professionals can produce. The supply is also relatively low and price inelastic as not everyone can work as a professional without long periods of training and aptitude.
Extract 1: average pay for manual labourers at the enterprise was between 2,000 to 3,000 yuan per month while professionals usually got around 12,000 yuan a month
The rural-urban migration had the effect of worsening the existing wage differential between professionals and manual labourers in the urban cities.
[4]
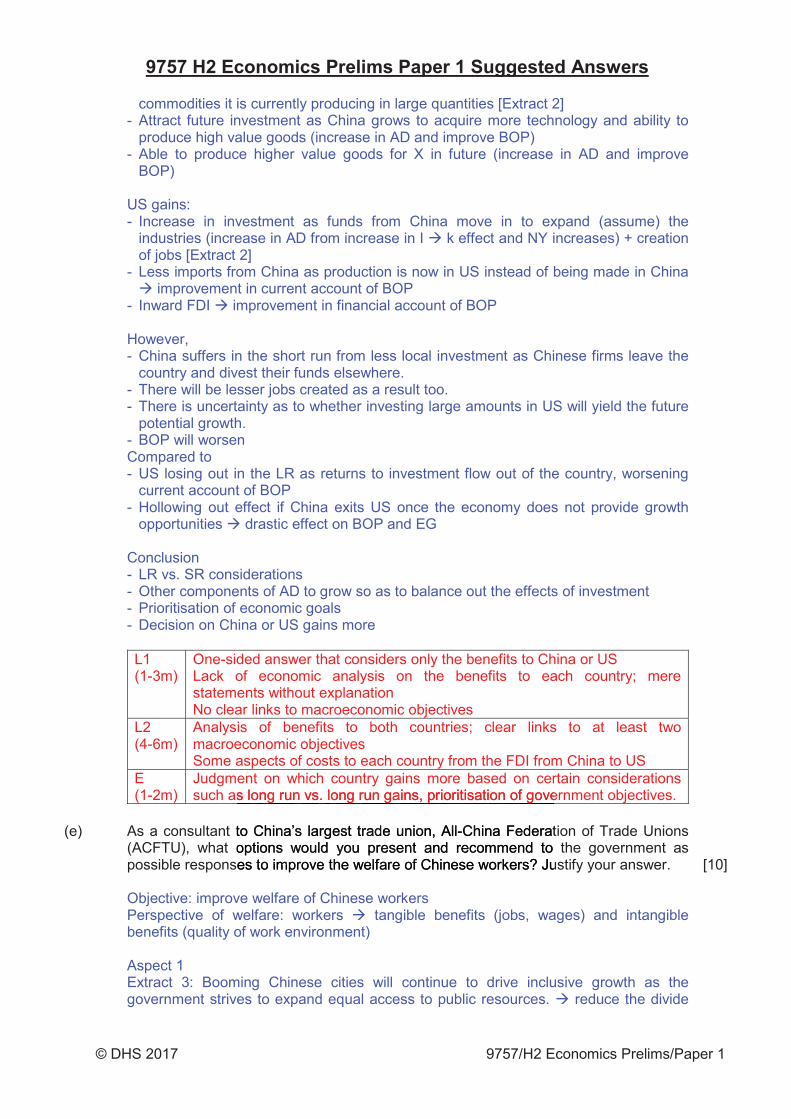
(d) Discuss whether China or U.S. has more to gain from the increased inflow of foreign direct investment from China into U.S.
China gains: - Improvement in current account of BOP as returns from outward FDI flow into China
in the future [Extract 2] - Development for China (potential growth) as China acquires knowledge and
technology in industries that it is currently not proficient in as compared to US (explain using AD-AS model on the rightward shift of AS) [Extract 2]
- As a form of divestment as China is not gaining much (X growth) from the
[8]
migration had the effect of worseninnngg thththeee exxxistonals and manual labourers in theeeeeee ee ururuuruururuuuu bababaaababan n nnnnnnn cicicititit eseses.
CChihihihihhh nananaananaa ooooooor rrr rr U.U.U.U.U.U.S.S.S.S.S.S.S hhhhhhasasasasasasas mmmmmmmorororrororore eeeeee totototototooo ggggggggain frfromom tthehe iincreat frrrrromomomommm CCCCCCChihihihhihihinanananananan intnntntoooo U.S.SSSSSSS
© DHS 2017 9757/H2 Economics Prelims/Paper 1
commodities it is currently producing in large quantities [Extract 2] - Attract future investment as China grows to acquire more technology and ability to
produce high value goods (increase in AD and improve BOP) - Able to produce higher value goods for X in future (increase in AD and improve
BOP)
US gains: - Increase in investment as funds from China move in to expand (assume) the
industries (increase in AD from increase in I k effect and NY increases) + creation of jobs [Extract 2]
- Less imports from China as production is now in US instead of being made in China improvement in current account of BOP
- Inward FDI improvement in financial account of BOP
However, - China suffers in the short run from less local investment as Chinese firms leave the
country and divest their funds elsewhere. - There will be lesser jobs created as a result too. - There is uncertainty as to whether investing large amounts in US will yield the future
potential growth. - BOP will worsen Compared to - US losing out in the LR as returns to investment flow out of the country, worsening
current account of BOP - Hollowing out effect if China exits US once the economy does not provide growth
opportunities drastic effect on BOP and EG
Conclusion - LR vs. SR considerations - Other components of AD to grow so as to balance out the effects of investment - Prioritisation of economic goals - Decision on China or US gains more
L1 (1-3m)
One-sided answer that considers only the benefits to China or US Lack of economic analysis on the benefits to each country; mere statements without explanation No clear links to macroeconomic objectives
L2 (4-6m)
Analysis of benefits to both countries; clear links to at least two macroeconomic objectives Some aspects of costs to each country from the FDI from China to US
E (1-2m)
Judgment on which country gains more based on certain considerations such as long run vs. long run gains, prioritisation of government objectives.
(e) As a consultant to China’s largest trade union, All-China Federation of Trade Unions (ACFTU), what options would you present and recommend to the government as possible responses to improve the welfare of Chinese workers? Justify your answer.
Objective: improve welfare of Chinese workers Perspective of welfare: workers tangible benefits (jobs, wages) and intangible benefits (quality of work environment)
Aspect 1 Extract 3: Booming Chinese cities will continue to drive inclusive growth as the government strives to expand equal access to public resources. reduce the divide
[10]
ent on which country gains more based on cers loooongngngng rrrrrunnn vs.... llllllooonooo gggggg rurururururunnnnnn gagagagagg ins,,, pprioritisatataatatioioioionnnn ofofofofof gggggoooovo e
to CCChininnininnna’aaaaaa ssss lalalalalalargesesesesesesst ttttt trtrtrtrtrtrtradadadadaddadadeee ee ununununuununioioioioioooonnn,nn AAAAAAAAAlllllllllll-CCCC-Chihihhhhh nana FFededere atoppptititititionononnonnns s s sss wowowowowwowoululululululd dddd dd yoyoyoyoyouuuuuu prprprprprppp eseseseesesessenenenenenenenttttttt anaaaaaaaa d rerecocommmmeend toesssss tttooo imimimimimmimprprprprprprprovovovovovoo e eeee thththht eee ee weweweweweewelflflflfflflfararararararareee eeee ofofofofofofofo CCChineesese wwororkekers? Ju
© DHS 2017 9757/H2 Economics Prelims/Paper 1
between higher wage and lower wage workers; increasing the tangible/material welfare of the lower income group, as well as the intangible/non-material welfare
The ongoing urbanisation is necessary as this will push workers into higher value-added jobs with higher wage as compared to jobs in the rural areas. However the income disparity within urban cities will be addressed by the government through improving access to public resources such as public safety and law enforcement, clean water, public transport, healthcare or even public housing. This will raise the quality of living in urban cities for Chinese workers.
Suggested options: (i) construction of utilities, build cheap public housing, cheap public transport (ii) minimum wage (show on DD/SS model) (iii) progressive income tax (to explain that the tax collected from higher income is
given to lower income group)
Drawbacks: - strain on government budget and will take a long time for infrastructure to be
constructed - long term projects that will not improve welfare of workers immediately - workers may not know how to gain access to these resources due to ignorance
Aspect 2 Extract 3: China announced plans to develop the “Internet Plus” plan in March, to upgrade the manufacturing powerhouse by riding the tide of internet-led innovation. raise productivity of workers to increase wage rate and to create more higher quality jobs
In improving the manufacturing sector where most Chinese workers (lower paid) are placed, it signifies a possible increase in productivity of these workers as they learn to make better use of technology and learn newer, more efficient methods of manufacturing. This will raise their output per hour, thus increase in labour productivity, which will lead to higher wages.
Suggested options: (i) supply-side measures that will shift AS to the right (ii) supply-side measures that will shift AS downwards
Drawbacks: - some jobs lost as productivity increases or that there is now more automation - exploitation by firms as they make use of the technology but do not pass on the
benefits as higher wages to workers
Aspect 3 Extract 3: As the world’s largest investor in low-carbon energy, with an investment of about $90 billion last year, China aims to cap CO2 emission by 2030. move away from high polluting industries that will improve the intangible welfare of Chinese workers
Suggested options: (i) investment in low-carbon energy will result in increase in AD via I, thus triggering
the k effect (AD-AS model) (ii) tax on polluting manufacturers based on CBA, where tax=MEC at output
(MSB=MSC)
firms as they make use of the technology buther wages to workers
e world’s largest investor in low-carbrbrbononon eeenenenergy, wlast year, China aims to cap CO2O2O2 eeemimimissssssioioon by 2
ing industries that will improve the intangible
© DHS 2017 9757/H2 Economics Prelims/Paper 1
The high levels of pollution as a result of China being the world’s manufacturing powerhouse is well known. The efforts by the government to increase investment in solar energy or alternative low-carbon energy will serve to reduce the levels of pollution plaguing China. This has two effects: (1) The reduction in pollution will improve the non-material welfare of workers as they
enjoy a better quality work environment and are less likely to suffer respiratory illnesses that will affect their lives in the future
(2) The investment is an injection for the economy increase in AD will lead to k effect that generates multiple rounds of jobs for the Chinese. This will help to develop the urban cities further, proving opportunities for Chinese to move from rural areas to urban cities, enjoying higher wages and thus higher material welfare.
Drawbacks: - Effects felt only in the LR - Structural rigidities as Chinese workers may not possess skills to fit into jobs that are
‘newly’ created due to investment in solar energy/alternative energy - Lack of information on the optimal level of tax - Imposition of tax will reduce output of manufacturers and in turn reduce jobs in those
industries - Structural unemployment may occur as these displaced workers cannot find work in
the ‘new’ industries
- Recommend at least two options – must improve both tangible (wage) and intangible welfare of Chinese workers
- Explain to government that these policies will require fine-tuning along the way as these policies generally take years to complete – provide suggestions of further government intervention to help ensure that the benefits reach Chinese workers
- Providing information and education/training is an important tool to help Chinese workers
- Negotiations and agreements with firms may be necessary to ensure that the welfare of Chinese workers are truly improved
L1 (1-3m)
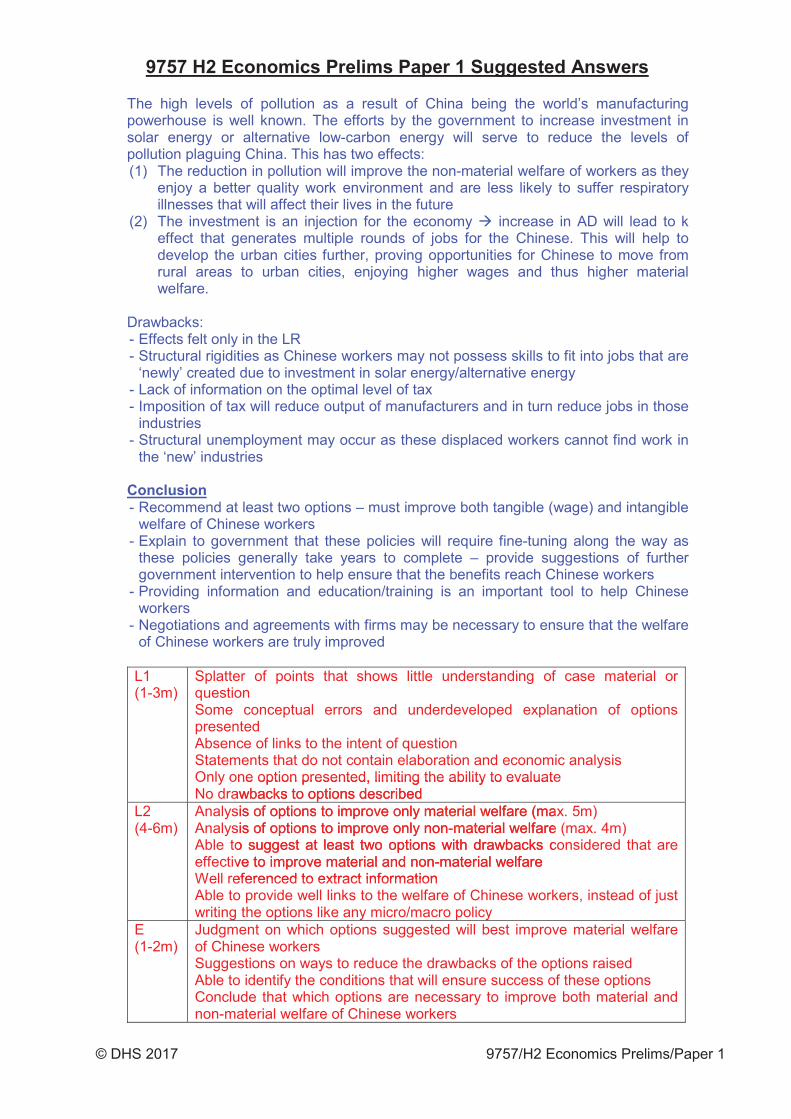
Splatter of points that shows little understanding of case material or question Some conceptual errors and underdeveloped explanation of options presented Absence of links to the intent of question Statements that do not contain elaboration and economic analysis Only one option presented, limiting the ability to evaluate No drawbacks to options described
L2 (4-6m)
Analysis of options to improve only material welfare (max. 5m) Analysis of options to improve only non-material welfare (max. 4m) Able to suggest at least two options with drawbacks considered that are effective to improve material and non-material welfare Well referenced to extract information Able to provide well links to the welfare of Chinese workers, instead of just writing the options like any micro/macro policy
E (1-2m)
Judgment on which options suggested will best improve material welfare of Chinese workers Suggestions on ways to reduce the drawbacks of the options raised Able to identify the conditions that will ensure success of these options Conclude that which options are necessary to improve both material and non-material welfare of Chinese workers
ne option presented, limiting the ability to evaluateawbbbbbbacaccckskskskskksk ttttooo opppppptittittit ooonooo s sss s dedededededescscscsscscririribebbb dddsis ooooooffff f opooooo tiono ssssss totototototo iiiiimpmpmpmpmpmprorororororoveveveveveve ooonly mmmaaaaaaaaateteteteteteteeteteeeririririr allllalalallal wwwwwwwwelelelelelfafafafafarerererere (((((masis ooof opopopopopoptittt onononnnnssssss to iiiiiimpmpmpmpmpmprorororororoveveveveveve oooooonlnlnlnlnlnly y y y yyy nnnnonnn n-n-nnn-mamamamaammamattetetetetetetettt rialalalall wwwwweelelelelfafafafafareo sususususuuggggggggggggesesesesesest t tttt atattatatt lllllleaeaeaeaeae stststststst tttttwowowowwow ooooooptptptptptp ioioioiooionsnsnsnsnsnss withhhhh drdrdrdrdrawawawawawbababababa kcks cve tottotttoto iiiiiimpmpmpmpmpmprorororororovevveve mmmmataa errrrrriaiaiaiaiaiall llll anananananandddddd nonnnnonon-maaaaateteteteterialalalalal wwwwweleleee fare eferenced to extract information
© DHS 2017 9757/H2 Economics Prelims/Paper 2
Question Analysis This question aims to test candidates’ ability to identify related (and more significant) markets to the sugarcane market based on the preamble food market and ethanol market
identify and explain the relevant elasticity concepts for the 3 markets – YED, PED, PES explain the events of the (1) rise in fertiliser costs and poor harvest of sugarcane crop, (2) strong economic growth and (3) rise in minimum support price of ethanol on the consumer expenditure of the 3 markets to analyse the changes in the product of equilibrium P & Q
<P> The events are likely to cause demand to rise and supply to fall, leading to a rise in total expenditure (TE) on food.
<E> Relatively strong economic growth rise in purchasing power increased willingness and ability to buy more normal goods encourages higher food consumption since food is a normal good but a necessity (YED < 1) less than proportionate rise in demand for food
<E> Rise in fertiliser costs and faltering monsoon rise in production costs for farmers and poorer harvests for water-intensive agricultural crops e.g. rice respectively supply falls
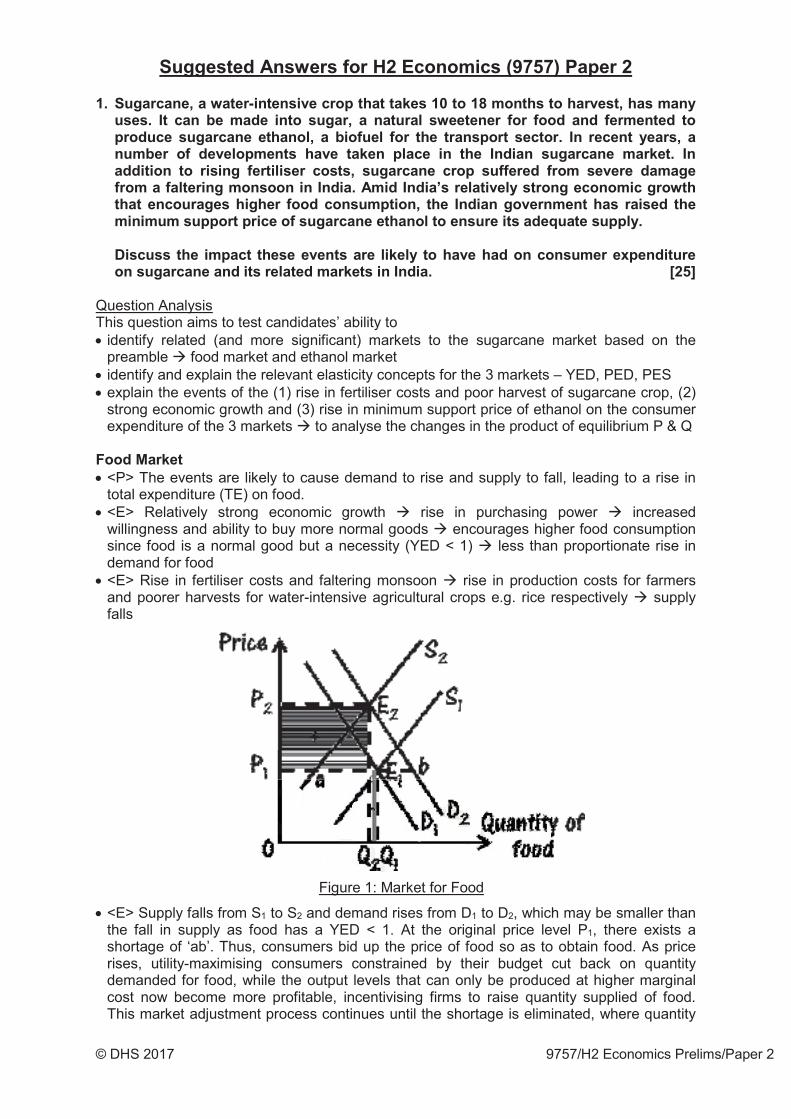
Figure 1: Market for Food
<E> Supply falls from S1 to S2 and demand rises from D1 to D2, which may be smaller than the fall in supply as food has a YED < 1. At the original price level P1, there exists a shortage of ‘ab’. Thus, consumers bid up the price of food so as to obtain food. As price rises, utility-maximising consumers constrained by their budget cut back on quantity demanded for food, while the output levels that can only be produced at higher marginal cost now become more profitable, incentivising firms to raise quantity supplied of food. This market adjustment process continues until the shortage is eliminated, where quantity
© DHS 2017 9757/H2 Economics Prelims/Paper 2
demanded equals quantity supplied. This results in the equilibrium price to rise from P1 to P2 and equilibrium quantity to fall from Q1 to Q2.
<E & L> For the rise in demand, TE on food rises, regardless of price elasticity of supply (PES). For the fall in supply, whether TE rises or falls depends on price elasticity of demand (PED) for food, which is likely to be < 1 as there are no alternative substitutes of food, and food is a necessity. TE rises from 0P1E1Q1 to 0P2E2Q2 as the rise in price (horizontal striped shaded + area) leads to a less than proportionate fall in quantity demanded (vertical striped shaded - area). As such, regardless of the relative shifts of demand and supply, consumers’ expenditure on food rises.
EV: to consider the type of food to determine the impact of the events on TE on food different PED of different foods, e.g. staples such as rice, potatoes, lentils consumed byIndians could have a much more price inelastic demand as they have a much higherdegree of necessity than other types of food such as processed food much largerincrease in consumer expenditure for staples than processed food, ceteris paribusmore luxurious type food such as meat, pork or fish vs. more basic necessities type foodsuch as vegetables, staples former faces a larger rise in demand than the latter larger rise in consumer expenditure for former than latter, ceteris paribuswater-intensive crops like sugarcane, rice face a larger fall in supply than less water-intensive crops like oilseeds, millets and pulses, and assuming PED < 1 larger rise inconsumer expenditure for such foodagricultural crops vs. non-agricultural food like meat, pork or fish may face a muchsmaller fall in supply as they are less affected by the rising fertiliser costs and falteringmonsoon, and assuming PED < 1 smaller rise in consumer expenditure for non-agricultural food, ceteris paribus
<P> The events are likely to cause rise in demand and fall in supply rise in sugarcane TE
<E> Relatively strong economic growth encourages higher food consumption (as explained earlier), including sugar used in the production of many food rise in derived demand for sugarcane, since it is a key factor of production (FOP) used in the production of sugar
<E> At the same time, if the minimum support price of sugarcane ethanol were to rise quantity supplied will likely rise as the output levels that can only be produced at higher marginal cost now become more profitable rise in derived demand for sugarcane, a key factor input used in the production of sugarcane ethanol
<E> As explained earlier, rise in fertiliser costs and faltering monsoon supply falls for water-intensive crops like sugarcane.
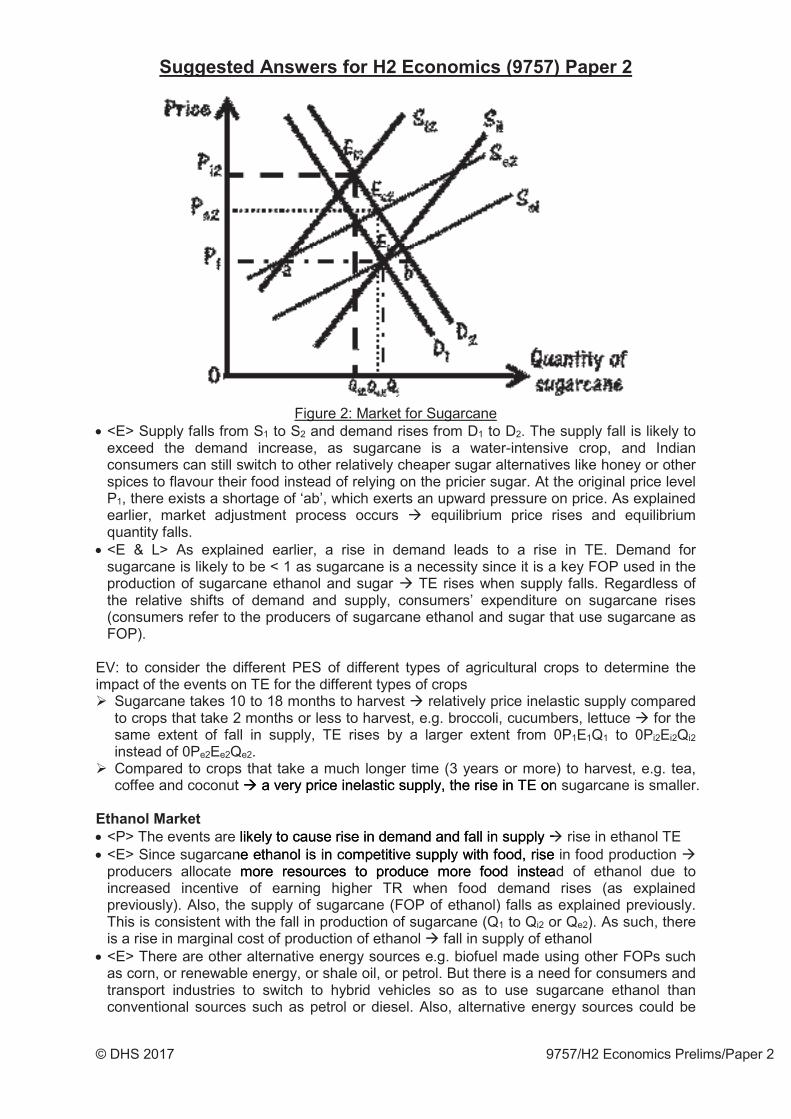
© DHS 2017 9757/H2 Economics Prelims/Paper 2
Figure 2: Market for Sugarcane <E> Supply falls from S1 to S2 and demand rises from D1 to D2. The supply fall is likely to exceed the demand increase, as sugarcane is a water-intensive crop, and Indian consumers can still switch to other relatively cheaper sugar alternatives like honey or other spices to flavour their food instead of relying on the pricier sugar. At the original price level P1, there exists a shortage of ‘ab’, which exerts an upward pressure on price. As explained earlier, market adjustment process occurs equilibrium price rises and equilibrium quantity falls.
<E & L> As explained earlier, a rise in demand leads to a rise in TE. Demand for sugarcane is likely to be < 1 as sugarcane is a necessity since it is a key FOP used in the production of sugarcane ethanol and sugar TE rises when supply falls. Regardless of the relative shifts of demand and supply, consumers’ expenditure on sugarcane rises (consumers refer to the producers of sugarcane ethanol and sugar that use sugarcane as FOP).
EV: to consider the different PES of different types of agricultural crops to determine the impact of the events on TE for the different types of crops
Sugarcane takes 10 to 18 months to harvest relatively price inelastic supply comparedto crops that take 2 months or less to harvest, e.g. broccoli, cucumbers, lettuce for thesame extent of fall in supply, TE rises by a larger extent from 0P1E1Q1 to 0Pi2Ei2Qi2instead of 0Pe2Ee2Qe2.Compared to crops that take a much longer time (3 years or more) to harvest, e.g. tea,coffee and coconut a very price inelastic supply, the rise in TE on sugarcane is smaller.
<P> The events are likely to cause rise in demand and fall in supply rise in ethanol TE <E> Since sugarcane ethanol is in competitive supply with food, rise in food production producers allocate more resources to produce more food instead of ethanol due to increased incentive of earning higher TR when food demand rises (as explained previously). Also, the supply of sugarcane (FOP of ethanol) falls as explained previously. This is consistent with the fall in production of sugarcane (Q1 to Qi2 or Qe2). As such, there is a rise in marginal cost of production of ethanol fall in supply of ethanol
<E> There are other alternative energy sources e.g. biofuel made using other FOPs such as corn, or renewable energy, or shale oil, or petrol. But there is a need for consumers and transport industries to switch to hybrid vehicles so as to use sugarcane ethanol than conventional sources such as petrol or diesel. Also, alternative energy sources could be
t a vvvvvverereere y yyyy priccccce eeee inelelelellasasasasasasasstit c ccc suss ppppppppply, the rise in TETE on
likekekekekk lylyylylyyy ttttttooo ooo cacacaaaac uuusuu e ririririrr sesesesesseeee iiiiinnnnnn dddedddd mamamamamamam nnndnndn and ffalall l inin ssupupplplyy ne eeeeththththhhanananananananololoololololol is sssss innnnn cccccomomomomomompepepepepeppepetititititititittttt vevevevevev sssssuuuupu ply y wiwithth ffoooodd, risemore resources to ppppproduce morore foood instea
© DHS 2017 9757/H2 Economics Prelims/Paper 2
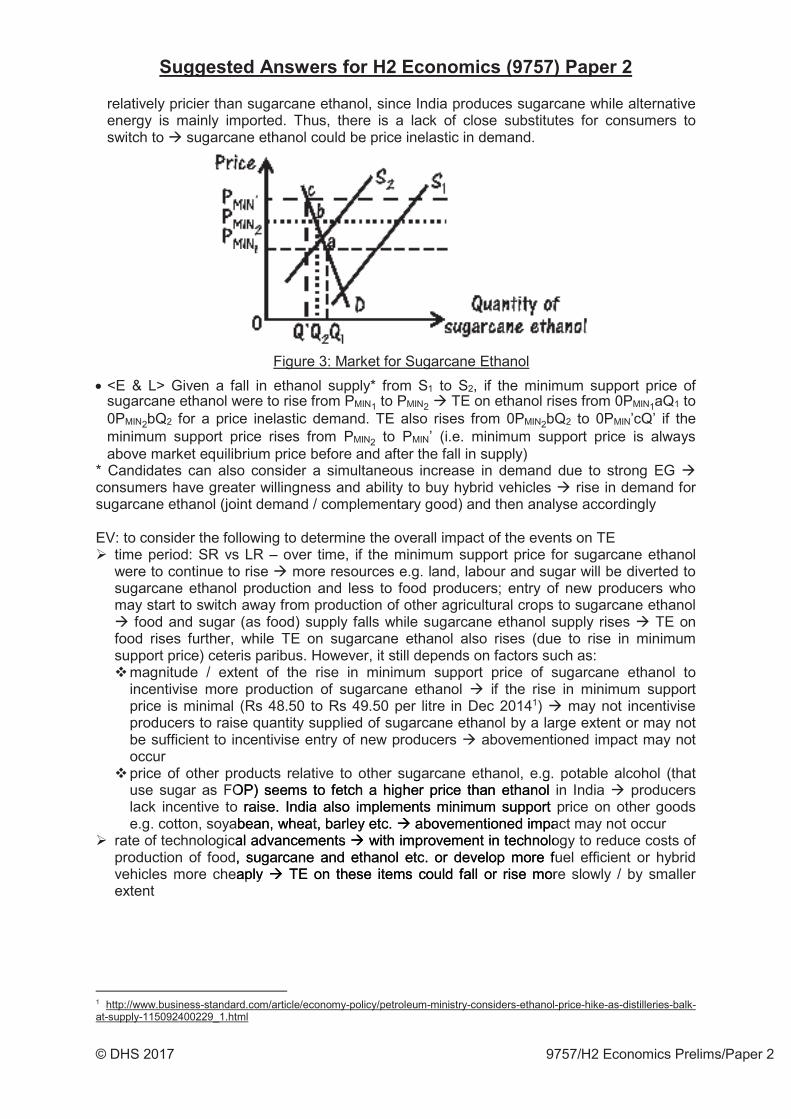
relatively pricier than sugarcane ethanol, since India produces sugarcane while alternative energy is mainly imported. Thus, there is a lack of close substitutes for consumers to switch to sugarcane ethanol could be price inelastic in demand.
Figure 3: Market for Sugarcane Ethanol <E & L> Given a fall in ethanol supply* from S1 to S2, if the minimum support price of sugarcane ethanol were to rise from PMIN1 to PMIN2 TE on ethanol rises from 0PMIN1aQ1 to 0PMIN2bQ2 for a price inelastic demand. TE also rises from 0PMIN2bQ2 to 0PMIN’cQ’ if the minimum support price rises from PMIN2 to PMIN’ (i.e. minimum support price is always above market equilibrium price before and after the fall in supply)
* Candidates can also consider a simultaneous increase in demand due to strong EG consumers have greater willingness and ability to buy hybrid vehicles rise in demand for sugarcane ethanol (joint demand / complementary good) and then analyse accordingly
EV: to consider the following to determine the overall impact of the events on TE time period: SR vs LR – over time, if the minimum support price for sugarcane ethanolwere to continue to rise more resources e.g. land, labour and sugar will be diverted tosugarcane ethanol production and less to food producers; entry of new producers whomay start to switch away from production of other agricultural crops to sugarcane ethanol
food and sugar (as food) supply falls while sugarcane ethanol supply rises TE onfood rises further, while TE on sugarcane ethanol also rises (due to rise in minimumsupport price) ceteris paribus. However, it still depends on factors such as:
magnitude / extent of the rise in minimum support price of sugarcane ethanol toincentivise more production of sugarcane ethanol if the rise in minimum support price is minimal (Rs 48.50 to Rs 49.50 per litre in Dec 20141) may not incentivise producers to raise quantity supplied of sugarcane ethanol by a large extent or may not be sufficient to incentivise entry of new producers abovementioned impact may not occur price of other products relative to other sugarcane ethanol, e.g. potable alcohol (that use sugar as FOP) seems to fetch a higher price than ethanol in India producers lack incentive to raise. India also implements minimum support price on other goods e.g. cotton, soyabean, wheat, barley etc. abovementioned impact may not occur
rate of technological advancements with improvement in technology to reduce costs ofproduction of food, sugarcane and ethanol etc. or develop more fuel efficient or hybrid vehicles more cheaply TE on these items could fall or rise more slowly / by smaller extent
1 http://www.business-standard.com/article/economy-policy/petroleum-ministry-considers-ethanol-price-hike-as-distilleries-balk-at-supply-115092400229_1.html
g , gOPPPP))))) seeseeseeememeememeee s ssss toooooo ffffffffetchchchchchhh aaaaaaaa hhhhigigiiggher rrr price than ethhananolo raaaisisisisisiseeee.ee Indnnddiaaaaaa aaaaaaalslslslslslsso imimimimimmmplplplplplplp emmmmentsttsst mmmmmmiininininiinii iimimimimmimmumum ssupuppoportbeaeeaaan, wwwwwwheheeatatatatatatat, bababaaaarrrlrrrr eyeyeyeyeyeyey eeeetctctctctctctct . aaaaaaaabbbobbbbbbbbb veveveveveeeemememementntnnnnnn ioionenedd imimpaal aaaaadvdvvdvdvvancementntntntnts ss s s with immmmprppp ovemenent t inin ttecechnhnolo, sususugaagagaaaarcrcrcrcrcrcrccanananananananeeee ananannddddd etetetetetethahahahahhahahanononononooonolll lll etetetetetetete c.cc or dedevevelolop p mmore faply TE on these ittttems could ffall or rise mor
© DHS 2017 9757/H2 Economics Prelims/Paper 2
1
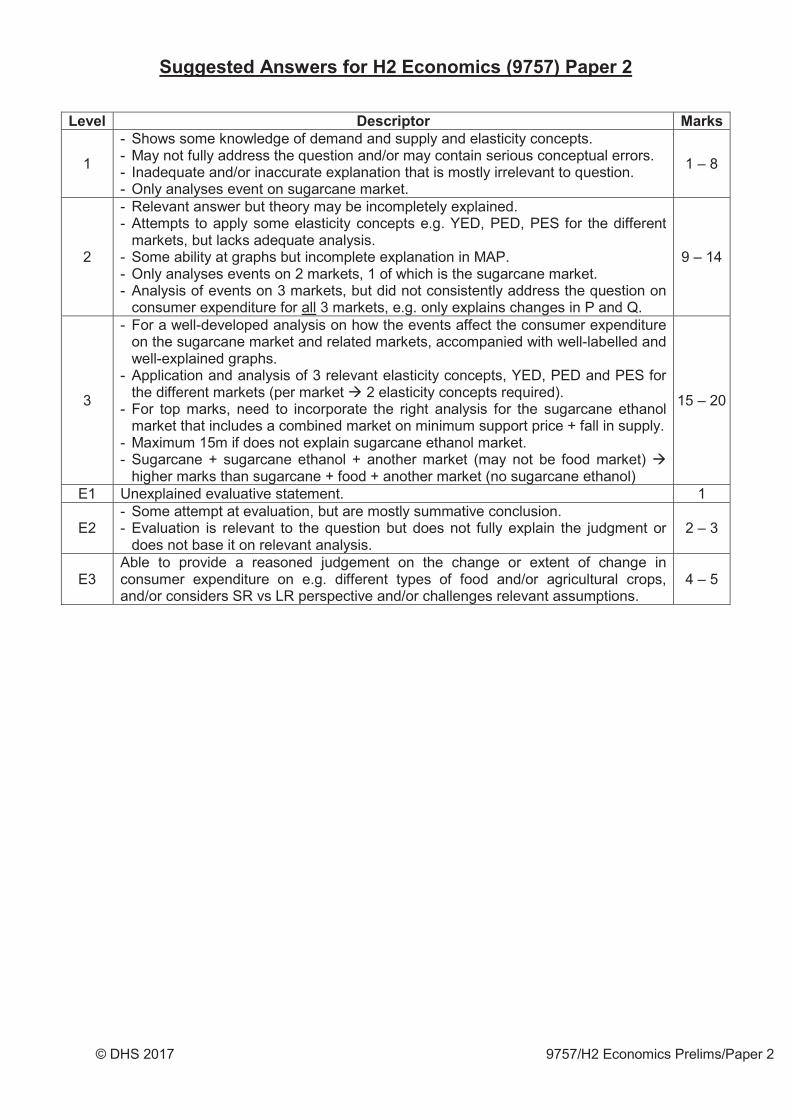
- Shows some knowledge of demand and supply and elasticity concepts. - May not fully address the question and/or may contain serious conceptual errors. - Inadequate and/or inaccurate explanation that is mostly irrelevant to question. - Only analyses event on sugarcane market.
1 – 8
2
- Relevant answer but theory may be incompletely explained. - Attempts to apply some elasticity concepts e.g. YED, PED, PES for the different
markets, but lacks adequate analysis. - Some ability at graphs but incomplete explanation in MAP. - Only analyses events on 2 markets, 1 of which is the sugarcane market. - Analysis of events on 3 markets, but did not consistently address the question on
consumer expenditure for all 3 markets, e.g. only explains changes in P and Q.
9 – 14
3
- For a well-developed analysis on how the events affect the consumer expenditure on the sugarcane market and related markets, accompanied with well-labelled and well-explained graphs.
- Application and analysis of 3 relevant elasticity concepts, YED, PED and PES for the different markets (per market 2 elasticity concepts required).
- For top marks, need to incorporate the right analysis for the sugarcane ethanol market that includes a combined market on minimum support price + fall in supply.
- Maximum 15m if does not explain sugarcane ethanol market. - Sugarcane + sugarcane ethanol + another market (may not be food market)
higher marks than sugarcane + food + another market (no sugarcane ethanol)
15 – 20
E1 Unexplained evaluative statement. 1
E2 - Some attempt at evaluation, but are mostly summative conclusion. - Evaluation is relevant to the question but does not fully explain the judgment or
does not base it on relevant analysis. 2 – 3
E3 Able to provide a reasoned judgement on the change or extent of change in consumer expenditure on e.g. different types of food and/or agricultural crops, and/or considers SR vs LR perspective and/or challenges relevant assumptions.
4 – 5
© DHS 2017 9757/H2 Economics Prelims/Paper 2
Question Analysis This is a simple content question that aims to test candidates’ ability to identify and explain the different types of internal economies of scale (EOS) when firms grow
identify and explain the different types of external EOS due to industries’ expansion
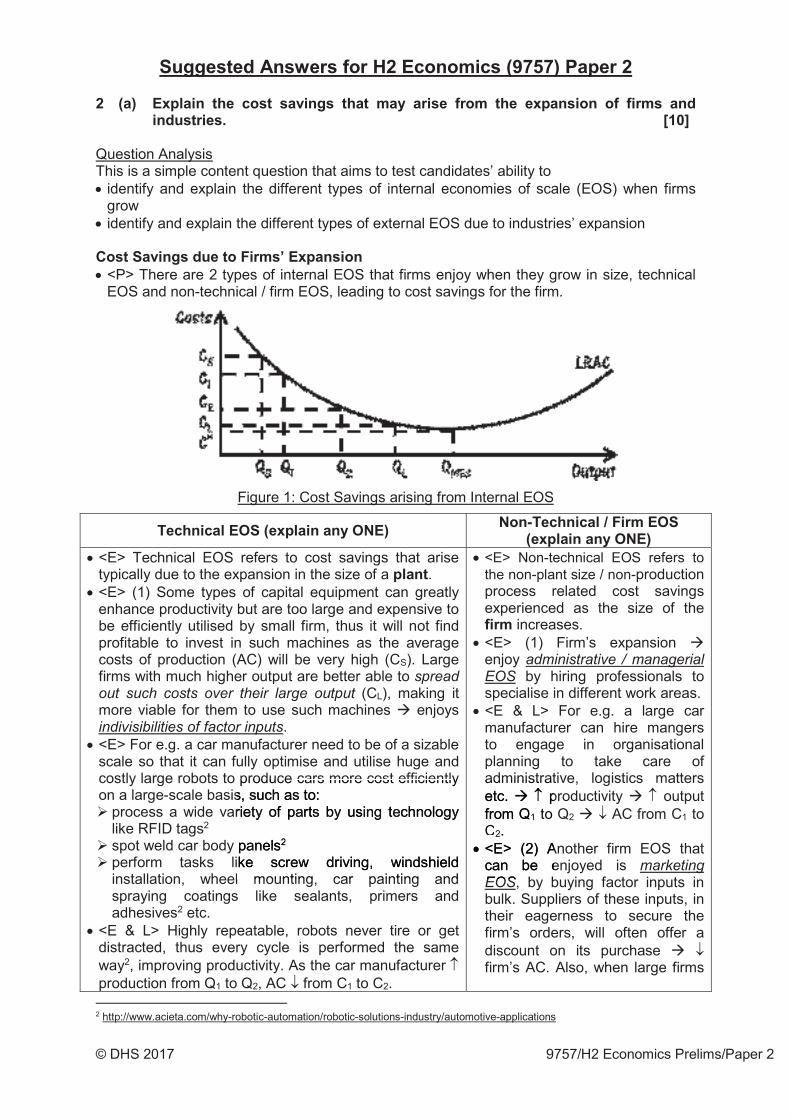
<P> There are 2 types of internal EOS that firms enjoy when they grow in size, technical EOS and non-technical / firm EOS, leading to cost savings for the firm.
Figure 1: Cost Savings arising from Internal EOS
<E> Technical EOS refers to cost savings that arise typically due to the expansion in the size of a .
<E> (1) Some types of capital equipment can greatly enhance productivity but are too large and expensive to be efficiently utilised by small firm, thus it will not find profitable to invest in such machines as the average costs of production (AC) will be very high (CS). Large firms with much higher output are better able to
(CL), making it more viable for them to use such machines enjoys
. <E> For e.g. a car manufacturer need to be of a sizable scale so that it can fully optimise and utilise huge and costly large robots to produce cars more cost efficiently on a large-scale basis, such as to:
process a wide variety of parts by using technologylike RFID tags2
spot weld car body panels2
perform tasks like screw driving, windshieldinstallation, wheel mounting, car painting andspraying coatings like sealants, primers and adhesives2 etc.
<E & L> Highly repeatable, robots never tire or get distracted, thus every cycle is performed the same way2, improving productivity. As the car manufacturer production from Q1 to Q2, AC from C1 to C2.
<E> Non-technical EOS refers to the non-plant size / non-production process related cost savings experienced as the size of the
increases. <E> (1) Firm’s expansion enjoy
by hiring professionals to specialise in different work areas.
<E & L> For e.g. a large car manufacturer can hire mangers to engage in organisational planning to take care of administrative, logistics matters etc. productivity output from Q1 to Q2 AC from C1 to C2.
<E> (2) Another firm EOS that can be enjoyed is
, by buying factor inputs in bulk. Suppliers of these inputs, in their eagerness to secure the firm’s orders, will often offer a discount on its purchase firm’s AC. Also, when large firms
2 http://www.acieta.com/why-robotic-automation/robotic-solutions-industry/automotive-applications
administratetetc.c. pfrfrffff omom QQ1 to CC
produce cars more cost efficientlys, susus chchchchhchh asss to::rieeety y y y y yy ooofooo ppppaaartsssssss bbbbbby yyyyy usssssininininininingggggggg teechnonnooloooooooogygygygyggygyggggyggygyygyy
paaaaneneenelslslslslslss2
ke eeee scscscscscscsccrererererererew wwwwww drdrdrd ivivvi innnnggg,gggg wwwwwwwininininnninndsdsddsddd hielddmounting car painting and
22.<E<E>> (2) Acacann be e
b b
© DHS 2017 9757/H2 Economics Prelims/Paper 2
<E> (2) Another technical EOS that firms can enjoy is or division of operations / labour – by
assigning workers to specific roles, daily repetition allows the workers to accumulate skills and knowledge (learning by doing), thus the output per worker productivity. Total output at a faster rate AC.
<E & L> For e.g. Henry Ford adopted specialisation of labour by introducing the use of an assembly line to assemble the Ford Model T car allowed workers to specialise in a particular section of production – some workers specialise in assembling doors, others in painting of the doors etc. This assembly production method car production by 8 times productivity. output from Q1 to Q2 AC from C1 to C2.
advertise, the cost is spread over a larger output advertising expenditure per unit of output sold becomes very low.
<E & L> For e.g. large car manufacturers Toyota buy factor inputs like aluminium or steel in bulk quantities enjoy larger bargaining power negotiate for lower prices from suppliers. Advertisement cost is also spread over the large volume of vehicles sold by Toyota advertising cost per car is very low. output from Q1 to Q2 AC from C1 to C2.
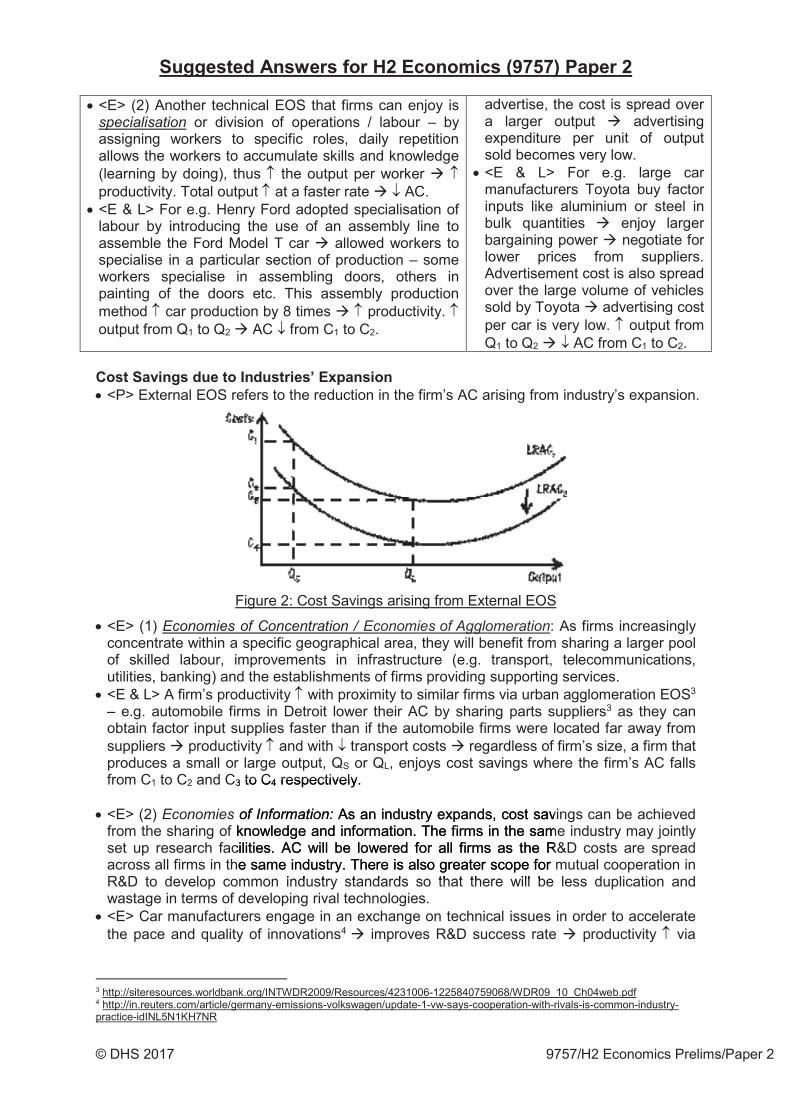
<P> External EOS refers to the reduction in the firm’s AC arising from industry’s expansion.
Figure 2: Cost Savings arising from External EOS
<E> (1) : As firms increasingly concentrate within a specific geographical area, they will benefit from sharing a larger pool of skilled labour, improvements in infrastructure (e.g. transport, telecommunications, utilities, banking) and the establishments of firms providing supporting services.
<E & L> A firm’s productivity with proximity to similar firms via urban agglomeration EOS3 – e.g. automobile firms in Detroit lower their AC by sharing parts suppliers3 as they can obtain factor input supplies faster than if the automobile firms were located far away from suppliers productivity and with transport costs regardless of firm’s size, a firm that produces a small or large output, QS or QL, enjoys cost savings where the firm’s AC falls from C1 to C2 and C3 to C4 respectively.
<E> (2) As an industry expands, cost savings can be achieved from the sharing of knowledge and information. The firms in the same industry may jointly set up research facilities. AC will be lowered for all firms as the R&D costs are spread across all firms in the same industry. There is also greater scope for mutual cooperation in R&D to develop common industry standards so that there will be less duplication and wastage in terms of developing rival technologies.
<E> Car manufacturers engage in an exchange on technical issues in order to accelerate the pace and quality of innovations4 improves R&D success rate productivity via
3 http://siteresources.worldbank.org/INTWDR2009/Resources/4231006-1225840759068/WDR09_10_Ch04web.pdf 4 http://in.reuters.com/article/germany-emissions-volkswagen/update-1-vw-says-cooperation-with-rivals-is-common-industry-practice-idINL5N1KH7NR
3 to C4 respectively.
AAAAAAAs sss ananananananan iiiinndndnnnn ustrryyy yyyyyy exexxexxxxexeexxexexpapapppapapapapapapandndndndnndnnddndnds,s,ssss ccosostt savknnnnnooowleeeeeeedgdgddgdddgeeeee aaanaaa d ininininininnfofofofofofoormrmrmrmrmrmrmrmaaataaaa ioioioioioooon.n.n.n.n.n.n. TTTTTTTTThe fffffffffiriiririrmsmsmsms inn ththee sasam
cilititiiiiiiesesesess...... ACACACACACACACAC wwwwwwililililili l lllll bebebeee lowowowowowowowowererererererededededededede ffffffororrorororro all ffirirmsms aass the Re sassamememememememe iiiiiindndndndndndndusususssustrrrrryyy.y Thehehehehehehererererereere iiiiis ssss alalaalalaaa sosss grereataterr sscocope for
ommon industry standards so that there will be
© DHS 2017 9757/H2 Economics Prelims/Paper 2
sharing / dissemination of R&D information than if such information were kept confidential regardless of firm’s size, the firm enjoys cost savings
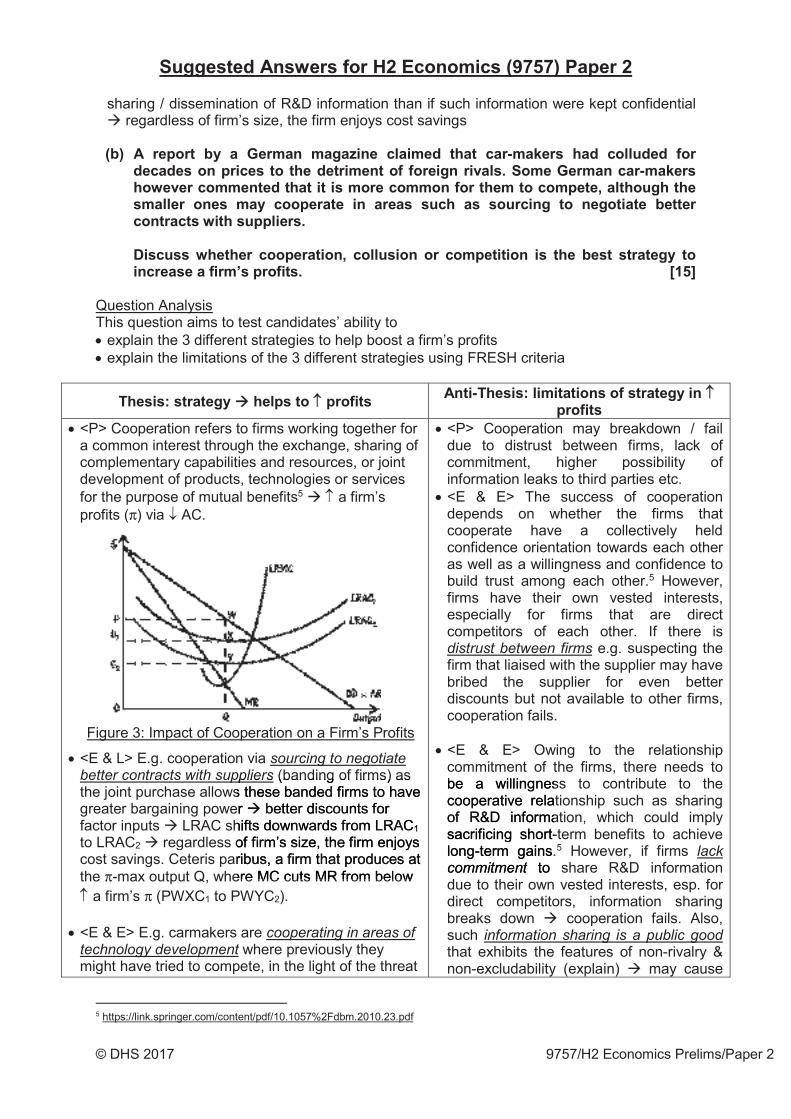
Question Analysis This question aims to test candidates’ ability to explain the 3 different strategies to help boost a firm’s profits explain the limitations of the 3 different strategies using FRESH criteria
<P> Cooperation refers to firms working together for a common interest through the exchange, sharing of complementary capabilities and resources, or joint development of products, technologies or services for the purpose of mutual benefits5 a firm’s profits ( ) via AC.
Figure 3: Impact of Cooperation on a Firm’s Profits
<E & L> E.g. cooperation via (banding of firms) as
the joint purchase allows these banded firms to have greater bargaining power better discounts for factor inputs LRAC shifts downwards from LRAC1 to LRAC2 regardless of firm’s size, the firm enjoys cost savings. Ceteris paribus, a firm that produces at the -max output Q, where MC cuts MR from below
a firm’s (PWXC1 to PWYC2).
<E & E> E.g. carmakers are where previously they
might have tried to compete, in the light of the threat
<P> Cooperation may breakdown / fail due to distrust between firms, lack of commitment, higher possibility of information leaks to third parties etc.
<E & E> The success of cooperation depends on whether the firms that cooperate have a collectively held confidence orientation towards each other as well as a willingness and confidence to build trust among each other.5 However, firms have their own vested interests, especially for firms that are direct competitors of each other. If there is
e.g. suspecting the firm that liaised with the supplier may have bribed the supplier for even better discounts but not available to other firms, cooperation fails.
<E & E> Owing to the relationship commitment of the firms, there needs to be a willingness to contribute to the cooperative relationship such as sharing of R&D information, which could imply sacrificing short-term benefits to achieve long-term gains.5 However, if firms
to share R&D information due to their own vested interests, esp. for direct competitors, information sharing breaks down cooperation fails. Also, such that exhibits the features of non-rivalry & non-excludability (explain) may cause
5 https://link.springer.com/content/pdf/10.1057%2Fdbm.2010.23.pdf
be a willingngnescocoopoppppereratativivee rerelaoofooofofofoooo RRRRRRRRRR&D&D&&& iinfnformasacrcriiififii icicinngg shshoort-loongng-t-terermm gains.
to
(banding of firms) as s thhhhhhesesesesesse eeee ee babababandnnn edededdededed firmsmsmsmsmsmssm tttttttto o oo o o hahhhaave r bbbbbbetteeerrr diiiiiiiscscscscscscscooouoooo ntntntntntntn ssss sss fofofofoffoor
hiftsttss dddddowowowowowwo nwnwnwwwwarararararaa dsdsdsss fffffffrororororororom mmmmmm LRLRLRLRLRLRLRL ACACACACACAACAC111111of fffffiriirirm’mmmmmmmm s s s s ss sisissisisis zezezezeze,,,,, thththththhe e e ee fifififififfiirmrmrmrmmmm eeeeenjnjnjnnjnnjjoyoyoyoyyoyys sssssribubububbus,s,,,, aaaaaaa fffffffiririririririrmmmmmmm thhhatatataa proooooodududududududducecececececececesss ssss ataatatatataa
were MC cuts MR from bbbbelow d t th i
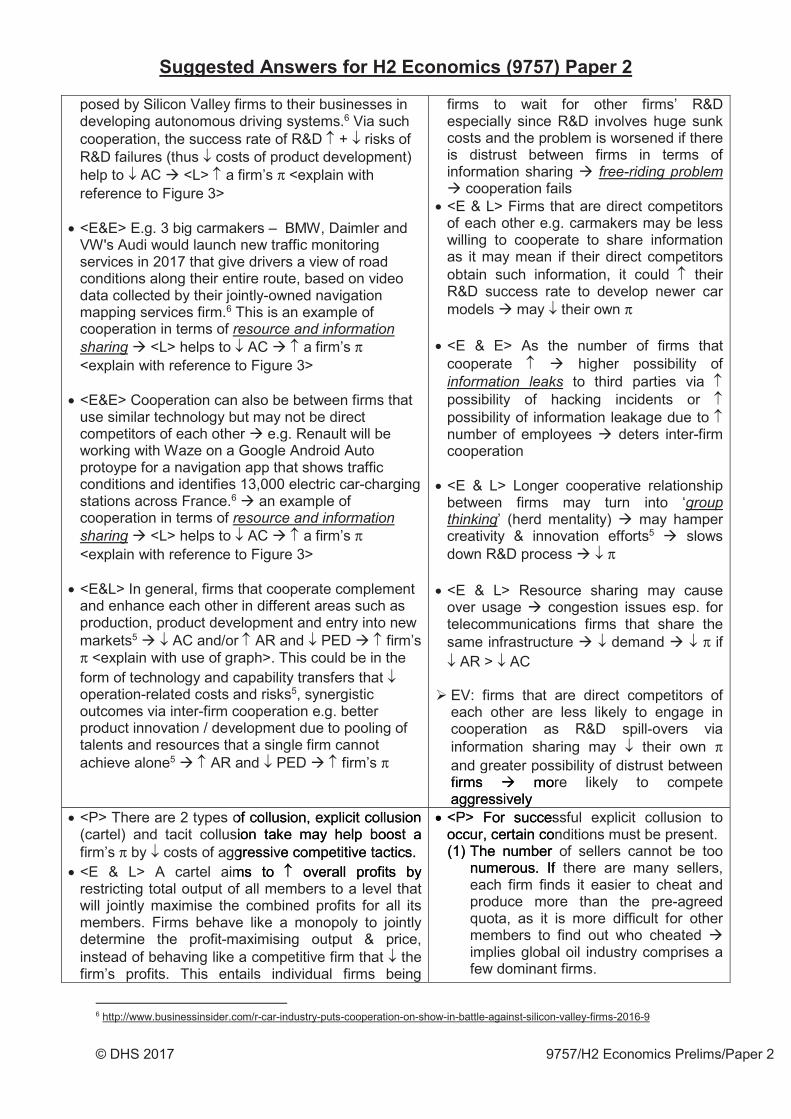
© DHS 2017 9757/H2 Economics Prelims/Paper 2
posed by Silicon Valley firms to their businesses in developing autonomous driving systems.6 Via such cooperation, the success rate of R&D + risks of R&D failures (thus costs of product development) help to AC <L> a firm’s <explain with reference to Figure 3>
<E&E> E.g. 3 big carmakers – BMW, Daimler and VW's Audi would launch new traffic monitoring services in 2017 that give drivers a view of road conditions along their entire route, based on video data collected by their jointly-owned navigation mapping services firm.6 This is an example of cooperation in terms of
<L> helps to AC a firm’s <explain with reference to Figure 3>
<E&E> Cooperation can also be between firms that use similar technology but may not be direct competitors of each other e.g. Renault will be working with Waze on a Google Android Auto protoype for a navigation app that shows traffic conditions and identifies 13,000 electric car-charging stations across France.6 an example of cooperation in terms of
<L> helps to AC a firm’s <explain with reference to Figure 3>
<E&L> In general, firms that cooperate complement and enhance each other in different areas such as production, product development and entry into new markets5 AC and/or AR and PED firm’s <explain with use of graph>. This could be in the
form of technology and capability transfers that operation-related costs and risks5, synergistic outcomes via inter-firm cooperation e.g. better product innovation / development due to pooling of talents and resources that a single firm cannot achieve alone5 AR and PED firm’s
firms to wait for other firms’ R&D especially since R&D involves huge sunk costs and the problem is worsened if there is distrust between firms in terms of information sharing
cooperation fails <E & L> Firms that are direct competitors of each other e.g. carmakers may be less willing to cooperate to share information as it may mean if their direct competitors obtain such information, it could their R&D success rate to develop newer car models may their own
<E & E> As the number of firms that cooperate higher possibility of
to third parties via possibility of hacking incidents or possibility of information leakage due to number of employees deters inter-firm cooperation
<E & L> Longer cooperative relationship between firms may turn into ‘
’ (herd mentality) may hamper creativity & innovation efforts5 slows down R&D process
<E & L> Resource sharing may cause over usage congestion issues esp. for telecommunications firms that share the same infrastructure demand if
AR > AC
EV: firms that are direct competitors ofeach other are less likely to engage incooperation as R&D spill-overs viainformation sharing may their own and greater possibility of distrust betweenfirms more likely to competeaggressively
<P> There are 2 types of collusion, explicit collusion (cartel) and tacit collusion take may help boost a firm’s by costs of aggressive competitive tactics.
<E & L> A cartel aims to overall profits by restricting total output of all members to a level that will jointly maximise the combined profits for all its members. Firms behave like a monopoly to jointly determine the profit-maximising output & price, instead of behaving like a competitive firm that the firm’s profits. This entails individual firms being
<P> For successful explicit collusion to occur, certain conditions must be present. (1) The number of sellers cannot be too
numerous. If there are many sellers, each firm finds it easier to cheat and produce more than the pre-agreed quota, as it is more difficult for other members to find out who cheated implies global oil industry comprises a few dominant firms.
6 http://www.businessinsider.com/r-car-industry-puts-cooperation-on-show-in-battle-against-silicon-valley-firms-2016-9
firms moagagggggrgrggg esessisivevelyly
of coooooollllllllllluususususuuu ioonnn, eeeeeeexpxpxpxppplilililililiiciciccicc t t t t tt cocooooooollllllllllllusususususionionnnnnn tttttakakakakakkakeee eeee mamamamamamay hehehehehehehelplplplplpp bbbbbbbboooooooo ststststststst aaaaaaa gresesesese sisisisiiiveveveveveeve ccccccccomomomomomompepepepepepetititiiititititiivevevevevevee tttttttacacacaccctititititit cscscscscscsc ... ms to overall profififif ts by
<<<<<<<<<<<<PP>P>P>P>P>P>P>>P>P FFFFFFoor ssuuccesoccucur,r, ccerertatainin cco(11) ) ThThe e nunumber
numemerous. Ifh fi fi
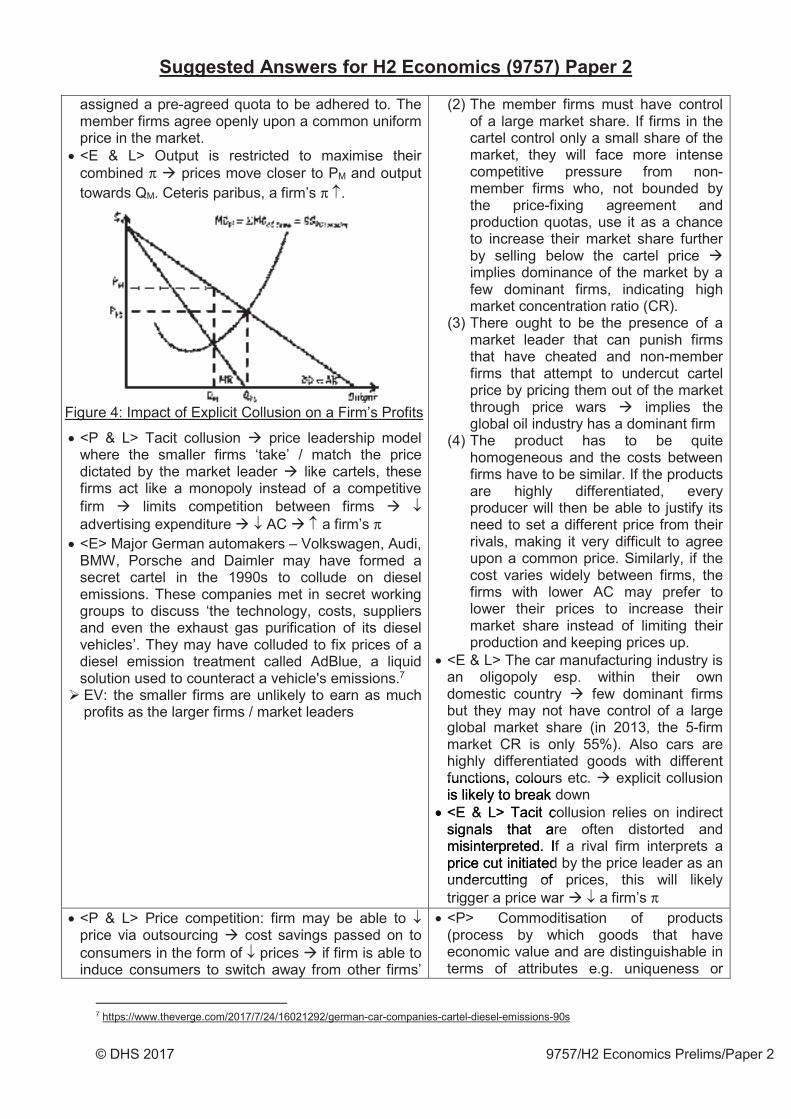
© DHS 2017 9757/H2 Economics Prelims/Paper 2
assigned a pre-agreed quota to be adhered to. The member firms agree openly upon a common uniform price in the market.
<E & L> Output is restricted to maximise their combined prices move closer to PM and output towards QM. Ceteris paribus, a firm’s .
Figure 4: Impact of Explicit Collusion on a Firm’s Profits
<P & L> Tacit collusion price leadership model where the smaller firms ‘take’ / match the price dictated by the market leader like cartels, these firms act like a monopoly instead of a competitive firm limits competition between firms advertising expenditure AC a firm’s
<E> Major German automakers – Volkswagen, Audi, BMW, Porsche and Daimler may have formed a secret cartel in the 1990s to collude on diesel emissions. These companies met in secret working groups to discuss ‘the technology, costs, suppliers and even the exhaust gas purification of its diesel vehicles’. They may have colluded to fix prices of a diesel emission treatment called AdBlue, a liquid solution used to counteract a vehicle's emissions.7 EV: the smaller firms are unlikely to earn as muchprofits as the larger firms / market leaders
(2) The member firms must have control of a large market share. If firms in the cartel control only a small share of the market, they will face more intense competitive pressure from non-member firms who, not bounded by the price-fixing agreement and production quotas, use it as a chance to increase their market share further by selling below the cartel price implies dominance of the market by a few dominant firms, indicating high market concentration ratio (CR).
(3) There ought to be the presence of a market leader that can punish firms that have cheated and non-member firms that attempt to undercut cartel price by pricing them out of the market through price wars implies the global oil industry has a dominant firm
(4) The product has to be quite homogeneous and the costs between firms have to be similar. If the products are highly differentiated, every producer will then be able to justify its need to set a different price from their rivals, making it very difficult to agree upon a common price. Similarly, if the cost varies widely between firms, the firms with lower AC may prefer to lower their prices to increase their market share instead of limiting their production and keeping prices up.
<E & L> The car manufacturing industry is an oligopoly esp. within their own domestic country few dominant firms but they may not have control of a large global market share (in 2013, the 5-firm market CR is only 55%). Also cars are highly differentiated goods with different functions, colours etc. explicit collusion is likely to break down
<E & L> Tacit collusion relies on indirect signals that are often distorted and misinterpreted. If a rival firm interprets a price cut initiated by the price leader as an undercutting of prices, this will likely trigger a price war a firm’s
<P & L> Price competition: firm may be able to price via outsourcing cost savings passed on to consumers in the form of prices if firm is able to induce consumers to switch away from other firms’
<P> Commoditisation of products (process by which goods that have economic value and are distinguishable in terms of attributes e.g. uniqueness or
7 https://www.theverge.com/2017/7/24/16021292/german-car-companies-cartel-diesel-emissions-90s
functions, colouris likelely y toto bbrereaka<<<<<<<<<<<<<<EEEEE EEEE &&& & &&&&&&&& L>L> TTacaciit csisiisiisisisigngngngngnalalaaaaa s ththatat amiisisintntererprprete ed. Iprpricice cucutt ininitiatedundercutting of
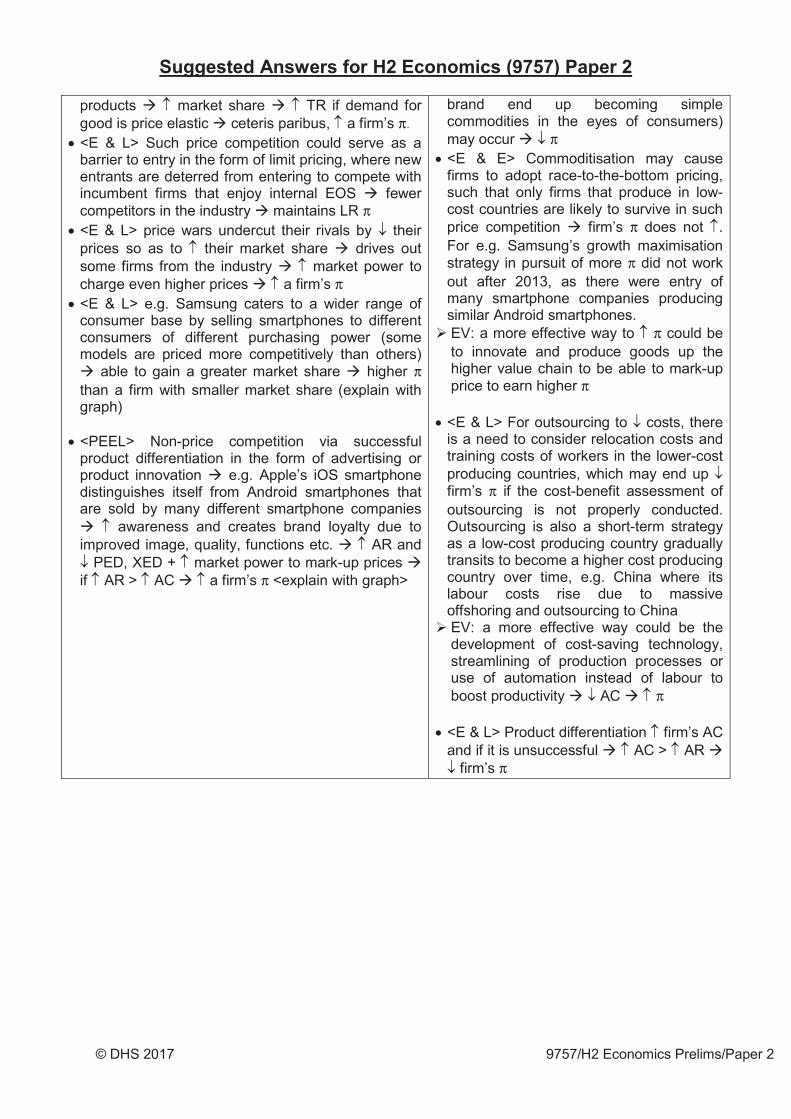
© DHS 2017 9757/H2 Economics Prelims/Paper 2
products market share TR if demand for good is price elastic ceteris paribus, a firm’s
<E & L> Such price competition could serve as a barrier to entry in the form of limit pricing, where new entrants are deterred from entering to compete with incumbent firms that enjoy internal EOS fewer competitors in the industry maintains LR
<E & L> price wars undercut their rivals by their prices so as to their market share drives out some firms from the industry market power to charge even higher prices a firm’s
<E & L> e.g. Samsung caters to a wider range of consumer base by selling smartphones to different consumers of different purchasing power (some models are priced more competitively than others)
able to gain a greater market share higher than a firm with smaller market share (explain with graph)
<PEEL> Non-price competition via successful product differentiation in the form of advertising or product innovation e.g. Apple’s iOS smartphone distinguishes itself from Android smartphones that are sold by many different smartphone companies
awareness and creates brand loyalty due to improved image, quality, functions etc. AR and
PED, XED + market power to mark-up prices if AR > AC a firm’s <explain with graph>
brand end up becoming simple commodities in the eyes of consumers) may occur
<E & E> Commoditisation may cause firms to adopt race-to-the-bottom pricing, such that only firms that produce in low-cost countries are likely to survive in such price competition firm’s does not . For e.g. Samsung’s growth maximisation strategy in pursuit of more did not work out after 2013, as there were entry of many smartphone companies producing similar Android smartphones. EV: a more effective way to could beto innovate and produce goods up the higher value chain to be able to mark-up price to earn higher
<E & L> For outsourcing to costs, there is a need to consider relocation costs and training costs of workers in the lower-cost producing countries, which may end up firm’s if the cost-benefit assessment of outsourcing is not properly conducted. Outsourcing is also a short-term strategy as a low-cost producing country gradually transits to become a higher cost producing country over time, e.g. China where its labour costs rise due to massive offshoring and outsourcing to China EV: a more effective way could be thedevelopment of cost-saving technology, streamlining of production processes or use of automation instead of labour to boost productivity AC
<E & L> Product differentiation firm’s AC and if it is unsuccessful AC > AR
firm’s
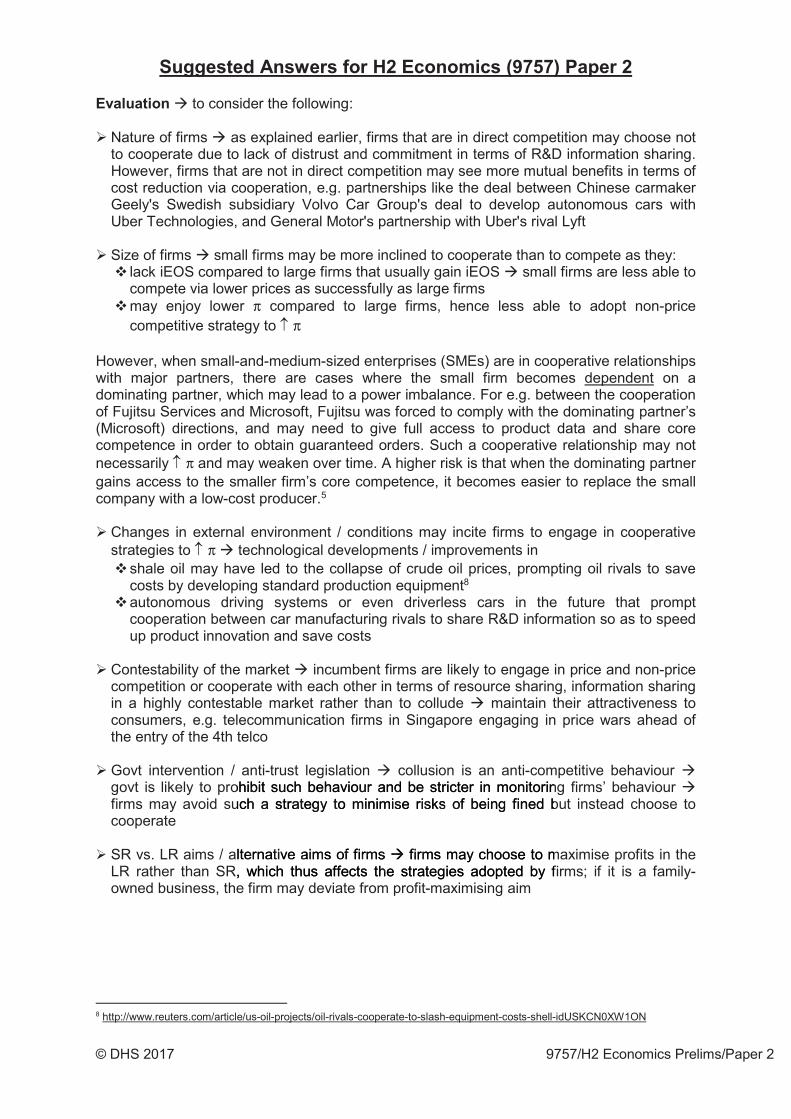
© DHS 2017 9757/H2 Economics Prelims/Paper 2
to consider the following:
Nature of firms as explained earlier, firms that are in direct competition may choose notto cooperate due to lack of distrust and commitment in terms of R&D information sharing.However, firms that are not in direct competition may see more mutual benefits in terms ofcost reduction via cooperation, e.g. partnerships like the deal between Chinese carmakerGeely's Swedish subsidiary Volvo Car Group's deal to develop autonomous cars withUber Technologies, and General Motor's partnership with Uber's rival Lyft
Size of firms small firms may be more inclined to cooperate than to compete as they: lack iEOS compared to large firms that usually gain iEOS small firms are less able tocompete via lower prices as successfully as large firms may enjoy lower compared to large firms, hence less able to adopt non-pricecompetitive strategy to
However, when small-and-medium-sized enterprises (SMEs) are in cooperative relationships with major partners, there are cases where the small firm becomes dependent on a dominating partner, which may lead to a power imbalance. For e.g. between the cooperation of Fujitsu Services and Microsoft, Fujitsu was forced to comply with the dominating partner’s (Microsoft) directions, and may need to give full access to product data and share core competence in order to obtain guaranteed orders. Such a cooperative relationship may not necessarily and may weaken over time. A higher risk is that when the dominating partner gains access to the smaller firm’s core competence, it becomes easier to replace the small company with a low-cost producer.5
Changes in external environment / conditions may incite firms to engage in cooperativestrategies to technological developments / improvements in
shale oil may have led to the collapse of crude oil prices, prompting oil rivals to savecosts by developing standard production equipment8 autonomous driving systems or even driverless cars in the future that promptcooperation between car manufacturing rivals to share R&D information so as to speed up product innovation and save costs
Contestability of the market incumbent firms are likely to engage in price and non-pricecompetition or cooperate with each other in terms of resource sharing, information sharingin a highly contestable market rather than to collude maintain their attractiveness toconsumers, e.g. telecommunication firms in Singapore engaging in price wars ahead ofthe entry of the 4th telco
Govt intervention / anti-trust legislation collusion is an anti-competitive behaviour govt is likely to prohibit such behaviour and be stricter in monitoring firms’ behaviour firms may avoid such a strategy to minimise risks of being fined but instead choose tocooperate
SR vs. LR aims / alternative aims of firms firms may choose to maximise profits in theLR rather than SR, which thus affects the strategies adopted by firms; if it is a family-owned business, the firm may deviate from profit-maximising aim
8 http://www.reuters.com/article/us-oil-projects/oil-rivals-cooperate-to-slash-equipment-costs-shell-idUSKCN0XW1ON
ohibbbbbbit ssssssucucucuuuu h hhhh beeeeeehahahaaaaviouououuouuouourrr rr anananaana ddd beeee stricter in monnititoro inuchhh aaaaaa strataattegggggggyyy yyyy totototototto mmmmmmmminininininnimimimimimi isiisise rissskkkkksssss ofofofofof bbbbbeieingng ffinneded b
lteeernrrnrnatatatatattiviviviviviviveeeeeee aiaiaiaa msmsmsmsmms ooooof ffff fifififififfirmrmrmrmmrmmrms s s sss fffffffiriiirirmmmmsm mmayay chohoosose to m, which thus affects thhhhhe strategieses adodopted by f
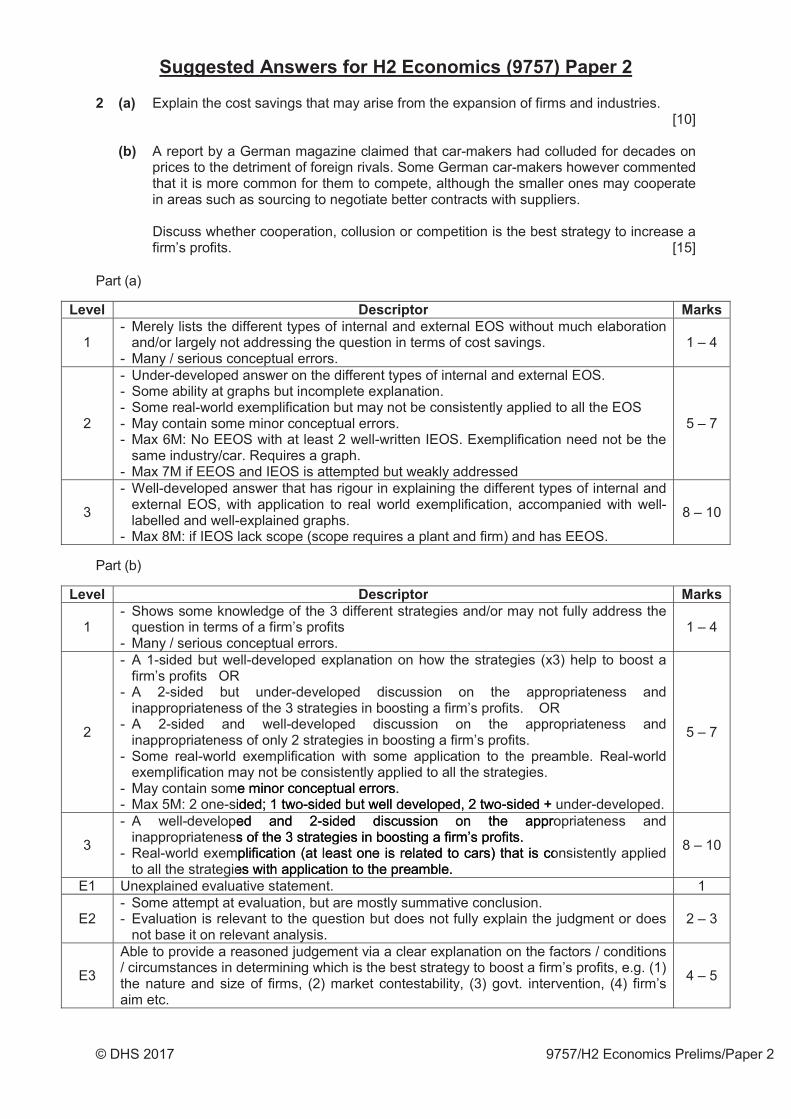
© DHS 2017 9757/H2 Economics Prelims/Paper 2
Explain the cost savings that may arise from the expansion of firms and industries. [10]
A report by a German magazine claimed that car-makers had colluded for decades on prices to the detriment of foreign rivals. Some German car-makers however commented that it is more common for them to compete, although the smaller ones may cooperate in areas such as sourcing to negotiate better contracts with suppliers.
Discuss whether cooperation, collusion or competition is the best strategy to increase a firm’s profits. [15]
Part (a)
1 - Merely lists the different types of internal and external EOS without much elaboration
and/or largely not addressing the question in terms of cost savings. - Many / serious conceptual errors.
1 – 4
2
- Under-developed answer on the different types of internal and external EOS. - Some ability at graphs but incomplete explanation. - Some real-world exemplification but may not be consistently applied to all the EOS - May contain some minor conceptual errors. - Max 6M: No EEOS with at least 2 well-written IEOS. Exemplification need not be the
same industry/car. Requires a graph. - Max 7M if EEOS and IEOS is attempted but weakly addressed
5 – 7
3
- Well-developed answer that has rigour in explaining the different types of internal and external EOS, with application to real world exemplification, accompanied with well-labelled and well-explained graphs.
- Max 8M: if IEOS lack scope (scope requires a plant and firm) and has EEOS.
8 – 10
Part (b)
1 - Shows some knowledge of the 3 different strategies and/or may not fully address the
question in terms of a firm’s profits - Many / serious conceptual errors.
1 – 4
2
- A 1-sided but well-developed explanation on how the strategies (x3) help to boost a firm’s profits OR
- A 2-sided but under-developed discussion on the appropriateness and inappropriateness of the 3 strategies in boosting a firm’s profits. OR
- A 2-sided and well-developed discussion on the appropriateness and inappropriateness of only 2 strategies in boosting a firm’s profits.
- Some real-world exemplification with some application to the preamble. Real-world exemplification may not be consistently applied to all the strategies.
- May contain some minor conceptual errors. - Max 5M: 2 one-sided; 1 two-sided but well developed, 2 two-sided + under-developed.
5 – 7
3
- A well-developed and 2-sided discussion on the appropriateness and inappropriateness of the 3 strategies in boosting a firm’s profits.
- Real-world exemplification (at least one is related to cars) that is consistently applied to all the strategies with application to the preamble.
8 – 10
E1 Unexplained evaluative statement. 1
E2 - Some attempt at evaluation, but are mostly summative conclusion. - Evaluation is relevant to the question but does not fully explain the judgment or does
not base it on relevant analysis. 2 – 3
E3
Able to provide a reasoned judgement via a clear explanation on the factors / conditions / circumstances in determining which is the best strategy to boost a firm’s profits, e.g. (1) the nature and size of firms, (2) market contestability, (3) govt. intervention, (4) firm’s aim etc.
4 – 5
y y pp ge mmmmmminororororororr conoooo ceeeeeeptptpptptttual erereeererere rororrorororor rssss.ideeed;d;d;dd;d; 11111 twowwoo-sididdididididededededededd butututututuu wwwwwweeeell dddeveeeelloloopepepepepepedd,dd,d, 2222222 ttwowo-s-sidideded +eddddd aaaaandnnnnn 2222222-s-s--s--- idididdddedededededede ddddddddissssssscucucucucucc ssssssioioioioiooioooon onononon tthehe appp ros ofofofofoo ttthehehehehehh 3333333 sssstrtttrttraaataa eggggieiieieieies ssssssss inininininn bbbbbbbooststststststs ininninnnng a firm’s’s pprorofifitsts.
tthahat is copliiififififfifficacacacaatittitititit onononononoon ((((((atatatttt lllleaeaeaeaeaeastststststt oooooonenenenenenenn iiiissss sss rerererererer lallalalalal tetetetteted too ccara s)s)es iwiththththth app ca on to prea le.applililililicatiiion to ththththtthhe eeee preamble
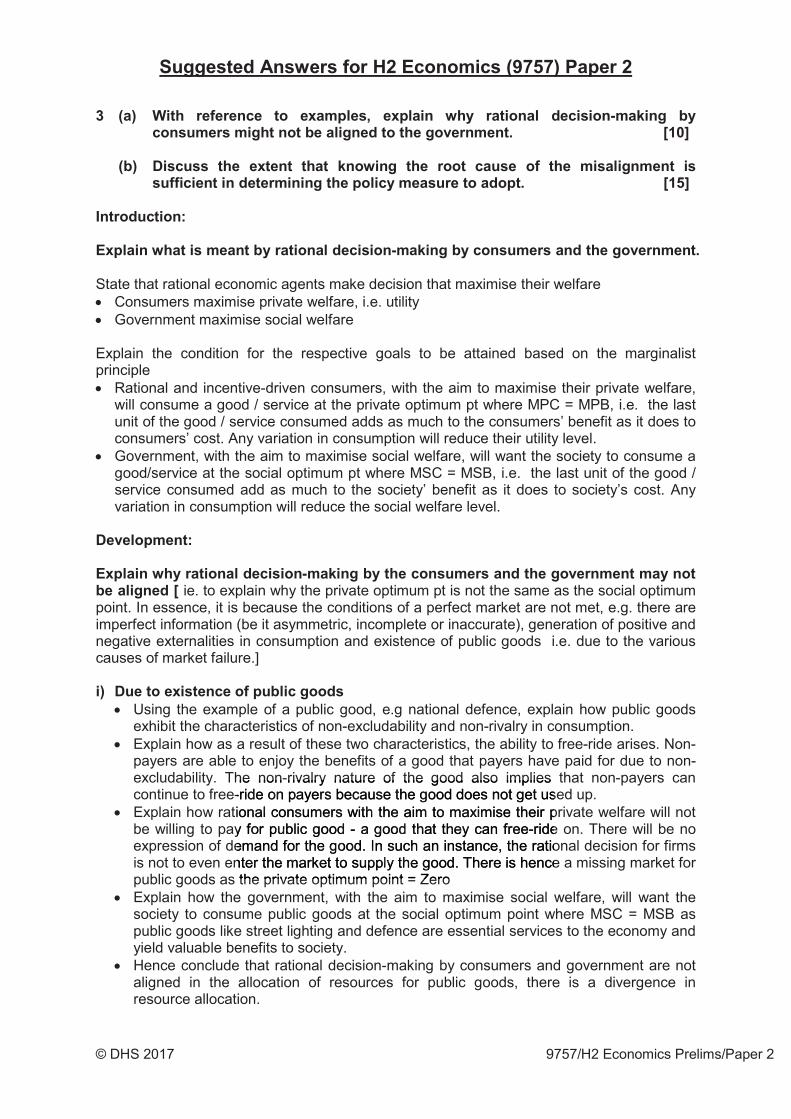
© DHS 2017 9757/H2 Economics Prelims/Paper 2
State that rational economic agents make decision that maximise their welfare Consumers maximise private welfare, i.e. utility Government maximise social welfare
Explain the condition for the respective goals to be attained based on the marginalist principle Rational and incentive-driven consumers, with the aim to maximise their private welfare,
will consume a good / service at the private optimum pt where MPC = MPB, i.e. the last unit of the good / service consumed adds as much to the consumers’ benefit as it does to consumers’ cost. Any variation in consumption will reduce their utility level.
Government, with the aim to maximise social welfare, will want the society to consume a good/service at the social optimum pt where MSC = MSB, i.e. the last unit of the good / service consumed add as much to the society’ benefit as it does to society’s cost. Any variation in consumption will reduce the social welfare level.
ie. to explain why the private optimum pt is not the same as the social optimum point. In essence, it is because the conditions of a perfect market are not met, e.g. there are imperfect information (be it asymmetric, incomplete or inaccurate), generation of positive and negative externalities in consumption and existence of public goods i.e. due to the various causes of market failure.]
Using the example of a public good, e.g national defence, explain how public goods exhibit the characteristics of non-excludability and non-rivalry in consumption.
Explain how as a result of these two characteristics, the ability to free-ride arises. Non-payers are able to enjoy the benefits of a good that payers have paid for due to non-excludability. The non-rivalry nature of the good also implies that non-payers can continue to free-ride on payers because the good does not get used up.
Explain how rational consumers with the aim to maximise their private welfare will not be willing to pay for public good - a good that they can free-ride on. There will be no expression of demand for the good. In such an instance, the rational decision for firms is not to even enter the market to supply the good. There is hence a missing market for public goods as the private optimum point = Zero
Explain how the government, with the aim to maximise social welfare, will want the society to consume public goods at the social optimum point where MSC = MSB as public goods like street lighting and defence are essential services to the economy and yield valuable benefits to society.
Hence conclude that rational decision-making by consumers and government are not aligned in the allocation of resources for public goods, there is a divergence in resource allocation.
he non rivalry nature of the good also implies-ridddddeee onononononon pppaaaya errrrrrrrsssssss becacacacacacaac usususususussseeeee thht e gogogood doees s nonot t geget t usionananaaaaalllll l coccccc nsumummmmmmererererererers s s s s ss wiwiwiwiiththththththth tttttthehehehhh aimmm toooooooo mamamamamammammammamam xixixixixxixxxix mimimmmm sese ttheheiir py foffoor pupupupupuupublblblbbb icccccc gggggggooddddddd - aaaaaaa gogogogogogogg ododododododod ttttthahahahahahahahat thththhhhhhheyeyeyeeyey cccccccaan ffreree-e-rirideemamaandndndnddndd fffffffororororororor thehehehehehee gggggggoooooooooood.d.dddd.d.dd.d. IIIIIIn nnnn susususususuchchchchchchch aaaaaaaaan inststanancece,, ththe rationtererereer tthehehehehehehe mmmmmmmararararaara kekekeeeket ttt tototooo supupupupupupupplplplplplplyy yyyyyy ththththththhhe eeeeee gggoodd. ThT erere e isis hencethe private optimum point = Zero
© DHS 2017 9757/H2 Economics Prelims/Paper 2
Using the example of good that incurs negative externalities in consumption, eg. driving.
Explain what constitute MPC and MPB of driving to drivers Explain how rational consumers will consume at the private optimum level where MPC
= MPB. Draw a diagram and illustrate that the private optimum point will be at Qp. Explain how driving -> traffic congestion and pollution ->reduce overall productivity for
firms located at the congested areas and increase healthcare cost for pedestrians along the road.
Explain how these negative externalities -> additional cost incurred by the society but consumers will not take this external cost into consideration (i.e they will ignore external cost)
Explain how the Government will need to take into account this external cost when deciding on the consumption level at society level. They will want to allocate resources to produce the good up to the social optimum level where MSC = MSB where MSC = MPC + MEC and MSB = MPB + MEB. (Assuming MEB = 0) Illustrate in the same diagram how MSC = MSB is at Qs which is less than Qp
Explain how incurrence of MEC will imply that MPC < MSC, rational decision-making will led consumers to allocate more resources to the consumption of the good than the level that the government deems socially desirable.
Hence conclude that rational decision-making by consumers and government are not aligned when the consumption of the good generates externalities, be it positive or negative -> divergence in resource allocation.
iii) Explain how consumers consume goods and services based on their perceived cost
and benefits. For example, in the consumption of healthcare or education, they will consume up to the point when MPB perceived = MPC perceived. Draw a diagram to illustrate.
Explain how the government will allocate resources to produce the good at the social optimum level where MSC = MSB.
Explain how imperfect information on benefits of consuming a good -> MPB perceived < MSB -> rational decision-making by consumers will lead them to allocate less resources to the consumption of the good than the level that the government deems socially desirable. or
Explain how imperfect information on cost of consuming a good -> MPCperceived > MSC -> rational decision-making will lead consumers to allocate more resources to the consumption of the good than the level that the government deems socially desirable.
Make reference to the earlier diagram to explain the divergence in the MSB and MPB perceived curve or the divergence between the MSC and MPC perceived curves.
Hence conclude that rational decision-making by consumers and the government are not aligned when there is imperfection information -> divergence in resource allocation.
g p gorrrrr theeeeee dddddddivvvvvereeee gegegegegeeg ncnnnnnn e bebebebebebebeb twtwtwtwtwtwt eeeeeeen ththhhhe MSC and MPMPCC pe
e thhatatatatatat ratiooonaaaaaaal dededededededed ciiiiiisisisisisiiiononononononn-m-m-m-maaakinnnnggg bybybybybyybyyyyyyyy cccccconnonooooo susumemersrs aandn ttthehheheherererereree iss imimimmmmmpepeppeppp rfrfrfrfrffecececececece titititititiononnononon iiiiinfnfnfnfnfnn oooroooo mamamamamaamaaaamamationononononnnnn ->>>> didivvergrgenencec
© DHS 2017 9757/H2 Economics Prelims/Paper 2
L1 (1-4)
Answers are descriptive statements and largely irrelevant. Concepts are descriptive and explained with many errors Weak or inappropriate applications of the concepts.
Merely state the conditions for rational decision-making by consumers and thegovernment but not able to explain them.
Merely state that there is a divergence between the decisions made by thembut not able to explain why
Poor use of examples or no examples
L2 (5-7)
Attempt to explain what is meant by rational decision-making by consumers and the government and how it is attained by using the marginalist principle and why they diverge
Insufficient scope and depth Adequate attempt at exemplification – at least two examples but may not be
effectively applied Treated the question as one on Market Failure and did not address the question
directly.
L3 (8-10)
Clear economic explanation of what is meant by rational decision-making by consumers and the government and how it is attained based on the marginalist principle
Clear economic explanation of why rational decision-making -> divergence between Govt and consumers in resource allocation by examining at least two reasons (public goods, tve/-ve externalities, imperfect information)
Excellent exemplification that draw out the reasons for the divergence between the consumers and the Govt’s decision in resource allocation (at least 2 examples)
Explain with examples why knowing the root cause is necessary in determining the policy measure to adopt to ensure appropriateness
For example, if the cause of market failure is due characteristics
of good (i.e. public good) which leads to missing market due to free-ridership problem - > Govt will have to and fund it through tax-payers-> appropriate and effective in resolving the market failure. Using the example of street lamps, police protection or national defence, exemplify how knowing the root cause determines the Govt’s decision to provide and fund using tax-payers’ money to resolve the free-riders’ problem
if the cause of market failure is due to which are not considered by producers/ consumers , then
-> internalisation of positive/negative externalities -> rise in production/consumption - > appropriate in resolving the market failure.
However, if the cause of the market failure is due to , then -> increase
awareness -> reduce divergence between actual and perceived benefits/costs -> rise /
ket failure is due characteristics gooooood)d))d)d)d) wwwwwwwhihihihich llllleaeaeaeaeaeaeadsssssss tttttttoooooo mimimimimm ssssinggg markett ddueue tto o frfreee-
aaaaaaandndnndndndn fffundddd itittttt tttttttttttttthrhrhrhrhrhrhh ouououuuououughghgggg ttaxax-p-paayeingggg theheheheheeh mmmararararararrket ttttt fafafafafafaaililililililurururrurrru e.eeeee UUUUUUUsisisisiisiss nnngnnnnnn ttttttttthehehehehehhhh eeeeeeexxampmplele oof nalalalal dddddddefefefefefeffenenenenenenencececececec ,,,, exexexexexee emmemememmmemmmplplplplplplp ifffy yy yy yy hohoohohohow ww w wwww knowwiningg ththee root cprorororroviviviiiidededededededee aaaaaaandndndnndnn fununununnu d ususususussususinininininingggggggg tatatatatatataax-x-x-x-xxx payeersrs’’ momoneney to re
© DHS 2017 9757/H2 Economics Prelims/Paper 2
fall in consumption - > appropriate in resolving the market failure. Using the examples of education / smoking etc, exemplify how there is a need to subsidise/tax due to the externalities as well as a need to provide public education due to imperfect information.
If the cause of market failure is due to asymmetric information -> Govt will on producers -> protect the consumers from being misinformed by
producers and perceiving marginal benefits to be higher than actual and hence consuming beyond the social optimum point. Using the example of used cars, explain how Govt implemented the lemon law to protect consumers from retailers who sell defective goods. If a defect surfaces within 6 months of purchase, it is assumed that the defect existed at the time of sale, unless the retailer can prove otherwise.
Explain how beyond looking at the root cause, there are other factors that need to be considered when deciding on the policy options. For example
For example, giving grants to industries
in support of their R&D efforts to develop green technology may be deemed most appropriate as the change in production method will reduce emission and resolve the root cause of the problem However, it is a strain on the govt’s budget and may not be feasible if the Govt is already accumulating fiscal debts. In addition, there is uncertainty of outcome and long gestation period. Hence Govt may choose to impose indirect taxes or issue tradable permits to control the amount of emission permitted instead, which is solve the root cause of the problem, is more immediate and helps generate tax revenue for the Govt. Hence knowing the root cause is not sufficient in determining the policy measure to take.
For example, imposing indirect taxes on consumption of cigarettes
may be deemed appropriate due to the negative externalities generated. However, if demand for smoking is price inelastic, then indirect taxes may not be effective in reducing consumption level to socially optimal level (MSB = MSC). Raising taxes too high a level to reduce consumption to socially optimal level may lead to consequences (i.e increase COL, political unrest etc) that offset the intended benefits. The Govt may choose to impose rules and regulations. Although it may not be political favourable as well, it is more effective as it is does not depend on consumers’ responses.
For example, although in theory, public goods are best provided by the Govt due to its characteristics of non-rivalry and non-excludability, State-owned enterprises (SOEs) tend to be inefficient given the absence profit and competition -> higher cost. Knowing its inherent inefficiency, the govt should set up public-private partnership and involve the private sector to deliver public services to introduce profit motives and discipline of the market with the aim to increase efficiency and lower cost. Hence knowing the root cause is not sufficient. Need to adopt policies to ensure efficiency as well.
Knowing the root cause of the misalignment of resource allocation between the govt and consumers is necessary as it determines the appropriateness and effectiveness of the policy choice. However, it may not be sufficient as there other criteria to meet when deciding on the best policy option to resolve the problem.
The extent that knowing the root cause is sufficient depends on the govt’s assessment on which criterion to prioritise. This may differ across and within countries depending on characteristics, economic conditions and constraints.
ion -> higher cost. Knowing its inherent inefficiencparrrtneneneeersrsrrssrsrshhipp p annnnnnnnddddddd invovovovovovoov lvlvlvlvlveeeeeee thtthhe prpprrivate sesectctoror tto o dedelivotivvvesesesesesese aaaaaanddd dddddddisiisisisisiscicicicicicipplplpppp ineeeeeee ofofofofofoffo ttthhhe mmmarrrrrrkekekekekekekekkekettt t wiwiwiwiwiiwwww ththththth tthehe aaiimencccceee knknknknnnnowowowowooowinininnnnggg ggg the eeeeee rorororororoootototototototot cccccccauauauuuauusesesesesesesese iiiiiiis nooooottttt suusususuufffficcieientnt.. NeN es wwwwelelellell.l.l.l.l.l.
© DHS 2017 9757/H2 Economics Prelims/Paper 2
If the govt has high budget deficit and forced to adopt austerity measures, knowingthe root cause of a problem will not be sufficient in deciding on the policy to adopt. If the policy is not feasible due to financial constaint, it cannot be implemented even if it can resolve the root cause of the problem. , then knowing the root cause will probably be sufficient in making a policy option
If the govt’s assessment is such that the costs of a policy will exceed its benefits, it isnot worth implementing it even if it resolves the root cause of the problem as the issues created may lead to bigger problems. Hence the govt may have to choose alternatives even if it does not solve the root cause of the problem. For example, a root cause of morning traffic congestion may be the usage of the road at the same time which is in turn due to the inflexible school and working hours. But such system and structure can only be changed over a long period of time (time frame) as it requires a change in mind set (feasibility) and may disrupt business operations (consequences). Hence setting ERP rates may be the next best option as it diverts commuters to take public transport but it will only lead to overcrowded trains and buses at peak hours.
There is often more than one option that can resolve the root cause of problem. Hence, there is a need to choose the most effective and feasible option with least consequences and can work within the time constraint.
Note that the govt may not even know the root cause. In this case it may be at best guesswork when choosing a policy
L1 (1-4)
Answers are descriptive and largely irrelevant. For example, instead of discussing the factors affecting policy options, student discuss the effectiveness of policies adopted to correct market failure
Concepts are descriptive or explained with many errors Poor use of examples or no examples Weak or inappropriate applications of the concepts
L2 (5-7)
Imbalanced approach of whether knowing the root cause is or is not sufficient to decide on the policy option
Lacks scope and depth of analysis - Only one other factor discussed besides ‘root cause’ (Max 7)
Attempt at exemplification
L3 (8-10)
Balanced approach on the extent that knowing the root cause is sufficient to decide on the policy option
Excellent use of examples to exemplify why knowing the root cause of a problem is not sufficient by examining the instances where other factors are necessary.
E1 (1)
Random evaluation or generic limitations of knowing the root cause in deciding on the policy option but did not address the question.
E2 (2-3)
Able to make a judgement on the extent that knowing the root cause is sufficient to decision on the policy although the reasoning may not be clear.
E3 (4-5)
Able to make a judgement on the extent that knowing the root cause is sufficient to decision on the policy to use by weighing the importance of the various factors, by stating the conditions for one factor to be more important than the others.
ake eeee aaa jujujujujujujudgdgdgdgdgdgd emememememeemenenennne t tt onnnnnn ttttttttheheheheheehehe eeeeeextxtxtxtxtxtxtteneeneenee t thatat kknoowiwinng the rn on the policy although the reasoning may not be
use of examples to exemplify why knowing the rocienenenene t bybybybybybyyy eeexaxxx mimimmimmm ninnnnnn nggggggg ttttttttheheheheheehe insnnsnstancnncccnces wherere ooththerer ffaca t
evaaaluaaaatitititititit onononooo oooooor r r rrr geeeeneneneneneneneriririririrr cccc ccc liilililiillimimimimimim tatatatatatatatititititiononononononnons ofofofofoffoofoffo kkkkknononnnnn wingng tthehe rcyy oppoppopopoppptitttititt ononononononon bbbbbbututututut dddddddididdididdidi nnnnnnnnototototototto aaaaaaaddddddddddddddrereeeeesssssssssss ttttttthe qqueueststioion.n.
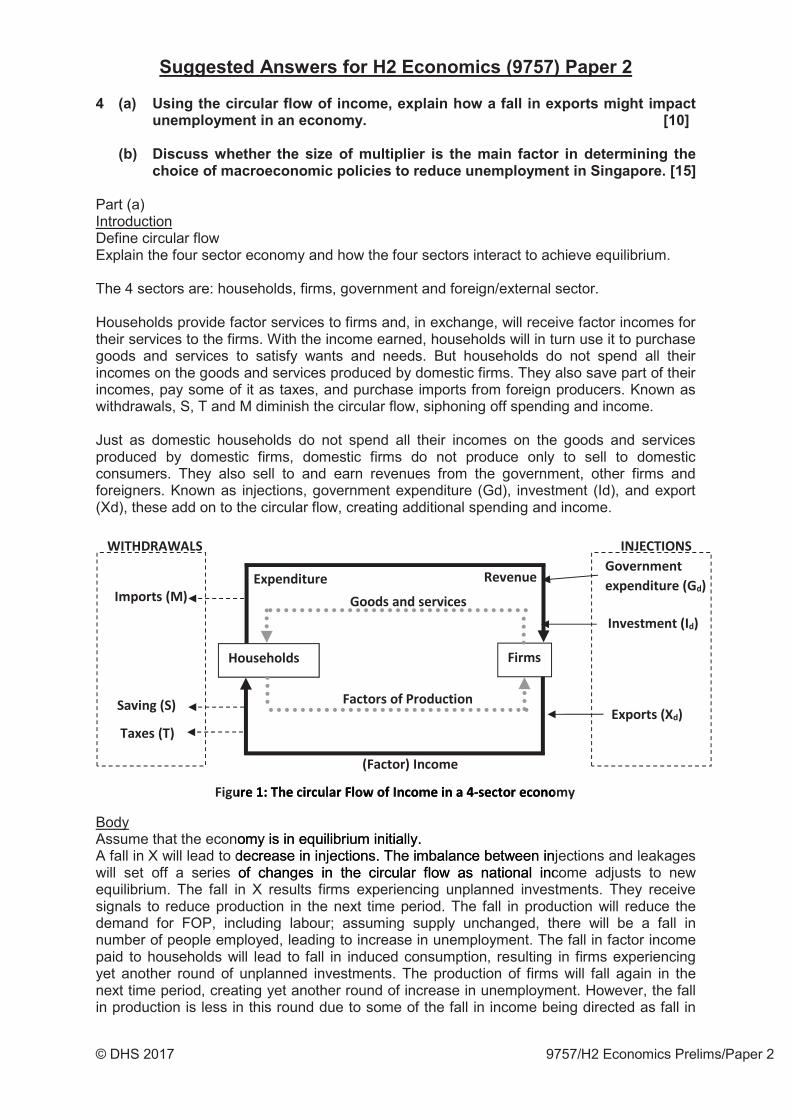
© DHS 2017 9757/H2 Economics Prelims/Paper 2
Part (a) Introduction Define circular flow Explain the four sector economy and how the four sectors interact to achieve equilibrium.
The 4 sectors are: households, firms, government and foreign/external sector.
Households provide factor services to firms and, in exchange, will receive factor incomes for their services to the firms. With the income earned, households will in turn use it to purchase goods and services to satisfy wants and needs. But households do not spend all their incomes on the goods and services produced by domestic firms. They also save part of their incomes, pay some of it as taxes, and purchase imports from foreign producers. Known as withdrawals, S, T and M diminish the circular flow, siphoning off spending and income.
Just as domestic households do not spend all their incomes on the goods and services produced by domestic firms, domestic firms do not produce only to sell to domestic consumers. They also sell to and earn revenues from the government, other firms and foreigners. Known as injections, government expenditure (Gd), investment (Id), and export (Xd), these add on to the circular flow, creating additional spending and income.
Body Assume that the economy is in equilibrium initially. A fall in X will lead to decrease in injections. The imbalance between injections and leakages will set off a series of changes in the circular flow as national income adjusts to new equilibrium. The fall in X results firms experiencing unplanned investments. They receive signals to reduce production in the next time period. The fall in production will reduce the demand for FOP, including labour; assuming supply unchanged, there will be a fall in number of people employed, leading to increase in unemployment. The fall in factor income paid to households will lead to fall in induced consumption, resulting in firms experiencing yet another round of unplanned investments. The production of firms will fall again in the next time period, creating yet another round of increase in unemployment. However, the fall in production is less in this round due to some of the fall in income being directed as fall in
ommmmmy yyy is iiin eqqqquilibrbrbrbrb iuiuiuiuiuuuuummmmm iiiniiii itialllllllll y.y.yyy.y dececcecrereasasasasasasasse ee ee ee ininininini injnjnjjnjnjececececctiitititiionononononns.sssssss TTTTTTTThehehehehehe iiiimbmbmmmbalanancece bbetetweween inof changes in the circrrrr ular flow as national inc
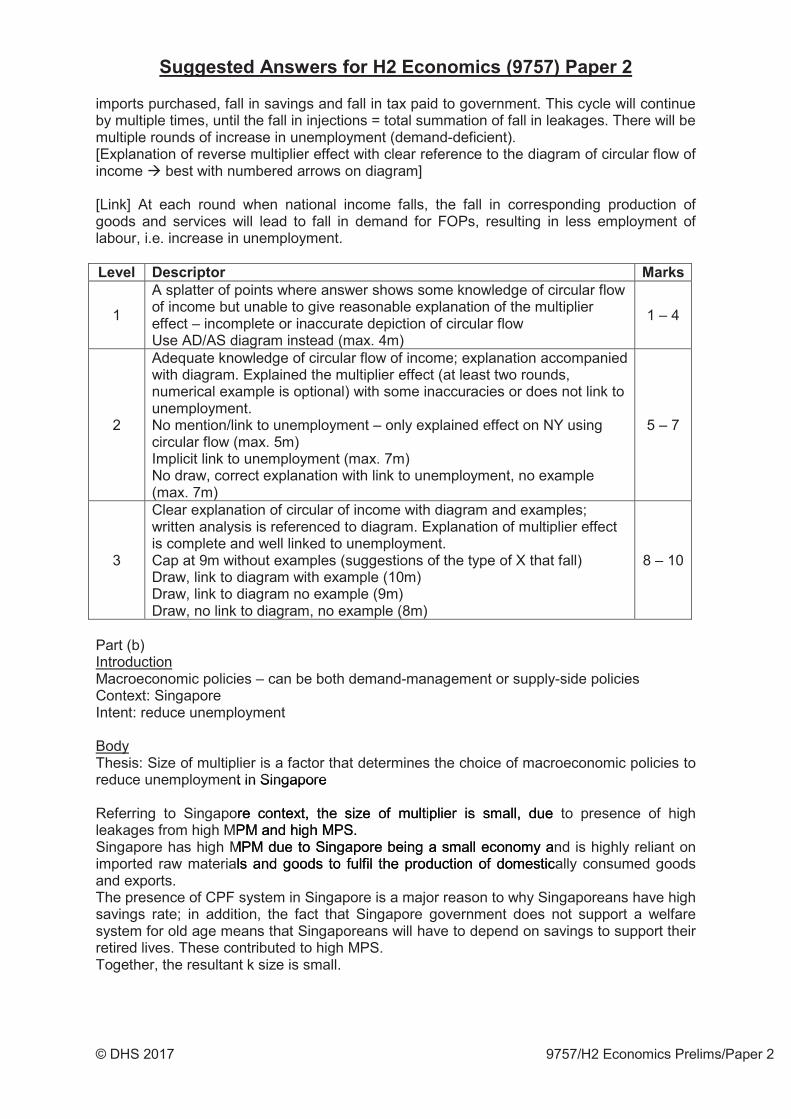
© DHS 2017 9757/H2 Economics Prelims/Paper 2
imports purchased, fall in savings and fall in tax paid to government. This cycle will continue by multiple times, until the fall in injections = total summation of fall in leakages. There will be multiple rounds of increase in unemployment (demand-deficient). [Explanation of reverse multiplier effect with clear reference to the diagram of circular flow of income best with numbered arrows on diagram]
[Link] At each round when national income falls, the fall in corresponding production of goods and services will lead to fall in demand for FOPs, resulting in less employment of labour, i.e. increase in unemployment.
1
A splatter of points where answer shows some knowledge of circular flow of income but unable to give reasonable explanation of the multiplier effect – incomplete or inaccurate depiction of circular flow Use AD/AS diagram instead (max. 4m)
1 – 4
2
Adequate knowledge of circular flow of income; explanation accompanied with diagram. Explained the multiplier effect (at least two rounds, numerical example is optional) with some inaccuracies or does not link to unemployment. No mention/link to unemployment – only explained effect on NY using circular flow (max. 5m) Implicit link to unemployment (max. 7m) No draw, correct explanation with link to unemployment, no example (max. 7m)
5 – 7
3
Clear explanation of circular of income with diagram and examples; written analysis is referenced to diagram. Explanation of multiplier effect is complete and well linked to unemployment. Cap at 9m without examples (suggestions of the type of X that fall) Draw, link to diagram with example (10m) Draw, link to diagram no example (9m) Draw, no link to diagram, no example (8m)
8 – 10
Part (b) Introduction Macroeconomic policies – can be both demand-management or supply-side policies Context: Singapore Intent: reduce unemployment
Body Thesis: Size of multiplier is a factor that determines the choice of macroeconomic policies to reduce unemployment in Singapore
Referring to Singapore context, the size of multiplier is small, due to presence of high leakages from high MPM and high MPS. Singapore has high MPM due to Singapore being a small economy and is highly reliant on imported raw materials and goods to fulfil the production of domestically consumed goods and exports. The presence of CPF system in Singapore is a major reason to why Singaporeans have high savings rate; in addition, the fact that Singapore government does not support a welfare system for old age means that Singaporeans will have to depend on savings to support their retired lives. These contributed to high MPS. Together, the resultant k size is small.
t in Singapore
ree ccccccconononoononnntextxxttx , thhhhhtheee eeee sizezezezezeee oooooof fff mmmultiiplilililililiererererereeereererrerr iiiisssssssss smsmssss aall,l, dduePMMMMM andndndndndndnd hhhhiggiggiggi hhhhhh h MPPPPPPPS.SS.SS.S.S.
MPMPMMMM dddddddueueueeueueue tttttttoooooo SiSiSiSiSiSSS ngngngngngnn apapapapapapaporororororororo e eeee bebebebebebbeeininininninnggggg aaaaaaa smmalall l ececononomo y als aaaandndnddddd ggggggggooooooooooooodsdsdsdsds ttttoooo fulflflflflflffililililillli tttheheheheheheheh pppppppprorrorororr ducttioionn ofof ddoomestic
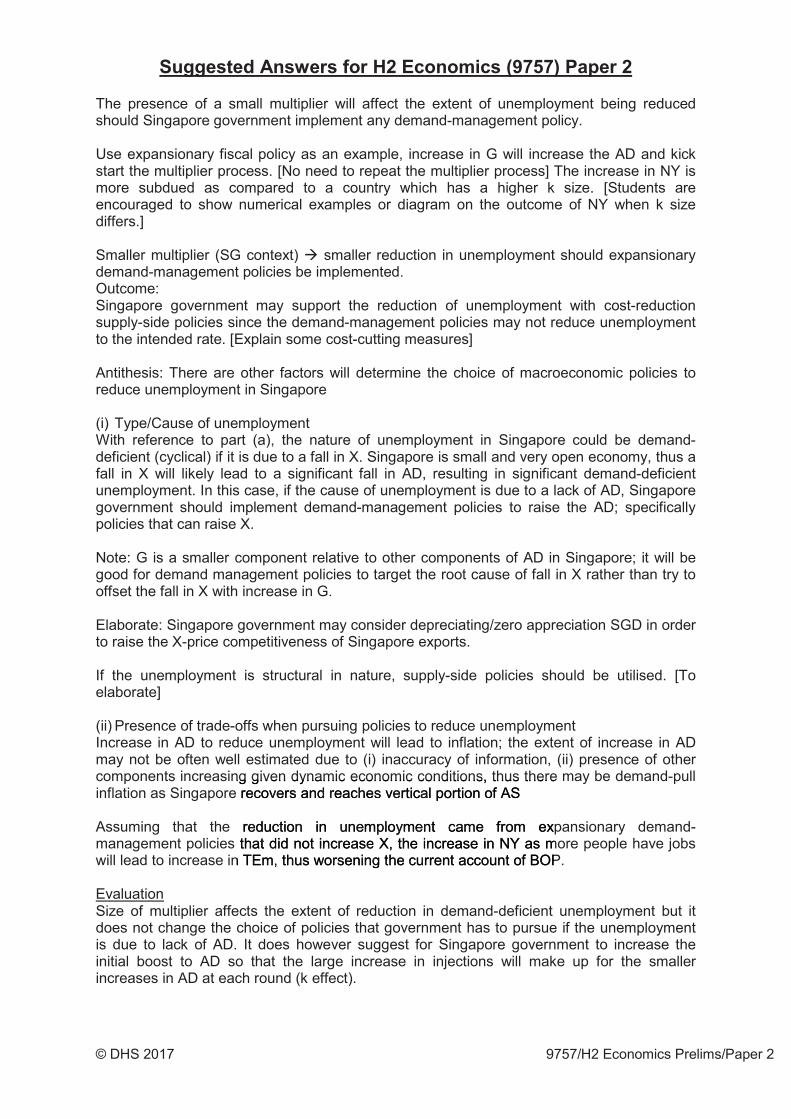
© DHS 2017 9757/H2 Economics Prelims/Paper 2
The presence of a small multiplier will affect the extent of unemployment being reduced should Singapore government implement any demand-management policy.
Use expansionary fiscal policy as an example, increase in G will increase the AD and kick start the multiplier process. [No need to repeat the multiplier process] The increase in NY is more subdued as compared to a country which has a higher k size. [Students are encouraged to show numerical examples or diagram on the outcome of NY when k size differs.]
Smaller multiplier (SG context) smaller reduction in unemployment should expansionary demand-management policies be implemented. Outcome: Singapore government may support the reduction of unemployment with cost-reduction supply-side policies since the demand-management policies may not reduce unemployment to the intended rate. [Explain some cost-cutting measures]
Antithesis: There are other factors will determine the choice of macroeconomic policies to reduce unemployment in Singapore
(i) Type/Cause of unemployment With reference to part (a), the nature of unemployment in Singapore could be demand-deficient (cyclical) if it is due to a fall in X. Singapore is small and very open economy, thus a fall in X will likely lead to a significant fall in AD, resulting in significant demand-deficient unemployment. In this case, if the cause of unemployment is due to a lack of AD, Singapore government should implement demand-management policies to raise the AD; specifically policies that can raise X.
Note: G is a smaller component relative to other components of AD in Singapore; it will be good for demand management policies to target the root cause of fall in X rather than try to offset the fall in X with increase in G.
Elaborate: Singapore government may consider depreciating/zero appreciation SGD in order to raise the X-price competitiveness of Singapore exports.
If the unemployment is structural in nature, supply-side policies should be utilised. [To elaborate]
(ii) Presence of trade-offs when pursuing policies to reduce unemployment Increase in AD to reduce unemployment will lead to inflation; the extent of increase in AD may not be often well estimated due to (i) inaccuracy of information, (ii) presence of other components increasing given dynamic economic conditions, thus there may be demand-pull inflation as Singapore recovers and reaches vertical portion of AS
Assuming that the reduction in unemployment came from expansionary demand-management policies that did not increase X, the increase in NY as more people have jobs will lead to increase in TEm, thus worsening the current account of BOP.
Evaluation Size of multiplier affects the extent of reduction in demand-deficient unemployment but it does not change the choice of policies that government has to pursue if the unemployment is due to lack of AD. It does however suggest for Singapore government to increase the initial boost to AD so that the large increase in injections will make up for the smaller increases in AD at each round (k effect).
ng given dynamic economic conditions, thus thererecececcovovvovovoveeerererree sss aaana dddddddd rerrerererereacccccccheheheheheheheh s sss sss vvvevev rticalaaa portionn ooff ASAS
reeeduduductctctctctctc ioioioiii n iiiniiii uuuuuuuneneneneneeempmpmppmpmpmpmplolololoololoymymymymymymymenenenennenennnent cacacccccaccacac memeemmeme ffroromm exethhhhhattatata dddddddiddddddd nnnnnnototototoo iiiiincncncncnccncn rerererereasasasasasasaaaseeeee X,X,X,XX,X,X, theheheheheheee iiiiiincnnnnnn reasase e inin NNY Y as m
n TTTTTEmEmEmmmEmm, thththhthhtthususususususus wwwwwwororororo sessss niniiiiingngngngngnngng ttttttttheheheheheheheh ccccccccuruuuru rentt aacccouountnt oof BOP
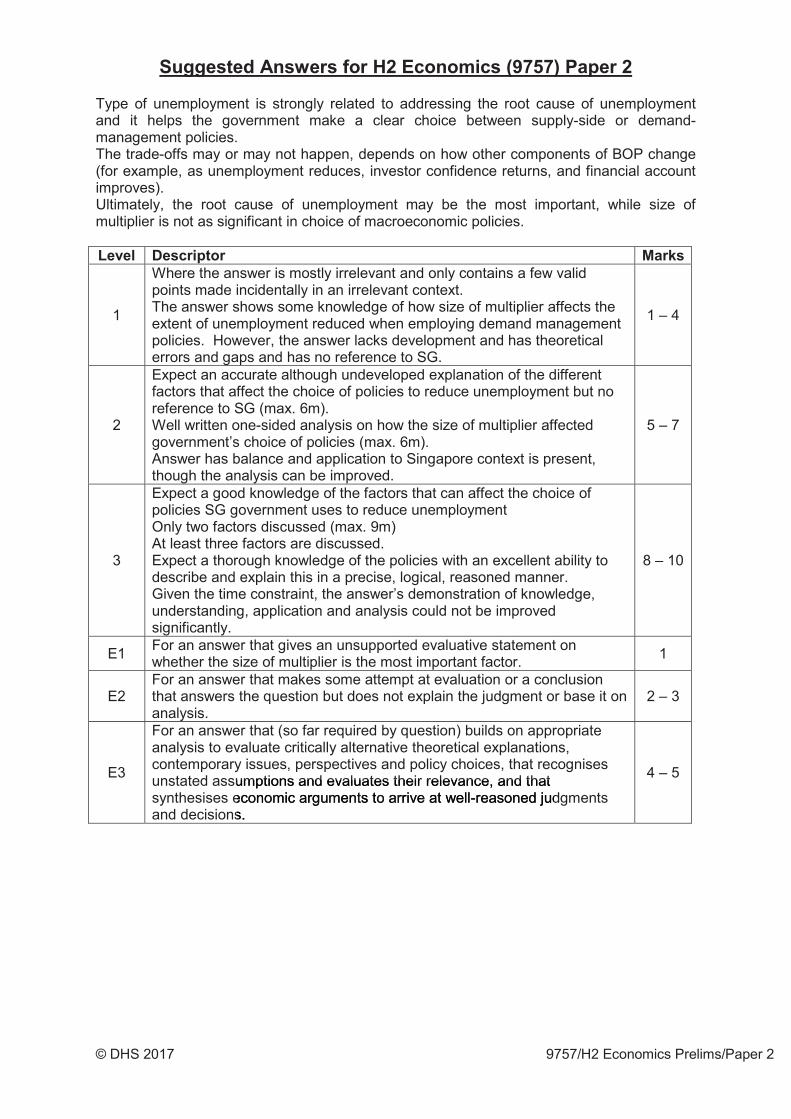
© DHS 2017 9757/H2 Economics Prelims/Paper 2
Type of unemployment is strongly related to addressing the root cause of unemployment and it helps the government make a clear choice between supply-side or demand-management policies. The trade-offs may or may not happen, depends on how other components of BOP change (for example, as unemployment reduces, investor confidence returns, and financial account improves). Ultimately, the root cause of unemployment may be the most important, while size of multiplier is not as significant in choice of macroeconomic policies.
1
Where the answer is mostly irrelevant and only contains a few valid points made incidentally in an irrelevant context. The answer shows some knowledge of how size of multiplier affects the extent of unemployment reduced when employing demand management policies. However, the answer lacks development and has theoretical errors and gaps and has no reference to SG.
1 – 4
2
Expect an accurate although undeveloped explanation of the different factors that affect the choice of policies to reduce unemployment but no reference to SG (max. 6m). Well written one-sided analysis on how the size of multiplier affected government’s choice of policies (max. 6m). Answer has balance and application to Singapore context is present, though the analysis can be improved.
5 – 7
3
Expect a good knowledge of the factors that can affect the choice of policies SG government uses to reduce unemployment Only two factors discussed (max. 9m) At least three factors are discussed. Expect a thorough knowledge of the policies with an excellent ability to describe and explain this in a precise, logical, reasoned manner. Given the time constraint, the answer’s demonstration of knowledge, understanding, application and analysis could not be improved significantly.
8 – 10
E1 For an answer that gives an unsupported evaluative statement on whether the size of multiplier is the most important factor. 1
E2 For an answer that makes some attempt at evaluation or a conclusion that answers the question but does not explain the judgment or base it on analysis.
2 – 3
E3
For an answer that (so far required by question) builds on appropriate analysis to evaluate critically alternative theoretical explanations, contemporary issues, perspectives and policy choices, that recognises unstated assumptions and evaluates their relevance, and that synthesises economic arguments to arrive at well-reasoned judgments and decisions.
4 – 5 umptpppp ions and evaluates their relevance, and that econononnomomommomomiccc aaargggggggumumumumumumumennnnnntsststststs tttttooooooo araarrriveee aatt wewellll-r-reaeasosonenedd juj ds.
© DHS 2017 9757/H2 Economics Prelims/Paper 2
Source: http://money.cnn.com, 15 Dec 2016
Part (a) Introduction Accelerate the pace of interest rate hikes – contractionary MP Intent: contractionary MP is used to manage inflation The US government is likely to be concerned with inflationary pressures arising from
(i) Economy closer to full employment (ii) Strong fiscal stimulus
Body [Explain how inflation arises] The fiscal stimulus will increase AD via G, and cause the US economy to be in disequilibrium. The presence of unplanned disinvestment will signal the firms to increase production, thereby causing increase in DD for FOPs, c.p.. This will subsequently increase the price of factor inputs. Firms will pass on the increase in the cost of production in the form of higher prices to HHs. This will result in increase in GPL across G&S.
The increase in GPL is exacerbated by the fact that US is operating very close/at full employment level, where the economy is operating at the vertical portion of AS.
Show on AD-AS diagram how there will be demand-pull inflation due to increase in G (fiscal stimulus) and the subsequent multiple increases in AD from the multiplier effect (focus is not on k effect, but rather the multiple increases in AD that makes demand-pull inflation)
[Explain how the contractionary MP works] The increase in interest rate will lead to domestic and external effects. Domestic: increase in interest rate will increase the cost of borrowing, reducing the expected rate of return of I to firms (movement along the MEI), leading to decrease in I. This will also raise the cost of financing big ticket items for HHs, hence Cd will decrease. There is increase in opportunity cost of C as HHs will forgo higher interest earnings from S if they choose to spend. This will encourage more S and less C. Overall, I and Cd will fall. The extent of which depends on interest elasticity and other factors such as consumer/investor confidence in the economic performance of US. External: US has free capital flows – increase in interest rates will increase hot money inflows as short term investors deposit money in US for the relative higher interest rate earnings in US short term capital markets (less hot money outflows too). This will mean US dollar appreciates against other currencies. The appreciated USD will result in increase in Px in foreign currencies and decrease in Pm in USD. Qdx will fall as Px increases, the extent of fall depending on the PEDx. The increase in Qdm will mean switch from domestic goods to import substitutes, the extent of rise depending on XED between imports and domestic goods. The result will be decrease in X and Cd.
Show on diagram how the policy works.
cing big ticket items for HHs, hence Cd will decreappppoooro tutututuutuninnnnnnn tyyy cosososososssost t t t t of CCCCCCC aaaaaas s ss s ss HHHHHHHs wiwww ll forgoo hhigigheher r inintet r. ThThThhhhisisisisiss wwwill enenennncococococococourururururururagggggeeee eee momommomomm rerere S aaandnddndndndddd llllesesesesesee ssssssss C.C.CCCfall. TTTheheheheheheh eeextxtxtttteneeeeee t ofofofofofofof wwwwwwwhihihhihihih chchchchchcchch ddddddddepepepepepepe enenenennenenne dssssss ooooooooonnnnn inininininii tetererestst eelalastessstotototorrr rrrr cococococoococ nfnfnnfnfnfnfididididi enenenenenenncecececececc iiiiinnnnnnnn ththththththheeeee ececececece ononononononnomomomomomommo ic ppererfoformrmanance of e caccac pipipipippip tatatatatatataalllllll ffflffff owowowowwows sss ––– ininininnnncrcrcrcrcrccc eaeaeaeaeaeaeaeasesesesesesesee iiinnn intetererestt rratatees will
m investors deposit money in US for the relative
© DHS 2017 9757/H2 Economics Prelims/Paper 2
1 A splatter of points where answer shows some knowledge of factors leading to inflation and use of interest rate to curb inflation. 1 – 4
2
Adequate knowledge of the causes of inflation and the causes are well explained. Explanation of how monetary policy works to reduce inflation in US. Some inaccuracies or no use of diagram. No context OR no reference to preamble (max. 5m) Why there is a need to quell inflation (link)
5 – 7
3 Clear explanation of causes of inflation and how monetary policy works. Detailed explanation of both domestic and external effects with the use of an appropriate diagram. Application to US context.
8 – 10
Part (b) Introduction Present the four macroeconomic objectives: price stability, full employment, sustainable EG and healthy BOP
Body Thesis: Price stability should be prioritised Any government desires for its country to achieve price stability because of the associated benefits.
Price stability preserves the purchasing power of money and therefore encourages savings. (benefit to households)
People are more willing to save part of their current income when price is stable because interest earnings are likely to help retain the purchasing power of savings over time given positive real interest rate. People will be better able to apportion their current income between current consumption (C) and future consumption (S); their real income and standard of living is maintained over time.
For example, in Singapore where the citizens have to save 20% of their monthly income in their CPF account, price stability will ensure that the purchasing power of the savings is preserved which will significantly improve the standard of living all her people.
Price stability promotes Investment and Economic Growth (benefit to firms and economy)
Likewise, firms are able to make better projections of their costs and revenue where prices are stable. This allows them to gauge their returns to investment with more confidence and certainty. This will shift the MEI curve upwards as illustrated in the following diagram. Hence, holding interest rate unchanged at r1, each additional unit of investment between I1 and I2, the returns from investment (as illustrated by point on MEI2) exceed the interest rate r1 and the area abc shows the expected net return for investment between I1 and I2. By the marginalist principle, firms will increase investment up till I2 whereby the rate of return (cI2) is equal to the interest rate r1. Thus, an increase in investor’s confidence will not only lead to increase in domestic investment but also attract Foreign Direct Investment (FDI) in the country.
e returns from investment (as illustrated by ppointhe aaarerererereeaaaaaa abaabbbc shshshshshshsshooowoooo sss ssss ththhthththe e ee e e exeexxpeeecccted net rretetururnn foforr inalistststtttt ppppppririrrirrr ncipppleeeeeee, fififiiiirmrmrmrmrmrmrms wiwiwiwiwiwwiw llllllllll incncncreasaasse e ininiinininnnnvevevevevevveveveeveststststsststsss mememmmm tnt uupp tillo thhhheee innnnnnnteteteteteeterererereestststststst ratttttteeeeeee rrrrrr11111..... ThThThThThThThThusssssss,,,,, anananananannanan incccccrererereasasassasse e inn iinvnvesestoin dododododomemememememeemeststststsststicicicicicc iiiiinvnvnvnvnvnvnvn esesesesee tmtmtmtmmtmtmmenenenenenenent t t t t bubububububbuut ttt tt alalalaaa sosssssss atttraractct FFororeie gn D
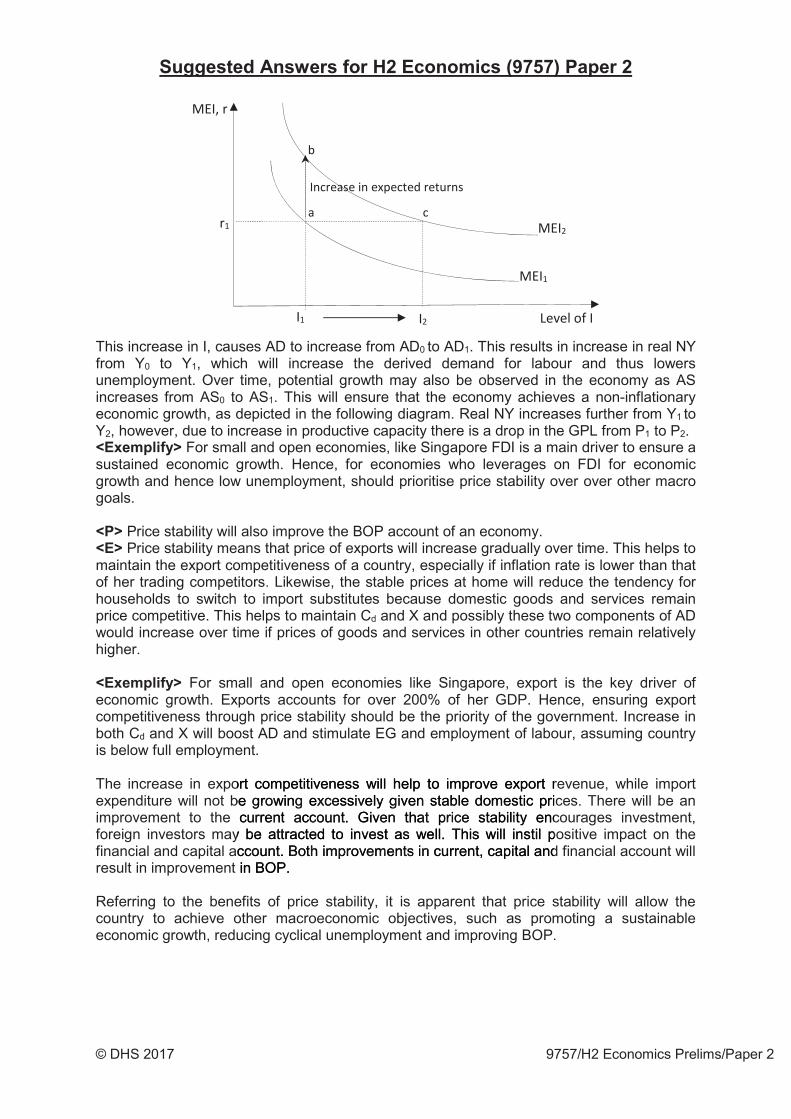
© DHS 2017 9757/H2 Economics Prelims/Paper 2
This increase in I, causes AD to increase from AD0 to AD1. This results in increase in real NY from Y0 to Y1, which will increase the derived demand for labour and thus lowers unemployment. Over time, potential growth may also be observed in the economy as AS increases from AS0 to AS1. This will ensure that the economy achieves a non-inflationary economic growth, as depicted in the following diagram. Real NY increases further from Y1 to Y2, however, due to increase in productive capacity there is a drop in the GPL from P1 to P2.
For small and open economies, like Singapore FDI is a main driver to ensure a sustained economic growth. Hence, for economies who leverages on FDI for economic growth and hence low unemployment, should prioritise price stability over over other macro goals.
Price stability will also improve the BOP account of an economy. Price stability means that price of exports will increase gradually over time. This helps to
maintain the export competitiveness of a country, especially if inflation rate is lower than that of her trading competitors. Likewise, the stable prices at home will reduce the tendency for households to switch to import substitutes because domestic goods and services remain price competitive. This helps to maintain Cd and X and possibly these two components of AD would increase over time if prices of goods and services in other countries remain relatively higher.
For small and open economies like Singapore, export is the key driver of economic growth. Exports accounts for over 200% of her GDP. Hence, ensuring export competitiveness through price stability should be the priority of the government. Increase in both Cd and X will boost AD and stimulate EG and employment of labour, assuming country is below full employment.
The increase in export competitiveness will help to improve export revenue, while import expenditure will not be growing excessively given stable domestic prices. There will be an improvement to the current account. Given that price stability encourages investment, foreign investors may be attracted to invest as well. This will instil positive impact on the financial and capital account. Both improvements in current, capital and financial account will result in improvement in BOP.
Referring to the benefits of price stability, it is apparent that price stability will allow the country to achieve other macroeconomic objectives, such as promoting a sustainable economic growth, reducing cyclical unemployment and improving BOP.
ort cccccommmmmpepeppepepp titttt tiveeeeenennn ss wwwwwwwwiliiii l hehhh lp ttto improve expoport rbe grgrgrgrgrgrowowoowwowingg exxxxxxxcececececececec sssssssivvivvivivelelelele y yyyyy gggigivennn ststtabablele ddomomesestitic ppri
curururrrrrererereerentnnnnnnn aacccccccccouoouououoo ntntntntntntnt. GiGiGiGGiGiGivevevevevevevev nnnnn thatatatatattatttt ppppppppriririririririririicecececececececcee ssssstatattt bbiliityty ency bebebebeb attttttttttt rarrararrractctctcttteeedeee tooooooo inininininnvevevevevevveeststststststs aaaaaaasssssss wwwwewwww ll. ThTThThThiisisis wwililll ininststilil pccocoooounnunununnt.t.t.t.t.t. BBBBBBBBotooootooo hhhhhh imimimimimimi prprprprprrovovovovovovvememememememee enenenenenenntstststststs in n nnnnn currrrenent,t ccapapitital andin BBBBOPOPOPOPOPOPO .
© DHS 2017 9757/H2 Economics Prelims/Paper 2
Although there are many benefits associated with price stability, a government need not prioritise price stability over other macroeconomic goals. This is because other macroeconomic objectives are also desirable to an economy.
High economic growth will reduce cyclical unemployment and rise the standard of living. An increase in national output production will require more factors of production (FOP),
including labour to be employed. Therefore, high economic growth will ensure that sufficient new jobs are created for the labour force, even as the labour force expands over time. Material standard of living refers to the amount of goods and services available for consumption and this is directly related to national output. Sustained economic growth will allow material standard of living of individuals to increase over time, as well as to maintain the material standard of living of each individual as population increases (where rate of increase in national output ≥ population growth).
This is especially relevant in developing economies like China, where the government actively pursues economic growth by maintaining a persistent undervalued currency as discussed in part (a), even at the expense of rising inflation.
Fall in unemployment will lead to increase in national output and hence ensure actual economic growth. It will also improve government’s budget position.
A decrease in unemployment means that more FOPs are employed, hence pushing the economy from a point within PPC to a point on the PPC. This helps to increase the national output and hence contribute to economic growth. The increase in national output will in turn increase the material standard of individuals in the economy. Furthermore, when unemployment is low, a government will spend less on unemployment benefits or other costs incurred due to unemployment (e.g. social costs incurred from higher crime rates or frequent riots committed by the unemployed). The government can better divert these resources to other uses such as to provide public or merit goods, which will improve the standard of living of its people. The government can collect more tax revenue as more people are now employed. This will lead to an improvement in the government budget.
Maintaining a healthy BOP will also ensure economic growth and an improvement in material standard of living.
Aggregate demand rises through increase in exports (in the case of current account surplus) and/or fixed capital formation (in the case of capital account surplus). Through adjusting to unplanned disinvestment and reinforced by the multiplier effect, real national income and employment both increase. A current account surplus increases the availability of goods and services to the country’s residents, allowing for satisfaction of more wants and needs and conferring higher level of utility, thereby raising the current material standard of living. Furthermore, an improvement in capital and financial account will lead to a net inflow of capital from other countries. This country is said to be a ‘net importer of capital’. This will increase the pace of capital accumulation and thus further expand the productive capacity of the country. An increase in the economy’s ability to produce goods and services to satisfy wants and needs will lead to improvement in future SOL.
Maintaining a healthy BOP will also ensure exchange rate stability. A sustained current/capital account surplus implies there is a prolonged net inflow of the
country’s currency. This, results in excess demand of the country’s currency in the foreign exchange market. This exerts an upward pressure on the country’s currency to appreciate. With sufficient reserves the central bank will be able to intervene in the forex market to maintain exchange rate stability. A stable exchange rate will reduce imported inflation and lower the risk of speculative attacks. Further, a stable exchange rate will boost investor’s confidence which will result in inflow of FDI, thus ensuring potential economic growth.
higher level of utility, thereby raising the currenn imimimimi prprprprrprooovovovoo emeemmmenenenenennenttt tttt in ccccccapapapapapapapititititittalall andddd financialal aaccccouountnt wcounununnnnntrtrtrtrtrtrieii s.. TTThhhihhhh s s sssss cococococococounununnnntrtrtrtrtrtrtrt y y y yy y yy isss saiddd d tototooooo bbbbe eeeeee a aaaaaaa ‘n‘netet iimpmpoortcappppiiitalalalala aaaaaaccc umumumumumummulatatatatatatatioioioioioioionnnnnnn ananannanannanddddddd thththththththususususususus furrthththththhtththht ererererer eexpxpanandd ththe aseeee iiiinn n n nnn ththththththt eeee ee e ecececececconononononono omommomommmmmy’yyyyyy ssssss ababababaabbillllllitititititity yyyyyy totottottt prooduducece ggooo dds aeaaaaadddd totototototoo iiiiiimpmpmpmpmpmpmprorrororovevevevevev memmmm ntntntntntntt iiiiiinnnn nn fufufufufufufuf tututututututuurerererererr SOLL..
© DHS 2017 9757/H2 Economics Prelims/Paper 2
Whether a government view price stability as the most important macroeconomic objective or not depends on: (choose any two)
Present Economic Conditions A country may also be suffering from other macroeconomic problems, such as high unemployment or fall in national output.
During the global financial crisis, USA suffered economic consequences such as fall in national output and high unemployment. It was also apparent that USA continued to experience inflation and large trade deficits during this period, simply because Federal Reserve kept lowering the inflation rate to boost economic growth. The US government was more concerned with raising output and to reduce the near ten percent unemployment rate than to deal with inflation. Hence, during an economic recession the fall in national output and increase in unemployment could be very severe, rendering the increase in prices less important a consideration to the government.
Economic Characteristics Small and open economies may have to prioritise price stability over other macroeconomic objectives because price stability is important for such economies to maintain their price competitiveness of exports over time and to sustain their export-driven economic growth.
This is seen in the case of Singapore, where her government views price stability as the intermediate goal to attain other macroeconomic goals in the long run. This is because price stability will create conducive environment for continuing investment in Singapore and investment will eventually contribute to sustained economic growth.
On the other hand, price stability for large and less open economies may not be as pressing an objective compared to the small and open economies. This is because a large economy does not need to target inflation as an intermediate goal to achieve economic growth and low unemployment.
Stage of Economic Development The government of a developed country will be more concerned with maintaining price stability, given the high level of accumulated savings and assets households generally possess from previously produced national output. When inflation is high, households will lose the purchasing power of their savings and assets, causing a rapid fall in material standard of living. In the event that inflation and economic growth are conflicting, it is more acceptable for the government to preserve the purchasing power of household savings and assets as economic growth is likely to be a small percentage from the already high absolute level of national output. The average inflation rate for Euro Area stands at 2.46% (end 2011).
In the case of Singapore, households tend to have a significant amount of savings locked in their CPF accounts with limited options to invest for higher returns. High inflation will erode the real value of savings in the CPF accounts of Singaporeans, and this would affect their ability to pay for their housing and retirement.
The government of a developing country on the other hand may prefer to prioritise economic growth over inflation, since she requires the rapid economic growth of output to improve the material standard of living of households, and to create employment for her largely unutilized labour force. Although increase in prices may result in fall in purchasing power, households in developing countries tend to have little savings and assets; hence the impact of price increases is not as significant on developing countries. The average inflation rate for the BRIC countries stands at 4.8% (Mar 2012).
t. The average inflation rate for Euro Area stands
caseeeeee oooooof SiSSiiS ngggggggapapapapapapapoooroooo e,eee hhhhhhhouoouoooouseses hoooldddss ss s s tetetetettettttetet nddndndnddndnd ttttto o hahaveve air CCCPCPF F FF F F F acacacaa cococococoouuunuuuu tsssssss wwwwwwwititititittthhhhh lilililiimimimimimimmim tetetetetttedddddddd optititititiiiiiononoooonoononsssss toto iinvnvesest t fo
e rreaeaeeallllll vavavavavaavav luluulululuue e eeee ofofoofofofofo sssssssavavvavavvvvvinininininingsgsgsggsgsg iiiinnnnn ththththththheee CPCCCC F acaccocoununtsts off Sty tttto oo papapapapapapay yyyyyyy fofofofofofofor rrrr thtthhttheieieiee rrr rr hooooooousususususuususinnnnnnnnggggggg ananananananana ddd retiireremementnt..
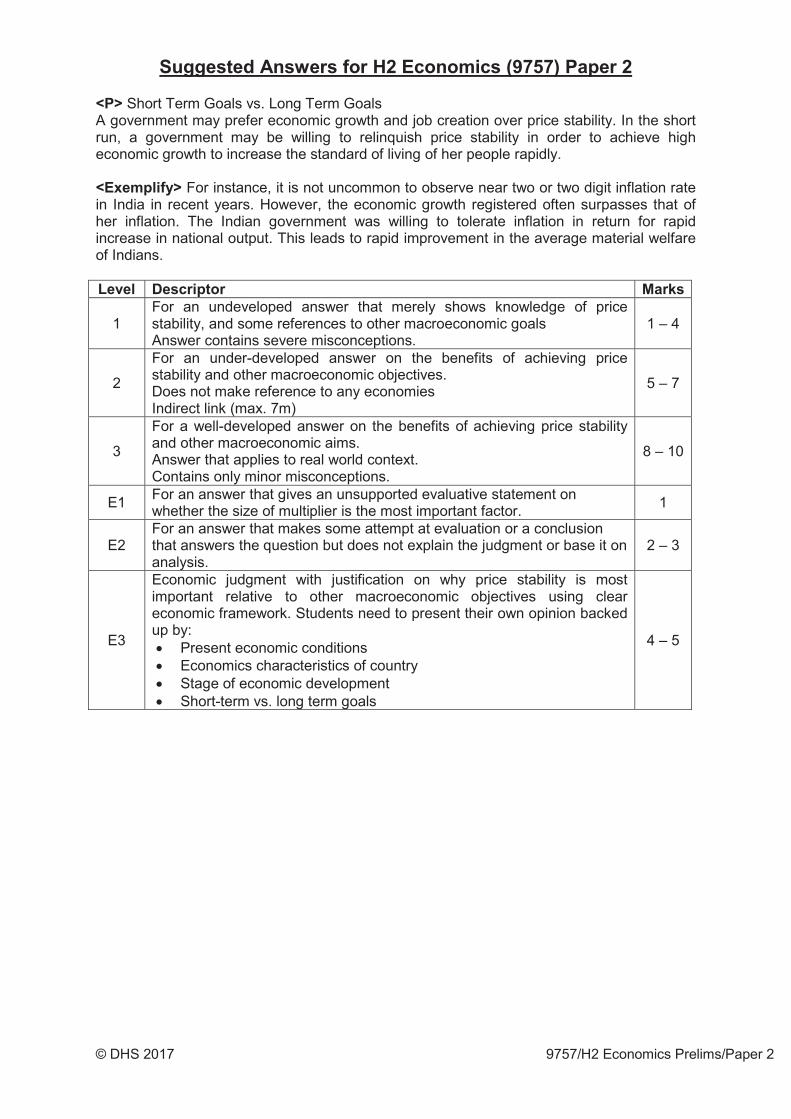
© DHS 2017 9757/H2 Economics Prelims/Paper 2
Short Term Goals vs. Long Term Goals A government may prefer economic growth and job creation over price stability. In the short run, a government may be willing to relinquish price stability in order to achieve high economic growth to increase the standard of living of her people rapidly.
For instance, it is not uncommon to observe near two or two digit inflation rate in India in recent years. However, the economic growth registered often surpasses that of her inflation. The Indian government was willing to tolerate inflation in return for rapid increase in national output. This leads to rapid improvement in the average material welfare of Indians.
1 For an undeveloped answer that merely shows knowledge of price stability, and some references to other macroeconomic goals Answer contains severe misconceptions.
1 – 4
2
For an under-developed answer on the benefits of achieving price stability and other macroeconomic objectives. Does not make reference to any economies Indirect link (max. 7m)
5 – 7
3
For a well-developed answer on the benefits of achieving price stability and other macroeconomic aims. Answer that applies to real world context. Contains only minor misconceptions.
8 – 10
E1 For an answer that gives an unsupported evaluative statement on whether the size of multiplier is the most important factor. 1
E2 For an answer that makes some attempt at evaluation or a conclusion that answers the question but does not explain the judgment or base it on analysis.
2 – 3
E3
Economic judgment with justification on why price stability is most important relative to other macroeconomic objectives using clear economic framework. Students need to present their own opinion backed up by:
Present economic conditions Economics characteristics of country Stage of economic development Short-term vs. long term goals
4 – 5
© DHS 2017 9757/H2 Economics Prelims/Paper 2
Explain how a country can have a CA over another country in the production of a good if it incurs a lower opportunity cost than that country in producing the good.
Explain that changes in CA can be due to changes in the quantity and quality of its factor endowment or rate of change in technological advancement.
Using the same or another illustration, explain how depletion of unskilled labour ->increase in their wages -> increase in unit COP of producing labour intensive manufactured goods -> i.e. need to incur a higher opportunity cost in terms of another good forgone. The opportunity cost may then become higher compared to its competitors, ceteris paribus -> lost its CA. Highlight how exhaustion of quantity of resources (labour, land and natural resources) -> erosion of CA for the country
Using the same or another illustration, explain how new CA can be developedthrough R&D -> higher rate of technological advancement than its competitors -> gain CA in higher-valued added goods. For example, explain how emergence of new competitors (from emerging countries) with advanced technology -> greater efficiency in producing a good -> fall in unit cost -> will be able to produce more of a good with the same resource cost. Assuming ceteris paribus -> fall in opportunity cost of producing the good in terms of alternatives forgone. If opportunity cost becomes lower than its competitors -> country gained CA in the production of the good
L1 (1-4)
Answers are descriptive and largely irrelevant Concepts are descriptive or explained with many errors Poor use of examples Weak or inappropriate applications of the concepts.
Merely state the theory of CA but did not explain why it might change. No economic framework
L2 (5-7)
Attempt to explain the theory of CA and why it might change overtime but insufficient in scope and depth.
Attempt at exemplification
L3 (8-10)
Clear economic explanation of what is meant by CA and why it might change overtime due to changes in quantity or quality of factor endowments and rate of advancement in technology
Sufficient scope and depth Excellent exemplification that draw out the impact of changing factor
endowments / rate of advancement in technology on opportunity cost -> change in CA.
onooooomimimimimimic exxplanananananananataatatatatationnnnnnnn ofofofofofoff wwwwhhhat isss mmmmmmeaeaeaeaeae ntntntntntnt bby y CACA aanddueuueee ttttto oo o oo chchananannnnngegeggeggg ss ss ss inininininini qqqqqqquaaaaaaaantntntntntntntitttttty yy yyyy orororororrorrrroror quauauauauaaaaaalililililitytyttytytyy oof f faactctoror en
meneeneennnt ttt in technologogogogogy y yy yyyyy sccccoppoppppe eee ee e anananananananddddddd deddedddeptptptp h hhh
exemplification thattttt draw out the impact
© DHS 2017 9757/H2 Economics Prelims/Paper 2
Identify that infant industry and declining industry arguments for protectionism are based on the concept of changing comparative advantage, i.e. dynamic CA.
Development: Explain the arguments for and against protectionism based on
Explain how protectionism based on infant industry and declining industry arising from changing CA can help the economy achieve its macroeconomic goals (Eg. promote economic growth, increase employment, improve C/A) or how without protectionism will have implications on macro goals (c/a deficit, EG, retrenchment -> structural unemployment)
An infant or newly established industry needs help in its initial stages because heavy initial costs are likely to be incurred and these costs cannot be completely covered by the initial small output. Time is needed to develop skilled management, reputation and exploit efficient technologies.
Because such industries have potential comparative advantage, a guaranteed home market will enable them to gain EOS and gain experience in production. Once they have achieved comparative advantage, the protection will be removed. They will be able to compete in the world markets as their prices are now comparable to similar exports from other countries.
Thus despite the inefficiency that restricting imports cause, government will justify the use of these protectionist methods if the long term benefits of growing the infant industries outweigh the short term deadweight losses to society.
Structural change occurs due to the loss of comparative advantage due to, say, the emergence of a low cost country. Given occupational or geographical immobility of labour, the structural change will lead to structural unemployment. Hence protectionism is sometimes adopted as a way to avoid the unemployment.
Workers in developed countries have claimed that their standard of living was undermined by the import of cheaper goods. Without protection, the local industries will be edged out and have to close down, resulting in the fall in employment and standard of living. To protect their jobs, they hence press for higher tariffs and other means to keep out the goods. This argument has been used in the US to protect the automobile, steel and textile industries.
Explain how such reasons should not be used be used given the welfare loss due to higher domestic prices and lower output -> Protecting domestic industries at the expense of consumers [graph to show welfare loss from tariff]. Breed inefficiency given the fall in competition. Beggar thy neighbour -> retaliation -> Protecting domestic industries at the expense of export industries
The infant industry argument should not be used as a justification because it did not consider the consequences -
per goods. Without protection, the local industriesesultinininnnngg gg gg g innn theeeeeeee fffffffalaaaaaa l inininnnin eeeeeempmmmpmpmmm lololoymmmeeent and ststanandadardrd oof essss ffffffororororoor higiiggi heeeeeeer rrrrrr taaaataaariffffffffffssss sss anananaana ddd ottthherr r r r rr mememememememmmem ananananaanaa ss toto kkeeep sedd in ththththththee e USUSUSUSUSUSUS tooooo prprprprpprprotototototototecececececcectt tt tt thththththtthheeeeeee auauauauauauuuautomomommmmmomomom bibibibibilllelell , ststeeeell anand
sons should not be used be used given the welfa
© DHS 2017 9757/H2 Economics Prelims/Paper 2
It may lead to wastage of resources and welfare loss if the potential CA is not realized - It is difficult to identify with certainty industries that are presently unprofitable but which may acquire comparative advantage in the long run. The government may incorrectly choose those industries without any potential comparative advantage. This leads to wastage of resources as government incur opportunity costs from subsidies given to these industries, and domestic consumers do not get to maximize their welfare due to higher domestic price compared to imports. If investments were made in other areas, the rate of economic growth and employment creation could be faster.
It may breed inefficiency due to the lack of competition. It is difficult to decide when the industry is fully and sufficiently established and hence able to do without protection. Some may remain as ‘perpetual infants’, requiring continual protection for survival and may continue to be inefficient and backward for a long time. This is because they are not subjected to the ‘discipline of the free market’ and hence suffer from X-inefficiency to lower unit cost of production sufficiently to become internationally competitive on their own.
It is difficult to remove protection once it is given due to vested interest and political pressures, especially if the government receives political funding from firms in such industries. Many governments may not give an “expiry date” on the protection given to infant industries.
The declining industry argument should not be used as a justification because it did not consider the consequences Such protection may unnecessarily slow down the restructuring process, depriving the
other thriving industries of valuable resources The problem is often a lack of willingness to restructure when a country loses its
comparative advantage over time. Tariff protection against low-cost producing countries will safeguard workers in the
protected high wage industries but at the expense of firms, which use these products as factor inputs. Consumers will also be denied the opportunity to buy from the cheaper source of supply. Therefore, benefits from trade will be lost.
Need time to develop new industries that it is gaining CA in and shut down declining industries which it is losing CA in. At most a short term solution. Need to establish a fixed time period and need to complement with SS-side policies such as retraining of workers
But changing CA affects all countries and imperfect factor mobility is a reality– if used as a justification -> all countries can adopt protectionism -> fall in world trade and rise in self-sufficiency -> fall in world output and increase in global prices
Instead, decision to adopt protectionistic measures can be due to other more valid reasons - unfair trade but hard to find evidence.
L1 (1-4)
Answers are descriptive and largely irrelevant. Students merely regurgitate the pros and cons of protectionism without applying to context of changing CA.
Concepts are descriptive or explained with many errors Poor use of examples Weak or inappropriate applications of the concepts Explain other reasons for protectionism instead when the question is on
‘changing CA’. Did not address the proble L2
are descriptive and largely irrelevant Students m
n world output and increase in global prices to adadadadddopopopoopoo t prototototototootececececeece tiononononononno isissisisstitititititt c cccc measaa ures ccanan bbe e dudue deee bbbbbbbutututututu haraarra d totototototoo fffffffininnnnnnd evevevevevevevididididididi enenence.
© DHS 2017 9757/H2 Economics Prelims/Paper 2
(5-7) Imbalanced approach of whether protectionism is justified or is not justified when CA changes. Ie. only explained why changing CA should or should not be used as justification for protection. If a balanced argument is given, it is probably limited in depth
Lacks scope and depth Attempt at exemplification
L3 (8-10)
Balanced approach on the extent that changing CA is a valid justification for country to adopt protectionism by examining all the benefits and costs of protectionism given the context of changing CA.
Excellent use of examples to exemplify the above
E1 (1) Random evaluation or generic limitations on protectionism without context E2
(2-3) Able to make a judgement on the extent that changing CA is a valid reason for
protectionism although the reasoning may not be clear. E3
(4-5) Able to make a judgement on the extent that changing CA is a valid reason for
protectionism by setting the conditions for it to be valid

Related Documents