DS-100 Midterm Exam Fall 2017 Name: Email: @berkeley.edu Student ID: Instructions: • This exam must be completed in the 1.5 hour time period ending at 8:30PM. • Note that some questions have bubbles to select a choice. This means that you should only select one choice. Other questions have boxes. This means you should select all that apply. • When selecting your choices, you must shade in the box/circle. Checkmarks will likely be mis-graded. • You may use a single page (two-sided) study guide. • Work quickly through each question. There are a total of 116 points on this exam. Honor Code: As a member of the UC Berkeley community, I act with honesty, integrity, and respect for others. I am the person whose name is on the exam and I completed this exam in accordance with the honor code. Signature: 1

Welcome message from author
This document is posted to help you gain knowledge. Please leave a comment to let me know what you think about it! Share it to your friends and learn new things together.
Transcript

DS-100 Midterm Exam
Fall 2017
Name:
Email: @berkeley.edu
Student ID:
Instructions:• This exam must be completed in the 1.5 hour time period ending at 8:30PM.
• Note that some questions have bubbles to select a choice. This means that you shouldonly select one choice. Other questions have boxes. This means you should selectall that apply.
• When selecting your choices, you must shade in the box/circle. Checkmarks willlikely be mis-graded.
• You may use a single page (two-sided) study guide.
• Work quickly through each question. There are a total of 116 points on this exam.
Honor Code:As a member of the UC Berkeley community, I act with honesty, integrity, and respect forothers. I am the person whose name is on the exam and I completed this exam in accordancewith the honor code.
Signature:
1

DS100 Midterm, Page 2 of 25 October 12, 2017
Syntax Reference
Regular Expressions
"ˆ" matches the position at the beginning ofstring (unless used for negation "[ˆ]")
"$" matches the position at the end of stringcharacter.
"?" match preceding literal or sub-expression0 or 1 times. When following "+" or "*"results in non-greedy matching.
"+" match preceding literal or sub-expressionone or more times.
"*" match preceding literal or sub-expressionzero or more times
"." match any character except new line.
"[ ]" match any one of the characters inside,accepts a range, e.g., "[a-c]".
"( )" used to create a sub-expression
"\d" match any digit character. "\D" is thecomplement.
"\w" match any word character (letters, digits,underscore). "\W" is the complement.
"\s" match any whitespace character includ-ing tabs and newlines. \S is the comple-ment.
"\b" match boundary between words
Some useful re package functions.
re.split(pattern, string) split thestring at substrings that match thepattern. Returns a list.
re.sub(pattern, replace, string)apply the pattern to string replac-ing matching substrings with replace.Returns a string.
Useful Pandas Syntax
df.loc[row_selection, col_list] # row selection can be booleandf.iloc[row_selection, col_list] # row selection can be booleandf.groupby(group_columns)[[’colA’, ’colB’]].sum()pd.merge(df1, df2, on=’hi’) # Merge df1 and df2 on the ’hi’ column
pd.pivot_table(df, # The input dataframeindex=out_rows, # values to use as rowscolumns=out_cols, # values to use as colsvalues=out_values, # values to use in tableaggfunc="mean", # aggregation functionfill_value=0.0) # value used for missing comb.

DS100 Midterm, Page 3 of 25 October 12, 2017
Data Generation and Probability Samples
For each of the following questions select the single best answer.
1. [2 Pts] A political scientist is interested in answering a question about a country composed ofthree states with exactly 10000, 20000, and 30000 voting adults. To answer this question, apolitical survey is administered by randomly sampling 25, 50, and 75 voting adults from eachtown, respectively. Which sampling plan was used in the survey?
© cluster sampling√
stratified sampling© quota sampling
© snowball sampling
2. [2 Pts] A deck with 26 cards labeled A through Z is thoroughly shuffled, and the value of thethird card in the deck is recorded. What is the probability that we observe the letter C on thethird card?
√ 126
© 326
© 2526· 2426· 126
© 126· 126· 2426
© None of the above.
3. [3 Pts] Suppose Sam visits your store to buy some items. He buys toothpaste for $2.00 withprobability 0.5. He buys a toothbrush for $1.00 with probability 0.1. Let the random variableX be the total amount Sam spends. What is E[X]? Show your work in the space provided.
√$1.10
© $1.5
© $3.00
© The toothpaste purchase may not be independent of the toothbrush purchase so wecan’t compute this expectation.
You may show your work in the following box for partial credit:
Solution: Let Xtoothpaste be the amount Sam spends on toothpaste, and Xtoothbrush be theamount Sam spends on a toothbrush.
From the linearity of expectation, we have:
E[X] = E[Xtoothpaste +Xtoothbrush] = E[Xtoothpaste] + E[Xtoothbrush]
We know that E[Xtoothpaste] = (0.5)(0) + (0.5)(2) = 1, and E[Xtoothbrush] = (0.9)(0) +(0.1)(1) = 0.1. Thus, E[X] = 1.1.

DS100 Midterm, Page 4 of 25 October 12, 2017
4. [3 Pts] Suppose we have a coin that lands heads 80% of the time. Let the random variable Xbe the proportion of times the coin lands tails out of 100 flips. What is Var[X]? You must showyour work in the space provided.
© 0.8 © 0.16 © 0.04√
0.0016 © 0.008
Solution: Let Xi be the outcome of the ith spin. If the ith spin lands heads than we sayXi = 1 and otherwise Xi = 0. Then the proportion of times Xi lands heads is given by:
Y =1
100
n∑i=1
Xi
We can compute the variance of Y using the following identities:
Var [Y ] = Var
[1
100
n∑i=1
Xi
](1)
=1
1002Var
[n∑i=1
Xi
](Squared variance of constant multiple.)
=1
1002
n∑i=1
Var [Xi] (Ind. Variables implies linearity of var.)
=1
1002
n∑i=1
p(1− p) = p(1− p)100
=.8(1− .8)
100=.16
100= .0016

DS100 Midterm, Page 5 of 25 October 12, 2017
5. A small town has 5 houses with the following people living in each house:
Abe,Ben Cat,Dan,Emma Frank,George Hank,Ira,Jen Kim,Lars
Suppose we take a cluster sample of 2 houses (without replacement), what is the chance that:
(1) [2 Pts] Kim and Lars are in the sample
© 0 © 1/20 © 1/10 © 1/6 © 1/5√
2/5 © 1
You may show your work in the following box for partial credit:
Solution: The chance that Kim and Lars are in the same sample is given by the chanceof choosing their house. The chance of choosing the their house on the first draw is 1
5.
Because we are drawing without replacement. The chance of choosing their house onthe second draw is given by the chance of not choosing their house on the first draw(45) times the chance of choosing their house on the second draw (1
4). Thus the total
chance of choosing them in the first two draws is:
1
5+
4
5× 1
4=
2
5
(2) [2 Pts] Kim, Abe, and Ben are in the sample
© 0 © 1/20√
1/10 © 1/6 © 1/5 © 2/5 © 1
You may show your work in the following box for partial credit:
Solution: To draw Kim, Abe, and Ben we would need to draw both of their houses.This can be done two ways (draw Abe and Ben’s house first and then Kim’s or viceversa). Each way has probability:
1
5× 1
4
Thus the total probability is:
2× 1
5× 1
4=
2
20=
1
10
(3) [1 Pt] Kim and Dan are in the sample - Select all that apply� The same as the chance Kim and Lars are in the sample

DS100 Midterm, Page 6 of 25 October 12, 2017
√The same as the chance Kim, Abe, and Ben are in the sample
� Neither of the above

DS100 Midterm, Page 7 of 25 October 12, 2017
Data Cleaning and EDA
6. True or False. For each of the following statements select true or false.
(1) [1 Pt] Exploratory data analysis is the process of testing key hypotheses.
© True√
False
Solution: False. Exploratory data analysis is the process of gaining understandingabout data to inform future analysis.
(2) [1 Pt] The structure of the data describes how it is formatted and organized.
√True © False
Solution: True. The structure of data includes its formatting (e.g., JSON, CSV, XML,raw text) as well as the fields and organization of records.
(3) [1 Pt] Throughout the process of exploratory data analysis it is often necessary to trans-form and clean data.
√True © False
Solution: True. A key step in exploratory data analysis is identify and in some casescorrecting anomalies and issues with data.
(4) [1 Pt] During the data cleaning process it is generally a good idea to drop records thatcontain missing values.
© True√
False
Solution: False. Nooooo. It is very important that the cleaning process is done withcare to avoid introducing transformations that might bias subsequent analysis. Drop-ping records with missing values, for example, missing addresses, could substantiallybias the data (e.g., removing homeless people).
7. In homework 3, we analyzed ride sharing data comparing the weekday and weekend patternsfor both casual and registered riders.

DS100 Midterm, Page 8 of 25 October 12, 2017
(1) [1 Pt] On weekdays, the number of casual riders was most frequently the numberof registered riders.
© higher than√
lower than © similar to
(2) [1 Pt] Which group of riders demonstrated a pronounced bi-modal daily usage pattern:
© Casual Riders√
Registered Riders © Both casual and registered riders.

DS100 Midterm, Page 9 of 25 October 12, 2017
8. Using the following snippet of data to answer each of the questions below.
Business.data
"business_id","name","address","phone"10,"TIRAMISU KITCHEN","033 BELDEN PL","+14154217044"19,"LIFESTYLE CAFE","1200 VAN NESS AVE","+14157763262"24,"OMNI S.F. HOTEL"," ","9999999999999999"42,"The "Best", Food!","500 CALIFORNIA ST","+14156211114"43,"The "Best", Food!","3716 Cesar Chavez","+14156211114"
(1) [1 Pt] Which of the following best describes the format of this file.© Raw Text© Tab Separated Values√
Comma Separated Values© JSON
(2) [1 Pt] Which of the following best describes the granularity of each record?© Restaurant Chains√
Individual Restaurant Locations© Strings© Daily
(3) [4 Pts] Select all the true statements.√
From the available data the business id appears to be a primary key.� There appear to be no missing values√
While the data appears to be quoted there may be issues with the quotecharacter.
� There are nested records.� None of the above statements is true.
DS100 Midterm, Page 10 of 25 October 12, 2017
Transformations and Smoothing
9. [3 Pts] Which of the following are reasonable motivations for applying a power transformation?Select all that apply:
√To help visualize highly skewed distributions
� Bring data distribution closer to random sampling√
To help straighten relationships between pairs of variables.� Reduce the dimension of data
� Remove missing values
� None of the above
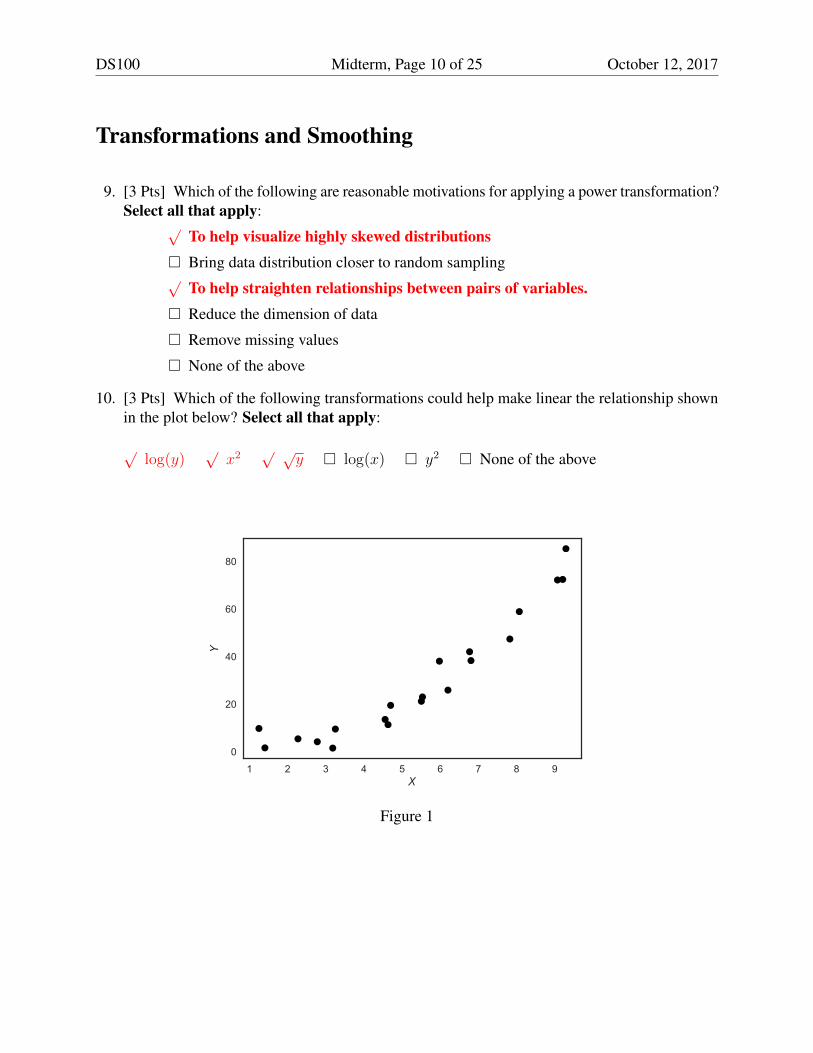
10. [3 Pts] Which of the following transformations could help make linear the relationship shownin the plot below? Select all that apply:
√log(y)
√x2
√ √y � log(x) � y2 � None of the above
1 2 3 4 5 6 7 8 9X
0
20
40
60
80
Y
Figure 1

DS100 Midterm, Page 11 of 25 October 12, 2017
3 2 1 0 1 2
0.0
0.1
0.2
0.3
0.4
0.5
0.6
0.7
Figure 2
11. [2 Pts] The above plot contains a histogram, rug plot, and Gaussian kernel density estimator.The Gaussian kernel is defined by:
Kα(x, z) =1√2πα2
exp
(−(x− z)2
2α2
)Judging from the shape of separate standing peaks, which of the following is the most likelyvalue for the kernel parameter α.
© α = 0√
α = 0.1 © α = 10 © α = 100
DS100 Midterm, Page 12 of 25 October 12, 2017
Regular Expressions
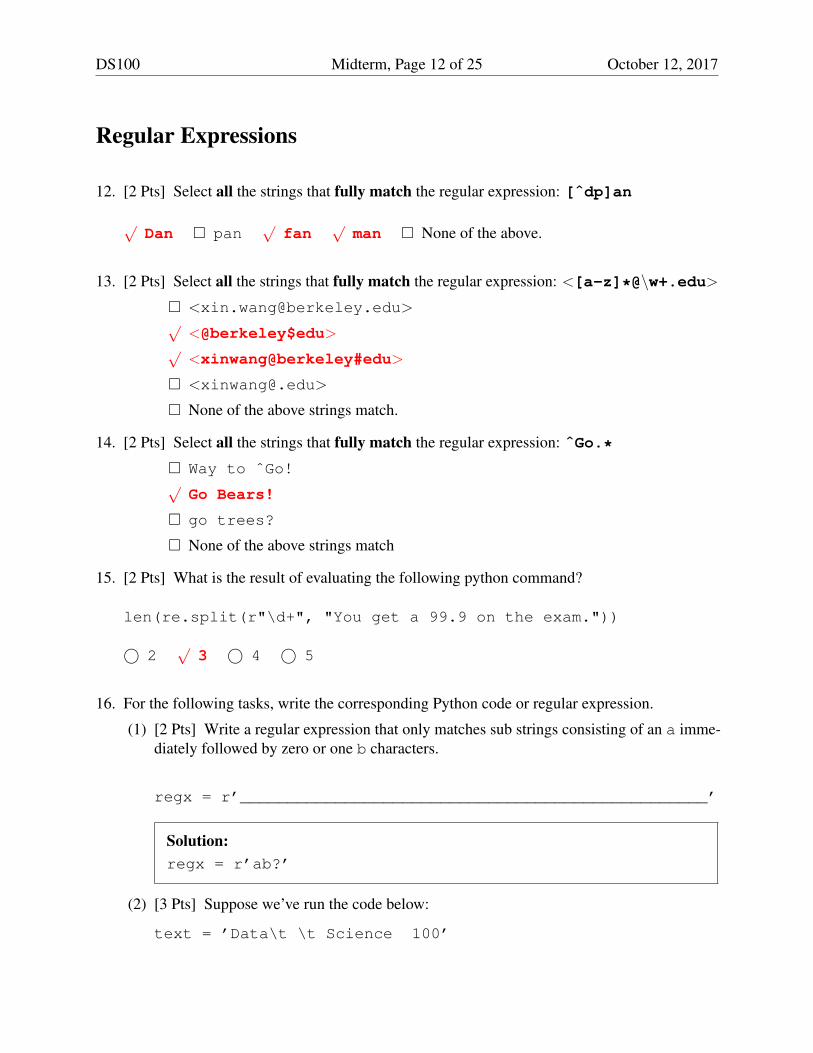
12. [2 Pts] Select all the strings that fully match the regular expression: [ˆdp]an
√Dan � pan
√fan
√man � None of the above.
13. [2 Pts] Select all the strings that fully match the regular expression: <[a-z]*@\w+.edu>� <[email protected]>√
<@berkeley$edu>√
<xinwang@berkeley#edu>
� None of the above strings match.
14. [2 Pts] Select all the strings that fully match the regular expression: ˆGo.*� Way to ˆGo!√
Go Bears!
� go trees?
� None of the above strings match
15. [2 Pts] What is the result of evaluating the following python command?
len(re.split(r"\d+", "You get a 99.9 on the exam."))
© 2√
3 © 4 © 5
16. For the following tasks, write the corresponding Python code or regular expression.
(1) [2 Pts] Write a regular expression that only matches sub strings consisting of an a imme-diately followed by zero or one b characters.
regx = r’_________________________________________________’
Solution:regx = r’ab?’
(2) [3 Pts] Suppose we’ve run the code below:
text = ’Data\t \t Science 100’

DS100 Midterm, Page 13 of 25 October 12, 2017
Use a method in the re module to replace all the continuous segments of spaces with asingle comma. The resulting string should look like "Data,Science,100".
re._______________________________________________________
Solution:re.sub(r’\s+’, ’,’, text)

DS100 Midterm, Page 14 of 25 October 12, 2017
DataFrames, Joins, and Aggregation
17. The ti and fare DataFrames contain data of the people aboard the Titanic when it crashed:
>>> ti.head() | >>> fare.head()survived class sex id | fare alone id
0 0 Third male 1410 | 0 73.5000 True 14571 1 First female 1522 | 1 9.2250 True 16452 1 Third female 1864 | 2 8.6625 True 17163 1 First female 1687 | 3 59.4000 False 13674 0 Third male 1173 | 4 18.0000 False 1639
Both tables contain one row for each passenger, uniquely identified by the id column. Here’s adescription of the columns in each DataFrame:
DataFrame ti DataFrame faresurvived: 1 if the person survived, else 0 fare: Price of ticket in USDclass: ticket class (First, Second, or Third) alone: True if the person was alone at purchase.sex: Sex of person (male or female)
Fill in the blanks to compute the following statements. You may assume that the pandas moduleis imported as pd. You may not use more lines than the ones provided.(1) [2 Pts] The total number of survivors.
Solution:ti[’survived’].sum()
(2) [4 Pts] The proportion of females who survived (a float).
ti.loc[_______________________________,___________].mean()
Solution:ti.loc[ti[’sex’] == ’female’, ’survived’].mean()

DS100 Midterm, Page 15 of 25 October 12, 2017
(3) [4 Pts] A DataFrame containing the proportion ofsurvivors for each sex. It should look like:
Solution:ti[[’survived’, ’sex’]].groupby(’sex’).mean()
(4) [5 Pts] A DataFrame containing the proportion ofsurvivors for each sex and class. It shouldlook like:
Solution:pd.pivot_table(ti, values=’survived’,
index=’sex’, columns=’class’)
(5) [8 Pts] A DataFrame containing the proportion of survivors for each sex after filtering outthose that bought their ticket alone. The table should have the same structure as (3) butwith different numbers.
merged = ___________________________________________________
(merged_____________________________________________________
___________________________________________________________
__________________________________________________________)

DS100 Midterm, Page 16 of 25 October 12, 2017
Solution:merged = pd.merge(ti, fare, on=’id’)(merged[merged[’alone’]].loc[:, [’survived’, ’sex’]].groupby(’sex’).mean())
18. [3 Pts] From the following list select all statements that are true for Pandas Data Frames.√
All data frames must have an index.� All columns must be the same type.√
You can always index a record by its row number.� Missing values in string columns are always encoded as NaN.
� None of the above

DS100 Midterm, Page 17 of 25 October 12, 2017
Visualizations
19. The figure below is a scatter plot of the heights of mothers (in) and fathers (in) of a sample of1000 UC Berkeley students.
(1) [2 Pts] What is the main problem with this plot?© Choice of scale© Jiggling the baseline© Aspect ratio√
Overplotting© Lack of context© Perception (length, angle, area)
(2) [2 Pts] What is the remedy for this problem?© Overlay plots√
Jitter values© Use color to condition on student’s gender© Transform one variable or the other or both© Improve labels and legends

DS100 Midterm, Page 18 of 25 October 12, 2017
20. [2 Pts] The following figure is a line plot of CO2 emissions over time. What is the mainproblem with this plot?
1960 1970 1980 1990 2000 2010
0200
400
date
co2
√Empty data region © Jiggling the baseline © Overplotting
© Lack of context © Perception (length, angle, area)
21. Consider the following visualization of the number of casual riders per hour by day of the week,which has been constructed from the bike sharing data used in Homework 3.
Sat Sun Mon Tue Wed Thu Friweekday
0
50
100
150
200
250
300
350
casu
al
(1) [2 Pts] Which days of the week frequently (at least 75% of the time) had fewer than 50casual riders? Select all that apply.
� Saturday � Sunday√
Monday√
Tuesday � None of the above.
(2) [3 Pts] Which of the following describe conclusions that we can draw about the distribu-tion of rider counts on Tuesdays using the above plot? Select all that apply.
� Skewed left � Symmetric√
Skewed right � Unimodal√
Has outliers� None of the above

DS100 Midterm, Page 19 of 25 October 12, 2017
Estimation and Loss Minimization
22. Consider the following loss function.
L(θ, x) =
{4(θ − x) θ ≥ x
x− θ θ < x
(1) [2 Pts] Select all statements that are true.� The loss function is concave.√
The loss function is convex.� The loss function is smooth.� None of the above statements are true.
(2) [4 Pts] Given a sample x1, . . . xn, which value of θ minimizes the average loss? Showyour work in the space provided.
√20th percentile © 25th percentile © 75th percentile © 80th percentile
Solution:
(3) [2 Pts] The optimal value θ∗ is a percentile for the√
sample© population

DS100 Midterm, Page 20 of 25 October 12, 2017
23. We propose the following simple model for a dataset consisting of four pointsD = {0, 2, 4, 10}:
y = θ∗
Use the following plots of loss functions for this model to answer the following questions.
0 2 4 10Choice for
10
20
30
40
50
60
70
80A
vera
ge L
oss
0 2 4 10Choice for
3
4
5
6
7
8
Figure 3
(1) [2 Pts] Which choice(s) for θ minimize the average squared loss? Select all that apply.
� 2 � 3√
4 � 10 � None of the above
(2) [2 Pts] Which choice(s) for θ minimize the average absolute loss? Select all that apply.
√2√
3√
4 � 10 � None of the above
(3) [2 Pts] Suppose we add an observation at y5 = 100. Which choice(s) for θ minimize theaverage absolute loss? Select all that apply.
� A value smaller than 3 � 3√
4 � 5 � A value larger than 5
(4) [2 Pts] Which loss function is most sensitive to outliers?
© absolute loss√
squared loss © Huber loss

DS100 Midterm, Page 21 of 25 October 12, 2017
24. [4 Pts] Which θ minimizes the following loss function for a dataset D comprised of (xi, yi)pairs? Show your work in the space provided.
L(θ,D) =n∑i=1
(yi − θxi)2
© θ =1
n
n∑i=1
yixi
√θ =
∑ni=1 xiyi∑ni=1 x
2i
© θ =
∑ni=1 yi∑ni=1 xi
© θ =
∑ni=1 y
2i∑n
i=1 x2i
Solution:

DS100 Midterm, Page 22 of 25 October 12, 2017
Sampling Distribution, Bootstrapping, and Confidence Intervals
25. True or False. For each of the following statements select true or false.
(1) [1 Pt] Suppose we have 100 samples drawn independently from a population. If weconstruct a 95% confidence interval for each sample, we expect 95 of them to include thesample mean.
© True√
False
Solution: False. All of them should include the sample mean.
(2) [1 Pt] The law of large numbers tells us that as the sample size grows, the average of arandom sample with replacement from a population gets closer to the population average.
√True © False
Solution: True. The sample looks more and more like the population as the samplesize grows, and we have seen that the standard error of the sample mean shrinks likeσ/√n as the sample mean approaches the population mean.
(3) [1 Pt] We often prefer a pseudo-random number generator because our simulations resultscan be exactly reproduced by controlling the seed.
√True © False
Solution: True. This is an essential aspect of reproducible data analyses and simula-tion studies.
(4) [1 Pt] As the sample size increases, the bootstrapped sampling distribution of a statisticwill always become roughly normal.
© True√
False
Solution: False. The bootstrapped sampling distribution should resemble the truesampling distribution of the statistic, which may or may not be normal.
26. [2 Pts] Suppose we have a census of household incomes for the entire state of California.Which of the following histograms would most closely resemble a normal curve?

DS100 Midterm, Page 23 of 25 October 12, 2017
√A histogram of 10000 sample means from samples of size n = 1000.
© A histogram of incomes from a SRS of n = 10000 households.
© A histogram of incomes from the entire census.
© None of the above would resemble a normal distribution.

DS100 Midterm, Page 24 of 25 October 12, 2017
27. [5 Pts] Suppose we have a Pandas Series called thePop which contains a census of 25000subjects. We also have a simple random sample of 400 individuals saved in the SeriestheSample. We are interested in studying the behavior of the bootstrap procedure on thesimple random sample. Fill in the blanks in the code below to construct 10000 bootstrappedestimates for the median.
boot_stats = [
______________________.
sample(n = _____________, replace = _____________).
______________________()
for j in range(________________)]
Solution:
boot_stats = [
theSample.
sample(n = 400, replace = True).
median()
for j in range(10000)
]

DS100 Midterm, Page 25 of 25 October 12, 2017
End of Exam
Related Documents