RESEARCH PAPER Drop-of-blood acoustic tweezing technique for integrative turbidimetric and elastometric measurement of blood coagulation Daishen Luo 1 & Erika M. Chelales 1 & Millicent M. Beard 1 & Nithya Kasireddy 1 & Damir B. Khismatullin 1 Received: 29 October 2020 /Revised: 25 February 2021 /Accepted: 4 March 2021 # Springer-Verlag GmbH Germany, part of Springer Nature 2021 Abstract Many patients develop coagulation abnormalities due to chronic and hereditary disorders, infectious disease, blood loss, extra- corporeal circulation, and oral anticoagulant misuse. These abnormalities lead to bleeding or thrombotic complications, the risk of which is assessed by coagulation analysis. Current coagulation tests pose safety concerns for neonates and small children due to large sample volume requirement and may be unreliable for patients with coagulopathy. This study introduces a containerless drop-of-blood method for coagulation analysis, termed “integrated quasi-static acoustic tweezing thromboelastometry” (i- QATT™), that addresses these needs. In i-QATT™, a single drop of blood is forced to levitate and deform by the acoustic radiation force. Coagulation-induced changes in drop turbidity and firmness are measured simultaneously at different instants. The parameters describing early, intermediate, and late stages of the coagulation process are evaluated from the resulting graphical outputs. i-QATT™ rapidly (<10 min) detected hyper- and hypo-coagulable states and identified single deficiency in coagulation factors VII, VIII, IX, X, and XIII. The linear relationship (r 2 > 0.9) was established between fibrinogen concentration and two i-QATT™ parameters: maximum clot firmness and maximum fibrin level. Factor XIII activity was uniquely measured by the fibrin network formation time (r 2 = 0.9). Reaction time, fibrin formation rate, and time to firm clot formation were linearly correlated with heparin concentration (r 2 > 0.7). tPA-induced hyperfibrinolysis was detected in the clot firmness output at 10 min. i-QATT™ provides comprehensive coagulation analysis in point-of-care or laboratory settings, well suited to the needs of neonatal and pediatric patients and adult patients with anemia or blood collection issues. Keywords Coagulation analysis . Coagulation factors . Anticoagulants . Fibrinolysis . Pediatrics Introduction Plasma and whole-blood coagulation tests are routinely per- formed to assess bleeding and thrombosis risks in critical care patients [1, 2], patients with coagulation disorders [3, 4], and patients on anticoagulant therapy [5]. Using a photo-optical turbidimetric or nephelometric technique [6, 7], plasma tests predict the onset of fibrin formation (reaction time) upon ex- posure to activators of extrinsic (PT/INR) or intrinsic pathway of coagulation (aPTT). The information about later stages, which is essential for bleeding/thrombotic risk prediction, can be obtained from whole-blood elastometric tests (TEG or ROTEM) in which temporal changes in blood elasticity (firmness) are measured [8, 9]. However, both TEG and ROTEM require frequent calibration, have high variability, and are not standardized for coagulation measurements [8, 10, 11]. The available coagulation analyzers operate with a relative- ly large sample volume, thus wasting this precious resource. Two to three milliliters of blood collected for one set of coag- ulation tests is a significant amount for neonates and small children [12]. With multiple tests performed at relatively short time intervals, pediatric patients may lose too much blood and become anemic. Due to a lack of clinically validated devices that can operate with small blood samples, monitoring of co- agulation abnormalities in small children remains challenging [13, 14]. There also is a growing concern that coagulation tests are unreliable [15], particularly, in coagulopathic and thrombotic patients [8, 10, 13, 16, 17]. Diagnostic errors can be caused by * Damir B. Khismatullin [email protected] 1 Department of Biomedical Engineering and Tulane Institute for Integrative Engineering for Health and Medicine, Tulane University, 6823 St. Charles Avenue 500 Lindy Boggs Center, New Orleans, LA 70118, USA https://doi.org/10.1007/s00216-021-03278-8 / Published online: 1 April 2021 Analytical and Bioanalytical Chemistry (2021) 413:3369–3379

Welcome message from author
This document is posted to help you gain knowledge. Please leave a comment to let me know what you think about it! Share it to your friends and learn new things together.
Transcript

RESEARCH PAPER
Drop-of-blood acoustic tweezing technique for integrativeturbidimetric and elastometric measurement of blood coagulation
Daishen Luo1& Erika M. Chelales1 & Millicent M. Beard1
& Nithya Kasireddy1 & Damir B. Khismatullin1
Received: 29 October 2020 /Revised: 25 February 2021 /Accepted: 4 March 2021# Springer-Verlag GmbH Germany, part of Springer Nature 2021
AbstractMany patients develop coagulation abnormalities due to chronic and hereditary disorders, infectious disease, blood loss, extra-corporeal circulation, and oral anticoagulant misuse. These abnormalities lead to bleeding or thrombotic complications, the riskof which is assessed by coagulation analysis. Current coagulation tests pose safety concerns for neonates and small children dueto large sample volume requirement and may be unreliable for patients with coagulopathy. This study introduces a containerlessdrop-of-blood method for coagulation analysis, termed “integrated quasi-static acoustic tweezing thromboelastometry” (i-QATT™), that addresses these needs. In i-QATT™, a single drop of blood is forced to levitate and deform by the acousticradiation force. Coagulation-induced changes in drop turbidity and firmness are measured simultaneously at different instants.The parameters describing early, intermediate, and late stages of the coagulation process are evaluated from the resultinggraphical outputs. i-QATT™ rapidly (<10 min) detected hyper- and hypo-coagulable states and identified single deficiency incoagulation factors VII, VIII, IX, X, and XIII. The linear relationship (r2 > 0.9) was established between fibrinogen concentrationand two i-QATT™ parameters: maximum clot firmness and maximum fibrin level. Factor XIII activity was uniquely measuredby the fibrin network formation time (r2 = 0.9). Reaction time, fibrin formation rate, and time to firm clot formation were linearlycorrelated with heparin concentration (r2 > 0.7). tPA-induced hyperfibrinolysis was detected in the clot firmness output at 10min.i-QATT™ provides comprehensive coagulation analysis in point-of-care or laboratory settings, well suited to the needs ofneonatal and pediatric patients and adult patients with anemia or blood collection issues.
Keywords Coagulation analysis . Coagulation factors . Anticoagulants . Fibrinolysis . Pediatrics
Introduction
Plasma and whole-blood coagulation tests are routinely per-formed to assess bleeding and thrombosis risks in critical carepatients [1, 2], patients with coagulation disorders [3, 4], andpatients on anticoagulant therapy [5]. Using a photo-opticalturbidimetric or nephelometric technique [6, 7], plasma testspredict the onset of fibrin formation (reaction time) upon ex-posure to activators of extrinsic (PT/INR) or intrinsic pathwayof coagulation (aPTT). The information about later stages,which is essential for bleeding/thrombotic risk prediction,
can be obtained from whole-blood elastometric tests (TEGor ROTEM) in which temporal changes in blood elasticity(firmness) are measured [8, 9]. However, both TEG andROTEM require frequent calibration, have high variability,and are not standardized for coagulation measurements [8,10, 11].
The available coagulation analyzers operate with a relative-ly large sample volume, thus wasting this precious resource.Two to three milliliters of blood collected for one set of coag-ulation tests is a significant amount for neonates and smallchildren [12]. With multiple tests performed at relatively shorttime intervals, pediatric patients may lose too much blood andbecome anemic. Due to a lack of clinically validated devicesthat can operate with small blood samples, monitoring of co-agulation abnormalities in small children remains challenging[13, 14].
There also is a growing concern that coagulation tests areunreliable [15], particularly, in coagulopathic and thromboticpatients [8, 10, 13, 16, 17]. Diagnostic errors can be caused by
* Damir B. [email protected]
1 Department of Biomedical Engineering and Tulane Institute forIntegrative Engineering for Health and Medicine, Tulane University,6823 St. Charles Avenue 500 Lindy Boggs Center, NewOrleans, LA 70118, USA
https://doi.org/10.1007/s00216-021-03278-8
/ Published online: 1 April 2021
Analytical and Bioanalytical Chemistry (2021) 413:3369–3379

Fig. 1 Quasi-static acoustic tweezing thromboelastometry (QATT) inte-grated with photo-optical turbidimetry. Shown are a schematic diagramof the experimental system: the shape of a levitated blood drop is recordedby camera 1 and blood turbidity is measured from light intensity in thecentral square region of the drop recorded by camera 2 or photodiode; bphotographs of an acoustically levitated and deformed (acousticallytweezed) sample drop of normal blood plasma before the onset of coag-ulation (0 min), during coagulation (10 min), and when plasma is fully
clotted (15 min); c location vs. aspect ratio curves for a sample drop ofnormal blood plasma at 1, 10, 13, and 19 min of sample tweezing; dmechanical tweezograph (elasticity vs. time curve) for coagulating nor-mal blood plasma; and e photo-optical tweezograph (darkness ingreyscale value vs. time) for coagulating normal blood plasma. Bloodplasma was exposed to an intrinsic pathway activator (APTT-XL) andcalcium chloride. The columns in b and symbols in c are the data collect-ed during the deformation phase of the pressure sweep
3370 Luo D. et al.

direct contact of a blood sample with artificial materials, e.g.,container or cartridge walls, during coagulation. Blood is avery sensitive biological material, and its coagulation in thebody is triggered by activated endothelial cells, collagen, and/or external environment such as air. When it is exposed toartificial materials, improper changes in this process mayoccur.
We have developed acoustic tweezing technology that ad-dresses the issues of sample size and sample-wall contact incoagulation analysis [18, 19]. In our approach, temporalchanges in blood viscoelasticity during coagulation areassessed from a single drop of blood (4–6 μL in volume)levitated and deformed in air in a standing acoustic wave field.Simultaneously with this mechanical measurement, we
measure changes in blood turbidity from acquired images ofthe blood drop. The focus of this study is to assess the feasi-bility of this integrated quasi-static technique (i-QATT™) todetect coagulation factor deficiency, measure functional levelsof coagulation factors and fibrinolytic agents, and monitoranticoagulant therapy.
Materials and methods
Reagents Pacific Hemostasis® PT (Thromboplastin-D) andaPTT reagents (aPTT-XL) were purchased from FisherScientific (Hampton, NH). Thromboplastin-D was suspendedin 4 mL PBS. Calcium chloride, porcine heparin sodium, and
Fig. 2 Graphical output of i-QATT™. a, b Shown are the mechanical(left) and photo-optical tweezographs (right) of 3–4 drops of normalblood plasma (FACT) and factor-deficient plasmas exposed to an intrin-sic (APTT-XL, a) or extrinsic (TF, b) pathway activator. c Mechanicaland photo-optical tweezographs of normal blood plasma exposed to
heparin at different doses (4–7 samples per dose) and then activated viathe extrinsic pathway. dMechanical tweezographs of normal blood plas-ma exposed to fibrinolytic agent tPA at different doses (5 samples perdose) and then activated via the extrinsic pathway
3371Drop-of-blood acoustic tweezing technique for integrative turbidimetric and elastometric measurement of...

3372 Luo D. et al.
human tissue plasminogen activator (tPA) were obtained fromSigma-Aldrich (St. Louis, MO). Calcium chloride was dis-solved in deionized water at a 222 mg/mL concentration(2 M). Heparin sodium was diluted in PBS into a 13.5 KU/mL stock solution. The tPA stock solution was prepared bydissolving tPA into PBS at a 0.5 mg/mL concentration.Human fibrinogen solution was purchased from EnzymeResearch Laboratories (South Bend, IN) and diluted in PBSinto a 400 mg/mL stock solution.
Blood plasma preparation FACT plasma and plasmas withdeficiency in FVII, FVIII, FIX, FX, and FXIII (less than 1%activity) were purchased from George King Bio-Medical(Overland Park, KA). Low fibrinogen-level plasma was pur-chased from Fisher Scientific (Hampton, NH). The extrinsicand intrinsic pathways of coagulation were triggered bythromboplastin-D (where TF is an active ingredient) andaPTT-XL, respectively, following either manufacturer’s in-structions (“commercial recipe”) or a custom recipe. The dataproduced using the commercial recipe are discussed inSupplementary Information (ESM) (see SupplementaryMethods and Results) and shown in ESM Figs. S2 and S3.In the custom recipe, 2 mL thromboplastin-D was mixed with18 mL of blood plasma to activate the extrinsic pathway. Sixmilliliters aPTT-XL and 2 mL calcium chloride were added to18 mL blood plasma to activate the intrinsic pathway.
In the fibrinogen study, a batch of FACT plasma with295 mg/dL fibrinogen concentration, as measured byClauss’ method, was used as a base. One hundred eighty mi-croliters plasma was mixed with 20 μL of either PBS orfibrinogen-in-PBS solution to reach the final fibrinogen con-centration of 265, 300, 400, 500, or 600 mg/dL. Low fibrino-gen plasma (70 mg/dL) was also used in this study.
To test the impact of heparin on blood coagulation, 200 μLFACT plasma was mixed with 20 μL PBS or heparin-in-PBS toachieve the final heparin concentration of 0, 0.15, 0.225, 0.3, or0.6 U/mL. After 15-min incubation, the thromboplastin-D solu-tion prepared by the custom recipe was applied to a heparin-treated plasma sample to activate the coagulation process. Thisprocedure was similar to the Rapid TEG test [20]. The effect ofFXIII activity on blood coagulation was measured using normal(100%activity), FXIII-deficient plasma (<1%), and a 1:1mixtureof normal and FXIII-deficient plasmas (50%).
Experimental system The acoustic tweezing coagulometer[18] consists of the following: (1) a custom Langevin-type
acoustic transducer; (2) a reflector mounted at full wavelengthaway from the transducer; (3) a function synthesizer (Agilent33220A, Santa Clara, CA) and a wideband power amplifier(Krohn-Hite 7500, Brockton, MA) that generate the drivingsignal at a frequency of 29.4 kHz; (4) two backlit light boxesand two CMOS camera (acA1920-25um, Basler, Ahrensburg,Germany) to record drop images; (5) an electronic single-channel pipette (CappMaestro, Capp, Nordhausen,Germany) for semi-automatic sample handling; and (6) a cus-tom environmental chamber integrated with a humidifier thatmaintains humidity at 90%. The coagulometer is controlled bya computer workstation connected to the function generatorand the cameras. The device is 40 cm long, 30 cm wide, and20 cm high, i.e., it is small enough to be placed on bedside.
In i-QATT™ analysis (Fig. 1a, see also ESM Fig. S1), a6-μL blood drop was injected into the standing wave field bythe pipette. The drop was first maintained at an aspect ratioclose to 1, referred to as a “resting state.” This was achievedwhen the input power of the transducer was 3.9 W. Quasi-static acoustic tweezing of the drop was induced through aseries of 1-min pressure sweeps. In each sweep, the inputvoltage (and thus the acoustic pressure) increased at a fixedincrement for 15 s to deform the drop to a maximum aspectratio of ~2.2 and then dropped to its resting state in 5 s. Theresting state was maintained for 40 s, i.e., until the next pres-sure sweep began. Changes in the drop aspect ratio (appliedstrain measure), drop vertical location (measure of the appliedextensional strain), and drop light transparency were assessedfrom recorded images of the drop (Fig. 1b). It is important tosay that the drop vertical position in the resting state is below apressure node because of gravity. An increase in acousticpressure causes the drop to move to a higher location, closerto the node, and it also induces vertical contraction of the drop,resulting in an increase in drop aspect ratio.
Data analysis By using a custom image analysis code, we firstplotted drop aspect ratio vs. location at different instances (Fig. 1c).Please note that times reported there are pressure sweep numbers,converted to the time scale based on the fact that the sweep dura-tion is 1 min. The linear part of the aspect ratio vs. location curveswas used to determine the slope angle θ (a measure of samplefirmness), which was then converted into the relative angle.
θr ¼ θ=θ0 ð1Þor the normalized angle
θn ¼ θr−1θr;max−1
� 100% ð2Þ
where θ0 is the initial angle and θr,max is the maximum value of θr.The set of time plots of θr andd θn and their derivatives is the i-QATT™ graphical output for blood firmness changes, referred toas a “mechanical tweezograph” (Fig. 1d). Simultaneously with
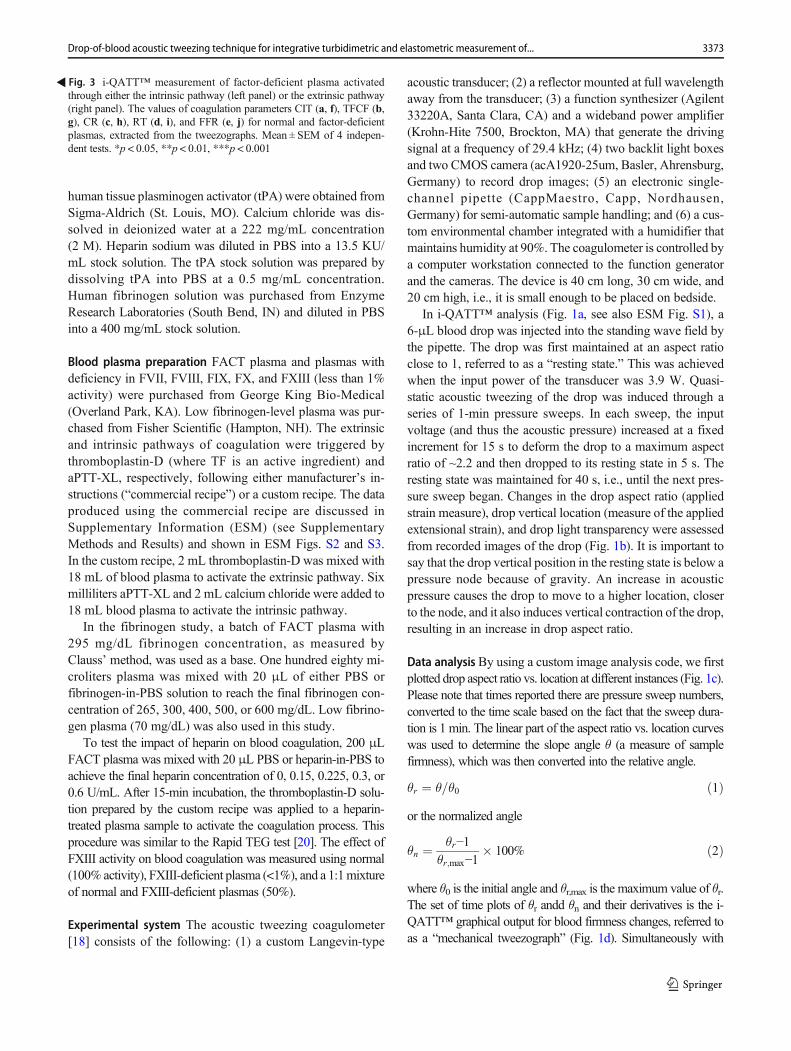
�Fig. 3 i-QATT™ measurement of factor-deficient plasma activatedthrough either the intrinsic pathway (left panel) or the extrinsic pathway(right panel). The values of coagulation parameters CIT (a, f), TFCF (b,g), CR (c, h), RT (d, i), and FFR (e, j) for normal and factor-deficientplasmas, extracted from the tweezographs. Mean ± SEM of 4 indepen-dent tests. *p < 0.05, **p < 0.01, ***p < 0.001
3373Drop-of-blood acoustic tweezing technique for integrative turbidimetric and elastometric measurement of...

drop shape analysis, we measured changes in light intensity in thecenter of the drop (20 pixels × 20 pixels area), which provided us
with the graphical output for fibrin formation kinetics (“photo-optical tweezograph,” Fig. 1e). The light intensity was measured
3374 Luo D. et al.

in grayscale values (0–255). Darkness was defined as a grayscalevalue divided by 255. Normalized darkness was calculated fromEq. (2) by replacing the angle with the light intensity.
i-QATT™ parameters The following coagulation parameterswere obtained from sigmoidal fitting of tweezographs: (1)CIT, the onset time of blood firmness change; (2) TFCF, thetime when blood firmness reaches its plateau value; (3) CR,the maximum rate of firmness change; (4) LY10 or LY15,blood firmness at 10 or 15 min; (5) MCF, the plateau valueof blood firmness; (6) RT, the onset time of light intensitychange; (7) FFR, the maximum rate of light intensity change;(8) MFL, the plateau value of the light intensity; and (9)FNFT, the difference between TFCF and RT.
Statistical analysis Statistical analysis of coagulation parame-ter values was conducted using GraphPad Prism (GraphPadSoftware, La Jolla, CA). The data were presented as mean ±SEM. The sample size was five or larger. The p value wascalculated by two-tailed, unpaired t-test and set at <0.05 for astatistically significant difference.
Results
Mechanical and photo-optical tweezographs As seen inFig. 2a, the mechanical tweezographs for normal and FVII-deficient plasmas (black and red lines) activated by APTT-XLwere nearly identical, while plasmas with FVIII (green), FIX(blue), FX (purple), or FXIII deficiency (orange) showedprolonged coagulation. In the photo-optical tweezographs,prolonged coagulation was observed in FVIII-, FIX-, andFX- but not FXIII-deficient plasmas. These differences aredue to factor deficiency in the intrinsic pathway (FVIII, FIX)and the downstream common pathway (FX, FXIII; see ESMFig. S5). FXIII deficiencywas detected in only the mechanicaltweezograph for the following reason. FXIII is the final en-zyme in the coagulation cascade that cross-links fibrin mole-cules formed during early stages of this process. It has noeffect on fibrin formation. Fibrin cross-linking leads to anincrease in clot firmness until the clot reaches its mature state,which is what the mechanical tweezograph exactly measures.
i-QATT™ accurately predicted defects in the extrinsic path-way, as evident by prolonged coagulation of thromboplastin-D- (TF-) but not APTT-XL-activated FVII-deficient plasmas(Fig. 2b vs. a). As expected, there was a strong delay in thecoagulation process for TF-activated plasmas deficient in FXor FXIII and normal coagulation for plasmas deficient inFVIII or FIX (Fig. 2b).
Figure 2c shows i-QATT™ measurement of blood plasmacoagulation at a clinical range of heparin concentration (0–0.6 U/mL) [21, 22]. Both mechanical and photo-optical datademonstrated that the coagulation became more prolongedwith an increase in heparin dose. i-QATT™ captures tPA-induced fibrinolysis, as seen in Fig. 2d. The firmness of atweezed blood plasma drop was reduced to its initial valuewithin 14 min at tPA dose of 0.5 μg/mL or higher.Additionally, i-QATT™ whole-blood analysis indicatesprolonged coagulation and a reduction in clot firmness withhigh doses of heparin and complete fibrinolysis at 15 to20 min for 0.5 μg/mL tPA (ESM Fig. S4).
Coagulation factor deficiency detection The values of fivecoagulation parameters (CIT, TFCF, CR, RT, and FFR) ex-tracted from mechanical and photo-optical tweezographs ofplasma samples are seen in Fig. 3 and ESM Table S1. Eachof the parameters demonstrated sensitivity to factor deficien-cy. In the case of the intrinsic pathway activation, CIT signif-icantly increased from its normal value (4.6 ± 0.45min) to 8.8± 1.0 min for FVIII-, 7.8 ± 0.96 min for FIX-, 7.2 ± 0.49 minfor FX-, and 7.3 ± 0.14 min for FXIII-deficient plasmas (Fig.3a). TFCF for FXIII-deficient plasma (13 ± 0.84 min) wassignificantly higher than that for normal plasma (7.0 ±0.31 min) and significantly lower than that for FVIII- (1.1 ±0.12 min), FIX- (19 ± 0.99 min), or FX-deficient plasma (16± 0.90 min) (Fig. 3b). Thus, TFCF can be used to rule outwhether blood plasma has a single deficiency in FXIII. FIXdeficiency can be detected fromCR, RT, and FFR values (Fig.3c–e). Specifically, CR for FIX-deficient plasma (0.80 ±0.07°/min) was significantly lower than that for normal (2.9± 0.33°/min), FVIII-deficient (1.14 ± 0.12°/min), or FX-deficient plasma (0.80 ± 0.07°/min) (Fig. 3c). RT significantlyincreased from its normal value (4.7 ± 0.40 min) to 8.2 ±0.36 min and 8.2 ± 0.39 min for plasma deficient in FVIIIand FX, respectively, and further prolonged to 10 ± 0.15 minfor FIX-deficient plasma. FFR was 53 ± 4.2 min−1 for normalplasma but dropped to 22 ± 2.0 min−1 with FVIII deficiency or18 ± 1.7 min−1 with FX deficiency. It reached its lowest valueof 14 ± 1.6 min−1 for plasma deficient in FIX. Note that CITwas much higher than RT for FXIII-deficient plasma (cf.Figure 3a and d) because of the prolonged fibrin cross-linking time.
With extrinsic pathway activation, CIT elevated from 0.55± 0.11min to 4.8 ± 0.75min or 4.8 ± 0.43min in plasmas withFVII or FX deficiency, respectively (8.7 times higher than the
�Fig. 4 Effect of fibrinogen and factor XIII on blood plasma coagulationas assessed by i-QATT™. Shown are a mechanical and b photo-opticaltweezographs for normal plasma reconstituted with fibrinogen at a finalconcentration of 70–600 mg/dL. c The coagulation parameters MFL andMCF show a linear dependence on fibrinogen concentration. d Timedelay between mechanical and photo-optical tweezing data for bloodplasma with different levels of FXIII activity (100%, 50%, and <1% ofthe normal level). e The effect of FXIII on coagulation parameter FNFT.Mean ± SEM of 5–7 independent tests. *p < 0.05, **p < 0.01,***p < 0.001
3375Drop-of-blood acoustic tweezing technique for integrative turbidimetric and elastometric measurement of...

normal value; Fig. 3f). Note that APTT-XL elevated the CITby 1.6 times in those plasma samples (Fig. 3a). This resultpoints out that i-QATT™ is highly sensitive to deficienciesin FX and other common pathway factors whenanticoagulated blood samples are activated via the extrinsic
pathway. Deficiency in FVII, FXIII, or FX had a significanteffect on TFCF and CR of TF-activated plasma. Particularly,TFCF rose from the normal plasma value (2.8 ± 0.10 min) to12 ± 0.40 min for FXIII-, 17 ± 0.36 min for FVII-, and 27 ±1.4 min for FX-deficient plasmas (Fig. 3g). Normal plasma
Fig. 5 Dose effect of heparin and tPA on blood plasma coagulation, asassessed by i-QATT™. The values of coagulation parameters CIT (a),TFCF (b), CR (c), RT (d), and FFR (e) for control and heparin-treated
plasma and LY10 (f) for tPA treated plasma. Mean ± SEM of 4 indepen-dent tests. *p < 0.05, **p < 0.01, ***p < 0.001
3376 Luo D. et al.
CR was 3.3 ± 0.23°/min, while FXIII-, FVII-, and FX-deficient plasmas had much lower values: 2.3 ± 0.24°/min,0.66 ± 0.02°/min, and 0.33 ± 0.02°/min, respectively (Fig.3h). Therefore, the TFCF or CR data can be used to rule outsingle factor deficiency in FVII and FXIII and to detect FXdeficiency. RTwasmuch slower in FVII- (2.2 ± 0.22min) andFX-deficient plasma (2.0 ± 0.13 min) than in normal plasma(0.74 ± 0.20 min) or plasma with deficiency in other factors(Fig. 3i). FFR also showed sensitivity to FVII and FX defi-ciencies (normal: 41 ± 2.7 min−1, FVII: 10 ± 0.31 min−1, andFX: 2.8 ± 0.12 min−1; Fig. 3j).
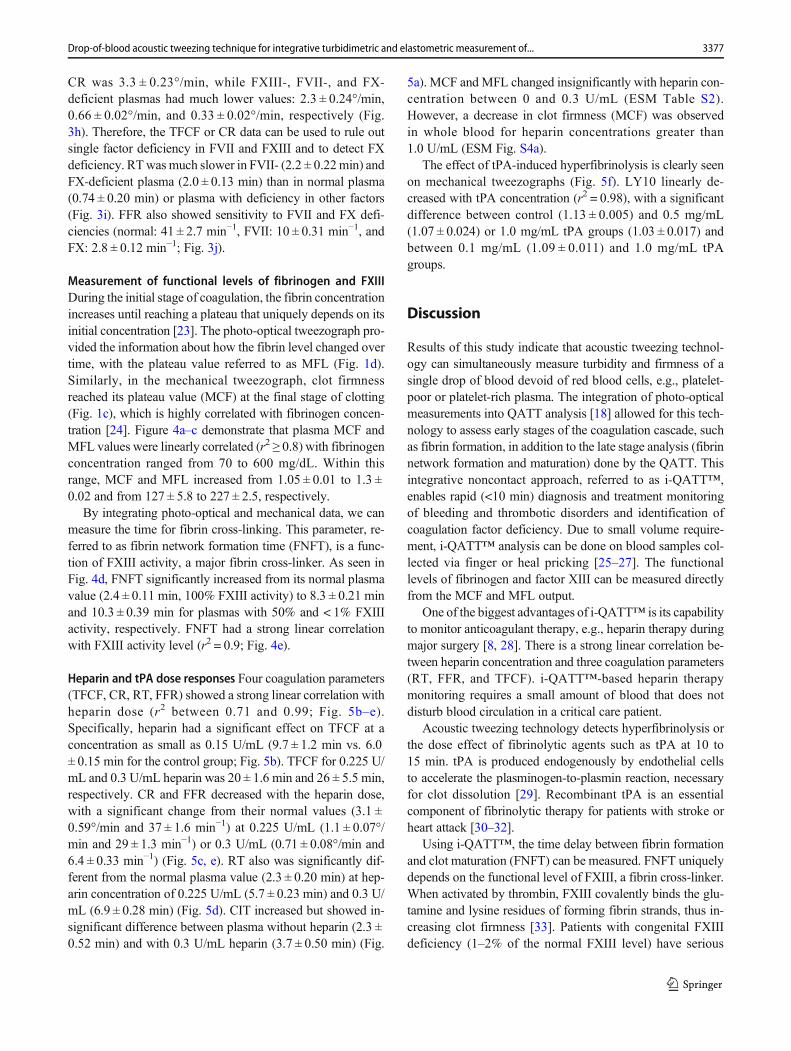
Measurement of functional levels of fibrinogen and FXIIIDuring the initial stage of coagulation, the fibrin concentrationincreases until reaching a plateau that uniquely depends on itsinitial concentration [23]. The photo-optical tweezograph pro-vided the information about how the fibrin level changed overtime, with the plateau value referred to as MFL (Fig. 1d).Similarly, in the mechanical tweezograph, clot firmnessreached its plateau value (MCF) at the final stage of clotting(Fig. 1c), which is highly correlated with fibrinogen concen-tration [24]. Figure 4a–c demonstrate that plasma MCF andMFL values were linearly correlated (r2 ≥ 0.8) with fibrinogenconcentration ranged from 70 to 600 mg/dL. Within thisrange, MCF and MFL increased from 1.05 ± 0.01 to 1.3 ±0.02 and from 127 ± 5.8 to 227 ± 2.5, respectively.
By integrating photo-optical and mechanical data, we canmeasure the time for fibrin cross-linking. This parameter, re-ferred to as fibrin network formation time (FNFT), is a func-tion of FXIII activity, a major fibrin cross-linker. As seen inFig. 4d, FNFT significantly increased from its normal plasmavalue (2.4 ± 0.11 min, 100% FXIII activity) to 8.3 ± 0.21 minand 10.3 ± 0.39 min for plasmas with 50% and < 1% FXIIIactivity, respectively. FNFT had a strong linear correlationwith FXIII activity level (r2 = 0.9; Fig. 4e).
Heparin and tPA dose responses Four coagulation parameters(TFCF, CR, RT, FFR) showed a strong linear correlation withheparin dose (r2 between 0.71 and 0.99; Fig. 5b–e).Specifically, heparin had a significant effect on TFCF at aconcentration as small as 0.15 U/mL (9.7 ± 1.2 min vs. 6.0± 0.15 min for the control group; Fig. 5b). TFCF for 0.225 U/mL and 0.3 U/mL heparin was 20 ± 1.6 min and 26 ± 5.5 min,respectively. CR and FFR decreased with the heparin dose,with a significant change from their normal values (3.1 ±0.59°/min and 37 ± 1.6 min−1) at 0.225 U/mL (1.1 ± 0.07°/min and 29 ± 1.3 min−1) or 0.3 U/mL (0.71 ± 0.08°/min and6.4 ± 0.33 min−1) (Fig. 5c, e). RT also was significantly dif-ferent from the normal plasma value (2.3 ± 0.20 min) at hep-arin concentration of 0.225 U/mL (5.7 ± 0.23 min) and 0.3 U/mL (6.9 ± 0.28 min) (Fig. 5d). CIT increased but showed in-significant difference between plasma without heparin (2.3 ±0.52 min) and with 0.3 U/mL heparin (3.7 ± 0.50 min) (Fig.
5a). MCF and MFL changed insignificantly with heparin con-centration between 0 and 0.3 U/mL (ESM Table S2).However, a decrease in clot firmness (MCF) was observedin whole blood for heparin concentrations greater than1.0 U/mL (ESM Fig. S4a).
The effect of tPA-induced hyperfibrinolysis is clearly seenon mechanical tweezographs (Fig. 5f). LY10 linearly de-creased with tPA concentration (r2 = 0.98), with a significantdifference between control (1.13 ± 0.005) and 0.5 mg/mL(1.07 ± 0.024) or 1.0 mg/mL tPA groups (1.03 ± 0.017) andbetween 0.1 mg/mL (1.09 ± 0.011) and 1.0 mg/mL tPAgroups.
Discussion
Results of this study indicate that acoustic tweezing technol-ogy can simultaneously measure turbidity and firmness of asingle drop of blood devoid of red blood cells, e.g., platelet-poor or platelet-rich plasma. The integration of photo-opticalmeasurements into QATT analysis [18] allowed for this tech-nology to assess early stages of the coagulation cascade, suchas fibrin formation, in addition to the late stage analysis (fibrinnetwork formation and maturation) done by the QATT. Thisintegrative noncontact approach, referred to as i-QATT™,enables rapid (<10 min) diagnosis and treatment monitoringof bleeding and thrombotic disorders and identification ofcoagulation factor deficiency. Due to small volume require-ment, i-QATT™ analysis can be done on blood samples col-lected via finger or heal pricking [25–27]. The functionallevels of fibrinogen and factor XIII can be measured directlyfrom the MCF and MFL output.
One of the biggest advantages of i-QATT™ is its capabilityto monitor anticoagulant therapy, e.g., heparin therapy duringmajor surgery [8, 28]. There is a strong linear correlation be-tween heparin concentration and three coagulation parameters(RT, FFR, and TFCF). i-QATT™-based heparin therapymonitoring requires a small amount of blood that does notdisturb blood circulation in a critical care patient.
Acoustic tweezing technology detects hyperfibrinolysis orthe dose effect of fibrinolytic agents such as tPA at 10 to15 min. tPA is produced endogenously by endothelial cellsto accelerate the plasminogen-to-plasmin reaction, necessaryfor clot dissolution [29]. Recombinant tPA is an essentialcomponent of fibrinolytic therapy for patients with stroke orheart attack [30–32].
Using i-QATT™, the time delay between fibrin formationand clot maturation (FNFT) can be measured. FNFT uniquelydepends on the functional level of FXIII, a fibrin cross-linker.When activated by thrombin, FXIII covalently binds the glu-tamine and lysine residues of forming fibrin strands, thus in-creasing clot firmness [33]. Patients with congenital FXIIIdeficiency (1–2% of the normal FXIII level) have serious
3377Drop-of-blood acoustic tweezing technique for integrative turbidimetric and elastometric measurement of...
hemorrhagic complications such as intracranial hematoma.FXIII deficiency is often acquired, e.g., in pediatric malignan-cies [34], hyperfibrinolysis [35], and disseminated intravascu-lar coagulation (DIC) [36, 37]. On the other hand, elevatedFXIII levels contribute to the development of arterial and ve-nous thrombosis [38]. Changes in FXIII activity cannot bemeasured by PT or aPTT tests, and the existing FXIII assays[39] are expensive and not readily available.
i-QATT™ addresses the issues of large sample volume andhigh variability of coagulation analyzers. Due to a minimumamount of blood sampled, this technology benefits neonataland pediatric patients and adult patients with anemia or bloodcollection difficulties. Since both the device and sample aresmall in size, i-QATT™ can be used for rapid screening ofcoagulation abnormalities, e.g., in patients with infectious dis-ease such as COVID-19, and for monitoring of anticoagulanttherapy in outpatient settings or at home.
The next step in establishing clinical utility of i-QATT™ isto expand it to whole-blood analysis. While QATT itselfworks with whole blood, our photo-optical method is de-signed for blood plasma. Red blood cells abundantly presentin whole blood mask the optical signal coming from fibrinmolecules at wavelengths above 600 nm. Recent data obtain-ed by UV-visible spectrophotometry [40, 41] and multi-wavelength light scattering [42] indicate that fibrin formationcan be detected from the absorption spectrum, particularly,from absorbance at wavelengths of 350 nm and 600 to800 nm where the contribution of red blood cells becomesrelatively small. The implementation of the light absorptiontechnique will be the focus of our future studies.
Supplementary Information The online version contains supplementarymaterial available at https://doi.org/10.1007/s00216-021-03278-8.
Acknowledgements The authors thank R. Glynn Holt for help with theexperimental system design and Nathan Nelson for fruitful discussion.
Authors’ contributions D. Luo designed the study and the acoustictweezing system, performed experiments, analyzed the data, and wrotethe manuscript. M. Beard performed the fibrinogen, heparin, and tPAexperiments. E. Chelales analyzed the data, helped with the code devel-opment, and performed factor deficiency plasma experiments. N.Kasireddy developed the data analysis code. D. Khismatullin conceived,designed, and supervised the study and wrote the manuscript.
Funding This study was supported by U.S. National Science Foundationgrants No. 1438537 and 1725033 (to D.K.), U.S. National ScienceFoundation grant No. 1843479 (to. D.L), American Heart Associationgrant No. 13GRNT17200013 (to D.K.), and U.S. National Institutes ofHealth grant No. GM104940 (to Tulane University).
Data availability All the information about acoustic tweezing technologyincluding the description of the methods to generate blood coagulation
data is proprietary. However, the clinical data produced using this tech-nology, such as graphical outputs (“tweezographs”) and values of coag-ulation parameters, is available to the public. If accepted for publication,this manuscript will be submitted to the digital archive PubMed Centralfor sharing with general public, according to the NIH Public AccessPolicy.
Code availability Not applicable
Declarations
Conflict of interest D. Luo, N. Kasireddy, and D. Khismatullin have afinancial interest in Levisonics Inc. The other authors have no competinginterests. i-QATT™ technology is protected by two pending patents:PCT/US14/55559 and PCT/US2018/014879.
Ethics approval Not applicable
Consent to participate Not applicable
Consent for publication Not applicable
References
1. Herbstreit F, Winter EM, Peters J, Hartmann M. Monitoring ofhaemostasis in liver transplantation: comparison of laboratorybased and point of care tests. Anaesthesia. 2010;65(1):44–9.
2. Levi M, Hunt BJ. A critical appraisal of point-of-care coagulationtesting in critically ill patients. J Thromb Haemost. 2015;13(11):1960–7.
3. Chitlur M, Young G. Global assays in hemophilia. Semin Hematol.2016;53(1):40–5.
4. Jennings I, Cooper P. Screening for thrombophilia: a laboratoryperspective. Br J Biomed Sci. 2003;60(1):39–51.
5. Salmela B, Joutsi-Korhonen L, Armstrong E, Lassila R. Activeonline assessment of patients using new oral anticoagulants: bleed-ing risk, compliance, and coagulation analysis. Semin ThrombHemost. 2012;38(1):23–30.
6. Taralov S, Kukladgiev B. Nephelometric study of the clotting ofblood plasma (fibrinogen-fibrin phase) by patients with deliriumtremens and chronic alcoholics. Folia Med (Plovdiv). 1976;18(2):171–6.
7. Koepke JA. Technologies for coagulation instruments. Lab Med.2000;31(4):211–6.
8. Chen A, Teruya J. Global hemostasis testing thromboelastography:old technology, new applications. Clin Lab Med. 2009;29(2):391–407.
9. Durila M, Malosek M. Rotational thromboelastometry along withthromboelastography plays a critical role in the management oftraumatic bleeding. Am J Emerg Med. 2014;32(3):288 e1–3.
10. Wang JS, Lin CY, HungWT, O’Connor MF, Thisted RA, Lee BK,et al. Thromboelastogram fails to predict postoperative hemorrhagein cardiac patients. Ann Thorac Surg. 1992;53(3):435–9.
11. Ganter MT, Hofer CK. Coagulation monitoring: current techniquesand clinical use of viscoelastic point-of-care coagulation devices.Anesth Analg. 2008;106(5):1366–75.
12. Chuang J, Sadler MA, Witt DM. Impact of evacuated collectiontube fill volume and mixing on routine coagulation testing using2.5-ml (pediatric) tubes. Chest. 2004;126(4):1262–6.
13. Pruthi RK. Abnormal partial thromboplast in time in adults andchildren. Clin Adv Hematol Oncol. 2011;9(6):466–7.
3378 Luo D. et al.
14. Lippi G, Favaloro EJ, Salvagno GL, Franchini M. Laboratory as-sessment and perioperative management of patients on antiplatelettherapy: from the bench to the bedside. Clin Chim Acta.2009;405(1–2):8–16.
15. Capoor MN, Stonemetz JL, Baird JC, Ahmed FS, Awan A,Birkenmaier C, et al. Prothrombin time and activated partial throm-boplastin time testing: a comparative effectiveness study in amillion-patient sample. PLoS One. 2015;10(8):e0133317.
16. Tripodi A, Mannucci PM. The coagulopathy of chronic liver dis-ease. N Engl J Med. 2011;365(2):147–56.
17. Pollack CV Jr. Coagulation assessment with the new generation oforal anticoagulants. Emerg Med J. 2016;33(6):423–30.
18. Holt RG, Luo D, Gruver N, Khismatullin DB. Quasi-static acoustictweezing thromboelastometry. J Thromb Haemost. 2017;15(7):1453–62.
19. Ansari Hosseinzadeh V, Brugnara C, Emani S, Khismatullin D,Holt RG. Monitoring of blood coagulation with non-contact droposcillation rheometry. J Thromb Haemost. 2019;17(8):1345–53.
20. Jeger V, Zimmermann H, Exadaktylos AK. Can RapidTEG accel-erate the search for coagulopathies in the patient with multiple in-juries? J Trauma Acute Care Surg. 2009;66(4):1253–7.
21. Brill-Edwards P, Ginsberg JS, Johnston M, Hirsh J. Establishing atherapeutic range for heparin therapy. Ann Intern Med.1993;119(2):104–9.
22. Toulon P, Boutiere B, Horellou MH, Trzeciak MC, Samama MM.Monitoring heparin therapy using activated partial thromboplastintime–results of a multicenter trial establishing the therapeutic rangefor SILIMAT, a reagent with high sensitivity to heparin. ThrombHaemost. 1998;80(1):104–8.
23 . Ty l e r HM. F i b r i n c r o s s l i n k i ng demons t r a t e d bythrombelastography. Thromb Diath Haemorrh. 1969;22(2):398–400.
24. Carroll RC, Craft RM, Chavez JJ, Snider CC, Kirby RK, Cohen E.Measurement of functional fibrinogen levels using thethrombelastograph. J Clin Anesth. 2008;20(3):186–90.
25. Im SB, Kim SC, Shim JS. A smart pipette for equipment-free sep-aration and delivery of plasma for on-site whole blood analysis.Anal Bioanal Chem. 2016;408(5):1391–7.
26. Kuo J-N, Zhan Y-H. Microfluidic chip for rapid and automaticextraction of plasma from whole human blood. MicrosystTechnol. 2015;21(1):255–61.
27. Maria MS, Rakesh PE, Chandra TS, Sen AK. Capillary flow-drivenmicrofluidic device with wettability gradient and sedimentation ef-fects for blood plasma separation. Sci Rep. 2017;7:43457.
28. Zavadil DP, Stammers AH, Willett LD, Deptula JJ, ChristensenKA, Sydzyik RT. Hematological abnormalities in neonatal patients
treated with extracorporeal membrane oxygenation (ECMO). JExtra Corpor Technol. 1998;30(2):83–90.
29. Hoylaerts M, Rijken D, Lijnen H, Collen D. Kinetics of the activa-tion of plasminogen by human tissue plasminogen activator. Roleof fibrin. J Biol Chem. 1982;257(6):2912–9.
30. Lo EH, Broderick JP, Moskowitz MA. tPA and proteolysis in theneurovascular unit. Stroke. 2004;35(2):354–6.
31. Adibhatla RM, Hatcher JF. Tissue plasminogen activator (tPA) andmatrix metalloproteinases in the pathogenesis of stroke: therapeuticstrategies. CNS Neurol Disord Drug Targets. 2008;7(3):243–53.
32. Goldstein LB. Acute ischemic stroke treatment in 2007.Circulation. 2007;116(13):1504–14.
33. Loewy AG, College H (2001) Structure and function of factor XIII34. Wiegering V, Andres O, Schlegel PG, Deinlein F, EyrichM, Sturm
A. Hyperfibrinolysis and acquired factor XIII deficiency in newlydiagnosed pediatric malignancies. Haematologica. 2013;98:e90–1.
35. Dirkmann D, Gorlinger K, Gisbertz C, Dusse F, Peters J. FactorXIII and tranexamic acid but not recombinant factor VIIa attenuatetissue plasminogen activator-induced hyperfibrinolysis in humanwhole blood. Anesth Analg. 2012;114(6):1182–8.
36. Rodeghiero F, Barbui T, Battista R, Chisesi T, Rigoni G, Dini E.Molecular subunits and transamidase activity of factor XIII duringdisseminated intravascular coagulation in acute leukaemia. ThrombHaemost. 1980;43(01):006–9.
37. Song JW, Choi JR, Song KS, Rhee JH. Plasma factor XIII activityin patients with disseminated intravascular coagulation. YonseiMed J. 2006;47(2):196–200.
38. Muszbek L, Bagoly Z, Bereczky Z, Katona E. The involvement ofblood coagulation factor XIII in fibrinolysis and thrombosis.Cardiovasc Hematol Agents Med Chem. 2008;6(3):190–205.
39. Dorgalaleh A, Kazemi A, Zaker F, ShamsizadehM, Rashidpanah J,Mollaei M. Laboratory diagnosis of factor XIII deficiency, routinecoagulation tests with quantitative and qualitative methods. ClinLab. 2016;62(4):491–8.
40. Chernysh IN, Weisel JW. Dynamic imaging of fibrin network for-mation correlated with other measures of polymerization. Blood.2008;111(10):4854–61.
41. Wiman B, RanbyM. Determination of soluble fibrin in plasma by arapid and quantitative spectrophotometric assay. Thromb Haemost.1986;55(2):189–93.
42. Dassi C, Seyve L, Garcia X, Bigo E, Marlu R, Caton F, et al.Fibrinography: a multiwavelength light-scattering assay of fibrinstructure. Hemasphere. 2019;3(1):e166.
Publisher’s note Springer Nature remains neutral with regard to jurisdic-tional claims in published maps and institutional affiliations.
3379Drop-of-blood acoustic tweezing technique for integrative turbidimetric and elastometric measurement of...
Related Documents


