DOT HS 809 669 Technical Report DRIVERS’ PERCEPTIONS OF HEADLIGHT GLARE FROM ONCOMING AND FOLLOWING VEHICLES Published By: National Center for Statistics and Analysis Advanced Research and Analysis This document is available to the public from the National Technical Information Service, Springfield, Virginia, VA 22161 January 2004

Welcome message from author
This document is posted to help you gain knowledge. Please leave a comment to let me know what you think about it! Share it to your friends and learn new things together.
Transcript

DOT HS 809 669
Technical Report
DRIVERS’ PERCEPTIONS OF HEADLIGHT GLARE FROM ONCOMING AND FOLLOWING VEHICLES
Published By:
National Center for Statistics and AnalysisAdvanced Research and Analysis
This document is available to the public from the National Technical Information Service, Springfield, Virginia, VA 22161
January 2004
This publication is distributed by the U.S. Department of Transportation, National Highway Traffic Safety Administration, in the interest of information exchange. The opinions, findings and conclusions expressed in this publication are those of the author(s) and not necessarily those of the Department of Transportation or the National Highway Traffic Safety Administration. The United States Government assumes no liability for its contents or use thereof. If trade or manufacturers' names are mentioned, it is only because they are considered essential to the object of the publication and should not be construed as an endorsement. The United States Government does not endorse products or manufacturers.

National Center for Statistics and Analysis 400 Seventh St., S.W., Washington, D.C. 20590 i
Technical Report Documentation Page 1. Report No.DOT HS 809 669
2. Government Accession No. 3. Recipient's Catalog No.
5. Report Date January 2004
4. Title and Subtitle
DRIVERS’ PERCEPTIONS OF HEADLIGHT GLARE FROM ONCOMING AND FOLLOWING VEHICLES 6. Performing Organization Code
NPO-121 and NVS-322 7. Author(s) Santokh Singh*Ph. D. and Mike Perel@
8. Performing Organization Report No.
10. Work Unit No. (TRAIS) 9. Performing Organization Name and Address
* Rainbow Technology Inc. @ Crash Avoidance Research Division 17106 Thatcher Court NHTSA, U.S. Department of Transportation Olney, MD 20832 400 Seventh Street, S.W., Washington, D.C. 20590
11. Contract or Grant No.
13. Type of Report and Period Covered NHTSA Technical Report
12. Sponsoring Agency Name and Address National Highway Traffic Safety Administration U.S. Department of Transportation 400 Seventh Street, S.W. Washington, D.C. 20590 14. Sponsoring Agency Code
15. Supplementary Notes
Authors wish to thank reviewers from NHTSA for their useful comments and Mr. Tom Bragan and Ms. Ellin Ramsey for proofreading this report.
16. Abstract
Recently, U.S. drivers have been expressing concern over the discomfort and reduced visibility that they experience from headlight glare from other vehicles. Drivers have focused their concern on the relatively new high intensity discharge lights, high mounted lights, and various auxiliary lights. In order to better understand this glare problem, the National Highway Traffic Safety Administration collected data on drivers’ perception of glare from a representative sample of U.S. drivers. The survey was conducted through Omnibus Survey of the Bureau of Transportation Statistics. The present study is based on the information (data) collected on two types of glare: glare from oncoming and following vehicles.
The survey data were analyzed to find out how U.S. drivers perceive the two types of glare and if glare perception is associated with respondents’ age and gender. Contingency analysis was conducted to establish these associations. The statistics showed that a sizeable number of respondents feel that glare was ‘disturbing’. The percent frequency distributions were used to better understand the age and gender profiles of drivers who felt disturbed by the nighttime glare. It was found that the age group 35 to 44 had the highest percentage of night drivers as well as among those who felt glare ‘disturbing’. In addition, female respondents of this age group were more of the opinion that the glare from oncoming and following vehicles was ‘disturbing’ as compared with other age groups of their own gender or even of the opposite gender.
17. Key Words age, association, following glare , gender, oncoming glare, respondents
18. Distribution Statement Document is available to the public through the National Technical Information Service, Springfield, VA 22161 http//:www.ntis.gov
19. Security Classif. (of this report) Unclassified
20. Security Classif. (of this page)Unclassified
21. No. of Pages16
22. Price
Form DOT F 1700.7 (8-72) Reproduction of completed page authorized

National Center for Statistics and Analysis 400 Seventh St., S.W., Washington, D.C. 20590 ii
TABLE OF CONTENTS
SECTION/SUBSECTION PAGE No.
EXECUTIVE SUMMARY…………………………………………………………………………….…………. ii
1. Introduction and background……………………………………………………………………. 1
2. Overview of the Omnibus survey………………………………………………………………... 1
3. Objective of the study and methodology………………………………………………………… 2
4. Selection of variables for statistical analysis…………………………………………………….. 2
5. Overall glare ratings of survey respondents……………………………………………………... 2
6. Association between glare perception and respondents’ age and gender.………………………. 3
7. Age-wise distribution of respondents with the rating ‘disturbing’……………………………… 4
8. Gender-wise distribution of respondents with the rating ‘disturbing’…………………………... 6
9. Male-female comparison in the subpopulations of night-driving and glare-disturbed respondents ……………………………………………………………………………………… 7
9.1 Male and female night-driving respondents over age groups……………………………….. 7
9.2. Male and female glare-disturbed respondents over age groups……………………………. 8
10. Temporal profiles of glare ratings……………………………………………………………….. 9
11. Summary and conclusions……………………………………………………………………….. 10
12. References………………………………………………………………………………………... 11
13. Appendix A. Tables: Bivariate frequency distributions: Age vs. Rating and Sex vs. Rating for oncoming and following glare…………………………………………………………………… 12

National Center for Statistics and Analysis 400 Seventh St., S.W., Washington, D.C. 20590 iii
EXECUTIVE SUMMARY
Background and objectives
In recent years, an increasing number of drivers have complained to the National Highway Traffic Safety Administration (NHTSA) about headlight glare. A number of comments concerned objections to glare from fog lamps and high-mounted headlights on trucks and SUVs. The comments from the public to the NHTSA Docket 01-8885 helped to identify many of the glare concerns of the U.S. driving population. The large number of glare complaints demonstrated the extent to which the public was concerned with the glare from other vehicles. The number of comments was larger than those that NHTSA received on other safety concerns. However, the docket comments may not provide a true assessment of the glare concern of the driving population.
High intensity of headlights may extend the visibility of objects ahead, but it may also increase the discomfort that glare of the headlights may cause to drivers of other vehicles. Glare can also reduce visibility distances by reducing object contrast or causing drivers to avert their eyes from the roadway to avoid discomfort. The challenge for headlight designers and regulators is to maintain an appropriate balance between glare and visibility. While empirical research is often necessary to quantify these tradeoffs, such research can only study a small number of drivers under a limited set of real world conditions. This limits the extent to which findings can be generalized to the entire population of drivers as well as to real world driving conditions.
To help put the docket comments on glare into perspective, NHTSA asked the Bureau of Transportation Statistics (BTS) to include several questions pertinent to this issue in a series of nationwide telephone surveys titled ‘Omnibus Survey’. These surveys were conducted monthly (January to December, 2002) with a new sample of subjects each month. However, the questions concerning glare were asked only during the first six months: January to June 2002. The questions pertaining to drivers’ perceptions of glare from oncoming and following vehicles is the subject of this study.
Based on the survey, the primary objective of this study was to obtain a nationally representative assessment of drivers’ perceptions of glare. Additionally, the objective was to confirm if drivers’ perceptions of glare are associated with their age and gender and bring out the differences that might exist due to gender and age of the respondent.
Data and methodology
The analyses conducted in this study are based on the ‘Omnibus Survey’ data that consists of drivers’ perceptions of glare expressed as: ‘not noticeable’, ‘barely noticeable’, ‘noticeable but acceptable’, ‘disturbing’, or ‘crash or near miss’ due to two types of glare: glare from oncoming and following vehicles.
Descriptive statistics were used to study variations with respect to glare perceptions that exist among drivers due to age and gender. Contingency analysis was used to test hypotheses related to the possible associations between glare ratings and age and gender. Bivariate distributions: Age x Glare perception and Gender x Glare perception were used to obtain a better idea about the glare perception.
Results and conclusions
The results show that for the majority of respondents (about 54%) glare was ‘noticeable but acceptable’. However, the sizeable number of drivers (about 30%) who experienced nighttime glare as ‘disturbing’ cannot be ignored. The response data of drivers falling into this category was further analyzed to bring

National Center for Statistics and Analysis 400 Seventh St., S.W., Washington, D.C. 20590 iv
out the differences that might exist due to the type of glare and age and gender of the respondent. In fact, the frequency distributions of the glare-disturbed respondents over age and gender groups, for oncoming and following glare, did not indicate any difference due to the type of glare; the distributions were found in close proximity with each other. There were, however, percentage differences among age and gender groups.
The age-wise comparison highlighted some differences and similarities among age groups. For instance, the distribution of the glare-disturbed respondents over age groups showed that most of the respondents who rated glare ‘disturbing’ were not old drivers. Also, the ratings of discomfort from glare for old drivers were not significantly different from that for the younger drivers. In general, the percentage of the glare-disturbed respondents was highest for the age groups 35 to 44 and 45 to 54. For oncoming glare, the 55 to 64 year old group had the highest percentage of the glare-disturbed respondents, while for following glare, it was the age group 18 to 24 that contributed most to the this category of drivers.
Through gender-wise comparison of respondents, it was observed that although male and female representation in the population of all respondents was the same, the females, in general, were found more glare-disturbed. Distributions of male and female respondents over age groups showed that among all night-driving and glare-disturbed respondents, 35 to 44 year old had the highest representation, with a higher female representation. Male-female comparison within each age group showed that among the night-driving respondents, males had much higher representation in the age group 75 and above, while in other age groups the differences in male-female representations were small. The gender-wise comparison was also done for the glare-disturbed respondents in each age group. Significant differences in male-female representations were observed within each age group of this category of respondents with much larger differences for the age groups 35 to 44 and 75 and above. It was also found that 35 to 44 year old females had much higher representation as compared with the males of this age group, even though the differences between the two genders of this age group among all respondents was not so large.
The statistics also show that for both oncoming and following glare, as the number of dark hours decreases from January to June, the percentage of ‘concerned’ respondents decreases. The largest decrease in the percentage of glare-disturbed respondents was observed from March to April. Only a slight change in the percentages of both ‘concerned’ and ‘minimally concerned’ respondents was observed in May and June.

National Center for Statistics and Analysis 400 Seventh St., S.W., Washington, D.C. 20590 1
1. Introduction and background
In recent years, an increasing number of drivers have complained to the National Highway Traffic Safety Administration (NHTSA) about headlight glare. The complaints are documented in citizen submissions to Docket 01-8885, Notice 1. Since its publication in September 2001, the docket has received about 4,000 comments from all over the United States. A number of comments concerned objections to glare from fog lamps and high-mounted headlights on trucks and SUVs. However, the primary concern was glare from high intensity discharge (HID) lights. HID differ in several respects from more conventional halogen lamps. HIDs have a bluer spectral content, a wider beam pattern, and can have a smaller luminous area. While a few drivers with HID on their vehicles thought that their night visibility improved, the great majority of the comments expressed drivers’ complaints about glare from HID-equipped vehicles.
Increasing intensity may extend the visibility of objects ahead but it may also increase the discomfort that glare of the headlights may cause to drivers of other vehicles. Glare can also reduce visibility distances by reducing object contrast or causing drivers to avert their eyes from the roadway to avoid discomfort. The challenge for headlight designers and regulators is to maintain an appropriate balance between glare and visibility. While empirical research is often necessary to quantify these tradeoffs, such research can only study a small number of drivers under a limited set of real world conditions. This limits the extent to which findings can be generalized to the entire population of drivers.
The comments from the public to the NHTSA docket helped to put the glare concerns of the driving population at large into perspective. The large number of glare complaints demonstrated the extent to which the public was concerned with the glare from other vehicles while driving on the roadways. The number of comments was much larger than the number of public comments that NHTSA has received on other safety topics. The drivers’ descriptions of their glare problems helped to provide real-world insight into the safety-related problems being experienced on the roadways. For example, many drivers described being “blinded” for a few seconds after exposure to the glare and needed to slow down. The strong feelings of the public about being exposed to glare were also evident in their comments.
Despite the useful information provided by docket comments, they do not necessarily provide a representative assessment of the glare concerns of the U.S. driving population. The comments may be biased because drivers with glare problems are more likely to write as compared with those who have no such issues. It is also likely that many viewpoints were not represented because many drivers did not know about the docket.
To help put the docket comments on glare into perspective, NHTSA asked the Bureau of Transportation Statistics (BTS) to include several questions pertinent to this issue in a series of nationwide telephone surveys titled ‘Omnibus Survey’. These surveys were conducted monthly (January to December, 2002) with a new sample of subjects each month. However, the questions concerning glare were asked only during the first six months: January to June 2002. The questions pertaining to drivers’ perceptions of glare from oncoming vehicles and glare from the vehicles behind are the subject of this study.
2. Overview of the Omnibus survey
The Omnibus Survey is a stratified random national probability sample conducted monthly by the BTS to monitor expectations of, and satisfaction with, the transportation system, as well as to gather information on specific events and issues, using a Random-Digit-Dialed telephone methodology. Various sampling issues, such as selection of sampling design, sampling weights, precision of estimates, etc., were resolved before the interviews started. The target population of the survey consisted of U. S. non-institutionalized adult population of drivers who were 18 years of age or older. The average (over

National Center for Statistics and Analysis 400 Seventh St., S.W., Washington, D.C. 20590 2
six months) final completed sample size was 1,053 cases per month, of which on the average 870 were valid responses. Each respondent who drove at night during the previous twelve months was asked to express his/her perception of nighttime glare from: oncoming and following vehicles by selecting one of the five ratings: ‘not noticeable’, ‘barely noticeable’, ‘noticeable but acceptable’, ‘disturbing’, or ‘caused a crash or near miss’.
The background information of the survey, sampling procedures, data collection, data elements and survey variables, response rates, final weights and standard errors of estimates are provided in the survey documentation of the Omnibus Survey issued by Bureau of Transportation Statistics [1].
3. Objective of the study and methodology
A descriptive analysis was conducted to get a comparative idea about different glare ratings. One of the objectives of this study was to confirm if the driver’s perception of glare on driving is in any way associated with age and gender of the respondents. Contingency analysis was used to test hypotheses related to the possible association between glare ratings and age and gender. Contingency analysis [2] is one of the useful techniques to study the relation between two variables that can be arranged in a contingency table, such as Table A.1 (Appendix).
Bivariate percent frequency distributions were used to study the differences that exist among respondents of different age and gender groups in perceiving glare. These differences were depicted through percentage histograms and polygons.
4. Selection of variables for statistical analysis
As mentioned earlier, the present study is focused on ‘glare from oncoming vehicles’ and ‘glare from following vehicles’. Accordingly, the analyses conducted in this study are based on responses of the interviewed persons to the following two questions:
Q1. In the last 12 months, while driving at night, has the glare from the headlights of an oncoming vehicle been ‘not noticeable’, ‘barely noticeable’, ‘noticeable but acceptable’, ‘disturbing’, or did it cause a ‘crash or near miss’?
Q2. In the last 12 months, while driving at night, has the glare from the headlights of a vehicle behind been ‘not noticeable’, ‘barely noticeable’, ‘noticeable but acceptable’, ‘disturbing’, or did it cause a ‘crash or near miss’?
The two glare types covered by questions Q1 and Q2 will be referred to, respectively, as oncoming and following glare. It is important to note that the above two questions do not cover the respondents of the survey who did not drive at night during the last twelve months. Such respondents are therefore not subject of this study. In addition, the respondents who ‘refused’ to answer the two glare questions or responded ‘don’t know’, do not provide any information about the glare issue. Hence, such respondents will also be excluded from the analysis. Thus, the term ‘respondent’ used henceforth should be understood to mean a survey respondent whose response was one of the five choices. The respondents considered in this study can accordingly be classified in five categories: ‘not noticeable’, ‘barely noticeable’, ‘noticeable but acceptable’, ‘disturbing’, ‘crash or near miss’.
5. Overall glare ratings of survey respondents
As a first step, a descriptive analysis was conducted to get an overall picture of how the U.S. drivers, in general, perceive glare from oncoming and following vehicles. Figure 1 presents percent frequencies of

National Center for Statistics and Analysis 400 Seventh St., S.W., Washington, D.C. 20590 3
1 %
31%
5%6%
57%
0.2%
30%
54%
9%7%
0
10
20
30
40
50
60
70
80
90
100
Glare perception
Perc
ent f
requ
ency
OncomingFollowing
Not noticeable DisturbingNoticeable but acceptable
Barely noticeable
Crash or near miss
respondents for responses (ratings): not noticeable, barely noticeable, noticeable but acceptable,‘disturbing’, crash or near miss, aggregated for the six months (January to June). It can be seen inFigure 1 (box with broken line border) that according to majority of respondents, both oncoming andfollowing glare is ‘noticeable but acceptable’; the percent frequencies of respondents with this ratingbeing the highest 57% and 54%, respectively, for the two types of glare.
Figure 1. Percent frequency distributions of respondents over five glare ratings foroncoming and following glare (Data source: Omnibus Survey 2002, BTS).
Figure 1 also shows that for small percentages (6% and 7%) of respondents, oncoming and followingglare types were ‘not noticeable’ and so was the case with respondents who rated glare as ‘barelynoticeable’; the latter formed only 5% and 9%, respectively, for the two types of glare. The respondentswho were seriously concerned about glare and had significant representation among respondents werethe ones for whom glare was ‘disturbing’. About 31% of respondents perceived oncoming glare‘disturbing’ and about 30%, following glare. Since temperament plays an important role in perception,the class of respondents who felt disturbed from glare was considered as a special class for furtheranalysis. The following analysis is focused on detecting the differences that might exist in terms of thecontribution of different age- and gender-based groups to the class ‘disturbing’. These respondents willbe referred to as ‘glare-disturbed’ respondents.
6. Association between glare perception and respondent’s age and gender
Perception is a process whereby sensory stimulation in humans is translated into organized experienceand so is the glare perception. Therefore, in order to get a deeper insight into the glare issue, it isimportant to investigate if the human attributes: age and gender of the respondents can have influenceon his/her perception of the glare. To confirm this, contingency analysis was conducted to test thehypothesis of independence between glare perception and respondent’s age as well as between glareperception and respondent’s gender for both oncoming and following glare. As the Omnibus survey wasbased on stratified simple random design, the statistical software SUDAAN was used for contingencyanalysis of the survey data, which takes into account the underlying sampling design. The analysis willbe supplemented by what is called Ph-coefficient, which measures the strength of association betweentwo categorical variables.
The analysis for testing independence between glare perception and age yielded the value 64.08 of Chi-square with 24 degrees of freedom and p-value 0.000001. These statistics confirm that respondent’s age

National Center for Statistics and Analysis 400 Seventh St., S.W., Washington, D.C. 20590 4
possibly influences how he/she perceives oncoming glare. The value 0.3 of Phi-coefficient with its lower and upper attainable bounds 0 and 0.9, respectively, shows a strong association between respondent’s age and his/her perception of oncoming glare. Similarly, the test statistics: 25.56 of Chi-square with 4 degrees of freedom and p-value 0.00001 show that gender of the respondent, too, has bearing on oncoming glare perception. The value 0.2 of Phi-coefficient with its lower and upper attainable bounds 0 and 0.7, respectively, shows a strong association between respondent’s sex and the rating of oncoming glare.
The hypothesis of independence between glare perception and age as well as between glare perception and gender was also tested for following glare. The value 60.38 of Chi-square with 24 degrees of freedom and p-value 0.0000001 shows that respondent’s age has influence on how he/she perceives following glare. The value 0.3 of Phi-coefficient with its lower and upper attainable bounds 0 and 0.9, respectively, shows a strong association between respondent’s age and the rating of following glare. Similarly, the test statistics: 37.97 of Chi-square with 4 degrees of freedom and p-value 0.000001 show that gender of the respondent, too, has bearing on oncoming glare perception. The value 0.2 of Phi-coefficient with its lower and upper attainable bounds 0 and 0.7, respectively, shows a strong association between respondent’s sex and the rating of following glare.
It was found in Section 5 that the glare-disturbed respondents formed the second largest category among all respondents in case of both oncoming (31%) and following (30%) glare. These rather large percentages of the glare disturbed respondents and the influence that age and gender can have on glare perception, lead to further investigation as to how these dependencies reflect on the glare perception ‘disturbing’. In the subsequent analysis, we bring out differences among different age groups as well as between male and female glare-disturbed respondents for oncoming and following glare.
7. Age-wise distribution of respondents with the rating ‘disturbing’
The survey data were first analyzed to obtain the distribution of the rating ‘disturbing’ for each of the two glare types over seven age groups: 18 to 24, 25 to 34, 35 to 44, 45 to 54, 55 to 64, 65 to 74 and above 74. The results for glare from oncoming and following vehicles are plotted as percentages and cumulative (in reverse order) percentages, respectively, in Figure 2(a) and Figure 2(b). While interpreting results presented in these figures, it should be noted that the statistics shown at the end of hanging bars are to be read in reference to the x-axis secondary labels, such as the label >=18, >=25 etc. Thus, this figure not only gives an idea about the percentage of respondents of different age
Figure 2(a). Oncoming glare Figure 2(b). Following glare
Figure 2. Percent frequency and cumulative percent frequency (reverse order) distributions of glare-disturbed respondents over seven age groups (Data source: Omnibus Survey 2002, BTS).
12%
17%
23%
23%
14%
8% 3%
0
18 - 24 25 - 34 35 - 44 45 - 54 55 - 64 65 - 74 >74Age group (years)
100%88%
71%48%
25%11%
3%
Respondent's with age>=18 >=55>=45>=35>=25 >=65 >=75
16%
18%
22%
23%
13%
7% 2%
018 - 24 25 - 34 35 - 44 45 - 54 55 - 64 65 - 74 >74
Age group (years)
100%84%
66%44%
22%9%
>=18 >=55>=45>=35>=25 >=65 >=75
2%
Respondent's with age

National Center for Statistics and Analysis 400 Seventh St., S.W., Washington, D.C. 20590 5
groups in the ‘disturbing’ category, but also shows the percentage of respondents in that category whose age is greater than or equal to 18, 25, 35, 45, 55, 65, or 75. It can be seen in these figures that thefrequency distributions of respondents with the perception ‘disturbing’ for oncoming and followingglare are in close proximity with each other. Figure 2(a) shows that most of the people who rated oncoming glare ‘disturbing’ were not older drivers. In fact, only 11% of respondents who ratedoncoming glare ‘disturbing’ were above 65 as compared with 45% (22 + 23) between 35 and 54. The distribution for glare from following vehicles (Figure 2(b)) shows almost the same statistics: 9% of the respondents with the rating ‘disturbing’ were above 65 and 46% (23 + 23) between 35 and 54.
Although older drivers eyes are particularly susceptible to the adverse affects of glare on judging distance, it is possible that the effects of glare on driver’s discomfort are not age dependent. The results of the current analysis of the survey data supports the findings of several research studies in which it has been noted that the ratings of discomfort from oncoming glare for older drivers (65 and above) are not significantly different from younger drivers (18 to 24); being 11% and 12%, respectively.
In addition to looking at the age profile of glare-disturbed respondents, it is informative to comparedifferent age groups with respect to their rating ‘disturbing’. This was done by taking into account theage group sizes and computing percent frequencies relative to these sizes. The results for oncoming and following glare are presented, respectively, in Figure 3(a) and Figure 3(b). These results show that for oncoming glare, 55 to 64 year old respondents had the highest percentage (37%), while for following glare, it was the age group 18 to 24 that contributed most (34%) to the this category of drivers. In general, the percentage of glare-disturbed respondents was highest for age groups: 45 to 54 and 55 to 64for both types of glare.
AGE GROUPRESPODENT
CATEG. 18-24 25-34 35-44 45-54 55-64 65-74 >=75Glare-
disturbed 26 28 30 36 37 31 28
Others 74 72 70 74 63 69 72
Total 100 100 100 100 100 100 100
AGE GROUPRESPODENT
CATEG. 18-24 25-34 35-44 45-54 55-64 65-74 >=75
Glare-disturbed 34 27 28 33 32 24 21
Others 66 73 72 67 68 76 79
Total 100 100 100 100 100 100 100
Figure 3(a). Oncoming glare. Figure 3(b). Following glare.
Figure 3. Percent frequencies of glare-disturbed respondents and the rest in each of the seven age groups.(Data source: Omnibus Survey 2002, BTS).
A comparison of Figure 3(a) and Figure 3(b) shows that except for 18 to 24 year old drivers, the percentages of drivers with rating ‘disturbing’ was higher for oncoming glare as compared with
18 - 24 25 - 34 35 - 44 45 - 54 55 - 64 65 - 74 >74Age group (years)
Per
cen
t fr
equ
ency
Glare-disturbed Others
18 - 24 25 - 34 35 - 44 45 - 54 55 - 64 65 - 74 >74Age group (years)
Per
cen
t fr
equ
ency
Glare-disturbed Others
26% 30% 36% 37% 31% 28% 27% 28% 33% 32% 24% 21%34%28%
74% 72% 70% 64% 63% 69% 72% 66% 73% 72% 67% 68% 76% 79%

National Center for Statistics and Analysis 400 Seventh St., S.W., Washington, D.C. 20590 6
following glare. The younger drivers were more concerned with glare from following vehicles; 34% ofthem rated this type of glare as ‘disturbing’, while 26% rated oncoming glare as ‘disturbing’.
Figure 4 gives a comparative picture of the representations of different age groups in the entirepopulation of respondents and in the ‘disturbing’ category. In case of oncoming glare (Figure 4(a)), all age groups had lower representation in the ‘disturbing’ category, except for the age groups 45 to 54 and55 to 64, whose representations in this category were 23% and 14%, respectively, as compared withtheir respective percentages 20% and 12% in the population. For following glare, the picture was slightly different. In addition to higher representations (23% and 13%, respectively) of these two agegroups in the ‘disturbing’ category, the age group 18 to 24, too, had a higher percentage (16%) in the glare-disturbed category as compared with their representation (14%) in the population of respondents.Figure 4(a) and Figure 4(b) show that except for age group 18 to 24, the distributions respondents over age groups were the same for both oncoming and following glare.
Figure 4(a). Oncoming glare. Figure 4(b). Following glare.
Figure 4. Percent frequency distributions of glare-disturbed and all respondents over seven age groups.(Data source: Omnibus Survey 2002, BTS).
8. Gender-wise distribution of respondents with the rating ‘disturbing’
It has been established in Section 6 that the glare perception has dependence on the respondent’s gender. It is, therefore, important to see the way in which male and female respondents differ from each other with respect to their glare perception. Figure 5 shows male and female representations in the populationof all respondents as well as in the subpopulation of glare-disturbed respondents. The statistics in Figure 5(a) show that for oncoming glare, although the two gender groups had almost the same (50.3% and49.7%, respectively) representation in the population, the female respondents had a higher representation (55.5%) among the glare-disturbed as compared with 44.5% male respondents. Similarly,in case of following glare, with the same representation of the two gender groups in the population, thefemale representation in the ‘disturbing’ category was higher (53.4%) as compared with the malerepresentation (46.6%).
Even though male and female respondents had almost the same representation in the population ofrespondents (Figure 5), for oncoming glare a higher percentage (33.9%) of female respondents were found glare-disturbed as compared with male respondents, among whom 28.8% were found in the ‘disturbing’ category. Similarly, for following glare, 33.1% of female respondents were in the ‘disturbing’ category as compared with 26.2% of male respondents who fell into this category. Thisleads to the conclusion that females, in general, feel more disturbed from both types of glare. A
14% 19
% 24%
20%
12%
8% 3%12% 17
% 23%
23%
14%
8% 3%
18 - 24 25 - 34 35 - 44 45 - 54 55 - 64 65 - 74 >74Age group (in years)
Per
cen
t fr
equ
ency
Representation in populationRepresentation in category 'disturbing'
14% 19
% 24%
20%
12%
8% 3%
16%
18% 22
%
23%
13%
7% 2%
18 - 24 25 - 34 35 - 44 45 - 54 55 - 64 65 - 74 >74Age group (in years)
Per
cen
t fr
equ
ency
Representation in populationRepresentation in category 'disturbing'

National Center for Statistics and Analysis 400 Seventh St., S.W., Washington, D.C. 20590 7
comparison of similar statistics related to oncoming (in Figure (a)) and following (in Figure 5(b)) glare perception shows that there is virtually no difference between these two types of glare. Following this observation, in the subsequent sections we will present and discuss the results only for oncoming glare.
Figure 5(a). Oncoming glare. Figure 5(b). Following glare.
Figure 5. Venn diagram showing percentages of male and female respondents among oncoming andfollowing glare-disturbed and all respondents. (Data source: Omnibus Survey 2002, BTS).
9. Male-female comparison in subpopulations of night-driving and glare-disturbedrespondents
To gain better insight into the glare issue, the differences that have been observed among respondents’glare perception due to age and gender differences must be viewed in comparison with such differencesthat exist among the night-driving respondents. The following statistical analysis yields statistics that can be used for this purpose.
9.1 Male and female night-driving respondents over age groups
Figure 6 (a) presents statistics that show a comparison of male and female subpopulations of night-driving respondents. The same profile can be seen for the two gender groups, over seven age groups (Figure 6(a)). In both cases, the percentages of the night-driving respondents keep increasing until the age group 35 to 44 and starts decreasing thereafter with minimum for the age group 75 and above.
However, there are differences between two genders for some age groups. One difference is that a slightly higher percentage (24.9%) of 35 to 44 year old females drive at night as compared with their male counterparts (23.0%). The difference between the two genders, in terms of night driving, can beseen also for the age group 75 and above, though in this case a higher percentage (3.9%) of malesreported driving at night as compared with females (2.7%).
Figure 6(b) shows male-female comparisons within each age group of respondents who drove at night.A slightly higher male percentage was observed for age groups 18 to 24 and 25 to 34. A visible difference (48.9% males and 51.1% females) was observed for the age group 35 to 44. For the rest of the age groups, increasingly higher percentage of male night-driving respondents can be seen with amarkedly large difference (60.4% males and 39.6% females) for 75 and above respondents.
46.6%
28.8% of M 33.9% of F 26.2% of M 33.1% of F
50.3% 49.7%
44.5% 55.5%
50.3% 49.7%
53.4%

National Center for Statistics and Analysis 400 Seventh St., S.W., Washington, D.C. 20590 8
AGE GROUPGENDER
18-24 25-34 35-44 45-54 55-64 65-74 >=75 Total
Male 13.3 19.4 23.0 20.3 12.2 7.8 3.9 100
Female 13.4 18.9 24.9 20.3 11.8 8.2 2.7 100
AGE GROUPGENDER
18-24 25-34 35-44 45-54 55-64 65-74 >=75
Male 50.7 51.6 48.9 50.8 51.9 49.5 60.4
Female 49.3 48.4 51.1 49.2 48.1 50.5 39.6
Total 100 100 100 100 100 100 100
Figure 6(a). Percentage frequency distributions for male Figure 6(b). Male and female percentages of night- andfemale night-driving respondents, over age groups. driving respondents in each of the seven age groups.
Figure 6. Percentage frequency distributions of night-driving respondents(Data source: Omnibus Survey 2002, BTS).
9.2 Male and female glare-disturbed respondents over age groups
Unlike the night-driving respondents, the age profiles of male and female glare-disturbed respondents are different. A comparison of male and female subpopulations of glare-disturbed respondents over age groups in Figure 7(a) shows that a higher percentage of males of age groups 18 to 24, 65 to 74, and 75
AGE GROUPGENDER
18-24 25-34 35-44 45-54 55-64 65-74 >=75 Total
Male 12.4 17.1 20.2 23.0 14.3 9.2 3.9 100
Female 11.5 17.3 24.4 23.2 13.6 7.7 2.3 100
AGE GROUPGENDER
18-24 25-34 35-44 45-54 55-64 65-74 >=75
Male 48.3 46.3 41.8 46.2 47.8 50.8 59.9
Female 51.7 53.7 58.2 53.8 52.2 49.2 40.1
Total 100 100 100 100 100 100 100
Figure 7(a). Gender-wise comparison. Figure 7(b). Age-wise comparison.
Figure 7. Percent distributions of glare-disturbed respondents (Data source: Omnibus Survey 2002, BTS).
0
10
20
30
40
50
60
70
80
18-24 25-34 35-44 45-54 55-64 65-74 >=75Age group
Per
cen
tag
e n
igh
t-d
rivi
ng
MaleFemale
0
5
10
15
20
25
30
18-24 25-34 35-44 45-54 55-64 65-74 >=75Age group
Per
cen
tag
e n
igh
t-d
rivi
ng
Male
Female
0
5
10
15
20
25
30
18-24 25-34 35-44 45-54 55-64 65-74 >=75Age group
Per
cen
t g
lare
-dis
turb
ed
MaleFemale
0
10
20
30
40
50
60
70
80
18-24 25-34 35-44 45-54 55-64 65-74 >=75Age group
Per
cen
t g
lare
-dis
turb
ed
Male
Female

National Center for Statistics and Analysis 400 Seventh St., S.W., Washington, D.C. 20590 9
and above perceive glare as ‘disturbing’ as compared with females belonging to these age groups. Ashift was observed for the age group 35 to 44 in that a higher percentage (24.4%) of female glare-disturbed respondents was observed as compared with 20.2% of male glare-disturbed respondents. It can also be seen in this figure that the highest percentage (23.0%) of glare-disturbed males wasobserved for the age group 45 to 54, while that of the glare-disturbed females (24.4%) was for the agegroup 35 to 44.
Figure 7(b) shows male-female comparison of glare-disturbed respondents within each age group.Higher percentages of female glare-disturbed respondents were observed for age groups 25 to 34, 35 to 44 and 45 to 54 with a maximum difference (41.8% males and 58.2% females) for 35 to 44 year oldglare-disturbed respondents. Although, a large difference was also observed for the age group 75 and above, more males (59.9%) were found glare-disturbed as compared with 40.1%. females.
10. Temporal profile of glare ratings
Glare ratings may be influenced by the length of time that drivers are exposed to vehicle lights. For example, the fewer the number of daylight hours, the greater is the number of hours during whichdrivers will be exposed to headlight glare at night, i.e., oncoming and following glare. In view of this fact, the temporal variations with respect to glare ratings were studied over six months: January,February, March, April, May, and June.
For that purpose broader categories of glare ratings were considered that were representative of the levelof concern of the respondents, defined as:
Level of concern:
.or
.
miss'nearorcrash''disturbing'isresponseifConcerned,
'acceptablebutnoticeable'or,'noticeablebarely,'noticeablenot'isresponseifconcerned,Minimally
Figure 9 shows temporal profiles of ‘minimally concerned’ (dark dotted line) and ‘concerned’ (lightdotted line) respondents over six months (January to June). In order to obtain an idea about the trend over six months, moving averages were computed. In this figure, these are plotted as a dark solid linefor ‘minimally concerned’ and as a light solid line for ‘concerned’ respondents.
Figure 9(a). Oncoming glare. Figure 9(b). Following glare.
Figure 9. Temporal profiles of glare ratings of respondents for oncoming and following glare over six months(January to June) (Data source: Omnibus Survey 2002, BTS).
0
10
20
30
40
50
60
70
80
90
100
Per
cen
t:M
in-C
on
cern
ed/C
on
cern
ed
Min-ConcernedConcernedMv.avg-Min-ConcernedMv.avg-Concerned
Jan Feb MarMay JunApr
Jan Feb MarMay JunApr
Month0
10
20
30
40
50
60
70
80
90
100
Per
cen
t:M
in.C
on
cern
ed/C
on
cern
ed
Min-ConcernedConcernedM-avrg,Min-concernedM-avrg,Concerned
Jan Feb MarMay Jun
Apr
Jan Feb MarMay JunApr
Month
National Center for Statistics and Analysis 400 Seventh St., S.W., Washington, D.C. 20590 10
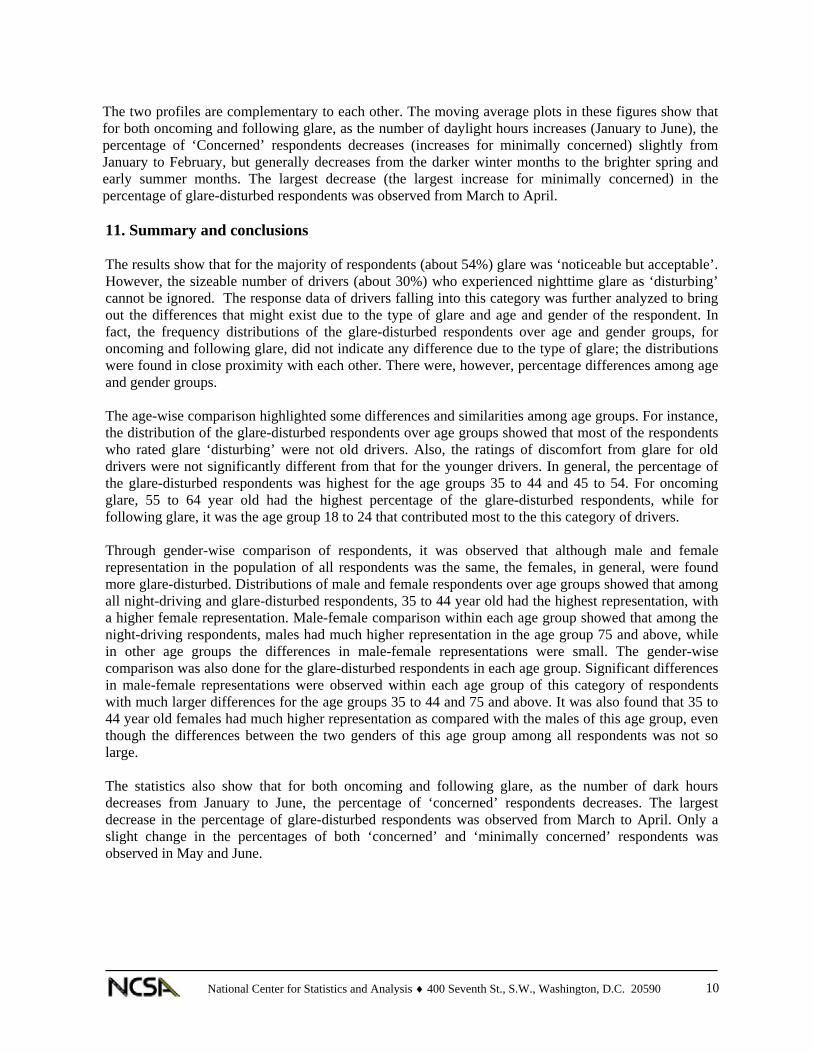
The two profiles are complementary to each other. The moving average plots in these figures show that for both oncoming and following glare, as the number of daylight hours increases (January to June), the percentage of ‘Concerned’ respondents decreases (increases for minimally concerned) slightly from January to February, but generally decreases from the darker winter months to the brighter spring and early summer months. The largest decrease (the largest increase for minimally concerned) in the percentage of glare-disturbed respondents was observed from March to April.
11. Summary and conclusions
The results show that for the majority of respondents (about 54%) glare was ‘noticeable but acceptable’. However, the sizeable number of drivers (about 30%) who experienced nighttime glare as ‘disturbing’ cannot be ignored. The response data of drivers falling into this category was further analyzed to bring out the differences that might exist due to the type of glare and age and gender of the respondent. In fact, the frequency distributions of the glare-disturbed respondents over age and gender groups, for oncoming and following glare, did not indicate any difference due to the type of glare; the distributions were found in close proximity with each other. There were, however, percentage differences among age and gender groups.
The age-wise comparison highlighted some differences and similarities among age groups. For instance, the distribution of the glare-disturbed respondents over age groups showed that most of the respondents who rated glare ‘disturbing’ were not old drivers. Also, the ratings of discomfort from glare for old drivers were not significantly different from that for the younger drivers. In general, the percentage of the glare-disturbed respondents was highest for the age groups 35 to 44 and 45 to 54. For oncoming glare, 55 to 64 year old had the highest percentage of the glare-disturbed respondents, while for following glare, it was the age group 18 to 24 that contributed most to the this category of drivers.
Through gender-wise comparison of respondents, it was observed that although male and female representation in the population of all respondents was the same, the females, in general, were found more glare-disturbed. Distributions of male and female respondents over age groups showed that among all night-driving and glare-disturbed respondents, 35 to 44 year old had the highest representation, with a higher female representation. Male-female comparison within each age group showed that among the night-driving respondents, males had much higher representation in the age group 75 and above, while in other age groups the differences in male-female representations were small. The gender-wise comparison was also done for the glare-disturbed respondents in each age group. Significant differences in male-female representations were observed within each age group of this category of respondents with much larger differences for the age groups 35 to 44 and 75 and above. It was also found that 35 to 44 year old females had much higher representation as compared with the males of this age group, even though the differences between the two genders of this age group among all respondents was not so large.
The statistics also show that for both oncoming and following glare, as the number of dark hours decreases from January to June, the percentage of ‘concerned’ respondents decreases. The largest decrease in the percentage of glare-disturbed respondents was observed from March to April. Only a slight change in the percentages of both ‘concerned’ and ‘minimally concerned’ respondents was observed in May and June.

National Center for Statistics and Analysis 400 Seventh St., S.W., Washington, D.C. 20590 11
12. References
[1] Bureau of Transportation Statistics, Survey Documentation for the Bureau of Transportation Statistics Omnibus Survey Program, January to May 2002.
[2] Kendall, M.G. and Stuart A., The Advanced Theory of Statistics, Vol. 2, Hafner Publishing Company, New York, 1967.

National Center for Statistics and Analysis 400 Seventh St., S.W., Washington, D.C. 20590 12
13. Appendix A. Bivariate frequency distributions: Age vs. Glare rating and Gender vs. Glare rating for oncoming and following glare
This section provides statistics that were produced by SUDAAN cross tabulation procedure for oncoming and following glare types.
Table A.1 and Table A.2 present bivariate frequency distribution of age- and sex-based groups of respondents, based on their responses to question Q1, related to perception of glare from oncoming vehicles.
Table A.1. Bivariate frequency distribution: Age vs. Oncoming glare rating
Oncoming glare rating
Age group Statistic Not
noticeable Barely
noticeable Noticeable but
acceptable Disturbing Crash or near miss
Total
Weighted Size 1567461 1391752 12936571 5948684 123298 21967765 18 to 24 Sample Size 5 5 43 23 0 76
Weighted Size 2423762 1413269 18612288 8602074 481899 31533292 25 to 34 Sample Size 12 8 97 45 2 163
Weighted Size 2446880 1889094 22761159 11232660 225161 38554954 35 to 44 Sample Size 12 11 121 61 1 206
Weighted Size 1579715 1673743 17943060 11546292 250794 32993604 45 to 54 Sample Size 9 10 102 67 1 189
Weighted Size 1419958 1002579 9994766 6959966 25247 19402515 55 to 64 Sample Size 8 6 65 42 0 122
Weighted Size 833226 831486 7980846 4200666 0 13846223 65 to 74 Sample Size 5 5 42 24 0 76
Weighted Size 729448 302509 3009410 1501529 29075 5571970 75 and above Sample Size 5 2 17 9 0 33
Weighted Size 11000448 8504433 93238099 49991871 1135472 163870322 Total Sample Size 56 46 487 270 5 864
(Data source: Omnibus Survey 2002, BTS)
Table A.1. Bivariate frequency distribution: Sex vs. Oncoming glare rating
Oncoming glare rating
SexStatistic Not
noticeable Barely
noticeable Noticeable but
acceptable Disturbing Crash or near miss
Total
Male Weighted Size 6919885 4458832 48022133 23427247 654746 83482844
Sample Size 33 22 236 117 3 410
Female Weighted Size 4107626 4045601 46311448 27130845 480726 82076246
Sample Size 23 24 255 156 3 460
Weighted Size 11027512 8504433 94333582 50558092 1135472 165559090 Total Sample Size 56 46 491 272 5 870
(Data source: Omnibus Survey 2002, BTS)

National Center for Statistics and Analysis 400 Seventh St., S.W., Washington, D.C. 20590 13
Table A.3 and Table A.4 present bivariate frequency distribution of age- and sex-based groups of respondents, based on their responses to question Q2, related to perception of glare from oncoming vehicles.
Table A.3. Bivariate frequency distribution: Age vs. Following glare rating
Following glare rating
Age group Statistic Not
noticeable Barely
noticeable Noticeable but
acceptable Disturbing Crash or near miss
Total
Weighted Size 1842399 2143349 10343279 7638739 0 21967765 18 to 24
Sample Size 7 7 37 25 0 76
Weighted Size 1803748 2850946 18068017 8601540 270002 31594253 25 to 34
Sample Size 10 16 94 43 1 164
Weighted Size 2554046 3077828 22510358 10354634 87490 38584356 35 to 44
Sample Size 14 17 117 58 1 206
Weighted Size 1999600 2687472 18000123 10406958 18130 33112283 45 to 54
Sample Size 11 15 101 64 0 190
Weighted Size 1596738 1689228 10307519 5993286 0 19586770 55 to 64
Sample Size 10 11 64 38 0 123
Weighted Size 1564391 1335354 7443577 3513997 0 13857320 65 to 74
Sample Size 9 7 40 20 0 76
Weighted Size 948667 677948 2721257 1196800 0 5544672 75 and above
Sample Size 6 4 16 7 0 32
Weighted Size 12309590 14462125 89394129 47705953 375622 164247418 TotalSample Size 66 76 468 255 2 866
(Data source: Omnibus Survey 2002, BTS)
Table A.4. Bivariate frequency distribution: Sex vs. Following glare rating
Following glare rating
SexStatistic Not
noticeable Barely
noticeable Noticeable but
acceptable Disturbing Crash or near miss
Total
Weighted Size 7101625 8321053 46970149 21286678 80835 83760340 Male
Sample Size 35 41 229 106 1 411
Weighted Size 5286631 6290957 43203578 27155553 294787 82231505 Female
Sample Size 31 35 242 152 2 461
Weighted Size 12388255 14612010 90173727 48442231 375622 165991845 TotalSample Size 66 76 471 258 2 873
(Data source: Omnibus Survey 2002, BTS)


DOT HS 809 669January 2004
Related Documents