DRAPER ELEMENTARY SCHOOLWIDE DATA As of February, 2014-15 School Year

Draper Progress Report 3.5.15.pdf
Dec 24, 2015
Welcome message from author
This document is posted to help you gain knowledge. Please leave a comment to let me know what you think about it! Share it to your friends and learn new things together.
Transcript

DRAPER ELEMENTARY SCHOOLWIDE DATA
As of February, 2014-15 School Year

At Draper, we are striving to
change the world one lesson, one student
at a time…

Improving Our System: Highlighting Our
Implementation Priorities

Priority #1: Instructional Coherence

What is Instructional Coherence?
� Instructional framework � Prioritized standards
� Specified curriculum � Instructional strategies
� Assessments
� School culture supports and requires the use of the framework
� School resources are allocated to sustain implementation of the framework
Newman, Smith, Allensorth, & Bryk, 2001

Focused Improvement
Random Acts of Improvement Focused Improvement Adapted from Figure 2.1 from Data Analysis for Continuous School Improvement
Victoria Bernhardt (2004)
PLAN
EVALUATE
►►
►►
►►
►► IMPROVE
IMPLEMENT
Mission
Vision
Values
Standards
Goals
PLAN
EVALUATE
IMPROVE
►►
►►
►►
►►
IMPLEMENT
This is our intention

Canyons School District Academic Framework to Support Effective Instruction
July 2014 - V.6.8!
Response to Intervention (RtI)/Multi-Tiered System of Supports (MTSS) for Academics and Behavior
RtI Multi-Tiered System of Support
(1) Providing high quality core instruction (and intervention) matched to students’ needs
(2) using data over time (i.e. rate of learning, level of performance, fidelity of implementation)
(3) to make important educational decisions.
Student Achievement
Principles
• ALL CSD Students and educators are part of ONE proactive educational system.
• Evidence-based instruction and interventions are aligned with rigorous content standards.
• Data are used to guide instructional decisions, align curriculum horizontally and vertically, and allocate resources.
• CSD educators use instructionally relevant assessments that are reliable and valid.
• CSD educators problem solve collaboratively to meet student needs.
• Ongoing, targeted, quality professional development and coaching supports effective instruction for ALL students. • Leadership at all levels is vital.
Core Expectations for ALL Teachers in the Classrooms and Common Areas
Standards for
Instruction
Evidence-Based
Instructional Priorities
Time Allocation
for Instruction
Teacher Learning
Data
Student Performance
Data
Collaborative Problem
Solving for Improvement
Standards clarify what we want students to learn and do.
Techniques to increase student achievement and engagement.
Maintain a school culture in which instructional time is a highly valued resource.
Teacher learning and professional growth fostered through public practice and ongoing feedback.
Student academic and behavioral performance is assessed using a variety of reliable and valid methods.
Consistent use of Canyons’ Problem-Solving Protocol: Identify, analyze, plan, and evaluate.
Cour
se a
nd L
evel
Spe
cific
Curriculum maps with common pacing guides
Instructional content aligned with the Utah Core Standards
Scientifically research-based programs
Standards-based instruction, grading, and reporting
Classroom Positive Behavioral Interventions and Supports (PBIS)
Explicit Instruction (I, We, Ya’ll, You)
Instructional Hierarchy: Acquisition, Automaticity, Application (AAA)
Systematic Vocabulary Development
Maximizing Opportunities to Respond (OTR)
Feedback Cycle
Scaffolded Instruction & Grouping (SIG) Structures
Classroom instructional time is maximized and aligned with the standards every day of the school year, including appropriate pacing to ensure rigor and student understanding
Master schedule allocates adequate time for student learning and growth
Planning time is used to intentionally increase the application of evidence-based instructional priorities and standards for instruction
Scheduling is ensured for:
• Intervention and skill-based instruction
• Special Education services • English Language
Development (ELD)
Annual setting of goals and documentation of progress (e.g. CSIP, LANDTrust, CTESS)
Progressing on the educator continuum (emerging, implementing, and leading)
Formalized protocols and checklists to monitor and evaluate implementation
Public practice applications:
• Coaching cycles with peer coaches, teacher specialist, achievement coach, and/or new teacher coach
• Instructional Professional Learning Communities (IPLCs)
• Learning walkthroughs and targeted observations
• Lesson study • Video analysis
Formative assessment:
• Universal benchmarking and screening
• Common Formative Assessments (CFAs) administered on schedule
• Progress monitoring • Rubrics and objective
trackers • Regular checks for
understanding (e.g. daily) Summative assessment:
• College- and career-readiness assessments (e.g. ACT)
• Student Assessment of Growth and Excellence (SAGE)
• Rate of Improvement (ROI) • Student Learning Objectives
(SLOs)
Early warning system for identification of risk (academic, behavior, and attendance)
Timely and consistent review of relevant data by teams (e.g. BLT, IPLC, CST):
• Evaluate effectiveness of instruction for all groups of students using valid and reliable data (student and teacher data)
• Determine needs for supplemental and intensive instruction (additional information may be needed)
Cros
s Cu
tting
All
Clas
sroo
ms
International Society for Technology in Education Standards (ISTE)
School-wide Positive Behavioral Interventions and Supports (PBIS)
World-Class Instructional Design and Assessment (WIDA)
Federal and state requirements (IEP, 504)

Peer Observations & Feedback

Priority #2: Shared Responsibility and Commitment to
Student Learning

Teachers Make a Difference � Students assigned to 3 highly effective teachers in
a row earned as much as 50 percentile points higher on standardized tests than students who were assigned to 3 ineffective teachers
~ Sanders & Rivers, 1996
� Highly effective teachers can offset the disadvantages associated with poverty, thereby closing the achievement gap
~ Rivkin, Hanushek, & Kain, 2005

Knowing how critical
a great teacher is to
student success,
at Draper we focus on:

Public Practice Success for iPLCs relies on:
� Shared values, vision, goals
� Collaborative instructional decisions based on data to support student learning
� Professional development and application of the learning
� Humility and trust of the team individually and collectively

Team Data Reporting

School Data Wall

Shared Values, Vision, and Goals
� Professional development is more effective in changing teachers’ practices when teachers from the same grade or department and school are able to collectively engage in activities that allow them to obtain feedback about teaching and review student work in relation to the school’s reform initiative or improvement goals.
Desimone, et. al., (2002)

iPLCs: Weekly Data & Planning Meetings

Connecting the Dots � State standards for Teaching and Learning
� District goals
� School CSIP/LandTrust/BLT Action Plan Goals � Performance goals—achievement of specific outcomes
� Learning goals—strategies, processes, and procedures for achieving the specified outcome � e.g., Instructional Priorities, progress monitoring, etc.
� iPLC team goals
� Individual educator goals

Instructional Walk-Throughs (Observations)

Canyons School District Academic Framework to Support Effective Instruction
July 2014 - V.6.8!
Response to Intervention (RtI)/Multi-Tiered System of Supports (MTSS) for Academics and Behavior
RtI Multi-Tiered System of Support
(1) Providing high quality core instruction (and intervention) matched to students’ needs
(2) using data over time (i.e. rate of learning, level of performance, fidelity of implementation)
(3) to make important educational decisions.
Student Achievement
Principles
• ALL CSD Students and educators are part of ONE proactive educational system.
• Evidence-based instruction and interventions are aligned with rigorous content standards.
• Data are used to guide instructional decisions, align curriculum horizontally and vertically, and allocate resources.
• CSD educators use instructionally relevant assessments that are reliable and valid.
• CSD educators problem solve collaboratively to meet student needs.
• Ongoing, targeted, quality professional development and coaching supports effective instruction for ALL students. • Leadership at all levels is vital.
Core Expectations for ALL Teachers in the Classrooms and Common Areas
Standards for
Instruction
Evidence-Based
Instructional Priorities
Time Allocation
for Instruction
Teacher Learning
Data
Student Performance
Data
Collaborative Problem
Solving for Improvement
Standards clarify what we want students to learn and do.
Techniques to increase student achievement and engagement.
Maintain a school culture in which instructional time is a highly valued resource.
Teacher learning and professional growth fostered through public practice and ongoing feedback.
Student academic and behavioral performance is assessed using a variety of reliable and valid methods.
Consistent use of Canyons’ Problem-Solving Protocol: Identify, analyze, plan, and evaluate.
Cour
se a
nd L
evel
Spe
cific
Curriculum maps with common pacing guides
Instructional content aligned with the Utah Core Standards
Scientifically research-based programs
Standards-based instruction, grading, and reporting
Classroom Positive Behavioral Interventions and Supports (PBIS)
Explicit Instruction (I, We, Ya’ll, You)
Instructional Hierarchy: Acquisition, Automaticity, Application (AAA)
Systematic Vocabulary Development
Maximizing Opportunities to Respond (OTR)
Feedback Cycle
Scaffolded Instruction & Grouping (SIG) Structures
Classroom instructional time is maximized and aligned with the standards every day of the school year, including appropriate pacing to ensure rigor and student understanding
Master schedule allocates adequate time for student learning and growth
Planning time is used to intentionally increase the application of evidence-based instructional priorities and standards for instruction
Scheduling is ensured for:
• Intervention and skill-based instruction
• Special Education services • English Language
Development (ELD)
Annual setting of goals and documentation of progress (e.g. CSIP, LANDTrust, CTESS)
Progressing on the educator continuum (emerging, implementing, and leading)
Formalized protocols and checklists to monitor and evaluate implementation
Public practice applications:
• Coaching cycles with peer coaches, teacher specialist, achievement coach, and/or new teacher coach
• Instructional Professional Learning Communities (IPLCs)
• Learning walkthroughs and targeted observations
• Lesson study • Video analysis
Formative assessment:
• Universal benchmarking and screening
• Common Formative Assessments (CFAs) administered on schedule
• Progress monitoring • Rubrics and objective
trackers • Regular checks for
understanding (e.g. daily) Summative assessment:
• College- and career-readiness assessments (e.g. ACT)
• Student Assessment of Growth and Excellence (SAGE)
• Rate of Improvement (ROI) • Student Learning Objectives
(SLOs)
Early warning system for identification of risk (academic, behavior, and attendance)
Timely and consistent review of relevant data by teams (e.g. BLT, IPLC, CST):
• Evaluate effectiveness of instruction for all groups of students using valid and reliable data (student and teacher data)
• Determine needs for supplemental and intensive instruction (additional information may be needed)
Cros
s Cu
tting
All
Clas
sroo
ms
International Society for Technology in Education Standards (ISTE)
School-wide Positive Behavioral Interventions and Supports (PBIS)
World-Class Instructional Design and Assessment (WIDA)
Federal and state requirements (IEP, 504)

Feedback

Student Engagement
62.8%

Observed Groupings

Lessons Align with Grade Level Utah Core Standards

Learning Tasks are Aligned with Standards-Based Objectives & Follow CSD Curriculum Maps

Engagement Opportunity Occurs at a Rate Appropriate to
the Instruction Cycle

Engagement is Universal: Every Student has an Individual or
Group Opportunity to Respond

Engagement is Sufficiently Challenging & Promotes Student Thinking at Varying
Degrees of Cognitive Rigor

Clear Behavior Expectations are Followed

Classroom Routines and Arrangements are Clear &
Established

Student Behavior is Closely Monitored

Lesson is Brisk and Purposeful

Feedback (academic & behavioral)
is Specific and Clearly Understood by Students

Corrective Feedback is Non-Threatening & Promotes
Attempts

Full Feedback Sequence is Delivered
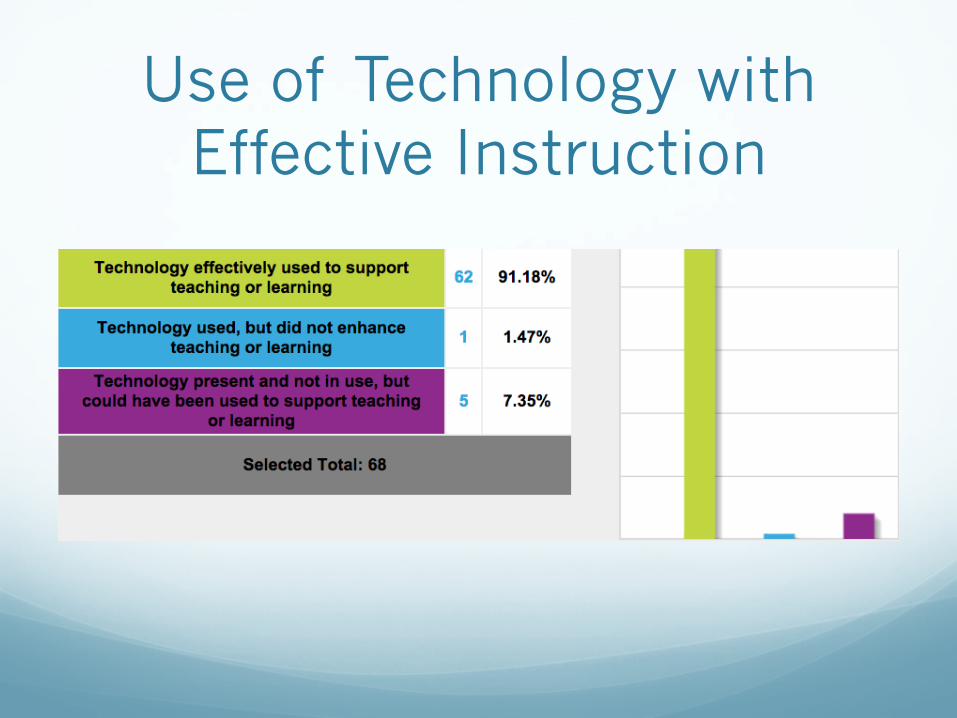
Use of Technology with Effective Instruction

2014-15 School Improvement Reading Goals
� By May of 2015, 85% of students will meet or exceed benchmark on Tests of Early Literacy (K-1) or Oral Reading Fluency (1st-5th)
� By May of 2015, 91% of 3rd-5th graders will be proficient on ELA SAGE
� By May of 2015, 91% of K-5th graders will be proficient (80% or higher) on ELA Unit tests with standardized administration.
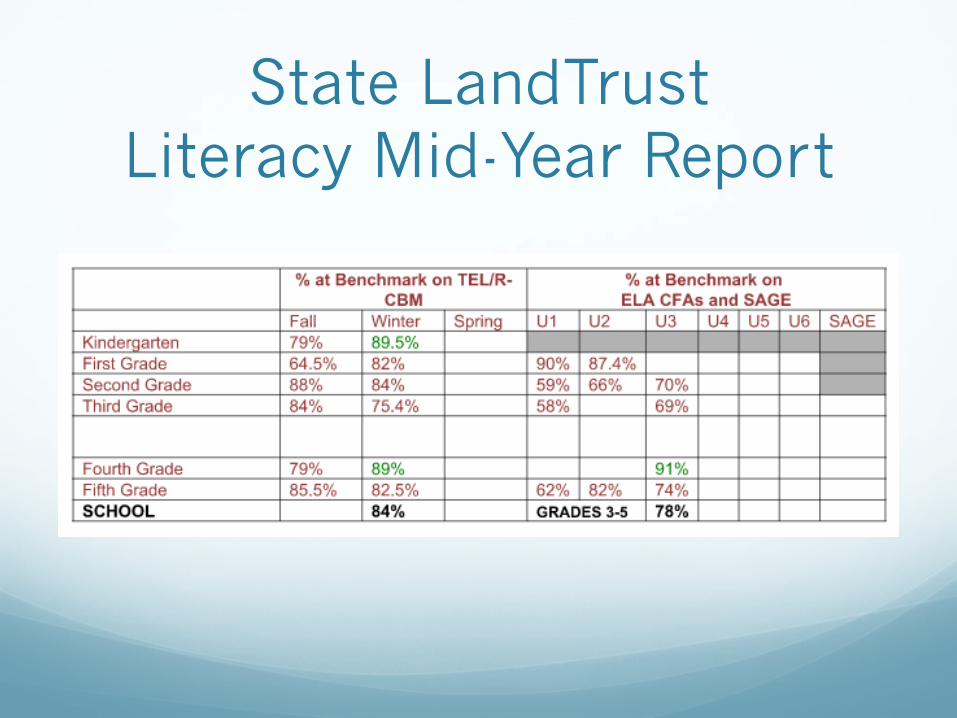
State LandTrust Literacy Mid-Year Report

Schoolwide Reading Trends
70 73 73 72 73
78 77 76 78
72 76
81
68
77 81 80
84
0
10
20
30
40
50
60
70
80
90
100
2009 F
2010 W
2010 S
2010 F
2011 W
2011 S
2011 F
2012 W
2012 S
2012 F
2013 W
2013 S
2013 F
2014 W
2014 S
2014 F
2015 W
Draper Reading CBM Data Grades K-5 2009-2015

Kindergarten Reading
Goal of 85% for Spring
Goal of 85% for Spring

1st grade Reading
+4%
+17.6%

2nd grade Reading
-4%

3rd grade Reading
-8.6%

4th grade Reading
+10%

5th grade Reading
-3%

Reading Comparative Performance Data

2014-15 Schoolwide Action Plan
Actions/Timeline Required to Meet Goal:
� Increase focus on quality core instruction with fewer interruptions/transitions/regroupings � Master schedule � Fidelity of core implementation with Reading Street � SpEd and intervention groups to be pulled during Skill-Based Small Group time
� Conduct weekly data analysis during grade level team meetings supported by principal and coach.
� General core instruction observed, coached, and supported through school-wide walk-throughs, instructional coaching, and Grade Level Team PD on a regular basis.
� Implementation of a school-wide schedule (including Specials to free up teachers) for data-analysis, problem-solving, and/or professional development weekly.
� Progress monitoring of reading CBM data by classroom teachers.

2014-15 Professional Development Plans for Reading
PD Provided to Staff for This Goal:
� Reading Street and English Language Arts PD by principal, AC, faculty, and EBL
� Aimsweb training for new teachers
� Engagement strategies, Feedback, and OTR PD
� Reading fluency PD
� Depth of Knowledge PD
� Lesson Plan writing (CTESS)

2014-15 School Improvement Math Goal
� By May of 2015, 85% of students will meet or exceed benchmark on Tests of Early Numeracy (K-1) or Math Computation Fluency (M-COMP)
� By May of 2015, 91% of 3rd-5th graders will be proficient on Math SAGE
� By May of 2015, 91% of K-5th graders will be proficient (80% or higher) on Math CFA and/or Topic tests with standardized administration.

State LandTrust Mid-Year Math Report

Schoolwide Math Trends
65
78
66 68
77 75 80 80 79
85 84 80
90 87 86
91
0
10
20
30
40
50
60
70
80
90
100
2010 W
2010 S
2010 F
2011 W
2011 S
2011 F
2012 W
2012 S
2012 F
2013 W
2013 S
2013 F
2014 W
2014 S
2014 F
2015 W
Draper Math CBM Data Grades K-5 2009-2015

Kindergarten Math
+13.3% Spring goal of80%

1st grade Math
+3.7%

2nd grade Math
-1%

3rd grade Math
+4%

4th grade Math
+15%

5th grade Math
+3.4%
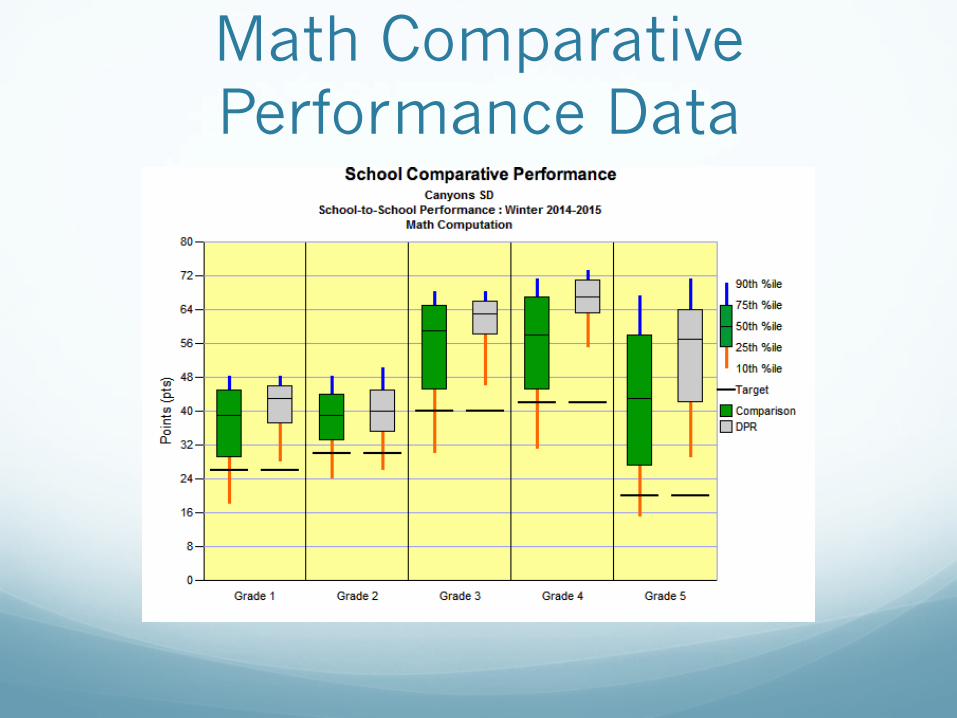
Math Comparative Performance Data
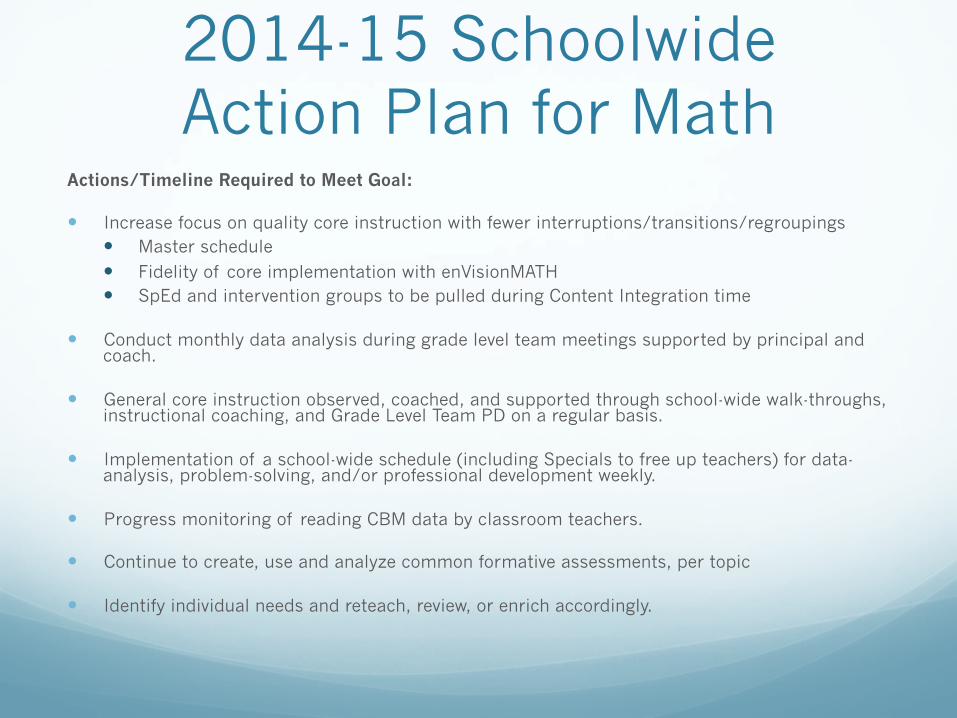
2014-15 Schoolwide Action Plan for Math
Actions/Timeline Required to Meet Goal:
� Increase focus on quality core instruction with fewer interruptions/transitions/regroupings � Master schedule
� Fidelity of core implementation with enVisionMATH � SpEd and intervention groups to be pulled during Content Integration time
� Conduct monthly data analysis during grade level team meetings supported by principal and coach.
� General core instruction observed, coached, and supported through school-wide walk-throughs, instructional coaching, and Grade Level Team PD on a regular basis.
� Implementation of a school-wide schedule (including Specials to free up teachers) for data-analysis, problem-solving, and/or professional development weekly.
� Progress monitoring of reading CBM data by classroom teachers.
� Continue to create, use and analyze common formative assessments, per topic
� Identify individual needs and reteach, review, or enrich accordingly.

2014-15 Professional Development Plan for Math
PD Provided to Staff for This Goal:
� EnVision and Math Block PD by principal, AC, faculty, and EBL
� Aimsweb training for new teachers
� Small group math instruction PD
� Reflex Math and Moby Max PD
� Lesson Planning (CTESS)

School Attendance Goal: 95%
We know from research literature that when students miss more than 10% of school days, they are at risk for academic, behavioral, and
social challenges.
When a student’s attendance falls below 90%, we often notice those challenges with
classroom content, friendships, a sense of cohesion with the class, and confidence in
grade level skills.

Schoolwide Attendance Data
93.80%
93.37%
93.82%
94.66%
93.66%
93.64%
93.83%
92.50% 93.00% 93.50% 94.00% 94.50% 95.00%
Grade K
Grade 1
Grade 2
Grade 3
Grade 4
Grade 5
SCHOOL
GRADE
LEVELS
Student Attendance % By Grade


Related Documents