DRAFT ENVIRONMENTAL IMPACT ASSESSMENT & ENVIRONMENT MANAGEMENT PLAN “B1” CATEGORY – MINOR MINERAL THIRU.V. MANIKANDAN ROUGH STONE AND GRAVEL QUARRY At S.F.Nos - 869/1 and 869/2 Extent - 2.57.5 Ha Village - Chettipalayam Taluk - Madukkarai District - Coimbatore For Obtaining Environmental Clearance under EIA Notification – 2006 Schedule Sl. No. 1 (a) (i): Mining Project NAME OF PROPOSED PROJECT PROPONENT THIRU.V. MANIKANDAN, S/o. Vellingiri, No. 55B, Mariyamman Kovil Sreet, Chettipalayam Post, Coimbatore District – 641 201 ToR obtained vide Letter No. SEIAA-TN/F.No.8553/SEAC/ToR-1010/2021 Dated:28.07.2021 Environmental Consultant GEO EXPLORATION AND MINING SOLUTIONS Old No. 260-B, New No. 17, Advaitha Ashram Road, Alagapuram, Salem – 636 004, Tamil Nadu, India Accredited for sector 1 Category ‘A’ & 38 Category ‘B’ Certificate No : NABET/EIA/1922/SA 0139 Phone: 0427-2431989, Email: [email protected], [email protected] Web: www.gemssalem.com ENVIRONMENTAL LAB Enviro-Tech Services Plot No. 1/32, South Side G.T. Road Industrial Area Ghaziabad U.P.-201001 Baseline Monitoring Season – March 2021 to May 2021 AUGUST 2021

Welcome message from author
This document is posted to help you gain knowledge. Please leave a comment to let me know what you think about it! Share it to your friends and learn new things together.
Transcript
DRAFT ENVIRONMENTAL IMPACT ASSESSMENT
&
ENVIRONMENT MANAGEMENT PLAN
“B1” CATEGORY – MINOR MINERAL
THIRU.V. MANIKANDAN ROUGH STONE AND GRAVEL QUARRY
At
S.F.Nos - 869/1 and 869/2
Extent - 2.57.5 Ha
Village - Chettipalayam
Taluk - Madukkarai
District - Coimbatore
For Obtaining
Environmental Clearance under EIA Notification – 2006 Schedule Sl. No. 1 (a) (i): Mining Project
NAME OF PROPOSED PROJECT PROPONENT
THIRU.V. MANIKANDAN, S/o. Vellingiri,
No. 55B, Mariyamman Kovil Sreet,
Chettipalayam Post,
Coimbatore District – 641 201
ToR obtained vide
Letter No. SEIAA-TN/F.No.8553/SEAC/ToR-1010/2021 Dated:28.07.2021
Environmental Consultant GEO EXPLORATION AND MINING SOLUTIONS
Old No. 260-B, New No. 17,
Advaitha Ashram Road, Alagapuram,
Salem – 636 004, Tamil Nadu, India Accredited for sector 1 Category ‘A’ & 38 Category ‘B’
Certificate No : NABET/EIA/1922/SA 0139
Phone: 0427-2431989, Email: [email protected], [email protected]
Web: www.gemssalem.com
ENVIRONMENTAL LAB
Enviro-Tech Services Plot No. 1/32, South Side G.T. Road
Industrial Area Ghaziabad U.P.-201001
Baseline Monitoring Season – March 2021 to May 2021
AUGUST 2021

i
For the easy representation the proposed quarries and existing quarries are designated as below – PROPOSED QUARRY
CODE Name of the Proponent and Address S.F.Nos ,Village & Taluk Extent in Ha Status
P1
Thiru.V. Manikandan, S/o. Vellingiri,
No.55B, Mariyamman Kovil Street,
Chettipalayam post, Coimbatore – 641 201.
869/1 & 869/2, Chettipalayam
&Madukkarai 2.57.5
Obtained ToR Vide Lr.No.SEIAA-
TN/F.No.8553/SEAC/ToR-
1010/2021 Dated: 28.07.2021
NEAREST PROPOSED QUARRY
P2
Thiru. K. Paramasivam,
S/o. Krishnasamy Gounder,
Erathotti Thottam, Karacheri,
Periyakuyilai Post, Chettipalayam Via,
Coimbatore District - 641 201.
351/2G & 351/2H, Arasampalayam &
Kinathukadavu
1.86.0
Obtained ToR vide,
Lr No.SEIAA-
TN/F.No.7780/SEAC/ToR-
812/2020 Dated:09.11.2020
P3
Thiru.R.Nataraj,
No.3/183, Karachery, Chettipalayam (via),
Kinathukadavu, Coimbatore District – 641
201
90/2(P) & 91/1A(P0), Pachapalayam & Sulur
1.34.5
Obtained ToR vide,
Lr.No. SEIAA-
TN/F.No.8034/SEAC/ToR-
893/2020 Dated:16.03.2021
P4
Thiru.K.Nataraj,
Theerthakinaru Thottam, Karacheri,
Chettipalayam via, Kinathukadavu Taluk,
Coimbatore District – 641 201
84/5A(Part), Pachapalayam &
Sulur 1.48.0
Obtained ToR vide,
Lr.No. SEIAA-
TN/F.No.8043/SEAC/ToR-
915/2020 Dated:16.03.2021
P5
Tmt.R.Baby,
W/o. R.S. Radhakrishnan, No.96/65G, Ruba
Nagar, Ramanathapuram, Coimbatore
District – 641 045
83/1C1B & 83/1C2, Pachapalayam & Sulur
1.33.0
Obtained ToR vide,
Lr.No. SEIAA-
TN/F.No.8362/SEAC/ToR-
981/2021 Dated: 05.07.2021
P6
Thiru.M.Ramasamy,
S/o. Mariyagounder, Kalavaithottam,
Thegani, Periyakuyili Post,
Coimbatore District – 641 201
80/1E1, 80/1E2 & 80/1E4, Pachapalayam & Sulur
1.37.0
Obtained ToR Vide Lr.No.SEIAA-
TN/F.No.8297/SEAC/ToR-
958/2020 Dated: 03.05.2021
P7
Thiru.K.M.Subramaniyam,
S/o.A.Muthusamy, no.46/3, P.K.P.Layout,
R.S.Puram, Coimbatore District – 641 002
94/1A, 94/9A & 94/10A, Pachapalayam & Sulur
1.45.0 Subject area Precise area
communication
P8
Thiru.M.Anandha Prabhu
S/o. Marimuthu,
No. 3/226A, Karachery, Kinathukadavu,
Coimbatore – 641 201
90/3A, 3B, 91/1B1, 1B2,1B3,
1C, 2A & 91/2B, Pachapalayam
& Sulur
1.41.5
Obtained ToR Vide Lr.No.SEIAA-
TN/F.No.8631/SEAC/ToR-
1026/2021 Dated: 26.08.2021
P9
Thiru.A.Palanisamy
S/o. Appachi Gounder,
Near Idumban Kovil, Thekani Via,
Pachapalayam, Sulur Taluk,
Coimbatore District – 641 201
85/2B(Part), Pachapalayam &
Sulur 1.32.0 Precise area communicated
P10
Thiru.C.Palanisamy,
3/84, Periyakuli Post,
Karachery, Coimbatore – 641 201
82/2A(P) & 80/2B, Pachapalayam & Sulur
1.75.5 Application Processed
P11
Thiru.B.Kandasamy Gounder,
S/o. Arusamy Gounder,
Periya Thottam, Periyakuli Post,
Karachery, Coimbatore – 641 201
349/3(P), Pachapalayam &
Sulur 0.44.0 Application Processed
P12
Thiru.M.Visuvanathan
S/o. Myilsamy Gounder,
West Thottam, Karachery,
Chettipalayam (via), Coimbatore
360/1A5, 360/1A6, Arasampalayam &
Kinathukadavu
1.00.5 Precise area communicated
P13
Thiru.M.Loganathan
S/o. Myilsamy Gounder,
West Thottam, Karachery,
Chettipalayam (via), Coimbatore
360/1A1(P), 360/1A2(P),
360/1A3, Arasampalayam &
Kinathukadavu
0.78.5 Application Processed
TOTAL 18.13.0 Ha

ii
EXISTING QUARRIES
CODE Name of the Proponent and Address S.F.Nos Extent in Ha Lease Period
E1 Thiru.M.Rajamani 361/1A & 362/1 0.99.0 01.06.2016 to 31.05.2021
E2 Thiru.K.Ravikumar 355/2A(P), 355/2C(P) &
355/2D1(P) 1.93.5 02.06.2016 to 01.06.2021
E3 Thiru.A.Dharmaraj 94/2C 0.46.0 15.09.2016 to 14.09.2021
E4 Thiru.C.Ganesan 151/1E(P) 1.58.0 15.09.2016 to 14.09.2021
E5 Thiru.T.Pushparaj 90/4, 90/1D, 90/1C & 90/2D 1.14.0 17.09.2016 to 16.09.2021
E6 Thiru.M.Sundarraj 92/1 1.14.5 17.09.2016 to 16.09.2021
E7 Tmt.C.Maragatham 92/3, 93/4, 93/1A, 93/1B,
93/2A, 110/3 & 110/4 5.98.0 17.09.2016 to 16.09.2021
E8 Thiru.V.Somasundaram 360/1B(P) & 360/1C(P) 0.90.0 17.09.2026 to 16.09.2021
E9 Thiru.S.Kalimuthu 364 3.85.5 17.09.2016 to 16.09.2021
E10 Thiru.V.Ganapathy Gounder 89/2(P) 1.54.0 23.09.2016 to 22.09.2021
E11 Thiru.V.Mohandass 82/3 & 80/1C1 3.24.5 07.03.2017 to 06.03.2022
E12 Tvl.KNR Construction Pvt Ltd 89/1 & 89/2(P) 1.28.8 01.08.2017 to 31.07.2022
E13 Thiru.S.Arunachalam 83/1C1A 1.33.0 13.04.2018 to 12.04.2023
E14 Thiru.R.Chinnasamy 83/1A(P) & 83/2(P) 1.73.0 13.04.2018 to 12.04.2023
E15 Thiru.R.Senthilkumar 94/6B, 94/7(P), 94/12, 94/13 &
94/1/ 2.07.0 13.04.2018 to 12.04.2023
E16 Thiru.S.Ganesan 94/4, 94/6A & 94/8A 1.43.5 13.04.2018 to 12.04.2024
E17 Thiru.A.Thanikasalam 101/2 1.21.5 25.01.2019 to 24.01.2024
TOTAL 31.83.8Ha
TOTAL CLUSTER EXTENT 49.96.8 Ha
Note:-
• Cluster area is calculated as per MoEF & CC Notification – S.O. 2269 (E) Dated: 01.07.2016
As per above notification S.O.2269(E) dated : 01.07.2016 in para (b) in Appendix XI,- (ii)(5): The lease not
operative for three years or more and leases which have got environmental clearance as on 15th January, 2016 shall
not be counted for calculating the area of cluster, but shall be included in the Environment Management Plan and the
Regional Environmental Management Plan”

i | P a g e
TERMS OF REFERENCE (ToR) COMPLIANCE
P1 – Thiru.V. Manikandan
“ToR issued vide Letter No. SEIAA-TN/F.No. 8553/SEAC/ToR-1010/2021 Dated:28.07.2021
ADDITIONAL STUDIES
1 Restricting the maximum depth of mining from 42m to
37m considering the Environment impacts due to the
mining, safety of the working personnel and following
the principle of the sustainable mining and consequent
the maximum minable quantities of 348355cu.m of
Rough stone & 34746cu.m of Gravel are permitted for
mining over five years.
Agreed and noted
2 A bench height of 5m needs to be maintained as per the
approved mining plan considering the hydro geological
regime of the surrounding area as well as for safe
mining.
Agreed and noted
3 There are many water bodies present within 500m and
1km and hence impact study shall be conducted
considering those water bodies.
Details of water bodies present within the buffer
zone are given in Chapter:3, Page.No:34
4 The cumulative impact analysis due to emission from
the source and the fugitive emission due to mining as
well as transport of minerals needs to be assessed and
the report may be submitted.
Air Quality Modelling for prediction of
incremental GLC’s of pollutant was carried out
using AERMOD view 9.6.1 Model.
Details in Chapter No. 4, Page No. 85
5 During EIA presentation the maximum depth in
adjacent mines should be given. Considering the data on
all cluster mines the impact study shall be conducted.
Ultimate pit dimensions of the proposed quarries
are listed in Chapter: 11, Page.no: 151
6 The project Proponent shall furnish the contour map of
the water table detailing the number of well located
around the site and its impacts on the wells due to
mining activity
Contour map of the water table showing nearby
wells around the project site is provided in figure
no:Chapter no:3, pg.no:43-48
7 The Project proponent shall conduct the hydro –
geological study to evaluate the impact of proposed
mining activity on the ground water table, agriculture
activity, and water bodies such as rivers, tanks canals,
ponds etc., located nearby the proposed mining area.
The proponent shall furnish the detail on number of
ground water pumping wells, open wells within the
radius of 1km along with the water levels in both
monsoon and Non-monsoon seasons. The proponent
would also collect the data of water table level from the
PWD/TWAD in this area during both monsoon and
non-monsoon seasons
Hydrogeological study was carried out in the core
and buffer zone. The result and impacts of mining
activity on ground water are discussed in chapter
no: 3, Pg.No:43
Detail on number of ground water pumping
wells, open wells within the radius of 1km along
with the water levels in both monsoon and Non-
monsoon seasons is provided in chapter no:3,
pg.no:43
8 The proponent shall carry out the cumulative impact
study on the agriculture area due to Mining, Crushers
and other activities around the site area
The details of agriculture activity and livelihood
of the people in the study area are studied and
discussed under chapter No.3. pg.no:80
9 The details of surrounding well and the assessment of
cumulative impact on the groundwater due to mining
shall be the part of EIA study.
Cumulative impact of ground water is discussed
in chapter no:3, Pg.no:39.
10 The socio economic impact study should be carried out
within 10km of the buffer zone from the mines.
Socio-Economic Studies were carried out
covering 10km radius from the periphery of the
project area and identified 37 villages.
The details are discussed in Chapter No.3, Page
No. 80.
11 A tree survey study shall be carried out (number, variety Agreed and noted

ii | P a g e
name of the species, age etc.,) in the mining lease
applied area and its management during mining activity.
12 CER activities should be furnished taking into
consideration the requirement of the local habitants
available within the buffer zone as per Office
memorandum of MoEF & CC
CER of about Rs. 2,06,200/- is being proposed to
carry out developmental activities in the village.
13 A detailed Mine- Closure plan for the proposed project
shall be submitted.
Mine- Closure plan for the proposed project is
discussed in chapter no:4 .Pg.no:99
14 A detailed report on the safety and health aspects of the
workers and for the surrounding habitations during
operation of mining for drilling and blasting shall be
submitted
Standard Operating Procedures as per DGMS for
Safety and Health aspects of the workers and for
surrounding habitants during mining operations is
to be followed. The details are discussed under
Chapter No.10, Page No.146
15 The recommendation for the issue of Terms of
Reference is subject to the final outcome of the Hon’ble
NGT, Principal bench, New Delhi in O.A.No.186 of
2016 (M.A.No. 350/2016) and
O.A.No.200/2016andO.A.No.580/2016(M.A.No.1182/2
016)And O.A. No. 404/2016 (M.A.No758/2016,
M.A.No 920/2016, M.A.No. 1122/2016,
M.A.No.12/2017 &M.A.No. 843/2017) and O.A.No
405/2016 and O.A.No 520 of 2016 (M.A.No. 981/2016,
M.A.No.982/2016 &M.A.No. 384/2017)
Noted and agreed
16 A detailed study of the lithology of the mining lease
area shall be furnished.
The Lithology of the miming lease area is
furnished in chapter no:2 pg.no: 17
17 The Project Proponent shall furnish the details of the
existing green belt area earmarked with GPS
coordinates and list of trees planted with a copy of
photos/documents and be included in the EIA report
The number of trees (name of the species, age)
present in the mining lease applied area and its
maintenance is discussed under green-belt
development provided in Chapter No:4 ,Pg.no:94
ADDITIONAL CONDITIONS
1 As per the MoEF & CC office memorandum F.No.22-
65/2017-IA.III dated 30.09.2020 and 20.10.2020 the
proponent shall address the concerns raised during the
public consultation and all the activities proposed shall
be part of the Environment Management plan.
The issues raised during public hearing will be
addressed in Final EIA EMP Report
STANDARD TERMS OF REFERENCE
1 Year-wise production details since 1994 should be
given, clearly stating the highest production achieved in
any one year prior to 1994. It may also be categorically
informed whether there had been any increase in
production after the EIA Notification 1994 came into
force, w.r.t. the highest production achieved prior to
1994.
Not applicable.
2 A copy of the document in support of the fact that the
Proponent is the rightful lessee of the mine should be
given.
The applied land for quarrying is patta land
owned by Project Proponent. Patta copy, other
land documents are enclosed as Annexure
Volume 1
3 All documents including approved mine plan, EIA and
Public Hearing should be compatible with one another
in terms of the mine lease area, production levels, waste
generation and its management, mining technology etc.
and should be in the name of the lessee.
Noted & agreed.
4 All corner coordinates of the mine lease area,
superimposed on a High Resolution Imagery/ toposheet,
Map showing –
Project area is with adjacent quarries details is

iii | P a g e
topographic sheet, geomorphology and geology of the
area should be provided. Such an Imagery of the
proposed area should clearly show the land use and
other ecological features of the study area (core and
buffer zone).
enclosed in Figure No1.1 page No. 2
Project area boundary coordinates superimposed
on Toposheet – Figure No. 1.1A, Page No. 5
Toposheet of the project area covering 10km
radius – Figure No. 1.2, Page No. 6
Geology map of the project area covering 10km
radius - Figure No. 2.11, Page No. 21
5 Information should be provided in Survey of India
Toposheet in 1:50,000 scale indicating geological map
of the area, geomorphology of land forms of the area,
existing minerals and mining history of the area,
important water bodies, streams and rivers and soil
characteristics.
Geology map of the project area covering 10km
radius - Figure No. 2.11, Page No. 21
Geomorphological features are incorporated in
the Toposheet map covering 10km radius around
the project area Figure No. 2.12, Page No. 22
6 Details about the land proposed for mining activities
should be given with information as to whether mining
conforms to the land use policy of the State; land
diversion for mining should have approval from State
land use board or the concerned authority.
The applied area was inspected by the officers of
Department of Geology along with revenue
officials and found that the land is fit for
quarrying under the policy of State Government.
7 It should be clearly stated whether the proponent
Company has a well laid down Environment Policy
approved by its Board of Directors? If so, it may be
spelt out in the EIA Report with description of the
prescribed operating process/procedures to bring into
focus any infringement/deviation/ violation of the
environmental or forest norms/conditions? The
hierarchical system or administrative order of the
Company to deal with the environmental issues and for
ensuring compliance with the EC conditions may also
be given. The system of reporting of non-compliances /
violations of environmental norms to the Board of
Directors of the Company and/or shareholders or
stakeholders at large, may also be detailed in the EIA
Report.
The proponent has framed its Environmental
Policy and the same is discussed in the Chapter
No 10, Page No 141
8 Issues relating to Mine Safety, including subsidence
study in case of underground mining and slope study in
case of open cast mining, blasting study etc. should be
detailed. The proposed safeguard measures in each case
should also be provided.
It is an opencast quarrying operation proposed to
operate in Mechanized method.
9 The study area will comprise of 10 km zone around the
mine lease from lease periphery and the data contained
in the EIA such as waste generation etc., should be for
the life of the mine / lease period.
Noted & agreed.
10 Land use of the study area delineating forest area,
agricultural land, grazing land, wildlife sanctuary,
national park, migratory routes of fauna, water bodies,
human settlements and other ecological features should
be indicated. Land use plan of the mine lease area
should be prepared to encompass preoperational,
operational and post operational phases and submitted.
Impact, if any, of change of land use should be given.
Land use and land cover of the study area is
discussed in Chapter No. 3, Page No. 31.
11 Details of the land for any Over Burden Dumps outside
the mine lease, such as extent of land area, distance
from mine lease, its land use, R&R issues, if any,
should be given
Not Applicable.
12 A Certificate from the Competent Authority in the State Not Applicable.
iv | P a g e
Forest Department should be provided, confirming the
involvement of forest land, if any, in the project area. In
the event of any contrary claim by the Project Proponent
regarding the status of forests, the site may be inspected
by the State Forest Department along with the Regional
Office of the Ministry to ascertain the status of forests,
based on which, the Certificate in this regard as
mentioned above be issued. In all such cases, it would
be desirable for representative of the State Forest
Department to assist the Expert Appraisal Committees.
13 Status of forestry clearance for the broken up area and
virgin forestland involved in the Project including
deposition of net present value (NPV) and
compensatory afforestation (CA) should be indicated. A
copy of the forestry clearance should also be furnished.
Not Applicable.
14 Implementation status of recognition of forest rights
under the Scheduled Tribes and other Traditional Forest
Dwellers (Recognition of Forest Rights) Act, 2006
should be indicated.
Not Applicable.
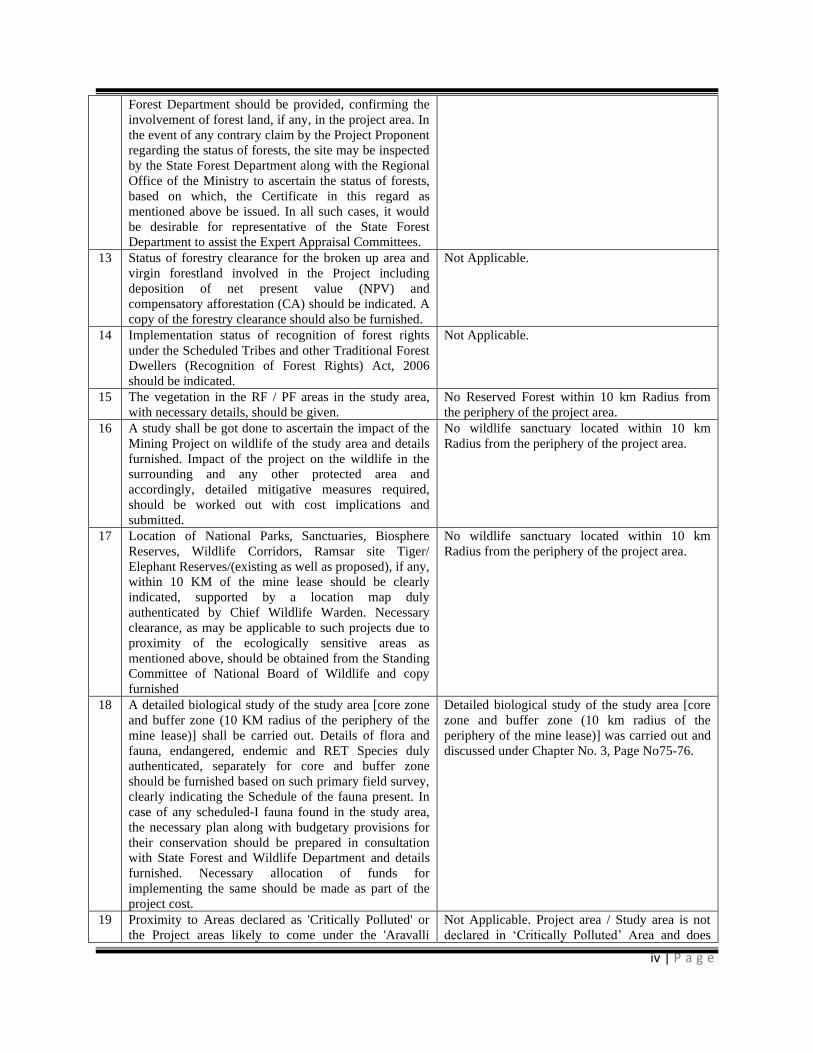
15 The vegetation in the RF / PF areas in the study area,
with necessary details, should be given.
No Reserved Forest within 10 km Radius from
the periphery of the project area.
16 A study shall be got done to ascertain the impact of the
Mining Project on wildlife of the study area and details
furnished. Impact of the project on the wildlife in the
surrounding and any other protected area and
accordingly, detailed mitigative measures required,
should be worked out with cost implications and
submitted.
No wildlife sanctuary located within 10 km
Radius from the periphery of the project area.
17 Location of National Parks, Sanctuaries, Biosphere
Reserves, Wildlife Corridors, Ramsar site Tiger/
Elephant Reserves/(existing as well as proposed), if any,
within 10 KM of the mine lease should be clearly
indicated, supported by a location map duly
authenticated by Chief Wildlife Warden. Necessary
clearance, as may be applicable to such projects due to
proximity of the ecologically sensitive areas as
mentioned above, should be obtained from the Standing
Committee of National Board of Wildlife and copy
furnished
No wildlife sanctuary located within 10 km
Radius from the periphery of the project area.
18 A detailed biological study of the study area [core zone
and buffer zone (10 KM radius of the periphery of the
mine lease)] shall be carried out. Details of flora and
fauna, endangered, endemic and RET Species duly
authenticated, separately for core and buffer zone
should be furnished based on such primary field survey,
clearly indicating the Schedule of the fauna present. In
case of any scheduled-I fauna found in the study area,
the necessary plan along with budgetary provisions for
their conservation should be prepared in consultation
with State Forest and Wildlife Department and details
furnished. Necessary allocation of funds for
implementing the same should be made as part of the
project cost.
Detailed biological study of the study area [core
zone and buffer zone (10 km radius of the
periphery of the mine lease)] was carried out and
discussed under Chapter No. 3, Page No75-76.
19 Proximity to Areas declared as 'Critically Polluted' or
the Project areas likely to come under the 'Aravalli
Not Applicable. Project area / Study area is not
declared in ‘Critically Polluted’ Area and does

v | P a g e
Range', (attracting court restrictions for mining
operations), should also be indicated and where so
required, clearance certifications from the prescribed
Authorities, such as the SPCB or State Mining
Department should be secured and furnished to the
effect that the proposed mining activities could be
considered.
not come under ‘Aravalli Range.
20 Similarly, for coastal Projects, A CRZ map duly
authenticated by one of the authorized agencies
demarcating LTL. HTL, CRZ area, location of the mine
lease w.r.t CRZ, coastal features such as mangroves, if
any, should be furnished. (Note: The Mining Projects
falling under CRZ would also need to obtain approval
of the concerned Coastal Zone Management Authority).
Not Applicable. The project doesn't attract the
C.R.Z. Notification, 2018.
21 R&R Plan/compensation details for the Project Affected
People (PAP) should be furnished. While preparing the
R&R Plan, the relevant State/National Rehabilitation &
Resettlement Policy should be kept in view. In respect
of SCs /STs and other weaker sections of the society in
the study area, a need based sample survey, family-
wise, should be undertaken to assess their requirements,
and action programmes prepared and submitted
accordingly, integrating the sectoral programmes of line
departments of the State Government. It may be clearly
brought out whether the village(s) located in the mine
lease area will be shifted or not. The issues relating to
shifting of village(s) including their R&R and socio-
economic aspects should be discussed in the Report.
The proposed project area is devoid of major
cultivations and there are no habitations within a
radius of 300 meters.
22 One season (non-monsoon) [i.e. March-May (Summer
Season); October-December (post monsoon season) ;
December-February (winter season)]primary baseline
data on ambient air quality as per
CPCB Notification of 2009, water quality, noise level,
soil and flora and fauna shall be collected and the AAQ
and other data so compiled presented date-wise in the
EIA and EMP Report. Site-specific meteorological data
should also be collected. The location of the monitoring
stations should be such as to represent whole of the
study area and justified keeping in view the pre-
dominant downwind direction and location of sensitive
receptors. There should be at least one monitoring
station within 500 m of the mine lease in the pre-
dominant downwind direction. The mineralogical
composition of PM10, particularly for free silica, should
be given.
Baseline Data were collected for One Season
March - May 2021 as per CPCB Notification and
MoEF & CC Guidelines.
Details in Chapter No. 3, Page No.31 - 74.
23 Air quality modelling should be carried out for
prediction of impact of the project on the air quality of
the area. It should also take into account the impact of
movement of vehicles for transportation of mineral. The
details of the model used and input parameters used for
modelling should be provided. The air quality contours
may be shown on a location map clearly indicating the
location of the site, location of sensitive receptors, if
any, and the habitation. The wind roses showing pre-
dominant wind direction may also be indicated on the
Air Quality Modelling for prediction of
incremental GLC’s of pollutant was carried out
using AERMOD view 9.6.1 Model.

vi | P a g e
map.
24 The water requirement for the Project, its availability
and source should be furnished. A detailed water
balance should also be provided. Fresh water
requirement for the Project should be indicated.
Total Water Requirement for this project is given
in the chapter No 2, Table No 2.13, Page No 27
25 Necessary clearance from the Competent Authority for
drawl of requisite quantity of water for the Project
should be provided.
Water for dust suppression, greenbelt
development and domestic use will be sourced
from accumulated rainwater/seepage water in
mine pits.
26 Description of water conservation measures proposed to
be adopted in the Project should be given. Details of
rainwater harvesting proposed in the Project, if any,
should be provided.
The rain water collected in the pits after spell of
rain will be used for greenbelt development and
dust suppression.
27 Impact of the Project on the water quality, both surface
and groundwater, should be assessed and necessary
safeguard measures, if any required, should be
provided.
Impact Studies and Mitigation Measures of Water
Quality discussed in Chapter 4, Page No. 84.
28 Based on actual monitored data, it may clearly be
shown whether working will intersect groundwater.
Necessary data and documentation in this regard may be
provided. In case the working will intersect
groundwater table, a detailed Hydro Geological Study
should be undertaken and Report furnished. The Report
inter-alia, shall include details of the aquifers present
and impact of mining activities on these aquifers.
Necessary permission from Central Ground Water
Authority for working below ground water and for
pumping of ground water should also be obtained and
copy furnished.
The ground water table inferred 60-65m below
ground level.
29 Details of any stream, seasonal or otherwise, passing
through the lease area and modification / diversion
proposed, if any, and the impact of the same on the
hydrology should be brought out.
There is no stream, seasonal or other water bodies
passing within the project area. Therefore no
modification/ diversion of water bodies is
anticipated.
30 Information on site elevation, working depth,
groundwater table etc. Should be provided both in
AMSL and BGL. A schematic diagram may also be
provided for the same.
Highest elevation of the project area is 172m
AMSL.
Ultimate depth of the mine is 45 m BGL.
Water level of the area is 60-65m BGL
31 A time bound Progressive Greenbelt Development Plan
shall be prepared in a tabular form (indicating the linear
and quantitative coverage, plant species and time frame)
and submitted, keeping in mind, the same will have to
be executed up front on commencement of the Project.
Phase-wise plan of plantation and compensatory
afforestation should be charted clearly indicating the
area to be covered under plantation and the species to be
planted. The details of plantation already done should
be given. The plant species selected for green belt
should have greater ecological value and should be of
good utility value to the local population with emphasis
on local and native species and the species which are
tolerant to pollution.
Recommended Species proposed for Greenbelt
Development are given in the Chapter 4, Page
No.94.

vii | P a g e
32 Impact on local transport infrastructure due to the
Project should be indicated. Projected increase in truck
traffic as a result of the Project in the present road
network (including those outside the Project area)
should be worked out, indicating whether it is capable
of handling the incremental load. Arrangement for
improving the infrastructure, if contemplated (including
action to be taken by other agencies such as State
Government) should be covered. Project Proponent
shall conduct Impact of Transportation study as per
Indian Road Congress Guidelines.
Traffic density survey was carried out to analyse
the impact of Transportation in the study area as
per IRC guidelines 1961 and it is inferred that
there is no significant impact due to the proposed
transportation from the project area. Details in
Chapter 2, Page No.25
33 Details of the onsite shelter and facilities to be provided
to the mine workers should be included in the EIA
Report.
Infrastructure & other facilities will be provided
to the Mine Workers after the grant of quarry
lease and the same has been discussed in the
Chapter No. 2 Page No. 26.
34 Conceptual post mining land use and Reclamation and
Restoration of mined out areas (with plans and with
adequate number of sections) should be given in the
EIA report.
The details of conceptual plan is discussed in
Approved Mining Plan enclosed as Annexure
Volume 1
35 Occupational Health impacts of the Project should be
anticipated and the proposed preventive measures spelt
out in detail. Details of pre-placement medical
examination and periodical medical examination
schedules should be incorporated in the EMP. The
project specific occupational health mitigation measures
with required facilities proposed in the mining area may
be detailed.
Details in Chapter 4, Page No. 99.
36 Public health implications of the Project and related
activities for the population in the impact zone should
be systematically evaluated and the proposed remedial
measures should be detailed along with budgetary
allocations.
Details in Chapter 8, Page No. 137.
37 Measures of socio economic significance and influence
to the local community proposed to be provided by the
Project Proponent should be indicated. As far as
possible, quantitative dimensions may be given with
time frames for implementation.
Details in Chapter-7 , Page No.134
38 Detailed environmental management plan (EMP) to
mitigate the environmental impacts which, should inter-
alia include the impacts of change of land use, loss of
agricultural and grazing land, if any, occupational health
impacts besides other impacts specific to the proposed
Project.
Environment Management Plan Chapter 10, Page
No. 141-149
39 Public Hearing points raised and commitment of the
Project Proponent on the same along with time bound
Action Plan with budgetary provisions to implement the
same should be provided and also incorporated in the
final EIA/EMP Report of the Project.
The outcome of public hearing will be updated in
the final EIA/AMP report
40 Details of litigation pending against the project, if any,
with direction /order passed by any Court of Law
against the Project should be given.
No litigation is pending in any court against this
project.
41 The cost of the Project (capital cost and recurring cost)
as well as the cost towards implementation of EMP
should be clearly spelt out.
The project cost and EMP cost are detailed in
Chapter 2, Page No. 28
viii | P a g e
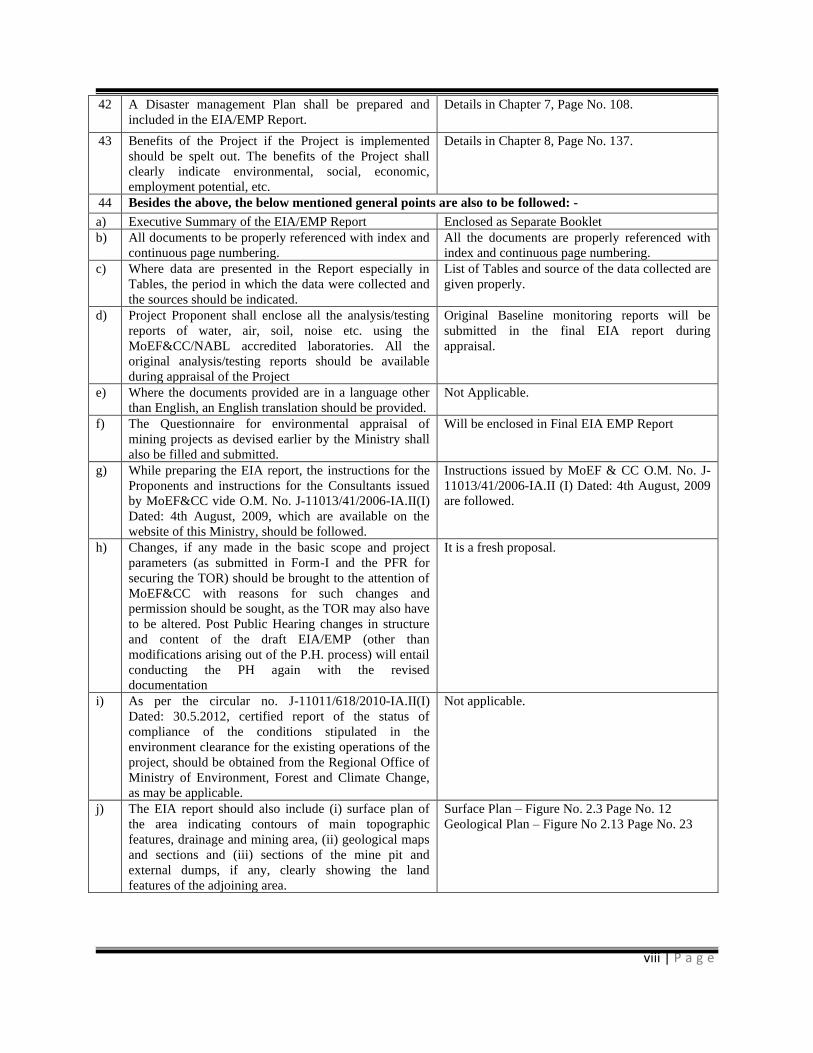
42 A Disaster management Plan shall be prepared and
included in the EIA/EMP Report.
Details in Chapter 7, Page No. 108.
43 Benefits of the Project if the Project is implemented
should be spelt out. The benefits of the Project shall
clearly indicate environmental, social, economic,
employment potential, etc.
Details in Chapter 8, Page No. 137.
44 Besides the above, the below mentioned general points are also to be followed: -
a) Executive Summary of the EIA/EMP Report Enclosed as Separate Booklet
b) All documents to be properly referenced with index and
continuous page numbering.
All the documents are properly referenced with
index and continuous page numbering.
c) Where data are presented in the Report especially in
Tables, the period in which the data were collected and
the sources should be indicated.
List of Tables and source of the data collected are
given properly.
d) Project Proponent shall enclose all the analysis/testing
reports of water, air, soil, noise etc. using the
MoEF&CC/NABL accredited laboratories. All the
original analysis/testing reports should be available
during appraisal of the Project
Original Baseline monitoring reports will be
submitted in the final EIA report during
appraisal.
e) Where the documents provided are in a language other
than English, an English translation should be provided.
Not Applicable.
f) The Questionnaire for environmental appraisal of
mining projects as devised earlier by the Ministry shall
also be filled and submitted.
Will be enclosed in Final EIA EMP Report
g) While preparing the EIA report, the instructions for the
Proponents and instructions for the Consultants issued
by MoEF&CC vide O.M. No. J-11013/41/2006-IA.II(I)
Dated: 4th August, 2009, which are available on the
website of this Ministry, should be followed.
Instructions issued by MoEF & CC O.M. No. J-
11013/41/2006-IA.II (I) Dated: 4th August, 2009
are followed.
h) Changes, if any made in the basic scope and project
parameters (as submitted in Form-I and the PFR for
securing the TOR) should be brought to the attention of
MoEF&CC with reasons for such changes and
permission should be sought, as the TOR may also have
to be altered. Post Public Hearing changes in structure
and content of the draft EIA/EMP (other than
modifications arising out of the P.H. process) will entail
conducting the PH again with the revised
documentation
It is a fresh proposal.
i) As per the circular no. J-11011/618/2010-IA.II(I)
Dated: 30.5.2012, certified report of the status of
compliance of the conditions stipulated in the
environment clearance for the existing operations of the
project, should be obtained from the Regional Office of
Ministry of Environment, Forest and Climate Change,
as may be applicable.
Not applicable.
j) The EIA report should also include (i) surface plan of
the area indicating contours of main topographic
features, drainage and mining area, (ii) geological maps
and sections and (iii) sections of the mine pit and
external dumps, if any, clearly showing the land
features of the adjoining area.
Surface Plan – Figure No. 2.3 Page No. 12
Geological Plan – Figure No 2.13 Page No. 23
ix | P a g e
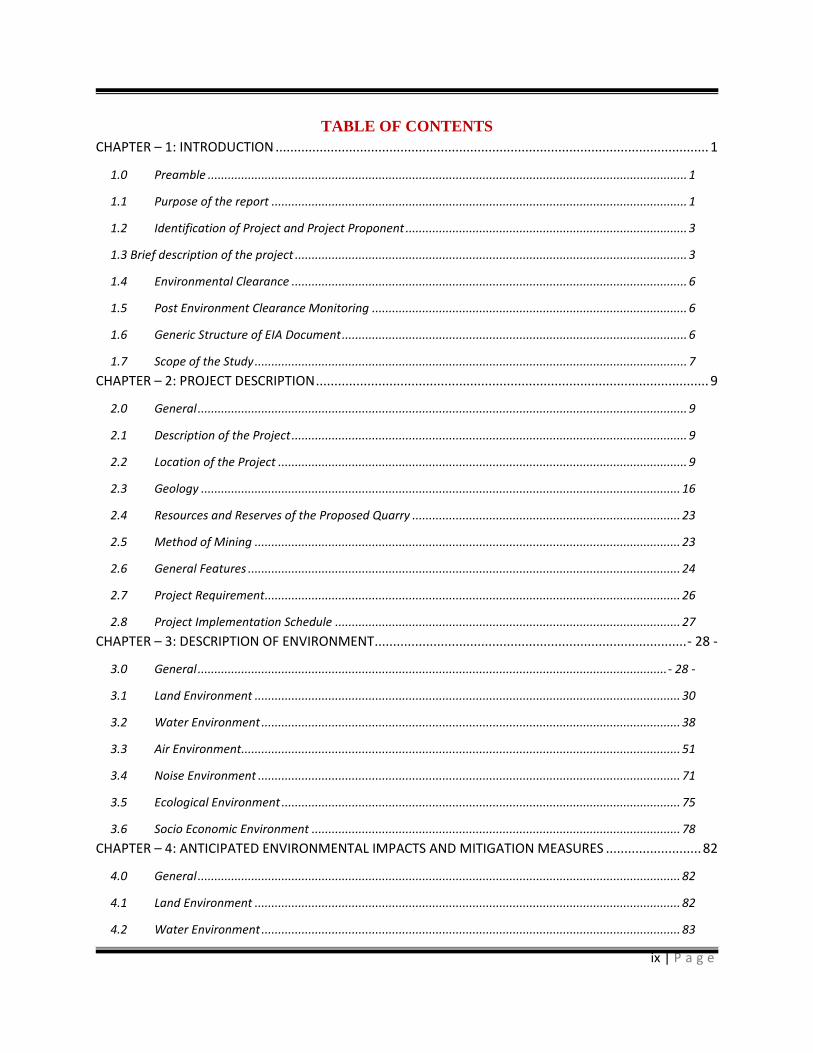
TABLE OF CONTENTS
CHAPTER – 1: INTRODUCTION ...................................................................................................................... 1
1.0 Preamble ............................................................................................................................................... 1
1.1 Purpose of the report ............................................................................................................................ 1
1.2 Identification of Project and Project Proponent .................................................................................... 3
1.3 Brief description of the project ..................................................................................................................... 3
1.4 Environmental Clearance ...................................................................................................................... 6
1.5 Post Environment Clearance Monitoring .............................................................................................. 6
1.6 Generic Structure of EIA Document ....................................................................................................... 6
1.7 Scope of the Study ................................................................................................................................. 7
CHAPTER – 2: PROJECT DESCRIPTION ........................................................................................................... 9
2.0 General .................................................................................................................................................. 9
2.1 Description of the Project ...................................................................................................................... 9
2.2 Location of the Project .......................................................................................................................... 9
2.3 Geology ............................................................................................................................................... 16
2.4 Resources and Reserves of the Proposed Quarry ................................................................................ 23
2.5 Method of Mining ............................................................................................................................... 23
2.6 General Features ................................................................................................................................. 24
2.7 Project Requirement ............................................................................................................................ 26
2.8 Project Implementation Schedule ....................................................................................................... 27
CHAPTER – 3: DESCRIPTION OF ENVIRONMENT ..................................................................................... - 28 -
3.0 General ............................................................................................................................................ - 28 -
3.1 Land Environment ............................................................................................................................... 30
3.2 Water Environment ............................................................................................................................. 38
3.3 Air Environment................................................................................................................................... 51
3.4 Noise Environment .............................................................................................................................. 71
3.5 Ecological Environment ....................................................................................................................... 75
3.6 Socio Economic Environment .............................................................................................................. 78
CHAPTER – 4: ANTICIPATED ENVIRONMENTAL IMPACTS AND MITIGATION MEASURES .......................... 82
4.0 General ................................................................................................................................................ 82
4.1 Land Environment ............................................................................................................................... 82
4.2 Water Environment ............................................................................................................................. 83
x | P a g e
4.3 Air Environment................................................................................................................................... 84
4.4 Noise Environment (Impact & Mitigation Measures) .......................................................................... 91
4.5 Ecology and Biodiversity ..................................................................................................................... 94
4.6 Socio Economic .................................................................................................................................... 98
4.7 Occupational Health and Safety .......................................................................................................... 98
4.8 Mine Waste Management .................................................................................................................. 99
4.9 Mine Closure ....................................................................................................................................... 99
CHAPTER – 5: ANALYSIS OF ALTERNATIVES (TECHNOLOGY AND SITE) .................................................... 101
5.0 Introduction: ...................................................................................................................................... 101
5.1 Factors Behind the Selection of Project Site ............................................................................................. 101
5.2 Analysis of Alternative Site ................................................................................................................ 101
5.3 Factors Behind Selection of Proposed Technology ................................................................................... 101
5.4 Analysis of Alternative Technology ................................................................................................... 101
CHAPTER – 6: ENVIRONMENTAL MONITORING PROGRAMME ................................................................ 102
6.0 General .............................................................................................................................................. 102
6.1 Methodology of Monitoring Mechanism .......................................................................................... 102
6.2 Implementation Schedule of Mitigation Measures ........................................................................... 103
6.3 Monitoring Schedule and Frequency ................................................................................................. 103
6.4 Environmental Policy of the Proponents ........................................................................................... 104
6.5 Budgetary Provision for Environmental Monitoring Programme ..................................................... 104
6.6 Reporting Schedules of Monitored Data ........................................................................................... 105
CHAPTER – 7: ADDITIONAL STUDIES ......................................................................................................... 106
7.0 General .............................................................................................................................................. 106
7.1. Public Consultation: ........................................................................................................................... 106
7.2 Risk Assessment ................................................................................................................................ 106
7.3 Disaster Management Plan ............................................................................................................... 108
7.4 CUMULATIVE IMPACT STUDY ............................................................................................................ 111
7.5 PLASTIC WASTE MANAGEMENT PLAN FOR P1 TO P9 ....................................................................... 135
7.6 POST COVID HEALTH MANAGEMENT PLAN FOR P1 TO P9 ............................................................... 136
CHAPTER – 8: PROJECT BENEFITS ............................................................................................................. 137
8.0 General .............................................................................................................................................. 137
8.1 Employment Potential ....................................................................................................................... 137
8.2 Socio-Economic Welfare Measures Proposed ................................................................................... 137

xi | P a g e
8.3 Improvement in Physical Infrastructure ............................................................................................ 138
8.4 Improvement in Social Infrastructure ................................................................................................ 138
8.5 Other Tangible Benefits ..................................................................................................................... 138
CHAPTER – 9: ENVIRONMENTAL COST BENEFIT ANALYSIS....................................................................... 140
CHAPTER - 10: ENVIRONMENTAL MANAGEMENT PLAN .......................................................................... 141
10.0 General .............................................................................................................................................. 141
10.1 Environmental Policy ......................................................................................................................... 141
10.2 Land Environment Management – .................................................................................................... 142
10.3 Soil Management .............................................................................................................................. 142
10.4 Water Management .......................................................................................................................... 143
10.5 Air Quality Management ................................................................................................................... 143
10.6 Noise Management ........................................................................................................................... 144
10.7 Ground Vibration and Fly Rock Control ............................................................................................. 144
10.8 Biological Environment Management ............................................................................................... 145
10.9 occupational safety & health management ...................................................................................... 146
10.10 CONCLUSION – .................................................................................................................................. 149
CHAPTER – 11: SUMMARY AND CONCLUSIONS ....................................................................................... 150
11.1 INTRODUCTION ................................................................................................................................. 150
11.2 PROJECT DESCRIPTION ...................................................................................................................... 150
11.3 DESCRIPTION OF THE ENVIRONMENT ............................................................................................... 151
11.4 ANTICIPATED ENVIRONMENTAL IMPACTS AND MITIGATION MEASURES ........................................ 154
11.5 ANALYSIS OF ALTERNATIVES ............................................................................................................. 157
11.6 ENVIRONMENTAL MONITORING PROGRAM .................................................................................... 157
11.7 ADDITIONAL STUDIES ........................................................................................................................ 157
11.8 PROJECT BENEFITS ............................................................................................................................ 158
11.9 CONCLUSION ..................................................................................................................................... 159
CHAPTER 12.0: DISCLOSURE OF CONSULTANTS ....................................................................................... 160
xii | P a g e
LIST OF TABLES
TABLE 1.1: PROPOSED PROJECTS IN THE CLUSTER ....................................................... 3
TABLE 1.2: DETAILS OF PROJECT PROPONENT ................................................................ 3
TABLE 1.3: SALIENT FEATURES OF THE PROPOSED PROJECT .................................... 3
TABLE 1.4 – STRUCTURE OF THE EIA REPORT.................................................................. 7
TABLE 1.5 – ENVIRONMENT ATTRIBUTES .......................................................................... 7
TABLE 2.1: SITE CONNECTIVITY TO THE PROPOSED QUARRY ..................................... 9
TABLE 2.2 – BOUNDARY CO-ORDINATES OF PROPOSED PROJECT ........................... 10
TABLE 2.3 – LAND USE PATTERN OF THE PROPOSED PROJECT ................................ 16
TABLE 2.4: OPERATIONAL DETAILS FOR PROPOSED PROJECTS ............................... 16
TABLE 2.5: RANGE OF AQUIFER PARAMETERS .............................................................. 19
TABLE 2.6: CUMULATIVE PRODUCTION OF ROUGH STONE ....................................... 23
TABLE 2.7: CUMULATIVE PRODUCTION OF GRAVEL .................................................... 23
TABLE 2.8 PROPOSED MACHINERY DEPLOYMENT ........................................................ 24
TABLE 2.9 – TRAFFIC SURVEY LOCATION’S ..................................................................... 24
TABLE 2.10 – EXISTING TRAFFIC VOLUME ...................................................................... 25
TABLE 2.11 – ANTICIPATED TRAFFIC DUE TO THIS PROPOSED PROJECT ............. 25
TABLE 2.12 – SUMMARY OF TRAFFIC VOLUME............................................................... 25
TABLE 2.13 – WATER REQUIREMENT FOR THE PROJECT ............................................ 26
TABLE 2.14: EMPLOYMENT POTENTIAL ............................................................................ 27
TABLE 2.15 – PROJECT COST................................................................................................. 27
TABLE 2.16 – EXPECTED TIME SCHEDULE FOR THE PROPOSED QUARRIES ......... 27
TABLE 3.1 – ENVIRONMENTAL MONITORING ATTRIBUTES AND FREQUENCY OF
MONITORING ................................................................................................................. - 29 -
TABLE 3.2 – LAND USE / LAND COVER TABLE 10 KM RADIUS ..................................... 30

xiii | P a g e
TABLE 3.3 – DETAILS OF ENVIRONMENT SENSITIVITY AROUND THE PROJECT
AREA .................................................................................................................................... 33
TABLE 3.4 – WATER BODIES WITHIN THE PROPOSED QUARRY ................................. 33
TABLE 3.5 – SOIL SAMPLING LOCATIONS ......................................................................... 33
TABLE 3.6 – METHODOLOGY OF SAMPLING COLLECTION .......................................... 34
TABLE 3.7 – SOIL QUALITY MONITORING DATA ............................................................. 37
TABLE 3.8 – WATER SAMPLING LOCATIONS .................................................................... 39
TABLE 3.9 – SURFACE WATER ANALYSIS RESULTS ....................................................... 40
TABLE 3.10 – GROUND WATER ANALYSIS RESULTS ....................................................... 41
TABLE 3.11: PRE MONSOON WATER LEVEL OF OPEN WELLS 1 KM RADIUS .......... 42
TABLE 3.12: PRE MONSOON WATER LEVEL OF BOREWELLS 1 KM RADIUS ........... 45
TABLE 3.13 – RAINFALL DATA .............................................................................................. 52
TABLE 3.14 – METEOROLOGICAL DATA RECORDED AT SITE...................................... 52
TABLE 3.15 – METHODOLOGY AND INSTRUMENT USED FOR AIR QUALITY
ANALYSIS ............................................................................................................................ 54
TABLE 3.16 – NATIONAL AMBIENT AIR QUALITY STANDARDS ................................... 54
TABLE 3.17 – AMBIENT AIR QUALITY (AAQ) MONITORING LOCATIONS .................. 55
TABLE 3.18 – AAQ1- CORE ZONE (South East Corner) ........................................................ 57
TABLE 3.19 – AAQ2 - CORE ZONE ......................................................................................... 58
TABLE 3.20 – AAQ3 – CORE ZONE......................................................................................... 59
TABLE 3.21– AAQ4 – CORE ZONE.......................................................................................... 60
TABLE 3.22 – AAQ5 – MALUMICHAMPATTY (BUFFER ZONE) ...................................... 61
TABLE 3.23 – AAQ6 - OTHAKALMANDAPAM (BUFFER ZONE) ..................................... 62
TABLE 3.24 – AAQ7 - CHETTIPALAYAM VILLAGE (BUFFER ZONE) .......................... 63
TABLE 3.25 – AAQ8 - VADASITHUR VILLAGE (BUFFER ZONE) .................................. 64
xiv | P a g e
TABLE 3.26 – AAQ9 - ARASAMPALAYAM VILLAGE (BUFFER ZONE)......................... 65
TABLE 3.27 – AAQ10 - PONNAKKANI VILLAGE (BUFFER ZONE) ................................ 66
TABLE 3.28 – ABSTRACT OF AMBIENT AIR QUALITY DATA ......................................... 67
TABLE 3.29– AVERAGE FUGITIVE DUST SAMPLE VALUES IN μg/m3 .......................... 70
TABLE 3.30– FUGITIVE DUST SAMPLE VALUES IN μg/m3 – ........................................... 71
TABLE 3.31 – DETAILS OF SURFACE NOISE MONITORING LOCATIONS................... 72
TABLE 3.32 – NOISE MONITORING RESULTS IN CORE AND BUFFER ZONE ............ 72
TABLE 3.33 – FLORA ................................................................................................................ 75
TABLE 3.34 – FAUNA ................................................................................................................ 77
TABLE 3.35: VILLAGE POPULATION FACTS ...................................................................... 79
TABLE 3.36: VILLAGE DEMOGRAPHICS POPULATION .................................................. 79
TABLE 3.37: VILLAGE 2011 CENSUS DATA ......................................................................... 80
TABLE 3.38 – POPULATION CHARACTERISTICS AROUND 10KM RADIUS ................. 80
TABLE 4.1: WATER REQUIREMENTS .................................................................................. 84
TABLE 4.2: ESTIMATED EMISSION RATE .......................................................................... 85
TABLE 4.3: INCREMENTAL & RESULTANT GLC OF PM10 .............................................. 88
TABLE 4.4: INCREMENTAL & RESULTANT GLC OF PM2.5 .............................................. 88
TABLE 4.5: INCREMENTAL & RESULTANT GLC OF SO2 ................................................. 89
TABLE 4.6: INCREMENTAL & RESULTANT GLC OF NOX ................................................ 89
TABLE 4.7: INCREMENTAL & RESULTANT GLC OF FUGITIVE DUST ........................ 89
TABLE 4.8: ACTIVITY AND NOISE LEVEL PRODUCED BY MACHINERY .................... 91
TABLE 4.9: PREDICTED NOISE INCREMENTAL VALUES .............................................. 91
TABLE 4.10: PREDICTED PPV VALUES DUE TO BLASTING ........................................... 92
TABLE 4.11: RECOMMENDED SPECIES FOR GREENBELT DEVELOPMENT PLAN . 94
TABLE 4.12: GREENBELT DEVELOPMENT PLAN............................................................. 95

xv | P a g e
TABLE 4.13: BUDGET FOR GREEBELT DEVELOPMENT PLAN ..................................... 95
TABLE 4.14: ECOLOGICAL IMPACT ASSESSMENTS ........................................................ 96
TABLE 4.15: ANTICIPATED IMPACT OF ECOLOGY AND BIODIVERSITY ................... 97
TABLE 6.1 IMPLEMENTATION SCHEDULE ..................................................................... 103
TABLE 6.2: PROPOSED MONITORING SCHEDULE POST EC ....................................... 104
TABLE 6.3 ENVIRONMENT MONITORING BUDGET ...................................................... 105
TABLE 7.1 RISK ASSESSMENT & CONTROL MEASURES .............................................. 106
TABLE 7.2: PROPOSED TEAMS TO DEAL WITH EMERGENCY SITUATION ............. 109
TABLE 7.3: LIST OF QUARRIES WITHIN 500 METER RADIUS FROM THIS
PROPOSAL ........................................................................................................................ 111
TABLE 7.4: SALIENT FEATURES OF THE PROPOSED PROJECTS IN CLUSTER ..... 112
TABLE 7.5 CUMULATIVE PRODUCTION LOAD OF ROUGH STONE INCLUSTER.... 125
TABLE 7.6: CUMULATIVE PRODUCTION OF GRAVEL IN CLUSTER ......................... 126
TABLE 7.7: EMISSION ESTIMATION FROM CLUSTER .................................................. 126
TABLE 7.8: INCREMENTAL & RESULTANT GLC WITHIN CLUSTER .......................... 131
TABLE 7.9: PREDICTED NOISE INCREMENTAL VALUES FROM CLUSTER ............. 131
TABLE 7.10: NEAREST HABITATION FROM EACH MINE............................................. 132
TABLE 7.11: GROUND VIBRATIONS AT 26 MINES .......................................................... 133
TABLE 7.12: SOCIO ECONOMIC BENEFITS FROM 26 MINES ...................................... 134
TABLE 7.13: GREENBELT DEVELOPMENT BENEFITS FROM 26 MINES.................. 134
TABLE 7.14: ACTION PLAN TO MANAGE PLASTIC WASTE .......................................... 135
TABLE 8.1 CER – ACTION PLAN .......................................................................................... 139
TABLE 10.1: PROPOSED CONTROLS FOR LAND ENVIRONMENT .............................. 142
ABLE 10.2: PROPOSED CONTROLS FOR SOIL MANAGEMENT ................................... 142
TABLE 10.3: PROPOSED CONTROLS FOR WATER ENVIRONMENT ........................... 143

xvi | P a g e
TABLE 10.4: PROPOSED CONTROLS FOR AIR ENVIRONMENT .................................. 143
TABLE 10.5: PROPOSED CONTROLS FOR NOISE ENVIRONMENT ............................. 144
TABLE 10.6: PROPOSED CONTROLS FOR GROUND VIBRATIONS & FLY ROCK ..... 144
TABLE 10.7 PROPOSED GREENBELT ACTIVITIES FOR5 YEAR PLAN PERIOD ....... 145
TABLE 10.8: RECOMMENDED SPECIES TO PLANT IN THE GREENBELT ................ 146
TABLE 10.9: MEDICAL EXAMINATION SCHEDULE ....................................................... 146
TABLE 10.10: LIST OF PERIODICAL TRAININGS PROPOSED FOR EMPLOYEES ... 148
TABLE 10.11: EMP BUDGET FOR PROPOSED PROJECT ............................................... 149
TABLE 11.1: SALIENT FEATURES OF THE PROPOSED PROJECT .............................. 150
TABLE 11.2: LAND USE PATTERN OF THE PROPOSED PROJECT .............................. 151
TABLE 11.3 RESOURCES AND RESERVES OF PROPOSED PROJECT ......................... 151
TABLE 11.4: ULTIMATE PIT DIMENSION ......................................................................... 151
TABLE 11.5: WATER REQUIREMENT OF THE PROPOSED PROJECT ........................ 151
TABLE 11.6: LAND USE / LAND COVER TABLE 10 KM RADIUS ................................... 152
TABLE 11.7: METEOROLOGICAL DATA RECORDED AT SITE ..................................... 153
TABLE 11.8: ANTICIPATED IMPACTS & MITIGATION MEASURES ............................ 154
TABLE 11.9: POST PROJECT MONITORING PROGRAM ................................................ 157
TABLE 11.14: EMP BUDGET ................................................................................................. 158

xvii | P a g e
LIST OF FIGURES
FIG 1.1 SATELLITE IMAGERY CLUSTER QUARRIES ......................................................... 2
FIG1.1A KEY MAP SHOWING THE LOCATION OF THE PROJECT SITE ........................ 4
FIGURE 1.2: TOPOSHEET SHOWING LOCATION OF THE PROJECT SITE AROUND
10 KM RADIUS ...................................................................................................................... 5
FIGURE 2.1: TOPOGRAPHICAL VIEW OF THE PROJECT SITE ..................................... 10
FIGURE 2.2: SHOWING GOOGLE IMAGE ROUGH STONE AND GRAVEL QUARRY
PROJECT AREA .................................................................................................................. 11
FIGURE 2.3: QUARRY LEASE PLAN ..................................................................................... 11
FIGURE 2.4: SATELLITE IMAGERY OF CLUSTER QUARRIES ....................................... 12
FIGURE 2.5: DIGITIZED MAP OF THE STUDY AREA (10 KM RADIUS FROM
PROJECT SITE) .................................................................................................................. 13
FIGURE 2.6: DIGITIZED MAP OF THE STUDY AREA (5 KM RADIUS FROM PROJECT
SITE) ..................................................................................................................................... 14
FIGURE 2.7: DIGITIZED MAP OF THE STUDY AREA (1 KM RADIUS FROM PROJECT
SITE) ..................................................................................................................................... 15
FIGURE 2.8: GROUND WATER LEVEL VARIATIONS OF COIMBATORE DISTRICT .. 19
TABLE 2.10: GROUND WATER LEVEL VARIATIONS OF COIMBATORE DISTRICT .. 19
FIGURE 2.11: REGIONAL GEOLOGY MAP .......................................................................... 20
FIGURE 2.12: GEOMORPHOLOGY MAP .............................................................................. 21
FIGURE 2.13: TOPOGRAPHY, GEOLOGICAL, YEARWISE DEVELOPMENT ................ 22
FIGURE 2.14: TRAFFIC SURVEY LOCATIONS & TRANSPORTATION ROUTE MAP . 25
FIGURE 3.1: LAND USE LAND COVER MAP 10KM RADIUS ............................................ 31
FIGURE 3.2: LAND USE AND LAND COVER CHART ......................................................... 32
FIGURE 3.3: SOIL SAMPLING LOCATIONS AROUND 10 KM RADIUS .......................... 35
FIGURE 3.4: SOIL MAP ........................................................................................................ - 36 -
FIGURE 3.5: SITE PHOTOGRAPHS OF WATER SAMPLING LOCATIONS .................... 39

xviii | P a g e
FIGURE 3.6: CONTOUR MAP OF OPEN WELL WATER LEVEL ...................................... 43
FIGURE 3.7: CONTOUR MAP OF BORE WELL WATER LEVEL ...................................... 45
FIGURE 3.8: DRAINAGE MAP AROUND 10 KM RADIUS FROM PROJECT SITE ......... 48
FIGURE 3.9: GROUND WATER LEVEL MAP ....................................................................... 49
FIGURE 3.10: WINDROSE DIAGRAM.................................................................................... 53
FIGURE 3.11: SITE PHOTOGRAPHS OF AMBIENT AIR MONITORING ........................ 55
FIGURE 3.12 AMBIENT AIR QUALITY LOCATIONS AROUND 5 KM RADIUS .............. 56
FIGURE 3.13 : BAR DIAGRAM OF PARTICULATE MATTER (PM10) ............................... 68
FIGURE 3.13A : BAR DIAGRAM OF PARTICULATE MATTER (PM2.5) ............................ 68
FIGURE 3.14: BAR DIAGRAM OF PARTICULATE MATTER (SO2) .................................. 69
FIGURE 3.14A: BAR DIAGRAM OF PARTICULATE MATTER (NO2) ............................... 69
FIGURE 3.15: NOISE MONITORING STATIONS AROUND 10 KM RADIUS ................... 73
FIGURE 3.16: DAY & NIGHT TIME NOISE LEVELS IN CORE AND BUFFER ZONE .. 74
FIGURE 4.1: AERMOD TERRAIN MAP ................................................................................. 86
FIGURE 4.2: PREDICTED INCREMENTAL CONCENTRATION OF PM10 ...................... 87
FIGURE 4.3: PREDICTED INCREMENTAL CONCENTRATION OF SO2......................... 87
FIGURE 4.4: PREDICTED INCREMENTAL CONCENTRATION OF NOX ....................... 87
FIGURE 4.5: PREDICTED INCREMENTAL CONCENTRATION OF FUGITIVE DUST 88
Figure 6.1 Hierarchy of Environmental Monitoring Cell ....................................................... 102
FIGURE 7.1: DISASTER MANAGEMENT TEAM LAYOUT .............................................. 108
FIGURE 10.1: PERSONAL PROTECTIVE EQUIPMENT TO THE MINE WORKERS ... 147

Thiru.V.Manikandan Rough Stone and Gravel Quarry Chapter - 1
Geo Exploration and Mining Solutions 1 | P a g e
CHAPTER – 1: INTRODUCTION
1.0 Preamble
Environmental Impact Assessment (EIA) is the management tool to ensure the sustainable development
and it is a process, used to identify the environmental, social and economic impacts of a project prior to decision-
making. It is a decision making tool, which guides the decision makers in taking appropriate decisions for any
project. EIA systematically examines both beneficial and adverse consequences of the project and ensures that these
impacts are taken into account during the project designing. It also reduces conflicts by promoting community
participation, information, decision makers, and helps in developing the base for environmentally sound project.
Rough Stone and Gravel are the major requirements for construction industry. This EIA report is prepared
by considering Cumulative load of all proposed & existing quarries of Arasampalayam, Pachapalayam &
Chettipalayam Rough Stone and Gravel Cluster Quarries consisting of Thirteen Proposed and Seventeen Existing
Quarries with total extent of Cluster of 49.96.8Ha in Arasampalayam, Pachapalayam & Chettipalayam Village,
Kinathukadavu, Sulur & Madukkarai Taluk, Coimbatore District and Tamil Nadu State, cluster area calculated as
per MoEF & CC Notification S.O. 2269(E) Dated 1st July 2016.
This EIA Report is prepared in compliance with ToR obtained for the below proposals in Table 1.1 and the
Baseline Monitoring study has been carried out during the period of March 2021 – May 2021
This EIA Report is prepared in compliance with ToR obtained letter No Lr.No.SEIAA-
TN/F.No.8553/SEAC/ToR-1010/2021 Dated: 28.07.2021.
The Baseline Monitoring study has been carried out during Pre Moonsoon season (March - May 2021)
considering the provisions of MoEF & CC Office Memorandum Dated: 29.08.2017 and MoEF & CC Notification
S.O. 996 (E) Dated: 10.04.2015.
1.1 Purpose of the report
The Ministry of Environment and Forests, Govt. of India, through its EIA notification S.O. 1533(E) of 14 th
September 2006 and its subsequent amendments as per Gazette Notification S.O. 3977 (E) of 14 thAugust 2018,
Mining Projects are classified under two categories i.e. A (> 100 Ha) and B (≤ 100 Ha), and Schematic Presentation
of Requirements on Environmental Clearance of Minor Minerals including cluster situation in Appendix – XI.
Now, as per Order Dated: 04.09.2018 & 13.09.2018 passed by Hon'ble National Green Tribunal, New
Delhi in O.A. No. 173 of 2018 & O.A. No, 186 of 2016 and MoEF & CC Office Memorandum F. No. L-
11011/175/2018-IA-II (M) Dated: 12.12.2018 clarified the requirement for EIA, EMP and therefore, Public
Consultation for all areas from 5 to 25 ha falling in Category B - 1 and appraised by SEAC/ SEIAA as well as for
cluster situation.
The proposed projects are categorized under category “B1” Activity 1(a) (mining lease area in cluster
situation) and will be considered at SEIAA – TN after conducting Public Hearing and Submission of EIA/EMP
Report for Grant of Environmental Clearance.
“Draft EIA report prepared on the basis of ToR Issued for carrying out public hearing for the grant of
Environmental Clearance from SEIAA, Tamil Nadu”
Thiru.V.Manikandan Rough Stone and Gravel Quarry Chapter - 1
Geo Exploration and Mining Solutions 2 | P a g e
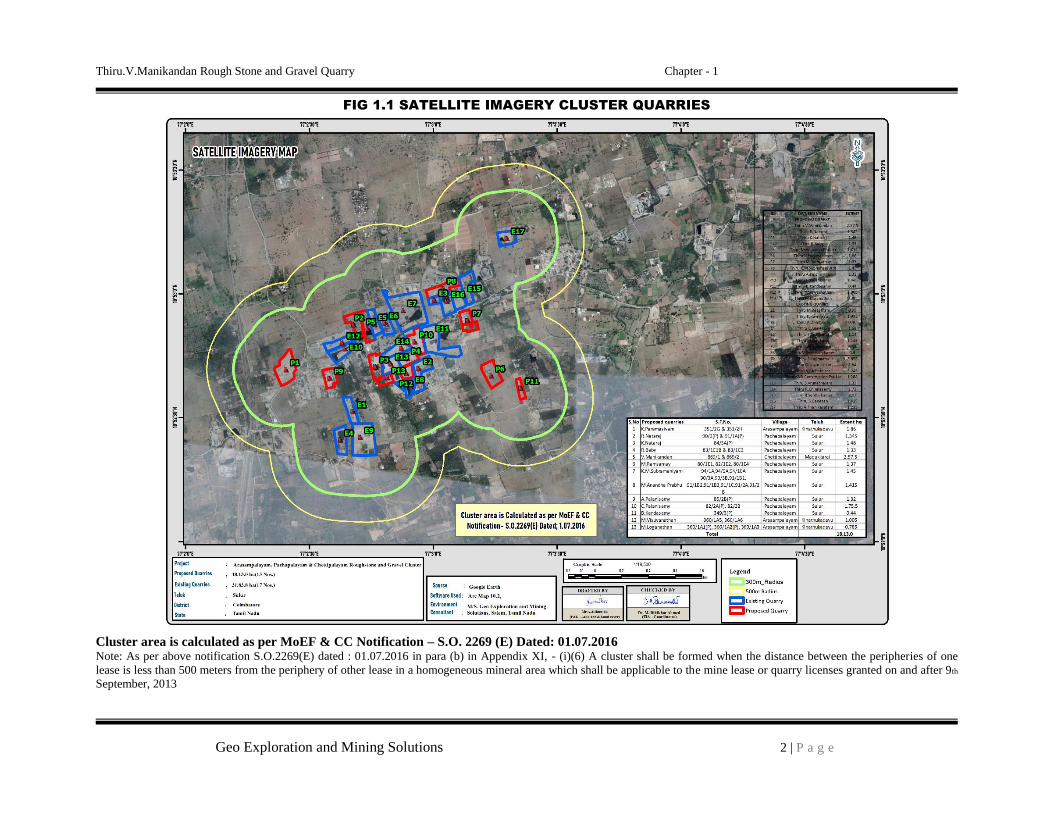
FIG 1.1 SATELLITE IMAGERY CLUSTER QUARRIES
Cluster area is calculated as per MoEF & CC Notification – S.O. 2269 (E) Dated: 01.07.2016 Note: As per above notification S.O.2269(E) dated : 01.07.2016 in para (b) in Appendix XI, - (i)(6) A cluster shall be formed when the distance between the peripheries of one
lease is less than 500 meters from the periphery of other lease in a homogeneous mineral area which shall be applicable to the mine lease or quarry licenses granted on and after 9th
September, 2013
Thiru.V.Manikandan Rough Stone and Gravel Quarry Chapter - 1
Geo Exploration and Mining Solutions 3 | P a g e
1.2 Identification of Project and Project Proponent 1.2.1 Identification of Project
The project area is a Patta Land, no forest land is involved
TABLE 1.1: PROPOSED PROJECT
Name of the Project Thiru.V. Manikandan Rough Stone & Gravel Quarry
S.F. No. 869/1 & 869/2
Extent 2.57.5Ha
Village Taluk and Chettipalayam Village, Madukkarai Taluk
District Coimbatore District Source: Approved Mining Plan
1.2.2 Identification of Project Proponent
TABLE 1.2: DETAILS OF PROJECT PROPONENT
Name of the Company Thiru. V.Manikandan Roughstone & Gravel Quarry
Address No.55B, Mariyamman kovil street, Chettipalayam post,
Coimbatore District – 641 201
Mobile +91 9944767693, 94425 88277 & 9994282775
Status Proprietor Source: Approved Mining Plan
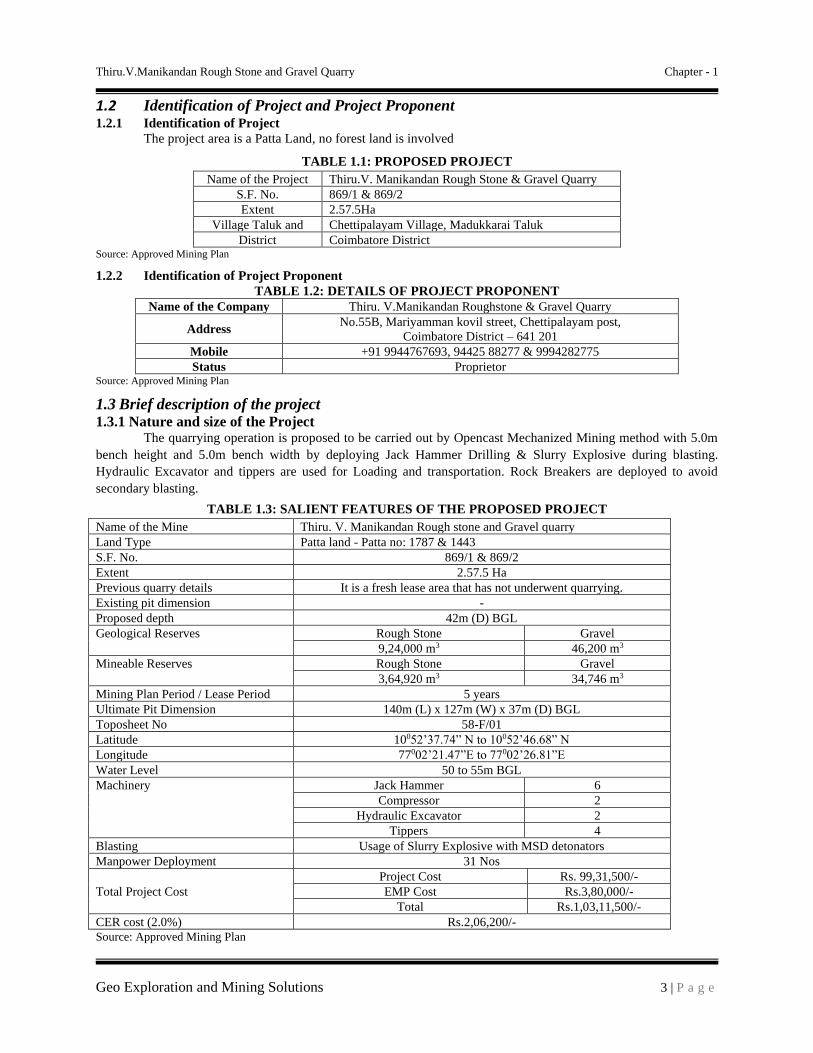
1.3 Brief description of the project 1.3.1 Nature and size of the Project
The quarrying operation is proposed to be carried out by Opencast Mechanized Mining method with 5.0m
bench height and 5.0m bench width by deploying Jack Hammer Drilling & Slurry Explosive during blasting.
Hydraulic Excavator and tippers are used for Loading and transportation. Rock Breakers are deployed to avoid
secondary blasting.
TABLE 1.3: SALIENT FEATURES OF THE PROPOSED PROJECT
Name of the Mine Thiru. V. Manikandan Rough stone and Gravel quarry
Land Type Patta land - Patta no: 1787 & 1443
S.F. No. 869/1 & 869/2
Extent 2.57.5 Ha
Previous quarry details It is a fresh lease area that has not underwent quarrying.
Existing pit dimension -
Proposed depth 42m (D) BGL
Geological Reserves Rough Stone Gravel
9,24,000 m3 46,200 m3
Mineable Reserves Rough Stone Gravel
3,64,920 m3 34,746 m3
Mining Plan Period / Lease Period 5 years
Ultimate Pit Dimension 140m (L) x 127m (W) x 37m (D) BGL
Toposheet No 58-F/01
Latitude 10052’37.74” N to 10052’46.68” N
Longitude 77002’21.47”E to 77002’26.81”E
Water Level 50 to 55m BGL
Machinery Jack Hammer 6
Compressor 2
Hydraulic Excavator 2
Tippers 4
Blasting Usage of Slurry Explosive with MSD detonators
Manpower Deployment 31 Nos
Total Project Cost
Project Cost Rs. 99,31,500/-
EMP Cost Rs.3,80,000/-
Total Rs.1,03,11,500/-
CER cost (2.0%) Rs.2,06,200/-
Source: Approved Mining Plan

Thiru.V.Manikandan Rough Stone and Gravel Quarry Chapter - 1
Geo Exploration and Mining Solutions 4 | P a g e
1.3.2 Location of the project
The project falls in Chettipalayam village, Kinathukadavu taluk, Coimbatore District.
The Proposed Project area is located about 17 Km South east side of Coimbatore District and 14.5Km
South West side of 7.0Km North east of Kinathukadavu Taluk & 3.5km North of Chettipalayam Village.
FIG1.1A KEY MAP SHOWING THE LOCATION OF THE PROJECT SITE

Thiru.V.Manikandan Rough Stone and Gravel Quarry Chapter - 1
Geo Exploration and Mining Solutions 5 | P a g e
FIGURE 1.2: TOPOSHEET SHOWING LOCATION OF THE PROJECT SITE AROUND 10 KM RADIUS

Thiru.V.Manikandan Rough Stone and Gravel Quarry Chapter - 1
Geo Exploration and Mining Solutions 6 | P a g e
1.4 Environmental Clearance
The Environmental Clearance process for the project will comprise of four stages. These stages in
sequential order are given below:-
1. Screening
2. Scoping
3. Public consultation &
4. Appraisal
SCREENING –
• The proponent applied for Rough Stone and Gravel Quarry Lease Dated: 21.12.2017
• Precise Area Communication Letter was issued by the District Collector, Coimbatore
Rc.No.1536/Mines/2017, Dated:19.10.2019
• The Mining Plan was prepared by Qualified Person and approved by Joint Director / Assistant Director
(i/c), Department of Geology and Mining, Coimbatore Rc.No.1536/Mines /2017 dated 10.12.2019
• Proponent applied for ToR for Environmental Clearance vide proposal No SIA/TN/MIN/8553/2021,
Dated:10.06.2021.
SCOPING –
• The proposal was placed in 215th SEAC meeting held on 29.06.2021 and the committee recommended for
issue of ToR.
• The proposal was considered in 449th SEIAA meeting held on 24.07.2021 and issued ToR vide Letter No
Lr.No. SEIAA-TN/F.No.8553/SEAC/ToR-1010/2021 Dated:28.07.2021
Public Consultation –
Application to The Member Secretary of the Tamil Nadu Pollution Control Board (TNPCB) to conduct
Public Hearing in a systematic, time bound and transparent manner ensuring widest possible public participation at
the project site or in its close proximity in the district is submitted along with this Draft EIA/ EMP Report and the
outcome of public hearing proceedings will be detailed in the Final EIA/EMP Report.
Appraisal –
Appraisal is the detailed scrutiny by the State Expert Appraisal Committee (SEAC) of the application and
other documents like the final EIA & EMP Report, outcome of the Public Consultations including Public Hearing
Proceedings, submitted by the proponent to the regulatory authority concerned for grant of environmental clearance.
The report has been prepared using the following references:
• Guidance Manual of Environmental Impact Assessment for Mining of Minerals, Ministry of Environment
and Forests, 2010
▪ EIA Notification, 14th September, 2006
▪ ToR Letter No. SEIAA-TN/F.No.8553/SEAC/ToR-1010/2021 Dated:28.07.2021- Thiru.V. Manikandan
• Approved Mining of the Rough stone and Gravel quarry project
1.5 Post Environment Clearance Monitoring
The Project Proponent will submit a half-yearly compliance report in respect of stipulated Environmental
Clearance terms and conditions to MoEF & CC Regional Office & SEIAA after grant of EC on 1st June and 1st
December of every year.
1.6 Generic Structure of EIA Document
The overall contents of the EIA report follow the list of contents prescribed in the EIA Notification 2006
and the “Environmental Impact Assessment Guidance Manual for Mining of Minerals” published by MoEF & CC.
A brief description of each Chapter is presented in Table No. 1.5.
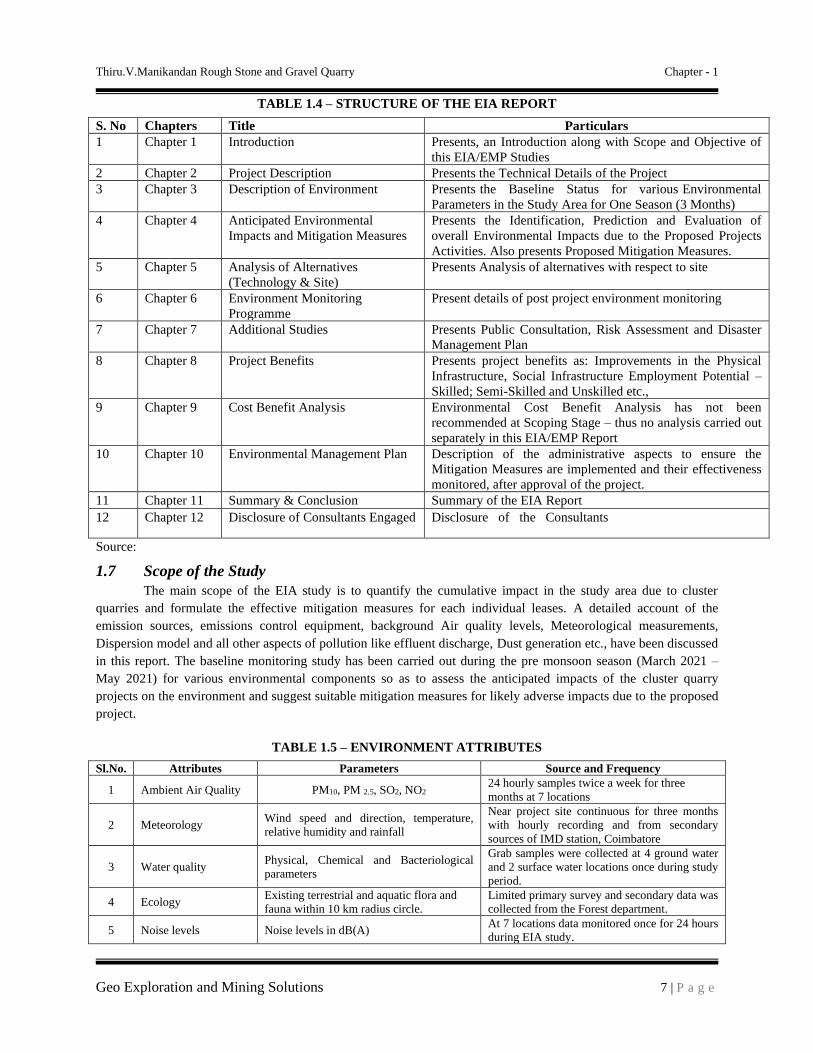
Thiru.V.Manikandan Rough Stone and Gravel Quarry Chapter - 1
Geo Exploration and Mining Solutions 7 | P a g e
TABLE 1.4 – STRUCTURE OF THE EIA REPORT
S. No Chapters Title Particulars
1 Chapter 1 Introduction Presents, an Introduction along with Scope and Objective of
this EIA/EMP Studies
2 Chapter 2 Project Description Presents the Technical Details of the Project
3 Chapter 3 Description of Environment Presents the Baseline Status for various Environmental
Parameters in the Study Area for One Season (3 Months)
4 Chapter 4 Anticipated Environmental
Impacts and Mitigation Measures
Presents the Identification, Prediction and Evaluation of
overall Environmental Impacts due to the Proposed Projects
Activities. Also presents Proposed Mitigation Measures.
5 Chapter 5 Analysis of Alternatives
(Technology & Site)
Presents Analysis of alternatives with respect to site
6 Chapter 6 Environment Monitoring
Programme
Present details of post project environment monitoring
7 Chapter 7 Additional Studies Presents Public Consultation, Risk Assessment and Disaster
Management Plan
8 Chapter 8 Project Benefits Presents project benefits as: Improvements in the Physical
Infrastructure, Social Infrastructure Employment Potential –
Skilled; Semi-Skilled and Unskilled etc.,
9 Chapter 9 Cost Benefit Analysis Environmental Cost Benefit Analysis has not been
recommended at Scoping Stage – thus no analysis carried out
separately in this EIA/EMP Report
10 Chapter 10 Environmental Management Plan Description of the administrative aspects to ensure the
Mitigation Measures are implemented and their effectiveness
monitored, after approval of the project.
11 Chapter 11 Summary & Conclusion Summary of the EIA Report
12 Chapter 12 Disclosure of Consultants Engaged Disclosure of the Consultants
Source:
1.7 Scope of the Study
The main scope of the EIA study is to quantify the cumulative impact in the study area due to cluster
quarries and formulate the effective mitigation measures for each individual leases. A detailed account of the
emission sources, emissions control equipment, background Air quality levels, Meteorological measurements,
Dispersion model and all other aspects of pollution like effluent discharge, Dust generation etc., have been discussed
in this report. The baseline monitoring study has been carried out during the pre monsoon season (March 2021 –
May 2021) for various environmental components so as to assess the anticipated impacts of the cluster quarry
projects on the environment and suggest suitable mitigation measures for likely adverse impacts due to the proposed
project.
TABLE 1.5 – ENVIRONMENT ATTRIBUTES
Sl.No. Attributes Parameters Source and Frequency
1 Ambient Air Quality PM10, PM 2.5, SO2, NO2 24 hourly samples twice a week for three
months at 7 locations
2 Meteorology Wind speed and direction, temperature,
relative humidity and rainfall
Near project site continuous for three months
with hourly recording and from secondary
sources of IMD station, Coimbatore
3 Water quality Physical, Chemical and Bacteriological
parameters
Grab samples were collected at 4 ground water
and 2 surface water locations once during study
period.
4 Ecology Existing terrestrial and aquatic flora and
fauna within 10 km radius circle.
Limited primary survey and secondary data was
collected from the Forest department.
5 Noise levels Noise levels in dB(A) At 7 locations data monitored once for 24 hours
during EIA study.

Thiru.V.Manikandan Rough Stone and Gravel Quarry Chapter - 1
Geo Exploration and Mining Solutions 8 | P a g e
6 Soil Characteristics Physical and Chemical Parameters Once at 5 locations during study period
7 Land use Existing land use for different categories Based on Survey of India topographical sheet
and satellite imagery and primary survey.
8 Socio-Economic
Aspects
Socio-economic and demographic
characteristics, worker characteristics
Based on primary survey and secondary
sources data like census of India 2011.
9 Hydrology
Drainage pattern of the area, nature of
streams, aquifer characteristics, recharge
and discharge areas
Based on data collected from secondary sources
as well as hydro-geology study report prepared.
10
Risk assessment and
Disaster Management
Plan
Identify areas where disaster can occur by
fires and explosions and release of toxic
substances
Based on the findings of Risk assessment done
for the mining associated activities
Source: Field Monitoring Data
The data has been collected as per the requirement of the ToR issued by SEIAA – TN and Standard ToR
Published by MoEF & CC.
1.7.1 Regulatory Compliance & Applicable Laws/Regulations
▪ Application for Quarrying Lease as per Tamil Nadu Minor Mineral Concession Rules, 1959
▪ Obtained Precise Area Communication Letter as per Tamil Nadu Minor Mineral Concession Rules, 1959
for Preparation of Mining Plan and obtaining Environmental Clearance
▪ The Mining Plan of Rough Stone and Gravel quarry has been approved under Rule 41 & 42 as amended of
Tamil Nadu Minor Mineral Concession Rules, 1959
▪ ToR Letter No. SEIAA-TN/F.No.8553/SEAC/ToR-1010/2021 Dated:28.07.2021- Thiru.V. Manikandan
▪ Approved Mining of the Rough stone and Gravel quarry project
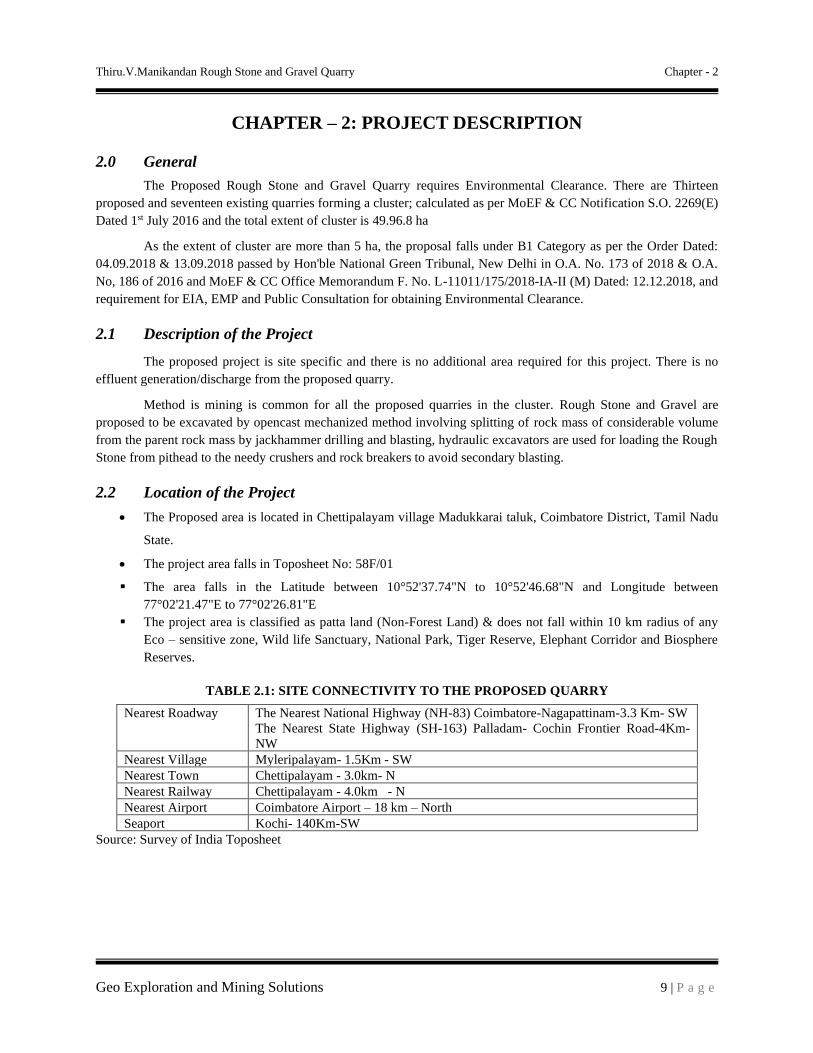
Thiru.V.Manikandan Rough Stone and Gravel Quarry Chapter - 2
Geo Exploration and Mining Solutions 9 | P a g e
CHAPTER – 2: PROJECT DESCRIPTION
2.0 General
The Proposed Rough Stone and Gravel Quarry requires Environmental Clearance. There are Thirteen
proposed and seventeen existing quarries forming a cluster; calculated as per MoEF & CC Notification S.O. 2269(E)
Dated 1st July 2016 and the total extent of cluster is 49.96.8 ha
As the extent of cluster are more than 5 ha, the proposal falls under B1 Category as per the Order Dated:
04.09.2018 & 13.09.2018 passed by Hon'ble National Green Tribunal, New Delhi in O.A. No. 173 of 2018 & O.A.
No, 186 of 2016 and MoEF & CC Office Memorandum F. No. L-11011/175/2018-IA-II (M) Dated: 12.12.2018, and
requirement for EIA, EMP and Public Consultation for obtaining Environmental Clearance.
2.1 Description of the Project
The proposed project is site specific and there is no additional area required for this project. There is no
effluent generation/discharge from the proposed quarry.
Method is mining is common for all the proposed quarries in the cluster. Rough Stone and Gravel are
proposed to be excavated by opencast mechanized method involving splitting of rock mass of considerable volume
from the parent rock mass by jackhammer drilling and blasting, hydraulic excavators are used for loading the Rough
Stone from pithead to the needy crushers and rock breakers to avoid secondary blasting.
2.2 Location of the Project
• The Proposed area is located in Chettipalayam village Madukkarai taluk, Coimbatore District, Tamil Nadu
State.
• The project area falls in Toposheet No: 58F/01
▪ The area falls in the Latitude between 10°52'37.74"N to 10°52'46.68"N and Longitude between
77°02'21.47"E to 77°02'26.81"E
▪ The project area is classified as patta land (Non-Forest Land) & does not fall within 10 km radius of any
Eco – sensitive zone, Wild life Sanctuary, National Park, Tiger Reserve, Elephant Corridor and Biosphere
Reserves.
TABLE 2.1: SITE CONNECTIVITY TO THE PROPOSED QUARRY
Nearest Roadway The Nearest National Highway (NH-83) Coimbatore-Nagapattinam-3.3 Km- SW
The Nearest State Highway (SH-163) Palladam- Cochin Frontier Road-4Km-
NW
Nearest Village Myleripalayam- 1.5Km - SW
Nearest Town Chettipalayam - 3.0km- N
Nearest Railway Chettipalayam - 4.0km - N
Nearest Airport Coimbatore Airport – 18 km – North
Seaport Kochi- 140Km-SW
Source: Survey of India Toposheet

Thiru.V.Manikandan Rough Stone and Gravel Quarry Chapter - 2
Geo Exploration and Mining Solutions 10 | P a g e
The Proposed area coners coordinates are given below.
TABLE 2.2 – BOUNDARY CO-ORDINATES OF PROPOSED PROJECT
1 100 52’37.74”N 770 02’23.20”E
2 100 52’41.70”N 770 02’21.47”E
3 100 52’42.24”N 770 02’21.61”E
4 100 52’42.67”N 770 02’22.77”E
5 100 52’43.77”N 770 02’22.74”E
6 100 52’44.83”N 770 02’23.80”E
7 100 52’46.47”N 770 02’24.91”E
8 100 52’46.68”N 770 02’25.35”E
9 100 52’41.60”N 770 02’26.81”E
10 100 52’40.97”N 770 02’26.21”E
11 100 52’39.60”N 770 02’26.36”E
12 100 52’38.33”N 770 02’24.61”E
Source: Quarry Lease Plan
FIGURE 2.1: TOPOGRAPHICAL VIEW OF THE PROJECT SITE

Thiru.V.Manikandan Rough Stone and Gravel Quarry Chapter - 2
Geo Exploration and Mining Solutions 11 | P a g e
FIGURE 2.2: SHOWING GOOGLE IMAGE ROUGH STONE AND GRAVEL QUARRY PROJECT AREA
FIGURE 2.3: QUARRY LEASE PLAN
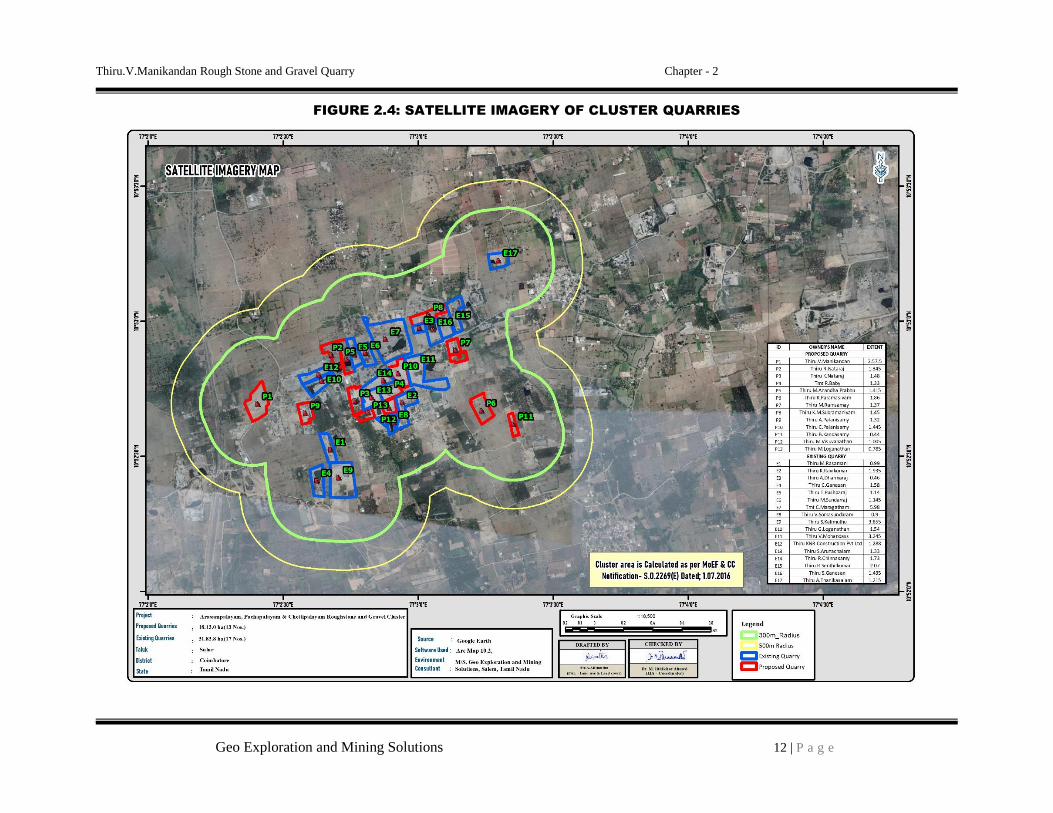
Thiru.V.Manikandan Rough Stone and Gravel Quarry Chapter - 2
Geo Exploration and Mining Solutions 12 | P a g e
FIGURE 2.4: SATELLITE IMAGERY OF CLUSTER QUARRIES
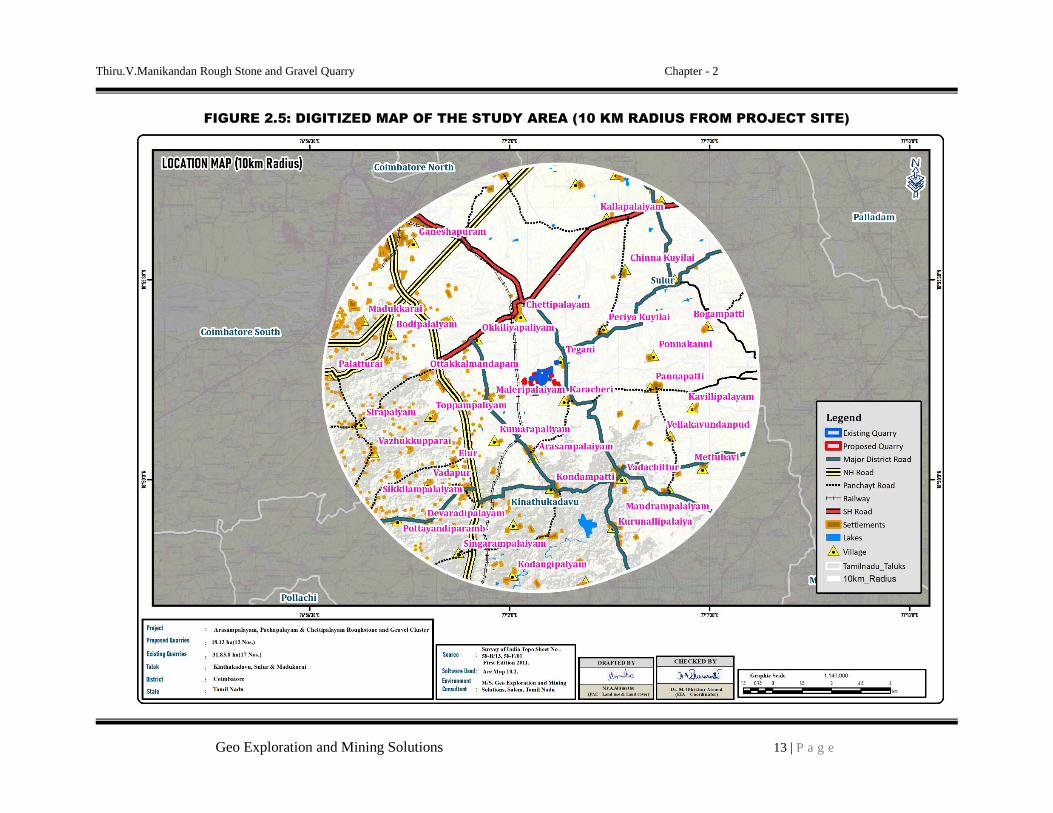
Thiru.V.Manikandan Rough Stone and Gravel Quarry Chapter - 2
Geo Exploration and Mining Solutions 13 | P a g e
FIGURE 2.5: DIGITIZED MAP OF THE STUDY AREA (10 KM RADIUS FROM PROJECT SITE)
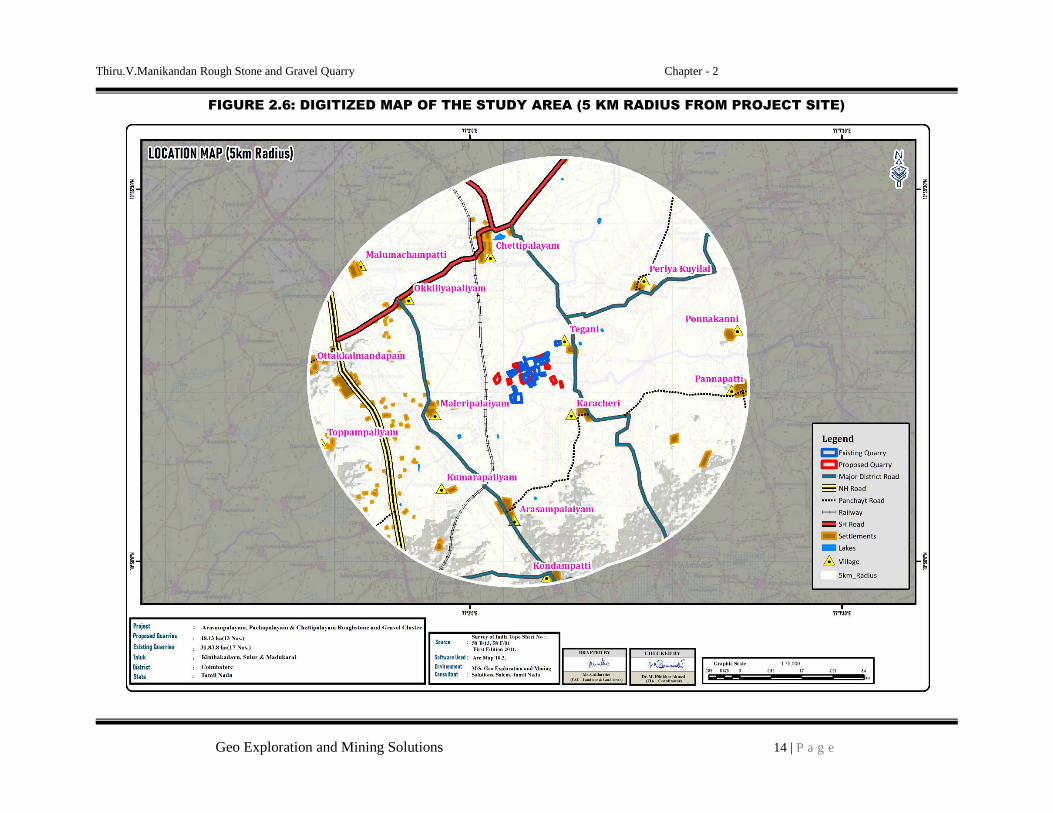
Thiru.V.Manikandan Rough Stone and Gravel Quarry Chapter - 2
Geo Exploration and Mining Solutions 14 | P a g e
FIGURE 2.6: DIGITIZED MAP OF THE STUDY AREA (5 KM RADIUS FROM PROJECT SITE)

Thiru.V.Manikandan Rough Stone and Gravel Quarry Chapter - 2
Geo Exploration and Mining Solutions 15 | P a g e
FIGURE 2.7: DIGITIZED MAP OF THE STUDY AREA (1 KM RADIUS FROM PROJECT SITE)
Source:

Thiru.V.Manikandan Rough Stone and Gravel Quarry Chapter - 2
Geo Exploration and Mining Solutions 16 | P a g e
2.2.1 Project Area
(i) The project area is site specific, there is No beneficiation or processing proposed inside the project
area.
(ii) There is no forest land involved in the proposed project area and is devoid of major vegetation and
trees.
TABLE 2.3 – LAND USE PATTERN OF THE PROPOSED PROJECT
Description Present area in (ha) Area at the end of life of quarry (Ha)
Area under quarry Nil 1.95.7
Infrastructure Nil 0.02.0
Roads Nil 0.02.0
Green Belt Nil 0.40.0
Un – utilized area 2.57.5 0.17.8
Grand Total 2.57.5 2.57.5
Source: Approved Mining Plan
2.2.2 Size or Magnitude of Operation TABLE 2.4: OPERATIONAL DETAILS FOR PROPOSED PROJECTS
PARTICULARS
DETAILS
Rough Stone
(5Year Plan period)
Gravel
(3Year Plan period)
Geological Resources 9,24,000 m3 46,200 m3
Mineable Reserves 3,64,920 m3 34,746 m3
Production for five year plan period 3,48,355 m3 34,746 m3
Mining Plan Period / Lease Applied Period 5 Years
Number of Working Days 300 Days
Production per day 232 m3 39 m3
No of Lorry loads (6m3 per load) 39 6
Proposed Depth for Mining Plan Period 37m (2m Gravel + 35m Rough stone)
Source: approved mining plan
* Gravel and weathered formation are proposed to excavate for first year, second year and third years only
2.3 Geology
2.3.1 Regional Geology
Peninsular gneiss forms the oldest rock formations, in which the massive formation of Charnockite lies
over with rich accumulation of recent quaternary formation. On regional scale the Charnockite body N30°E to
S30°W with dipping SE60°.
Stratigraphy of the area –
AGE FORMATION
Recent - Quaternary weathered formation (Gravel)
---------Unconformity-----------
Archaean - Charnockite
Peninsular Gneiss complex Geologically, the district is covered by rocks belonging to Archean age
comprising the khondalite group, Charnockite Group, migmatite group, Sathayamangalam group, Bhavani Group
and Alkali complex of Proterozoic age and Recent to Late Plestocene rocks of Cainozoic age.
The Charnockite Group of rocks consisting of Charnockite, pyroxene granulites and associated magnetite
quartzite, the Knodalite Group comprising gametiferous – sillimanite gneiss, calc-granulite, crystalline limestone,
sillimanite quartzites and associated migmatitic gneisses. The rocks are restricted to the central and southern
portions of the district, especially around Sulur, Madukkarai and Pollachi taluks.

Thiru.V.Manikandan Rough Stone and Gravel Quarry Chapter - 2
Geo Exploration and Mining Solutions 17 | P a g e
The fissile homblende gneisses (Peninsular gneiss – younger phase) of Bhavani Group with enclaves of
schistose, micaceous and amphibolitic rocks, fuchsite – kyanite quartzites, ferruginous quartzite (Satya Mangalam
Group) intruded by a number of ultramafic and basic rocks and granites are seen in the Northern portions of the
district especially around Mettupalayam and Northern areas of Coimbatore. The granites are Proterozoic age and
occupy the Western end and Eastern Part of the District as separate bodies and are recognized as Maruthamalai
Granite and Punjapuliyampatti Granites respectively. The quaternary alluvium is seen in the Western areas of
Coimbatore town. The alluvium is more than 30m thick in the Chinnathadagam valley northwest of Coimbatore and
in the Siruvani valley west of Coimbatore.
Source: District Survey Report for Minor Minerals Coimbatore District – May 2019
https://www.tnmines.tn.gov.in/pdf/dsr/9.pdf
2.3.2 Local Geology: -
The study area follows the regional trend and mainly comprises of Hard Rock Formation as a homogeneous
formation / Batholith formation of Charnockite. All the project areas is plain terrain, all the project areas is covered
with gravel formation of 2m to 3m thickness; Massive Charnockite formation is found after 2 m to 3 m gravel
formation which is clearly inferred from the nearby existing quarry pit.
2.3.3 Hydrogeology
Coimbatore District is underlain by crystalline metamorphic complex in the western parts of district and
sedimentary tract in eastern side. An area of 4551 Sq.km is covered by crystalline rocks (63%) and 2671 Sq.km is
covered by sediments (37%). The general geological sequence of formation is given below:
Quaternary - Laterites, Sands and Clays
Tertiary - Sandstone, Gravels and Clays
Cretaceous - Limestone, Calcareous Sandstone and Clay unconformity.
Archaean - Charnockites, Gneisses, Granites, Dolerites and Pegmatite
• The major part of the area is covered by metamorphic crystalline rocks of charnockite, granitic gneiss of
Archaean age intruded by dolerite dykes and pegmatite veins. These rocks are highly metamorphosed and
have been subjected to very severe folding, crushing and faulting.
• Ground Water occurs under the phreatic condition and wherever there are deep seated fractures, it occurs
under semi-confined to confined conditions.
• Occurrence of Ground Water in hard rock depends upon the intensity and depth of weathering, fractures
and fissures present in the rocks.
• Granites and gneisses yield moderately compared to the yield in Charnockites.
• Depth of well in hard rock generally ranges between 8 and 15m below ground level.
• Generally yield in open wells ranges from 30 to 250m3 /day and in bore well between 260 and 430 m3 /day.
The weathered thickness varies from 2.5 m to 42m in general there are 3 to 5 fracture zones within 100 m
and 1 to 4 fracture zones between 100 and 200 m.
The Cretaceous formation is represented by Arenaceous Lime stone, Calcareous sand - stone and marl.
The Tertiary formation is argillaceous comprising of Silty clay stones, argillaceous Lime stone.
The Quaternary deposits represented by the river deposits of Ponnaiyar and Varahanadhi spread over as patches in
Tiruppur District. The alluvium consists of unconsolidated sands, gravelly sands, clays and clayey sands. The
thickness of the sands ranges between 15 and 25 m in the alluvial formation which also form potential aquifers. In
some areas, sand stone of tertiary formation are the potential groundwater reservoirs.

Thiru.V.Manikandan Rough Stone and Gravel Quarry Chapter - 2
Geo Exploration and Mining Solutions 18 | P a g e
Aquifer Systems:
Occurrence and storage of groundwater depend upon three factors viz., Geology, Topography and rainfall
in the form of precipitation. Apart from Geology, wide variation in topographic profile and intensity of rainfall
constitutes the prime factors of groundwater recharge. Aquifers are part of the more complex hydro geological
system and the behaviour of the entire system cannot be interpreted easily. In hard rock terrain the occurrence of
Ground Water is limited to top weathered, fissured and fractured zone which extends to maximum 30 m on an
average it is about 10-15 m in Coimbatore District.
In Sedimentary formations, the presence of primary inter granular porosity enhances the transmitting
capacity of groundwater where the yield will be appreciable. The sedimentary area which occupies the eastern part
of the district along the coastal tract is more favourable for groundwater recharge. Ground Water occurs both in semi
confined and confined conditions. A brief description of occurrence of groundwater in each formation is furnished
below.
Alluvial Formations
In the river alluvium groundwater occurs under water table condition. The maximum thickness is 37 m and
the average thickness of the aquifer is approximately 12 m. These formations are porous and permeable which have
good water bearing zones.
Tertiary Cuddalore sandstone
Tertiary formations are represented by Cuddalore Sandstone and characterised as fluvial to brakish marine
deposits. Predominantly this formation is divided into Lower and Upper Cuddalore formations. In the Upper
Cuddalore formations the groundwater occurs in semi confined conditions, whereas in the Lower Cuddalore the
groundwater occurs in confined condition with good groundwater potential.
Cretaceous Formations
Groundwater occurring in the lens shape in the sandy clay lenses and fine sand is underlain by white and
black clay beds which constitute phreatic aquifer depth which ranges 10m to 15m below ground level. Phreatic
aquifer in Limestone is potential due to the presence of Oolitic Limestone.
Hard Rock Formations
Groundwater occurs under water table conditions but the intensity of weathering, joint, fracture and its
development is much less in other type of rocks when compared to gneissic formation. The groundwater potential is
low, when compared with the gneissic formations
Granitic Gneiss
Groundwater occurs under water table conditions in weathered, jointed and fractural formations. The pore
space developed in the weathered mantle acts as shallow granular aquifers and forms the potential water bearing and
yielding zones water table is shallow in canal and tank irrigation regions and it is somewhat deeper in other regions.
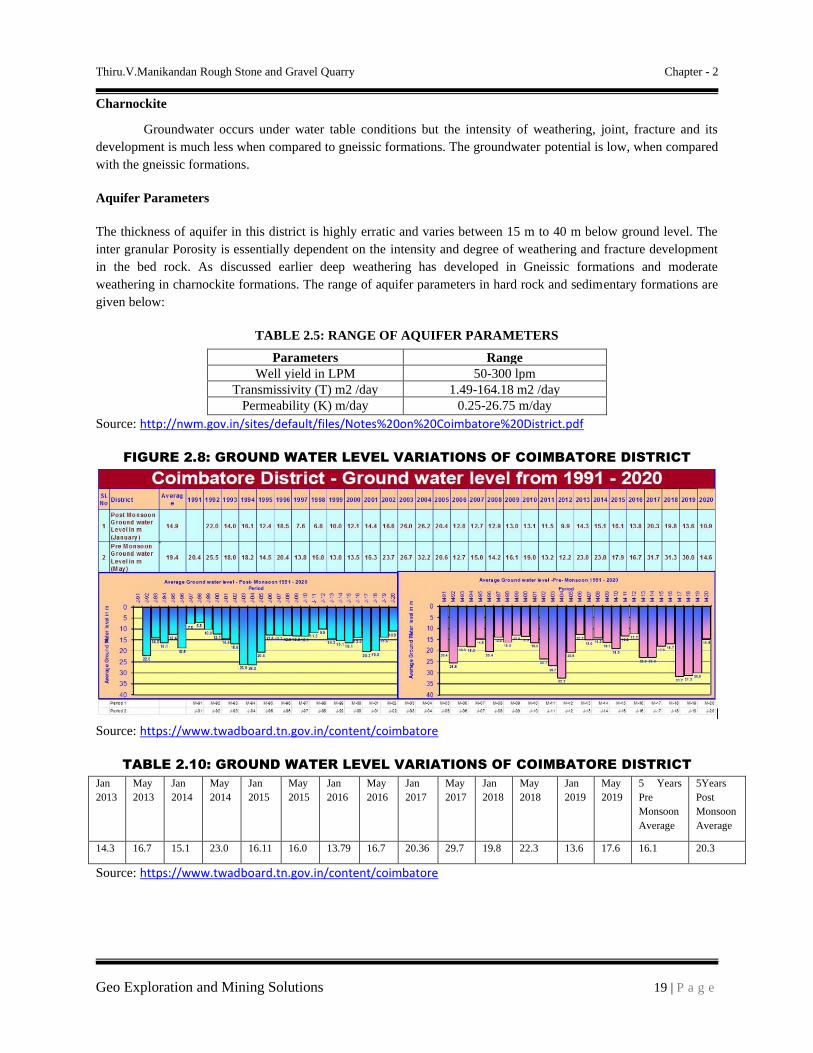
Thiru.V.Manikandan Rough Stone and Gravel Quarry Chapter - 2
Geo Exploration and Mining Solutions 19 | P a g e
Charnockite
Groundwater occurs under water table conditions but the intensity of weathering, joint, fracture and its
development is much less when compared to gneissic formations. The groundwater potential is low, when compared
with the gneissic formations.
Aquifer Parameters
The thickness of aquifer in this district is highly erratic and varies between 15 m to 40 m below ground level. The
inter granular Porosity is essentially dependent on the intensity and degree of weathering and fracture development
in the bed rock. As discussed earlier deep weathering has developed in Gneissic formations and moderate
weathering in charnockite formations. The range of aquifer parameters in hard rock and sedimentary formations are
given below:
TABLE 2.5: RANGE OF AQUIFER PARAMETERS
Parameters Range
Well yield in LPM 50-300 lpm
Transmissivity (T) m2 /day 1.49-164.18 m2 /day
Permeability (K) m/day 0.25-26.75 m/day
Source: http://nwm.gov.in/sites/default/files/Notes%20on%20Coimbatore%20District.pdf
FIGURE 2.8: GROUND WATER LEVEL VARIATIONS OF COIMBATORE DISTRICT
Source: https://www.twadboard.tn.gov.in/content/coimbatore
TABLE 2.10: GROUND WATER LEVEL VARIATIONS OF COIMBATORE DISTRICT
Jan
2013
May
2013
Jan
2014
May
2014
Jan
2015
May
2015
Jan
2016
May
2016
Jan
2017
May
2017
Jan
2018
May
2018
Jan
2019
May
2019
5 Years
Pre
Monsoon
Average
5Years
Post
Monsoon
Average
14.3 16.7 15.1 23.0 16.11 16.0 13.79 16.7 20.36 29.7 19.8 22.3 13.6 17.6 16.1 20.3
Source: https://www.twadboard.tn.gov.in/content/coimbatore
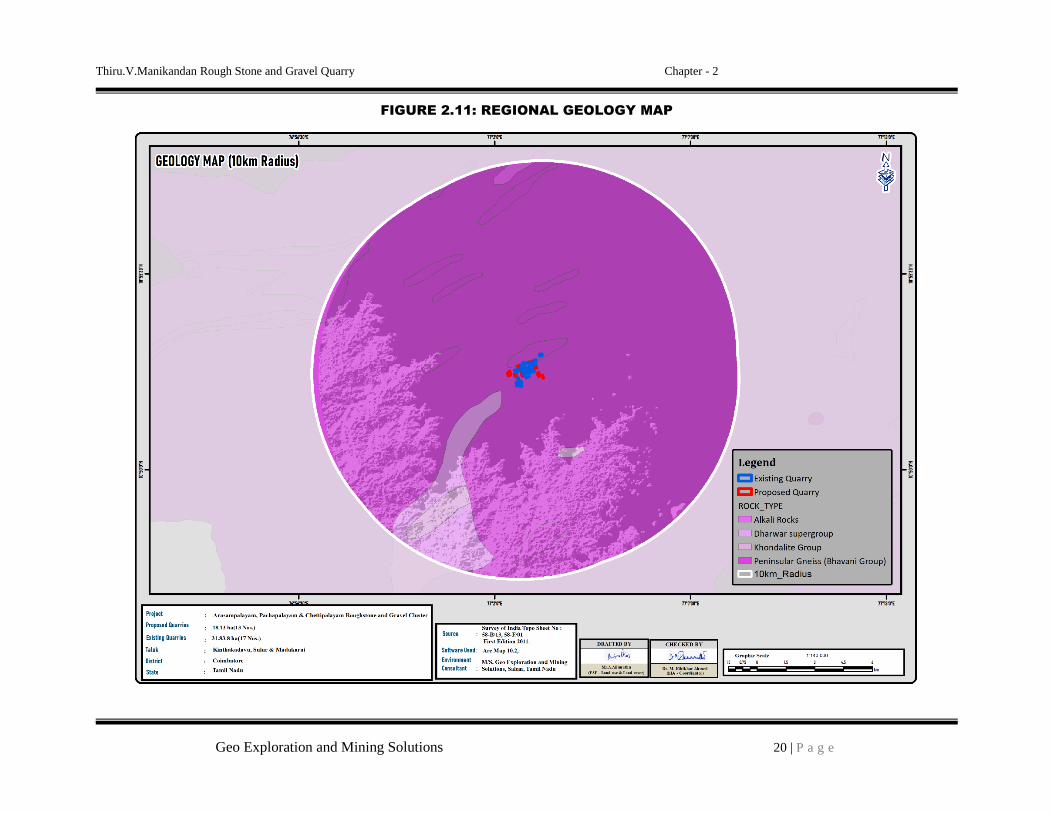
Thiru.V.Manikandan Rough Stone and Gravel Quarry Chapter - 2
Geo Exploration and Mining Solutions 20 | P a g e
FIGURE 2.11: REGIONAL GEOLOGY MAP

Thiru.V.Manikandan Rough Stone and Gravel Quarry Chapter - 2
Geo Exploration and Mining Solutions 21 | P a g e
FIGURE 2.12: GEOMORPHOLOGY MAP

Thiru.V.Manikandan Rough Stone and Gravel Quarry Chapter - 2
Geo Exploration and Mining Solutions 22 | P a g e
FIGURE 2.13: TOPOGRAPHY, GEOLOGICAL, YEARWISE DEVELOPMENT
Source: Approved Mining plan

Thiru.V.Manikandan Rough Stone and Gravel Quarry Chapter - 2
Geo Exploration and Mining Solutions 23 | P a g e
2.4 Resources and Reserves of the Proposed Quarry
The available mineable reserves are calculated after leaving necessary safety distances prescribed in the
Precise area communication letter.
TABLE 2.6: CUMULATIVE PRODUCTION OF ROUGH STONE
Production for five year
plan period
Per Year
Production in m3
Per Day Production
in m3
Number of Lorry Load
Per Day @ 12m3 per load
3,48,355 69,671 232 19 Trips /Day
TABLE 2.7: CUMULATIVE PRODUCTION OF GRAVEL
Mineable Reserves
in m3
Per Year Production in
m3 Per Day in m3 Number of Lorry Load @ 12m3 per load
34,746 11,582 39 3 Trips /Day, 18- Trips /week
Disposal of Waste
In the proposed Quarry no waste is anticipated, quarried out materials (Rough stone and Gravel) will
be utilized (100%).
2.5 Method of Mining
The method of mining is common for all the proposed projects – The method of mining is Opencast
Mechanized Mining Method is being proposed by formation of 5.0 meter height bench with a bench width not less
than the bench height. However, as far as the quarrying of Rough Stone is concerned, observance of the provisions
of Regulation 106 (2) (b) as above is seldom possible due to various inherent petro genetic factors coupled with
mining difficulties. Hence it is proposed to obtain relaxation to the provisions of the above regulation from the
Director of Mines Safety for which necessary provision is available with the Regulation 106 (2) (b) of MMR-1961,
under Mine Act – 1952.
The top layer of overburden (Gravel) will be Excavate directly by Hydraulic Excavators and loaded into
tippers directly and sold to needy customers. The Rough Stone is a batholith formation and the splitting of rock mass
of considerable volume from the parent rock mass will be carried out by deploying jackhammer drilling and Slurry
Explosives will be used for blasting. Hydraulic Excavators attached with Rock Breakers unit will be deployed for
breaking large boulders to required fragmented sizes to avoid secondary blasting and hydraulic excavators attached
with bucket unit will be deployed for loading the Rough Stone into the tippers and then the stone is transported from
pithead to the nearby crushers.
2.5.1 Drilling
Drilling will be carried out as per parameters given below:-
Spacing – 1.2m, Burden –1.0, Depth of hole - 1.5m
2.5.2 Blasting
Blasting will be done as per details below:-
▪ Controlled blasting parameter: -
Spacing – 1.2m
Burden – 1.0 m
Depth of hole – 1.5 m
Charge per hole – 0.5Kg
Powder factor – 6.0 tonnes/kg
Dia of hole – 32 mm
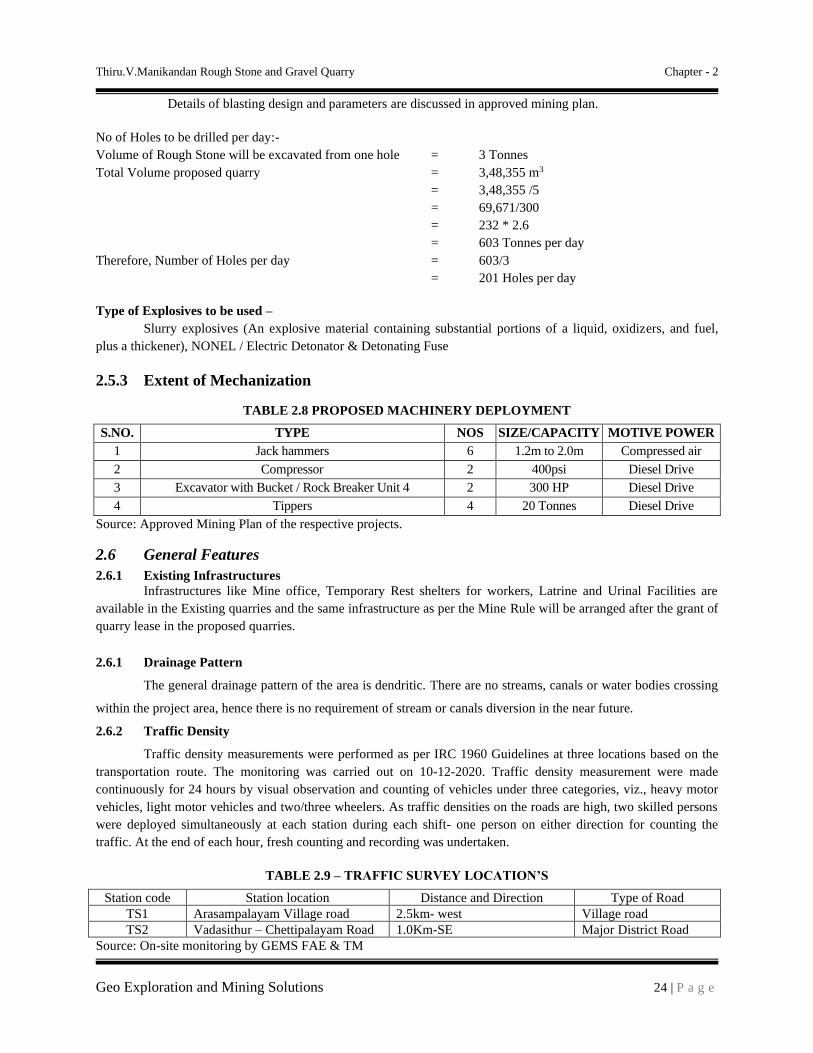
Thiru.V.Manikandan Rough Stone and Gravel Quarry Chapter - 2
Geo Exploration and Mining Solutions 24 | P a g e
Details of blasting design and parameters are discussed in approved mining plan.
No of Holes to be drilled per day:-
Volume of Rough Stone will be excavated from one hole = 3 Tonnes
Total Volume proposed quarry = 3,48,355 m3
= 3,48,355 /5
= 69,671/300
= 232 * 2.6
= 603 Tonnes per day
Therefore, Number of Holes per day = 603/3
= 201 Holes per day
Type of Explosives to be used –
Slurry explosives (An explosive material containing substantial portions of a liquid, oxidizers, and fuel,
plus a thickener), NONEL / Electric Detonator & Detonating Fuse
2.5.3 Extent of Mechanization
TABLE 2.8 PROPOSED MACHINERY DEPLOYMENT
S.NO. TYPE NOS SIZE/CAPACITY MOTIVE POWER
1 Jack hammers 6 1.2m to 2.0m Compressed air
2 Compressor 2 400psi Diesel Drive
3 Excavator with Bucket / Rock Breaker Unit 4 2 300 HP Diesel Drive
4 Tippers 4 20 Tonnes Diesel Drive
Source: Approved Mining Plan of the respective projects.
2.6 General Features
2.6.1 Existing Infrastructures
Infrastructures like Mine office, Temporary Rest shelters for workers, Latrine and Urinal Facilities are
available in the Existing quarries and the same infrastructure as per the Mine Rule will be arranged after the grant of
quarry lease in the proposed quarries.
2.6.1 Drainage Pattern
The general drainage pattern of the area is dendritic. There are no streams, canals or water bodies crossing
within the project area, hence there is no requirement of stream or canals diversion in the near future.
2.6.2 Traffic Density
Traffic density measurements were performed as per IRC 1960 Guidelines at three locations based on the
transportation route. The monitoring was carried out on 10-12-2020. Traffic density measurement were made
continuously for 24 hours by visual observation and counting of vehicles under three categories, viz., heavy motor
vehicles, light motor vehicles and two/three wheelers. As traffic densities on the roads are high, two skilled persons
were deployed simultaneously at each station during each shift- one person on either direction for counting the
traffic. At the end of each hour, fresh counting and recording was undertaken.
TABLE 2.9 – TRAFFIC SURVEY LOCATION’S
Station code Station location Distance and Direction Type of Road
TS1 Arasampalayam Village road 2.5km- west Village road
TS2 Vadasithur – Chettipalayam Road 1.0Km-SE Major District Road
Source: On-site monitoring by GEMS FAE & TM

Thiru.V.Manikandan Rough Stone and Gravel Quarry Chapter - 2
Geo Exploration and Mining Solutions 25 | P a g e
FIGURE 2.14: TRAFFIC SURVEY LOCATIONS & TRANSPORTATION ROUTE MAP
(Source: Survey of India Toposheet)
TABLE 2.10 – EXISTING TRAFFIC VOLUME
Station code HMV (Hourly Average) LMV hourly average 2/3 Hourly average
Total PCU per hour No PCU No PCU No PCU
TS1 24 72 12 12 38 19 103
TS2 102 306 143 143 114 57 506
Source: On-site monitoring by GEMS FAE & TM
• PCU conversion factor for HMV (Trucks and Bus) = 3, LMV (Car, Jeep and Auto) = 1 and 0.5 for Motor
Vehicles (2/3 Wheelers)
TABLE 2.11 – ANTICIPATED TRAFFIC DUE TO THIS PROPOSED PROJECT
Transportation of Rough stone per day
Capacity of trucks Cumulative Trips Volume in PCU
10/20 tonnes
73 per day (63 Trips of Rough stone and 10 Trips of Gravel)
ie., 8 Tippers per hour
162
Source: Anticipated based on Approved Mining Plan Production
TABLE 2.12 – SUMMARY OF TRAFFIC VOLUME
Route Existing traffic
value in PCU
Incremental traffic from
the quarry in PCU
Total traffic
volume
Hourly Capacity in PCU
as per IRC guidelines
Village road 103 162 265 500
Major District Road 506 162 668 1200
Source: On-site monitoring analysis summary by GEMS FAE & TM
As per the IRC 1960 this existing road can handle 1,200 PCU in hour and Major district road can handle
1500 PCU in hour hence there will not be any conjunction due to this transportation.
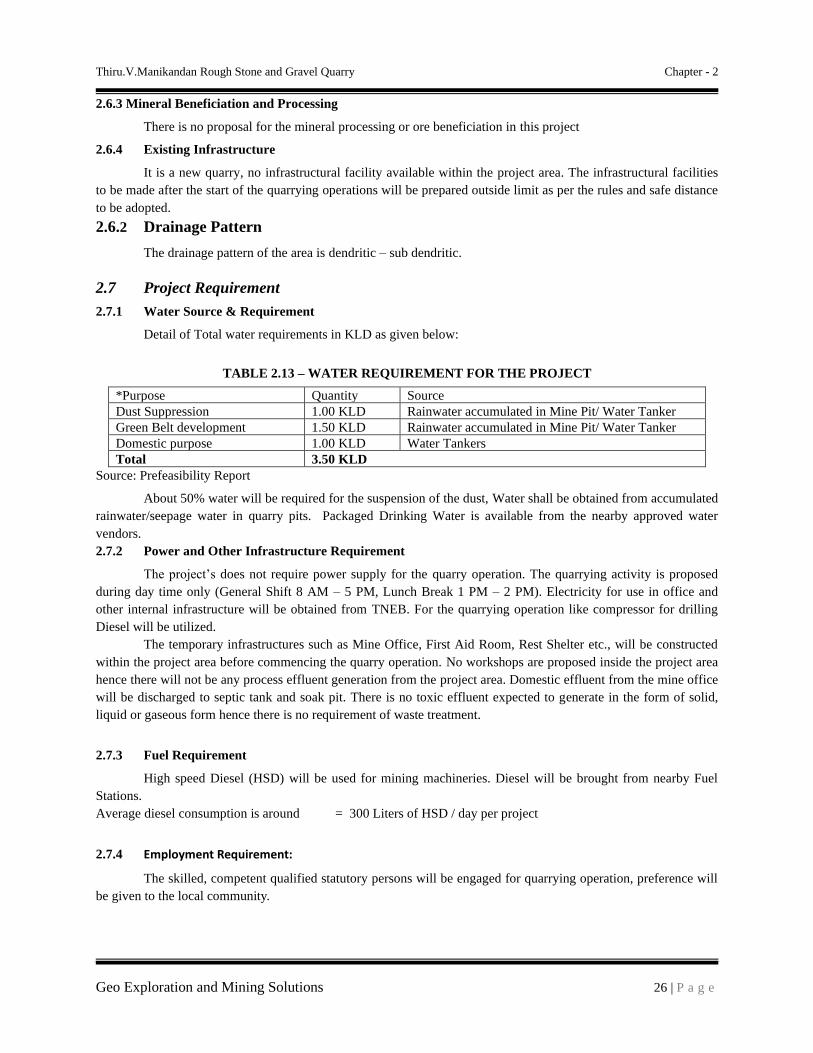
Thiru.V.Manikandan Rough Stone and Gravel Quarry Chapter - 2
Geo Exploration and Mining Solutions 26 | P a g e
2.6.3 Mineral Beneficiation and Processing
There is no proposal for the mineral processing or ore beneficiation in this project
2.6.4 Existing Infrastructure
It is a new quarry, no infrastructural facility available within the project area. The infrastructural facilities
to be made after the start of the quarrying operations will be prepared outside limit as per the rules and safe distance
to be adopted.
2.6.2 Drainage Pattern
The drainage pattern of the area is dendritic – sub dendritic.
2.7 Project Requirement
2.7.1 Water Source & Requirement
Detail of Total water requirements in KLD as given below:
TABLE 2.13 – WATER REQUIREMENT FOR THE PROJECT
*Purpose Quantity Source
Dust Suppression 1.00 KLD Rainwater accumulated in Mine Pit/ Water Tanker
Green Belt development 1.50 KLD Rainwater accumulated in Mine Pit/ Water Tanker
Domestic purpose 1.00 KLD Water Tankers
Total 3.50 KLD
Source: Prefeasibility Report
About 50% water will be required for the suspension of the dust, Water shall be obtained from accumulated
rainwater/seepage water in quarry pits. Packaged Drinking Water is available from the nearby approved water
vendors.
2.7.2 Power and Other Infrastructure Requirement
The project’s does not require power supply for the quarry operation. The quarrying activity is proposed
during day time only (General Shift 8 AM – 5 PM, Lunch Break 1 PM – 2 PM). Electricity for use in office and
other internal infrastructure will be obtained from TNEB. For the quarrying operation like compressor for drilling
Diesel will be utilized.
The temporary infrastructures such as Mine Office, First Aid Room, Rest Shelter etc., will be constructed
within the project area before commencing the quarry operation. No workshops are proposed inside the project area
hence there will not be any process effluent generation from the project area. Domestic effluent from the mine office
will be discharged to septic tank and soak pit. There is no toxic effluent expected to generate in the form of solid,
liquid or gaseous form hence there is no requirement of waste treatment.
2.7.3 Fuel Requirement
High speed Diesel (HSD) will be used for mining machineries. Diesel will be brought from nearby Fuel
Stations.
Average diesel consumption is around = 300 Liters of HSD / day per project
2.7.4 Employment Requirement:
The skilled, competent qualified statutory persons will be engaged for quarrying operation, preference will
be given to the local community.
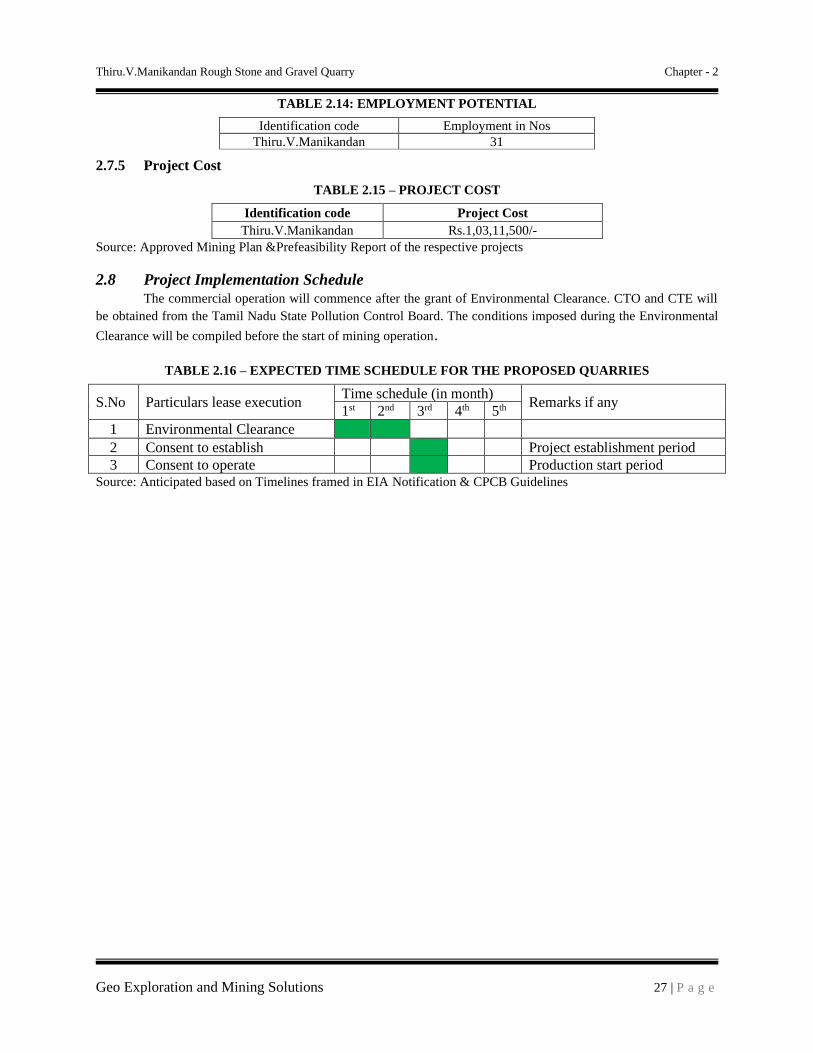
Thiru.V.Manikandan Rough Stone and Gravel Quarry Chapter - 2
Geo Exploration and Mining Solutions 27 | P a g e
TABLE 2.14: EMPLOYMENT POTENTIAL
Identification code Employment in Nos
Thiru.V.Manikandan 31
2.7.5 Project Cost
TABLE 2.15 – PROJECT COST
Identification code Project Cost
Thiru.V.Manikandan Rs.1,03,11,500/-
Source: Approved Mining Plan &Prefeasibility Report of the respective projects
2.8 Project Implementation Schedule
The commercial operation will commence after the grant of Environmental Clearance. CTO and CTE will
be obtained from the Tamil Nadu State Pollution Control Board. The conditions imposed during the Environmental
Clearance will be compiled before the start of mining operation.
TABLE 2.16 – EXPECTED TIME SCHEDULE FOR THE PROPOSED QUARRIES
S.No Particulars lease execution Time schedule (in month)
Remarks if any 1st 2nd 3rd 4th 5th
1 Environmental Clearance
2 Consent to establish Project establishment period
3 Consent to operate Production start period Source: Anticipated based on Timelines framed in EIA Notification & CPCB Guidelines

Thiru.V.Manikandan Rough Stone and Gravel Quarry Chapter - 3
Geo Exploration and Mining Solutions - 28 - | P a g e
CHAPTER – 3: DESCRIPTION OF ENVIRONMENT
3.0 General
This chapter presents a regional background to the baseline data at the very onset, which will help in better
appreciation of micro-level field data, generated on several environmental and ecological attributes of the study area.
The baseline status of the project environment is described section wise for better understanding of the broad-
spectrum conditions. The baseline environment quality represents the background environmental scenario of various
environmental components such as Land, Water, Air, Noise, Biological and Socio-economic status of the study area.
Field monitoring studies to evaluate the base line status of the project site were carried out covering March 2021,
April & May 2021 with CPCB guidelines. Environmental data has been collected with reference to cluster quarries
by Enviro-Tech Services – An ISO 9001: 2015,14001: 2015 & 45001:2015 Certified & MoEF Recognised
Laboratory, accredited by ISO/IEC-17025:2017 (NABL) & UPPCB Certified & MoEF Notified Laboratory, for the
below attributes-
o Land
o Water
o Air
o Noise
o Biological
o Socio-economic status
Study Area
An area of 10 km radius (aerial distance) from the periphery of the cluster is considered for EIA study. The
data collection has been used to understand the existing environment scenario around the cluster quarries against
which the potential impacts of the project can be assessed. The study area has been divided into two zones viz core
zone and buffer zone where core zone is considered as cluster and buffer zone taken as 10km radius from the
periphery of the Cluster. Both Core zone and Buffer zone is taken as the study area.
Study Period
The baseline study was conducted during the pre-monsoon season i.e. March 2021 – May 2021.
Study Methodology
Baseline data’s was generated for various environmental parameters including Land, Soil, Water (surface
and groundwater), Air, Noise, Ecology & Biodiversity and Socio-economic status to determine the quality of the
prevailing environmental settings. A MoEF accredited Laboratory was used for generating the baseline data.
1. The project area (Core zone) was surveyed in detail with the help of Total Station survey instrument and
the boundary pillars were picked up with the help of handheld GPS. The boundary coordinates were
superimposed on the satellite imagery to understand the relief of the area, besides Land use pattern of the
area was studied through the Bhuvan (ISRO).
2. Soil samples were collected and analysed for relevant physico-chemical characteristics, exchangeable
cations, nutrients & micro nutrients etc., in order to assess the impact of mining activities and proposed
greenbelt development
3. Ground water samples were collected during the study period from the open wells and bore wells, while
surface water was collected from river and lake in the buffer zone. The samples were analysed for
parameters necessary to determine water quality (based on IS: 10500:2012 criteria) and those which are
relevant from the point of view of environmental impact of the proposed quarries.
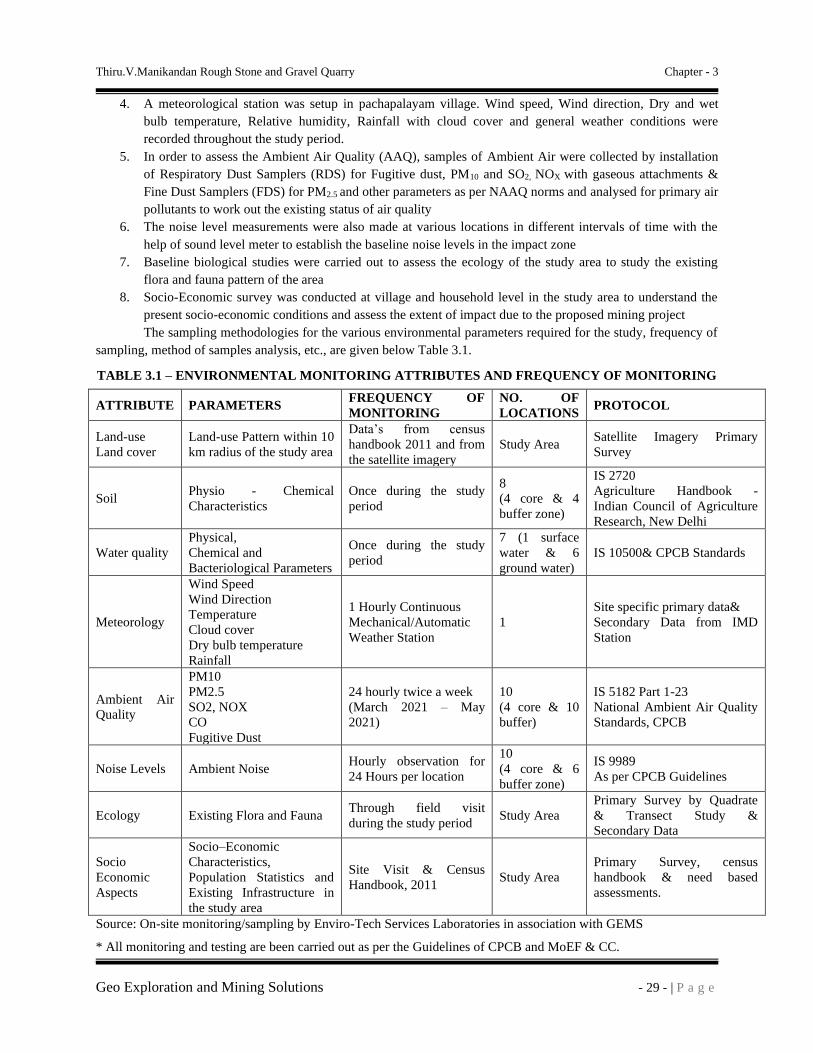
Thiru.V.Manikandan Rough Stone and Gravel Quarry Chapter - 3
Geo Exploration and Mining Solutions - 29 - | P a g e
4. A meteorological station was setup in pachapalayam village. Wind speed, Wind direction, Dry and wet
bulb temperature, Relative humidity, Rainfall with cloud cover and general weather conditions were
recorded throughout the study period.
5. In order to assess the Ambient Air Quality (AAQ), samples of Ambient Air were collected by installation
of Respiratory Dust Samplers (RDS) for Fugitive dust, PM10 and SO2, NOX with gaseous attachments &
Fine Dust Samplers (FDS) for PM2.5 and other parameters as per NAAQ norms and analysed for primary air
pollutants to work out the existing status of air quality
6. The noise level measurements were also made at various locations in different intervals of time with the
help of sound level meter to establish the baseline noise levels in the impact zone
7. Baseline biological studies were carried out to assess the ecology of the study area to study the existing
flora and fauna pattern of the area
8. Socio-Economic survey was conducted at village and household level in the study area to understand the
present socio-economic conditions and assess the extent of impact due to the proposed mining project
The sampling methodologies for the various environmental parameters required for the study, frequency of
sampling, method of samples analysis, etc., are given below Table 3.1.
TABLE 3.1 – ENVIRONMENTAL MONITORING ATTRIBUTES AND FREQUENCY OF MONITORING
ATTRIBUTE PARAMETERS FREQUENCY OF
MONITORING
NO. OF
LOCATIONS PROTOCOL
Land-use
Land cover
Land-use Pattern within 10
km radius of the study area
Data’s from census
handbook 2011 and from
the satellite imagery
Study Area Satellite Imagery Primary
Survey
Soil Physio - Chemical
Characteristics
Once during the study
period
8
(4 core & 4
buffer zone)
IS 2720
Agriculture Handbook -
Indian Council of Agriculture
Research, New Delhi
Water quality
Physical,
Chemical and
Bacteriological Parameters
Once during the study
period
7 (1 surface
water & 6
ground water)
IS 10500& CPCB Standards
Meteorology
Wind Speed
Wind Direction
Temperature
Cloud cover
Dry bulb temperature
Rainfall
1 Hourly Continuous
Mechanical/Automatic
Weather Station
1
Site specific primary data&
Secondary Data from IMD
Station
Ambient Air
Quality
PM10
PM2.5
SO2, NOX
CO
Fugitive Dust
24 hourly twice a week
(March 2021 – May
2021)
10
(4 core & 10
buffer)
IS 5182 Part 1-23
National Ambient Air Quality
Standards, CPCB
Noise Levels Ambient Noise Hourly observation for
24 Hours per location
10
(4 core & 6
buffer zone)
IS 9989
As per CPCB Guidelines
Ecology Existing Flora and Fauna Through field visit
during the study period Study Area
Primary Survey by Quadrate
& Transect Study &
Secondary Data
Socio
Economic
Aspects
Socio–Economic
Characteristics,
Population Statistics and
Existing Infrastructure in
the study area
Site Visit & Census
Handbook, 2011 Study Area
Primary Survey, census
handbook & need based
assessments.
Source: On-site monitoring/sampling by Enviro-Tech Services Laboratories in association with GEMS
* All monitoring and testing are been carried out as per the Guidelines of CPCB and MoEF & CC.
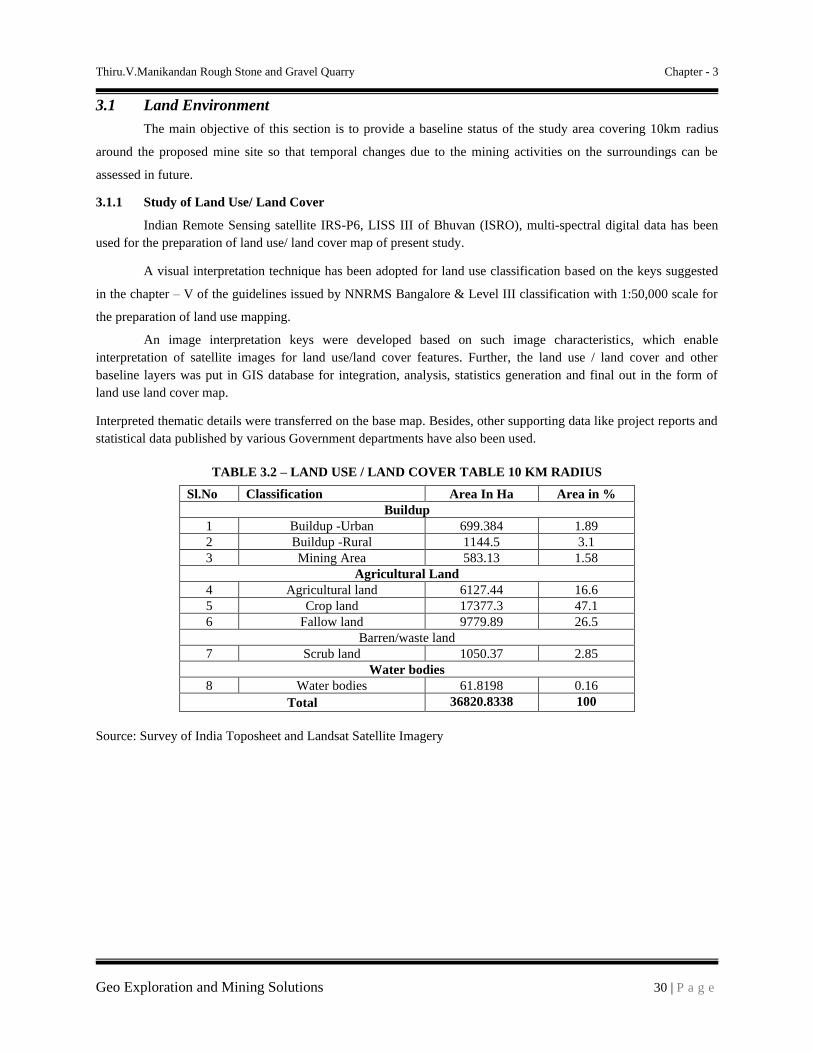
Thiru.V.Manikandan Rough Stone and Gravel Quarry Chapter - 3
Geo Exploration and Mining Solutions 30 | P a g e
3.1 Land Environment
The main objective of this section is to provide a baseline status of the study area covering 10km radius
around the proposed mine site so that temporal changes due to the mining activities on the surroundings can be
assessed in future.
3.1.1 Study of Land Use/ Land Cover
Indian Remote Sensing satellite IRS-P6, LISS III of Bhuvan (ISRO), multi-spectral digital data has been
used for the preparation of land use/ land cover map of present study.
A visual interpretation technique has been adopted for land use classification based on the keys suggested
in the chapter – V of the guidelines issued by NNRMS Bangalore & Level III classification with 1:50,000 scale for
the preparation of land use mapping.
An image interpretation keys were developed based on such image characteristics, which enable
interpretation of satellite images for land use/land cover features. Further, the land use / land cover and other
baseline layers was put in GIS database for integration, analysis, statistics generation and final out in the form of
land use land cover map.
Interpreted thematic details were transferred on the base map. Besides, other supporting data like project reports and
statistical data published by various Government departments have also been used.
TABLE 3.2 – LAND USE / LAND COVER TABLE 10 KM RADIUS
Sl.No Classification Area In Ha Area in %
Buildup
1 Buildup -Urban 699.384 1.89
2 Buildup -Rural 1144.5 3.1
3 Mining Area 583.13 1.58
Agricultural Land
4 Agricultural land 6127.44 16.6
5 Crop land 17377.3 47.1
6 Fallow land 9779.89 26.5
Barren/waste land
7 Scrub land 1050.37 2.85
Water bodies
8 Water bodies 61.8198 0.16
Total 36820.8338 100
Source: Survey of India Toposheet and Landsat Satellite Imagery
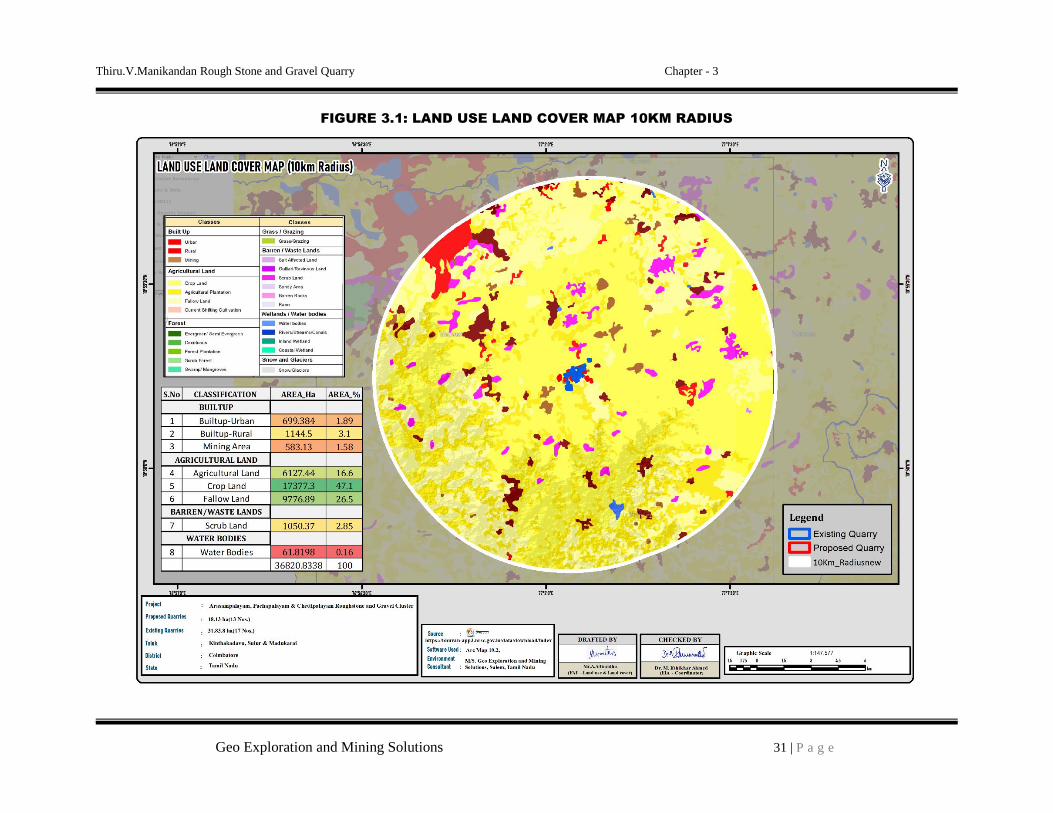
Thiru.V.Manikandan Rough Stone and Gravel Quarry Chapter - 3
Geo Exploration and Mining Solutions 31 | P a g e
FIGURE 3.1: LAND USE LAND COVER MAP 10KM RADIUS
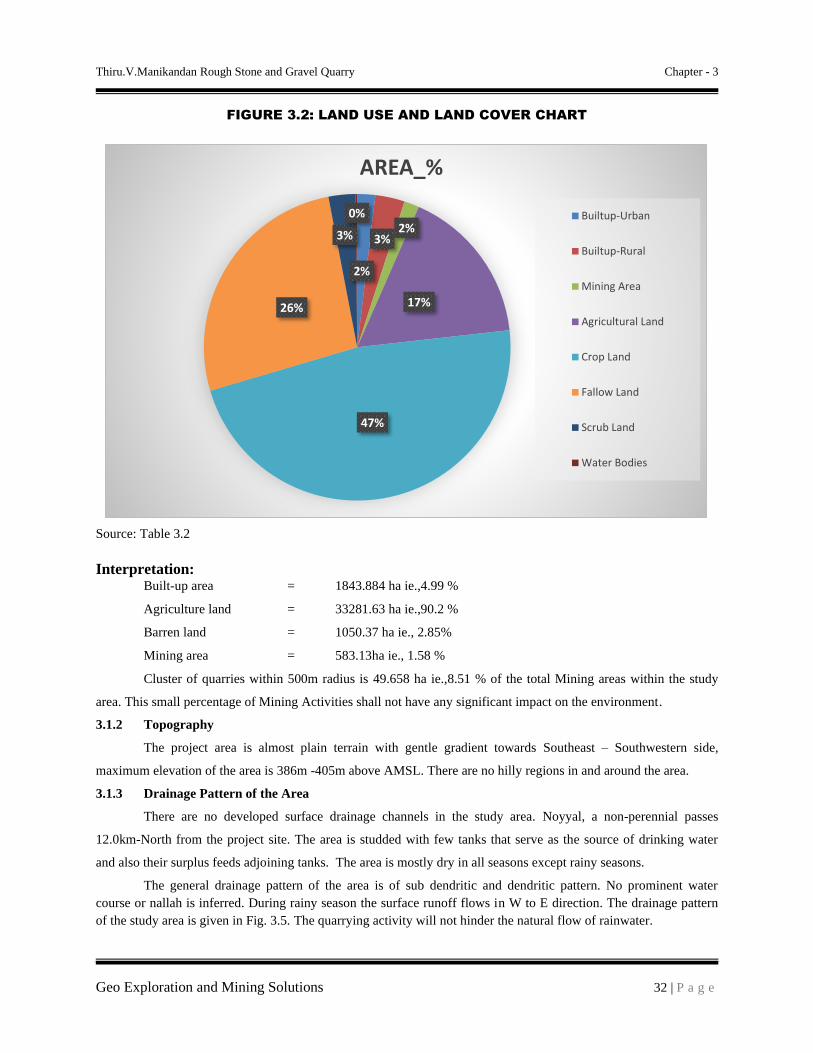
Thiru.V.Manikandan Rough Stone and Gravel Quarry Chapter - 3
Geo Exploration and Mining Solutions 32 | P a g e
FIGURE 3.2: LAND USE AND LAND COVER CHART
Source: Table 3.2
Interpretation: Built-up area = 1843.884 ha ie.,4.99 %
Agriculture land = 33281.63 ha ie.,90.2 %
Barren land = 1050.37 ha ie., 2.85%
Mining area = 583.13ha ie., 1.58 %
Cluster of quarries within 500m radius is 49.658 ha ie.,8.51 % of the total Mining areas within the study
area. This small percentage of Mining Activities shall not have any significant impact on the environment.
3.1.2 Topography
The project area is almost plain terrain with gentle gradient towards Southeast – Southwestern side,
maximum elevation of the area is 386m -405m above AMSL. There are no hilly regions in and around the area.
3.1.3 Drainage Pattern of the Area
There are no developed surface drainage channels in the study area. Noyyal, a non-perennial passes
12.0km-North from the project site. The area is studded with few tanks that serve as the source of drinking water
and also their surplus feeds adjoining tanks. The area is mostly dry in all seasons except rainy seasons.
The general drainage pattern of the area is of sub dendritic and dendritic pattern. No prominent water
course or nallah is inferred. During rainy season the surface runoff flows in W to E direction. The drainage pattern
of the study area is given in Fig. 3.5. The quarrying activity will not hinder the natural flow of rainwater.
2%
3%2%
17%
47%
26%
3%
0%
AREA_%
Builtup-Urban
Builtup-Rural
Mining Area
Agricultural Land
Crop Land
Fallow Land
Scrub Land
Water Bodies

Thiru.V.Manikandan Rough Stone and Gravel Quarry Chapter - 3
Geo Exploration and Mining Solutions 33 | P a g e
3.1.2 Environmental Features in the Study Area
There is no Wildlife Sanctuaries, National Park and Archaeological monuments within the study area. No
Protected and Reserved Forest area is involved in the project area. Therefore, there will be no need to
acquisition/diversion of forest land. The details related to the environment sensitivity around the mine lease area i.e.
10 km radius of the mine lease area, are given in the below Table 3.3.
3.1.5 Seismic Sensitivity
The proposed project site falls in the seismic Zone II, low damage risk zone as per BMTPC, Vulnerability
Atlas of Seismic zone of India IS: 1893 – 2002. The project area falls in the hard rock terrain on the peninsular
shield of south India which is highly stable.
TABLE 3.3 – DETAILS OF ENVIRONMENT SENSITIVITY AROUND THE PROJECT AREA
Sl.No Sensitive Ecological Features Name Arial Distance in km from Mine Lease Boundary
1 National Park /
Wild life Sanctuaries None Nil within 10 km Radius
2 Reserve Forest None Nil within 10 km radius
3
Tiger Reserve/
Elephant Reserve/
Biosphere Reserve
None Nil within 10KM Radius
4 Critically Polluted Areas None Nil within 10Km Radius
5 Mangroves None Nil within 10Km Radius
6 Mountains/Hills None Nil within 10Km Radius
7 Notified Archaeological Sites None Nil within 10Km Radius
8 Defence Installation None Nil within 10Km Radius
Source: Survey of India Toposheet, Village Cadastral Map& Google Earth/Maps
TABLE 3.4 – WATER BODIES WITHIN THE PROPOSED QUARRY
1 Odai near_Kothavadi 8.3km_SE
2 Tank Near Gurunallipalayam 7.3km_SE
3 Tank Near Myleripalayam 2.2km_SW
4 Tank Near Chettipalaym 3.8km_NW
5 Odai Near Thekani 1.2km_NE
Source: Village Cadastral Map and Field Survey
3.1.6 Soil Environment
Soil quality of the study area is one of the important components of the land environment. The composite
soil samples were collected from the study area and analysed for different parameters. The locations of the
monitoring sites are detailed in Table 3.4 and Figure 3.3.
TABLE 3.5 – SOIL SAMPLING LOCATIONS
S. No Location Code Monitoring Locations Distance & Direction Coordinates
1 S-1 Core Zone - 10°52'40.49"N 77° 3'12.69"E
2 S-2 Core Zone - 10°52'51.81"N 77° 3'8.35"E
3 S-3 Core Zone - 10°52'54.81"N 77° 2'42.92"E
4 S-4 Core Zone - 10°52'36.37"N 77° 2'44.84"E
5 S-5 Malumichampatty 3.5km NW 10°54'14.16"N 77° 0'51.37"E
6 S-6 Chettipalayam 3km North 10°55'1.66"N 77° 2'52.62"E
7 S-7 Vadasithur 4.5km SE 10°50'23.00"N 77° 4'57.67"E
8 S-8 Ponnakkani 4.5km NE 10°53'30.03"N 77° 5'48.78"E
Source: On-site monitoring/sampling by Enviro-Tech Services Laboratories in association with GEMS

Thiru.V.Manikandan Rough Stone and Gravel Quarry Chapter - 3
Geo Exploration and Mining Solutions 34 | P a g e
The objective of the soil sampling is -
1. To determine the baseline soil characteristics of the study area;
2. To determine the impact of proposed activity on soil characteristics and;
To determine the impact on soil more importantly agriculture production point of view.
Methodology –
For studying soil quality, sampling locations were selected to assess the existing soil conditions in and
around the proposed quarry site representing various land use conditions. The samples were collected by auger
boring into the soil up to 90-cm depth. eight (8) locations were selected for soil sampling on the basis of soil
types, vegetative cover, industrial & residential activities including infrastructure facilities, which would accord an
overall idea of the soil characteristics. The samples were analysed for physical and chemical characteristics. The
sealed samples were sent to laboratory for analysis. The samples were filled in Polythene bags, coded and sent to
laboratory for analysis and the details of methodology in respect are given in below Table 3.5.
TABLE 3.6 – METHODOLOGY OF SAMPLING COLLECTION
Particulars Details
Frequency One grab sample from each station-once during the study period
Methodology Composite grab samples of the topsoil were collected from 3 depths, and mixed to provide a
representative sample for analysis. They were stored in airtight Polythene bags and analysed at the
laboratory.
Source: On-site monitoring/sampling by Enviro-Tech Services Laboratories in association with GEMS
Soil Testing Result –
The samples were analysed as per the standard methods prescribed in “Soil Chemical Analysis (M.L.
Jackson, 1967) & Department of Agriculture, Cooperation & Farmers Welfare, Ministry of Agriculture & Farmers
Welfare, Government of India”. The important properties analysed for soil are bulk density, porosity, infiltration
rate, pH and Organic matter, kjeldahi Nitrogen, Phosphorous and Potassium. The standard classification of soil and
physico-chemical characteristics of the soils are presented below in Table 3.6 & Test Results in Table 3.7.
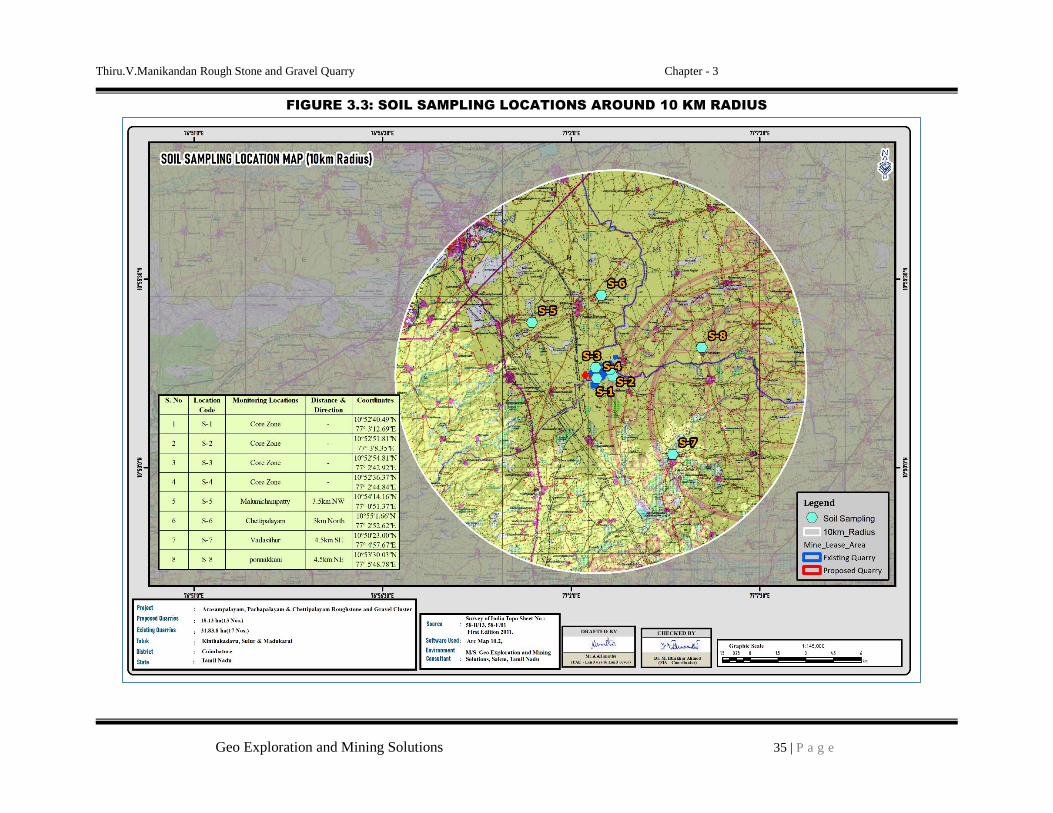
Thiru.V.Manikandan Rough Stone and Gravel Quarry Chapter - 3
Geo Exploration and Mining Solutions 35 | P a g e
FIGURE 3.3: SOIL SAMPLING LOCATIONS AROUND 10 KM RADIUS

Thiru.V.Manikandan Rough Stone and Gravel Quarry Chapter - 3
Geo Exploration and Mining Solutions - 36 - | P a g e
FIGURE 3.4: SOIL MAP
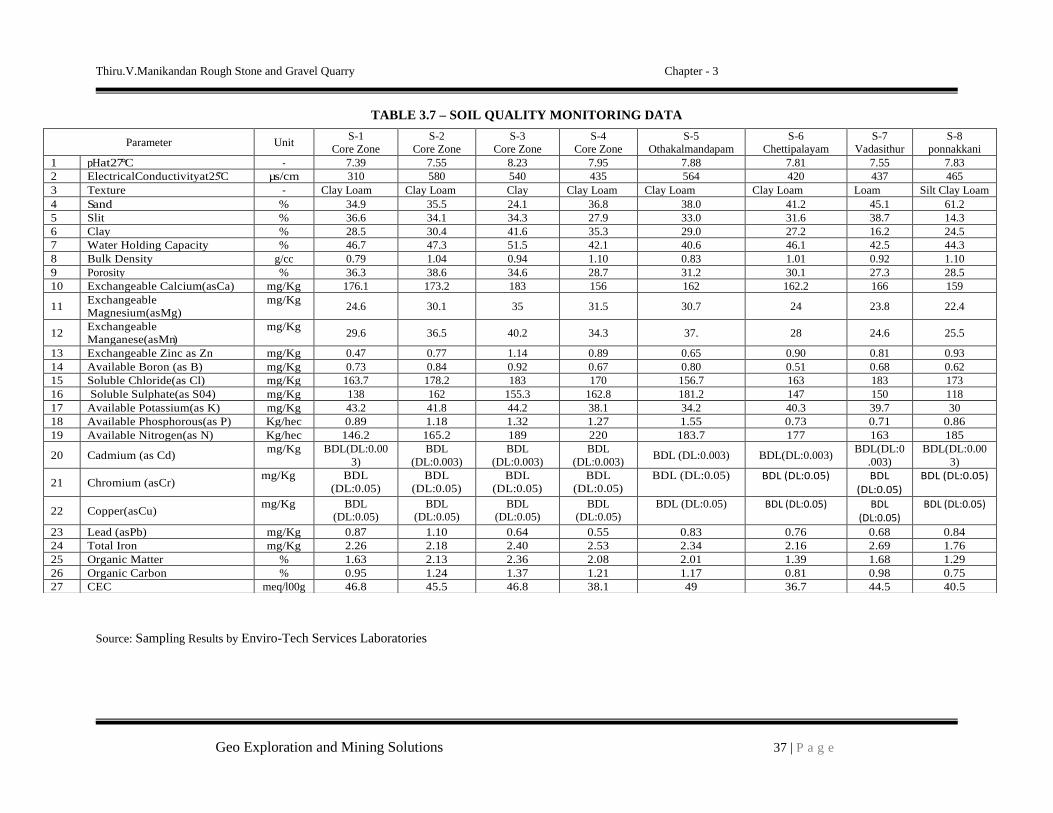
Thiru.V.Manikandan Rough Stone and Gravel Quarry Chapter - 3
Geo Exploration and Mining Solutions 37 | P a g e
TABLE 3.7 – SOIL QUALITY MONITORING DATA
Source: Sampling Results by Enviro-Tech Services Laboratories
Parameter Unit S-1
Core Zone
S-2
Core Zone
S-3
Core Zone
S-4
Core Zone
S-5
Othakalmandapam
S-6
Chettipalayam
S-7
Vadasithur
S-8
ponnakkani
1 pHat27°C - 7.39 7.55 8.23 7.95 7.88 7.81 7.55 7.83
2 ElectricalConductivityat25̊C µs/cm 310 580 540 435 564 420 437 465
3 Texture - Clay Loam Clay Loam Clay Clay Loam Clay Loam Clay Loam Loam Silt Clay Loam
4 Sand % 34.9 35.5 24.1 36.8 38.0 41.2 45.1 61.2
5 Slit % 36.6 34.1 34.3 27.9 33.0 31.6 38.7 14.3
6 Clay % 28.5 30.4 41.6 35.3 29.0 27.2 16.2 24.5
7 Water Holding Capacity % 46.7 47.3 51.5 42.1 40.6 46.1 42.5 44.3
8 Bulk Density g/cc 0.79 1.04 0.94 1.10 0.83 1.01 0.92 1.10
9 Porosity % 36.3 38.6 34.6 28.7 31.2 30.1 27.3 28.5
10 Exchangeable Calcium(asCa) mg/Kg 176.1 173.2 183 156 162 162.2 166 159
11 Exchangeable
Magnesium(asMg)
mg/Kg 24.6 30.1 35 31.5 30.7 24 23.8 22.4
12 Exchangeable
Manganese(asMn)
mg/Kg 29.6 36.5 40.2 34.3 37. 28 24.6 25.5
13 Exchangeable Zinc as Zn mg/Kg 0.47 0.77 1.14 0.89 0.65 0.90 0.81 0.93
14 Available Boron (as B) mg/Kg 0.73 0.84 0.92 0.67 0.80 0.51 0.68 0.62
15 Soluble Chloride(as Cl) mg/Kg 163.7 178.2 183 170 156.7 163 183 173
16 Soluble Sulphate(as S04) mg/Kg 138 162 155.3 162.8 181.2 147 150 118
17 Available Potassium(as K) mg/Kg 43.2 41.8 44.2 38.1 34.2 40.3 39.7 30
18 Available Phosphorous(as P) Kg/hec 0.89 1.18 1.32 1.27 1.55 0.73 0.71 0.86
19 Available Nitrogen(as N) Kg/hec 146.2 165.2 189 220 183.7 177 163 185
20 Cadmium (as Cd) mg/Kg BDL(DL:0.00
3)
BDL
(DL:0.003)
BDL
(DL:0.003)
BDL
(DL:0.003) BDL (DL:0.003) BDL(DL:0.003)
BDL(DL:0
.003)
BDL(DL:0.00
3)
21 Chromium (asCr) mg/Kg BDL
(DL:0.05)
BDL
(DL:0.05)
BDL
(DL:0.05)
BDL
(DL:0.05)
BDL (DL:0.05) BDL (DL:0.05) BDL (DL:0.05)
BDL (DL:0.05)
22 Copper(asCu) mg/Kg BDL
(DL:0.05)
BDL
(DL:0.05)
BDL
(DL:0.05)
BDL
(DL:0.05)
BDL (DL:0.05) BDL (DL:0.05) BDL (DL:0.05)
BDL (DL:0.05)
23 Lead (asPb) mg/Kg 0.87 1.10 0.64 0.55 0.83 0.76 0.68 0.84
24 Total Iron mg/Kg 2.26 2.18 2.40 2.53 2.34 2.16 2.69 1.76
25 Organic Matter % 1.63 2.13 2.36 2.08 2.01 1.39 1.68 1.29
26 Organic Carbon % 0.95 1.24 1.37 1.21 1.17 0.81 0.98 0.75
27 CEC meq/l00g 46.8 45.5 46.8 38.1 49 36.7 44.5 40.5

Thiru.V.Manikandan Rough Stone and Gravel Quarry Chapter - 3
Geo Exploration and Mining Solutions 38 | P a g e
Interpretation & Conclusion
Physical Characteristics –
The physical properties of the soil samples were examined for texture, bulk density, porosity and water
holding capacity. The soil texture found in the study area is Clay to Sandy Soil and Bulk Density of Soils in the
study area varied between 0.79 – 1.10 g/cc. The Water Holding Capacity and Porosity of the soil samples is found to
be medium i.e. ranging from 30.1 – 47.3 %.
Chemical Characteristics –
• The nature of soil is slightly alkaline to strongly alkaline in nature with pH range 7.39 to 8.23
• The available Nitrogen content range between 146.2 to 220 kg/ha
• The available Phosphorus content range between 0.71 to 1.55 kg/ha
• The available Potassium range between 30.0 to 44.2 mg/kg
Whereas, the micronutrient as zinc (Zn), iron (Fe) and copper (Cu) were found in the range of 0.47 to 1.14
mg/kg; 1.76 to 2.69 mg/kg and ND
Wilting co efficient in significant level would mean that the soil would support the vegetation. The soil
properties in the buffer zone reveal that the soil can sustain vegetation. If amended suitability the core area can also
withstand plantation.
3.2 Water Environment
The water resources, both surface and groundwater play a significant role in the development of the area.
The purpose of this study is to assess the water quality characteristics for critical parameters and evaluate the
impacts on agricultural productivity, domestic community usage, recreational resources and aesthetics in the
vicinity. The water samples were collected and transported as per the norms in pre-treated sampling cans to
laboratory for analysis.
3.2.1 Surface Water Resources:
Noyyal river lies at 12.5 Km North from the project cluster. The area is studded with few tanks that serve
as the source for agriculture and also their surplus feeds adjoining tanks. The rainfall over the area is moderate, the
rainwater storage in open wells, trenches is in practice over the area and the stored water acts as source of freshwater
for couple of months after rainy season.
3.2.2 Ground Water Resources:
The terrain is underlain by hard rock formations, Fissured and fractured crystalline rocks constitute the
important aquifer systems in the Coimbatore region. Ground water occurs under phreatic to semi-confined
conditions in these formations and is being developed by means of dug wells and filter points. Proterozoic formation
is the basement rocks which consist of quartzite, crystalline limestone, calc-granulite, hornblende – biotite gneiss,
charnockite or pyroxene granulite, granite and pegmatite. Weathered, a fissured cracks, shear zones and joints in the
basement rock act as a good groundwater potential zone in the study area.
The study area falls in the Sulur block which is categorized as over-exploited zone as per G.O (MS) No 113 dated
09.06.2016.
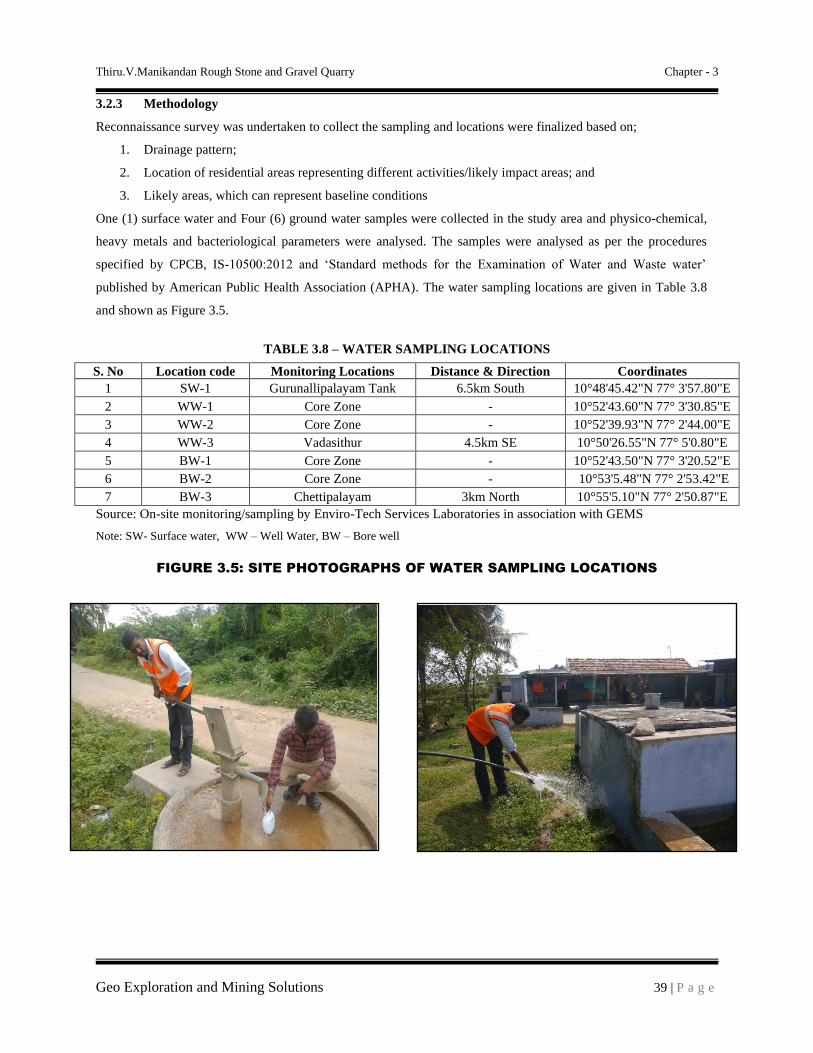
Thiru.V.Manikandan Rough Stone and Gravel Quarry Chapter - 3
Geo Exploration and Mining Solutions 39 | P a g e
3.2.3 Methodology
Reconnaissance survey was undertaken to collect the sampling and locations were finalized based on;
1. Drainage pattern;
2. Location of residential areas representing different activities/likely impact areas; and
3. Likely areas, which can represent baseline conditions
One (1) surface water and Four (6) ground water samples were collected in the study area and physico-chemical,
heavy metals and bacteriological parameters were analysed. The samples were analysed as per the procedures
specified by CPCB, IS-10500:2012 and ‘Standard methods for the Examination of Water and Waste water’
published by American Public Health Association (APHA). The water sampling locations are given in Table 3.8
and shown as Figure 3.5.
TABLE 3.8 – WATER SAMPLING LOCATIONS
S. No Location code Monitoring Locations Distance & Direction Coordinates
1 SW-1 Gurunallipalayam Tank 6.5km South 10°48'45.42"N 77° 3'57.80"E
2 WW-1 Core Zone - 10°52'43.60"N 77° 3'30.85"E
3 WW-2 Core Zone - 10°52'39.93"N 77° 2'44.00"E
4 WW-3 Vadasithur 4.5km SE 10°50'26.55"N 77° 5'0.80"E
5 BW-1 Core Zone - 10°52'43.50"N 77° 3'20.52"E
6 BW-2 Core Zone - 10°53'5.48"N 77° 2'53.42"E
7 BW-3 Chettipalayam 3km North 10°55'5.10"N 77° 2'50.87"E
Source: On-site monitoring/sampling by Enviro-Tech Services Laboratories in association with GEMS
Note: SW- Surface water, WW – Well Water, BW – Bore well
FIGURE 3.5: SITE PHOTOGRAPHS OF WATER SAMPLING LOCATIONS
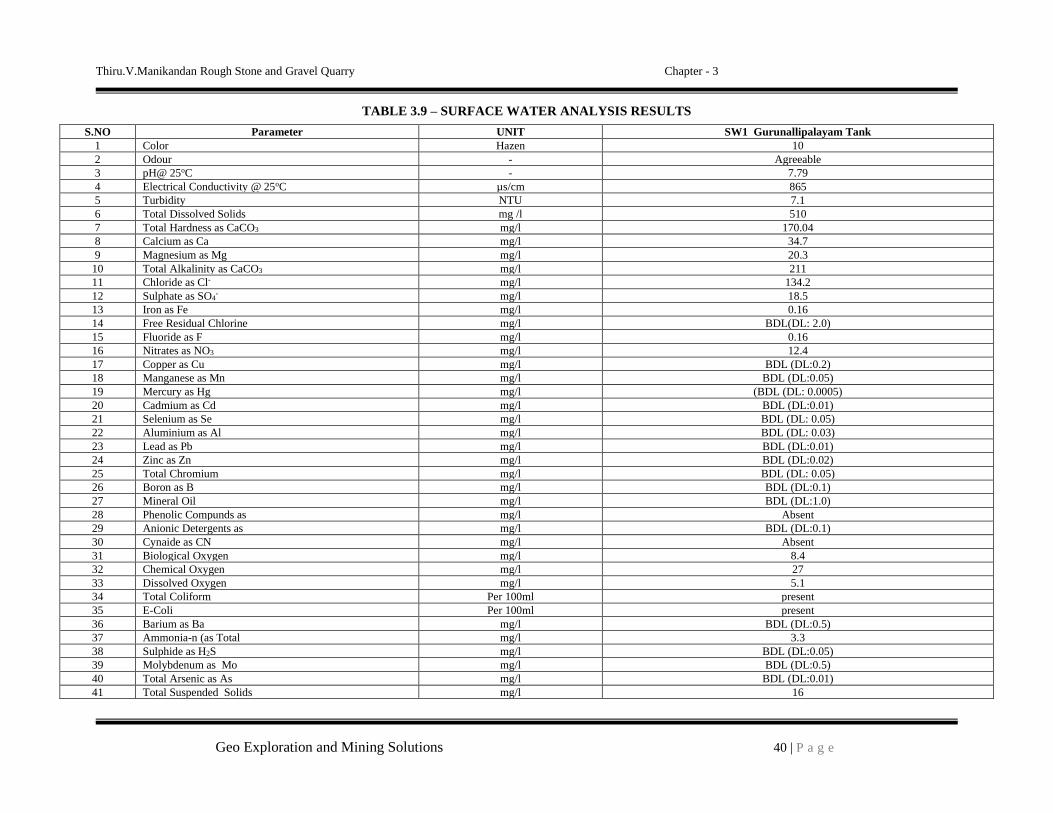
Thiru.V.Manikandan Rough Stone and Gravel Quarry Chapter - 3
Geo Exploration and Mining Solutions 40 | P a g e
TABLE 3.9 – SURFACE WATER ANALYSIS RESULTS
S.NO Parameter UNIT SW1 Gurunallipalayam Tank
1 Color Hazen 10
2 Odour - Agreeable
3 pH@ 25oC - 7.79
4 Electrical Conductivity @ 25oC µs/cm 865
5 Turbidity NTU 7.1
6 Total Dissolved Solids mg /l 510
7 Total Hardness as CaCO3 mg/l 170.04
8 Calcium as Ca mg/l 34.7
9 Magnesium as Mg mg/l 20.3
10 Total Alkalinity as CaCO3 mg/l 211
11 Chloride as Cl- mg/l 134.2
12 Sulphate as SO4- mg/l 18.5
13 Iron as Fe mg/l 0.16
14 Free Residual Chlorine mg/l BDL(DL: 2.0)
15 Fluoride as F mg/l 0.16
16 Nitrates as NO3 mg/l 12.4
17 Copper as Cu mg/l BDL (DL:0.2)
18 Manganese as Mn mg/l BDL (DL:0.05)
19 Mercury as Hg mg/l (BDL (DL: 0.0005)
20 Cadmium as Cd mg/l BDL (DL:0.01)
21 Selenium as Se mg/l BDL (DL: 0.05)
22 Aluminium as Al mg/l BDL (DL: 0.03)
23 Lead as Pb mg/l BDL (DL:0.01)
24 Zinc as Zn mg/l BDL (DL:0.02)
25 Total Chromium mg/l BDL (DL: 0.05)
26 Boron as B mg/l BDL (DL:0.1)
27 Mineral Oil mg/l BDL (DL:1.0)
28 Phenolic Compunds as mg/l Absent
29 Anionic Detergents as mg/l BDL (DL:0.1)
30 Cynaide as CN mg/l Absent
31 Biological Oxygen mg/l 8.4
32 Chemical Oxygen mg/l 27
33 Dissolved Oxygen mg/l 5.1
34 Total Coliform Per 100ml present
35 E-Coli Per 100ml present
36 Barium as Ba mg/l BDL (DL:0.5)
37 Ammonia-n (as Total mg/l 3.3
38 Sulphide as H2S mg/l BDL (DL:0.05)
39 Molybdenum as Mo mg/l BDL (DL:0.5)
40 Total Arsenic as As mg/l BDL (DL:0.01)
41 Total Suspended Solids mg/l 16

Thiru.V.Manikandan Rough Stone and Gravel Quarry Chapter - 3
Geo Exploration and Mining Solutions 41 | P a g e
TABLE 3.10 – GROUND WATER ANALYSIS RESULTS
S.NO Parameter Unit WW2
Core Zone
WW3
Core Zone
WW4
Vadasithur
BW5
Core Zone
BW6
Core Zone
BW7
Chettipalayam
1 Color Hazen < 5 < 5 < 5 < 5 < 5 < 5
2 Odour - Agreeable Agreeable Agreeable Agreeable Agreeable Agreeable
3 pH@ 25oC - 7.06 6.71 7.55 7.67 7.08 8.27
4 Electrical Conductivity µs/cm 956 800 959 825 888 764
5 Turbidity NTU < 1 < 1 < 1 < 1 < 1 < 1
6 Total Dissolved Solids mg /l 564 472 566 486 524 451
7 Total Hardness as CaCO3 mg/l 180.52 143.1 189.59 132.84 201.95 103.6
8 Calcium as Ca mg/l 36.1 29.7 33.8 22.1 38.1 20.3
9 Magnesium as Mg mg/l 22 16.8 25.6 18.9 26 12.9
10 Total Alkalinity mg/l 173 144 186.1 160 157.3 146
11 Chloride as Cl- mg/l 200 179 210 165.2 176 162
12 Sulphate as SO4- mg/l 20.7 15.1 19.2 17.1 19.4 11.8
13 Iron as Fe mg/l 0.22 BDL(DL:0.1) BDL(DL:0.1) 0.11 0.22 BDL(DL:0.1)
14 Free Residual Chlorine mg/l BDL(DL: 2.0) BDL(DL: 2.0) BDL(DL: 2.0) BDL(DL: 2.0) BDL(DL: 2.0) BDL(DL: 2.0)
15 Fluoride as F mg/l 0.17 0.21 0.15 0.61 0.16 0.20
16 Nitrates as NO3 mg/l 10.2 8.5 9.7 7.7 6.8 8.4
17 Copper as Cu mg/l BDL (DL:0.2) BDL (DL:0.2) BDL (DL:0.2) BDL (DL:0.2) BDL (DL:0.2) BDL (DL:0.2)
18 Manganese as Mn mg/l BDL (DL:0.05) BDL (DL:0.05) BDL (DL:0.05) BDL (DL:0.05) BDL (DL:0.05) BDL (DL:0.05)
19 Mercury as Hg mg/l (BDL (DL: 0.0005) (BDL (DL: 0.0005) (BDL (DL: 0.0005) (BDL (DL: 0.0005) (BDL (DL: 0.0005) (BDL (DL: 0.0005)
20 Cadmium as Cd mg/l BDL (DL:0.01) BDL (DL:0.01) BDL (DL:0.01) BDL (DL:0.01) BDL (DL:0.01) BDL (DL:0.01)
21 Selenium as Se mg/l BDL (DL: 0.05) BDL (DL: 0.05) BDL (DL: 0.05) BDL (DL: 0.05) BDL (DL: 0.05) BDL (DL: 0.05)
22 Aluminium as Al mg/l BDL (DL: 0.03) BDL (DL: 0.03) BDL (DL: 0.03) BDL (DL: 0.03) BDL (DL: 0.03) BDL (DL: 0.03)
23 Lead as Pb mg/l BDL (DL:0.01) BDL (DL:0.01) BDL (DL:0.01) BDL (DL:0.01) BDL (DL:0.01) BDL (DL:0.01)
24 Zinc as Zn mg/l BDL (DL:0.02) BDL (DL:0.02) BDL (DL:0.02) BDL (DL:0.02) BDL (DL:0.02) BDL (DL:0.02)
25 Total Chromium mg/l BDL (DL: 0.05) BDL (DL: 0.05) BDL (DL: 0.05) BDL (DL: 0.05) BDL (DL: 0.05) BDL (DL: 0.05)
26 Boron as B mg/l BDL (DL:0.1) BDL (DL:0.1) BDL (DL:0.1) BDL (DL:0.1) BDL (DL:0.1) BDL (DL:0.1)
27 Mineral Oil mg/l BDL (DL:1.0) BDL (DL:1.0) BDL (DL:1.0) BDL (DL:1.0) BDL (DL:1.0) BDL (DL:1.0)
28 Phenolic Compunds mg/l Absent Absent Absent Absent Absent Absent
29 Anionic Detergents mg/l BDL (DL:0.1) BDL (DL:0.1) BDL (DL:0.1) BDL (DL:0.1) BDL (DL:0.1) BDL (DL:0.1)
30 Cynaide as CN mg/l Absent Absent Absent Absent Absent Absent
31 Total Coliform Per 100ml < 2 < 2 < 2 < 2 < 2 < 2
32 E-Coli Per 100ml < 2 < 2 < 2 < 2 < 2 < 2
33 Barium as Ba mg/l BDL (DL:0.5) BDL (DL:0.5) BDL (DL:0.5) BDL (DL:0.5) BDL (DL:0.5) BDL (DL:0.5)
34 Ammonia (as Total mg/l BDL (DL:0.1) BDL (DL:0.1) BDL (DL:0.1) BDL (DL:0.1) BDL (DL:0.1) BDL (DL:0.1)
35 Sulphide as H2S mg/l BDL (DL:0.05) BDL (DL:0.05) BDL (DL:0.05) BDL (DL:0.05) BDL (DL:0.05) BDL (DL:0.05)
36 Molybdenum as Mo mg/l BDL (DL:0.5) BDL (DL:0.5) BDL (DL:0.5) BDL (DL:0.5) BDL (DL:0.5) BDL (DL:0.5)
37 Total Arsenic as mg/l BDL (DL:0.01) BDL (DL:0.01) BDL (DL:0.01) BDL (DL:0.01) BDL (DL:0.01) BDL (DL:0.01)
38 Total Suspended Solids mg/l BDL(DL:2) BDL(DL:2) BDL(DL:2) BDL(DL:2) BDL(DL:2) BDL(DL:2) * IS: 10500:2012-Drinking Water Standards; # within the permissible limit as per the WHO Standard. The water can be used for drinking purpose in the absence of alternate sources. Note: SW- Surface water, GW – Ground water. Source: Sampling Results by Enviro-Tech Services Laboratories
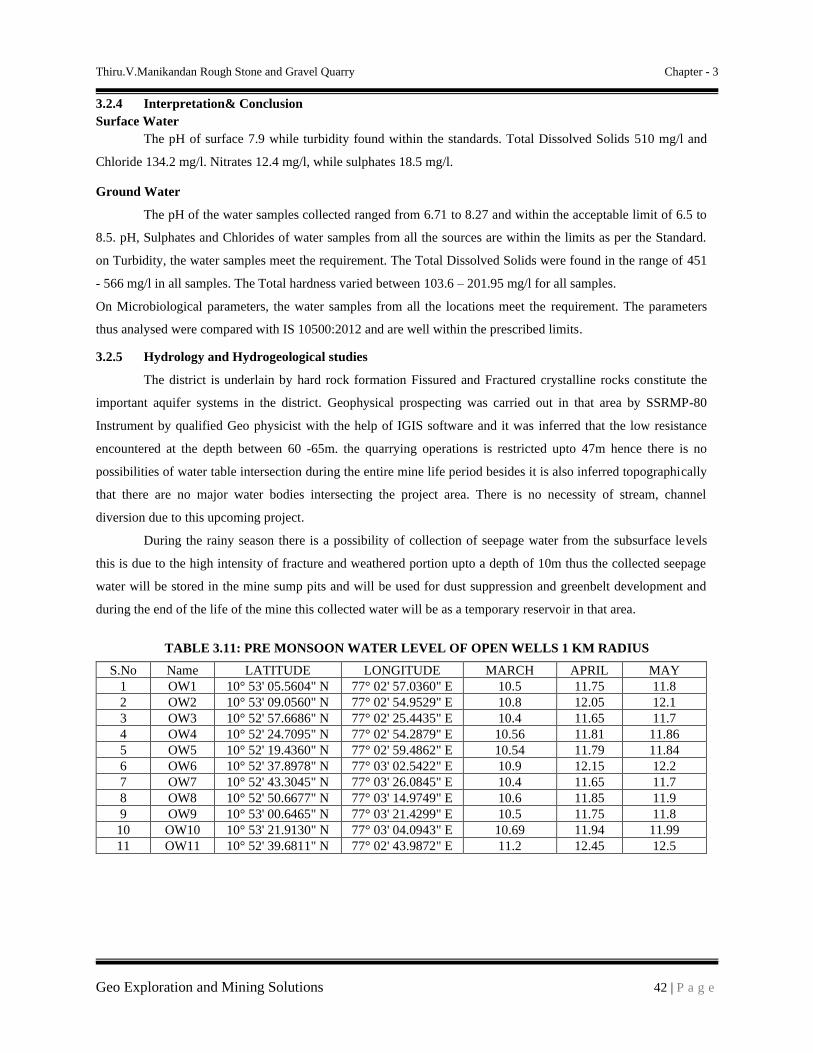
Thiru.V.Manikandan Rough Stone and Gravel Quarry Chapter - 3
Geo Exploration and Mining Solutions 42 | P a g e
3.2.4 Interpretation& Conclusion
Surface Water
The pH of surface 7.9 while turbidity found within the standards. Total Dissolved Solids 510 mg/l and
Chloride 134.2 mg/l. Nitrates 12.4 mg/l, while sulphates 18.5 mg/l.
Ground Water
The pH of the water samples collected ranged from 6.71 to 8.27 and within the acceptable limit of 6.5 to
8.5. pH, Sulphates and Chlorides of water samples from all the sources are within the limits as per the Standard.
on Turbidity, the water samples meet the requirement. The Total Dissolved Solids were found in the range of 451
- 566 mg/l in all samples. The Total hardness varied between 103.6 – 201.95 mg/l for all samples.
On Microbiological parameters, the water samples from all the locations meet the requirement. The parameters
thus analysed were compared with IS 10500:2012 and are well within the prescribed limits.
3.2.5 Hydrology and Hydrogeological studies
The district is underlain by hard rock formation Fissured and Fractured crystalline rocks constitute the
important aquifer systems in the district. Geophysical prospecting was carried out in that area by SSRMP-80
Instrument by qualified Geo physicist with the help of IGIS software and it was inferred that the low resistance
encountered at the depth between 60 -65m. the quarrying operations is restricted upto 47m hence there is no
possibilities of water table intersection during the entire mine life period besides it is also inferred topographically
that there are no major water bodies intersecting the project area. There is no necessity of stream, channel
diversion due to this upcoming project.
During the rainy season there is a possibility of collection of seepage water from the subsurface levels
this is due to the high intensity of fracture and weathered portion upto a depth of 10m thus the collected seepage
water will be stored in the mine sump pits and will be used for dust suppression and greenbelt development and
during the end of the life of the mine this collected water will be as a temporary reservoir in that area.
TABLE 3.11: PRE MONSOON WATER LEVEL OF OPEN WELLS 1 KM RADIUS
S.No Name LATITUDE LONGITUDE MARCH APRIL MAY
1 OW1 10° 53' 05.5604" N 77° 02' 57.0360" E 10.5 11.75 11.8
2 OW2 10° 53' 09.0560" N 77° 02' 54.9529" E 10.8 12.05 12.1
3 OW3 10° 52' 57.6686" N 77° 02' 25.4435" E 10.4 11.65 11.7
4 OW4 10° 52' 24.7095" N 77° 02' 54.2879" E 10.56 11.81 11.86
5 OW5 10° 52' 19.4360" N 77° 02' 59.4862" E 10.54 11.79 11.84
6 OW6 10° 52' 37.8978" N 77° 03' 02.5422" E 10.9 12.15 12.2
7 OW7 10° 52' 43.3045" N 77° 03' 26.0845" E 10.4 11.65 11.7
8 OW8 10° 52' 50.6677" N 77° 03' 14.9749" E 10.6 11.85 11.9
9 OW9 10° 53' 00.6465" N 77° 03' 21.4299" E 10.5 11.75 11.8
10 OW10 10° 53' 21.9130" N 77° 03' 04.0943" E 10.69 11.94 11.99
11 OW11 10° 52' 39.6811" N 77° 02' 43.9872" E 11.2 12.45 12.5
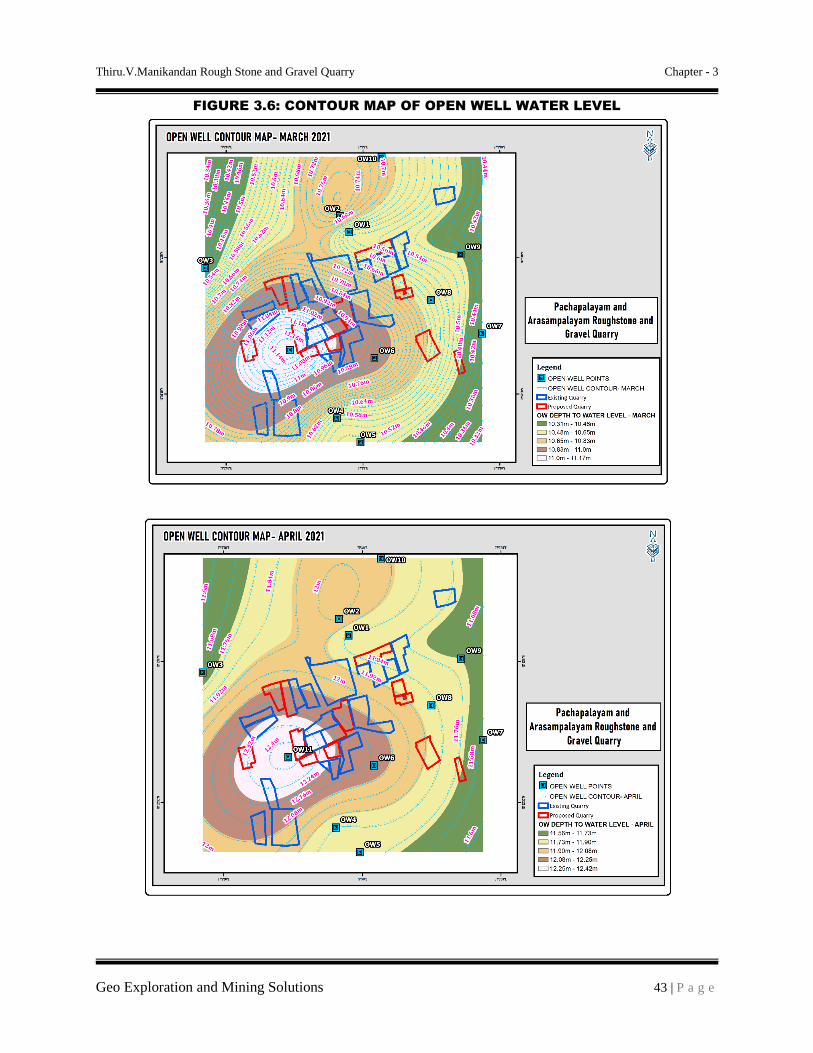
Thiru.V.Manikandan Rough Stone and Gravel Quarry Chapter - 3
Geo Exploration and Mining Solutions 43 | P a g e
FIGURE 3.6: CONTOUR MAP OF OPEN WELL WATER LEVEL

Thiru.V.Manikandan Rough Stone and Gravel Quarry Chapter - 3
Geo Exploration and Mining Solutions 44 | P a g e

Thiru.V.Manikandan Rough Stone and Gravel Quarry Chapter - 3
Geo Exploration and Mining Solutions 45 | P a g e
TABLE 3.12: PRE MONSOON WATER LEVEL OF BOREWELLS 1 KM RADIUS
S.No Name LATITUDE LONGITUDE MARCH APRIL MAY
1 BW1 10° 53' 04.8433" N 77° 03' 26.3969" E 65.8 67 67.22
2 BW2 10° 53' 20.2460" N 77° 03' 10.0747" E 66.2 68 67.62
3 BW3 10° 53' 15.6145" N 77° 02' 52.2323" E 65.4 67 66.82
4 BW4 10° 53' 11.8112" N 77° 02' 37.0295" E 65.9 67 67.32
5 BW5 10° 53' 02.1711" N 77° 02' 23.6306" E 66 67 67.42
6 BW6 10° 52' 34.2182" N 77° 02' 58.0728" E 65.8 67 67.22
7 BW7 10° 52' 16.7547" N 77° 03' 01.4431" E 65.3 67 66.72
8 BW8 10° 52' 34.0318" N 77° 03' 06.4992" E 65.7 67 67.12
9 BW9 10° 52' 42.4633" N 77° 03' 20.5152" E 65.6 67 67.02
FIGURE 3.7: CONTOUR MAP OF BORE WELL WATER LEVEL

Thiru.V.Manikandan Rough Stone and Gravel Quarry Chapter - 3
Geo Exploration and Mining Solutions 47 | P a g e

Thiru.V.Manikandan Rough Stone and Gravel Quarry Chapter - 3
Geo Exploration and Mining Solutions 48 | P a g e
FIGURE 3.8: DRAINAGE MAP AROUND 10 KM RADIUS FROM PROJECT SITE

Thiru.V.Manikandan Rough Stone and Gravel Quarry Chapter - 3
Geo Exploration and Mining Solutions 49 | P a g e
FIGURE 3.9: GROUND WATER LEVEL MAP
Source : Bhuvan

Thiru.V.Manikandan Rough Stone and Gravel Quarry Chapter - 3
Geo Exploration and Mining Solutions 50 | P a g e
3.2.5.1 Methodology and Data Acquisition
Electric Resistivity Method is well established for delineating lateral as well vertical discontinuities in the
resistive structure of the Earth’s subsurface. The present study makes use of vertical electric sounding (VES) to
delineate the Vertical Resistivity structure at depth. Schlumberger electrode set up was employed for making
sounding measurements. Since it is least influenced by lateral in homogeneities and is capable of providing higher
depth of investigation. This is four electrodes collinear set up where in the outer electrodes send current into the
ground and the inner electrodes measure the potential difference.
The present study utilizes maximum current electrode separation AB/2. The data from this survey are
commonly arranged and contoured in the farm of Pseudo-section that gives an approximate of the subsurface
resistivity. This technique is used for the inversion of Schlumberger VES data to predict the layer parameter namely
layer resistivity and Geo electric layer thickness. The main goal of the present study is to search the vertical in
homogeneities that is consistent with the measured data.
For a Schlumberger among the Apparent resistivity can be calculated as follows
ρa = GΔV
I
ΔV = potential difference between receiving electrodes
G = Geometric Factor.
Rocks show wide variation in resistivity ranging from 10-8 more than 10+14 ohmmeter. On a broad classification,
one can group the rocks falling in the range of 10-8 to 1 ohmmeter as good conductors. 1 to 106 ohmmeter as
intermediate conductors and 106 to 1012 ohmmeter as more as poor conductor. The resistivity of rocks and
subsurface lithology, which is mostly dependent on its porosity and the pore fluid resistivity is defined by Archie’s
Law,
ρr = Fρw = a Ømρw
ρr = Resistivity of Rocks
ρw = Resistivity of water in pores of rock
F = Formation Factor
Ø = Fractional pore volume
A = Constants with values ranging from 0.5 to 2.5
3.2.5.2 Survey Layout
The layout for a resistivity survey depends on the choice of the current and potential electrode arrangement,
which is called electrode array. Here the present study is considered with Schlumberger array. In which the
distance may be used for current electrode separation while potential electrode separation is kept on third to one fifth
of the same. One interesting aspect in VES is the principle of reciprocity, which permits interchange of the potential
and current electrode without any effect on the measured apparent resistivity.
The field equipment deployed for the study is in a deep resistivity meter with a model of SSR – MP – AT.
This Signal stacking Resistivity meter is a high-quality data acquisition system incorporating several innovation
features for Earth resistivity. In the presence of random earth Noises the signal to nose ration can be enhanced by √N
where N is the number of stacked readings. This SSR meter in which running averages of measurements [1,
(1+2)/2, (1+2+3)/3 … (1+2...+16/16)] up to the chosen stacks are displayed and the final average is stored
automatically, in memory utilizing the principles of stacking to achieve the benefit of high signals to noise ratio.
Based on these above significations the signal stacking resistivity meter was used for (VES) Vertical Electric
Resistivity Sounding.

Thiru.V.Manikandan Rough Stone and Gravel Quarry Chapter - 3
Geo Exploration and Mining Solutions 51 | P a g e
RESISTIVITY SURVEY PROFILE
Measurements of ground Resistivity is essentially done by sending a current through two electrodes called
current electrodes (C1& C2) and measuring the resulting potential by two other electrodes called potential electrode
(P1& P2). The amount of current required to be sent into the ground depends on the contact resistance at the current
electrode, the ground resistivity and the depth of interest.
3.2.5.3 Data Presentation
It was inferred that the low resistance encountered at the depth between 60-65m. The maximum depth
proposed out of proposed projects is 37 m BGL. Hence there is no possibilities of water table intersection during the
entire mine life period besides it is also inferred topographically that there are no major water bodies intersecting the
project area.
3.2.5.4 Geophysical Data Interpretation
The geophysical data’s was obtained to study the lateral variations, vertical in homogeneities in the sub –
surface with respect to the availability of groundwater. From the interpreted data, it has inferred that the area has
moderate groundwater potential in the investigated area. This small quarrying operation will not have any significant
impact on the natural water bodies.
3.3 Air Environment
The ambient air quality with respect to the study area of 10 km radius including the cluster quarries forms
the baseline information. The prime objective of baseline air quality monitoring is to assess existing air quality of
the area. This will also be useful in assessing the conformity to standards of the ambient air quality during the
operations
The existing ambient air quality of the area is important for evaluating the impact of mining activities on
the ambient air quality. These will also be useful for assessing the conformity to standards of the ambient air quality
during the operation of Existing and proposed quarries within the radius of 500m.
The sources of air pollution in the region are mostly due to vehicular traffic, dust arising from unpaved
village road and domestic & agricultural activities. This section describes the identification of sampling locations,
methodology adopted during the monitoring period and sampling frequency.
The baseline status of the ambient air quality has been assessed through scientifically designed ambient air quality
network. The design of monitoring network in the air quality surveillance program has been based on the following
considerations:
• Meteorological conditions.
• Topography of the study area.
• Likely impact area.

Thiru.V.Manikandan Rough Stone and Gravel Quarry Chapter - 3
Geo Exploration and Mining Solutions 52 | P a g e
3.3.1 Meteorology & Climate
Meteorology is the key to understand the air quality. The essential relationship between meteorological
condition and atmospheric dispersion involves the wind in the broadest sense. Wind fluctuations over a very wide
range of time, accomplish dispersion and strongly influence other processes associated with them.
A temporary meteorological station was installed at project site. The station was installed at a height of 4 m
above the ground level in such a way that there are no obstructions facilitating flow of wind, wind speed, wind
direction, humidity and temperature are recorded on hourly basis.
Climate –
Coimbatore is 421m above sea level. Coimbatore's climate is classified as tropical. The summers here have
a good deal of rainfall, while the winters have very little rain. This location is classified as Aw by Köppen and
Geiger. In Coimbatore –
• The average annual temperature is 25.4°C | 77.8°F.
• The annual rainfall here is around 952mm | 37.5 inch.
• The driest month is January with 13mm |0.5 inch of rainfall. The greatest amount of precipitation occurs in
October, with an average of 181mm | 7.1 inch.
• The warmest month of the year is April, with an average temperature of 28.9°C | 84.1°F. The lowest
average temperatures in the year occur in December, when it is around 23.2°C | 73.7°F.
• The difference in precipitation between the driest month and the wettest month is 168 mm | 7 inch. The
variation in annual temperatures throughout the year is 5.8°C | 42.4°F.
Source: https://en.climate-data.org/asia/india/tamil-nadu/coimbatore-2788/
Rainfall –
The average annual rainfall and the 5 years rainfall is as follows:
TABLE 3.13 – RAINFALL DATA
Actual Rainfall in mm Normal Rainfall in mm
2013 2014 2015 2016 2017 2018
901.0 1221.7 992.9 505.5 873.4 1302.0 689.3
Source: https://www.twadboard.tn.gov.in/content/coimbatore
TABLE 3.14 – METEOROLOGICAL DATA RECORDED AT SITE
S.No Parameters Mar-2021 April– 2021 May- 2021
1 Temperature (0C)
Max 31.4 30.4 32.0
Min 26.3 24.9 24.4
Avg 28.8 27.6 28.2
2 Relative Humidity (%) Avg 51 66 63
3 Wind Speed (m/s)
Max 6.389 4.375 8.000
Min 1.458 1.528 0.903
Avg 3.923 2.951 4.451
4 Cloud Cover (OKTAS) 0-8 0-8 0-8
5 Wind Direction NE,ENE SSW,SSE WSW,SSW
Source: On-site monitoring/sampling by Enviro-Tech Services Laboratories in association with GEMS
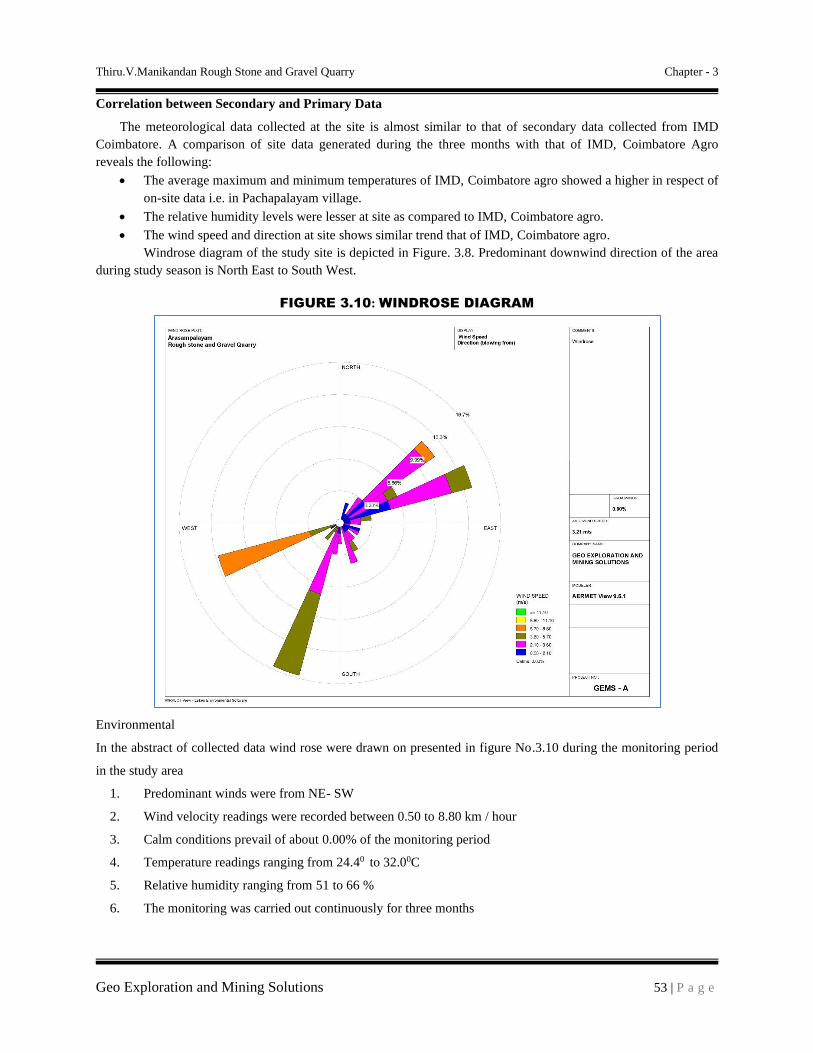
Thiru.V.Manikandan Rough Stone and Gravel Quarry Chapter - 3
Geo Exploration and Mining Solutions 53 | P a g e
Correlation between Secondary and Primary Data
The meteorological data collected at the site is almost similar to that of secondary data collected from IMD
Coimbatore. A comparison of site data generated during the three months with that of IMD, Coimbatore Agro
reveals the following:
• The average maximum and minimum temperatures of IMD, Coimbatore agro showed a higher in respect of
on-site data i.e. in Pachapalayam village.
• The relative humidity levels were lesser at site as compared to IMD, Coimbatore agro.
• The wind speed and direction at site shows similar trend that of IMD, Coimbatore agro.
Windrose diagram of the study site is depicted in Figure. 3.8. Predominant downwind direction of the area
during study season is North East to South West.
FIGURE 3.10: WINDROSE DIAGRAM
Environmental
In the abstract of collected data wind rose were drawn on presented in figure No.3.10 during the monitoring period
in the study area
1. Predominant winds were from NE- SW
2. Wind velocity readings were recorded between 0.50 to 8.80 km / hour
3. Calm conditions prevail of about 0.00% of the monitoring period
4. Temperature readings ranging from 24.40 to 32.00C
5. Relative humidity ranging from 51 to 66 %
6. The monitoring was carried out continuously for three months

Thiru.V.Manikandan Rough Stone and Gravel Quarry Chapter - 3
Geo Exploration and Mining Solutions 54 | P a g e
3.3.2 Methodology and Objective
The prime objective of the ambient air quality study is to assess the existing air quality of study area and its
conformity to NAAQS. The observed sources of air pollution in the study area are industrial, traffic and domestic
activities. The baseline status of the ambient air quality has been established through a scientifically designed
ambient air quality monitoring network considering the followings:
• Meteorological condition on synoptic scale;
• Topography of the study area;
• Representatives of regional background air quality for obtaining baseline status;
▪ Location of residential areas representing different activities;
▪ Accessibility and power availability; etc
3.3.3 Sampling and Analytical Techniques
TABLE 3.15 – METHODOLOGY AND INSTRUMENT USED FOR AIR QUALITY ANALYSIS
Parameter Method Instrument
PM2.5 Gravimetric Method
Beta attenuation Method
Fine Particulate Sampler
Make – Thermo Environmental Instruments – TEI 121
PM10 Gravimetric Method
Beta attenuation Method
Respirable Dust Sampler
Make –Thermo Environmental Instruments – TEI 108
SO2 IS-5182 Part II
(Improved West & Gaeke method) Respirable Dust Sampler withgaseous attachment
NOx IS-5182 Part II
(Jacob & Hochheiser modifiedmethod) Respirable Dust Sampler with gaseous attachment
Free Silica NIOSH – 7601 Visible Spectrophotometry
Source: Sampling Methodology followed by Enviro-Tech Services Laboratories & CPCB Notification
TABLE 3.16 – NATIONAL AMBIENT AIR QUALITY STANDARDS
Sl.
No.
Pollutant Time Weighted
Average
Concentration in ambient air
Industrial, Residential,
Rural & other areas
Ecologically Sensitive area
(Notified by Central Govt.)
1 Sulphur Dioxide (μg/m3) Annual Avg.*
24 hours**
50.0
80.0
20.0
80.0
2 Nitrogen Dioxide (μg/m3) Annual Avg.
24 hours
40.0
80.0
30.0
80.0
3 Particulate matter (size less
than 10µm) PM10 (μg/m3)
Annual Avg.
24 hours
60.0
100.0
60.0
100.0
4 Particulate matter (size less
than 2.5 µm PM2.5 (μg/m3)
Annual Avg.
24 hours
40.0
60.0
40.0
60.0
Source: NAAQS CPCB Notification No. B-29016/20/90/PCI-I Dated: 18th Nov 2009 *Annual Arithmetic mean of minimum 104 measurements in a year taken twice a Week 24 hourly at uniform interval,
** 24 hourly / 8 hourly or 1 hourly monitored values as applicable shall be complied with 98 % of the time in a year. However, 2% of the time, they may exceed the
limits but not on two consecutive days of monitoring.
3.3.4 Frequency & Parameters for Sampling
Ambient air quality monitoring has been carried out with a frequency of two samples per week at seven (7)
locations, adopting a continuous 24 hourly (3 shift of 8-hour) schedule for the period March - May 2021. The
baseline data of ambient air has been generated for PM10, PM2.5, Sulphur Dioxide (SO2) & Nitrogen Dioxide (NO2).

Thiru.V.Manikandan Rough Stone and Gravel Quarry Chapter - 3
Geo Exploration and Mining Solutions 55 | P a g e
3.3.5 Ambient Air Quality Monitoring Stations
Ten (10) monitoring stations were set up in the study area as depicted in Figure 3.6.1 for assessment of the
existing ambient air quality. Details of the sampling locations are as per given below.
TABLE 3.17 – AMBIENT AIR QUALITY (AAQ) MONITORING LOCATIONS
S. No Location Code Monitoring Locations Distance & Direction Coordinates
1 AAQ-1 Core Zone - 10°52'42.59"N 77°03'11.73"E
2 AAQ-2 Core Zone - 10°52'55.94"N 77°03'05.43"E
3 AAQ-3 Core Zone - 10°52'49.17"N 77°02'45.99"E
4 AAQ-4 Core Zone - 10°52'35.64"N 77°02'44.49"E
5 AAQ-5 Malumichampatty 3.5km NW 10°54'14.41"N 77°00'49.53"E
6 AAQ-6 Othakalmandapam 3km SW 10°52'47.91"N 77°00'41.58"E
7 AAQ-7 Chettipalayam 3km North 10°55'1.47"N 77°02'51.18"E
8 AAQ-8 Vadasithur 4.5km SE 10°50'21.48"N 77°04'56.52"E
9 AAQ-9 Arasampalayam 2.5km SW 10°50'54.42"N 77°02'29.15"E
10 AAQ-10 ponnakkani 4.5km NE 10°53'30.52"N 77°05'49.82"E
Source: On-site monitoring/sampling by Enviro-Tech Services Laboratories in association with GEMS
FIGURE 3.11: SITE PHOTOGRAPHS OF AMBIENT AIR MONITORING
Source: Monitoring photographs from the FAE and Team Members

Thiru.V.Manikandan Rough Stone and Gravel Quarry Chapter - 3
Geo Exploration and Mining Solutions 56 | P a g e
FIGURE 3.12 AMBIENT AIR QUALITY LOCATIONS AROUND 5 KM RADIUS

Thiru.V.Manikandan Rough Stone and Gravel Quarry Chapter - 3
Geo Exploration and Mining Solutions 57 | P a g e
TABLE 3.18 – AAQ1- CORE ZONE (South East Corner)
Period: March – May-2021 Location: AAQ1- South East Corner Sampling Time: 24-hourly
Monitoring Particulates, µg/m3 Gaseous Pollutants, µg/m3 Other Pollutants (Particulate Phase) , µg/m3
Date Period, hrs. SPM
PM2.5 PM10 SO2 NO2 NH3 O3
(8-hly Avg.)
CO
(8-hly Avg.)
Pb,
µg/m3
As,
ng/m3 Ni, ng/m3
C6H6, ng/m3
BaP,
ng/m3
NAAQ Norms* (24 hrs.)
60(24 hrs.) 100
(24 hrs.)
80
(24 hrs.)
80
(24 hrs.)
400
(24 hrs.)
100
(8 hrs.)
2.0
(8hrs.)
1.0
(24 hrs.)
6.0
(annual)
20
(annual)
5.0
(annual)
1.0
(annual)
02.03.2021 07.00-07.00 63.8 24.1 44.7 8.9 25.7 <5 <5 <1.0 <0.01 <5 <3 <1.0 <3.0
03.03.2021 07.15-07.15 64.7 22.8 42.6 7.7 23.9 <5 <5 <1.0 <0.01 <5 <3 <1.0 <3.0
09.03.2021 07.00-07.00 63.5 23.3 43.4 10.3 24.7 <5 <5 <1.0 <0.01 <5 <3 <1.0 <3.0
10.03.2021 07.15-07.15 62.8 24.9 41.8 8.4 26.8 <5 <5 <1.0 <0.01 <5 <3 <1.0 <3.0
16.03.2021 07.00-07.00 62.5 23.7 43.6 7.6 24.1 <5 <5 <1.0 <0.01 <5 <3 <1.0 <3.0
17.03.2021 07.15-07.15 64.7 23.5 45.5 10.5 25.5 <5 <5 <1.0 <0.01 <5 <3 <1.0 <3.0
23.03.2021 07.00-07.00 65.5 23.1 46.5 9.3 23.7 <5 <5 <1.0 <0.01 <5 <3 <1.0 <3.0
24.03.2021 07.15-07.15 62.3 22.6 42.9 10.4 24.8 <5 <5 <1.0 <0.01 <5 <3 <1.0 <3.0
30.03.2021 07.00-07.00 63.5 23.7 45.3 8.7 25.6 <5 <5 <1.0 <0.01 <5 <3 <1.0 <3.0
31.03.2021 07.15-07.15 62.4 22.1 43.9 10.3 26.7 <5 <5 <1.0 <0.01 <5 <3 <1.0 <3.0
06.04.2021 07.00-07.00 63.8 23.2 43.7 9.6 24.1 <5 <5 <1.0 <0.01 <5 <3 <1.0 <3.0
07.04.2021 07.15-07.15 65.2 21.7 42.6 11.2 25.9 <5 <5 <1.0 <0.01 <5 <3 <1.0 <3.0
13.04.2021 07.00-07.00 61.5 24.4 42.5 10.5 26.8 <5 <5 <1.0 <0.01 <5 <3 <1.0 <3.0
14.04.2021 07.15-07.15 63.7 23.9 43.3 9.4 24.4 <5 <5 <1.0 <0.01 <5 <3 <1.0 <3.0
20.04.2021 07.00-07.00 62.5 23.8 42.7 10.6 23.6 <5 <5 <1.0 <0.01 <5 <3 <1.0 <3.0
21.04.2021 07.15-07.15 66.8 23.3 42.8 9.3 23.8 <5 <5 <1.0 <0.01 <5 <3 <1.0 <3.0
27.04.2021 07.00-07.00 64.2 24.4 43.4 8.7 25.5 <5 <5 <1.0 <0.01 <5 <3 <1.0 <3.0
28.04.2021 07.15-07.15 63.5 23.6 42.9 10.5 24.7 <5 <5 <1.0 <0.01 <5 <3 <1.0 <3.0
04.05.2021 07.00-07.00 65.5 21.5 45.1 11.2 23.6 <5 <5 <1.0 <0.01 <5 <3 <1.0 <3.0
05.05.2021 07.15-07.15 62.9 23.7 43.6 9.4 25.7 <5 <5 <1.0 <0.01 <5 <3 <1.0 <3.0
11.05.2021 07.00-07.00 64.4 22.9 43.7 10.2 26.2 <5 <5 <1.0 <0.01 <5 <3 <1.0 <3.0
12.05.2021 07.15-07.15 63.4 23.1 42.8 11.5 23.4 <5 <5 <1.0 <0.01 <5 <3 <1.0 <3.0
18.05.2021 07.00-07.00 62.9 23.5 41.9 8.3 24.7 <5 <5 <1.0 <0.01 <5 <3 <1.0 <3.0
19.05.2021 07.15-07.15 62.3 22.8 43.6 8.7 25.5 <5 <5 <1.0 <0.01 <5 <3 <1.0 <3.0
25.05.2021 07.00-07.00 62.7 23.1 44.3 9.6 25.1 <5 <5 <1.0 <0.01 <5 <3 <1.0 <3.0
26.05.2021 07.15-07.15 62.5 22.5 42.8 8.9 25.9 <5 <5 <1.0 <0.01 <5 <3 <1.0 <3.0
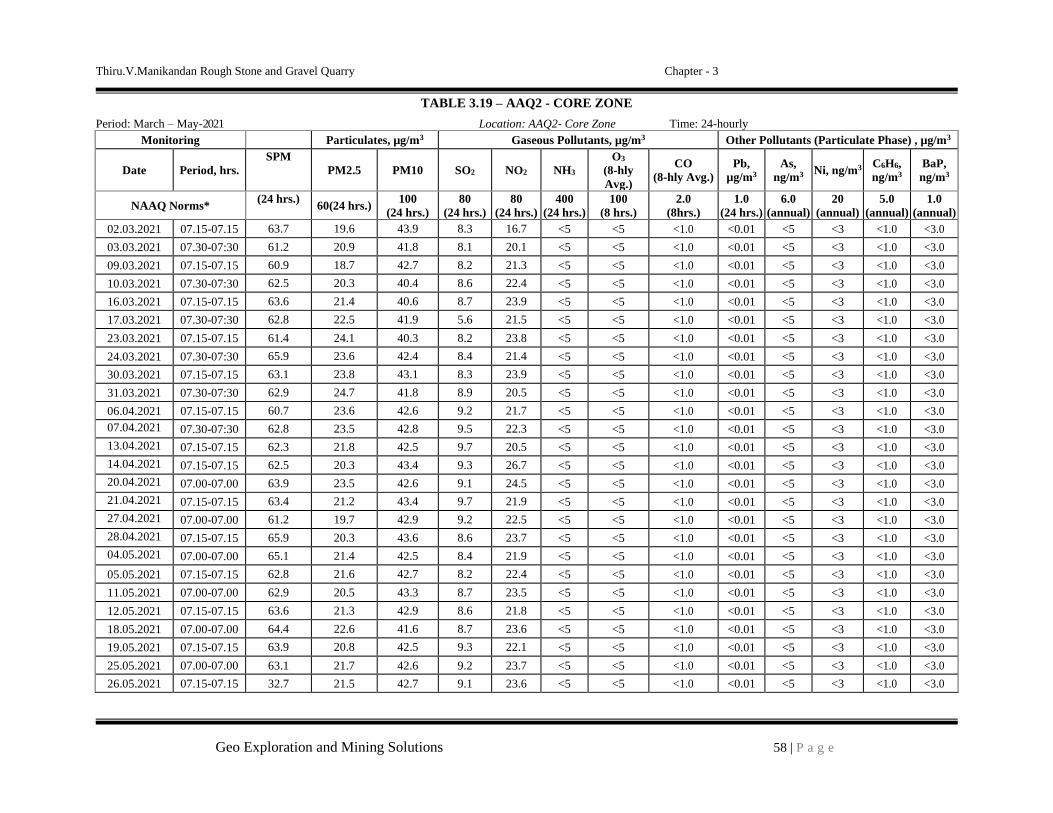
Thiru.V.Manikandan Rough Stone and Gravel Quarry Chapter - 3
Geo Exploration and Mining Solutions 58 | P a g e
TABLE 3.19 – AAQ2 - CORE ZONE
Period: March – May-2021 Location: AAQ2- Core Zone Time: 24-hourly
Monitoring Particulates, µg/m3 Gaseous Pollutants, µg/m3 Other Pollutants (Particulate Phase) , µg/m3
Date Period, hrs.
SPM
PM2.5 PM10 SO2 NO2 NH3
O3 (8-hly
Avg.)
CO
(8-hly Avg.)
Pb,
µg/m3
As,
ng/m3 Ni, ng/m3
C6H6, ng/m3
BaP,
ng/m3
NAAQ Norms* (24 hrs.)
60(24 hrs.) 100
(24 hrs.)
80
(24 hrs.)
80
(24 hrs.)
400
(24 hrs.)
100
(8 hrs.)
2.0
(8hrs.)
1.0
(24 hrs.)
6.0
(annual)
20
(annual)
5.0
(annual)
1.0
(annual)
02.03.2021 07.15-07.15 63.7 19.6 43.9 8.3 16.7 <5 <5 <1.0 <0.01 <5 <3 <1.0 <3.0
03.03.2021 07.30-07:30 61.2 20.9 41.8 8.1 20.1 <5 <5 <1.0 <0.01 <5 <3 <1.0 <3.0
09.03.2021 07.15-07.15 60.9 18.7 42.7 8.2 21.3 <5 <5 <1.0 <0.01 <5 <3 <1.0 <3.0
10.03.2021 07.30-07:30 62.5 20.3 40.4 8.6 22.4 <5 <5 <1.0 <0.01 <5 <3 <1.0 <3.0
16.03.2021 07.15-07.15 63.6 21.4 40.6 8.7 23.9 <5 <5 <1.0 <0.01 <5 <3 <1.0 <3.0
17.03.2021 07.30-07:30 62.8 22.5 41.9 5.6 21.5 <5 <5 <1.0 <0.01 <5 <3 <1.0 <3.0
23.03.2021 07.15-07.15 61.4 24.1 40.3 8.2 23.8 <5 <5 <1.0 <0.01 <5 <3 <1.0 <3.0
24.03.2021 07.30-07:30 65.9 23.6 42.4 8.4 21.4 <5 <5 <1.0 <0.01 <5 <3 <1.0 <3.0
30.03.2021 07.15-07.15 63.1 23.8 43.1 8.3 23.9 <5 <5 <1.0 <0.01 <5 <3 <1.0 <3.0
31.03.2021 07.30-07:30 62.9 24.7 41.8 8.9 20.5 <5 <5 <1.0 <0.01 <5 <3 <1.0 <3.0
06.04.2021 07.15-07.15 60.7 23.6 42.6 9.2 21.7 <5 <5 <1.0 <0.01 <5 <3 <1.0 <3.0
07.04.2021 07.30-07:30 62.8 23.5 42.8 9.5 22.3 <5 <5 <1.0 <0.01 <5 <3 <1.0 <3.0
13.04.2021 07.15-07.15 62.3 21.8 42.5 9.7 20.5 <5 <5 <1.0 <0.01 <5 <3 <1.0 <3.0
14.04.2021 07.15-07.15 62.5 20.3 43.4 9.3 26.7 <5 <5 <1.0 <0.01 <5 <3 <1.0 <3.0
20.04.2021 07.00-07.00 63.9 23.5 42.6 9.1 24.5 <5 <5 <1.0 <0.01 <5 <3 <1.0 <3.0
21.04.2021 07.15-07.15 63.4 21.2 43.4 9.7 21.9 <5 <5 <1.0 <0.01 <5 <3 <1.0 <3.0
27.04.2021 07.00-07.00 61.2 19.7 42.9 9.2 22.5 <5 <5 <1.0 <0.01 <5 <3 <1.0 <3.0
28.04.2021 07.15-07.15 65.9 20.3 43.6 8.6 23.7 <5 <5 <1.0 <0.01 <5 <3 <1.0 <3.0
04.05.2021 07.00-07.00 65.1 21.4 42.5 8.4 21.9 <5 <5 <1.0 <0.01 <5 <3 <1.0 <3.0
05.05.2021 07.15-07.15 62.8 21.6 42.7 8.2 22.4 <5 <5 <1.0 <0.01 <5 <3 <1.0 <3.0
11.05.2021 07.00-07.00 62.9 20.5 43.3 8.7 23.5 <5 <5 <1.0 <0.01 <5 <3 <1.0 <3.0
12.05.2021 07.15-07.15 63.6 21.3 42.9 8.6 21.8 <5 <5 <1.0 <0.01 <5 <3 <1.0 <3.0
18.05.2021 07.00-07.00 64.4 22.6 41.6 8.7 23.6 <5 <5 <1.0 <0.01 <5 <3 <1.0 <3.0
19.05.2021 07.15-07.15 63.9 20.8 42.5 9.3 22.1 <5 <5 <1.0 <0.01 <5 <3 <1.0 <3.0
25.05.2021 07.00-07.00 63.1 21.7 42.6 9.2 23.7 <5 <5 <1.0 <0.01 <5 <3 <1.0 <3.0
26.05.2021 07.15-07.15 32.7 21.5 42.7 9.1 23.6 <5 <5 <1.0 <0.01 <5 <3 <1.0 <3.0

Thiru.V.Manikandan Rough Stone and Gravel Quarry Chapter - 3
Geo Exploration and Mining Solutions 59 | P a g e
TABLE 3.20 – AAQ3 – CORE ZONE
Period: March – May-2021 : AAQ3- Core Zone Sampling Time: 24-hourly
Monitoring Particulates, µg/m3 Gaseous Pollutants, µg/m3 Other Pollutants (Particulate Phase) , µg/m3
Date Period, hrs.
SPM
PM2.5 PM10 SO2 NO2 NH3
O3 (8-hly
Avg.)
CO
(8-hly Avg.)
Pb,
µg/m3
As,
ng/m3 Ni, ng/m3
C6H6, ng/m3
BaP,
ng/m3
NAAQ Norms*
(24 hrs.) 60
(24 hrs.)
100
(24 hrs.)
80
(24 hrs.)
80
(24 hrs.)
400
(24 hrs.)
100
(8 hrs.)
2.0
(8hrs.)
1.0
(24 hrs.)
6.0
(annual)
20
(annual)
5.0
(annual)
1.0
(annual)
02.03.2021 07.15-07.15 62.8 22.8 42.7 7.3 25.6 <5 <5 <1.0 <0.01 <5 <3 <1.0 <3.0
03.03.2021 07.30-07:30 61.8 26.4 46.3 7.9 24.9 <5 <5 <1.0 <0.01 <5 <3 <1.0 <3.0
09.03.2021 07.15-07.15 64.5 25.3 45.5 7.6 26.9 <5 <5 <1.0 <0.01 <5 <3 <1.0 <3.0
10.03.2021 07.30-07:30 63.9 23.9 45.9 7.1 25.2 <5 <5 <1.0 <0.01 <5 <3 <1.0 <3.0
16.03.2021 07.15-07.15 65.7 26.7 46.3 7.6 27.9 <5 <5 <1.0 <0.01 <5 <3 <1.0 <3.0
17.03.2021 07.30-07:30 65.6 23.9 46.7 8.6 24.2 <5 <5 <1.0 <0.01 <5 <3 <1.0 <3.0
23.03.2021 07.15-07.15 64.7 24.4 42.3 8.1 26.3 <5 <5 <1.0 <0.01 <5 <3 <1.0 <3.0
24.03.2021 07.30-07:30 62.9 25.3 45.8 8.3 25.1 <5 <5 <1.0 <0.01 <5 <3 <1.0 <3.0
30.03.2021 07.15-07.15 63.5 26.8 45.5 8.1 25.9 <5 <5 <1.0 <0.01 <5 <3 <1.0 <3.0
31.03.2021 07.30-07:30 62.9 23.9 46.3 7.3 24.9 <5 <5 <1.0 <0.01 <5 <3 <1.0 <3.0
06.04.2021 07.15-07.15 65.8 26.4 46.6 7.6 27.2 <5 <5 <1.0 <0.01 <5 <3 <1.0 <3.0
07.04.2021 07.30-07:30 62.4 24.5 46.7 7.1 26.5 <5 <5 <1.0 <0.01 <5 <3 <1.0 <3.0
13.04.2021 07.15-07.15 63.5 26.5 45.2 7.2 28.4 <5 <5 <1.0 <0.01 <5 <3 <1.0 <3.0
14.04.2021 07.15-07.15 64.6 26.7 43.9 7.3 26.5 <5 <5 <1.0 <0.01 <5 <3 <1.0 <3.0
20.04.2021 07.00-07.00 65.8 23.9 42.7 7.5 25.4 <5 <5 <1.0 <0.01 <5 <3 <1.0 <3.0
21.04.2021 07.15-07.15 65.3 25.5 42.8 7.6 25.3 <5 <5 <1.0 <0.01 <5 <3 <1.0 <3.0
27.04.2021 07.00-07.00 65.9 26.7 46.4 7.1 25.1 <5 <5 <1.0 <0.01 <5 <3 <1.0 <3.0
28.04.2021 07.15-07.15 66.2 26.3 46.1 7.2 24.7 <5 <5 <1.0 <0.01 <5 <3 <1.0 <3.0
04.05.2021 07.00-07.00 63.6 25.4 43.9 7.8 28.4 <5 <5 <1.0 <0.01 <5 <3 <1.0 <3.0
05.05.2021 07.15-07.15 65.7 25.8 46.5 8.3 25.2 <5 <5 <1.0 <0.01 <5 <3 <1.0 <3.0
11.05.2021 07.00-07.00 64.8 26.9 46.7 8.4 25.9 <5 <5 <1.0 <0.01 <5 <3 <1.0 <3.0
12.05.2021 07.15-07.15 65.9 26.3 42.8 8.6 26.7 <5 <5 <1.0 <0.01 <5 <3 <1.0 <3.0
18.05.2021 07.00-07.00 65.4 25.7 46.3 7.1 26.2 <5 <5 <1.0 <0.01 <5 <3 <1.0 <3.0
19.05.2021 07.15-07.15 63.2 24.9 45.9 7.4 26.8 <5 <5 <1.0 <0.01 <5 <3 <1.0 <3.0
25.05.2021 07.00-07.00 61.7 24.7 44.2 7.6 25.7 <5 <5 <1.0 <0.01 <5 <3 <1.0 <3.0
26.05.2021 07.15-07.15 62.9 24.3 44.1 7.1 25.3 <5 <5 <1.0 <0.01 <5 <3 <1.0 <3.0
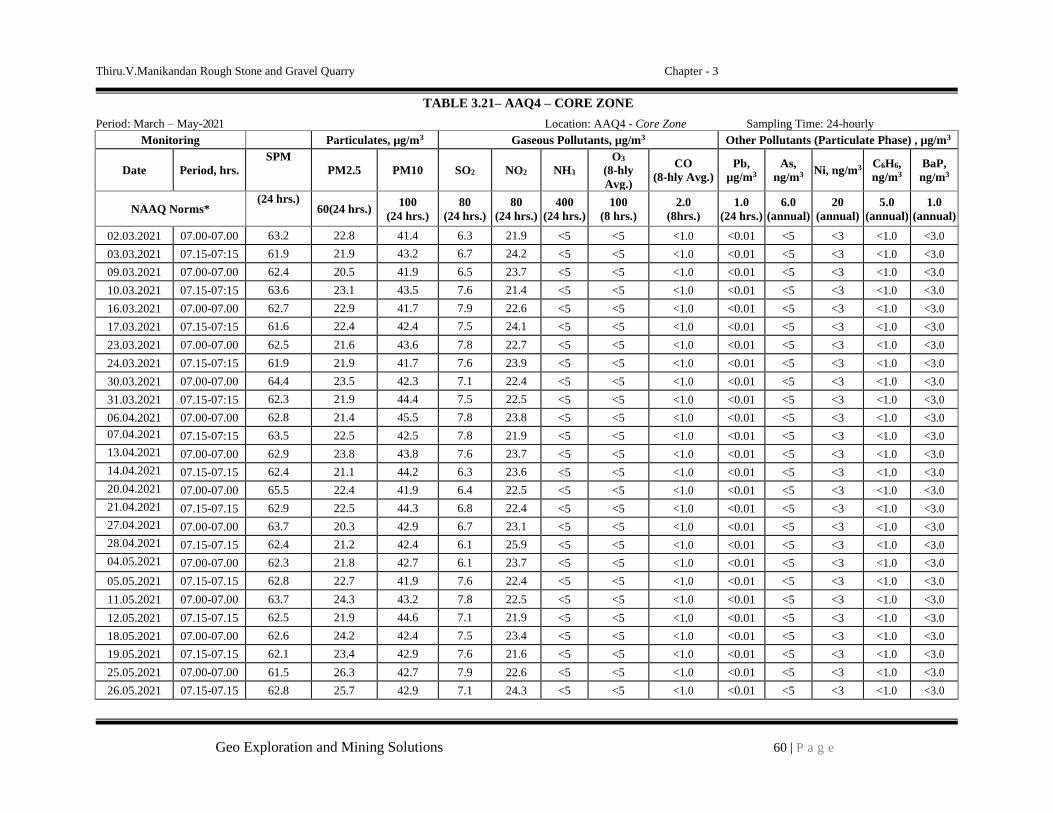
Thiru.V.Manikandan Rough Stone and Gravel Quarry Chapter - 3
Geo Exploration and Mining Solutions 60 | P a g e
TABLE 3.21– AAQ4 – CORE ZONE
Period: March – May-2021 Location: AAQ4 - Core Zone Sampling Time: 24-hourly
Monitoring Particulates, µg/m3 Gaseous Pollutants, µg/m3 Other Pollutants (Particulate Phase) , µg/m3
Date Period, hrs.
SPM
PM2.5 PM10 SO2 NO2 NH3
O3 (8-hly
Avg.)
CO
(8-hly Avg.)
Pb,
µg/m3
As,
ng/m3 Ni, ng/m3
C6H6, ng/m3
BaP,
ng/m3
NAAQ Norms* (24 hrs.)
60(24 hrs.) 100
(24 hrs.)
80
(24 hrs.)
80
(24 hrs.)
400
(24 hrs.)
100
(8 hrs.)
2.0
(8hrs.)
1.0
(24 hrs.)
6.0
(annual)
20
(annual)
5.0
(annual)
1.0
(annual)
02.03.2021 07.00-07.00 63.2 22.8 41.4 6.3 21.9 <5 <5 <1.0 <0.01 <5 <3 <1.0 <3.0
03.03.2021 07.15-07:15 61.9 21.9 43.2 6.7 24.2 <5 <5 <1.0 <0.01 <5 <3 <1.0 <3.0
09.03.2021 07.00-07.00 62.4 20.5 41.9 6.5 23.7 <5 <5 <1.0 <0.01 <5 <3 <1.0 <3.0
10.03.2021 07.15-07:15 63.6 23.1 43.5 7.6 21.4 <5 <5 <1.0 <0.01 <5 <3 <1.0 <3.0
16.03.2021 07.00-07.00 62.7 22.9 41.7 7.9 22.6 <5 <5 <1.0 <0.01 <5 <3 <1.0 <3.0
17.03.2021 07.15-07:15 61.6 22.4 42.4 7.5 24.1 <5 <5 <1.0 <0.01 <5 <3 <1.0 <3.0
23.03.2021 07.00-07.00 62.5 21.6 43.6 7.8 22.7 <5 <5 <1.0 <0.01 <5 <3 <1.0 <3.0
24.03.2021 07.15-07:15 61.9 21.9 41.7 7.6 23.9 <5 <5 <1.0 <0.01 <5 <3 <1.0 <3.0
30.03.2021 07.00-07.00 64.4 23.5 42.3 7.1 22.4 <5 <5 <1.0 <0.01 <5 <3 <1.0 <3.0
31.03.2021 07.15-07:15 62.3 21.9 44.4 7.5 22.5 <5 <5 <1.0 <0.01 <5 <3 <1.0 <3.0
06.04.2021 07.00-07.00 62.8 21.4 45.5 7.8 23.8 <5 <5 <1.0 <0.01 <5 <3 <1.0 <3.0
07.04.2021 07.15-07:15 63.5 22.5 42.5 7.8 21.9 <5 <5 <1.0 <0.01 <5 <3 <1.0 <3.0
13.04.2021 07.00-07.00 62.9 23.8 43.8 7.6 23.7 <5 <5 <1.0 <0.01 <5 <3 <1.0 <3.0
14.04.2021 07.15-07.15 62.4 21.1 44.2 6.3 23.6 <5 <5 <1.0 <0.01 <5 <3 <1.0 <3.0
20.04.2021 07.00-07.00 65.5 22.4 41.9 6.4 22.5 <5 <5 <1.0 <0.01 <5 <3 <1.0 <3.0
21.04.2021 07.15-07.15 62.9 22.5 44.3 6.8 22.4 <5 <5 <1.0 <0.01 <5 <3 <1.0 <3.0
27.04.2021 07.00-07.00 63.7 20.3 42.9 6.7 23.1 <5 <5 <1.0 <0.01 <5 <3 <1.0 <3.0
28.04.2021 07.15-07.15 62.4 21.2 42.4 6.1 25.9 <5 <5 <1.0 <0.01 <5 <3 <1.0 <3.0
04.05.2021 07.00-07.00 62.3 21.8 42.7 6.1 23.7 <5 <5 <1.0 <0.01 <5 <3 <1.0 <3.0
05.05.2021 07.15-07.15 62.8 22.7 41.9 7.6 22.4 <5 <5 <1.0 <0.01 <5 <3 <1.0 <3.0
11.05.2021 07.00-07.00 63.7 24.3 43.2 7.8 22.5 <5 <5 <1.0 <0.01 <5 <3 <1.0 <3.0
12.05.2021 07.15-07.15 62.5 21.9 44.6 7.1 21.9 <5 <5 <1.0 <0.01 <5 <3 <1.0 <3.0
18.05.2021 07.00-07.00 62.6 24.2 42.4 7.5 23.4 <5 <5 <1.0 <0.01 <5 <3 <1.0 <3.0
19.05.2021 07.15-07.15 62.1 23.4 42.9 7.6 21.6 <5 <5 <1.0 <0.01 <5 <3 <1.0 <3.0
25.05.2021 07.00-07.00 61.5 26.3 42.7 7.9 22.6 <5 <5 <1.0 <0.01 <5 <3 <1.0 <3.0
26.05.2021 07.15-07.15 62.8 25.7 42.9 7.1 24.3 <5 <5 <1.0 <0.01 <5 <3 <1.0 <3.0
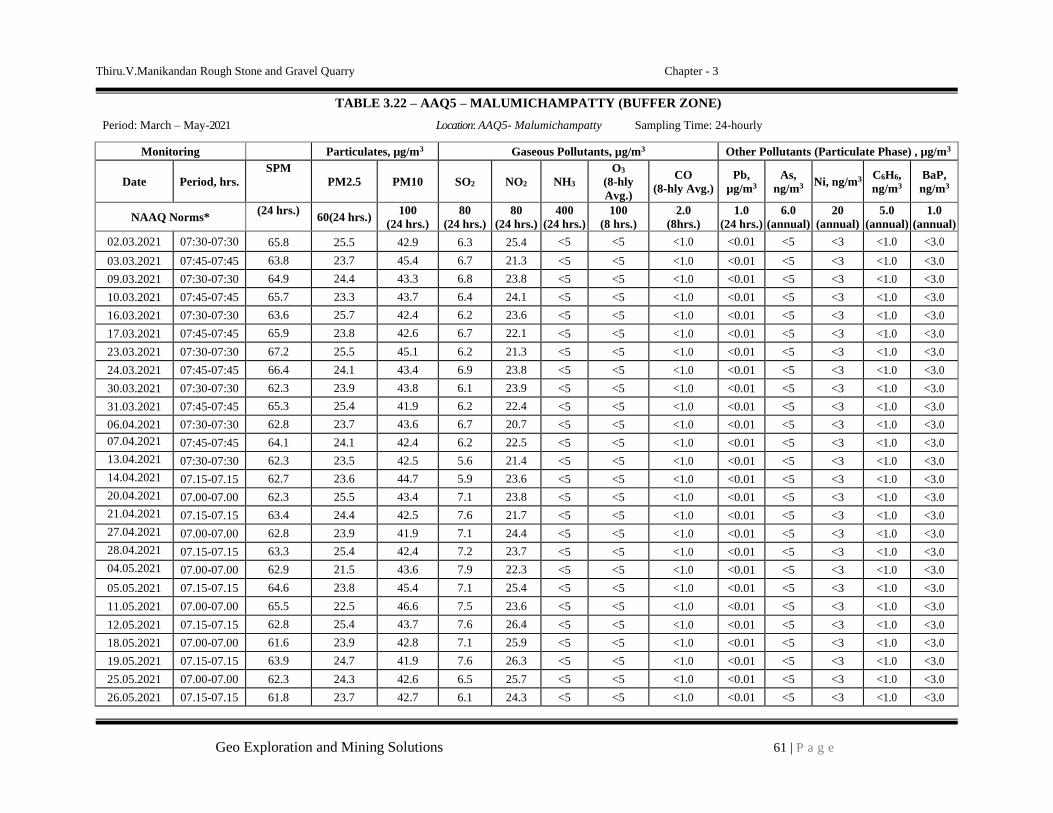
Thiru.V.Manikandan Rough Stone and Gravel Quarry Chapter - 3
Geo Exploration and Mining Solutions 61 | P a g e
TABLE 3.22 – AAQ5 – MALUMICHAMPATTY (BUFFER ZONE)
Period: March – May-2021 Location: AAQ5- Malumichampatty Sampling Time: 24-hourly
Monitoring Particulates, µg/m3 Gaseous Pollutants, µg/m3 Other Pollutants (Particulate Phase) , µg/m3
Date Period, hrs.
SPM
PM2.5 PM10 SO2 NO2 NH3
O3 (8-hly
Avg.)
CO
(8-hly Avg.)
Pb,
µg/m3
As,
ng/m3 Ni, ng/m3
C6H6, ng/m3
BaP,
ng/m3
NAAQ Norms* (24 hrs.)
60(24 hrs.) 100
(24 hrs.)
80
(24 hrs.)
80
(24 hrs.)
400
(24 hrs.)
100
(8 hrs.)
2.0
(8hrs.)
1.0
(24 hrs.)
6.0
(annual)
20
(annual)
5.0
(annual)
1.0
(annual)
02.03.2021 07:30-07:30 65.8 25.5 42.9 6.3 25.4 <5 <5 <1.0 <0.01 <5 <3 <1.0 <3.0
03.03.2021 07:45-07:45 63.8 23.7 45.4 6.7 21.3 <5 <5 <1.0 <0.01 <5 <3 <1.0 <3.0
09.03.2021 07:30-07:30 64.9 24.4 43.3 6.8 23.8 <5 <5 <1.0 <0.01 <5 <3 <1.0 <3.0
10.03.2021 07:45-07:45 65.7 23.3 43.7 6.4 24.1 <5 <5 <1.0 <0.01 <5 <3 <1.0 <3.0
16.03.2021 07:30-07:30 63.6 25.7 42.4 6.2 23.6 <5 <5 <1.0 <0.01 <5 <3 <1.0 <3.0
17.03.2021 07:45-07:45 65.9 23.8 42.6 6.7 22.1 <5 <5 <1.0 <0.01 <5 <3 <1.0 <3.0
23.03.2021 07:30-07:30 67.2 25.5 45.1 6.2 21.3 <5 <5 <1.0 <0.01 <5 <3 <1.0 <3.0
24.03.2021 07:45-07:45 66.4 24.1 43.4 6.9 23.8 <5 <5 <1.0 <0.01 <5 <3 <1.0 <3.0
30.03.2021 07:30-07:30 62.3 23.9 43.8 6.1 23.9 <5 <5 <1.0 <0.01 <5 <3 <1.0 <3.0
31.03.2021 07:45-07:45 65.3 25.4 41.9 6.2 22.4 <5 <5 <1.0 <0.01 <5 <3 <1.0 <3.0
06.04.2021 07:30-07:30 62.8 23.7 43.6 6.7 20.7 <5 <5 <1.0 <0.01 <5 <3 <1.0 <3.0
07.04.2021 07:45-07:45 64.1 24.1 42.4 6.2 22.5 <5 <5 <1.0 <0.01 <5 <3 <1.0 <3.0
13.04.2021 07:30-07:30 62.3 23.5 42.5 5.6 21.4 <5 <5 <1.0 <0.01 <5 <3 <1.0 <3.0
14.04.2021 07.15-07.15 62.7 23.6 44.7 5.9 23.6 <5 <5 <1.0 <0.01 <5 <3 <1.0 <3.0
20.04.2021 07.00-07.00 62.3 25.5 43.4 7.1 23.8 <5 <5 <1.0 <0.01 <5 <3 <1.0 <3.0
21.04.2021 07.15-07.15 63.4 24.4 42.5 7.6 21.7 <5 <5 <1.0 <0.01 <5 <3 <1.0 <3.0
27.04.2021 07.00-07.00 62.8 23.9 41.9 7.1 24.4 <5 <5 <1.0 <0.01 <5 <3 <1.0 <3.0
28.04.2021 07.15-07.15 63.3 25.4 42.4 7.2 23.7 <5 <5 <1.0 <0.01 <5 <3 <1.0 <3.0
04.05.2021 07.00-07.00 62.9 21.5 43.6 7.9 22.3 <5 <5 <1.0 <0.01 <5 <3 <1.0 <3.0
05.05.2021 07.15-07.15 64.6 23.8 45.4 7.1 25.4 <5 <5 <1.0 <0.01 <5 <3 <1.0 <3.0
11.05.2021 07.00-07.00 65.5 22.5 46.6 7.5 23.6 <5 <5 <1.0 <0.01 <5 <3 <1.0 <3.0
12.05.2021 07.15-07.15 62.8 25.4 43.7 7.6 26.4 <5 <5 <1.0 <0.01 <5 <3 <1.0 <3.0
18.05.2021 07.00-07.00 61.6 23.9 42.8 7.1 25.9 <5 <5 <1.0 <0.01 <5 <3 <1.0 <3.0
19.05.2021 07.15-07.15 63.9 24.7 41.9 7.6 26.3 <5 <5 <1.0 <0.01 <5 <3 <1.0 <3.0
25.05.2021 07.00-07.00 62.3 24.3 42.6 6.5 25.7 <5 <5 <1.0 <0.01 <5 <3 <1.0 <3.0
26.05.2021 07.15-07.15 61.8 23.7 42.7 6.1 24.3 <5 <5 <1.0 <0.01 <5 <3 <1.0 <3.0

Thiru.V.Manikandan Rough Stone and Gravel Quarry Chapter - 3
Geo Exploration and Mining Solutions 62 | P a g e
TABLE 3.23 – AAQ6 - OTHAKALMANDAPAM (BUFFER ZONE)
Period: March – May-2021 Location: AAQ6 – Othakalmandapam Sampling Time: 24-hourly
Monitoring Particulates, µg/m3 Gaseous Pollutants, µg/m3 Other Pollutants (Particulate Phase) , µg/m3
Date Period, hrs.
SPM
PM2.5 PM10 SO2 NO2 NH3
O3 (8-hly
Avg.)
CO
(8-hly Avg.)
Pb,
µg/m3
As,
ng/m3 Ni, ng/m3
C6H6, ng/m3
BaP,
ng/m3
NAAQ Norms* (24 hrs.)
60(24 hrs.) 100
(24 hrs.)
80
(24 hrs.)
80
(24 hrs.)
400
(24 hrs.)
100
(8 hrs.)
2.0
(8hrs.)
1.0
(24 hrs.)
6.0
(annual)
20
(annual)
5.0
(annual)
1.0
(annual)
02.03.2021 08:00-08:00 62.3 22.7 41.3 7.6 21.6 <5 <5 <1.0 <0.01 <5 <3 <1.0 <3.0
03.03.2021 08:15-08:15 62.8 23.4 42.7 8.6 23.4 <5 <5 <1.0 <0.01 <5 <3 <1.0 <3.0
09.03.2021 08:00-08:00 61.6 21.6 43.4 8.1 21.7 <5 <5 <1.0 <0.01 <5 <3 <1.0 <3.0
10.03.2021 08:15-08:15 63.8 23.5 41.8 8.3 20.9 <5 <5 <1.0 <0.01 <5 <3 <1.0 <3.0
16.03.2021 08:00-08:00 64.4 22.8 43.6 7.1 21.5 <5 <5 <1.0 <0.01 <5 <3 <1.0 <3.0
17.03.2021 08:15-08:15 62.3 25.5 42.4 7.6 23.8 <5 <5 <1.0 <0.01 <5 <3 <1.0 <3.0
23.03.2021 08:00-08:00 64.9 23.7 41.8 7.1 21.2 <5 <5 <1.0 <0.01 <5 <3 <1.0 <3.0
24.03.2021 08:15-08:15 64.2 21.9 43.9 7.6 21.4 <5 <5 <1.0 <0.01 <5 <3 <1.0 <3.0
30.03.2021 08:00-08:00 62.5 23.6 42.7 6.5 21.9 <5 <5 <1.0 <0.01 <5 <3 <1.0 <3.0
31.03.2021 08:15-08:15 63.8 21.4 42.6 6.4 23.3 <5 <5 <1.0 <0.01 <5 <3 <1.0 <3.0
06.04.2021 08:00-08:00 61.7 23.7 40.7 6.6 21.7 <5 <5 <1.0 <0.01 <5 <3 <1.0 <3.0
07.04.2021 08:15-08:15 62.9 21.8 40.9 6.1 21.3 <5 <5 <1.0 <0.01 <5 <3 <1.0 <3.0
13.04.2021 08:00-08:00 63.5 21.3 42.5 6.4 23.5 <5 <5 <1.0 <0.01 <5 <3 <1.0 <3.0
14.04.2021 07.15-07.15 61.4 22.5 41.9 6.7 22.6 <5 <5 <1.0 <0.01 <5 <3 <1.0 <3.0
20.04.2021 07.00-07.00 63.6 24.6 42.4 6.2 23.8 <5 <5 <1.0 <0.01 <5 <3 <1.0 <3.0
21.04.2021 07.15-07.15 62.7 25.7 43.7 6.9 21.4 <5 <5 <1.0 <0.01 <5 <3 <1.0 <3.0
27.04.2021 07.00-07.00 62.5 23.5 41.9 6.1 21.8 <5 <5 <1.0 <0.01 <5 <3 <1.0 <3.0
28.04.2021 07.15-07.15 63.9 21.6 42.6 6.8 22.9 <5 <5 <1.0 <0.01 <5 <3 <1.0 <3.0
04.05.2021 07.00-07.00 62.6 25.9 42.2 7.3 23.7 <5 <5 <1.0 <0.01 <5 <3 <1.0 <3.0
05.05.2021 07.15-07.15 62.1 23.1 46.1 7.5 21.4 <5 <5 <1.0 <0.01 <5 <3 <1.0 <3.0
11.05.2021 07.00-07.00 62.3 25.3 44.5 7.1 24.9 <5 <5 <1.0 <0.01 <5 <3 <1.0 <3.0
12.05.2021 07.15-07.15 64.4 24.1 42.5 7.5 22.9 <5 <5 <1.0 <0.01 <5 <3 <1.0 <3.0
18.05.2021 07.00-07.00 64.7 26.9 43.7 7.3 23.7 <5 <5 <1.0 <0.01 <5 <3 <1.0 <3.0
19.05.2021 07.15-07.15 62.3 23.7 43.9 7.1 21.4 <5 <5 <1.0 <0.01 <5 <3 <1.0 <3.0
25.05.2021 07.00-07.00 61.2 24.9 42.1 7.8 22.3 <5 <5 <1.0 <0.01 <5 <3 <1.0 <3.0
26.05.2021 07.15-07.15 61.8 23.7 42.7 7.2 22.9 <5 <5 <1.0 <0.01 <5 <3 <1.0 <3.0

Thiru.V.Manikandan Rough Stone and Gravel Quarry Chapter - 3
Geo Exploration and Mining Solutions 63 | P a g e
TABLE 3.24 – AAQ7 - CHETTIPALAYAM VILLAGE (BUFFER ZONE)
Period: March – May-2021 Location: AAQ7– Chettipalayam Sampling Time: 24-hourly
Monitoring Particulates, µg/m3 Gaseous Pollutants, µg/m3 Other Pollutants (Particulate Phase) , µg/m3
Date Period, hrs.
SPM
PM2.5 PM10 SO2 NO2 NH3
O3 (8-hly
Avg.)
CO
(8-hly Avg.)
Pb,
µg/m3
As,
ng/m3 Ni, ng/m3
C6H6, ng/m3
BaP,
ng/m3
NAAQ Norms* (24 hrs.)
60(24 hrs.) 100
(24 hrs.)
80
(24 hrs.)
80
(24 hrs.)
400
(24 hrs.)
100
(8 hrs.)
2.0
(8hrs.)
1.0
(24 hrs.)
6.0
(annual)
20
(annual)
5.0
(annual)
1.0
(annual)
02.03.2021 08:00-08:00 61.9 23.3 43.7 6.8 22.3 <5 <5 <1.0 <0.01 <5 <3 <1.0 <3.0
03.03.2021 08:15-08:15 63.7 21.6 41.9 6.3 22.1 <5 <5 <1.0 <0.01 <5 <3 <1.0 <3.0
09.03.2021 08:00-08:00 62.8 22.4 42.6 6.1 22.6 <5 <5 <1.0 <0.01 <5 <3 <1.0 <3.0
10.03.2021 08:15-08:15 64.2 23.9 43.8 5.8 23.2 <5 <5 <1.0 <0.01 <5 <3 <1.0 <3.0
16.03.2021 08:00-08:00 63.9 22.6 42.7 5.2 23.5 <5 <5 <1.0 <0.01 <5 <3 <1.0 <3.0
17.03.2021 08:15-08:15 62.5 23.5 43.5 5.1 23.8 <5 <5 <1.0 <0.01 <5 <3 <1.0 <3.0
23.03.2021 08:00-08:00 61.9 21.7 41.6 5.3 23.7 <5 <5 <1.0 <0.01 <5 <3 <1.0 <3.0
24.03.2021 08:15-08:15 64.7 22.8 43.6 5.0 23.8 <5 <5 <1.0 <0.01 <5 <3 <1.0 <3.0
30.03.2021 08:00-08:00 61.9 25.3 42.5 5.8 23.1 <5 <5 <1.0 <0.01 <5 <3 <1.0 <3.0
31.03.2021 08:15-08:15 63.7 23.9 44.9 5.6 23.2 <5 <5 <1.0 <0.01 <5 <3 <1.0 <3.0
06.04.2021 08:00-08:00 62.9 21.7 41.9 5.1 24.1 <5 <5 <1.0 <0.01 <5 <3 <1.0 <3.0
07.04.2021 08:15-08:15 62.5 24.4 43.6 5.8 24.5 <5 <5 <1.0 <0.01 <5 <3 <1.0 <3.0
13.04.2021 08:00-08:00 63.8 23.6 42.7 6.6 23.5 <5 <5 <1.0 <0.01 <5 <3 <1.0 <3.0
14.04.2021 07.15-07.15 61.4 25.9 43.6 6.5 23.5 <5 <5 <1.0 <0.01 <5 <3 <1.0 <3.0
20.04.2021 07.00-07.00 62.5 21.7 41.9 6.4 23.9 <5 <5 <1.0 <0.01 <5 <3 <1.0 <3.0
21.04.2021 07.15-07.15 63.9 23.3 42.5 5.5 23.5 <5 <5 <1.0 <0.01 <5 <3 <1.0 <3.0
27.04.2021 07.00-07.00 61.5 25.6 43.4 5.6 23.1 <5 <5 <1.0 <0.01 <5 <3 <1.0 <3.0
28.04.2021 07.15-07.15 62.8 25.7 41.9 5.1 22.1 <5 <5 <1.0 <0.01 <5 <3 <1.0 <3.0
04.05.2021 07.00-07.00 63.6 21.9 42.4 5.6 22.6 <5 <5 <1.0 <0.01 <5 <3 <1.0 <3.0
05.05.2021 07.15-07.15 64.9 22.1 41.8 5.7 22.5 <5 <5 <1.0 <0.01 <5 <3 <1.0 <3.0
11.05.2021 07.00-07.00 62.3 24.3 43.4 6.2 20.5 <5 <5 <1.0 <0.01 <5 <3 <1.0 <3.0
12.05.2021 07.15-07.15 62.8 21.9 42.7 6.3 21.8 <5 <5 <1.0 <0.01 <5 <3 <1.0 <3.0
18.05.2021 07.00-07.00 62.5 23.7 43.6 6.5 20.6 <5 <5 <1.0 <0.01 <5 <3 <1.0 <3.0
19.05.2021 07.15-07.15 61.7 22.4 41.9 6.1 20.5 <5 <5 <1.0 <0.01 <5 <3 <1.0 <3.0
25.05.2021 07.00-07.00 61.2 21.3 41.9 6.8 20.2 <5 <5 <1.0 <0.01 <5 <3 <1.0 <3.0
26.05.2021 07.15-07.15 61.5 21.5 42.5 6.4 20.7 <5 <5 <1.0 <0.01 <5 <3 <1.0 <3.0

Thiru.V.Manikandan Rough Stone and Gravel Quarry Chapter - 3
Geo Exploration and Mining Solutions 64 | P a g e
TABLE 3.25 – AAQ8 - VADASITHUR VILLAGE (BUFFER ZONE)
Period: March – May-2021 Location: AAQ98– Vadasithur Sampling Time: 24-hourly
Monitoring Particulates, µg/m3 Gaseous Pollutants, µg/m3 Other Pollutants (Particulate Phase) , µg/m3
Date Period, hrs.
SPM
PM2.5 PM10 SO2 NO2 NH3
O3 (8-hly
Avg.)
CO
(8-hly Avg.)
Pb,
µg/m3
As,
ng/m3 Ni, ng/m3
C6H6, ng/m3
BaP,
ng/m3
NAAQ Norms* (24 hrs.)
60(24 hrs.) 100
(24 hrs.)
80
(24 hrs.)
80
(24 hrs.)
400
(24 hrs.)
100
(8 hrs.)
2.0
(8hrs.)
1.0
(24 hrs.)
6.0
(annual)
20
(annual)
5.0
(annual)
1.0
(annual)
02.03.2021 08:00-08:00 62.9 20.3 43.2 5.3 23.3 <5 <5 <1.0 <0.01 <5 <3 <1.0 <3.0
03.03.2021 08:15-08:15 62.0 20.9 43.5 5.3 23.5 <5 <5 <1.0 <0.01 <5 <3 <1.0 <3.0
09.03.2021 08:00-08:00 62.8 21.3 43.9 5.6 23.6 <5 <5 <1.0 <0.01 <5 <3 <1.0 <3.0
10.03.2021 08:15-08:15 62.4 21.4 43.7 5.4 23.7 <5 <5 <1.0 <0.01 <5 <3 <1.0 <3.0
16.03.2021 08:00-08:00 60.2 21.6 43.5 5.3 23.5 <5 <5 <1.0 <0.01 <5 <3 <1.0 <3.0
17.03.2021 08:15-08:15 60.8 21.7 44.6 6.5 23.6 <5 <5 <1.0 <0.01 <5 <3 <1.0 <3.0
23.03.2021 08:00-08:00 60.4 20.3 44.2 6.1 23.8 <5 <5 <1.0 <0.01 <5 <3 <1.0 <3.0
24.03.2021 08:15-08:15 60.9 20.1 44.3 6.5 21.5 <5 <5 <1.0 <0.01 <5 <3 <1.0 <3.0
30.03.2021 08:00-08:00 61.2 20.4 43.5 6.1 21.6 <5 <5 <1.0 <0.01 <5 <3 <1.0 <3.0
31.03.2021 08:15-08:15 61.5 19.3 44.3 6.4 22.5 <5 <5 <1.0 <0.01 <5 <3 <1.0 <3.0
06.04.2021 08:00-08:00 61.9 19.7 42.5 6.8 22.6 <5 <5 <1.0 <0.01 <5 <3 <1.0 <3.0
07.04.2021 08:15-08:15 61.2 18.3 42.6 6.3 22.7 <5 <5 <1.0 <0.01 <5 <3 <1.0 <3.0
13.04.2021 08:00-08:00 60.2 18.9 41.6 6.4 23.6 <5 <5 <1.0 <0.01 <5 <3 <1.0 <3.0
14.04.2021 07.15-07.15 59.7 19.4 42.7 6.9 23.4 <5 <5 <1.0 <0.01 <5 <3 <1.0 <3.0
20.04.2021 07.00-07.00 59.8 20.3 44.6 6.7 22.3 <5 <5 <1.0 <0.01 <5 <3 <1.0 <3.0
21.04.2021 07.15-07.15 60.2 21.3 42.3 6.8 22.5 <5 <5 <1.0 <0.01 <5 <3 <1.0 <3.0
27.04.2021 07.00-07.00 60.9 23.2 42.3 6.1 22.6 <5 <5 <1.0 <0.01 <5 <3 <1.0 <3.0
28.04.2021 07.15-07.15 61.3 22.5 43.8 6.4 22.3 <5 <5 <1.0 <0.01 <5 <3 <1.0 <3.0
04.05.2021 07.00-07.00 61.7 22.4 43.7 7.3 23.4 <5 <5 <1.0 <0.01 <5 <3 <1.0 <3.0
05.05.2021 07.15-07.15 61.5 23.5 43.6 7.5 23.6 <5 <5 <1.0 <0.01 <5 <3 <1.0 <3.0
11.05.2021 07.00-07.00 61.6 21.2 43.2 7.6 23.4 <5 <5 <1.0 <0.01 <5 <3 <1.0 <3.0
12.05.2021 07.15-07.15 61.8 21.3 42.3 7.1 23.6 <5 <5 <1.0 <0.01 <5 <3 <1.0 <3.0
18.05.2021 07.00-07.00 61.3 21.5 42.9 7.5 22.1 <5 <5 <1.0 <0.01 <5 <3 <1.0 <3.0
19.05.2021 07.15-07.15 61.0 20.3 42.7 7.6 23.1 <5 <5 <1.0 <0.01 <5 <3 <1.0 <3.0
25.05.2021 07.00-07.00 62.3 21.3 42.9 7.8 22.6 <5 <5 <1.0 <0.01 <5 <3 <1.0 <3.0
26.05.2021 07.15-07.15 62.5 21.5 42.5 7.9 22.9 <5 <5 <1.0 <0.01 <5 <3 <1.0 <3.0
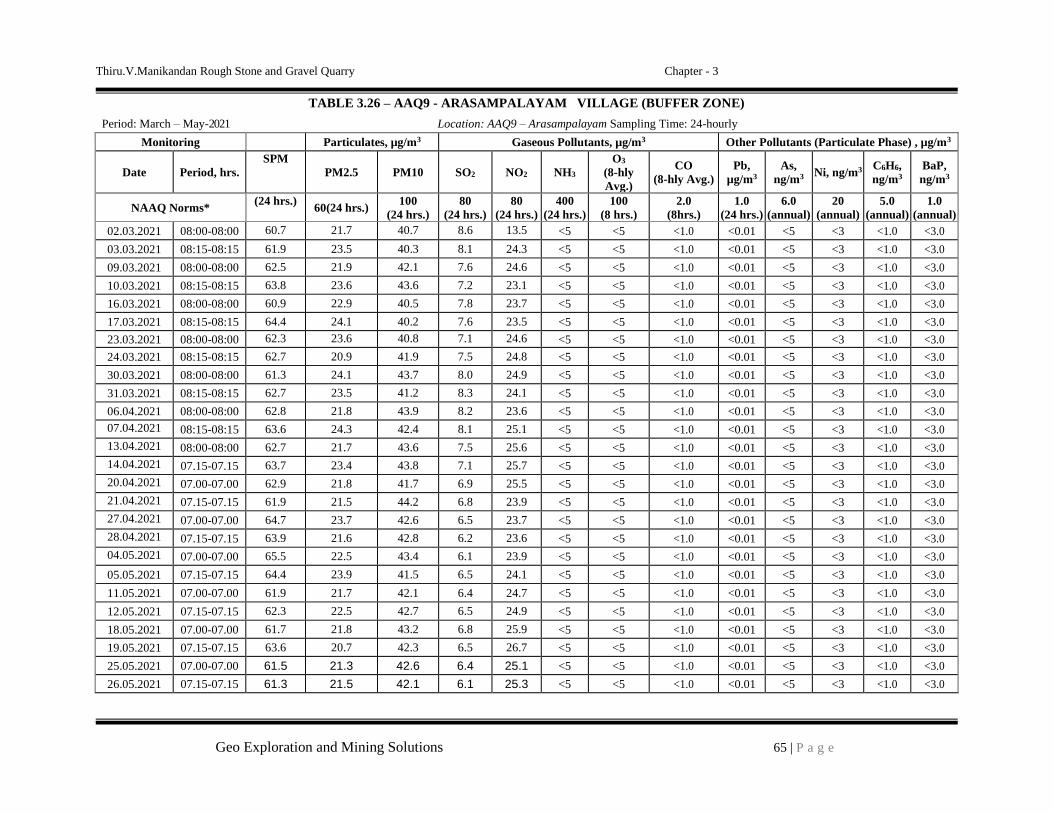
Thiru.V.Manikandan Rough Stone and Gravel Quarry Chapter - 3
Geo Exploration and Mining Solutions 65 | P a g e
TABLE 3.26 – AAQ9 - ARASAMPALAYAM VILLAGE (BUFFER ZONE)
Period: March – May-2021 Location: AAQ9 – Arasampalayam Sampling Time: 24-hourly
Monitoring Particulates, µg/m3 Gaseous Pollutants, µg/m3 Other Pollutants (Particulate Phase) , µg/m3
Date Period, hrs.
SPM
PM2.5 PM10 SO2 NO2 NH3
O3 (8-hly
Avg.)
CO
(8-hly Avg.)
Pb,
µg/m3
As,
ng/m3 Ni, ng/m3
C6H6, ng/m3
BaP,
ng/m3
NAAQ Norms* (24 hrs.)
60(24 hrs.) 100
(24 hrs.)
80
(24 hrs.)
80
(24 hrs.)
400
(24 hrs.)
100
(8 hrs.)
2.0
(8hrs.)
1.0
(24 hrs.)
6.0
(annual)
20
(annual)
5.0
(annual)
1.0
(annual)
02.03.2021 08:00-08:00 60.7 21.7 40.7 8.6 13.5 <5 <5 <1.0 <0.01 <5 <3 <1.0 <3.0
03.03.2021 08:15-08:15 61.9 23.5 40.3 8.1 24.3 <5 <5 <1.0 <0.01 <5 <3 <1.0 <3.0
09.03.2021 08:00-08:00 62.5 21.9 42.1 7.6 24.6 <5 <5 <1.0 <0.01 <5 <3 <1.0 <3.0
10.03.2021 08:15-08:15 63.8 23.6 43.6 7.2 23.1 <5 <5 <1.0 <0.01 <5 <3 <1.0 <3.0
16.03.2021 08:00-08:00 60.9 22.9 40.5 7.8 23.7 <5 <5 <1.0 <0.01 <5 <3 <1.0 <3.0
17.03.2021 08:15-08:15 64.4 24.1 40.2 7.6 23.5 <5 <5 <1.0 <0.01 <5 <3 <1.0 <3.0
23.03.2021 08:00-08:00 62.3 23.6 40.8 7.1 24.6 <5 <5 <1.0 <0.01 <5 <3 <1.0 <3.0
24.03.2021 08:15-08:15 62.7 20.9 41.9 7.5 24.8 <5 <5 <1.0 <0.01 <5 <3 <1.0 <3.0
30.03.2021 08:00-08:00 61.3 24.1 43.7 8.0 24.9 <5 <5 <1.0 <0.01 <5 <3 <1.0 <3.0
31.03.2021 08:15-08:15 62.7 23.5 41.2 8.3 24.1 <5 <5 <1.0 <0.01 <5 <3 <1.0 <3.0
06.04.2021 08:00-08:00 62.8 21.8 43.9 8.2 23.6 <5 <5 <1.0 <0.01 <5 <3 <1.0 <3.0
07.04.2021 08:15-08:15 63.6 24.3 42.4 8.1 25.1 <5 <5 <1.0 <0.01 <5 <3 <1.0 <3.0
13.04.2021 08:00-08:00 62.7 21.7 43.6 7.5 25.6 <5 <5 <1.0 <0.01 <5 <3 <1.0 <3.0
14.04.2021 07.15-07.15 63.7 23.4 43.8 7.1 25.7 <5 <5 <1.0 <0.01 <5 <3 <1.0 <3.0
20.04.2021 07.00-07.00 62.9 21.8 41.7 6.9 25.5 <5 <5 <1.0 <0.01 <5 <3 <1.0 <3.0
21.04.2021 07.15-07.15 61.9 21.5 44.2 6.8 23.9 <5 <5 <1.0 <0.01 <5 <3 <1.0 <3.0
27.04.2021 07.00-07.00 64.7 23.7 42.6 6.5 23.7 <5 <5 <1.0 <0.01 <5 <3 <1.0 <3.0
28.04.2021 07.15-07.15 63.9 21.6 42.8 6.2 23.6 <5 <5 <1.0 <0.01 <5 <3 <1.0 <3.0
04.05.2021 07.00-07.00 65.5 22.5 43.4 6.1 23.9 <5 <5 <1.0 <0.01 <5 <3 <1.0 <3.0
05.05.2021 07.15-07.15 64.4 23.9 41.5 6.5 24.1 <5 <5 <1.0 <0.01 <5 <3 <1.0 <3.0
11.05.2021 07.00-07.00 61.9 21.7 42.1 6.4 24.7 <5 <5 <1.0 <0.01 <5 <3 <1.0 <3.0
12.05.2021 07.15-07.15 62.3 22.5 42.7 6.5 24.9 <5 <5 <1.0 <0.01 <5 <3 <1.0 <3.0
18.05.2021 07.00-07.00 61.7 21.8 43.2 6.8 25.9 <5 <5 <1.0 <0.01 <5 <3 <1.0 <3.0
19.05.2021 07.15-07.15 63.6 20.7 42.3 6.5 26.7 <5 <5 <1.0 <0.01 <5 <3 <1.0 <3.0
25.05.2021 07.00-07.00 61.5 21.3 42.6 6.4 25.1 <5 <5 <1.0 <0.01 <5 <3 <1.0 <3.0
26.05.2021 07.15-07.15 61.3 21.5 42.1 6.1 25.3 <5 <5 <1.0 <0.01 <5 <3 <1.0 <3.0

Thiru.V.Manikandan Rough Stone and Gravel Quarry Chapter - 3
Geo Exploration and Mining Solutions 66 | P a g e
TABLE 3.27 – AAQ10 - PONNAKKANI VILLAGE (BUFFER ZONE)
Period: March – May-2021 Location: AAQ10– Ponnakkani Sampling Time: 24-hourly
Monitoring Particulates, µg/m3 Gaseous Pollutants, µg/m3 Other Pollutants (Particulate Phase) , µg/m3
Date Period, hrs.
SPM
PM2.5 PM10 SO2 NO2 NH3
O3 (8-hly
Avg.)
CO
(8-hly Avg.)
Pb,
µg/m3
As,
ng/m3 Ni, ng/m3
C6H6, ng/m3
BaP,
ng/m3
NAAQ Norms* (24 hrs.)
60(24 hrs.) 100
(24 hrs.)
80
(24 hrs.)
80
(24 hrs.)
400
(24 hrs.)
100
(8 hrs.)
2.0
(8hrs.)
1.0
(24 hrs.)
6.0
(annual)
20
(annual)
5.0
(annual)
1.0
(annual)
02.03.2021 08:00-08:00 57.6 22.1 43.5 5.5 20.5 <5 <5 <1.0 <0.01 <5 <3 <1.0 <3.0
03.03.2021 08:15-08:15 57.2 21.9 44.3 5.3 21.3 <5 <5 <1.0 <0.01 <5 <3 <1.0 <3.0
09.03.2021 08:00-08:00 58.6 22.5 42.1 5.4 20.4 <5 <5 <1.0 <0.01 <5 <3 <1.0 <3.0
10.03.2021 08:15-08:15 56.2 21.4 43.9 5.9 19.6 <5 <5 <1.0 <0.01 <5 <3 <1.0 <3.0
16.03.2021 08:00-08:00 56.4 21.6 42.4 5.1 19.2 <5 <5 <1.0 <0.01 <5 <3 <1.0 <3.0
17.03.2021 08:15-08:15 56.8 21.5 43.7 5.5 20.1 <5 <5 <1.0 <0.01 <5 <3 <1.0 <3.0
23.03.2021 08:00-08:00 57.3 22.5 43.3 5.7 21.6 <5 <5 <1.0 <0.01 <5 <3 <1.0 <3.0
24.03.2021 08:15-08:15 57.5 21.1 42.7 5.5 20.8 <5 <5 <1.0 <0.01 <5 <3 <1.0 <3.0
30.03.2021 08:00-08:00 56.8 22.5 42.9 5.3 20.3 <5 <5 <1.0 <0.01 <5 <3 <1.0 <3.0
31.03.2021 08:15-08:15 56.2 22.9 43.0 5.9 21.4 <5 <5 <1.0 <0.01 <5 <3 <1.0 <3.0
06.04.2021 08:00-08:00 56.3 23.4 43.8 5.1 20.6 <5 <5 <1.0 <0.01 <5 <3 <1.0 <3.0
07.04.2021 08:15-08:15 56.8 22.1 43.1 5.7 21.6 <5 <5 <1.0 <0.01 <5 <3 <1.0 <3.0
13.04.2021 08:00-08:00 57.2 21.6 43.6 5.3 20.6 <5 <5 <1.0 <0.01 <5 <3 <1.0 <3.0
14.04.2021 07.15-07.15 57.4 22.5 42.8 5.7 20.5 <5 <5 <1.0 <0.01 <5 <3 <1.0 <3.0
20.04.2021 07.00-07.00 57.9 21.6 42.3 5.2 21.4 <5 <5 <1.0 <0.01 <5 <3 <1.0 <3.0
21.04.2021 07.15-07.15 56.2 22.4 43.7 5.9 19.8 <5 <5 <1.0 <0.01 <5 <3 <1.0 <3.0
27.04.2021 07.00-07.00 56.3 23.5 43.1 5.7 19.1 <5 <5 <1.0 <0.01 <5 <3 <1.0 <3.0
28.04.2021 07.15-07.15 56.8 22.1 42.8 5.0 19.6 <5 <5 <1.0 <0.01 <5 <3 <1.0 <3.0
04.05.2021 07.00-07.00 56.1 22.7 43.5 5.9 19.8 <5 <5 <1.0 <0.01 <5 <3 <1.0 <3.0
05.05.2021 07.15-07.15 57.3 22.5 42.3 5.6 19.7 <5 <5 <1.0 <0.01 <5 <3 <1.0 <3.0
11.05.2021 07.00-07.00 57.7 22.4 43.1 5.3 19.6 <5 <5 <1.0 <0.01 <5 <3 <1.0 <3.0
12.05.2021 07.15-07.15 57.9 21.5 42.9 5.1 19.2 <5 <5 <1.0 <0.01 <5 <3 <1.0 <3.0
18.05.2021 07.00-07.00 56.6 23.1 42.1 5.5 20.1 <5 <5 <1.0 <0.01 <5 <3 <1.0 <3.0
19.05.2021 07.15-07.15 56.2 24.6 43.7 5.7 20.0 <5 <5 <1.0 <0.01 <5 <3 <1.0 <3.0
25.05.2021 07.00-07.00 57.9 22.5 42.8 5.8 20.8 <5 <5 <1.0 <0.01 <5 <3 <1.0 <3.0
26.05.2021 07.15-07.15 57.6 22.9 43.2 5.9 20.1 <5 <5 <1.0 <0.01 <5 <3 <1.0 <3.0
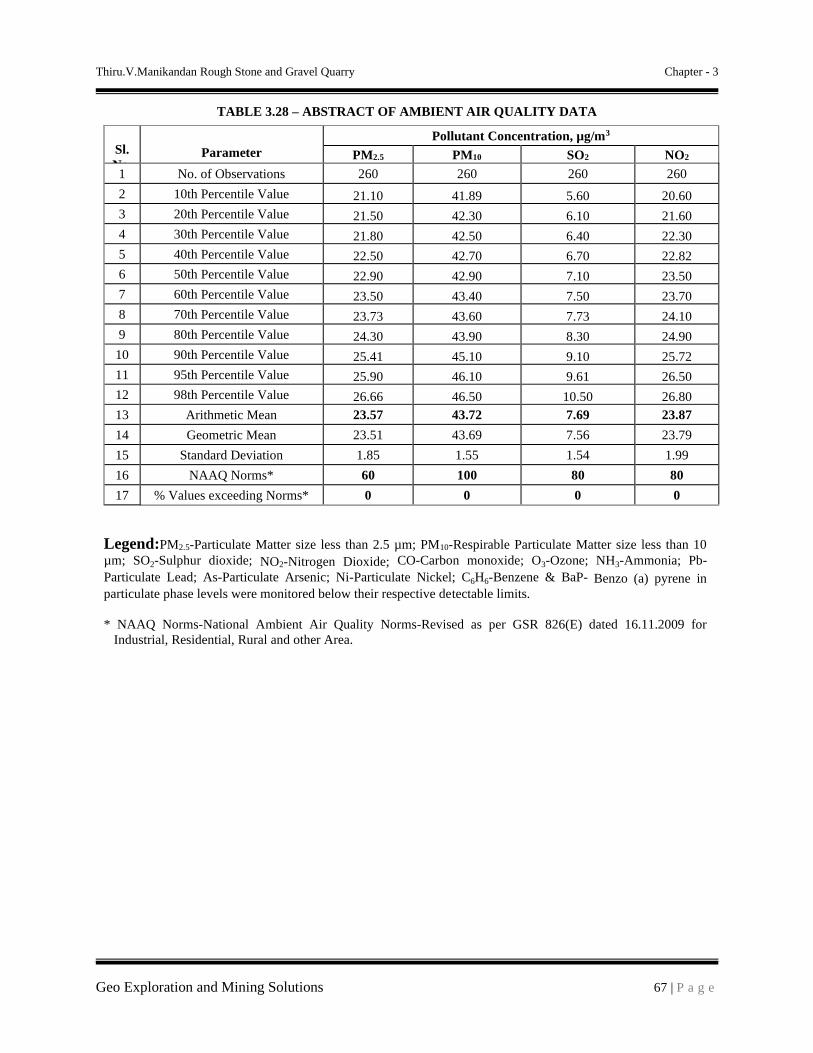
Thiru.V.Manikandan Rough Stone and Gravel Quarry Chapter - 3
Geo Exploration and Mining Solutions 67 | P a g e
TABLE 3.28 – ABSTRACT OF AMBIENT AIR QUALITY DATA
Sl.
No.
Parameter
Pollutant Concentration, µg/m3
PM2.5 PM10 SO2 NO2
1 No. of Observations 260 260 260 260
2 10th Percentile Value 21.10 41.89 5.60 20.60
3 20th Percentile Value 21.50 42.30 6.10 21.60
4 30th Percentile Value 21.80 42.50 6.40 22.30
5 40th Percentile Value 22.50 42.70 6.70 22.82
6 50th Percentile Value 22.90 42.90 7.10 23.50
7 60th Percentile Value 23.50 43.40 7.50 23.70
8 70th Percentile Value 23.73 43.60 7.73 24.10
9 80th Percentile Value 24.30 43.90 8.30 24.90
10 90th Percentile Value 25.41 45.10 9.10 25.72
11 95th Percentile Value 25.90 46.10 9.61 26.50
12 98th Percentile Value 26.66 46.50 10.50 26.80
13 Arithmetic Mean 23.57 43.72 7.69 23.87
14 Geometric Mean 23.51 43.69 7.56 23.79
15 Standard Deviation 1.85 1.55 1.54 1.99
16 NAAQ Norms* 60 100 80 80
17 % Values exceeding Norms* 0 0 0 0
Legend:PM2.5-Particulate Matter size less than 2.5 µm; PM10-Respirable Particulate Matter size less than 10
µm; SO2-Sulphur dioxide; NO2-Nitrogen Dioxide; CO-Carbon monoxide; O3-Ozone; NH3-Ammonia; Pb-
Particulate Lead; As-Particulate Arsenic; Ni-Particulate Nickel; C6H6-Benzene & BaP- Benzo (a) pyrene in
particulate phase levels were monitored below their respective detectable limits.
* NAAQ Norms-National Ambient Air Quality Norms-Revised as per GSR 826(E) dated 16.11.2009 for
Industrial, Residential, Rural and other Area.

Thiru.V.Manikandan Rough Stone and Gravel Quarry Chapter - 3
Geo Exploration and Mining Solutions 68 | P a g e
FIGURE 3.13 : BAR DIAGRAM OF PARTICULATE MATTER (PM10)
FIGURE 3.13A : BAR DIAGRAM OF PARTICULATE MATTER (PM2.5)
AAQ1 AAQ2 AAQ3 AAQ4 AAQ5 AAQ6 AAQ7 AAQ8 AAQ9 AAQ10
Arithmetic Mean 43.5 42.4 45.2 43.0 43.4 42.7 42.8 43.3 42.3 43.1
Minimum 41.8 40.3 42.3 41.4 41.9 40.7 41.6 41.6 40.2 42.1
Maximum 46.5 43.9 46.7 45.5 46.6 46.1 44.9 44.6 44.2 44.3
NAAQ Norms 100.0 100.0 100.0 100.0 100.0 100.0 100.0 100.0 100.0 100.0
0.0
20.0
40.0
60.0
80.0
100.0
120.0P
oll
uta
nt
Con
cen
trati
on
, µ
g/m
3
Particulate Matter (PM10, µg/m3)
AAQ1 AAQ2 AAQ3 AAQ4 AAQ5 AAQ6 AAQ7 AAQ8 AAQ9 AAQ10
Arithmetic Mean 23.3 21.7 25.5 22.6 24.3 23.7 23.2 20.9 22.5 22.4
Minimum 21.5 18.7 22.8 20.3 21.5 21.3 21.3 18.3 20.7 21.1
Maximum 24.9 24.7 26.9 26.3 25.7 26.9 25.9 23.5 24.3 24.6
NAAQ Norms 60.0 60.0 60.0 60.0 60.0 60.0 60.0 60.0 60.0 60.0
0.0
10.0
20.0
30.0
40.0
50.0
60.0
70.0
Poll
uta
nt
Con
cen
trati
on
, µ
g/m
3
Particulate Matter (PM2.5, µg/m3)

Thiru.V.Manikandan Rough Stone and Gravel Quarry Chapter - 3
Geo Exploration and Mining Solutions 69 | P a g e
FIGURE 3.14: BAR DIAGRAM OF PARTICULATE MATTER (SO2)
FIGURE 3.14A: BAR DIAGRAM OF PARTICULATE MATTER (NO2)
AAQ1 AAQ2 AAQ3 AAQ4 AAQ5 AAQ6 AAQ7 AAQ8 AAQ9 AAQ10
Arithmetic Mean 9.6 8.7 7.6 7.2 6.7 7.1 5.9 6.6 7.2 5.5
Minimum 7.6 5.6 7.1 6.1 5.6 6.1 5.0 5.3 6.1 5.0
Maximum 11.5 9.7 8.6 7.9 7.9 8.6 6.8 7.9 8.6 5.9
NAAQ Norms 80.0 80.0 80.0 80.0 80.0 80.0 80.0 80.0 80.0 80.0
0.0
10.0
20.0
30.0
40.0
50.0
60.0
70.0
80.0
90.0P
ollu
tan
t C
on
cen
trat
ion
, µg/
m3
Gaseous Pollutant (SO2, µg/m3)
AAQ1 AAQ2 AAQ3 AAQ4 AAQ5 AAQ6 AAQ7 AAQ8 AAQ9 AAQ10
Arithmetic Mean 25.0 22.4 26.0 23.0 23.6 22.4 22.7 23.0 24.2 20.3
Minimum 23.4 16.7 24.2 21.4 20.7 20.9 20.2 21.5 13.5 19.1
Maximum 26.8 26.7 28.4 25.9 26.4 24.9 24.5 23.8 26.7 21.6
NAAQ Norms 80.0 80.0 80.0 80.0 80.0 80.0 80.0 80.0 80.0 80.0
0.0
10.0
20.0
30.0
40.0
50.0
60.0
70.0
80.0
90.0
Poll
uta
nt
Con
cen
trati
on
, µ
g/m
3
Gaseous Pollutant (NOx, µg/m3)
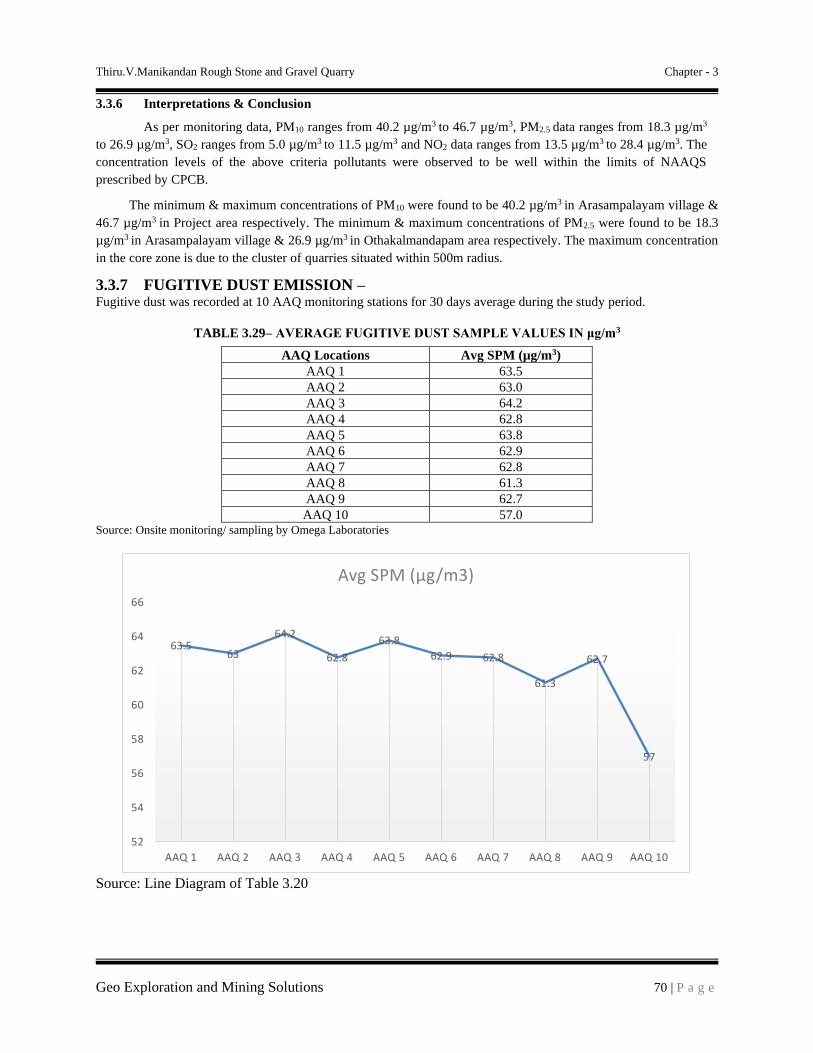
Thiru.V.Manikandan Rough Stone and Gravel Quarry Chapter - 3
Geo Exploration and Mining Solutions 70 | P a g e
3.3.6 Interpretations & Conclusion
As per monitoring data, PM10 ranges from 40.2 µg/m3 to 46.7 µg/m3, PM2.5 data ranges from 18.3 µg/m3
to 26.9 µg/m3, SO2 ranges from 5.0 µg/m3 to 11.5 µg/m3 and NO2 data ranges from 13.5 µg/m3 to 28.4 µg/m3. The
concentration levels of the above criteria pollutants were observed to be well within the limits of NAAQS
prescribed by CPCB.
The minimum & maximum concentrations of PM10 were found to be 40.2 µg/m3 in Arasampalayam village &
46.7 µg/m3 in Project area respectively. The minimum & maximum concentrations of PM2.5 were found to be 18.3
µg/m3 in Arasampalayam village & 26.9 µg/m3 in Othakalmandapam area respectively. The maximum concentration
in the core zone is due to the cluster of quarries situated within 500m radius.
3.3.7 FUGITIVE DUST EMISSION – Fugitive dust was recorded at 10 AAQ monitoring stations for 30 days average during the study period.
TABLE 3.29– AVERAGE FUGITIVE DUST SAMPLE VALUES IN μg/m3
AAQ Locations Avg SPM (µg/m3)
AAQ 1 63.5
AAQ 2 63.0
AAQ 3 64.2
AAQ 4 62.8
AAQ 5 63.8
AAQ 6 62.9
AAQ 7 62.8
AAQ 8 61.3
AAQ 9 62.7
AAQ 10 57.0 Source: Onsite monitoring/ sampling by Omega Laboratories
Source: Line Diagram of Table 3.20
63.563
64.2
62.8
63.8
62.9 62.8
61.3
62.7
57
52
54
56
58
60
62
64
66
AAQ 1 AAQ 2 AAQ 3 AAQ 4 AAQ 5 AAQ 6 AAQ 7 AAQ 8 AAQ 9 AAQ 10
Avg SPM (µg/m3)

Thiru.V.Manikandan Rough Stone and Gravel Quarry Chapter - 3
Geo Exploration and Mining Solutions 71 | P a g e
TABLE 3.30– FUGITIVE DUST SAMPLE VALUES IN μg/m3 –
SPM (µg/m3) AAQ1 AAQ2 AAQ3 AAQ4 AAQ5 AAQ6 AAQ7 AAQ8 AAQ9 AAQ10
Average 63.5 63.0 64.2 62.8 63.8 62.9 62.8 61.3 62.7 57.0 Max 66.8 65.9 66.2 65.5 67.2 64.9 64.9 62.9 65.5 58.6 Min 61.5 60.7 61.7 61.5 61.6 61.2 61.2 59.7 60.7 56.1
Source: Calculations from Lab Analysis Reports
Source: Bar Diagram of table 3.30
3.4 Noise Environment The vehicular movement on road and mining activities is the major sources of noise in study area, the
environmental assessment of noise from the mining activity and vehicular traffic can be undertaken by taking into
consideration various factors like potential damage to hearing, physiological responses, and annoyance and
general community responses.
The main objective of noise monitoring in the study area is to establish the baseline noise level and assess
the impact of the total noise expected to be generated during the project operations around the project site.
3.4.1 Identification of Sampling Locations
In order to assess the ambient noise levels within the study area, noise monitoring was carried out at
ten (10) locations. The noise level monitoring locations were carried out by covering commercial, residential, rural
areas within the radius of 10km. A noise monitoring methodology was chosen such that it best suited the purpose
and objectives of the study.
A A Q 1 A A Q 2 A A Q 3 A A Q 4 A A Q 5 A A Q 6 A A Q 7 A A Q 8 A A Q 9 A A Q 1 0
63.5 63 64.2 62.8 63.8 62.9 62.8 61.3 62.7 57
66.8 65.9 66.2 65.5 67.2 64.9 64.9 62.9 65.5 58.6
61.5 60.7 61.7 61.5 61.6 61.2 61.2 59.7 60.7 56.1
FUGITIVE DUST SAM PLE VALUES IN Μ G/M 3
Average Max Min
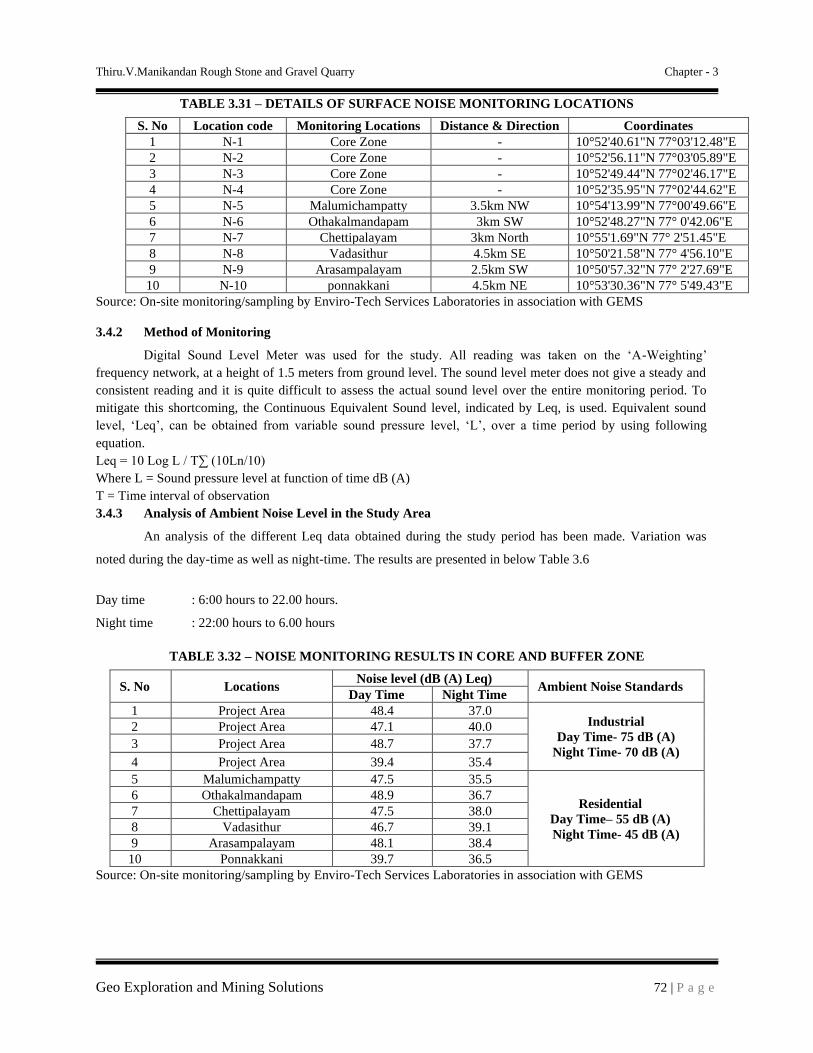
Thiru.V.Manikandan Rough Stone and Gravel Quarry Chapter - 3
Geo Exploration and Mining Solutions 72 | P a g e
TABLE 3.31 – DETAILS OF SURFACE NOISE MONITORING LOCATIONS
S. No Location code Monitoring Locations Distance & Direction Coordinates
1 N-1 Core Zone - 10°52'40.61"N 77°03'12.48"E
2 N-2 Core Zone - 10°52'56.11"N 77°03'05.89"E
3 N-3 Core Zone - 10°52'49.44"N 77°02'46.17"E
4 N-4 Core Zone - 10°52'35.95"N 77°02'44.62"E
5 N-5 Malumichampatty 3.5km NW 10°54'13.99"N 77°00'49.66"E
6 N-6 Othakalmandapam 3km SW 10°52'48.27"N 77° 0'42.06"E
7 N-7 Chettipalayam 3km North 10°55'1.69"N 77° 2'51.45"E
8 N-8 Vadasithur 4.5km SE 10°50'21.58"N 77° 4'56.10"E
9 N-9 Arasampalayam 2.5km SW 10°50'57.32"N 77° 2'27.69"E
10 N-10 ponnakkani 4.5km NE 10°53'30.36"N 77° 5'49.43"E
Source: On-site monitoring/sampling by Enviro-Tech Services Laboratories in association with GEMS
3.4.2 Method of Monitoring
Digital Sound Level Meter was used for the study. All reading was taken on the ‘A-Weighting’
frequency network, at a height of 1.5 meters from ground level. The sound level meter does not give a steady and
consistent reading and it is quite difficult to assess the actual sound level over the entire monitoring period. To
mitigate this shortcoming, the Continuous Equivalent Sound level, indicated by Leq, is used. Equivalent sound
level, ‘Leq’, can be obtained from variable sound pressure level, ‘L’, over a time period by using following
equation.
Leq = 10 Log L / T∑ (10Ln/10)
Where L = Sound pressure level at function of time dB (A)
T = Time interval of observation
3.4.3 Analysis of Ambient Noise Level in the Study Area
An analysis of the different Leq data obtained during the study period has been made. Variation was
noted during the day-time as well as night-time. The results are presented in below Table 3.6
Day time : 6:00 hours to 22.00 hours.
Night time : 22:00 hours to 6.00 hours
TABLE 3.32 – NOISE MONITORING RESULTS IN CORE AND BUFFER ZONE
S. No Locations Noise level (dB (A) Leq)
Ambient Noise Standards Day Time Night Time
1 Project Area 48.4 37.0 Industrial
Day Time- 75 dB (A)
Night Time- 70 dB (A)
2 Project Area 47.1 40.0
3 Project Area 48.7 37.7
4 Project Area 39.4 35.4
5 Malumichampatty 47.5 35.5
Residential
Day Time– 55 dB (A)
Night Time- 45 dB (A)
6 Othakalmandapam 48.9 36.7
7 Chettipalayam 47.5 38.0
8 Vadasithur 46.7 39.1
9 Arasampalayam 48.1 38.4
10 Ponnakkani 39.7 36.5
Source: On-site monitoring/sampling by Enviro-Tech Services Laboratories in association with GEMS
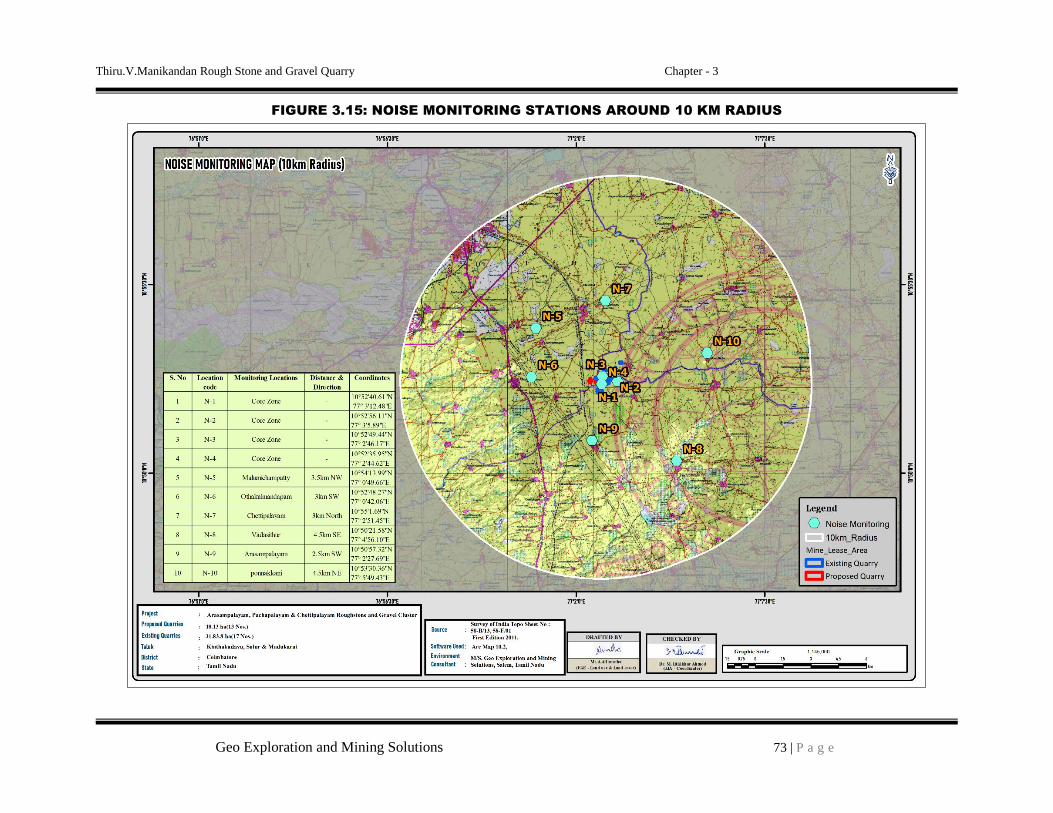
Thiru.V.Manikandan Rough Stone and Gravel Quarry Chapter - 3
Geo Exploration and Mining Solutions 73 | P a g e
FIGURE 3.15: NOISE MONITORING STATIONS AROUND 10 KM RADIUS
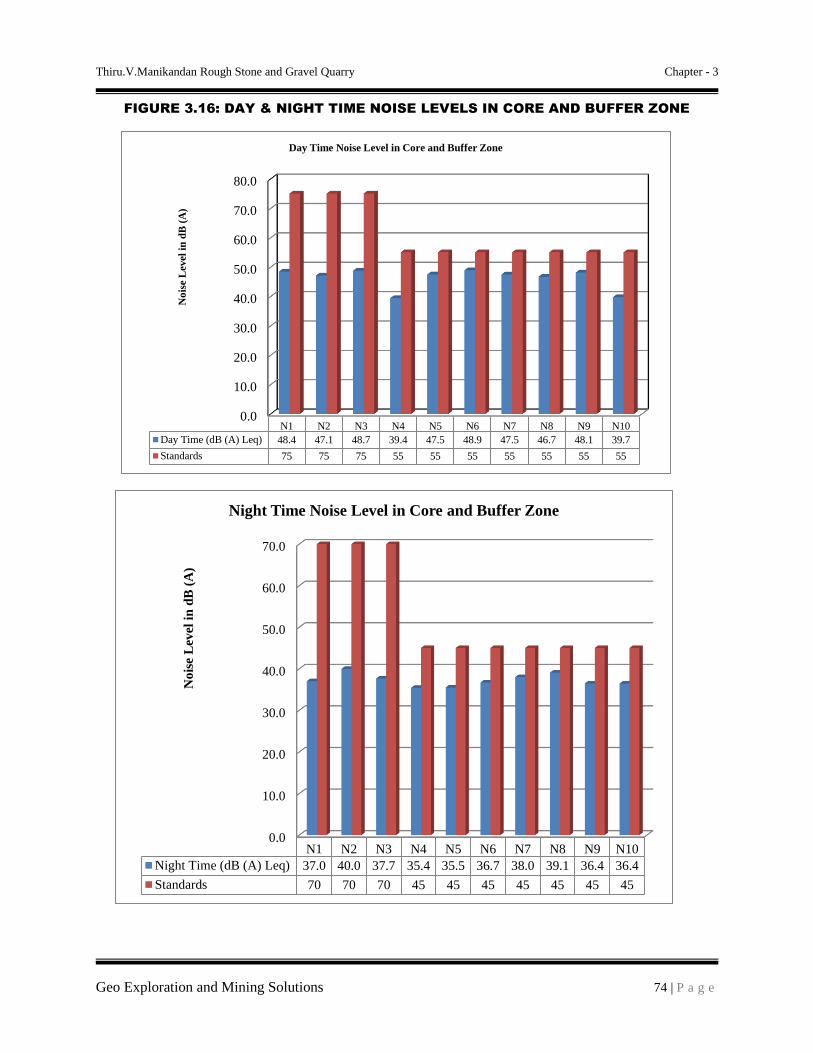
Thiru.V.Manikandan Rough Stone and Gravel Quarry Chapter - 3
Geo Exploration and Mining Solutions 74 | P a g e
FIGURE 3.16: DAY & NIGHT TIME NOISE LEVELS IN CORE AND BUFFER ZONE
0.0
10.0
20.0
30.0
40.0
50.0
60.0
70.0
80.0
N1 N2 N3 N4 N5 N6 N7 N8 N9 N10
Day Time (dB (A) Leq) 48.4 47.1 48.7 39.4 47.5 48.9 47.5 46.7 48.1 39.7
Standards 75 75 75 55 55 55 55 55 55 55
No
ise
Level
in d
B (
A)
Day Time Noise Level in Core and Buffer Zone
0.0
10.0
20.0
30.0
40.0
50.0
60.0
70.0
N1 N2 N3 N4 N5 N6 N7 N8 N9 N10
Night Time (dB (A) Leq) 37.0 40.0 37.7 35.4 35.5 36.7 38.0 39.1 36.4 36.4
Standards 70 70 70 45 45 45 45 45 45 45
No
ise
Lev
el i
n d
B (
A)
Night Time Noise Level in Core and Buffer Zone
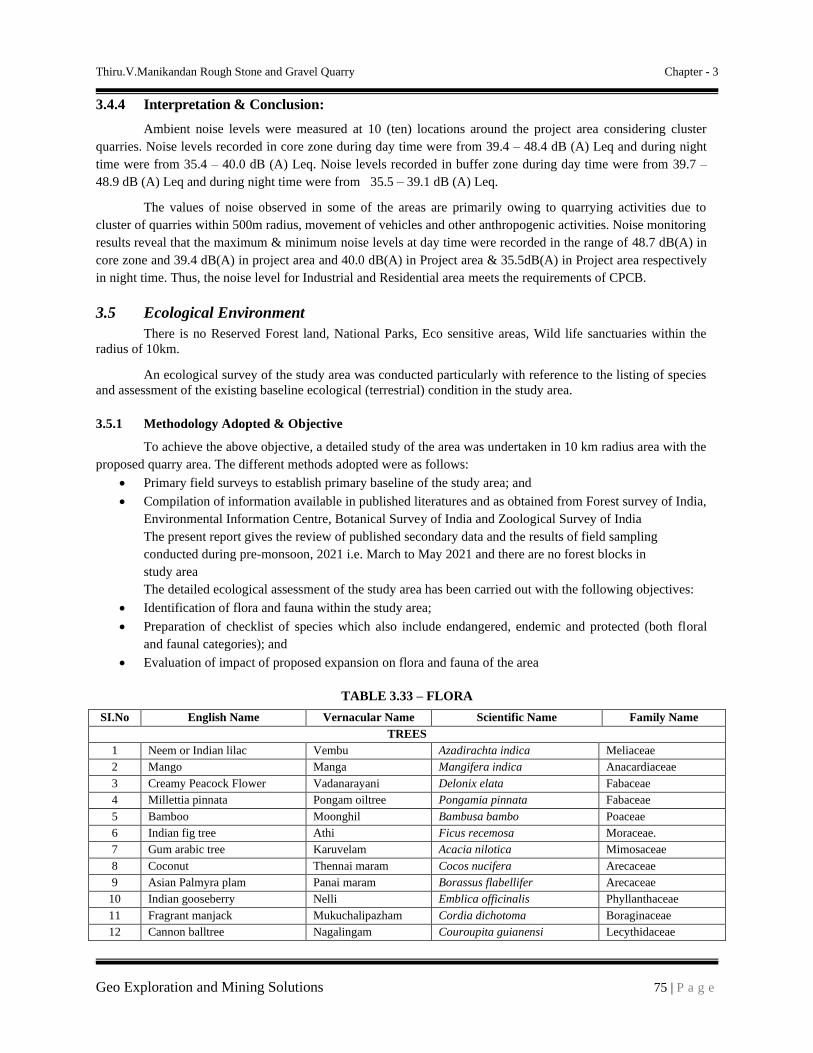
Thiru.V.Manikandan Rough Stone and Gravel Quarry Chapter - 3
Geo Exploration and Mining Solutions 75 | P a g e
3.4.4 Interpretation & Conclusion:
Ambient noise levels were measured at 10 (ten) locations around the project area considering cluster
quarries. Noise levels recorded in core zone during day time were from 39.4 – 48.4 dB (A) Leq and during night
time were from 35.4 – 40.0 dB (A) Leq. Noise levels recorded in buffer zone during day time were from 39.7 –
48.9 dB (A) Leq and during night time were from 35.5 – 39.1 dB (A) Leq.
The values of noise observed in some of the areas are primarily owing to quarrying activities due to
cluster of quarries within 500m radius, movement of vehicles and other anthropogenic activities. Noise monitoring
results reveal that the maximum & minimum noise levels at day time were recorded in the range of 48.7 dB(A) in
core zone and 39.4 dB(A) in project area and 40.0 dB(A) in Project area & 35.5dB(A) in Project area respectively
in night time. Thus, the noise level for Industrial and Residential area meets the requirements of CPCB.
3.5 Ecological Environment
There is no Reserved Forest land, National Parks, Eco sensitive areas, Wild life sanctuaries within the
radius of 10km.
An ecological survey of the study area was conducted particularly with reference to the listing of species
and assessment of the existing baseline ecological (terrestrial) condition in the study area.
3.5.1 Methodology Adopted & Objective
To achieve the above objective, a detailed study of the area was undertaken in 10 km radius area with the
proposed quarry area. The different methods adopted were as follows:
• Primary field surveys to establish primary baseline of the study area; and
• Compilation of information available in published literatures and as obtained from Forest survey of India,
Environmental Information Centre, Botanical Survey of India and Zoological Survey of India
The present report gives the review of published secondary data and the results of field sampling
conducted during pre-monsoon, 2021 i.e. March to May 2021 and there are no forest blocks in
study area
The detailed ecological assessment of the study area has been carried out with the following objectives:
• Identification of flora and fauna within the study area;
• Preparation of checklist of species which also include endangered, endemic and protected (both floral
and faunal categories); and
• Evaluation of impact of proposed expansion on flora and fauna of the area
TABLE 3.33 – FLORA
SI.No English Name Vernacular Name Scientific Name Family Name
TREES
1 Neem or Indian lilac Vembu Azadirachta indica Meliaceae
2 Mango Manga Mangifera indica Anacardiaceae
3 Creamy Peacock Flower Vadanarayani Delonix elata Fabaceae
4 Millettia pinnata Pongam oiltree Pongamia pinnata Fabaceae
5 Bamboo Moonghil Bambusa bambo Poaceae
6 Indian fig tree Athi Ficus recemosa Moraceae.
7 Gum arabic tree Karuvelam Acacia nilotica Mimosaceae
8 Coconut Thennai maram Cocos nucifera Arecaceae
9 Asian Palmyra plam Panai maram Borassus flabellifer Arecaceae
10 Indian gooseberry Nelli Emblica officinalis Phyllanthaceae
11 Fragrant manjack Mukuchalipazham Cordia dichotoma Boraginaceae
12 Cannon balltree Nagalingam Couroupita guianensi Lecythidaceae

Thiru.V.Manikandan Rough Stone and Gravel Quarry Chapter - 3
Geo Exploration and Mining Solutions 76 | P a g e
13 Black plum Navalmaram Sygygium cumini Myrtaceae
14 Beauty leaf Punnai Calophyllu inophyllum Calophyllaceae
15 Tamarind Puliyamaram Tamarindus indica Legumes
16 Banyan tree Alamaram Ficus benghalensis Moraceae
17 Guava Koyya Psidium guajava Myrtaceae
18 Rain tree Mazhaimaram Enterolobium saman Fabaceae
19 Teak Thekku Tectona grandis Verbenaceae
20 Five leaf chastera Nochi Vitex negundo Lamiaceae
21 Eucalyptus Eucalyptus Eucalyptus globules Myrtaceae
22 Jack fruit Palamaram Artocarpus heterophyllus Moraceae
23 Henna Marudaani Lawsonia inermis Lythraceae
24 Lemon Ezhumuchaipalam Citrus lemon Rutaceae
25 Papaya Pappali maram Carica papaya L Caricaceae
26 Indian fir tree Nettilinkam Polylathia longifolia Annonaceae
27 Acacia Nilotica Karuvelam maram Vachellia nilotica Fabaceae
28 Chinese chaste tree Nochi Vitex negundo Verbenaceae
29 Peepal Arasanmaram Ficus religiosa Moraceae
30 Noni Nuna maram Morinda citrifolia Rubiaceae
31 Manilkara zapota Sapota Manilkara zapota Sapotaceae
32 custard apple Seethapazham Annona reticulata Annonaceae
33 Curry tree Velipparuthi Murraya koenigii Asclepiadaceae
34 banana tree Vazhaimaram Musa Musaceae
SHRUBS
35 Avaram Avarai Senna auriculata Fabaceae
36 Flame of the Woods Idlipoo xoracoc cinea Rubiaceae
37 Puriging nut Kattamanakku Jatropha curcas Euphorbiaceae
38 Night shade plan Sundaika Solanum torvum Solanaceae
39 Ceylon Date Palm Icham Phoenix pusilla Arecaceae
40 Indian mallow Thuthi Abutilon indicum Meliaceae
41 Shoe flower. Chemparuthi Hibiscu rosa-sinensis Malvaceae
42 Rosary pea Kundumani Abrus precatorius Fabaceae
43 Milk Weed Erukku Calotropis gigantea Apocynaceae
44 Indian Oleander Arali Nerium indicum Apocynaceae
45 Touch-me-not Thottalchinungi Mimosa pudica Mimosaceae
HERBS
46 Carrot grass Parttiniyam Parthenium hysterophorus Asteraceae
47 Prickly chaff flower Nayuruv Achyranthes aspera Amaranthaceae
48 Carryme seed Kilanell Phyllanthus amarus Phyllanthaceae
49 Nabhali Kuthiraikulambadi Cyanotis cristata Commelinaceae
50 Benghal dayflower Kanamvazha Commelina benghalensis Commelinaceae
51 False daisy Karisilanganni Eclipta prostata Asteraceae
52 Indian pennywort. Vallarai Centella asiatica Apiaceae
53 Common nut sedge Korai Cyperus rotundus Cyperaceae
54 Holy basil Thulasi Ocimum tenuiflorum Lamiaceae
55 Poor land flatsedg Kunnakora Cyperus compressus Cyperaceae
56 Common leucas Thumbai Leucas aspera Lamiaceae
57 Indian Copperleaf Kuppaimeni Acalypha indica Euphorbiaceae
58 Red Hogweed Mukurattai Boerhavia diffusa Nyctaginaceae
59 Tridax daisy Veetukaayapoondu Tridax procumbens Asteraceae
60 Indian doab Arugampul Cynodon dactylon Poaceae
61 European black nightshade Manathakkali Solanumnigrum Solanaceae
62 Ivy gourd Kovai Coccinia grandis Cucurbitaceae
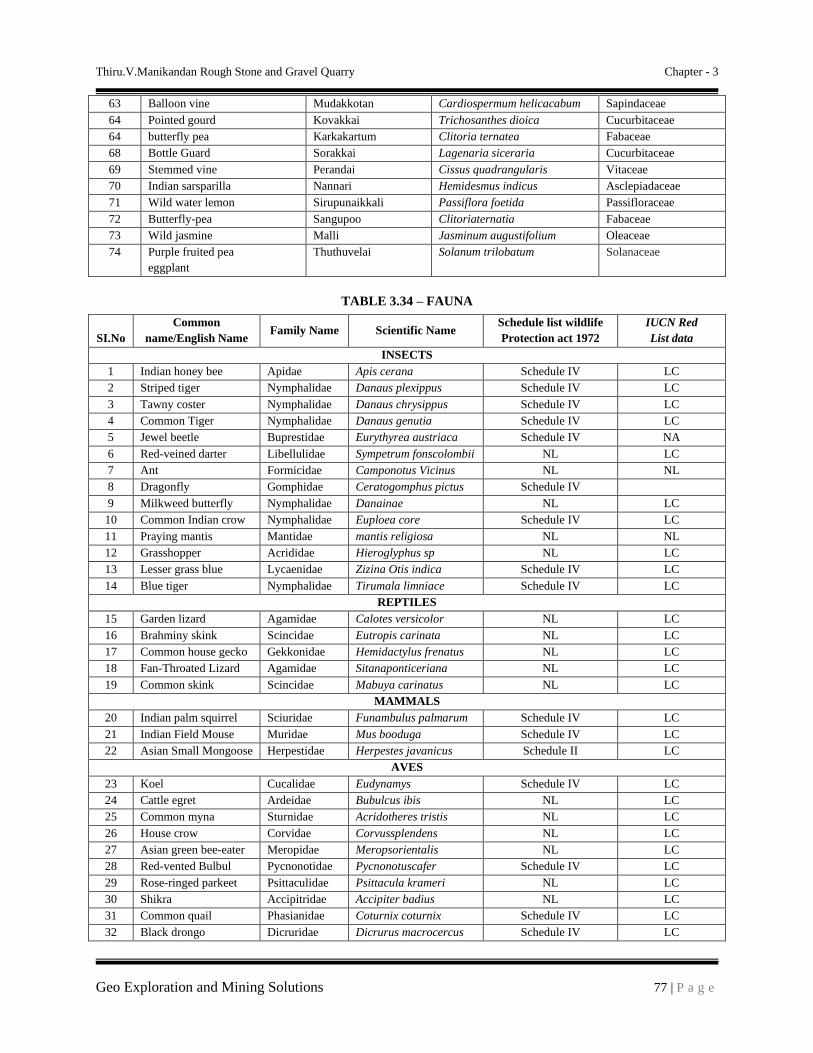
Thiru.V.Manikandan Rough Stone and Gravel Quarry Chapter - 3
Geo Exploration and Mining Solutions 77 | P a g e
63 Balloon vine Mudakkotan Cardiospermum helicacabum Sapindaceae
64 Pointed gourd Kovakkai Trichosanthes dioica Cucurbitaceae
64 butterfly pea Karkakartum Clitoria ternatea Fabaceae
68 Bottle Guard Sorakkai Lagenaria siceraria Cucurbitaceae
69 Stemmed vine Perandai Cissus quadrangularis Vitaceae
70 Indian sarsparilla Nannari Hemidesmus indicus Asclepiadaceae
71 Wild water lemon Sirupunaikkali Passiflora foetida Passifloraceae
72 Butterfly-pea Sangupoo Clitoriaternatia Fabaceae
73 Wild jasmine Malli Jasminum augustifolium Oleaceae
74 Purple fruited pea
eggplant
Thuthuvelai Solanum trilobatum Solanaceae
TABLE 3.34 – FAUNA
SI.No
Common
name/English Name Family Name Scientific Name
Schedule list wildlife
Protection act 1972
IUCN Red
List data
INSECTS
1 Indian honey bee Apidae Apis cerana Schedule IV LC
2 Striped tiger Nymphalidae Danaus plexippus Schedule IV LC
3 Tawny coster Nymphalidae Danaus chrysippus Schedule IV LC
4 Common Tiger Nymphalidae Danaus genutia Schedule IV LC
5 Jewel beetle Buprestidae Eurythyrea austriaca Schedule IV NA
6 Red-veined darter Libellulidae Sympetrum fonscolombii NL LC
7 Ant Formicidae Camponotus Vicinus NL NL
8 Dragonfly Gomphidae Ceratogomphus pictus Schedule IV
9 Milkweed butterfly Nymphalidae Danainae NL LC
10 Common Indian crow Nymphalidae Euploea core Schedule IV LC
11 Praying mantis Mantidae mantis religiosa NL NL
12 Grasshopper Acrididae Hieroglyphus sp NL LC
13 Lesser grass blue Lycaenidae Zizina Otis indica Schedule IV LC
14 Blue tiger Nymphalidae Tirumala limniace Schedule IV LC
REPTILES
15 Garden lizard Agamidae Calotes versicolor NL LC
16 Brahminy skink Scincidae Eutropis carinata NL LC
17 Common house gecko Gekkonidae Hemidactylus frenatus NL LC
18 Fan-Throated Lizard Agamidae Sitanaponticeriana NL LC
19 Common skink Scincidae Mabuya carinatus NL LC
MAMMALS
20 Indian palm squirrel Sciuridae Funambulus palmarum Schedule IV LC
21 Indian Field Mouse Muridae Mus booduga Schedule IV LC
22 Asian Small Mongoose Herpestidae Herpestes javanicus Schedule II LC
AVES
23 Koel Cucalidae Eudynamys Schedule IV LC
24 Cattle egret Ardeidae Bubulcus ibis NL LC
25 Common myna Sturnidae Acridotheres tristis NL LC
26 House crow Corvidae Corvussplendens NL LC
27 Asian green bee-eater Meropidae Meropsorientalis NL LC
28 Red-vented Bulbul Pycnonotidae Pycnonotuscafer Schedule IV LC
29 Rose-ringed parkeet Psittaculidae Psittacula krameri NL LC
30 Shikra Accipitridae Accipiter badius NL LC
31 Common quail Phasianidae Coturnix coturnix Schedule IV LC
32 Black drongo Dicruridae Dicrurus macrocercus Schedule IV LC

Thiru.V.Manikandan Rough Stone and Gravel Quarry Chapter - 3
Geo Exploration and Mining Solutions 78 | P a g e
33 Two-tailed Sparrow Dicruridae Dicrurus macrocercus Schedule IV LC
34 Grey Francolin Phasianidae Francolinus
pondicerianus
Schedule IV LC
35 Common Quail Phasianidae Coturnix coturnix Schedule IV LC
36 White-breasted
waterhen
Rallidae Amaurornis phoenicurus NL LC
37 Common Coot Rallidae Fulica atra Schedule IV LC
AMPHIBIANS
38 Indian Burrowing frog Dicroglossidae Sphaerotheca breviceps Schedule IV LC
39 Green Pond Frog Ranidae Rana hexadactyla Schedule IV LC
40 Tiger Frog Chordata Hoplobatrachus
tigerinus (Rana tigerina)
Schedule IV LC
3.5.2 Interpretation& Conclusion:
The core zone of the area is patta dry – barren land, No forest land is involved in the project area. The
proposed quarry area is covered by thorny bushes and prosopis juliaflora. There is no Wild Life Sanctuary or
National Park within the study area of 10km. There is no schedule I species of animals observed within study area
as per Wildlife Protection Act 1972 as well as no species is in vulnerable, endangered or threatened category as
per IUCN. There is no endangered red list species found in the study area. Hence this small mining operation over
short period of time will not have any significant impact on the surrounding flora and fauna.
3.6 Socio Economic Environment
There is no Approved habitation/ village within the radius of 300m from the project area. Socio-economic
study is an essential part of environmental study. It includes demographic structure of the area, provision of basic
amenities viz., housing, education, health and medical services, occupation, water supply, sanitation,
communication, transportation, prevailing diseases pattern as well as feature like temples, historical monuments
etc., at the baseline level. This will help in visualizing and predicting the possible impact depending upon the nature
and magnitude of the project. It is expected that the Socio Economic Status of the area will substantially improve
because of this proposed project. As the proposed project will provide direct and indirect employment and improve
the infrastructural facilities in that area and, thus, improve their standard of living.
3.6.1 Objectives of the Study
The objectives of the socio-economic study are as follows:
• To study the socio-economic status of the people living in the study area of the proposed mining project
• To assess the impact of the project on Quality of life of the people in the study area
• To recommend Community Development measures needs to be taken up in the study Area.
3.6.2 Scope of Work
• To study the Socio-economic Environment of the area from the secondary sources;
• Data Collection & Analysis
• Prediction of project impact
• Mitigation Measures
3.6.3 Administrative Setup of Coimbatore District
Coimbatore is the third largest city of tamilnadu, Coimbatore is one of the most industrialized cities in
Tamil Nadu, known as the textile capital of South India or the Manchester of the South, the city is situated on the
banks of the river Noyyal, Coimbatore existed even prior to the 2nd or 3rd century AD ruled by Karikalan, the first
of the early Cholas.

Thiru.V.Manikandan Rough Stone and Gravel Quarry Chapter - 3
Geo Exploration and Mining Solutions 79 | P a g e
There are more than 25,000 small, medium, large sale industries and textile mill. Coimbatore is also
famous for the manufacture of motor pump sets and varied engineering goods. The development of Hydro electricity
from the Pykara Falls in the 1930 led to a cotton boom in Coimbatore.
Coimbatore serves as an entry and exit point to neighbouring Kerala and the ever popular hill station of
Udhagamandalam (Ooty). It is the disembarking point for those who want to take the Mountain train that runs from
Mettupalayam, just 35 kms from Coimbatore. There are also regular bus services from Coimbatore to Ooty.
3.6.4 Study area
CHETTIPALAYAM VILLAGE
Chettipalayam is a Town Panchayat city in district of Coimbatore, Tamil Nadu. The Chettipalayam city is
divided into 15 wards for which elections are held every 5 years. The Chettipalayam Town Panchayat has
population of 10,366 of which 5,268 are males while 5,098 are females as per report released by Census India 2011.
• Sex Ratio of Chettipalayam Village -Census 2011
As per the Census Data 2011 the Female Sex Ratio is of 968 against state average of 996. Moreover Child
Sex Ratio in Chettipalayam is around 833 compared to Tamil Nadu state average of 943.
• Literacy of Chettipalayam Village
Literacy rate of Chettipalayam city is 77.00 % lower than state average of 80.09 %. In Chettipalayam, Male
literacy is around 83.35 % while female literacy rate is 70.52 %.
• Workers profile of Chettipalayam Village
In Chettipalayam Town Panchayat out of total population, 4,450 were engaged in work activities. 91.6% of
workers describe their work as Main Work (Employment or Earning more than 6 Months) while 8.4% were
involved in Marginal activity providing livelihood for less than 6 months. Of 4,450 workers engaged in Main Work,
439 were cultivators (owner or co-owner) while 266 were Agricultural labourer.
TABLE 3.35: VILLAGE POPULATION FACTS
Village population Facts Chettipalayam
Number of Households
Population 10,366
Male Population 5,268
Female Population 5,098
Children Population 880
Sex-ratio 968
Literacy 77%
Male Literacy 83.35%
Female Literacy 70.52%
Scheduled Tribes (ST) % 0
Scheduled Caste (SC) % 28.16%
Source:https://etrace.in/census/village/arasampalayam-pollachi-district-coimbatore-tamil-nadu-644475,
https://www.census2011.co.in/data/village/644389-pachapalayam-tamil-nadu.html,
https://www.censusindia.co.in/towns/chettipalayam-population-coimbatore-tamil-nadu-803995
TABLE 3.36: VILLAGE DEMOGRAPHICS POPULATION
Village Total Population Male Population Female Population
Chettipalayam 10366 5268 5098

Thiru.V.Manikandan Rough Stone and Gravel Quarry Chapter - 3
Geo Exploration and Mining Solutions 80 | P a g e
Source:https://etrace.in/census/village/arasampalayam-pollachi-district-coimbatore-tamil-nadu-644475,
https://www.census2011.co.in/data/village/644389-pachapalayam-tamil-nadu.html,
https://www.censusindia.co.in/towns/chettipalayam-population-coimbatore-tamil-nadu-803995
TABLE 3.37: VILLAGE 2011 CENSUS DATA
Description CENSUS 2011 DATA
Village Name Chettipalayam
Teshil Name Madukkarai
District Name Coimbatore
State Name Tamil Nadu
Total Population 10366
Total Area 31.86km2
Total No of House Holds 2841
Total Male Population 5268
Total Female Population 5098
0-6 Age group Total Population 880
0-6 Age group Male Population 480
0-6 Age group Female Population 400
Source:https://etrace.in/census/village/arasampalayam-pollachi-district-coimbatore-tamil-nadu-644475,
https://www.census2011.co.in/data/village/644389-pachapalayam-tamil-nadu.html,
https://www.censusindia.co.in/towns/chettipalayam-population-coimbatore-tamil-nadu-803995
TABLE 3.38 – POPULATION CHARACTERISTICS AROUND 10KM RADIUS
Total No of
Villages
No. of
Households
Total
Populatio
n
Populati
on Male
Populatio
n female
SC
Populat
ion
Male
SC
Popula
tion
female
Total
Literate
s Male
Total
Literates
Female
Total
Illiterate
s Male
Total
Illiterates
Female
23 19487 67456 33820 33636 7220 7380 25077 20247 8743 13389
Total
Worker
Population
Male
Total
Worker
Population
Female
Main
Working
Populatio
n Male
Main
Workin
g
Populat
ion
Female
Main
Cultivato
r
Populatio
n Male
Main
Cultiva
tor
Populat
ion
Female
Main
Agricultural
Labourers
Population
Male
Main
Agricultur
al
Labourers
Population
Female
Non
Working
Populati
on Male
Non
Working
Populatio
n Female
22409 13146 20663 10785 4239 2456 4427 4411 11411 20490
3.6.5 Basic Amenities
A better network of physical infrastructure facilities (well-built roads, rail links, irrigation, power and
telecommunication, information technology, market-network and social infrastructure support, viz., health and
education, water and sanitation, veterinary services and co-operative) is essential for development of the rural
economy.
A review of infrastructure facilities available in the area has been given on the basis of field survey. In
this study the villages which fall within 10 km radius around the site has been covered. Infrastructure facilities
available in the area are presented below. All basic amenities Education (higher education, colleges, universities,
Medical college, Transport facilities, Railway station, Bus station area available in the district headquarters.
Coimbatore at a distance of 16km – Northwest).
Thiru.V.Manikandan Rough Stone and Gravel Quarry Chapter - 3
Geo Exploration and Mining Solutions 81 | P a g e
3.6.6 Recommendation and Suggestion
• Awareness program should be conducted to make the population aware to get education and a better
livelihood
• Health care centre and ambulance facility can be provided to the population to get easy and accessible
medical facilities
• Vocational training programme can be organized to make the people self - employed, particularly for women
and unemployed youth
• On the basis of qualification and skills local youths may be employed.
• Long term and short term employments can be generated
• Maternity facility should be made available at the place to avoid going too far off places for treatment which
involves risks. Apart from that as these areas are prone to various diseases a hospital with modern facilities
should be opened on a priority basis in a central place to provide better health facilities to the villagers around
the project
• While developing an Action Plan, it is very important to identify the population who falls under the
marginalized and vulnerable groups. So that special attention can be given to these groups with special
provisions while making action plans.
3.6.7 Conclusion
The socio economic study of surveyed villages gives a clear picture of its population, average household
size, literacy rate and sex ratio etc. It is also found that a part of population is suffering from lack of permanent job
to run their day to day life. Their expectation is to earn some income for their sustainability on a long-term basis.
The proposed project will aim to provide preferential employment to the local people there by improving the
employment opportunity in the area and in turn the social standards will improve.
The nearby villages within 5kms radius have PHC, Anganwadi school, Post office, Telegram, Government
and Private school, bus connectivity besides.

Thiru.V.Manikandan Rough Stone and Gravel Quarry Chapter - 4
Geo Exploration and Mining Solutions 82 | P a g e
CHAPTER – 4: ANTICIPATED ENVIRONMENTAL IMPACTS AND
MITIGATION MEASURES
4.0 General
The environmental impact can be categorized as either primary or secondary, primary impacts which are
attributed directly by the project; secondary impacts are those which are indirectly induced. The open cast mining
operations involve development of benches, Approach road, Haul road, Excavation and handling of material. If adequate
control measures are not taken to prevent/mitigate the adverse environmental impacts/lead to damage of the eco-system.
In order to maintain the environmental commensuration with the mining operation, it is essential to undertake
studies on the existing environmental scenario and assess the impact on different environmental components. This would
help in formulating suitable management plans for sustainable resource extraction. Based on the baseline environmental
status at the existing mine site, the environmental factors that are likely to be affected (Impacts) are identified, quantified
and assessed. The various anticipated impacts will be on
- Land environment
- Water Environment
- Air Environment
- Noise Environment
- Socio economic environment
- Solid waste
- Soil environment
4.1 Land Environment 4.1.2 Anticipated Impact from Proposed Project
• Permanent or temporary change on land use and land cover.
• Change in Topography: Topography of the ML area will change at the end of the life of the mine.
• Movement of heavy vehicles sometimes cause problems to agricultural land, human habitations due to dust,
noise and it also causes traffic hazards.
• Due to degradation of land by pitting the aesthetic environment of the core zone may be affected.
• Earthworks during the rainy season increase the potential for soil erosion and sediment laden water entering the
water ways.
• If no due care is taken wash off from the exposed working area may choke the water course & can also causes
the siltation of water course
4.1.2.1 Common Mitigation Measures for Proposed Project
• The mining activity will be gradual confined in blocks and excavation will be undertaken progressively along
with other mitigative measures like phase wise development of greenbelt etc.,
• Construction of garland drains all around the quarry pits and construction of check dam at strategic location in
lower elevations to prevent erosion due to surface runoff during rainfall and also to collect the storm water for
various uses within the proposed area
• Green belt development along the boundary within safety zone. The small quantity of water stored in the
mined-out pit will be used for greenbelt
• Thick plantation will be carried out on unutilized area, top benches of mined out pits, on safety barrier, etc.,
• At conceptual stage, the land use pattern of the quarry will be changed into Greenbelt area and temporary
reservoir
• In terms of aesthetics, natural vegetation surrounding the quarry will be retained (such as in a buffer area i.e.,
7.5 m safety barrier and other safety provided) so as to help minimise dust emissions.
• Proper fencing will be carried out at the conceptual stage, Security will be posted round the clock, to prevent
inherent entry of the public and cattle

Thiru.V.Manikandan Rough Stone and Gravel Quarry Chapter - 4
Geo Exploration and Mining Solutions 83 | P a g e
4.1.3 Soil Environment
4.1.4 Impact on Soil Environment
The top layer of the project site in the form of Gravel formation, the Gravel will be directly loaded into
tippers for the filling and levelling of low lying areas. There is no disposal of Gravel. The excavated rough stone
will be directly loaded into dumpers to the needy customers.
There will be no disposal of waste water from the quarry operation, No discharge of toxic effluent from the
proposed projects. The dust emission at working face and haul roads will be controlled by water sprinkling and
plantation.
Erosion and Sedimentation (Removal of protective vegetation cover; Exposure of underlying soil horizons that
may be less pervious, or more erodible than the surface layers; Reduced capacity of soils to absorb rainfall;
Increased energy in storm-water runoff due to concentration and velocity; and Exposure of subsurface materials
which are unsuitable for vegetation establishment).
4.1.5 Common Mitigation Measures for Proposed Project
▪ Run-off diversion – Garland drains will be constructed all around the project boundary to prevent surface
flows from entering the quarry works areas. And will be discharged into vegetated natural drainage lines, or
as distributed flow across an area stabilised against erosion.
▪ Sedimentation ponds - Run-off from working areas will be routed towards sedimentation ponds. These trap
sediment and reduce suspended sediment loads before runoff is discharged from the quarry site.
Sedimentation ponds should be designed based on runoff, retention times, and soil characteristics. There
may be a need to provide a series of sedimentation ponds to achieve the desired outcome.
▪ Retain vegetation – Retain existing or re-plant the vegetation at the site wherever possible.
▪ Monitoring and maintenance – Weekly monitoring and daily maintenance of erosion control systems so
that they perform as specified specially during rainy season
4.1.6 Waste Dump Management
There are no wastages anticipated in this Rough stone and Gravel quarrying operation. The entire quarried out
materials will be utilized (100%).
The overburden in the form of Gravel formation the gravel will be also sold to needy customers for the filling
and levelling of low lying areas.
4.2 Water Environment
4.2.1 Anticipated Impact on Surface and ground water
The impact due to quarrying on the water quality is expected to be insignificant because of no use of
chemicals or hazardous substances during quarrying process. The quarrying activity will not intersect ground water
table as the maximum depth of the quarry in the is 37m and water table is found at a depth of 65m BGL.
The quarrying operation will be carried out well above the water table. There is no intersection of surface
water bodies (Streams, Canal, Odai etc.,) in the project area. During rainy season rain water will be collected in the
quarry pit and later used for greenbelt development and for the water sprinkling in the haul roads. There is no
proposal for discharging of quarry pit water outside the project area.

Thiru.V.Manikandan Rough Stone and Gravel Quarry Chapter - 4
Geo Exploration and Mining Solutions 84 | P a g e
TABLE 4.1: WATER REQUIREMENTS
*Purpose Quantity Source
Dust Suppression 1.0 KLD Rainwater accumulated in Mine Pit/ Water Tanker
Green Belt development 1.5 KLD Rainwater accumulated in Mine Pit/ Water Tanker
Domestic purpose 1.0 KLD Water Tankers
Total 3.5 KLD
* Water for drinking purpose will be brought from approved water vendors
Source: Approved Mining Plan Pre-Feasibility Report
4.2.2 Common Mitigation measures:
▪ Garland drain, settling tank will be constructed along the proposed mining lease area. The Garland drain
will be connected to settling tank and sediments will be trapped in the settling traps and only clear water
will be discharged out to the natural drainage
• Rainwater will be collected in sump in the mining pits and will be allowed to store and pumped out to
surface setting tank of 15 m x 10m x 3m to remove suspended solids if any. This collected water will be
judiciously used for dust suppression and such sites where dust likely to be generated and for developing
green belt. The proponent will collect and judicially utilize the rainwater as part of rainwater harvesting
system.
▪ Providing benches with inner slopes and through a system of drains and channels, allowing rain water to
descent into surrounding drains, so as to minimize the effects of erosion & water logging arising out of
uncontrolled descent of water.
▪ Reuse the water collected during storm for dust suppression and greenbelt development within the mines
▪ Installing interceptor traps/oil separators to remove oils and greases. Water from the tipper wash-down
facility and machinery maintenance yard will pass through interceptor traps/oil separators prior to its reuse;
▪ Using flocculating or coagulating agents to assist in the settling of suspended solids during monsoon
seasons;
▪ Periodic (every 6 month once) analysis of quarry pit water and ground water quality in nearby villages.
▪ Domestic sewage from site office & urinals/latrines provided in ML is discharged in septic tank followed
by soak pits.
▪ Waste water discharge from mine will be treated in settling tanks before using for dust suppression and tree
plantation purposes.
▪ De-silting will be carried out before and immediately after the monsoon season.
▪ Regular monitoring (every 6 month once) and analysing the quality of water in open well, bore wells and
surface water
4.3 Air Environment
The air borne particulate matter is the main air pollutant in this opencast mining. The mining operation will
be carried out by jackhammer drilling (35mm dia) and Hydraulic Excavators will be utilized for excavation of
Rough Stone waste.
4.3.1. Anticipated
Impact ▪ During mining, at various stages activities such as excavation, drilling, blasting, and transportation of
materials, particular matter (PM), gases such as Sulphur dioxide, oxides of Nitrogen from vehicular exhaust
are the main air pollutants.
▪ Emissions of noxious gases due to incomplete detonation of explosive may sometimes pollute the air.
▪ The fugitive dust released from the mining operations may cause effect on the mine workers who are
directly exposed to the fugitive dust.
▪ Simultaneously, the air-borne dust may travel to longer distances and settle in the villages located near the
mine lease area.

Thiru.V.Manikandan Rough Stone and Gravel Quarry Chapter - 4
Geo Exploration and Mining Solutions 85 | P a g e
4.3.1.1. Modelling of Incremental Concentration from Proposed Project
Wind erosion of the exposed areas and the air borne particulate matter generated by quarrying operation,
and transportation are mainly PM10 & PM2.5 and emissions of Sulphur dioxide (SO2) & Oxides of Nitrogen (NOx)
due to excavation/loading equipment and vehicles plying on haul roads are the cause of air pollution in the project
area.
Similarly, loading - unloading and transportation of Rough Stone, wind erosion of the exposed area and
movement of light vehicles causes of pollution. This leads to an impact on the ambient air environment around the
project area.
Anticipated incremental concentration due to this quarrying activity and net increase in emissions due to
quarrying activities within 500 meters around the project area is predicted by Open Pit Source modelling using
AERMOD Software.
The impact on Air Environment is due to the mining and allied activities during Land Development phase,
Mining process and Transportation. The emissions of Sulphur dioxide (SO2), Oxides of Nitrogen (NOx) due to
excavation/loading equipment and vehicles plying on haul roads are marginal. Loading - unloading and
transportation of Rough Stone, wind erosion of the exposed area and movement of light vehicles will be the main
polluting source in the mining activities releasing Particulate Matter (PM10) affecting Ambient Air of the area.
Prediction of impacts on air environment has been carried out taking into consideration cumulative production three
proposed quarries. Air environment and net increase in emissions by Open pit source modelling in AERMOD
Software.
4.3.1.2 Emission Estimation
An emissions factor is a representative value that attempts to relate the quantity of a pollutant released to
the atmosphere with an activity associated with the release of that pollutant.
The general equation for emissions estimation is:
E = A x EF x (1-ER/100) Where:
E = emissions;
A = activity rate;
EF = emission factor, and
ER =overall emission reduction efficiency, %
The proposed mining activity includes various activities like ground preparation, excavation, handling and
transport of ore. These activities have been analysed systematically basing on USEPA-Emission Estimation
Technique Manual, for Mining AP-42, to arrive at possible emissions to the atmosphere and estimated emissions are
given in Table 4-2.
TABLE 4.2: ESTIMATED EMISSION RATE
Estimated Emission Rate for PM10
Activity Source type Value Unit
Drilling Point Source 0.092710688 g/s
Blasting Point Source 0.001656775 g/s
Mineral Loading Point Source 0.043473072 g/s
Haul Road Line Source 0.002494769 g/s/m
Overall Mine Area Source 0.058268850 g/s
Estimated Emission Rate for SO2 Overall Mine Area Source 0.000869972 g/s
Estimated Emission Rate for NOx Overall Mine Area Source 0.000050035 g/s
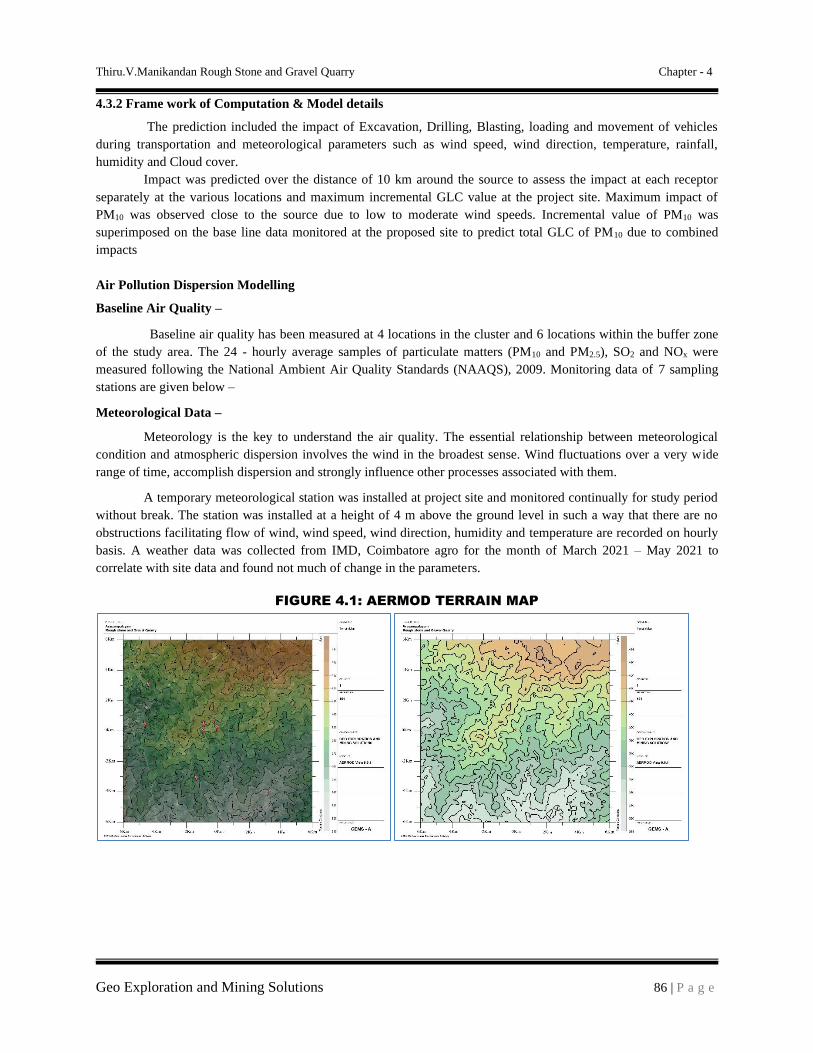
Thiru.V.Manikandan Rough Stone and Gravel Quarry Chapter - 4
Geo Exploration and Mining Solutions 86 | P a g e
4.3.2 Frame work of Computation & Model details
The prediction included the impact of Excavation, Drilling, Blasting, loading and movement of vehicles
during transportation and meteorological parameters such as wind speed, wind direction, temperature, rainfall,
humidity and Cloud cover.
Impact was predicted over the distance of 10 km around the source to assess the impact at each receptor
separately at the various locations and maximum incremental GLC value at the project site. Maximum impact of
PM10 was observed close to the source due to low to moderate wind speeds. Incremental value of PM10 was
superimposed on the base line data monitored at the proposed site to predict total GLC of PM10 due to combined
impacts
Air Pollution Dispersion Modelling
Baseline Air Quality –
Baseline air quality has been measured at 4 locations in the cluster and 6 locations within the buffer zone
of the study area. The 24 - hourly average samples of particulate matters (PM10 and PM2.5), SO2 and NOx were
measured following the National Ambient Air Quality Standards (NAAQS), 2009. Monitoring data of 7 sampling
stations are given below –
Meteorological Data –
Meteorology is the key to understand the air quality. The essential relationship between meteorological
condition and atmospheric dispersion involves the wind in the broadest sense. Wind fluctuations over a very wide
range of time, accomplish dispersion and strongly influence other processes associated with them.
A temporary meteorological station was installed at project site and monitored continually for study period
without break. The station was installed at a height of 4 m above the ground level in such a way that there are no
obstructions facilitating flow of wind, wind speed, wind direction, humidity and temperature are recorded on hourly
basis. A weather data was collected from IMD, Coimbatore agro for the month of March 2021 – May 2021 to
correlate with site data and found not much of change in the parameters.
FIGURE 4.1: AERMOD TERRAIN MAP

Thiru.V.Manikandan Rough Stone and Gravel Quarry Chapter - 4
Geo Exploration and Mining Solutions 87 | P a g e
FIGURE 4.2: PREDICTED INCREMENTAL CONCENTRATION OF PM10
FIGURE 4.3: PREDICTED INCREMENTAL CONCENTRATION OF SO2
FIGURE 4.4: PREDICTED INCREMENTAL CONCENTRATION OF NOX

Thiru.V.Manikandan Rough Stone and Gravel Quarry Chapter - 4
Geo Exploration and Mining Solutions 88 | P a g e
FIGURE 4.5: PREDICTED INCREMENTAL CONCENTRATION OF FUGITIVE DUST
4.3.2.1 Model Results
The post project Resultant Concentrations of PM10, PM2.5, SO2& NOX (GLC) is given in Table below:
TABLE 4.3: INCREMENTAL & RESULTANT GLC OF PM10
Station
Code Location
X Coordinate
(m)
Y Coordinate
(m)
Average
Baseline
PM10 (μg/m3)
Incremental
value of PM10 due
to mining (μg/m3)
Total
PM10 (μg/m3)
(5+6)
AAQ1 10°52'42.59"N 77° 3'11.73"E -64 57 43.5 19.96 63.46
AAQ2 10°52'55.94"N 77° 3'5.43"E -259 471 42.4 19.42 61.82
AAQ3 10°52'49.17"N 77° 2'45.99"E -853 257 45.1 19.16 64.26
AAQ4 10°52'35.64"N 77° 2'44.49"E -897 -162 42.3 19.76 62.06
AAQ5 10°54'14.41"N 77° 0'49.53"E -4407 2895 43.3 14.98 58.25
AAQ6 10°52'47.91"N 77° 0'41.58"E -4652 224 42.7 6.87 49.57
AAQ7 10°55'1.47"N 77° 2'51.18"E -695 4340 42.7 11.15 49.57
AAQ8 10°50'21.48"N 77° 4'56.52"E 3135 -4308 43.2 0 43.2
AAQ9 10°50'54.42"N 77° 2'29.15"E -1365 -3288 42.3 2.11 44.41
AAQ10 10°53'30.52"N 77° 5'49.82"E 4765 1537 43.1 0 43.1
TABLE 4.4: INCREMENTAL & RESULTANT GLC OF PM2.5
Station
Code Location
X
Coordinate
(m)
Y
Coordinate
(m)
Average
Baseline
PM2.5 (μg/m3)
Incremental
value of PM2.5 due
to mining (μg/m3)
Total
PM2.5 (μg/m3)
(5+6)
AAQ1 10°52'42.59"N 77° 3'11.73"E -64 57 23.3 11.92 35.22
AAQ2 10°52'55.94"N 77° 3'5.43"E -259 471 21.7 11.53 33.23
AAQ3 10°52'49.17"N 77° 2'45.99"E -853 257 25.3 11.19 36.49
AAQ4 10°52'35.64"N 77° 2'44.49"E -897 -162 22.6 11.71 34.31
AAQ5 10°54'14.41"N 77° 0'49.53"E -4407 2895 24.2 10.24 34.44
AAQ6 10°52'47.91"N 77° 0'41.58"E -4652 224 23.5 6.31 29.81
AAQ7 10°55'1.47"N 77° 2'51.18"E -695 4340 23.1 8.13 31.23
AAQ8 10°50'21.48"N 77° 4'56.52"E 3135 -4308 20.9 0 20.9
AAQ9 10°50'54.42"N 77° 2'29.15"E -1365 -3288 22.5 4.01 26.51
AAQ10 10°53'30.52"N 77° 5'49.82"E 4765 1537 22.4 1.65 24.05

Thiru.V.Manikandan Rough Stone and Gravel Quarry Chapter - 4
Geo Exploration and Mining Solutions 89 | P a g e
TABLE 4.5: INCREMENTAL & RESULTANT GLC OF SO2
Station
Code Location
X
Coordinate
(m)
Y
Coordinate
(m)
Average
Baseline
So2 (μg/m3)
Incremental
value of So2 due
to mining (μg/m3)
Total
So2 (μg/m3)
(5+6)
AAQ1 10°52'42.59"N 77° 3'11.73"E -64 57 9.6 3.69 13.29
AAQ2 10°52'55.94"N 77° 3'5.43"E -259 471 8.7 3.63 12.33
AAQ3 10°52'49.17"N 77° 2'45.99"E -853 257 7.6 3.60 11.2
AAQ4 10°52'35.64"N 77° 2'44.49"E -897 -162 7.2 3.67 10.87
AAQ5 10°54'14.41"N 77° 0'49.53"E -4407 2895 6.7 2.52 9.22
AAQ6 10°52'47.91"N 77° 0'41.58"E -4652 224 7.1 0 7.1
AAQ7 10°55'1.47"N 77° 2'51.18"E -695 4340 5.9 0.95 6.85
AAQ8 10°50'21.48"N 77° 4'56.52"E 3135 -4308 6.6 0 6.6
AAQ9 10°50'54.42"N 77° 2'29.15"E -1365 -3288 7.2 0 7.2
AAQ10 10°53'30.52"N 77° 5'49.82"E 4765 1537 5.5 0 5.5
TABLE 4.6: INCREMENTAL & RESULTANT GLC OF NOX
Station
Code Location
X
Coordinate
(m)
Y
Coordinate
(m)
Average
Baseline
Nox (μg/m3)
Incremental
value of Nox due to
mining (μg/m3)
Total
Nox (μg/m3)
(5+6)
AAQ1 10°52'42.59"N 77° 3'11.73"E -64 57 25.0 13.87 38.87
AAQ2 10°52'55.94"N 77° 3'5.43"E -259 471 22.4 11.98 34.38
AAQ3 10°52'49.17"N 77° 2'45.99"E -853 257 26.0 9.79 35.79
AAQ4 10°52'35.64"N 77° 2'44.49"E -897 -162 23.0 13.20 36.2
AAQ5 10°54'14.41"N 77° 0'49.53"E -4407 2895 23.6 2.58 26.18
AAQ6 10°52'47.91"N 77° 0'41.58"E -4652 224 22.4 0 22.4
AAQ7 10°55'1.47"N 77° 2'51.18"E -695 4340 22.6 0 22.6
AAQ8 10°50'21.48"N 77° 4'56.52"E 3135 -4308 23.0 0 23.0
AAQ9 10°50'54.42"N 77° 2'29.15"E -1365 -3288 24.2 0 24.2
AAQ10 10°53'30.52"N 77° 5'49.82"E 4765 1537 20.3 0 20.3
TABLE 4.7: INCREMENTAL & RESULTANT GLC OF FUGITIVE DUST
Station
Code Location
X Coordinate
(m)
Y
Coordinate
(m)
Average
Baseline
Fugitive
(μg/m3)
Incremental
value of
Fugitive due
to mining (μg/m3)
Total
Fugitive
(μg/m3) (5+6)
AAQ1 10°52'42.59"N 77° 3'11.73"E -64 57 63.6 36.25 99.85
AAQ2 10°52'55.94"N 77° 3'5.43"E -259 471 63.0 15.33 78.33
AAQ3 10°52'49.17"N 77° 2'45.99"E -853 257 64.3 10.07 74.37
AAQ4 10°52'35.64"N 77° 2'44.49"E -897 -162 62.8 24.18 86.98
AAQ5 10°54'14.41"N 77° 0'49.53"E -4407 2895 63.8 0 63.8
AAQ6 10°52'47.91"N 77° 0'41.58"E -4652 224 62.9 0 62.9
AAQ7 10°55'1.47"N 77° 2'51.18"E -695 4340 62.8 0 62.8
AAQ8 10°50'21.48"N 77° 4'56.52"E 3135 -4308 61.3 0 61.3
AAQ9 10°50'54.42"N 77° 2'29.15"E -1365 -3288 62.7 0 62.7
AAQ10 10°53'30.52"N 77° 5'49.82"E 4765 1537 57.0 0 57.0
From the resultant of cumulative concentration i.e., Background + Incremental Concentration of pollutant in all the
receptor locations without effective mitigation measures are still within the prescribed NAAQ limits of 100, 80 & 80 µg/m3 for
PM10, SO2 & NOX respectively. By adopting suitable mitigation measures, the pollutant levels in the atmosphere can be further
being controlled.

Thiru.V.Manikandan Rough Stone and Gravel Quarry Chapter - 4
Geo Exploration and Mining Solutions 90 | P a g e
4.3.4. Common Mitigation Measures for \Proposed Project
Drilling – To control dust at source, wet drilling will be practiced. Where there is a scarcity of water,
suitably designed dust extractor will be provided for dry drilling along with dust hood at the mouth of the drill-hole
collar.
Advantages of Wet Drilling: -
• In this system dust gets suppressed close to its formation. Dust suppression become very effective and the
work environment will be improved from the point of occupational comfort and health.
• Due to dust free atmosphere, the life of engine, compressor etc., will be increased.
• The life of drill bit will be increased.
• The rate of penetration of drill will be increased.
• Due to the dust free atmosphere visibility will be improved resulting in safer working conditions.
Blasting –
• Establish time of blasting to suit the local conditions and water sprinkling on blasting face
• Avoid blasting i.e., when temperature inversion is likely to occur and strong wind blows towards residential
areas
• Controlled blasting includes Adoption of suitable explosive charge and short delay detonators, adequate
stemming of holes at collar zone and restricting blasting to a particular time of the day i.e. at the time lunch
hours, controlled charge per hole as well as charge per round of hole
• Before loading of material water will be sprayed on blasted material
• Dust mask will be provided to the workers and their use will be strictly monitored
Haul Road & Transportation –
• Water will be sprinkled on haul roads twice a day to avoid dust generation during transportation
• Transportation of material will be carried out during day time and material will be covered with taurpaulin
• The speed of tippers plying on the haul road will be limited below 20 km/hr to avoid generation of dust.
• Water sprinkling on haul roads & loading points will be carried out twice a day
• Main source of gaseous pollution will be from vehicle used for transportation of mineral; therefore, weekly
maintenance of machines improves combustion process & makes reduction in the pollution.
• The un-metalled haul roads will be compacted weekly before being put into use.
• Over loading of tippers will be avoided to prevent spillage.
• It will be ensured that all transportation vehicles carry a valid PUC certificate
• Grading of haul roads and service roads to clear accumulation of loose materials
Green Belt –
• Planting of trees all along main mine haul roads and regular grading of haul roads will be practiced to
prevent the generation of dust due to movement of dumpers/trucks
• Green belt of adequate width will be developed around the project areas
Occupational Health –
• Dust mask will be provided to the workers and their use will be strictly monitored
• Annual medical checkups, trainings and campaigns will be arranged to ensure awareness about importance
of wearing dust masks among all mine workers & tipper drivers
• Ambient Air Quality Monitoring will be conducted six months once to assess effectiveness of mitigation
measures proposed

Thiru.V.Manikandan Rough Stone and Gravel Quarry Chapter - 4
Geo Exploration and Mining Solutions 91 | P a g e
4.4 Noise Environment (Impact & Mitigation Measures)
Noise pollution is mainly due to operation like drilling & blasting and plying of trucks & HEMM. These
activities will not cause any problem to the inhabitants of this area because there is no human settlement in close
proximity to the project area. Noise modelling has been carried out considering blasting and compressor operation
(drilling) and transportation activities.
Predictions have been carried out to compute the noise level at various distances around the working pit
due to these major noise-generating sources. Noise modelling has been carried out to assess the impact on
surrounding ambient noise levels. Basic phenomenon of the model is the geometric attenuation of sound. Noise at a
point generates spherical waves, which are propagated outwards from the source through the air at a speed of 1,100
ft/sec, with the first wave making an ever-increasing sphere with time. As the wave spreads the intensity of noise
diminishes as the fixed amount of energy is spread over an increasing surface area of the sphere. The assumption of
the model is based on point source relationship i.e., for every doubling of the distance the noise levels are decreased
by 6 dB (A).
For hemispherical sound wave propagation through homogeneous loss free medium, one can estimate noise
levels at various locations at different sources using model based on first principle.
Lp2 = Lp1 - 20 log (r2/r1) - Ae1, 2
Where:
Lp1& Lp2 are sound levels at points located at distances r1& r2 from the source.
Ae1, 2 is the excess attenuation due to environmental conditions. Combined effect of all sources can be determined at
various locations by logarithmic addition.
Lptotal = 10 log {10(Lp1/10) + 10(Lp2/10) + 10(Lp3/10) +……}
4.4.1 Anticipated Impact Attenuation due to Green Belt has been taken to be 4.9 dB (A). The inputs required for the model are:
• Source data
• Receptor data
• Attenuation factor
Source data has been computed taking into account of all the machinery and activities used in the mining process.
Same has been listed in Table 4-8.
TABLE 4.8: ACTIVITY AND NOISE LEVEL PRODUCED BY MACHINERY
Sl.No. Machinery / Activity Impact on Environment? Noise Produced in dB(A) at 50 ft from source*
1 Blasting Yes 94
2 Jack Hammer Yes 88
3 Compressor No 81
4 Excavator No 85
5 Tipper No 84
Total Noise Produced 95.8
*50 feet from source = 15.24 meters
Source: U.S. Department of Transportation (Federal Highway Administration) – Construction Noise Handbook
The total noise to be produced by mining activity is calculated to be 95.8 dB (A). Generally most mining
operations produce noise between 100-109 dB (A). We have considered equipment and operation noise levels (max)
to be approx. 109 dB (A) for nose prediction modelling.
TABLE 4.9: PREDICTED NOISE INCREMENTAL VALUES
Location ID N1 N2 N3 N4 N5 N6 N7 N8 N9 N10
Maximum Monitored Value (Day) dB(A) 55.3 54.5 55.3 46.5 51.8 57.6 54.7 53.5 57.1 45.9
Incremental Value dB(A) 42.8 46.7 48.7 41.0 44.5 44.5 46.1 42.4 45.0 46.5
Total Predicted Noise level dB(A) 53.7 53.4 53.9 47.6 52.5 53.2 52.5 53.8 52.9 49.2
NAAQ Standards Industrial Day Time- 75 dB (A) Night Time- 70 dB (A)
Residential Day Time– 55 dB (A) Night Time- 45 dB (A)

Thiru.V.Manikandan Rough Stone and Gravel Quarry Chapter - 4
Geo Exploration and Mining Solutions 92 | P a g e
4.4.2 Common Mitigation Measures for Proposed Project The following noise mitigation measures are proposed for control of Noise.
▪ Time intervals for each quarry during blasting.
• Use of personal protective devices i.e., earmuffs and earplugs by workers, who are working in high noise
generating areas.
• Limiting time exposure of workers to excessive noise.
• Proper and regular maintenance of vehicles, machinery and other equipment’s.
• The noise generated by the machinery will be reduced by proper lubrication of the machinery and other
equipment’s.
• Speed of trucks entering or leaving the quarry will be limited to moderate speed to prevent undue noise
from empty vehicles...
• Noise levels will be controlled by using optimum explosive charge, proper delay detonators and proper
stemming to prevent blow out of holes (occasionally).
• Providing proper noise proof enclosure for the workers separated from the noise source and noise prone
equipment.
• Provision of Quiet areas, where employees can get relief from workplace noise.
• The development of green belts around the periphery of the quarry site to attenuate noise.
• Regular medical check–up and proper training to personnel to create awareness about adverse noise level
effects.
4.4.3 Ground Vibrations
Ground vibrations due to the proposed mining activities are anticipated due to operation of Mining
Machines like Excavators, drilling and blasting, transportation vehicles, etc., However, the major source of ground
vibration from the quarry is blasting. The major impact of the ground vibrations is observed on the domestic houses
located in the villages nearby the mine lease area. The kuchha houses are more prone to cracks and damage due to
the vibrations induced by blasting whereas RCC framed structures can withstand more ground vibrations. Apart
from this, the ground vibrations may develop a fear factor in the nearby settlements.
Another impact due to blasting activities is fly rocks. These may fall on the houses or agricultural fields
nearby the mining lease area and may cause injury to persons or damage to the structures. Nearest habitation from
the project area is located 1km Southeast in Karacheri village. The ground vibrations due to the blasting in proposed
mine are calculated using the empirical equation.
The empirical equation for assessment of peak particle velocity (PPV) is:
V = K [R/Q0.5] –B Where –
V = peak particle velocity (mm/s)
K = site and rock factor constant
Q = maximum instantaneous charge (kg)
B = constant related to the rock and site (usually 1.6)
R = distance from charge (m)
TABLE 4.10: PREDICTED PPV VALUES DUE TO BLASTING
Maximum Charge in kgs Nearest Habitation in m PPV in m/ms
75 400 1.086

Thiru.V.Manikandan Rough Stone and Gravel Quarry Chapter - 4
Geo Exploration and Mining Solutions 93 | P a g e
From the above graph, the charge per blast of 29Kg is well below the Peak Particle Velocity of 8 mm/s as
per Directorate General of Mines Safety for safe level criteria through Circular No. 7 dated 29/8/1997. It should be
ensured that the explosives used for blasting at one blast should not exceed more than 28 Kg at any point of time.
However, as per statutory requirement control measures will be adopted to avoid the impacts due to ground
vibrations and fly rocks due to blasting.
4.4.3.1 Common Mitigation Measures for Proposed Project
▪ The blasting operations in the cluster quarries are carried out without deep hole drilling and blasting using
delay detonators, which reduces the ground vibrations;
▪ Proper quantity of explosive, suitable stemming materials and appropriate delay system will be adopted to
avoid overcharging and for safe blasting;
▪ Adequate safe distance from blasting will be maintained as per DGMS guidelines;
▪ Blasting shelter will be provided as per DGMS guidelines;
▪ Blasting operations will be carried out only during day time;
▪ The charge per delay will be minimized and preferably more number of delays will be used per blasts;
▪ During blasting, other activities in the immediate vicinity will be temporarily stopped;
▪ Drilling parameters like depth, diameter and spacing will be properly designed to give proper blast;
▪ A fully trained explosives blast man (Mining Mate, Mines Foreman, 2nd Class Mines Manager/ 1st Class
Mines Manager) will be appointed.
▪ A set of shot firing rules will be drawn up and blasting shall commence outlining the detailed operating
procedures that will be followed to ensure that shot firing operations on site take place without endangering
the workforce or public.
▪ Sufficient angular stemming material will be used to confine the explosive force and minimise
environmental disturbance caused by venting / misfire.
▪ The detonators will be connected in a predetermined sequence to ensure that only one charge is detonated
at any one time and a NONEL or similar type initiation system will be used.
▪ The detonation delay sequence shall be designed so as to ensure that firing of the holes is in the direction of
free faces so as to minimise vibration effects.
▪ Appropriate blasting techniques shall be adopted such that the predicted peak particle velocity shall not
exceed 8 Hz.
▪ Vibration monitoring will be carried out every 6 months to check the efficacy of blasting practices

Thiru.V.Manikandan Rough Stone and Gravel Quarry Chapter - 4
Geo Exploration and Mining Solutions 94 | P a g e
4.5 Ecology and Biodiversity 4.5.1 Impact on Ecology and Biodiversity
There are no migratory corridors, migratory Avian-Fauna, Rare endemic, endangered species and wild animals
in the area. No breeding and nesting site were identified in project site. No National park and Wildlife Sanctuary found
within 10km radius.
The cluster quarry area is dry barren land and devoid of plantation, the area is surround by seasonal agriculture
lands, Existing Rough stone quarries and crushers hence no requirement for the uprooting of trees due to this quarry
project.
Barbed wire fencing will be constructed around the project area to prevent the entry of cattles. In the post
mining stage, fencing is proposed constructed all around the mined-out void to prevent fall of animals in the mine pits.
No medicinal plant identified in core and buffer area.
The fauna in the vicinity of the project site is restricted to few common small species. There will be no impact
on fauna due to this quarry project. Even though there are no impact on bio diversity and flora/fauna status due to project
operations, positive impacts will arise due to well-planned reclamation measures for restoration of land status in the area
ultimately to productive land category with elaborately planned green belt development activities and along with creation
of water resources in the working pits.
4.5.2 Common Mitigation Measures for Proposed Project
Keeping all this in mind the mitigations have been suggested under environmental management plan. With the
understanding of the role of plant species as bio-filter to control air pollution, appropriate plant species (mainly tree
species) have been suggested conceding the area/site requirements and needed performance of specific species. The
details of year wise proposed plantation program are given in Table 4.13.
The main objective of the green belt is to provide a barrier between the source of pollution and the surrounding
areas. In order to compensate the loss of vegetation cover, it is suggested to carry out afforestation program mainly in
proposed areas falls in the cluster earmarked for plantation program as per Approved Mining Plan in different phases.
This habitat improvement program would ensure the faunal species to re-colonize and improve the abundance status in
the core zone.
The objectives of the green belt cover will cover the following:
▪ Noise abatement
▪ Ecological restoration
▪ Aesthetic, biological and visual improvement of area due to improved vegetative and plantations cover.
4.5.2.2.1. Species Recommendation for Plantation granted in the district
Following points have been considered while recommending the species for plantation:
▪ Natural growth of existing species and survival rate of various species.
▪ Suitability of a particular plant species for a particular type of area.
▪ Creating of biodiversity.
▪ Fast growing, thick canopy copy, perennial and evergreen large leaf area.
▪ Efficient in absorbing pollutants without major effects of natural growth.
▪ The following species may be considering primary for plantation best suited for the prevailing climate
condition in the area.
TABLE 4.11: RECOMMENDED SPECIES FOR GREENBELT DEVELOPMENT PLAN
SI.No Name of the plant (Botanical) Family Name Common Name Habit
1 Azadirachta indica Meliaceae Neem, Vembu Tree
2 Albiziafalcatoria Fabaceae Tamarind, Puliyamaram Tree
3 Polyalthialongifolia Annonaceae Kattumaram Tree
4 Borassus Flabellifer Arecaceae Palmyra Palm Tree

Thiru.V.Manikandan Rough Stone and Gravel Quarry Chapter - 4
Geo Exploration and Mining Solutions 95 | P a g e
The 7.5m Safety distance along the boundary has been identified to be utilized for subsequent Afforestation.
However, the afforestation should always be carried out in a systematic and scientific manner. Regional trees like Neem,
Pongamia, Pinnata, and Casuarina will be planted along the Lease boundary and avenue plantation will be carried out in
respective proposed projects. The rate of survival expected to be 80% in this area. Afforestation Plan is given in Table
No.4.13 and budget of green belt development plan are given in Table No.4.14.
TABLE 4.12: GREENBELT DEVELOPMENT PLAN
Year No. of trees proposed to
be planted
Survial
%
Area to be covered
sq.m
Name of the species No. of trees expected to
be grown
I 90 80% 800 Neem, Pongamia Pinnata,
Casuarina etc.,
72
II 90 80% 800 72
III 90 80% 800 72
IV 90 80% 800 72
V 90 80% 800 72
TABLE 4.13: BUDGET FOR GREEBELT DEVELOPMENT PLAN
Activity Year
Cost Total Cost I II III IV V
Plantation in Nos 90 90 90 90 90 @ 200 Rs/ Saplings
including maintenance Rs 45,000
Plantation cost 9000 9000 9000 9000 9000
Maintenance (Rs.)
(Manuring, Fertilizer,
Insecticide application,
Watchman etc.)
Cost (Rs. 5,000/-) per year Rs 25,000
TOTAL Rs 50,000
After complete extraction of mineral, the excavated pits will be allowed to collect rainwater and seepage water
to serve as a reservoir to charge the nearby wells. Fish culture will also be attempted. A bund will be constructed around
the pits. In order to minimize the impact of mining on the vegetation outside the mine lease area, it is recommended that
adequate protection measures must be implemented. As mining involves movement of vehicles and increased
anthropogenic activities, some of the areas can be fenced by involving local people and educating them about increased
benefits of such activities.
4.5.3. Anticipated Impact on Fauna
▪ There is no Wildlife Sanctuary and Biosphere Reserve within 10 km radius of the project site.
▪ No rare, endemic & endangered species are reported in the buffer zone. However, during the course of mining,
the management will practice scientific method of mining with proper Environmental Management Plan
including pollution control measures especially for air and noise, to avoid any adverse impact on the
surrounding wildlife.
▪ Fencing around all the proposed mine lease areas will be constructed to restrict the entry of stray animals
▪ Green belt development will be carried out which will help in minimizing adverse impact on the flora found in
the area.
4.5.3.1. Measures for protection and conservation of wildlife species ▪ Undertaking mitigative measures for conducive environment to the flora and fauna in consultation with Forest
Department.
▪ Dust suppression system will be installed within mine and periphery of mine for all proposed projects
▪ Plantation around mine area will help in creating habitats for small faunal species and to create better
environment for various fauna. Creating and developing awareness for nature and wildlife in the adjoining
villages.

Thiru.V.Manikandan Rough Stone and Gravel Quarry Chapter - 4
Geo Exploration and Mining Solutions 96 | P a g e
4.5.3.2. Mitigation Measures
▪ All the preventive measures will be taken for growth & development of fauna.
▪ Creating and development awareness for nature and wildlife in the adjoin villages.
▪ The workers shall be trained to not harm any wildlife, should it come near the project site. No work shall be
carried out after 6.00 pm.
4.5.4. Impact on Aquatic Biodiversity
Mining activities will not disturb the existing aquatic ecology as there is no effluent discharge proposed from
the Rough stone quarry. There is no natural perennial surface water body within the mine lease area. Hence, aquatic
biodiversity is not observed in the mine lease area.
4.5.5. Impact Assessment on Biological Environment
A detail of impact and assessments was mentioned in Table No 4.15.
TABLE 4.14: ECOLOGICAL IMPACT ASSESSMENTS
SI.No Attributes Assessment
1 Proximity to national park/wildlife
sanctuary/reserve forest /mangroves/
coastline/estuary/sea
NO Reserve Forest within 10 km Radius.
2 Proposed mining project impact surface water
quality that also provide water to wildlife
‘NO ‘scheduled or threatened wildlife animal sighted
regularly core in core area.
3 Located near an area populated by rare or
endangered species
NO endangered, critically endangered, vulnerable
species sighted in core mining lease area.
4 Proposed project restricts access to waterholes
for wildlife
‘NO‘
5 Project likely to affect migration routes ‘NO ‘migration route observed during monitoring
period.
6 Proposed mining project increase siltation that
would affect nearby biodiversity area.
Surface runoff management such as garland drains is
proposed to be constructed, so there will be no siltation
nearby mining area.
7 Risk of fall/slip or cause death to wild animals
due to project activities
‘NO‘
8 Activities of the project affects the
breeding/nesting sites of birds and animals
No breeding and nesting site was identified in mining
lease site. The fauna sighted mostly migrated from
buffer area.
9 Mining project effect the forest-based
livelihood/ any specific forest product on
which local livelihood depended
‘NO‘
10 The project release effluents into a water body
that also supplies water to a wildlife
No water body near to core zone so chances of water
become polluted is low.
11 The project likely to affect wetlands,
Fish breeding grounds, marine ecology
‘NO‘. Wetland was not present in near core
Mining lease area. No breeding and nesting ground
present in core mining area.
12 Project likely to affect flora of an area, which
have medicinal value
‘NO‘
13 Forestland is to be diverted, has carbon high
sequestration
‘NO ‘There was no forest land diverted.

Thiru.V.Manikandan Rough Stone and Gravel Quarry Chapter - 4
Geo Exploration and Mining Solutions 97 | P a g e
TABLE 4.15: ANTICIPATED IMPACT OF ECOLOGY AND BIODIVERSITY
Sl.
No Aspect Description
Likely Impacts on
Ecology and
Biodiversity (EB)
Impact
Consequence -
Probability
Description /
Justification
Significance Mitigation Measures
Pre-Mining Phase
1 Uprooting of
vegetation of lease
area
Site specific loss of
common floral
diversity (Direct
impact)
Site possesses
common floral (not
trees) species.
Clearance of these
species will not
result in loss of flora
Less severe No immediate action
required. However,
Greenbelt /plantation
will be developed in
project site and in
periphery of the project
boundary, which will
improve flora and fauna
diversity of the project
area.
Site specific loss of
associated faunal
diversity (Partial
impact)
Site supports only
common species,
which use wide
variety of habitats of
the buffer zone
reserve forest area.
So, there is no threat
of faunal diversity.
-Loss of Habitat
(Direct impact)
Site does not form
Unique / critical
habitat structure for
unique flora or
fauna.
Mining phase
2 Excavation of
mineral using
machine and
labours,
Transportation
activities will
generate noise.
Site-specific
disturbance to
normal faunal
movements at the
site due to noise.
(Partial impact)
Site does not form
unique / critical
habitat structure for
unique flora or
fauna.
Less severe Mining activity should
not be operated after
5PM.
Excavation of dump
and transportation work
should stop before
7PM.
3 Vehicular
Movement for
transportation of
materials will result
in generation of dust
(SPM) due to haul
roads and emission
of SO2,NO2,CO etc.
Impact on
surrounding
agriculture and
associated fauna
due to deposition of
dust and Emission
of CO. (Indirect
impact)
Impact is less as the
agricultural land far
from core area.
Less severe All vehicles will be
certified for appropriate
Emission levels.
More plantation has
been suggested
Upgrade the vehicles
with alternative fuel
such biodiesel,
methanol and biofuel
around the mining area.

Thiru.V.Manikandan Rough Stone and Gravel Quarry Chapter - 4
Geo Exploration and Mining Solutions 98 | P a g e
4.6 Socio Economic
4.6.1 Anticipated Impact from Proposed Project ▪ Dust generation from mining activity can have negative impact on the health of the workers and people in the
nearby area.
▪ Approach roads can be damaged by the movement of tippers
▪ Increase in Employment opportunities both direct and indirect thereby increasing economic status of people of
the region
4.6.2 Common Mitigation Measures for Proposed Project
▪ Good maintenance practices will be adopted for all machinery and equipment, which will help to avert potential
noise problems.
▪ Green belt will be developed in and around the project site as per Central Pollution Control Board (CPCB)
guidelines.
▪ Air pollution control measure will be taken to minimize the environmental impact within the core zone.
▪ For the safety of workers, personal protective appliances like hand gloves, helmets, safety shoes, goggles,
aprons, nose masks and ear protecting devices will be provided as per mines act and rules.
▪ Benefit to the State and the Central governments through financial revenues by way of royalty, tax, duties, etc..,
from this project directly and indirectly.
▪ From above details, the quarry operations will have highly beneficial positive impact in the area
4.7 Occupational Health and Safety
Occupational health and safety hazards occur during the operational phase of mining and primarily include the
following:
▪ Respiratory hazards
▪ Noise
▪ Physical hazards
▪ Explosive storage and handling
4.7.1 Respiratory Hazards
Long-term exposure to silica dust may cause silicosis the following measures are proposed:
▪ Cabins of excavators and tippers will be enclosed with AC and sound proof
▪ Use of personal dust masks will be made compulsory
4.7.2 Noise
Workers are likely to get exposed to excessive noise levels during mining activities. The following measures are
proposed for implementation
▪ No employee will be exposed to a noise level greater than 85 dB(A) for a duration of more than 8 hours per day
without hearing protection
▪ The use of hearing protection will be enforced actively when the equivalent sound level over 8 hours reaches 85
dB(A), the peak sound levels reach 140 dB(C), or the average maximum sound level reaches 110 dB(A)
▪ Ear muffs provided will be capable of reducing sound levels at the ear to at least 85 dB(A)
▪ Periodic medical hearing checks will be performed on workers exposed to high noise levels

Thiru.V.Manikandan Rough Stone and Gravel Quarry Chapter - 4
Geo Exploration and Mining Solutions 99 | P a g e
4.7.3 Physical Hazards
The following measures are proposed for control of physical hazards
▪ Specific personnel training on work-site safety management will be taken up;
▪ Work site assessment will be done by rock scaling of each surface exposed to workers to prevent accidental
rock falling and / or landslide, especially after blasting activities;
▪ Natural barriers, temporary railing, or specific danger signals will be provided along rock benches or other pit
areas where work is performed at heights more than 2m from ground level;
▪ Maintenance of yards, roads and footpaths, providing sufficient water drainage and preventing slippery surfaces
with an all-weather surface, such as coarse gravel will be taken up
4.7.4 Occupational Health Survey
All the persons will undergo pre-employment and periodic medical examination. Employees will be monitored
for occupational diseases by conducting the following tests
▪ General physical tests
▪ Audiometric tests
▪ Full chest, X-ray, Lung function tests, Spirometric tests
▪ Periodic medical examination – yearly
▪ Lung function test – yearly, those who are exposed to dust
▪ Eye test
Essential medicines will be provided at the site. The medicines and other test facilities will be provided at free
of cost. The first aid box will be made available at the mine for immediate treatment.
First aid training will be imparted to the selected employees regularly. The lists of first aid trained members
shall be displayed at strategic places.
4.8 Mine Waste Management
No waste is anticipated from any of the proposed quarries.
4.9 Mine Closure
Mine closure plan is the most important environmental requirement in mining projects. The mine closure plan
should cover technical, environmental, social, legal and financial aspects dealing with progressive and post closure
activities. The closure operation is a continuous series of activities starting from the decommissioning of the project.
Therefore, progressive mine closure plan should be specifically dealt with in the mining plan and is to be reviewed along
with mining plan. As progressive mine closure is a continuous series of activities, it is obvious that the proposals of
scientific mining have included most of the activities to be included in the closure plan. While formulating the closure
objectives for the site, it is important to consider the existing or the pre-mining land use of the site; and how the operation
will affect this activity.
The primary aim is to ensure that the following broad objectives along with the abandonment of the mine can
be successfully achieved:
▪ To create a productive and sustainable after-use for the site, acceptable to mine owners, regulatory agencies,
and the public
▪ To protect public health and safety of the surrounding habitation
▪ To minimize environmental damage
▪ To conserve valuable attributes and aesthetics
▪ To overcome adverse socio-economic impacts.

Thiru.V.Manikandan Rough Stone and Gravel Quarry Chapter - 4
Geo Exploration and Mining Solutions 100 | P a g e
4.9.1 Mine Closure Criteria
The criteria involved in mine closure are discussed below:
4.9.1.1 Physical Stability
All anthropogenic structures, which include mine workings, buildings, rest shelters etc., remaining after mine
decommissioning should be physically stable. They should present no hazard to public health and safety as a result of
failure or physical deterioration and they should continue to perform the functions for which they were designed. The
design periods and factors of safety proposed should take full account of extreme events such as floods, hurricane, winds
or earthquakes, etc. and other natural perpetual forces like erosion, etc.,
4.9.1.2 Chemical Stability
The solid wastes on the mine site should be chemically stable. This means that the consequences of chemical
changes or conditions leading to leaching of metals, salts or organic compounds should not endanger public health and
safety nor result in the deterioration of environmental attributes. If the pollutant discharge likely to cause adverse impacts
is predicted in advance, appropriate mitigation measures like settling of suspended solids or passive treatment to improve
water quality as well as quantity, etc., could be planned. Monitoring should demonstrate that there is no adverse effect of
pollutant concentrations exceeding the statutory limits for the water, soil and air qualities in the area around the closed
mine.
4.9.1.3 Biological Stability
The stability of the surrounding environment is primarily dependent upon the physical and chemical
characteristics of the site, whereas the biological stability of the mine site itself is closely related to rehabilitation and
final land use. Nevertheless, biological stability can significantly influence physical or chemical stability by stabilizing
soil cover, prevention of erosion/wash off, leaching, etc.,
A vegetation cover over the disturbed site is usually one of the main objectives of the rehabilitation programme,
as vegetation cover is the best long-term method of stabilizing the site. When the major earthwork components of the
rehabilitation programme have been completed, the process of establishing a stable vegetation community begins. For re-
vegetation, management of soil nutrient levels is an important consideration. Additions of nutrients are useful under three
situations.
▪ Where the nutrient level of spread topsoil is lower than material in-situ e.g. for development of social forestry
▪ Where it is intended to grow plants with a higher nutrient requirement than those occurring naturally e.g.
planning for agriculture
▪ Where it is desirable to get a quick growth response from the native flora during those times when moisture is
not a limiting factor e.g. development of green barriers
The Mine closure plan should be as per the approved mining plan. The mine closure is a part of approved mine plan and
activities of closure shall be carried out as per the process described in mine closure plan.
Thiru.V.Manikandan Rough Stone and Gravel Quarry Chapter - 5
Geo Exploration and Mining Solutions 101 | P a g e
CHAPTER – 5: ANALYSIS OF ALTERNATIVES (TECHNOLOGY AND SITE)
5.0 Introduction:
Consideration of alternatives to a project proposal is a requirement of EIA process. This quarry is site
specific. The site has been selected based on geological investigation and exploration and from the Existing quarry
pits around the project site. Drilling, Blasting, Excavation, Loading & Transportation will be carried out in this
quarrying operation.
• This area denotes the indicative of flow pattern of the rock mass in N300E to S300W with dipping SE600.
• Transportation facility for materials & manpower.
• Overall impact on environment and mitigation feasibility.
• Socio – economic background.
Enough infrastructure exists and lesser resources are required to be deployed. Since, any major construction for
infrastructure is not required and hence does not affect the environment considerably.
5.1 Factors Behind the Selection of Project Site
Rough Stone and Gravel Quarry Projects at Chettipalayam Village is a site specific. The proposed mining
lease area has following advantages:-
▪ The mineral deposit occurs in a non-forest area.
▪ There is no habitation within the project area; hence no R & R issues exist.
▪ There is no river, stream, nallah and water bodies in the applied mine lease area.
▪ Availability of skilled, semi-skilled and unskilled workers in this region.
▪ All the basic amenities such as medical, fire fighting, education, transportation, communication and
infrastructural facilities are well connected and accessible.
▪ The mining operations will not intersect the ground water level. Hence, no impact on ground water
environment.
▪ Study area falls in seismic zone – III, there is no major history of landslides, earthquake, subsidence etc.,
recorded in the past history
5.2 Analysis of Alternative Site
The mineral deposits are site specific in nature; hence, question of seeking alternate site does not arise for
this project.
5.3 Factors Behind Selection of Proposed Technology
Mechanized open cast mining operation with drilling and blasting method will be used to extract Rough
Stone and Gravel in the area. The quarry areas falls in the clusters has following advantages –
▪ As the mineral deposition is homogeneous and batholith formation, therefore opencast method of working
out deposit is preferred over underground method
▪ The material will be loaded after sprinkling with water with the help of excavators into dumpers / trippers
and transported to the needy customers.
▪ Blasting and availability of drills along with controlled blasting technology gives desired fragmentation so
that the mineral is handled safely and used without secondary blasting.
Semi skilled labours fit for quarrying operations are easily available around the nearby villages
5.4 Analysis of Alternative Technology
Open cast mechanized method has been selected for this project. This technology is having least gestation
period, economically viable, safest and less labour intensive. The method has inbuilt flexibility for increasing or
decreasing the production as per market condition.

Thiru.V.Manikandan Rough Stone and Gravel Quarry Chapter - 6
Geo Exploration and Mining Solutions 102 | P a g e
CHAPTER – 6: ENVIRONMENTAL MONITORING PROGRAMME
6.0 General
Environmental Monitoring will be taken up for various environmental components as per conditions
stipulated in Environmental Clearance Letter issued by MoEF & Consent to Operate issued by the State Pollution
Control Board. Monitoring reports will be submitted to regulator as per statutory requirements. The entire
monitoring work will be carried out by MoEF & CC / NABL recognized laboratories.
The monitoring and evaluation of environmental parameters indicates potential changes occurring in the
environment, which paves way for implementation of rectifying measures wherever required to maintain the status
of the natural environment. Evaluation is also a very effective tool to judge the effectiveness or deficiency of the
measures adopted and provides insight for future corrections.
6.1 Methodology of Monitoring Mechanism
Implementation of EMP and periodic monitoring will be carried out by the proponents and respective
quarry owners in the cluster quarries. A comprehensive monitoring mechanism has been devised for monitoring of
impacts due to proposed project; Mine Management Level environmental protection measures like dust suppression,
treatment and recycling of waste water, control of noise due to blasting and Ground vibration, maintenance of
machinery and vehicles, housekeeping in the mine premises, plantation, implementation of other hand,
implementation of area level protection measures like plantation and green Environmental Management Plan and
environmental clearance conditions will be monitored by the proponent. On the belt development, environmental
quality monitoring etc.,
An environment monitoring cell (EMC) will be constituted at the quarry consisting of following members
to monitor the implementation of EMP and other environmental protection measures.
FIGURE 6.1 HIERARCHY OF ENVIRONMENTAL MONITORING CELL

Thiru.V.Manikandan Rough Stone and Gravel Quarry Chapter - 6
Geo Exploration and Mining Solutions 103 | P a g e
The responsibilities of this cell will be:
• Implementation of pollution control measures
• Monitoring programme implementation
• Post-plantation care
• To check the efficiency of pollution control measures taken
• Any other activity as may be related to environment
• Seeking expert’s advice when needed
The environmental monitoring cell will co-ordinate all monitoring programs at site and data thus generated
will be regularly furnished to the State regulatory agencies. The sampling and analysis report of the monitored
environmental attributes will be submitted to the Tamil Nadu Pollution Control Board (TNPCB) at a frequency of
monthly, half-yearly and yearly. The half-yearly reports will be submitted to Ministry of Environment and Forest,
Regional Office and SEIAA as well.
The sampling and analysis of the environmental attributes will be as per the guidelines of Central Pollution
Control Board (CPCB)/Ministry of Environment, Forest and Climate Change (MoEF & CC).
6.2 Implementation Schedule of Mitigation Measures
The mitigation measures proposed in Chapter-4 will be implemented so as to reduce the impact on the
environment due to the operations of the proposed project. Implementation schedule of mitigation measures is given
in Table 6.1.
TABLE 6.1 IMPLEMENTATION SCHEDULE
Sl No. Recommendations Time Period Schedule
1 Land Environment Control
Measures Before commissioning of the project
Immediately after the
commencement of the project
2 Soil Quality Control
Measures Before commissioning of the project
Immediately after the
commencement of the project
3 Water Pollution Control
Measures
Before commissioning of the project and
along with mining operation
Immediately and as project
progress
4 Air Pollution Control
Measures
Before commissioning of the project and
along with mining operation
Immediately and as project
progress
5 Noise Pollution Control
Measures
Before commissioning of the project and
along with mining operation
Immediately and as project
progress
6 Ecological Environment Phase wise implementation every year
along with mine operations
Immediately and as project
progress
6.3 Monitoring Schedule and Frequency
The environmental monitoring will be conducted in the mine operations as follows:
• Air quality;
• Water and wastewater quality;
• Noise levels;
• Soil Quality; and
• Greenbelt Development
The details of monitoring are detailed in Table 6.2

Thiru.V.Manikandan Rough Stone and Gravel Quarry Chapter - 6
Geo Exploration and Mining Solutions 104 | P a g e
TABLE 6.2: PROPOSED MONITORING SCHEDULE POST EC
S.
No.
Environment
Attributes Location
Monitoring Parameters
Duration Frequency
1 Air Quality 2 Locations (1 Core & 1
Buffer) 24 hours
Once in 6
months
Fugitive Dust, PM2.5,
PM10, SO2 and NOx.
2 Meteorology
At mine site before start of
Air Quality Monitoring &
IMD Secondary Data
Hourly /
Daily
Continuous
online
monitoring
Wind speed, Wind
direction, Temperature,
Relative humidity and
Rainfall
3 Water Quality
Monitoring
2 Locations (1SW & 1
GW) -
Once in 6
months
Parameters specified
under IS:10500, 1993 &
CPCB Norms
4 Hydrology
Water level in open wells
in buffer zone around 1 km
at specific wells
- Once in 6
months Depth in bgl
5 Noise 2 Locations (1 Core & 1
Buffer)
Hourly – 1
Day
Once in 6
months
Leq, Lmax, Lmin, Leq
Day & Leq Night
6 Vibration At the nearest habitation
(in case of reporting) –
During blasting
Operation Peak Particle Velocity
7 Soil 2 Locations (1 Core & 1
Buffer) –
Once in six
months
Physical and Chemical
Characteristics
8 Greenbelt Within the Project Area Daily Monthly Maintenance
Source: Guidance of manual for mining of minerals, February 2010
6.4 Environmental Policy of the Proponents
The project proponents in the proposed quarries are committed to ensure that:
• Protect the environment by control and prevention of pollution and promote green environment.
• To operate the quarry with an objective of no injuries and accidents at the work place and provide a safe
work place for our employees, contractors and others who perform their duties.
• Adequate health care will be taken to all the employees and create process to reduce the adverse effect of
the operations on Health of the employees.
• Provide safety appliance and continuous training in safety to employees to ensure safe production and
achieve the target of zero accidents.
• Develop safe working methods and practices, remove unsafe work conditions and consider all the aspects
at the early stages of process development to provide safe working atmosphere.
• Communicate Safety, Health and Environmental Policy to all employees for better understanding and
practice.
6.5 Budgetary Provision for Environmental Monitoring Programme
The cost in respect of monitoring of environmental attributes, parameter to be monitored,
sampling/monitoring locations with frequency and cost provision against each proposal is shown in Table 6.3.
Monitoring work will be outsourced to external laboratory approved by NABL / MoEF.
The proposed total cost for Environmental Monitoring Programme for proposed quarry for the mining plan
period is Rs 3,80,000/-.

Thiru.V.Manikandan Rough Stone and Gravel Quarry Chapter - 6
Geo Exploration and Mining Solutions 105 | P a g e
TABLE 6.3 ENVIRONMENT MONITORING BUDGET
Parameter Capital Cost
Air Quality
Meteorology
Water Quality
Hydrology
Soil Quality
Noise Quality
Vibration Study
Greenbelt
Rs.3,80,000/-
Total Rs. 3,80,000/-
Source: Approved Mining Plans
6.6 Reporting Schedules of Monitored Data
The monitored data on Air quality, Water quality, Noise levels and other environmental attributes will be
periodically examined by the proponent with Environmental Monitoring cell and necessary corrective measures will
be carried out. The monitoring data will be submitted to Tamil Nadu State Pollution Control Board in the
Compliance to CTO Conditions & environmental audit statements every year to MoEF & CC and Half-Yearly
Compliance Monitoring Reports to MoEF & CC Regional Office and SEIAA.
Periodical reports to be submitted to:-
• MoEF & CC – Half yearly status report
• TNPCB - Half yearly status report
• Department of Geology and Mining: quarterly, half yearly annual reports
• SEIAA, Chennai, Tamil Nadu
Besides the Mines Manager/Agent will submit the periodical reports to –
• Director of mines safety,
• Labour enforcement officer,
• Controller of explosives as per the norms stipulated by the department.

Thiru.V.Manikandan Rough Stone and Gravel Quarry Chapter - 7
Geo Exploration and Mining Solutions 106 | P a g e
CHAPTER – 7: ADDITIONAL STUDIES
7.0 General
The following Additional Studies were done as per items identified by project proponent and items
identified by regulatory authority. And items identified by public and other stakeholders will be incorporated
after Public Hearing.
▪ Public Consultation
▪ Risk Assessment
▪ Disaster Management Plan
▪ Cumulative Impact Study
▪ Plastic Waste Management
▪ Post-COVID Health Management Plan
7.1. Public Consultation:
Application to The Member Secretary of the Tamil Nadu Pollution Control Board (TNPCB) to conduct
Public Hearing in a systematic, time bound and transparent manner ensuring widest possible public participation
at the project site or in its close proximity in the district is submitted along with this Draft EIA / EMP Report
and the outcome of public hearing proceedings will be detailed in the Final EIA/EMP Report.
7.2 Risk Assessment
The methodology for the risk assessment has been based on the specific risk assessment guidance
issued by the Directorate General of Mine Safety (DGMS), Dhanbad, vide Circular No.13 of 2002, dated 31st
December, 2002. The DGMS risk assessment process is intended to identify existing and probable hazards in
the work environment and all operations and assess the risk levels of those hazards in order to prioritize those
that need immediate attention. Further, mechanisms responsible for these hazards are identified and their control
measures, set to timetable are recorded along with pinpointed responsibilities.
The cluster quarry operation will be carried out under the direction of a Qualified Competent Mine
manager holding certificate of competency to manage a metalliferous mine granted by the DGMS, Dhanbad.
Risk Assessment is all about prevention of accidents and to take necessary steps to prevent it from happening.
Factors of risks involved due to human induced activities in connection with mining & allied activities with
detailed analysis of causes and control measures for the mine is given in below Table 7.1.
TABLE 7.1 RISK ASSESSMENT & CONTROL MEASURES
S. No Risk factors Causes of risk Control measures
1 Accidents due to
explosives and heavy
mining machineries
Improper handling and
unsafe working practice
▪ All safety precautions and provisions of
Mine Act, 1952, Metalliferrous Mines
Regulation, 1961 and Mines Rules, 1955
will be strictly followed during all mining
operations;
▪ Entry of unauthorized persons will be
prohibited;
▪ Fire fighting and first-aid provisions in
the mine office complex and mining area;
▪ Proviszons of all the safety appliances
such as safety boot, helmets, goggles etc.
will be made available to the employees
and regular check for their use.
▪ Working of quarry, as per approved plans
and regularly updating the mine plans;
▪ Cleaning of mine faces shall be daily

Thiru.V.Manikandan Rough Stone and Gravel Quarry Chapter - 7
Geo Exploration and Mining Solutions 107 | P a g e
done in order to avoid any overhang or
undercut;
▪ Handling of explosives, charging and
firing shall be carried out by competent
persons only under the supervision of a
Mine Manager;
▪ Maintenance and testing of all mining
equipment as per manufacturer‘s
guidelines.
2 Drilling& Blasting Due to improper and
unsafe practices
Due to high pressure of
compressed air, hoses
may burst
Drill Rod may break
▪ Safe operating procedure established for
drilling (SOP) will be strictly followed.
▪ Only trained operators will be deployed.
▪ No drilling shall be commenced in an
area where shots have been fired until the
blaster/blasting foreman has made a
thorough Examination of all places,
▪ Drilling shall not be carried on
simultaneously on the benches at places
directly one above the other.
▪ Periodical preventive maintenance and
replacement of worn out accessories in
the compressor and drill equipment as per
operator manual.
▪ All drills unit shall be provided with wet
drilling shall be maintained in efficient
working in condition.
▪ Operator shall regularly use all the
personal protective equipment.
3 Blasting Fly rock, ground
vibration, Noise and dust.
Improper charging,
stemming & Blasting/
fining of blast holes
Vibration due to
movement of vehicles
▪ The maximum charge per delay and by
optimum blast hole pattern, vibrations
will be controlled within the permissible
limit and blast can be conducted safely.
▪ SOP for Charging, Stemming &
Blasting/Firing of Blast Holes will be
followed by blasting crew during initial
stage of operation
▪ Shots are fired during daytime only.
▪ All holes charged on any one day shall be
fired on the same day.
▪ The danger zone is and will be distinctly
demarcated (by means of red flags)
4 Transportation Potential hazards and
unsafe workings
contributing to accident
and injuries
Overloading of material
While reversal &
overtaking of vehicle
Operator of truck leaving
▪ Before commencing work, drivers
personally check the dumper/truck/tipper
for oil(s), fuel and water levels, tyre
inflation, general cleanliness and inspect
the brakes, steering system, warning
devices including automatically operated
audio visual reversing alarm, rear view
mirrors , side indicator lights etc., are in
good condition.
▪ Not allow any unauthorized person to ride
on the vehicle nor allow any unauthorized
person to operate the vehicle.
▪ Concave mirrors should be kept at all
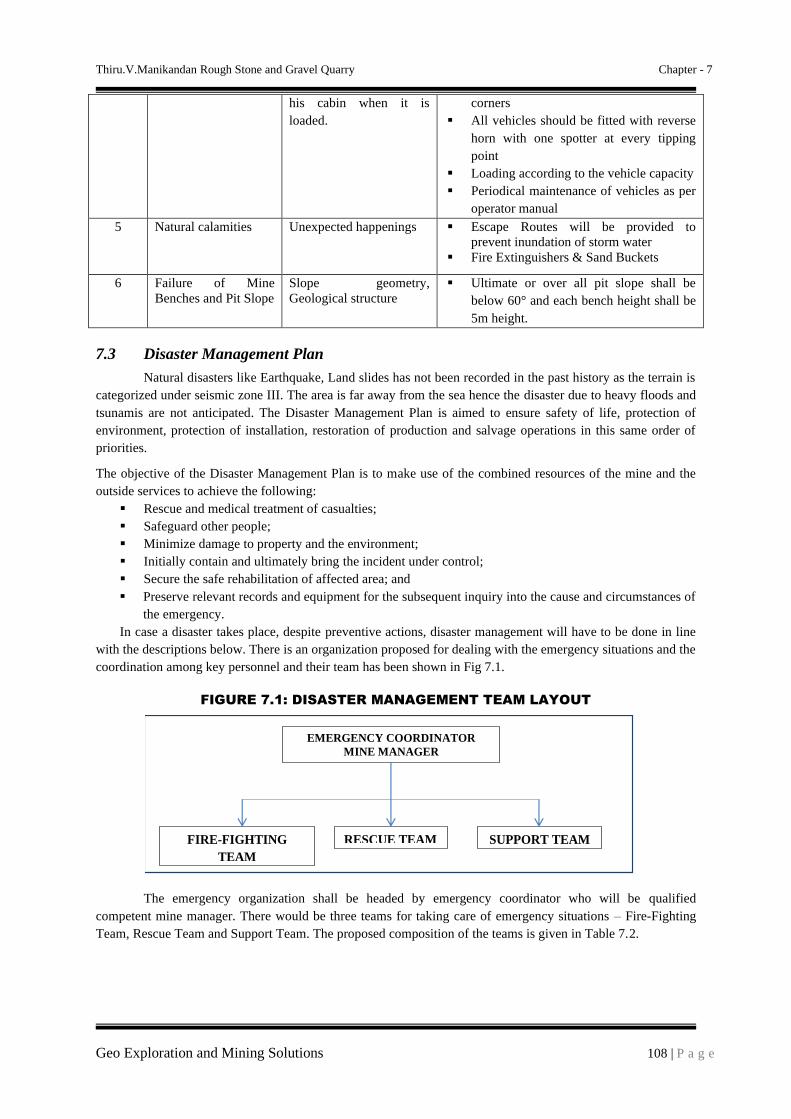
Thiru.V.Manikandan Rough Stone and Gravel Quarry Chapter - 7
Geo Exploration and Mining Solutions 108 | P a g e
his cabin when it is
loaded.
corners
▪ All vehicles should be fitted with reverse
horn with one spotter at every tipping
point
▪ Loading according to the vehicle capacity
▪ Periodical maintenance of vehicles as per
operator manual
5 Natural calamities Unexpected happenings ▪ Escape Routes will be provided to
prevent inundation of storm water
▪ Fire Extinguishers & Sand Buckets
6 Failure of Mine
Benches and Pit Slope
Slope geometry,
Geological structure
▪ Ultimate or over all pit slope shall be
below 60° and each bench height shall be
5m height.
7.3 Disaster Management Plan
Natural disasters like Earthquake, Land slides has not been recorded in the past history as the terrain is
categorized under seismic zone III. The area is far away from the sea hence the disaster due to heavy floods and
tsunamis are not anticipated. The Disaster Management Plan is aimed to ensure safety of life, protection of
environment, protection of installation, restoration of production and salvage operations in this same order of
priorities.
The objective of the Disaster Management Plan is to make use of the combined resources of the mine and the
outside services to achieve the following:
▪ Rescue and medical treatment of casualties;
▪ Safeguard other people;
▪ Minimize damage to property and the environment;
▪ Initially contain and ultimately bring the incident under control;
▪ Secure the safe rehabilitation of affected area; and
▪ Preserve relevant records and equipment for the subsequent inquiry into the cause and circumstances of
the emergency.
In case a disaster takes place, despite preventive actions, disaster management will have to be done in line
with the descriptions below. There is an organization proposed for dealing with the emergency situations and the
coordination among key personnel and their team has been shown in Fig 7.1.
FIGURE 7.1: DISASTER MANAGEMENT TEAM LAYOUT
The emergency organization shall be headed by emergency coordinator who will be qualified
competent mine manager. There would be three teams for taking care of emergency situations – Fire-Fighting
Team, Rescue Team and Support Team. The proposed composition of the teams is given in Table 7.2.
EMERGENCY COORDINATOR
MINE MANAGER
SUPPORT TEAM RESCUE TEAM FIRE-FIGHTING
TEAM

Thiru.V.Manikandan Rough Stone and Gravel Quarry Chapter - 7
Geo Exploration and Mining Solutions 109 | P a g e
TABLE 7.2: PROPOSED TEAMS TO DEAL WITH EMERGENCY SITUATION
DESIGNATION QUALIFICATION
FIRE-FIGHTING TEAM
Team Leader/ Emergency Coordinator (EC) Mines Manager
Team Member Mines Foreman
Team Member Mining Mate
RESCUE TEAM
Team Leader/ Emergency Coordinator (EC) Mines Manager
Team Member/ Incident Controller (IC) Environment Officer
Team Member Mining Foreman
SUPPORT TEAM
Team Leader/ Emergency Coordinator (EC) Mines Manager
Assistant Team Leader Environment Officer
Team Member Mining Mate
Security Team Leader/ Emergency Security Controller Mines Foreman
Once the mine becomes operational, the above table along with names of personnel will be prepared
and made easily available to workers. A mobile communication network and wireless shall connect Mine
Emergency Control Room (MECR) to control various departments of the mine, fire station and neighbouring
industrial units/mines.
Roles and responsibilities of emergency team –
(a) Emergency coordinator (EC)
The emergency coordinator shall assume absolute control of site
(b) Incident controller (IC)
Incident controller shall be a person who shall go to the scene of emergency and supervise the action
plan to overcome or contain the emergency. Shift supervisor or Environmental Officer shall assume the charge
of IC.
(c) Communication and advisory team
The advisory and communication team shall consist of heads of Mining Departments i.e., Mines
Manager
(d) Roll call coordinator
The Mine Foreman shall be Roll Call Coordinator. The roll call coordinator will conduct the roll call
and will evacuate the mine personnel to assembly point. His prime function shall be to account for all personnel
on duty.
(e) Search and rescue team
There shall be a group of people trained and equipped to carryout rescue operation of trapped
personnel. The people trained in first aid and fire-fighting shall be included in search and rescue team
(f) Emergency security controller
Emergency Security Controller shall be senior most security person located at main gate office and
directing the outside agencies e.g. fire brigade, police, doctor and media men etc.,

Thiru.V.Manikandan Rough Stone and Gravel Quarry Chapter - 7
Geo Exploration and Mining Solutions 110 | P a g e
Emergency control procedure –
The onset of emergency, will in all probability, commence with a major fire or explosion or collapse of
wall along excavation and shall be detected by various safety devices and also by members of operational staff
on duty. If located by a staff member on duty, he (as per site emergency procedure of which he is adequately
briefed) will go to nearest alarm call point, break glass and trigger off the alarms. He will also try his best to
inform about location and nature of accident to the emergency control room. In accordance with work
emergency procedure the following key activities will immediately take place to interpret and take control of
emergency.
• On site fire crew led by a fireman will arrive at the site of incident with fire foam tenders and necessary
equipment.
• Emergency security controller will commence his role from main gate office
• Incident controller shall rush to the site of emergency and with the help of rescue team and will start
handling the emergency.
• Site main controller will arrive at MECR with members of his advisory and communication team and
will assume absolute control of the site.
o He will receive information continuously from incident controller and give decisions and
directions to:
• Incident controller
• Mine control rooms
• Emergency security controller
Proposed fire extinguishers at different locations –
The following type of fire extinguishers is proposed at strategic locations within the quarry.
Location Type of Fire Extinguishers
Electrical Equipment’s CO2 type, foam type, dry chemical powder type
Fuel Storage Area CO2 type, foam type, dry chemical powder type, Sand bucket
Office Area Dry chemical type, foam type
Alarm system to be followed during disaster –
On receiving the message of disaster from Site Controller, fire-fighting team, the mine control room
attendant will sound siren wailing for 5 minutes. Incident controller will arrange to broadcast disaster message
through public address system.
On receiving the message of "Emergency Over" from Incident Controller the emergency control room attendant
will give "All Clear Signal”, by sounding alarm straight for 2 minutes.
The features of alarm system will be explained to one and all to avoid panic or misunderstanding during
disaster.
In order to prevent or take care of hazard / disasters if any the following control measures have been
adopted.
▪ All safety precautions and provisions of Metalliferous Mines Regulations (MMR), 1961 is strictly
followed during all mining operations
▪ Fire fighting and first-aid provisions in the mines office complex and mining area will be provided.
▪ Provisions of all the safety appliances such as safety boot, helmets, goggles, dust masks, ear plugs and
ear muffs etc. are made available to the employees and the use of same is strictly adhered to through
regular monitoring
▪ Training and refresher courses for all the employees working in the quarry in phase manner
▪ Cleaning of mine faces will be carried out regularly
▪ Provision of high capacity standby pumps with generator sets with enough quantity of diesel for
emergency pumping especially during monsoon.
▪ A blasting SIREN will be used at the time of blasting for audio signal.
▪ Checking of blasting area for any un-blasted hole or material.
▪ Warning notice boards indicating the time of blasting and NOT TO TRESPASS will be displayed at
prominent places

Thiru.V.Manikandan Rough Stone and Gravel Quarry Chapter - 7
Geo Exploration and Mining Solutions 111 | P a g e
7.4 CUMULATIVE IMPACT STUDY There are 13 proposed and 17 existing quarries falls in the cluster. The list of quarries is as below –
TABLE 7.3: LIST OF QUARRIES WITHIN 500 METER RADIUS FROM THIS PROPOSAL
PROPOSED QUARRY
CODE Name of the Proponent and Address S.F.Nos ,Village & Taluk Extent in Ha Status
P1
Thiru.V.Manikandan, S/o. Vellingiri,
No.55B, Mariyamman Kovil Street,
Chettipalayam post, Coimbatore – 641 201.
869/1 & 869/2, Chettipalayam
&Madukkarai
2.57.5
Obtained ToR Vide
Lr.No.SEIAA-
TN/F.No.8553/SEAC/ToR-
1010/2021 Dated: 28.07.2021
NEAREST PROPOSED QUARRY
P2
Thiru. K. Paramasivam,
S/o. Krishnasamy Gounder,
Erathotti Thottam, Karacheri,
Periyakuyilai Post, Chettipalayam Via,
Coimbatore District - 641 201.
351/2G & 351/2H, Arasampalayam &
Kinathukadavu
1.86.0
Obtained ToR vide,
Lr No.SEIAA-
TN/F.No.7780/SEAC/ToR-
812/2020 Dated:09.11.2020
P3
Thiru.R.Nataraj,
No.3/183, Karachery, Chettipalayam (via),
Kinathukadavu, Coimbatore District – 641 201
90/2(P) & 91/1A(P0), Pachapalayam & Sulur
1.34.5
Obtained ToR vide,
Lr.No. SEIAA-
TN/F.No.8034/SEAC/ToR-
893/2020 Dated:16.03.2021
P4
Thiru.K.Nataraj,
Theerthakinaru Thottam, Karacheri,
Chettipalayam via, Kinathukadavu Taluk,
Coimbatore District – 641 201
84/5A(Part), Pachapalayam & Sulur
1.48.0
Obtained ToR vide,
Lr.No. SEIAA-
TN/F.No.8043/SEAC/ToR-
915/2020 Dated:16.03.2021
P5
Tmt.R.Baby,
W/o. R.S. Radhakrishnan, No.96/65G, Ruba
Nagar, Ramanathapuram, Coimbatore District
– 641 045
83/1C1B & 83/1C2, Pachapalayam & Sulur
1.33.0
Obtained ToR vide,
Lr.No. SEIAA-
TN/F.No.8362/SEAC/ToR-
981/2021 Dated: 05.07.2021
P6
Thiru.M.Ramasamy,
S/o. Mariyagounder, Kalavaithottam, Thegani,
Periyakuyili Post,
Coimbatore District – 641 201
80/1E1, 80/1E2 & 80/1E4, Pachapalayam & Sulur
1.37.0
Obtained ToR Vide
Lr.No.SEIAA-
TN/F.No.8297/SEAC/ToR-
958/2020 Dated: 03.05.2021
P7
Thiru.K.M.Subramaniyam,
S/o.A.Muthusamy, no.46/3, P.K.P.Layout,
R.S.Puram, Coimbatore District – 641 002
94/1A, 94/9A & 94/10A, Pachapalayam & Sulur
1.45.0 Subject area Precise area
communication
P8
Thiru.M.Anandha Prabhu
S/o. Marimuthu,
No. 3/226A, Karachery, Kinathukadavu,
Coimbatore – 641 201
90/3A, 3B, 91/1B1,
1B2,1B3, 1C, 2A & 91/2B, Pachapalayam & Sulur
1.41.5
Obtained ToR Vide
Lr.No.SEIAA-
TN/F.No.8631/SEAC/ToR-
1026/2021 Dated: 26.08.2021
P9
Thiru.A.Palanisamy
S/o. Appachi Gounder,
Near Idumban Kovil, Thekani Via,
Pachapalayam, Sulur Taluk,
Coimbatore District – 641 201
85/2B(Part), Pachapalayam
& Sulur 1.32.0 Precise area communicated
P10
Thiru.C.Palanisamy,
3/84, Periyakuli Post,
Karachery, Coimbatore – 641 201
82/2A(P) & 80/2B, Pachapalayam & Sulur
1.75.5 Application Processed
P11
Thiru.B.Kandasamy Gounder,
S/o. Arusamy Gounder,
Periya Thottam, Periyakuli Post,
Karachery, Coimbatore – 641 201
349/3(P), Pachapalayam &
Sulur 0.44.0 Application Processed
P12
Thiru.M.Visuvanathan
S/o. Myilsamy Gounder,
West Thottam, Karachery,
Chettipalayam (via), Coimbatore
360/1A5, 360/1A6, Arasampalayam &
Kinathukadavu
1.00.5 Precise area communicated
P13
Thiru.M.Loganathan
S/o. Myilsamy Gounder,
West Thottam, Karachery,
Chettipalayam (via), Coimbatore
360/1A1(P), 360/1A2(P),
360/1A3, Arasampalayam
& Kinathukadavu
0.78.5 Application Processed

Thiru.V.Manikandan Rough Stone and Gravel Quarry Chapter - 7
Geo Exploration and Mining Solutions 112 | P a g e
TOTAL 18.13.0 Ha
EXISTING QUARRIES
CODE Name of the Proponent and Address S.F.Nos Extent in Ha Lease Period
E1 Thiru.M.Rajamani 361/1A & 362/1 0.99.0 01.06.2016 to 31.05.2021
E2 Thiru.K.Ravikumar 355/2A(P), 355/2C(P) &
355/2D1(P) 1.93.5 02.06.2016 to 01.06.2021
E3 Thiru.A.Dharmaraj 94/2C 0.46.0 15.09.2016 to 14.09.2021
E4 Thiru.C.Ganesan 151/1E(P) 1.58.0 15.09.2016 to 14.09.2021
E5 Thiru.T.Pushparaj 90/4, 90/1D, 90/1C &
90/2D 1.14.0 17.09.2016 to 16.09.2021
E6 Thiru.M.Sundarraj 92/1 1.14.5 17.09.2016 to 16.09.2021
E7 Tmt.C.Maragatham 92/3, 93/4, 93/1A, 93/1B,
93/2A, 110/3 & 110/4 5.98.0 17.09.2016 to 16.09.2021
E8 Thiru.V.Somasundaram 360/1B(P) & 360/1C(P) 0.90.0 17.09.2026 to 16.09.2021
E9 Thiru.S.Kalimuthu 364 3.85.5 17.09.2016 to 16.09.2021
E10 Thiru.V.Ganapathy Gounder 89/2(P) 1.54.0 23.09.2016 to 22.09.2021
E11 Thiru.V.Mohandass 82/3 & 80/1C1 3.24.5 07.03.2017 to 06.03.2022
E12 Tvl.KNR Construction Pvt Ltd 89/1 & 89/2(P) 1.28.8 01.08.2017 to 31.07.2022
E13 Thiru.S.Arunachalam 83/1C1A 1.33.0 13.04.2018 to 12.04.2023
E14 Thiru.R.Chinnasamy 83/1A(P) & 83/2(P) 1.73.0 13.04.2018 to 12.04.2023
E15 Thiru.R.Senthilkumar 94/6B, 94/7(P), 94/12,
94/13 & 94/1/ 2.07.0 13.04.2018 to 12.04.2023
E16 Thiru.S.Ganesan 94/4, 94/6A & 94/8A 1.43.5 13.04.2018 to 12.04.2024
E17 Thiru.A.Thanikasalam 101/2 1.21.5 25.01.2019 to 24.01.2024
TOTAL 31.83.8Ha
TOTAL CLUSTER EXTENT 49.96.8 Ha
Note:-
• Cluster area is calculated as per MoEF & CC Notification – S.O. 2269 (E) Dated: 01.07.2016
As per above notification S.O.2269(E) dated : 01.07.2016 in para (b) in Appendix XI,- (ii)(5): The lease not
operative for three years or more and leases which have got environmental clearance as on 15th January, 2016
shall not be counted for calculating the area of cluster, but shall be included in the Environment Management
Plan and the Regional Environmental Management Plan”
TABLE 7.4: SALIENT FEATURES OF THE PROPOSED PROJECTS IN CLUSTER
SALIENT FEATURES OF PROPOSAL “P1”
Name of the Mine Thiru. V. Manikandan Rough stone and Gravel quarry
Land Type Patta land - Patta no: 1787 & 1443
S.F. No. 869/1 & 869/2
Extent 2.57.5 Ha
Previous quarry details It is a fresh lease area that has not underwent quarrying.
Existing pit dimension -
Proposed depth 42m (D) BGL
Geological Reserves Rough Stone Gravel
9,24,000 m3 46,200 m3
Mineable Reserves Rough Stone Gravel
3,64,920 m3 34,746 m3
Mining Plan Period / Lease Period 5 years
Ultimate Pit Dimension 140m (L) x 127m (W) x 42m (D) BGL
Toposheet No 58-F/01
Latitude 10052’37.74” N to 10052’46.68” N
Longitude 77002’21.47”E to 77002’26.81”E
Water Level 50 to 55m BGL
Machinery Jack Hammer 6
Compressor 2
Hydraulic Excavator 2
Tippers 4

Thiru.V.Manikandan Rough Stone and Gravel Quarry Chapter - 7
Geo Exploration and Mining Solutions 113 | P a g e
Blasting Usage of Slurry Explosive with MSD detonators
Manpower Deployment 31 Nos
Total Project Cost
Project Cost Rs. 99,31,500/-
EMP Cost Rs.3,80,000/-
Total Rs.1,03,11,500/-
CER cost (2.0%) Rs.2,06,200/-
SALIENT FEATURES OF PROPOSAL “P2”
Name of the Mine Thiru. K.Paramasivam Rough Stone & Gravel Quarry
Land Type Patta land vide patta no:885 & 280
S.F. Nos 351/2G & 351/2H
Extent 1.86.0 ha
Proposed depth of mining 39m bgl
Geological Resources in m3 Rough Stone Weathered Gravel Topsoil
6,23,000 m3 53,400 m3 17,800m3
Mineable Reserves Rough Stone Weathered Gravel Topsoil
1,73,705 m3 38,637m3 12,879
Mining Plan Period / Lease Period 5 Years
Ultimate Pit Dimension 163 m (L) * 85 m(W) * 39 m (D) BGL
Toposheet No 58-F/01
Latitude between 10052’37.12”N to 10053’44.07” N
Longitude between 77003’11.54”E to 77003’16.83”E
Highest Elevation 386m AMSL
Machinery proposed
Jack Hammer 4
Compressor 1
Excavator with Bucket and
Rock Breaker 1
Tippers 2
Blasting Usage of Slurry Explosive with MSD detonators
Manpower Deployment 18 Nos
Total Project Cost
Project cost Rs 46,65,700/-
EMP Cost Rs 3,80,000/-
Total Rs 50,45,700/-
CER cost (2.0%) Rs.1,01,300/-
SALIENT FEATURES OF PROPOSAL “P3”
Name of the Mine Thiru. R.Nataraj Rough Stone & Gravel Quarry
Land Type Patta land vide patta no: 1411
S.F. Nos 90/2(Part) and 91/1A(P)
Extent 1.34.5Ha
Previous quarry operation details Operated by Thiru. C.Nataraj
S.F.Nos: 89/5, 90/2(P) & 91/1A
Rc.No.2749/2005/MM-2 dated 25.03.2005
Lease period 14.04.2005
Existing pit dimensions 65m (L) x 48m (W) x 12m(D)
Geological Reserves Rough Stone Gravel
4,03,500 m3 26,900 m3
Mineable Reserves Rough Stone Gravel
1,53,750 m3 15,580 m3
Mining Plan Period / Lease Period 5 Years
Ultimate Pit Dimension 169m (L) x 73m (W) x 32m BGL (D)
Toposheet No 58-F/01
Latitude 10052’49.45”N to 10052’55.57” N
Longitude 77002’38.33”E to 77002’43.22”E
Machinery proposed
Jack Hammer 4
Compressor 1
Excavator with Bucket and Rock Breaker 1
Tippers 2
Blasting Usage of Slurry Explosive with MSD detonators
Manpower Deployment 20 Nos
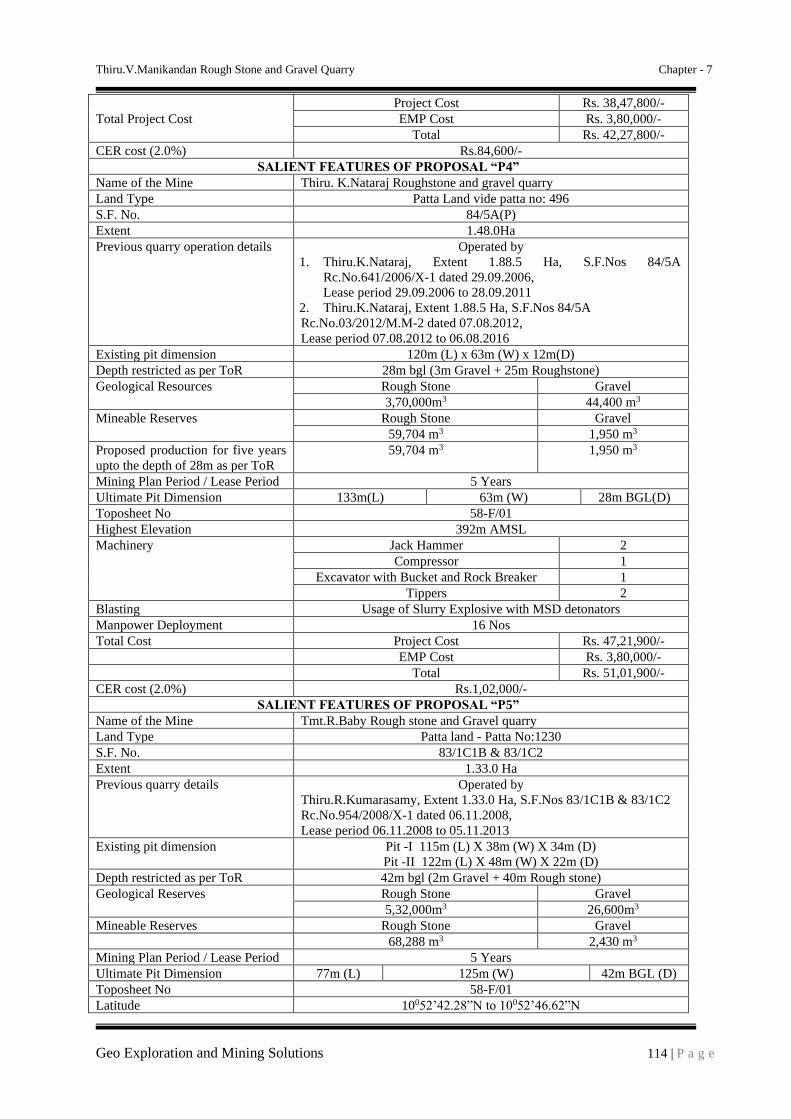
Thiru.V.Manikandan Rough Stone and Gravel Quarry Chapter - 7
Geo Exploration and Mining Solutions 114 | P a g e
Total Project Cost
Project Cost Rs. 38,47,800/-
EMP Cost Rs. 3,80,000/-
Total Rs. 42,27,800/-
CER cost (2.0%) Rs.84,600/-
SALIENT FEATURES OF PROPOSAL “P4”
Name of the Mine Thiru. K.Nataraj Roughstone and gravel quarry
Land Type Patta Land vide patta no: 496
S.F. No. 84/5A(P)
Extent 1.48.0Ha
Previous quarry operation details Operated by
1. Thiru.K.Nataraj, Extent 1.88.5 Ha, S.F.Nos 84/5A
Rc.No.641/2006/X-1 dated 29.09.2006,
Lease period 29.09.2006 to 28.09.2011
2. Thiru.K.Nataraj, Extent 1.88.5 Ha, S.F.Nos 84/5A
Rc.No.03/2012/M.M-2 dated 07.08.2012,
Lease period 07.08.2012 to 06.08.2016
Existing pit dimension 120m (L) x 63m (W) x 12m(D)
Depth restricted as per ToR 28m bgl (3m Gravel + 25m Roughstone)
Geological Resources Rough Stone Gravel
3,70,000m3 44,400 m3
Mineable Reserves Rough Stone Gravel
59,704 m3 1,950 m3
Proposed production for five years
upto the depth of 28m as per ToR
59,704 m3 1,950 m3
Mining Plan Period / Lease Period 5 Years
Ultimate Pit Dimension 133m(L) 63m (W) 28m BGL(D)
Toposheet No 58-F/01
Highest Elevation 392m AMSL
Machinery Jack Hammer 2
Compressor 1
Excavator with Bucket and Rock Breaker 1
Tippers 2
Blasting Usage of Slurry Explosive with MSD detonators
Manpower Deployment 16 Nos
Total Cost Project Cost Rs. 47,21,900/-
EMP Cost Rs. 3,80,000/-
Total Rs. 51,01,900/-
CER cost (2.0%) Rs.1,02,000/-
SALIENT FEATURES OF PROPOSAL “P5”
Name of the Mine Tmt.R.Baby Rough stone and Gravel quarry
Land Type Patta land - Patta No:1230
S.F. No. 83/1C1B & 83/1C2
Extent 1.33.0 Ha
Previous quarry details Operated by
Thiru.R.Kumarasamy, Extent 1.33.0 Ha, S.F.Nos 83/1C1B & 83/1C2
Rc.No.954/2008/X-1 dated 06.11.2008,
Lease period 06.11.2008 to 05.11.2013
Existing pit dimension Pit -I 115m (L) X 38m (W) X 34m (D)
Pit -II 122m (L) X 48m (W) X 22m (D)
Depth restricted as per ToR 42m bgl (2m Gravel + 40m Rough stone)
Geological Reserves Rough Stone Gravel
5,32,000m3 26,600m3
Mineable Reserves Rough Stone Gravel
68,288 m3 2,430 m3
Mining Plan Period / Lease Period 5 Years
Ultimate Pit Dimension 77m (L) 125m (W) 42m BGL (D)
Toposheet No 58-F/01
Latitude 10052’42.28”N to 10052’46.62”N

Thiru.V.Manikandan Rough Stone and Gravel Quarry Chapter - 7
Geo Exploration and Mining Solutions 115 | P a g e
Longitude 77002’50.93”E to 77002’56.53”E
Water Level 55 to 60m BGL
Machinery Jack Hammer 3
Compressor 1
Excavator with Bucket and Rock Breaker 1
Tippers 2
Blasting Usage of Slurry Explosive with MSD detonators
Manpower Deployment 19 Nos
Total Project Cost
Project Cost Rs. 43,50,600/-
EMP Cost Rs. 3,80,000/-
Total Rs. 47,30,600/-
CER cost (2.0%) Rs.94,600/-
SALIENT FEATURES OF PROPOSAL “P6”
Name of the Mine Thiru. M. Ramasamy Rough stone and Gravel quarry
Land Type Patta land - Patta no: 1087 & 1088
S.F. No. 80/1E1, 80/1E2 & 80/1E4
Extent 1.37.0 Ha
Previous quarry details Operated by
Thiru.R.Ramasamy, Extent 1.37.0 Ha, S.F.Nos 80/1E1, 80/1E2 &
80/1E4
Rc.No.846/2011/MM-2 dated 11.07.2012,
Lease period 11.07.2012 to 10.07.2017
Existing pit dimension Pit -I 16m (L) X 16m (W) X 3m (D)
Pit -II 47m (L) X 60m (W) X 4m (D)
Pit -III 20m (L) X 54m (W) X 17m (D)
Proposed depth 33m bgl (3m Gravel + 30m Rough stone)
Geological Reserves Rough Stone Gravel
4,21,324 m3 16,854 m3
Mineable Reserves Rough Stone Gravel
71,510m3 6,477 m3
Mining Plan Period / Lease Period 5 Years
Ultimate Pit Dimension I 67m (L) 60m (W) 33m BGL (D)
II 42m (L) 70m (W) 18 BGL (D)
Toposheet No 58-F/01
Latitude 10052’50.73”N to 10052’56.22”N
Longitude 77003’06.33”E to 77003’10.97”E
Water Level 65 to 70m BGL
Machinery Jack Hammer 4
Compressor 1
Hydraulic Excavator 1
Tippers 2
Blasting Usage of Slurry Explosive with MSD detonators
Manpower Deployment 20 Nos
Total Project Cost
Project Cost Rs. 34,74,500/-
EMP Cost Rs. 3,80,000/-
Total Rs. 38,54,500/-
CER cost (2.0%) Rs.77,500/-
SALIENT FEATURES OF PROPOSAL “P7”
Name of the Mine Thiru. K.M.Subramaniayan Rough stone quarry
Land Type Patta land - Patta no: 318
S.F. No. 94/1A, 94/9A & 94/10A
Extent 1.45.0 Ha
Previous quarry details Operated by
Tmt.S.Gokhilamani, Extent 2.98.0 Ha,
S.F.Nos 94/1A, 2A, 3, 8B, 9A & 10A
Rc.No.862/2012/MM-2 dated 28.07.2012,
Lease period 28.07.2012 to 27.07.2016 (Four Years)
Existing pit dimension 237m (L) X 44m (W) X 2m (D)
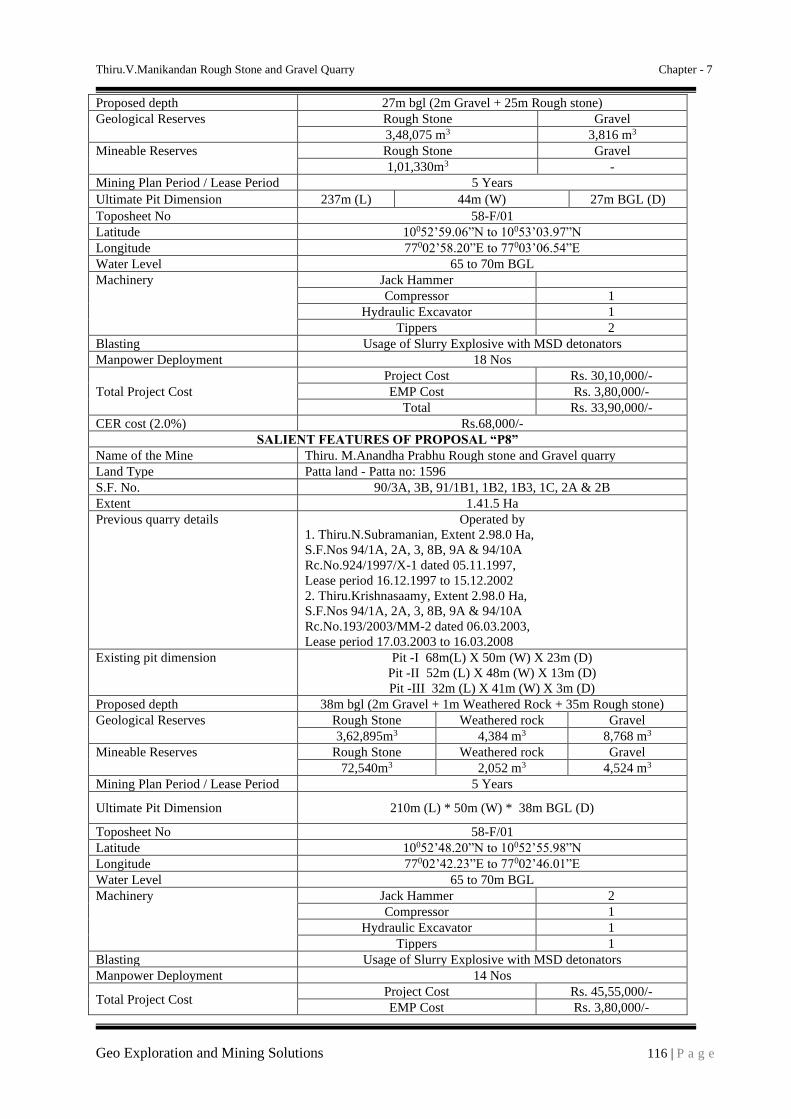
Thiru.V.Manikandan Rough Stone and Gravel Quarry Chapter - 7
Geo Exploration and Mining Solutions 116 | P a g e
Proposed depth 27m bgl (2m Gravel + 25m Rough stone)
Geological Reserves Rough Stone Gravel
3,48,075 m3 3,816 m3
Mineable Reserves Rough Stone Gravel
1,01,330m3 -
Mining Plan Period / Lease Period 5 Years
Ultimate Pit Dimension 237m (L) 44m (W) 27m BGL (D)
Toposheet No 58-F/01
Latitude 10052’59.06”N to 10053’03.97”N
Longitude 77002’58.20”E to 77003’06.54”E
Water Level 65 to 70m BGL
Machinery Jack Hammer
Compressor 1
Hydraulic Excavator 1
Tippers 2
Blasting Usage of Slurry Explosive with MSD detonators
Manpower Deployment 18 Nos
Total Project Cost
Project Cost Rs. 30,10,000/-
EMP Cost Rs. 3,80,000/-
Total Rs. 33,90,000/-
CER cost (2.0%) Rs.68,000/-
SALIENT FEATURES OF PROPOSAL “P8”
Name of the Mine Thiru. M.Anandha Prabhu Rough stone and Gravel quarry
Land Type Patta land - Patta no: 1596
S.F. No. 90/3A, 3B, 91/1B1, 1B2, 1B3, 1C, 2A & 2B
Extent 1.41.5 Ha
Previous quarry details Operated by
1. Thiru.N.Subramanian, Extent 2.98.0 Ha,
S.F.Nos 94/1A, 2A, 3, 8B, 9A & 94/10A
Rc.No.924/1997/X-1 dated 05.11.1997,
Lease period 16.12.1997 to 15.12.2002
2. Thiru.Krishnasaamy, Extent 2.98.0 Ha,
S.F.Nos 94/1A, 2A, 3, 8B, 9A & 94/10A
Rc.No.193/2003/MM-2 dated 06.03.2003,
Lease period 17.03.2003 to 16.03.2008
Existing pit dimension Pit -I 68m(L) X 50m (W) X 23m (D)
Pit -II 52m (L) X 48m (W) X 13m (D)
Pit -III 32m (L) X 41m (W) X 3m (D)
Proposed depth 38m bgl (2m Gravel + 1m Weathered Rock + 35m Rough stone)
Geological Reserves Rough Stone Weathered rock Gravel
3,62,895m3 4,384 m3 8,768 m3
Mineable Reserves Rough Stone Weathered rock Gravel
72,540m3 2,052 m3 4,524 m3
Mining Plan Period / Lease Period 5 Years
Ultimate Pit Dimension 210m (L) * 50m (W) * 38m BGL (D)
Toposheet No 58-F/01
Latitude 10052’48.20”N to 10052’55.98”N
Longitude 77002’42.23”E to 77002’46.01”E
Water Level 65 to 70m BGL
Machinery Jack Hammer 2
Compressor 1
Hydraulic Excavator 1
Tippers 1
Blasting Usage of Slurry Explosive with MSD detonators
Manpower Deployment 14 Nos
Total Project Cost Project Cost Rs. 45,55,000/-
EMP Cost Rs. 3,80,000/-
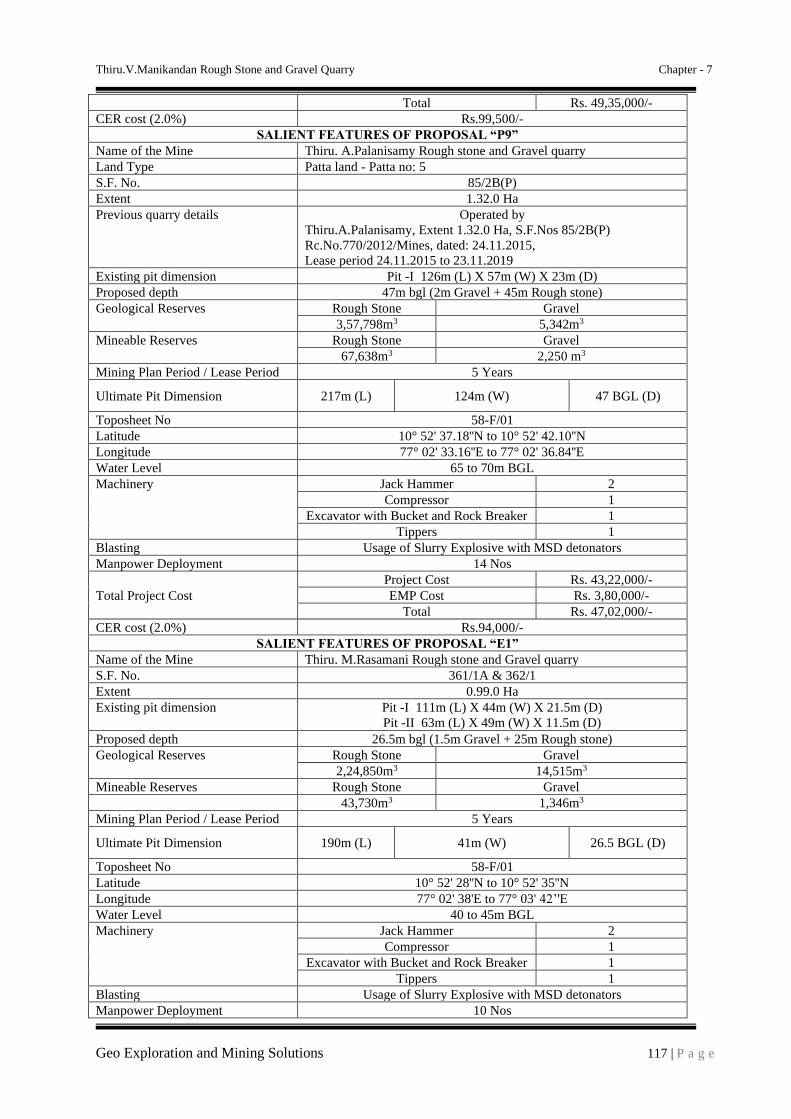
Thiru.V.Manikandan Rough Stone and Gravel Quarry Chapter - 7
Geo Exploration and Mining Solutions 117 | P a g e
Total Rs. 49,35,000/-
CER cost (2.0%) Rs.99,500/-
SALIENT FEATURES OF PROPOSAL “P9”
Name of the Mine Thiru. A.Palanisamy Rough stone and Gravel quarry
Land Type Patta land - Patta no: 5
S.F. No. 85/2B(P)
Extent 1.32.0 Ha
Previous quarry details Operated by
Thiru.A.Palanisamy, Extent 1.32.0 Ha, S.F.Nos 85/2B(P)
Rc.No.770/2012/Mines, dated: 24.11.2015,
Lease period 24.11.2015 to 23.11.2019
Existing pit dimension Pit -I 126m (L) X 57m (W) X 23m (D)
Proposed depth 47m bgl (2m Gravel + 45m Rough stone)
Geological Reserves Rough Stone Gravel
3,57,798m3 5,342m3
Mineable Reserves Rough Stone Gravel
67,638m3 2,250 m3
Mining Plan Period / Lease Period 5 Years
Ultimate Pit Dimension 217m (L) 124m (W) 47 BGL (D)
Toposheet No 58-F/01
Latitude 10° 52' 37.18''N to 10° 52' 42.10''N
Longitude 77° 02' 33.16''E to 77° 02' 36.84''E
Water Level 65 to 70m BGL
Machinery Jack Hammer 2
Compressor 1
Excavator with Bucket and Rock Breaker 1
Tippers 1
Blasting Usage of Slurry Explosive with MSD detonators
Manpower Deployment 14 Nos
Total Project Cost
Project Cost Rs. 43,22,000/-
EMP Cost Rs. 3,80,000/-
Total Rs. 47,02,000/-
CER cost (2.0%) Rs.94,000/-
SALIENT FEATURES OF PROPOSAL “E1”
Name of the Mine Thiru. M.Rasamani Rough stone and Gravel quarry
S.F. No. 361/1A & 362/1
Extent 0.99.0 Ha
Existing pit dimension Pit -I 111m (L) X 44m (W) X 21.5m (D)
Pit -II 63m (L) X 49m (W) X 11.5m (D)
Proposed depth 26.5m bgl (1.5m Gravel + 25m Rough stone)
Geological Reserves Rough Stone Gravel
2,24,850m3 14,515m3
Mineable Reserves Rough Stone Gravel
43,730m3 1,346m3
Mining Plan Period / Lease Period 5 Years
Ultimate Pit Dimension 190m (L) 41m (W) 26.5 BGL (D)
Toposheet No 58-F/01
Latitude 10° 52' 28''N to 10° 52' 35''N
Longitude 77° 02' 38'E to 77° 03' 42’'E
Water Level 40 to 45m BGL
Machinery Jack Hammer 2
Compressor 1
Excavator with Bucket and Rock Breaker 1
Tippers 1
Blasting Usage of Slurry Explosive with MSD detonators
Manpower Deployment 10 Nos

Thiru.V.Manikandan Rough Stone and Gravel Quarry Chapter - 7
Geo Exploration and Mining Solutions 118 | P a g e
Total Project Cost Project Cost Rs. 31,77,000/-
CER cost (2.0%) Rs. 63,540/-
SALIENT FEATURES OF PROPOSAL “E2”
Name of the Mine Thiru. K.Ravikumar Rough stone and Gravel quarry
S.F. No. 355/2A(P), 2C(P) & 2D(P)
Extent 1.93.5 Ha
Existing pit dimension 104m (L) X 118m (W) X 19m (D)
Proposed depth 42m bgl (2m Gravel + 40m Rough stone)
Geological Reserves Rough Stone Gravel
6,71,040m3 39,708m3
Mineable Reserves Rough Stone Gravel
1,42,980m3 8,136m3
Mining Plan Period / Lease Period 5 Years
Ultimate Pit Dimension 212m (L) 98m (W) 42 BGL (D)
Toposheet No 58-F/01
Latitude 10° 52' 36''N to 10° 52' 46''N
Longitude 77° 02' 55'E to 77° 03' 60’'E
Water Level 40 to 45m BGL
Machinery Jack Hammer 2
Compressor 1
Excavator with Bucket and Rock Breaker 1
Tippers 1
Blasting Usage of Slurry Explosive with MSD detonators
Manpower Deployment 11 Nos
Total Project Cost Project Cost Rs. 59,85,000/-
CER cost (2.0%) Rs. 1,19,700/-
SALIENT FEATURES OF PROPOSAL “E3”
Name of the Mine Thiru. A.Dharmaraj Rough stone and Gravel quarry
S.F. No. 94/2C
Extent 0.46.0 Ha
Existing pit dimension -
Proposed depth 17m bgl (2m Gravel + 15m Rough stone)
Geological Reserves Rough Stone Gravel
68,850m3 9,180m3
Mineable Reserves Rough Stone Gravel
16,390m3 4,964m3
Mining Plan Period / Lease Period 5 Years
Ultimate Pit Dimension 73m (L) 34m (W) 17 BGL (D)
Toposheet No 58-F/01
Latitude 10° 52' 57.32''N to 10° 52' 59.65''N
Longitude 77° 02' 58.71'E to 77° 03'01.98’'E
Water Level 40 to 45m BGL
Machinery Jack Hammer 2
Compressor 1
Excavator with Bucket and Rock Breaker 1
Tippers 1
Blasting Usage of Slurry Explosive with MSD detonators
Manpower Deployment 13 Nos
Total Project Cost Project Cost Rs. 34,36,000/-
CER cost (2.0%) Rs. 68,720/-
SALIENT FEATURES OF PROPOSAL “E4”
Name of the Mine Thiru. C.Ganesan Rough stone quarry
S.F. No. 151/1E(Part)
Extent 1.58.0 Ha
Existing pit dimension 142m x 66m x 16m(d)
Proposed depth 16m bgl (1m topsoil + 15m Rough stone)
Geological Reserves Rough Stone Topsoil
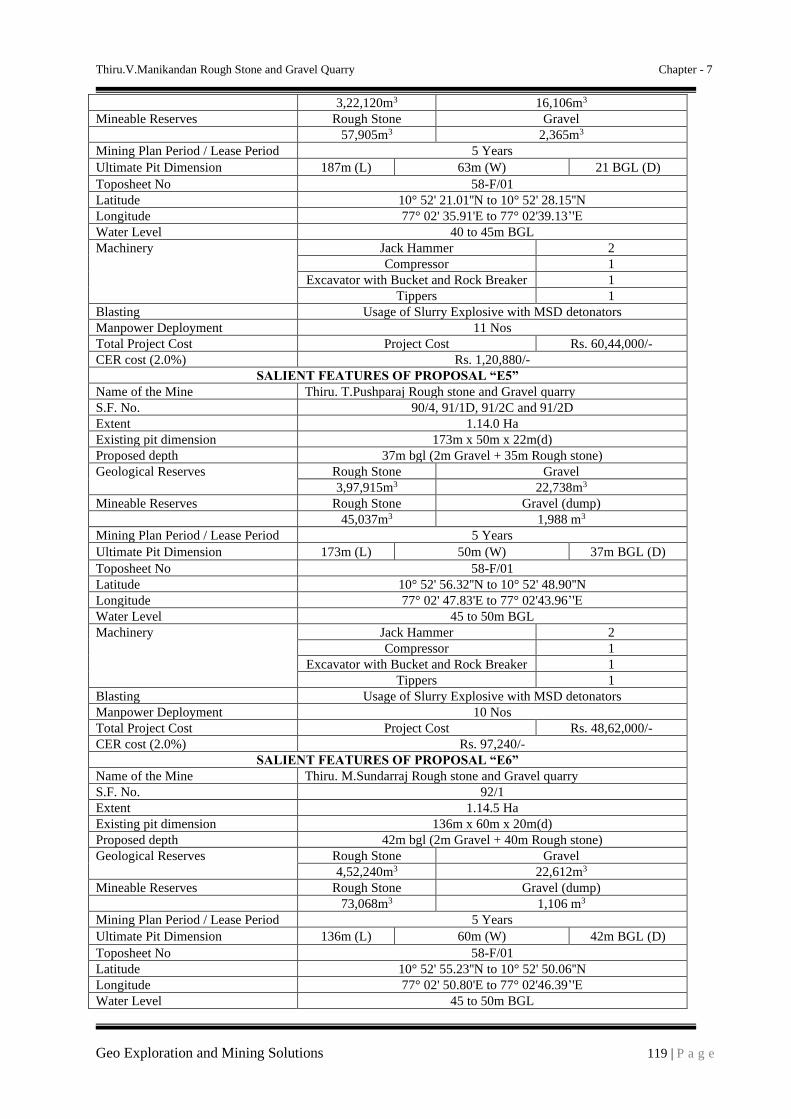
Thiru.V.Manikandan Rough Stone and Gravel Quarry Chapter - 7
Geo Exploration and Mining Solutions 119 | P a g e
3,22,120m3 16,106m3
Mineable Reserves Rough Stone Gravel
57,905m3 2,365m3
Mining Plan Period / Lease Period 5 Years
Ultimate Pit Dimension 187m (L) 63m (W) 21 BGL (D)
Toposheet No 58-F/01
Latitude 10° 52' 21.01''N to 10° 52' 28.15''N
Longitude 77° 02' 35.91'E to 77° 02'39.13’'E
Water Level 40 to 45m BGL
Machinery Jack Hammer 2
Compressor 1
Excavator with Bucket and Rock Breaker 1
Tippers 1
Blasting Usage of Slurry Explosive with MSD detonators
Manpower Deployment 11 Nos
Total Project Cost Project Cost Rs. 60,44,000/-
CER cost (2.0%) Rs. 1,20,880/-
SALIENT FEATURES OF PROPOSAL “E5”
Name of the Mine Thiru. T.Pushparaj Rough stone and Gravel quarry
S.F. No. 90/4, 91/1D, 91/2C and 91/2D
Extent 1.14.0 Ha
Existing pit dimension 173m x 50m x 22m(d)
Proposed depth 37m bgl (2m Gravel + 35m Rough stone)
Geological Reserves Rough Stone Gravel
3,97,915m3 22,738m3
Mineable Reserves Rough Stone Gravel (dump)
45,037m3 1,988 m3
Mining Plan Period / Lease Period 5 Years
Ultimate Pit Dimension 173m (L) 50m (W) 37m BGL (D)
Toposheet No 58-F/01
Latitude 10° 52' 56.32''N to 10° 52' 48.90''N
Longitude 77° 02' 47.83'E to 77° 02'43.96’'E
Water Level 45 to 50m BGL
Machinery Jack Hammer 2
Compressor 1
Excavator with Bucket and Rock Breaker 1
Tippers 1
Blasting Usage of Slurry Explosive with MSD detonators
Manpower Deployment 10 Nos
Total Project Cost Project Cost Rs. 48,62,000/-
CER cost (2.0%) Rs. 97,240/-
SALIENT FEATURES OF PROPOSAL “E6”
Name of the Mine Thiru. M.Sundarraj Rough stone and Gravel quarry
S.F. No. 92/1
Extent 1.14.5 Ha
Existing pit dimension 136m x 60m x 20m(d)
Proposed depth 42m bgl (2m Gravel + 40m Rough stone)
Geological Reserves Rough Stone Gravel
4,52,240m3 22,612m3
Mineable Reserves Rough Stone Gravel (dump)
73,068m3 1,106 m3
Mining Plan Period / Lease Period 5 Years
Ultimate Pit Dimension 136m (L) 60m (W) 42m BGL (D)
Toposheet No 58-F/01
Latitude 10° 52' 55.23''N to 10° 52' 50.06''N
Longitude 77° 02' 50.80'E to 77° 02'46.39’'E
Water Level 45 to 50m BGL

Thiru.V.Manikandan Rough Stone and Gravel Quarry Chapter - 7
Geo Exploration and Mining Solutions 120 | P a g e
Machinery Jack Hammer 2
Compressor 1
Excavator with Bucket and Rock Breaker 1
Tippers 1
Blasting Usage of Slurry Explosive with MSD detonators
Manpower Deployment 10 Nos
Total Project Cost Project Cost Rs. 57,43,500/-
CER cost (2.0%) Rs. 1,14,870/-
SALIENT FEATURES OF PROPOSAL “E7”
Name of the Mine Thiru. C.Maragatham Rough stone and Gravel quarry
S.F. No. 92/3, 92/4, 93/1A, 93/1B
Extent 5.98.0 Ha
Existing pit dimension -
Proposed depth 12m bgl (2m Gravel + 10m Rough stone)
Geological Reserves Rough Stone Gravel
9,01,620m3 1,20,216m3
Mineable Reserves Rough Stone Gravel (dump)
1,97,945m3 27,974 m3
Yearwise production 90,415m3 27,974 m3
Mining Plan Period / Lease Period 5 Years
Ultimate Pit Dimension 267m (L) 229m (W) 17m BGL (D)
Toposheet No 58-F/01
Latitude 10° 52' 50.57''N to 10° 53' 00.84''N
Longitude 77° 02' 47.67'E to 77° 02'58.64’'E
Water Level 45 to 50m BGL
Machinery Jack Hammer 2
Compressor 1
Excavator with Bucket and Rock Breaker 1
Tippers 1
Blasting Usage of Slurry Explosive with MSD detonators
Manpower Deployment 10 Nos
Total Project Cost Project Cost Rs. 74,24,000/-
CER cost (2.0%) Rs. 1,48,480/-
SALIENT FEATURES OF PROPOSAL “E8”
Name of the Mine Thiru. V.Somasundaram Rough stone and Gravel quarry
S.F. No. 360/1B(P) & 360/1G(P)
Extent 0.90.0 Ha
Existing pit dimension Block – I =324m (L) X 27m (W) X 2m (D)
Block – II =106m (L) X 50m (W) X 12m (D)
Proposed depth 28m bgl (3m Gravel + 25m Rough stone)
Geological Reserves Rough Stone Gravel
1,96,700m3 20,695m3
Mineable Reserves Rough Stone Gravel (dump)
24,410m3 105 m3
Yearwise production 24,410m3 105 m3
Mining Plan Period / Lease Period 5 Years
Ultimate Pit Dimension Block – I =27m (L) X 32m (W) X 12m (D)
Block – II =112m (L) X 50m (W) X 28m (D)
Toposheet No 58-F/01
Latitude 10° 52'32.84''N to 10° 52' 39.37''N
Longitude 77° 02' 50.61'E to 77° 02'55.19’'E
Water Level 45 to 50m BGL
Machinery Jack Hammer 2
Compressor 1
Excavator with Bucket and Rock Breaker 1
Tippers 1
Blasting Usage of Slurry Explosive with MSD detonators
Manpower Deployment 13 Nos
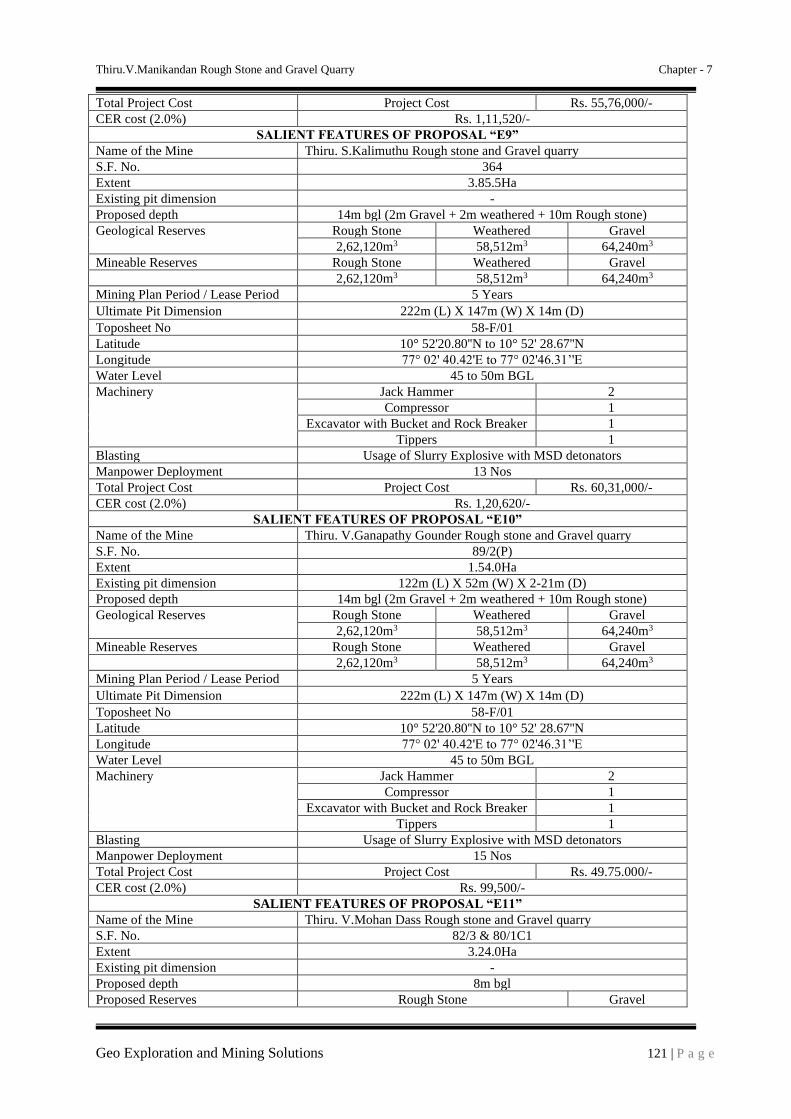
Thiru.V.Manikandan Rough Stone and Gravel Quarry Chapter - 7
Geo Exploration and Mining Solutions 121 | P a g e
Total Project Cost Project Cost Rs. 55,76,000/-
CER cost (2.0%) Rs. 1,11,520/-
SALIENT FEATURES OF PROPOSAL “E9”
Name of the Mine Thiru. S.Kalimuthu Rough stone and Gravel quarry
S.F. No. 364
Extent 3.85.5Ha
Existing pit dimension -
Proposed depth 14m bgl (2m Gravel + 2m weathered + 10m Rough stone)
Geological Reserves Rough Stone Weathered Gravel
2,62,120m3 58,512m3 64,240m3
Mineable Reserves Rough Stone Weathered Gravel
2,62,120m3 58,512m3 64,240m3
Mining Plan Period / Lease Period 5 Years
Ultimate Pit Dimension 222m (L) X 147m (W) X 14m (D)
Toposheet No 58-F/01
Latitude 10° 52'20.80''N to 10° 52' 28.67''N
Longitude 77° 02' 40.42'E to 77° 02'46.31’'E
Water Level 45 to 50m BGL
Machinery Jack Hammer 2
Compressor 1
Excavator with Bucket and Rock Breaker 1
Tippers 1
Blasting Usage of Slurry Explosive with MSD detonators
Manpower Deployment 13 Nos
Total Project Cost Project Cost Rs. 60,31,000/-
CER cost (2.0%) Rs. 1,20,620/-
SALIENT FEATURES OF PROPOSAL “E10”
Name of the Mine Thiru. V.Ganapathy Gounder Rough stone and Gravel quarry
S.F. No. 89/2(P)
Extent 1.54.0Ha
Existing pit dimension 122m (L) X 52m (W) X 2-21m (D)
Proposed depth 14m bgl (2m Gravel + 2m weathered + 10m Rough stone)
Geological Reserves Rough Stone Weathered Gravel
2,62,120m3 58,512m3 64,240m3
Mineable Reserves Rough Stone Weathered Gravel
2,62,120m3 58,512m3 64,240m3
Mining Plan Period / Lease Period 5 Years
Ultimate Pit Dimension 222m (L) X 147m (W) X 14m (D)
Toposheet No 58-F/01
Latitude 10° 52'20.80''N to 10° 52' 28.67''N
Longitude 77° 02' 40.42'E to 77° 02'46.31’'E
Water Level 45 to 50m BGL
Machinery Jack Hammer 2
Compressor 1
Excavator with Bucket and Rock Breaker 1
Tippers 1
Blasting Usage of Slurry Explosive with MSD detonators
Manpower Deployment 15 Nos
Total Project Cost Project Cost Rs. 49.75.000/-
CER cost (2.0%) Rs. 99,500/-
SALIENT FEATURES OF PROPOSAL “E11”
Name of the Mine Thiru. V.Mohan Dass Rough stone and Gravel quarry
S.F. No. 82/3 & 80/1C1
Extent 3.24.0Ha
Existing pit dimension -
Proposed depth 8m bgl
Proposed Reserves Rough Stone Gravel
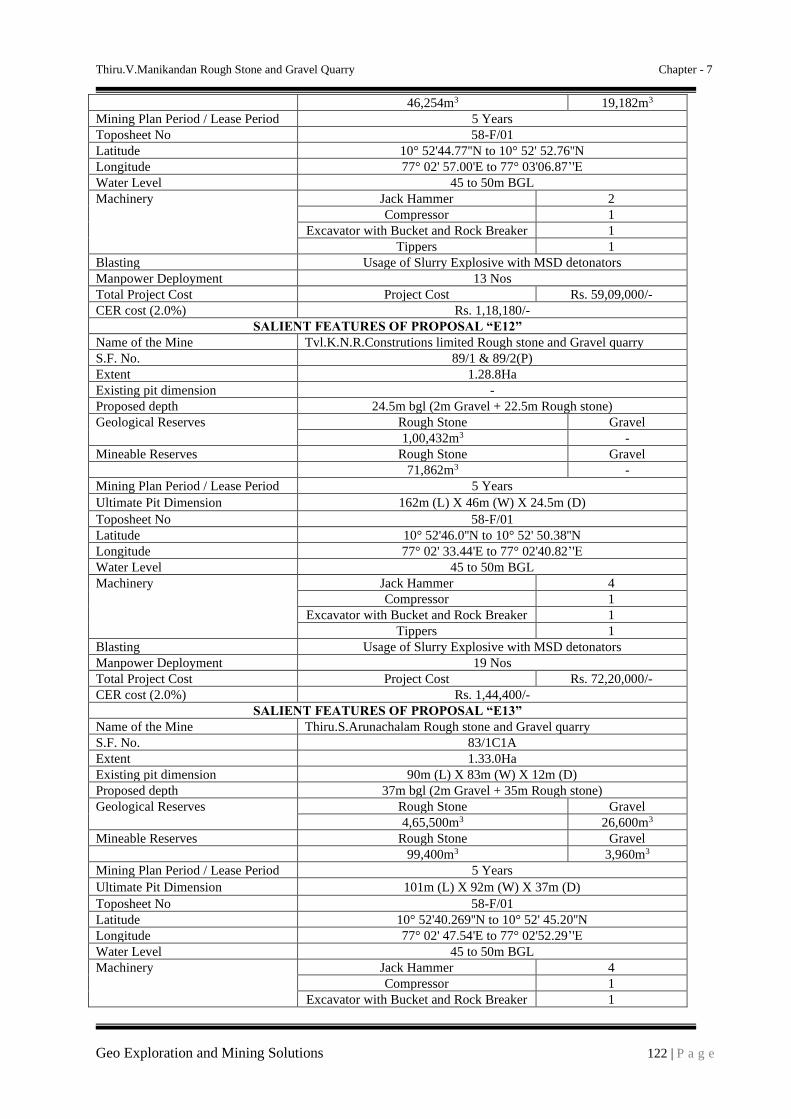
Thiru.V.Manikandan Rough Stone and Gravel Quarry Chapter - 7
Geo Exploration and Mining Solutions 122 | P a g e
46,254m3 19,182m3
Mining Plan Period / Lease Period 5 Years
Toposheet No 58-F/01
Latitude 10° 52'44.77''N to 10° 52' 52.76''N
Longitude 77° 02' 57.00'E to 77° 03'06.87’'E
Water Level 45 to 50m BGL
Machinery Jack Hammer 2
Compressor 1
Excavator with Bucket and Rock Breaker 1
Tippers 1
Blasting Usage of Slurry Explosive with MSD detonators
Manpower Deployment 13 Nos
Total Project Cost Project Cost Rs. 59,09,000/-
CER cost (2.0%) Rs. 1,18,180/-
SALIENT FEATURES OF PROPOSAL “E12”
Name of the Mine Tvl.K.N.R.Construtions limited Rough stone and Gravel quarry
S.F. No. 89/1 & 89/2(P)
Extent 1.28.8Ha
Existing pit dimension -
Proposed depth 24.5m bgl (2m Gravel + 22.5m Rough stone)
Geological Reserves Rough Stone Gravel
1,00,432m3 -
Mineable Reserves Rough Stone Gravel
71,862m3 -
Mining Plan Period / Lease Period 5 Years
Ultimate Pit Dimension 162m (L) X 46m (W) X 24.5m (D)
Toposheet No 58-F/01
Latitude 10° 52'46.0''N to 10° 52' 50.38''N
Longitude 77° 02' 33.44'E to 77° 02'40.82’'E
Water Level 45 to 50m BGL
Machinery Jack Hammer 4
Compressor 1
Excavator with Bucket and Rock Breaker 1
Tippers 1
Blasting Usage of Slurry Explosive with MSD detonators
Manpower Deployment 19 Nos
Total Project Cost Project Cost Rs. 72,20,000/-
CER cost (2.0%) Rs. 1,44,400/-
SALIENT FEATURES OF PROPOSAL “E13”
Name of the Mine Thiru.S.Arunachalam Rough stone and Gravel quarry
S.F. No. 83/1C1A
Extent 1.33.0Ha
Existing pit dimension 90m (L) X 83m (W) X 12m (D)
Proposed depth 37m bgl (2m Gravel + 35m Rough stone)
Geological Reserves Rough Stone Gravel
4,65,500m3 26,600m3
Mineable Reserves Rough Stone Gravel
99,400m3 3,960m3
Mining Plan Period / Lease Period 5 Years
Ultimate Pit Dimension 101m (L) X 92m (W) X 37m (D)
Toposheet No 58-F/01
Latitude 10° 52'40.269''N to 10° 52' 45.20''N
Longitude 77° 02' 47.54'E to 77° 02'52.29’'E
Water Level 45 to 50m BGL
Machinery Jack Hammer 4
Compressor 1
Excavator with Bucket and Rock Breaker 1

Thiru.V.Manikandan Rough Stone and Gravel Quarry Chapter - 7
Geo Exploration and Mining Solutions 123 | P a g e
Tippers 1
Blasting Usage of Slurry Explosive with MSD detonators
Manpower Deployment 11 Nos
Total Project Cost Project Cost Rs. 38,26,000/-
CER cost (2.0%) Rs. 76,520/-
SALIENT FEATURES OF PROPOSAL “E14”
Name of the Mine Thiru.R.Chinnasamy Rough stone and Gravel quarry
S.F. No. 83/1A(P) & 83/2(P)
Extent 1.73.0Ha
Existing pit dimension Pit-I 131m (L) X 48m (W) X 7m (D)
Pit-II 67m (L) X 80m (W) X 12m (D)
Proposed depth 37m bgl (2m Gravel + 35m Rough stone)
Geological Reserves Rough Stone Gravel
6,05,500m3 34,600m3
Mineable Reserves Rough Stone Gravel
1,08,440m3 -
Mining Plan Period / Lease Period 5 Years
Ultimate Pit Dimension Pit-I 131m (L) X 48m (W) X 27m (D)
Pit-II 67m (L) X 80m (W) X 37m (D)
Toposheet No 58-F/01
Latitude 10° 52'42.95''N to 10° 52' 49.57''N
Longitude 77° 02' 47.40'E to 77° 02'54.89’'E
Water Level 45 to 50m BGL
Machinery Jack Hammer 4
Compressor 1
Excavator with Bucket and Rock Breaker 1
Tippers 1
Blasting Usage of Slurry Explosive with MSD detonators
Manpower Deployment 11 Nos
Total Project Cost Project Cost Rs. 39,06,000/-
CER cost (2.0%) Rs. 78,120/-
SALIENT FEATURES OF PROPOSAL “E15”
Name of the Mine Thiru.R.Senthilkumar Rough stone and Gravel quarry
S.F. No. 94/6B(P), 94/7(P), 94/18(P)
Extent 2.07.0Ha
Existing pit dimension Pit-I 131m (L) X 58m (W) X 12m (D)
Pit-II 91 (L) X 65m (W) X 17m (D)
Proposed depth 17m bgl (2m Gravel + 35m Rough stone)
Geological Reserves Rough Stone Gravel
8,00,038m3 -
Mineable Reserves Rough Stone Gravel
93,500m3 -
Mining Plan Period / Lease Period 5 Years
Ultimate Pit Dimension Pit-I 196m (L) X 90m (W) X 17m (D)
Toposheet No 58-F/01
Latitude 10° 52'52''N to 10° 53' 06''N
Longitude 77° 03' 04'E to 77° 03'10’'E
Water Level 45 to 50m BGL
Machinery Jack Hammer 4
Compressor 1
Excavator with Bucket and Rock Breaker 1
Tippers 1
Blasting Usage of Slurry Explosive with MSD detonators
Manpower Deployment 13 Nos
Total Project Cost Project Cost Rs. 34,10,000/-
CER cost (2.0%) Rs. 68,200/-
SALIENT FEATURES OF PROPOSAL “E16”

Thiru.V.Manikandan Rough Stone and Gravel Quarry Chapter - 7
Geo Exploration and Mining Solutions 124 | P a g e
Name of the Mine Thiru.S.Ganesan Rough stone and Gravel quarry
S.F. No. 94/4, 94/6A & 94/8A
Extent 1.43.5Ha
Existing pit dimension 80m (L) X 30m (W) X 17m (D)
Proposed depth 22m bgl (2m Gravel + 20m Rough stone)
Geological Reserves Rough Stone Gravel
4,36,436m3 -
Mineable Reserves Rough Stone Gravel
70,935m3 7,420m3
Yearwise Production 45,860m3 7,420m3
Mining Plan Period / Lease Period 5 Years
Ultimate Pit Dimension Pit-I 145m (L) X 75m (W) X 22m (D)
Toposheet No NC-43-7 & NC 43-8
Latitude 10'53'01"N to10'52'55"N
Longitude 77"03'01"E to 77'03'05"E
Water Level 45 to 50m BGL
Machinery Jack Hammer 2
Compressor 1
Excavator with Bucket and Rock Breaker 1
Tippers 1
Blasting Usage of Slurry Explosive with MSD detonators
Manpower Deployment 13 Nos
Total Project Cost Project Cost Rs. 30,92,500/-
CER cost (2.0%) Rs. 61,850/-
SALIENT FEATURES OF PROPOSAL “E17”
Name of the Mine Thiru.A.Thanikasalam Rough stone and Gravel quarry
S.F. No. 101/2
Extent 1.21.5Ha
Existing pit dimension Pit- I 45m (L) X 30m (W) X 20m (D)
Pit- II 45m (L) X 35m (W) X 10m (D)
Proposed depth 37.5m bgl (2m Gravel + 0.5m weathered + 35m Rough stone)
Geological Reserves Rough Stone Weathered rock Gravel
4,25,250m3 6,075 m3 24,300m3
Mineable Reserves Rough Stone Gravel Gravel
1,03,420m3 2,968m3 7,420m3
Yearwise Production 45,860m3 7,420m3 12,392m3
Mining Plan Period / Lease Period 5 Years
Ultimate Pit Dimension Pit-I 116m (L) X 83m (W) X 37.5m (D)
Toposheet No 58 F/01
Latitude 10'53'11.51"N to10'53'15.42"N
Longitude 77"03'15.51"E to 77'03'20.23"E
Water Level 45 to 50m BGL
Machinery Jack Hammer 4
Compressor 1
Excavator with Bucket and Rock Breaker 1
Tippers 1
Blasting Usage of Slurry Explosive with MSD detonators
Manpower Deployment 23 Nos
Total Project Cost Project Cost Rs. 50,81,950/-
CER cost (2.0%) Rs. 1,01,639/-
The Cumulative Impact is mainly anticipated due to drilling & blasting and excavation and
transportation activities in all the quarries (proposed and existing) within the cluster and major impact
anticipated is on Air & Noise Environment and Ground Vibrations due to blasting.
Impact on Air Environment –
Calculating the Cumulative Load of Mining within the cluster is as shown in table 7.5 & 7.6
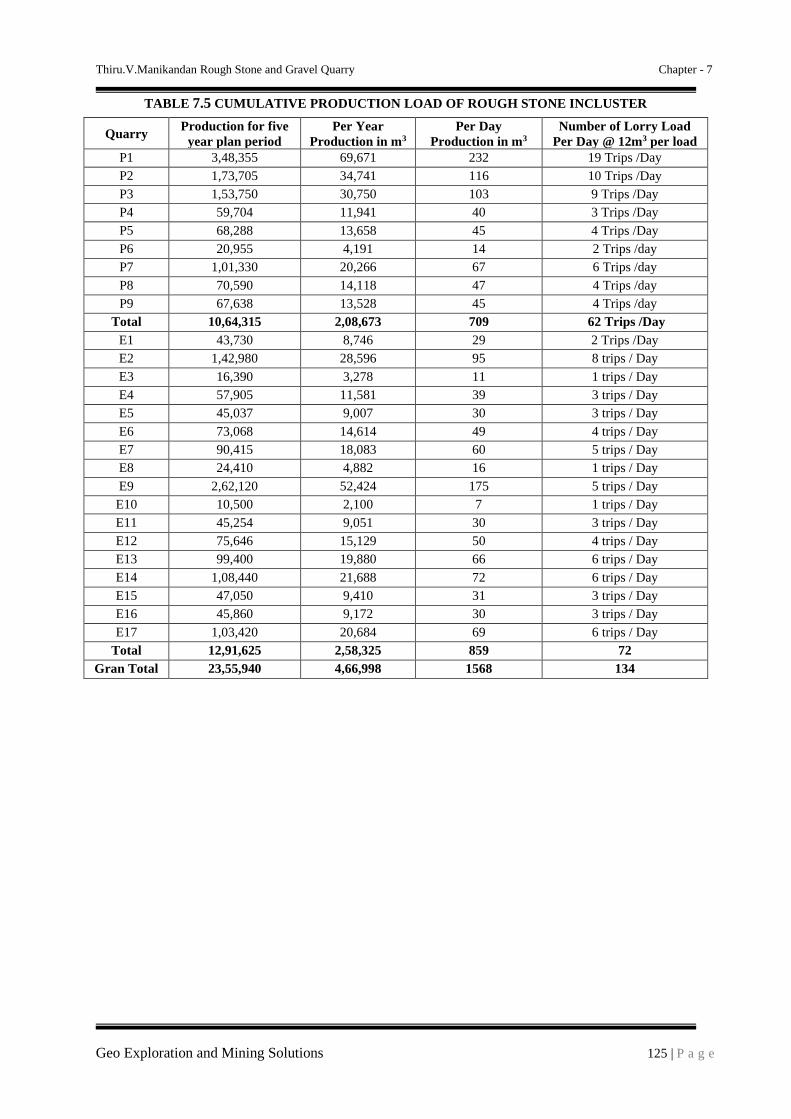
Thiru.V.Manikandan Rough Stone and Gravel Quarry Chapter - 7
Geo Exploration and Mining Solutions 125 | P a g e
TABLE 7.5 CUMULATIVE PRODUCTION LOAD OF ROUGH STONE INCLUSTER
Quarry Production for five
year plan period
Per Year
Production in m3
Per Day
Production in m3
Number of Lorry Load
Per Day @ 12m3 per load
P1 3,48,355 69,671 232 19 Trips /Day
P2 1,73,705 34,741 116 10 Trips /Day
P3 1,53,750 30,750 103 9 Trips /Day
P4 59,704 11,941 40 3 Trips /Day
P5 68,288 13,658 45 4 Trips /Day
P6 20,955 4,191 14 2 Trips /day
P7 1,01,330 20,266 67 6 Trips /day
P8 70,590 14,118 47 4 Trips /day
P9 67,638 13,528 45 4 Trips /day
Total 10,64,315 2,08,673 709 62 Trips /Day
E1 43,730 8,746 29 2 Trips /Day
E2 1,42,980 28,596 95 8 trips / Day
E3 16,390 3,278 11 1 trips / Day
E4 57,905 11,581 39 3 trips / Day
E5 45,037 9,007 30 3 trips / Day
E6 73,068 14,614 49 4 trips / Day
E7 90,415 18,083 60 5 trips / Day
E8 24,410 4,882 16 1 trips / Day
E9 2,62,120 52,424 175 5 trips / Day
E10 10,500 2,100 7 1 trips / Day
E11 45,254 9,051 30 3 trips / Day
E12 75,646 15,129 50 4 trips / Day
E13 99,400 19,880 66 6 trips / Day
E14 1,08,440 21,688 72 6 trips / Day
E15 47,050 9,410 31 3 trips / Day
E16 45,860 9,172 30 3 trips / Day
E17 1,03,420 20,684 69 6 trips / Day
Total 12,91,625 2,58,325 859 72
Gran Total 23,55,940 4,66,998 1568 134

Thiru.V.Manikandan Rough Stone and Gravel Quarry Chapter - 7
Geo Exploration and Mining Solutions 126 | P a g e
TABLE 7.6: CUMULATIVE PRODUCTION OF GRAVEL IN CLUSTER
Quarry Mineable
Reserves in m3
Per Year
Production in m3 Per Day in m3 Number of Lorry Load @ 12m3
per load
P1 34,746 11,582 39 3 Trips /Day, 18- Trips /week
P2 38,637 12,879 43 4 Trips /Day, 24 trips per week
P3 15,580 5,193 17 1 Trips /Day , 6- Trips /week
P4 1,950 650 2 1- Trips /week
P5 2,430 810 3 1- Trips /week
P6 2,850 2,850 10 2- Trips /week
P7 - - - -
P8 6,576 2,192 7 1- Trips /week
P9 2,250 750 3 1- Trips /week
TOTAL 70,273 25,324 85 54 Trips/ week
E1 1346 1346 4 1 Trips\ day
E2 8136 2712 9 1 Trips\ day
E3 4964 4964 16 2 Trips\ day
E4 2365 2365 8 1 Trips\ day
E5 - - - -
E6 - - - -
E7 27974 9325 31 3 Trips\ day
E8 105 105 1 1 Trips\ day
E9 1,22,752 10,917 136 11 Trips\ day
E10 - - - -
E11 19182 6394 21 2 Trips\ day
E12 - - - -
E13 3960 3960 13 1 Trips\ day
E14 3570 3570 12 1 Trips\ day
E15 12012 6,006 20 2 Trips\ day
E16 7420 7420 25 2 Trips\ day
E17 15,360 5120 17 1 Trips\ day
Total 229146 64204 313 24 Trips\ day
Grand
total
2,99,419 89,528 398 78 Trips\ day
Source: Approved Mining plans of the respective projects
Based on the above production quantities the emissions due to various activities in all the 26 mines
includes various activities like ground preparation, excavation, handling and transport of mineral. These
activities have been analysed systematically basing on USEPA-Emission Estimation Technique Manual, for
Mining AP-42, to arrive at possible emissions to the atmosphere and estimated emissions are given in Table 7.7.
TABLE 7.7: EMISSION ESTIMATION FROM CLUSTER
EMISSION ESTIMATION FOR QUARRY “P1”
Estimated Emission Rate for PM10
Activity Source type Value Unit
Drilling Point Source 0.092710688 g/s
Blasting Point Source 0.001656775 g/s
Mineral Loading Point Source 0.043473072 g/s
Haul Road Line Source 0.002494769 g/s/m
Overall Mine Area Source 0.058268850 g/s
Estimated Emission Rate for SO2 Overall Mine Area Source 0.000869972 g/s
Estimated Emission Rate for NOx Overall Mine Area Source 0.000050035 g/s
EMISSION ESTIMATION FOR QUARRY “P2”
Estimated Emission Rate for PM10
Activity Source type Value Unit
Drilling Point Source 0.075668508 g/s
Blasting Point Source 0.000600054 g/s
Mineral Loading Point Source 0.041797098 g/s
Haul Road Line Source 0.00249067 g/s/m
Overall Mine Area Source 0.050307285 g/s
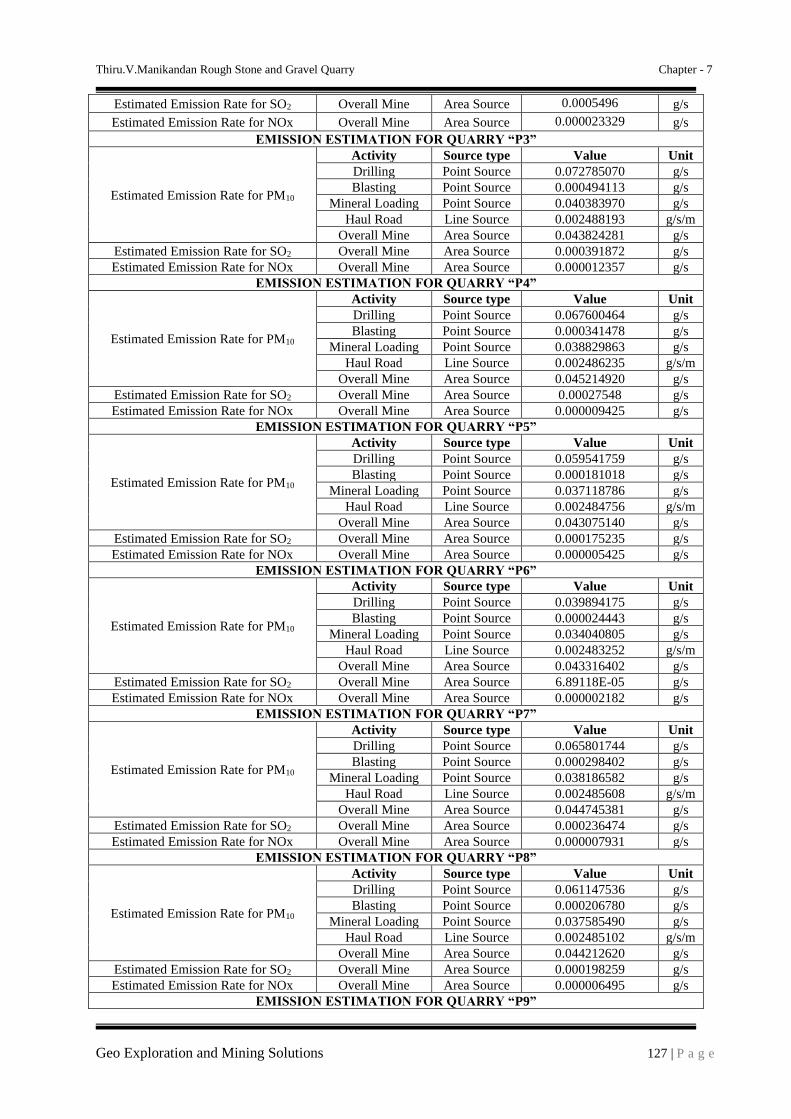
Thiru.V.Manikandan Rough Stone and Gravel Quarry Chapter - 7
Geo Exploration and Mining Solutions 127 | P a g e
Estimated Emission Rate for SO2 Overall Mine Area Source 0.0005496 g/s
Estimated Emission Rate for NOx Overall Mine Area Source 0.000023329 g/s
EMISSION ESTIMATION FOR QUARRY “P3”
Estimated Emission Rate for PM10
Activity Source type Value Unit
Drilling Point Source 0.072785070 g/s
Blasting Point Source 0.000494113 g/s
Mineral Loading Point Source 0.040383970 g/s
Haul Road Line Source 0.002488193 g/s/m
Overall Mine Area Source 0.043824281 g/s
Estimated Emission Rate for SO2 Overall Mine Area Source 0.000391872 g/s
Estimated Emission Rate for NOx Overall Mine Area Source 0.000012357 g/s
EMISSION ESTIMATION FOR QUARRY “P4”
Estimated Emission Rate for PM10
Activity Source type Value Unit
Drilling Point Source 0.067600464 g/s
Blasting Point Source 0.000341478 g/s
Mineral Loading Point Source 0.038829863 g/s
Haul Road Line Source 0.002486235 g/s/m
Overall Mine Area Source 0.045214920 g/s
Estimated Emission Rate for SO2 Overall Mine Area Source 0.00027548 g/s
Estimated Emission Rate for NOx Overall Mine Area Source 0.000009425 g/s
EMISSION ESTIMATION FOR QUARRY “P5”
Estimated Emission Rate for PM10
Activity Source type Value Unit
Drilling Point Source 0.059541759 g/s
Blasting Point Source 0.000181018 g/s
Mineral Loading Point Source 0.037118786 g/s
Haul Road Line Source 0.002484756 g/s/m
Overall Mine Area Source 0.043075140 g/s
Estimated Emission Rate for SO2 Overall Mine Area Source 0.000175235 g/s
Estimated Emission Rate for NOx Overall Mine Area Source 0.000005425 g/s
EMISSION ESTIMATION FOR QUARRY “P6”
Estimated Emission Rate for PM10
Activity Source type Value Unit
Drilling Point Source 0.039894175 g/s
Blasting Point Source 0.000024443 g/s
Mineral Loading Point Source 0.034040805 g/s
Haul Road Line Source 0.002483252 g/s/m
Overall Mine Area Source 0.043316402 g/s
Estimated Emission Rate for SO2 Overall Mine Area Source 6.89118E-05 g/s
Estimated Emission Rate for NOx Overall Mine Area Source 0.000002182 g/s
EMISSION ESTIMATION FOR QUARRY “P7”
Estimated Emission Rate for PM10
Activity Source type Value Unit
Drilling Point Source 0.065801744 g/s
Blasting Point Source 0.000298402 g/s
Mineral Loading Point Source 0.038186582 g/s
Haul Road Line Source 0.002485608 g/s/m
Overall Mine Area Source 0.044745381 g/s
Estimated Emission Rate for SO2 Overall Mine Area Source 0.000236474 g/s
Estimated Emission Rate for NOx Overall Mine Area Source 0.000007931 g/s
EMISSION ESTIMATION FOR QUARRY “P8”
Estimated Emission Rate for PM10
Activity Source type Value Unit
Drilling Point Source 0.061147536 g/s
Blasting Point Source 0.000206780 g/s
Mineral Loading Point Source 0.037585490 g/s
Haul Road Line Source 0.002485102 g/s/m
Overall Mine Area Source 0.044212620 g/s
Estimated Emission Rate for SO2 Overall Mine Area Source 0.000198259 g/s
Estimated Emission Rate for NOx Overall Mine Area Source 0.000006495 g/s
EMISSION ESTIMATION FOR QUARRY “P9”
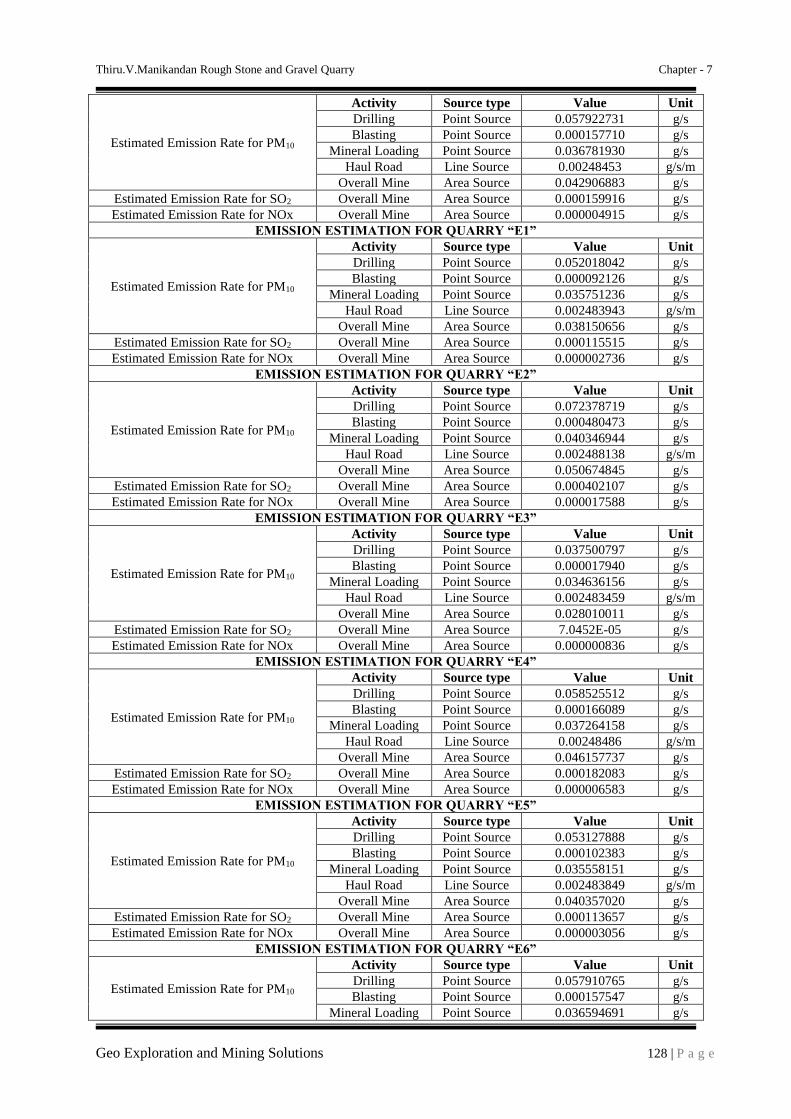
Thiru.V.Manikandan Rough Stone and Gravel Quarry Chapter - 7
Geo Exploration and Mining Solutions 128 | P a g e
Estimated Emission Rate for PM10
Activity Source type Value Unit
Drilling Point Source 0.057922731 g/s
Blasting Point Source 0.000157710 g/s
Mineral Loading Point Source 0.036781930 g/s
Haul Road Line Source 0.00248453 g/s/m
Overall Mine Area Source 0.042906883 g/s
Estimated Emission Rate for SO2 Overall Mine Area Source 0.000159916 g/s
Estimated Emission Rate for NOx Overall Mine Area Source 0.000004915 g/s
EMISSION ESTIMATION FOR QUARRY “E1”
Estimated Emission Rate for PM10
Activity Source type Value Unit
Drilling Point Source 0.052018042 g/s
Blasting Point Source 0.000092126 g/s
Mineral Loading Point Source 0.035751236 g/s
Haul Road Line Source 0.002483943 g/s/m
Overall Mine Area Source 0.038150656 g/s
Estimated Emission Rate for SO2 Overall Mine Area Source 0.000115515 g/s
Estimated Emission Rate for NOx Overall Mine Area Source 0.000002736 g/s
EMISSION ESTIMATION FOR QUARRY “E2”
Estimated Emission Rate for PM10
Activity Source type Value Unit
Drilling Point Source 0.072378719 g/s
Blasting Point Source 0.000480473 g/s
Mineral Loading Point Source 0.040346944 g/s
Haul Road Line Source 0.002488138 g/s/m
Overall Mine Area Source 0.050674845 g/s
Estimated Emission Rate for SO2 Overall Mine Area Source 0.000402107 g/s
Estimated Emission Rate for NOx Overall Mine Area Source 0.000017588 g/s
EMISSION ESTIMATION FOR QUARRY “E3”
Estimated Emission Rate for PM10
Activity Source type Value Unit
Drilling Point Source 0.037500797 g/s
Blasting Point Source 0.000017940 g/s
Mineral Loading Point Source 0.034636156 g/s
Haul Road Line Source 0.002483459 g/s/m
Overall Mine Area Source 0.028010011 g/s
Estimated Emission Rate for SO2 Overall Mine Area Source 7.0452E-05 g/s
Estimated Emission Rate for NOx Overall Mine Area Source 0.000000836 g/s
EMISSION ESTIMATION FOR QUARRY “E4”
Estimated Emission Rate for PM10
Activity Source type Value Unit
Drilling Point Source 0.058525512 g/s
Blasting Point Source 0.000166089 g/s
Mineral Loading Point Source 0.037264158 g/s
Haul Road Line Source 0.00248486 g/s/m
Overall Mine Area Source 0.046157737 g/s
Estimated Emission Rate for SO2 Overall Mine Area Source 0.000182083 g/s
Estimated Emission Rate for NOx Overall Mine Area Source 0.000006583 g/s
EMISSION ESTIMATION FOR QUARRY “E5”
Estimated Emission Rate for PM10
Activity Source type Value Unit
Drilling Point Source 0.053127888 g/s
Blasting Point Source 0.000102383 g/s
Mineral Loading Point Source 0.035558151 g/s
Haul Road Line Source 0.002483849 g/s/m
Overall Mine Area Source 0.040357020 g/s
Estimated Emission Rate for SO2 Overall Mine Area Source 0.000113657 g/s
Estimated Emission Rate for NOx Overall Mine Area Source 0.000003056 g/s
EMISSION ESTIMATION FOR QUARRY “E6”
Estimated Emission Rate for PM10
Activity Source type Value Unit
Drilling Point Source 0.057910765 g/s
Blasting Point Source 0.000157547 g/s
Mineral Loading Point Source 0.036594691 g/s

Thiru.V.Manikandan Rough Stone and Gravel Quarry Chapter - 7
Geo Exploration and Mining Solutions 129 | P a g e
Haul Road Line Source 0.002484412 g/s/m
Overall Mine Area Source 0.040518703 g/s
Estimated Emission Rate for SO2 Overall Mine Area Source 0.000151336 g/s
Estimated Emission Rate for NOx Overall Mine Area Source 0.000004091 g/s
EMISSION ESTIMATION FOR QUARRY “E7”
Estimated Emission Rate for PM10
Activity Source type Value Unit
Drilling Point Source 0.062181263 g/s
Blasting Point Source 0.000224860 g/s
Mineral Loading Point Source 0.038773304 g/s
Haul Road Line Source 0.002486176 g/s/m
Overall Mine Area Source 0.078969690 g/s
Estimated Emission Rate for SO2 Overall Mine Area Source 0.000298746 g/s
Estimated Emission Rate for NOx Overall Mine Area Source 0.000035894 g/s
EMISSION ESTIMATION FOR QUARRY “E8”
Estimated Emission Rate for PM10
Activity Source type Value Unit
Drilling Point Source 0.042189230 g/s
Blasting Point Source 0.000032331 g/s
Mineral Loading Point Source 0.032995845 g/s
Haul Road Line Source 0.002482959 g/s/m
Overall Mine Area Source 0.036584705 g/s
Estimated Emission Rate for SO2 Overall Mine Area Source 5.24523E-05 g/s
Estimated Emission Rate for NOx Overall Mine Area Source 0.000001137 g/s
EMISSION ESTIMATION FOR QUARRY “E9”
Estimated Emission Rate for PM10
Activity Source type Value Unit
Drilling Point Source 0.091092747 g/s
Blasting Point Source 0.001517167 g/s
Mineral Loading Point Source 0.047288600 g/s
Haul Road Line Source 0.002511406 g/s/m
Overall Mine Area Source 0.071940817 g/s
Estimated Emission Rate for SO2 Overall Mine Area Source 0.001820211 g/s
Estimated Emission Rate for NOx Overall Mine Area Source 0.000155534 g/s
EMISSION ESTIMATION FOR QUARRY “E10”
Estimated Emission Rate for PM10
Activity Source type Value Unit
Drilling Point Source 0.032424999 g/s
Blasting Point Source 0.000008670 g/s
Mineral Loading Point Source 0.030161874 g/s
Haul Road Line Source 0.002482485 g/s/m
Overall Mine Area Source 0.045267777 g/s
Estimated Emission Rate for SO2 Overall Mine Area Source 2.26666E-05 g/s
Estimated Emission Rate for NOx Overall Mine Area Source 0.000000796 g/s
EMISSION ESTIMATION FOR QUARRY “E11”
Estimated Emission Rate for PM10
Activity Source type Value Unit
Drilling Point Source 0.054697637 g/s
Blasting Point Source 0.000118429 g/s
Mineral Loading Point Source 0.039502700 g/s
Haul Road Line Source 0.002486999 g/s/m
Overall Mine Area Source 0.061952229 g/s
Estimated Emission Rate for SO2 Overall Mine Area Source 0.00031479 g/s
Estimated Emission Rate for NOx Overall Mine Area Source 0.000021843 g/s
EMISSION ESTIMATION FOR QUARRY “E12”
Estimated Emission Rate for PM10
Activity Source type Value Unit
Drilling Point Source 0.058790366 g/s
Blasting Point Source 0.000169881 g/s
Mineral Loading Point Source 0.039245068 g/s
Haul Road Line Source 0.002486692 g/s/m
Overall Mine Area Source 0.042784832 g/s
Estimated Emission Rate for SO2 Overall Mine Area Source 0.000277375 g/s
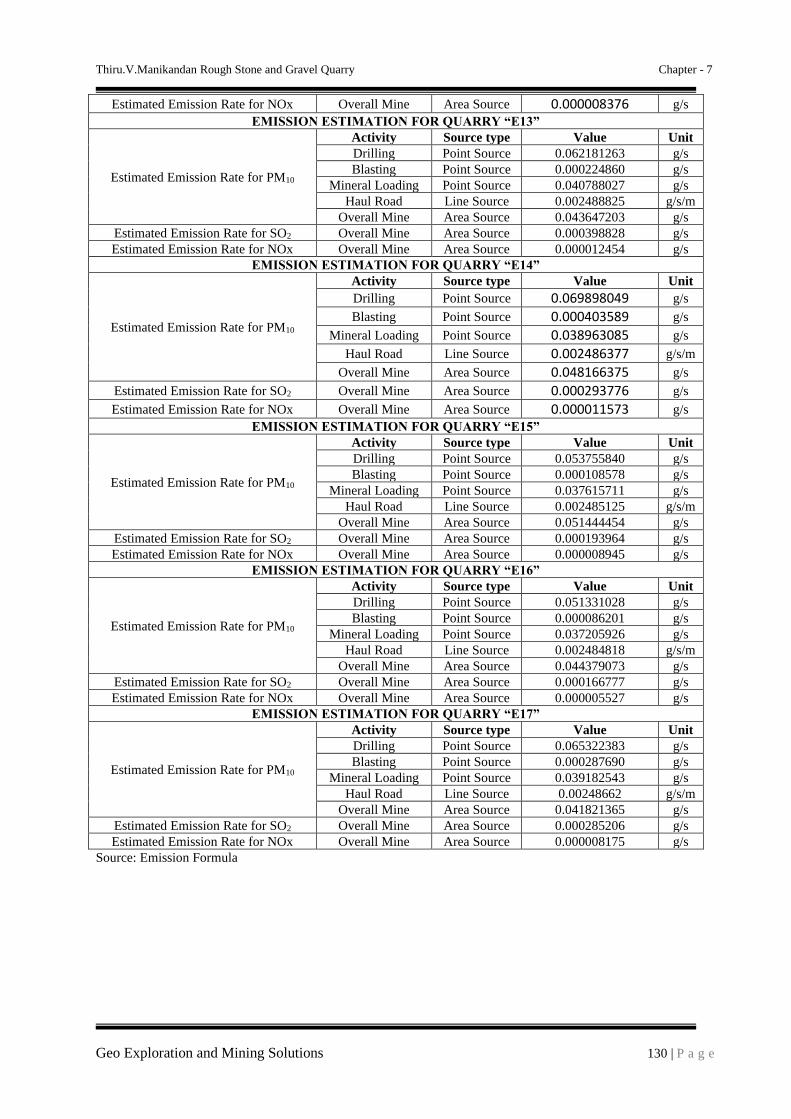
Thiru.V.Manikandan Rough Stone and Gravel Quarry Chapter - 7
Geo Exploration and Mining Solutions 130 | P a g e
Estimated Emission Rate for NOx Overall Mine Area Source 0.000008376 g/s
EMISSION ESTIMATION FOR QUARRY “E13”
Estimated Emission Rate for PM10
Activity Source type Value Unit
Drilling Point Source 0.062181263 g/s
Blasting Point Source 0.000224860 g/s
Mineral Loading Point Source 0.040788027 g/s
Haul Road Line Source 0.002488825 g/s/m
Overall Mine Area Source 0.043647203 g/s
Estimated Emission Rate for SO2 Overall Mine Area Source 0.000398828 g/s
Estimated Emission Rate for NOx Overall Mine Area Source 0.000012454 g/s
EMISSION ESTIMATION FOR QUARRY “E14”
Estimated Emission Rate for PM10
Activity Source type Value Unit
Drilling Point Source 0.069898049 g/s
Blasting Point Source 0.000403589 g/s
Mineral Loading Point Source 0.038963085 g/s
Haul Road Line Source 0.002486377 g/s/m
Overall Mine Area Source 0.048166375 g/s
Estimated Emission Rate for SO2 Overall Mine Area Source 0.000293776 g/s
Estimated Emission Rate for NOx Overall Mine Area Source 0.000011573 g/s
EMISSION ESTIMATION FOR QUARRY “E15”
Estimated Emission Rate for PM10
Activity Source type Value Unit
Drilling Point Source 0.053755840 g/s
Blasting Point Source 0.000108578 g/s
Mineral Loading Point Source 0.037615711 g/s
Haul Road Line Source 0.002485125 g/s/m
Overall Mine Area Source 0.051444454 g/s
Estimated Emission Rate for SO2 Overall Mine Area Source 0.000193964 g/s
Estimated Emission Rate for NOx Overall Mine Area Source 0.000008945 g/s
EMISSION ESTIMATION FOR QUARRY “E16”
Estimated Emission Rate for PM10
Activity Source type Value Unit
Drilling Point Source 0.051331028 g/s
Blasting Point Source 0.000086201 g/s
Mineral Loading Point Source 0.037205926 g/s
Haul Road Line Source 0.002484818 g/s/m
Overall Mine Area Source 0.044379073 g/s
Estimated Emission Rate for SO2 Overall Mine Area Source 0.000166777 g/s
Estimated Emission Rate for NOx Overall Mine Area Source 0.000005527 g/s
EMISSION ESTIMATION FOR QUARRY “E17”
Estimated Emission Rate for PM10
Activity Source type Value Unit
Drilling Point Source 0.065322383 g/s
Blasting Point Source 0.000287690 g/s
Mineral Loading Point Source 0.039182543 g/s
Haul Road Line Source 0.00248662 g/s/m
Overall Mine Area Source 0.041821365 g/s
Estimated Emission Rate for SO2 Overall Mine Area Source 0.000285206 g/s
Estimated Emission Rate for NOx Overall Mine Area Source 0.000008175 g/s
Source: Emission Formula

Thiru.V.Manikandan Rough Stone and Gravel Quarry Chapter - 7
Geo Exploration and Mining Solutions 131 | P a g e
TABLE 7.8: INCREMENTAL & RESULTANT GLC WITHIN CLUSTER
PM10 in µg/m3
Location AAQ1 – CORE
Background (average) 43.5
Highest Incremental 19.96
Resultant 63.46
NAAQ Norms 100 µg/m3
PM2.5 in µg/m3
Background (average) 23.3
Highest Incremental 11.92
Resultant 35.22
NAAQ Norms 80 µg/m3
SO2 in µg/m3
Location AAQ1 – CORE
Background (average) 9.6
Highest Incremental 3.69
Resultant 13.29
NAAQ Norms 80 µg/m3
NOx in µg/m3
Location AAQ1 – CORE
Background (average) 25.0
Incremental 13.87
Resultant 38.87
NAAQ Norms 80 µg/m3
Noise Environment –
Noise pollution is mainly due to operation like drilling & blasting and plying of trucks & HEMM.
Cumulative Noise modelling has been carried out considering blasting and compressor operation (drilling) and
transportation activities. Predictions have been carried out to compute the noise level at various distances around
the different quarries within the 500 m radius.
For hemispherical sound wave propagation through homogeneous loss free medium, one can estimate
noise levels at various locations at different sources using model based on first principle.
Lp2 = Lp1 - 20 log (r2/r1) - Ae1, 2
Where:
Lp1& Lp2 are sound levels at points located at distances r1& r2 from the source.
Ae1, 2 is the excess attenuation due to environmental conditions. Combined effect of all sources can be
determined at various locations by logarithmic addition.
Lptotal = 10 log {10(Lp1/10) + 10(Lp2/10) + 10(Lp3/10) +……}
Attenuation due to Green Belt has been taken to be 4.9 dB (A). The inputs required for the model are:
Source data has been computed taking into account of all the machinery and activities used in the mining
process.
TABLE 7.9: PREDICTED NOISE INCREMENTAL VALUES FROM CLUSTER
Location ID Background Value
(Day) dB(A)
Incremental Value
dB(A)
Total Predicted
dB(A)
Residential Area
Standards dB(A)
Habitation Near P1 49.5 44.5 50.7
55
Habitation Near P2 53.3 42.8 53.7
Habitation Near P3 52.4 46.7 53.4
Habitation Near P4 52.3 48.7 53.9
Habitation Near P5 46.5 41.0 47.6
Habitation Near P6 51.8 44.5 52.5
Habitation Near P7 52.6 44.5 53.2
Habitation Near P8 51.4 46.1 52.5
Habitation Near P9 53.5 42.4 53.8
Habitation Near E1 52.1 45.0 52.9
Habitation Near E2 45.9 46.5 49.2
Habitation Near E3 50.2 45.8 51.5
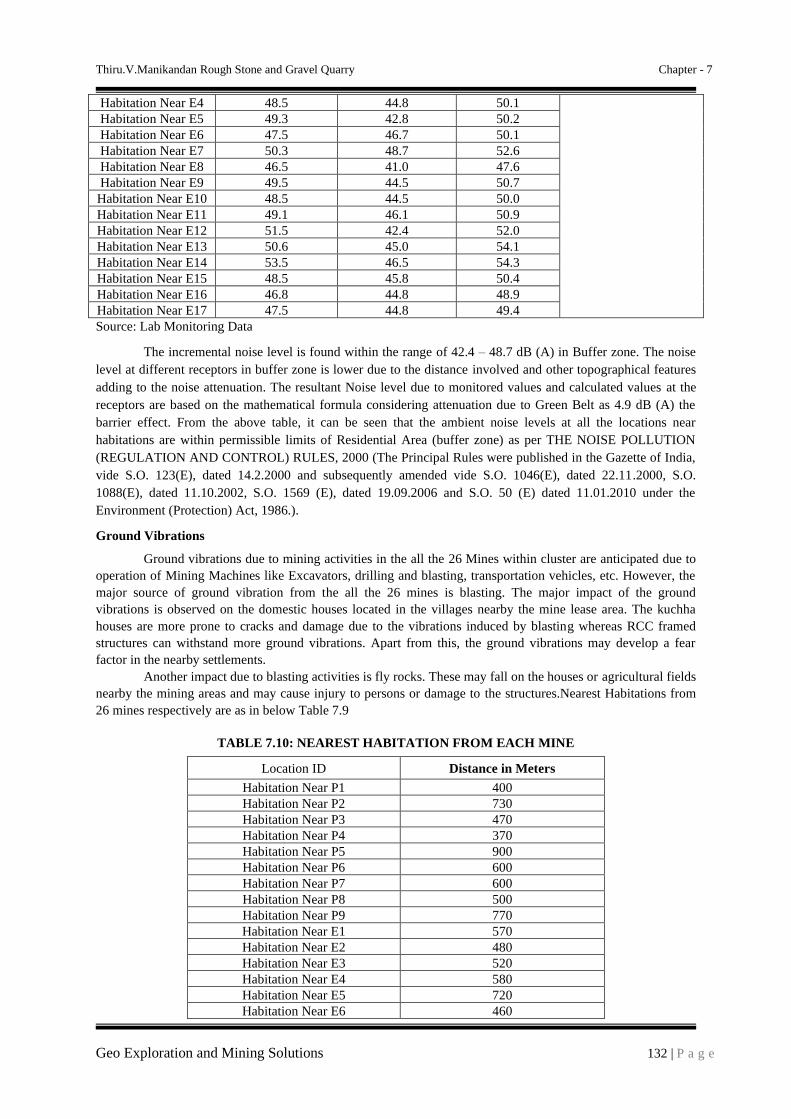
Thiru.V.Manikandan Rough Stone and Gravel Quarry Chapter - 7
Geo Exploration and Mining Solutions 132 | P a g e
Habitation Near E4 48.5 44.8 50.1
Habitation Near E5 49.3 42.8 50.2
Habitation Near E6 47.5 46.7 50.1
Habitation Near E7 50.3 48.7 52.6
Habitation Near E8 46.5 41.0 47.6
Habitation Near E9 49.5 44.5 50.7
Habitation Near E10 48.5 44.5 50.0
Habitation Near E11 49.1 46.1 50.9
Habitation Near E12 51.5 42.4 52.0
Habitation Near E13 50.6 45.0 54.1
Habitation Near E14 53.5 46.5 54.3
Habitation Near E15 48.5 45.8 50.4
Habitation Near E16 46.8 44.8 48.9
Habitation Near E17 47.5 44.8 49.4
Source: Lab Monitoring Data
The incremental noise level is found within the range of 42.4 – 48.7 dB (A) in Buffer zone. The noise
level at different receptors in buffer zone is lower due to the distance involved and other topographical features
adding to the noise attenuation. The resultant Noise level due to monitored values and calculated values at the
receptors are based on the mathematical formula considering attenuation due to Green Belt as 4.9 dB (A) the
barrier effect. From the above table, it can be seen that the ambient noise levels at all the locations near
habitations are within permissible limits of Residential Area (buffer zone) as per THE NOISE POLLUTION
(REGULATION AND CONTROL) RULES, 2000 (The Principal Rules were published in the Gazette of India,
vide S.O. 123(E), dated 14.2.2000 and subsequently amended vide S.O. 1046(E), dated 22.11.2000, S.O.
1088(E), dated 11.10.2002, S.O. 1569 (E), dated 19.09.2006 and S.O. 50 (E) dated 11.01.2010 under the
Environment (Protection) Act, 1986.).
Ground Vibrations
Ground vibrations due to mining activities in the all the 26 Mines within cluster are anticipated due to
operation of Mining Machines like Excavators, drilling and blasting, transportation vehicles, etc. However, the
major source of ground vibration from the all the 26 mines is blasting. The major impact of the ground
vibrations is observed on the domestic houses located in the villages nearby the mine lease area. The kuchha
houses are more prone to cracks and damage due to the vibrations induced by blasting whereas RCC framed
structures can withstand more ground vibrations. Apart from this, the ground vibrations may develop a fear
factor in the nearby settlements.
Another impact due to blasting activities is fly rocks. These may fall on the houses or agricultural fields
nearby the mining areas and may cause injury to persons or damage to the structures.Nearest Habitations from
26 mines respectively are as in below Table 7.9
TABLE 7.10: NEAREST HABITATION FROM EACH MINE
Location ID Distance in Meters
Habitation Near P1 400
Habitation Near P2 730
Habitation Near P3 470
Habitation Near P4 370
Habitation Near P5 900
Habitation Near P6 600
Habitation Near P7 600
Habitation Near P8 500
Habitation Near P9 770
Habitation Near E1 570
Habitation Near E2 480
Habitation Near E3 520
Habitation Near E4 580
Habitation Near E5 720
Habitation Near E6 460
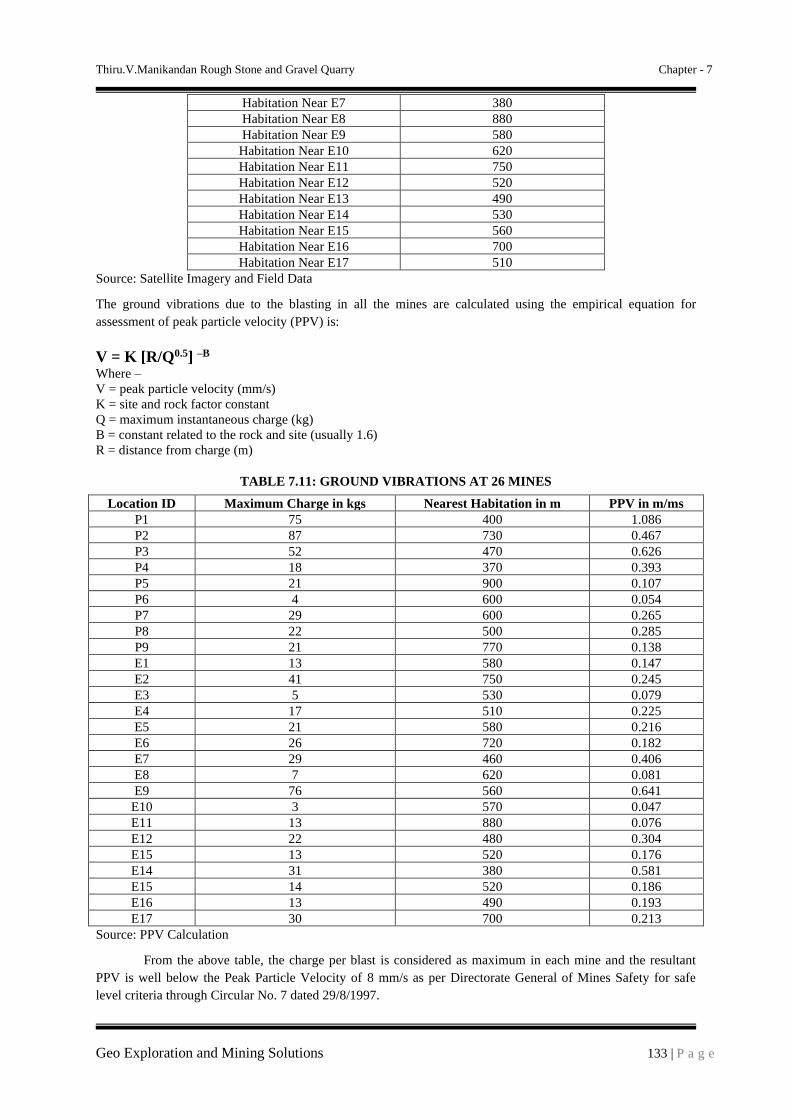
Thiru.V.Manikandan Rough Stone and Gravel Quarry Chapter - 7
Geo Exploration and Mining Solutions 133 | P a g e
Habitation Near E7 380
Habitation Near E8 880
Habitation Near E9 580
Habitation Near E10 620
Habitation Near E11 750
Habitation Near E12 520
Habitation Near E13 490
Habitation Near E14 530
Habitation Near E15 560
Habitation Near E16 700
Habitation Near E17 510
Source: Satellite Imagery and Field Data
The ground vibrations due to the blasting in all the mines are calculated using the empirical equation for
assessment of peak particle velocity (PPV) is:
V = K [R/Q0.5] –B Where –
V = peak particle velocity (mm/s)
K = site and rock factor constant
Q = maximum instantaneous charge (kg)
B = constant related to the rock and site (usually 1.6)
R = distance from charge (m)
TABLE 7.11: GROUND VIBRATIONS AT 26 MINES
Location ID Maximum Charge in kgs Nearest Habitation in m PPV in m/ms
P1 75 400 1.086
P2 87 730 0.467
P3 52 470 0.626
P4 18 370 0.393
P5 21 900 0.107
P6 4 600 0.054
P7 29 600 0.265
P8 22 500 0.285
P9 21 770 0.138
E1 13 580 0.147
E2 41 750 0.245
E3 5 530 0.079
E4 17 510 0.225
E5 21 580 0.216
E6 26 720 0.182
E7 29 460 0.406
E8 7 620 0.081
E9 76 560 0.641
E10 3 570 0.047
E11 13 880 0.076
E12 22 480 0.304
E15 13 520 0.176
E14 31 380 0.581
E15 14 520 0.186
E16 13 490 0.193
E17 30 700 0.213
Source: PPV Calculation
From the above table, the charge per blast is considered as maximum in each mine and the resultant
PPV is well below the Peak Particle Velocity of 8 mm/s as per Directorate General of Mines Safety for safe
level criteria through Circular No. 7 dated 29/8/1997.

Thiru.V.Manikandan Rough Stone and Gravel Quarry Chapter - 7
Geo Exploration and Mining Solutions 134 | P a g e
Socio Economic Environment –
The 26 mines shall provide employment and revenue will be created to government
TABLE 7.12: SOCIO ECONOMIC BENEFITS FROM 26 MINES
Employment Project Cost CER @ 2%
P1 31 Rs.1,03,11,500/- Rs.2,06,200/-
P2 18 Rs 50,45,700/- Rs.1,01,300/-
P3 20 Rs. 42,27,800/- Rs.84,600/-
P4 16 Rs.51,01,900/- Rs.1,02,000/-
P5 19 Rs.47,30,600/- Rs.94,600/-
P6 20 Rs 38,54,500/- Rs 77,500/-
P7 18 Rs 33,90,000/- Rs 98,000/-
P8 14 Rs 49,35,000/- Rs 99,500/-
P9 14 Rs 47,02,000/- Rs 94,000/-
Total 170 Rs. 4,62,99,000/- Rs. 9,57,700/-
E1 10 Rs. 31,77,000/- Rs. 63,540/-
E2 11 Rs.59,85,000/- Rs. 1,19,700/-
E3 13 Rs.33,52,000/- Rs. 67,040/-
E4 11 Rs.60,44,000/- Rs. 1,20,880/-
E5 10 Rs.48,62,000/- Rs. 97,240/-
E6 10 Rs.57,43,500/- Rs. 1,14,870/-
E7 10 Rs.74,24,000/- Rs. 1,48,480/-
E8 13 Rs.54,40,000/- Rs. 1,08,800/-
E9 13 Rs.60,31,000/- Rs. 1,20,620/-
E10 15 Rs. 49,75,000/- Rs. 99,500/-
E11 13 Rs.59,09,000/- Rs. 1,18,180/-
E12 19 Rs.68,70,000/- Rs. 1,37,400/-
E13 11 Rs.38,26,000/- Rs. 76,520/-
E14 11 Rs.39,06,000/- Rs. 78,120/-
E15 13 Rs.34,10,000/- Rs. 68,200/-
E16 13 Rs.30,92,500/- Rs. 61,850/-
E17 23 Rs.50,81,950/- Rs. 1,01,639/-
Total 219 Rs. 8,51,28,950/- Rs.17,02,579/-
Grand Total 389 Rs.13,14,27,950/- Rs.26,60,279/-
A total of 170 people will get employment due to 9 mines in cluster and already employed at existing
mines are 219 Nos. Allocation for Corporate Environment Responsibility (CER) shall be made as per
Government of India, MoEF & CC Office Memorandum F.No.22-65/2017-IA.III, Dated: 01.05.2018 by all the
mines.
As per para 6 (II) of the office memorandum, all the mines being a green field project & Capital
Investment is ≤ 100 crores, they shall contribute 2% of Capital Investment towards CER as per directions of
EAC/SEAC.
• 9 Proposed projects shall fund towards CER – Rs 9,57,700/-
• Existing project shall fund towards CER – Rs 17,02,579/-
• Projects in Cluster shall fund towards CER – Rs 26,60,279/-
TABLE 7.13: GREENBELT DEVELOPMENT BENEFITS FROM 26 MINES
CODE
No of Trees
proposed to be
planted
Survival
%
Area Covered
Sq.m Name of the Species
No. of Trees
expected to be
grown
P1 450 80% 4000 Neem, Casuarina 360
P2 240 80% 2150 Neem, Casuarina 190
P3 150 80% 1500 Neem, Casuarina 120
P4 840 80% 7560 Neem, Casuarina 670
P5 390 80% 3500 Neem, Casuarina 315

Thiru.V.Manikandan Rough Stone and Gravel Quarry Chapter - 7
Geo Exploration and Mining Solutions 135 | P a g e
P6 120 80% 1100 Neem, Casuarina 95
P7 280 80% 2500 Neem, Casuarina 225
P8 150 80% 1300 Neem, Casuarina 120
P9 210 80% 1910 Neem, Casuarina 170
Total 2830 80% 25520 Neem, Casuarina 2265
E1 100 80% 1000 Neem, Casuarina 80
E2 100 80% 1000 Neem, Casuarina 80
E3 100 80% 700 Neem, Casuarina 80
E4 100 80% 1000 Neem, Casuarina 80
E5 100 80% 1000 Neem, Casuarina 80
E6 100 80% 1300 Neem, Casuarina 80
E7 150 80% 2500 Neem, Casuarina 120
E8 100 80% 1500 Neem, Casuarina 80
E9 100 80% 1000 Neem, Casuarina 80
E10 150 80% - Neem, Casuarina 120
E11 100 80% 1000 Neem, Casuarina 80
E12 150 80% 4970 Neem, Casuarina 120
E13 150 80% 1200 Neem, Casuarina 120
E14 150 80% 1200 Neem, Casuarina 120
E15 100 80% 1000 Neem, Casuarina 80
E16 100 80% 1000 Neem, Casuarina 80
E17 500 80% 1600 Neem, Casuarina 400
Total 2350 80% 22970 Neem, Casuarina 1880
Grand Total 5,180 80% 48,490 Neem, Casuarina 4,145
Based on the Proposed Mining Plans it’s anticipated that there shall growth of native species of Neem,
Casuarina, etc in the Cluster at a rate of 2830 Trees Planted over a period of 5 Years with Survival Rate of 80%
and expected growth is around 2265 Trees over an area of 25,520 Sq.m cumulative of all proposed quarries and
2350 Trees Planted over a period of 5 Years with Survival Rate of 80% and expected growth is around 1880
Trees over an area of 22970 Sq.m cumulative of all existing quarries.
7.5 PLASTIC WASTE MANAGEMENT PLAN FOR P1 TO P9
All the Project Proponent shall comply with Tamil Nadu Government Order (Ms) No. 84 Environment
and Forest (EC.2) Department Dated: 25.06.2018 regarding ban on one time use and throw away plastics
irrespective of thickness with effect from 01.01.2019 under Environment (Protection) Act, 1986.
Objective –
• To investigate the actual supply chain network of plastic waste.
• To identify and propose a sustainable plastic waste management by installing bins for collection of
recyclables with all the plastic waste
• Preparation of a system design layout, and necessary modalities for implementation and monitoring.
TABLE 7.14: ACTION PLAN TO MANAGE PLASTIC WASTE
Sl.No. Activity Responsibility
1 Framing of Layout Design by incorporating provision of the Rules, user fee to be
charged from waste generators for plastic waste management, penalties/fines for
littering, burning plastic waste or committing any other acts of public nuisance
Mines Manager
2 Enforcing waste generators to practice segregation of bio-degradable, recyclable
and domestic hazardous waste
Mines Manager
3 Collection of plastic waste Mines Foreman
4 Setting up of Material Recovery Facilities Mines Manager
5 Segregation of Recyclable and Non-Recyclable plastic waste at Material
Recovery Facilities
Mines Foreman
6 Channelization of Recyclable Plastic Waste to registered recyclers Mines Foreman
7 Channelization of Non-Recyclable Plastic Waste for use either in Cement kilns,
in Road Construction
Mines Foreman
8 Creating awareness among all the stakeholders about their responsibility Mines Manager
9 Surprise checking’s of littering, open burning of plastic waste or committing any
other acts of public nuisance
Mine Owner
Source: Proposed by FAE’s and EC
Thiru.V.Manikandan Rough Stone and Gravel Quarry Chapter - 7
Geo Exploration and Mining Solutions 136 | P a g e
7.6 POST COVID HEALTH MANAGEMENT PLAN FOR P1 TO P9
COVID – 19 disease caused by SARS-CoV-2 Coronavirus is relatively a new disease, with fresh
information being known on a dynamic basis about the natural history of the disease, especially in terms of post-
recovery events.
After acute COVID-19 illness, recovered patients may continue to report wide variety of signs and
symptoms including fatigue, body ache, cough, sore throat, difficulty in breathing, etc. As of now there is
limited evidence of post-COVID sequalae and further research is required and is being actively pursued. A
holistic approach is required for follow up care and well-being of all post COVID recovering patients.
Post-COVID Follow Up Protocol –
• Continue COVID appropriate behaviour (use of mask, hand & respiratory hygiene, physical distancing).
• Drink adequate amount of warm water (if not contra-indicated).
• Make sure your workplaces are clean and hygienic
• Surface (e.g. desks and tables) and objects (e.g. telephones, helmet) need to be wiped with disinfectant
regularly
• Put sanitizing hand rub dispensers in prominent places around the workplace. Make sure these dispensers
are regularly refilled
• Display posters promoting hand-washing
• Make sure that staff, contractors and customers have access to places where they can wash their hands
with soap and water
• Display posters promoting respiratory hygiene.
• Brief your employees, contractors and customers that if COVID-19 starts spreading in your community
anyone with even a mild cough or low-grade fever (37.3°C or more) need to stay at home. They should
also stay home (or work from home) if they have had to take simple medications, such as
paracetamol/acetaminophen, ibuprofen or aspirin, which may mask symptoms of infection
• Keep communicating and promoting the message that people need to stay at home even if they have just
mild symptoms of COVID-19.
• Consider whether a face-to-face meeting or event is needed. Could it be replaced by a teleconference or
online event?
• Could the meeting or event be scaled down so that fewer people attend?
• Pre-order sufficient supplies and materials, including tissues and hand sanitizer for all employees. Have
surgical masks available to offer anyone who develops respiratory symptoms.
• It is also suggested by the Ministry of AYUSH that the use of Chyawanprash in the morning (1
teaspoonful) with luke warm water/milk is highly recommended (under the direction of Registered
Ayurveda physician) as in the clinical practice Chyawanprash is believed to be effective in post-recovery
period.
• If there is persistent dry cough / sore throat, do saline gargles and take steam inhalation. The addition of
herbs/spices for gargling/steam inhalation. Cough medications, should be taken on advice of medical
doctor or qualified practitioner of Ayush.
• Look for early warning signs like high grade fever, breathlessness, Sp02 < 95%, unexplained chest pain,
new onset of confusion, focal weakness.
• Avoid smoking and consumption of alcohol.
• Communicate to your employees and contractors about the plan and make sure they are aware of what
they need to do – or not do – under the plan. Emphasize key points such as the importance of staying
away from work even if they have only mild symptoms or have had to take simple medications (e.g.
paracetamol, ibuprofen) which may mask the symptoms
The plan should address how to keep your business running even if a significant number of employees,
contractors and suppliers cannot come to your place of business - either due to local restrictions on travel or
because they are ill.

Thiru.V.Manikandan Rough Stone and Gravel Quarry Chapter - 8
Geo Exploration and Mining Solutions 137 | P a g e
CHAPTER – 8: PROJECT BENEFITS
8.0 General
The Proposed Project for Quarrying Rough Stone and Gravel at Chettipalayam Village aims to produce
cumulatively 3,48,355 m3 Rough Stone & 34,746m3 of Gravel over a period of 5 Years. This will enhance the
socio-economic activities in the adjoining areas and will result in the following benefits
• Increase in Employment Potential
• Improvement in Socio-Economic Welfare
• Improvement in Physical Infrastructure
• Improvement in Social infrastructure
8.1 Employment Potential
It is proposed to provide employment to about 31 persons for carrying out mining operations and give
preference to the local people in providing employment. In addition there will be opportunity for indirect
employment to many people in the form of contractual jobs, business opportunities, service facilities etc. the
economic status of the local people will be enhanced due to mining project.
8.2 Socio-Economic Welfare Measures Proposed
The impact of mining activity in the area will be more positive than negative on the socio-economic
environment in the immediate project impact area. The employment opportunities both direct and indirect will
contribute to enhanced money incomes to job seekers with minimal skill sets especially among the local
communities.
Project benefits
Employment potential
Meet out the demand
supply gap
Economy Growth for
local community
Revenue for state and country
Thiru.V.Manikandan Rough Stone and Gravel Quarry Chapter - 8
Geo Exploration and Mining Solutions 138 | P a g e
8.3 Improvement in Physical Infrastructure
The proposed project site is located in Chettipalayam village, Kinathukadavu, taluk, Coimbatore
District of Tamil Nadu and the area have communications, roads and other facilities already well established.
The following physical infrastructure facilities will further improve due to the cluster quarry projects.
• Road Transport facilities
• Communications
• Medical, Educational and social benefits will be made available to the nearby civilian population in
addition to the workmen employed in the mine.
8.4 Improvement in Social Infrastructure
The quarry projects in the region will have positive impact on the social economic condition of the area
by way of providing employment to the local peoples; thereby increasing the per capita income, housing,
education, medical and transportation facilities, economic status, health and agriculture.
• Social welfare program like Medical camps, Educational facilities to the poverty level
students, Providing water supply from the quarries during drought seasons will be taken from
the project proponent’s
• Supplementing Govt. efforts in health monitoring camps, social welfare and various
Awareness programs among the rural population.
8.5 Other Tangible Benefits
The proposed quarry project is likely to have other tangible benefits as given below.
• Indirect employment opportunities to local people in contractual works like construction of
infrastructural facilities, transportation, sanitation, for supply of goods and services to the quarry site
and other community services.
• Additional housing demand for rental accommodation will increase.
• Cultural, recreation and aesthetic facilities will also improve.
• Improvement in communication, transport, education, community development and medical facilities
and overall change in employment and income opportunity.
• The State Government will also benefit directly from the proposed mine, through increased revenue
from royalties, cess, DMF, GST etc.,
CORPORATE SOCIAL RESPONSIBILITY
Project Proponent will take responsibility to develop awareness among all levels of their staff about
CSR activities and the integration of social processes with business processes. Those involved with the
undertaking of CSR activities will be provided with adequate training and re-orientation.
Under this programme, the project proponents will take-up following programmes for social and
economic development of villages within 10 km of the project site. For this purpose, separate budget will be
provided every year. For finalization of these schemes, proponent will interact with LSG. The schemes will be
selected from the following broad areas –
• Health Services
• Social Development
• Infrastructure Development
• Education & Sports
• Self-Employment

Thiru.V.Manikandan Rough Stone and Gravel Quarry Chapter - 8
Geo Exploration and Mining Solutions 139 | P a g e
CSR Cost Estimation
▪ CSR activities will be taken up in the Chettipalayam village mainly contributing to education, health,
training of women self-help groups and contribution to infrastructure etc., CSR budget is allocated as
2.5% of the profit.
CORPORATE ENVIRONMENT RESPONSIBILITY–
Allocation for Corporate Environment Responsibility (CER) shall be made as per Government of India,
MoEF & CC Office Memorandum F.No.22-65/2017-IA.III, Dated: 01.05.2018.
As per para 6 (II) of the office memorandum, the mines being a green field project & Capital Investment is ≤
100 crores, they shall contribute 2% of Capital Investment towards CER as per directions of EAC/SEAC and the
total CER amount from the proposed mines is Rs. 2,06,200/-
TABLE 8.1 CER – ACTION PLAN
Activity Beneficiaries Total In Rs
Providing funds for smart class facilities at Chettipalayam village
Government School Chettipalayam villagers Rs.2,06,200/-
TOTAL Rs.2,06,200/-
Source: Field survey conducted by FAE, consultation with project proponent

Thiru.V.Manikandan Rough Stone and Gravel Quarry Chapter - 9
Geo Exploration and Mining Solutions 140 | P a g e
CHAPTER – 9: ENVIRONMENTAL COST BENEFIT ANALYSIS
Not Applicable, Since Environmental Cost Benefit Analysis not recommended at the Scoping stage.

Thiru.V.Manikandan Rough Stone and Gravel Quarry Chapter - 10
Geo Exploration and Mining Solutions 141 | P a g e
CHAPTER - 10: ENVIRONMENTAL MANAGEMENT PLAN
10.0 General
Environment Management Plan (EMP) aims at the preservation of ecological system by considering in-
built pollution abatement facilities at the proposed site. Good practices of Environmental Management plan will
ensure to keep all the environmental parameters of the project in respect of Ambient Air quality, Water quality,
Socio – economic improvement standards.
Mitigation measures at the source level and an overall environment management plan at the study area are
elicited so as to improve the supportive capacity of the receiving bodies. The EMP presented in this chapter
discusses the administrative aspects of ensuring that mitigative measures are implemented and their effectiveness
monitored after approval of the EIA.
10.1 Environmental Policy
The Project Proponent is committed to conduct all its operations and activities in an environmentally
responsible manner and to continually improve environmental performance.
The Proponent Thiru. V.Manikandan will –
• Allocate necessary resources to ensure the implementation of the environmental policy
• Meet the requirements of all laws, acts, regulations, and standards relevant to its operations and activities
• Implement a program to train employees in general environmental issues and individual workplace
environmental responsibilities
• Ensure that an effective closure strategy is in place at all stages of project development and that progressive
reclamation is undertaken as early as possible to reduce potential long-term environmental and community
impacts
• Implement monitoring programmes to provide early warning of any deficiency or unanticipated
performance in environmental safeguards
• Conduct periodic reviews to verify environmental performance and to continuously strive towards
improvement
Description of the Administration and Technical Setup –
The Environment Monitoring Cell discussed under Chapter 6 will ensure effective implementation of
environment management plan and to ensure compliance of environmental statutory guidelines through Mine
Management Level of each Proposed Quarry.
The said team will be responsible for:
• Monitoring of the water/ waste water quality, air quality and solid waste generated
• Analysis of the water and air samples collected through external laboratory
• Implementation and monitoring of the pollution control and protective measures/ devices which shall
include financial estimation, ordering, installation of air pollution control equipment, waste water treatment
plant, etc.
• Co-ordination of the environment related activities within the project as well as with outside agencies
• Collection of health statistics of the workers and population of the surrounding villages
• Green belt development
• Monitoring the progress of implementation of the environmental monitoring programme
• Compliance to statutory provisions, norms of State Pollution Control Board, Ministry of Environment and
Forests and the conditions of the environmental clearance as well as the consents to establish and consents
to operate.

Thiru.V.Manikandan Rough Stone and Gravel Quarry Chapter - 10
Geo Exploration and Mining Solutions 142 | P a g e
10.2 Land Environment Management –
Land degradation is one of the major adverse impacts of opencast mining in the form of excavated voids
and contamination of soil affects the viability of the soil resource.
Soil contamination then has a number of flow-on effects like, Inhibition of plant growth, and death of
existing plants in contaminated areas and contamination of soil also has potential to impact on a surface water
quality and groundwater resources.
TABLE 10.1: PROPOSED CONTROLS FOR LAND ENVIRONMENT
CONTROL RESPONSIBILITY
Designing vehicle wash-down system so that all washed water is captured and
passed through grease and oil separators.
Mines Manager
Re fueling will be carried out in a safe location, away from vehicle movement
pathways
Mine Foreman &
Mining Mate
Greenbelt development and its maintenance Environment Officer
Garland drains with catch pits to be provided all around the project area to prevent
run off affecting the surrounding lands.
Environment Officer
The periphery of Project area will be planted with thick plantation to arrest the
fugitive dust, which will also act as acoustic barrier.
Mines Manager
Thick plantation using native flora spices will be carried out on the top benches. Mines Manager
There will be formation of a small surface water body in the mined out area, which
can be used for watering the greenbelt at the conceptual stages.
Environment Officer
Source: Proposed by FAE’s & EIA Coordinator
10.3 Soil Management
Top Soil Management –
▪ There is no topsoil for this project site.
Overburden / Waste and Side Burden Management –
▪ The overburden in the form of Gravel formation, the Gravel will be directly loaded into tippers for the
filling and levelling of low lying areas, this will be done only after obtaining permission and paying
necessary seigniorage fees to the Government.
ABLE 10.2: PROPOSED CONTROLS FOR SOIL MANAGEMENT
CONTROL RESPONSIBILITY
Garland drains are to be paved around the quarry pit area to arrest possible wash off in
the rainy seasons
Mines Manager
Surface run-off from the surface water via garland drains will be diverted to the mine
pits
Mine Foreman &
Mining Mate
Design haul roads and other access roads with drainage systems to minimize
concentration of flow and erosion risk
Environment Officer
keeping records of mitigation of erosion events, to improve on management techniques Environment Officer
A monitoring map with information including their GPS coordinates, erosion type,
intensity, and the extent of the affected area, as well as existing control measures and
assessment of their performance
Environment Officer
Empty sediment from sediment traps
Maintain, repair or upgrade garland drain system
Environment Officer
Test soils for pH, EC, chloride, exchangeable cations, particle size and water holding
capacity
Mines Manager
Source: Proposed by FAE’s & EIA Coordinator

Thiru.V.Manikandan Rough Stone and Gravel Quarry Chapter - 10
Geo Exploration and Mining Solutions 143 | P a g e
10.4 Water Management
In the proposed quarrying project, no process is involved for the effluent generation, only oil & grease from
the machinery wash is anticipated and domestic sewage from mine office.
The quarrying operation is restricted upto a depth of 37m BGL as per the ToR, the water table in the area is
50m – 55 m below ground level, and hence the proposed projects will not intersect the Ground water table during
entire quarry period.
TABLE 10.3: PROPOSED CONTROLS FOR WATER ENVIRONMENT
CONTROL RESPONSIBILITY
To maximize the reuse of pit water for water supply Mines Foreman
Temporary and permanent garland drain will be constructed to contain the catchments of
the mining area and to divert runoff from undisturbed areas through the mining areas
Mines Manager
Natural drains/nallahs/brooklets outside the project area should not be disturbed at any
point of mining operations
Mines Manager
Ensure there is no process effluent generation or discharge from the project area into
water bodies
Mines Foreman
Domestic sewage generated from the project area will be disposed in septic tank and
soak pit system
Mines Foreman
Monthly or after rainfall, inspection for performance of water management structures
and systems
Mines Manager
Conduct ground water and surface water monitoring for parameters specified by CPCB Manager Mines
Source: Proposed by FAE’s & EIA Coordinator
10.5 Air Quality Management
The existing and proposed mining activities would result in the increase of particulate matter
concentrations due to fugitive dust. Water sprinkling twice per day on the haul roads, approach roads in the vicinity
would be undertaken and will be continued as there is possibility for dust generation due to truck mobility. It will be
ensured that vehicles are properly maintained to comply with exhaust emission requirements
TABLE 10.4: PROPOSED CONTROLS FOR AIR ENVIRONMENT
CONTROL RESPONSIBILITY
Generation of dust during excavation is minimized by daily (twice) water sprinkling on
working face and daily (twice) water sprinkling on haul road
Mines Manager
Wet drilling procedure /drills with dust extractor system to control dust generation during
drilling at source itself is implemented
Mines Manager
Maintenance as per operator manual of the equipment and machinery in the mines to
minimizing air pollution
Mines Manager
Ambient Air Quality Monitoring carried out in the project area and in surrounding villages
to access the impact due to the mining activities and the efficacy of the adopted air pollution
control measures
Mines Manager
Provision of Dust Mask to all workers Mines Manager
Greenbelt development all along the periphery of the project area Mines Manager
Source: Proposed by FAE’s & EIA Coordinator
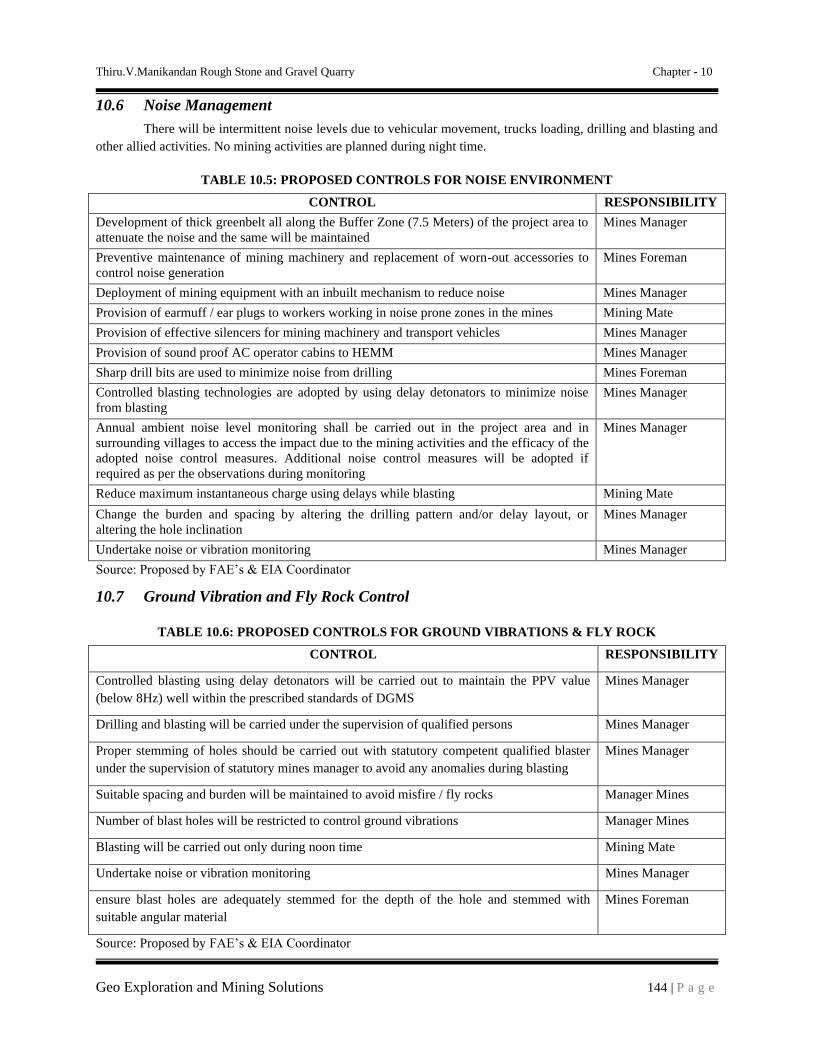
Thiru.V.Manikandan Rough Stone and Gravel Quarry Chapter - 10
Geo Exploration and Mining Solutions 144 | P a g e
10.6 Noise Management
There will be intermittent noise levels due to vehicular movement, trucks loading, drilling and blasting and
other allied activities. No mining activities are planned during night time.
TABLE 10.5: PROPOSED CONTROLS FOR NOISE ENVIRONMENT
CONTROL RESPONSIBILITY
Development of thick greenbelt all along the Buffer Zone (7.5 Meters) of the project area to
attenuate the noise and the same will be maintained
Mines Manager
Preventive maintenance of mining machinery and replacement of worn-out accessories to
control noise generation
Mines Foreman
Deployment of mining equipment with an inbuilt mechanism to reduce noise Mines Manager
Provision of earmuff / ear plugs to workers working in noise prone zones in the mines Mining Mate
Provision of effective silencers for mining machinery and transport vehicles Mines Manager
Provision of sound proof AC operator cabins to HEMM Mines Manager
Sharp drill bits are used to minimize noise from drilling Mines Foreman
Controlled blasting technologies are adopted by using delay detonators to minimize noise
from blasting
Mines Manager
Annual ambient noise level monitoring shall be carried out in the project area and in
surrounding villages to access the impact due to the mining activities and the efficacy of the
adopted noise control measures. Additional noise control measures will be adopted if
required as per the observations during monitoring
Mines Manager
Reduce maximum instantaneous charge using delays while blasting Mining Mate
Change the burden and spacing by altering the drilling pattern and/or delay layout, or
altering the hole inclination
Mines Manager
Undertake noise or vibration monitoring Mines Manager
Source: Proposed by FAE’s & EIA Coordinator
10.7 Ground Vibration and Fly Rock Control
TABLE 10.6: PROPOSED CONTROLS FOR GROUND VIBRATIONS & FLY ROCK
CONTROL RESPONSIBILITY
Controlled blasting using delay detonators will be carried out to maintain the PPV value
(below 8Hz) well within the prescribed standards of DGMS
Mines Manager
Drilling and blasting will be carried under the supervision of qualified persons Mines Manager
Proper stemming of holes should be carried out with statutory competent qualified blaster
under the supervision of statutory mines manager to avoid any anomalies during blasting
Mines Manager
Suitable spacing and burden will be maintained to avoid misfire / fly rocks Manager Mines
Number of blast holes will be restricted to control ground vibrations Manager Mines
Blasting will be carried out only during noon time Mining Mate
Undertake noise or vibration monitoring Mines Manager
ensure blast holes are adequately stemmed for the depth of the hole and stemmed with
suitable angular material
Mines Foreman
Source: Proposed by FAE’s & EIA Coordinator

Thiru.V.Manikandan Rough Stone and Gravel Quarry Chapter - 10
Geo Exploration and Mining Solutions 145 | P a g e
10.8 Biological Environment Management
The proponent will take all necessary steps to avoid the impact on the ecology of the area by adopting
suitable management measures in the planning and implementation stage. During mining, thick plantation will be
carried out around the project periphery, on safety barrier zone, on top benches of quarried out area etc.,
Following control measures are proposed for its management and will be the responsibility of the Mines Manager.
• Greenbelt development all along the safety barrier of the project area
• It is also proposed to implement the greenbelt development programme and post plantation status will be
regularly checked for every season.
• The main attributes that retard the survival of sapling is fugitive dust, this fugitive dust can be controlled by
water sprinkling on the haul roads and installing a sprinkler unit near the newly planted area.
• Year wise greenbelt development will be recorded and monitored
▪ Based on the area of plantation.
▪ Period of plantation
▪ Type of plantation
▪ Spacing between the plants
▪ Type of manuring and fertilizers and its periods
▪ Lopping period, interval of watering
▪ Survival rate
▪ Density of plantation
• The ultimate reclamation planned leaves a congenial environment for development of flora & immigration
of small fauna through green belt and water reservoir. The green belt and water reservoir developed within
the Project at the end of mine life will attract the birds and animals towards the project area in the post
mining period.
10.8.1 Green Belt Development Plan
About 450 nos. of saplings is proposed to be planted for the Mining plan period in safety barrier of applied mine
lease area with survival rate 80%. The greenbelt development plan has been prepared keeping in view the land use
changes that will occur due to mining operation in the area.
TABLE 10.7 PROPOSED GREENBELT ACTIVITIES FOR5 YEAR PLAN PERIOD
Year No. of tress proposed
to be planted
Area to be
covered in m2 Name of the species Survival rate
expected in %
No. of trees
expected to be
grown
I 90 800 Neem, Pongamia
Pinnata, Casuarina
etc.,
80% 72
II 90 800 80% 72
III 90 800 80% 72
IV 90 800 80% 72
V 90 800 80% 72
Source: Conceptual Plan of Approved Mining plan& proposed by FAE’s & EIA Coordinator
The objectives of the greenbelt development plan are –
• Provide a green belt around the periphery of the quarry area to combat the dispersal of dust in the adjoining
areas,
• Protect the erosion of the soil, Conserve moisture for increasing ground water recharging,
• Restore the ecology of the area, restore aesthetic beauty of the locality and meet the requirement of fodder, fuel
and timber of the local community.
A well-planned Green Belt with multi rows (three tiers) preferably with long canopy leaves shall be developed
with dense plantations around the boundary and haul roads to prevent air, dust noise propagation to undesired places
and efforts will be taken for the enhancement of survival rate.
10.8.2 Species Recommended for Plantation
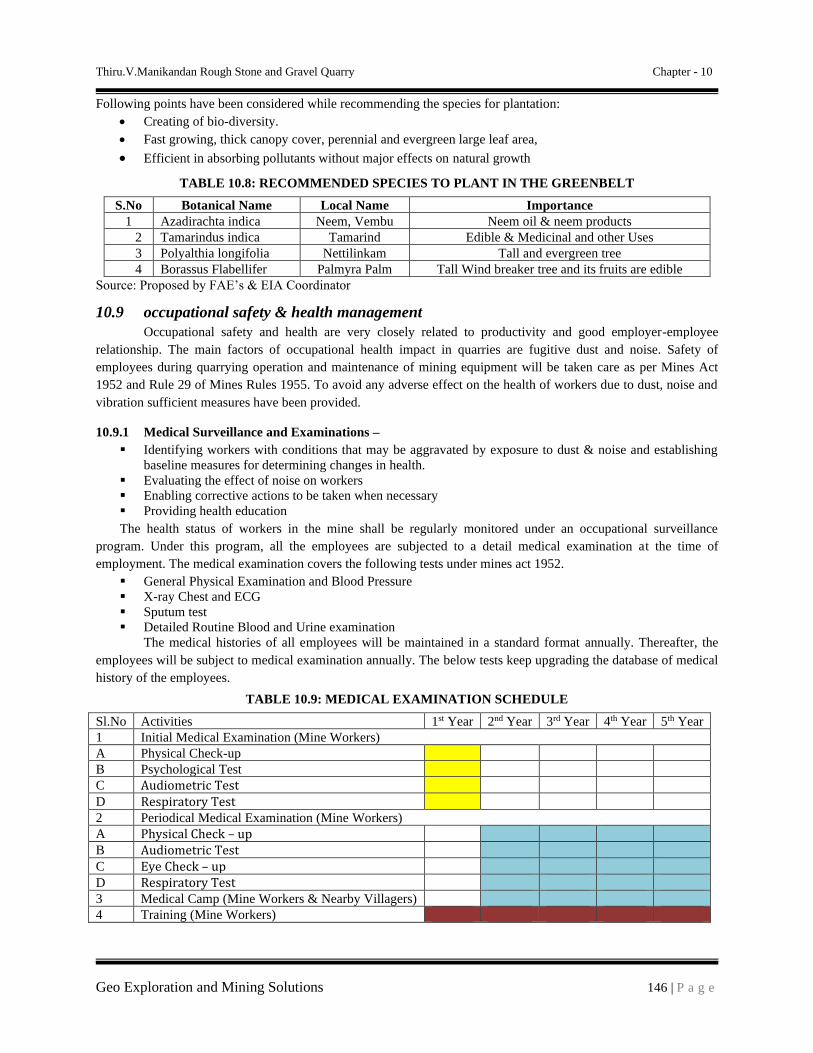
Thiru.V.Manikandan Rough Stone and Gravel Quarry Chapter - 10
Geo Exploration and Mining Solutions 146 | P a g e
Following points have been considered while recommending the species for plantation:
• Creating of bio-diversity.
• Fast growing, thick canopy cover, perennial and evergreen large leaf area,
• Efficient in absorbing pollutants without major effects on natural growth
TABLE 10.8: RECOMMENDED SPECIES TO PLANT IN THE GREENBELT
S.No Botanical Name Local Name Importance
1 Azadirachta indica Neem, Vembu Neem oil & neem products
2 Tamarindus indica Tamarind Edible & Medicinal and other Uses
3 Polyalthia longifolia Nettilinkam Tall and evergreen tree
4 Borassus Flabellifer Palmyra Palm Tall Wind breaker tree and its fruits are edible
Source: Proposed by FAE’s & EIA Coordinator
10.9 occupational safety & health management
Occupational safety and health are very closely related to productivity and good employer-employee
relationship. The main factors of occupational health impact in quarries are fugitive dust and noise. Safety of
employees during quarrying operation and maintenance of mining equipment will be taken care as per Mines Act
1952 and Rule 29 of Mines Rules 1955. To avoid any adverse effect on the health of workers due to dust, noise and
vibration sufficient measures have been provided.
10.9.1 Medical Surveillance and Examinations –
▪ Identifying workers with conditions that may be aggravated by exposure to dust & noise and establishing
baseline measures for determining changes in health.
▪ Evaluating the effect of noise on workers
▪ Enabling corrective actions to be taken when necessary
▪ Providing health education
The health status of workers in the mine shall be regularly monitored under an occupational surveillance
program. Under this program, all the employees are subjected to a detail medical examination at the time of
employment. The medical examination covers the following tests under mines act 1952.
▪ General Physical Examination and Blood Pressure
▪ X-ray Chest and ECG
▪ Sputum test
▪ Detailed Routine Blood and Urine examination
The medical histories of all employees will be maintained in a standard format annually. Thereafter, the
employees will be subject to medical examination annually. The below tests keep upgrading the database of medical
history of the employees.
TABLE 10.9: MEDICAL EXAMINATION SCHEDULE
Sl.No Activities 1st Year 2nd Year 3rd Year 4th Year 5th Year
1 Initial Medical Examination (Mine Workers)
A Physical Check-up
B Psychological Test
C Audiometric Test
D Respiratory Test
2 Periodical Medical Examination (Mine Workers)
A Physical Check – up
B Audiometric Test
C Eye Check – up
D Respiratory Test
3 Medical Camp (Mine Workers & Nearby Villagers)
4 Training (Mine Workers)

Thiru.V.Manikandan Rough Stone and Gravel Quarry Chapter - 10
Geo Exploration and Mining Solutions 147 | P a g e
Medical Follow ups:- Work force will be divided into three targeted groups age wise as follows:-
Age Group PME as per Mines Rules 1955 Special Examination
Less than 25 years Once in a Three Years In case of emergencies
Between 25 to 40 Years Once in a Three Years In case of emergencies
Above 40 Years Once in a Three Years In case of emergencies
Medical help on top priority immediately after diagnosis/ accident is the essence of preventive aspects.
10.9.2 Proposed Occupational Health and Safety Measures –
▪ The mine site will have adequate drinking water supply so that workers do not get dehydrated.
▪ Lightweight and loose fitting clothes having light colours will be preferred to wear.
▪ Noise exposure measurements will be taken to determine the need for noise control strategies.
▪ The personal protective equipment will be provided for mine workers.
▪ Supervisor will be instructed for reporting any problems with hearing protectors or noise control
equipment.
▪ At noisy working activity, exposure time will be minimized.
▪ Dust generating sources will be identified and proper control measure will be adopted.
▪ Periodic medical examinations will be provided for all workers.
▪ Strict observance of the provisions of DGMS Acts, Rules and Regulations in respect of safety both by
management and the workers.
▪ The width of road will be maintained more than thrice the width of the vehicle. A code of traffic rules will
be implemented.
▪ In respect of contract work, safety code for contractors and workers will be implemented. They will be
allowed to work under strict supervision of statutory person/officials only after they will impart training at
vocational training centres. All personal protective equipment's will be provided to them.
▪ A safety committee meeting every month will be organized to discuss the safety of the mines and the
persons employed.
▪ Celebration of annual mines safety week and environmental week in order to develop safety awareness and
harmony amongst employees and co quarry owners.
FIGURE 10.1: PERSONAL PROTECTIVE EQUIPMENT TO THE MINE WORKERS

Thiru.V.Manikandan Rough Stone and Gravel Quarry Chapter - 10
Geo Exploration and Mining Solutions 148 | P a g e
10.9.3 Health and Safety Training Programme
The Proponents will provide special induction program along with machinery manufacturers for the
operators and co-operators to run and maintain the machinery effectively and efficiently. The training program for
the supervisors and office staffs will be arranged in the Group Vocational Training Centres in the State and engage
Environmental Consultants to provide periodical training to all the employees to carry out the mining operation in
and eco-friendly manner.
TABLE 10.10: LIST OF PERIODICAL TRAININGS PROPOSED FOR EMPLOYEES
Course Personnel Frequency Duration Instruction
New-Employee Training
All new employees
exposed to mine
hazards
Once One
week
Employee rights
Supervisor responsibilities
Self-rescue
Respiratory devices
Transportation controls
Communication systems
Escape and emergency
evacuation
Ground control hazards
Occupational health hazards
Electrical hazards
First aid
Explosives
Task Training
Like Drilling, Blasting,
Stemming, safety, Slope
stability, Dewatering, Haul road
maintenance,
Employees
assigned to new
work tasks
Before new
Assignments Variable
Task-specific health &safety
procedures and SOP for
various mining activity.
Supervised practice in
assigned work tasks.
Refresher
Training
All employees
who received new-
hire training
Yearly One
week
Required health and safety
standards
Transportation controls
Communication systems
Escape ways, emergency
evacuations
Fire warning
Ground control hazards
First aid
Electrical hazards
Accident prevention
Explosives
Respirator devices
Hazard
Training
All employees
exposed to mine
hazards
Once Variable
Hazard recognition and
avoidance
Emergency evacuation
procedures
Health standards
Safety rules
Respiratory devices
Source: Proposed by FAE’s & EIA Coordinator as per DGMS Norms

Thiru.V.Manikandan Rough Stone and Gravel Quarry Chapter - 10
Geo Exploration and Mining Solutions 149 | P a g e
10.9.4 Budgetary Provision for Environmental Management –
Adequate budgetary provision has been made by the Company for execution of Environmental
Management Plan. The Table 10.11 gives overall investment on the environmental safeguards and recurring
expenditure for successful monitoring and implementation of control measures.
TABLE 10.11: EMP BUDGET FOR PROPOSED PROJECT
Sl.No. Description Item Capital cost
(Rs. In Lakhs)
Recurring cost
per annum
(Rs. in Lakhs)
1 Occupational health
& safety
Dust Mask, Safety Shoes, Helmets Ear Plugs,
Gloves, Goggles Reflector jacket, Safety Belt,
Medical check ups
1.00 0.60
2 Environmental
Monitoring
Air, Water, Noise & Vibration, Soil Parameters 0.76 0.76
3 Water & Soil
erosion
Garland drains &Settling tanks, check dam/gully
plugs, etc 2.00 0.40
4 Drinking Water Facilities and Sanitation Facilities 1.00 0.25
5 Water Sprinkling Arrangements 0.85 0.20
6 Haul Road Maintenance 1.00 0.30
7 Green belt Development & Plantation 0.85 0.20
8 Environmental Awareness Programme 0.25 0.25
9 Fencing, Fertilizer, Manure, Manpower, etc. 1.88 0.40
Total 9.59 3.36
In order to implement the environmental protection measures, an amount of Rs.9.59 lakhs as capital cost
and recurring cost as Rs. 3.36 lakhs as recurring cost is proposed considering present market price considering
present market scenario for the proposed project.
10.10 CONCLUSION –
Various aspects of mining activities were considered and related impacts were evaluated. Considering all
the possible ways to mitigate the environmental concerns Environmental Management Plan was prepared and fund
has been allocated for the same. The EMP is dynamic, flexible and subjected to periodic review. For project where
the major environmental impacts are associated, EMP will be under regular review. Senior Management responsible
for the project will conduct a review of EMP and its implementation to ensure that the EMP remains effective and
appropriate. Thus, the proper steps will be taken to accomplish all the goals mentioned in the EMP and the project
will bring the positive impact in the study area.
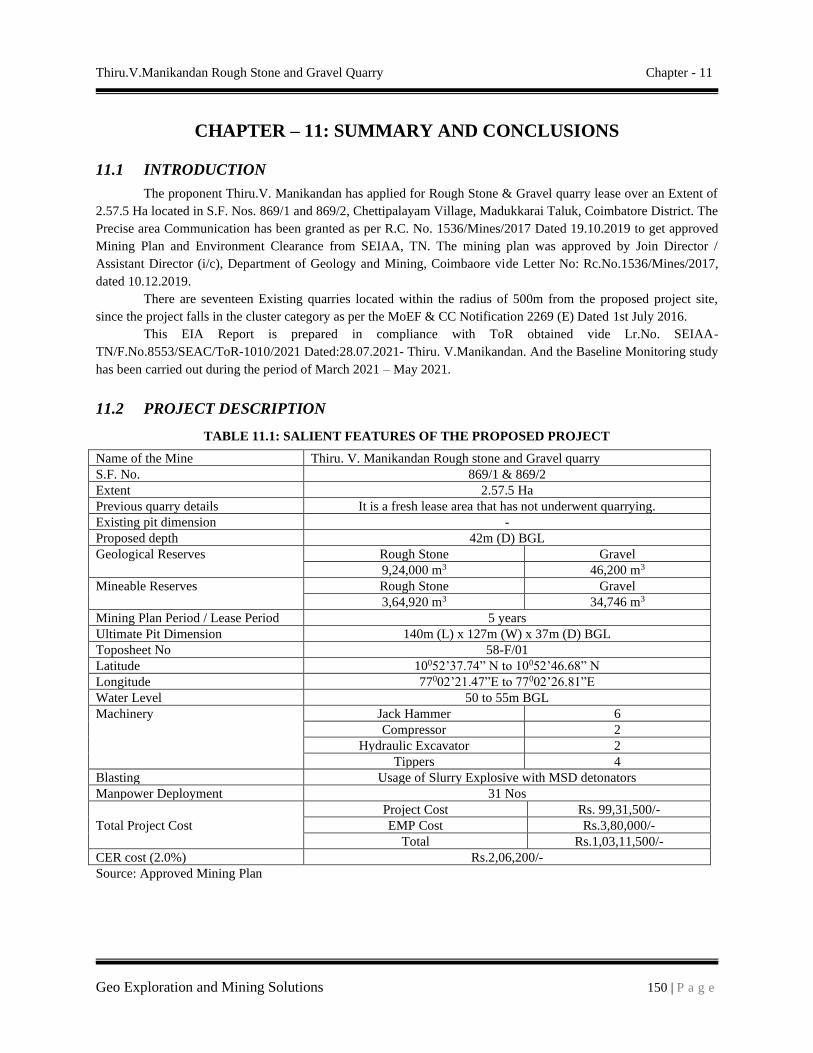
Thiru.V.Manikandan Rough Stone and Gravel Quarry Chapter - 11
Geo Exploration and Mining Solutions 150 | P a g e
CHAPTER – 11: SUMMARY AND CONCLUSIONS
11.1 INTRODUCTION
The proponent Thiru.V. Manikandan has applied for Rough Stone & Gravel quarry lease over an Extent of
2.57.5 Ha located in S.F. Nos. 869/1 and 869/2, Chettipalayam Village, Madukkarai Taluk, Coimbatore District. The
Precise area Communication has been granted as per R.C. No. 1536/Mines/2017 Dated 19.10.2019 to get approved
Mining Plan and Environment Clearance from SEIAA, TN. The mining plan was approved by Join Director /
Assistant Director (i/c), Department of Geology and Mining, Coimbaore vide Letter No: Rc.No.1536/Mines/2017,
dated 10.12.2019.
There are seventeen Existing quarries located within the radius of 500m from the proposed project site,
since the project falls in the cluster category as per the MoEF & CC Notification 2269 (E) Dated 1st July 2016.
This EIA Report is prepared in compliance with ToR obtained vide Lr.No. SEIAA-
TN/F.No.8553/SEAC/ToR-1010/2021 Dated:28.07.2021- Thiru. V.Manikandan. And the Baseline Monitoring study
has been carried out during the period of March 2021 – May 2021.
11.2 PROJECT DESCRIPTION
TABLE 11.1: SALIENT FEATURES OF THE PROPOSED PROJECT
Name of the Mine Thiru. V. Manikandan Rough stone and Gravel quarry
S.F. No. 869/1 & 869/2
Extent 2.57.5 Ha
Previous quarry details It is a fresh lease area that has not underwent quarrying.
Existing pit dimension -
Proposed depth 42m (D) BGL
Geological Reserves Rough Stone Gravel
9,24,000 m3 46,200 m3
Mineable Reserves Rough Stone Gravel
3,64,920 m3 34,746 m3
Mining Plan Period / Lease Period 5 years
Ultimate Pit Dimension 140m (L) x 127m (W) x 37m (D) BGL
Toposheet No 58-F/01
Latitude 10052’37.74” N to 10052’46.68” N
Longitude 77002’21.47”E to 77002’26.81”E
Water Level 50 to 55m BGL
Machinery Jack Hammer 6
Compressor 2
Hydraulic Excavator 2
Tippers 4
Blasting Usage of Slurry Explosive with MSD detonators
Manpower Deployment 31 Nos
Total Project Cost
Project Cost Rs. 99,31,500/-
EMP Cost Rs.3,80,000/-
Total Rs.1,03,11,500/-
CER cost (2.0%) Rs.2,06,200/-
Source: Approved Mining Plan
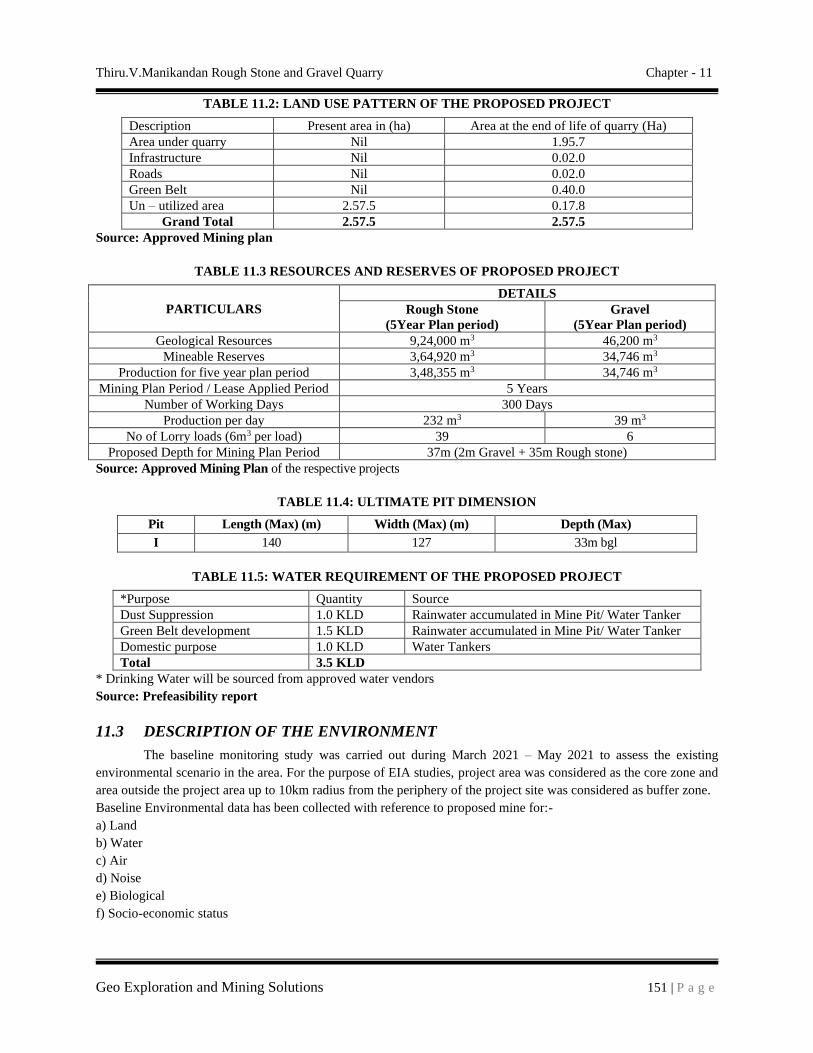
Thiru.V.Manikandan Rough Stone and Gravel Quarry Chapter - 11
Geo Exploration and Mining Solutions 151 | P a g e
TABLE 11.2: LAND USE PATTERN OF THE PROPOSED PROJECT
Description Present area in (ha) Area at the end of life of quarry (Ha)
Area under quarry Nil 1.95.7
Infrastructure Nil 0.02.0
Roads Nil 0.02.0
Green Belt Nil 0.40.0
Un – utilized area 2.57.5 0.17.8
Grand Total 2.57.5 2.57.5
Source: Approved Mining plan
TABLE 11.3 RESOURCES AND RESERVES OF PROPOSED PROJECT
PARTICULARS
DETAILS
Rough Stone
(5Year Plan period)
Gravel
(5Year Plan period)
Geological Resources 9,24,000 m3 46,200 m3
Mineable Reserves 3,64,920 m3 34,746 m3
Production for five year plan period 3,48,355 m3 34,746 m3
Mining Plan Period / Lease Applied Period 5 Years
Number of Working Days 300 Days
Production per day 232 m3 39 m3
No of Lorry loads (6m3 per load) 39 6
Proposed Depth for Mining Plan Period 37m (2m Gravel + 35m Rough stone)
Source: Approved Mining Plan of the respective projects
TABLE 11.4: ULTIMATE PIT DIMENSION
Pit Length (Max) (m) Width (Max) (m) Depth (Max)
I 140 127 33m bgl
TABLE 11.5: WATER REQUIREMENT OF THE PROPOSED PROJECT
*Purpose Quantity Source
Dust Suppression 1.0 KLD Rainwater accumulated in Mine Pit/ Water Tanker
Green Belt development 1.5 KLD Rainwater accumulated in Mine Pit/ Water Tanker
Domestic purpose 1.0 KLD Water Tankers
Total 3.5 KLD
* Drinking Water will be sourced from approved water vendors
Source: Prefeasibility report
11.3 DESCRIPTION OF THE ENVIRONMENT
The baseline monitoring study was carried out during March 2021 – May 2021 to assess the existing
environmental scenario in the area. For the purpose of EIA studies, project area was considered as the core zone and
area outside the project area up to 10km radius from the periphery of the project site was considered as buffer zone.
Baseline Environmental data has been collected with reference to proposed mine for:-
a) Land
b) Water
c) Air
d) Noise
e) Biological
f) Socio-economic status
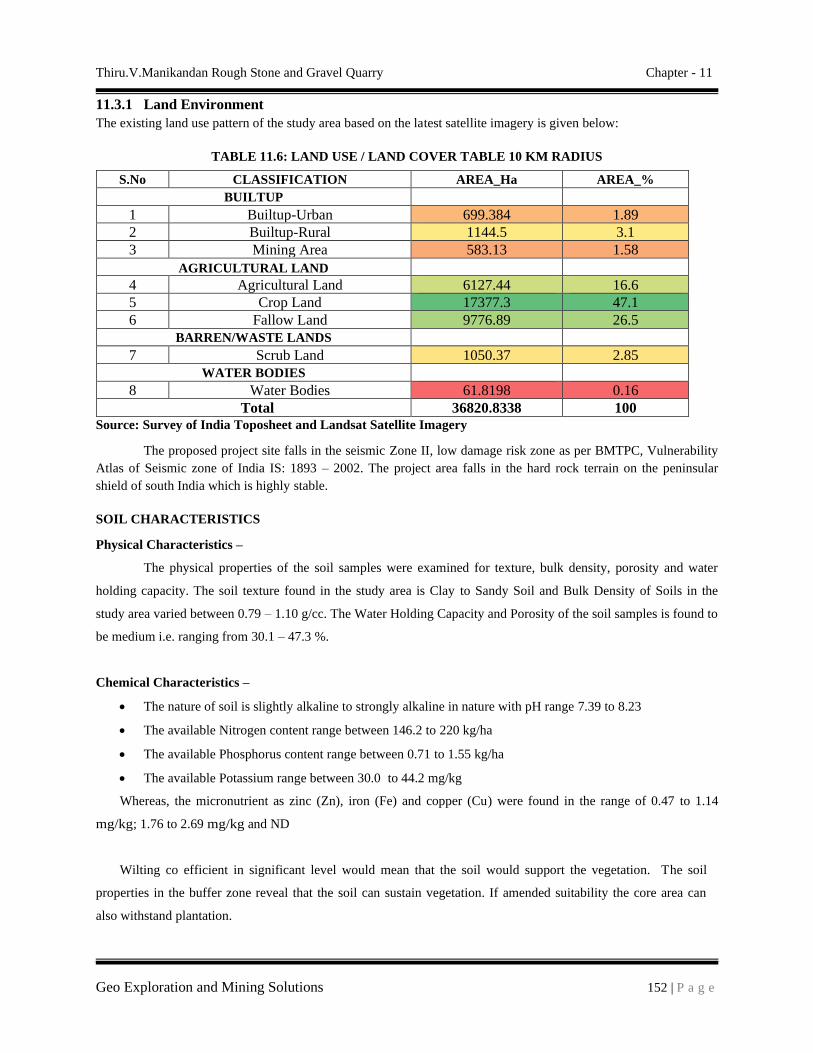
Thiru.V.Manikandan Rough Stone and Gravel Quarry Chapter - 11
Geo Exploration and Mining Solutions 152 | P a g e
11.3.1 Land Environment
The existing land use pattern of the study area based on the latest satellite imagery is given below:
TABLE 11.6: LAND USE / LAND COVER TABLE 10 KM RADIUS
S.No CLASSIFICATION AREA_Ha AREA_%
BUILTUP
1 Builtup-Urban 699.384 1.89
2 Builtup-Rural 1144.5 3.1
3 Mining Area 583.13 1.58
AGRICULTURAL LAND
4 Agricultural Land 6127.44 16.6
5 Crop Land 17377.3 47.1
6 Fallow Land 9776.89 26.5
BARREN/WASTE LANDS
7 Scrub Land 1050.37 2.85
WATER BODIES
8 Water Bodies 61.8198 0.16
Total 36820.8338 100
Source: Survey of India Toposheet and Landsat Satellite Imagery
The proposed project site falls in the seismic Zone II, low damage risk zone as per BMTPC, Vulnerability
Atlas of Seismic zone of India IS: 1893 – 2002. The project area falls in the hard rock terrain on the peninsular
shield of south India which is highly stable.
SOIL CHARACTERISTICS
Physical Characteristics –
The physical properties of the soil samples were examined for texture, bulk density, porosity and water
holding capacity. The soil texture found in the study area is Clay to Sandy Soil and Bulk Density of Soils in the
study area varied between 0.79 – 1.10 g/cc. The Water Holding Capacity and Porosity of the soil samples is found to
be medium i.e. ranging from 30.1 – 47.3 %.
Chemical Characteristics –
• The nature of soil is slightly alkaline to strongly alkaline in nature with pH range 7.39 to 8.23
• The available Nitrogen content range between 146.2 to 220 kg/ha
• The available Phosphorus content range between 0.71 to 1.55 kg/ha
• The available Potassium range between 30.0 to 44.2 mg/kg
Whereas, the micronutrient as zinc (Zn), iron (Fe) and copper (Cu) were found in the range of 0.47 to 1.14
mg/kg; 1.76 to 2.69 mg/kg and ND
Wilting co efficient in significant level would mean that the soil would support the vegetation. The soil
properties in the buffer zone reveal that the soil can sustain vegetation. If amended suitability the core area can
also withstand plantation.
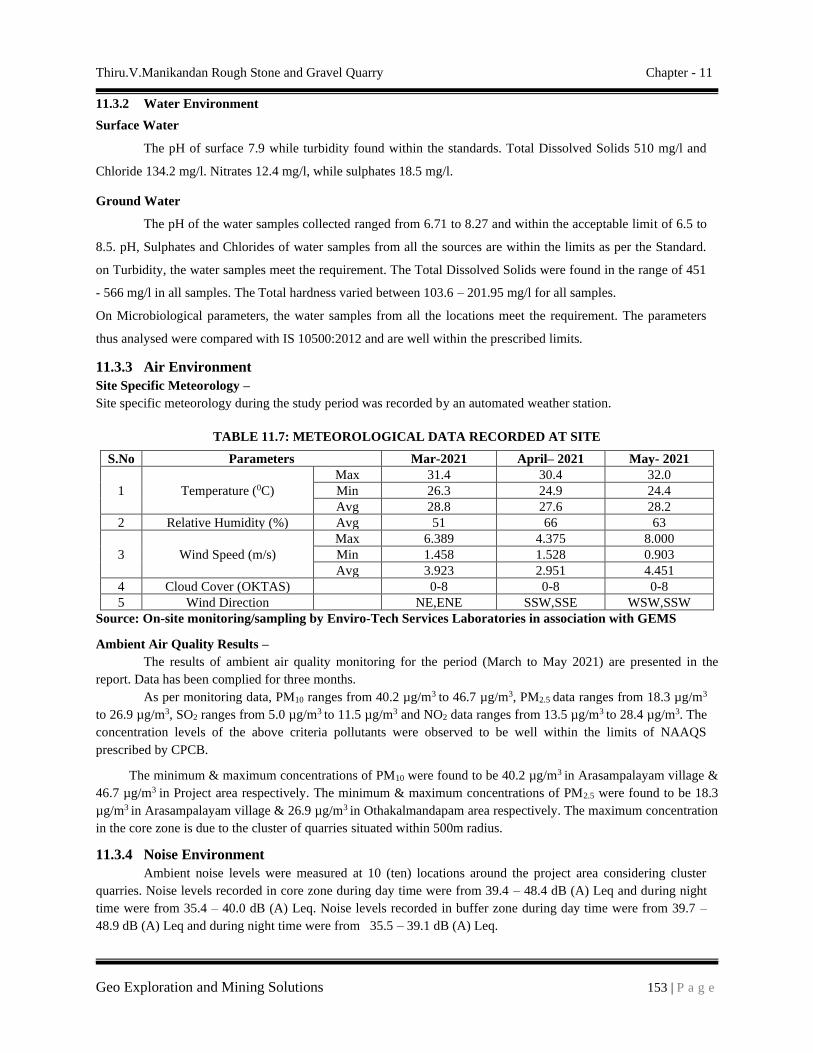
Thiru.V.Manikandan Rough Stone and Gravel Quarry Chapter - 11
Geo Exploration and Mining Solutions 153 | P a g e
11.3.2 Water Environment
Surface Water
The pH of surface 7.9 while turbidity found within the standards. Total Dissolved Solids 510 mg/l and
Chloride 134.2 mg/l. Nitrates 12.4 mg/l, while sulphates 18.5 mg/l.
Ground Water
The pH of the water samples collected ranged from 6.71 to 8.27 and within the acceptable limit of 6.5 to
8.5. pH, Sulphates and Chlorides of water samples from all the sources are within the limits as per the Standard.
on Turbidity, the water samples meet the requirement. The Total Dissolved Solids were found in the range of 451
- 566 mg/l in all samples. The Total hardness varied between 103.6 – 201.95 mg/l for all samples.
On Microbiological parameters, the water samples from all the locations meet the requirement. The parameters
thus analysed were compared with IS 10500:2012 and are well within the prescribed limits.
11.3.3 Air Environment
Site Specific Meteorology –
Site specific meteorology during the study period was recorded by an automated weather station.
TABLE 11.7: METEOROLOGICAL DATA RECORDED AT SITE
S.No Parameters Mar-2021 April– 2021 May- 2021
1 Temperature (0C)
Max 31.4 30.4 32.0
Min 26.3 24.9 24.4
Avg 28.8 27.6 28.2
2 Relative Humidity (%) Avg 51 66 63
3 Wind Speed (m/s)
Max 6.389 4.375 8.000
Min 1.458 1.528 0.903
Avg 3.923 2.951 4.451
4 Cloud Cover (OKTAS) 0-8 0-8 0-8
5 Wind Direction NE,ENE SSW,SSE WSW,SSW
Source: On-site monitoring/sampling by Enviro-Tech Services Laboratories in association with GEMS
Ambient Air Quality Results –
The results of ambient air quality monitoring for the period (March to May 2021) are presented in the
report. Data has been complied for three months.
As per monitoring data, PM10 ranges from 40.2 µg/m3 to 46.7 µg/m3, PM2.5 data ranges from 18.3 µg/m3
to 26.9 µg/m3, SO2 ranges from 5.0 µg/m3 to 11.5 µg/m3 and NO2 data ranges from 13.5 µg/m3 to 28.4 µg/m3. The
concentration levels of the above criteria pollutants were observed to be well within the limits of NAAQS
prescribed by CPCB.
The minimum & maximum concentrations of PM10 were found to be 40.2 µg/m3 in Arasampalayam village &
46.7 µg/m3 in Project area respectively. The minimum & maximum concentrations of PM2.5 were found to be 18.3
µg/m3 in Arasampalayam village & 26.9 µg/m3 in Othakalmandapam area respectively. The maximum concentration
in the core zone is due to the cluster of quarries situated within 500m radius.
11.3.4 Noise Environment
Ambient noise levels were measured at 10 (ten) locations around the project area considering cluster
quarries. Noise levels recorded in core zone during day time were from 39.4 – 48.4 dB (A) Leq and during night
time were from 35.4 – 40.0 dB (A) Leq. Noise levels recorded in buffer zone during day time were from 39.7 –
48.9 dB (A) Leq and during night time were from 35.5 – 39.1 dB (A) Leq.

Thiru.V.Manikandan Rough Stone and Gravel Quarry Chapter - 11
Geo Exploration and Mining Solutions 154 | P a g e
The values of noise observed in some of the areas are primarily owing to quarrying activities due to
cluster of quarries within 500m radius, movement of vehicles and other anthropogenic activities. Noise monitoring
results reveal that the maximum & minimum noise levels at day time were recorded in the range of 48.7 dB(A) in
core zone and 39.4 dB(A) in project area and 40.0 dB(A) in Project area & 35.5dB(A) in Project area respectively
in night time. Thus, the noise level for Industrial and Residential area meets the requirements of CPCB.
11.3.5 Biological Environment
There is no schedule I species of animals observed within study area as per Wildlife Protection Act 1972 as
well as no species is in vulnerable, endangered or threatened category as per IUCN. There is no endangered red list
species found in the study area. Hence this small mining operation over short period of time will not have any
significant impact on the surrounding flora and fauna.
11.3.6 Socio-Economic Environment
An attempt has been made to assess the impact of the proposed mining project at Pachapalayam and
Arasampalayam Village on Socio-economic aspect of the study area. The various attributes that have been taken into
account are population composition, employment generation, occupational shift, household income and
consumption pattern. Implementation of the Proposed Mine Project will generate both direct and indirect
employment. Besides, Mining operation will be legally valid and it will bring income to the state exchequer. At
present seasonal agriculture is the main occupation of the people as more than half of the population depends on it.
With the implementation of the proposed mining project the occupational pattern of the people in the area will
change making more people engaged in mining-based activities rather in seasonal agriculture.
11.4 ANTICIPATED ENVIRONMENTAL IMPACTS AND MITIGATION MEASURES
The summary of anticipated adverse environmental impacts due to the proposed project and mitigation
measures are given below: -
TABLE 11.8: ANTICIPATED IMPACTS & MITIGATION MEASURES
Impact Mitigation Measure
Land Environment
▪ Destruction of natural landscapes
▪ Changes in soil characteristics
▪ Soil erosion and slope instability
▪ Mining will be carried out as per approved mine plan in
scientific and systematic way
▪ Safety Zone or Buffer area will be maintained and will not be
mined and instead plantation will be carried out in the safety
zone
▪ Barbed wire fencing will be provided all along the proposed
mine boundary
▪ At conceptual stage, the land use pattern of the quarry will be
changed into Greenbelt area and temporary reservoir
▪ Construction of garland
▪ Construction of garland drains all around the quarry pit and
construction of settling traps at strategic location in lower
elevations to prevent soil erosion due to surface runoff during
rainfall and also to collect the storm water for various uses
within the proposed area
Water Environment
▪ Decrease in aquifer recharge and
increase in surface runoff;
▪ Disturbance to land drainage, overload
and erosion of watercourses;
▪ Changes to the surface over which water
▪ Construction of garland drains all around the quarry pit and
construction of settling traps at strategic location in lower
elevations to prevent soil erosion due to surface runoff during
rainfall and also to collect the storm water for various uses
within the proposed area

Thiru.V.Manikandan Rough Stone and Gravel Quarry Chapter - 11
Geo Exploration and Mining Solutions 155 | P a g e
flows;
▪ Changes to surface and groundwater
resources quantity and quality due to
stream blockage and contamination by
particulate matter or waste;
▪ Contamination of aquifers due to
removal of the natural filter medium.
▪ De-silting will be carried out before and immediately after
the monsoon season and the settling tank and drains will be
cleaned weekly, especially during monsoons
▪ Domestic sewage from site office & urinals/latrines provided
in project area will be discharged through septic tank
followed by soak pit system.
▪ Tippers & HEMM will be washed in a designated area and
the washed water will be routed through drains to a settling
tank, which has an oil & grease trap, only clear water will be
reused for greenbelt development.
Air Environment
▪ Generation of Fugitive Dust
▪ Dust will be generated mainly during
excavation, loading &unloading
activities.
▪ Gaseous pollutants will by generated
mostly by the traffic.
▪ Reduction in visibility due to dust
plumes.
▪ Coating of surfaces leading to
annoyance and loss of amenity.
▪ Physical and/or chemical contamination
and corrosion.
▪ Increase in the concentration of
suspended particles in runoff water.
▪ Coating of vegetation leading to reduced
photosynthesis,
▪ Inhibited growth, destroying of foliage,
degradation of crops;
▪ Increase in health hazards due to
inhalation of dust.
▪ Haul roads will be well maintained by sprinkling water twice
a day
▪ The access road will be cleaned and brushed to ensure that
mud and dust deposits do not accumulate.
▪ To ensure that dust and debris is minimised on the access
road, all the tipper drivers will be instructed to use water
spray system on all the tyres and spray water on the loaded
material that is provided at the compound area before leaving
the site
▪ Speed restrictions will be imposed to avoid spillage of loaded
materials upon the road and to reduce wear and tear of the
road.
▪ Weekly inspections of the condition of the access road by
competent person employed, and immediate action will be
taken to address any potholes or damage to the road surface.
▪ Dust wetting agents can be mixed with the water applied to
haul roads during hot, dry weather conditions to increase the
duration that the road surface remains damp.
▪ Personal Protective Equipment’s will be provided to all
workers
▪ All drilling rods used will have dust suppression systems
fitted which injects water into the hole.
▪ Wet gunny bags will be used as a cover while drilling.
▪ The blast zone will be kept damp by the application of water
from the rain gun fitted to the water tanker prior to each blast
to control any fugitive dust emissions that could arise from
the surface during detonation.
▪ A daily visual inspection shall be conducted by the site
manager who will keep a daily log of all process operations
and site activities and note any malfunctions which could
lead to abnormal emissions from the quarry operations.
▪ A site speed limit of 20 km/h will be set to minimise the
potential for dust generation
▪ Weekly maintenance programme to identify machinery due
for maintenance, based on the number of hours it has been in
operation.
▪ Air filters are renewed after every 1000 hours of use, unless
otherwise indicated by an on board computer system.
▪ All site machineries & tippers will be serviced and
maintained 6 month once and drivers will report any defects
immediately to the site manager to enable repairs to be
carried out promptly.
Noise & Vibration
▪ Annoyance and deterioration of the
quality of life;
▪ Usage of sharp drill bits while drilling which will help in
reducing noise;

Thiru.V.Manikandan Rough Stone and Gravel Quarry Chapter - 11
Geo Exploration and Mining Solutions 156 | P a g e
▪ Propelling of rocks fragments by
blasting.
▪ Shaking of buildings and people due to
blasting;
▪ Secondary blasting will be totally avoided and hydraulic rock
breaker will be used for breaking boulders;
▪ Controlled blasting with proper spacing, burden, stemming
and optimum charge/delay will be maintained;
▪ The blasting will be carried out during favorable atmospheric
condition and less human activity timings by using
nonelectrical initiation system;
▪ Proper maintenance, oiling and greasing of machines will be
done every week to reduce generation of noise;
▪ Provision of sound insulated chambers for the workers
working on machines (HEMM) producing higher levels of
noise;
▪ Silencers / mufflers will be installed in all machineries;
▪ Green Belt/Plantation will be developed around the project
area and along the haul roads. The plantation minimizes
propagation of noise;
▪ Personal Protective Equipment (PPE) like ear muffs/ear
plugs will be provided to the operators of HEMM and
persons working near HEMM and their use will be ensured
though training and awareness.
Biological Environment
▪ Direct impacts include land clearance
and excavation causing destruction of
flora and fauna and loss of habitats;
▪ Indirect impacts include habitat
degradation due to noise, dust, and
human activity.
▪ Only some common herbs, shrubs and grass will be cleared.
So there will be no impact on the biodiversity.
▪ Green belt development with suitable species will enhance
the biodiversity of the project area.
▪ The core zone or buffer zone does not encompass any
threatened flora or fauna species.
Socio-Economic Environment
▪ Health and safety of workers and the
general public;
▪ Increase in traffic volumes and sizes of
road vehicles;
▪ Economic issues, including the increase
in employment opportunities;
▪ The mining activity puts negligible change in the socio
economic profile.
▪ Around 170 local workers will get employment opportunities
along with periodical training to generate local skills.
▪ New patterns of indirect employment/ income will generate.
▪ Regular health check-up camp.
▪ Assistance to schools and scholarship to children will be
provided.
Occupational Health & Safety
▪ Exposure to Dust
▪ Noise and Vibration Exposure
▪ Physical Hazards
▪ Respiratory hazards due to Dust exposure
▪ Provision of rest shelters for mine workers with amenities
like drinking water etc.
▪ All safety measures like use of safety appliances, such as
dust masks, helmets, shoes, safety awareness programs,
awards, posters, slogans related to safety etc.
▪ Training of employees for use of safety appliances and first
aid in vocational training center.
▪ Weekly maintenance and testing of all equipment as per
manufacturers’ guidelines.
▪ Pre placement and Yearly Medical Examination of all
workers by a medical Officer
▪ First Aid facility will be provided at the mine site.
▪ Close surveillance of the factors in working environment and
work practices which may affect environment and worker’s
health by the mines manager employed.
▪ Working of mine as per approved mining plan and
environmental plans
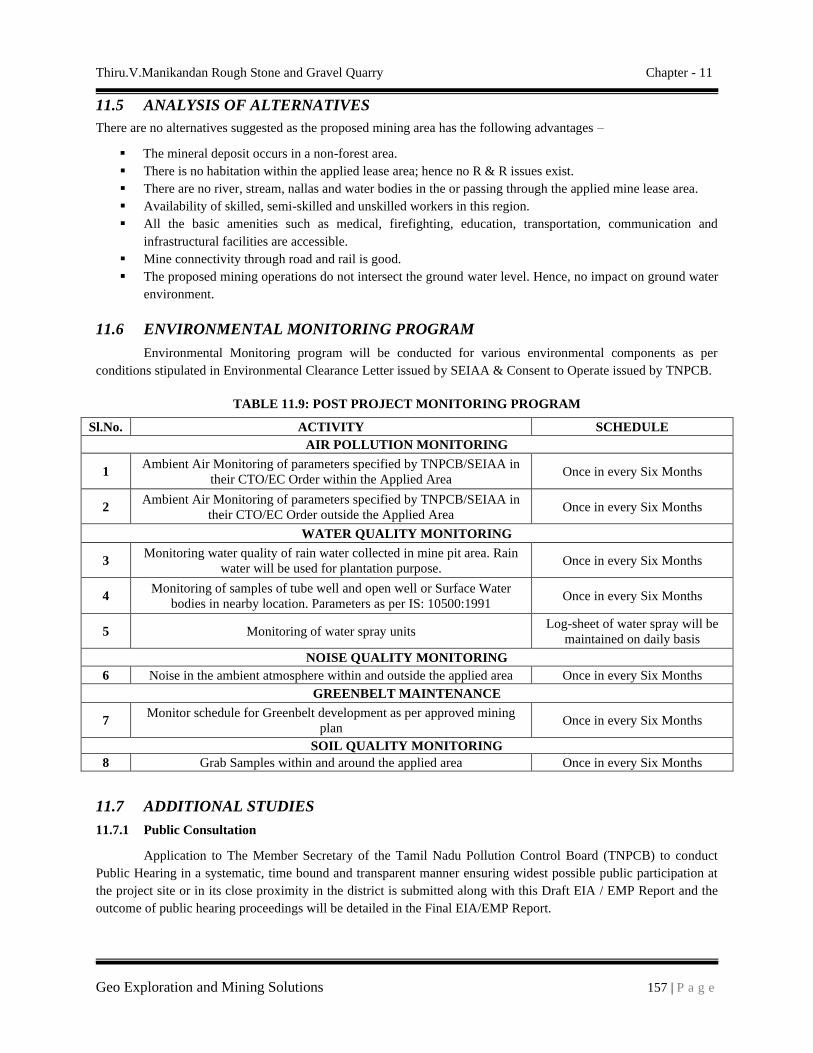
Thiru.V.Manikandan Rough Stone and Gravel Quarry Chapter - 11
Geo Exploration and Mining Solutions 157 | P a g e
11.5 ANALYSIS OF ALTERNATIVES
There are no alternatives suggested as the proposed mining area has the following advantages –
▪ The mineral deposit occurs in a non-forest area.
▪ There is no habitation within the applied lease area; hence no R & R issues exist.
▪ There are no river, stream, nallas and water bodies in the or passing through the applied mine lease area.
▪ Availability of skilled, semi-skilled and unskilled workers in this region.
▪ All the basic amenities such as medical, firefighting, education, transportation, communication and
infrastructural facilities are accessible.
▪ Mine connectivity through road and rail is good.
▪ The proposed mining operations do not intersect the ground water level. Hence, no impact on ground water
environment.
11.6 ENVIRONMENTAL MONITORING PROGRAM
Environmental Monitoring program will be conducted for various environmental components as per
conditions stipulated in Environmental Clearance Letter issued by SEIAA & Consent to Operate issued by TNPCB.
TABLE 11.9: POST PROJECT MONITORING PROGRAM
Sl.No. ACTIVITY SCHEDULE
AIR POLLUTION MONITORING
1 Ambient Air Monitoring of parameters specified by TNPCB/SEIAA in
their CTO/EC Order within the Applied Area Once in every Six Months
2 Ambient Air Monitoring of parameters specified by TNPCB/SEIAA in
their CTO/EC Order outside the Applied Area Once in every Six Months
WATER QUALITY MONITORING
3 Monitoring water quality of rain water collected in mine pit area. Rain
water will be used for plantation purpose. Once in every Six Months
4 Monitoring of samples of tube well and open well or Surface Water
bodies in nearby location. Parameters as per IS: 10500:1991 Once in every Six Months
5 Monitoring of water spray units Log-sheet of water spray will be
maintained on daily basis
NOISE QUALITY MONITORING
6 Noise in the ambient atmosphere within and outside the applied area Once in every Six Months
GREENBELT MAINTENANCE
7 Monitor schedule for Greenbelt development as per approved mining
plan Once in every Six Months
SOIL QUALITY MONITORING
8 Grab Samples within and around the applied area Once in every Six Months
11.7 ADDITIONAL STUDIES
11.7.1 Public Consultation
Application to The Member Secretary of the Tamil Nadu Pollution Control Board (TNPCB) to conduct
Public Hearing in a systematic, time bound and transparent manner ensuring widest possible public participation at
the project site or in its close proximity in the district is submitted along with this Draft EIA / EMP Report and the
outcome of public hearing proceedings will be detailed in the Final EIA/EMP Report.

Thiru.V.Manikandan Rough Stone and Gravel Quarry Chapter - 11
Geo Exploration and Mining Solutions 158 | P a g e
11.7.2 Risk Analysis & Disaster Management Plan
The methodology for the risk assessment has been based on the specific risk assessment guidance issued by
the Directorate General of Mine Safety (DGMS), Dhanbad, vide Circular No.13 of 2002, dated 31stDecember, 2002.
The DGMS risk assessment process is intended to identify existing and probable hazards in the work environment
and all operations and assess the risk levels of those hazards in order to prioritize those that need immediate
attention. Further, mechanisms responsible for these hazards are identified and their control measures, set to
timetable are recorded along with pinpointed responsibilities.
In the unlikely event that a consequence has occurred, disaster management kicks in. This includes
instituting procedures pertaining to a number of issues such as communication, rescue, and rehabilitation. These are
addressed in the disaster management plan. Both, the RA and DMP, are living documents and need to be updated
whenever there are changes in operations, equipment, or procedures Assessment is all about preventing accidents
and taking necessary steps to prevent it from happening.
The Disaster Management Plan (DMP) is a guide, giving general considerations, directions, and procedures
for handling emergencies likely to arise from planned operations. The DMP has been prepared on the basis of the
Risk Assessment and related findings covered in the report.
11.8 PROJECT BENEFITS Various benefits are envisaged due to the proposed mine and a comprehensive description of various
advantages and benefits anticipated from the proposed project to the locality, neighbourhood, region and nation as a
whole are –
▪ Improved road communication
▪ Rain water harvesting structures to augment the water availability for irrigation and plantation and ground
water recharge
▪ Creation of community assets (infrastructure) like school buildings, village roads/ linked roads, dispensary
& health Centre, community Centre, market place etc.,
▪ Strengthening of existing community facilities through the Community Development Programme
▪ Skill development & capacity building like vocational training
▪ Awareness program and community activities, like health camps, medical aids, sports & cultural activities,
plantation etc.
In order to implement the environmental protection measures, budget is proposed considering present
market price considering present market scenario in the below table for respective proposed projects.
TABLE 11.14: EMP BUDGET
Sl.No. Description Item Capital cost
(Rs. In Lakhs)
Recurring cost
per annum
(Rs. in Lakhs)
1 Occupational health
& safety
Dust Mask, Safety Shoes, Helmets Ear Plugs,
Gloves, Goggles Reflector jacket, Safety Belt,
Medical check ups
1.00 0.60
2 Environmental
Monitoring
Air, Water, Noise & Vibration, Soil Parameters 0.76 0.76
3 Water & Soil
erosion
Garland drains &Settling tanks, check dam/gully
plugs, etc 2.00 0.40
4 Drinking Water Facilities and Sanitation Facilities 1.00 0.25
5 Water Sprinkling Arrangements 0.85 0.20
6 Haul Road Maintenance 1.00 0.30
7 Green belt Development & Plantation 0.85 0.20
8 Environmental Awareness Programme 0.25 0.25
9 Fencing, Fertilizer, Manure, Manpower, etc. 1.88 0.40
Total 9.59 3.36

Thiru.V.Manikandan Rough Stone and Gravel Quarry Chapter - 11
Geo Exploration and Mining Solutions 159 | P a g e
11.9 CONCLUSION
EIA study was performed as per the approved ToR and Standard ToR. Various environmental attributes
were studied relating with aspects of mining activities. The related impacts were identified and evaluated.
Considering all the possible ways to mitigate the environmental concerns Environmental Management Plan was
prepared and accordingly fund was allocated. The EMP has been dynamic, flexible and subject to periodic review.
CER activities were identified and for its time bound implementation, fund has been allocated.
The project will increase the revenue of the State Govt. as well as it will help in the social upliftment of the
local community. The green belt development programme will help in increasing the green cover in the area. Thus,
the proposed project is not likely to affect the environment or adjacent ecosystem adversely.
The Mine Management will be responsible for the project review of EMP and its implementation to ensure
that the EMP remains effective and appropriate. Thus, the proper steps will be taken to accomplish all the goals
mentioned in the EMP and the project will bring the positive impact in the study area.

Thiru.V.Manikandan Rough Stone and Gravel Quarry Chapter - 12
Geo Exploration and Mining Solutions 160 | P a g e
CHAPTER 12.0: DISCLOSURE OF CONSULTANTS
The Project Proponent Thiru.V. Manikandan have engaged M/s Geo Exploration and Mining Solutions, an
Accredited Organization under Quality Council of India – National Accreditation Board for Education & Training,
New Delhi, for carrying out the EIA Study as per the ToR Issued.
Name and address of the consultancy:
GEO EXPLORATION AND MINING SOLUTIONS
No 17, Advaitha Ashram Road,
Alagapuram, Salem – 636 004
Tamil Nadu, India
Email: [email protected]
Web: www.gemssalem.com
Phone: 0427 2431989.
The Accredited Experts and associated members who were engaged for this EIA study as given below –
Sl.No. Name of the expert In house/ Empanelled EIA Coordinator FAE
Sector Category Sector Category
1 Dr. M. Ifthikhar Ahmed In-house 1 A
WP
GEO
SC
B
A
A
2 Dr. P. Thangaraju In-house - - HG
GEO
A
A
3 Mr. A. Jagannathan In-house - -
AP
NV
SHW
B
A
B
4 Mr. N. Senthilkumar Empanelled 38
28
B
B
AQ
WP
RH
B
B
A
5 Mrs. Jisha parameswaran In-house - - SW B
6 Mr. Govindasamy In-house - - WP B
7 Mrs. K. Anitha In-house - - SE A
8 Mrs. Amirtham In-house - - EB B
9 Mr. Alagappa Moses Empanelled - - EB A
10 Mr. A. Allimuthu In-house - - LU B
11 Mr. S. Pavel Empanelled - - RH B
12 Mr. J. R. Vikram Krishna Empanelled - - SHW
RH
A
A Abbreviations
EC EIA Coordinator
AEC Associate EIA Coordinator
FAE Functional Area Expert
FAA Functional Area Associates
TM Team Member
GEO Geology
WP Water pollution monitoring, prevention and control
AP Air pollution monitoring, prevention and control
LU Land Use
AQ Meteorology, air quality modeling, and prediction
EB Ecology and bio-diversity
NV Noise and vibration
SE Socio economics
HG Hydrology, ground water and water conservation
SC Soil conservation
RH Risk assessment and hazard management
SHW Solid and hazardous wastes
MSW Municipal Solid Wastes
ISW Industrial Solid Wastes
HW Hazardous Wastes

Thiru.V.Manikandan Rough Stone and Gravel Quarry Chapter - 12
Geo Exploration and Mining Solutions 161 | P a g e
DECLARATION BY EXPERTS CONTRIBUTING TO THE EIA/EMP
Declaration by experts contributing to the EIA/EMP for Rough Stone & Gravel Quarry over an Extent of
2.57.5 ha in Chettipalayam Village of Madukkarai Taluk, Coimbatore District of Tamil Nadu. It is also certified that
information furnished in the above EIA study are true and correct to the best of our Knowledge.
I, hereby, certify that I was a part of the EIA team in the following capacity that developed the EIA/EMP Report.
Name: Dr. M. Ifthikhar Ahmed
Designation: EIA Coordinator
Date & Signature:
Period of Involvement: January 2019 to till date
Associated Team Member with EIA Coordinator:
1. Mr. S. Nagamani
2. Mr. Viswanathan
3. Mr. Santhoshkumar
4. Mr. S. Ilavarasan
FUNCTIONAL AREA EXPERTS ENGAGED IN THE PROJECT
Sl.
No.
Functional
Area Involvement
Name of the
Expert/s Signature
1 AP
▪ Identification of different sources of air pollution
due to the proposed mine activity
▪ Prediction of air pollution and propose
mitigation measures / control measures
Mr. A. Jagannathan
2 WP
▪ Suggesting water treatment systems, drainage
facilities
▪ Evaluating probable impacts of effluent/waste
water discharges into the receiving
environment/water bodies and suggesting
control measures.
Dr. M. Ifthikhar
Ahmed
Mr. N. Senthilkumar
3 HG
▪ Interpretation of ground water table and predict
impact and propose mitigation measures.
▪ Analysis and description of aquifer
Characteristics
Dr. P. Thangaraju
4 GEO
▪ Field Survey for assessing the regional and local
geology of the area.
▪ Preparation of mineral and geological maps.
▪ Geology and Geo morphological
analysis/description and Stratigraphy/Lithology.
Dr. M. Ifthikhar
Ahmed
Dr. P. Thangaraju
5 SE
▪ Revision in secondary data as per Census of
India, 2011.
▪ Impact Assessment & Preventive Management
Plan
▪ Corporate Environment Responsibility.
Mrs. K. Anitha

Thiru.V.Manikandan Rough Stone and Gravel Quarry Chapter - 12
Geo Exploration and Mining Solutions 162 | P a g e
6 EB
▪ Collection of Baseline data of Flora and Fauna.
▪ Identification of species labelled as Rare,
Endangered and threatened as per IUCN list.
▪ Impact of the project on flora and fauna.
▪ Suggesting species for greenbelt development.
Mrs. Amirtham
Mr. Alagappa Moses
7 RH
▪ Identification of hazards and hazardous
substances
▪ Risks and consequences analysis
▪ Vulnerability assessment
▪ Preparation of Emergency Preparedness Plan
▪ Management plan for safety.
Mr. N. Senthilkumar
Mr. S. Pavel
Mr. J. R. Vikram
Krishna
8 LU
▪ Construction of Land use Map
▪ Impact of project on surrounding land use
▪ Suggesting post closure sustainable land use
and mitigative measures.
Mr. A. Allimuthu
9 NV ▪ Identify impacts due to noise and vibrations
▪ Suggesting appropriate mitigation measures for
EMP.
Mr. A. Jagannathan
10 AQ
▪ Identifying different source of emissions and
propose predictions of incremental GLC using
AERMOD.
▪ Recommending mitigations measures for EMP
Mr. N. Senthilkumar
11 SC ▪ Assessing the impact on soil environment and
proposed mitigation measures for soil
conservation
Dr. M. Ifthikhar
Ahmed
12 SHW
▪ Identify source of generation of non-hazardous
solid waste and hazardous waste.
▪ Suggesting measures for minimization of
generation of waste and how it can be reused or
recycled.
Mr. A. Jagannathan
Mr. J. R. Vikram
Krishna
LIST OF TEAM MEMBERS ENGAGED IN THIS PROJECT
Sl.No. Name Functional
Area Involvement Signature
1 Mr. S. Nagamani AP; GEO;
AQ
▪ Site Visit with FAE
▪ Provide inputs & Assisting FAE with sources of Air
Pollution, its impact and suggest control measures
▪ Provide inputs on Geological Aspects
▪ Analyse & provide inputs and assist FAE with
meteorological data, emission estimation, AERMOD
modelling and suggesting control measures
2 Mr. Viswanathan AP; WP; LU
▪ Site Visit with FAE
▪ Provide inputs & Assisting FAE with sources of Air
Pollution, its impact and suggest control measures
▪ Assisting FAE on sources of water pollution, its
impacts and suggest control measures
▪ Assisting FAE in preparation of land use maps
3 Mr.
Santhoshkumar GEO; SC
▪ Site Visit with FAE
▪ Provide inputs on Geological Aspects
▪ Assist in Resources & Reserve Calculation and
preparation of Production Plan & Conceptual Plan
▪ Provide inputs & Assisting FAE with soil
conservation methods and identifying impacts
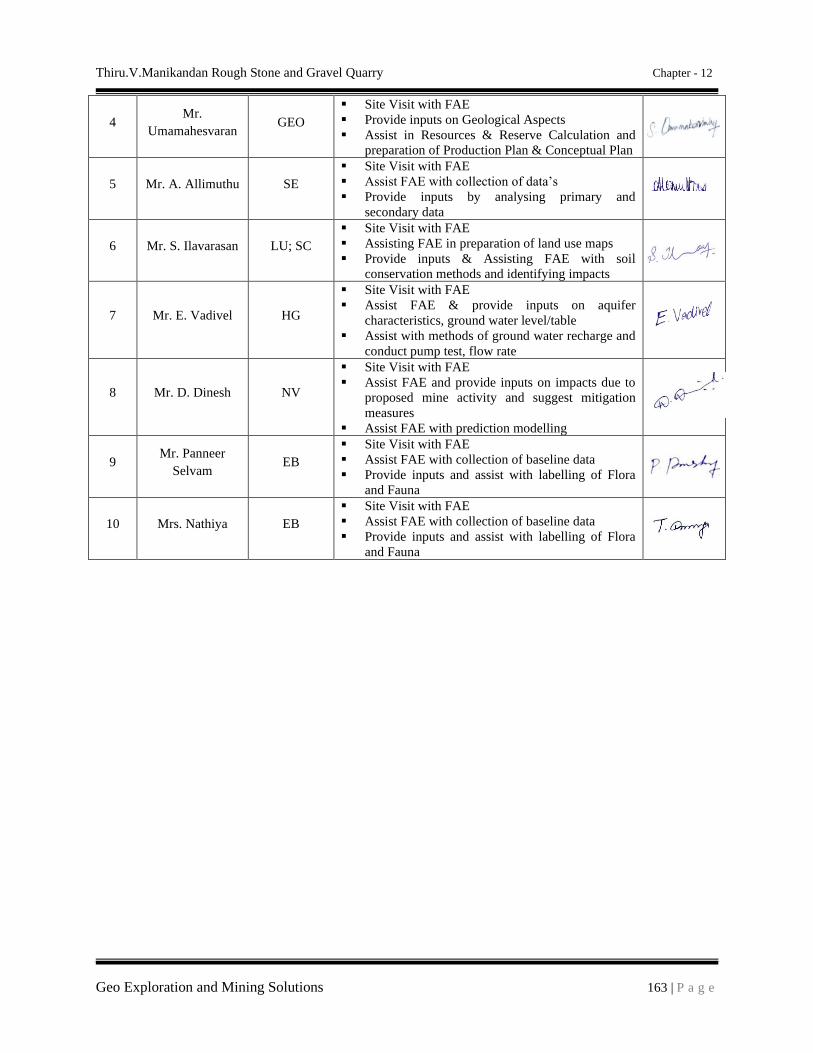
Thiru.V.Manikandan Rough Stone and Gravel Quarry Chapter - 12
Geo Exploration and Mining Solutions 163 | P a g e
4 Mr.
Umamahesvaran GEO
▪ Site Visit with FAE
▪ Provide inputs on Geological Aspects
▪ Assist in Resources & Reserve Calculation and
preparation of Production Plan & Conceptual Plan
5 Mr. A. Allimuthu SE
▪ Site Visit with FAE
▪ Assist FAE with collection of data’s
▪ Provide inputs by analysing primary and
secondary data
6 Mr. S. Ilavarasan LU; SC
▪ Site Visit with FAE
▪ Assisting FAE in preparation of land use maps
▪ Provide inputs & Assisting FAE with soil
conservation methods and identifying impacts
7 Mr. E. Vadivel HG
▪ Site Visit with FAE
▪ Assist FAE & provide inputs on aquifer
characteristics, ground water level/table
▪ Assist with methods of ground water recharge and
conduct pump test, flow rate
8 Mr. D. Dinesh NV
▪ Site Visit with FAE
▪ Assist FAE and provide inputs on impacts due to
proposed mine activity and suggest mitigation
measures
▪ Assist FAE with prediction modelling
9 Mr. Panneer
Selvam EB
▪ Site Visit with FAE
▪ Assist FAE with collection of baseline data
▪ Provide inputs and assist with labelling of Flora
and Fauna
10 Mrs. Nathiya EB
▪ Site Visit with FAE
▪ Assist FAE with collection of baseline data
▪ Provide inputs and assist with labelling of Flora
and Fauna

Thiru.V.Manikandan Rough Stone and Gravel Quarry Chapter - 12
Geo Exploration and Mining Solutions 164 | P a g e
DECLARATION BY THE HEAD OF THE ACCREDITED CONSULTANT ORGANIZATION
I, Dr. M. Ifthikhar Ahmed, Managing Partner, Geo Exploration and Mining Solutions, hereby, confirm that
the above mentioned Functional Area Experts and Team Members prepared the EIA/EMP for Rough Stone &
Gravel Quarry over an Extent of 2.57.5 ha in Chettipalayam Village of Madukkarai Taluk, Coimbatore District of
Tamil Nadu. It is also certified that information furnished in the EIA study are true and correct to the best of our
Knowledge.
Signature& Date:
Name: Dr. M. Ifthikhar Ahmed
Designation: Managing Partner
Name of the EIA Consultant Organization: M/s. Geo Exploration and Mining Solutions
NABET Certificate No & Issue Date: NABET/EIA/1922/SA 0139 Dated: 11-10-2021
Validity: Valid till 06.08.2022
Minutes of 317th Accreditation Committee Meeting for Surveillance - Assessment held July. 16, 2021.
Related Documents