Department of State Health Services Strategic Plan for 2023-2027 Part II As Required by Texas Government Code Chapter 2056 Department of State Health Services John Hellerstedt, M.D., Commissioner June 2022

Welcome message from author
This document is posted to help you gain knowledge. Please leave a comment to let me know what you think about it! Share it to your friends and learn new things together.
Transcript
Department of State Health Services Strategic Plan for 2023-2027
Part II
As Required by
Texas Government Code
Chapter 2056
Department of State Health Services
John Hellerstedt, M.D., Commissioner
June 2022

This page intentionally left blank.
Department of State Health Services
Strategic Plan for 2023—2027
TEXASHealth and HumanServices
Department of State Health Services
Hellerstedt, M.D., Commissioner
Submitted June 1, 2022

This page intentionally left blank.
Table of Contents
Schedule A: Budget Structure ....................................................... A-1
Schedule B: Performance Measure Definitions ............................... B-1
Schedule C: Historically Underutilized Business Plan ...................... C-1
Schedule D: Statewide Capital Planning ......................................... D-1
Schedule E: Health and Human Services Strategic Plan .................. E-1
Schedule F: Health and Human Services System Workforce Plan ... F-1
Schedule G: Workforce Development System Strategic Plan .......... G-1
Schedule H: Report on Customer Service ........................................ H-1

This page intentionally left black.
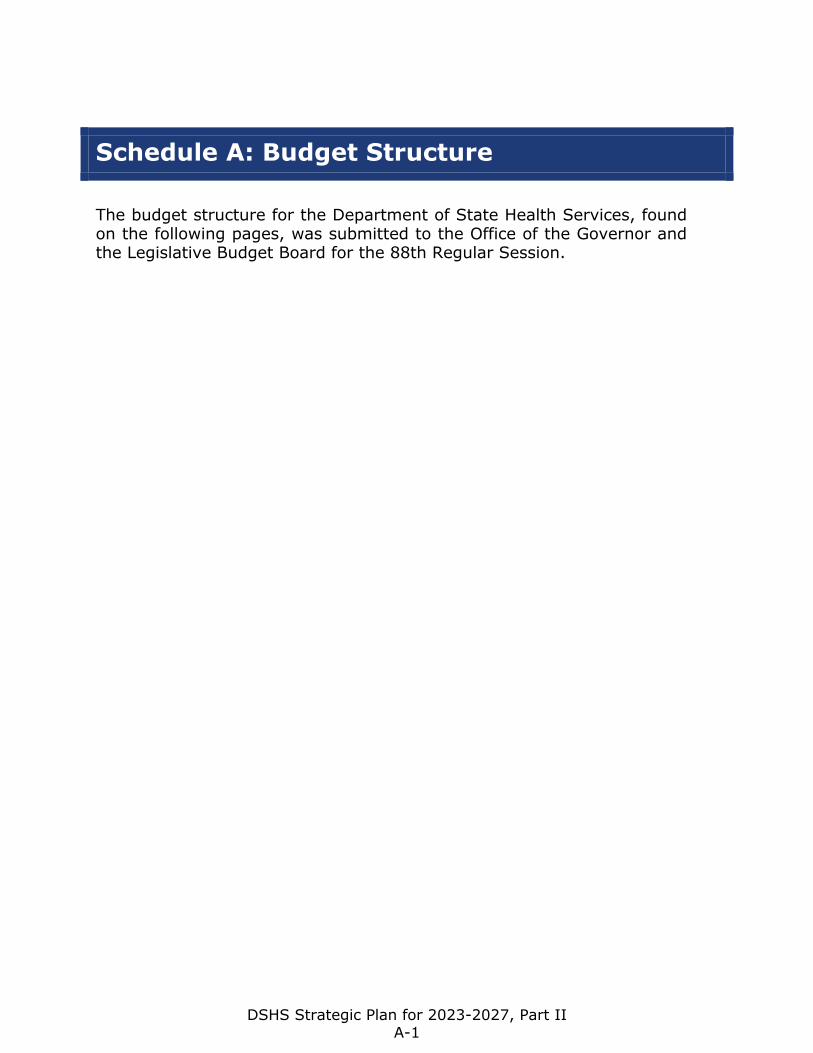
Schedule A: Budget Structure
The budget structure for the Department of State Health Services, found on the following pages, was submitted to the Office of the Governor and the Legislative Budget Board for the 88th Regular Session.
DSHS Strategic Plan for 2023-2027
DSHS Strategic Plan for 2023-2027, A-1
, Part II
Part II
����������������� ������������������������ �������������� !" #$ �!" #$ �%& $'() � !" #$ �'*�' �+�,-,./.-0,1�.2345.678.9-2,:.;,<= >>�?@�����A�������B���@����BC�A����D EFDGFHIHHJ�KE�KELM�N.;5O�<-0P�QR.5,43.P�,2-,.NOSTUV L@ L�@ WX ���XWL@ C X�YZXLA�[�A���������LA����������A�����LA��������[A������?�[�\���]�?����?\����A������?����?�?A����������A�������������_Z@�X�M �abbX�M �W �c@YL�YZX�V YML@ZC LabYc_ �b�_Y�[A���_����?�������?A���?LA�[�A���������Y���A������ �?�����������������[�\���?����?�������]A�����������?����?�?A����B[A�[�A��������A?����?���A�������B�����[�������A�����?����?���[�A�����d���[A�����?����?����A��������A�������������[���������������_Z@�X�M �abbX�M �W �c@YL�YZX� L�\���_����?LA�[�A���������c��A���������A�����c��A���������������[�\���?����?��A������?A���?[�\���?����?A������������������������?����?��[�A������L��������[������[A��A���������A�[A�[�A���������A�[��A��[������\����AA�A���B����A���[�������B�����?�A[�\���?����?�������A���������?A����������A�������V LabYc_ �b�_L@ LecZZ@W�Cc��_Z@�X�M �abbX�M �W �c@YL�YZX� C��������������M����������������AA���A����B��A�������B��������������������A�������\���\�A�?�B����?�B�����?�A������������������f CY��b����Y��Yc��_Z@�X�M �abbX�M �W �c@YL�YZX� _����?@�����A���Z[�A���?����?A�����A���T _ �b�_@ gY��@Y ��_Z@�X�M �abbX�M �W �c@YL�YZX� �A��A_����?���c�������LA�����?����?������A�������A��������������\��h�����������M������?A���?\�A��AF\������������A��������B�����������\�A��A?����?����B������������i\����?����?�\�A��A�����������j Z@W @_ �b�_�XWcZbZXY���_Z@�X�M �abbX�M �W �c@YL�YZX� L���D��k
E
A
DSHS Strategic Plan for 2023-2027, Part II A-2
����������������� ������������������������ �������������� !" #$ �!" #$ �%& $'() � !" #$ �'*�' �+�,-,./.-0,1�.2345.678.9-2,:.;,<= >>�?@�����A�������B���@����BC�A����D EFDGFHIHHJ�KE�KELM�N.;5O�<-0P�QR.5,43.P�,2-,.NOSTU V����?W����������������X������B�����Y�B�������A�Z�������A�������Z���?����?���?����?��A�[S V �\�VW����]W������X��V_@�]�M �a\\]�M �W �X@L�_]�b W� �� X_]�@\FL@ C ]�_]F�@ ��M ]����������W������X���A��BLA������������A�������@������?�����AA�����������A���?��cA�����cA������Z��������������������[�V_@�]�M �a\\]�M �W �X@L�_]� �����Y�X?���A�������������������c������cA��A�����������Y��?���A������������������[d MMa]e XV\W@ ]f�Wa\��]� g���V_@�]�M �a\\]�M �W �X@L�_]� VCF��WLA���������c������cA��A�����cA���������������A����������������cA�����������������B�������������������������������BVCF��W����������B������h�����?����?�����������A����cA�����A�[b VCF��WL@ C ]�_]�V_@�]�M �a\\]�M �W �X@L�_]� ���������W������LA��������B c���������������A���������X��������A�����������������������������B���������A��c�A���A�B�������icA������Z��BZ����Z�A��B����Z�A��B���Y������������������?����?��A���������������������[�c������������������cA������������A���?��cA��������A�������������������������Y���������������[���������AcA��A����������������������B�A���B���cA�������A�������c�A����j��?V�����k��������[T ] X�_a�W� �� L@ CF LF�a@C�V_@�]�M �a\\]�M �W �X@L�_]� ���A������������LA���������c���������������������������Z�A���������A���������B��cA������������A���?��cA�������Z�A�������B������A�����Z�A����������������[l ��a@C \\�]X fL@ C ]�_]�V_@�]�M �a\\]�M �W �X@L�_]� L���H��m
E
A
DSHS Strategic Plan for 2023-2027, Part II A-3
����������������� ������������������������ �������������� !" #$ �!" #$ �%& $'() � !" #$ �'*�' �+�,-,./.-0,1�.2345.678.9-2,:.;,<= >>�?@�����A�������B���@����BC�A����D EFDGFHIHHJ�KE�KELM�N.;5O�<-0P�QR.5,43.P�,2-,.NOSTU �����V����A��AW���������X��������VWX�LA������Y������Z������������B�A�������B��YY�A�B������������A��������?������V����A��AW���������X��������VWX�[S �\V ]� @_@W] V�W_ �XW� �� �a_@�]�M �^ bb]�M �X �V@WL�W_]�T ab�aL@_M_�W_]cVa@_]WVa����?LA����������V?A����X������LA����������?����?YA���������AA��������?�����AA������YA������d���?A�����������[�a_@�]�M �^ bb]�M �X �V@WL�W_]� a����?LA�������cV?A����X������LA��������X�����Y�����Y�������������������A����������A�����?����?A��ed�?����A��?������A�d������?A����������������f�A�������������AYA��A�����A��Z?����Ag��������[h Va@_]WVXW� �� L@ C ]�W_]�a_@�]�M �^ bb]�M �X �V@WL�W_]� @��������?�������d����LA�����������i���X�����Y������i���YA��A����A������?��������d����YA������[j @ X V � _ �_�VV_L@_X V���a_@�]�M �^ bb]�M �X �V@WL�W_]�k ���� b�_@��_@l�����b�d�A���A�_Y�A����A���A������d�A���A�����YY�A���Y�d���?����?YA��A������������[�a_@�]�M �^ bb]�M �X �V@WL�W_]� b�d�A���A���A�����LA�����������������d�A���A���A���������YY�A���Y�d���?����?YA��A������������[h b�_@��_@l� @CWV ��a_@�]�M �^ bb]�M �X �V@WL�W_]� b�d�A���A������������X�d���A����d�����d���A���A������d�A���A�[j b�_@��_@l�� ��W]�_]XX ��a_@�]�M �^ bb]�M �X �V@WL�W_]� L���J��m
E
A
DSHS Strategic Plan for 2023-2027, Part II A-4
����������������� ������������������������ �������������� !" #$ �!" #$ �%& $'() � !" #$ �'*�' �+�,-,./.-0,1�.2345.678.9-2,:.;,<= >>�?@�����A�������B���@����BC�A����D EFDGFHIHHJ�KE�KELM�N.;5O�<-0P�QR.5,43.P�,2-,.NOSTUV WXMMYZ[�\] ��]� @C[W �W��������]����?��A�����[�_A����?�?����?���?���A��B����B����������������������B�����?�����?���_��������������������������A?����?��A���A�����a�]X@�Z�M �bY Z�M �c �W@[L�[XZ�d L@XMX� M�� @Z� �ZcW][c] ��]LA�����M���A������W?���]����?c�����_�����__�A�_A���A�?����?��A���A��������?���A��B����B��������B�����?�Ae��������������������?���?���������f����_A�����A�a�]X@�Z�M �bY Z�M �c �W@[L�[XZ� M���A������W?���]����?LA������������������f��Be������������������gf��������A�������?���?����?��A�������g������������B�������B�?���A��B��������������ad M�� @Z� �ZcW][c] ��]�]X@�Z�M �bY Z�M �c �W@[L�[XZ� W?���A����?�_�����]����?W�A�Z�������������A��A����_A��A����A�?���A����?�_�����?����?��A������B�����h���������?]]�WaV W][c@ Zi[�]�L W[� Z c��]X@�Z�M �bY Z�M �c �W@[L�[XZ�V ��@ Zj�] Z]�]W�@ [Zb@���@YW�Y@ ��A����?��]����?��A�[��A���A����A�c�����_�����?������_���������A�������������������A����_A�����A����A��������k�����A�����?����?��A��������a�]X@�Z�M �bY Z�M �c �W@[L�[XZ� M�����A����W�A��������c�����_�����?����A��������k�����A�����?����?��A��������ad M��Zc�@�YM�W�@ �\�� M��]X@�Z�M �bY Z�M �c �W@[L�[XZ� �����LA���A�W�A�X�����c�����_���������_A���A����_A��������?����?��A�������A�������A��A����A����������aV � l��L@[M�@\W�@ Xbb[W �]X@�Z�M �bY Z�M �c �W@[L�[XZ� L���K��m
E
A
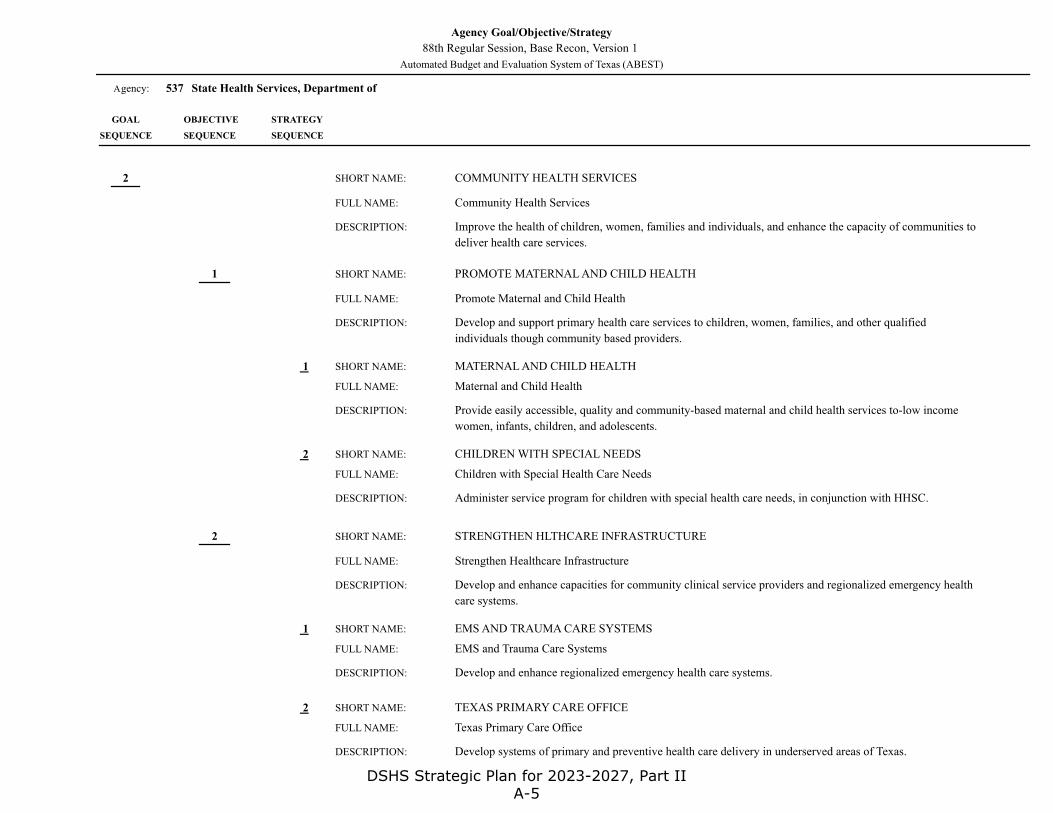
DSHS Strategic Plan for 2023-2027, Part II A-5
����������������� ������������������������ �������������� !" #$ �!" #$ �%&$'() � !" #$ �'*�' �+�,-,./.-0,1�.2345.678.9-2,:.;,<= >>�?@�����A�������B���@����BC�A����D EFDGFHIHHJ�KE�KELM�N.;5O�<-0P�QR.5,43.P�,2-,.NOSTUT VWX�YM @L@W� V�ZWX� @CZV �V������ALA����������A�������?����������������������[������\��?�A�������������������[A�����[�\���?����?���������]� W@�X�M �_Y X�M �a �V@ZL�ZWX�b ZV X�ZXcd@ cY ��W@eVWMLZ�XV LA����������������@�������A�V��[������ ���A�������B����A������������B��A����������B�����?�AA�����A������f[A�����������A���?���[?�������������������A[A��������f�������A����[������g��?������A��]� W@�X�M �_Y X�M �a �V@ZL�ZWX� _����M�������aA��������a����������[������[A��A���������A��?�������������B�A���B�����������������]b _WWa�M ����Xaa@Yc��_ �e� W@�X�M �_Y X�M �a �V@ZL�ZWX� ���A������������?a����������[������A��h�������������A��h����������A�������A�[A��A�����A�������A[A������B����[��������������A��������?����?B����������������������]i XCZ@WXM X�� � �� W@�X�M �_Y X�M �a �V@ZL�ZWX� @��������V���A��a����������[�������A��h�������������A��h����������A�������A�[A��A����A������A�����A��������]T @�aZ��ZWXVWX�@W� W@�X�M �_Y X�M �a �V@ZL�ZWX� �����]c��] �����������X���A�����A�\�������]c��] �����������X���A�����A�\��]j � k��]cWC� W@�X�M �_Y X�M �a �V@ZL�ZWX� L���E��l
E
A
DSHS Strategic Plan for 2023-2027, Part II A-6
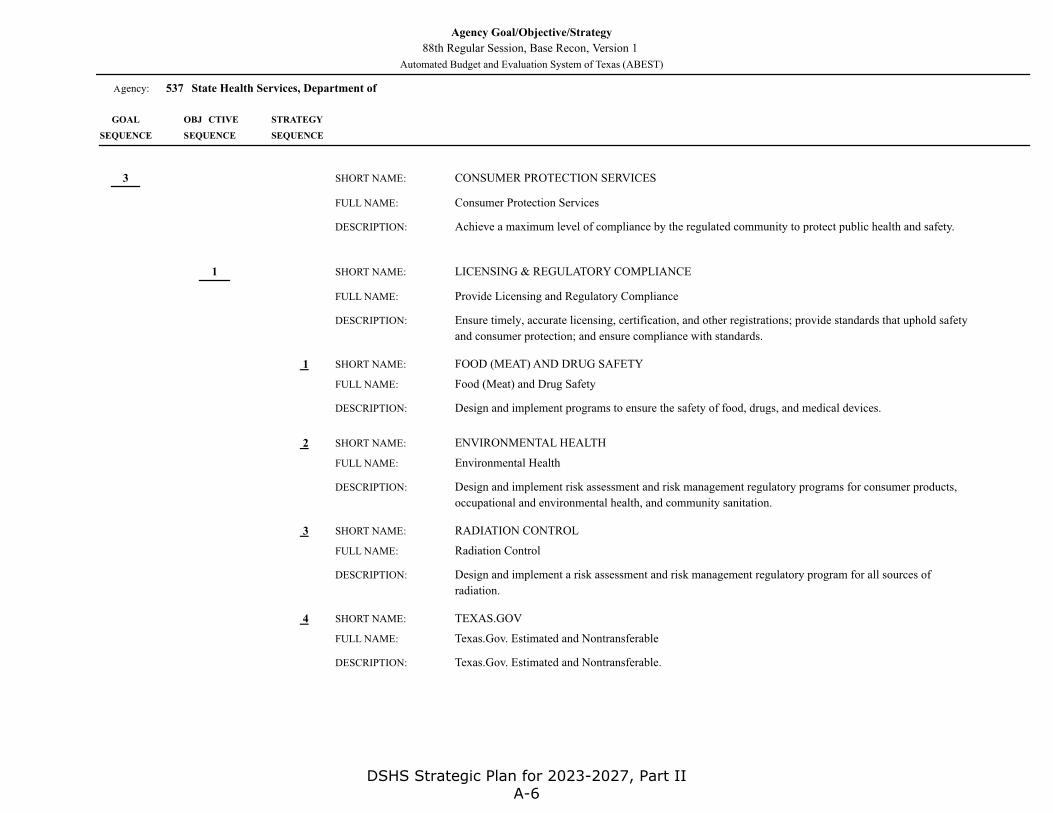
����������������� ������������������������ �������������� !" #$ �!" #$ �%& $'() � !" #$ �'*�' �+�,-,./.-0,1�.2345.678.9-2,:.;,<= >>�?@�����A�������B���@����BC�A����D EFDGFHIHHJ�KE�KELM�N.;5O�<-0P�QR.5,43.P�,2-,.NOSTUV �W XYZ[\] \�L@ _ Y��������[���\���A���������?������LA�����LA��������������A��A�������������������a��b���b���������A��������A�?�������c�d @�X�M �efggX�M �] �Y@\L�\X�h �W XYZ[\] \�L@ _ Y��������[���\���A���������?������LA�����LA��������������A��A�������������������a��b���b���������A��������A�?�������c�d @�X�M �efggX�M �] �Y@\L�\X� ������[���\���A���������?������LA�����LA��������������A��A�������������������a��b���b���������A��������A�?�������ch �W XYZ[\] \�L@ _ Y���d @�X�M �efggX�M �] �Y@\L�\X�S \X]\@ Y��]M\X\��@��\X\���A�����������A�����\���A�����������A�����c�d @�X�M �efggX�M �] �Y@\L�\X�h M�X�W \X]\@ Y��]M\X\��@��\XM�����\���A�����������A�����M���������A�����������A�����c�d @�X�M �efggX�M �] �Y@\L�\X� Y���A����������A�����Y���A����������A�����ch Y X�@�g�]M\X\��@��\X�d @�X�M �efggX�M �] �Y@\L�\X� \���A���������?������LA��A����bb�A�\���A���������?������bA��A����bb�A�ci \�L@ W@�M�fLL @��d @�X�M �efggX�M �] �Y@\L�\X� L���j��k
E
A
DSHS Strategic Plan for 2023-2027, Part II A-7
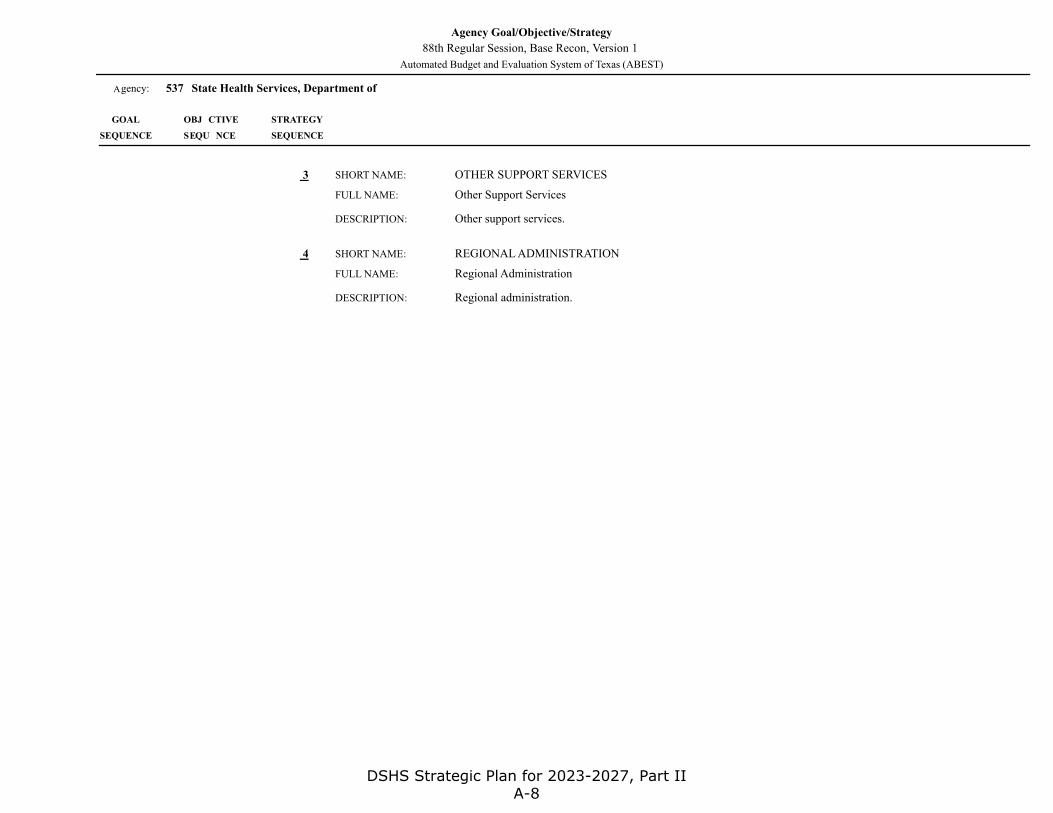
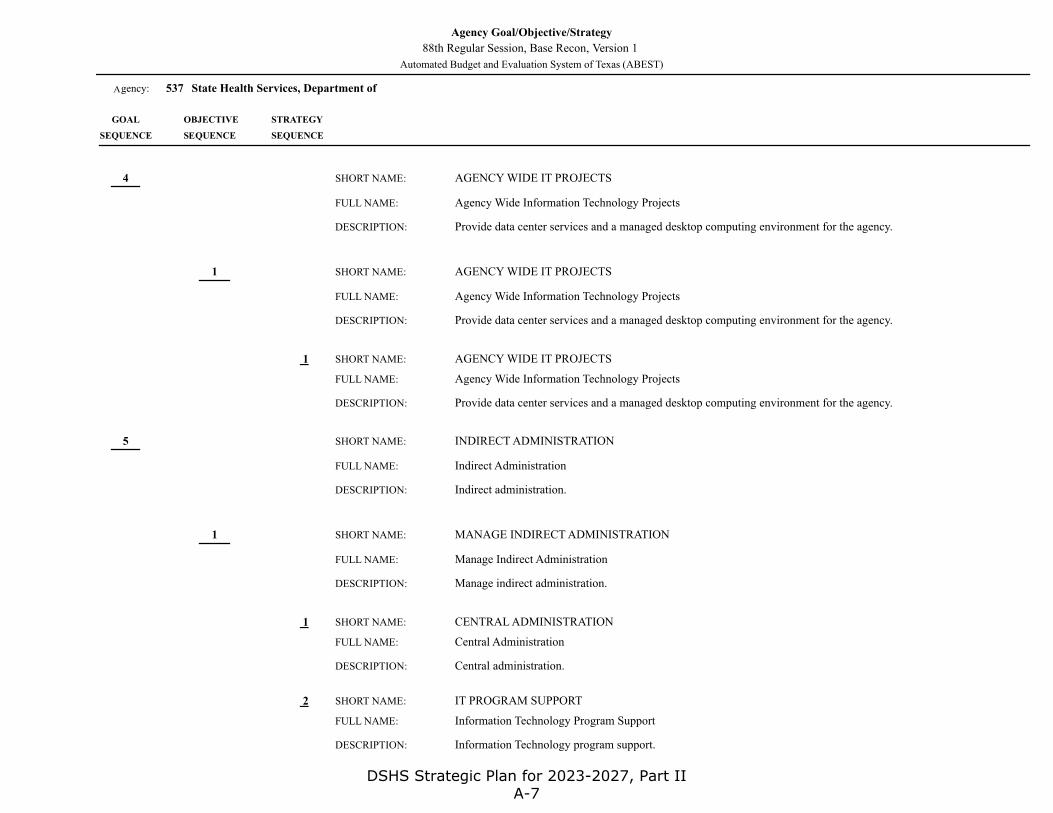
����������������� ������������������������ �������������� !" #$ �!" #$�%&$'() � !" #$ �'*�' �+�,-,./.-0,1�.2345.678.9-2,:.;,<= >>�?@�����A�������B���@����BC�A����D EFDGFHIHHJ�KE�KELM�N.;5O�<-0P�QR.5,43.P�,2-,.NOSTU V�?�A��WW�A���A�����V�?�A��WW�A���A�����XT V�Y @�ZLLV@�� @C[\ ��YV@�]�M �Z__]�M � �\@[L�[V]� @���������������A�����@���������������A�����Xa @ b[V]�_� M[][��@��[V]�YV@�]�M �Z__]�M � �\@[L�[V]�
L���c��c
EE
A
DSHS Strategic Plan for 2023-2027, Part II A-8
Schedule B: List of Measure Definitions
The list of measure definitions for the Department of State Health Services, found on the following pages, was submitted to the Office of the Governor and the Legislative Budget Board for the 88th Regular Session.
DSHS Strategic Plan for 2023-2027, Part II B-1
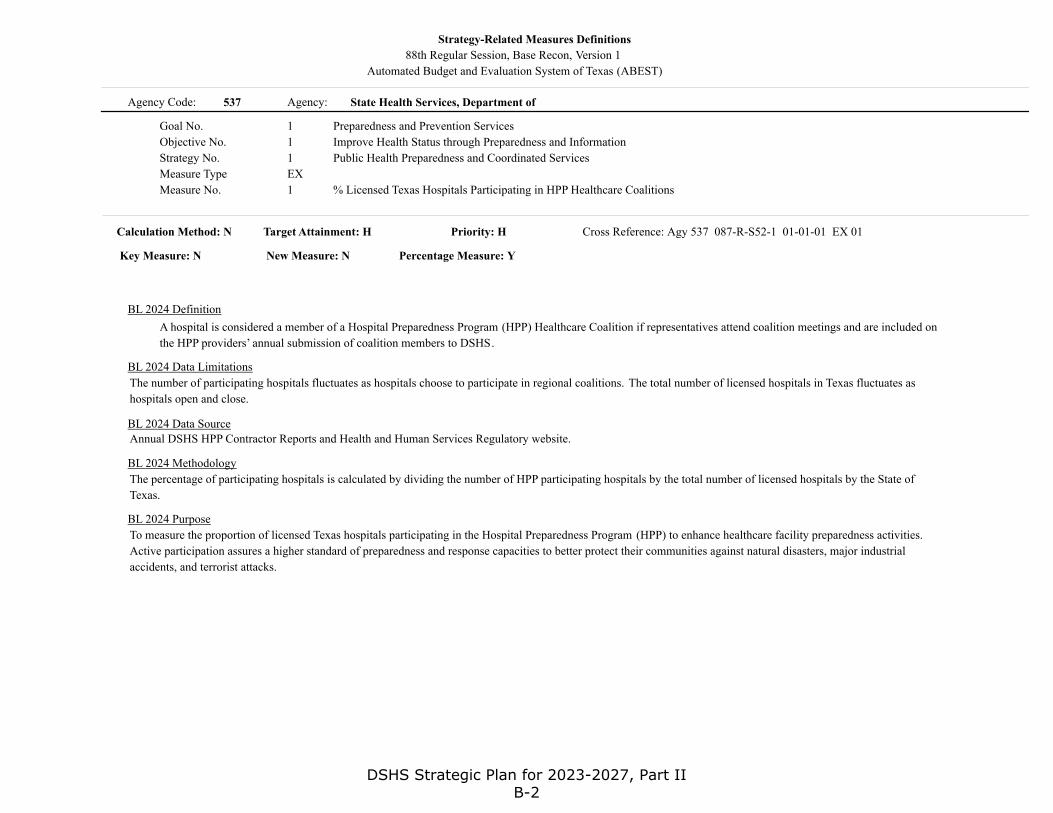
Automated Budget and Evaluation System of Texas (ABEST)
88th Regular Session, Base Recon, Version 1
Strategy-Related Measures Definitions
Agency Code:
Goal No.
% Licensed Texas Hospitals Participating in HPP Healthcare CoalitionsMeasure No.
Public Health Preparedness and Coordinated Services
Improve Health Status through Preparedness and Information
Preparedness and Prevention Services
Measure Type
Strategy No.
Objective No.
State Health Services, Department ofAgency: 537
1
1
1
1
EX
Priority: H
Key Measure: N New Measure: N
Target Attainment: H Cross Reference: Agy 537 087-R-S52-1 01-01-01 EX 01Calculation Method: N
Percentage Measure: Y
A hospital is considered a member of a Hospital Preparedness Program (HPP) Healthcare Coalition if representatives attend coalition meetings and are included on
the HPP providers’ annual submission of coalition members to DSHS.
BL 2024 Definition
The number of participating hospitals fluctuates as hospitals choose to participate in regional coalitions. The total number of licensed hospitals in Texas fluctuates as
hospitals open and close.
BL 2024 Data Limitations
Annual DSHS HPP Contractor Reports and Health and Human Services Regulatory website.
BL 2024 Data Source
The percentage of participating hospitals is calculated by dividing the number of HPP participating hospitals by the total number of licensed hospitals by the State of
Texas.
BL 2024 Methodology
To measure the proportion of licensed Texas hospitals participating in the Hospital Preparedness Program (HPP) to enhance healthcare facility preparedness activities.
Active participation assures a higher standard of preparedness and response capacities to better protect their communities against natural disasters, major industrial
accidents, and terrorist attacks.
BL 2024 Purpose
DSHS Strategic Plan for 2023-2027, Part II B-2
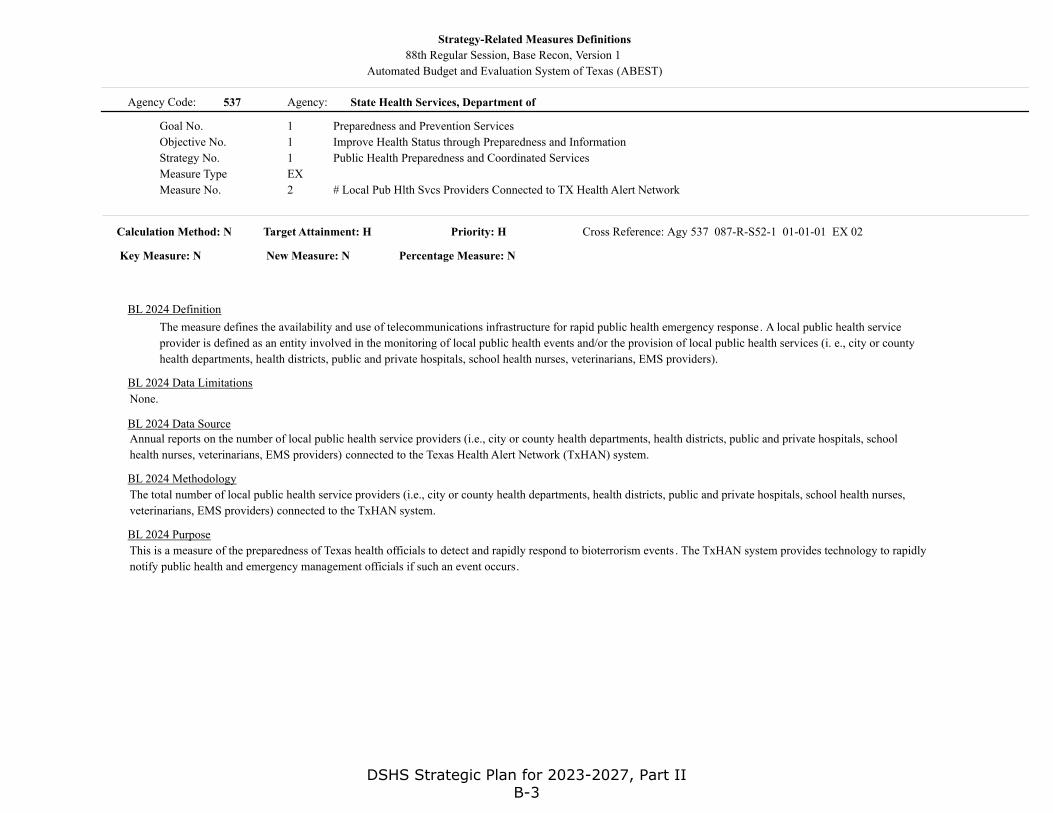
Automated Budget and Evaluation System of Texas (ABEST)
88th Regular Session, Base Recon, Version 1
Strategy-Related Measures Definitions
Agency Code:
Goal No.
# Local Pub Hlth Svcs Providers Connected to TX Health Alert NetworkMeasure No.
Public Health Preparedness and Coordinated Services
Improve Health Status through Preparedness and Information
Preparedness and Prevention Services
Measure Type
Strategy No.
Objective No.
State Health Services, Department ofAgency: 537
1
1
1
2
EX
Priority: H
Key Measure: N New Measure: N
Target Attainment: H Cross Reference: Agy 537 087-R-S52-1 01-01-01 EX 02Calculation Method: N
Percentage Measure: N
The measure defines the availability and use of telecommunications infrastructure for rapid public health emergency response. A local public health service
provider is defined as an entity involved in the monitoring of local public health events and/or the provision of local public health services (i. e., city or county
health departments, health districts, public and private hospitals, school health nurses, veterinarians, EMS providers).
BL 2024 Definition
None.
BL 2024 Data Limitations
Annual reports on the number of local public health service providers (i.e., city or county health departments, health districts, public and private hospitals, school
health nurses, veterinarians, EMS providers) connected to the Texas Health Alert Network (TxHAN) system.
BL 2024 Data Source
The total number of local public health service providers (i.e., city or county health departments, health districts, public and private hospitals, school health nurses,
veterinarians, EMS providers) connected to the TxHAN system.
BL 2024 Methodology
This is a measure of the preparedness of Texas health officials to detect and rapidly respond to bioterrorism events . The TxHAN system provides technology to rapidly
notify public health and emergency management officials if such an event occurs.
BL 2024 Purpose
DSHS Strategic Plan for 2023-2027, Part II B-3
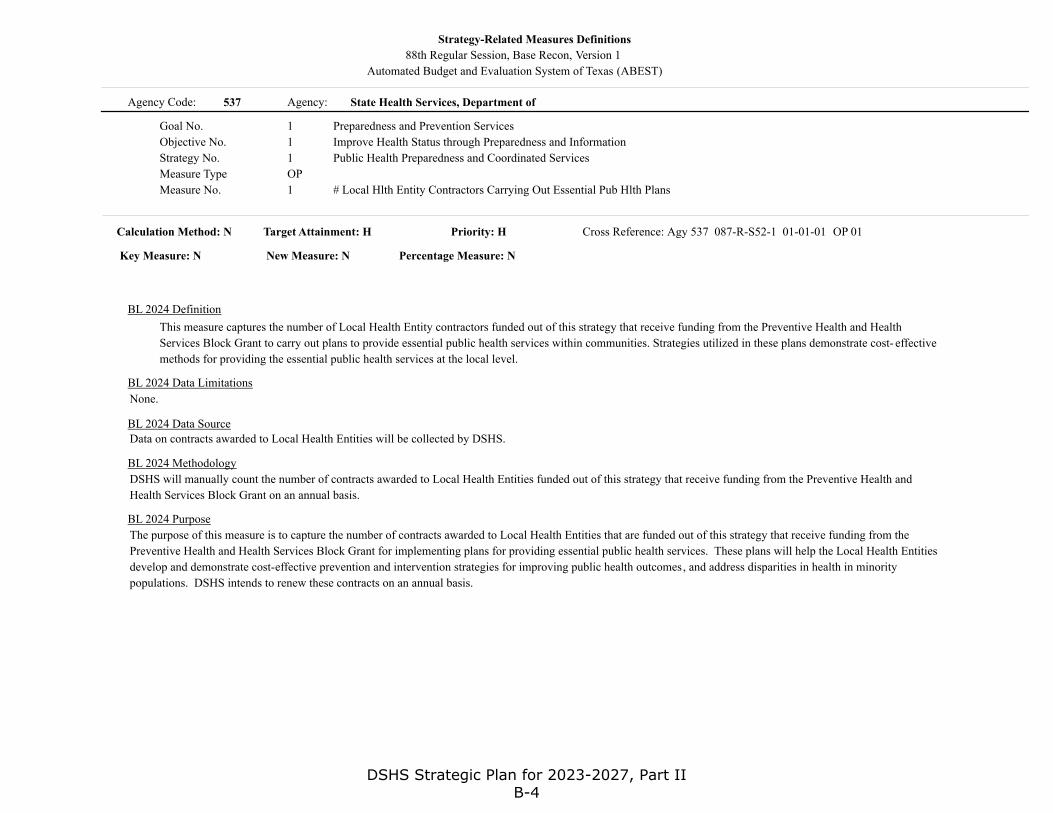
Automated Budget and Evaluation System of Texas (ABEST)
88th Regular Session, Base Recon, Version 1
Strategy-Related Measures Definitions
Agency Code:
Goal No.
# Local Hlth Entity Contractors Carrying Out Essential Pub Hlth PlansMeasure No.
Public Health Preparedness and Coordinated Services
Improve Health Status through Preparedness and Information
Preparedness and Prevention Services
Measure Type
Strategy No.
Objective No.
State Health Services, Department ofAgency: 537
1
1
1
1
OP
Priority: H
Key Measure: N New Measure: N
Target Attainment: H Cross Reference: Agy 537 087-R-S52-1 01-01-01 OP 01Calculation Method: N
Percentage Measure: N
This measure captures the number of Local Health Entity contractors funded out of this strategy that receive funding from the Preventive Health and Health
Services Block Grant to carry out plans to provide essential public health services within communities. Strategies utilized in these plans demonstrate cost- effective
methods for providing the essential public health services at the local level.
BL 2024 Definition
None.
BL 2024 Data Limitations
Data on contracts awarded to Local Health Entities will be collected by DSHS.
BL 2024 Data Source
DSHS will manually count the number of contracts awarded to Local Health Entities funded out of this strategy that receive funding from the Preventive Health and
Health Services Block Grant on an annual basis.
BL 2024 Methodology
The purpose of this measure is to capture the number of contracts awarded to Local Health Entities that are funded out of this strategy that receive funding from the
Preventive Health and Health Services Block Grant for implementing plans for providing essential public health services. These plans will help the Local Health Entities
develop and demonstrate cost-effective prevention and intervention strategies for improving public health outcomes, and address disparities in health in minority
populations. DSHS intends to renew these contracts on an annual basis.
BL 2024 Purpose
DSHS Strategic Plan for 2023-2027, Part II B-4
Automated Budget and Evaluation System of Texas (ABEST)
88th Regular Session, Base Recon, Version 1
Strategy-Related Measures Definitions
Agency Code:
Goal No.
Average Number of Days to Certify or Verify Vital Statistics RecordsMeasure No.
Vital Statistics
Improve Health Status through Preparedness and Information
Preparedness and Prevention Services
Measure Type
Strategy No.
Objective No.
State Health Services, Department ofAgency: 537
1
1
2
1
EF
Priority: H
Key Measure: Y New Measure: N
Target Attainment: L Cross Reference: Agy 537 087-R-S52-1 01-01-02 EF 01Calculation Method: N
Percentage Measure: N
The average number of days it takes the Vital Statistics Section (VSS) to complete all fee-related customer requests for VSS services and products as per TAC
181.22, including certified copies and verifications of vital records, corrections and amendments to vital records, and inquiries on our registries for Paternity,
Acknowledgement of Paternity, Court of Continuing Jurisdiction, and Adoptions.
BL 2024 Definition
None.
BL 2024 Data Limitations
A Structured Query Language (SQL) query from the TxEVER database.
BL 2024 Data Source
A SQL query is used to calculate the average number of days it takes VSS to complete a fee-based request. The total number of days it take to certify each request will
be divided by the total number of requests for each reporting period.
BL 2024 Methodology
Identify the time it take to process fee-based request for VSS services and products provided during the reporting period . This information reflects VSS ability to meet
customer needs and helps identify the resources needed to meet those needs.
BL 2024 Purpose
DSHS Strategic Plan for 2023-2027, Part II B-5
Automated Budget and Evaluation System of Texas (ABEST)
88th Regular Session, Base Recon, Version 1
Strategy-Related Measures Definitions
Agency Code:
Goal No.
Number of Requests for Records Services CompletedMeasure No.
Vital Statistics
Improve Health Status through Preparedness and Information
Preparedness and Prevention Services
Measure Type
Strategy No.
Objective No.
State Health Services, Department ofAgency: 537
1
1
2
1
OP
Priority: H
Key Measure: N New Measure: N
Target Attainment: H Cross Reference: Agy 537 087-R-S52-1 01-01-02 OP 01Calculation Method: C
Percentage Measure: N
The number of fee based requests for certified copies and verifications of vital records fulfilled by the Vital Statistics Section . Vital records refer to birth, death,
fetal death, marriage, and divorce/annulment records that are registered in the state of Texas.
BL 2024 Definition
None.
BL 2024 Data Limitations
A Structured Query Language (SQL) query from the TxEVER database.
BL 2024 Data Source
A SQL query will be used to extract counts for the reporting time period from the TxEVER database of certified copies and verifications issues for vital records , and sum
these counts together.
BL 2024 Methodology
Identify the volume of fee based requests for certified copies and verifications of vital records completed during the reporting month. This information reflects demand
for these services and helps identify the resources needed to meet demand.
BL 2024 Purpose
DSHS Strategic Plan for 2023-2027, Part II B-6
Automated Budget and Evaluation System of Texas (ABEST)
88th Regular Session, Base Recon, Version 1
Strategy-Related Measures Definitions
Agency Code:
Goal No.
# of Border/Binational Public Health Svcs Provided to Border ResidentsMeasure No.
Border Health and Colonias
Improve Health Status through Preparedness and Information
Preparedness and Prevention Services
Measure Type
Strategy No.
Objective No.
State Health Services, Department ofAgency: 537
1
1
4
1
OP
Priority: H
Key Measure: N New Measure: N
Target Attainment: H Cross Reference: Agy 537 087-R-S52-1 01-01-04 OP 01Calculation Method: C
Percentage Measure: N
This measure captures the number of essential border and binational public health services provided to border residents to optimize border binational
communication and coordination, strengthen border data and information, increase community-based healthy border initiatives, and to strengthen border health
best practices and evaluation.
BL 2024 Definition
Complete data may not be available for the reporting period at the time the reports are due.
BL 2024 Data Limitations
Binational Health Council meeting reports, workgroup meeting reports, activity/intervention/project reports and summaries, and quarterly reports.
BL 2024 Data Source
The number of essential border/binational public health services will be manually counted and documented. Amounts are gathered through analysis of Binational
Health Council meeting reports, workgroup meeting reports, activity/intervention/project reports and summaries, and quarterly reports provided by border offices
(Austin, El Paso, Eagle Pass, Laredo and Harlingen) and contracting partners.
BL 2024 Methodology
The main purpose is to ensure the border/binational public health services provided to border communities contribute to the health and well-being of residents along
the Texas/Mexico border.
BL 2024 Purpose
DSHS Strategic Plan for 2023-2027, Part II B-7
Automated Budget and Evaluation System of Texas (ABEST)
88th Regular Session, Base Recon, Version 1
Strategy-Related Measures Definitions
Agency Code:
Goal No.
Ave # Working Days Required by Staff to Complete Customized RequestsMeasure No.
Health Data and Statistics
Improve Health Status through Preparedness and Information
Preparedness and Prevention Services
Measure Type
Strategy No.
Objective No.
State Health Services, Department ofAgency: 537
1
1
5
1
EF
Priority: H
Key Measure: N New Measure: N
Target Attainment: L Cross Reference: Agy 537 087-R-S52-1 01-01-05 EF 01Calculation Method: N
Percentage Measure: N
This measure tracks the average time required by staff of Center for Health Statistics (CHS) to complete a customized data request, from receipt of the data request
to completion and dissemination back to the customer.
BL 2024 Definition
Dependent upon consistent use of tracking system by CHS employees in recording data requests. As standard reports and information become part of the website,
more complex data requests will be handled by staff. This could increase the time required to complete requests.
BL 2024 Data Limitations
A record is kept for each request for data and information received. This includes requests for reports that may require special computer runs, standard reports, and
technical assistance.
BL 2024 Data Source
The number of working days to complete a data request is defined as the number of working days between when a request is received (or clarified if needed) until when
the data or information is delivered. The average number of working days is calculated as the total number of working days to respond to requests, divided by the total
number of requests completed.
BL 2024 Methodology
This measure monitors productivity and responsiveness to customer requests requiring customization to attain the data.
BL 2024 Purpose
DSHS Strategic Plan for 2023-2027, Part II B-8
Automated Budget and Evaluation System of Texas (ABEST)
88th Regular Session, Base Recon, Version 1
Strategy-Related Measures Definitions
Agency Code:
Goal No.
Average Successful Requests - Pages per DayMeasure No.
Health Data and Statistics
Improve Health Status through Preparedness and Information
Preparedness and Prevention Services
Measure Type
Strategy No.
Objective No.
State Health Services, Department ofAgency: 537
1
1
5
1
OP
Priority: H
Key Measure: N New Measure: N
Target Attainment: H Cross Reference: Agy 537 087-R-S52-1 01-01-05 OP 01Calculation Method: N
Percentage Measure: N
This measure tracks the average successful requests for pages from the Center for Health Statistics (CHS) website per day.
BL 2024 Definition
None.
BL 2024 Data Limitations
Web Server Log Files.
BL 2024 Data Source
The statistic used will be “Average successful requests for pages from the CHS website per day”. The total number of successful requests for pages, extracted from the
web server logs, will be divided by the number of days in the quarter. This measures access to complete web pages and excludes graphics and other auxiliary files.
BL 2024 Methodology
This measure monitors the use of Center for Health Statistics (CHS) web-based products by customers.
BL 2024 Purpose
DSHS Strategic Plan for 2023-2027, Part II B-9
Automated Budget and Evaluation System of Texas (ABEST)
88th Regular Session, Base Recon, Version 1
Strategy-Related Measures Definitions
Agency Code:
Goal No.
Dollar Value (in Millions) of Vaccine Provided by the Federal GovtMeasure No.
Immunize Children and Adults in Texas
Infectious Disease Control, Prevention and Treatment
Preparedness and Prevention Services
Measure Type
Strategy No.
Objective No.
State Health Services, Department ofAgency: 537
1
2
1
1
EX
Priority: H
Key Measure: Y New Measure: N
Target Attainment: H Cross Reference: Agy 537 087-R-S52-1 01-02-01 EX 01Calculation Method: N
Percentage Measure: N
The Centers for Disease Control and Prevention (CDC) provides funding for the purchase of childhood and adult vaccines/toxoids/biologicals. These direct
assistance awards are in the form of actual vaccine products in lieu of cash awards.
BL 2024 Definition
None
BL 2024 Data Limitations
At the beginning of each federal fiscal year the Centers for Disease Control and Prevention (CDC) estimates the amount of federal awards that the Texas Department of
State Health Services will receive during that grant period.
BL 2024 Data Source
The annual performance measure data is based on reports from CDC on the number and dollar amount of vaccines shipped.
BL 2024 Methodology
This is an indicator of immunization activity, which is essential to prevent and reduce vaccine-preventable diseases.
BL 2024 Purpose
DSHS Strategic Plan for 2023-2027, Part II B-10
Automated Budget and Evaluation System of Texas (ABEST)
88th Regular Session, Base Recon, Version 1
Strategy-Related Measures Definitions
Agency Code:
Goal No.
# of Sites Authorized to Access State Immunization Registry SystemMeasure No.
Immunize Children and Adults in Texas
Infectious Disease Control, Prevention and Treatment
Preparedness and Prevention Services
Measure Type
Strategy No.
Objective No.
State Health Services, Department ofAgency: 537
1
2
1
2
EX
Priority: M
Key Measure: N New Measure: N
Target Attainment: H Cross Reference: Agy 537 087-R-S52-1 01-02-01 EX 02Calculation Method: N
Percentage Measure: N
This measure will count the number of providers (public and private) insurance companies, schools, and day care centers authorized to access the statewide
immunization registry.
BL 2024 Definition
None.
BL 2024 Data Limitations
On a quarterly basis, the ImmTrac application database will be queried to document the number of sites authorized to access the registry.
BL 2024 Data Source
Sites are defined as the facility or office authorized to access the registry and not the individual workstation . This will be a frequency or simple count of the number of
registered sites authorized to access to the immunization registry that have accessed the registry (logged in) during the previous two years.
BL 2024 Methodology
An increase in the number of sites participating in the registry is important for the growth of the number of children's records contained in the database and
immunization histories stored in the registry.
BL 2024 Purpose
DSHS Strategic Plan for 2023-2027, Part II B-11
Automated Budget and Evaluation System of Texas (ABEST)
88th Regular Session, Base Recon, Version 1
Strategy-Related Measures Definitions
Agency Code:
Goal No.
Number of Vaccine Doses Administered to ChildrenMeasure No.
Immunize Children and Adults in Texas
Infectious Disease Control, Prevention and Treatment
Preparedness and Prevention Services
Measure Type
Strategy No.
Objective No.
State Health Services, Department ofAgency: 537
1
2
1
1
OP
Priority: H
Key Measure: Y New Measure: N
Target Attainment: H Cross Reference: Agy 537 087-R-S52-1 01-02-01 OP 01Calculation Method: C
Percentage Measure: N
The number of state-supplied vaccine doses administered to children. One dose is equal to one antigen. An antigen refers to an individual vaccine component.
Combination vaccines contain several antigens, and therefore several doses.
BL 2024 Definition
TVFC Providers are required to report at the time they go into the order system to order more vaccine. We recommend that they order vaccines by the 5th of the month,
however some providers chose to order at a later date and do not report their doses administered by the 5th of the month, which results in delayed reporting of doses
administered.
BL 2024 Data Limitations
Providers of state-supplied vaccines, including regional public health clinics, local health departments/districts, community and rural health centers, and private
providers submit doses administered data through the Electronic Vaccine Inventory portal . The data are reported monthly by each provider, and maintained in a
database designed to track and generate reports on doses administered.
BL 2024 Data Source
A report is produced based on aggregated data. Data are cumulative.
BL 2024 Methodology
This measure provides an indication of the overall usage of vaccines through the Texas Vaccines for Children (TVFC) program. It also guides policy and procedure
changes impacting the Texas Vaccines for Children program.
BL 2024 Purpose
DSHS Strategic Plan for 2023-2027, Part II B-12
Automated Budget and Evaluation System of Texas (ABEST)
88th Regular Session, Base Recon, Version 1
Strategy-Related Measures Definitions
Agency Code:
Goal No.
Number of Vaccine Doses Administered to AdultsMeasure No.
Immunize Children and Adults in Texas
Infectious Disease Control, Prevention and Treatment
Preparedness and Prevention Services
Measure Type
Strategy No.
Objective No.
State Health Services, Department ofAgency: 537
1
2
1
2
OP
Priority: H
Key Measure: N New Measure: N
Target Attainment: H Cross Reference: Agy 537 087-R-S52-1 01-02-01 OP 02Calculation Method: C
Percentage Measure: N
The number of state-supplied vaccine doses administered to adults. One dose is equal to one antigen. An antigen refers to an individual vaccine component.
Combination vaccines contain several antigens, and therefore several doses.
BL 2024 Definition
None.
BL 2024 Data Limitations
Providers of state-supplied vaccines, including regional public health clinics, local health departments/districts, community and rural health centers, and private
providers submit doses administered data through the Electronic Vaccine Inventory portal . The data are reported monthly by each provider, and maintained in a
database designed to track and generate reports on doses administered.
BL 2024 Data Source
A report is produced based on aggregated data. Data are cumulative.
BL 2024 Methodology
This measure provides an indication of the overall usage of vaccines through the Adult Safety Net program. It also guides policy and procedure changes impacting the
Adult Safety Net program.
BL 2024 Purpose
DSHS Strategic Plan for 2023-2027, Part II B-13
Automated Budget and Evaluation System of Texas (ABEST)
88th Regular Session, Base Recon, Version 1
Strategy-Related Measures Definitions
Agency Code:
Goal No.
Proportion of HIV Positive Persons who Receive their Test ResultsMeasure No.
HIV/STD Prevention
Infectious Disease Control, Prevention and Treatment
Preparedness and Prevention Services
Measure Type
Strategy No.
Objective No.
State Health Services, Department ofAgency: 537
1
2
2
1
EF
Priority: M
Key Measure: N New Measure: N
Target Attainment: H Cross Reference: Agy 537 087-R-S52-1 01-02-02 EF 01Calculation Method: N
Percentage Measure: N
The percentage of clients testing HIV positive who receive their HIV test results from a targeted HIV testing site.
BL 2024 Definition
This does not reflect all HIV testing in the state, only testing completed by DSHS contractors funded for HIV prevention counseling and testing services and expanded
HIV testing projects.
BL 2024 Data Limitations
Program data systems maintained by the HIV/STD program. This system contains data on HIV testing done by DSHS contractors funded for HIV Counseling and
Testing Services and/or Expanded HIV Testing. Data are collected on the number of persons testing HIV positive and how many of those clients received their test
results.
BL 2024 Data Source
The number of clients who received their HIV positive test result will be divided by the total number of clients who tested HIV positive.
BL 2024 Methodology
To assess the performance of HIV prevention counseling and testing contractors.
BL 2024 Purpose
DSHS Strategic Plan for 2023-2027, Part II B-14
Automated Budget and Evaluation System of Texas (ABEST)
88th Regular Session, Base Recon, Version 1
Strategy-Related Measures Definitions
Agency Code:
Goal No.
Number of Persons Served by the HIV Medication ProgramMeasure No.
HIV/STD Prevention
Infectious Disease Control, Prevention and Treatment
Preparedness and Prevention Services
Measure Type
Strategy No.
Objective No.
State Health Services, Department ofAgency: 537
1
2
2
1
OP
Priority: H
Key Measure: Y New Measure: N
Target Attainment: H Cross Reference: Agy 537 087-R-S52-1 01-02-02 OP 01Calculation Method: C
Percentage Measure: N
The number of income eligible HIV infected persons enrolled in the Texas HIV Medication Program who have received medication or insurance assistance.
BL 2024 Definition
None.
BL 2024 Data Limitations
This information is retrieved from the HIV medication Program databases maintained by the HIV/STD Medication Program staff.
BL 2024 Data Source
This is the number of unduplicated individuals who have presented a prescription and received medication within the designated time period (per quarter and fiscal
year) or who have received support from the program for a health insurance plan that provides prescription coverage.
BL 2024 Methodology
To determine the number of eligible persons with HIV receiving life extending medications that suppresses viral load and decrease HIV transmission , or who have
received assistance through the program.
BL 2024 Purpose
DSHS Strategic Plan for 2023-2027, Part II B-15
Automated Budget and Evaluation System of Texas (ABEST)
88th Regular Session, Base Recon, Version 1
Strategy-Related Measures Definitions
Agency Code:
Goal No.
# of Clients with HIV/AIDS Receiving Medical and Supportive ServicesMeasure No.
HIV/STD Prevention
Infectious Disease Control, Prevention and Treatment
Preparedness and Prevention Services
Measure Type
Strategy No.
Objective No.
State Health Services, Department ofAgency: 537
1
2
2
2
OP
Priority: H
Key Measure: N New Measure: N
Target Attainment: H Cross Reference: Agy 537 087-R-S52-1 01-02-02 OP 02Calculation Method: C
Percentage Measure: N
The unduplicated number of clients receiving medical and supportive services from HIV service providers supported through Ryan White Program funds or DSHS
State Services funds. Services include outpatient medical care, case management, dental care, substance abuse treatment, mental health services, local
pharmaceutical assistance programs, home health, insurance assistance, hospice care, client advocacy, respite and child care, food bank, home delivered meals,
nutritional supplements, housing related services, transportation, legal services, and other supportive services allowed by the Health Resources & Services
Administration.
BL 2024 Definition
These data reflect care delivered by providers who receive Ryan White Program funds (Parts A, B, C, and D) and DSHS State HIV Services funds. The measure does not
reflect all medical and supportive services delivered to HIV infected persons in Texas, but only those delivered by providers who receive Ryan White Program funds
(Parts A, B, C, and D) or State HIV Services funds. However, the data do not solely reflect those services contracted by DSHS. The reported clients may be served with
a mixture of state, federal and local funds, and the assignment of funds is arbitrary at a client level, regardless of funding source supporting the service. Therefore, our
client count reflects all eligible clients receiving at least one eligible service from a provider receiving Ryan White or State HIV services funds .
BL 2024 Data Limitations
HIV service providers throughout the state report on medical and supportive services provided to eligible clients using the Uniform Reporting System (URS).
BL 2024 Data Source
The unduplicated number of clients receiving medical and psychosocial services is reported in the URS.
BL 2024 Methodology
To monitor the number of persons receiving medical and psychosocial services through funded providers and to measure progress on program objectives.
BL 2024 Purpose
DSHS Strategic Plan for 2023-2027, Part II B-16
Automated Budget and Evaluation System of Texas (ABEST)
88th Regular Session, Base Recon, Version 1
Strategy-Related Measures Definitions
Agency Code:
Goal No.
Number of Communicable Disease Investigations ConductedMeasure No.
Infectious Disease Prevention, Epidemiology and Surveillance
Infectious Disease Control, Prevention and Treatment
Preparedness and Prevention Services
Measure Type
Strategy No.
Objective No.
State Health Services, Department ofAgency: 537
1
2
3
1
OP
Priority: H
Key Measure: Y New Measure: N
Target Attainment: H Cross Reference: Agy 537 087-R-S52-1 01-02-03 OP 01Calculation Method: C
Percentage Measure: N
The number of communicable disease reports managed during the fiscal year.
BL 2024 Definition
Data are limited to information entered into the National Electronic Disease Surveillance System (NEDSS) infectious disease reporting systems. Does not include HIV,
STD, or TB records.
BL 2024 Data Limitations
Data in the National Electronic Disease Surveillance System (NEDSS).
BL 2024 Data Source
This measure is calculated quarterly by summing the number of reports entered into NEDSS. For the purpose of identifying which NEDSS records to count in this
performance measure, a NEDSS record is defined as one instance per patient of an investigation, a lab report, or a morbidity report.
BL 2024 Methodology
Measures the number of communicable disease reports.
BL 2024 Purpose
DSHS Strategic Plan for 2023-2027, Part II B-17
Automated Budget and Evaluation System of Texas (ABEST)
88th Regular Session, Base Recon, Version 1
Strategy-Related Measures Definitions
Agency Code:
Goal No.
Number Zoonotic Disease Surveillance Activities ConductedMeasure No.
Infectious Disease Prevention, Epidemiology and Surveillance
Infectious Disease Control, Prevention and Treatment
Preparedness and Prevention Services
Measure Type
Strategy No.
Objective No.
State Health Services, Department ofAgency: 537
1
2
3
2
OP
Priority: H
Key Measure: N New Measure: N
Target Attainment: H Cross Reference: Agy 537 087-R-S52-1 01-02-03 OP 02Calculation Method: C
Percentage Measure: N
Epidemiologic surveillance activities and field investigations that include surveillance or case-related zoonotic disease consultations, zoonotic samples collected,
sites sampled, and disease case investigations. These activities and investigations are designed to discover the cause, extent, and impact of the conditions.
BL 2024 Definition
None.
BL 2024 Data Limitations
Zoonosis Control Branch Workplan/Monthly Report is the report generated from the accumulation of all Zoonosis Control Regional offices including Central Office.
BL 2024 Data Source
The number includes the sum of the number of surveillance or case-related zoonotic disease consultations, zoonotic samples collected, sites sampled, and disease case
investigations.
BL 2024 Methodology
Measure the number of surveillance activities and field investigations conducted.
BL 2024 Purpose
DSHS Strategic Plan for 2023-2027, Part II B-18
Automated Budget and Evaluation System of Texas (ABEST)
88th Regular Session, Base Recon, Version 1
Strategy-Related Measures Definitions
Agency Code:
Goal No.
# Healthcare Facilities Enrolled in Texas Health Care Safety NetworkMeasure No.
Infectious Disease Prevention, Epidemiology and Surveillance
Infectious Disease Control, Prevention and Treatment
Preparedness and Prevention Services
Measure Type
Strategy No.
Objective No.
State Health Services, Department ofAgency: 537
1
2
3
3
OP
Priority: H
Key Measure: Y New Measure: N
Target Attainment: H Cross Reference: Agy 537 087-R-S52-1 01-02-03 OP 03Calculation Method: N
Percentage Measure: N
The number of healthcare facilities (HCFs) enrolled in the Texas Health Care Safety Network (TxHSN), a system used to report health care-associated infections
and preventable adverse events and collect other types of healthcare safety response data.
BL 2024 Definition
Data are limited to long term care facilities, end stage renal disease centers, special hospitals, general hospitals and ambulatory surgical centers which are enrolled in
TxHSN and in compliance with Chapter 98 of the Texas Health and Safety Code reporting requirements.
BL 2024 Data Limitations
The data are captured in TxHSN.
BL 2024 Data Source
This measure is calculated quarterly by running a report in TxHSN for the number of facilities enrolled and in compliance with reporting requirements.
BL 2024 Methodology
Tracks the total number of HCFs and measures healthcare facility compliance with legislatively mandated reporting of health care-associated infections and preventable
adverse events.
BL 2024 Purpose
DSHS Strategic Plan for 2023-2027, Part II B-19
Automated Budget and Evaluation System of Texas (ABEST)
88th Regular Session, Base Recon, Version 1
Strategy-Related Measures Definitions
Agency Code:
Goal No.
Number of Tuberculosis Disease Investigations ConductedMeasure No.
TB Surveillance and Prevention
Infectious Disease Control, Prevention and Treatment
Preparedness and Prevention Services
Measure Type
Strategy No.
Objective No.
State Health Services, Department ofAgency: 537
1
2
4
1
OP
Priority: H
Key Measure: Y New Measure: N
Target Attainment: H Cross Reference: Agy 537 087-R-S52-1 01-02-04 OP 01Calculation Method: C
Percentage Measure: N
The number of TB reports managed during the fiscal year.
BL 2024 Definition
Data are limited to information entered into the TB registry and case management data systems. There may be occasional system issues that limit the electronic
laboratory reporting processes or that delay the submission of samples.
BL 2024 Data Limitations
The DSHS captures data in the Texas Tuberculosis (TB) Surveillance Database.
BL 2024 Data Source
This measure is the total number of TB records entered into the Texas Tuberculosis (TB) Surveillance Database. A TB record is defined as an initial laboratory report
that consists of the following: a positive acid fast-bacilli smear, a positive nucleic acid amplification test, a positive TB culture, a drug susceptibility test, or a genotype
result. In the absence of a laboratory report, a TB record is defined by a report of a provider diagnosis of confirmed or suspected TB, TB infection, or contact to a
suspected or confirmed TB case.
BL 2024 Methodology
Measures the number of disease reports managed by a DSHS public health region or local health department.
BL 2024 Purpose
DSHS Strategic Plan for 2023-2027, Part II B-20
Automated Budget and Evaluation System of Texas (ABEST)
88th Regular Session, Base Recon, Version 1
Strategy-Related Measures Definitions
Agency Code:
Goal No.
Number of Inpatient Days, Texas Center for Infectious DiseaseMeasure No.
Texas Center for Infectious Disease (TCID)
Infectious Disease Control, Prevention and Treatment
Preparedness and Prevention Services
Measure Type
Strategy No.
Objective No.
State Health Services, Department ofAgency: 537
1
2
5
1
OP
Priority: H
Key Measure: Y New Measure: N
Target Attainment: H Cross Reference: Agy 537 087-R-S52-1 01-02-05 OP 01Calculation Method: C
Percentage Measure: N
The total number of days of care charged for occupied inpatient beds.
BL 2024 Definition
None.
BL 2024 Data Limitations
Total daily census is aggregated in the Hospital Information System at midnight.
BL 2024 Data Source
Calculated by summing all inpatient days for the reporting period.
BL 2024 Methodology
Monitoring of total patient days at TCID is a public health indicator both of acuity of patient conditions and complications in communities . This reflects the utilization
of total beds.
BL 2024 Purpose
DSHS Strategic Plan for 2023-2027, Part II B-21
Automated Budget and Evaluation System of Texas (ABEST)
88th Regular Session, Base Recon, Version 1
Strategy-Related Measures Definitions
Agency Code:
Goal No.
Number of Admissions: Total Number Patients Admitted to TCIDMeasure No.
Texas Center for Infectious Disease (TCID)
Infectious Disease Control, Prevention and Treatment
Preparedness and Prevention Services
Measure Type
Strategy No.
Objective No.
State Health Services, Department ofAgency: 537
1
2
5
2
OP
Priority: H
Key Measure: N New Measure: N
Target Attainment: H Cross Reference: Agy 537 087-R-S52-1 01-02-05 OP 02Calculation Method: C
Percentage Measure: N
Number of admissions for the reporting period.
BL 2024 Definition
None.
BL 2024 Data Limitations
Admission summary for each patient admitted to TCID is logged into the electronic medical record and internal data base, and data is compiled quarterly.
BL 2024 Data Source
Whole number cumulated for the reporting period.
BL 2024 Methodology
Measures activity and utilization of Tuberculosis inpatient treatment.
BL 2024 Purpose
DSHS Strategic Plan for 2023-2027, Part II B-22
Automated Budget and Evaluation System of Texas (ABEST)
88th Regular Session, Base Recon, Version 1
Strategy-Related Measures Definitions
Agency Code:
Goal No.
Number of Laboratory Tests PerformedMeasure No.
Laboratory Services
State Laboratory
Preparedness and Prevention Services
Measure Type
Strategy No.
Objective No.
State Health Services, Department ofAgency: 537
1
4
1
1
OP
Priority: H
Key Measure: N New Measure: N
Target Attainment: H Cross Reference: Agy 537 087-R-S52-1 01-04-01 OP 01Calculation Method: C
Percentage Measure: N
The number of laboratory tests performed represents the number of specimens submitted to the laboratory multiplied by the number of tests performed on each
specimen. The number of tests is defined by the actual tests requested by the individual or organization submitting the specimen .
BL 2024 Definition
This measure will report only the total volume of tests performed by the laboratory and will not account for differences in the amount of work needed for various tests.
BL 2024 Data Limitations
Summary reports from the laboratory information management systems.
BL 2024 Data Source
Count of number of individual tests performed on specimens submitted to the laboratory.
BL 2024 Methodology
To provide an indicator of the volume of testing performed by the Laboratory Services Section of DSHS.
BL 2024 Purpose
DSHS Strategic Plan for 2023-2027, Part II B-23
Automated Budget and Evaluation System of Texas (ABEST)
88th Regular Session, Base Recon, Version 1
Strategy-Related Measures Definitions
Agency Code:
Goal No.
% of Initial Newborn Screen Results Reported within 7 Days Of BirthMeasure No.
Laboratory Services
State Laboratory
Preparedness and Prevention Services
Measure Type
Strategy No.
Objective No.
State Health Services, Department ofAgency: 537
1
4
1
2
OP
Priority: H
Key Measure: Y New Measure: N
Target Attainment: H Cross Reference: Agy 537 087-R-S52-1 01-04-01 OP 02Calculation Method: N
Percentage Measure: Y
The percent of newborn screening specimens collected at less than or equal to 7 days of life that have testing completed and reported for the entire current
Newborn Screening panel by the DSHS Laboratory Services Section when the infant is less than or equal to 7 days of age.
BL 2024 Definition
None.
BL 2024 Data Limitations
Newborn Screening Laboratory Information Management System.
BL 2024 Data Source
Extract all newborn screening specimens received in the given timeframe where the date of birth subtracted from the date of specimen collection is less than or equal to
7.0 days. Calculate the age at reporting by subtracting the date of birth from the date at reporting. Count the number of specimens where the age at reporting is less than
or equal to 7.0. Divide the count reported at less than or equal to 7 days by the total count of specimens collected at less than or equal to 7 days.
BL 2024 Methodology
Measure the timeliness of the Newborn Screening system including specimen collection timing by the healthcare provider, transport to the DSHS laboratory, receipt into
the DSHS laboratory, completion of testing for all disorders, and generation of final reports.
BL 2024 Purpose
DSHS Strategic Plan for 2023-2027, Part II B-24
Automated Budget and Evaluation System of Texas (ABEST)
88th Regular Session, Base Recon, Version 1
Strategy-Related Measures Definitions
Agency Code:
Goal No.
Number of Newborns Receiving Hearing Screens (All Funding Sources)Measure No.
Maternal and Child Health
Promote Maternal and Child Health
Community Health Services
Measure Type
Strategy No.
Objective No.
State Health Services, Department ofAgency: 537
2
1
1
1
OP
Priority: H
Key Measure: N New Measure: N
Target Attainment: H Cross Reference: Agy 537 087-R-S52-1 02-01-01 OP 01Calculation Method: C
Percentage Measure: N
This measure reports the number of newborns receiving a newborn hearing screen, as mandated under Health and Safety Code, Title 2, Subtitle B, Chapter 47.
BL 2024 Definition
Complete data may not be available for the reporting period at the time the report is due; therefore, projections may be included based on available data.
BL 2024 Data Limitations
The data source is the Texas Early Hearing Detection and Intervention Management Information System (TEHDI MIS).
BL 2024 Data Source
Newborns receiving a newborn hearing screen as reported to TEHDI will be counted.
BL 2024 Methodology
This measure is intended to show the population of newborns that receive a newborn hearing screening. Early identification of newborns who are deaf or hard of
hearing is critical to initiate interventions allowing developmental language, vocabulary, and communication support.
BL 2024 Purpose
DSHS Strategic Plan for 2023-2027, Part II B-25
Automated Budget and Evaluation System of Texas (ABEST)
88th Regular Session, Base Recon, Version 1
Strategy-Related Measures Definitions
Agency Code:
Goal No.
Average Annual Cost Per CSHCN Client Receiving Case ManagementMeasure No.
Children with Special Health Care Needs
Promote Maternal and Child Health
Community Health Services
Measure Type
Strategy No.
Objective No.
State Health Services, Department ofAgency: 537
2
1
2
1
EF
Priority: H
Key Measure: N New Measure: N
Target Attainment: L Cross Reference: Agy 537 087-R-S52-1 02-01-02 EF 01Calculation Method: N
Percentage Measure: N
This measure reports the average annual cost per unduplicated client with special health care needs who receives case management. Case management provides a
comprehensive service to assist clients and their families in gaining access to needed resources, including intake, assessment, coordination, advocacy and
follow-up. Dually-eligible, Medicaid and the Children with Special Health Care Needs (CSHCN) Services Program clients served are not reflected in this measure.
For purposes of this performance measure, "CSHCN clients" are children with special health care needs who receive case management but are not necessarily
enrolled in the CSHCN Services Program. A client is considered as receiving case management services when a case manager has been assigned to the client and
his or her family, and services have been provided.
BL 2024 Definition
Complete data may not be available for the reporting period at the time the report is due; therefore, estimates may be included based on the data available.
BL 2024 Data Limitations
The number of clients receiving case management services is derived from the monthly regional reports provided to the Texas Department of State Health Services
(DSHS) by CSHCN Services Program regional program directors and organizations funded to provide case management. Expenditure data is obtained from the DSHS
accounting system.
BL 2024 Data Source
The average cost per unduplicated client receiving case management is calculated by dividing the total expended for case management by the total number of clients
who received case management services. Estimates may be used for quarters in which claims data is incomplete.
BL 2024 Methodology
This measure reports the number of non-Medicaid clients with special health care needs who receive case management services. Services ensure clients a) gain access
to necessary medical, social, educational and other services to reduce morbidity and mortality; b) are encouraged to use cost effective health care; and c) receive
appropriate referrals to medical providers and community resources to discourage over utilization and duplication of services.
BL 2024 Purpose
DSHS Strategic Plan for 2023-2027, Part II B-26
Automated Budget and Evaluation System of Texas (ABEST)
88th Regular Session, Base Recon, Version 1
Strategy-Related Measures Definitions
Agency Code:
Goal No.
Number of CSHCN Clients Receiving Case ManagementMeasure No.
Children with Special Health Care Needs
Promote Maternal and Child Health
Community Health Services
Measure Type
Strategy No.
Objective No.
State Health Services, Department ofAgency: 537
2
1
2
1
OP
Priority: H
Key Measure: N New Measure: N
Target Attainment: H Cross Reference: Agy 537 087-R-S52-1 02-01-02 OP 01Calculation Method: C
Percentage Measure: N
This measure reports the unduplicated number of clients with special health care needs who receive case management. Case management provides a
comprehensive service to assist clients and their families in gaining access to needed resources, including intake, assessment, coordination, advocacy and
follow-up. Dually-eligible, Medicaid and Children with Special Health Care Needs (CSHCN) Services Program clients served are not reflected in this measure. For
purposes of this performance measure, "CSHCN clients" are children special health care needs who receive case management but are not necessarily enrolled in
the CSHCN Services Program. A client is considered as receiving case management services when a case manager has been assigned to the client and his or her
family, and services have been provided.
BL 2024 Definition
Complete data may not be available for the reporting period at the time the report is due; therefore, estimates may be included based on the data available.
BL 2024 Data Limitations
The number of clients receiving case management services is derived from the quarterly regional reports provided to the Texas Department of State Health Services
(DSHS) central office.
BL 2024 Data Source
The number of clients with a case manager reported by the regional offices and organizations funded to provide case management.
BL 2024 Methodology
This measure reports the number of non-Medicaid clients with special health care needs who receive case management services. Services ensure clients a) gain access
to necessary medical, social, educational and other services to reduce morbidity and mortality; b) are encouraged to use cost-effective health care; and c) receive
appropriate referrals to medical providers and community resources to discourage over utilization and duplication of services.
BL 2024 Purpose
DSHS Strategic Plan for 2023-2027, Part II B-27
Automated Budget and Evaluation System of Texas (ABEST)
88th Regular Session, Base Recon, Version 1
Strategy-Related Measures Definitions
Agency Code:
Goal No.
Number of Trauma FacilitiesMeasure No.
EMS and Trauma Care Systems
Strengthen Healthcare Infrastructure
Community Health Services
Measure Type
Strategy No.
Objective No.
State Health Services, Department ofAgency: 537
2
2
1
1
EX
Priority: M
Key Measure: Y New Measure: N
Target Attainment: H Cross Reference: Agy 537 087-R-S52-1 02-02-01 EX 01Calculation Method: N
Percentage Measure: N
This measure is defined as the number of hospitals designated as trauma facilities. Each trauma facility designation is documented in applications filed and by
survey reports filed by staff or the applicant hospital. Each designation survey is documented in files established by staff for each designated facility.
BL 2024 Definition
None.
BL 2024 Data Limitations
Versa Regulation online licensing system of designated trauma facilities and trauma designation files is the data source.
BL 2024 Data Source
The number is determined by adding the number of designated trauma facilities at each level and then summing those.
BL 2024 Methodology
This measure provides a way to determine the level of department regulatory activities within this strategy. Significant staff resources are required to designate trauma
facilities. This measure provides a way to track those resources.
BL 2024 Purpose
DSHS Strategic Plan for 2023-2027, Part II B-28

Automated Budget and Evaluation System of Texas (ABEST)
88th Regular Session, Base Recon, Version 1
Strategy-Related Measures Definitions
Agency Code:
Goal No.
Number of Stroke FacilitiesMeasure No.
EMS and Trauma Care Systems
Strengthen Healthcare Infrastructure
Community Health Services
Measure Type
Strategy No.
Objective No.
State Health Services, Department ofAgency: 537
2
2
1
2
EX
Priority: M
Key Measure: Y New Measure: N
Target Attainment: H Cross Reference: Agy 537 087-R-S52-1 02-02-01 EX 02Calculation Method: N
Percentage Measure: N
This measure is defined as the number of hospitals designated as stroke facilities. Each stroke facility designation is documented in applications filed and by
survey reports filed by staff or the applicant hospital. Each designation survey is documented in files established by staff for each designated facility.
BL 2024 Definition
None
BL 2024 Data Limitations
The Versa Regulation online licensing system of designated stroke facilities and stroke designation files is the data source.
BL 2024 Data Source
The number is determined by adding the number of designated stroke facilities at each level and then summing those.
BL 2024 Methodology
This measure provides a way to determine the level of department regulatory activities within this strategy. Significant staff resources are required to designate stroke
facilities. This measure provides a way to track those resources.
BL 2024 Purpose
DSHS Strategic Plan for 2023-2027, Part II B-29
Automated Budget and Evaluation System of Texas (ABEST)
88th Regular Session, Base Recon, Version 1
Strategy-Related Measures Definitions
Agency Code:
Goal No.
Number of Hospitals with Maternal Care DesignationMeasure No.
EMS and Trauma Care Systems
Strengthen Healthcare Infrastructure
Community Health Services
Measure Type
Strategy No.
Objective No.
State Health Services, Department ofAgency: 537
2
2
1
3
EX
Priority: H
Key Measure: Y New Measure: N
Target Attainment: H Cross Reference: Agy 537 087-R-S52-1 02-02-01 EX 03Calculation Method: N
Percentage Measure: N
This measure is defined as the total number of hospitals designated at any maternal level of care. To achieve the maternal level of care designation, facilities submit
to DSHS an application including a report from an on-site review conducted by an independent organization which documents compliance with Texas
Administrative Code 25, Chapter 133, Subchapter J, Hospital Level of Care Designations for Neonatal and Maternal Care, and a letter from the applicable Perinatal
Care Region verifying participation in the region. Re-designation is required every three years. The measure definition does not include “licensed” in the
description because the state owned hospitals (e.g. UTMB) are not licensed but may seek designation at some point.
BL 2024 Definition
Complete data may not be available for the reporting period at the time the report is due; therefore, estimates may be included based on the data available.
BL 2024 Data Limitations
The Versa Regulation online licensing system of designated maternal care facilities, maternal care designation files, and Health and Human Services licensing database
are the data source.
BL 2024 Data Source
The number reported is the total number of designated facilities, determined by adding the number of individually designated maternal facilities and reflecting all levels
of designation, into a single total.
BL 2024 Methodology
To track fluctuations in the number of hospitals that are designated at a Maternal Level of Care. Maternal Level of Care Designation is an eligibility requirement for
hospital Medicaid reimbursement for maternal care.
BL 2024 Purpose
DSHS Strategic Plan for 2023-2027, Part II B-30
Automated Budget and Evaluation System of Texas (ABEST)
88th Regular Session, Base Recon, Version 1
Strategy-Related Measures Definitions
Agency Code:
Goal No.
Number of Hospitals with Neonatal Care DesignationMeasure No.
EMS and Trauma Care Systems
Strengthen Healthcare Infrastructure
Community Health Services
Measure Type
Strategy No.
Objective No.
State Health Services, Department ofAgency: 537
2
2
1
4
EX
Priority: H
Key Measure: Y New Measure: N
Target Attainment: H Cross Reference: Agy 537 087-R-S52-1 02-02-01 EX 04Calculation Method: N
Percentage Measure: N
This measure is defined as the total number of hospitals designated at any neonatal level of care.
To achieve the neonatal level of care designation, facilities submit to DSHS an application including a report from an on-site review conducted by an independent
organization which documents compliance with Texas Administrative Code 25, Chapter 133, Subchapter J, Hospital Level of Care Designations for Neonatal and
Maternal Care, and a letter from the applicable Perinatal Care Region verifying participation in the region. Re-designation is required every three years. The
measure definition does not include “licensed” in the description because the state owned hospitals (e.g. UTMB) are not licensed but may seek designation at
some point.
BL 2024 Definition
Complete data may not be available for the reporting period at the time the report is due; therefore, estimates may be included based on the data available.
BL 2024 Data Limitations
The Versa Regulation online licensing system of designated neonatal care facilities, neonatal care designation files, and Health and Human Services licensing database
are the data source.
BL 2024 Data Source
The number reported is the total number of designated facilities, determined by adding the number of individually designated facilities and reflecting all levels of
neonatal designation, into a single total.
BL 2024 Methodology
To track fluctuations in the number of hospitals that are designated at a Neonatal Level of Care. Neonatal Level of Care Designation is an eligibility requirement for
hospital Medicaid reimbursement for neonatal care.
BL 2024 Purpose
DSHS Strategic Plan for 2023-2027, Part II B-31
Automated Budget and Evaluation System of Texas (ABEST)
88th Regular Session, Base Recon, Version 1
Strategy-Related Measures Definitions
Agency Code:
Goal No.
Number of Providers Funded: EMS/TraumaMeasure No.
EMS and Trauma Care Systems
Strengthen Healthcare Infrastructure
Community Health Services
Measure Type
Strategy No.
Objective No.
State Health Services, Department ofAgency: 537
2
2
1
1
OP
Priority: H
Key Measure: Y New Measure: N
Target Attainment: H Cross Reference: Agy 537 087-R-S52-1 02-02-01 OP 01Calculation Method: C
Percentage Measure: N
This measure tracks emergency health care providers who are provided funding through one or more of the EMS/trauma systems development funding programs.
BL 2024 Definition
None.
BL 2024 Data Limitations
The EMS and Trauma Systems database of contractors and files.
BL 2024 Data Source
The number is determined by counting the providers who are funded. Data is obtained from contract files.
BL 2024 Methodology
This measure is an indicator of how well the department handles the distribution of funds intended for emergency healthcare system's development.
BL 2024 Purpose
DSHS Strategic Plan for 2023-2027, Part II B-32
Automated Budget and Evaluation System of Texas (ABEST)
88th Regular Session, Base Recon, Version 1
Strategy-Related Measures Definitions
Agency Code:
Goal No.
# EMS Personnel Licensed, Permit, Cert, RegisteredMeasure No.
EMS and Trauma Care Systems
Strengthen Healthcare Infrastructure
Community Health Services
Measure Type
Strategy No.
Objective No.
State Health Services, Department ofAgency: 537
2
2
1
2
OP
Priority: H
Key Measure: Y New Measure: N
Target Attainment: H Cross Reference: Agy 537 087-R-S52-1 02-02-01 OP 02Calculation Method: C
Percentage Measure: N
The cumulative total (both new and renewals) of EMS personnel licensed, permitted, certified, registered, documented, or placed on a registry.
BL 2024 Definition
Complete data may not be available for the reporting period at the time the report is due; therefore, estimates may be included based on the data available.
BL 2024 Data Limitations
The data is obtained from the regulatory system application(s).
BL 2024 Data Source
The total number of new and renewal licenses, permits, certifications, and registrations of EMS personnel that are issued by DSHS.
BL 2024 Methodology
The measure provides an inventory of the total number of licensed, permitted, certified, or registered EMS personnel in the state.
BL 2024 Purpose
DSHS Strategic Plan for 2023-2027, Part II B-33
Automated Budget and Evaluation System of Texas (ABEST)
88th Regular Session, Base Recon, Version 1
Strategy-Related Measures Definitions
Agency Code:
Goal No.
Number of EMS Personnel Complaint Investigations ConductedMeasure No.
EMS and Trauma Care Systems
Strengthen Healthcare Infrastructure
Community Health Services
Measure Type
Strategy No.
Objective No.
State Health Services, Department ofAgency: 537
2
2
1
3
OP
Priority: L
Key Measure: N New Measure: N
Target Attainment: H Cross Reference: Agy 537 087-R-S52-1 02-02-01 OP 03Calculation Method: C
Percentage Measure: N
The number of EMS personnel complaint investigations conducted is defined as the total number of investigations performed by staff which are documented by
an appropriate investigative report. The investigations are initiated upon notification of possible violations of state laws or rules.
BL 2024 Definition
Complete data may not be available for the reporting period at the time the report is due; therefore, estimates may be included based on the data available.
BL 2024 Data Limitations
The data are extracted from regulatory system application(s), which has an enforcement module for tracking complaint investigations.
BL 2024 Data Source
The closed complaint investigations are totaled quarterly and are cumulative for the fiscal year.
BL 2024 Methodology
Investigating complaints against EMS personnel is an element of public health protection. This measure illustrates the level of workload performed by the program.
BL 2024 Purpose
DSHS Strategic Plan for 2023-2027, Part II B-34
Automated Budget and Evaluation System of Texas (ABEST)
88th Regular Session, Base Recon, Version 1
Strategy-Related Measures Definitions
Agency Code:
Goal No.
Number of Licenses Issued for EMS ProvidersMeasure No.
EMS and Trauma Care Systems
Strengthen Healthcare Infrastructure
Community Health Services
Measure Type
Strategy No.
Objective No.
State Health Services, Department ofAgency: 537
2
2
1
4
OP
Priority: M
Key Measure: N New Measure: N
Target Attainment: H Cross Reference: Agy 537 087-R-S52-1 02-02-01 OP 04Calculation Method: C
Percentage Measure: N
The number of EMS Provider licenses issued reflects the number of newly licensed entities, entities renewing licenses, changing ownership (i.e., entities bought
and sold), changing address, name, and number of beds.
BL 2024 Definition
This measure may be less than the actual workload due to applications received and reviewed where no license is issued (for various reasons). This measure does not
reflect the number of licensed EMS Providers at any given time (i.e., a count of licensed providers) due to the fact that while initial licenses are being issued to new
entities, a number of entities are closing or undergoing a change of ownership.
BL 2024 Data Limitations
After the receipt of a complete application and licensing fee and upon completion of the application review, a license is issued to the EMS Provider. All license data is
entered into the regulatory system application(s).
BL 2024 Data Source
The licenses issued are totaled each quarter and are cumulative for the fiscal year.
BL 2024 Methodology
These counts can be used for analyzing trends in the EMS industry and in forecasting future trends, growths, and/or declines in the EMS industry as well as showing
the significant workload of the programs.
BL 2024 Purpose
DSHS Strategic Plan for 2023-2027, Part II B-35
Automated Budget and Evaluation System of Texas (ABEST)
88th Regular Session, Base Recon, Version 1
Strategy-Related Measures Definitions
Agency Code:
Goal No.
# EMS Provider and Educ Program Complaint Investigations ConductedMeasure No.
EMS and Trauma Care Systems
Strengthen Healthcare Infrastructure
Community Health Services
Measure Type
Strategy No.
Objective No.
State Health Services, Department ofAgency: 537
2
2
1
5
OP
Priority: H
Key Measure: N New Measure: N
Target Attainment: H Cross Reference: Agy 537 087-R-S52-1 02-02-01 OP 05Calculation Method: C
Percentage Measure: N
The number of EMS Provider and Education Program complaint investigations conducted is defined as the total number of investigations under state regulations
performed by staff and the total number of self-investigated complaints. The investigations are initiated upon notification of possible violations of state laws or
rules.
BL 2024 Definition
Complete data may not be available for the reporting period at the time the report is due; therefore, estimates may be included based on the data available.
BL 2024 Data Limitations
The data are computed from the regulatory system application(s) containing information from investigation reports submitted by staff.
BL 2024 Data Source
The complaint investigations are totaled quarterly and are cumulative for the fiscal year.
BL 2024 Methodology
Investigating complaints against Provider and Education Program is an element of public health protection. This measure illustrates the level of workload performed by
the program.
BL 2024 Purpose
DSHS Strategic Plan for 2023-2027, Part II B-36
Automated Budget and Evaluation System of Texas (ABEST)
88th Regular Session, Base Recon, Version 1
Strategy-Related Measures Definitions
Agency Code:
Goal No.
Number of EMS Provider and Education Program Surveys ConductedMeasure No.
EMS and Trauma Care Systems
Strengthen Healthcare Infrastructure
Community Health Services
Measure Type
Strategy No.
Objective No.
State Health Services, Department ofAgency: 537
2
2
1
6
OP
Priority: H
Key Measure: N New Measure: N
Target Attainment: H Cross Reference: Agy 537 087-R-S52-1 02-02-01 OP 06Calculation Method: C
Percentage Measure: N
This measure is defined as the number of surveys and inspections of EMS Provider and EMS educational programs conducted by staff , excluding complaint
investigations.
BL 2024 Definition
Complete data may not be available for the reporting period at the time the report is due; therefore, estimates may be included based on the data available.
BL 2024 Data Limitations
Each survey and inspection is documented in a report provided by staff at the completion of the survey or inspection process . These reports are kept in the regulatory
system application(s).
BL 2024 Data Source
This measure is the total number of surveys and inspections of EMS Providers and EMS educational programs conducted by staff for each quarter , excluding complaint
investigations, and is cumulative for the fiscal year.
BL 2024 Methodology
This measure illustrates the total number of surveys and inspections, pertaining to the quality of EMS Providers and EMS educational programs, conducted by staff,
excluding complaint investigations.
BL 2024 Purpose
DSHS Strategic Plan for 2023-2027, Part II B-37
Automated Budget and Evaluation System of Texas (ABEST)
88th Regular Session, Base Recon, Version 1
Strategy-Related Measures Definitions
Agency Code:
Goal No.
Average Cost Per Surveillance Activity - Food/Meat and Drug SafetyMeasure No.
Food (Meat) and Drug Safety
Provide Licensing and Regulatory Compliance
Consumer Protection Services
Measure Type
Strategy No.
Objective No.
State Health Services, Department ofAgency: 537
3
1
1
1
EF
Priority: H
Key Measure: Y New Measure: N
Target Attainment: L Cross Reference: Agy 537 087-R-S52-1 03-01-01 EF 01Calculation Method: N
Percentage Measure: N
The average cost per surveillance activity is defined as the average of all costs for the inspection and investigation programs relative to food, drug and meat
safety.
BL 2024 Definition
Complete data may not be available for the reporting period at the time the report is due; therefore, estimates may be included based on the data available.
BL 2024 Data Limitations
The number of surveillance activities is obtained from the data are obtained from the regulatory system application(s). The expenditures data is obtained from the DSHS
accounting system.
BL 2024 Data Source
The year-to-date cost is calculated for each program area: manufactured food, retail foods, drugs and medical devices, meat safety, milk and dairy, and seafood safety.
The expenditures are obtained from the accounting system used by the DSHS budget office. These costs are divided by the program area's year-to-date number of
surveillance activities conducted.
BL 2024 Methodology
Measures the average cost per surveillance activity for food, drug and meat safety.
BL 2024 Purpose
DSHS Strategic Plan for 2023-2027, Part II B-38
Automated Budget and Evaluation System of Texas (ABEST)
88th Regular Session, Base Recon, Version 1
Strategy-Related Measures Definitions
Agency Code:
Goal No.
# of Surveillance Activities Conducted - Food/Meat and Drug SafetyMeasure No.
Food (Meat) and Drug Safety
Provide Licensing and Regulatory Compliance
Consumer Protection Services
Measure Type
Strategy No.
Objective No.
State Health Services, Department ofAgency: 537
3
1
1
1
OP
Priority: H
Key Measure: N New Measure: N
Target Attainment: H Cross Reference: Agy 537 087-R-S52-1 03-01-01 OP 01Calculation Method: C
Percentage Measure: N
The total number of inspection activities and investigations performed by staff that are documented by appropriate reports . Includes: routine, special, complaint,
compliance, inspections and investigations; seafood surveys; collection of samples; recall effectiveness checks and scheduling of drugs.
BL 2024 Definition
Complete data may not be available for the reporting period at the time the report is due; therefore, estimates may be included based on the data available.
BL 2024 Data Limitations
The data are obtained from the regulatory system application(s) and other systems maintained to document activities. The programs collect routine, special, complaint,
and compliance inspection and investigation data, as well as sample data and recall effectiveness data.
BL 2024 Data Source
The number of inspections, re-inspections, and investigations where there is a documented report are counted. The inspections and investigations include routine,
special, complaint, and compliance inspections and investigations; seafood surveys; collection of samples; recall effectiveness checks and scheduling of drugs.
BL 2024 Methodology
The measure illustrates the level of workload for each inspector as an average which aides in justifying staff resources. This data is necessary to calculate the cost of
inspections. Without knowing how many activities are performed under this measure it would be impossible to determine the average cost of inspections /activities.
BL 2024 Purpose
DSHS Strategic Plan for 2023-2027, Part II B-39
Automated Budget and Evaluation System of Texas (ABEST)
88th Regular Session, Base Recon, Version 1
Strategy-Related Measures Definitions
Agency Code:
Goal No.
# of Enforcement Actions Initiated - Food/Meat and Drug SafetyMeasure No.
Food (Meat) and Drug Safety
Provide Licensing and Regulatory Compliance
Consumer Protection Services
Measure Type
Strategy No.
Objective No.
State Health Services, Department ofAgency: 537
3
1
1
2
OP
Priority: H
Key Measure: N New Measure: N
Target Attainment: H Cross Reference: Agy 537 087-R-S52-1 03-01-01 OP 02Calculation Method: C
Percentage Measure: N
Enforcement actions initiated include notices of violation that propose revocation, suspension and denial of licenses; administrative penalties and orders;
enforcement conferences; referrals to the Attorney General and District Attorney; repeated violation letters; detentions, letters of advisement, letters of concern,
warning letters, incident evaluations, collection letters, and inspection warrants obtained and all other actions at law.
BL 2024 Definition
Complete data may not be available for the reporting period at the time the report is due; therefore, estimates may be included based on the data available.
BL 2024 Data Limitations
The data are obtained from the regulatory system application(s).
BL 2024 Data Source
The data are totaled quarterly and are cumulative for the fiscal year. For this measure, the total number of enforcement actions are counted.
BL 2024 Methodology
The information obtained through this measure ensures DSHS is in compliance with state laws and rules.
BL 2024 Purpose
DSHS Strategic Plan for 2023-2027, Part II B-40
Automated Budget and Evaluation System of Texas (ABEST)
88th Regular Session, Base Recon, Version 1
Strategy-Related Measures Definitions
Agency Code:
Goal No.
# of Licenses/Registrations Issued - Food/Meat and Drug SafetyMeasure No.
Food (Meat) and Drug Safety
Provide Licensing and Regulatory Compliance
Consumer Protection Services
Measure Type
Strategy No.
Objective No.
State Health Services, Department ofAgency: 537
3
1
1
3
OP
Priority: M
Key Measure: N New Measure: N
Target Attainment: H Cross Reference: Agy 537 087-R-S52-1 03-01-01 OP 03Calculation Method: C
Percentage Measure: N
The total number of new and renewed licenses, permits, registrations, certifications and accreditations issued to food, milk, meat, drug, and device establishments,
studios, manufacturers, wholesalers, salvagers, brokers, educational programs, and individuals.
BL 2024 Definition
Complete data may not be available for the reporting period at the time the report is due; therefore, estimates may be included based on the data available.
BL 2024 Data Limitations
The data are calculated manually and by automated databases. The programs (seafood safety, milk & dairy, food, drug, and meat safety) collect data on licenses,
permits, and registrations. Licensing and certification data are collected by the manufactured foods, milk & dairy, retail, and seafood safety programs. Granting data are
collected by the Meat Safety Assurance Unit. Accreditation data are collected by the retail foods and manufactured foods programs. Source documentation identifies
the manual and regulatory system application(s).
BL 2024 Data Source
The number of licenses, permits, registrations, certifications, and accreditations issued are totaled quarterly and are cumulative for the FY. The total number of new &
renewal licenses, permits, registrations, certifications, and accreditations are issued by the food and drug regulatory licensing groups to: food, milk, drug & device
establishments, studios, manufacturers, wholesalers, brokers, educational programs, and individuals, and the total number of grants issued by the MSA.
BL 2024 Methodology
This measure provides an inventory of the total number of licenses in the state. It provides information about the businesses that are operating food, milk & drug &
device, studios, manufacturer, wholesale, and brokers in the state. The potential impact of the data is being able to trace-back food borne illnesses and determine the
number of employees that are needed to regulate these businesses.
BL 2024 Purpose
DSHS Strategic Plan for 2023-2027, Part II B-41
Automated Budget and Evaluation System of Texas (ABEST)
88th Regular Session, Base Recon, Version 1
Strategy-Related Measures Definitions
Agency Code:
Goal No.
Average Cost Per Surveillance Activity - Environmental HealthMeasure No.
Environmental Health
Provide Licensing and Regulatory Compliance
Consumer Protection Services
Measure Type
Strategy No.
Objective No.
State Health Services, Department ofAgency: 537
3
1
2
1
EF
Priority: H
Key Measure: Y New Measure: N
Target Attainment: L Cross Reference: Agy 537 087-R-S52-1 03-01-02 EF 01Calculation Method: N
Percentage Measure: N
The average cost per surveillance activity is defined as the average of all costs for the inspections and investigation programs relative to environmental health.
BL 2024 Definition
Complete data may not be available for the reporting period at the time the report is due; therefore, estimates may be included based on the data available.
BL 2024 Data Limitations
The number of surveillance activities is obtained from the data are obtained from the regulatory system application(s). The expenditure data is obtained from the DSHS
accounting.
BL 2024 Data Source
The year to date cost is calculated for toxic substances control, general sanitation, and product safety programs for surveillance activities. These costs are divided by
the program area’s year to date number of surveillance activities conducted.
BL 2024 Methodology
Measures the average cost per surveillance activity for environmental health.
BL 2024 Purpose
DSHS Strategic Plan for 2023-2027, Part II B-42
Automated Budget and Evaluation System of Texas (ABEST)
88th Regular Session, Base Recon, Version 1
Strategy-Related Measures Definitions
Agency Code:
Goal No.
Number of Surveillance Activities Conducted - Environmental HealthMeasure No.
Environmental Health
Provide Licensing and Regulatory Compliance
Consumer Protection Services
Measure Type
Strategy No.
Objective No.
State Health Services, Department ofAgency: 537
3
1
2
1
OP
Priority: H
Key Measure: N New Measure: N
Target Attainment: H Cross Reference: Agy 537 087-R-S52-1 03-01-02 OP 01Calculation Method: C
Percentage Measure: N
The total number of surveillance activities, inspections and investigations performed by staff that are documented by appropriate reports . Includes routine,
complaint, and compliance inspections, collection of samples, which are performed at a place of business, school, clinic, public building, temporary work place, or
other facility.
BL 2024 Definition
Complete data may not be available for the reporting period at the time the report is due; therefore, estimates may be included based on the data available.
BL 2024 Data Limitations
The data are obtained from the regulatory system application(s).
BL 2024 Data Source
The total number of inspections, re-inspections and investigations that are documented by inspection reports are counted. Included are routine, special, complaint, and
compliance inspections, collection of samples, and any other type of investigation performed at a place of business, school, clinic, public building, temporary work
place, or other facility.
BL 2024 Methodology
It illustrates the level of workload borne by each inspector as an average which aides in justifying staff resources . This data are necessary to calculate the cost of
inspections. Without knowing how many activities are performed under this measure it would be impossible to determine the average cost of inspections /activities.
BL 2024 Purpose
DSHS Strategic Plan for 2023-2027, Part II B-43
Automated Budget and Evaluation System of Texas (ABEST)
88th Regular Session, Base Recon, Version 1
Strategy-Related Measures Definitions
Agency Code:
Goal No.
Number of Enforcement Actions Initiated - Environmental HealthMeasure No.
Environmental Health
Provide Licensing and Regulatory Compliance
Consumer Protection Services
Measure Type
Strategy No.
Objective No.
State Health Services, Department ofAgency: 537
3
1
2
2
OP
Priority: H
Key Measure: N New Measure: N
Target Attainment: H Cross Reference: Agy 537 087-R-S52-1 03-01-02 OP 02Calculation Method: C
Percentage Measure: N
Enforcement actions initiated include notices of violation with proposed revocation, suspensions and denials of licenses, administrative penalties and orders,
enforcement conferences, referral to the Attorney General and District Attorney, repeated violation letters, detentions, letters of advisements, warning letters,
incident evaluations, collection letters and inspection warrants obtained and all other actions at law.
BL 2024 Definition
Complete data may not be available for the reporting period at the time the report is due; therefore, estimates may be included based on the data available.
BL 2024 Data Limitations
The data are obtained from the regulatory system application(s).
BL 2024 Data Source
The total number enforcement actions are counted. Included are notices of violation with proposed revocation, suspension and denial of licenses, administrative
penalties and orders, enforcement conferences, referrals to the Attorney General (AG) and District Attorney (DA) from Enforcement staff, repeated violation letters,
detentions, letters of advisements, warning letters, incident evaluations, collection letters, and inspection warrants obtained from Inspections staff.
BL 2024 Methodology
The information obtained through this measure ensures DSHS is in compliance with state laws and rules.
BL 2024 Purpose
DSHS Strategic Plan for 2023-2027, Part II B-44
Automated Budget and Evaluation System of Texas (ABEST)
88th Regular Session, Base Recon, Version 1
Strategy-Related Measures Definitions
Agency Code:
Goal No.
Number of Licenses Issued - Environmental HealthMeasure No.
Environmental Health
Provide Licensing and Regulatory Compliance
Consumer Protection Services
Measure Type
Strategy No.
Objective No.
State Health Services, Department ofAgency: 537
3
1
2
3
OP
Priority: M
Key Measure: N New Measure: N
Target Attainment: H Cross Reference: Agy 537 087-R-S52-1 03-01-02 OP 03Calculation Method: C
Percentage Measure: N
This measure includes the number of licenses, permits, registrations, certifications, and accreditations issued. For purposes of this output measure, "license"
includes new and renewal licenses, permits, registrations, certifications, accreditations issued or initially denied. The types of "licenses" are: youth camp, volatile
chemical, hazardous products, asbestos, and lead.
BL 2024 Definition
Complete data may not be available for the reporting period at the time the report is due; therefore, estimates may be included based on the data available.
BL 2024 Data Limitations
The data are obtained from the regulatory system application(s).
BL 2024 Data Source
The total number of new and renewal licenses, permits, registrations, certifications and accreditations issued by the environmental regulatory licensing groups to youth
camps, and abusable volatile chemical manufacturers and distributors, hazardous products manufacturers and distributors, asbestos, lead abatement companies and
related licensees.
BL 2024 Methodology
This measure is important because it provides an inventory of the total number of licenses that we have in the state. It implies that we have knowledge of the
businesses that are operating youth camps, abusable volatile chemical manufacturers and distributors, and lead abatement in the state. The data is indicative of the
number of businesses that are in compliance with state laws and rules. It also indicates the number of employees that are needed to regulate these businesses.
BL 2024 Purpose
DSHS Strategic Plan for 2023-2027, Part II B-45
Automated Budget and Evaluation System of Texas (ABEST)
88th Regular Session, Base Recon, Version 1
Strategy-Related Measures Definitions
Agency Code:
Goal No.
Average Cost Per Surveillance Activity - Radiation ControlMeasure No.
Radiation Control
Provide Licensing and Regulatory Compliance
Consumer Protection Services
Measure Type
Strategy No.
Objective No.
State Health Services, Department ofAgency: 537
3
1
3
1
EF
Priority: H
Key Measure: Y New Measure: N
Target Attainment: L Cross Reference: Agy 537 087-R-S52-1 03-01-03 EF 01Calculation Method: N
Percentage Measure: N
The average cost per surveillance activity is defined as the average of all costs for the inspection and investigation programs relative to radiation control.
BL 2024 Definition
Complete data may not be available for the reporting period at the time the report is due; therefore, estimates may be included based on the data available.
BL 2024 Data Limitations
The number of surveillance activities is obtained from the data are obtained from the regulatory system application(s). The expenditures data is obtained from the DSHS
accounting system.
BL 2024 Data Source
The year-to-date cost is calculated for the radioactive materials, x-ray, lasers, industrial radiography, and mammography programs. These costs are divided by the
program area’s year to date number of surveillance activities conducted
BL 2024 Methodology
Measures the average cost per surveillance activity for radiation control.
BL 2024 Purpose
DSHS Strategic Plan for 2023-2027, Part II B-46
Automated Budget and Evaluation System of Texas (ABEST)
88th Regular Session, Base Recon, Version 1
Strategy-Related Measures Definitions
Agency Code:
Goal No.
Number of Surveillance Activities Conducted - Radiation ControlMeasure No.
Radiation Control
Provide Licensing and Regulatory Compliance
Consumer Protection Services
Measure Type
Strategy No.
Objective No.
State Health Services, Department ofAgency: 537
3
1
3
1
OP
Priority: H
Key Measure: N New Measure: N
Target Attainment: H Cross Reference: Agy 537 087-R-S52-1 03-01-03 OP 01Calculation Method: C
Percentage Measure: N
The number of surveillance activities, inspections and investigations performed by staff documented by an appropriate report . Includes routine, special,
complaint, and compliance inspections.
BL 2024 Definition
Complete data may not be available for the reporting period at the time the report is due; therefore, estimates may be included based on the data available.
BL 2024 Data Limitations
The data are obtained from the regulatory system application(s). The programs collect routine, special complaint, and compliance inspections and investigation data,
including data and recall effectiveness data
BL 2024 Data Source
The total number of inspections and investigations where there is a documented report are counted. Included are routine, special, complaint, and compliance
inspections, and collection of samples.
BL 2024 Methodology
It illustrates the level of workload borne by each inspector as an average which aides in justifying staff resources . This data are necessary to calculate the cost of
inspections. Without knowing how many activities are performed under this measure it would be impossible to determine the average cost of inspections /activities.
BL 2024 Purpose
DSHS Strategic Plan for 2023-2027, Part II B-47
Automated Budget and Evaluation System of Texas (ABEST)
88th Regular Session, Base Recon, Version 1
Strategy-Related Measures Definitions
Agency Code:
Goal No.
Number of Enforcement Actions Initiated - Radiation ControlMeasure No.
Radiation Control
Provide Licensing and Regulatory Compliance
Consumer Protection Services
Measure Type
Strategy No.
Objective No.
State Health Services, Department ofAgency: 537
3
1
3
2
OP
Priority: H
Key Measure: N New Measure: N
Target Attainment: H Cross Reference: Agy 537 087-R-S52-1 03-01-03 OP 02Calculation Method: C
Percentage Measure: N
The number of enforcement actions initiated is defined as the total number of enforcement related activities initiated. Enforcement actions include a radioactive
material license, x-ray or laser registration, industrial radiography certification, general license acknowledgment, mammography certification, or identification card
revocation, enforcement conference, proposal of administrative penalties, administrative hearings, forwarding a case to the Attorney General or other appropriate
authority for civil or criminal penalties or seeking an injunction for appropriate reason, and any other actions in courts of law.
BL 2024 Definition
Complete data may not be available for the reporting period at the time the report is due; therefore, estimates may be included based on the data available.
BL 2024 Data Limitations
The data are obtained from the regulatory system application(s).
BL 2024 Data Source
This measure counts the total number enforcement actions. Included are preliminary reports of administrative penalties, revocation, suspension and denial of licenses,
orders, enforcement conferences, and referrals to the Attorney General (AG) and District Attorney (DA) from Enforcement staff; and detentions, incident evaluations
and warnings (notices of violations) from Policy, Standards, Quality Assurance (PSQA) and Inspection staff.
BL 2024 Methodology
Measures the number of enforcement actions initiated.
BL 2024 Purpose
DSHS Strategic Plan for 2023-2027, Part II B-48
Automated Budget and Evaluation System of Texas (ABEST)
88th Regular Session, Base Recon, Version 1
Strategy-Related Measures Definitions
Agency Code:
Goal No.
Number of Licenses/Registrations Issued - Radiation ControlMeasure No.
Radiation Control
Provide Licensing and Regulatory Compliance
Consumer Protection Services
Measure Type
Strategy No.
Objective No.
State Health Services, Department ofAgency: 537
3
1
3
3
OP
Priority: M
Key Measure: N New Measure: N
Target Attainment: H Cross Reference: Agy 537 087-R-S52-1 03-01-03 OP 03Calculation Method: C
Percentage Measure: N
This is the measure of the total number of actions issued on radioactive material licenses, x-ray or laser registrations, industrial radiography certifications, general
license acknowledgments, and mammography certifications and mammography accreditations (includes new permits, amendments, renewals, and terminations).
BL 2024 Definition
Complete data may not be available for the reporting period at the time the report is due; therefore, estimates may be included based on the data available.
BL 2024 Data Limitations
The data are obtained from the regulatory system application(s).
BL 2024 Data Source
The number of licenses and registrations issued is totaled quarterly and is cumulative for the fiscal year. The total number of new, renewal, amendment, and termination
actions issued on radioactive material licenses, x-ray or laser registrations, industrial radiography certifications, general license acknowledgments, and mammography
certifications and accreditations.
BL 2024 Methodology
Measures the number of licenses/registrations issues.
BL 2024 Purpose
DSHS Strategic Plan for 2023-2027, Part II B-49
Schedule C: Historically Underutilized Business Plan
The Historically Underutilized Businesses Plan, found on the following pages, was developed by the HHSC Division of Procurement & Contracting Services, in compliance with Texas Government Code Section 2161.123.
DSHS Strategic Plan for 2023-2027, Part II C-1
Health and Human Services System Strategic
Plans 2023–2027 Schedule C:
Historically Underutilized Businesses Plan
As Required by
Tex. Gov’t Code Sec. 2161.123
Health and Human Services Commission
Department of State Health Services
May 2022
DSHS Strategic Plan for 2023-2027, Part II C-2

This page intentionally left blank.
DSHS Strategic Plan for 2023-2027, Part II C-3
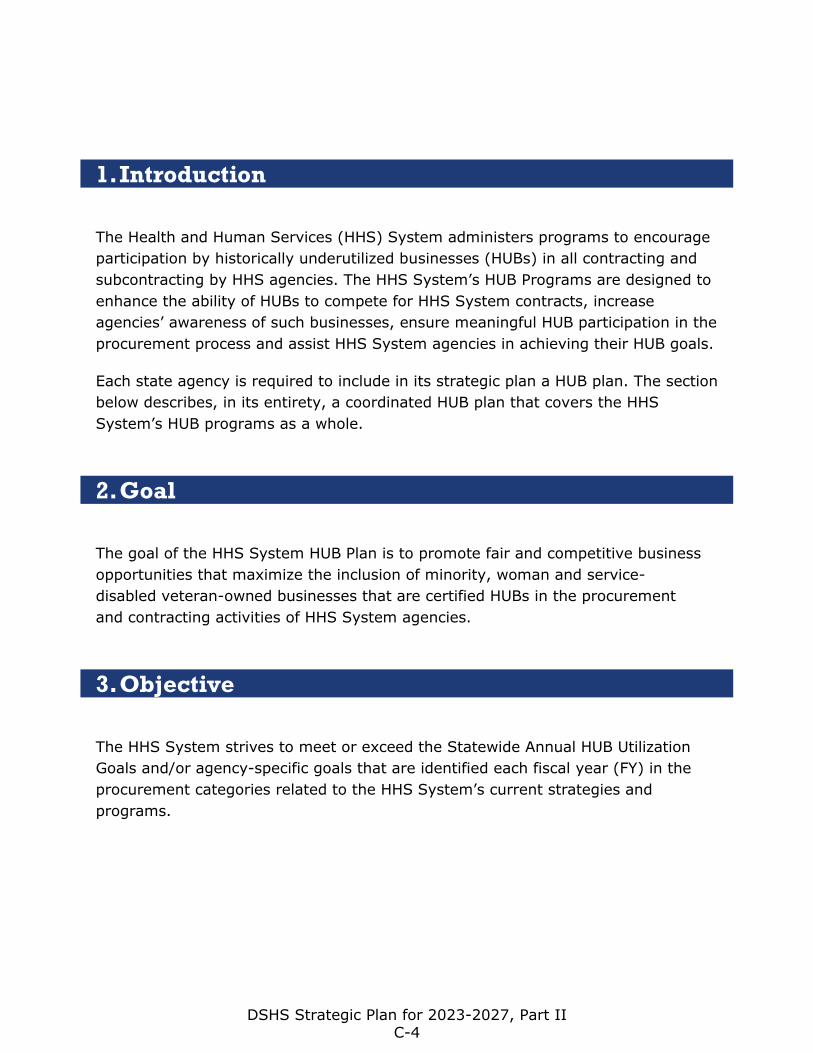
1. Introduction
The Health and Human Services (HHS) System administers programs to encourage participation by historically underutilized businesses (HUBs) in all contracting and subcontracting by HHS agencies. The HHS System’s HUB Programs are designed to enhance the ability of HUBs to compete for HHS System contracts, increase agencies’ awareness of such businesses, ensure meaningful HUB participation in the procurement process and assist HHS System agencies in achieving their HUB goals.
Each state agency is required to include in its strategic plan a HUB plan. The section below describes, in its entirety, a coordinated HUB plan that covers the HHS System’s HUB programs as a whole.
2. Goal
The goal of the HHS System HUB Plan is to promote fair and competitive business opportunities that maximize the inclusion of minority, woman and service-disabled veteran-owned businesses that are certified HUBs in the procurement and contracting activities of HHS System agencies.
3. Objective
The HHS System strives to meet or exceed the Statewide Annual HUB Utilization Goals and/or agency-specific goals that are identified each fiscal year (FY) in the procurement categories related to the HHS System’s current strategies and programs.
DSHS Strategic Plan for 2023-2027, Part II C-4
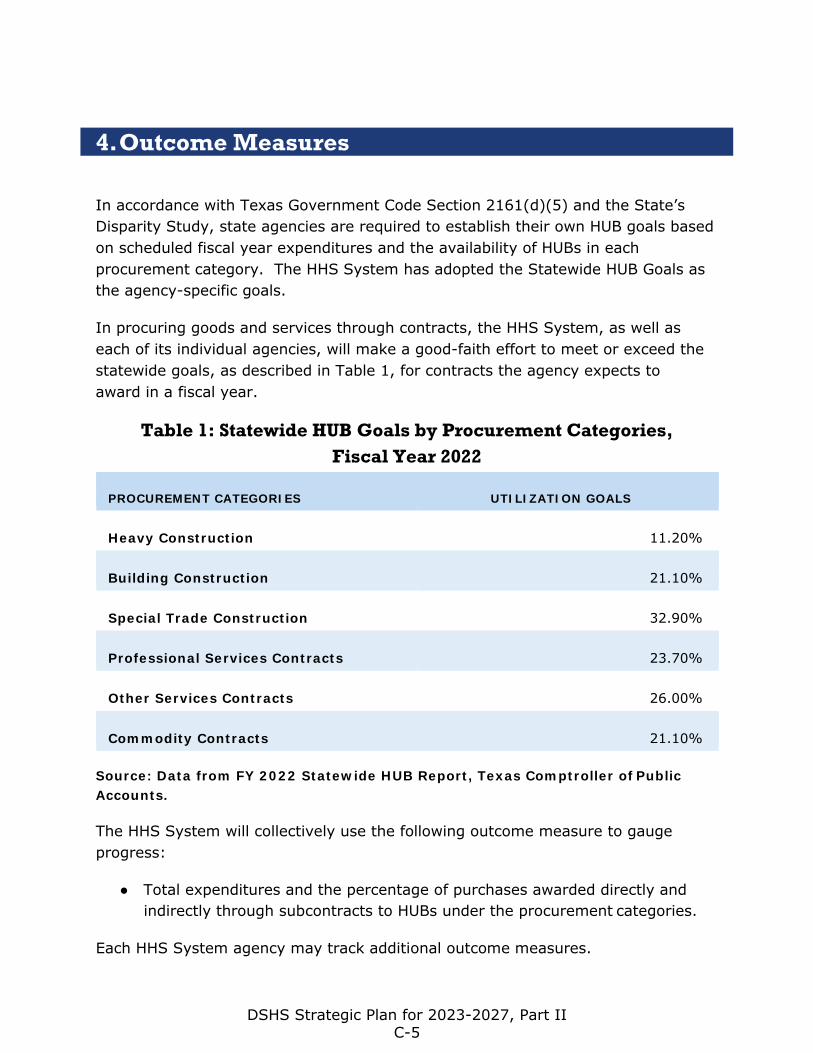
4. Outcome Measures
In accordance with Texas Government Code Section 2161(d)(5) and the State’s Disparity Study, state agencies are required to establish their own HUB goals based on scheduled fiscal year expenditures and the availability of HUBs in each procurement category. The HHS System has adopted the Statewide HUB Goals as the agency-specific goals.
In procuring goods and services through contracts, the HHS System, as well as each of its individual agencies, will make a good-faith effort to meet or exceed the statewide goals, as described in Table 1, for contracts the agency expects to award in a fiscal year.
Table 1: Statewide HUB Goals by Procurement Categories, Fiscal Year 2022
PROCUREMENT CATEGORIES UTILIZATION GOALS
Heavy Construction 11.20%
Building Construction 21.10%
Special Trade Construction 32.90%
Professional Services Contracts 23.70%
Other Services Contracts 26.00%
Commodity Contracts 21.10%
Source: Data from FY 2022 Statewide HUB Report, Texas Comptroller of Public Accounts.
The HHS System will collectively use the following outcome measure to gauge progress:
● Total expenditures and the percentage of purchases awarded directly andindirectly through subcontracts to HUBs under the procurement categories.
Each HHS System agency may track additional outcome measures.
DSHS Strategic Plan for 2023-2027, Part II C-5
5. HHS System Strategies
The HHS System maintains and implements policies and procedures, in accordance with the HUB statute and rules, to guide the agencies in increasing the use of HUBs by contracting directly and/or indirectly through subcontracting.
The HHS System employ several additional strategies, such as:
● Implementing policies to ensure good faith effort requirements areperformed and maintained from the development of the solicitation throughthe duration of the contract
● Utilizing the Centralized Master Bidders List and HUB Directory to solicitbids from HUBs
● Maintaining a HUB Program Office of HUB Coordinators at HHSCheadquarters for effective coordination for all HHS agencies
● Developing and implementing reporting practices to provide updates to theExecutive Commissioner, Chief Operating Officer, Deputy ExecutiveCommissioners and Associate Commissioners on HHS HUB Programactivities, related initiatives, and projects
● Developing target-marketing strategies inclusive of web-based training toprovide guidance on HHS System procurements
● Maintaining an active upcoming Procurement Forecast schedule on websiteto provide notices of opportunities prior to posting to encourage HUBparticipation
● Increasing awareness of the HUB Program across the HHS System byproviding information to all new employees and how they may assist in theefforts to increase HUB utilization
● Enhancing outreach efforts internally and externally by promoting access,awareness, and accountability through education and training
● Increasing HUB participation in Spot Bid purchases by mandating theagency solicit a HUB for purchases starting at $5,000 to $10,000
6. Output Measures
The HHS System will collectively use and individually track the following output measures to gauge progress:
DSHS Strategic Plan for 2023-2027, Part II C-6
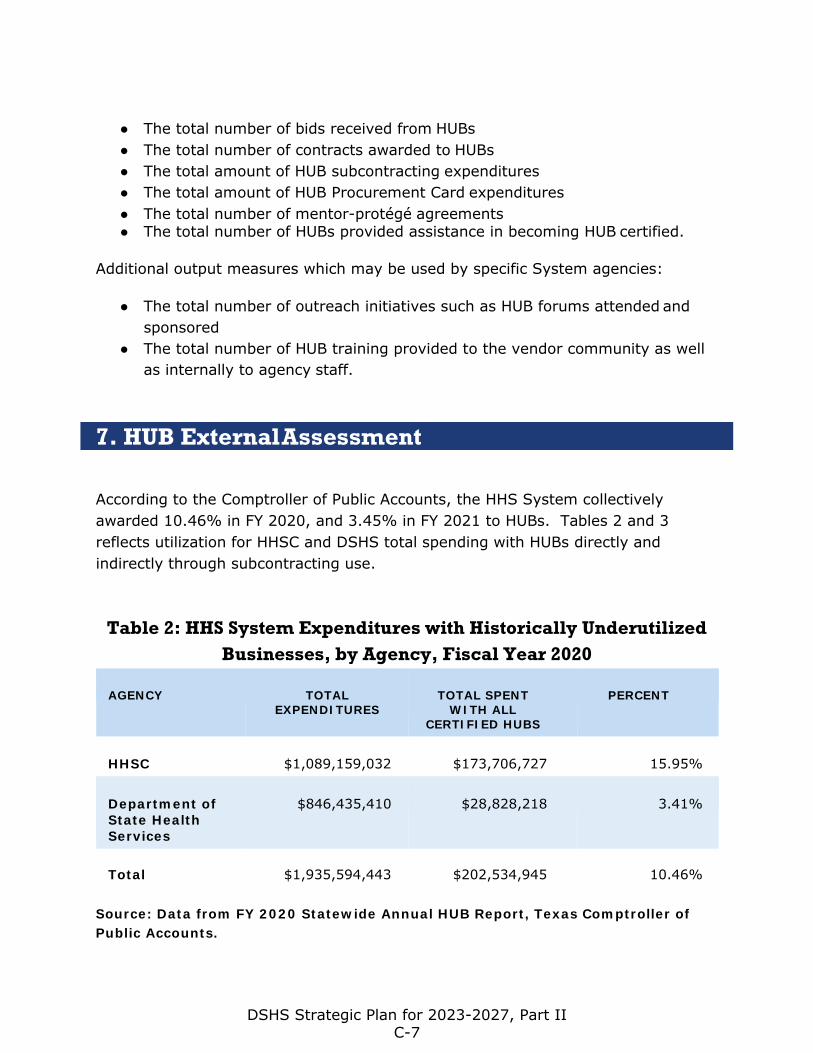
● The total number of bids received from HUBs● The total number of contracts awarded to HUBs● The total amount of HUB subcontracting expenditures● The total amount of HUB Procurement Card expenditures● The total number of mentor-protégé agreements● The total number of HUBs provided assistance in becoming HUB certified.
Additional output measures which may be used by specific System agencies:
● The total number of outreach initiatives such as HUB forums attended andsponsored
● The total number of HUB training provided to the vendor community as wellas internally to agency staff.
7. HUB External Assessment
According to the Comptroller of Public Accounts, the HHS System collectively awarded 10.46% in FY 2020, and 3.45% in FY 2021 to HUBs. Tables 2 and 3 reflects utilization for HHSC and DSHS total spending with HUBs directly and indirectly through subcontracting use.
Table 2: HHS System Expenditures with Historically Underutilized Businesses, by Agency, Fiscal Year 2020
AGENCY TOTAL EXPENDITURES
TOTAL SPENT WITH ALL
CERTIFIED HUBS
PERCENT
HHSC $1,089,159,032 $173,706,727 15.95%
Department of State Health Services
$846,435,410 $28,828,218 3.41%
Total $1,935,594,443 $202,534,945 10.46%
Source: Data from FY 2020 Statewide Annual HUB Report, Texas Comptroller of Public Accounts.
DSHS Strategic Plan for 2023-2027, Part II C-7
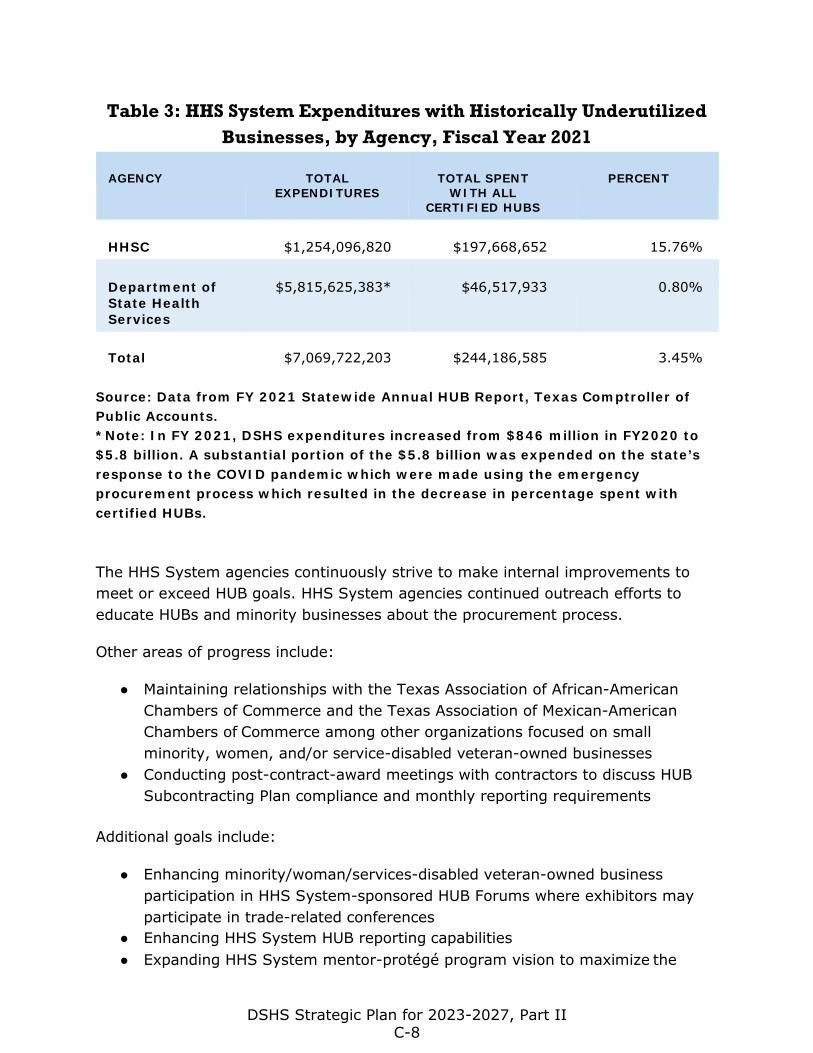
Table 3: HHS System Expenditures with Historically Underutilized Businesses, by Agency, Fiscal Year 2021
AGENCY TOTAL EXPENDITURES
TOTAL SPENT WITH ALL
CERTIFIED HUBS
PERCENT
HHSC $1,254,096,820 $197,668,652 15.76%
Department of State Health Services
$5,815,625,383* $46,517,933 0.80%
Total $7,069,722,203 $244,186,585 3.45%
Source: Data from FY 2021 Statewide Annual HUB Report, Texas Comptroller of Public Accounts. *Note: In FY 2021, DSHS expenditures increased from $846 million in FY2020 to$5.8 billion. A substantial portion of the $5.8 billion was expended on the state’sresponse to the COVID pandemic which were made using the emergencyprocurement process which resulted in the decrease in percentage spent withcertified HUBs.
The HHS System agencies continuously strive to make internal improvements to meet or exceed HUB goals. HHS System agencies continued outreach efforts to educate HUBs and minority businesses about the procurement process.
Other areas of progress include:
● Maintaining relationships with the Texas Association of African-AmericanChambers of Commerce and the Texas Association of Mexican-AmericanChambers of Commerce among other organizations focused on smallminority, women, and/or service-disabled veteran-owned businesses
● Conducting post-contract-award meetings with contractors to discuss HUBSubcontracting Plan compliance and monthly reporting requirements
Additional goals include:
● Enhancing minority/woman/services-disabled veteran-owned businessparticipation in HHS System-sponsored HUB Forums where exhibitors mayparticipate in trade-related conferences
● Enhancing HHS System HUB reporting capabilities● Expanding HHS System mentor-protégé program vision to maximize the
DSHS Strategic Plan for 2023-2027, Part II C-8
state’s resources through cooperation and assistance from other public entities and corporate businesses
● Promoting and increasing awareness of HHS System procurementopportunities for direct and indirect capacity.
DSHS Strategic Plan for 2023-2027, Part II C-9
Schedule D: Statewide Capital Plan
The statewide capital plan for the Department of State Health Services will be submitted once approved.
DSHS Strategic Plan for 2023-2027, Part II D-1
Schedule E: Health and Human Services
Strategic Plan
The Health and Human Services Strategic Plan, developed by the Health and Human Services Commission and the Department of State Health Services in accordance with Texas Government Code Chapter 531, will be submitted to the Strategic Plan Distribution List entities October 2022. The Plan will be available on the Health and Human Services Commission website.
DSHS Strategic Plan for 2023-2027, Part II E-1
Schedule F: Agency Workforce Plan
The Health and Human Services System Workforce Plan, found on the following pages, was developed by the HHSC Division of System Support Services, Department of Human Resources, in compliance with Texas Government Code Section 2056.0021.
DSHS Strategic Plan for 2023-2027, Part II F-1
Strategic Staffing Analysis and Workforce
Plan
For the Planning Period 2023-2027
As Required by
Texas Government Code
Section 2056.0021
Health and Human Services System
May 2022
DSHS Strategic Plan for 2023-2027, Part II F-2
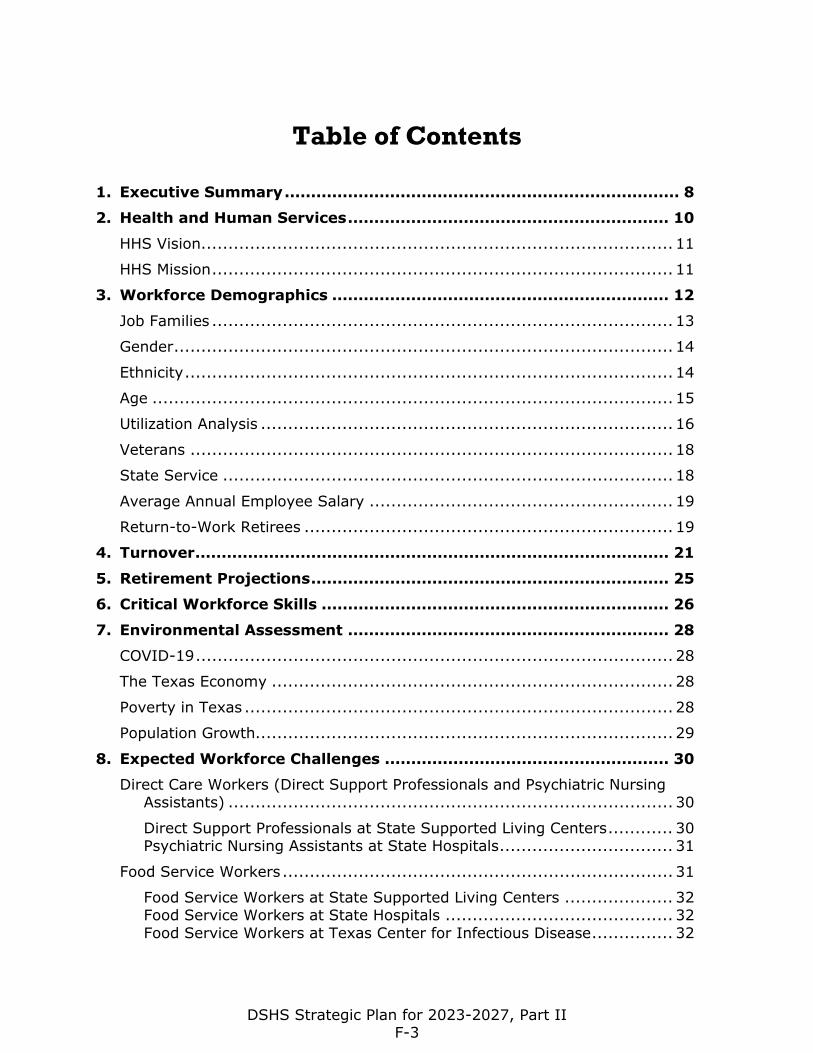
Table of Contents
1. Executive Summary ........................................................................... 8
2. Health and Human Services ............................................................. 10
HHS Vision ....................................................................................... 11
HHS Mission ..................................................................................... 11
3. Workforce Demographics ................................................................ 12
Job Families ..................................................................................... 13
Gender ............................................................................................ 14
Ethnicity .......................................................................................... 14
Age ................................................................................................ 15
Utilization Analysis ............................................................................ 16
Veterans ......................................................................................... 18
State Service ................................................................................... 18
Average Annual Employee Salary ........................................................ 19
Return-to-Work Retirees .................................................................... 19
4. Turnover .......................................................................................... 21
5. Retirement Projections .................................................................... 25
6. Critical Workforce Skills .................................................................. 26
7. Environmental Assessment ............................................................. 28
COVID-19 ........................................................................................ 28
The Texas Economy .......................................................................... 28
Poverty in Texas ............................................................................... 28
Population Growth............................................................................. 29
8. Expected Workforce Challenges ...................................................... 30
Direct Care Workers (Direct Support Professionals and Psychiatric Nursing Assistants) .................................................................................. 30
Direct Support Professionals at State Supported Living Centers ............ 30 Psychiatric Nursing Assistants at State Hospitals ................................ 31
Food Service Workers ........................................................................ 31
Food Service Workers at State Supported Living Centers .................... 32 Food Service Workers at State Hospitals .......................................... 32 Food Service Workers at Texas Center for Infectious Disease ............... 32
DSHS Strategic Plan for 2023-2027, Part II F-3
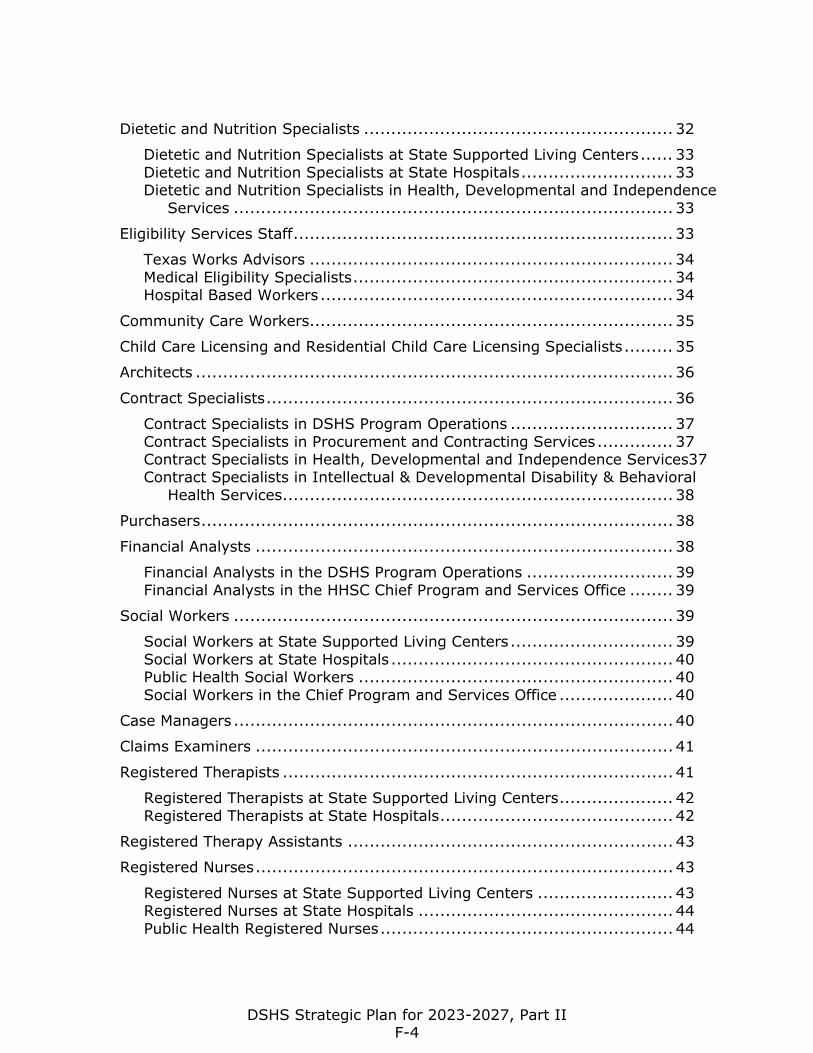
Dietetic and Nutrition Specialists ......................................................... 32
Dietetic and Nutrition Specialists at State Supported Living Centers ...... 33 Dietetic and Nutrition Specialists at State Hospitals ............................ 33 Dietetic and Nutrition Specialists in Health, Developmental and Independence
Services ................................................................................. 33
Eligibility Services Staff ...................................................................... 33
Texas Works Advisors ................................................................... 34 Medical Eligibility Specialists ........................................................... 34 Hospital Based Workers ................................................................. 34
Community Care Workers................................................................... 35
Child Care Licensing and Residential Child Care Licensing Specialists ......... 35
Architects ........................................................................................ 36
Contract Specialists ........................................................................... 36
Contract Specialists in DSHS Program Operations .............................. 37 Contract Specialists in Procurement and Contracting Services .............. 37 Contract Specialists in Health, Developmental and Independence Services37 Contract Specialists in Intellectual & Developmental Disability & Behavioral
Health Services ........................................................................ 38
Purchasers ....................................................................................... 38
Financial Analysts ............................................................................. 38
Financial Analysts in the DSHS Program Operations ........................... 39 Financial Analysts in the HHSC Chief Program and Services Office ........ 39
Social Workers ................................................................................. 39
Social Workers at State Supported Living Centers .............................. 39 Social Workers at State Hospitals .................................................... 40 Public Health Social Workers .......................................................... 40 Social Workers in the Chief Program and Services Office ..................... 40
Case Managers ................................................................................. 40
Claims Examiners ............................................................................. 41
Registered Therapists ........................................................................ 41
Registered Therapists at State Supported Living Centers ..................... 42 Registered Therapists at State Hospitals ........................................... 42
Registered Therapy Assistants ............................................................ 43
Registered Nurses ............................................................................. 43
Registered Nurses at State Supported Living Centers ......................... 43 Registered Nurses at State Hospitals ............................................... 44 Public Health Registered Nurses ...................................................... 44
DSHS Strategic Plan for 2023-2027, Part II F-4
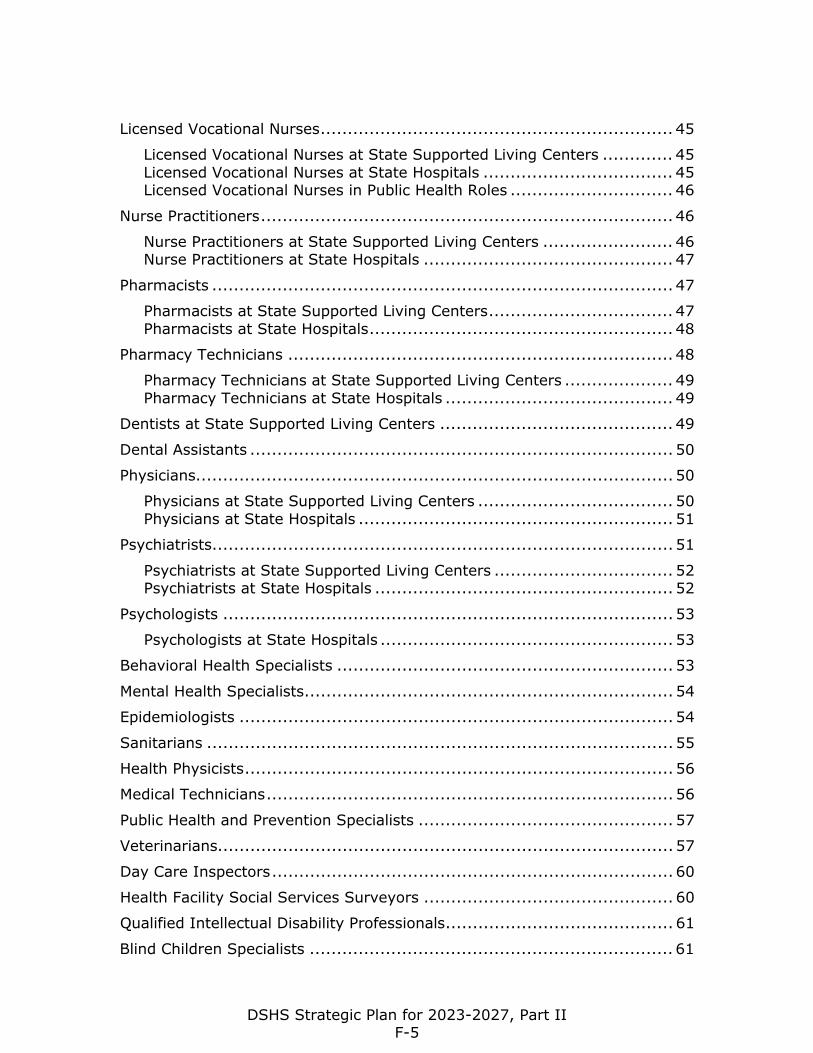
Licensed Vocational Nurses ................................................................. 45
Licensed Vocational Nurses at State Supported Living Centers ............. 45 Licensed Vocational Nurses at State Hospitals ................................... 45 Licensed Vocational Nurses in Public Health Roles .............................. 46
Nurse Practitioners ............................................................................ 46
Nurse Practitioners at State Supported Living Centers ........................ 46 Nurse Practitioners at State Hospitals .............................................. 47
Pharmacists ..................................................................................... 47
Pharmacists at State Supported Living Centers .................................. 47 Pharmacists at State Hospitals ........................................................ 48
Pharmacy Technicians ....................................................................... 48
Pharmacy Technicians at State Supported Living Centers .................... 49 Pharmacy Technicians at State Hospitals .......................................... 49
Dentists at State Supported Living Centers ........................................... 49
Dental Assistants .............................................................................. 50
Physicians........................................................................................ 50
Physicians at State Supported Living Centers .................................... 50 Physicians at State Hospitals .......................................................... 51
Psychiatrists ..................................................................................... 51
Psychiatrists at State Supported Living Centers ................................. 52 Psychiatrists at State Hospitals ....................................................... 52
Psychologists ................................................................................... 53
Psychologists at State Hospitals ...................................................... 53
Behavioral Health Specialists .............................................................. 53
Mental Health Specialists .................................................................... 54
Epidemiologists ................................................................................ 54
Sanitarians ...................................................................................... 55
Health Physicists ............................................................................... 56
Medical Technicians ........................................................................... 56
Public Health and Prevention Specialists ............................................... 57
Veterinarians.................................................................................... 57
Day Care Inspectors .......................................................................... 60
Health Facility Social Services Surveyors .............................................. 60
Qualified Intellectual Disability Professionals .......................................... 61
Blind Children Specialists ................................................................... 61
DSHS Strategic Plan for 2023-2027, Part II F-5
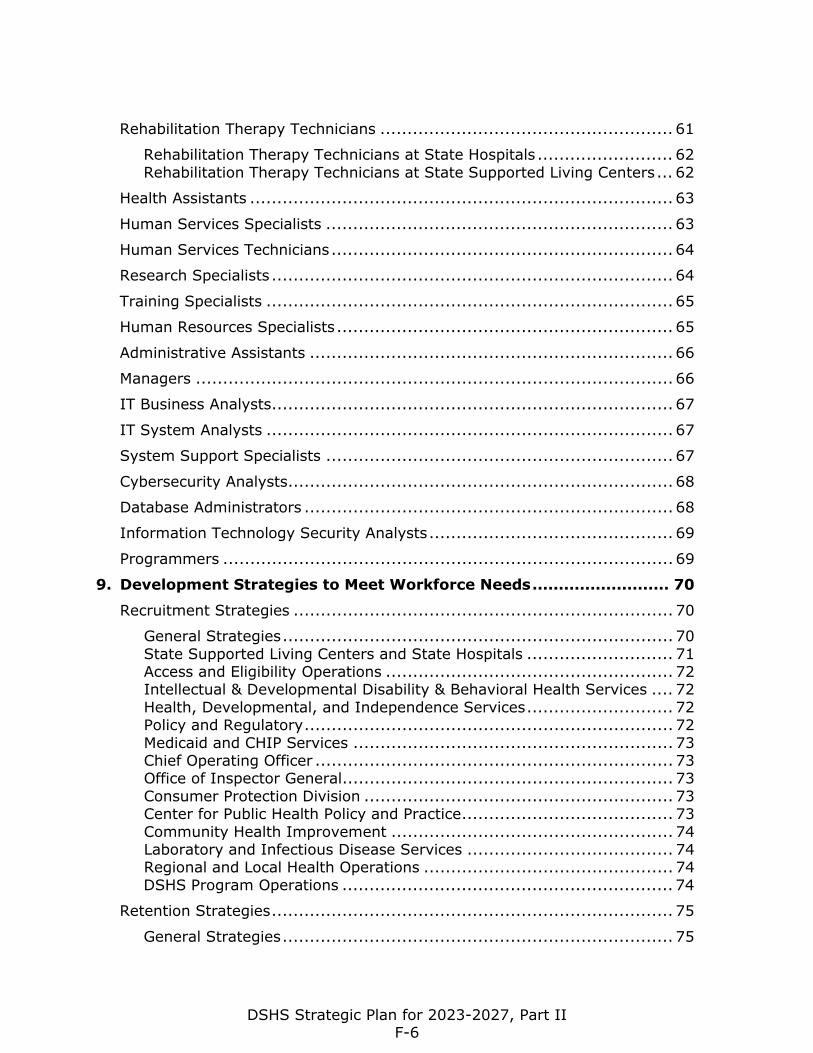
Rehabilitation Therapy Technicians ...................................................... 61
Rehabilitation Therapy Technicians at State Hospitals ......................... 62 Rehabilitation Therapy Technicians at State Supported Living Centers ... 62
Health Assistants .............................................................................. 63
Human Services Specialists ................................................................ 63
Human Services Technicians ............................................................... 64
Research Specialists .......................................................................... 64
Training Specialists ........................................................................... 65
Human Resources Specialists .............................................................. 65
Administrative Assistants ................................................................... 66
Managers ........................................................................................ 66
IT Business Analysts .......................................................................... 67
IT System Analysts ........................................................................... 67
System Support Specialists ................................................................ 67
Cybersecurity Analysts ....................................................................... 68
Database Administrators .................................................................... 68
Information Technology Security Analysts ............................................. 69
Programmers ................................................................................... 69
9. Development Strategies to Meet Workforce Needs .......................... 70
Recruitment Strategies ...................................................................... 70
General Strategies ........................................................................ 70 State Supported Living Centers and State Hospitals ........................... 71 Access and Eligibility Operations ..................................................... 72 Intellectual & Developmental Disability & Behavioral Health Services .... 72 Health, Developmental, and Independence Services ........................... 72 Policy and Regulatory .................................................................... 72 Medicaid and CHIP Services ........................................................... 73 Chief Operating Officer .................................................................. 73 Office of Inspector General ............................................................. 73 Consumer Protection Division ......................................................... 73 Center for Public Health Policy and Practice ....................................... 73 Community Health Improvement .................................................... 74 Laboratory and Infectious Disease Services ...................................... 74 Regional and Local Health Operations .............................................. 74 DSHS Program Operations ............................................................. 74
Retention Strategies .......................................................................... 75
General Strategies ........................................................................ 75
DSHS Strategic Plan for 2023-2027, Part II F-6
State Supported Living Centers and State Hospitals ........................... 76 Access and Eligibility Operations ..................................................... 77 Intellectual & Developmental Disability & Behavioral Health Services .... 77 Health, Developmental, and Independence Services ........................... 77 Policy and Regulatory .................................................................... 77 Medicaid and CHIP Services ........................................................... 78 Chief Operating Officer .................................................................. 78 Office of Inspector General ............................................................. 78 Consumer Protection Division ......................................................... 79 Laboratory and Infectious Disease Services ...................................... 79 Regional and Local Health Operations .............................................. 79 DSHS Program Operations ............................................................. 79
References ........................................................................................... 80
Prepared by: System Support Services Human Resources
DSHS Strategic Plan for 2023-2027, Part II F-7
1. Executive Summary
The Health and Human Services (HHS) System Strategic Staffing Analysis and Workforce Plan is an integral part of HHS’ staffing plan. Workforce planning is a business necessity due to many factors, including:
● constraints on funding;● increasing demand for HHS services;● increasing number of current employees reaching retirement age resulting in
fewer, less experienced workers available as replacements; and● increasing competition for highly skilled employees.
HHS agencies are proactively addressing this challenge by preparing for the future and reducing risks. Designed for flexibility, the HHS System Strategic Staffing Analysis and Workforce Plan allows HHS executive management to make staffing adjustments according to the changing needs of HHS agencies.
State leaders in Texas recognize the importance of workforce planning. As part of their strategic plans, state agencies are required under the Texas Government Code, Section 2056.0021, to develop a workforce plan in accordance with the guidelines developed by the State Auditor’s Office (SAO). To meet these requirements, this HHS Workforce Plan – a Schedule attachment to the HHS System Strategic Plan for the Fiscal Years 2023–2027 - analyzes the following key elements for the entire HHS System:
● Current Workforce Demographics – Describes how many employees workfor the HHS agencies, where they work, what they are paid, how many ofthem are return-to-work retirees, how many have left HHS, how many mayretire, and whether minority groups are underutilized when compared to thestate Civilian Labor Force (CLF) for Equal Employment Opportunity (EEO) jobcategories. The workforce is examined by gender, race, age and length ofstate service.
● Expected Workforce Challenges – Describes anticipated staffing needsbased on population trends, projected job growth and other demographictrends. A detailed examination of each identified shortage occupation wasconducted to identify and understand retention and recruitment problems.
● Strategies to Meet Workforce Needs – Describes recruitment andretention strategies that address expected workforce challenges for shortageoccupation jobs.
The following is the detailed HHS System Strategic Staffing Analysis and Workforce Plan.
DSHS Strategic Plan for 2023-2027, Part II F-8

DSHS Strategic Plan for 2023-2027, Part II F-9
2. Health and Human Services
The Health and Human Services System, as reflected in Article II of the General Appropriations Act, consists of the two agencies described below:
● Health and Human Services Commission (HHSC). HHSC began services in1991. HHSC provides leadership to the HHS agencies, manages the day-to-day operations of state supported living centers and state hospitals, andadministers programs that deliver benefits and services, including: Medicaid for families and children. Long-term care for people who are older or who have disabilities. Supplemental Nutrition Assistance Program food benefits and Temporary
Assistance for Needy Families cash assistance. Behavioral health services. Services to help keep people who are older or who have disabilities in
their homes and communities. Services for women. Services for people with special health needs.
The agency also oversees regulatory functions including:
Licensing and credentialing long-term care facilities, such as nursing homes and assisted living.
Health care facilities regulation. Licensing child-care providers.
● Department of State Health Services (DSHS). DSHS includes programspreviously administered by the Texas Department of Health, the TexasCommission on Alcohol and Drug Abuse, and the Health Care InformationCouncil. The agency began services on September 1, 2004 and continues toadminister programs to promote and protect public health by creating bettersystems that include prevention, intervention and effective partnerships withcommunities across the state. The agency works to: Improve health outcomes through public and population health strategies,
including prevention and intervention. Optimize public health response to disasters, disease threats, and
outbreaks. Improve and optimize business functions and processes to support
delivery of public health services in communities. Enhance operational structures to support public health functions of the
state. Improve recognition and support for a highly skilled and dedicated
workforce. Foster effective partnership and collaboration to achieve public health
goals.
DSHS Strategic Plan for 2023-2027, Part II F-10
Promote the use of science and data to drive decision-making and best practices.
HHS Vision Making a positive difference in the lives of the people we serve.
HHS Mission Improving the health, safety and well-being of Texans with good stewardship of public resources.
DSHS Strategic Plan for 2023-2027, Part II F-11
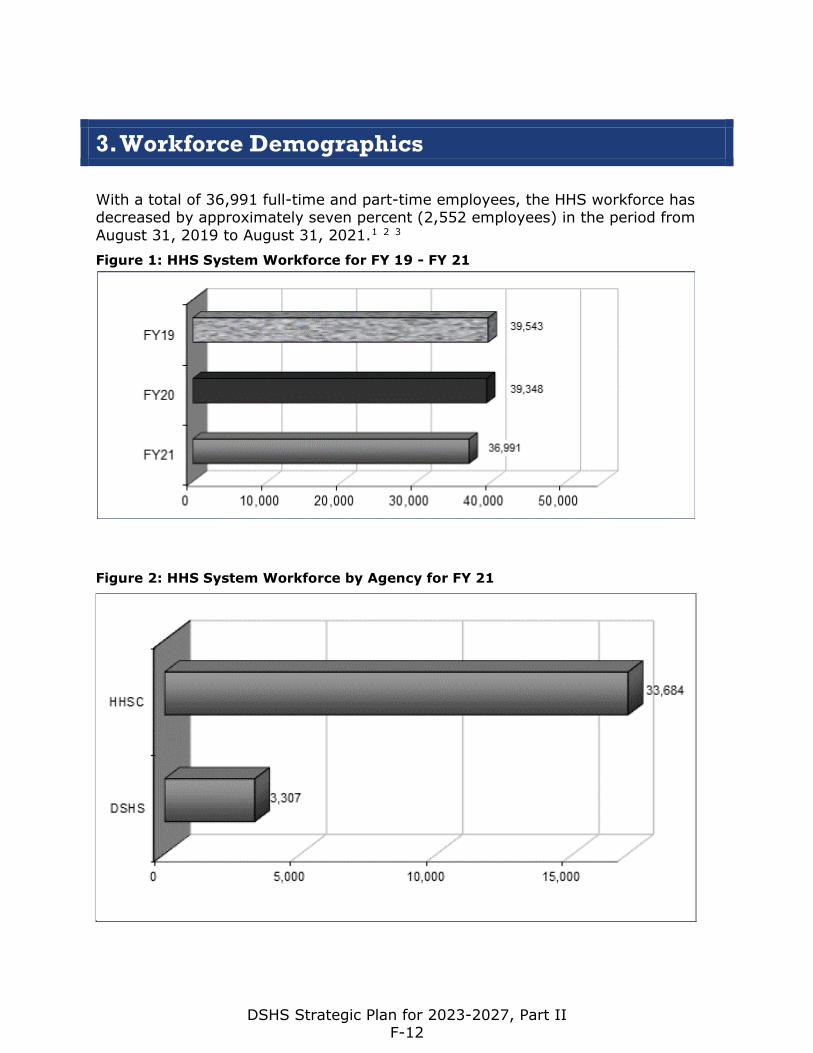
3. Workforce Demographics
With a total of 36,991 full-time and part-time employees, the HHS workforce has decreased by approximately seven percent (2,552 employees) in the period from August 31, 2019 to August 31, 2021.1 2 3 Figure 1: HHS System Workforce for FY 19 - FY 21
Figure 2: HHS System Workforce by Agency for FY 21
DSHS Strategic Plan for 2023-2027, Part II F-12
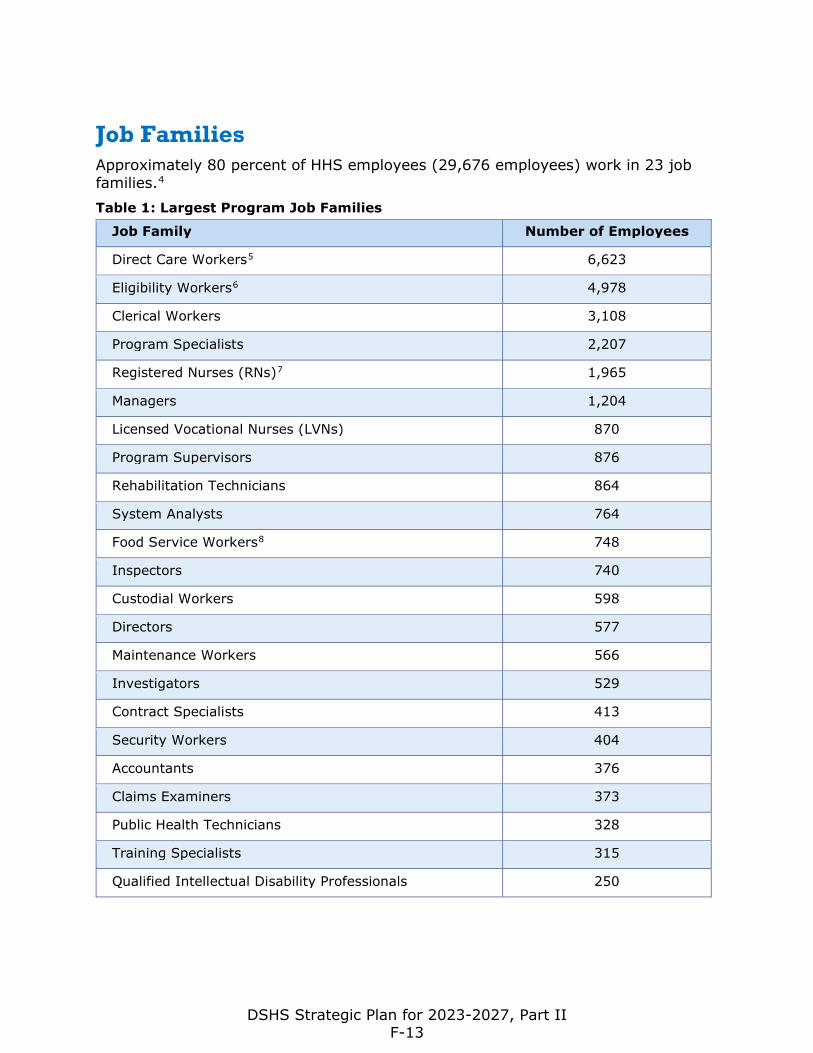
Job Families Approximately 80 percent of HHS employees (29,676 employees) work in 23 job families.4 Table 1: Largest Program Job Families
Job Family Number of Employees
Direct Care Workers5 6,623
Eligibility Workers6 4,978
Clerical Workers 3,108
Program Specialists 2,207
Registered Nurses (RNs)7 1,965
Managers 1,204
Licensed Vocational Nurses (LVNs) 870
Program Supervisors 876
Rehabilitation Technicians 864
System Analysts 764
Food Service Workers8 748
Inspectors 740
Custodial Workers 598
Directors 577
Maintenance Workers 566
Investigators 529
Contract Specialists 413
Security Workers 404
Accountants 376
Claims Examiners 373
Public Health Technicians 328
Training Specialists 315
Qualified Intellectual Disability Professionals 250
DSHS Strategic Plan for 2023-2027, Part II F-13
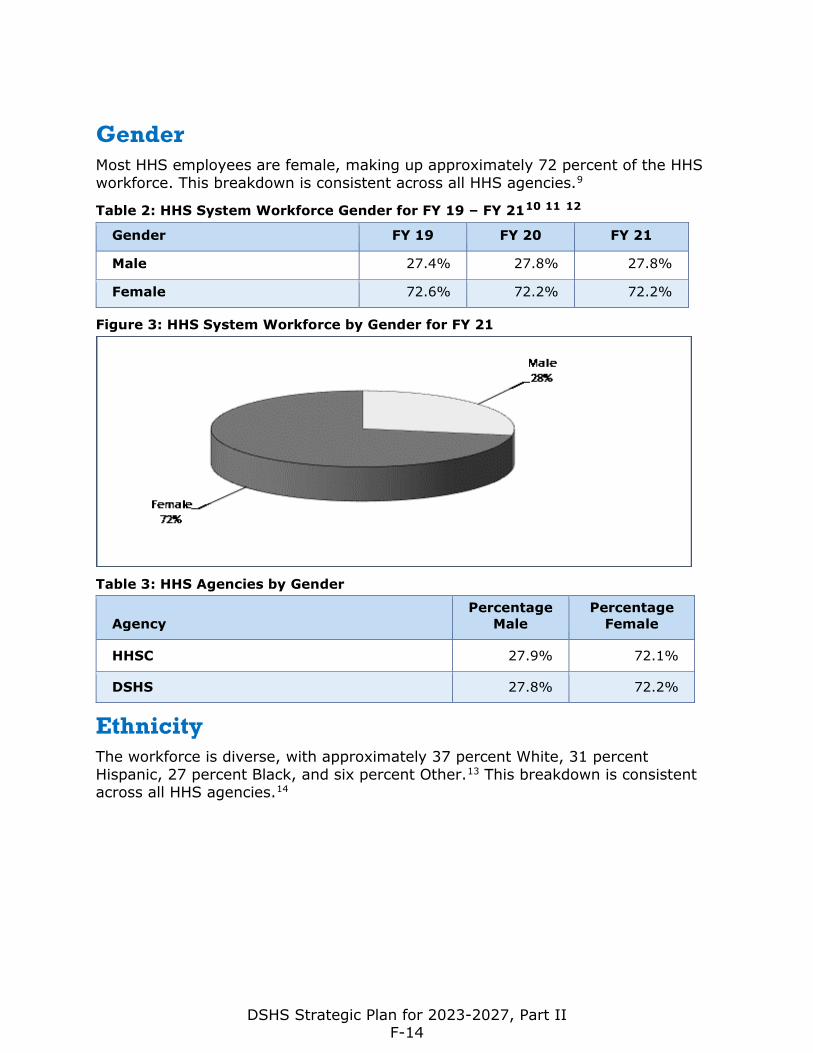
Gender Most HHS employees are female, making up approximately 72 percent of the HHS workforce. This breakdown is consistent across all HHS agencies.9
Table 2: HHS System Workforce Gender for FY 19 – FY 2110 11 12
Gender FY 19 FY 20 FY 21
Male 27.4% 27.8% 27.8%
Female 72.6% 72.2% 72.2%
Figure 3: HHS System Workforce by Gender for FY 21
Table 3: HHS Agencies by Gender
Agency Percentage
Male Percentage
Female
HHSC 27.9% 72.1%
DSHS 27.8% 72.2%
Ethnicity The workforce is diverse, with approximately 37 percent White, 31 percent Hispanic, 27 percent Black, and six percent Other.13 This breakdown is consistent across all HHS agencies.14
DSHS Strategic Plan for 2023-2027, Part II F-14
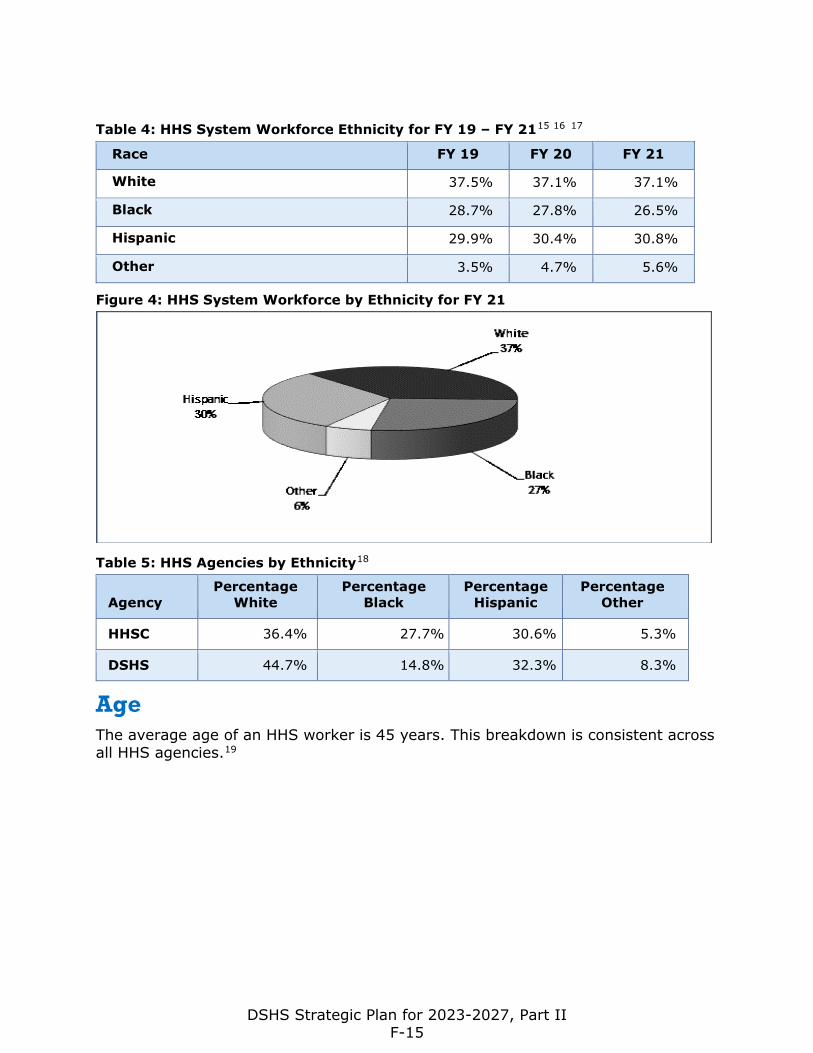
Table 4: HHS System Workforce Ethnicity for FY 19 – FY 2115 16 17
Race FY 19 FY 20 FY 21
White 37.5% 37.1% 37.1%
Black 28.7% 27.8% 26.5%
Hispanic 29.9% 30.4% 30.8%
Other 3.5% 4.7% 5.6%
Figure 4: HHS System Workforce by Ethnicity for FY 21
Table 5: HHS Agencies by Ethnicity18
Agency Percentage
White Percentage
Black Percentage
Hispanic Percentage
Other
HHSC 36.4% 27.7% 30.6% 5.3%
DSHS 44.7% 14.8% 32.3% 8.3%
Age The average age of an HHS worker is 45 years. This breakdown is consistent across all HHS agencies.19
DSHS Strategic Plan for 2023-2027, Part II F-15
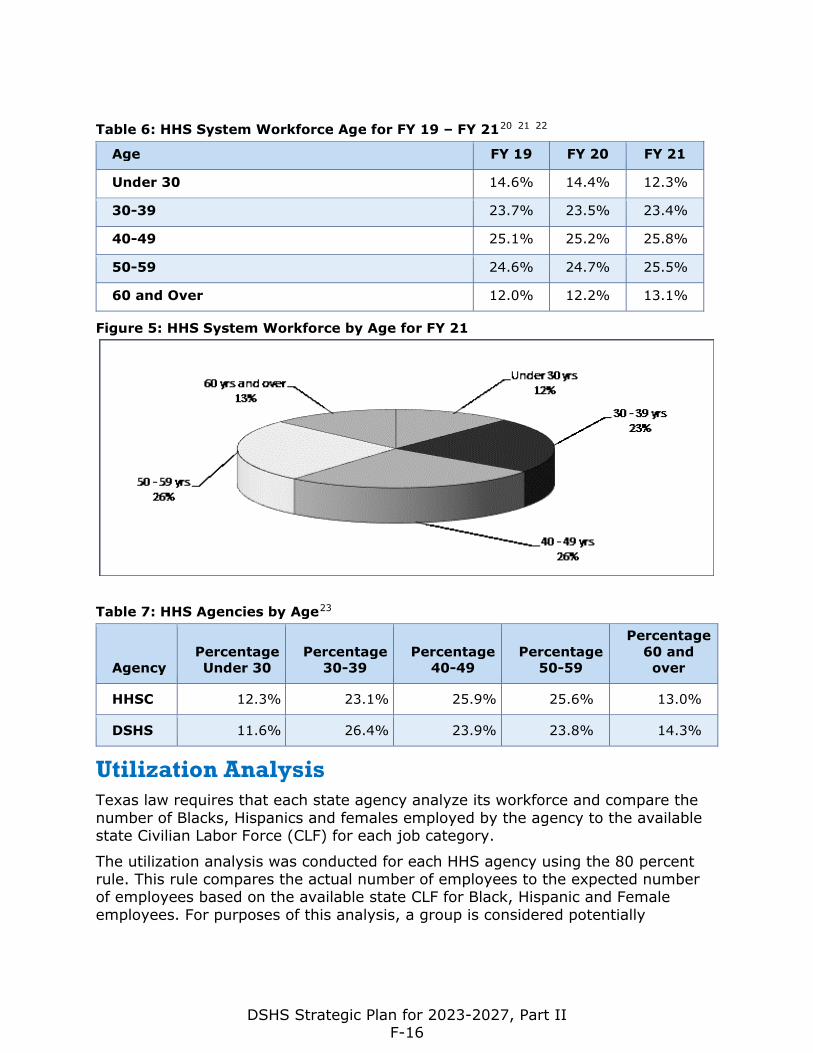
Table 6: HHS System Workforce Age for FY 19 – FY 2120 21 22
Age FY 19 FY 20 FY 21
Under 30 14.6% 14.4% 12.3%
30-39 23.7% 23.5% 23.4%
40-49 25.1% 25.2% 25.8%
50-59 24.6% 24.7% 25.5%
60 and Over 12.0% 12.2% 13.1%
Figure 5: HHS System Workforce by Age for FY 21
Table 7: HHS Agencies by Age23
Agency Percentage Under 30
Percentage 30-39
Percentage 40-49
Percentage 50-59
Percentage 60 and over
HHSC 12.3% 23.1% 25.9% 25.6% 13.0%
DSHS 11.6% 26.4% 23.9% 23.8% 14.3%
Utilization Analysis Texas law requires that each state agency analyze its workforce and compare the number of Blacks, Hispanics and females employed by the agency to the available state Civilian Labor Force (CLF) for each job category.
The utilization analysis was conducted for each HHS agency using the 80 percent rule. This rule compares the actual number of employees to the expected number of employees based on the available state CLF for Black, Hispanic and Female employees. For purposes of this analysis, a group is considered potentially
DSHS Strategic Plan for 2023-2027, Part II F-16
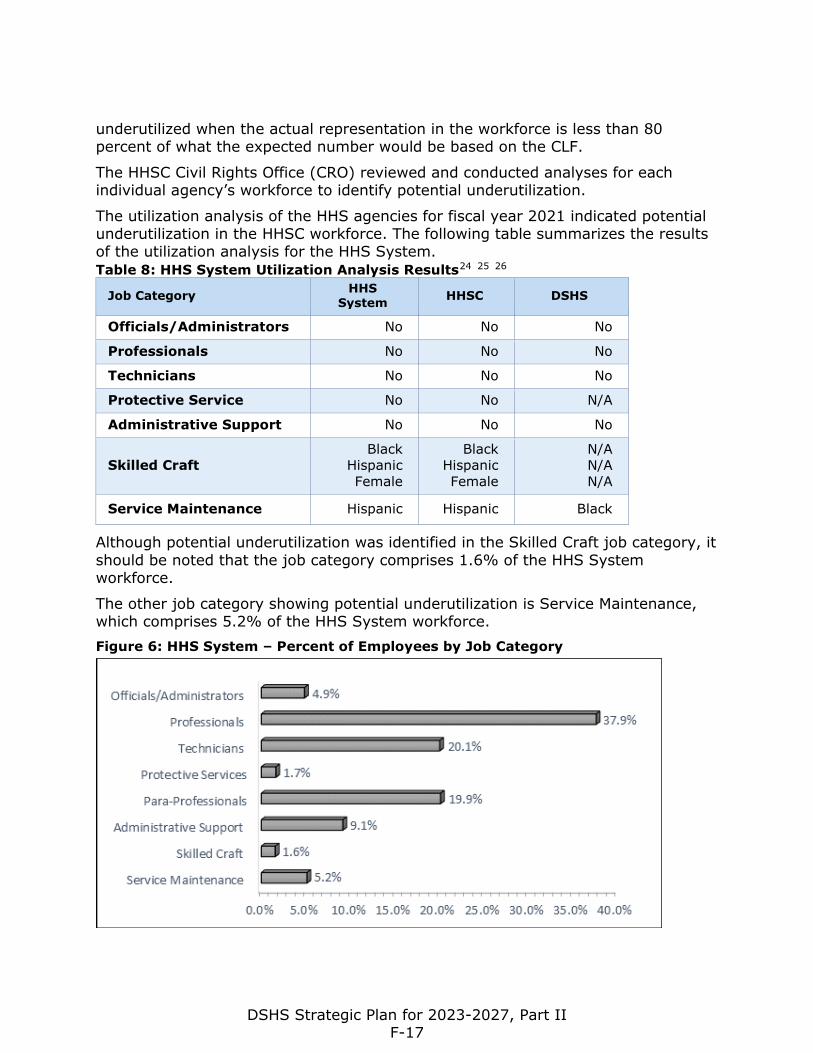
underutilized when the actual representation in the workforce is less than 80 percent of what the expected number would be based on the CLF.
The HHSC Civil Rights Office (CRO) reviewed and conducted analyses for each individual agency’s workforce to identify potential underutilization.
The utilization analysis of the HHS agencies for fiscal year 2021 indicated potential underutilization in the HHSC workforce. The following table summarizes the results of the utilization analysis for the HHS System. Table 8: HHS System Utilization Analysis Results24 25 26
Job Category HHS System HHSC DSHS
Officials/Administrators No No No
Professionals No No No
Technicians No No No
Protective Service No No N/A
Administrative Support No No No
Skilled Craft Black
Hispanic Female
Black Hispanic Female
N/A N/A N/A
Service Maintenance Hispanic Hispanic Black
Although potential underutilization was identified in the Skilled Craft job category, it should be noted that the job category comprises 1.6% of the HHS System workforce.
The other job category showing potential underutilization is Service Maintenance, which comprises 5.2% of the HHS System workforce. Figure 6: HHS System – Percent of Employees by Job Category
DSHS Strategic Plan for 2023-2027, Part II F-17
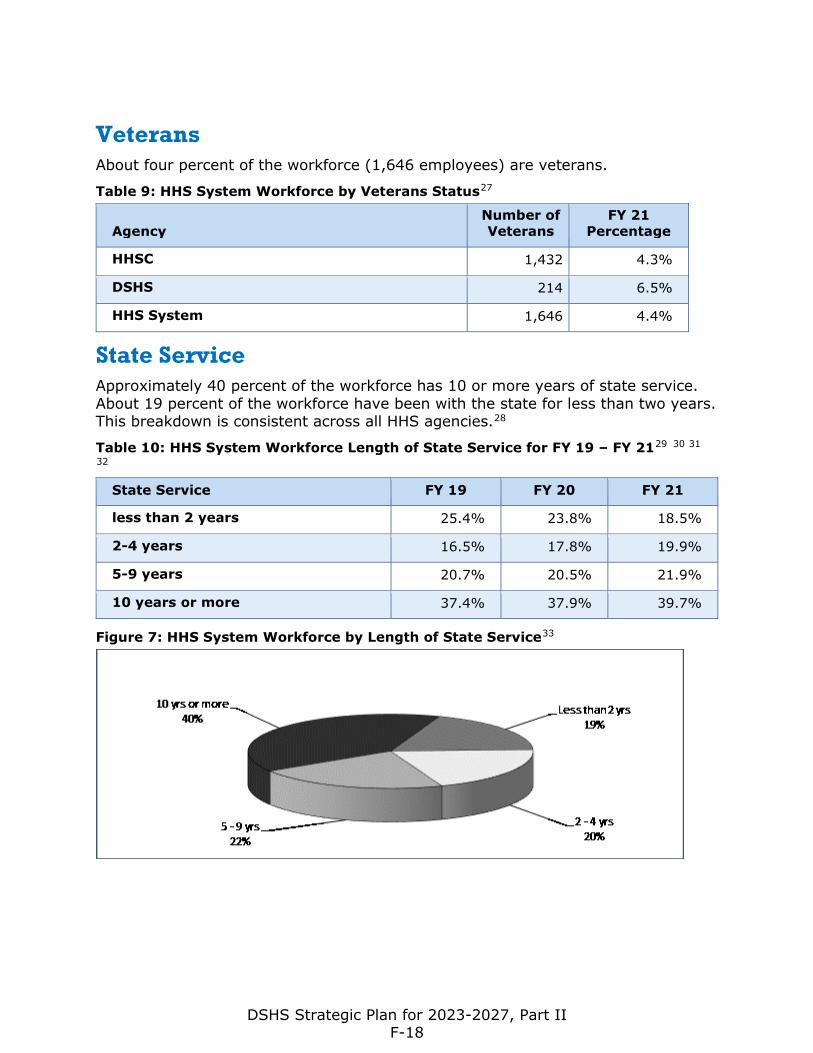
Veterans About four percent of the workforce (1,646 employees) are veterans.
Table 9: HHS System Workforce by Veterans Status27
State Service Approximately 40 percent of the workforce has 10 or more years of state service. About 19 percent of the workforce have been with the state for less than two years. This breakdown is consistent across all HHS agencies.28
Table 10: HHS System Workforce Length of State Service for FY 19 – FY 2129 30 31 32
Figure 7: HHS System Workforce by Length of State Service33
Agency Number of Veterans
FY 21 Percentage
HHSC 1,432 4.3%
DSHS 214 6.5%
HHS System 1,646 4.4%
State Service FY 19 FY 20 FY 21
less than 2 years 25.4% 23.8% 18.5%
2-4 years 16.5% 17.8% 19.9%
5-9 years 20.7% 20.5% 21.9%
10 years or more 37.4% 37.9% 39.7%
DSHS Strategic Plan for 2023-2027, Part II F-18
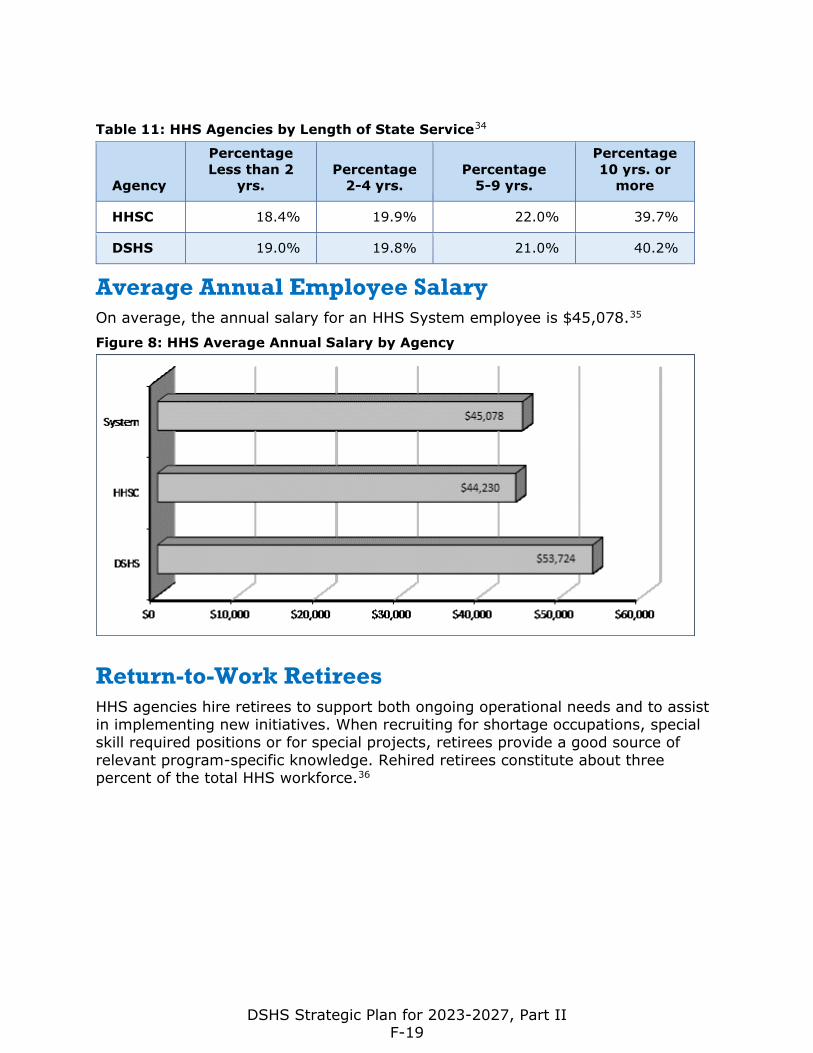
Table 11: HHS Agencies by Length of State Service34
Agency
Percentage Less than 2
yrs. Percentage
2-4 yrs.Percentage
5-9 yrs.
Percentage 10 yrs. or
more
HHSC 18.4% 19.9% 22.0% 39.7%
DSHS 19.0% 19.8% 21.0% 40.2%
Average Annual Employee Salary On average, the annual salary for an HHS System employee is $45,078.35 Figure 8: HHS Average Annual Salary by Agency
Return-to-Work Retirees HHS agencies hire retirees to support both ongoing operational needs and to assist in implementing new initiatives. When recruiting for shortage occupations, special skill required positions or for special projects, retirees provide a good source of relevant program-specific knowledge. Rehired retirees constitute about three percent of the total HHS workforce.36
DSHS Strategic Plan for 2023-2027, Part II F-19
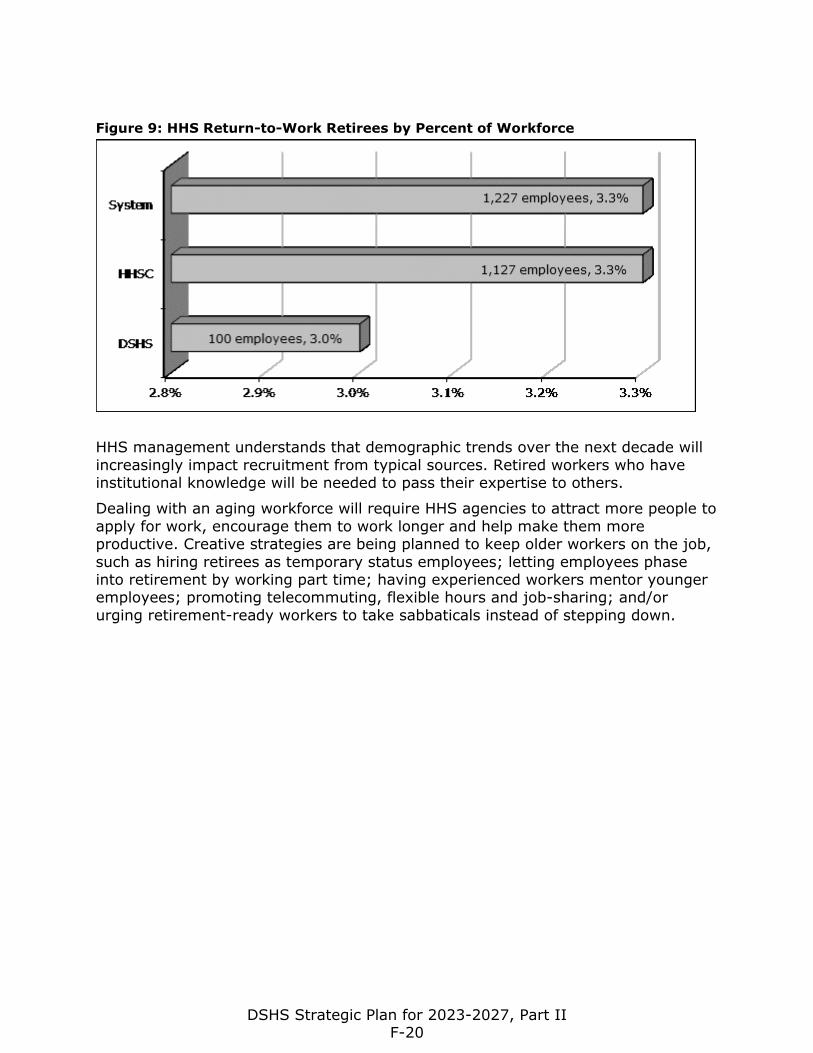
Figure 9: HHS Return-to-Work Retirees by Percent of Workforce
HHS management understands that demographic trends over the next decade will increasingly impact recruitment from typical sources. Retired workers who have institutional knowledge will be needed to pass their expertise to others.
Dealing with an aging workforce will require HHS agencies to attract more people to apply for work, encourage them to work longer and help make them more productive. Creative strategies are being planned to keep older workers on the job, such as hiring retirees as temporary status employees; letting employees phase into retirement by working part time; having experienced workers mentor younger employees; promoting telecommuting, flexible hours and job-sharing; and/or urging retirement-ready workers to take sabbaticals instead of stepping down.
DSHS Strategic Plan for 2023-2027, Part II F-20
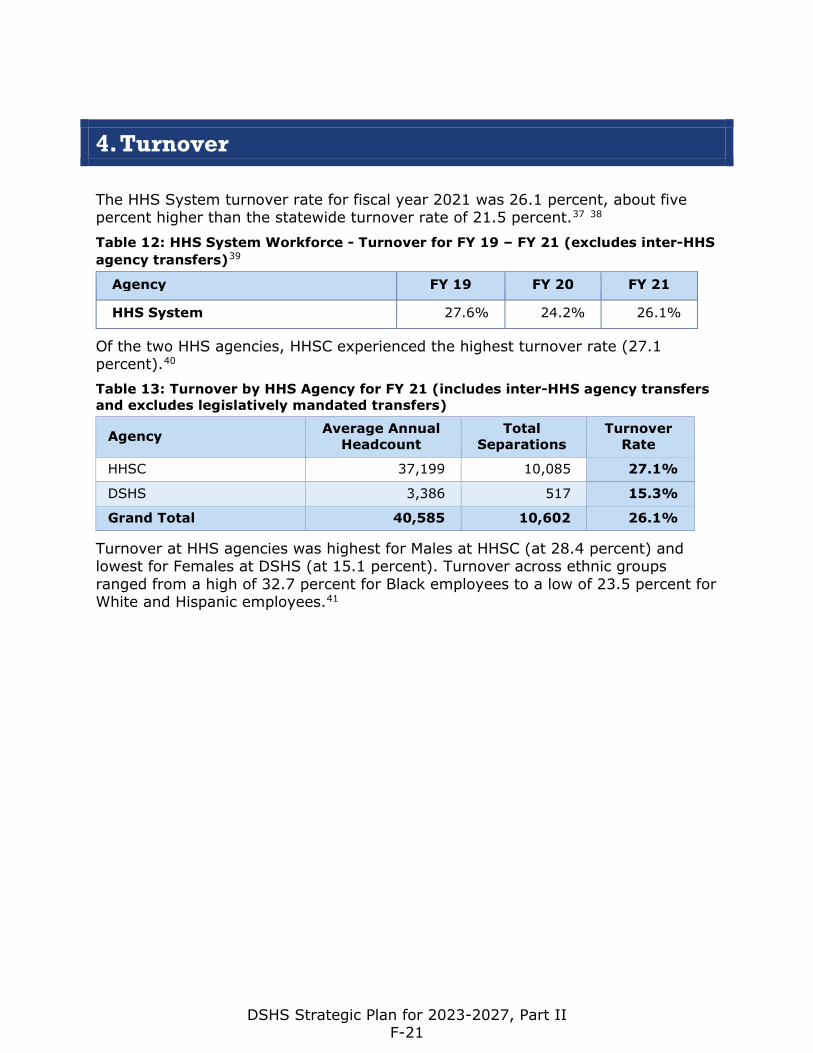
4. Turnover
The HHS System turnover rate for fiscal year 2021 was 26.1 percent, about five percent higher than the statewide turnover rate of 21.5 percent.37 38 Table 12: HHS System Workforce - Turnover for FY 19 – FY 21 (excludes inter-HHS agency transfers)39
Agency FY 19 FY 20 FY 21
HHS System 27.6% 24.2% 26.1%
Of the two HHS agencies, HHSC experienced the highest turnover rate (27.1 percent).40 Table 13: Turnover by HHS Agency for FY 21 (includes inter-HHS agency transfers and excludes legislatively mandated transfers)
Agency Average Annual Headcount
Total Separations
Turnover Rate
HHSC 37,199 10,085 27.1%
DSHS 3,386 517 15.3%
Grand Total 40,585 10,602 26.1%
Turnover at HHS agencies was highest for Males at HHSC (at 28.4 percent) and lowest for Females at DSHS (at 15.1 percent). Turnover across ethnic groups ranged from a high of 32.7 percent for Black employees to a low of 23.5 percent for White and Hispanic employees.41
DSHS Strategic Plan for 2023-2027, Part II F-21
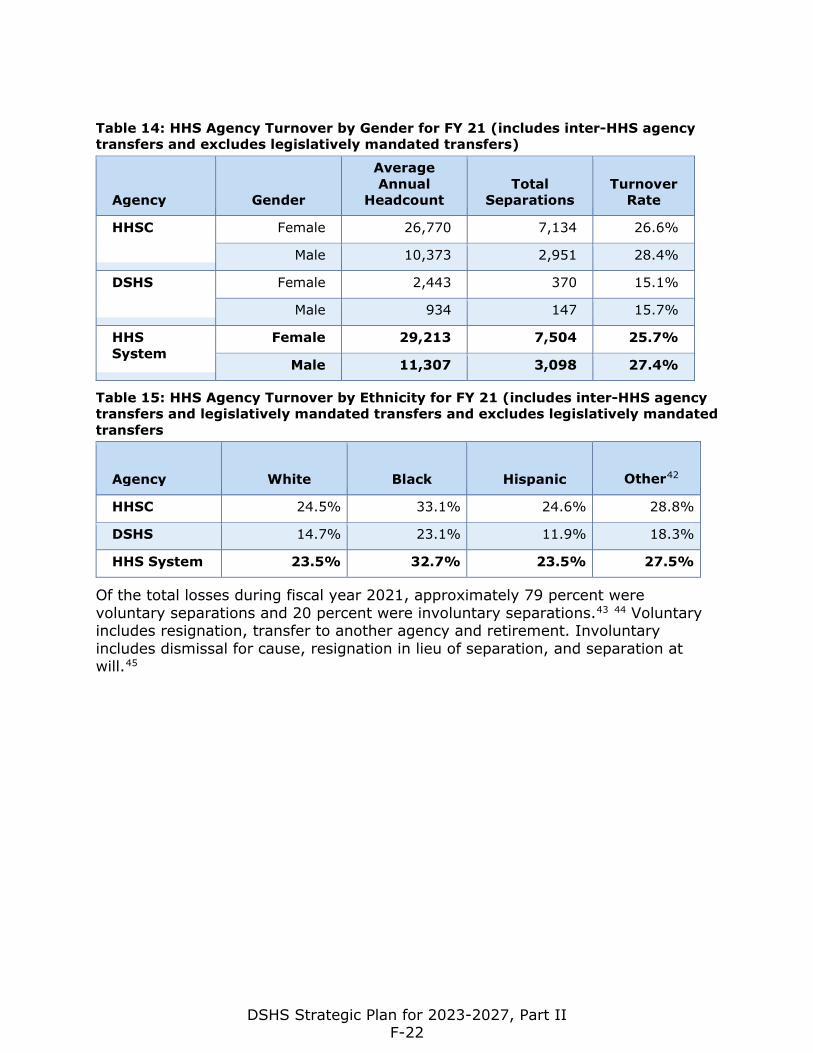
Table 14: HHS Agency Turnover by Gender for FY 21 (includes inter-HHS agency transfers and excludes legislatively mandated transfers)
Agency Gender
Average Annual
Headcount Total
Separations Turnover
Rate
HHSC Female 26,770 7,134 26.6%
Male 10,373 2,951 28.4%
DSHS Female 2,443 370 15.1%
Male 934 147 15.7%
HHS System
Female 29,213 7,504 25.7%
Male 11,307 3,098 27.4%
Table 15: HHS Agency Turnover by Ethnicity for FY 21 (includes inter-HHS agency transfers and legislatively mandated transfers and excludes legislatively mandated transfers
Agency White Black Hispanic Other42
HHSC 24.5% 33.1% 24.6% 28.8%
DSHS 14.7% 23.1% 11.9% 18.3%
HHS System 23.5% 32.7% 23.5% 27.5%
Of the total losses during fiscal year 2021, approximately 79 percent were voluntary separations and 20 percent were involuntary separations.43 44 Voluntary includes resignation, transfer to another agency and retirement. Involuntary includes dismissal for cause, resignation in lieu of separation, and separation at will.45
DSHS Strategic Plan for 2023-2027, Part II F-22
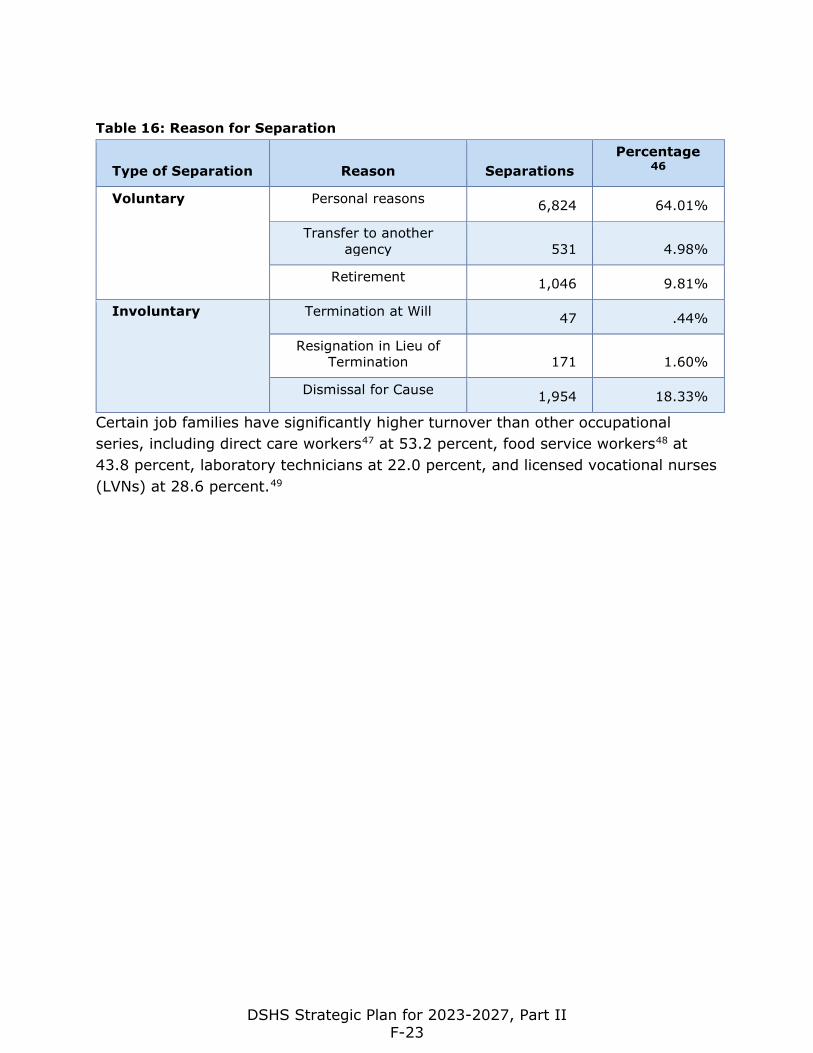
Table 16: Reason for Separation
Type of Separation Reason Separations Percentage
46
Voluntary Personal reasons 6,824 64.01%
Transfer to another agency 531 4.98%
Retirement 1,046 9.81%
Involuntary Termination at Will 47 .44%
Resignation in Lieu of Termination 171 1.60%
Dismissal for Cause 1,954 18.33%
Certain job families have significantly higher turnover than other occupational series, including direct care workers47 at 53.2 percent, food service workers48 at 43.8 percent, laboratory technicians at 22.0 percent, and licensed vocational nurses (LVNs) at 28.6 percent.49
DSHS Strategic Plan for 2023-2027, Part II F-23
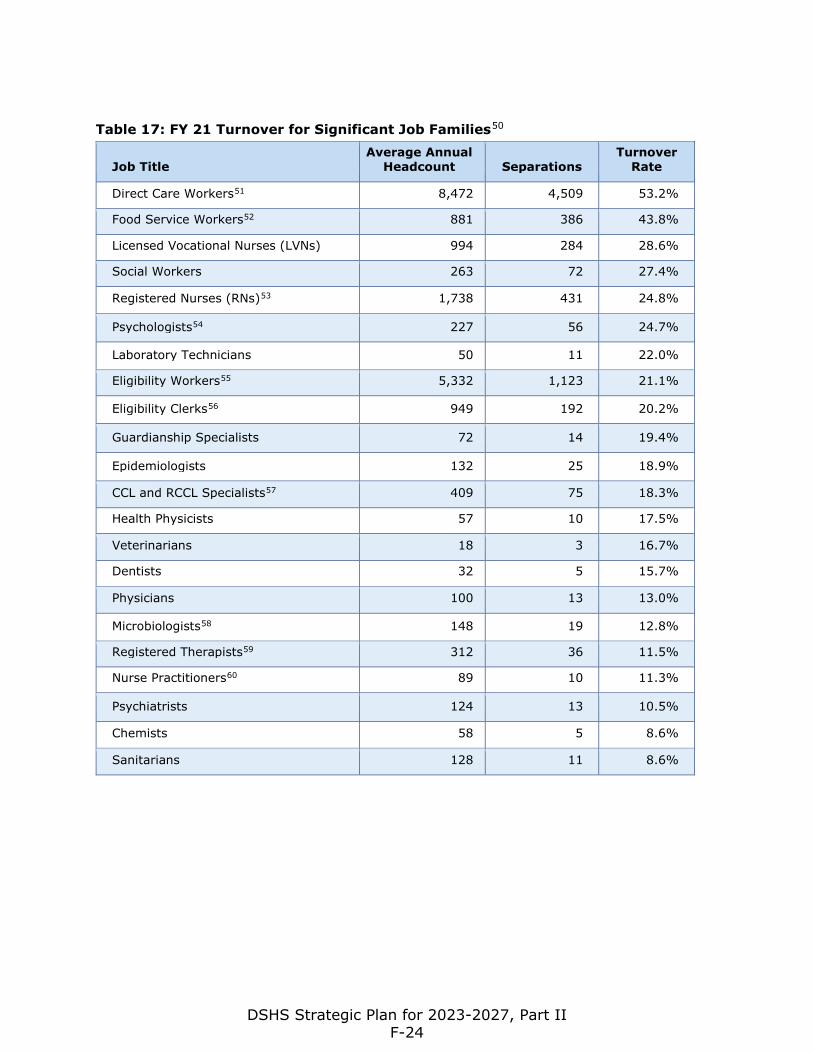
Table 17: FY 21 Turnover for Significant Job Families50
Job Title Average Annual
Headcount Separations Turnover
Rate
Direct Care Workers51 8,472 4,509 53.2%
Food Service Workers52 881 386 43.8%
Licensed Vocational Nurses (LVNs) 994 284 28.6%
Social Workers 263 72 27.4%
Registered Nurses (RNs)53 1,738 431 24.8%
Psychologists54 227 56 24.7%
Laboratory Technicians 50 11 22.0%
Eligibility Workers55 5,332 1,123 21.1%
Eligibility Clerks56 949 192 20.2%
Guardianship Specialists 72 14 19.4%
Epidemiologists 132 25 18.9%
CCL and RCCL Specialists57 409 75 18.3%
Health Physicists 57 10 17.5%
Veterinarians 18 3 16.7%
Dentists 32 5 15.7%
Physicians 100 13 13.0%
Microbiologists58 148 19 12.8%
Registered Therapists59 312 36 11.5%
Nurse Practitioners60 89 10 11.3%
Psychiatrists 124 13 10.5%
Chemists 58 5 8.6%
Sanitarians 128 11 8.6%
DSHS Strategic Plan for 2023-2027, Part II F-24
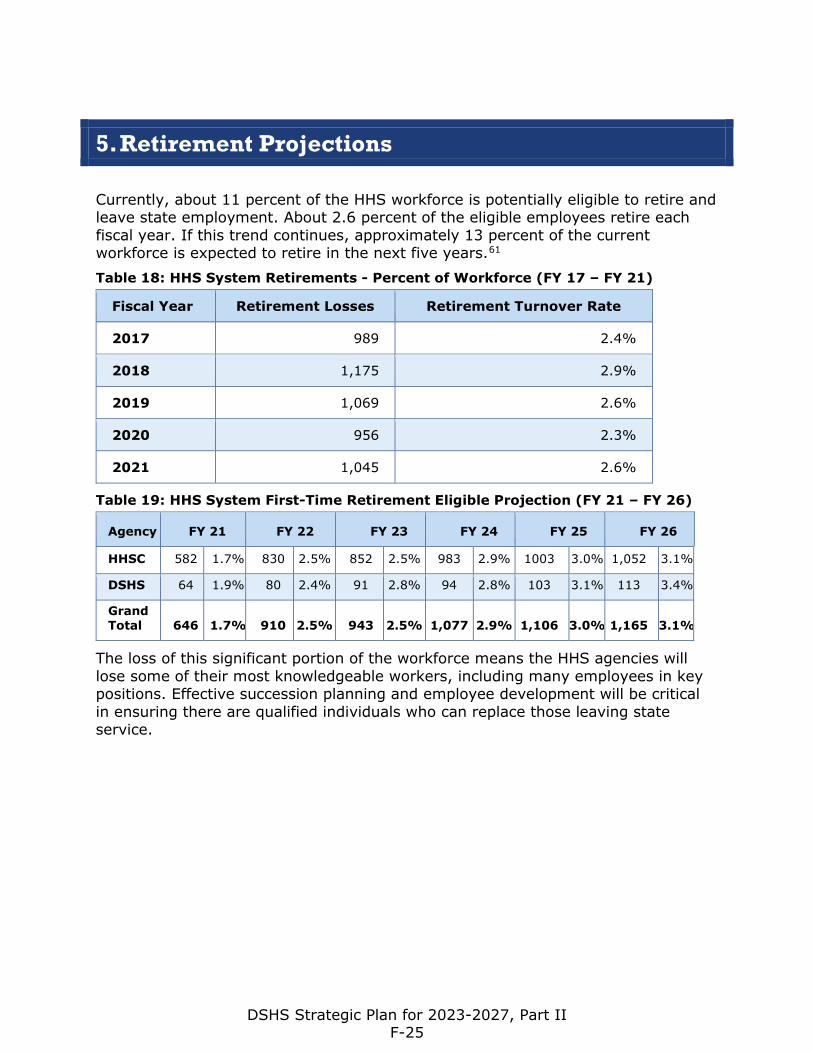
5. Retirement Projections
Currently, about 11 percent of the HHS workforce is potentially eligible to retire and leave state employment. About 2.6 percent of the eligible employees retire each fiscal year. If this trend continues, approximately 13 percent of the current workforce is expected to retire in the next five years.61 Table 18: HHS System Retirements - Percent of Workforce (FY 17 – FY 21)
Fiscal Year Retirement Losses Retirement Turnover Rate
2017 989 2.4%
2018 1,175 2.9%
2019 1,069 2.6%
2020 956 2.3%
2021 1,045 2.6%
Table 19: HHS System First-Time Retirement Eligible Projection (FY 21 – FY 26)
Agency FY 21 FY 22 FY 23 FY 24 FY 25 FY 26
HHSC 582 1.7% 830 2.5% 852 2.5% 983 2.9% 1003 3.0% 1,052 3.1%
DSHS 64 1.9% 80 2.4% 91 2.8% 94 2.8% 103 3.1% 113 3.4%
Grand Total 646 1.7% 910 2.5% 943 2.5% 1,077 2.9% 1,106 3.0% 1,165 3.1%
The loss of this significant portion of the workforce means the HHS agencies will lose some of their most knowledgeable workers, including many employees in key positions. Effective succession planning and employee development will be critical in ensuring there are qualified individuals who can replace those leaving state service.
DSHS Strategic Plan for 2023-2027, Part II F-25
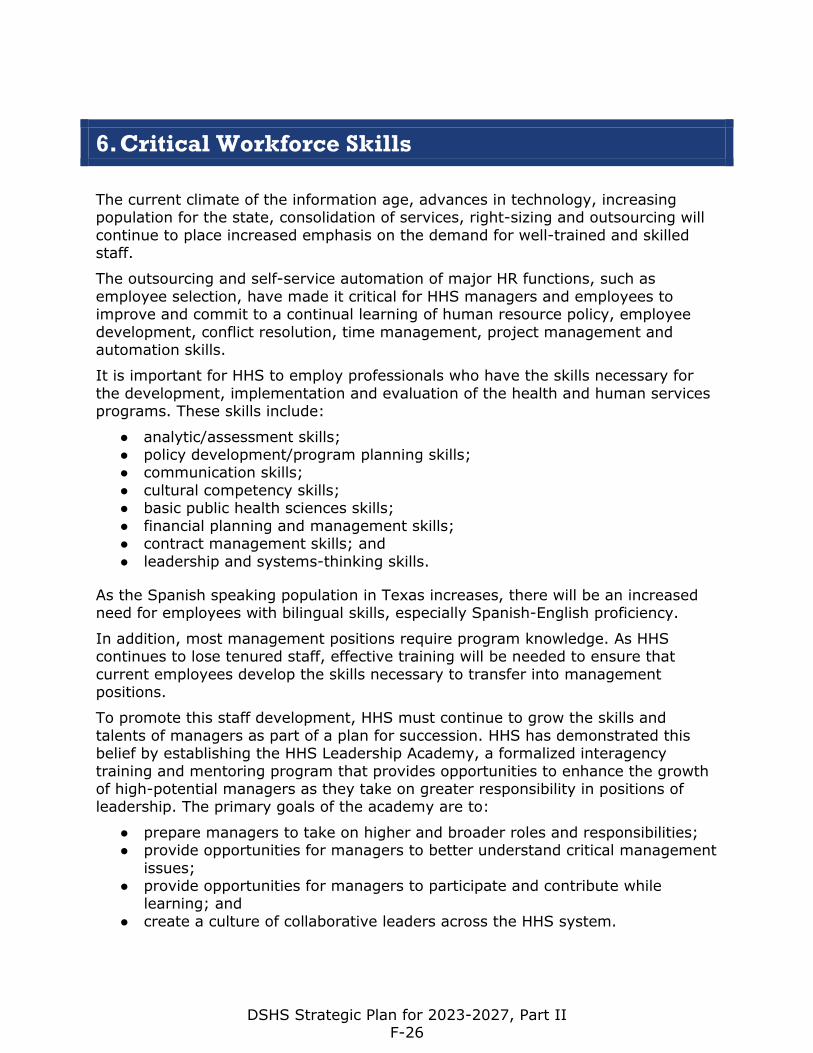
6. Critical Workforce Skills
The current climate of the information age, advances in technology, increasing population for the state, consolidation of services, right-sizing and outsourcing will continue to place increased emphasis on the demand for well-trained and skilled staff.
The outsourcing and self-service automation of major HR functions, such as employee selection, have made it critical for HHS managers and employees to improve and commit to a continual learning of human resource policy, employee development, conflict resolution, time management, project management and automation skills.
It is important for HHS to employ professionals who have the skills necessary for the development, implementation and evaluation of the health and human services programs. These skills include:
● analytic/assessment skills; ● policy development/program planning skills; ● communication skills; ● cultural competency skills; ● basic public health sciences skills; ● financial planning and management skills; ● contract management skills; and ● leadership and systems-thinking skills.
As the Spanish speaking population in Texas increases, there will be an increased need for employees with bilingual skills, especially Spanish-English proficiency.
In addition, most management positions require program knowledge. As HHS continues to lose tenured staff, effective training will be needed to ensure that current employees develop the skills necessary to transfer into management positions.
To promote this staff development, HHS must continue to grow the skills and talents of managers as part of a plan for succession. HHS has demonstrated this belief by establishing the HHS Leadership Academy, a formalized interagency training and mentoring program that provides opportunities to enhance the growth of high-potential managers as they take on greater responsibility in positions of leadership. The primary goals of the academy are to:
● prepare managers to take on higher and broader roles and responsibilities; ● provide opportunities for managers to better understand critical management
issues; ● provide opportunities for managers to participate and contribute while
learning; and ● create a culture of collaborative leaders across the HHS system.
DSHS Strategic Plan for 2023-2027, Part II F-26
Through this planned development of management skills and the careful selection of qualified staff, HHS will continue to meet the challenges posed by increased retirements.
DSHS Strategic Plan for 2023-2027, Part II F-27
7. Environmental Assessment
COVID-19 In early 2020, the nation experienced both a public health emergency and an economic crisis as the novel coronavirus (COVID-19) spread across the country. The federal government declared COVID-19 a national emergency on March 13, 2020,62 and government entities at the state and local levels took measures to help stop the spread of the virus. Every state declared a state of emergency, and the majority put stay-at-home orders in place.
The effects of the pandemic struck the economy almost immediately in 2020: Over 22 million jobs were lost from February to April of that year.63 In response to these challenges, Congress passed the Coronavirus Aid, Relief, and Economic Security (CARES) Act (2020) on March 25, 2020. CARES provided direct financial assistance to families, workers, and small businesses.64
Subsequently, as positive COVID-19 cases fell across the country, consumer confidence grew and employment levels increased.65 Employment rose by 431,000 jobs in March 2022 and the unemployment rate for the country currently stands at 3.6 percent.66
The Texas Economy Texas, which had sustained years of positive job growth, and added over 250,000 jobs in 2019,67 lost 1.4 million jobs between February and April of 202068 due to the initial stages of the pandemic. The unemployment rate reached a high of 12.9 percent in April 2020, but the rate dropped to 6.9 percent for the year. In 2021, the annual average unemployment rate for Texas fell to 5.7 percent.69
Texas’ economy began to bounce back as COVID cases decreased in 2021. Texas added approximately 657,300 jobs from June 2020 to June 2021 and by December 2021 all the jobs lost during the pandemic were recovered.70 In addition, the Federal Reserve Bank of Dallas predicts employment to grow 3.3 percent in 2022.71 The Texas Leading Index rose 17 times in the last 19 months, which shows consumer confidence in spending and saving. This also suggests strong job growth in the future.72
Poverty in Texas As the number of families living in poverty increases for the state, combined with the challenges created by the pandemic, the demand for services provided by the HHS System will continue to increase.
The U.S. Department of Health and Human Services defined the poverty level for 2021 according to household/family size as follows:
● $26,500 or less for a family of four;
DSHS Strategic Plan for 2023-2027, Part II F-28
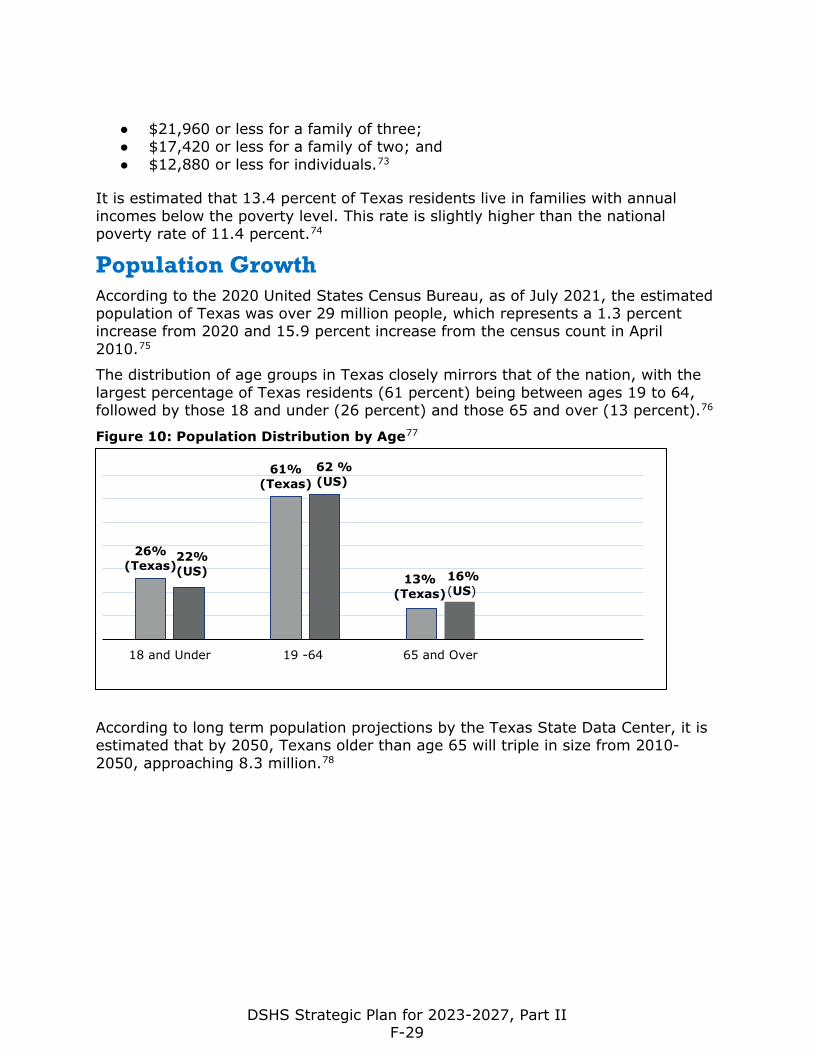
● $21,960 or less for a family of three; ● $17,420 or less for a family of two; and ● $12,880 or less for individuals.73
It is estimated that 13.4 percent of Texas residents live in families with annual incomes below the poverty level. This rate is slightly higher than the national poverty rate of 11.4 percent.74
Population Growth According to the 2020 United States Census Bureau, as of July 2021, the estimated population of Texas was over 29 million people, which represents a 1.3 percent increase from 2020 and 15.9 percent increase from the census count in April 2010.75
The distribution of age groups in Texas closely mirrors that of the nation, with the largest percentage of Texas residents (61 percent) being between ages 19 to 64, followed by those 18 and under (26 percent) and those 65 and over (13 percent).76
Figure 10: Population Distribution by Age77
According to long term population projections by the Texas State Data Center, it is estimated that by 2050, Texans older than age 65 will triple in size from 2010-2050, approaching 8.3 million.78
26%(Texas)
61%(Texas)
13%(Texas)
22%(US)
62 %(US)
18 and Under 19 -64 65 and Over
16%(US)
DSHS Strategic Plan for 2023-2027, Part II F-29
8. Expected Workforce Challenges
HHS will need to continue to recruit and retain health and human services professionals. Certain jobs will continue to be essential to the delivery of services throughout the HHS System. Many of the jobs are low paying, highly stressful and experience higher than normal turnover.
Additionally, the demand for certain public health positions is expected to increase as the response to the COVID-19 pandemic continues.
Direct Care Workers (Direct Support Professionals and Psychiatric Nursing Assistants) There are approximately 6,624 direct care workers employed within HHS. The direct care worker group is made up of direct support professionals in state supported living centers and psychiatric nursing assistants in the state hospitals. Though these positions require no formal education to perform the work, employees must develop interpersonal skills to effectively engage with residents and patients. The physical requirements of the position may be challenging due to the nature of the work and the pay is low.79
The overall turnover rate for employees in this group is very high, at about 53 percent annually.80 State supported living centers and state hospitals have historically had trouble in both recruiting and retaining these valuable workers.
Direct Support Professionals at State Supported Living Centers There are 4,418 direct support professionals in state supported living centers across the state, representing approximately 18 percent of the System's total workforce.81 These employees provide 24-hour direct care to residents in state supported living centers. They directly support these individuals by providing services including basic hygiene needs, dressing, and bathing, general health care, and dining assistance. They support life-sustaining medical care such as external feeding and lifting individuals with physical challenges. A trained and experienced direct care staff is essential to ensure resident safety, health, and well-being.
There are no formal education requirements to apply for a job in this series; however, extensive on-the-job training is required. It takes six to nine months for a new direct support professional to become proficient in the basic skills necessary to carry out routine job duties.
A typical HHS direct support professional is 40 years of age and has about seven years of state service.82
Turnover for direct support professionals is over twice the state average at 55 percent, which is one of the highest turnover rates of any job category in the System. During fiscal year 2021, the System lost about 3,131 direct support professionals. Within this job family, entry-level Direct Support Professional Is
DSHS Strategic Plan for 2023-2027, Part II F-30
experienced the highest turnover at approximately 72 percent. Turnover rates by location ranged from 38 percent at Austin State Supported Living Center to 77 percent at the San Angelo State Supported Living Center.83 84
The vacancy rate for these professionals is 35 percent, and it often takes up to five months to fill vacant positions.
The State Auditor’s Office (SAO) 2020 market index analysis found the average state salary for Direct Support Professional Is and IIIs to range from four to seven percent behind the market rate, contributing to challenges in recruitment.85
Psychiatric Nursing Assistants at State Hospitals There are approximately 2,206 psychiatric nursing assistants employed in HHS state hospitals across Texas.86
Some of their daily essential job functions include assisting licensed nurses with medication administration or treatment in addition to monitoring patients’ vital signs to ensure their health and safety. At times, psychiatric nursing assistants are the first to intervene during crisis situations and act as the frontline staff most likely to de-escalate situations to avoid the need for behavioral interventions. These critical positions also have a higher potential for on-the-job injuries, both from lifting requirements and intervention during crisis situations. They also may be required to work throughout the day and night.
The SAO 2020 market index analysis found the average state salary for a Psychiatric Nursing Assistant Is and IIIs to be seven to 12 percent behind the market rate, increasing existing challenges to recruitment.87 88
The average psychiatric nursing assistant is about 39 years of age and has an average of seven years of service.89
Turnover for psychiatric nursing assistants is very high at about 50 percent, reflecting the loss of 1,378 workers during fiscal year 2021. Within this job family, Psychiatric Nursing Assistant Is experienced the highest turnover at 67 percent. Turnover rates vary by location, from 33 percent at Terrell State Hospital to 66 percent at the Big Spring State Hospital.90
HHS is currently having trouble filling vacant psychiatric nursing assistant positions, as there are 873 vacancies in this job family. Vacant positions are going unfilled an average of four months.91
Food Service Workers HHS employs approximately 748 food service workers.92
The average hourly rate paid to food service workers is $11.51.93 The turnover rate for food service workers is very high, at about 44 percent.94 The SAO 2020 market index analysis found the average state salary for Food Service Workers ranged eight to 11 percent behind the market rate; Food Service Managers ranged from six to 15 percent behind the market rate; and Cooks ranged from nine to 11 percent behind the market rate.95
DSHS Strategic Plan for 2023-2027, Part II F-31
Retention and recruitment of these workers remains a major challenge for the System.
Food Service Workers at State Supported Living Centers There are 449 food service workers employed in HHS state supported living centers throughout Texas.96 The typical food service worker is about 46 years of age and has an average of approximately nine years of service.97
Turnover in these food service worker positions is very high, at 49 percent. By location, turnover rates range from 35 percent at Richmond State Living Center to 87 percent at Lubbock State Living Center.98
Food Service Workers at State Hospitals There are 289 food service workers employed at HHS state hospitals and centers throughout Texas.99
The typical food service worker is about 46 years of age and has an average of about eight years of service.100
Of the state hospitals with over 20 food service workers, turnover rates range from 16 percent at Rio Grande State Hospital Center to 56 percent at Rusk State Hospital.101
Food Service Workers at Texas Center for Infectious Disease There are 10 food service workers employed in the Texas Center for Infectious Disease (TCID).102
The typical food service worker is about 46 years of age and has an average of approximately seven years of service.103
At 26 percent, turnover for these food service worker positions is high and slightly above the state average of 21.5 percent.104 105
Dietetic and Nutrition Specialists There are 56 dietetic and nutrition specialists employed by HHS, with the majority (55 percent) classified as Dietetic and Nutrition Specialists IIIs.106 These specialists facilitate/direct operations of nutrition care services, serve as a member of the patient’s recovery team, and plan special therapeutic menus for patients.
Dietetic and nutrition specialists work in state hospitals, state supported living centers, and in Health, Developmental and Independence Services (HDIS). The typical system dietetic and nutrition specialist is 45 years of age and has nine years of service. Thirty-four percent of these specialists have 10 or more years of service.107
The average salary for the dietetics and nutrition specialists is $57,229, which is below both the national average wage of $65,620 and Texas average wage of $64,560.108 109
DSHS Strategic Plan for 2023-2027, Part II F-32
Turnover is about the same as the state average at 21 percent, which represents a total loss of 13 employees.110 111 The vacancy rate is 15 percent, and it can take over five months to fill these vacancies.112
According to the Bureau of Labor Statistics, employment of dietitians and nutritionists is projected to grow 11 percent from 2020 to 2030. This is faster than the average for all occupations.113
Dietetic and Nutrition Specialists at State Supported Living Centers There are 22 Dietetic and Nutrition Specialist IIs and IIIs at state supported living centers across Texas.114
On average, these specialists are about 45 years of age and have 10 years of service.115
The turnover rate for these dietetic and nutrition specialists is high at 17 percent (representing four total losses), with a high vacancy rate of approximately 24 percent.116 117
Dietetic and Nutrition Specialists at State Hospitals There are 13 dietetic and nutrition specialists employed in the state hospital system, which the slight majority working as Dietetic and Nutrition Specialist IIIs (seven specialists).118
The typical specialist at these facilities is about 50 years of age and has an average of nine years of service.119
Only the San Antonio State Hospital experienced turnover in the group, as they lost only one employee. The vacancy rate is 24 percent and it often takes over six months to fill a position.120 121
Dietetic and Nutrition Specialists in Health, Developmental and Independence Services About 21 percent of dietetic and nutrition specialists (12 employees) work in HDIS.122
The typical dietetic and nutrition specialist in HDIS is about 35 years of age and has an average of five years of service. Over eight percent of these specialists are currently eligible to retire.123
The average turnover rate for dietetic and nutrition specialists is currently high 23 percent, which is higher than the state average rate of 21.5 percent.124 125
Eligibility Services Staff Across the state, there are about 4,978 eligibility advisors within the Access & Eligibility Services (AES) area accounting for about 13 percent of the HHS System workforce.126
DSHS Strategic Plan for 2023-2027, Part II F-33
Most of these individuals (4,199 employees or 84 percent) are employed as Texas Works advisors with the remaining made up of Hospital-Based advisors and Medical Eligibility specialists.127
Overall turnover for these workers is high at 21 percent, with Texas Works advisors and Medical Eligibility specialists experiencing the highest turnover at 21 percent, followed by hospital-based workers at 15 percent.128
Texas Works Advisors There are approximately 4,199 Texas Works advisors within AES that make eligibility determinations for the Supplemental Nutrition Assistance Program (SNAP), Temporary Assistance for Needly Families (TANF), Medicaid for children, families, and pregnant women, and the Children’s Health Insurance Plan (CHIP). The typical Texas Works advisor is 42 years of age and has an average of seven years of service.129
Turnover for these employees is high at 21 percent, representing a loss of 963 workers in fiscal year 2021. Certain regions of Texas experienced higher turnover than others, including the Northeast area of the state at 28 percent, and the Metroplex area at 27 percent. Entry-level Texas Works Advisor Is experienced the highest turnover at 52 percent.130
In addition, AES has encountered difficulties finding qualified candidates for new eligibility advisor positions. Due to this shortage of qualified applicants, vacant positions go unfilled for an average of over four months, with vacant positions in the Houston area remaining unfilled for an average of a little more than six months.131
Medical Eligibility Specialists Within AES, there are 526 Medical Eligibility specialists determining financial eligibility for Medicaid for Elderly and People with Disabilities (MEPD). Medical Eligibility specialists have, on average, eight years of service, with an average age of 43.132
Turnover for these specialists is high at about 21 percent, representing the loss of 118 employees in fiscal year 2021. Entry-level Medical Eligibility Specialist Is experienced the highest turnover, at 58 percent, which is 15 percent higher than fiscal year 2019.133
Hospital Based Workers AES has about 253 Hospital-Based advisors stationed in nursing facilities, hospitals, and clinics. These advisors determine eligibility for the SNAP, TANF, Medicaid and CHIP programs.134
These tenured advisors have an average of 13 years of service and over 56 percent of these employees have 10 or more years of service, with an average age of 46.135
Turnover for these employees is currently below the state average at 15 percent.136 137
DSHS Strategic Plan for 2023-2027, Part II F-34
Community Care Workers HHS employs about 412 Community Care workers within AES. These workers conduct home visits, determine needs for services, develop service plans, and refer individuals for appropriate services.138
The typical Community Care worker is 47 years of age and has an average of 12 years of service.139
Community Care workers make an average salary of $33,679, which is below both the national average wage of $40,460 and Texas average wage of $39,630.140 141
The turnover rate for AES Community Care workers is moderately high at 14 percent, representing the loss of about 61 employees.142 The vacancy rate for these positions is well-managed at six percent, with these positions often remaining unfilled for about five weeks.143
Child Care Licensing and Residential Child Care Licensing Specialists There are 406 Child Care Licensing (CCL) and Residential Child Care Licensing (RCCL) specialists employed within the System who monitor, investigate and inspect child day-care facilities and homes, residential child-care facilities, child-placing agencies and foster homes.144 145 In addition, they conduct child abuse/neglect investigations of children placed in 24-hour childcare facilities and child placing agencies licensed or certified by Residential Child Care Licensing.
The typical specialist is 41 years of age and has an average of nine years of service. About 34 percent of these employees have 10 or more years of service.146
CCL and RCCL specialist turnover is high at 18 percent, though slightly below the state average rate of 21.5 percent. Within this group, the highest turnover was experienced by RCCL Inspector IIIs at 36 percent and RCCL Investigator and Compliance Specialist IIs at 21 percent.147 148
Guardianship Staff The HHS System employs 81 guardianship specialists and guardianship supervisors who are responsible for providing guardianship services to eligible clients.149 Staff continuously assess and determine whether guardianship is the most appropriate and least restrictive alternative necessary to ensure the consumer’s health and safety.
Retention continues to be a challenge, since these positions require specialized skills and salaries are not comparable with that paid by other agencies and the private sector.
Guardianship Specialists There are 69 guardianship specialists employed at HHS.150
DSHS Strategic Plan for 2023-2027, Part II F-35
HHS guardianship specialists are about 46 years of age and have an average of 10 years of service.151
The turnover rate for guardianship specialists is high at about 19 percent annually, which is slightly below the state average turnover rate of 21.5 percent.152 153
About 16 percent of these tenured employees will be eligible to retire in the next five years.154
Guardianship Supervisors There are 12 guardianship supervisors working for HHS.155
HHS guardianship supervisors has an average of about 18 years of service, with an average age of 52 years.156
Though the turnover rate for these highly tenured guardianship supervisors is currently well-managed at about eight percent, HHS may face significant recruitment challenges in the next few years to replace these tenured employees who are eligible for retirement. With about 25 percent of these employees currently eligible to retire, this rate is expected to increase in the next five years to about 67 percent.157 158
Architects These are 16 Architect IIs employed within the Chief Policy and Regulatory Office (CPRO). These architects perform architectural plan reviews and conduct initial and annual surveys and complaint/incident investigations on state licensure, and (when applicable) federal certification requirements for nursing facilities, assisted living facilities, Day Activity and Health Services facilities, Intermediate Care Facilities for Individuals with Intellectual Disabilities, and in-patient Hospice facilities.159
These HHS Architect IIs have, on average, 10 years of service, with an average age of 59 years of age. Over 85 percent of these employees have five or more years of service.160
The SAO 2020 market index analysis found the average state salary for Architect IIs is $75,786. The SAO 2020 market index analysis found that the average state salary for Architect IIs to be four percent behind the market rate.161
Though the turnover rate for these employees is only 11 percent, with a vacancy rate of 20 percent, vacant positions often go unfilled for over seven months due to a shortage of qualified applicants available for work.162
Though only 13 percent of these employees are currently eligible to retire, over 56 percent will be eligible to retire in the next five years.163
HHS needs to expand their recruitment strategies to replace these highly skilled workers.
Contract Specialists There are 413 contract specialists employed within the HHS System. These specialists utilize various levels of technical expertise related to procurement,
DSHS Strategic Plan for 2023-2027, Part II F-36
contract development, contract management, and program performance to meet agency needs for goods and services. Contract specialists may also consult and communicate with various community stakeholders and state and local authorities to evaluate the effectiveness of programs to meet the agency’s needs. In addition, contract specialists may be responsible for monitoring contract performance, administering billing and tracking expenditures, and facilitate meetings between the System and vendors.164
System contract specialists are, on average, 45 years of age and have about 12 years of service. Over 50 percent of these employees have 10 or more years of service.165
The average salary for contract specialists is $54,892 a year.166 The SAO market index analysis found that state Contract Specialist IIIs and IVs make two to seven percent less than the market rate.167
Turnover for these specialists is above the state average at 26 percent.168 169 With a vacancy rate of about 13 percent, vacant positions often go unfilled for over four months due to a shortage of qualified applicants available for work.170
Contract Specialists in DSHS Program Operations The Program Operations (PO) area of DSHS employs 59 Contract Specialist IVs and Vs. These contract specialists have an average of 12 years of service and are about 46 years of age. Over 45 percent of this group have over 10 years of service.171
The turnover rate for these contract specialists is currently well-managed at four percent, though the vacancy rate is high at 19 percent.172 173 With over 30 percent of these Contract Specialist Vs eligible to retire in the five years, HHS will need to focus on competitive recruitment strategies.174
Contract Specialists in Procurement and Contracting Services In HHSC Procurement and Contracting Services (PCS), there are 46 Contract Specialist IVs and Vs. The average contract specialist in this group is, on average, 47 years of age, with 12 years of service.175 The total turnover rate for these contract specialists is moderately high at 14 percent, though it often takes over five months to fill vacancies with qualified candidates.176 177
Contract Specialists in Health, Developmental and Independence Services There are 42 contract specialists in HDIS. On average, these contract specialists are about 46 years of age, with an average of 11 years of service. Forty-three percent of this group have over 10 years of service.178
The turnover rate for these contract specialists is currently well below the state average at 12 percent, it can take up to six months to fill vacancies.179 180 181
DSHS Strategic Plan for 2023-2027, Part II F-37
Contract Specialists in Intellectual & Developmental Disability & Behavioral Health Services Intellectual & Developmental Disability & Behavioral Health Services (IDD-BH) employs 54 Contract Specialist IVs and Vs. These contract specialists have an average of 11 years of service and are about 47 years of age. Fifty-two percent of this group has at least 10 years of service.182
The turnover rate for these specialists is below the state average at 16 percent, though the vacancy rate is high at 21 percent.183 184 Over 29 percent of these contract specialists are eligible to retire in the next five years.185 186
Purchasers There are 97 purchasers employed within HHSC PCS. With 32 employees, Purchaser IVs make up over half of the group.187 Purchasers perform functions such as assisting with procurements, receiving and tracking vendor responses, as well as distributing responses to assigned buyers. They may also assist with identifying provider resources and evaluating information supplied by bidders. Advanced employees, such as Purchaser VIs, identify purchasing related issues and work with management, requesters, subject matter experts, and outside stakeholders.188
The average salary for this group of PCS purchasers is $50,554.189 In the SAO market report index for fiscal year 2020, state Purchaser IVs make 13 percent below the state market index rate.190
These tenured purchasers are, on average, 48 years of age and have an average of 12 years of service. Over 43 percent of these employees have more than 10 years of service.191
Though the turnover rate for this group is high at 15 percent, the vacancy rate is very low at five percent.192 193 On average, it can take over four months to fill these vacancies.194
Financial Analysts There are 117 financial analysts employed in the HHS System. These employees perform advanced financial analysis, examine and investigate accounting records, as well as conduct regulatory work related to revenue collections and budget appropriations.195
The average financial analyst is 46 years of age with about 12 years of service. Almost 30 percent of these employees will be eligible to retire in the next five years.196 197
Turnover is well-managed for these positions, as the rate is well below the state average at nine percent.198 199
The SAO’s report on market index for fiscal year 2020 found the market index rate salary for financial analysts to be four to seven percent below the market index, which may account for the high vacancy rate at 18 percent. It can take up to three months to fill these vacancies.200 201
DSHS Strategic Plan for 2023-2027, Part II F-38
Financial Analysts in the DSHS Program Operations There are 17 Financial Analyst Is, IIs, and IIIs in the PO Division of DSHS. The average PO financial analyst is 37 years of age and has about six years of service.202
Turnover for this group is high with a turnover rate of 32 percent.203 The vacancy rate is also high at 15 percent.204
Financial Analysts in the HHSC Chief Program and Services Office In the CPSO, there are 11 Financial Analyst Is, IIs, IIIs, and IVs. The average CPSO financial analyst has about 11 years of service and is 48 years of age.205
Turnover is low for this group, and the vacancy rate is only eight percent, but it can take up to a year to fill vacant positions.206 207
Social Workers There are 234 social workers employed in the HHS System, with the majority (58 percent) housed in state hospitals across the state.208
Turnover for these social workers is high at 27 percent.209
High turnover may be due to the large disparity between private sector and HHS salaries. The average annual salary for system Social Worker I through V is $46,567, which falls significantly below the market rate. The SAO 2020 market index analysis found that the average state salary for Social Worker IIs and IIIs ranged from eight to nine percent behind the market rate. In addition, the average annual salary for social workers is below the national ($62,310) and state ($64,480) averages.210 211
These problems are expected to worsen as tenured employees approach retirement. Though only nine percent of these employees are currently eligible to retire, this number is expected to increase to about 21 percent in the next five years.212
Social Workers at State Supported Living Centers Approximately 12 percent of HHS social workers (27 employees) work at state supported living centers across the state.213 These employees serve as liaisons between the resident’s legally authorized representative and others to assure ongoing care, treatment, and support using person-centered practices. They gather information to assess a resident’s support systems and service needs, support the assessment of the resident’s rights and capacity to make decisions, and assist with the coordination of admissions, transfers, transitions, and discharges.
The typical social worker at these facilities is about 51 years of age and has an average of 13 years of service.214
The average turnover rate for these social workers is very high at 39 percent, much higher than the state average rate of 21.5 percent, with positions often remaining unfilled for an average of over five months before being filled.215 216 217
DSHS Strategic Plan for 2023-2027, Part II F-39
Social Workers at State Hospitals There are 135 social workers at HHS state hospitals.218 These employees are critical to managing patient flow in state hospitals and taking the lead role in communicating with patient families and community resources. Social workers provide essential functions within state hospitals that include conducting psychosocial assessments, therapeutic treatment and case coordination for individuals receiving services from HHS in-patient psychiatric hospitals and the Waco Center for Youth.
State hospital social workers are about 42 years of age and have an average of nine years of service.219
The overall turnover rate for these social workers is high at around 29 percent, with the Kerrville State Hospital experiencing turnover of more than 68 percent.220
Public Health Social Workers There are 61 Public Health Region social workers across the state.221 These employees provide case management consultation for families with children who have health risks, conditions, or special healthcare needs.
The typical public health social worker is about 44 years of age and has an average of nine years of service.222
The average turnover rate for these social workers is high at 20 percent, though slightly below the state average rate of 21.5 percent.223 224 Of the regions with two or more employees, the Arlington area experienced the highest rate at 36 percent and the South Texas area had the lowest at 12 percent.225
With a high vacancy rate of 24 percent, and with nearly 20 percent of these employees being eligible for retirement within the next five years, recruitment and retention of these workers remains a challenge.226
Social Workers in the Chief Program and Services Office The CPSO employs 11 Social Worker IIIs.227 Some of their essential job functions include providing case management, collecting and analyzing information to determine care eligibility, and providing resource facilitation. They may also develop and maintain relations with community referral sources and stakeholders.
The typical social worker in this group is about 43 years of age and has an average of six years of service.228
The average turnover rate for these social workers is well-managed at 10 percent, although the vacancy rate is high at 27 percent. Positions often remain vacant for an average of over two months before being filled.229 230
Case Managers There are 58 case managers employed by HHS, with the majority (91 percent) housed in state hospitals across the state.231 Case managers assume an advocate role for both acute and chronically disabled psychiatric patients, coordinating
DSHS Strategic Plan for 2023-2027, Part II F-40
functions to ensure patients actively involve themselves in those activities which will promote acquisition of skills to enhance their ability to function more independently and successfully in the community. The typical case manager is about 41 years of age and has an average of 11 years of service.232
Turnover for the case managers is high at 24 percent. Turnover rates by location ranged from 0 percent at Big Springs State Hospital to 50 percent at the Rio Grande State Center.233
This high turnover may be due to the large disparity between private sector and HHS salaries. The average annual salary for HHS Case Manager I through V is $33,666, which falls below the market rate.234 The SAO 2020 market index analysis found that the average state salary for Case Manager Is and IIIs to be seven percent behind the market rate.235
These problems are expected to worsen as tenured employees approach retirement. About 16 percent of these employees will be eligible to retire in the next five years.236
Claims Examiners HHS employs 373 claims examiners in AES. Over 99 percent of these examiners work in the Division for Disability Services (DDS), which is under AES. These employees research and verify DDS jurisdiction to process incoming disability cases for adjudication. The typical claims examiner is 43 years of age and has 11 years of service.237
The average turnover rate for Claims Examiner IIs, IIIs, and IVs is high at 18 percent, though slightly below the state average rate of 21.5 percent. With a turnover rate of 45 percent, Claims Examiners II positions are the most challenging to retain and therefore contribute the highest number of vacancies.238 239
Claims Examiner IIs earn an average annual salary of $38,880.240 This salary falls significantly below the market rate. The SAO 2020 market index analysis found Claims Examiner IIs to be 10 percent below the market index rate.241
This disparity may contribute to HHS’ ability to recruit qualified applicants, as Claims Examiners IIs experience the highest vacancy rate at 70 percent. With over 200 vacant Claims Examiners positions, it often takes over six months to fill the vacancies.242
Registered Therapists There are 295 registered therapists employed at HHS state hospitals and state supported living centers. 243 244 They specialize in various areas, such as audiology, speech-language pathology, physical therapy, and certified occupational therapy. This group also includes licensed physical therapy assistants (LPTA). Registered therapists provide essential care to the citizens of Texas and are critical workers for direct-care services.
DSHS Strategic Plan for 2023-2027, Part II F-41
The average salary for all registered therapists is $75,609, which is above the national average wage of $65,030 and Texas average wage of $67,520.245 246
Occupational therapists earn, on average, $89,715 a year. This is comparable to the national average wage of $89,740, but below the Texas average wage of $96,100. 247 248
The national average salary for physical therapists of $92,920 is also comparable to the system average of $92,076. The average salary for physical therapists in Texas is higher at $98,340. 249 250
System speech language pathologists’ average salary of $84,306 is commensurate with national average wage of $85,820 and the Texas average wage of $82,940. 251 252
The turnover rate for all registered therapists is low at 12 percent. Registered Therapist IIs experienced the highest turnover at 18 percent. They also have the highest vacancy rate at 23 percent, with it often taking almost six months to fill vacant Therapist II positions.253 254
HHS will need to strengthen their recruitment efforts for these critical workers, as 23 percent of these employees will be eligible to retire in the next five years.255
Registered Therapists at State Supported Living Centers HHS employs 231 registered therapists in state supported living centers across Texas.256 These employees have, on average, nine years of service, with an average age of 48.257
The turnover for all registered therapists in state supported living centers is below the state average at 11 percent. El Paso State Supported Living Center has the highest turnover rate at 54 percent, followed by Mexia State Supported Living Center at 32 precent.258 259
HHS may face significant recruitment challenges in the next few years to replace these employees who will be eligible for retirement. Though only about eight percent of these employees are currently eligible to retire, approximately 21 percent will be eligible in the next five years.260
Registered Therapists at State Hospitals There are 54 registered therapists working in state hospitals across Texas. These employees have, on average, 12 years of service, with an average age of 45. Fifty percent of the therapists have 10 or more years of service.261
The turnover for all registered therapists in the state hospitals is high at 17 percent, though slightly below the state average rate of 21.5 percent. North Texas State Hospital experienced the highest turnover rate at 30 percent. Of state hospitals with at least 10 registered therapists, San Antonio State Hospital experienced the lowest at eight percent.262 263
Like the state supported living centers, HHS may face recruitment challenges in the next few years to replace these tenured employees who will be eligible for
DSHS Strategic Plan for 2023-2027, Part II F-42
retirement. Thirteen percent of these employees are currently eligible to retire, and approximately 33 percent of them will be eligible in the next five years.264
Full staffing of these positions is critical to direct-care services.
Registered Therapy Assistants There are 12 registered therapy assistants employed in HHS state hospitals.265 These assistants write therapy summary reports, assure therapeutic interventions are consistent with optimal client function, and maintain therapy space, materials, and equipment. Under the supervision of a registered therapist, they may also plan and facilitate therapeutic groups and activities.
The average registered therapy assistant is 47 years of age and has an average of seven years of service. Seventy-five percent of these employees work at the Austin State Hospital, with the remaining 25 percent at San Antonio State Hospital.266
Registered therapy assistants earn an average salary of $51,585, which is below the national average wage of $60,740 and Texas average wage of $69,470. 267 268
Turnover for registered therapy assistants is high at 18 percent, though vacancies are currently well-managed, as all positions for their group are filled.
Registered Nurses Registered nurses (RNs) constitute one of the largest healthcare occupations. With over three million jobs in the U.S., job opportunities for RNs are expected to grow nine percent from 2020 to 2030, about as fast as the average for all occupations. About 194,500 openings for registered nurses are projected each year, on average, over the decade.269 270
HHS employs approximately 1,581 RNs across the state.271 272 As the demand for nursing services increases, the recruitment and retention of nurses will continue to be a challenge, and the need for competitive salaries will be critical.
Currently, the average annual salary for HHS System RNs is $63,856.273 This salary falls below both national and state averages for these occupations. Nationally, the average annual earnings for RNs in 2020 was $82,750.274 In Texas, the average annual earnings for RNs in 2020 was $ 79,120.275 In addition, the SAO 2020 market index analysis found the average state salary for Nurse II-IVs ranged from five to 10 percent behind the market rate and 10 percent behind the market rate for Public Health Nurse IIs.276 Posted vacant positions are currently taking about six months to fill.277
To address these difficulties, HHS may consider requesting additional funding to increase salary levels for these positions.
Registered Nurses at State Supported Living Centers About 42 percent of System RNs (664 RNs) work at HHS state supported living centers across Texas.278
DSHS Strategic Plan for 2023-2027, Part II F-43
The typical state supported living center RN is about 48 years of age and has an average of approximately nine years of service.279
The turnover rate for these RNs is considered high at about 21 percent. Turnover is especially high at the El Paso State Supported Living Center at approximately 41 percent and the San Antonio State Supported Living Center at about 34 percent.280
In addition, HHS finds it difficult to fill these vacant nurse positions. With a vacancy rate of approximately 18 percent, RN positions often remain open for more than six months before being filled. Some facilities are experiencing even longer vacancy durations. At the Brenham and Denton state supported living centers, it takes about nine months to fill a vacancy.281
Registered Nurses at State Hospitals About 41 percent of System RNs (649 RNs) work at state hospitals across the Texas, providing frontline medical care of patients. They provide medications, primary health care and oversee psychiatric treatment.282
System nurses at state hospitals are generally required to work varied shifts and weekends. The work requires special skills and staff often work long hours with minimal staffing. The work is also physically demanding, making it increasingly more difficult for the workforce to keep up with these work demands. All of these job factors contribute to higher-than-average turnover rates. Turnover for these RNs is considered very high at about 32 percent. Turnover is over 40 percent at the El Paso Psychiatric Center, the Rusk State Hospital, the Terrell State Hospital, and the Waco Center for Youth.283
The typical RN at a System state hospital is about 48 years of age and has an average of approximately 10 years of service.284
At these state hospitals, there are always vacant nursing positions that need to be filled. These RN positions often remain open for about six months before being filled. Some hospitals are experiencing longer vacancy durations. At the Big Spring State Hospital, the Rusk State Hospital, and the Waco Center for Youth, it takes about eight months to fill a position.285
Public Health Registered Nurses Approximately 57 System RNs provide direct care and population-based services in the many counties in Texas that have no local health department, or where state support is needed. 286 287 These RNs are often the individuals who are on the frontline in the delivery of public health services to rural communities throughout the state. These nurses serve as consultants and advisors to county, local, and stakeholder groups, and educate community partners. These RNs assist in communicable disease investigation, control and prevention, and are critical to successful public health preparedness and response throughout the state.
Public Health RNs have, on average, seven years of service, with an average age of 48 years.288
DSHS Strategic Plan for 2023-2027, Part II F-44
Overall turnover for these RNs is about 19 percent. Certain areas of Texas experienced higher turnover than others, including those in the Lubbock area at 44 percent and the El Paso area at 67 percent.289
Licensed Vocational Nurses There are 870 licensed vocational nurses (LVNs) employed by HHS. The majority of these employees (about 97 percent) work at state hospitals and state supported living centers across Texas.290 291
About three percent work in Public Health Regions and central office program support, assisting in communicable disease prevention and control and the delivery of population-based services to individuals, families, and communities.292
On average, HHS LVNs are 47 years of age and have nine years of service.293
As with RNs, the nursing shortage is also impacting the HHS’ ability to attract and retain LVNs. Turnover for LVNs is currently high at about 29 percent.294
Currently, the average annual salary for System LVNs during fiscal year 2021 was $42,444.295 This salary falls below both national and state averages for this occupation. Nationally, the average annual earnings for licensed practical nurses and LVNs is $ 51,850, and $ 50,220 in Texas.296 The SAO 2020 market index analysis found the average state salary for LVN Is was 14 percent behind the market rate, and the salary for LVN IIs were 13 percent behind the market rate.297
Recruitment and retention of these highly skilled employees remains a significant challenge.
Licensed Vocational Nurses at State Supported Living Centers There are 469 LVNs employed at HHS state supported living centers across Texas. These LVNs are, on average, 47 years of age and have an average of approximately nine years of service.298
Turnover for LVNs at state supported living centers is very high at about 30 percent. The state supported living centers experienced the loss of 166 LVNs in fiscal year 2021. Turnover is extremely high at the El Paso State Supported Living Center at 72 percent and the Corpus Christi Bond Homes at 57 percent.299
With a very high vacancy rate of about 35 percent, vacant positions often go unfilled for over seven months. Some centers are experiencing even longer vacancy durations. At the Brenham, Denton, and San Angelo state supported living centers it takes about 10 months to fill a position.300
Licensed Vocational Nurses at State Hospitals There are approximately 372 LVNs employed at HHS state hospitals and centers across Texas.301
On average, a state hospital LVN is about 47 years of age and has nine years of service.302
DSHS Strategic Plan for 2023-2027, Part II F-45
Turnover for these LVNs is high at about 27 percent. Turnover is especially high at Rusk State Hospital (at 43 percent) and the San Antonio State Hospital at 35 percent.303
State hospitals continue to experience difficulty in recruiting and retaining qualified staff which can be attributed to a shortage in the qualified labor pool. Market competition and budget limitations significantly constrain the ability of state hospitals to compete for available talent.
Licensed Vocational Nurses in Public Health Roles About three percent of System LVNs (29 LVNs) work in the Public Health Regions across Texas.304
They have, on average, 11 years of service, with an average age of about 50 years.305 The overall turnover for these LVNs is high, at about 17 percent, though slightly below the state average rate of 21.5 percent.306 307
Retention is expected to remain an issue as employment of LVNs is projected to grow nine percent from 2020 to 2030, about as fast as the average for all occupations. Budgetary limitations will continue to make it difficult for the System to offer competitive salaries.308
Nurse Practitioners HHS employs 90 nurse practitioners throughout the System.309 310 Under the supervision of a physician, 51 of these nurse practitioners are responsible for providing advanced medical services and clinical care to individuals at state hospitals and those who reside in state supported living centers across Texas.311
These highly skilled employees have, on average, 10 years of service, with an average age of 49. Approximately 40 percent of these employees have 10 years or more of service.312
System nurse practitioners earn an average annual salary of $118,202.313 This salary falls slightly below the market rate. The SAO 2020 market index analysis found the average state salary for nurse practitioners was about 10 percent behind the market rate for the Advanced Practice Registered Nurse I and about four percent behind the market rate for the Advanced Practice Registered Nurse II.314 Recruitment and retention of nurse practitioners continue to be challenging for state supported living centers, which are also competing with private sector salaries.
The turnover rate for nurse practitioners is well-managed at about 11 percent.315 About 11 percent of nurse practitioners are currently eligible to retire, with this number increasing to 22 percent in the next five years.316
Nurse Practitioners at State Supported Living Centers HHS employs 38 nurse practitioners at state supported living centers across Texas.317 These highly skilled employees have, on average, eight years of service, with an average age of 47.318
DSHS Strategic Plan for 2023-2027, Part II F-46
The overall turnover rate for these nurse practitioners is high at about 19 percent.319
Nurse Practitioners at State Hospitals HHS employs 51 nurse practitioners at state hospitals across Texas.320
These employees have, on average, 11 years of service, with an average age of 50.321
About 10 percent of these highly skilled employees are currently eligible to retire. This number will increase to approximately 26 percent retirement eligibility in the next five years.322
Expansion projects at certain state hospitals will require additional clinical and non-clinical professional staff in Kerrville, San Antonio and at the North Texas State Hospital - Vernon Campus. These projects are expected to increase the demand for employees in positions that are already at critical shortage levels.
Pharmacists HHS employs 105 pharmacists, with an average annual salary of $106,766.323 This salary falls significantly below the market rate. The average annual salary for pharmacists nationally is $125,690 and $127,320 in Texas.324 In addition, the SAO 2020 market index analysis found the average state salary for Pharmacist Is 15 percent behind the market rate, and Pharmacist IIs at five percent behind the market rate.325 This disparity is affecting the System’s ability to recruit qualified applicants for open positions. Pharmacist positions often remain unfilled for over three months.326 Though pharmacist turnover is only moderately high at 14 percent, a significant number of pharmacists are nearing retirement age (or have already retired and returned to work), and over 20 percent will be eligible to retire in the next five years.327 328 Recruitment and retention of these highly skilled employees will continue to be a problem for the System.
Pharmacists at State Supported Living Centers About 45 percent of System pharmacists (47 employees) work at HHS state supported living centers. The typical pharmacist at these facilities is about 47 years of age and has an average of seven years of service.329 Turnover for these pharmacists is currently moderately high at about 12 percent, though some Centers are experiencing much higher turnover, including the Lufkin State Supported Living Center at 75 percent and the Abilene State Supported Living Center at 25 percent.330 HHS may face significant recruitment challenges in the next few years to retain these highly skilled employees who will be eligible for retirement. Though only six percent of these employees are currently eligible to retire, 17 percent them will be eligible in the next five years.331
DSHS Strategic Plan for 2023-2027, Part II F-47
Pharmacists at State Hospitals There are 33 System pharmacists working in state hospitals across Texas. These highly skilled employees are essential to the timely filling of prescribed medications for patients in state hospitals. The majority of these employees are in Pharmacist II positions (23 employees or 70 percent).332 These pharmacists play a key role in the monitoring of costs and inventory of medications, and in the ongoing monitoring of in-patients’ medication histories, needs and potential adverse drug issues. They provide important clinical consultation to psychiatrists and physicians regarding complex medical and psychiatric conditions that may be intractable to traditional medication treatment interventions. The typical pharmacist at a state hospital is about 48 years of age and has an average of 10 years of service. About 39 percent of these employees have 10 or more years of service.333 Turnover for these pharmacists is currently high at about 22 percent, with positions often remaining unfilled for nearly four months before being filled.334 335 Some state hospitals are experiencing much higher turnover. With 22 percent of these pharmacists currently eligible to retire, and 38 percent eligible to retire in the next five years, HHS will need to develop creative recruitment strategies to replace these skilled and highly tenured employees.336
Pharmacy Technicians There are 73 pharmacy technicians in HHS, with the majority (99 percent) employed in state hospitals and state supported living centers across the state.337 These employees assist pharmacists in various technical aspects of preparation of non-routine medication orders for passes, furloughs and discharges. They fill medication carts, maintain required medication stock for after-hours pre-packaging and labeling unit-dose and multiple dose medication orders, perform courier and drug delivery duties, and inspect medication rooms for out-of-date merchandise and appropriateness of stock.
System pharmacy technicians earn an average annual salary of $29,057, which is below the average national wage of $37,970, and lower than the Texas average wage of $38,330.338 339 This salary also falls below the market rate. The SAO 2020 market index analysis found the average state salary for Pharmacy Technician Is to be 14 percent behind the market rate and Pharmacy Technician IIs to be seven percent behind the market rate.340
Turnover for these pharmacy technicians is very high at 37 percent.341 With a high vacancy rate of 41 percent, pharmacy technician positions often remain unfilled for over five months before being filled.342
DSHS Strategic Plan for 2023-2027, Part II F-48
Pharmacy Technicians at State Supported Living Centers About 48 percent of HHS pharmacy technicians (35 employees) work at state supported living centers across Texas.343
The typical pharmacy technician at these facilities is about 45 years of age and has an average of nine years of service.344
Turnover for these pharmacy technicians is high at about 26 percent, reflecting the loss of about 10 workers during fiscal year 2021. Turnover rates by location ranged from 0 percent at the San Antonio State Supported Living Center to 100 percent at the Lufkin State Supported Living Center.345
Pharmacy technician positions often remain open for months before being filled. At the Denton State Supported Living Center, positions have remained vacant for an average of six months.346
Pharmacy Technicians at State Hospitals There are 37 pharmacy technicians working at HHS state hospitals, with about 68 percent employed in Pharmacy Technician II positions.347
These employees have, on average, nine years of service, with an average age of 43.348
Turnover for these pharmacy technicians is very high at about 32 percent. Big Springs State Hospital experienced one of the highest turnover rates at 73 percent.349
The vacancy rate for these positions is high, at about 18 percent, with positions often remaining unfilled for over five months.350
HHS may face significant recruitment challenges in the next few years, as 16 percent of these employees will be eligible for retirement in the next five years.351
Dentists at State Supported Living Centers The demand for dentists nationwide is expected to increase as the overall population ages. Employment of dentists is projected to grow by eight percent through 2030.352
The System employs a total of 30 dentists across the state.353 Of the 30 dentists employed by the System, a little over half (53 percent) provide advanced dental care and treatment for residents living at the HHS supported living centers across Texas. The typical dentist at these facilities is about 55 years of age and has an average of 12 years of service.354
Facility dentists earn an average salary of $143,074, which is below the national average wage of $167,160, and lower than the Texas average wage of $150,060.355 356
Turnover for these dentists is high at about 27 percent.357 State supported living centers face challenges competing with private sector salaries to fill current vacancies.
DSHS Strategic Plan for 2023-2027, Part II F-49
It is anticipated that HHS will face significant recruitment challenges in the next few years to replace these highly skilled employees who will be eligible for retirement. About 19 percent of these employees are currently eligible to retire, and this number will increase to about 38 percent in the next five years.358
Dental Assistants There are 21 Dental Assistant Is and IIs working in the state hospitals and state supported living centers, with IIs make up 86 percent of the total.359 These assistants prepare treatment areas, assist dentists with instrumentation, and instruct staff, guardians, or patients regarding treatment and hygiene.
Dental assistants have, on average, 11 years of service, with an average age of 47 years of age. Over 76 percent have five or more years of service.360
Dental assistants make an average salary of $30,727, which is below the national wage of $42,510 and state wage of $38,370 average salaries.361
Turnover for dental assistants is much lower than the state average, at only nine percent.362 363 There were no vacancies for dental assistants in fiscal year 2021.364
Nineteen percent of dental assistants are eligible to retire this year, and over 29 percent will be eligible to retire in five years.365
Physicians There are currently about 256,670 active physicians across the country.366
HHS employs 95 physicians, with 71 percent employed in HHS state supported living centers, state hospitals.367
These highly skilled employees have, on average, nine years of service, with an average age of 57. About 37 percent of these employees have 10 years or more of service.368
System physicians are currently earning an average annual salary of $194,982.369 This salary is below the average nationally wage of $231,500 and lower than the Texas average wage of $237,890.370 The SAO 2020 market index analysis found the average state salary for Physicians to be six to 10 percent behind the market rate.371
Turnover for these physicians is currently moderately high at 13 percent, though positions are remaining vacant for an average of more than six months.372 373
About 17 percent of these highly skilled and tenured employees are currently eligible to retire, with this number increasing to 37 percent in the next five years.374
Physicians at State Supported Living Centers There are 41 physicians working at state supported living centers across Texas.375 Full staffing of these positions is critical to direct-care services.
These physicians have, on average, eight years of service, with an average age of 58.376 Local physicians who have established long term private practices often apply
DSHS Strategic Plan for 2023-2027, Part II F-50
as a staff physician at state supported living centers late in their career to secure retirement and insurance benefits, thus explaining the reason for the high average age.
Turnover for these physicians is moderately high at 14 percent.377
To meet the health needs of individuals residing in state supported living centers, it is critical that HHS recruit and retain qualified physicians. However, due to the short supply and large demand, state supported living centers are experiencing difficulty hiring physicians, with positions remaining unfilled for an average of almost seven months.378
Physicians at State Hospitals There are currently 26 physicians at HHS who are providing essential medical care in state hospitals.379 They take the lead role in diagnosing, determining a course of treatment, making referrals to outside medical hospitals, prescribing medications and monitoring the patients’ progress toward discharge. Physician services in state hospitals are essential to the ongoing monitoring and management of an increasing number of complex chronic medical conditions, such as diabetes, seizure disorders, hypertension and chronic obstructive pulmonary disease (COPD). These employees are critical to the System’s preparedness and response to medical services provided by the state and to major public health initiatives, such as obesity prevention, diabetes, disease outbreak control and others.
These physicians have, on average, 13 years of service, with an average age of about 57. Local physicians who have established long term private practices often apply as physicians at state hospitals late in their working career to secure retirement and insurance benefits, contributing to the high overall age. More than 40 percent of the full-time physicians are 50 years of age or older.380
Turnover for these physicians is currently low at eight percent, though it takes about nine months to fill a state hospital physician position with someone who has appropriate skills and expertise.381 382
In addition, HHS may face significant challenges in the next few years to replace those employees who are eligible for retirement. About 31 percent of these highly skilled and tenured employees are currently eligible to retire. Within five years, about 46 percent will be eligible to retire.383 If these employees choose to retire, HHS will lose some of the most experienced medical personnel – those with institutional knowledge and skills that will be difficult to match and even harder to recruit.
Psychiatrists There are currently about 25,520 psychiatrists nationwide.384 A 4.5 percent decrease is projected in the state government sector by 2030.385
HHS employs 121 psychiatrists throughout the System, with about 84 percent employed in state hospitals across Texas.386
DSHS Strategic Plan for 2023-2027, Part II F-51
These highly skilled and tenured employees have, on average, 12 years of service, with an average age of 53.387
System psychiatrists currently earn an average annual salary of $247,565.388 The SAO 2020 market index analysis found the average state salary for Psychiatrist IIs and IVs ranged from 14 to 10 percent behind the market rate.389
Turnover for System psychiatrists is currently at about 11 percent.390 The vacancy rate is high at about 20 percent, with positions remaining vacant for an average of seven months.391
About 23 percent of these highly skilled and tenured employees are currently eligible to retire, with this number increasing to 34 percent in the next five years.392
Psychiatrists at State Supported Living Centers There are 16 psychiatrists assigned to state supported living centers.393 Full staffing of these positions is critical to providing psychiatric services needed by residents.
These psychiatrists have, on average, nine years of service, with an average age of 55.394
With a high vacancy rate of 16 percent, vacant positions in state supported living centers go unfilled for about seven months.395
Psychiatrists at State Hospitals There are currently 102 System psychiatrists providing essential medical and psychiatric care in state hospitals.396 These highly skilled employees take the lead role in diagnosing, determining a course of treatment, prescribing medications and monitoring patient progress. Recruiting and retaining psychiatrists at the state hospitals has been especially difficult for HHS.
These psychiatrists have, on average, 13 years of service, with an average age of 53. About 53 percent of these employees have 10 or more years of service.397
Annual turnover for these psychiatrists is currently well-managed at about 10 percent, although much higher rates were reported for Big Springs State Hospital at 42 percent and 19 percent for North Texas State Hospital.398
With an overall high vacancy rate of about 20 percent, most vacant psychiatrist positions go unfilled for over seven months.399 These challenges are expected to continue, as about 26 percent of these highly skilled and tenured employees are currently eligible to retire and may leave at any time. Within five years, this number will increase to 35 percent.400
State hospitals continue to face increasing difficulty in recruiting qualified psychiatrists as salaries are not competitive with the private sector, and there is a general shortage of a qualified labor pool.
Due to the complex medical and mental challenges that individuals residing in state hospitals exhibit, it is critical that HHS is able to effectively recruit and retain qualified psychiatrists.
DSHS Strategic Plan for 2023-2027, Part II F-52
Psychologists There are 43 psychologists in HHS, with 72 percent employed in state hospitals across the state.401
System psychologists earn an average annual salary of $84,883.402 This salary falls below the market rate. The SAO 2020 market index analysis found the average state salary for Psychologist Is to be 11 percent behind the market rate and Psychologist IIIs to be eight percent behind the market rate.403
Turnover for these psychologists is very high at 37 percent. With a high vacancy rate of 41 percent, psychologist positions often remaining unfilled for over five months.404 405
Psychologists at State Hospitals There are 31 psychologists working at HHS state hospitals, with about 65 percent employed in Psychologist II positions.406 Full staffing of these positions is critical to providing needed psychological services to patients.
State hospital psychologists play a key role in the development of treatment programs for both individual patients and groups of patients. Their evaluations are critical to the ongoing management and discharge of patients receiving competency restoration services, an ever-growing patient population in the state hospitals. They also provide testing and evaluation services important to ongoing treatment, such as the administration of IQ, mood, and neurological testing instruments.
These highly skilled and tenured employees have, on average, 11 years of service, with an average age of 51.407
Turnover for these psychologists is very high at about 36 percent. Rio Grande State Center experienced the highest turnover at 80 percent.408
The vacancy rate for these positions is very high, at about 34 percent, with positions often remaining unfilled for over six months.409
HHS may face significant recruitment challenges in the next few years, as 13 percent of these highly skilled and tenured employees are currently eligible for retirement and may leave HHS at any time.410
Behavioral Health Specialists There are 130 behavioral health specialists within HHS.411 These specialists are employed at state supported living centers across the state, providing behavior support services, including behavior observations, data analysis, training of behavioral interventions, and the modeling of behavior support. Behavior health specialists participate as a member of individuals’ interdisciplinary teams, and are responsible for assisting in the development, implementation, and evaluation of behavior support plans (including comprehensive functional behavioral assessments), staff training, data collection and reporting, and program evaluation.
DSHS Strategic Plan for 2023-2027, Part II F-53
On average, HHS behavioral health specialists are 40 years of age and have about eight years of service. About 28 percent of these employees have 10 or more years of service.412
The turnover rate for these employees is currently high at about 26 percent. Both the Lufkin State Supported Living Center and the Austin State Supported Living Center are experiencing the highest turnover rate, at 44 percent.413
HHS experienced difficulty filling vacant positions. With a high vacancy rate of 17 percent, vacant positions often go unfilled for over four months.414
With 15 percent of these employees eligible to retire in the next five years, HHS will need to develop creative recruitment strategies to replace these skilled employees.415
Mental Health Specialists There are 33 mental health specialists within HHS.416 These specialists are employed at state hospitals across the state, performing psychological testing, assessments, group therapies, counseling, reporting and data collection. They participate in Program Recovery Teams, with duties of coordinating recovery planning.
On average, HHS mental health specialists are 41 years of age and have about eight years of service. About 21 percent of these employees have 10 or more years of service.417
The turnover rate for HHS mental health specialists is high at about 21 percent, reflecting the loss of about eight specialists during fiscal year 2021. Turnover rates by location ranged from 0 percent at the Austin State Hospital to 45 percent at the North Texas State Hospital.418
With a very high vacancy rate of 31 percent, vacant positions often go unfilled for more than six months.419
With 18 percent of these employees eligible to retire in the next five years, HHS will need to develop creative recruitment strategies to replace these skilled employees.420
Epidemiologists HHS employs 127 epidemiologists who provide services in the areas of infectious disease and injury control, chronic disease control, emergency and disaster preparedness, disease surveillance and other public health areas.421 They provide critical functions during disasters and pandemics and other preparedness and response planning.
As of May 2021, there were approximately 8,180 epidemiologist jobs in the U.S., with a projected job growth rate of 10 percent by 2030.422
On average, System epidemiologists have about six years of service, with an average age of approximately 35 years.423
DSHS Strategic Plan for 2023-2027, Part II F-54
Turnover for System epidemiologists is currently high at about 19 percent. This rate is much higher for experienced Epidemiologist IIIs, at about 22 percent.424
Low pay is a contributing factor in the inability to attract qualified epidemiologist applicants. System epidemiologists are currently earning an average annual salary of $60,312.425 This salary is significantly below the average national wage of $86,740, and also lower than the Texas average wage of $82,810.426 In addition, the SAO 2020 market index analysis found that the average state salary for epidemiologists range from 11 percent (for Epidemiologist Is) to 12 percent (for Epidemiologist IIIs) behind the market rate.427
Currently, only about seven percent of these employees are eligible to retire and this rate will increase in the next five years to 16 percent.428
Surveillance functions involving preparedness, response and monitoring will need more qualified public health professionals i.e., Epidemiologists. Emerging threats will require continuous and agile learning for Epidemiologists in areas such as disease prevention and population health. HHS will need to closely monitor this occupation due to the nationally non-competitive salaries and a general shortage of professionals performing this work.
Sanitarians There are 126 sanitarians employed with HHS, with 73 percent employed within the DSHS Division for Consumer Protection.429 HHS registered sanitarians inspect all food manufacturers, wholesale food distributors, food salvagers in Texas, as well as all retail establishments in the 188 counties not covered by local health jurisdictions and conduct a multitude of environmental inspections such as children’s camps, asbestos abatement, hazardous chemicals/products and many others. Sanitarians are instrumental in protecting the citizens of Texas from food-borne illness and many dangerous environmental situations and consumer products, including imported foods, drugs and consumer products. The U.S. Food and Drug Administration (FDA) and the Consumer Products Safety Commission (CPSC) have little manpower and therefore depend on the state programs to protect citizens. System sanitarians also respond to a variety of emergencies, including truck wrecks, fires, tornados, floods, and hurricanes. They are the first line of defense against a bioterrorist attack on the food supply.
On average, HHS sanitarians are 44 years of age and have about 11 years of service. About 44 percent of these employees have 10 or more years of service.430
Though the turnover rate for HHS sanitarians is currently low at about nine percent, HHS has experienced difficulty filling vacant positions, with vacant positions often going unfilled for over seven months due to a shortage of qualified applicants available for work.431 432
Historically, HHS has faced special challenges filling vacancies in both rural and urban areas of the state. In addition, the state requirement for sanitarians to be registered and have at least 30 semester hours of science (in addition to 18 hours
DSHS Strategic Plan for 2023-2027, Part II F-55
of continuing education units annually) has made it increasingly difficult to find qualified individuals.
With 14 percent of sanitarians currently eligible to retire, and 21 percent eligible to retire in the next five years, HHS will need to develop creative recruitment strategies to replace these skilled and highly tenured employees.433
Health Physicists Within DSHS, there are 51 health physicists, all employed within the Consumer Protection Division.434 These employees plan and conduct complex and highly advanced technical inspections and license application review of radioactive material, nuclear medicine, industrial x-ray units, general medical diagnostic x-ray units, fluoroscopic units, mammographic units, C-Arm units, radiation therapy equipment, laser equipment, and industrial and medical radioactive materials to assure user's compliance with applicable State and Federal regulations. Health physicists are instrumental in emergency planning for the offsite response of nuclear power plants and are the the first line of defense for radiological disaster response.
Health physicists have, on average, 13 years of service, with an average age of 50 years. Over 60 percent of these employees have 10 or more years of service.435
HHS health physicists earn an average annual salary of $60,435 which is higher than both the average national wage of $57,560 and the Texas average wage of $48,200.436 437
Turnover for HHS health physicists is high at 18 percent, though slightly below the state average rate of 21.5 percent.438 439 Vacant positions often go unfilled for over four months due to a small number of qualified applicants.440
Medical Technicians Within HHS, there are 20 medical technicians.441 These workers assist nursing staff with age-appropriate patient care, which includes providing for patient’s personal hygiene; making beds and assisting with preparation of unit’s and patient’s rooms for receiving new patients; taking vital signs; obtaining specimens; cleaning patient care equipment; and transporting patients to and from various departments.
Half of these medical technicians are employed at TCID, with the remaining technicians employed at HHS state hospitals and state supported living centers across Texas.
System medical technicians have, on average, 13 years of service, with an average age of 49 years. About 40 percent of these employees have 10 or more years of service.442
The turnover rate for all System medical technicians is high at 22 percent. This rate is 38 percent for entry-level Medical Technician Is at TCID.443
DSHS Strategic Plan for 2023-2027, Part II F-56
The vacancy rate for System medical technicians is currently high at about 17 percent, though slightly below the state average rate of 21.5 percent.444 445 Vacant positions often remain unfilled for three months.446
HHS medical technicians earn an average annual salary of $28,549.447 The SAO 2020 market index analysis found the average state salary for medical technicians ranged from nine to 10 percent behind the market rate.448 This disparity may be affecting HHS’ ability to recruit qualified applicants for open positions.
Currently, 20 percent of these employees are eligible to retire, with 35 percent of these employees eligible in the next five years.449
Public Health and Prevention Specialists Within HHS, there are 23 public health and prevention specialists employed within the DSHS’ Division for Laboratory and Infectious Disease.450 These employees provide technical consultation to local health departments, human and animal health care professionals, government officials, community action groups, and others on a number of public health areas, including disease epidemiology and surveillance to treat, prevent and control infectious diseases, sexually-transmitted diseases, and zoonotic diseases; provision of vaccines and life-saving HIV medications; and newborn screening testing.
These public health and prevention specialists have, on average, 10 years of service, with an average age of 44 years. Forty-four percent of these employees have 10 or more years of service.451
The overall turnover for these public health and prevention specialists is 17 percent, which is high, though slightly below the state average rate of 21.5 percent.452 453
In addition, this division finds it difficult to fill these vacant public health and prevention specialist positions, which often remain open for over a year before being filled.454
Retention is expected to remain an issue as these employees approach retirement. Twenty-two percent of these public health and prevention specialists are currently eligible to retire, and about 30 percent will be eligible to retire in the next five years.455
Veterinarians There are 18 veterinarians working for DSHS in the Consumer Protection Division, the Division for Laboratory and Infectious Disease Services, and in Public Health Regions across the state.456 System veterinarians perform advanced veterinary work and are responsible for the day-to-day management of the Zoonosis Control Program.
These highly skilled and tenured employees have, on average, 15 years of service, with an average age of 53.457
System veterinarians make $91,544, which is below the average national wage of $109,920 and state wage of $113,720. 458 459 In addition, the SAO 2020 market
DSHS Strategic Plan for 2023-2027, Part II F-57
index analysis found that the average state salary for Veterinarian IIs to be nine percent behind the market rate.460
Turnover for veterinarians is high at 17 percent, though slightly below the state average rate of 21.5 percent.461 462
The agency may face significant recruitment challenges in the next few years to replace these highly skilled and tenured employees who are eligible for retirement. Currently, 17 percent of veterinarians are eligible to retire, and over 50 percent of Veterinarian II’s will be eligible to retire in the next five years.463
Laboratory Staff DSHS operates a state laboratory in Austin and two regional laboratories, one in San Antonio and the other in Harlingen. In addition, the Austin State Hospital provides laboratory services for the other HHS state hospitals and state supported living centers.
While laboratory staff is made up of several highly skilled employees, there are four job groups that are essential to laboratory operations: chemists, microbiologists, laboratory technicians, and medical technologists.
Chemists There are 58 chemists employed in the HHS Division for Laboratory and Infectious Disease Services, all located in Austin.464
HHS chemists are about 44 years of age and have an average of about 11 years of service. Most of the employees have 10 years or more of service.465
The turnover rate for HHS chemists is well maintained at about nine percent annually, which is significantly below the state average turnover rate of 21.5 percent.466 467
Vacant HHS chemist positions often go unfilled for over seven months due to a shortage of qualified applicants available for work.468 These vacancy problems are expected to worsen as employees approach retirement. About 17 percent of these tenured and highly skilled employees are currently eligible to retire, with that number increasing to 26 percent within the next five years.469
Low pay is a factor in the inability to attract qualified chemist applicants. System chemists earn an average annual salary of about $53,722.80.470 The SAO 2020 market index analysis found the average state salary for chemists ranged from eight to 10 percent behind the market rate.471 The average annual national wage is $89,130, and the Texas wage is $88,070.472
Microbiologists There are 148 microbiologists working for HHS, with the majority at the Austin laboratory.473 474
System microbiologists have, on average, 10 years of service, with an average age of about 40 years.475
DSHS Strategic Plan for 2023-2027, Part II F-58
The turnover rate for all System microbiologists is moderately high at about 13 percent, which is below the state average rate of 21.5 percent. The rate is much higher for mid-level Microbiologist IIIs at 21 percent.476 477
System microbiologists earn an average annual salary of $51,865.478 The SAO 2020 market index analysis found the average state salary for Microbiologist IIs was 13 percent behind the market rate and seven percent behind the market rate for Microbiologists IV.479 This average annual salary also falls below the national and statewide market rates for this occupation. The average annual national wage is $87,820, and the Texas wage is $62,350.480 This disparity in earnings is affecting the System’s ability to recruit qualified applicants for open positions. Microbiologist positions often remain unfilled for over seven months.481
In addition, HHS may face significant recruitment challenges in the next few years to replace these highly skilled and tenured employees who are eligible for retirement. Approximately 10 percent of these employees are currently eligible to retire, this rate will increase in the next five years to about 16 percent.482
Laboratory Technicians There are 50 laboratory technicians employed at HHS.483
The typical laboratory technician is about 41 years of age and has an average of nine years of service.484
The turnover rate for System laboratory technicians is high at about 22 percent.485
While the vacancy rate for System laboratory technicians is low, at about six percent, vacant positions often go unfilled for about five months due to a shortage of qualified applicants available for work.486
Low pay is a factor in the inability to attract qualified laboratory technician applicants. HHS laboratory technicians earn an average annual salary of about $34,221.487 The average national wage is $56,910, and the Texas wage is $53,240.488 The SAO 2020 market index analysis found the average state salary for Laboratory Technician Is to IIs ranged from three to 11 percent behind the market rate.489
These problems are expected to worsen as employees approach retirement. About 24 percent of these tenured employees will be eligible to retire in the next five years.490
Medical Technologists Within HHS, there are 62 medical technologists.491 These workers perform complex clinical laboratory work and are critical to providing efficient and quality healthcare.
System medical technologists have, on average, eight years of service, with an average age of 43 years. About 29 percent of these employees have 10 or more years of service.492
The turnover rate for all System medical technologists is currently high at about 20 percent, though slightly below the state average rate of 21.5 percent.493 494
DSHS Strategic Plan for 2023-2027, Part II F-59
The vacancy rate for System medical technologists is at about 10 percent, with vacant positions often going unfilled for over five months due to a shortage of qualified applicants available for work.495
HHS medical technologists earn an average annual salary of $49,960.496 The SAO 2020 market index analysis found the average state salary for medical technologists ranged from nine to 15 percent behind the market rate.497 This disparity is affecting HHS’ ability to recruit qualified applicants for open positions.
Though only about seven percent of these employees are currently eligible to retire, almost 20 percent of these employees will be eligible in the next five years.498
Day Care Inspectors There are 73 day care inspectors within HHS.499 These specialists are responsible for conducting investigations and inspections of unregulated child care facilities and conducting parent and provider trainings related to the benefits of regulation.
The typical day care inspector is about 40 years of age and has an average of seven years of service. Nearly 20 percent of these employees have 10 or more years of service.500
These day care inspectors earn an average annual salary of $41,048.501 This salary is below the average national wage of $78,740, and lower than the Texas wage of $76,510.502 In addition, the SAO 2020 market index analysis found the average state salary for Inspector IIIs to be six percent behind the market rate and Inspector Vs to be two percent behind the market rate.503 This disparity may be affecting HHS’ ability to recruit qualified applicants for open positions.
Turnover for these inspectors is high at 19 percent, though slightly below the state average rate of 21.5 percent.504 505 With a vacancy rate of about 11 percent, vacant positions often go unfilled for about four months due to a shortage of qualified applicants available for work.506
Health Facility Social Services Surveyors The HHS System employs 23 health facility social services surveyors.507 These employees are responsible for planning, organizing, and conducting investigations in Long Term Care facilities to determine compliance with state and federal laws, regulations, and rules.
The typical health facility social services surveyor is about 54 years of age and has an average of 11 years of service. Nearly 44 percent of these employees have 10 years or more of service.508
The overall turnover rate for these surveyors is high at about 25 percent annually, which is slightly above the state average turnover rate of 21.5 percent.509 510
With a high vacancy rate of 23 percent, health facility social services surveyor positions often go unfilled for six months due to a shortage of qualified applicants available for work.511 These vacancy concerns are expected to worsen as employees approach retirement. About 35 percent of these employees are currently eligible to
DSHS Strategic Plan for 2023-2027, Part II F-60
retire, and about 39 percent of these tenured employees will be eligible to retire in the next five years.512
Qualified Intellectual Disability Professionals There are 250 qualified intellectual disabilities professionals employed by HHS, with the 99 percent housed in state supported living centers across the state.513 These qualified intellectual disabilities professionals are responsible for the development, implementation, monitoring, and revision of highly individualized Personal Support Plans for residents which promote dignity, respect, choice, and the exercising of personal rights for each person who is on their assigned caseload.
The typical qualified intellectual disabilities professional at these facilities is about 41 years of age and has an average of nine years of service. About 36 percent of these professionals have 10 or more years of service.514
Turnover for the qualified intellectual disabilities professional job family is high at 19 percent, reflecting the loss of 51 professional during fiscal year 2021. Turnover was highest at the Lufkin State Support Living Center at 37 percent and the Corpus Christi State Supported Living Center at 29 percent.515
Blind Children Specialists HHS employs 14 Blind Children Specialist Is.516 These specialists all work within the Rehabilitative and Independence Services section of HDIS. These specialists are responsible for assisting blind children and their families with counseling, information, support, training, and guidance that foster vocational discovery and development using the agency's employment lifestyle philosophy while promoting the blind or visually impaired child’s self-sufficiency.
The typical Blind Children Specialist I is about 40 years of age and has an average of only three years of service. Seventy-nine percent of these specialists have less than two years of service.517
Turnover for these specialists is high at 19 percent, though slightly below the state average of 21.5 percent.518 519 With a high vacancy rate of 22 percent, vacant positions often go unfilled for about four months due to a shortage of qualified applicants available for work.520
Since these employees require a nine-month probationary training period, all resignations are costly to the program. Their knowledge and skill level are critical to the delivery of quality services to children and families.
Rehabilitation Therapy Technicians There are approximately 571 rehabilitation therapy technicians employed across Texas in the state hospitals and state supported living centers. Technician Vs make up most of this job family at 33 percent. Many of the technicians perform entry-level habilitative and rehabilitative therapy work. Some of their essential job functions include studying clients’ behavior to determine the need for therapeutic activities and writing progress notes and assisting clients with instructions for their
DSHS Strategic Plan for 2023-2027, Part II F-61
selected therapeutic activities such as arts, crafts, drama, music, printing, sewing and recreation. Higher level technicians at state hospitals may be responsible for developing a comprehensive, structured, hospital-wide recreational activity program.521
The U.S. Bureau of Labor Statistics estimates that about 11,200 openings for these types of positions are projected each year until 2030 as many of the vacancies are expected to come from workers who transfer to different occupations or retire.522
The average rehabilitation therapy technician is 43 years of age with, on average, 11 years of service. Forty-five percent of technicians have 10 or more years of service.523
The average salary for Rehabilitation Therapy Technician Is is $22,171.524 Technician IIIs earn $27,429 per year and Technician Vs make the most at $32,306 annually.525 Rehabilitation counselors, which is the most similar profession in U.S. Bureau of Labor Statistics’ categories, make an average national wage of $44,740, and Texas wage of $43,610.526
The turnover rate for these technicians is 28 percent, higher than the state average rate of 21.5 percent. 527 528 Rehabilitation Therapy Technician Is have the highest turnover rate at 55 percent.529 The Technician Is had the highest vacancy rate at 47 percent.530 Over 25 percent of rehabilitation therapy technicians are eligible to retire in five years.531
Rehabilitation Therapy Technicians at State Hospitals There are 293 rehabilitations therapy technicians working in state hospitals, with 34 percent classified as Technician IIs. There are 126 who work at the North Texas State Hospital; the Waco Center for Youth has the smallest group with six technicians on staff. The average technician working at the state hospitals is 42 years of age with 11 years of service.532
The turnover rate for state hospital rehabilitation technicians is high at 21 percent, with Kerrville State Hospital experiencing the highest turnover at 39 percent.533 Austin State Hospital has the lowest turnover rate at 13 percent.534 The vacancy rate is 16 percent, and it can take almost six months to fill these vacancies.535
Rehabilitation Therapy Technicians at State Supported Living Centers The state supported living centers employs 571 rehabilitation therapy technicians. The Denton Sate Supported Living Center has the largest group, with 80 technicians, while the Rio Grande State Center has the smallest, with 17 technicians.536
On average, these rehabilitation therapy technicians are about 44 years of age and have 11 years of service.537
The overall turnover rate for these technicians is very high at 31 percent.538 The vacancy rate for these positions is also high at 24 percent.539
DSHS Strategic Plan for 2023-2027, Part II F-62
Health Assistants There are 103 health assistants employed in the HHS system, with 98 percent working in state supported living centers. The remaining two percent work at the North Texas State hospital. Some of the health assistants’ essential job functions include assisting with performing diagnostic and treatment functions, assisting with research projects and program evaluations, and gathering information and data from direct care and clinical staff. They may also administer or assist with various behavioral and psychiatric assessments as deemed necessary by a specialist or analyst. The average health assistant is about 38 years of age and has an average of 10 years of service.540 System health assistants earn an average salary of $31,592 per year.541 This is lower than the national average wage of $35,850 and Texas average wage of $34,660.542 Turnover for health assistants is 22 percent, slightly higher than the state average rate of 21.5 percent, reflecting a loss of 24 workers during fiscal year 2021. Richmond State Supported Living Center had the highest turnover rate at 61 percent, followed by San Angelo State Supported Living Center at 56 percent.543 544 The vacancy rate for health assistants is well-managed at 11 percent. Denton State Supported Living Center had the highest vacancy rate at 25 percent. It often takes over four months to fill vacant positions in that area.545
Human Services Specialists There are 83 human services specialists employed within the system. Over 42 percent work in HDIS. The specialists have various responsibilities, including determining eligibility and need for Personal Care Services and Community First Choice. They may provide case management consultation, assessment and services for children and families who have health risks, conditions, or special health care needs.546 The typical human services specialist is about 48 years of age and has an average of 11 years of service. Over 70 percent of these specialists have five or more years of service.547 Human services specialists earn an average salary of $43,926, with Human Services Specialist VIIs, who make up 63 percent of this group, earning $45,848.548 According to the Bureau of Labor Statistics, the average national wage for health education specialists and community health workers is $48,140.549
The average turnover rate for this group is moderately high at 12 percent, though lower than the state average rate of 21.5 percent, with Human Services Specialist IVs experiencing the highest turnover at 27 percent.550 551 With a high vacancy rate of 15 percent, vacant positions have remained unfilled for over six months.552
DSHS Strategic Plan for 2023-2027, Part II F-63
HHS will need to prepare recruitment strategies for these specialists, as 16 percent of them are currently eligible to retire, and 28 percent will be eligible in the next five years.553
Human Services Technicians There are 24 human services technicians employed within the Health and Specialty Care System (HSCS), with the 75 percent housed in Corpus Christi Bond Homes.554 These technicians are responsible for the daily supervision and care of assigned individuals, and focus on training, implementing, and monitoring assigned Person Support Plan activities. These technicians also support and encourage families during the treatment process, performing work as a family partner, engaging families during the admission process, answering questions about the process, encouraging participation in treatment and helping families make informed decisions about recovery.
The typical HSCS human services technician is about 49 years of age and has an average of 10 years of service. Fifty percent of these technicians have 10 or more years of service.555
Turnover for these technicians is very high at 30 percent, with all these losses occurring at Corpus Christi Bond Homes.556
This high turnover may be due to the large disparity between private sector and HHS salaries. The average annual salary for HSCS Human Services Technician I through III is $26,328, which falls below the market rate.557 The SAO 2020 market index analysis found that the average state salary for Human Services Technician IIs to be 10 percent behind the market rate.558
These problems are expected to worsen as tenured employees approach retirement. About 17 percent of these employees are currently eligible to retire, with that number increasing to 38 percent in the next five years.559
Research Specialists HHS employs 125 research specialists throughout the System.560 These research specialists are responsible for providing statistical and programming work critical to supporting the services the agencies provide.
These employees have, on average, 11 years of service, with an average age of 42. Approximately 47 percent of these employees have 10 years or more of service.561
HHS research specialists earn an average annual salary of $59,588.562 The SAO 2020 market index analysis found the average state salary for research specialists ranged from about eight to 13 percent behind the market rate for Research Specialists I - III.563 Recruitment and retention of research specialists continue to be challenging for HHS, who is also competing with other public and private sector salaries.
The turnover rate for research specialists is about 18 percent, with turnover slightly higher in the DSHS Division for Laboratory and Infectious Disease at 22 percent.564
DSHS Strategic Plan for 2023-2027, Part II F-64
The vacancy rate for research specialists is high at approximately 17 percent, with positions remaining unfilled for over three months.565
About 12 percent of research specialists are currently eligible to retire, with this number increasing to 22 percent in the next five years.566
Training Specialists There are 17 Training Specialist IIIs, IVs, and Vs employed within HDIS. They develop, implement, and evaluate training programs, as well as develop methods for assessing and evaluating the effectiveness of training. About 53 percent of these employees are Training Specialist Vs.567
Training specialists in this area have, on average, nine years of service, with an average age of 48. Over 64 percent of these employees have five or more years of service.568
These training specialists earn an average annual salary of $57,399, which is, according to the SAO’s most recent classification report, up to 14 percent behind the market rate.569 570
Human Resources Specialists HHS employs 37 human resources specialists who provide support services to over 36,000 HHS employees.571 Human Resources (HR) is a core business area of HHS and has quickly established itself as an HHS strategic business partner.
HR has evolved and now plays an important role in strategic planning, employee engagement, recruitment and onboarding, legal and regulatory compliance, a change agent, training partner, and data steward.
Although the role of human resources has evolved, the average annual salary paid to HHS human resources staff falls below the average annual salary of many of the same classified positions in other state agencies of similar size and organizational structure. HHS human resources specialists are currently earning an average annual salary of $55,941.572 The SAO 2020 market index analysis found that the average state salary for human resources specialists range from seven percent for Human Resources Specialist IIIs to fifteen percent for Human Resources Specialist IIs behind the market rate.573 In addition, the salary paid to HHS human resources specialists is significantly below the average national wage of $70,720, and also lower than the Texas average wage of $69,360.574
As of May 2021, there were approximately 674,800 human resources specialist jobs in the U.S., with a projected job growth rate of 10 percent from 2020 to 2030, about as fast as the average for all occupations.575
On average, HHS human resources specialists have about eleven years of service, with an average age of approximately 47 years.576
Turnover for HHS human resources specialists is currently high at about 25 percent, with System Support Services Division experiencing the highest turnover rate at 23 percent.577
DSHS Strategic Plan for 2023-2027, Part II F-65
Currently, about 11 percent of these employees are eligible to retire. This rate is expected to increase in the next five years to about 22 percent.578
Administrative Assistants HHS employs 1,213 administrative assistants who provide office support services to the various HHS program areas.579
The turnover rate for HHS administrative assistants is moderately high at about 16 percent.580 Although the overall vacancy rate is high at 14 percent, AES experienced the highest vacancy rate at 31 percent, with positions remaining unfilled for over five months.581 582
The average annual salary paid to HHS administrative assistants falls below the average annual salary of many of the same classified positions in other state agencies of similar size and organizational structure. HHS administrative assistants are currently earning an average annual salary of $33,944.583 The SAO 2020 market index analysis found that the average state salary for administrative assistants range from six percent for Administrative Assistant IVs to 12 percent for Administrative Assistant Is behind the market rate.584 In addition, the salary paid to HHS administrative assistants is significantly below the average national wage of $42,250, and also lower than the Texas average wage of $38,110.585
On average, HHS administrative assistants have about 13 years of service, with an average age of approximately 48 years.586
About 17 percent of these employees are currently eligible to retire. This rate is expected to double to about 34 percent within the next five years.587
Managers Managers perform a variety of high-level task throughout the system. There are 1,204 managers employed by the system, with a moderately high turnover rate of 13 percent.588 589
Though turnover is consistent for managers throughout the system, there are certain areas that vary, both higher and lower.
In DSHS’s Community Health Improvement Division, the turnover rate was high at 23 percent (nine separations), higher than the state average rate of 21.5 percent. Other areas of note include the DSHS Laboratory and Infectious Disease Services Division at 19 percent (seven separations); Information Technology (IT) at 16 percent (nine separations), and System Support Services at only seven percent (two separations).590 591
The vacancy rate for System managers is 10 percent, which is also consistent among most areas, but with a few notable exceptions. In the Regulatory Division, the vacancy rate is much lower, at five percent, with only seven losses. On the other hand, IT had a higher than average vacancy rate at 19 percent.592
DSHS Strategic Plan for 2023-2027, Part II F-66
IT Business Analysts Within the IT Division, there are 20 Business Analyst IIs and IIIs.593 This group of business analysts provide critical support to the agency and some of their responsibilities include the gathering, assessment and validation of business requirements, while providing assistance to development team members and support to application users.
These business analysts have, on average, six years of service, with an average age of 46 years. About 50 percent of these employees have five or more years of service.594
IT Business Analyst IIs and IIIs earn an average annual salary of $79,327.595 This is below the national average wage of $102,210 and Texas average wage of $105,130.596 This disparity may be affecting HHS’ ability to recruit qualified applicants for open positions.
The turnover rate for these business analysts is moderately high at 16 percent.597
The vacancy rate for these positions is 13 percent, with positions remaining unfilled for over three months. 598
IT System Analysts The IT Division employs 465 system analysts.599 This group of system analysts provide technical support, analyze business requirements and procedures, and collaborate with vendors, business providers, and application teams. These positions provide critical support to the IT division and HHS system.
This group of analysts are, on average, 50 years of age and have an average of 12 years of service. Over 45 percent of these employees have 10 or more years of service.600
Turnover for these analysts is currently well-managed at 10 percent, though with a vacancy rate of 16 percent, it often takes up to four months to fill vacant positions.601 602
These system analysts earn an average annual salary of $77,960.603 This is below the national average wage of $102,210 and Texas average wage of $105,130.604
HHS will need to focus on creative recruiting and retention strategies, since 30 percent of employees will be eligible to retire in the next five years.605
System Support Specialists Within the IT Division, there are 57 System Support Specialist IVs.606 These workers perform various functions, such as software installations, troubleshooting/diagnosing complex hardware, software, and network performance problems, in addition to interpreting technical documents for users. This group of employees provide essential technical support to the agency.
DSHS Strategic Plan for 2023-2027, Part II F-67
These System Support Specialist IVs have, on average, 17 years of service, with an average age of 46 years. Over 63 percent of these employees have 10 or more years of service.607
The turnover rate for System Support Specialist IVs is below the state average at 12 percent.608 609 The vacancy rate is currently low at eight percent, though vacant positions often remain unfilled for four months.610
IT System Support Specialist IVs earn an average annual salary of $47,328.611 The SAO 2020 market index analysis found the average state salary for System Support Specialist IVs to be $58,800.612 This disparity may be affecting HHS’ ability to recruit qualified applicants for open positions in a timely manner.
Currently, 16 percent of these employees are eligible to retire, and over 42 percent will be eligible within the next five years.613
Cybersecurity Analysts There are 10 cybersecurity analysts employed within the IT Division.614 These employees provide direction and guidance in strategic and tactical cybersecurity operations. They protect cybersecurity assets, deliver cybersecurity incident detection, and monitor cybersecurity alerts using advanced information systems. Cybersecurity analysts play a critical role in protecting the agency’s data.
Cybersecurity analysts have, on average, eight years of service, with an average age of 48 years of age. Over 30 percent of these employees have 10 or more years of service.615
HHS cybersecurity analysts earn an average annual salary of $110,978 which is below the average national wage of $113,270, but higher than the Texas average wage of $101,800.616 617
The turnover for cybersecurity analysts is high at 19 percent, though slightly below the state average of 21.5 percent.618 619
HHS will need to develop creative retention strategies to keep these highly skilled employees in a competitive field.
Database Administrators There are 29 database administrators working in the IT Division.620 Some of their job responsibilities include designing, developing, maintaining, and improving database solutions for the agency. They also are responsible for performing advanced logical database administration and development. These workers provide critical support to various areas of the agency.
These highly skilled employees have, on average, nine years of service, with an average age of 52.621
HHS database administrators earn an average annual salary of $93,487, which is below the national average wage of $96,550 and Texas average wage of $98,910.622 623
DSHS Strategic Plan for 2023-2027, Part II F-68
Turnover for database administrators is high at 17 percent, though slightly below the state average rate of 21.5 percent.624 625 In addition, the vacancy rate for these positions is also high at 22 percent, with position often going unfilled for almost three months.626
Due to the high vacancy rate, the agency will need to make special efforts to recruit adept workers in Texas’ growingly competitive IT field.
Information Technology Security Analysts There are 20 IT security analysts within the IT Division.627 These are key positions that strategically plan and execute HHS’s Information Security Risk roadmap. Many of them are subject matter experts on IT Security Risk and Assurance related topics and lead internal security and compliance assessments for assurance purposes. Information technology security analysts help facilitate and promote security awareness within the agency.
HHS IT security analysts earn an average annual salary of $96,034, which is well below the national average wage of $113,270 and Texas average wage of $101,800.628 629
The typical IT security analyst is 48 years of age and has an average of 11 years of service. Nearly half of these of these employees have 10 or more years of service.630
Turnover for these analysts is high at 17 percent, though slightly below the state average rate of 21.5 percent.631 632 With a vacancy rate of about 17 percent, vacant positions often go unfilled for over two months due to a shortage of qualified applicants available for work.633
Programmers There are 51 Programmer IVs, Vs, and VIs employed within the IT Division.634 These skilled programmers perform functions such as computer programming, analysis, and development of complex business processes and system solutions. These employees code, test, and debug programs that are in development, as well as provide technical direction and guidance to technical staff in related programming activities.
These programmers are, on average, 47 years of age and have an average of five years of service. Over 27 percent of these employees have less than two years of service.635
The turnover rate for this group is well below the state average at six percent, although the vacancy rate is high at 27 percent. 636 637 638 On average, it can take up to four months to fill these vacancies.639
DSHS Strategic Plan for 2023-2027, Part II F-69
9. Development Strategies to Meet Workforce Needs
Recruitment Strategies General Strategies
● Continue to advertise job postings in relevant schools, colleges and professional listings and organizations.
● Continue to advertise job postings on agency approved social media outlets, using LinkedIn and occupation-specific association job boards.
● Mention staffing needs when networking with professionals in the field. ● Hold in-person and virtual job fairs in various regions across Texas and
provide conditional job offers on-site. ● Utilize hiring “sprints” to expedite the recruitment process by filling multiple
positions at a time. ● Create college campus flyers for distribution to local colleges and universities. ● Notify existing staff of job postings to encourage recruitment of qualified
candidates. ● Host internships to recruit from local colleges and universities. ● Continue to promote a positive workforce culture, which leads to word-of-
mouth advertising from current employees to their friends and acquaintances.
● Establish “promote from within” as a first principle when looking for, and filling, internal leadership roles. For example, post senior positions internally for a period of time before posting externally.
● Continue to inform applicants of state benefits, including job stability, medical/dental/vision insurance options for the employee and family members, career advancement, and defined benefit retirement plans.
● Continue to inform applicants of job incentives, including flexible schedules, compressed workweek schedule options, telework options, and other site-specific benefits (e.g., cafeteria, gym, etc.).
● Advertise the Public Service Loan Forgiveness (PSLF) program to potential applicants and that HHS agencies are qualifying employers and provide information regarding PSLF program requirements to new employees.
● Explore expanding opportunities for flexible work schedules, telework, mobile work, and alternative offices.
● Place work-from-home policies in job postings and job descriptions. ● Use functional titles in job postings instead of more general position titles. ● Broaden experience requirements to attract a larger pool of applicants. ● Explore increasing entry level salaries to be competitive in a market where
qualified applicants are in short supply. ● Post and hire at mid-range or higher salary for key positions in order to
compete with other public and private employers. ● Continue to submit salary exception requests for approval of salary offers
greater than the HHS allowable amount when appropriate.
DSHS Strategic Plan for 2023-2027, Part II F-70
● Review and update position classifications as necessary. ● Identify positions that could benefit from the Texas Workforce Commission’s
Veteran’s Direct Hire Process.
State Supported Living Centers and State Hospitals ● Continue to provide sign-on bonuses for select critical shortage positions,
including direct support professionals, psychiatric nursing assistants, and registered nurses.
● Pilot flexible schedules, part-time positions within facilities, particularly for direct support professionals and psychiatric nursing assistants.
● Procure a Practice Match recruiting tool subscription to help recruit physicians, psychologists, dentists, psychiatrists, registered nurses, and other specialties who have a provider identification number.
● Coordinate with the Office of Communications to explore: Developing individual facility landing pages to help aid in recruiting but
also communication with current staff. Purchasing targeted Facebook Ads for recruiting select critical shortage
and hard to fill positions. Obtaining social media access for all recruitment specialists. Creating social media pages for facilities.
● Renew CareerArc recruiting tool to increase visibility for open positions. ● Continue to use salary increase plans for all facility staff. ● Develop compensation plans by discipline to further support a unified
strategy to compensate employees. ● Explore the potential use of locality pay based on geographical location. ● Pilot different shift patterns to provide better work-life balance. ● Evaluate expanded use of the tuition reimbursement program. ● Explore hiring a recruitment specialist at each facility, primarily focusing on
talent acquisition. ● Implement the first-step application to assist with making more immediate
contact with potential candidates and assist them with completing the state of Texas application.
● Enhance internship program options. ● Develop or procure leadership training to promote an improved workplace
culture. ● Through the Health and Specialty Care System (HSCS) Recruitment and
Retention Workgroup, develop HSCS workforce initiatives, strategic planning for workforce-related challenges, and establish priorities for workforce-related policy development or changes, statutory initiatives, or implementation.
● Use the Recruitment Specialist Workgroup to share recruitment best practices, discuss facility recruitment needs, learn from facility successes in recruiting efforts, and strategize to promote and evolve recruitment efforts.
● Implement a Compensation Workgroup to explore the possibility of designing a competitive, automated, and equitable compensation plan for new and tenured staff.
DSHS Strategic Plan for 2023-2027, Part II F-71
Access and Eligibility Operations ● Updated initial screening criteria for eligibility advisors to increase pool of
candidates by reducing customer service requirement to one year and removing screening disqualifications for travel and work hours.
● Explore hiring part-time employees who have previous Texas Works (TW) and Medicaid for the Elderly and People with Disabilities (MEPD) experience (i.e., retirees), and work with The Office of Veteran Affairs Services Coordinators.
● Inform applicants of the opportunity for career advancement and promotion of internal hiring preferences to program specialist and management positions.
● Speak at local colleges and universities in rehabilitation, social work and medical schools.
● Interview applicants at local high-traffic eligibility offices.
Intellectual & Developmental Disability & Behavioral Health Services
• Explore the development of a career ladder for program specialists and contract specialists.
• Establish partnerships with universities such as the University of Texas-Steve Hicks School of Social Work to provide interns during fall and spring semesters.
• Distribute notifications of job openings through state and national outlets such as the National Association of State Mental Health Program Directors, Substance Abuse and Mental Health Services Administration, and state professional organizations such as the Texas Counseling Association.
Health, Developmental, and Independence Services ● Continue to use a hybrid virtual and in-person work model to attract
applicants for contract specialist, financial analyst, and training specialist positions.
● Explore reclassifying lower-level positions for contract specialists, reimbursement officers, financial analysts, training specialists.
● Explore the development of career ladders for social workers, blind children specialists and human services specialists.
● Continue to encourage internal staff to apply for higher level positions within the program.
● Continue to increase visibility to skilled workers by speaking at the Executive Leadership Academy (ELA), as well as state and industry conferences.
Policy and Regulatory ● Explore increasing salaries for architects, engineers, and investigators. ● Explore establishing market rates for Regulatory positions.
DSHS Strategic Plan for 2023-2027, Part II F-72
Medicaid and CHIP Services ● Evaluate which positions are appropriate to shift to regional full-time
equivalents to overcome salary versus cost-of-living barriers. ● Continue implementation of the MCS Professional Internship Program. ● Develop and improve onboarding tools for staff, including interview questions
aligned to MCS mission and values, a sample onboarding calendar and checklist, a one-page document on hiring processes, and other guides to help managers with virtual onboarding process.
Chief Operating Officer ● Offer full-time telecommuting for more Information Technology (IT)
positions. ● Continue to utilize the IT Workforce Support Team for assistance with job
postings, and recruitment and hiring activities. ● Continue to use the HHSC Procurement and Contracting Services (PCS)
promotion-from-within model to recruit and retain staff. ● Continue to advertise vacant Human Resources (HR) positions on association
web sites, such as Texas State Human Resources Association, as well as on external job boards.
● Use data analytics to assist agency leadership in making data-driven informed decisions.
● Expand the use of agency-wide market salary data analysis to help support the funding of increased salaries in certain positions that are hard-to-fill and retain.
● Upgrade the telecom system to enable Operations and Support Services operators to telework.
Office of Inspector General ● Explore the development of a career ladder for Audit division staff. ● Present the Officer of Inspector General (OIG) mission and work at
universities to help proactively recruit students.
Consumer Protection Division ● Increase the number of interns performing programmatic work to help
introduce public health work as a career choice to college students. ● Explore strategies to improve the starting salary structures to align more
closely with those provided by state, federal and private entities.
Center for Public Health Policy and Practice ● Continue advertising job postings in public health schools and professional
listings, as well as non-public health schools (to target students with more intense policy and administration expertise).
● Host virtual outreach events to faculty and students to highlight and market careers in public health.
DSHS Strategic Plan for 2023-2027, Part II F-73
Community Health Improvement ● Send job postings for certain positions (epidemiologists, registered and public
health nurses, research specialists, and manager positions) to different state and national organizations, such as Public Health departments in universities, the U.S. Health Resources & Services Administration (HRSA), the Association of Maternal & Child Health Programs (AMCHP), and the American College of Obstetricians and Gynecologists (ACOG).
● Explore bringing up the starting salary for registered and public health nurses to 75 percent of the maximum of the salary range.
● Explore bringing up the starting salary for public health and prevention specialists to the mid-range or greater of the salary range.
Laboratory and Infectious Disease Services ● Re-evaluate Pharmacy Unit positions to identify those under market rate for
equity adjustments and ensure that pay is comparable to other salaries within the same geographic area.
● Explore increasing the starting salary for research specialist positions to be competitive with those with statistical or programing experience in the private sector.
● Explore the development of a career ladder for veterinarian and social worker positions.
● Upgrade specific entry level positions to be commensurate with other programs in the agency.
Regional and Local Health Operations ● Explore the development of a career ladder for social worker positions. ● Explore aggressive marketing and direct recruiting through the
implementation of an agency-level staffing services contract.
DSHS Program Operations ● Accept more diversity in education for financial analyst positions (e.g., public
health or social services degree in addition to accounting and finance), while not requiring a specified amount of college level accounting coursework.
● Increase entry-level salaries for contract specialist and financial analyst positions to be competitive in a market where qualified applicants are in short supply.
● Continue to use the COVID Grants Hiring Team, made up of three Hiring Specialists who support DSHS managers with all aspects of the hiring activities.
● Establish a team to support DSHS by developing recruitment strategies and programs, conduct studies, and increase/strengthen partnership with HHSC and other state agencies on best practices.
● Explore setting up a contract with a staffing agency to provide open-position marketing and candidate sourcing for all vacant COVID grant-funded positions.
DSHS Strategic Plan for 2023-2027, Part II F-74
Retention Strategies General Strategies
● Focus more resources on succession planning activities. ● Explore opportunities to mentor professional staff. ● Ensure workloads are evenly and effectively distributed. ● Establish “promote from within” principles to retain top talent by showing
them a clear and attainable career path within the organization. ● Award merits when funding is available. ● Explore expanding opportunities for flexible work schedules, telework, mobile
work, and alternative offices. ● Pay certification/licensure fees and training opportunities when funds are
available. ● Encourage staff to apply for internal promotion opportunities. ● Continue to provide advanced and ongoing training opportunities. ● Continue to provide staff with leadership training opportunities, including the
HHS Executive Leadership Academy (ELA) and the Aspiring Leaders Academy (ALA), and other state and national leadership academies.
● Continue to cross-train staff. ● Establish focus groups to hear retention ideas directly from staff. ● Survey staff about their needs and design engagement opportunities based
on their feedback. ● Continue to engage staff through activities such as all staff meetings,
newsletters and management meetings. ● Develop a management forum and other tools to assist individuals with the
technical skills transition and be successful in positions that require both technical and management skills.
● Identify ways for staff to feel more connected through team building activities.
● Explore engaging staff in the full spectrum of cross-program activities and collaborations.
● Continue to provide regular performance and career discussions to start proactively identifying, evaluating, and fostering emerging leaders.
● Continue to foster a culture that is meaningful and rewarding by increasing team member job satisfaction by providing ownership of building and planning programs out using their own creativity, and providing meaningful guidance and feedback, and one-on-one assistance as needed.
● Continue to recognize and reward employees who make significant contributions.
● Hold staff appreciation events on a regular basis. ● Continue to use administrative leave to reward staff when expectations are
exceeded. ● Create shared resources for teams to improve their performance and
experience (e.g., memo writing guides, etc.). ● Continue to use technology such as Microsoft Teams in lieu of travel for
onsite meetings/monitoring, where possible.
DSHS Strategic Plan for 2023-2027, Part II F-75
● Consider requesting additional funding to increase salary levels for high turnover and hard-to-fill positions and large salary discrepancies compared to the Texas labor market and other Texas state agencies.
State Supported Living Centers and State Hospitals ● Pilot flexible schedules, part-time positions within facilities, particularly for
direct support professionals and psychiatric nursing assistants. ● Hire a retention specialist at each facility. ● Enhance internship program options. ● Continue to use salary increase plans for HSCS staff. ● Develop compensation plans by discipline to further support a unified
strategy to compensate employees. ● Explore the potential use of locality pay based on geographical location. ● Pilot different shift patterns to provide better work-life balance. ● Evaluate expanded use of the tuition reimbursement program. ● Explore a program in which childcare assistance is provided to staff. ● Explore ride-share options for facility staff. ● Expand texting service to facility level support staff. ● Host quarterly Town Hall meetings. ● Establish routine meetings with division and facility leadership for routine
information sharing. ● Provide training targeted for non-standard shift staff, and to complement
existing work schedules. ● Develop or procure leadership training to promote an improved workplace
culture. ● Develop on-the-job training programs to support ongoing coaching and
mentoring of new hires. ● Use the HSCS Recruitment and Retention Workgroup to develop workforce
initiatives, strategic planning for workforce-related challenges, and establish priorities for workforce-related policy development or changes, statutory initiatives, or implementation.
● Use the Retention Specialist Workgroup to share retention best practices and current data, discuss facility needs and collaborations with other local teams and learn from facility successes in retention efforts.
● Use the Workplace Violence Workgroup to develop strategies that can be implemented to reduce, address, and respond to workplace violence.
● Use the Reducing Staff Injuries Workgroup to develop strategies to reduce staff injuries in restraint or other related incidents.
● Use the Compensation Workgroup to explore the possibility of designing a competitive, automated, and equitable compensation plan for new and tenured staff.
● Use the Health and Wellness Workgroup to develop and expand strategies to foster overall employee wellness and ensure employee’s needs (emotional, physical, mental) are being met through trauma informed care approaches.
DSHS Strategic Plan for 2023-2027, Part II F-76
Access and Eligibility Operations ● Explore providing equity adjustments for Eligibility Advisor Is and claims
examiners. ● Explore expanded use of retention bonuses for claims examiners.
Intellectual & Developmental Disability & Behavioral Health Services
● Explore the development of career ladders for program specialists and contract specialists.
● Explore feasibility of increased funding for positions and opportunities for advancement and/or regular increases in salary.
● Utilize job audits to keep experienced staff. ● Examine pay equity and formulate strategies to address disparities in wages
amongst peers in like roles across the division. ● Explore covering the costs for professional licensing and renewals. ● Support a pro-team environment by using a “buddy system.” ● Encourage one-on-one meetings with all staff, not just direct reports. ● Implement findings identified from IDD-BH responses to the Survey of
Employee Engagement. ● Leverage interns as a retention as well as recruitment strategy.
Health, Developmental, and Independence Services ● Explore the development of career ladders for social workers, blind children
specialists and human services specialists. ● Explore feasibility of increased funding for positions and opportunities for
advancement and/or regular increases in salary. ● Create an internal structure for awarding merits. ● Explore salary equity assessments. ● Explore increasing the percent of new staff participating in HDIS New
Employee Orientation. ● Explore increasing the percent of directors, managers, and supervisors
completing Crucial Conversations training. ● Continue ongoing recognition for extraordinary work, award administrative
leave, encourage team building activities, developed “’A’ Team” recognition for staff that exhibit positive teamwork and support to peers.
● Continue to use the ECI Office Employee Engagement Committee at the state office level, which plans activities to help promote connection and community, frequently shares available training and professional development opportunities, and encourages participation in those opportunities for ECI staff.
Policy and Regulatory ● Work with the HHSC budget team to identify funds to increase salaries for
existing staff.
DSHS Strategic Plan for 2023-2027, Part II F-77
● Develop “stay surveys” to determine what employee needs are before staff begin looking for new positions.
Medicaid and CHIP Services ● Continue hosting bi-monthly MCS Immersion sessions, which provide new
staff with information about the work MCS does, its structure and culture. This allows new staff to immediately learn more about the division and encourages staff to make connections with other new hires.
● Continue to host quarterly all-staff meetings to gather (virtually) as a group to share good news and current agency priorities from MCS leadership.
● Continue to communicate consistently with staff through the weekly MCS newsletter, which includes updates on projects, staff members, engagement opportunities, and helpful resources.
● Launch an academy for staff to participate in a cohort-model program to improve on both hard and soft skills necessary to succeed in the division.
Chief Operating Officer ● Explore the development of career ladders for HR staff. ● Expand the use of agency-wide market salary data analysis to help support
the funding of increased salaries in certain positions that are hard-to-fill and retain.
● Continue to review budget reports on a regular basis to determine if funds are available to award regular or one-time merit awards, administrative leave, development opportunities, and tuition reimbursement to staff meeting eligibility requirements in an effort to enhance retention.
● Continue to review HR positions and reclassify to a more appropriate classification and salary group.
● Use data analytics to assist agency leadership in making data-driven informed decisions.
● Offer full-time telecommuting for IT positions where possible. ● Explore expanding telework opportunities for HR positions that are not
traditionally eligible to telework due to location or nature of the job. ● Utilize LinkedIn Learning licenses that have been purchased to create
learning paths for positions that are at risk of turnover or high vacancies. This will give employees a roadmap to learn the skills necessary to advance to the next level in their classification.
● Expand training and development opportunities for HR team members and create leads within teams to assist with training new team members and providing support to managers with large teams.
● Reassign administrative work away from key IT staff. ● Create an internship program within IT for paid and unpaid interns to assist
in generating a pipeline of candidates and market HHSC IT job opportunities.
Office of Inspector General ● Explore the development of a career ladder for Audit division staff.
DSHS Strategic Plan for 2023-2027, Part II F-78
Consumer Protection Division ● As part of the regular audit process for health physicist and sanitarian
positions, assess the federal and private sector compensation packages for comparison, and make recommendations on pay scales as appropriate.
● Establish a salary entry point for health physicist and sanitarian positions that encourages qualified applicants to apply, along with a protocol to increase compensation that is tied to ongoing training and subject matter expertise.
● Continue to internally promote the DSHS Shine Awards, an agency-wide awards and recognition program.
● Ensure, to the extent possible, that the workplace reflects continuous upgrades and improvements, especially in the areas of IT and communication technologies.
Laboratory and Infectious Disease Services ● Explore the development of a career ladder for veterinarian and social worker
positions. ● Continue to assess salaries as compared with market levels for chemists,
microbiologists, laboratory technicians, public health prevention specialists, and managers.
● Explore increasing the pay for epidemiologists to coincide with the increase in the Austin metropolitan area cost of living, and to remain competitive with national salaries.
● Explore offering shift differential pay for chemists, medical technologists, and molecular biologists who work weekends.
● Review supervisory-level veterinarian jobs for appropriateness and for reclassification to the Veterinarian IV and/or director series.
● Increase funding for positions and opportunities for advancement (position) and/or regular increases in salary.
● Explore allowing managers to telework or manage from regional offices.
Regional and Local Health Operations ● Explore the development of a career ladder for social worker positions. ● Work with Certified Nursing Assistant (CNA) programs to develop and
promote CNA (Medical Technicians) tracks with rotations at the Texas Center for Infectious Disease (TCID).
● Explore equity adjustments for staff serving in the Specialized Health and Social Services (SHSS) Program.
DSHS Program Operations ● Establish a team that will support DSHS by developing retention strategies
and programs, conducting studies, and increasing/strengthening partnerships with HHSC and other state agencies on best practices.
● Work internally to cross-train team members and document processes for each area of oversight.
● Decrease travel for staff with increased remote work.
DSHS Strategic Plan for 2023-2027, Part II F-79
References
1 HHSAS Database, as of 8/31/19. 2 HHSAS Database, as of 8/31/20. 3 HHSAS Database, as of 8/31/21. 4 Ibid. 5 Direct care workers include direct support professionals and psychiatric nursing assistants. 6 Eligibility workers includes Texas works advisors, hospital-based workers and medical eligibility
specialists within Access and Eligibility Services (AES). 7 RNs include public health nurses, nurse surveyors, and direct care nurses. 8 Food service workers include food service workers, managers and cooks. 9 HHSAS Database, as of 8/31/21. 10 HHSAS Database, as of 8/31/19. 11 HHSAS Database, as of 8/31/20. 12 HHSAS Database, as of 8/31/21. 13 Ethnicity “Other” includes American Indian, Alaska Native, Asian, Native Hawaiian, Other Pacific
Islander and two or more races. 14 Ibid. 15 HHSAS Database, as of 8/31/19. 16 HHSAS Database, as of 8/31/20. 17 HHSAS Database, as of 8/31/21. 18 Ibid. 19 Ibid. 20 HHSAS Database, as of 8/31/19. 21 HHSAS Database, as of 8/31/20. 22 HHSAS Database, as of 8/31/21. 23 Totals may not equal 100% due to rounding. 24 HHS System workforce data is from CAPPS-HCM Database as of 8/31/2021. 25 CLF data for underutilization percentages comes from the “Equal Employment Opportunity and
Minority Hiring Practices Report Fiscal Years 2017-2018” published by the Texas Workforce Commission (TWC). Note: CLF data from TWC did not include Para-Professionals as a job category and did not indicate if members of that category were counted as part of any other categories - as a result, it is not included in the above table.
26 “N/A” for Protective Service is due to that workforce being integrated into HHSC as part of Transformation. “N/A” for Skilled Craft indicates the number of employees in that job category was too small (less than 30) to test any differences for statistical significance.
27 Ibid. 28 HHSAS Database, as of 8/31/21. 29 Totals may not equal 100% due to rounding. 30 HHSAS Database, as of 8/31/19. 31 HHSAS Database, as of 8/31/20. 32 HHSAS Database, as of 8/31/21. 33 Ibid. 34 Ibid. 35 Ibid. 36 Ibid. 37 HHS turnover calculations do not consider interagency transfers due to legislatively mandated
transfers as separations. All other interagency transfers were counted as separations since these separations significantly impact HHS agencies.
38 State Auditor’s Office, “A Biennial Report on the State’s Position Classification Plan,” October 2020 Report No. 21-107 web page https://sao.texas.gov/reports/main/21-701.pdf, last accessed 4/11/22. Note: The State Auditor’s Office does not consider transfers between state agencies as a loss to the state and therefore does not include this turnover in their calculations.
DSHS Strategic Plan for 2023-2027, Part II F-80
39 HHSAS Database for FY 2019-2021. Note: Legislative transfers are not considered separations. 40 HHSAS Database for FY 2021. Note: Legislative transfers are not considered separations. 41 Ibid. 42 Ethnicity “Other” includes American Indian, Alaska Native, Asian, Native Hawaiian, Other Pacific
Islander and two or more races. 43 Death accounted for .83% of separations. 44 HHSAS Database for FY 2021. 45 Ibid. 46 Death accounted for .83% of separations (88 separations). 47 Direct care workers include direct support professionals and psychiatric nursing assistants. 48 Food service workers include food service workers, managers and cooks. 49 HHSAS Database for FY 2021. 50 HHSAS Database for FY 2021. Note: Legislative transfers are not considered separations. 51 Direct care workers include direct support professionals and psychiatric nursing assistants. 52 Food service workers include food service workers, managers and cooks. 53 RNs include public health nurses and direct care nurses. 54 Psychologists include behavioral health specialists and behavioral analysts. 55 Eligibility workers includes Texas works advisors, hospital-based workers and medical eligibility
specialists within Access and Eligibility Services (AES). 56 Eligibility clerks includes clerical, administrative assistant, and customer service representative
positions within AES. 57 CCL and RCCL specialists include CCL inspectors and specialists and RCCL inspectors and
investigators. 58 Microbiologists include molecular biologists. 59 Registered therapists include registered audio, speech, occupational, licensed, certified, and physical
therapists at state supported living centers and state hospitals. 60 Nurse practitioners include nurse practitioners at state supported living centers and state hospitals. 61 Includes return-to-work-retirees. HHSAS Database. 62 Exec. Order No. 85 FR 15337 - Declaring a National Emergency Concerning the Novel Coronavirus
Disease (COVID-19) Outbreak Federal Register. Presidential Proclamation 9994. Wednesday, March 18, 2020., 3 C.F.R.
63 Texas Comptroller of Public Accounts. (2021, January). Weathering the Pandemic: Texas Industries and COVID-19. https://comptroller.texas.gov/. Retrieved April 2022, from https://comptroller.texas.gov/economy/fiscal-notes/2021/jan/pandemic.php.
64 Assistance for American Families and Workers. U.S. Department of the Treasury. Retrieved April 19, 2022, from https://home.treasury.gov/policy-issues/coronavirus/assistance-for-American-families-and-workers.
65 MacroVar Limited. US Consumer Confidence Index Retrieved April 19, 2022, https://macrovar.com/united-states/consumer-confidence-index/.
66 Employment Situation News Release. (2022, April). https://www.bls.gov/. Retrieved April 19, 2022, from Employment Situation Summary - 2022 Q01 Results (bls.gov).
67 “Texas Expansion Likely to Continue,” in 2020, Says Dallas Fed Economist. (2020, January 31). dallasfed.org. Retrieved April 19, 2022, from https://www.dallasfed.org/news/releases/2020/nr200131teo.aspx.
68 Ibid. 69 Unemployment Rates for States. (2019, September 20). bls.gov. Retrieved April 19, 2022, from
https://www.bls.gov/lau/lastrk21.htm. 70 Texas Annual Economic Report, 2020-2021. Https://www.twc.texas.gov/. Retrieved April 19, 2022,
from https://www.twc.texas.gov/agency/reports-plans-publications. 71 Your Texas Economy. Dallasfed.Org. Retrieved April 19, 2022, from
https://www.dallasfed.org/research/forecast/2022/emp220415.aspx. 72 Texas Employment Forecast. (2021, December 17). dallasfed.Org. Retrieved April 19, 2022, from
https://www.dallasfed.org/research/forecast/2021/emp211217.aspx. 73 2021 Poverty Guidelines. ASPE. Retrieved April 19, 2022, from https://aspe.hhs.gov/topics/poverty-
economic-mobility/poverty-guidelines/prior-hhs-poverty-guidelines-federal-register-references/2021-poverty-guidelines.
DSHS Strategic Plan for 2023-2027, Part II F-81
74 U.S. Census Bureau QuickFacts: Texas. Census Bureau QuickFacts. Retrieved April 19, 2022, from https://www.census.gov/quickfacts/TX.
75 Ibid. 76 Ibid. 77 U.S. Census Bureau QuickFacts: Texas. Census Bureau QuickFacts. Retrieved April 19, 2022, from
https://www.census.gov/quickfacts/TX. 78 “Texas Population Projections, 2010 to 2050,” Office of the State Demographer, January 2019, web
page 20190128_PopProjectionsBrief.pdf (texas.gov) Retrieved April 19, 2022, from https://demographics.texas.gov/.
79 HHSAS Database, as of 8/31/21. 80 HHSAS Database, FY 2021 data. 81 HHSAS Database, as of 8/31/21. 82 Ibid. 83 State Auditor’s Office, “Classified Employee Turnover for Fiscal Year 2021,” March 2022, Report No.
22-702 web page https://sao.texas.gov/reports/main/22-702.pdf last accessed 4/10/22. 84 HHSAS Database, FY 2021 data. 85 State Auditor’s Office, “A Biennial Report on the State’s Position Classification Plan,” October 2020
Report No. 21-107 web page https://sao.texas.gov/reports/main/21-701.pdf, last accessed 03/22/22.
86 HHSAS Database, as of 8/31/21. 87 Ibid. 88 State Auditor’s Office, “A Biennial Report on the State’s Position Classification Plan,” October 2020
Report No. 21-107 web page https://sao.texas.gov/reports/main/21-701.pdf, last accessed 03/22/22.
89 HHSAS Database, as of 8/31/21. 90 HHSAS Database, FY 2021 data. 91 HHSAS Database, as of 8/31/21. 92 HHSAS Database, as of 8/31/21. Note: Food service workers include food service workers,
managers, and cooks. 93 HHSAS Database, as of 8/31/21. 94 HHSAS Database, FY 2021 data. 95 State Auditor’s Office, “A Biennial Report on the State’s Position Classification Plan,” October 2020
Report No. 21-107 web page https://sao.texas.gov/reports/main/21-701.pdf, last accessed 03/22/22.
96 HHSAS Database, as of 8/31/21. 97 Ibid. 98 HHSAS Database, FY 2021 data. 99 HHSAS Database, as of 8/31/21. 100 Ibid. 101 HHSAS Database, FY 2021 data. 102 HHSAS Database, as of 8/31/21. 103 Ibid. 104 HHSAS Database, FY 2021 data. 105 State Auditor’s Office, “Classified Employee Turnover for Fiscal Year 2021,” March 2022, Report No.
22-702 web page https://sao.texas.gov/reports/main/22-702.pdf last accessed 4/10/22. 106 HHSAS Database, as of 8/31/21. 107 Ibid. 108 Ibid. 109 U.S. Department of Labor, Bureau of Labor Statistics., Selected Occupational Projections Data, web
page Tables Created by BLS. Last accessed on 4/10/22. 110 State Auditor’s Office, “Classified Employee Turnover for Fiscal Year 2021,” March 2022, Report No.
22-702 web page https://sao.texas.gov/reports/main/22-702.pdf last accessed 4/10/22. 111 HHSAS Database, FY 2021 data. 112 HHSAS Database, as of 8/31/21. 113 U.S. Department of Labor, Bureau of Labor Statistics., web page
https://www.bls.gov/ooh/healthcare/dietitians-and-nutritionists.htm. Last accessed on 4/10/22. 114 HHSAS Database, as of 8/31/21.
DSHS Strategic Plan for 2023-2027, Part II F-82
115 Ibid. 116 HHSAS Database, FY 2021 data. 117 HHSAS Database, as of 8/31/21. 118 Ibid. 119 Ibid. 120 Ibid. 121 HHSAS Database, FY 2021 data. 122 HHSAS Database, as of 8/31/21. 123 Ibid. 124 State Auditor’s Office, “Classified Employee Turnover for Fiscal Year 2021,” March 2022, Report No.
22-702 web page https://sao.texas.gov/reports/main/22-702.pdf last accessed 4/10/22. 125 HHSAS Database, FY 2021 data. 126 HHSAS Database, as of 8/31/21. 127 Ibid. 128 Ibid. 129 Ibid. 130 HHSAS Database, FY 2021 data. 131 HHSAS Database, as of 8/31/21. 132 Ibid. 133 HHSAS Database, FY 2021 data. 134 HHSAS Database, as of 8/31/21. 135 Ibid. 136 State Auditor’s Office, “Classified Employee Turnover for Fiscal Year 2021,” March 2022, Report No.
22-702 web page https://sao.texas.gov/reports/main/22-702.pdf last accessed 4/10/22. 137 HHSAS Database, FY 2021 data. 138 HHSAS Database, as of 8/31/21. 139 Ibid. 140 Ibid. 141 U.S. Department of Labor, Bureau of Labor Statistics., Selected Occupational Projections Data, web
page Tables Created by BLS. Last accessed on 4/10/22. 142 HHSAS Database, FY 2021 data. 143 HHSAS Database, as of 8/31/21. 144 CCL and RCCL specialists include CCL inspectors, program specialists and supervisors, and RCCL
inspectors, investigators, and supervisors. 145 HHSAS Database, as of 8/31/21. 146 Ibid. 147 State Auditor’s Office, “Classified Employee Turnover for Fiscal Year 2021,” March 2022, Report No.
22-702 web page https://sao.texas.gov/reports/main/22-702.pdf last accessed 4/10/22. 148 HHSAS Database, FY 2021 data. 149 HHSAS Database, as of 8/31/21. 150 Ibid. 151 Ibid. 152 HHSAS Database, FY 2021 data. 153 State Auditor’s Office, “Classified Employee Turnover for Fiscal Year 2021,” March 2022, Report No.
22-702 web page https://sao.texas.gov/reports/main/22-702.pdf, last accessed 4/10/22. 154 Includes return-to-work retirees. HHSAS Database, as of 8/31/21. 155 HHSAS Database, as of 8/31/21. 156 Ibid. 157 HHSAS Database, FY 2021 data. 158 Includes return-to-work retirees. HHSAS Database, as of 8/31/2021 159 HHSAS Database, as of 8/31/2021 160 Ibid 161 State Auditor’s Office, “A Biennial Report on the State’s Position Classification Plan,” October 2020
Report No. 21-107 web page https://sao.texas.gov/reports/main/21-701.pdf, last accessed 4/15/22.
162 HHSAS Database, FY 2021 163 Includes return-to-work retirees. HHSAS Database, as of 8/31/2021
DSHS Strategic Plan for 2023-2027, Part II F-83
164 HHSAS Database, as of 8/31/21. 165 Ibid. 166 Ibid. 167 State Auditor’s Office, “A Biennial Report on the State’s Position Classification Plan,” October 2020,
Report No. 21-701, web page http://www.sao.texas.gov/reports/main/21-701.pdf, last accessed 4/15/22.
168 HHSAS Database, FY 2021 data. 169 State Auditor’s Office, “Classified Employee Turnover for Fiscal Year 2021,” March 2022, Report No.
22-702 web page https://sao.texas.gov/reports/main/22-702.pdf, last accessed 4/10/22.170 Ibid. 171 HHSAS Database, as of 8/31/21. 172 HHSAS Database, FY 2021 data. 173 Ibid. 174 Includes return-to-work retirees. HHSAS Database, as of 8/31/2021 175 HHSAS Database, as of 8/31/21. 176 HHSAS Database, FY 2021 data. 177 HHSAS Database, as of 8/31/21. 178 Ibid. 179 HHSAS Database, FY 2021 data. 180 State Auditor’s Office, “Classified Employee Turnover for Fiscal Year 2021,” March 2022, Report No.
22-702 web page https://sao.texas.gov/reports/main/22-702.pdf last accessed 4/10/22.181 HHSAS Database, as of 8/31/21. 182 Ibid. 183 State Auditor’s Office, “Classified Employee Turnover for Fiscal Year 2021,” March 2022, Report No.
22-702 web page https://sao.texas.gov/reports/main/22-702.pdf last accessed 4/10/22.184 HHSAS Database, FY 2021 data. 185 State Auditor’s Office, “Classified Employee Turnover for Fiscal Year 2021,” March 2022, Report No.
22-702 web page https://sao.texas.gov/reports/main/22-702.pdf last accessed 4/10/22.186 Includes return-to-work retirees. HHSAS Database, as of 8/31/2021 187 HHSAS Database, as of 8/31/21. 188 Ibid. 189 Ibid. 190 State Auditor’s Office, “A Biennial Report on the State’s Position Classification Plan,” October 2020,
Report No. 21-701, web page http://www.sao.texas.gov/reports/main/21-701.pdf, last accessed 4/15/22.
191 HHSAS Database, as of 8/31/21. 192 HHSAS Database, FY 2021 data. 193 HHSAS Database, as of 8/31/21. 194 Ibid. 195 Ibid. 196 Ibid. 197 Includes return-to-work retirees. HHSAS Database, as of 8/31/2021 198 State Auditor’s Office, “Classified Employee Turnover for Fiscal Year 2021,” March 2022, Report No.
22-702 web page https://sao.texas.gov/reports/main/22-702.pdf last accessed 4/10/22.199 HHSAS Database, FY 2021 data. 200 U.S. Department of Labor, Bureau of Labor Statistics., Selected Occupational Projections Data, web
page Tables Created by BLS. Last accessed on 4/10/22. 201 HHSAS Database, as of 8/31/21. 202 Ibid. 203 HHSAS Database, FY 2021 data. 204 HHSAS Database, as of 8/31/21. 205 Ibid. 206 HHSAS Database, FY 2021 data. 207 HHSAS Database, as of 8/31/21. 208 Ibid. 209 HHSAS Database, FY 2021 data. 210 HHSAS Database, as of 8/31/21.
DSHS Strategic Plan for 2023-2027, Part II F-84
211 U.S. Department of Labor, Bureau of Labor Statistics., Selected Occupational Projections Data, web page Tables Created by BLS. Last accessed on 4/10/22.
212 Includes return-to-work retirees. HHSAS Database, as of 8/31/21. 213 HHSAS Database, as of 8/31/21. 214 Ibid. 215 State Auditor’s Office, “Classified Employee Turnover for Fiscal Year 2021,” March 2022, Report No.
22-702 web page https://sao.texas.gov/reports/main/22-702.pdf last accessed 4/10/22. 216 HHSAS Database, FY 2021 data. 217 HHSAS Database, as of 8/31/21. 218 HHSAS Database, as of 8/31/21. 219 Ibid. 220 HHSAS Database, FY 2021 data. 221 HHSAS Database, as of 8/31/21. 222 Ibid. 223 State Auditor’s Office, “Classified Employee Turnover for Fiscal Year 2021,” March 2022, Report No.
22-702 web page https://sao.texas.gov/reports/main/22-702.pdf last accessed 4/10/22. 224 HHSAS Database, FY 2021 data. 225 HHSAS Database, FY 2021 data. 226 Includes return-to-work retirees. HHSAS Database, as of 8/31/2021 227 HHSAS Database, as of 8/31/21. 228 Ibid. 229 HHSAS Database, FY 2021 data. 230 HHSAS Database, as of 8/31/21. 231 Ibid. 232 Ibid. 233 HHSAS Database, FY 2021 data. 234 HHSAS Database, as of 8/31/21. 235 State Auditor’s Office, “A Biennial Report on the State’s Position Classification Plan,” October 2020,
Report No. 21-701, web page http://www.sao.texas.gov/reports/main/21-701.pdf, last accessed 4/15/22.
236 Includes return-to-work retirees. HHSAS Database, as of 8/31/21. 237 HHSAS Database, as of 8/31/21. 238 State Auditor’s Office, “Classified Employee Turnover for Fiscal Year 2021,” March 2022, Report No.
22-702 web page https://sao.texas.gov/reports/main/22-702.pdf last accessed 4/10/22. 239 HHSAS Database, FY 2021 data. 240 HHSAS Database, as of 8/31/21. 241State Auditor’s Office, “A Biennial Report on the State’s Position Classification Plan,” October 2020,
Report No. 21-701, web page https://sao.texas.gov/reports/main/21-701.pdf 3/30/2022. 242 HHSAS Database, FY 2021 data. 243 Registered therapists include registered audio, speech, occupational, licensed, certified, and
physical therapists at state supported living centers and state hospitals. 244 HHSAS Database, as of 8/31/21. 245 Ibid. 246 U.S. Department of Labor, Bureau of Labor Statistics, Occupational Employment Statistics, web
page http://data.bls.gov/oes/search.jsp?data_tool=OES, Period: May 2021; last accessed on 4/15/22.
247 HHSAS Database, FY 2021 data. 248 U.S. Department of Labor, Bureau of Labor Statistics, Occupational Employment Statistics, web
page http://data.bls.gov/oes/search.jsp?data_tool=OES, Period: May 2021; last accessed on 4/15/22.
249 HHSAS Database, FY 2021 data. 250 U.S. Department of Labor, Bureau of Labor Statistics, Occupational Employment Statistics, web
page http://data.bls.gov/oes/search.jsp?data_tool=OES, Period: May 2021; last accessed on 4/15/22.
251 HHSAS Database, FY 2021 data.
DSHS Strategic Plan for 2023-2027, Part II F-85
252 U.S. Department of Labor, Bureau of Labor Statistics, Occupational Employment Statistics, web page http://data.bls.gov/oes/search.jsp?data_tool=OES, Period: May 2021; last accessed on 4/15/22.
253 HHSAS Database, FY 2021 254 HHSAS Database, FY 2021 data. 255 Includes return-to-work retirees. HHSAS Database, as of 8/31/2021 256 HHSAS Database, as of 8/31/21. 257 Ibid. 258 State Auditor’s Office, “Classified Employee Turnover for Fiscal Year 2021,” March 2022, Report No.
22-702 web page https://sao.texas.gov/reports/main/22-702.pdf last accessed 4/10/22. 259 HHSAS Database, FY 2021 data. 260 Includes return-to-work retirees. HHSAS Database, as of 8/31/21. 261 HHSAS Database, FY 2021 data. 262 State Auditor’s Office, “Classified Employee Turnover for Fiscal Year 2021,” March 2022, Report No.
22-702 web page https://sao.texas.gov/reports/main/22-702.pdf last accessed 4/10/22. 263 HHSAS Database, FY 2021 data. 264 Includes return-to-work retirees. HHSAS Database, as of 8/31/21. 265 HHSAS Database, as of 8/31/21. 266 HHSAS Database, as of 8/31/21. 267 HHSAS Database, FY 2021 data. 268 U.S. Department of Labor, Bureau of Labor Statistics, Occupational Employment Statistics, web
page http://data.bls.gov/oes/search.jsp?data_tool=OES, Period: May 2021; last accessed on 4/15/22.
269 U.S. Department of Labor, Bureau of Labor Statistics, Occupational Outlook Handbook, web page https://www.bls.gov/ooh/healthcare/registered-nurses.htm, last accessed on 4/16/22.
270 U.S. Department of Labor, Bureau of Labor Statistics, Selected Occupational Projections Data. Period: May 2020; web page http://www.bls.gov/emp/ep_table_110.htm, last accessed on 4/16/22.
271 HHSAS Database, as of 8/31/21. 272 RNs include public health nurses. 273 HHSAS Database, as of 8/31/21. 274 U.S. Department of Labor, Bureau of Labor Statistics, Occupational Employment Statistics, web
page https://www.bls.gov/oes/current/oes291141.htm, Period: May 2020; last accessed on 4/16/22. Employees listed under the occupational title of Registered Nurses.
275 Ibid. 276 State Auditor’s Office, “A Biennial Report on the State’s Position Classification Plan,” October 2020
Report No. 21-107 web page https://sao.texas.gov/reports/main/21-701.pdf, last accessed 4/16/22.
277 HHSAS Database, as of 8/31/21. 278 Ibid. 279 Ibid. 280 HHSAS Database, FY 2021 data. 281 HHSAS Database, as of 8/31/21. 282 Ibid. 283 HHSAS Database, FY 2021 data. 284 HHSAS Database, as of 8/31/21. 285 Ibid. 286 Ibid. 287 Includes RN II - Vs in public health roles and public health nurses. Note: Public health nurses are
also registered nurses. 288 HHSAS Database, as of 8/31/21. 289 HHSAS Database, FY 2021 data. 290 HHSAS Database, as of 8/31/21. 291 Includes Licensed Vocational Nurse II - III. 292 HHSAS Database, as of 8/31/21. 293 Ibid. 294 HHSAS Database, FY 2021 data. 295 HHSAS Database, as of 8/31/21.
DSHS Strategic Plan for 2023-2027, Part II F-86
296 U.S. Department of Labor, Bureau of Labor Statistics, Occupational Employment Statistics, web page https://www.bls.gov/oes/current/oes292061.htm, Period: May 2020; last accessed on 4/18/22. Employees listed under the occupational title of Licensed Practical and Licensed Vocational Nurses.
297 State Auditor’s Office, “A Biennial Report on the State’s Position Classification Plan,” October 2020 Report No. 21-107 web page https://sao.texas.gov/reports/main/21-701.pdf, last accessed 4/18/22.
298 HHSAS Database, as of 8/31/21. 299 HHSAS Database, FY 2021 data. 300 HHSAS Database, as of 8/31/21. 301 Ibid. 302 Ibid. 303 HHSAS Database, FY 2021 data. 304 HHSAS Database, as of 8/31/21. 305 Ibid. 306 State Auditor’s Office, “Classified Employee Turnover for Fiscal Year 2021,” March 2022, Report No.
22-702 web page https://sao.texas.gov/reports/main/22-702.pdf last accessed 4/10/22. 307 HHSAS Database, FY 2021 data. 308 U.S. Bureau of Labor Statistics, Occupational Outlook Handbook, website
https://www.bls.gov/ooh/healthcare/licensed-practical-and-licensed-vocational-nurses.htm#tab-6. 309 HHSAS Database, FY 2021 data. 310 Advanced Practice RN Is and RN IIs. 311 HHSAS Database, FY 2021 data. 312 Ibid. 313 Ibid. 314 State Auditor’s Office, “A Biennial Report on the State’s Position Classification Plan,” October 2020
Report No. 21-107 web page https://sao.texas.gov/reports/main/21-701.pdf, last accessed 03/22/2022. Note: For Advanced Practice Registered Nurse Is and IIs.
315 HHSAS Database, FY 2021 data. 316 Includes return-to-work retirees. HHSAS Database, as of 8/31/21. 317 HHSAS Database, as of 8/31/21. 318 Ibid. 319 HHSAS Database, FY 2021 data. 320 HHSAS Database, as of 8/31/21. 321 Ibid. 322 Includes return-to-work retirees. HHSAS Database, as of 8/31/21. 323 HHSAS Database, as of 8/31/21. 324 U.S. Department of Labor, Bureau of Labor Statistics., Selected Occupational Projections Data, web
page Tables Created by BLS. Last accessed on 4/10/22. 325 State Auditor’s Office, “A Biennial Report on the State’s Position Classification Plan,” October 2020
Report No. 21-107 web page https://sao.texas.gov/reports/main/21-701.pdf, last accessed 03/22/2022.
326 HHSAS Database, as of 8/31/21. 327 HHSAS Database, FY 2021 data. 328 Includes return-to-work retirees. HHSAS Database, as of 8/31/2021 329 HHSAS Database, as of 8/31/21. 330 HHSAS Database, FY 2021 data. 331 Includes return-to-work retirees. HHSAS Database, as of 8/31/21. 332 HHSAS Database, as of 8/31/21. 333 Ibid. 334 HHSAS Database, FY 2021 data. 335 HHSAS Database, as of 8/31/21. 336 Includes return-to-work retirees. HHSAS Database, as of 8/31/21. 337 HHSAS Database, as of 8/31/21. 338 Ibid.
DSHS Strategic Plan for 2023-2027, Part II F-87
339 U.S. Department of Labor, Bureau of Labor Statistics, Occupational Employment Statistics, web page http://data.bls.gov/oes/search.jsp?data_tool=OES, Period: May 2021; last accessed on 4/15/22. Note: The Employees are listed under the Occupational title of Pharmacy Technicians.
340 State Auditor’s Office, “A Biennial Report on the State’s Position Classification Plan,” October 2020 Report No. 21-107 web page https://sao.texas.gov/reports/main/21-701.pdf, last accessed 03/22/22.
341 HHSAS Database, FY 2021 data. 342 HHSAS Database, as of 8/31/21. 343 Ibid. 344 Ibid. 345 HHSAS Database, FY 2021 data. 346 HHSAS Database, as of 8/31/21. 347 Ibid. 348 Ibid. 349 HHSAS Database, FY 2021 data. 350 HHSAS Database, as of 8/31/21. 351 Includes return-to-work retirees. HHSAS Database, as of 8/31/21. 352 U.S. Department of Labor, Bureau of Labor Statistics, Occupational Outlook Handbook, web page
http://www.bls.gov/ooh/healthcare/dentists.htm, last accessed on 4/4/22. 353 HHSAS Database, as of 8/31/21. 354 Ibid. 355 Ibid. 356 U.S. Department of Labor, Bureau of Labor Statistics, Occupational Employment Statistics, web
page http://data.bls.gov/oes/search.jsp?data_tool=OES, Period: May 2019; last accessed on 4/28/20. Note: The Employees are listed under the Occupational title of Dentists, General.
357 HHSAS Database, FY 2021 data. 358 Includes return-to-work retirees. HHSAS Database, as of 8/31/21. 359 HHSAS Database, as of 8/31/21. 360 Ibid. 361 U.S. Department of Labor, Bureau of Labor Statistics, Occupational Employment Statistics, web
page https://www.bls.gov/oes/2019/may/oes291131.htm, Period: May 2021; last accessed on 4/27/20.
362 State Auditor’s Office, “Classified Employee Turnover for Fiscal Year 2021,” March 2022, Report No. 22-702 web page https://sao.texas.gov/reports/main/22-702.pdf last accessed 4/10/22.
363 HHSAS Database, FY 2021 data. 364 HHSAS Database, as of 8/31/21. 365 Includes return-to-work retirees. HHSAS Database, as of 8/31/21. 366 U.S. Department of Labor, Bureau of Labor Statistics., Selected Occupational Projections Data, web
page Tables Created by BLS. Last accessed on 4/15/22. 367 HHSAS Database, as of 8/31/21. 368 Ibid. 369 Ibid. 370 U.S. Department of Labor, Bureau of Labor Statistics, Occupational Employment Statistics, web
page http://data.bls.gov/oes/search.jsp?data_tool=OES, Period: May 2021; last accessed on 4/27/22.
371 State Auditor’s Office, “A Biennial Report on the State’s Position Classification Plan,” October 2020 Report No. 21-107 web page https://sao.texas.gov/reports/main/21-701.pdf, last accessed 4/15/22.
372 HHSAS Database, FY 2021 data. 373 HHSAS Database, as of 8/31/21. 374 Includes return-to-work retirees. HHSAS Database, as of 8/31/21. 375 HHSAS Database, as of 8/31/21. 376 Ibid. 377 HHSAS Database, FY 2021 data. 378 HHSAS Database, as of 8/31/21. 379 Ibid. 380 Ibid.
DSHS Strategic Plan for 2023-2027, Part II F-88
381 HHSAS Database, FY 2021 data. 382 HHSAS Database, as of 8/31/21. 383 Includes return-to-work retirees. HHSAS Database, as of 8/31/21. 384 U.S. Department of Labor, Bureau of Labor Statistics, Selected Occupational Projections Data, web
page Tables Created by BLS. Last accessed on 4/10/22. 385 U.S. Department of Labor, Bureau of Labor Statistics, Selected Occupational Projections Data, web
page National Employment Matrix_IND_622202 (bls.gov) Period: May 2021; last accessed on 4/10/22. For state psychiatric and substance abuse hospitals.
386 HHSAS Database, as of 8/31/21. 387 Ibid. 388 Ibid. 389 State Auditor’s Office, “A Biennial Report on the State’s Position Classification Plan,” October 2020
Report No. 21-107 web page https://sao.texas.gov/reports/main/21-701.pdf, last accessed 4/12/22.
390 HHSAS Database, FY 2021 data. 391 HHSAS Database, as of 8/31/21. 392 Includes return-to-work retirees. HHSAS Database, as of 8/31/21. 393 HHSAS Database, as of 8/31/21. 394 Ibid. 395 Ibid. 396 Ibid. 397 Ibid. 398 HHSAS Database, FY 2021 data. 399 HHSAS Database, as of 8/31/21. 400 Includes return-to-work retirees. HHSAS Database, as of 8/31/21. 401 HHSAS Database, as of 8/31/21. Note: Includes Psychologists I-III. 402 HHSAS Database, as of 8/31/21. 403 State Auditor’s Office, “A Biennial Report on the State’s Position Classification Plan,” October 2020
Report No. 21-107 web page https://sao.texas.gov/reports/main/21-701.pdf, last accessed 4/12/21.
404 HHSAS Database, FY 2021 data. 405 HHSAS Database, as of 8/31/21. 406 Ibid. 407 Ibid. 408 HHSAS Database, FY 2021 data. 409 HHSAS Database, as of 8/31/21. 410 Includes return-to-work retirees. HHSAS Database, as of 8/31/21. 411 HHSAS Database, as of 8/31/21. 412 Ibid. 413 HHSAS Database, FY 2021 data. 414 HHSAS Database, as of 8/31/21. 415 Includes return-to-work retirees. HHSAS Database, as of 8/31/21. 416 HHSAS Database, as of 8/31/21. 417 Ibid. 418 HHSAS Database, FY 2021 data. 419 HHSAS Database, as of 8/31/21. 420 Includes return-to-work retirees. HHSAS Database, as of 8/31/21. 421 HHSAS Database, as of 8/31/21. 422 U.S. Department of Labor, Bureau of Labor Statistics, Selected Occupational Projections Data, web
pagehttps://data.bls.gov/projections/occupationProj, Period: May 2020; last accessed on 4/13/22 423 HHSAS Database, as of 8/31/21. 424 HHSAS Database, FY 2021 data. 425 HHSAS Database, as of 8/31/21. 426 U.S. Department of Labor, Bureau of Labor Statistics, Occupational Employment and Wage
Statistics, web pagehttps://www.bls.gov/oes/current/oes191041.htm#st, Period: May 2021; last accessed on 4/13/22.
DSHS Strategic Plan for 2023-2027, Part II F-89
427 State Auditor’s Office, “A Biennial Report on the State’s Position Classification Plan,” October 2020 Report No. 21-107 web page https://sao.texas.gov/reports/main/21-701.pdf, last accessed 4/12/21.
428 Includes return-to-work retirees. HHSAS Database, as of 8/31/2021 429 HHSAS Database, as of 8/31/21. 430 Ibid. 431 HHSAS Database, FY 2021 data. 432 HHSAS Database, as of 8/31/21. 433 Includes return-to-work retirees. HHSAS Database, as of 8/31/21. 434 HHSAS Database, as of 8/31/21. 435 Ibid. 436 Ibid. 437 U.S. Department of Labor, Bureau of Labor Statistics, Occupational Employment Statistics, web
page https://www.bls.gov/oes/current/oes195011.htm, Period: May 2021; last accessed on 03/31/2021. Note: The Employees are listed under the Occupational title of Occupational Health and Safety Specialists.
438 State Auditor’s Office, “Classified Employee Turnover for Fiscal Year 2021,” March 2022, Report No. 22-702 web page https://sao.texas.gov/reports/main/22-702.pdf last accessed 4/10/22.
439 HHSAS Database, FY 2021 data. 440 HHSAS Database, as of 8/31/21. 441 Ibid. 442 Ibid. 443 HHSAS Database, FY 2021 data. 444 State Auditor’s Office, “Classified Employee Turnover for Fiscal Year 2021,” March 2022, Report No.
22-702 web page https://sao.texas.gov/reports/main/22-702.pdf last accessed 4/10/22. 445 HHSAS Database, FY 2021 data. 446 HHSAS Database, as of 8/31/21. 447 Ibid. 448 State Auditor’s Office, “A Biennial Report on the State’s Position Classification Plan,” October 2020
Report No. 21-107 web page https://sao.texas.gov/reports/main/21-701.pdf, last accessed 4/12/21.
449 Includes return-to-work retirees. HHSAS Database, as of 8/31/21. 450 HHSAS Database, as of 8/31/21. 451 Ibid. 452 State Auditor’s Office, “Classified Employee Turnover for Fiscal Year 2021,” March 2022, Report No.
22-702 web page https://sao.texas.gov/reports/main/22-702.pdf last accessed 4/10/22. 453 HHSAS Database, FY 2021 data. 454 HHSAS Database, as of 8/31/21. 455 Includes return-to-work retirees. HHSAS Database, as of 8/31/21. 456 HHSAS Database, as of 08/31/21. 457 Ibid. 458 Ibid. 459 U.S. Department of Labor, Bureau of Labor Statistics, Occupational Employment Statistics, web
page https://www.bls.gov/oes/current/oes291131.htm Period: May 2021; last accessed on 3/31/22. 460 State Auditor’s Office, “A Biennial Report on the State’s Position Classification Plan,” October 2020
Report No. 21-107 web page https://sao.texas.gov/reports/main/21-701.pdf, last accessed 3/30/22.
461 State Auditor’s Office, “Classified Employee Turnover for Fiscal Year 2021,” March 2022, Report No. 22-702 web page https://sao.texas.gov/reports/main/22-702.pdf last accessed 4/10/22.
462 HHSAS Database, FY 2021 data. 463 Includes return-to-work retirees. HHSAS Database, as of 8/31/21. 464 HHSAS Database, as of 8/31/21. 465 Ibid. 466 HHSAS Database, FY 2021 data. 467 State Auditor’s Office, “Classified Employee Turnover for Fiscal Year 2021,” March 2022, Report No.
22-702 web page https://sao.texas.gov/reports/main/22-702.pdf last accessed 4/10/22. 468 HHSAS Database, as of 8/31/21.
DSHS Strategic Plan for 2023-2027, Part II F-90
469 Includes return-to-work retirees. HHSAS Database, as of 8/31/21. 470 HHSAS Database, as of 8/31/21. 471 State Auditor’s Office, “A Biennial Report on the State’s Position Classification Plan,” October 2020
Report No. 21-107 web page https://sao.texas.gov/reports/main/21-701.pdf, last accessed 3/30/22.
472 U.S. Department of Labor, Bureau of Labor Statistics, Occupational Employment Statistics, web pagehttps://www.bls.gov/oes/current/oes192031.htm, Period: May 2020; last accessed on 4/15/22.
473 Microbiologists include molecular biologists. 474 HHSAS Database, as of 8/31/21. 475 Ibid. 476 State Auditor’s Office, “Classified Employee Turnover for Fiscal Year 2021,” March 2022, Report No.
22-702 web page https://sao.texas.gov/reports/main/22-702.pdf last accessed 4/10/22. 477 HHSAS Database, FY 2021 data. 478 HHSAS Database, as of 8/31/21. 479 State Auditor’s Office, “A Biennial Report on the State’s Position Classification Plan,” October 2020
Report No. 21-107 web page https://sao.texas.gov/reports/main/21-701.pdf, last accessed 3/30/22.
480 U.S. Department of Labor, Bureau of Labor Statistics, Occupational Employment Statistics, web page https://www.bls.gov/oes/current/oes191022.htm, Period: May 2020; last accessed on 4/15/22.
481 HHSAS Database, as of 8/31/21. 482 Includes return-to-work retirees. HHSAS Database, as of 8/31/21. 483 HHSAS Database, as of 8/31/21. 484 Ibid. 485 HHSAS Database, FY 2021 data. 486 HHSAS Database, as of 8/31/21. 487 Ibid. 488 U.S. Department of Labor, Bureau of Labor Statistics, Occupational Employment Statistics, web
pagehttps://www.bls.gov/oes/current/oes292010.htm, Period: May 2020; last accessed on 4/15/22. Employees listed under the occupational title of Clinical Laboratory Technologists and Technicians.
489 State Auditor’s Office, “A Biennial Report on the State’s Position Classification Plan,” October 2020 Report No. 21-107 web page https://sao.texas.gov/reports/main/21-701.pdf, last accessed 3/30/2022.
490 Includes return-to-work retirees. HHSAS Database, as of 8/31/21. 491 HHSAS Database, as of 8/31/21. 492 Ibid. 493 State Auditor’s Office, “Classified Employee Turnover for Fiscal Year 2021,” March 2022, Report No.
22-702 web page https://sao.texas.gov/reports/main/22-702.pdf last accessed 4/10/22. 494 HHSAS Database, FY 2021 data. 495 HHSAS Database, as of 8/31/21. 496 Ibid. 497 State Auditor’s Office, “A Biennial Report on the State’s Position Classification Plan,” October 2020
Report No. 21-107 web page https://sao.texas.gov/reports/main/21-701.pdf, last accessed 3/30/22.
498 Includes return-to-work retirees. HHSAS Database, as of 8/31/21. 499 HHSAS Database, as of 8/31/21. Note: Includes Inspectors II-V. 500 HHSAS Database, as of 8/31/21. 501 Ibid. 502 U.S. Department of Labor, Bureau of Labor Statistics, Occupational Employment Statistics, web
page http://data.bls.gov/oes/search.jsp?data_tool=OES, Period: May 2021; last accessed on 4/15/22. Note: Employees are listed under the Occupational title of Occupational Health and Safety Specialists.
503 State Auditor’s Office, “A Biennial Report on the State’s Position Classification Plan,” October 2020 Report No. 21-107 web page https://sao.texas.gov/reports/main/21-701.pdf, last accessed 3/30/22.
504 State Auditor’s Office, “Classified Employee Turnover for Fiscal Year 2021,” March 2022, Report No. 22-702 web page https://sao.texas.gov/reports/main/22-702.pdf last accessed 4/10/22.
DSHS Strategic Plan for 2023-2027, Part II F-91
505 HHSAS Database, FY 2021 data. 506 HHSAS Database, as of 8/31/21. 507 Ibid. 508 Ibid. 509 HHSAS Database, FY 2021 data. 510 State Auditor’s Office, “Classified Employee Turnover for Fiscal Year 2021,” March 2022, Report No.
22-702 web page https://sao.texas.gov/reports/main/22-702.pdf last accessed 4/10/22.511 HHSAS Database, as of 8/31/21. 512 Includes return-to-work retirees. HHSAS Database, as of 8/31/21. 513 HHSAS Database, as of 8/31/21. 514 Ibid. 515 HHSAS Database, FY 2021 data. 516 HHSAS Database, as of 8/31/21. 517 Ibid. 518 State Auditor’s Office, “Classified Employee Turnover for Fiscal Year 2021,” March 2022, Report No.
22-702 web page https://sao.texas.gov/reports/main/22-702.pdf last accessed 4/10/22.519 HHSAS Database, FY 2021 data. 520 Ibid. 521 HHSAS Database, as of 8/31/21. 522 U.S. Department of Labor, Bureau of Labor Statistics, Occupational Outlook Handbook, web page
https://www.bls.gov/ooh/community-and-social-service/rehabilitation-counselors.htm, last accessed on 4/16/22.
523 HHSAS Database, as of 8/31/21. 524 Ibid. 525 Ibid. 526 U.S. Department of Labor, Bureau of Labor Statistics, Occupational Employment Statistics, web
page http://data.bls.gov/oes/search.jsp?data_tool=OES, Period: May 2021; last accessed on 4/15/22. Note: Employees are listed under Rehabilitation Counselors.
527 State Auditor’s Office, “Classified Employee Turnover for Fiscal Year 2021,” March 2022, Report No. 22-702 web page https://sao.texas.gov/reports/main/22-702.pdf last accessed 4/10/22.
528 HHSAS Database, FY 2021 data. 529 Ibid. 530 HHSAS Database, as of 8/31/21. 531 Includes return-to-work retirees. HHSAS Database, as of 8/31/2021 532 HHSAS Database, as of 8/31/21. 533 HHSAS Database, FY 2021 data. 534 HHSAS Database, FY 2021 data. 535 HHSAS Database, as of 8/31/21. 536 Ibid. 537 Ibid. 538 HHSAS Database, FY 2021 data. 539 HHSAS Database, as of 8/31/21. 540 Ibid. 541 Ibid. 542 U.S. Department of Labor, Bureau of Labor Statistics, Occupational Employment Statistics, web
page https://www.bls.gov/ooh/healthcare/medical-assistants.htm. Last accessed on 4/15/22. 543 State Auditor’s Office, “Classified Employee Turnover for Fiscal Year 2021,” March 2022, Report No.
22-702 web page https://sao.texas.gov/reports/main/22-702.pdf last accessed 4/10/22.544 HHSAS Database, FY 2021 data. 545 HHSAS Database, as of 8/31/21. 546 Ibid. 547 Ibid. 548 Ibid. 549 https://www.bls.gov/ooh/community-and-social-service/health-educators.htm 550 State Auditor’s Office, “Classified Employee Turnover for Fiscal Year 2021,” March 2022, Report No.
22-702 web page https://sao.texas.gov/reports/main/22-702.pdf last accessed 4/10/22.551 HHSAS Database, FY 2021 data.
DSHS Strategic Plan for 2023-2027, Part II F-92
552 HHSAS Database, as of 8/31/21. 553 Includes return-to-work retirees. HHSAS Database, as of 8/31/21. 554 HHSAS Database, as of 8/31/21. 555 Ibid. 556 HHSAS Database, FY 2021 data. 557 HHSAS Database, as of 8/31/21. 558 State Auditor’s Office, “A Biennial Report on the State’s Position Classification Plan,” October 2020
Report No. 21-107 web page https://sao.texas.gov/reports/main/21-701.pdf, last accessed 3/30/22.
559 Includes return-to-work retirees. HHSAS Database, as of 8/31/21. 560 HHSAS Database, as of 8/31/21. 561 Ibid. 562 Ibid. 563 State Auditor’s Office, “A Biennial Report on the State’s Position Classification Plan,” October 2020
Report No. 21-107 web page https://sao.texas.gov/reports/main/21-701.pdf, last accessed 4/13/22.
564 HHSAS Database, FY 2021 data. 565 HHSAS Database, as of 8/31/21. 566 Includes return-to-work retirees. HHSAS Database, as of 8/31/21. 567 HHSAS Database, as of 08/31/21 568 Ibid. 569 HHSAS Database, as of 08/31/21 570 U.S. Department of Labor, Bureau of Labor Statistics, Occupational Employment Statistics, web
page https://www.bls.gov/oes/current/oes151212.htm Period: May 2021; last accessed on 03/31/21.
571 HHSAS Database, as of 8/31/21. 572 Ibid. 573 State Auditor’s Office, “A Biennial Report on the State’s Position Classification Plan,” October 2020
Report No. 21-107 web page https://sao.texas.gov/reports/main/21-701.pdf, last accessed 4/18/22.
574 U.S. Department of Labor, Bureau of Labor Statistics, Occupational Employment and Wage Statistics, web page https://www.bls.gov/oes/current/oes131071.htm, Period: May 2021; last accessed on 4/18/22.
575 U.S. Department of Labor, Bureau of Labor Statistics, Selected Occupational Projections Data, web page https://www.bls.gov/ooh/business-and-financial/human-resources-specialists.htm, Period: May 2020; last accessed on 4/18/22.
576 HHSAS Database, as of 8/31/21. 577 HHSAS Database, FY 2021 data. 578 Includes return-to-work retirees. HHSAS Database, as of 8/31/21. 579 HHSAS Database, as of 8/31/21. 580 HHSAS Database, FY 2021 data. 581 HHSAS Database, as of 8/31/21. 582 HHSAS Database, FY 2021 data. 583 HHSAS Database, as of 8/31/21. 584 State Auditor’s Office, “A Biennial Report on the State’s Position Classification Plan,” October 2020
Report No. 21-107 web page https://sao.texas.gov/reports/main/21-701.pdf, last accessed 4/18/22.
585 U.S. Department of Labor, Bureau of Labor Statistics, Occupational Employment and Wage Statistics, web page https://www.bls.gov/oes/current/oes436014., Period: May 2021; last accessed on 4/18/22.
586 HHSAS Database, as of 8/31/21. 587 Includes return-to-work retirees. HHSAS Database, as of 8/31/21. 588 HHSAS Database, as of 8/31/21. 589 HHSAS Database, FY 2021 data. 590 State Auditor’s Office, “Classified Employee Turnover for Fiscal Year 2021,” March 2022, Report No.
22-702 web page https://sao.texas.gov/reports/main/22-702.pdf last accessed 4/10/22. 591 HHSAS Database, FY 2021 data.
DSHS Strategic Plan for 2023-2027, Part II F-93
592 HHSAS Database, as of 8/31/21. 593 Ibid. 594 Ibid. 595 Ibid. 596 U.S. Department of Labor, Bureau of Labor Statistics, Occupational Employment and Wage
Statistics, web page https://www.bls.gov/oes/current/oes436014., Period: May 2021; last accessed on 4/18/22.
597 HHSAS Database, FY 2021 data. 598 Includes return-to-work retirees. HHSAS Database, as of 8/31/21. 599 HHSAS Database, as of 8/31/21. 600 Ibid. 601 HHSAS Database, FY 2021 data. 602 HHSAS Database, as of 8/31/21. 603 Ibid. 604 U.S. Department of Labor, Bureau of Labor Statistics, Occupational Employment and Wage
Statistics, web page https://www.bls.gov/oes/current/oes436014., Period: May 2021; last accessed on 4/18/22.
605 Includes return-to-work retirees. HHSAS Database, as of 8/31/21 606 HHSAS Database, as of 8/31/21. 607 Ibid. 608 State Auditor’s Office, “Classified Employee Turnover for Fiscal Year 2021,” March 2022, Report No.
22-702 web page https://sao.texas.gov/reports/main/22-702.pdf last accessed 4/10/22. 609 HHSAS Database, FY 2021 data. 610 HHSAS Database, as of 8/31/21. 611 Ibid. 612 State Auditor’s Office, “A Biennial Report on the State’s Position Classification Plan,” October 2020
Report No. 21-107 web page https://sao.texas.gov/reports/main/21-701.pdf, last accessed 3/30/22.
613 Includes return-to-work retirees. HHSAS Database, as of 8/31/21. 614 HHSAS Database, as of 8/31/21. 615 Ibid. 616 Ibid. 617 U.S. Department of Labor, Bureau of Labor Statistics, Occupational Employment Statistics, web
page https://www.bls.gov/oes/current/oes151212.htm Period: May 2021; last accessed on 03/31/22.
618 State Auditor’s Office, “Classified Employee Turnover for Fiscal Year 2021,” March 2022, Report No. 22-702 web page https://sao.texas.gov/reports/main/22-702.pdf last accessed 4/10/22.
619 HHSAS Database, FY 2021 data. 620 HHSAS Database, as of 8/31/21. 621 Ibid. 622 Ibid. 623 U.S. Department of Labor, Bureau of Labor Statistics, Occupational Employment Statistics, web
page https://www.bls.gov/oes/current/oes291131.htm Period: May 2021; last accessed on 3/31/22.
624 State Auditor’s Office, “Classified Employee Turnover for Fiscal Year 2021,” March 2022, Report No. 22-702 web page https://sao.texas.gov/reports/main/22-702.pdf last accessed 4/10/22.
625 HHSAS Database, FY 2021 data. 626 HHSAS Database, as of 8/31/21. 627 Ibid. 628 Ibid. 629 U.S. Department of Labor, Bureau of Labor Statistics, Occupational Employment Statistics, web
page https://www.bls.gov/oes/current/oes291131.htm Period: May 2021; last accessed on 3/31/22.
630 HHSAS Database, as of 8/31/21. 631 State Auditor’s Office, “Classified Employee Turnover for Fiscal Year 2021,” March 2022, Report No.
22-702 web page https://sao.texas.gov/reports/main/22-702.pdf last accessed 4/10/22. 632 HHSAS Database, FY 2021 data.
DSHS Strategic Plan for 2023-2027, Part II F-94
633 HHSAS Database, as of 8/31/21. 634 Ibid. 635 Ibid. 636 HHSAS Database, FY 2021 data. 637 State Auditor’s Office, “Classified Employee Turnover for Fiscal Year 2021,” March 2022, Report No.
22-702 web page https://sao.texas.gov/reports/main/22-702.pdf last accessed 4/10/22.638 HHSAS Database, as of 8/31/21. 639 Ibid.
DSHS Strategic Plan for 2023-2027, Part II F-95
Schedule G: Workforce Development System Strategic Planning
Schedule G is not required for the Department of State Health Services.
DSHS Strategic Plan for 2023-2027, Part II G-1
Schedule H: Report on Customer Service
The DSHS 2022 Report on Customer Service, found on the following pages, was compiled by the DSHS Center for System Coordination and Innovation, in compliance with the Texas Government Code Section 2114.002.
DSHS Strategic Plan for 2023-2027, Part II H-1
Introduction
This “2022 Report on Customer Service” is prepared in response to §2114.002 of the Government Code, which requires that Texas state agencies biennially submit information gathered from customers about the quality of agency services to the Office of the Governor’s (OOG) Budget and Policy Team and the Legislative Budget Board (LBB).
This report reflects the combined efforts of the Texas Department of State Health Services (DSHS) divisions during the State Fiscal Year (SFY) 2020 and SFY 2021 reporting period (September 2019 to August 2021).
The DSHS mission is “To improve the health, safety, and well-being of Texans through good stewardship of public resources, and a focus on core public health functions.” In pursuit of this mission, DSHS divisions administer a wide array of surveys to assess the quality of DSHS services. This report includes results of DSHS surveys that examine customer satisfaction in various programs. DSHS divisions use survey feedback to help improve customer service for individuals served in those programs.
DSHS divisions and programs independently conduct surveys that include questions about customer satisfaction with specific agency programs and services. This report presents descriptions and major findings from the following surveys:
• Children with Special Health Care Needs (CSHCN) Systems Development Group Case Management and Family Supports and Community Resources Family Satisfaction Surveys
• Business Filing and Verification Section – Customer Service Satisfaction Survey
• Surveillance Section – Customer Service Satisfaction Survey• Human Immunodeficiency Virus (HIV) Care Services Ryan White Part
B – Post Monitoring Satisfaction Survey• Laboratory Services Testing – Customer Satisfaction Survey• South Texas Laboratory – Water Sample Testing Survey
Overall, DSHS obtained feedback from a diverse group of customers. However, given the multitude of programs operated and customer groups served, it is possible this report only reflects a subset of all customers served in DSHS. Still, most respondents provided positive feedback regarding the services and supports they received, while a small percentage offered opportunities for improvement.
DSHS Strategic Plan for 2023-2027, Part II H-2
Department of State Health Services
DSHS conducted six surveys during SFY 2020 and SFY 2021 that collected customer
satisfaction data. More than 2,600 responses were received through these surveys,
primarily from families of children with special health care needs. For readability,
this chapter is organized into three sections:
● Community Health Improvement
CSHCN Systems Development Group Case Management and Family
Supports and Community Resources Family Satisfaction Surveys
● Consumer Protection Division
Business Filing and Verification Section – Customer Service Satisfaction
Survey
Surveillance Section Customer Service Satisfaction Survey
● Laboratory and Infectious Disease
Human Immunodeficiency Virus Care Services Ryan White Part-B, Post
Monitoring Satisfaction Survey
Laboratory Services Testing Customer Satisfaction Survey
South Texas Laboratory – Water Sample Testing Survey
Community Health Improvement
CSHCN Systems Development Group Case
Management and Family Supports and
Community Resources Family Satisfaction
Surveys
Purpose
The CSHCN Systems Development Group (SDG) serves children ages 0 to 21 with
special health care needs. The program works to strengthen community-based
services to improve systems of care for children and youth with special health care
needs by funding organizations across Texas through two different contracts: Case
DSHS Strategic Plan for 2023-2027, Part II H-3
Management (CASE) and Family Support and Community Resources (FSCR). CASE
contractors work in partnership with children and youth with special health care
needs (CYSHCN) and their families to assess needs, develop service plans, provide
linkages to state and local resources, and coordinate care. FSCR contractors help
CYSHCN and their families by providing a wide range of services and activities in
response to community needs. Services and activities include respite assistance,
educational workshops, recreational and fitness programs, parent to parent
networking, and crisis prevention.
In the first quarter of SFY 2020, CSHCN SDG developed separate FSCR and CASE
family experience surveys to better assess each contractor program. Previously, the
survey was the same for both contracts. The new FSCR family experience survey
gauges contractor responsiveness to family inquiries, respect for culture and
traditions, quality of linkages to needed resources, facilitation of parent-to-parent
connections, and support in helping families feel included in the community.
Additionally, the CASE survey measures family satisfaction with service plan
development, emergency preparedness planning, timeliness of follow-up, and
shared decision-making for their child.
Sample and Methods
The CSHCN FSCR and CASE Family Satisfaction Surveys were distributed during two
separate time periods, one for SFY 2020 and one for SFY 2021. CSHCN SDG
contractors sought responses from all families served by their organization with
CSHCN SDG funding. All families served were provided a survey at least once
during the contract year. Paper and online surveys were offered in both English and
Spanish. To ensure distribution, the CSHCN SDG sent each contractor printed
surveys, return envelopes, and links to the online surveys. Individuals who
completed a paper survey sent their response via postal mail to DSHS.
In SFY 2020, there were 558 completed FSCR responses out of 4,715 surveys
distributed by the CSHCN SDG contractors (11.8 percent response rate). There
were 116 completed CASE responses out of 1,004 surveys distributed by CSHCN
SDG contractors (11.6 percent response rate).
In SFY 2021, there were 847 completed FSCR responses out of 4,687 surveys
distributed by the CSHCN SDG contractors (18.1 percent response rate). There
were 146 completed CASE responses out of 1,077 surveys distributed by CSHCN
SDG contractors (13.5 percent response rate).
DSHS Strategic Plan for 2023-2027, Part II H-4
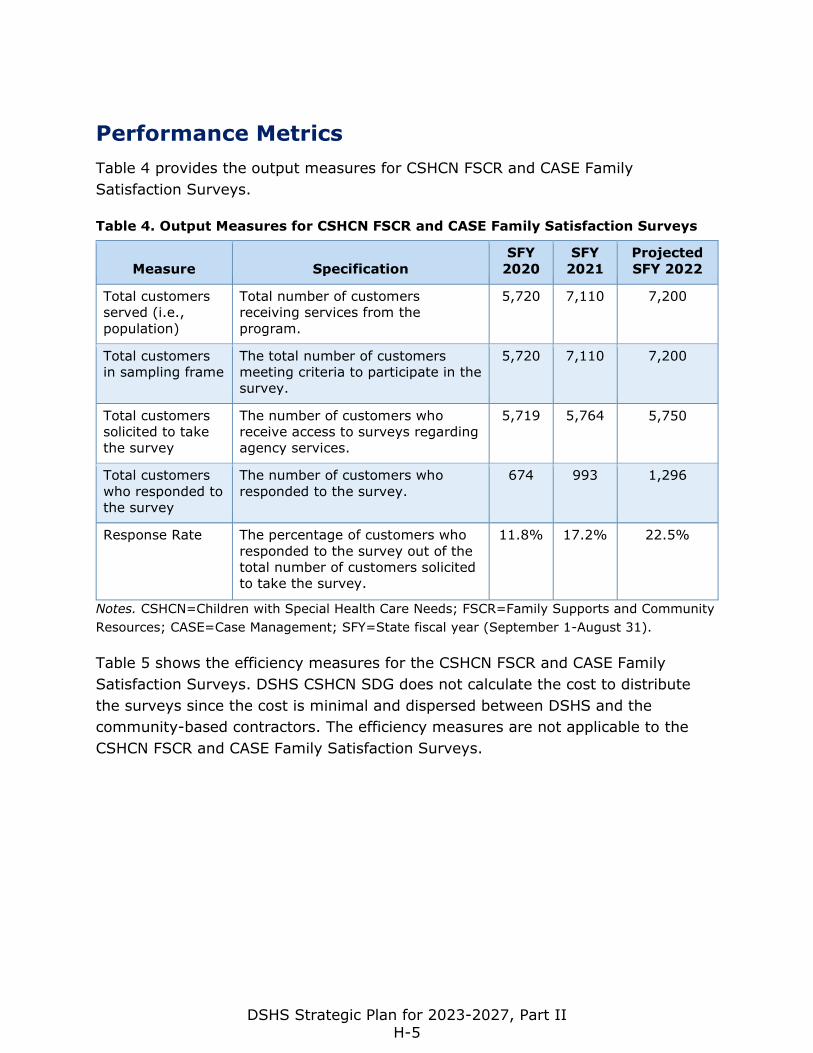
Performance Metrics
Table 4 provides the output measures for CSHCN FSCR and CASE Family
Satisfaction Surveys.
Table 4. Output Measures for CSHCN FSCR and CASE Family Satisfaction Surveys
Measure Specification
SFY
2020
SFY
2021
Projected
SFY 2022
Total customers
served (i.e.,
population)
Total number of customers
receiving services from the
program.
5,720 7,110 7,200
Total customers
in sampling frame
The total number of customers
meeting criteria to participate in the
survey.
5,720 7,110 7,200
Total customers
solicited to take
the survey
The number of customers who
receive access to surveys regarding
agency services.
5,719 5,764 5,750
Total customers
who responded to
the survey
The number of customers who
responded to the survey.
674 993 1,296
Response Rate The percentage of customers who
responded to the survey out of the
total number of customers solicited
to take the survey.
11.8% 17.2% 22.5%
Notes. CSHCN=Children with Special Health Care Needs; FSCR=Family Supports and Community
Resources; CASE=Case Management; SFY=State fiscal year (September 1-August 31).
Table 5 shows the efficiency measures for the CSHCN FSCR and CASE Family
Satisfaction Surveys. DSHS CSHCN SDG does not calculate the cost to distribute
the surveys since the cost is minimal and dispersed between DSHS and the
community-based contractors. The efficiency measures are not applicable to the
CSHCN FSCR and CASE Family Satisfaction Surveys.
DSHS Strategic Plan for 2023-2027, Part II H-5
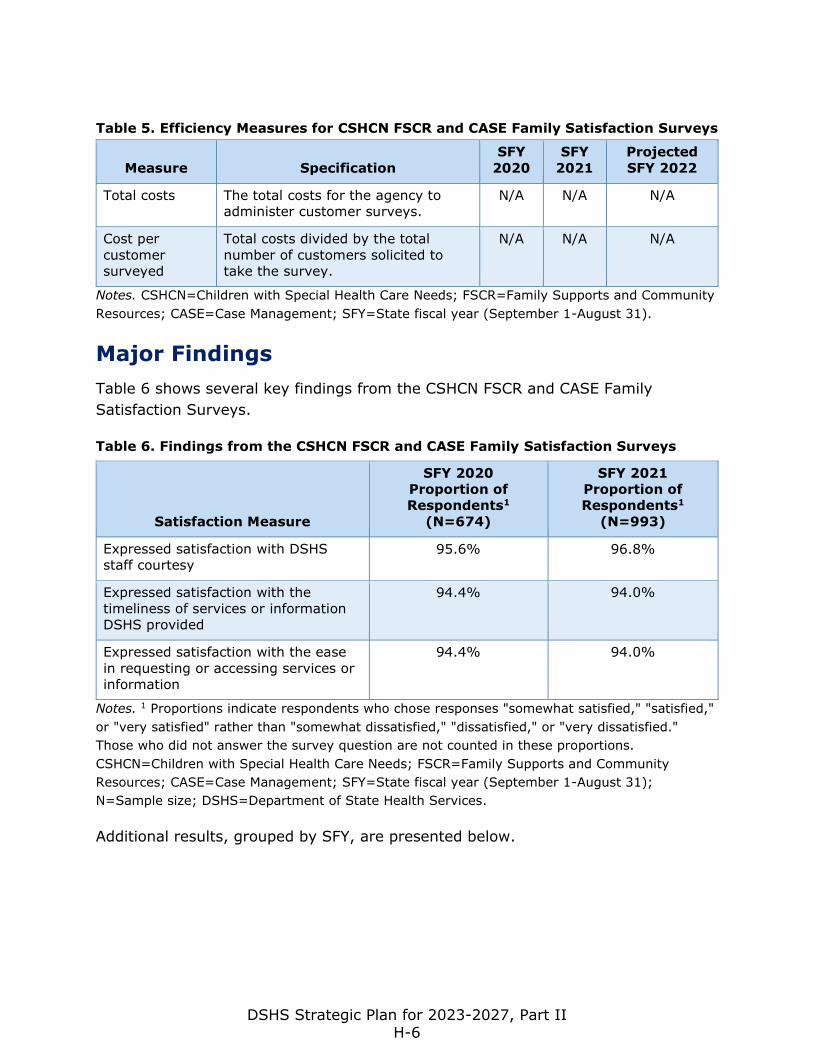
Table 5. Efficiency Measures for CSHCN FSCR and CASE Family Satisfaction Surveys
Measure Specification
SFY
2020
SFY
2021
Projected
SFY 2022
Total costs The total costs for the agency to
administer customer surveys.
N/A N/A N/A
Cost per
customer
surveyed
Total costs divided by the total
number of customers solicited to
take the survey.
N/A N/A N/A
Notes. CSHCN=Children with Special Health Care Needs; FSCR=Family Supports and Community
Resources; CASE=Case Management; SFY=State fiscal year (September 1-August 31).
Major Findings
Table 6 shows several key findings from the CSHCN FSCR and CASE Family
Satisfaction Surveys.
Table 6. Findings from the CSHCN FSCR and CASE Family Satisfaction Surveys
Satisfaction Measure
SFY 2020
Proportion of
Respondents1
(N=674)
SFY 2021
Proportion of
Respondents1
(N=993)
Expressed satisfaction with DSHS
staff courtesy 95.6% 96.8%
Expressed satisfaction with the
timeliness of services or information
DSHS provided
94.4% 94.0%
Expressed satisfaction with the ease
in requesting or accessing services or
information
94.4% 94.0%
Notes. 1 Proportions indicate respondents who chose responses "somewhat satisfied," "satisfied,"
or "very satisfied" rather than "somewhat dissatisfied," "dissatisfied," or "very dissatisfied."
Those who did not answer the survey question are not counted in these proportions.
CSHCN=Children with Special Health Care Needs; FSCR=Family Supports and Community
Resources; CASE=Case Management; SFY=State fiscal year (September 1-August 31);
N=Sample size; DSHS=Department of State Health Services.
Additional results, grouped by SFY, are presented below.
DSHS Strategic Plan for 2023-2027, Part II H-6
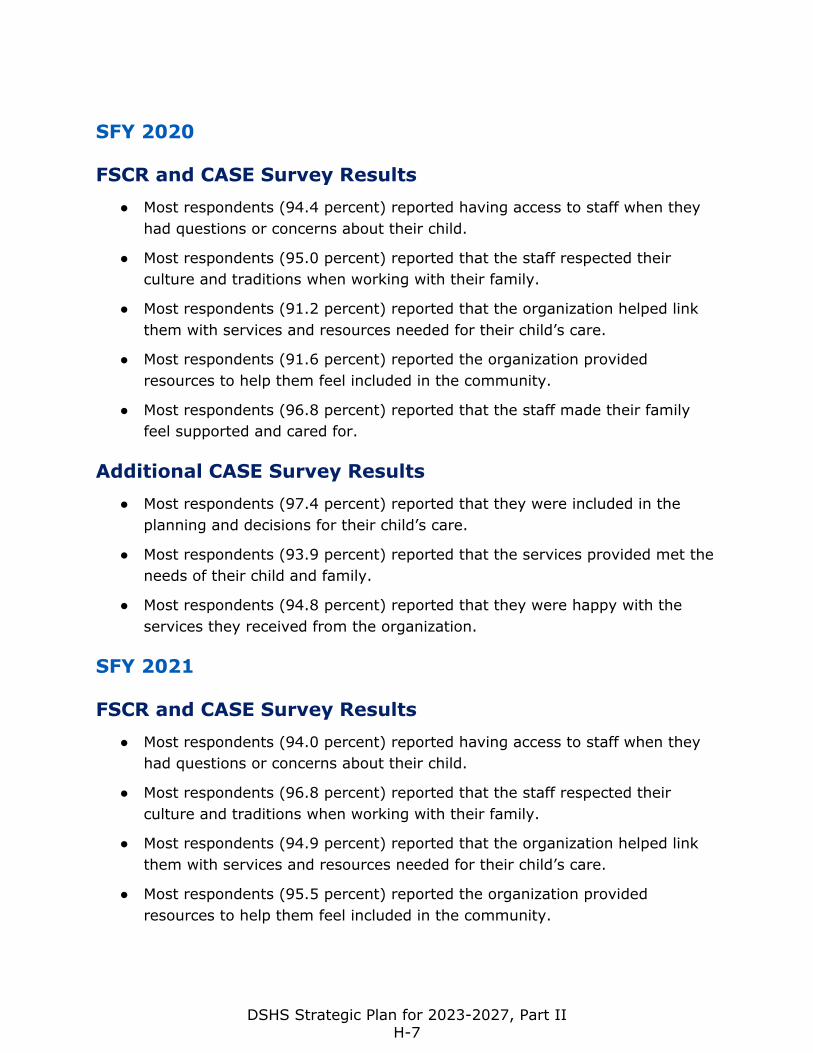
SFY 2020
FSCR and CASE Survey Results
● Most respondents (94.4 percent) reported having access to staff when they
had questions or concerns about their child.
● Most respondents (95.0 percent) reported that the staff respected their
culture and traditions when working with their family.
● Most respondents (91.2 percent) reported that the organization helped link
them with services and resources needed for their child’s care.
● Most respondents (91.6 percent) reported the organization provided
resources to help them feel included in the community.
● Most respondents (96.8 percent) reported that the staff made their family
feel supported and cared for.
Additional CASE Survey Results
● Most respondents (97.4 percent) reported that they were included in the
planning and decisions for their child’s care.
● Most respondents (93.9 percent) reported that the services provided met the
needs of their child and family.
● Most respondents (94.8 percent) reported that they were happy with the
services they received from the organization.
SFY 2021
FSCR and CASE Survey Results
● Most respondents (94.0 percent) reported having access to staff when they
had questions or concerns about their child.
● Most respondents (96.8 percent) reported that the staff respected their
culture and traditions when working with their family.
● Most respondents (94.9 percent) reported that the organization helped link
them with services and resources needed for their child’s care.
● Most respondents (95.5 percent) reported the organization provided
resources to help them feel included in the community.
DSHS Strategic Plan for 2023-2027, Part II H-7
● Most respondents (97.9 percent) reported that the staff made their family
feel supported and cared for.
Additional CASE Survey Results
● Most respondents (95.9 percent) reported that they were included in the
planning and decisions for their child’s care.
● Most respondents (93.2 percent) reported that the provided services met the
needs of their child and family.
● Most respondents (95.9 percent) reported that they were happy with the
services they received from the organization.
Consumer Protection Division
Business Filing and Verification Section –
Customer Service Satisfaction Survey
Purpose
The Business Filing and Verification Section (BFV) serves businesses and individuals
by processing and issuing certifications, licenses, and registrations to applicants,
while ensuring compliance with specific program regulations to ensure the safety of
Texans. The types of businesses and individuals that are served include retail stores
that sell abusable volatile chemicals; asbestos abatement; hazardous products;
retail consumable hemp, manufacturers, and distributors; lead abatement; youth
camps; drugs and medical devices manufacturers, distributors and salvagers; food
manufacturers, distributors, and salvagers; emergency medical services personnel
and providers; milk and dairy; radiation producing machines and radioactive
materials; industrial radiographers; retail food and school food establishments; and
tattoo and body piercing studios.
The BFV staff also provide customer service to businesses and individuals via email
and the telephone. In addition, staff provide answers and instructions related to the
submission of licensing applications and fees.
The purpose of the BFV Customer Service Satisfaction Survey is to measure
customer satisfaction with the BFV staff, the application submission experience, and
the information and instructions posted on the program website pages. The survey
DSHS Strategic Plan for 2023-2027, Part II H-8
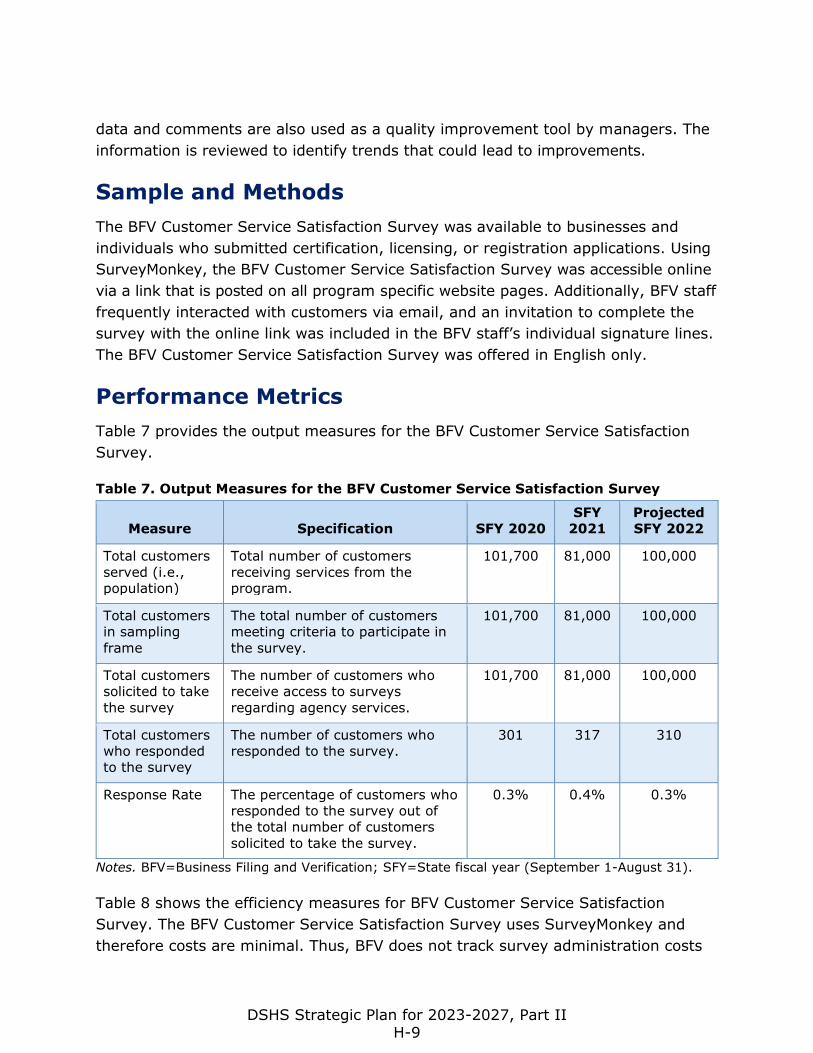
data and comments are also used as a quality improvement tool by managers. The
information is reviewed to identify trends that could lead to improvements.
Sample and Methods
The BFV Customer Service Satisfaction Survey was available to businesses and
individuals who submitted certification, licensing, or registration applications. Using
SurveyMonkey, the BFV Customer Service Satisfaction Survey was accessible online
via a link that is posted on all program specific website pages. Additionally, BFV staff
frequently interacted with customers via email, and an invitation to complete the
survey with the online link was included in the BFV staff’s individual signature lines.
The BFV Customer Service Satisfaction Survey was offered in English only.
Performance Metrics
Table 7 provides the output measures for the BFV Customer Service Satisfaction
Survey.
Table 7. Output Measures for the BFV Customer Service Satisfaction Survey
Measure Specification SFY 2020
SFY
2021
Projected
SFY 2022
Total customers
served (i.e.,
population)
Total number of customers
receiving services from the
program.
101,700 81,000 100,000
Total customers
in sampling
frame
The total number of customers
meeting criteria to participate in
the survey.
101,700 81,000 100,000
Total customers
solicited to take
the survey
The number of customers who
receive access to surveys
regarding agency services.
101,700 81,000 100,000
Total customers
who responded
to the survey
The number of customers who
responded to the survey.
301 317 310
Response Rate The percentage of customers who
responded to the survey out of
the total number of customers
solicited to take the survey.
0.3% 0.4% 0.3%
Notes. BFV=Business Filing and Verification; SFY=State fiscal year (September 1-August 31).
Table 8 shows the efficiency measures for BFV Customer Service Satisfaction
Survey. The BFV Customer Service Satisfaction Survey uses SurveyMonkey and
therefore costs are minimal. Thus, BFV does not track survey administration costs
DSHS Strategic Plan for 2023-2027, Part II H-9
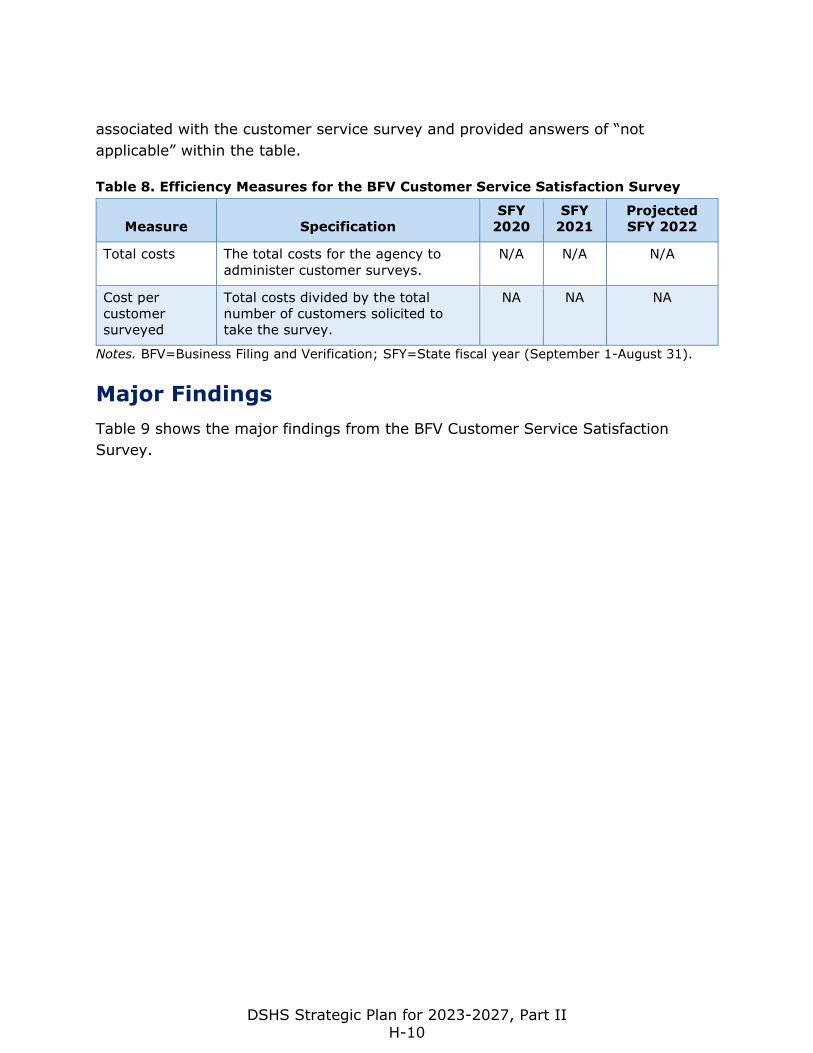
associated with the customer service survey and provided answers of “not
applicable” within the table.
Table 8. Efficiency Measures for the BFV Customer Service Satisfaction Survey
Measure Specification
SFY
2020
SFY
2021
Projected
SFY 2022
Total costs The total costs for the agency to
administer customer surveys.
N/A N/A N/A
Cost per
customer
surveyed
Total costs divided by the total
number of customers solicited to
take the survey.
NA NA NA
Notes. BFV=Business Filing and Verification; SFY=State fiscal year (September 1-August 31).
Major Findings
Table 9 shows the major findings from the BFV Customer Service Satisfaction
Survey.
DSHS Strategic Plan for 2023-2027, Part II H-10
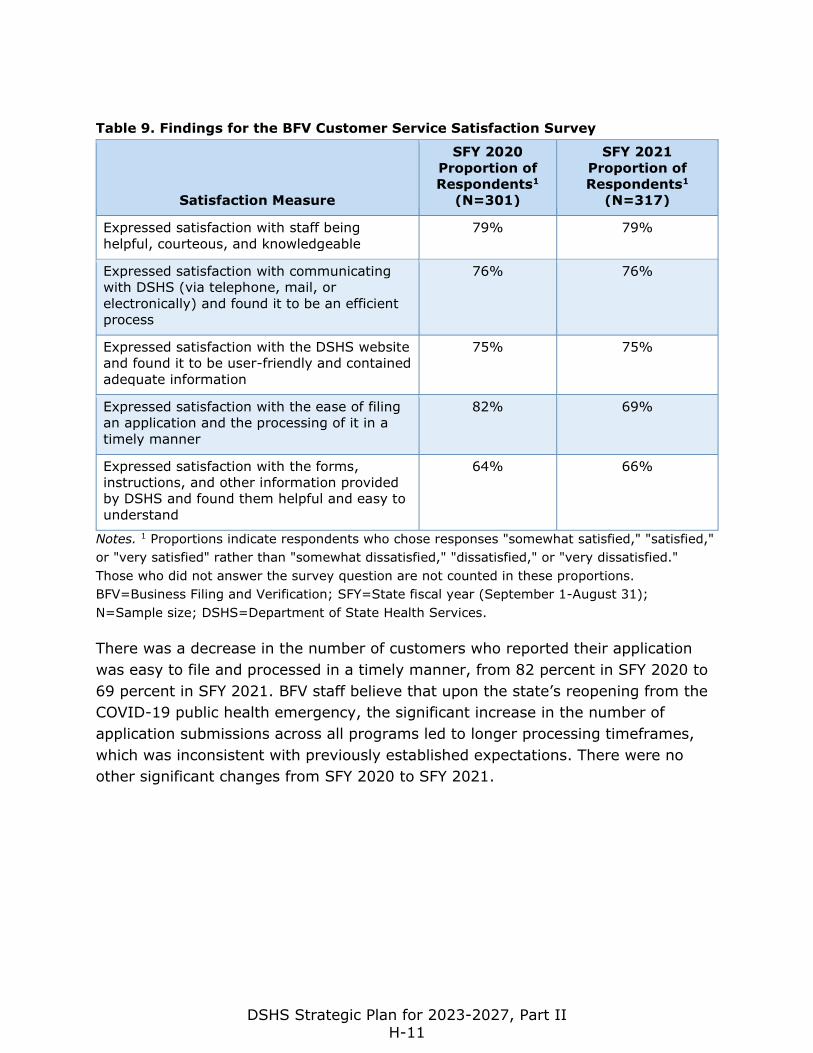
Table 9. Findings for the BFV Customer Service Satisfaction Survey
Satisfaction Measure
SFY 2020
Proportion of
Respondents1
(N=301)
SFY 2021
Proportion of
Respondents1
(N=317)
Expressed satisfaction with staff being
helpful, courteous, and knowledgeable
79% 79%
Expressed satisfaction with communicating
with DSHS (via telephone, mail, or
electronically) and found it to be an efficient
process
76% 76%
Expressed satisfaction with the DSHS website
and found it to be user-friendly and contained
adequate information
75% 75%
Expressed satisfaction with the ease of filing
an application and the processing of it in a
timely manner
82% 69%
Expressed satisfaction with the forms,
instructions, and other information provided
by DSHS and found them helpful and easy to
understand
64% 66%
Notes. 1 Proportions indicate respondents who chose responses "somewhat satisfied," "satisfied,"
or "very satisfied" rather than "somewhat dissatisfied," "dissatisfied," or "very dissatisfied."
Those who did not answer the survey question are not counted in these proportions.
BFV=Business Filing and Verification; SFY=State fiscal year (September 1-August 31);
N=Sample size; DSHS=Department of State Health Services.
There was a decrease in the number of customers who reported their application
was easy to file and processed in a timely manner, from 82 percent in SFY 2020 to
69 percent in SFY 2021. BFV staff believe that upon the state’s reopening from the
COVID-19 public health emergency, the significant increase in the number of
application submissions across all programs led to longer processing timeframes,
which was inconsistent with previously established expectations. There were no
other significant changes from SFY 2020 to SFY 2021.
DSHS Strategic Plan for 2023-2027, Part II H-11
Surveillance Section Customer Service
Satisfaction Survey
Purpose
The Surveillance Section of the Consumer Protection Division protects consumer
health and safety by ensuring compliance with state and federal law and rules
regulated under DSHS. Activities performed by Surveillance Section staff include
inspections, product and environmental sampling, complaint investigations, and
technical assistance.
The entities inspected include retail stores that sell abusable volatile chemicals or
hazardous products, asbestos abatement contractors, lead abatement contractors,
tattoo and body piercing studios, drugs and medical device manufacturers or
distributors, food manufacturers or warehouses, food and drug salvagers, milk
plants and dairy farms, entities that use and store radioactive materials, x-ray
machines, and mammography machines.
The purpose of the Surveillance Section Customer Service Survey is to determine
customer satisfaction of the regulated entities that interact with Surveillance
Section staff and provide the regulated entities a mechanism for input into the
inspections process. Additionally, the Surveillance Section Customer Service Survey
data and comments can be used as a quality assurance tool by managers. The
information is reviewed to identify trends that may lead to training opportunities for
staff and/or regulated entities.
Sample and Methods
The Surveillance Section Customer Service Survey, conducted online through
SurveyMonkey, is made available to all regulated entities who met with an
inspector. The survey was made available on March 1, 2017 and has been
perpetually listed for entities to complete. The link to the survey is printed on the
back of inspectors' business cards. Inspectors are required to present their business
cards and credentials upon entering a firm. On average, the Surveillance Section
conducts approximately 40,000 inspections annually. The survey is offered online
and in English only. From September 1, 2017 through August 31, 2021, 171
surveys were completed. For the reporting period of SFY 2020 and SFY 2021, a
total of 21 surveys were completed. The unit conducted additional remote and
DSHS Strategic Plan for 2023-2027, Part II H-12
virtual inspections during this time; however, due to the COVID-19 public health
emergency, lower response numbers were collected.
Performance Metrics
Table 10 provides the output measures for the Surveillance Section Customer
Service Survey.
Table 10. Output Measures for the Surveillance Section Customer Service Survey
Measure Specification
SFY
2020
SFY
2021
Projected SFY
2022
Total customers
served (i.e.,
population)
Total number of customers
receiving services from the
program.
53,800 69,181 61,500
Total customers
in sampling
frame
The total number of customers
meeting criteria to participate
in the survey.
53,800 69,181 61,500
Total customers
solicited to take
the survey
The number of customers who
receive access to surveys
regarding agency services.
53,800 69,181 61,500
Total customers
who responded
to the survey
The number of customers who
responded to the survey.
1 20 100
Response Rate The percentage of customers
who responded to the survey
out of the total number of
customers solicited to take the
survey.
0.00% 0.03% 0.16%
Notes. SFY=State fiscal year (September 1-August 31).
Table 11 provides efficiency measures for Surveillance Section Customer Service
Survey. Because the survey was conducted through SurveyMonkey, costs are
minimal. Thus, the Surveillance Section does not track costs associated with the
customer service survey and provided “not applicable” in the table.
DSHS Strategic Plan for 2023-2027, Part II H-13
Table 11. Efficiency Measures for the Surveillance Section Customer Service
Survey
Measure Specification
SFY
2020
SFY
2021
Projected
SFY 2022
Total costs The total costs for the agency to
administer customer surveys.
N/A N/A N/A
Cost per
customer
surveyed
Total costs divided by the total
number of customers solicited to
take the survey.
N/A N/A N/A
Notes. SFY=State fiscal year (September 1-August 31).
Major Findings
Table 12 presents the major findings from the Surveillance Section Customer
Service Survey.
DSHS Strategic Plan for 2023-2027, Part II H-14
Table 12. Findings from the Surveillance Section Customer Service Survey
Measure
SFY 2020
Proportion of
Respondents1
(N=1)
SFY 2021
Proportion of
Respondents
(N=20)
The inspector introduced himself/herself and
presented his/her credentials/ID before the
inspection.
N/A 100%
The purpose of the inspection was
adequately described at the beginning of the
inspection.
N/A 98.2%
The on-site inspection was completed in a
reasonable amount of time and did not
unduly interfere with the delivery of
services.
N/A 94.6%
The DSHS inspector was prepared and well
organized.
N/A 98.2%
The inspection was handled in a courteous
and professional manner.
N/A 98.2%
The inspector clearly explained any
applicable state or federal requirements,
answered questions adequately, and/or
referred them to an alternate source for the
information.
N/A 98.2%
I now have a better understanding or
knowledge of state and/or federal
requirements affecting my business.
N/A 94.6%
The inspector clearly explained their
findings.
N/A 98.2%
If deficiencies, observations, or violations
were found, the inspector clearly explained
the timeframe and/or process for corrective
action.
N/A 96.4%
Notes. 1 Results are not presented for SFY 2020 due to the small sample size (the COVID-19
public health emergency limited the number of responses collected).
SFY=State fiscal year (September 1-August 31); N=Sample size; DSHS=Department of State
Health Services.
DSHS Strategic Plan for 2023-2027, Part II H-15
Laboratory and Infectious Disease
Human Immunodeficiency Virus (HIV) Care
Services Ryan White Part-B, Post Monitoring
Satisfaction Survey
Purpose
DSHS HIV Care Services Ryan White Part-B and State Services Program serves
approximately 35,000 low income people living with HIV in Texas. This program
provides resources and funding to access medical and support services. The
program’s focus is to promote improved health outcomes and reduce HIV
transmission. The HIV Care Services Group conducts annual program monitoring to
assess the compliance to the 27 HIV Program Service Standards of Care of each 58
funded service providers across the state. This survey summary covers SFY 2020
and SFY 2021 of the HIV Care Services Post Monitoring Survey results.
The purpose of the annual Texas HIV Care Services Post Monitoring Survey is to
assess and gather feedback from program funded medical clinics and support
service agencies on the monitoring process and their satisfaction with their
experience. The survey, which is conducted by the HIV Care Services Groups’
Quality Management Coordinator, is an annual quality management activity.
Sample and Methods
The HIV Care Services Post Monitoring Survey sought responses from 58 Ryan
White Part-B and State Services funded service providers in SFY 2020 and SFY
2021.
During SFY 2021, the program implemented a burden reduction process, cutting
monitoring in half by monitoring 28 service providers in SFY 2021 and the
remaining 30 service providers in SFY 2022. The survey link was sent to each
monitored service provider agency representative after monitoring was completed.
The study was conducted electronically using Microsoft Forms. The surveys were
offered in English only. Individuals completed the survey themselves and
electronically submitted their responses using a survey link with the option to self-
identify or remain anonymous.
DSHS Strategic Plan for 2023-2027, Part II H-16
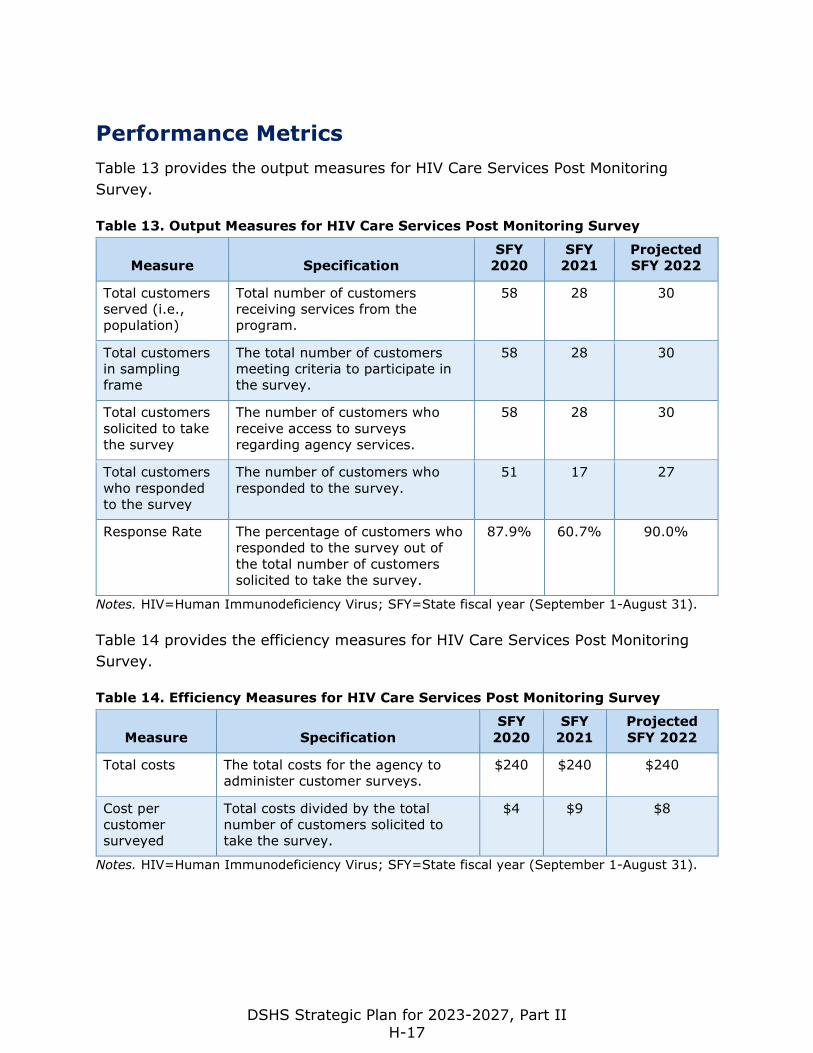
Performance Metrics
Table 13 provides the output measures for HIV Care Services Post Monitoring
Survey.
Table 13. Output Measures for HIV Care Services Post Monitoring Survey
Measure Specification
SFY
2020
SFY
2021
Projected
SFY 2022
Total customers
served (i.e.,
population)
Total number of customers
receiving services from the
program.
58 28 30
Total customers
in sampling
frame
The total number of customers
meeting criteria to participate in
the survey.
58 28 30
Total customers
solicited to take
the survey
The number of customers who
receive access to surveys
regarding agency services.
58 28 30
Total customers
who responded
to the survey
The number of customers who
responded to the survey.
51 17 27
Response Rate The percentage of customers who
responded to the survey out of
the total number of customers
solicited to take the survey.
87.9% 60.7% 90.0%
Notes. HIV=Human Immunodeficiency Virus; SFY=State fiscal year (September 1-August 31).
Table 14 provides the efficiency measures for HIV Care Services Post Monitoring
Survey.
Table 14. Efficiency Measures for HIV Care Services Post Monitoring Survey
Measure Specification
SFY
2020
SFY
2021
Projected
SFY 2022
Total costs The total costs for the agency to
administer customer surveys.
$240 $240 $240
Cost per
customer
surveyed
Total costs divided by the total
number of customers solicited to
take the survey.
$4 $9 $8
Notes. HIV=Human Immunodeficiency Virus; SFY=State fiscal year (September 1-August 31).
DSHS Strategic Plan for 2023-2027, Part II H-17
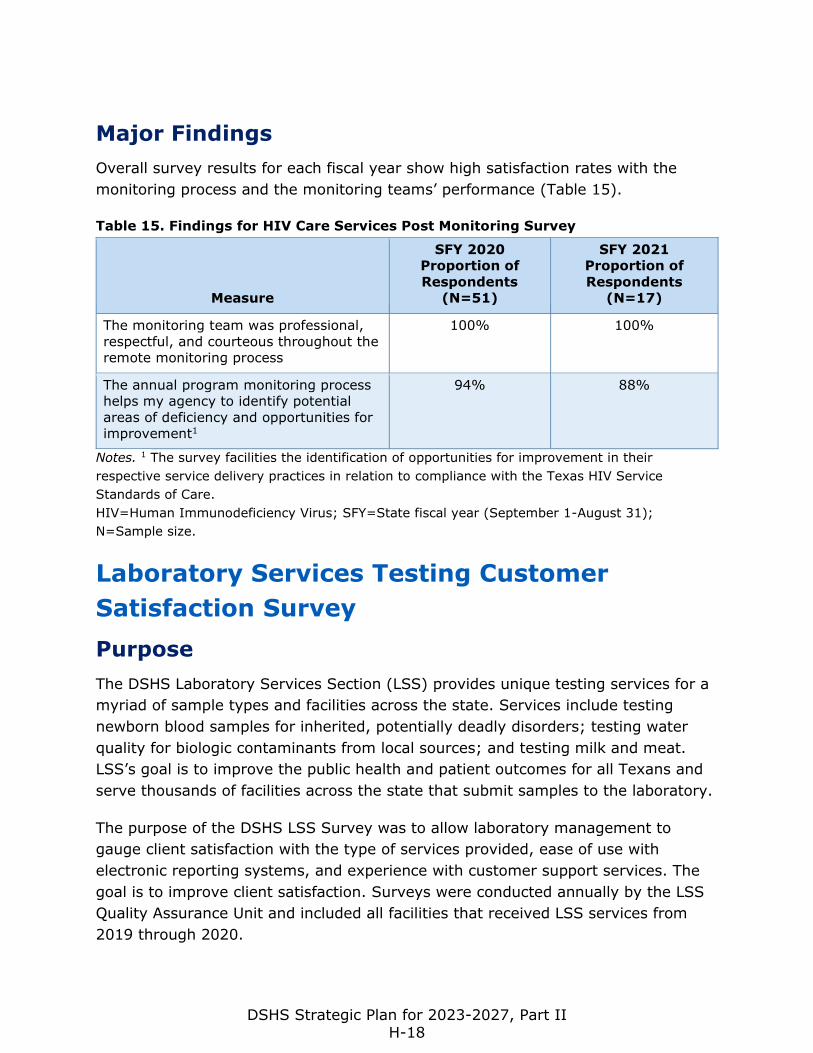
Major Findings
Overall survey results for each fiscal year show high satisfaction rates with the
monitoring process and the monitoring teams’ performance (Table 15).
Table 15. Findings for HIV Care Services Post Monitoring Survey
Measure
SFY 2020
Proportion of
Respondents
(N=51)
SFY 2021
Proportion of
Respondents
(N=17)
The monitoring team was professional,
respectful, and courteous throughout the
remote monitoring process
100% 100%
The annual program monitoring process
helps my agency to identify potential
areas of deficiency and opportunities for
improvement1
94% 88%
Notes. 1 The survey facilities the identification of opportunities for improvement in their
respective service delivery practices in relation to compliance with the Texas HIV Service
Standards of Care.
HIV=Human Immunodeficiency Virus; SFY=State fiscal year (September 1-August 31);
N=Sample size.
Laboratory Services Testing Customer
Satisfaction Survey
Purpose
The DSHS Laboratory Services Section (LSS) provides unique testing services for a
myriad of sample types and facilities across the state. Services include testing
newborn blood samples for inherited, potentially deadly disorders; testing water
quality for biologic contaminants from local sources; and testing milk and meat.
LSS’s goal is to improve the public health and patient outcomes for all Texans and
serve thousands of facilities across the state that submit samples to the laboratory.
The purpose of the DSHS LSS Survey was to allow laboratory management to
gauge client satisfaction with the type of services provided, ease of use with
electronic reporting systems, and experience with customer support services. The
goal is to improve client satisfaction. Surveys were conducted annually by the LSS
Quality Assurance Unit and included all facilities that received LSS services from
2019 through 2020.
DSHS Strategic Plan for 2023-2027, Part II H-18
Sample and Methods
DSHS LSS issued a survey for services rendered in 2019 and 2020 with surveys
issued the following year, 2020 and 2021 respectively. Facilities were made aware
of the survey opportunities through notices placed on results web portals, issued
via GovDelivery or ListServ, email, and the DSHS website. The responses could be
completed electronically by facility representatives for 30 days. The 2020 DSHS LSS
Survey closed February 28, 2020 and the 2021 DSHS LSS Survey closed on April
15, 2021. The surveys were offered in English and were available online only.
Performance Metrics
Table 16 provides output measures for the DSHS LSS Survey. The number of
customers who received access to the survey (26,323) is much larger than the
number of customers served in the program for several reasons:
● The laboratory openly advertises to everyone via the laboratory website,
online portals, and email distribution lists. The website can be seen by
everyone, including the general public. Online portals are actively seen by a
subset of active submitters (not all submitters use the online portals). The
email distribution lists are open to anyone who takes the time to subscribe.
The laboratory maintains seven email distribution lists and took count of the
number of email addresses part of each distribution list to arrive at 26,323.
● For every active submitting entity, many supporting staff members interact
with the laboratory on a regular or sporadic basis. Each submitting entity,
whether it be a clinic, hospital or individual, has supporting staff including
administrative, nurses, techs, etc. In the cases of hospitals and clinics, their
support staff, all those who work for the submitting
doctor/hospital/clinic/etc., can be large and often siloed. For instance, techs
sending out specimens are in a different area from those attaching results to
patient records, etc. Each has a portion of the job to ensure their patients are
taken care of. Each has its own experiences when interacting with the
laboratory. To get the information to the staff that needs it, the laboratory
maintains email distribution lists that send out periodic alerts, reminders, etc.
Customers, including all support staff, can sign up to be on any email
distribution list available.
DSHS Strategic Plan for 2023-2027, Part II H-19
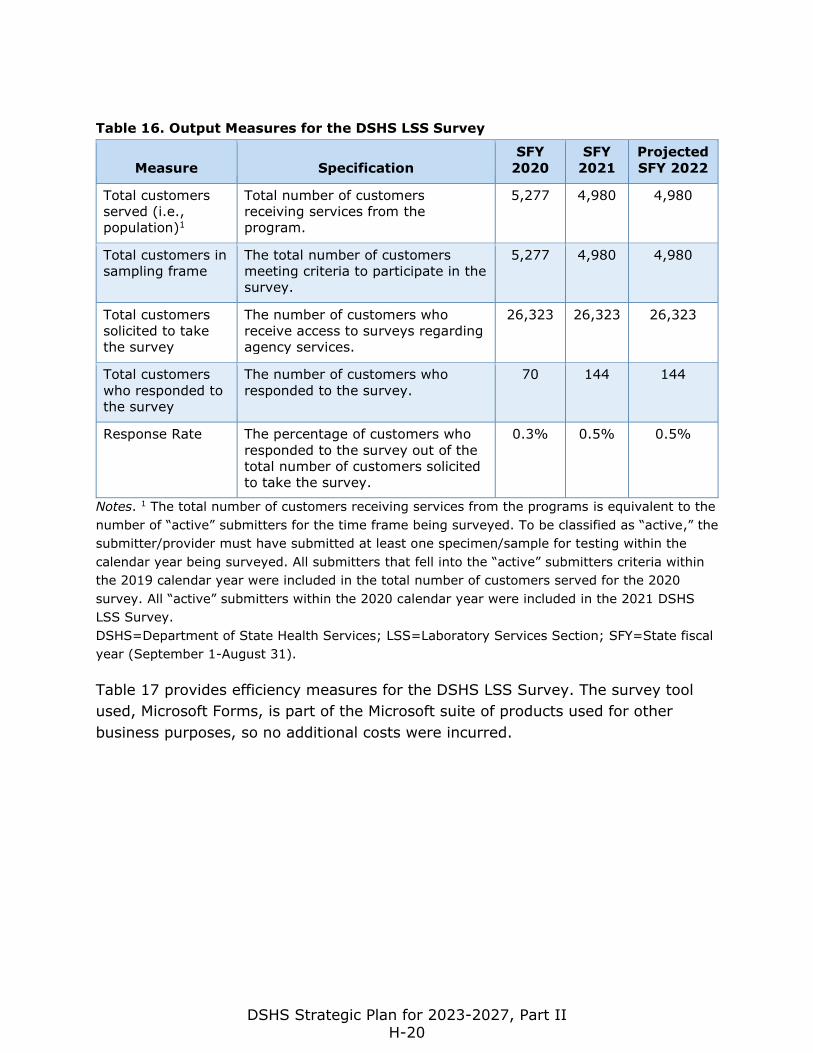
Table 16. Output Measures for the DSHS LSS Survey
Measure Specification
SFY
2020
SFY
2021
Projected
SFY 2022
Total customers
served (i.e.,
population)1
Total number of customers
receiving services from the
program.
5,277 4,980 4,980
Total customers in
sampling frame
The total number of customers
meeting criteria to participate in the
survey.
5,277 4,980 4,980
Total customers
solicited to take
the survey
The number of customers who
receive access to surveys regarding
agency services.
26,323 26,323 26,323
Total customers
who responded to
the survey
The number of customers who
responded to the survey.
70 144 144
Response Rate The percentage of customers who
responded to the survey out of the
total number of customers solicited
to take the survey.
0.3% 0.5% 0.5%
Notes. 1 The total number of customers receiving services from the programs is equivalent to the
number of “active” submitters for the time frame being surveyed. To be classified as “active,” the
submitter/provider must have submitted at least one specimen/sample for testing within the
calendar year being surveyed. All submitters that fell into the “active” submitters criteria within
the 2019 calendar year were included in the total number of customers served for the 2020
survey. All “active” submitters within the 2020 calendar year were included in the 2021 DSHS
LSS Survey.
DSHS=Department of State Health Services; LSS=Laboratory Services Section; SFY=State fiscal
year (September 1-August 31).
Table 17 provides efficiency measures for the DSHS LSS Survey. The survey tool
used, Microsoft Forms, is part of the Microsoft suite of products used for other
business purposes, so no additional costs were incurred.
DSHS Strategic Plan for 2023-2027, Part II H-20
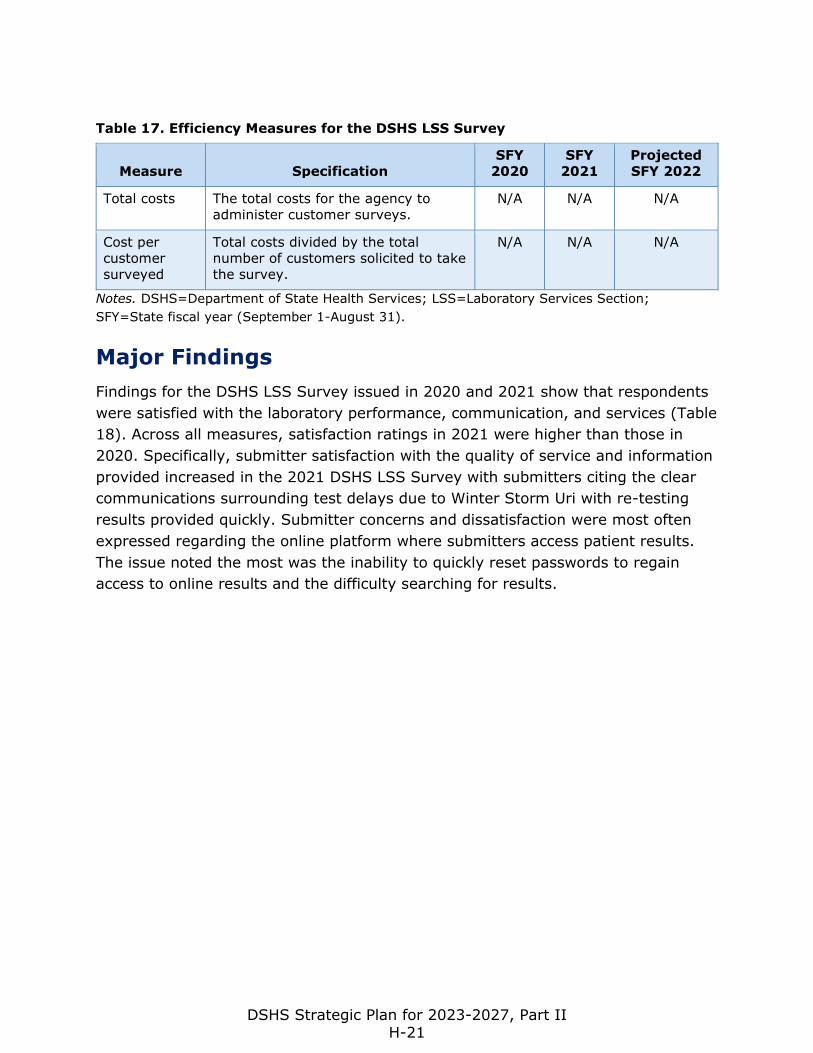
Table 17. Efficiency Measures for the DSHS LSS Survey
Measure Specification
SFY
2020
SFY
2021
Projected
SFY 2022
Total costs The total costs for the agency to
administer customer surveys.
N/A N/A N/A
Cost per
customer
surveyed
Total costs divided by the total
number of customers solicited to take
the survey.
N/A N/A N/A
Notes. DSHS=Department of State Health Services; LSS=Laboratory Services Section;
SFY=State fiscal year (September 1-August 31).
Major Findings
Findings for the DSHS LSS Survey issued in 2020 and 2021 show that respondents
were satisfied with the laboratory performance, communication, and services (Table
18). Across all measures, satisfaction ratings in 2021 were higher than those in
2020. Specifically, submitter satisfaction with the quality of service and information
provided increased in the 2021 DSHS LSS Survey with submitters citing the clear
communications surrounding test delays due to Winter Storm Uri with re-testing
results provided quickly. Submitter concerns and dissatisfaction were most often
expressed regarding the online platform where submitters access patient results.
The issue noted the most was the inability to quickly reset passwords to regain
access to online results and the difficulty searching for results.
DSHS Strategic Plan for 2023-2027, Part II H-21
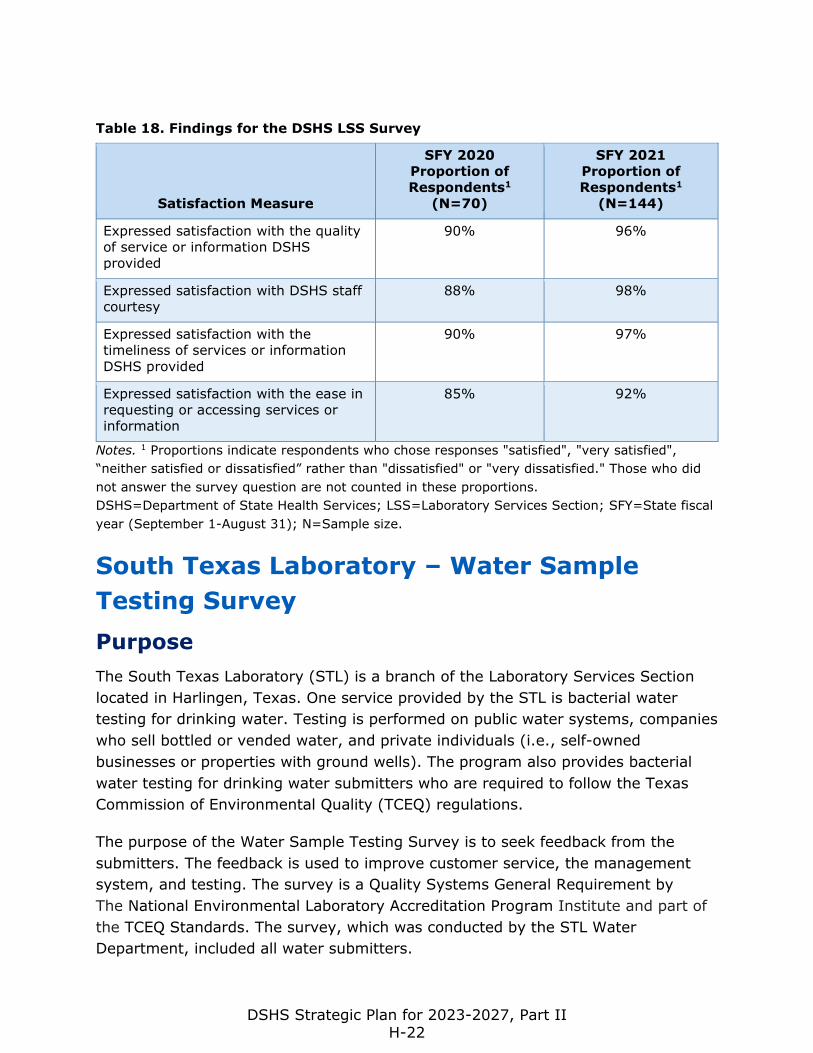
Table 18. Findings for the DSHS LSS Survey
Satisfaction Measure
SFY 2020
Proportion of
Respondents1
(N=70)
SFY 2021
Proportion of
Respondents1
(N=144)
Expressed satisfaction with the quality
of service or information DSHS
provided
90% 96%
Expressed satisfaction with DSHS staff
courtesy
88% 98%
Expressed satisfaction with the
timeliness of services or information
DSHS provided
90% 97%
Expressed satisfaction with the ease in
requesting or accessing services or
information
85% 92%
Notes. 1 Proportions indicate respondents who chose responses "satisfied", "very satisfied",
“neither satisfied or dissatisfied” rather than "dissatisfied" or "very dissatisfied." Those who did
not answer the survey question are not counted in these proportions.
DSHS=Department of State Health Services; LSS=Laboratory Services Section; SFY=State fiscal
year (September 1-August 31); N=Sample size.
South Texas Laboratory – Water Sample
Testing Survey
Purpose
The South Texas Laboratory (STL) is a branch of the Laboratory Services Section
located in Harlingen, Texas. One service provided by the STL is bacterial water
testing for drinking water. Testing is performed on public water systems, companies
who sell bottled or vended water, and private individuals (i.e., self-owned
businesses or properties with ground wells). The program also provides bacterial
water testing for drinking water submitters who are required to follow the Texas
Commission of Environmental Quality (TCEQ) regulations.
The purpose of the Water Sample Testing Survey is to seek feedback from the
submitters. The feedback is used to improve customer service, the management
system, and testing. The survey is a Quality Systems General Requirement by
The National Environmental Laboratory Accreditation Program Institute and part of
the TCEQ Standards. The survey, which was conducted by the STL Water
Department, included all water submitters.
DSHS Strategic Plan for 2023-2027, Part II H-22
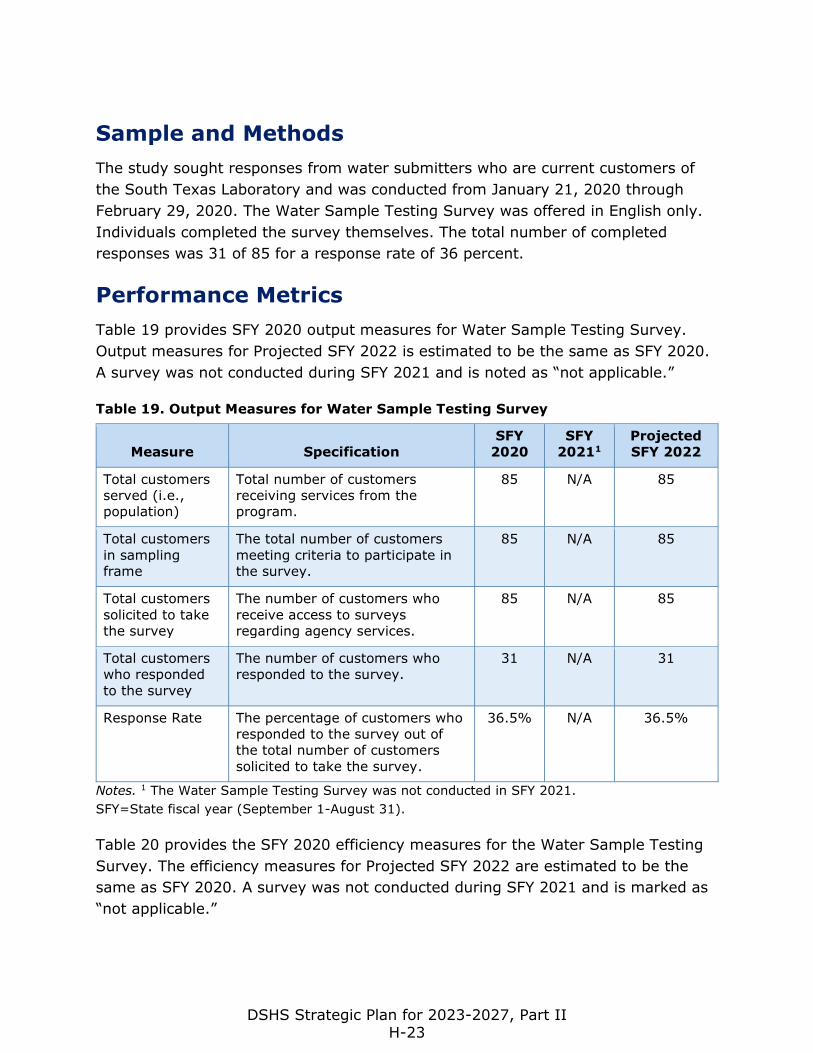
Sample and Methods
The study sought responses from water submitters who are current customers of
the South Texas Laboratory and was conducted from January 21, 2020 through
February 29, 2020. The Water Sample Testing Survey was offered in English only.
Individuals completed the survey themselves. The total number of completed
responses was 31 of 85 for a response rate of 36 percent.
Performance Metrics
Table 19 provides SFY 2020 output measures for Water Sample Testing Survey.
Output measures for Projected SFY 2022 is estimated to be the same as SFY 2020.
A survey was not conducted during SFY 2021 and is noted as “not applicable.”
Table 19. Output Measures for Water Sample Testing Survey
Measure Specification
SFY
2020
SFY
20211
Projected
SFY 2022
Total customers
served (i.e.,
population)
Total number of customers
receiving services from the
program.
85 N/A 85
Total customers
in sampling
frame
The total number of customers
meeting criteria to participate in
the survey.
85 N/A 85
Total customers
solicited to take
the survey
The number of customers who
receive access to surveys
regarding agency services.
85 N/A 85
Total customers
who responded
to the survey
The number of customers who
responded to the survey.
31 N/A 31
Response Rate The percentage of customers who
responded to the survey out of
the total number of customers
solicited to take the survey.
36.5% N/A 36.5%
Notes. 1 The Water Sample Testing Survey was not conducted in SFY 2021.
SFY=State fiscal year (September 1-August 31).
Table 20 provides the SFY 2020 efficiency measures for the Water Sample Testing
Survey. The efficiency measures for Projected SFY 2022 are estimated to be the
same as SFY 2020. A survey was not conducted during SFY 2021 and is marked as
“not applicable.”
DSHS Strategic Plan for 2023-2027, Part II H-23
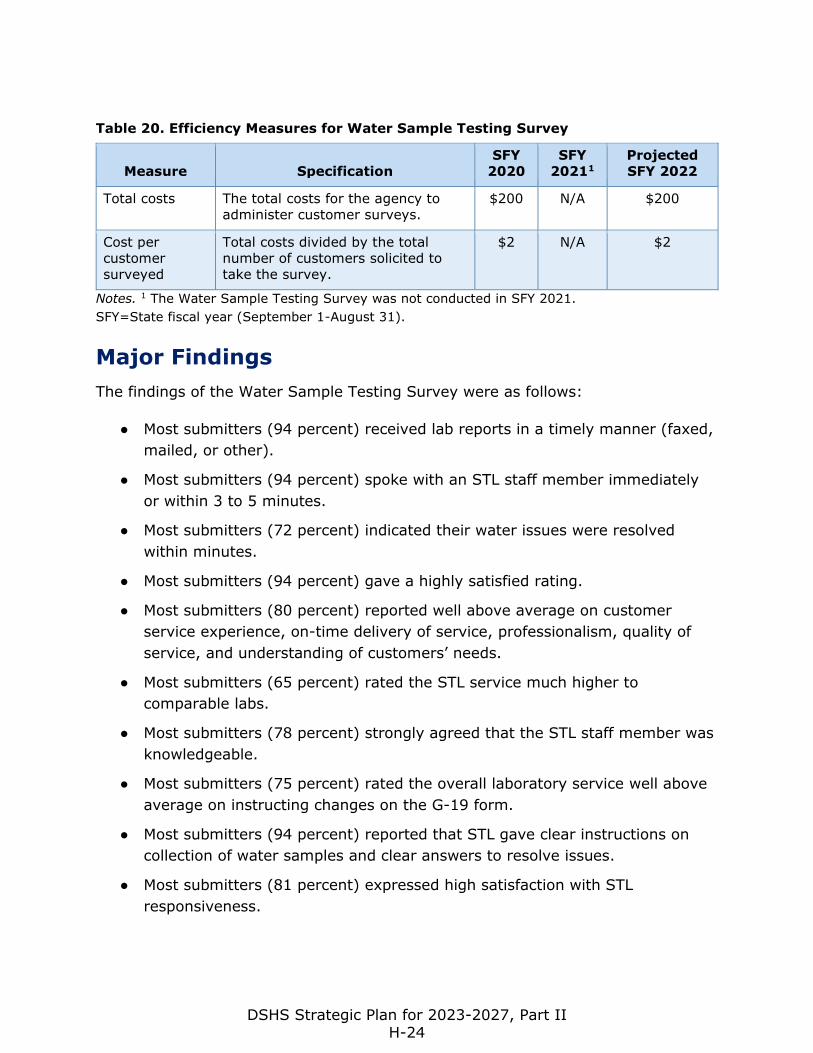
Table 20. Efficiency Measures for Water Sample Testing Survey
Measure Specification
SFY
2020
SFY
20211
Projected
SFY 2022
Total costs The total costs for the agency to
administer customer surveys.
$200 N/A $200
Cost per
customer
surveyed
Total costs divided by the total
number of customers solicited to
take the survey.
$2 N/A $2
Notes. 1 The Water Sample Testing Survey was not conducted in SFY 2021.
SFY=State fiscal year (September 1-August 31).
Major Findings
The findings of the Water Sample Testing Survey were as follows:
● Most submitters (94 percent) received lab reports in a timely manner (faxed,
mailed, or other).
● Most submitters (94 percent) spoke with an STL staff member immediately
or within 3 to 5 minutes.
● Most submitters (72 percent) indicated their water issues were resolved
within minutes.
● Most submitters (94 percent) gave a highly satisfied rating.
● Most submitters (80 percent) reported well above average on customer
service experience, on-time delivery of service, professionalism, quality of
service, and understanding of customers’ needs.
● Most submitters (65 percent) rated the STL service much higher to
comparable labs.
● Most submitters (78 percent) strongly agreed that the STL staff member was
knowledgeable.
● Most submitters (75 percent) rated the overall laboratory service well above
average on instructing changes on the G-19 form.
● Most submitters (94 percent) reported that STL gave clear instructions on
collection of water samples and clear answers to resolve issues.
● Most submitters (81 percent) expressed high satisfaction with STL
responsiveness.
DSHS Strategic Plan for 2023-2027, Part II H-24
● Most submitters (90 percent) provided an overall rating on the process of
problem resolving as “very good.”
● Many submitters (77 percent) rated the STL staff member as well above
average for the following characteristics: patience, enthusiastic, listens
carefully, friendly, responsive, and courteous to the water submitters.
DSHS Strategic Plan for 2023-2027, Part II H-25
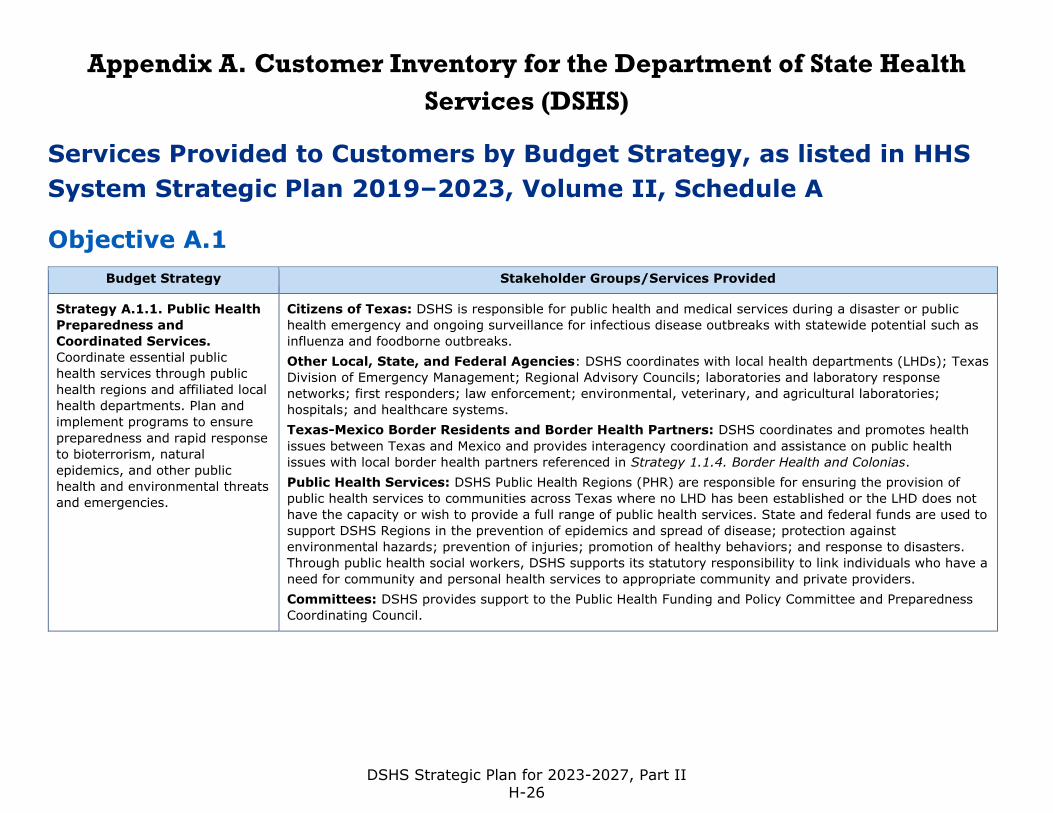
Appendix A. Customer Inventory for the Department of State Health
Services (DSHS)
Services Provided to Customers by Budget Strategy, as listed in HHS
System Strategic Plan 2019–2023, Volume II, Schedule A
Objective A.1
Budget Strategy Stakeholder Groups/Services Provided
Strategy A.1.1. Public Health
Preparedness and
Coordinated Services.
Coordinate essential public
health services through public
health regions and affiliated local
health departments. Plan and
implement programs to ensure
preparedness and rapid response
to bioterrorism, natural
epidemics, and other public
health and environmental threats
and emergencies.
Citizens of Texas: DSHS is responsible for public health and medical services during a disaster or public
health emergency and ongoing surveillance for infectious disease outbreaks with statewide potential such as
influenza and foodborne outbreaks.
Other Local, State, and Federal Agencies: DSHS coordinates with local health departments (LHDs); Texas
Division of Emergency Management; Regional Advisory Councils; laboratories and laboratory response
networks; first responders; law enforcement; environmental, veterinary, and agricultural laboratories;
hospitals; and healthcare systems.
Texas-Mexico Border Residents and Border Health Partners: DSHS coordinates and promotes health
issues between Texas and Mexico and provides interagency coordination and assistance on public health
issues with local border health partners referenced in Strategy 1.1.4. Border Health and Colonias.
Public Health Services: DSHS Public Health Regions (PHR) are responsible for ensuring the provision of
public health services to communities across Texas where no LHD has been established or the LHD does not
have the capacity or wish to provide a full range of public health services. State and federal funds are used to
support DSHS Regions in the prevention of epidemics and spread of disease; protection against
environmental hazards; prevention of injuries; promotion of healthy behaviors; and response to disasters.
Through public health social workers, DSHS supports its statutory responsibility to link individuals who have a
need for community and personal health services to appropriate community and private providers.
Committees: DSHS provides support to the Public Health Funding and Policy Committee and Preparedness
Coordinating Council.
DSHS Strategic Plan for 2023-2027, Part II H-26
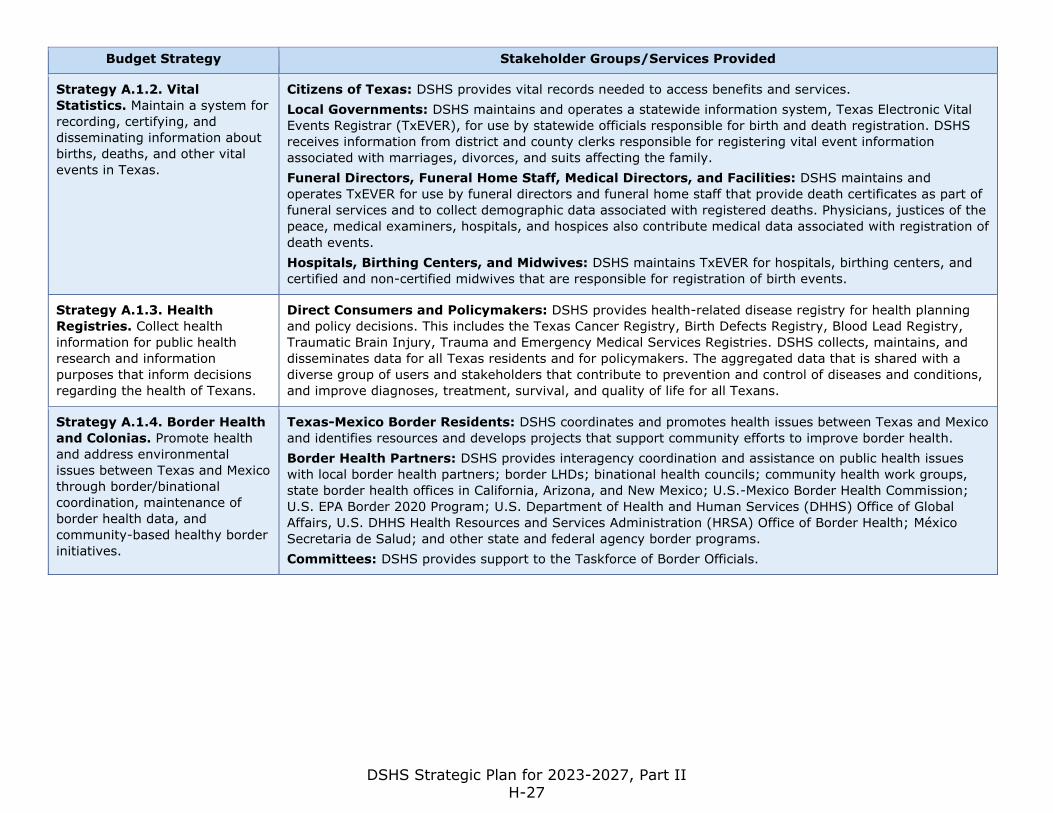
Budget Strategy Stakeholder Groups/Services Provided
Strategy A.1.2. Vital
Statistics. Maintain a system for
recording, certifying, and
disseminating information about
births, deaths, and other vital
events in Texas.
Citizens of Texas: DSHS provides vital records needed to access benefits and services.
Local Governments: DSHS maintains and operates a statewide information system, Texas Electronic Vital
Events Registrar (TxEVER), for use by statewide officials responsible for birth and death registration. DSHS
receives information from district and county clerks responsible for registering vital event information
associated with marriages, divorces, and suits affecting the family.
Funeral Directors, Funeral Home Staff, Medical Directors, and Facilities: DSHS maintains and
operates TxEVER for use by funeral directors and funeral home staff that provide death certificates as part of
funeral services and to collect demographic data associated with registered deaths. Physicians, justices of the
peace, medical examiners, hospitals, and hospices also contribute medical data associated with registration of
death events.
Hospitals, Birthing Centers, and Midwives: DSHS maintains TxEVER for hospitals, birthing centers, and
certified and non-certified midwives that are responsible for registration of birth events.
Strategy A.1.3. Health
Registries. Collect health
information for public health
research and information
purposes that inform decisions
regarding the health of Texans.
Direct Consumers and Policymakers: DSHS provides health-related disease registry for health planning
and policy decisions. This includes the Texas Cancer Registry, Birth Defects Registry, Blood Lead Registry,
Traumatic Brain Injury, Trauma and Emergency Medical Services Registries. DSHS collects, maintains, and
disseminates data for all Texas residents and for policymakers. The aggregated data that is shared with a
diverse group of users and stakeholders that contribute to prevention and control of diseases and conditions,
and improve diagnoses, treatment, survival, and quality of life for all Texans.
Strategy A.1.4. Border Health
and Colonias. Promote health
and address environmental
issues between Texas and Mexico
through border/binational
coordination, maintenance of
border health data, and
community-based healthy border
initiatives.
Texas-Mexico Border Residents: DSHS coordinates and promotes health issues between Texas and Mexico
and identifies resources and develops projects that support community efforts to improve border health.
Border Health Partners: DSHS provides interagency coordination and assistance on public health issues
with local border health partners; border LHDs; binational health councils; community health work groups,
state border health offices in California, Arizona, and New Mexico; U.S.-Mexico Border Health Commission;
U.S. EPA Border 2020 Program; U.S. Department of Health and Human Services (DHHS) Office of Global
Affairs, U.S. DHHS Health Resources and Services Administration (HRSA) Office of Border Health; México
Secretaria de Salud; and other state and federal agency border programs.
Committees: DSHS provides support to the Taskforce of Border Officials.
DSHS Strategic Plan for 2023-2027, Part II H-27
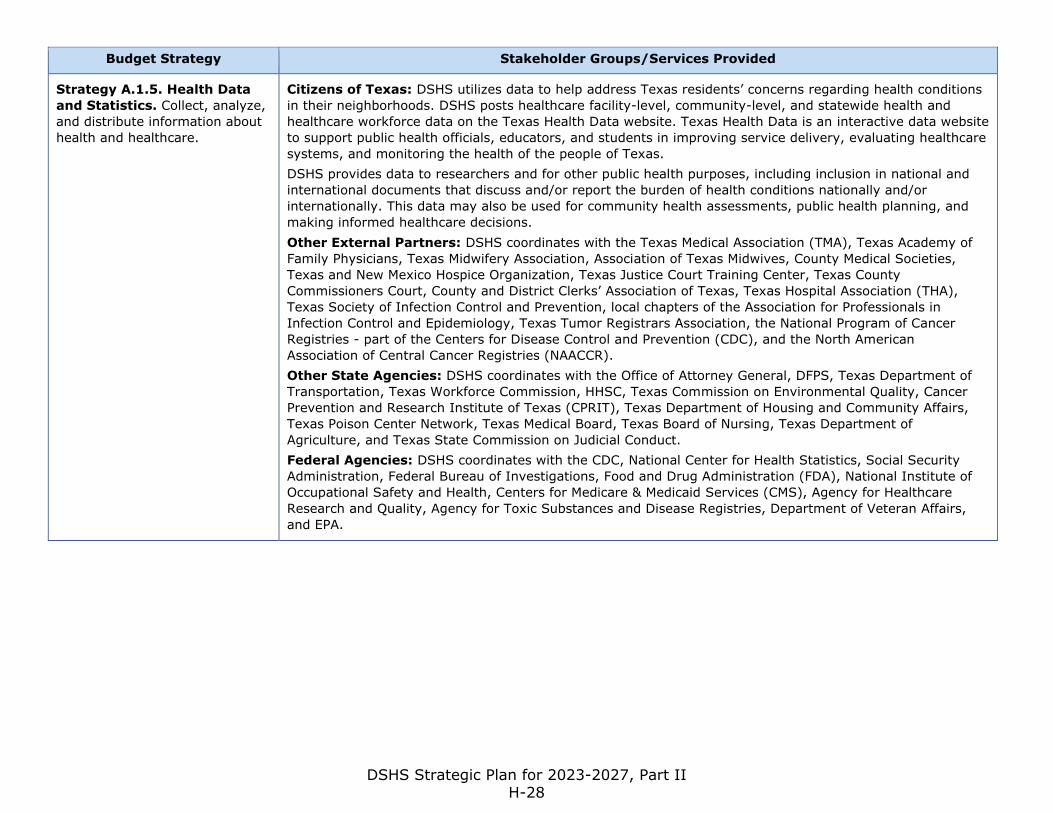
Budget Strategy Stakeholder Groups/Services Provided
Strategy A.1.5. Health Data
and Statistics. Collect, analyze,
and distribute information about
health and healthcare.
Citizens of Texas: DSHS utilizes data to help address Texas residents’ concerns regarding health conditions
in their neighborhoods. DSHS posts healthcare facility-level, community-level, and statewide health and
healthcare workforce data on the Texas Health Data website. Texas Health Data is an interactive data website
to support public health officials, educators, and students in improving service delivery, evaluating healthcare
systems, and monitoring the health of the people of Texas.
DSHS provides data to researchers and for other public health purposes, including inclusion in national and
international documents that discuss and/or report the burden of health conditions nationally and/or
internationally. This data may also be used for community health assessments, public health planning, and
making informed healthcare decisions.
Other External Partners: DSHS coordinates with the Texas Medical Association (TMA), Texas Academy of
Family Physicians, Texas Midwifery Association, Association of Texas Midwives, County Medical Societies,
Texas and New Mexico Hospice Organization, Texas Justice Court Training Center, Texas County
Commissioners Court, County and District Clerks’ Association of Texas, Texas Hospital Association (THA),
Texas Society of Infection Control and Prevention, local chapters of the Association for Professionals in
Infection Control and Epidemiology, Texas Tumor Registrars Association, the National Program of Cancer
Registries - part of the Centers for Disease Control and Prevention (CDC), and the North American
Association of Central Cancer Registries (NAACCR).
Other State Agencies: DSHS coordinates with the Office of Attorney General, DFPS, Texas Department of
Transportation, Texas Workforce Commission, HHSC, Texas Commission on Environmental Quality, Cancer
Prevention and Research Institute of Texas (CPRIT), Texas Department of Housing and Community Affairs,
Texas Poison Center Network, Texas Medical Board, Texas Board of Nursing, Texas Department of
Agriculture, and Texas State Commission on Judicial Conduct.
Federal Agencies: DSHS coordinates with the CDC, National Center for Health Statistics, Social Security
Administration, Federal Bureau of Investigations, Food and Drug Administration (FDA), National Institute of
Occupational Safety and Health, Centers for Medicare & Medicaid Services (CMS), Agency for Healthcare
Research and Quality, Agency for Toxic Substances and Disease Registries, Department of Veteran Affairs,
and EPA.
DSHS Strategic Plan for 2023-2027, Part II H-28
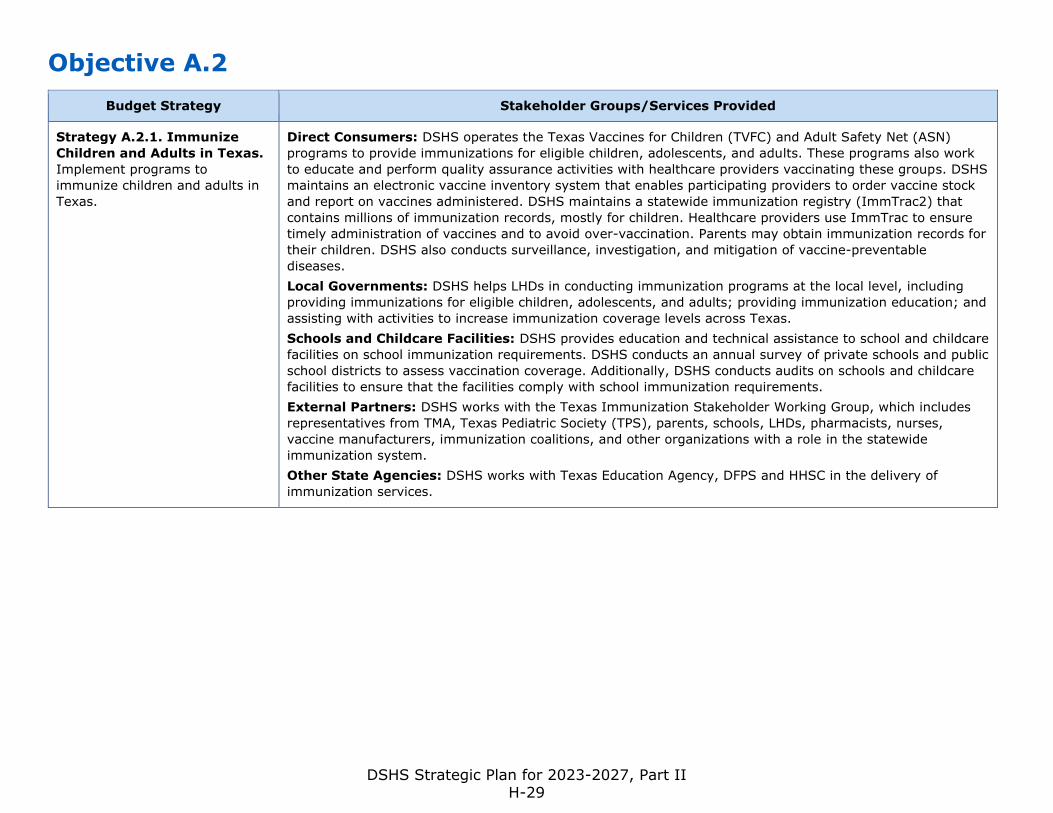
Objective A.2
Budget Strategy Stakeholder Groups/Services Provided
Strategy A.2.1. Immunize
Children and Adults in Texas.
Implement programs to
immunize children and adults in
Texas.
Direct Consumers: DSHS operates the Texas Vaccines for Children (TVFC) and Adult Safety Net (ASN)
programs to provide immunizations for eligible children, adolescents, and adults. These programs also work
to educate and perform quality assurance activities with healthcare providers vaccinating these groups. DSHS
maintains an electronic vaccine inventory system that enables participating providers to order vaccine stock
and report on vaccines administered. DSHS maintains a statewide immunization registry (ImmTrac2) that
contains millions of immunization records, mostly for children. Healthcare providers use ImmTrac to ensure
timely administration of vaccines and to avoid over-vaccination. Parents may obtain immunization records for
their children. DSHS also conducts surveillance, investigation, and mitigation of vaccine-preventable
diseases.
Local Governments: DSHS helps LHDs in conducting immunization programs at the local level, including
providing immunizations for eligible children, adolescents, and adults; providing immunization education; and
assisting with activities to increase immunization coverage levels across Texas.
Schools and Childcare Facilities: DSHS provides education and technical assistance to school and childcare
facilities on school immunization requirements. DSHS conducts an annual survey of private schools and public
school districts to assess vaccination coverage. Additionally, DSHS conducts audits on schools and childcare
facilities to ensure that the facilities comply with school immunization requirements.
External Partners: DSHS works with the Texas Immunization Stakeholder Working Group, which includes
representatives from TMA, Texas Pediatric Society (TPS), parents, schools, LHDs, pharmacists, nurses,
vaccine manufacturers, immunization coalitions, and other organizations with a role in the statewide
immunization system.
Other State Agencies: DSHS works with Texas Education Agency, DFPS and HHSC in the delivery of
immunization services.
DSHS Strategic Plan for 2023-2027, Part II H-29
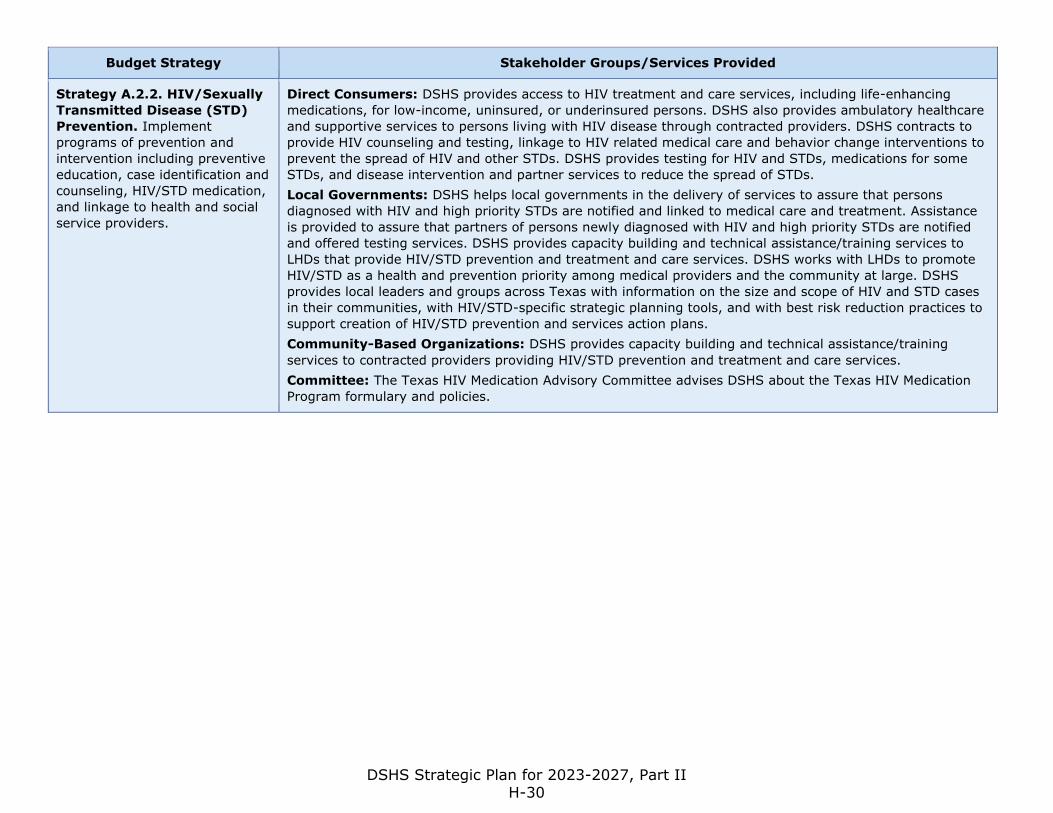
Budget Strategy Stakeholder Groups/Services Provided
Strategy A.2.2. HIV/Sexually
Transmitted Disease (STD)
Prevention. Implement
programs of prevention and
intervention including preventive
education, case identification and
counseling, HIV/STD medication,
and linkage to health and social
service providers.
Direct Consumers: DSHS provides access to HIV treatment and care services, including life-enhancing
medications, for low-income, uninsured, or underinsured persons. DSHS also provides ambulatory healthcare
and supportive services to persons living with HIV disease through contracted providers. DSHS contracts to
provide HIV counseling and testing, linkage to HIV related medical care and behavior change interventions to
prevent the spread of HIV and other STDs. DSHS provides testing for HIV and STDs, medications for some
STDs, and disease intervention and partner services to reduce the spread of STDs.
Local Governments: DSHS helps local governments in the delivery of services to assure that persons
diagnosed with HIV and high priority STDs are notified and linked to medical care and treatment. Assistance
is provided to assure that partners of persons newly diagnosed with HIV and high priority STDs are notified
and offered testing services. DSHS provides capacity building and technical assistance/training services to
LHDs that provide HIV/STD prevention and treatment and care services. DSHS works with LHDs to promote
HIV/STD as a health and prevention priority among medical providers and the community at large. DSHS
provides local leaders and groups across Texas with information on the size and scope of HIV and STD cases
in their communities, with HIV/STD-specific strategic planning tools, and with best risk reduction practices to
support creation of HIV/STD prevention and services action plans.
Community-Based Organizations: DSHS provides capacity building and technical assistance/training
services to contracted providers providing HIV/STD prevention and treatment and care services.
Committee: The Texas HIV Medication Advisory Committee advises DSHS about the Texas HIV Medication
Program formulary and policies.
DSHS Strategic Plan for 2023-2027, Part II H-30
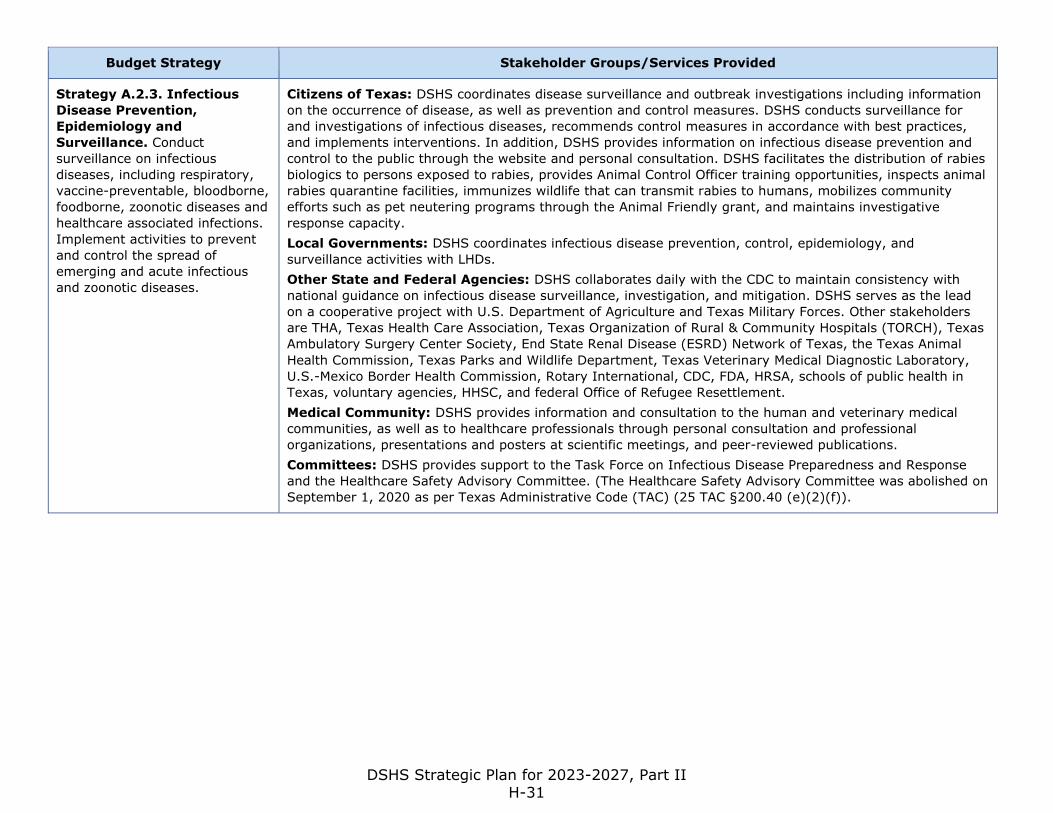
Budget Strategy Stakeholder Groups/Services Provided
Strategy A.2.3. Infectious
Disease Prevention,
Epidemiology and
Surveillance. Conduct
surveillance on infectious
diseases, including respiratory,
vaccine-preventable, bloodborne,
foodborne, zoonotic diseases and
healthcare associated infections.
Implement activities to prevent
and control the spread of
emerging and acute infectious
and zoonotic diseases.
Citizens of Texas: DSHS coordinates disease surveillance and outbreak investigations including information
on the occurrence of disease, as well as prevention and control measures. DSHS conducts surveillance for
and investigations of infectious diseases, recommends control measures in accordance with best practices,
and implements interventions. In addition, DSHS provides information on infectious disease prevention and
control to the public through the website and personal consultation. DSHS facilitates the distribution of rabies
biologics to persons exposed to rabies, provides Animal Control Officer training opportunities, inspects animal
rabies quarantine facilities, immunizes wildlife that can transmit rabies to humans, mobilizes community
efforts such as pet neutering programs through the Animal Friendly grant, and maintains investigative
response capacity.
Local Governments: DSHS coordinates infectious disease prevention, control, epidemiology, and
surveillance activities with LHDs.
Other State and Federal Agencies: DSHS collaborates daily with the CDC to maintain consistency with
national guidance on infectious disease surveillance, investigation, and mitigation. DSHS serves as the lead
on a cooperative project with U.S. Department of Agriculture and Texas Military Forces. Other stakeholders
are THA, Texas Health Care Association, Texas Organization of Rural & Community Hospitals (TORCH), Texas
Ambulatory Surgery Center Society, End State Renal Disease (ESRD) Network of Texas, the Texas Animal
Health Commission, Texas Parks and Wildlife Department, Texas Veterinary Medical Diagnostic Laboratory,
U.S.-Mexico Border Health Commission, Rotary International, CDC, FDA, HRSA, schools of public health in
Texas, voluntary agencies, HHSC, and federal Office of Refugee Resettlement.
Medical Community: DSHS provides information and consultation to the human and veterinary medical
communities, as well as to healthcare professionals through personal consultation and professional
organizations, presentations and posters at scientific meetings, and peer-reviewed publications.
Committees: DSHS provides support to the Task Force on Infectious Disease Preparedness and Response
and the Healthcare Safety Advisory Committee. (The Healthcare Safety Advisory Committee was abolished on
September 1, 2020 as per Texas Administrative Code (TAC) (25 TAC §200.40 (e)(2)(f)).
DSHS Strategic Plan for 2023-2027, Part II H-31
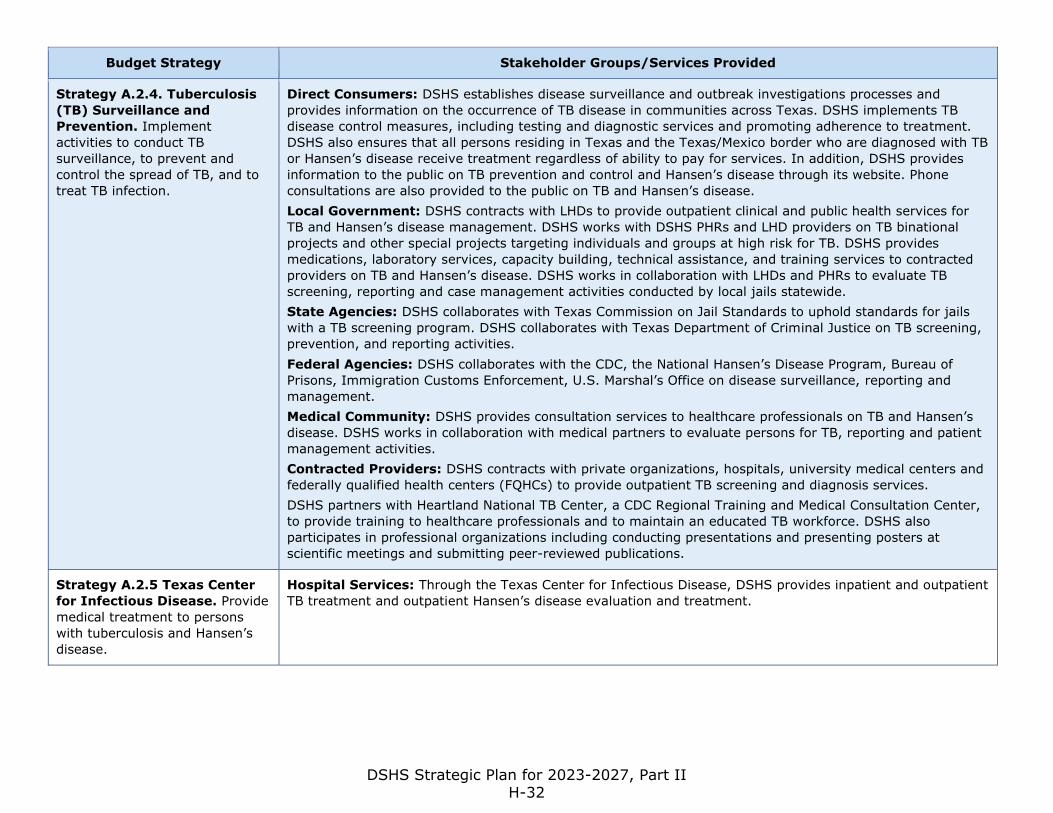
Budget Strategy Stakeholder Groups/Services Provided
Strategy A.2.4. Tuberculosis
(TB) Surveillance and
Prevention. Implement
activities to conduct TB
surveillance, to prevent and
control the spread of TB, and to
treat TB infection.
Direct Consumers: DSHS establishes disease surveillance and outbreak investigations processes and
provides information on the occurrence of TB disease in communities across Texas. DSHS implements TB
disease control measures, including testing and diagnostic services and promoting adherence to treatment.
DSHS also ensures that all persons residing in Texas and the Texas/Mexico border who are diagnosed with TB
or Hansen’s disease receive treatment regardless of ability to pay for services. In addition, DSHS provides
information to the public on TB prevention and control and Hansen’s disease through its website. Phone
consultations are also provided to the public on TB and Hansen’s disease.
Local Government: DSHS contracts with LHDs to provide outpatient clinical and public health services for
TB and Hansen’s disease management. DSHS works with DSHS PHRs and LHD providers on TB binational
projects and other special projects targeting individuals and groups at high risk for TB. DSHS provides
medications, laboratory services, capacity building, technical assistance, and training services to contracted
providers on TB and Hansen’s disease. DSHS works in collaboration with LHDs and PHRs to evaluate TB
screening, reporting and case management activities conducted by local jails statewide.
State Agencies: DSHS collaborates with Texas Commission on Jail Standards to uphold standards for jails
with a TB screening program. DSHS collaborates with Texas Department of Criminal Justice on TB screening,
prevention, and reporting activities.
Federal Agencies: DSHS collaborates with the CDC, the National Hansen’s Disease Program, Bureau of
Prisons, Immigration Customs Enforcement, U.S. Marshal’s Office on disease surveillance, reporting and
management.
Medical Community: DSHS provides consultation services to healthcare professionals on TB and Hansen’s
disease. DSHS works in collaboration with medical partners to evaluate persons for TB, reporting and patient
management activities.
Contracted Providers: DSHS contracts with private organizations, hospitals, university medical centers and
federally qualified health centers (FQHCs) to provide outpatient TB screening and diagnosis services.
DSHS partners with Heartland National TB Center, a CDC Regional Training and Medical Consultation Center,
to provide training to healthcare professionals and to maintain an educated TB workforce. DSHS also
participates in professional organizations including conducting presentations and presenting posters at
scientific meetings and submitting peer-reviewed publications.
Strategy A.2.5 Texas Center
for Infectious Disease. Provide
medical treatment to persons
with tuberculosis and Hansen’s
disease.
Hospital Services: Through the Texas Center for Infectious Disease, DSHS provides inpatient and outpatient
TB treatment and outpatient Hansen’s disease evaluation and treatment.
DSHS Strategic Plan for 2023-2027, Part II H-32
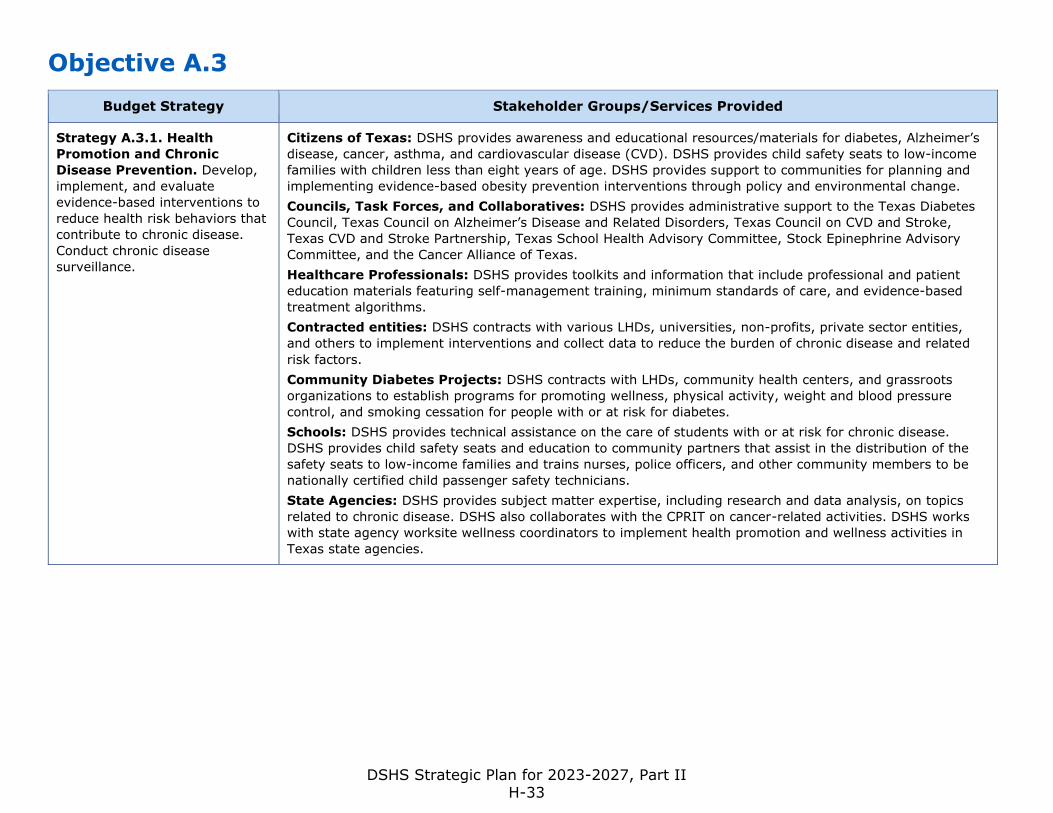
Objective A.3
Budget Strategy Stakeholder Groups/Services Provided
Strategy A.3.1. Health
Promotion and Chronic
Disease Prevention. Develop,
implement, and evaluate
evidence-based interventions to
reduce health risk behaviors that
contribute to chronic disease.
Conduct chronic disease
surveillance.
Citizens of Texas: DSHS provides awareness and educational resources/materials for diabetes, Alzheimer’s
disease, cancer, asthma, and cardiovascular disease (CVD). DSHS provides child safety seats to low-income
families with children less than eight years of age. DSHS provides support to communities for planning and
implementing evidence-based obesity prevention interventions through policy and environmental change.
Councils, Task Forces, and Collaboratives: DSHS provides administrative support to the Texas Diabetes
Council, Texas Council on Alzheimer’s Disease and Related Disorders, Texas Council on CVD and Stroke,
Texas CVD and Stroke Partnership, Texas School Health Advisory Committee, Stock Epinephrine Advisory
Committee, and the Cancer Alliance of Texas.
Healthcare Professionals: DSHS provides toolkits and information that include professional and patient
education materials featuring self-management training, minimum standards of care, and evidence-based
treatment algorithms.
Contracted entities: DSHS contracts with various LHDs, universities, non-profits, private sector entities,
and others to implement interventions and collect data to reduce the burden of chronic disease and related
risk factors.
Community Diabetes Projects: DSHS contracts with LHDs, community health centers, and grassroots
organizations to establish programs for promoting wellness, physical activity, weight and blood pressure
control, and smoking cessation for people with or at risk for diabetes.
Schools: DSHS provides technical assistance on the care of students with or at risk for chronic disease.
DSHS provides child safety seats and education to community partners that assist in the distribution of the
safety seats to low-income families and trains nurses, police officers, and other community members to be
nationally certified child passenger safety technicians.
State Agencies: DSHS provides subject matter expertise, including research and data analysis, on topics
related to chronic disease. DSHS also collaborates with the CPRIT on cancer-related activities. DSHS works
with state agency worksite wellness coordinators to implement health promotion and wellness activities in
Texas state agencies.
DSHS Strategic Plan for 2023-2027, Part II H-33
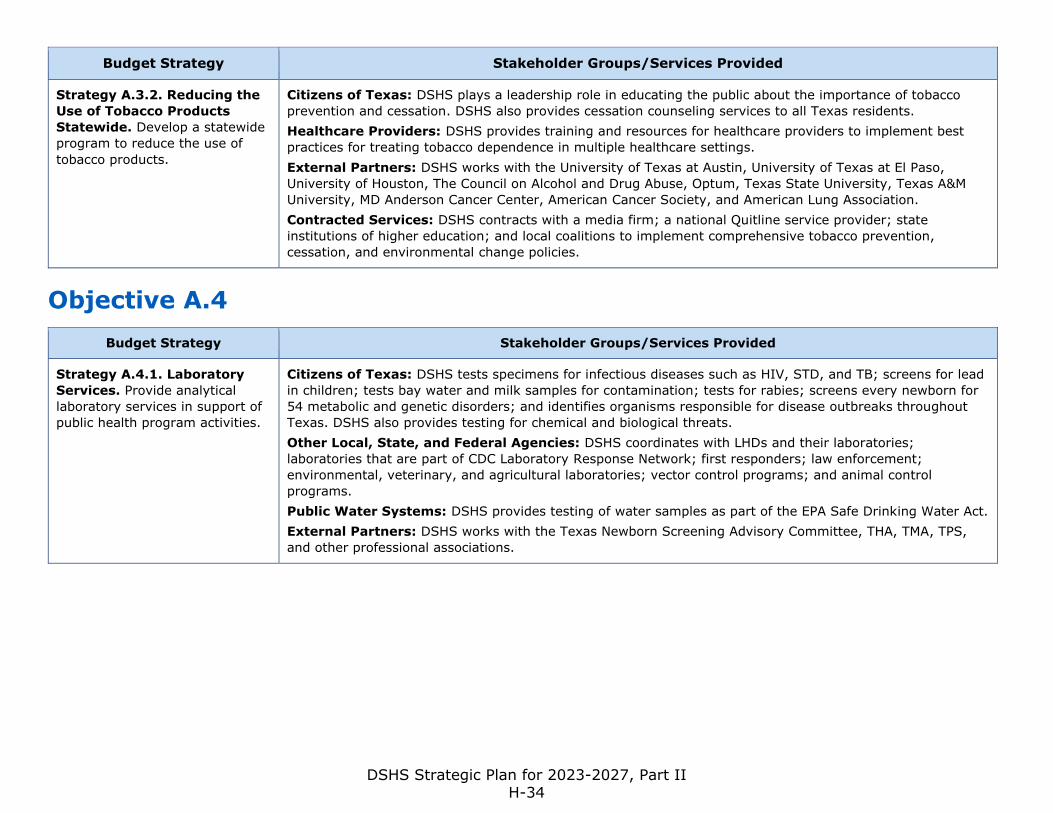
Budget Strategy Stakeholder Groups/Services Provided
Strategy A.3.2. Reducing the
Use of Tobacco Products
Statewide. Develop a statewide
program to reduce the use of
tobacco products.
Citizens of Texas: DSHS plays a leadership role in educating the public about the importance of tobacco
prevention and cessation. DSHS also provides cessation counseling services to all Texas residents.
Healthcare Providers: DSHS provides training and resources for healthcare providers to implement best
practices for treating tobacco dependence in multiple healthcare settings.
External Partners: DSHS works with the University of Texas at Austin, University of Texas at El Paso,
University of Houston, The Council on Alcohol and Drug Abuse, Optum, Texas State University, Texas A&M
University, MD Anderson Cancer Center, American Cancer Society, and American Lung Association.
Contracted Services: DSHS contracts with a media firm; a national Quitline service provider; state
institutions of higher education; and local coalitions to implement comprehensive tobacco prevention,
cessation, and environmental change policies.
Objective A.4
Budget Strategy Stakeholder Groups/Services Provided
Strategy A.4.1. Laboratory
Services. Provide analytical
laboratory services in support of
public health program activities.
Citizens of Texas: DSHS tests specimens for infectious diseases such as HIV, STD, and TB; screens for lead
in children; tests bay water and milk samples for contamination; tests for rabies; screens every newborn for
54 metabolic and genetic disorders; and identifies organisms responsible for disease outbreaks throughout
Texas. DSHS also provides testing for chemical and biological threats.
Other Local, State, and Federal Agencies: DSHS coordinates with LHDs and their laboratories;
laboratories that are part of CDC Laboratory Response Network; first responders; law enforcement;
environmental, veterinary, and agricultural laboratories; vector control programs; and animal control
programs.
Public Water Systems: DSHS provides testing of water samples as part of the EPA Safe Drinking Water Act.
External Partners: DSHS works with the Texas Newborn Screening Advisory Committee, THA, TMA, TPS,
and other professional associations.
DSHS Strategic Plan for 2023-2027, Part II H-34
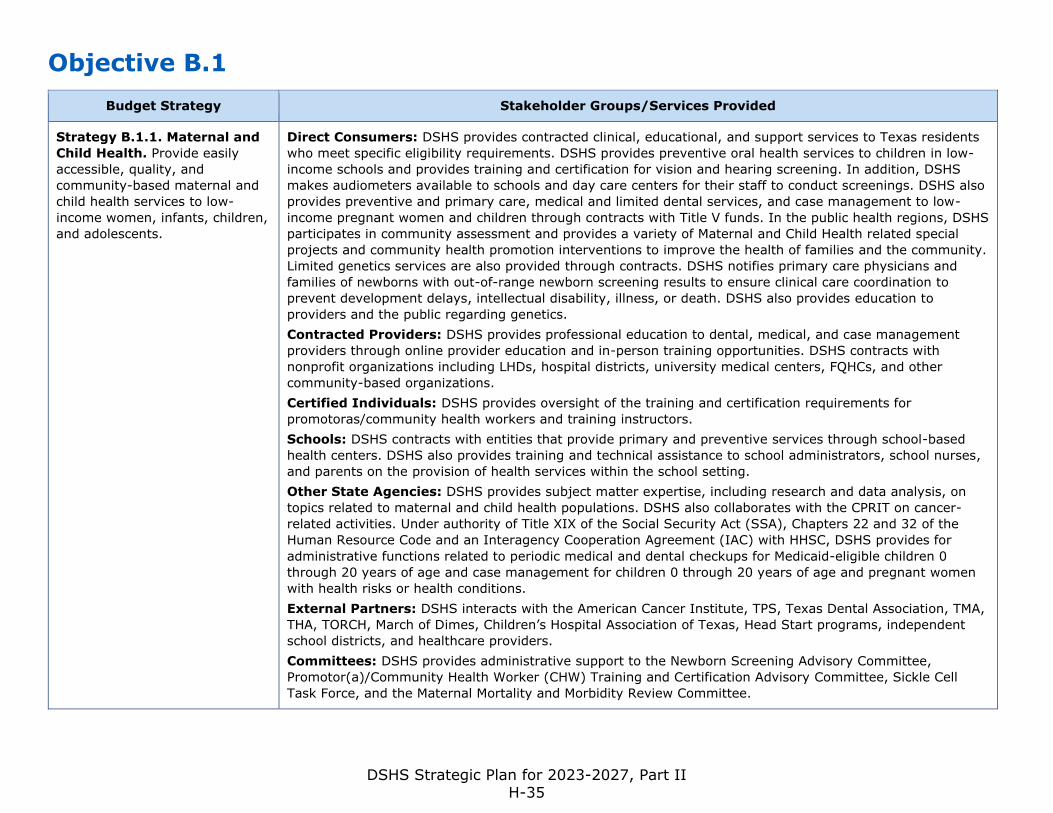
Objective B.1
Budget Strategy Stakeholder Groups/Services Provided
Strategy B.1.1. Maternal and
Child Health. Provide easily
accessible, quality, and
community-based maternal and
child health services to low-
income women, infants, children,
and adolescents.
Direct Consumers: DSHS provides contracted clinical, educational, and support services to Texas residents
who meet specific eligibility requirements. DSHS provides preventive oral health services to children in low-
income schools and provides training and certification for vision and hearing screening. In addition, DSHS
makes audiometers available to schools and day care centers for their staff to conduct screenings. DSHS also
provides preventive and primary care, medical and limited dental services, and case management to low-
income pregnant women and children through contracts with Title V funds. In the public health regions, DSHS
participates in community assessment and provides a variety of Maternal and Child Health related special
projects and community health promotion interventions to improve the health of families and the community.
Limited genetics services are also provided through contracts. DSHS notifies primary care physicians and
families of newborns with out-of-range newborn screening results to ensure clinical care coordination to
prevent development delays, intellectual disability, illness, or death. DSHS also provides education to
providers and the public regarding genetics.
Contracted Providers: DSHS provides professional education to dental, medical, and case management
providers through online provider education and in-person training opportunities. DSHS contracts with
nonprofit organizations including LHDs, hospital districts, university medical centers, FQHCs, and other
community-based organizations.
Certified Individuals: DSHS provides oversight of the training and certification requirements for
promotoras/community health workers and training instructors.
Schools: DSHS contracts with entities that provide primary and preventive services through school-based
health centers. DSHS also provides training and technical assistance to school administrators, school nurses,
and parents on the provision of health services within the school setting.
Other State Agencies: DSHS provides subject matter expertise, including research and data analysis, on
topics related to maternal and child health populations. DSHS also collaborates with the CPRIT on cancer-
related activities. Under authority of Title XIX of the Social Security Act (SSA), Chapters 22 and 32 of the
Human Resource Code and an Interagency Cooperation Agreement (IAC) with HHSC, DSHS provides for
administrative functions related to periodic medical and dental checkups for Medicaid-eligible children 0
through 20 years of age and case management for children 0 through 20 years of age and pregnant women
with health risks or health conditions.
External Partners: DSHS interacts with the American Cancer Institute, TPS, Texas Dental Association, TMA,
THA, TORCH, March of Dimes, Children’s Hospital Association of Texas, Head Start programs, independent
school districts, and healthcare providers.
Committees: DSHS provides administrative support to the Newborn Screening Advisory Committee,
Promotor(a)/Community Health Worker (CHW) Training and Certification Advisory Committee, Sickle Cell
Task Force, and the Maternal Mortality and Morbidity Review Committee.
DSHS Strategic Plan for 2023-2027, Part II H-35
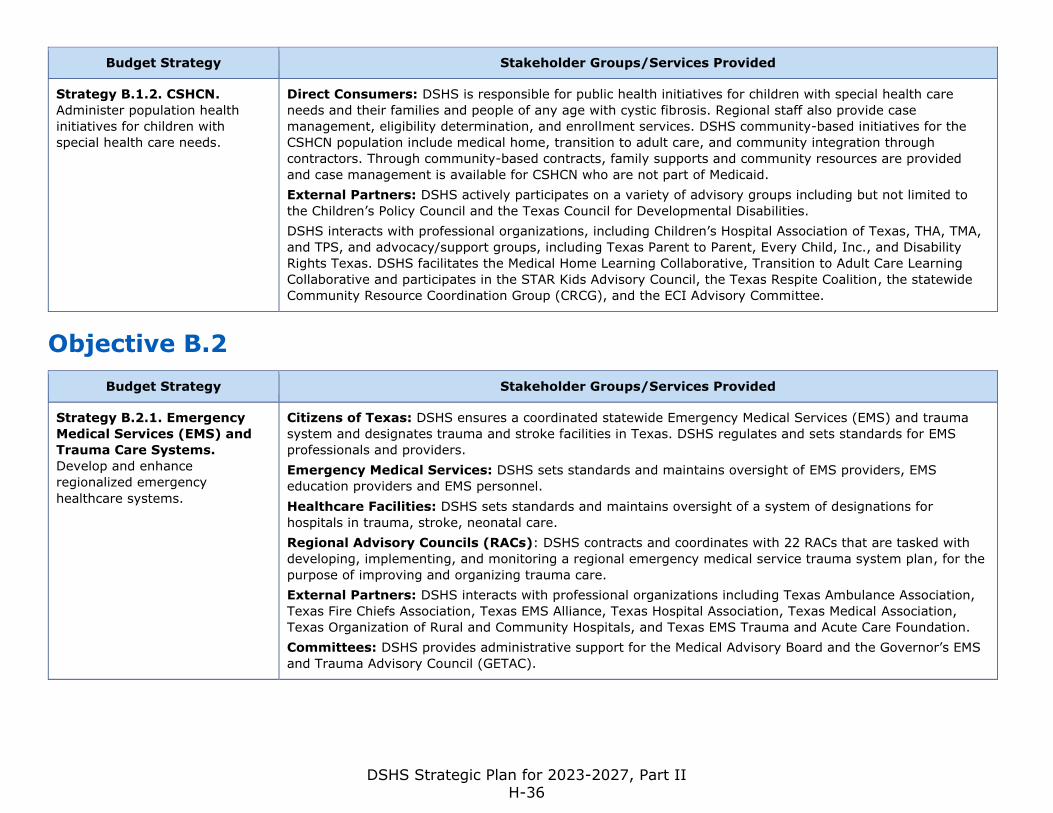
Budget Strategy Stakeholder Groups/Services Provided
Strategy B.1.2. CSHCN.
Administer population health
initiatives for children with
special health care needs.
Direct Consumers: DSHS is responsible for public health initiatives for children with special health care
needs and their families and people of any age with cystic fibrosis. Regional staff also provide case
management, eligibility determination, and enrollment services. DSHS community-based initiatives for the
CSHCN population include medical home, transition to adult care, and community integration through
contractors. Through community-based contracts, family supports and community resources are provided
and case management is available for CSHCN who are not part of Medicaid.
External Partners: DSHS actively participates on a variety of advisory groups including but not limited to
the Children’s Policy Council and the Texas Council for Developmental Disabilities.
DSHS interacts with professional organizations, including Children’s Hospital Association of Texas, THA, TMA,
and TPS, and advocacy/support groups, including Texas Parent to Parent, Every Child, Inc., and Disability
Rights Texas. DSHS facilitates the Medical Home Learning Collaborative, Transition to Adult Care Learning
Collaborative and participates in the STAR Kids Advisory Council, the Texas Respite Coalition, the statewide
Community Resource Coordination Group (CRCG), and the ECI Advisory Committee.
Objective B.2
Budget Strategy Stakeholder Groups/Services Provided
Strategy B.2.1. Emergency
Medical Services (EMS) and
Trauma Care Systems.
Develop and enhance
regionalized emergency
healthcare systems.
Citizens of Texas: DSHS ensures a coordinated statewide Emergency Medical Services (EMS) and trauma
system and designates trauma and stroke facilities in Texas. DSHS regulates and sets standards for EMS
professionals and providers.
Emergency Medical Services: DSHS sets standards and maintains oversight of EMS providers, EMS
education providers and EMS personnel.
Healthcare Facilities: DSHS sets standards and maintains oversight of a system of designations for
hospitals in trauma, stroke, neonatal care.
Regional Advisory Councils (RACs): DSHS contracts and coordinates with 22 RACs that are tasked with
developing, implementing, and monitoring a regional emergency medical service trauma system plan, for the
purpose of improving and organizing trauma care.
External Partners: DSHS interacts with professional organizations including Texas Ambulance Association,
Texas Fire Chiefs Association, Texas EMS Alliance, Texas Hospital Association, Texas Medical Association,
Texas Organization of Rural and Community Hospitals, and Texas EMS Trauma and Acute Care Foundation.
Committees: DSHS provides administrative support for the Medical Advisory Board and the Governor’s EMS
and Trauma Advisory Council (GETAC).
DSHS Strategic Plan for 2023-2027, Part II H-36
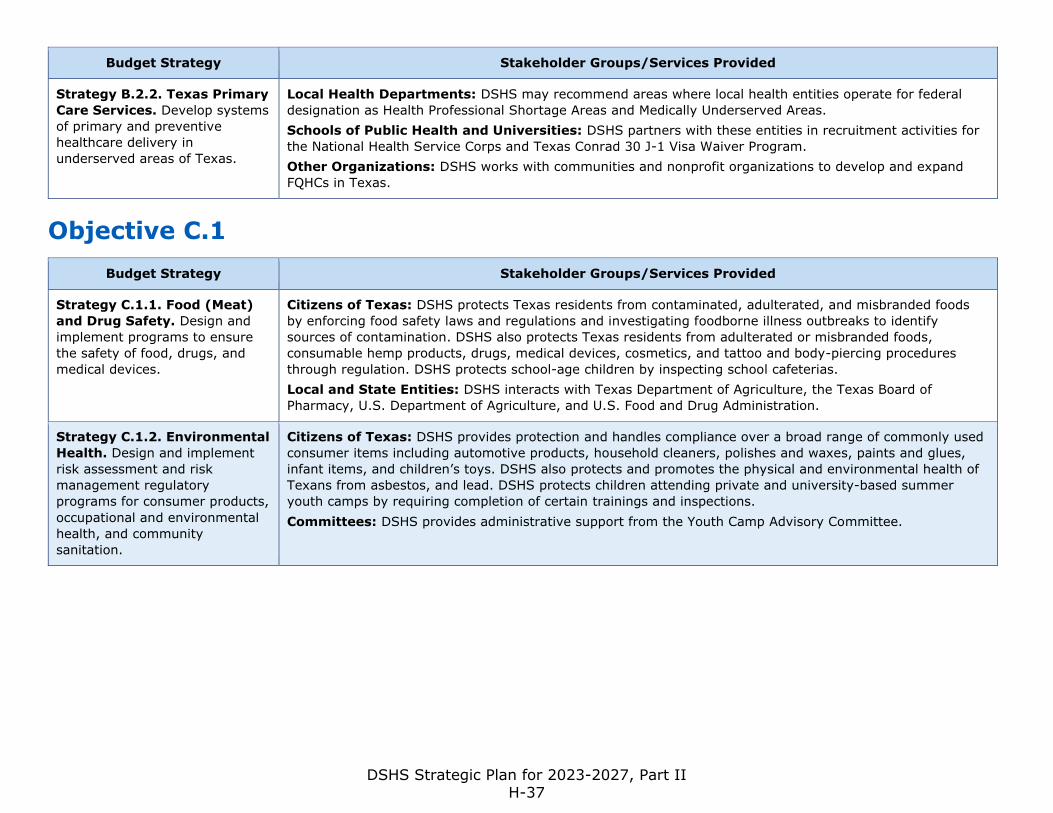
Budget Strategy Stakeholder Groups/Services Provided
Strategy B.2.2. Texas Primary
Care Services. Develop systems
of primary and preventive
healthcare delivery in
underserved areas of Texas.
Local Health Departments: DSHS may recommend areas where local health entities operate for federal
designation as Health Professional Shortage Areas and Medically Underserved Areas.
Schools of Public Health and Universities: DSHS partners with these entities in recruitment activities for
the National Health Service Corps and Texas Conrad 30 J-1 Visa Waiver Program.
Other Organizations: DSHS works with communities and nonprofit organizations to develop and expand
FQHCs in Texas.
Objective C.1
Budget Strategy Stakeholder Groups/Services Provided
Strategy C.1.1. Food (Meat)
and Drug Safety. Design and
implement programs to ensure
the safety of food, drugs, and
medical devices.
Citizens of Texas: DSHS protects Texas residents from contaminated, adulterated, and misbranded foods
by enforcing food safety laws and regulations and investigating foodborne illness outbreaks to identify
sources of contamination. DSHS also protects Texas residents from adulterated or misbranded foods,
consumable hemp products, drugs, medical devices, cosmetics, and tattoo and body-piercing procedures
through regulation. DSHS protects school-age children by inspecting school cafeterias.
Local and State Entities: DSHS interacts with Texas Department of Agriculture, the Texas Board of
Pharmacy, U.S. Department of Agriculture, and U.S. Food and Drug Administration.
Strategy C.1.2. Environmental
Health. Design and implement
risk assessment and risk
management regulatory
programs for consumer products,
occupational and environmental
health, and community
sanitation.
Citizens of Texas: DSHS provides protection and handles compliance over a broad range of commonly used
consumer items including automotive products, household cleaners, polishes and waxes, paints and glues,
infant items, and children’s toys. DSHS also protects and promotes the physical and environmental health of
Texans from asbestos, and lead. DSHS protects children attending private and university-based summer
youth camps by requiring completion of certain trainings and inspections.
Committees: DSHS provides administrative support from the Youth Camp Advisory Committee.
DSHS Strategic Plan for 2023-2027, Part II H-37
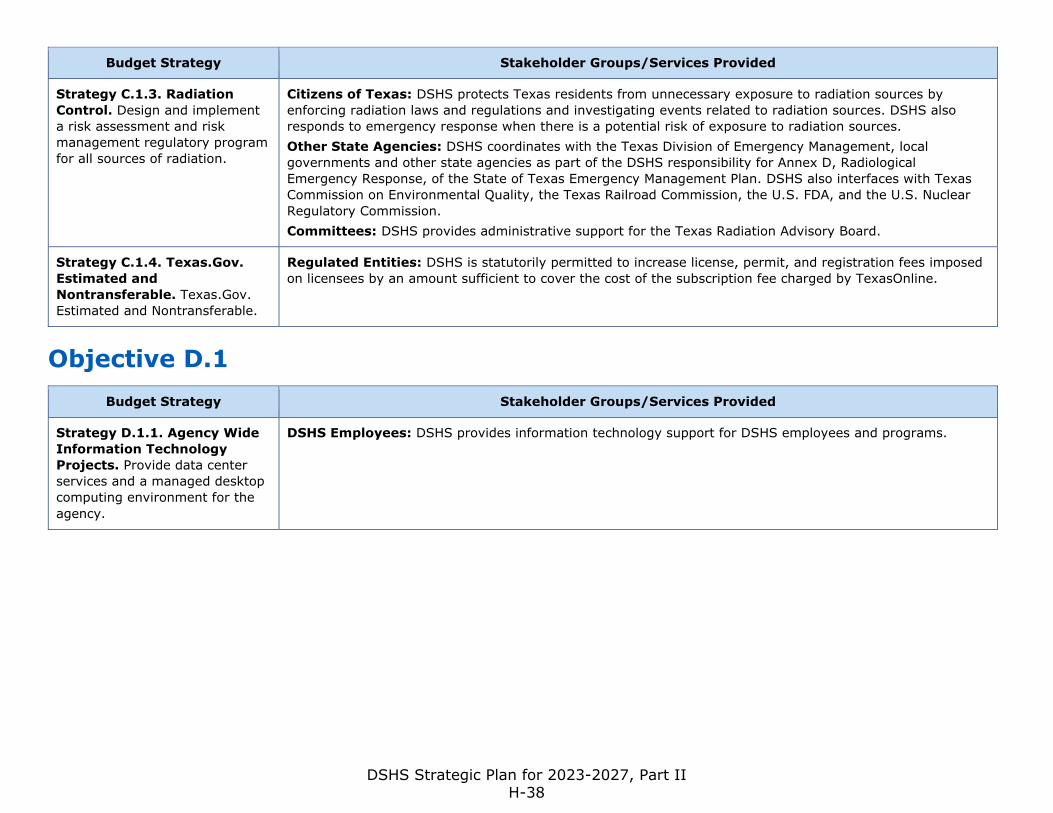
Budget Strategy Stakeholder Groups/Services Provided
Strategy C.1.3. Radiation
Control. Design and implement
a risk assessment and risk
management regulatory program
for all sources of radiation.
Citizens of Texas: DSHS protects Texas residents from unnecessary exposure to radiation sources by
enforcing radiation laws and regulations and investigating events related to radiation sources. DSHS also
responds to emergency response when there is a potential risk of exposure to radiation sources.
Other State Agencies: DSHS coordinates with the Texas Division of Emergency Management, local
governments and other state agencies as part of the DSHS responsibility for Annex D, Radiological
Emergency Response, of the State of Texas Emergency Management Plan. DSHS also interfaces with Texas
Commission on Environmental Quality, the Texas Railroad Commission, the U.S. FDA, and the U.S. Nuclear
Regulatory Commission.
Committees: DSHS provides administrative support for the Texas Radiation Advisory Board.
Strategy C.1.4. Texas.Gov.
Estimated and
Nontransferable. Texas.Gov.
Estimated and Nontransferable.
Regulated Entities: DSHS is statutorily permitted to increase license, permit, and registration fees imposed
on licensees by an amount sufficient to cover the cost of the subscription fee charged by TexasOnline.
Objective D.1
Budget Strategy Stakeholder Groups/Services Provided
Strategy D.1.1. Agency Wide
Information Technology
Projects. Provide data center
services and a managed desktop
computing environment for the
agency.
DSHS Employees: DSHS provides information technology support for DSHS employees and programs.
DSHS Strategic Plan for 2023-2027, Part II H-38
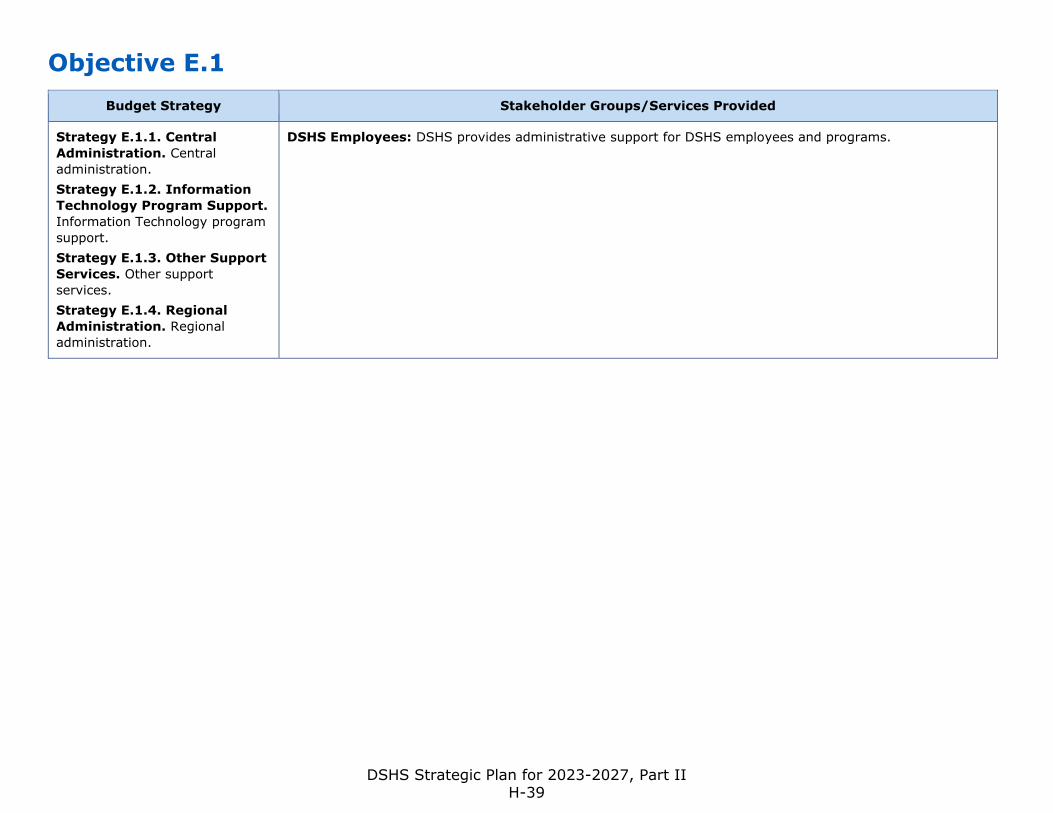
Objective E.1
Budget Strategy Stakeholder Groups/Services Provided
Strategy E.1.1. Central
Administration. Central
administration.
Strategy E.1.2. Information
Technology Program Support.
Information Technology program
support.
Strategy E.1.3. Other Support
Services. Other support
services.
Strategy E.1.4. Regional
Administration. Regional
administration.
DSHS Employees: DSHS provides administrative support for DSHS employees and programs.
DSHS Strategic Plan for 2023-2027, Part II H-39
Related Documents