1 EPCOR Electricity Distribution Ontario Inc. 2023 – 2027 Distribution System Plan 2022 – Ver. 1.0

Welcome message from author
This document is posted to help you gain knowledge. Please leave a comment to let me know what you think about it! Share it to your friends and learn new things together.
Transcript
1
EPCOR Electricity Distribution Ontario Inc.
2023 – 2027 Distribution System Plan
2022 – Ver. 1.0
EPCOR Electricity Distribution Ontario Inc. 2023 – 2027 Distribution System Plan – Ver. 1.0
_____________________________________________________________________________________ Page 2 of 128
TableofContentsIntroduction .................................................................................................................................................. 5
5.2 Distribution System Plan .................................................................................................................. 6
5.2.1 Distribution System Plan overview .................................................................................................. 6
5.2.2 Coordinated Planning with third parties .......................................................................................... 8
5.2.2a Overview of the consultations .................................................................................................. 8
5.2.3 Performance Measurement for continuous improvement ........................................................... 10
5.2.3a Metrics used to monitor DSP performance ............................................................................ 10
5.2.3b Service Quality and Reliability ................................................................................................. 14
5.3 Asset Management Process ........................................................................................................... 19
5.3.1 Asset Management Process overview ........................................................................................... 19
5.3.1a Asset Data Collection .............................................................................................................. 19
5.3.1b Asset Inventory ....................................................................................................................... 19
5.3.1c Asset Condition Assessment .................................................................................................. 21
5.3.1d Capital Program Planning ........................................................................................................ 21
5.3.1e Capital Project Delivery ........................................................................................................... 24
5.3.2 Overview of Assets Managed ......................................................................................................... 25
5.3.2a Description of the distribution service area ........................................................................... 25
5.3.2b System configuration .............................................................................................................. 27
5.3.2c Information by asset type ...................................................................................................... 33
5.3.2d Assessment of existing system capacity ................................................................................. 35
5.3.3 Asset Lifecycle Optimization Policies and Practices ....................................................................... 39
5.3.3a Formal policies and practices .................................................................................................. 39
5.3.3b Lifecycle Risk management ..................................................................................................... 42
5.3.4 System Capability assessment for renewable energy generation ................................................. 44
5.3.4a Applications from renewable generators > 10kW .................................................................. 44
5.3.4b Renewable generation connections anticipated 2023 ‐2027 ................................................. 44
5.3.5 Rate‐Funded Activities to Defer Distribution Infrastructure ........................................................ 44
5.4 Capital Expenditure Plan ................................................................................................................ 45
5.4.1 Capital Expenditure Summary ....................................................................................................... 47
5.4.2 Previous 5 year Capital Variance Explanation ............................................................................... 47
EPCOR Electricity Distribution Ontario Inc. 2023 – 2027 Distribution System Plan – Ver. 1.0
_____________________________________________________________________________________ Page 3 of 128
5.4.3 Impact of system capital investment on O&M costs .................................................................... 48
5.4.4 Investment drivers ........................................................................................................................ 51
5.4.5 Justifying Capital Expenditures ..................................................................................................... 54
5.4.6 Material Investments .................................................................................................................... 54
System Renewal Misc. Pole Replacement .............................................................................................. 56
System Renewal Misc. Rebuilds Underground ....................................................................................... 59
System Renewal Pole Line Rebuilds/Extensions ‐ 2023 .......................................................................... 62
System Renewal Pole Line Rebuilds/Extensions ‐ 2024 .......................................................................... 65
System Renewal Pole Line Rebuilds/Extensions ‐ 2025 .......................................................................... 68
System Renewal Pole Line Rebuilds/Extensions ‐ 2026 .......................................................................... 71
System Renewal Pole Line Rebuilds/Extensions ‐ 2027 .......................................................................... 74
Substation Feeder Protection Relay Replacement ................................................................................. 78
SCADA Fault Indicators ........................................................................................................................... 81
SCADA Controlled 44kV Overhead Switch Project .................................................................................. 83
System Service – Grid Modernization ‐ ArcGIS Pro and Utility Network Migration ............................... 85
Stayner MS 1 and MS2 Substation Upgrades ......................................................................................... 91
MS1 Thornbury Substation Upgrades ..................................................................................................... 95
MS2 Thornbury Substation Upgrades ..................................................................................................... 98
MS7 Collingwood Station Upgrades ..................................................................................................... 101
System Service – Grid Modernization ‐ Customer Experience Enhancement Project ......................... 104
System Service – Grid Modernization ‐ WMS Implementation Project................................................ 108
System Access Customer Additions – non‐discretionary ...................................................................... 111
System Access Road Relocation – non‐discretionary ........................................................................... 113
System Access Smart Meter Expenditures – non‐discretionary ........................................................... 115
General Plant Fleet Vehicle Replacement ............................................................................................. 118
General Plant IT Hardware .................................................................................................................... 121
OT Cyber Security Enhancement Project .............................................................................................. 124
OT Servers and Software Refresh ......................................................................................................... 126
Appendices ................................................................................................................................................ 128
METSCO Asset Condition Assessment .................................................................................................. 128
Vehicle Fleet Condition Assessment ..................................................................................................... 128
EPCOR Electricity Distribution Ontario Inc. 2023 – 2027 Distribution System Plan – Ver. 1.0
_____________________________________________________________________________________ Page 4 of 128
EEDO Customer Survey Results............................................................................................................. 128
EPCOR Electricity Distribution Ontario Inc. 2023 – 2027 Distribution System Plan – Ver. 1.0
_____________________________________________________________________________________ Page 5 of 128
IntroductionEPCOR Electricity Distribution Ontario Inc. (“EEDO”) is an electricity distributor licensed by the Ontario Energy Board. In accordance with its Distribution License ED-2002-0518, the Applicant provides electricity distribution services in four communities in Simcoe County: Collingwood, Stayner and Creemore (part of Clearview Township) and Thornbury (part of The Town of the Blue Mountains). EEDO has developed its five year Distribution System Plan (DSP) for the years 2023 to 2027, and submits this as part of his rate application.
This is EEDO’s second consolidated Distribution System Plan prepared in accordance with Chapter 5A of Filing Requirements for Electricity Transmission and Distribution Rate Applications – 2022 Edition for 2023 Rate Applications – For Small Utilities (“Small Utilities Distribution System Plan”). The original draft of the Distribution System Plan, for customer consultation purposes, covered the forecast 2019 – 2023 timeframe. This Distribution System Plan covers the 2023 – 2027 timeframe.
EPCOR Utilities Inc. (“EUI”) is a corporation under the laws of the province of Alberta and is the parent company of EEDO a corporation incorporated under the laws of the province of Ontario. EEDO is a corporation incorporated under the laws of the province of Ontario and is 100% owned by the EPCOR Utilities Inc. (“EUI”). EUI purchased the 100% interest of Collus PowerStream Corp. (CPC) on Oct 1, 2018 (MADD application (EB-2017-0373) approved by OEB August 30, 2018).
EEDO receives power from Hydro One 44kV feeders and as such is considered an embedded distributor. Revenue is earned by EEDO by delivering electric power to the homes and businesses in the service territory. The rates charged for this and the performance standards that the energy delivery system must meet are regulated by the Ontario Energy Board. As of December 31, 2021, EEDO served approximately 18,600 electricity distribution customers across its service area.
The Town of Collingwood functions as the major commercial centre for northwest Simcoe County and northeast Grey County. It has been identified as a Primary Settlement Area in the Province’s Places to Grow Act. The municipality has experienced a significant shift toward tourist-related service industries since the closure of the Collingwood Steamship Lines (CSL) shipbuilding operation in 1986. Other key large manufacturing losses, specifically affecting electricity demand, include the loss of large electricity users such as Magna and Collingwood Ethanol and load reductions from remaining users such as Pilkington Glass (no longer a large user). Today, Collingwood is a major tourist destination for the Greater Toronto Area (GTA). Collingwood is considered a regional hub for recreation, health care, commercial services and various types of employment. It is a prime tourist destination for both summer and winter recreational activities. Stayner, Creemore and Thornbury are smaller communities with a mix of residential and light general service customers.
EEDO is responsible for maintaining distribution and infrastructure assets deployed over 45 square kilometers. EEDO’s main objective is to optimize performance of assets at a reasonable cost with due regard for system reliability, public & worker safety and customer service expectations.
EPCOR Electricity Distribution Ontario Inc. 2023 – 2027 Distribution System Plan – Ver. 1.0
_____________________________________________________________________________________ Page 6 of 128
5.2 DistributionSystemPlan5.2.1DistributionSystemPlanoverview
EEDO’s Distribution System Plan documents EEDO’s asset management processes and capital expenditure plan for the 2023-2027 period. The Distribution System Plan documents the practices, policies and processes that are in-place to ensure that investment decisions support EEDO’s desired outcomes in a cost-effective manner and provides value to the customer.
EEDO’s Distribution System Plan is designed to support the achievement of the four key OEB established performance outcomes:
1. Customer Focus: services are provided in a manner that responds to identified customer preferences;
2. Operational Effectiveness: continuous improvement in productivity and cost performance is achieved; and utilities deliver on system reliability and quality objectives;
3. Public Policy Responsiveness: utilities deliver on obligations mandated by government (e.g., in legislation and in regulatory requirements imposed further to Ministerial directives to the Board); and
4. Financial Performance: financial viability is maintained; and savings from operational effectiveness are sustainable.
Since acquiring the utility on Oct. 1, 2018, EEDO has been engaging with our customers and stakeholders through multiple channels on these objectives. It is through these interactions that EEDO believes its customers have a vision for a cost effective, responsive and reliable electricity service delivered through a resilient system that can continue to meet climate change impacts.
To support this customer driven vision, EEDO has developed a plan that renews its assets such as power poles, municipal stations, and its power delivery equipment in order to maintain a base level of reliability. To optimize the cost of this work, these assets would be renewed based on a health condition assessment, not simply by age.
Despite EEDO’s best efforts to maintain a reliable system, the service is still subject to unplanned outages from events like storms where trees fall onto power lines causing a faulted condition. Customer feedback during these outages and through its recent survey has demonstrated a desire to resolve these outages faster, and to provide more timely information.
To improve on this performance, EEDO plans to deploy smart devices such as line sensors and remotely controllable switches to more quickly locate a fault and remotely restore customers. This is also potentially a more cost effective and safe response because there should be less time spent in the field searching for the fault.
While EEDO’s online outage map provides information where customers can retrieve real time information around where an outage is and when it may be restored, EEDO plans to implement solutions whereby outage information is pushed to customers in real time. This may be in the form of text or email, whereby the customer may be able to respond with any information they may have such as pictures of failed electrical equipment.
EPCOR Electricity Distribution Ontario Inc. 2023 – 2027 Distribution System Plan – Ver. 1.0
_____________________________________________________________________________________ Page 7 of 128
EEDO believes that our customer’s want to continue to participate in the opportunities surrounding distributed energy resources such as electric vehicle integration and distributed renewable energy. To prepare for this grid evolution, EEDO has been implementing grid technology solutions such as a digital model of our system that permits for advanced analytics. This technology will be essential to maintain safety and reliability with the complexities introduced by EV charging behaviours and exported energy from batteries and solar PV. EEDO has developed a plan to continue to upgrade, modify and keep secure these grid technology solutions in order to maintain pace with the growing distributed energy resources.
EEDO has organized the required information using the section headings in the Distribution System Plan Filing Requirements. Investment projects and activities have been grouped into one of the four OEB defined investment categories listed below, based on the ‘trigger’ driver of the expenditure:
System access - investments are modifications (including asset relocation) to the distribution system EEDO is obligated to perform to provide a customer (including a generator customer) or group of customers with access to electricity services via EEDO’s distribution system. This also includes meter refreshes as mandated by Measurement Canada and the OEB.
System renewal - investments involve replacing and/or refurbishing system assets to extend the original service life of the assets and thereby maintain the ability of EEDO’s distribution system to provide customers with electricity services.
System service - investments are modifications to EEDO’s distribution system to ensure the distribution system continues to meet EEDO operational objectives while addressing anticipated future customer electricity service requirements and grid modernization.
General plant - investments are modifications, replacements or additions to EEDO’s assets that are not part of the distribution system; including land and buildings; tools and equipment; rolling stock and electronic devices and software used to support day to day business and operations activities
The electric distribution system is capital intensive in nature and prudent capital investments and maintenance plans are essential to ensure the sustainability of the distribution network. EEDO’s Distribution System Plan documents the practices, policies and processes that are in-place to ensure that decisions on capital investments and maintenance plans support EEDO’s desired outcomes in a cost-effective manner and provides value to the customer.
As part of its planning process, EEDO has aimed for a consistent capital budget envelope for the DSP period that balances annual mandatory System Access investments with non-mandatory needs in the other three investment categories through a project pacing and prioritization process.
Individual capital investment category variation recognizes the specific impact of System Access work and other competing needs on the ability of EEDO to fund/do other work at the same time while keeping rates manageable. In this sense other non-mandatory work (i.e. System Renewal, System Service and General Plant) is prioritized, paced and managed to provide consistent yearly overall capital spends. While individual capital categories may vary from year to year, EEDO’s overall Capital spend has been kept relatively consistent over the DSP plan period to provide a steady and predictable impact on rates.
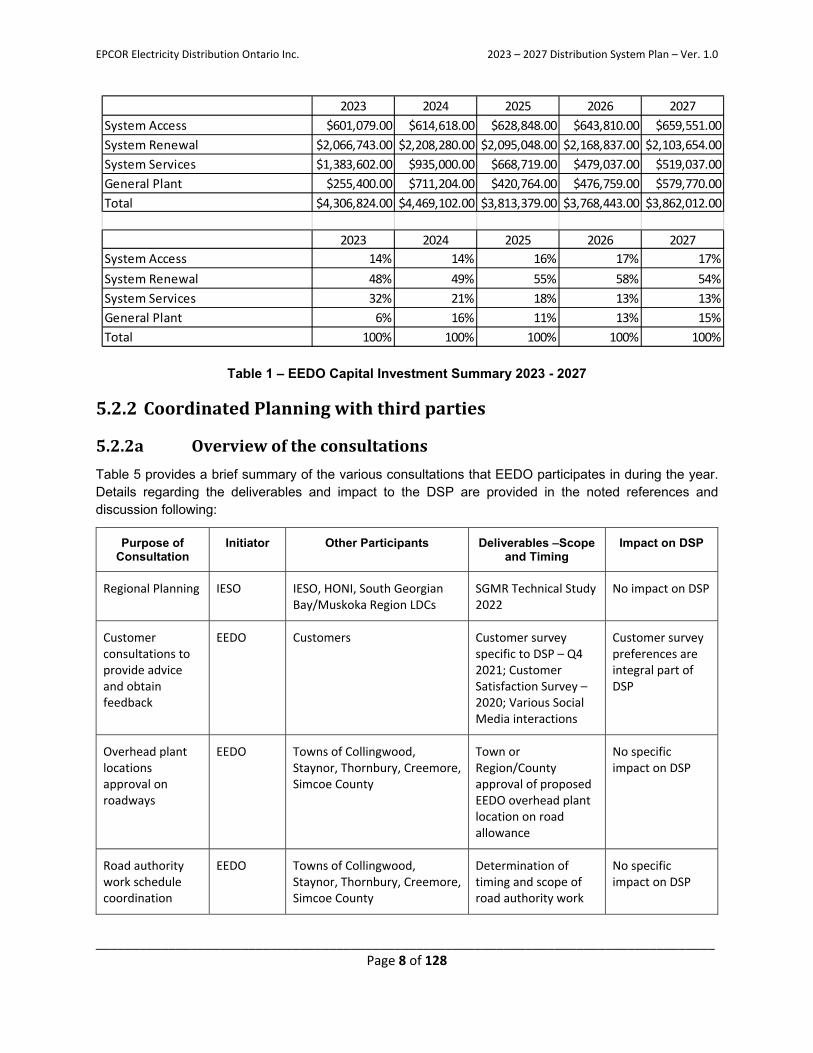
The following tables summarize the proposed capital investments (annual $ and % spend) within the four designated categories for the 2023 – 2027 period:
EPCOR Electricity Distribution Ontario Inc. 2023 – 2027 Distribution System Plan – Ver. 1.0
_____________________________________________________________________________________ Page 8 of 128
Table 1 – EEDO Capital Investment Summary 2023 - 2027
5.2.2CoordinatedPlanningwiththirdparties
5.2.2a Overviewoftheconsultations
Table 5 provides a brief summary of the various consultations that EEDO participates in during the year. Details regarding the deliverables and impact to the DSP are provided in the noted references and discussion following:
Purpose of Consultation
Initiator Other Participants Deliverables –Scope and Timing
Impact on DSP
Regional Planning IESO IESO, HONI, South Georgian Bay/Muskoka Region LDCs
SGMR Technical Study 2022
No impact on DSP
Customer consultations to provide advice and obtain feedback
EEDO Customers Customer survey specific to DSP – Q4 2021; Customer Satisfaction Survey – 2020; Various Social Media interactions
Customer survey preferences are integral part of DSP
Overhead plant locations approval on roadways
EEDO Towns of Collingwood, Staynor, Thornbury, Creemore, Simcoe County
Town or Region/County approval of proposed EEDO overhead plant location on road allowance
No specific impact on DSP
Road authority work schedule coordination
EEDO Towns of Collingwood, Staynor, Thornbury, Creemore, Simcoe County
Determination of timing and scope of road authority work
No specific impact on DSP
2023 2024 2025 2026 2027
System Access $601,079.00 $614,618.00 $628,848.00 $643,810.00 $659,551.00
System Renewal $2,066,743.00 $2,208,280.00 $2,095,048.00 $2,168,837.00 $2,103,654.00
System Services $1,383,602.00 $935,000.00 $668,719.00 $479,037.00 $519,037.00
General Plant $255,400.00 $711,204.00 $420,764.00 $476,759.00 $579,770.00
Total $4,306,824.00 $4,469,102.00 $3,813,379.00 $3,768,443.00 $3,862,012.00
2023 2024 2025 2026 2027
System Access 14% 14% 16% 17% 17%
System Renewal 48% 49% 55% 58% 54%
System Services 32% 21% 18% 13% 13%
General Plant 6% 16% 11% 13% 15%
Total 100% 100% 100% 100% 100%
EPCOR Electricity Distribution Ontario Inc. 2023 – 2027 Distribution System Plan – Ver. 1.0
_____________________________________________________________________________________ Page 9 of 128
that may impact existing EEDO plant
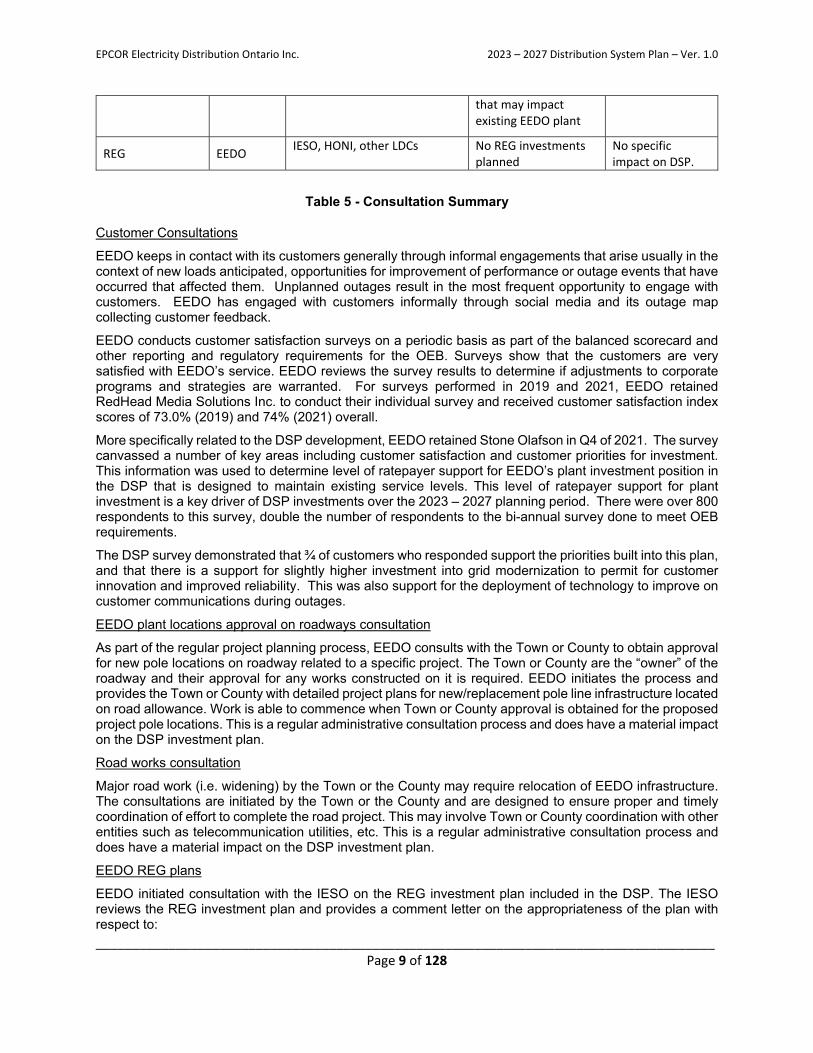
REG EEDO IESO, HONI, other LDCs No REG investments
planned No specific impact on DSP.
Table 5 - Consultation Summary
Customer Consultations
EEDO keeps in contact with its customers generally through informal engagements that arise usually in the context of new loads anticipated, opportunities for improvement of performance or outage events that have occurred that affected them. Unplanned outages result in the most frequent opportunity to engage with customers. EEDO has engaged with customers informally through social media and its outage map collecting customer feedback.
EEDO conducts customer satisfaction surveys on a periodic basis as part of the balanced scorecard and other reporting and regulatory requirements for the OEB. Surveys show that the customers are very satisfied with EEDO’s service. EEDO reviews the survey results to determine if adjustments to corporate programs and strategies are warranted. For surveys performed in 2019 and 2021, EEDO retained RedHead Media Solutions Inc. to conduct their individual survey and received customer satisfaction index scores of 73.0% (2019) and 74% (2021) overall.
More specifically related to the DSP development, EEDO retained Stone Olafson in Q4 of 2021. The survey canvassed a number of key areas including customer satisfaction and customer priorities for investment. This information was used to determine level of ratepayer support for EEDO’s plant investment position in the DSP that is designed to maintain existing service levels. This level of ratepayer support for plant investment is a key driver of DSP investments over the 2023 – 2027 planning period. There were over 800 respondents to this survey, double the number of respondents to the bi-annual survey done to meet OEB requirements.
The DSP survey demonstrated that ¾ of customers who responded support the priorities built into this plan, and that there is a support for slightly higher investment into grid modernization to permit for customer innovation and improved reliability. This was also support for the deployment of technology to improve on customer communications during outages.
EEDO plant locations approval on roadways consultation
As part of the regular project planning process, EEDO consults with the Town or County to obtain approval for new pole locations on roadway related to a specific project. The Town or County are the “owner” of the roadway and their approval for any works constructed on it is required. EEDO initiates the process and provides the Town or County with detailed project plans for new/replacement pole line infrastructure located on road allowance. Work is able to commence when Town or County approval is obtained for the proposed project pole locations. This is a regular administrative consultation process and does have a material impact on the DSP investment plan.
Road works consultation
Major road work (i.e. widening) by the Town or the County may require relocation of EEDO infrastructure. The consultations are initiated by the Town or the County and are designed to ensure proper and timely coordination of effort to complete the road project. This may involve Town or County coordination with other entities such as telecommunication utilities, etc. This is a regular administrative consultation process and does have a material impact on the DSP investment plan.
EEDO REG plans
EEDO initiated consultation with the IESO on the REG investment plan included in the DSP. The IESO reviews the REG investment plan and provides a comment letter on the appropriateness of the plan with respect to:
EPCOR Electricity Distribution Ontario Inc. 2023 – 2027 Distribution System Plan – Ver. 1.0
_____________________________________________________________________________________ Page 10 of 128
• The applications it has received from renewable generators for connection in EEDO’s service area;
• Whether EEDO has consulted with the IESO, or participated in planning meetings with the IESO;
• The potential need for co-ordination with other distributors and/or transmitters or others on implementing elements of the REG investments; and
• Whether the REG investments proposed in the DSP are consistent with any Regional Infrastructure Plan.
EEDO has not proposed any REG investments during the 5-year Distribution System Plan (DSP) period, and as such, no letter from the IESO is required.
Other Consultations
EEDO consults with its neighbouring utilities, such as Hydro One Distribution and Wasaga Distribution, on various matters such as joint use on poles, mutual assistance during severe weather incidents, etc.
A South Georgian Bay/Muskoka Region 2022 Technical Study was published in April 2021, and scoping assessment published in November of 2021. In the reports, two sub-regions formed part of the technical study – Barrie/Innisfil and Parry Sound/Muskoka. EEDO is considered outside of both these sub-regions as it was determined that local needs can be addressed through local planning between the transmitter (HONI) and EEDO. This study did not impact the DSP development. Through conversations with HONI, EEDO was able to determine that there is still available capacity through their transmission substations (TS) without the need for additional TS capacity, rather gained by transferring load among feeders from the TS.
5.2.3PerformanceMeasurementforcontinuousimprovement
5.2.3a MetricsusedtomonitorDSPperformanceEEDO has focuses on maintaining the adequacy, reliability and quality of service to its distribution customers. EEDO reviews DSP performance on an ongoing basis through various mechanisms such as:
Customer oriented performance - Customer survey
On a periodic basis, EEDO undertakes customer satisfaction surveys to obtain feedback on the overall value of service offered to customers. Customers (residential and commercial) are engaged to provide high level feedback on their perceptions of EEDO performance and where they think EEDO could improve service. EEDO’s target is maintain an Overall Customer Satisfaction Index score of 70% or higher. In 2019 this score was 73% and in 2021 this score was 74%.
Customer oriented performance - Service Reliability
Service reliability issues (i.e. Trouble Calls), as noted in crew Field & Time Reports, are reviewed by the Manager of Hydro Operations on a daily basis. Control Room logs are also received that cover any after-hours calls received by EPCOR Distribution and Transmission Inc’s Control Room staff in Edmonton who provide after-hours call answering service for EEDO. Meetings and discussions are held to review issues of an exceptional nature.
OEB defined baselines will be used to compare rolling 5-year averages for SAIDI and SAIFI (excluding loss of supply and major event days). For this DSP it is assumed that OEB baselines will be derived from 2018-
EPCOR Electricity Distribution Ontario Inc. 2023 – 2027 Distribution System Plan – Ver. 1.0
_____________________________________________________________________________________ Page 11 of 128
2022 reliability performance and will remain in place for most of the DSP period. The baselines are used as targets for reliability performance expectations in the current year. SAIDI and SAIFI are defined as:
SAIDI = System Average Interruption Duration Index
= Total Customer-Hours of Interruptions Total Customers Served
SAIFI = System Average Interruption Frequency Index
= Total Customer Interruptions Total Customers Served
The 2023 – 2027 reliability targets for SAIDI and SAIFI are based on the historical 2018 – 2022 5-year average for these measures.
These indices provide EEDO with an annual measure of its service performance for internal benchmarking and for comparisons with other distributors. In accordance with Section 7.3.2 of the OEB Electricity Distribution Rate Handbook, EEDO records and reports SAIDI and SAIFI figures annually.
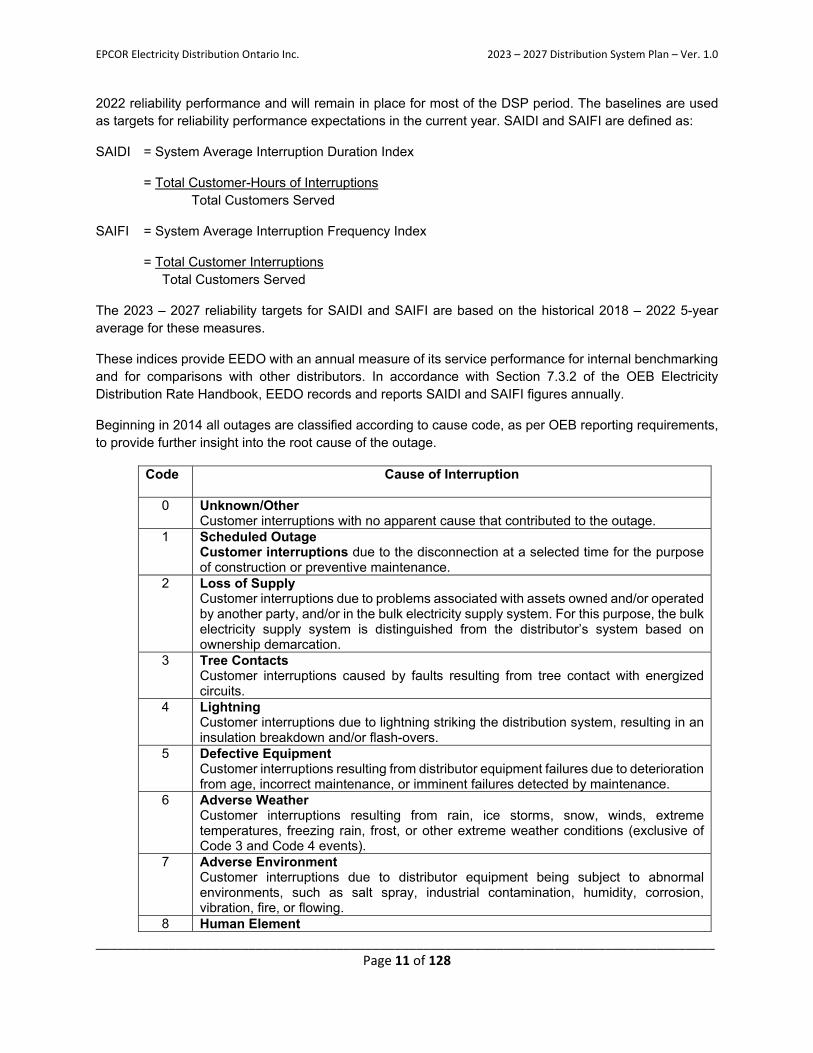
Beginning in 2014 all outages are classified according to cause code, as per OEB reporting requirements, to provide further insight into the root cause of the outage.
Code
Cause of Interruption
0 Unknown/Other Customer interruptions with no apparent cause that contributed to the outage.
1 Scheduled Outage Customer interruptions due to the disconnection at a selected time for the purpose of construction or preventive maintenance.
2 Loss of Supply Customer interruptions due to problems associated with assets owned and/or operated by another party, and/or in the bulk electricity supply system. For this purpose, the bulk electricity supply system is distinguished from the distributor’s system based on ownership demarcation.
3 Tree Contacts Customer interruptions caused by faults resulting from tree contact with energized circuits.
4 Lightning Customer interruptions due to lightning striking the distribution system, resulting in an insulation breakdown and/or flash-overs.
5 Defective Equipment Customer interruptions resulting from distributor equipment failures due to deterioration from age, incorrect maintenance, or imminent failures detected by maintenance.
6 Adverse Weather Customer interruptions resulting from rain, ice storms, snow, winds, extreme temperatures, freezing rain, frost, or other extreme weather conditions (exclusive of Code 3 and Code 4 events).
7 Adverse Environment Customer interruptions due to distributor equipment being subject to abnormal environments, such as salt spray, industrial contamination, humidity, corrosion, vibration, fire, or flowing.
8 Human Element
EPCOR Electricity Distribution Ontario Inc. 2023 – 2027 Distribution System Plan – Ver. 1.0
_____________________________________________________________________________________ Page 12 of 128
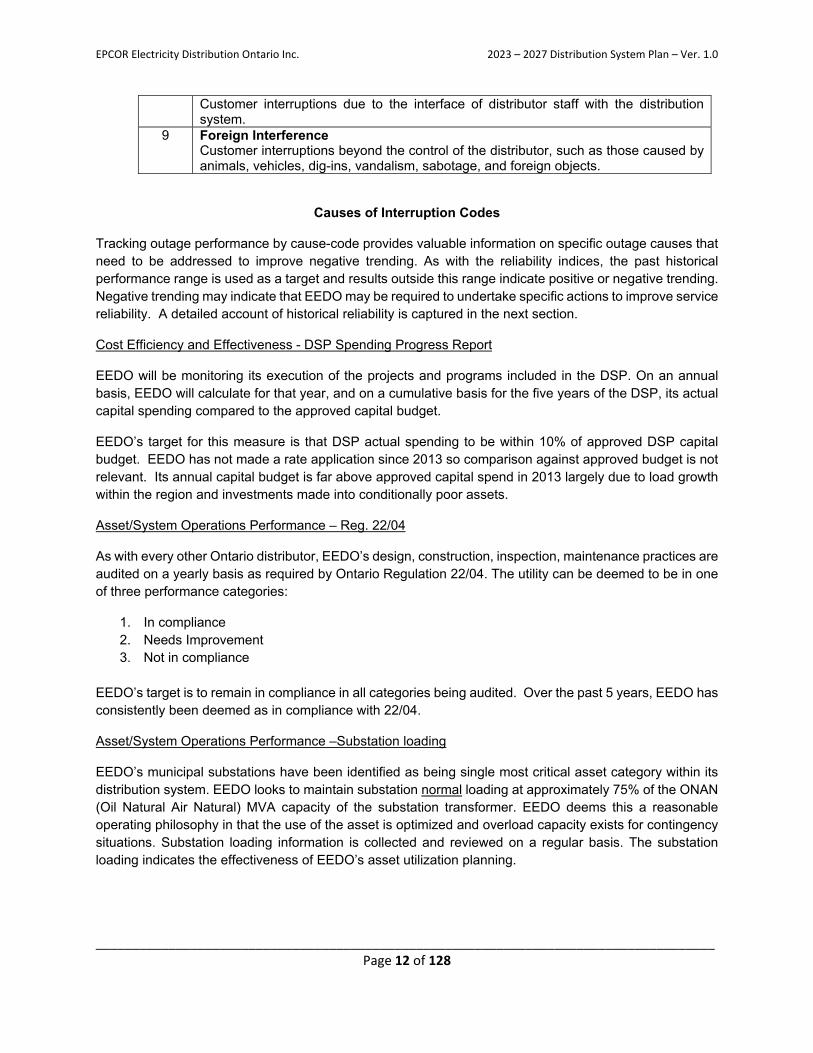
Customer interruptions due to the interface of distributor staff with the distribution system.
9 Foreign Interference Customer interruptions beyond the control of the distributor, such as those caused by animals, vehicles, dig-ins, vandalism, sabotage, and foreign objects.
Causes of Interruption Codes
Tracking outage performance by cause-code provides valuable information on specific outage causes that need to be addressed to improve negative trending. As with the reliability indices, the past historical performance range is used as a target and results outside this range indicate positive or negative trending. Negative trending may indicate that EEDO may be required to undertake specific actions to improve service reliability. A detailed account of historical reliability is captured in the next section.
Cost Efficiency and Effectiveness - DSP Spending Progress Report
EEDO will be monitoring its execution of the projects and programs included in the DSP. On an annual basis, EEDO will calculate for that year, and on a cumulative basis for the five years of the DSP, its actual capital spending compared to the approved capital budget.
EEDO’s target for this measure is that DSP actual spending to be within 10% of approved DSP capital budget. EEDO has not made a rate application since 2013 so comparison against approved budget is not relevant. Its annual capital budget is far above approved capital spend in 2013 largely due to load growth within the region and investments made into conditionally poor assets.
Asset/System Operations Performance – Reg. 22/04
As with every other Ontario distributor, EEDO’s design, construction, inspection, maintenance practices are audited on a yearly basis as required by Ontario Regulation 22/04. The utility can be deemed to be in one of three performance categories:
1. In compliance 2. Needs Improvement 3. Not in compliance
EEDO’s target is to remain in compliance in all categories being audited. Over the past 5 years, EEDO has consistently been deemed as in compliance with 22/04.
Asset/System Operations Performance –Substation loading
EEDO’s municipal substations have been identified as being single most critical asset category within its distribution system. EEDO looks to maintain substation normal loading at approximately 75% of the ONAN (Oil Natural Air Natural) MVA capacity of the substation transformer. EEDO deems this a reasonable operating philosophy in that the use of the asset is optimized and overload capacity exists for contingency situations. Substation loading information is collected and reviewed on a regular basis. The substation loading indicates the effectiveness of EEDO’s asset utilization planning.
EPCOR Electricity Distribution Ontario Inc. 2023 – 2027 Distribution System Plan – Ver. 1.0
_____________________________________________________________________________________ Page 13 of 128
EEDO’s target for this measure is that substation peak demand is not to exceed transformer maximum nameplate rating. This has not been met at all stations due to some switching events during peak days. Average utilization remains within limits. The EEDO service area is mostly summer peaking.
Asset/System Operations Performance –Feeder loading
As part of EEDO design and operating philosophy, 4kV and 44kV feeders are loaded to 50% of capacity to ensure that contingency situations can be addressed with the minimal amount of service interruption to the customer. Most MS feeders are sized to handle up to 500 Amps maximum load. Feeder loading is collected and reviewed on a monthly basis. The feeder loading indicates the effectiveness of EEDO’s asset utilization planning and contingency capability.
EEDO’s target for this measure is that feeder loading is not to exceed the 500A capacity level. This target has been met over the past five years.
There is capacity on the 4.16kV and 8.32kV feeder systems to accommodate incremental load growth (i.e. electric vehicles).
Asset/System Operations Performance – System Losses
EEDO system losses are monitored annually. System design and operation is managed such that system losses are maintained within OEB thresholds as defined in the OEB Practices Relating to Management of System Losses. Losses are monitored to ensure that the OEB 5% threshold is not exceeded.
EEDO system losses over the historical period are shown below:
2017 2018 2019 2020 2021 5.8% 2.6% 2.6% 3.6% 3.7%
EEDO System Losses
Losses have trended in the 2.6 – 6.0% range over this historical period.
RRFE Performance Scorecard
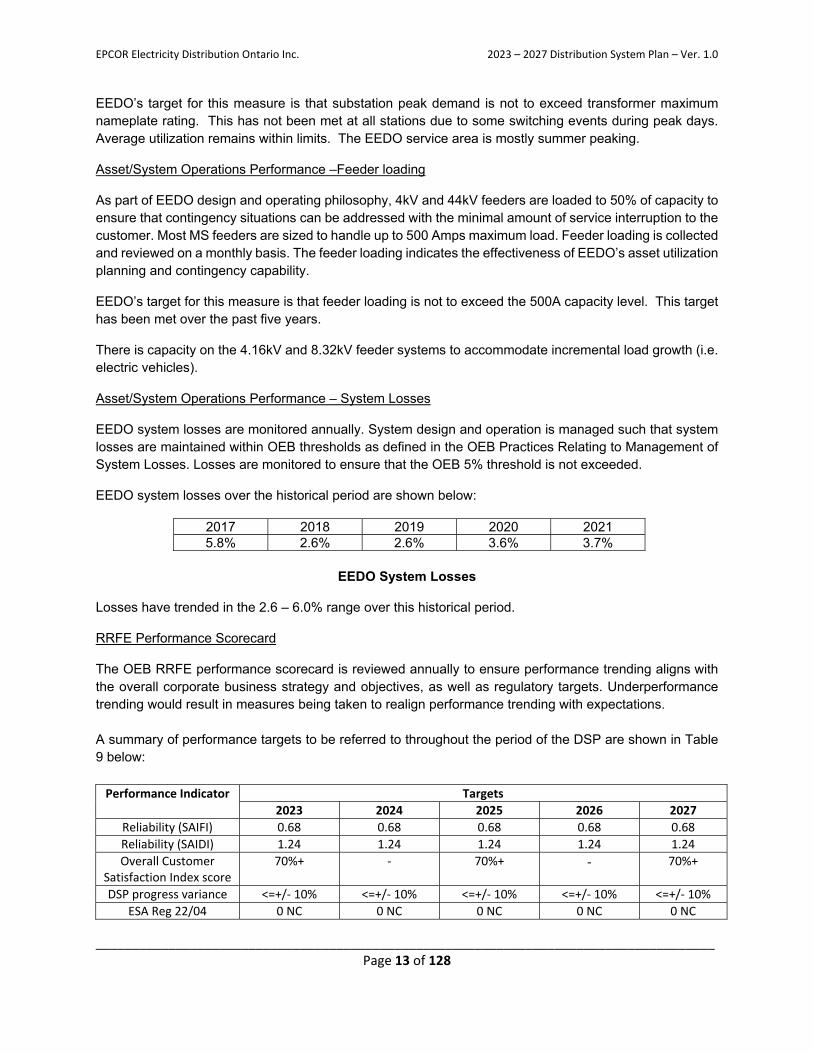
The OEB RRFE performance scorecard is reviewed annually to ensure performance trending aligns with the overall corporate business strategy and objectives, as well as regulatory targets. Underperformance trending would result in measures being taken to realign performance trending with expectations. A summary of performance targets to be referred to throughout the period of the DSP are shown in Table 9 below:
Performance Indicator Targets
2023 2024 2025 2026 2027
Reliability (SAIFI) 0.68 0.68 0.68 0.68 0.68
Reliability (SAIDI) 1.24 1.24 1.24 1.24 1.24
Overall Customer Satisfaction Index score
70%+ ‐ 70%+ ‐ 70%+
DSP progress variance <=+/‐ 10% <=+/‐ 10% <=+/‐ 10% <=+/‐ 10% <=+/‐ 10%
ESA Reg 22/04 0 NC 0 NC 0 NC 0 NC 0 NC
EPCOR Electricity Distribution Ontario Inc. 2023 – 2027 Distribution System Plan – Ver. 1.0
_____________________________________________________________________________________ Page 14 of 128
Substation loading (Normal)
Peak demand <=nameplate
Peak demand <=nameplate
Peak demand <=nameplate
Peak demand <=nameplate
Peak demand
<=nameplate
Feeder loading Feeder peak load <= 500
Amps
Feeder peak load <= 500
Amps
Feeder peak load <= 500
Amps
Feeder peak load <= 500
Amps
Feeder peak load <= 500
Amps
Losses <5% <5% <5% <5% <5%
DSP performance targets
*Customer satisfaction surveys performed biennially
Annual performance variances that are not within target ranges or meet minimal performance thresholds would result in senior management review of the cause that may result in changes to immediate or future plans to direct future performance back to target levels.
The RRFE performance scorecard metrics indicate that EEDO is effective in achieving RRFE performance outcomes. Most measures show historical performance is within target values. The OEB has ranked all Ontario LDCs in one of five efficiency groups (1 – 5) with Group 1 being deemed the most efficient and Group 5 being deemed the least efficient. EEDO is currently ranked in Group 2 with respect to Efficiency Assessment (stretch factor = 0.15%).
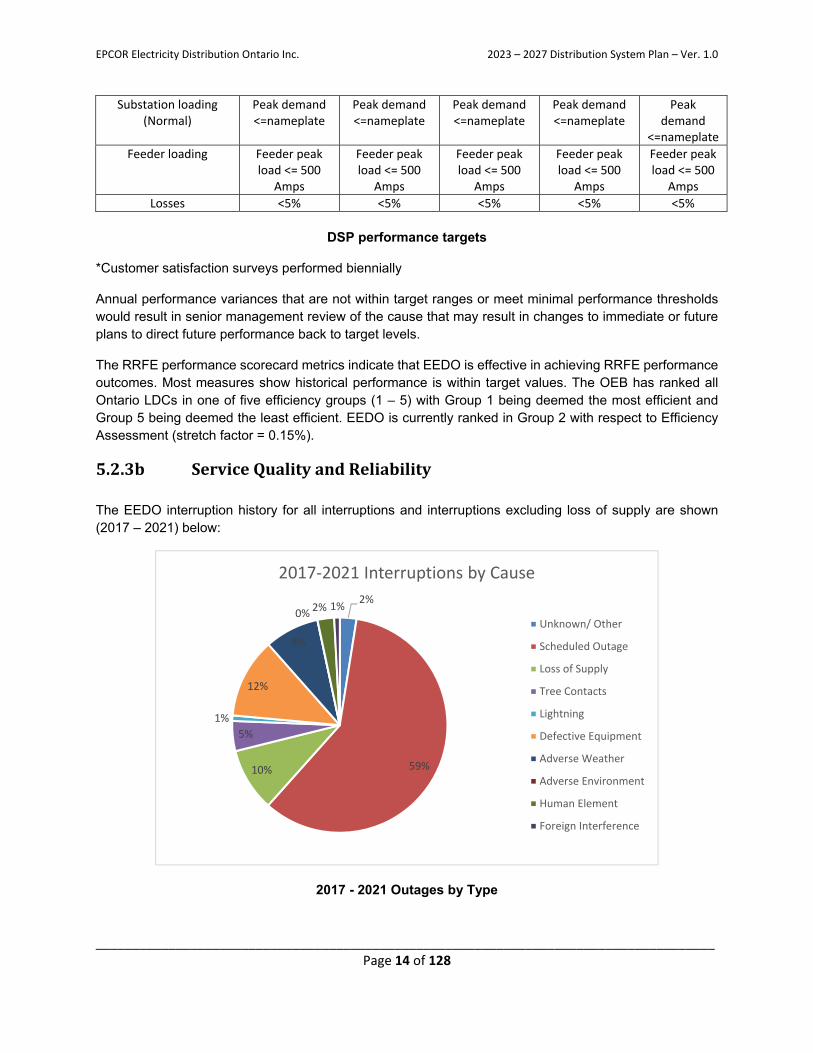
5.2.3b ServiceQualityandReliability
The EEDO interruption history for all interruptions and interruptions excluding loss of supply are shown (2017 – 2021) below:
2017 - 2021 Outages by Type
2%
59%10%
5%
1%
12%
8%
0% 2% 1%
2017‐2021 Interruptions by Cause
Unknown/ Other
Scheduled Outage
Loss of Supply
Tree Contacts
Lightning
Defective Equipment
Adverse Weather
Adverse Environment
Human Element
Foreign Interference
EPCOR Electricity Distribution Ontario Inc. 2023 – 2027 Distribution System Plan – Ver. 1.0
_____________________________________________________________________________________ Page 15 of 128
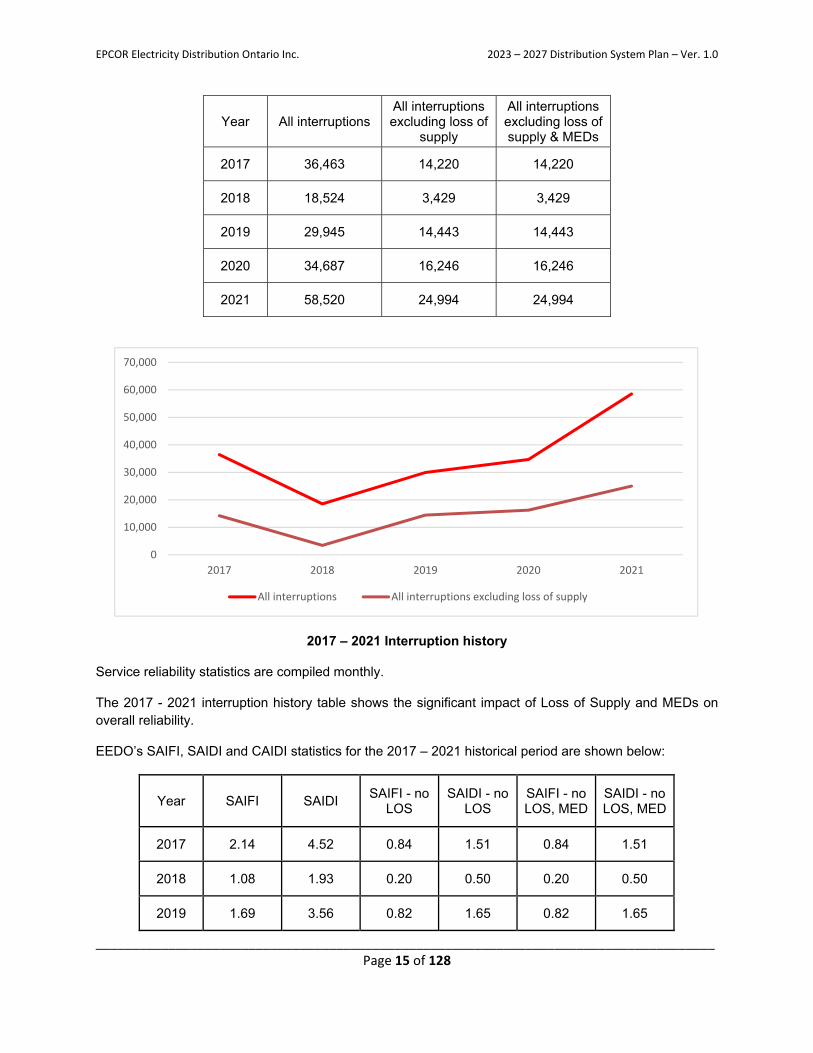
Year All interruptions All interruptions excluding loss of
supply
All interruptions excluding loss of supply & MEDs
2017 36,463 14,220 14,220
2018 18,524 3,429 3,429
2019 29,945 14,443 14,443
2020 34,687 16,246 16,246
2021 58,520 24,994 24,994
2017 – 2021 Interruption history
Service reliability statistics are compiled monthly.
The 2017 - 2021 interruption history table shows the significant impact of Loss of Supply and MEDs on overall reliability.
EEDO’s SAIFI, SAIDI and CAIDI statistics for the 2017 – 2021 historical period are shown below:
Year SAIFI SAIDI SAIFI - no
LOS SAIDI - no
LOS SAIFI - no LOS, MED
SAIDI - no LOS, MED
2017 2.14 4.52 0.84 1.51 0.84 1.51
2018 1.08 1.93 0.20 0.50 0.20 0.50
2019 1.69 3.56 0.82 1.65 0.82 1.65
0
10,000
20,000
30,000
40,000
50,000
60,000
70,000
2017 2018 2019 2020 2021
All interruptions All interruptions excluding loss of supply
EPCOR Electricity Distribution Ontario Inc. 2023 – 2027 Distribution System Plan – Ver. 1.0
_____________________________________________________________________________________ Page 16 of 128
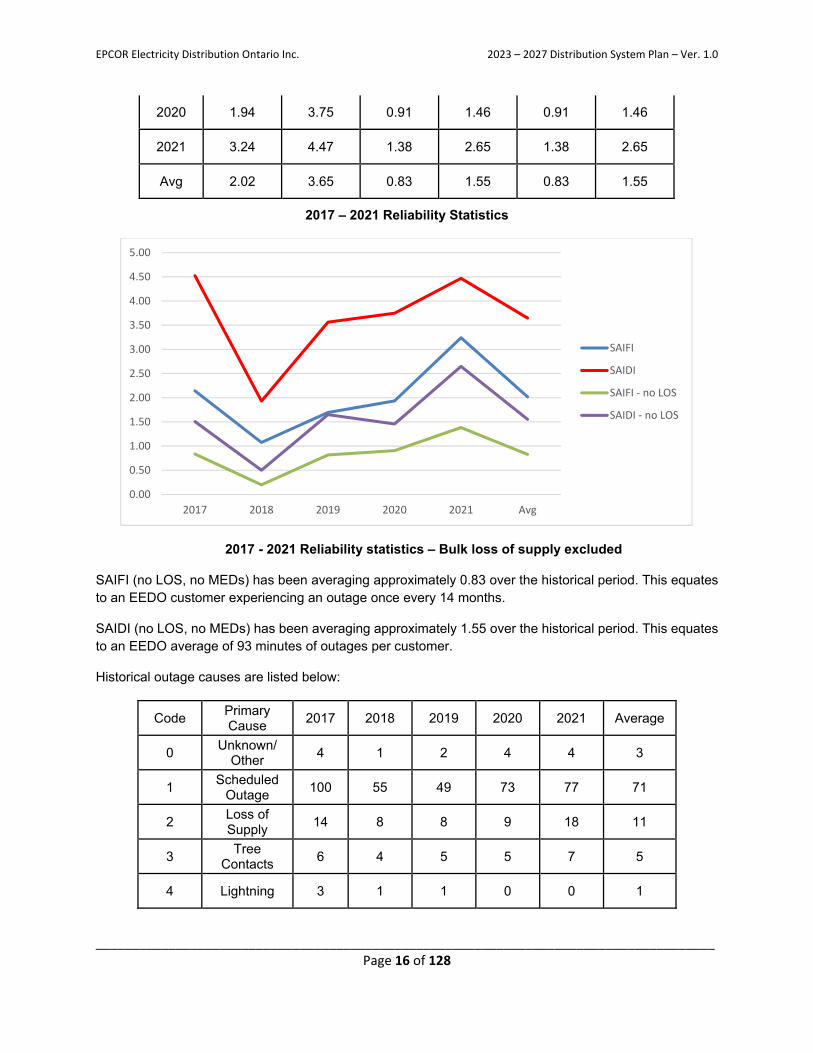
2020 1.94 3.75 0.91 1.46 0.91 1.46
2021 3.24 4.47 1.38 2.65 1.38 2.65
Avg 2.02 3.65 0.83 1.55 0.83 1.55
2017 – 2021 Reliability Statistics
2017 - 2021 Reliability statistics – Bulk loss of supply excluded
SAIFI (no LOS, no MEDs) has been averaging approximately 0.83 over the historical period. This equates to an EEDO customer experiencing an outage once every 14 months.
SAIDI (no LOS, no MEDs) has been averaging approximately 1.55 over the historical period. This equates to an EEDO average of 93 minutes of outages per customer.
Historical outage causes are listed below:
Code Primary Cause
2017 2018 2019 2020 2021 Average
0 Unknown/
Other 4 1 2 4 4 3
1 Scheduled
Outage 100 55 49 73 77 71
2 Loss of Supply
14 8 8 9 18 11
3 Tree
Contacts 6 4 5 5 7 5
4 Lightning 3 1 1 0 0 1
0.00
0.50
1.00
1.50
2.00
2.50
3.00
3.50
4.00
4.50
5.00
2017 2018 2019 2020 2021 Avg
SAIFI
SAIDI
SAIFI ‐ no LOS
SAIDI ‐ no LOS
EPCOR Electricity Distribution Ontario Inc. 2023 – 2027 Distribution System Plan – Ver. 1.0
_____________________________________________________________________________________ Page 17 of 128
5 Defective
Equipment 11 13 22 12 14 14
6 Adverse Weather
1 4 6 24 14 10
7 Adverse
Environment 0 0 0 0 0 0
8 Human Element
2 2 5 3 3 3
9 Foreign
Interference 0 1 0 2 2 1
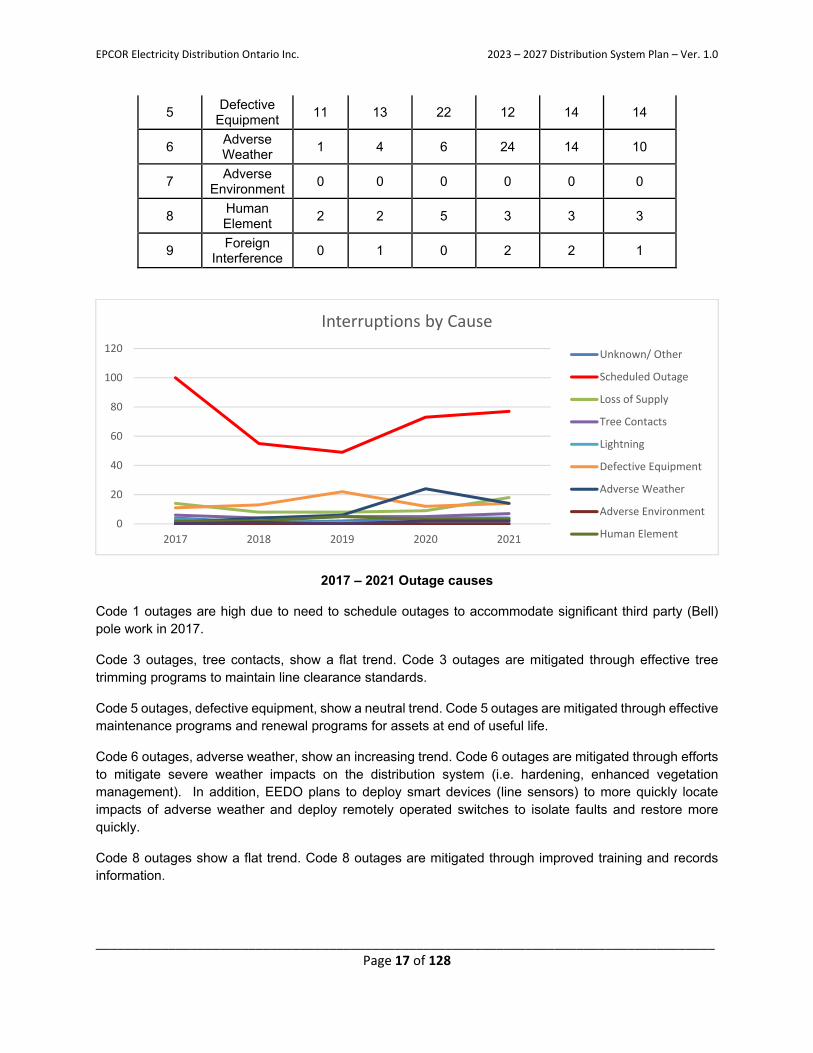
2017 – 2021 Outage causes
Code 1 outages are high due to need to schedule outages to accommodate significant third party (Bell) pole work in 2017.
Code 3 outages, tree contacts, show a flat trend. Code 3 outages are mitigated through effective tree trimming programs to maintain line clearance standards.
Code 5 outages, defective equipment, show a neutral trend. Code 5 outages are mitigated through effective maintenance programs and renewal programs for assets at end of useful life.
Code 6 outages, adverse weather, show an increasing trend. Code 6 outages are mitigated through efforts to mitigate severe weather impacts on the distribution system (i.e. hardening, enhanced vegetation management). In addition, EEDO plans to deploy smart devices (line sensors) to more quickly locate impacts of adverse weather and deploy remotely operated switches to isolate faults and restore more quickly.
Code 8 outages show a flat trend. Code 8 outages are mitigated through improved training and records information.
0
20
40
60
80
100
120
2017 2018 2019 2020 2021
Interruptions by Cause
Unknown/ Other
Scheduled Outage
Loss of Supply
Tree Contacts
Lightning
Defective Equipment
Adverse Weather
Adverse Environment
Human Element
EPCOR Electricity Distribution Ontario Inc. 2023 – 2027 Distribution System Plan – Ver. 1.0
_____________________________________________________________________________________ Page 18 of 128
Code 9 outages, foreign interference, show a neutral trend. Some Code 9 outages (i.e. animal contact) are mitigated through increased use of barriers and environmental design considerations. Other Code 9 outages (i.e. vehicle impacts) are more difficult to mitigate.
Customer oriented performance - Service Reliability
The reliability indices demonstrate the significant impact of planned outages and outages originating on the 44kV distribution system when compared to the 8.32kV and 4.16kV distribution systems. Many customers are affected by a single 44kVfeeder event as compared to an 8.32kv or 4.16kV feeder outage. Of note is the impact of Loss of Supply on total interruption numbers. This highlights the benefit of continuing the application of distribution automation on the 44kV system to mitigate the impact of outages.
As part of the Smart Grid development EEDO has implemented SmartMAP. SmartMAP is an innovative software solution that has improved outage restoration and operational efficiency, decreased system expansion costs, reduced theft of power, energy savings, and improved customer service for EEDO. It has resulted in improved outage documentation and information accuracy.
During this DSP period, EEDO intends to deploy line sensors to more accurately locate faults due to adverse weather conditions and tree contacts. This will speed up the time it takes for trouble crews to locate and clear any faults. In addition, EEDO intends to deploy remotely operated switches to fault isolate and restore as many customers as possible while trouble crews deal with the faulted condition.
Outage cause codes and anecdotal information indicate that system renewal requires attention in the DSP. Failure to address system renewal needs will affect long term system performance and not address the customer values identified through the customer survey process. Reliability was ranked high in customer surveys. Looking forward DSP investment priorities are expected to result in outcomes that maintain or enhance existing reliability performance.
EPCOR Electricity Distribution Ontario Inc. 2023 – 2027 Distribution System Plan – Ver. 1.0
_____________________________________________________________________________________ Page 19 of 128
5.3 AssetManagementProcess
This section of the Distribution System Plan provides a high-level overview of EEDO’s asset management process.
5.3.1AssetManagementProcessoverview
EEDO’s asset management process is a systematic approach used to plan and optimize ongoing capital, operating and maintenance expenditures on the distribution system and general plant. Electricity distributors are capital intensive in nature and prudent capital investments and maintenance plans are essential to ensure the sustainability of the distribution network. EEDO is continuing efforts to improve the information available to the asset management process for all major equipment.
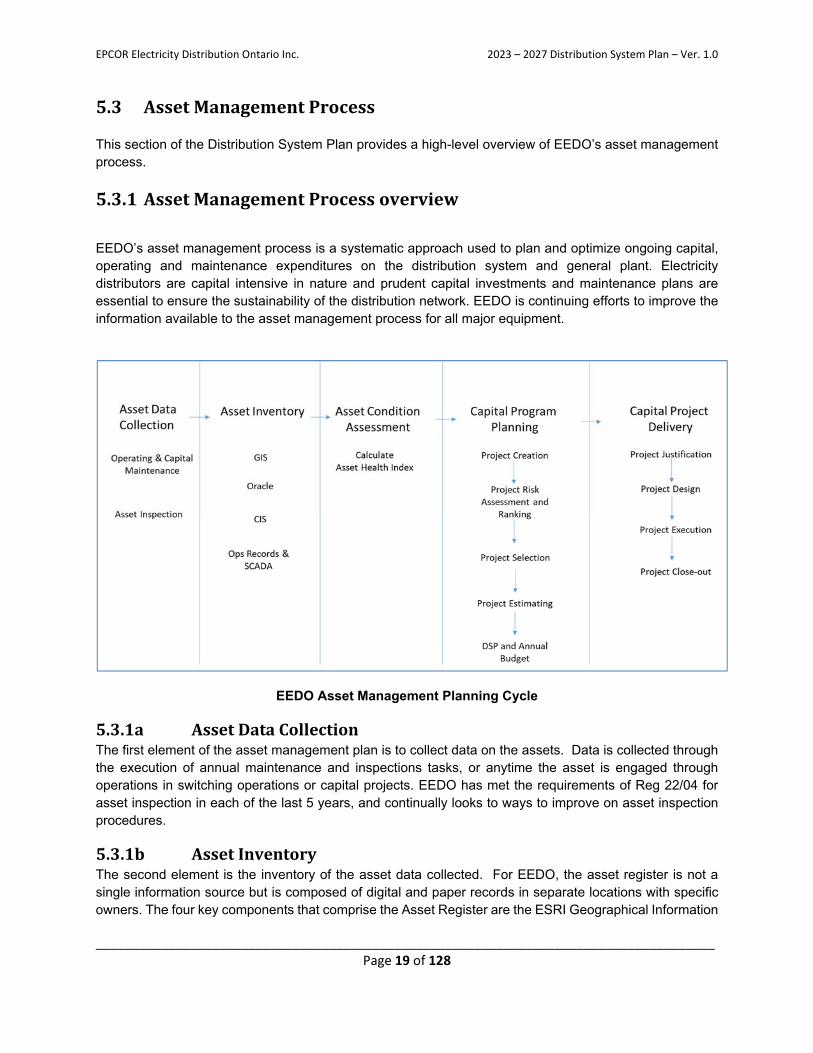
EEDO Asset Management Planning Cycle
5.3.1a AssetDataCollectionThe first element of the asset management plan is to collect data on the assets. Data is collected through the execution of annual maintenance and inspections tasks, or anytime the asset is engaged through operations in switching operations or capital projects. EEDO has met the requirements of Reg 22/04 for asset inspection in each of the last 5 years, and continually looks to ways to improve on asset inspection procedures.
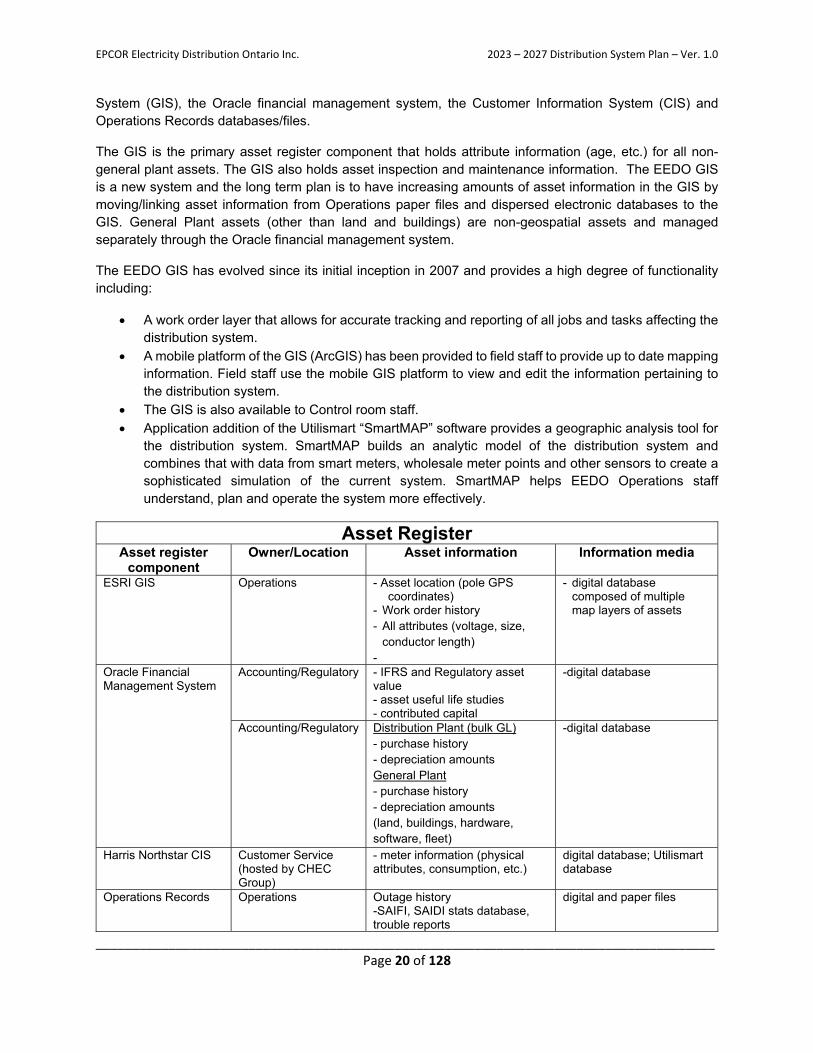
5.3.1b AssetInventoryThe second element is the inventory of the asset data collected. For EEDO, the asset register is not a single information source but is composed of digital and paper records in separate locations with specific owners. The four key components that comprise the Asset Register are the ESRI Geographical Information
EPCOR Electricity Distribution Ontario Inc. 2023 – 2027 Distribution System Plan – Ver. 1.0
_____________________________________________________________________________________ Page 20 of 128
System (GIS), the Oracle financial management system, the Customer Information System (CIS) and Operations Records databases/files.
The GIS is the primary asset register component that holds attribute information (age, etc.) for all non-general plant assets. The GIS also holds asset inspection and maintenance information. The EEDO GIS is a new system and the long term plan is to have increasing amounts of asset information in the GIS by moving/linking asset information from Operations paper files and dispersed electronic databases to the GIS. General Plant assets (other than land and buildings) are non-geospatial assets and managed separately through the Oracle financial management system.
The EEDO GIS has evolved since its initial inception in 2007 and provides a high degree of functionality including:
A work order layer that allows for accurate tracking and reporting of all jobs and tasks affecting the distribution system.
A mobile platform of the GIS (ArcGIS) has been provided to field staff to provide up to date mapping information. Field staff use the mobile GIS platform to view and edit the information pertaining to the distribution system.
The GIS is also available to Control room staff. Application addition of the Utilismart “SmartMAP” software provides a geographic analysis tool for
the distribution system. SmartMAP builds an analytic model of the distribution system and combines that with data from smart meters, wholesale meter points and other sensors to create a sophisticated simulation of the current system. SmartMAP helps EEDO Operations staff understand, plan and operate the system more effectively.
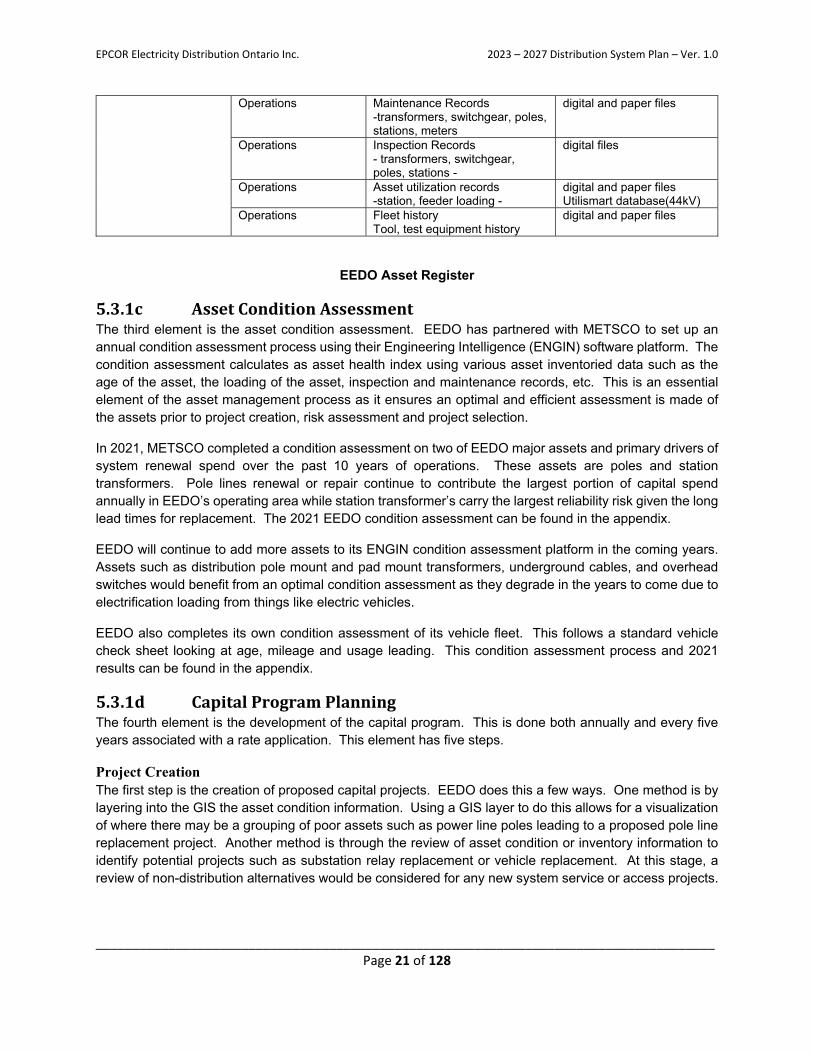
Asset Register Asset register
component Owner/Location Asset information Information media
ESRI GIS Operations - Asset location (pole GPS coordinates)
- Work order history - All attributes (voltage, size,
conductor length) -
- digital database composed of multiple map layers of assets
Oracle Financial Management System
Accounting/Regulatory - IFRS and Regulatory asset value - asset useful life studies - contributed capital
-digital database
Accounting/Regulatory Distribution Plant (bulk GL) - purchase history - depreciation amounts General Plant - purchase history - depreciation amounts (land, buildings, hardware, software, fleet)
-digital database
Harris Northstar CIS Customer Service (hosted by CHEC Group)
- meter information (physical attributes, consumption, etc.)
digital database; Utilismart database
Operations Records Operations
Outage history -SAIFI, SAIDI stats database, trouble reports
digital and paper files
EPCOR Electricity Distribution Ontario Inc. 2023 – 2027 Distribution System Plan – Ver. 1.0
_____________________________________________________________________________________ Page 21 of 128
Operations Maintenance Records -transformers, switchgear, poles, stations, meters
digital and paper files
Operations Inspection Records - transformers, switchgear, poles, stations -
digital files
Operations Asset utilization records -station, feeder loading -
digital and paper files Utilismart database(44kV)
Operations
Fleet history Tool, test equipment history
digital and paper files
EEDO Asset Register
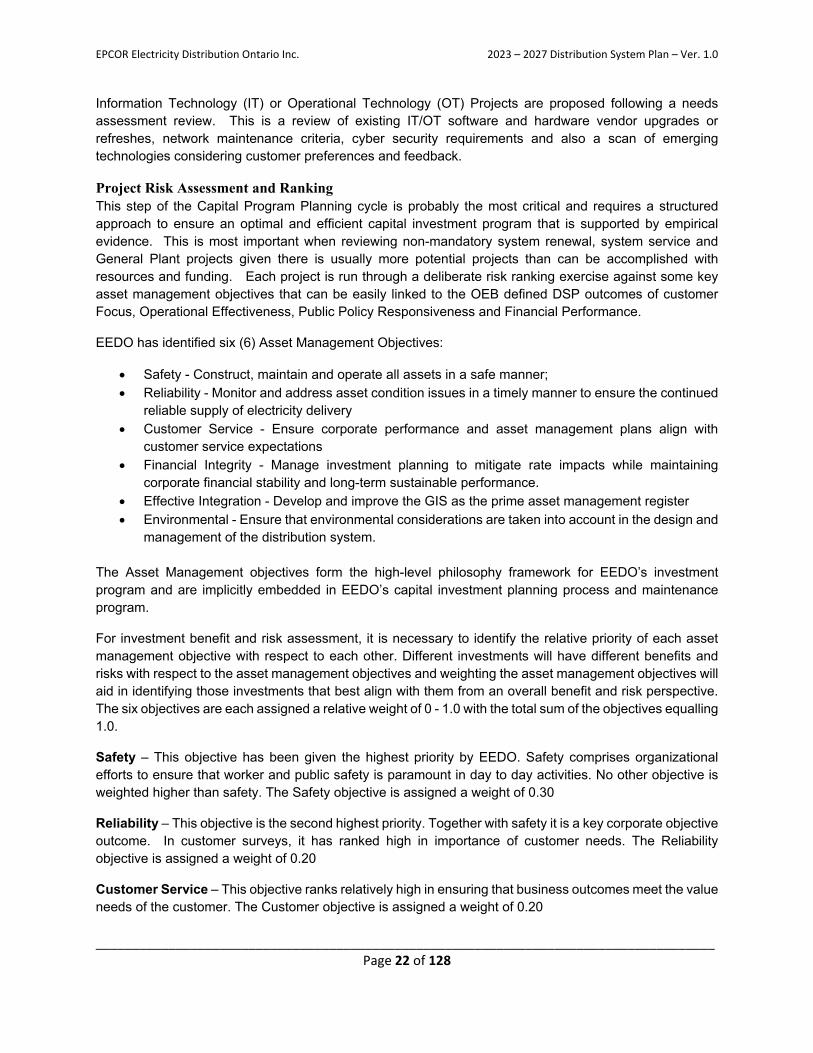
5.3.1c AssetConditionAssessmentThe third element is the asset condition assessment. EEDO has partnered with METSCO to set up an annual condition assessment process using their Engineering Intelligence (ENGIN) software platform. The condition assessment calculates as asset health index using various asset inventoried data such as the age of the asset, the loading of the asset, inspection and maintenance records, etc. This is an essential element of the asset management process as it ensures an optimal and efficient assessment is made of the assets prior to project creation, risk assessment and project selection.
In 2021, METSCO completed a condition assessment on two of EEDO major assets and primary drivers of system renewal spend over the past 10 years of operations. These assets are poles and station transformers. Pole lines renewal or repair continue to contribute the largest portion of capital spend annually in EEDO’s operating area while station transformer’s carry the largest reliability risk given the long lead times for replacement. The 2021 EEDO condition assessment can be found in the appendix.
EEDO will continue to add more assets to its ENGIN condition assessment platform in the coming years. Assets such as distribution pole mount and pad mount transformers, underground cables, and overhead switches would benefit from an optimal condition assessment as they degrade in the years to come due to electrification loading from things like electric vehicles.
EEDO also completes its own condition assessment of its vehicle fleet. This follows a standard vehicle check sheet looking at age, mileage and usage leading. This condition assessment process and 2021 results can be found in the appendix.
5.3.1d CapitalProgramPlanningThe fourth element is the development of the capital program. This is done both annually and every five years associated with a rate application. This element has five steps.
Project Creation The first step is the creation of proposed capital projects. EEDO does this a few ways. One method is by layering into the GIS the asset condition information. Using a GIS layer to do this allows for a visualization of where there may be a grouping of poor assets such as power line poles leading to a proposed pole line replacement project. Another method is through the review of asset condition or inventory information to identify potential projects such as substation relay replacement or vehicle replacement. At this stage, a review of non-distribution alternatives would be considered for any new system service or access projects.
EPCOR Electricity Distribution Ontario Inc. 2023 – 2027 Distribution System Plan – Ver. 1.0
_____________________________________________________________________________________ Page 22 of 128
Information Technology (IT) or Operational Technology (OT) Projects are proposed following a needs assessment review. This is a review of existing IT/OT software and hardware vendor upgrades or refreshes, network maintenance criteria, cyber security requirements and also a scan of emerging technologies considering customer preferences and feedback.
Project Risk Assessment and Ranking This step of the Capital Program Planning cycle is probably the most critical and requires a structured approach to ensure an optimal and efficient capital investment program that is supported by empirical evidence. This is most important when reviewing non-mandatory system renewal, system service and General Plant projects given there is usually more potential projects than can be accomplished with resources and funding. Each project is run through a deliberate risk ranking exercise against some key asset management objectives that can be easily linked to the OEB defined DSP outcomes of customer Focus, Operational Effectiveness, Public Policy Responsiveness and Financial Performance.
EEDO has identified six (6) Asset Management Objectives:
Safety - Construct, maintain and operate all assets in a safe manner; Reliability - Monitor and address asset condition issues in a timely manner to ensure the continued
reliable supply of electricity delivery Customer Service - Ensure corporate performance and asset management plans align with
customer service expectations Financial Integrity - Manage investment planning to mitigate rate impacts while maintaining
corporate financial stability and long-term sustainable performance. Effective Integration - Develop and improve the GIS as the prime asset management register Environmental - Ensure that environmental considerations are taken into account in the design and
management of the distribution system. The Asset Management objectives form the high-level philosophy framework for EEDO’s investment program and are implicitly embedded in EEDO’s capital investment planning process and maintenance program.
For investment benefit and risk assessment, it is necessary to identify the relative priority of each asset management objective with respect to each other. Different investments will have different benefits and risks with respect to the asset management objectives and weighting the asset management objectives will aid in identifying those investments that best align with them from an overall benefit and risk perspective. The six objectives are each assigned a relative weight of 0 - 1.0 with the total sum of the objectives equalling 1.0.
Safety – This objective has been given the highest priority by EEDO. Safety comprises organizational efforts to ensure that worker and public safety is paramount in day to day activities. No other objective is weighted higher than safety. The Safety objective is assigned a weight of 0.30
Reliability – This objective is the second highest priority. Together with safety it is a key corporate objective outcome. In customer surveys, it has ranked high in importance of customer needs. The Reliability objective is assigned a weight of 0.20
Customer Service – This objective ranks relatively high in ensuring that business outcomes meet the value needs of the customer. The Customer objective is assigned a weight of 0.20
EPCOR Electricity Distribution Ontario Inc. 2023 – 2027 Distribution System Plan – Ver. 1.0
_____________________________________________________________________________________ Page 23 of 128
Financial integrity - A stable rate of return, low electricity rates and ability to sustainably invest in distribution system access, service, renewal and general plant are key to the long term success of this objective. Balancing of stakeholder interests in this area is an ongoing exercise. In customer surveys, low electricity rates ranked high in importance of customer needs. In consideration that EEDO’s controllable portion of the customer bill is less than 25%, the financial integrity objective is assigned a weight of 0.15
Effective integration – This objective ensures that continual improvement of processes and practices ranks high in consideration of program development and deliverables. It is assigned a weight of 0.10.
Environmental – It is recognized that environmental considerations benefit the community as a whole. Considering the low likelihood of EEDO to affect the environment (e.g. oil spills, aesthetics, etc.) this goal does not carry the priority of the previous goals. The Environmental objective is assigned a weight of 0.05
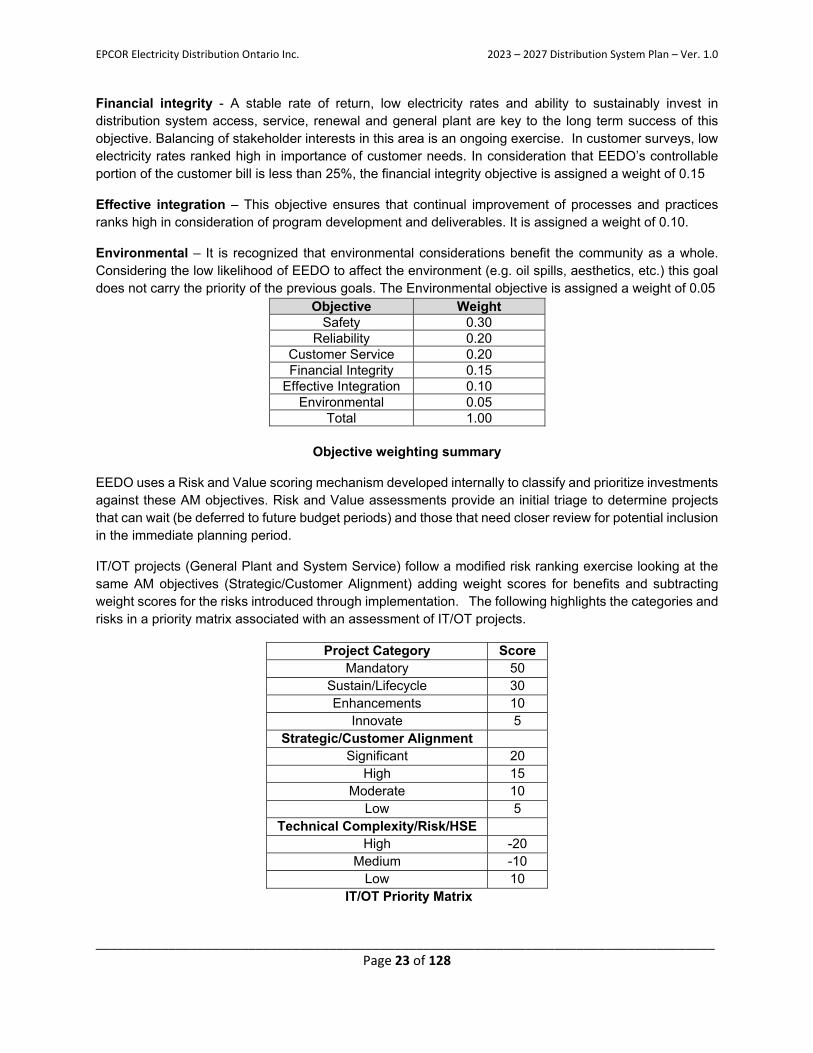
Objective Weight Safety 0.30
Reliability 0.20 Customer Service 0.20 Financial Integrity 0.15
Effective Integration 0.10 Environmental 0.05
Total 1.00
Objective weighting summary
EEDO uses a Risk and Value scoring mechanism developed internally to classify and prioritize investments against these AM objectives. Risk and Value assessments provide an initial triage to determine projects that can wait (be deferred to future budget periods) and those that need closer review for potential inclusion in the immediate planning period.
IT/OT projects (General Plant and System Service) follow a modified risk ranking exercise looking at the same AM objectives (Strategic/Customer Alignment) adding weight scores for benefits and subtracting weight scores for the risks introduced through implementation. The following highlights the categories and risks in a priority matrix associated with an assessment of IT/OT projects.
Project Category Score Mandatory 50
Sustain/Lifecycle 30 Enhancements 10
Innovate 5 Strategic/Customer Alignment
Significant 20 High 15
Moderate 10 Low 5
Technical Complexity/Risk/HSE
High -20 Medium -10
Low 10 IT/OT Priority Matrix
EPCOR Electricity Distribution Ontario Inc. 2023 – 2027 Distribution System Plan – Ver. 1.0
_____________________________________________________________________________________ Page 24 of 128
Project Selection and Estimating During these steps, the ranking of projects aids in the selection of projects that should move to the next phase project estimating. This becomes an above the line, below the line iterative exercise with the risk assessment step given shifting business priorities, customer feedback, and policy direction. Preliminary Project estimates are built based on historical spend and vendor quotes.
The step also includes the inclusion and impact of the mandatory projects. Mandatory capital projects are automatically included as per scheduled need. In general, mandatory projects are defined as:
• New/modified customer service connections (System Access)
• Road authority required plant relocation projects (System Access)
• Mandated service obligations (System Access)
• Renewable energy projects (System Access)
• Emergency plant replacement (System Renewal - reactive)
• Safety related projects (System Service)
DSP and Annual Budget Planning The outcome of the Capital Program Planning element is the five year capital program or Distribution System Plan and the annual capital budget. Capital Investments in a capital program are placed in one of the four investment categories: System Access, System Renewal, System Service or General Plant. This outcome is a result from the iterative steps of project risk assessment, selection and estimating. Mandatory investments are allocated budget envelope funds first. Remaining budget envelope funds are allocated to non-mandatory investments in the System Renewal, System Service and General Plant categories.
The intent is for the annual budget to reflect the DSP as closely as possible, however, there is opportunity for projects to move around or new projects to be introduced due to changing conditions. This is done staying within the DSP capital spend profile for the categories of system renewal, system access, system service and general plant. If there are material changes, this would results in an incremental capital model submission to the OEB.
5.3.1e CapitalProjectDeliveryEEDO follows EPCOR’s organization project management process to deliver capital projects. Prior to finalizing the annual budget or approving any spend, a project justification is completed. This is a more focused review of the risk assessment and cost benefit analysis of the project. This requires Senior Vice President Approval. Project Design follows where a more detailed estimate, technical design and schedule are developed. Project execution is tracked against the budget and schedule. Finally, the project is financially closed out following required accounting principles.
EPCOR Electricity Distribution Ontario Inc. 2023 – 2027 Distribution System Plan – Ver. 1.0
_____________________________________________________________________________________ Page 25 of 128
5.3.2OverviewofAssetsManaged
5.3.2a Descriptionofthedistributionservicearea General Locations EEDO is located on the shores of Georgian Bay in West Simcoe County. EEDO’s distribution service territory consists of four distinct geographically separated urban areas which includes the Towns of Collingwood, Stayner and Thornbury and the Village of Creemore. The service area is not contiguous with Thornbury, Stayner and Creemore being geographically separate from the Town of Collingwood. The service areas of EEDO are all within a short drive from each other.
Temperature and Weather
The EEDO service area has warm and sometimes hot summers with cold, longer winters (Köppen climate
classification Dfb). Along the shores of Georgian Bay, frequent heavy lake-effect snow squalls increase seasonal snowfall totals upwards of 3 m (120 in).
Severe weather in the summer manifests itself mostly in the form of thunderstorms and wind storms that can damage overhead distribution plant. In the winter, severe weather may consist of snow squalls, high winds and the occasional episode of freezing rain.
Service Area Density
The EEDO service area contains mostly urban customers with a diverse local industrial sector. Key industrial sectors include:
Retail Trade Accommodation and food services Health Care and Social Assistance Construction Manufacturing Arts, entertainment and recreation
Tourism is a key industry in EEDO that offers four-season recreation and leisure pursuits for both residents
and visitors alike.
Underground and Overhead Assets
EEDO is responsible for maintaining distribution and infrastructure assets deployed, including 210 kilometers of overhead lines and 167 kilometers of underground lines.
Customer and Economic Growth
From 2017 to 2021 the average annual customer growth rate was 1.4% for EEDO. The residential sector was the primary driver for customer growth.
EPCOR Electricity Distribution Ontario Inc. 2023 – 2027 Distribution System Plan – Ver. 1.0
_____________________________________________________________________________________ Page 26 of 128
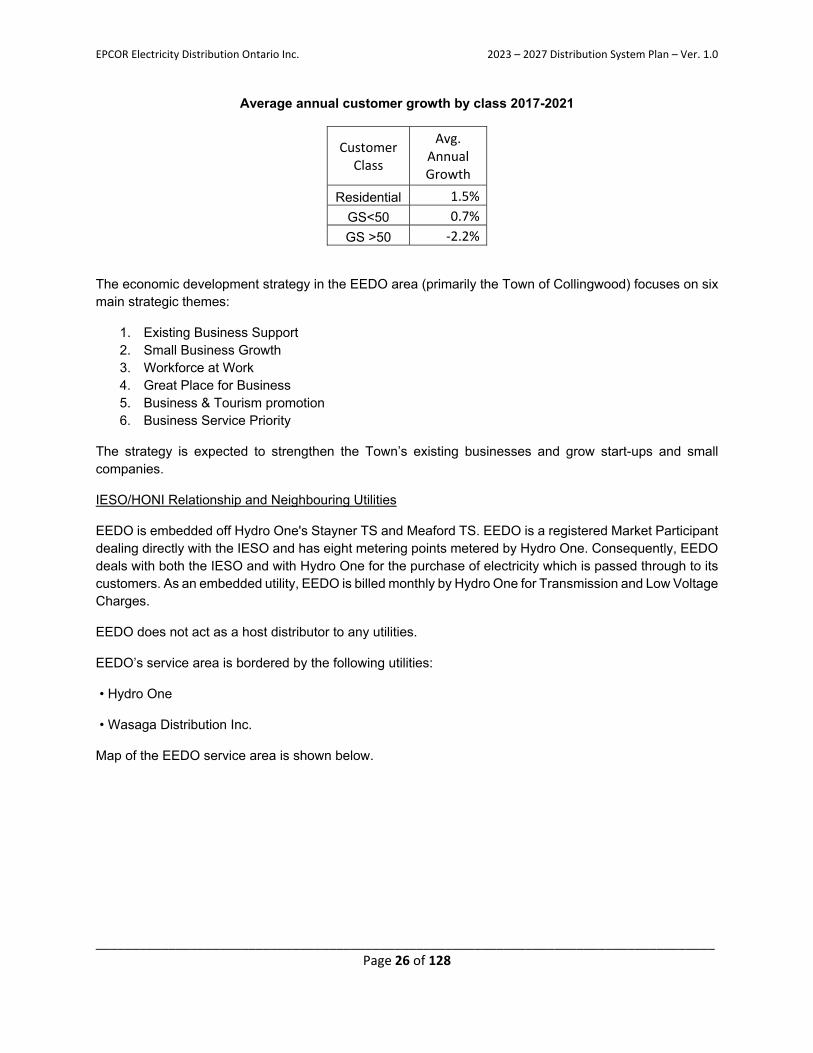
Average annual customer growth by class 2017-2021
Customer Class
Avg. Annual Growth
Residential 1.5%
GS<50 0.7%
GS >50 ‐2.2%
The economic development strategy in the EEDO area (primarily the Town of Collingwood) focuses on six main strategic themes:
1. Existing Business Support 2. Small Business Growth 3. Workforce at Work 4. Great Place for Business 5. Business & Tourism promotion 6. Business Service Priority
The strategy is expected to strengthen the Town’s existing businesses and grow start-ups and small companies.
IESO/HONI Relationship and Neighbouring Utilities
EEDO is embedded off Hydro One's Stayner TS and Meaford TS. EEDO is a registered Market Participant dealing directly with the IESO and has eight metering points metered by Hydro One. Consequently, EEDO deals with both the IESO and with Hydro One for the purchase of electricity which is passed through to its customers. As an embedded utility, EEDO is billed monthly by Hydro One for Transmission and Low Voltage Charges.
EEDO does not act as a host distributor to any utilities.
EEDO’s service area is bordered by the following utilities:
• Hydro One
• Wasaga Distribution Inc.
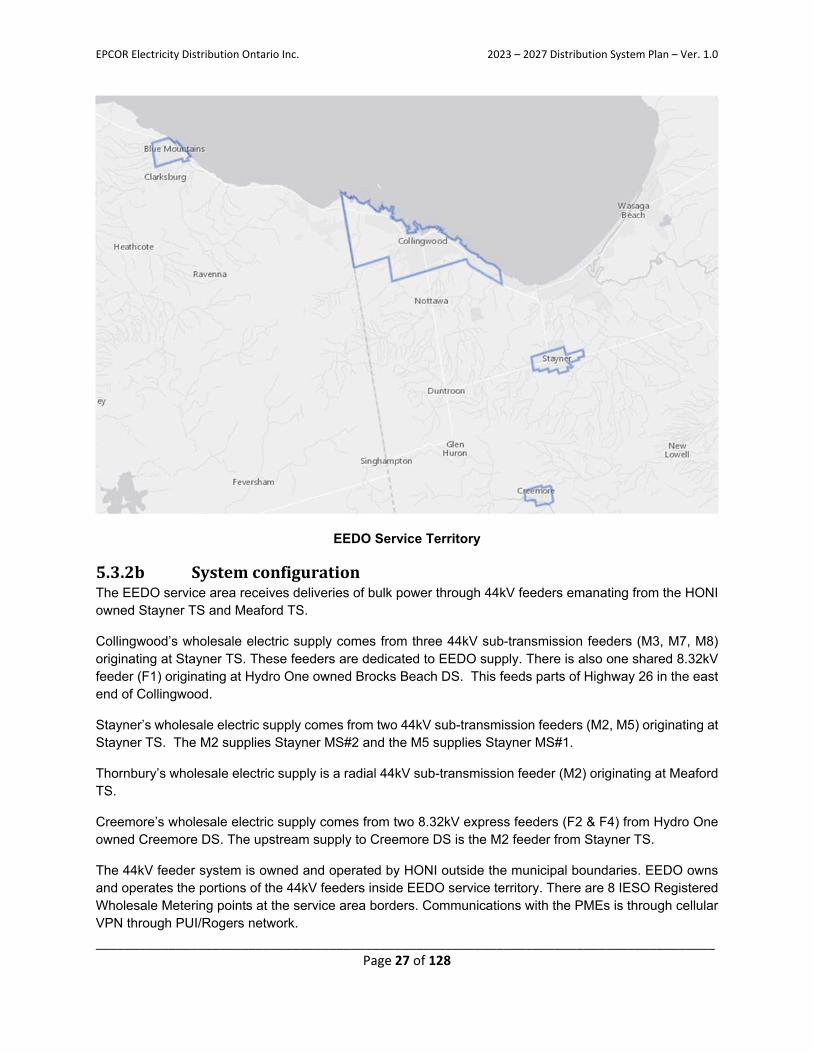
Map of the EEDO service area is shown below.
EPCOR Electricity Distribution Ontario Inc. 2023 – 2027 Distribution System Plan – Ver. 1.0
_____________________________________________________________________________________ Page 27 of 128
EEDO Service Territory
5.3.2b SystemconfigurationThe EEDO service area receives deliveries of bulk power through 44kV feeders emanating from the HONI owned Stayner TS and Meaford TS.
Collingwood’s wholesale electric supply comes from three 44kV sub-transmission feeders (M3, M7, M8) originating at Stayner TS. These feeders are dedicated to EEDO supply. There is also one shared 8.32kV feeder (F1) originating at Hydro One owned Brocks Beach DS. This feeds parts of Highway 26 in the east end of Collingwood.
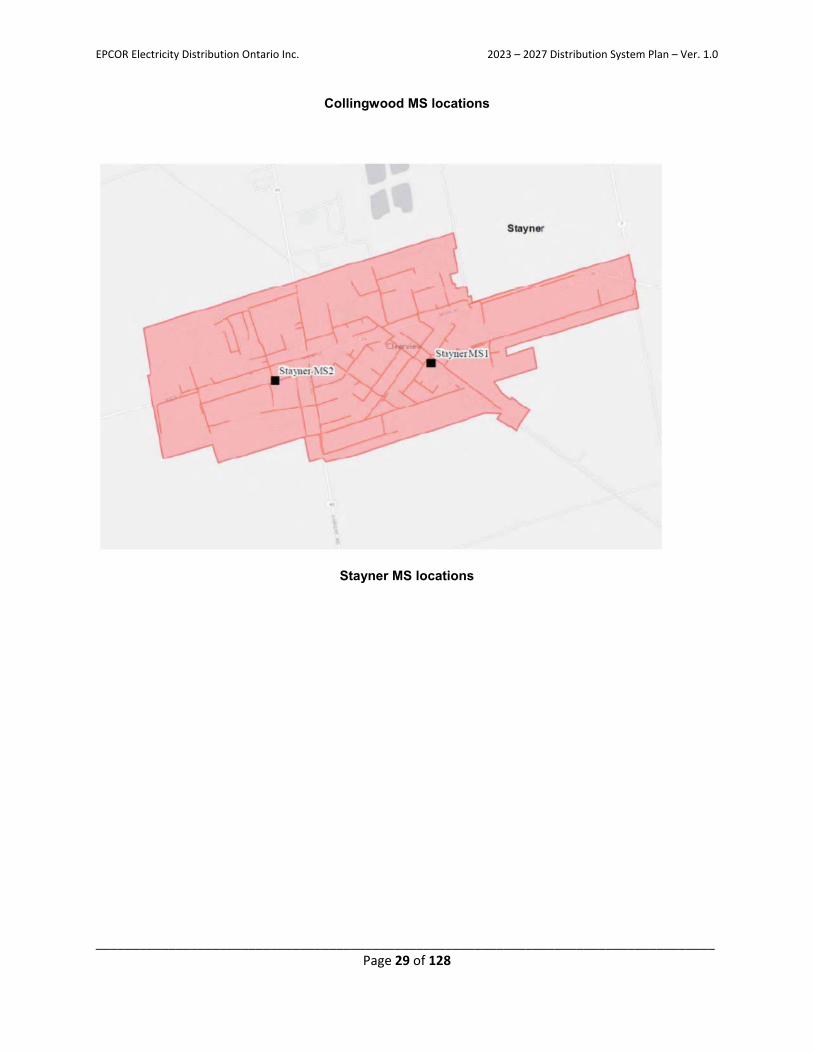
Stayner’s wholesale electric supply comes from two 44kV sub-transmission feeders (M2, M5) originating at Stayner TS. The M2 supplies Stayner MS#2 and the M5 supplies Stayner MS#1.
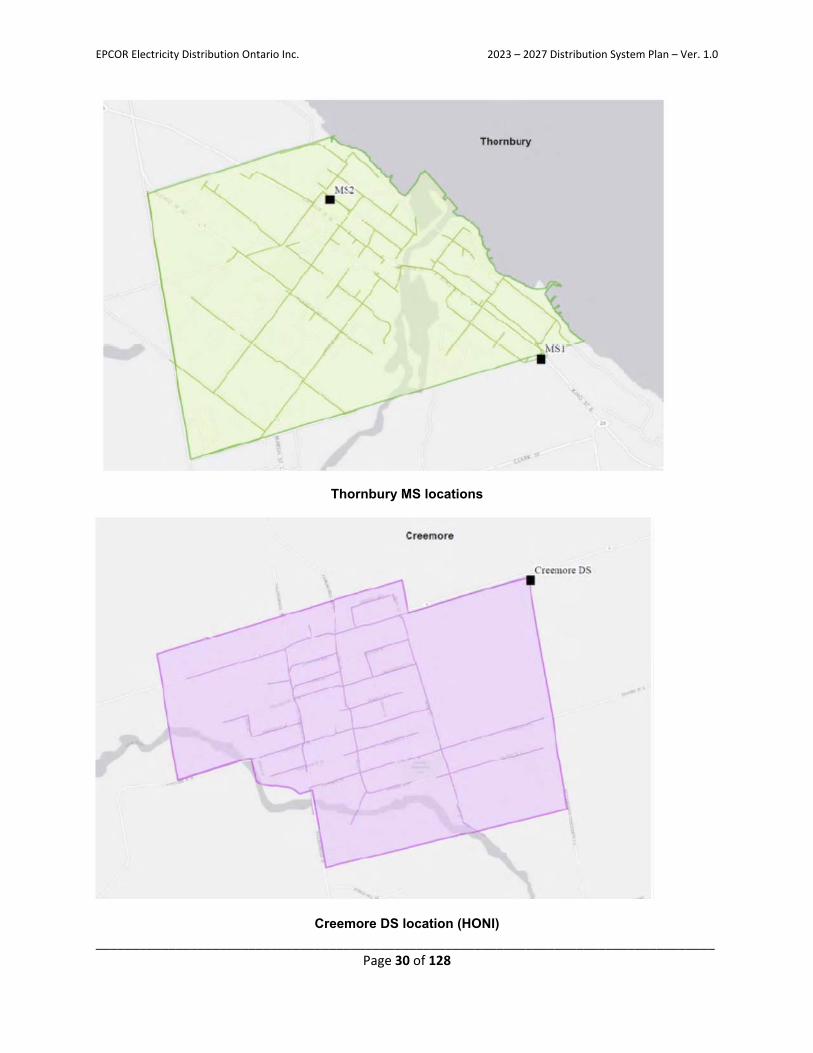
Thornbury’s wholesale electric supply is a radial 44kV sub-transmission feeder (M2) originating at Meaford TS.
Creemore’s wholesale electric supply comes from two 8.32kV express feeders (F2 & F4) from Hydro One owned Creemore DS. The upstream supply to Creemore DS is the M2 feeder from Stayner TS.
The 44kV feeder system is owned and operated by HONI outside the municipal boundaries. EEDO owns and operates the portions of the 44kV feeders inside EEDO service territory. There are 8 IESO Registered Wholesale Metering points at the service area borders. Communications with the PMEs is through cellular VPN through PUI/Rogers network.
EPCOR Electricity Distribution Ontario Inc. 2023 – 2027 Distribution System Plan – Ver. 1.0
_____________________________________________________________________________________ Page 28 of 128
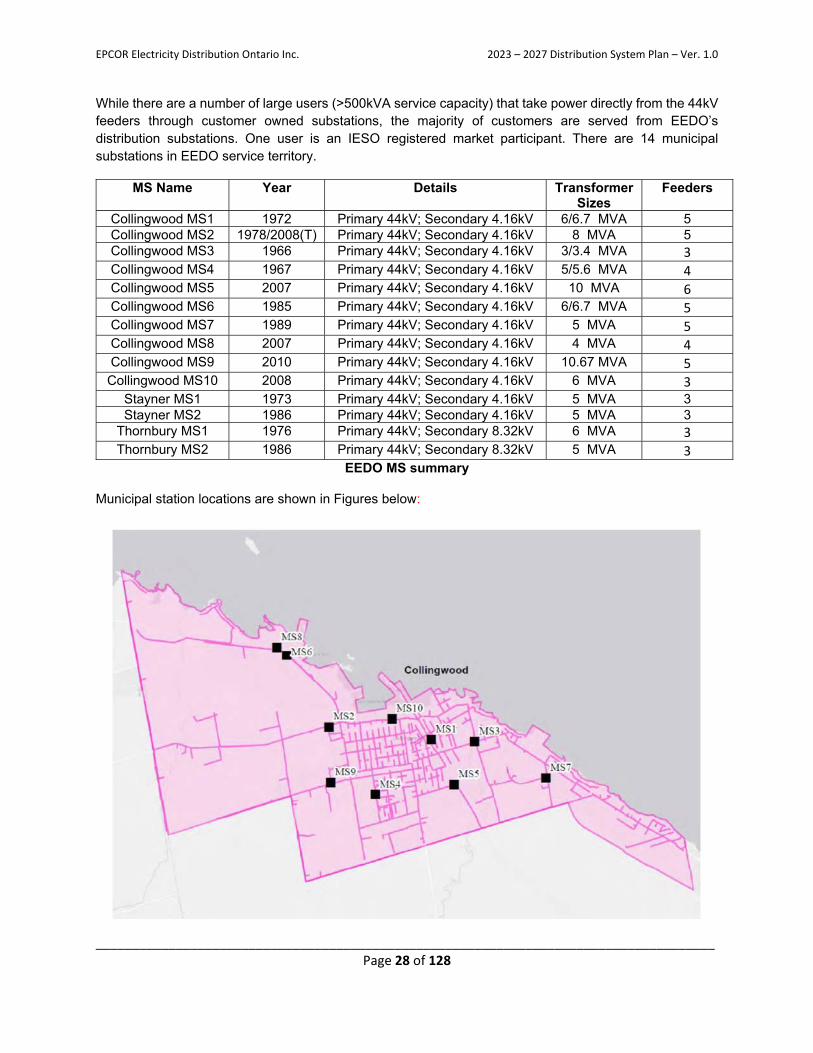
While there are a number of large users (>500kVA service capacity) that take power directly from the 44kV feeders through customer owned substations, the majority of customers are served from EEDO’s distribution substations. One user is an IESO registered market participant. There are 14 municipal substations in EEDO service territory.
MS Name Year Details Transformer Sizes
Feeders
Collingwood MS1 1972 Primary 44kV; Secondary 4.16kV 6/6.7 MVA 5 Collingwood MS2 1978/2008(T) Primary 44kV; Secondary 4.16kV 8 MVA 5 Collingwood MS3 1966 Primary 44kV; Secondary 4.16kV 3/3.4 MVA 3 Collingwood MS4 1967 Primary 44kV; Secondary 4.16kV 5/5.6 MVA 4 Collingwood MS5 2007 Primary 44kV; Secondary 4.16kV 10 MVA 6 Collingwood MS6 1985 Primary 44kV; Secondary 4.16kV 6/6.7 MVA 5 Collingwood MS7 1989 Primary 44kV; Secondary 4.16kV 5 MVA 5 Collingwood MS8 2007 Primary 44kV; Secondary 4.16kV 4 MVA 4 Collingwood MS9 2010 Primary 44kV; Secondary 4.16kV 10.67 MVA 5 Collingwood MS10 2008 Primary 44kV; Secondary 4.16kV 6 MVA 3
Stayner MS1 1973 Primary 44kV; Secondary 4.16kV 5 MVA 3 Stayner MS2 1986 Primary 44kV; Secondary 4.16kV 5 MVA 3
Thornbury MS1 1976 Primary 44kV; Secondary 8.32kV 6 MVA 3 Thornbury MS2 1986 Primary 44kV; Secondary 8.32kV 5 MVA 3
EEDO MS summary
Municipal station locations are shown in Figures below:
EPCOR Electricity Distribution Ontario Inc. 2023 – 2027 Distribution System Plan – Ver. 1.0
_____________________________________________________________________________________ Page 29 of 128
Collingwood MS locations
Stayner MS locations
EPCOR Electricity Distribution Ontario Inc. 2023 – 2027 Distribution System Plan – Ver. 1.0
_____________________________________________________________________________________ Page 30 of 128
Thornbury MS locations
Creemore DS location (HONI)
EPCOR Electricity Distribution Ontario Inc. 2023 – 2027 Distribution System Plan – Ver. 1.0
_____________________________________________________________________________________ Page 31 of 128
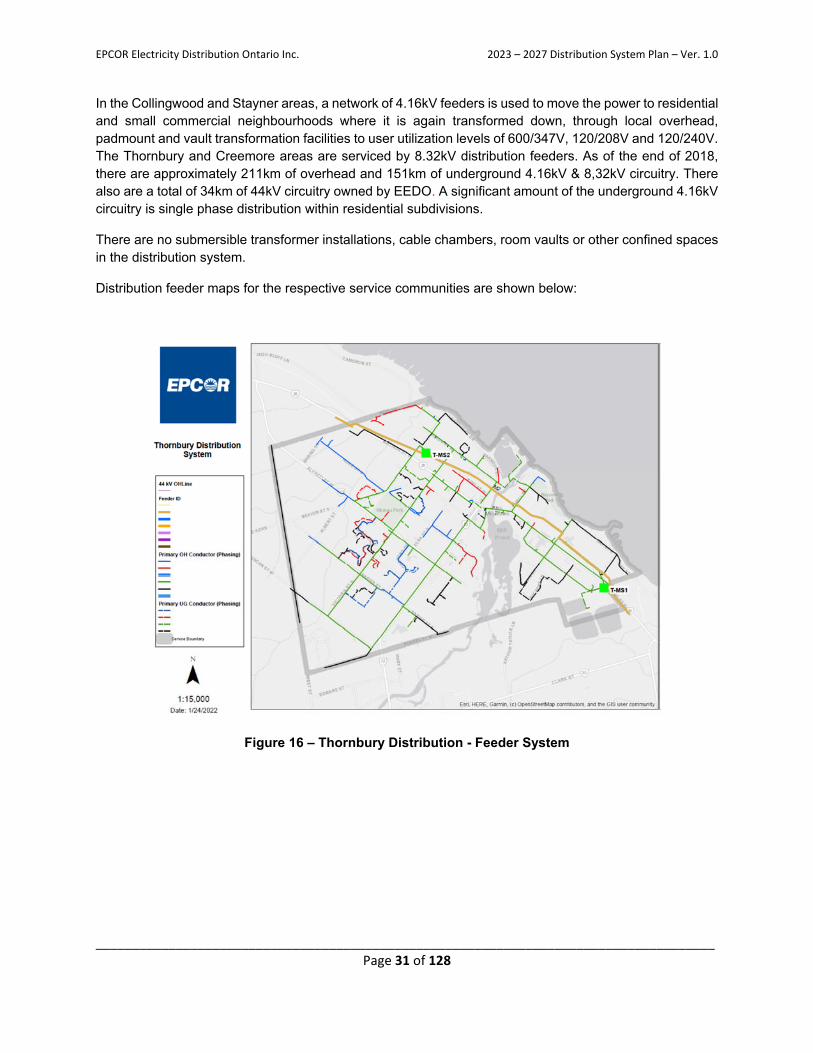
In the Collingwood and Stayner areas, a network of 4.16kV feeders is used to move the power to residential and small commercial neighbourhoods where it is again transformed down, through local overhead, padmount and vault transformation facilities to user utilization levels of 600/347V, 120/208V and 120/240V. The Thornbury and Creemore areas are serviced by 8.32kV distribution feeders. As of the end of 2018, there are approximately 211km of overhead and 151km of underground 4.16kV & 8,32kV circuitry. There also are a total of 34km of 44kV circuitry owned by EEDO. A significant amount of the underground 4.16kV circuitry is single phase distribution within residential subdivisions.
There are no submersible transformer installations, cable chambers, room vaults or other confined spaces in the distribution system.
Distribution feeder maps for the respective service communities are shown below:
Figure 16 – Thornbury Distribution - Feeder System
EPCOR Electricity Distribution Ontario Inc. 2023 – 2027 Distribution System Plan – Ver. 1.0
_____________________________________________________________________________________ Page 32 of 128
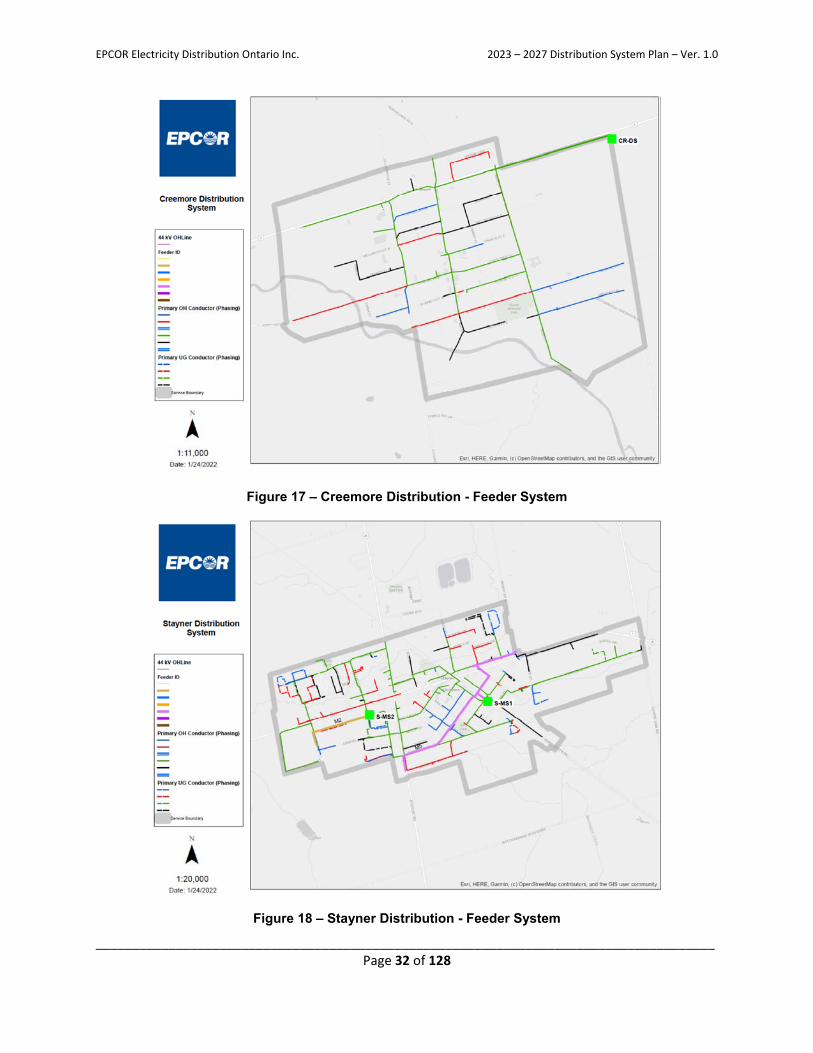
Figure 17 – Creemore Distribution - Feeder System
Figure 18 – Stayner Distribution - Feeder System
EPCOR Electricity Distribution Ontario Inc. 2023 – 2027 Distribution System Plan – Ver. 1.0
_____________________________________________________________________________________ Page 33 of 128
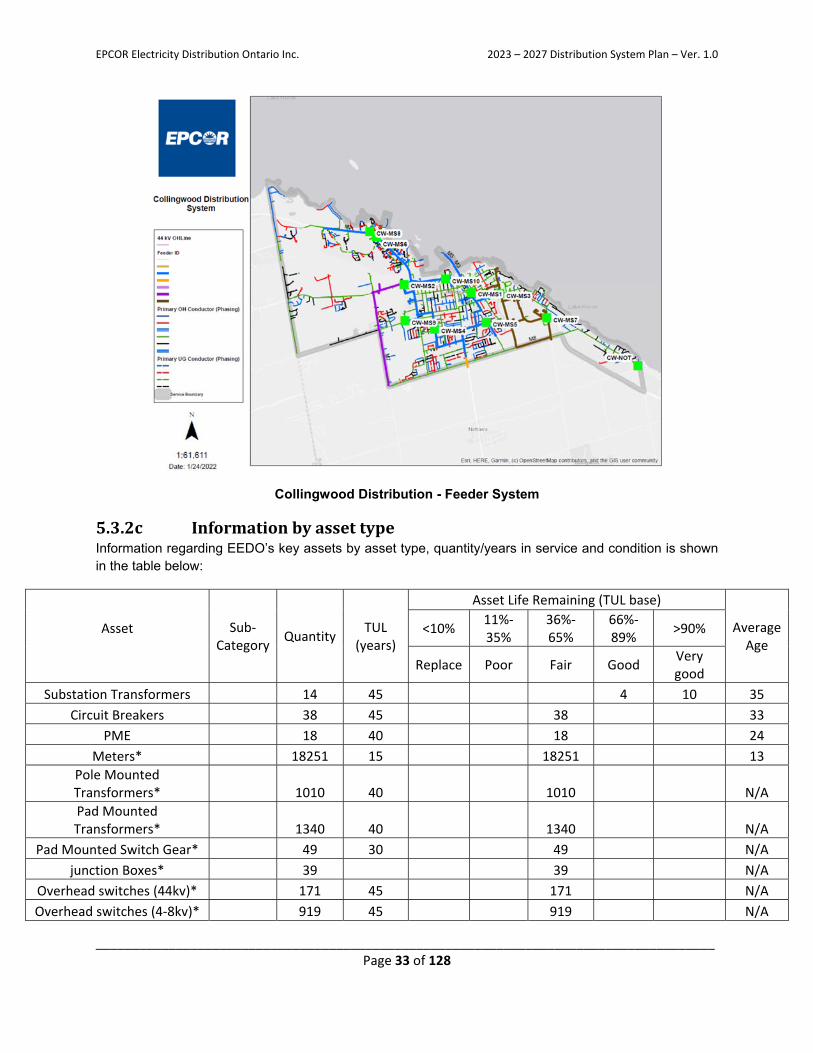
Collingwood Distribution - Feeder System
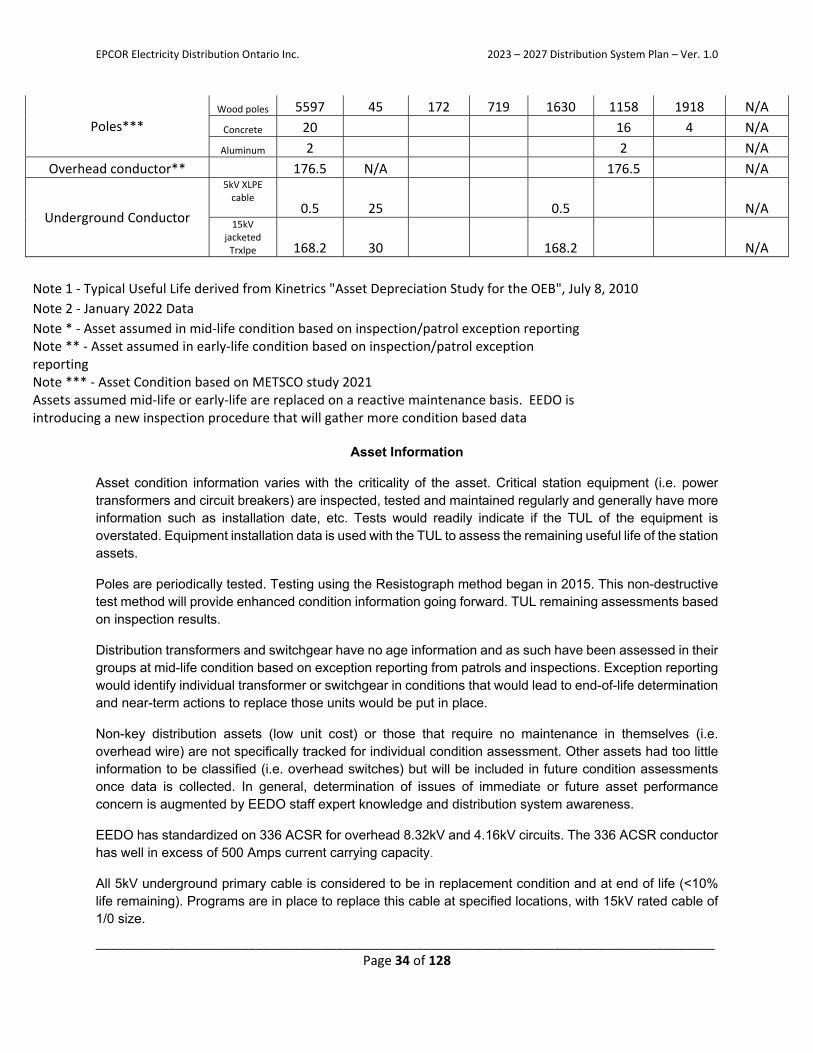
5.3.2c InformationbyassettypeInformation regarding EEDO’s key assets by asset type, quantity/years in service and condition is shown in the table below:
Asset Sub‐Category
Quantity TUL
(years)
Asset Life Remaining (TUL base)
Average Age
<10% 11%‐35%
36%‐65%
66%‐89%
>90%
Replace Poor Fair Good Very good
Substation Transformers 14 45 4 10 35
Circuit Breakers 38 45 38 33
PME 18 40 18 24
Meters* 18251 15 18251 13
Pole Mounted Transformers* 1010 40 1010 N/A
Pad Mounted Transformers* 1340 40 1340 N/A
Pad Mounted Switch Gear* 49 30 49 N/A
junction Boxes* 39 39 N/A
Overhead switches (44kv)* 171 45 171 N/A
Overhead switches (4‐8kv)* 919 45 919 N/A
EPCOR Electricity Distribution Ontario Inc. 2023 – 2027 Distribution System Plan – Ver. 1.0
_____________________________________________________________________________________ Page 34 of 128
Poles***
Wood poles 5597 45 172 719 1630 1158 1918 N/A
Concrete 20 16 4 N/A
Aluminum 2 2 N/A
Overhead conductor** 176.5 N/A 176.5 N/A
Underground Conductor
5kV XLPE cable
0.5 25 0.5 N/A 15kV
jacketed Trxlpe 168.2 30 168.2 N/A
Note 1 ‐ Typical Useful Life derived from Kinetrics "Asset Depreciation Study for the OEB", July 8, 2010 Note 2 ‐ January 2022 Data Note * ‐ Asset assumed in mid‐life condition based on inspection/patrol exception reporting Note ** ‐ Asset assumed in early‐life condition based on inspection/patrol exception reporting Note *** ‐ Asset Condition based on METSCO study 2021 Assets assumed mid‐life or early‐life are replaced on a reactive maintenance basis. EEDO is introducing a new inspection procedure that will gather more condition based data
Asset Information
Asset condition information varies with the criticality of the asset. Critical station equipment (i.e. power transformers and circuit breakers) are inspected, tested and maintained regularly and generally have more information such as installation date, etc. Tests would readily indicate if the TUL of the equipment is overstated. Equipment installation data is used with the TUL to assess the remaining useful life of the station assets.
Poles are periodically tested. Testing using the Resistograph method began in 2015. This non-destructive test method will provide enhanced condition information going forward. TUL remaining assessments based on inspection results.
Distribution transformers and switchgear have no age information and as such have been assessed in their groups at mid-life condition based on exception reporting from patrols and inspections. Exception reporting would identify individual transformer or switchgear in conditions that would lead to end-of-life determination and near-term actions to replace those units would be put in place.
Non-key distribution assets (low unit cost) or those that require no maintenance in themselves (i.e. overhead wire) are not specifically tracked for individual condition assessment. Other assets had too little information to be classified (i.e. overhead switches) but will be included in future condition assessments once data is collected. In general, determination of issues of immediate or future asset performance concern is augmented by EEDO staff expert knowledge and distribution system awareness.
EEDO has standardized on 336 ACSR for overhead 8.32kV and 4.16kV circuits. The 336 ACSR conductor has well in excess of 500 Amps current carrying capacity.
All 5kV underground primary cable is considered to be in replacement condition and at end of life (<10% life remaining). Programs are in place to replace this cable at specified locations, with 15kV rated cable of 1/0 size.
EPCOR Electricity Distribution Ontario Inc. 2023 – 2027 Distribution System Plan – Ver. 1.0
_____________________________________________________________________________________ Page 35 of 128
Over 891 wood poles are considered to be in poor or replace condition.
Proactive replacement strategies have been adopted for these key asset types. Other asset types (i.e. substation transformers) are being closely monitored to determine the specific replacement/refurbishment period. At this time no station replacement/refurbishments are planned during the 2023 – 2027 period. Reactive replacement strategies have been adopted for the remainder.
A multiyear long-term optimized replacement plan (rate and resource mitigation) for the key end of life pole assets has been prepared.
5.3.2d Assessmentofexistingsystemcapacity
EEDO is a summer peaking utility. Winters in EEDO’s service area are year over year consistent and generally cold, which influences the use of electricity for space heating. Summers are generally hot and humid influencing the use of electricity for space cooling. The summers have been getting warmer over the years (resulting in more Cooling Degree Days (CDD)) and the summer demand peak has exceeded the winter demand peak of late.
Station Capacity
Station capacity for planning purposes is based on 75% of the normal rating of the station transformers. Short time fluctuations in demand load would not be expected to exceed the normal rating of the station transformer. When normal loading exceeds 75% of the transformer rating the excess amount would be permanently transferred to another station with capacity or if this is not possible, due to system constraints or other issues, new facilities would be planned to be constructed.
In the Collingwood service area, the 75% loading guide allows MS to back each other up to various degrees to handle short term system disturbances and maintenance needs. Limitations in feeder interconnectivity may result in some loading over transformer normal rating for short periods of time.
In the Stayner and Thornbury service areas there are two stations in each which allows for switching between stations/feeders for operational and maintenance. Load growth in Stayner will be met by increasing the size of the station transformers to 5.7 MVA in this DSP period.
EEDO has a spare MS transformer (Primary 44kV; Secondary 4.16kV 3 MVA) that can be used for emergency replacement of any of the EEDO MS transformers that supply the 4.16kV distribution system.
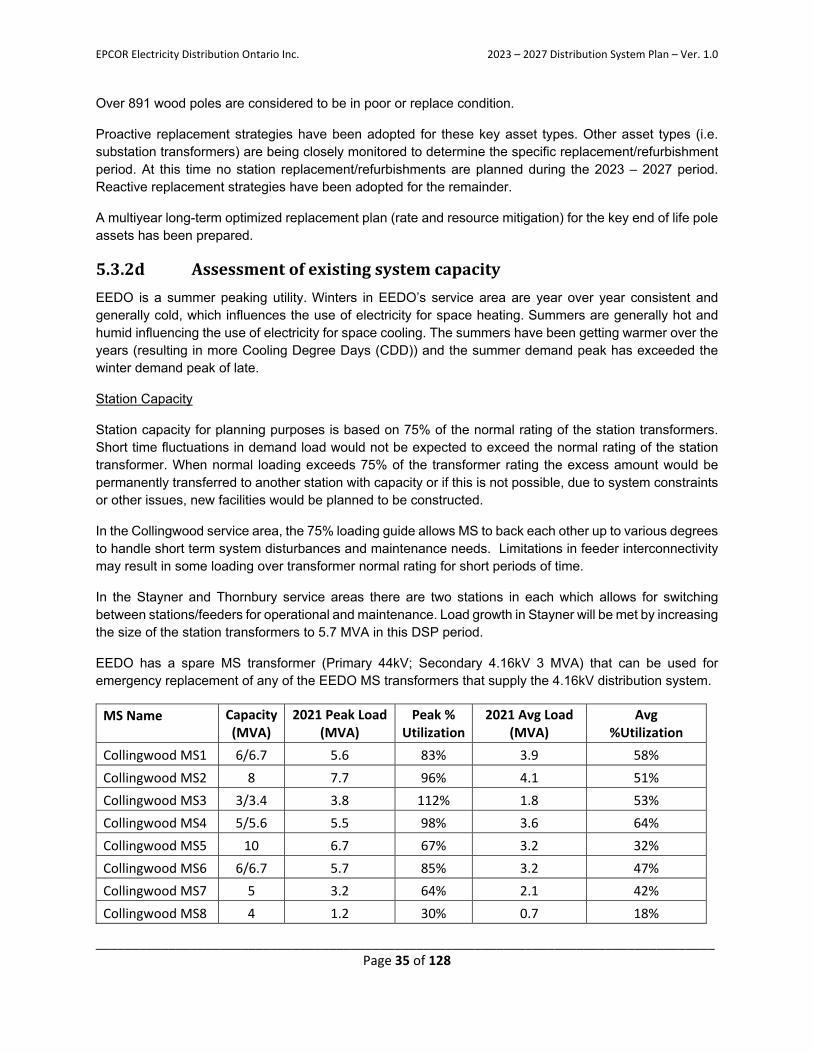
MS Name Capacity (MVA)
2021 Peak Load (MVA)
Peak % Utilization
2021 Avg Load (MVA)
Avg %Utilization
Collingwood MS1 6/6.7 5.6 83% 3.9 58%
Collingwood MS2 8 7.7 96% 4.1 51%
Collingwood MS3 3/3.4 3.8 112% 1.8 53%
Collingwood MS4 5/5.6 5.5 98% 3.6 64%
Collingwood MS5 10 6.7 67% 3.2 32%
Collingwood MS6 6/6.7 5.7 85% 3.2 47%
Collingwood MS7 5 3.2 64% 2.1 42%
Collingwood MS8 4 1.2 30% 0.7 18%
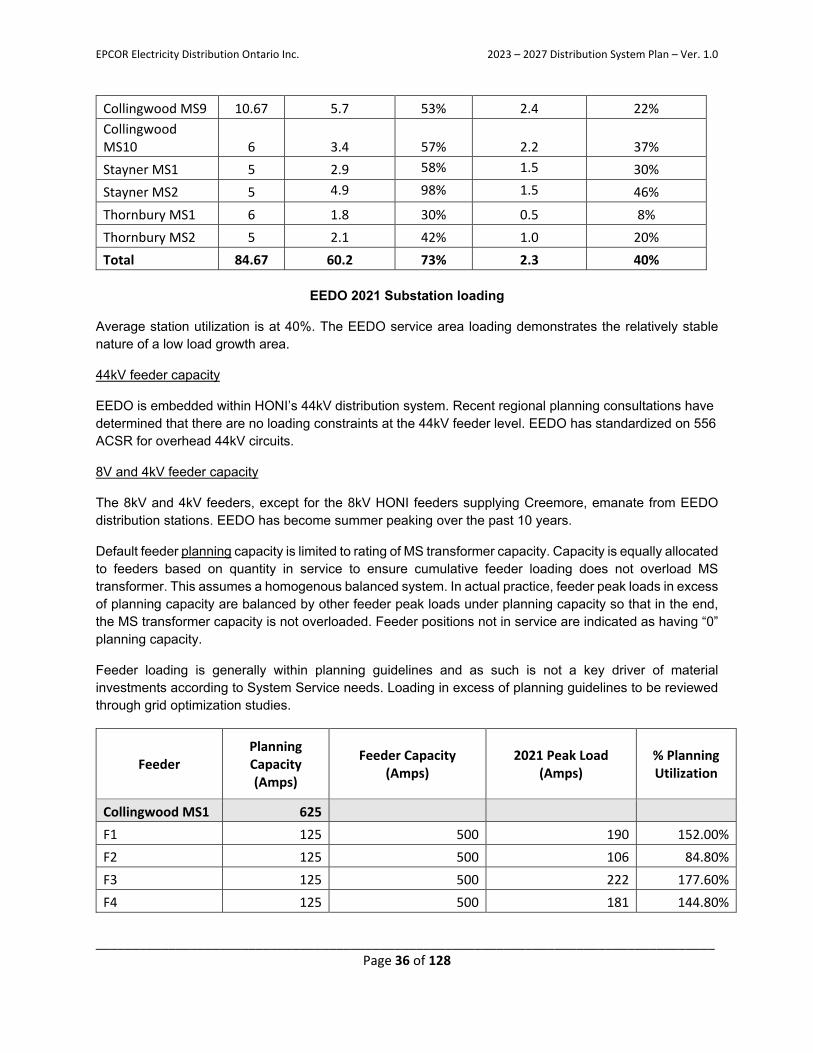
EPCOR Electricity Distribution Ontario Inc. 2023 – 2027 Distribution System Plan – Ver. 1.0
_____________________________________________________________________________________ Page 36 of 128
Collingwood MS9 10.67 5.7 53% 2.4 22%
Collingwood MS10 6 3.4 57% 2.2 37%
Stayner MS1 5 2.9 58% 1.5 30%
Stayner MS2 5 4.9 98% 1.5 46%
Thornbury MS1 6 1.8 30% 0.5 8%
Thornbury MS2 5 2.1 42% 1.0 20%
Total 84.67 60.2 73% 2.3 40%
EEDO 2021 Substation loading
Average station utilization is at 40%. The EEDO service area loading demonstrates the relatively stable nature of a low load growth area.
44kV feeder capacity
EEDO is embedded within HONI’s 44kV distribution system. Recent regional planning consultations have determined that there are no loading constraints at the 44kV feeder level. EEDO has standardized on 556 ACSR for overhead 44kV circuits.
8V and 4kV feeder capacity
The 8kV and 4kV feeders, except for the 8kV HONI feeders supplying Creemore, emanate from EEDO distribution stations. EEDO has become summer peaking over the past 10 years.
Default feeder planning capacity is limited to rating of MS transformer capacity. Capacity is equally allocated to feeders based on quantity in service to ensure cumulative feeder loading does not overload MS transformer. This assumes a homogenous balanced system. In actual practice, feeder peak loads in excess of planning capacity are balanced by other feeder peak loads under planning capacity so that in the end, the MS transformer capacity is not overloaded. Feeder positions not in service are indicated as having “0” planning capacity.
Feeder loading is generally within planning guidelines and as such is not a key driver of material investments according to System Service needs. Loading in excess of planning guidelines to be reviewed through grid optimization studies.
Feeder Planning Capacity (Amps)
Feeder Capacity (Amps)
2021 Peak Load (Amps)
% Planning Utilization
Collingwood MS1 625
F1 125 500 190 152.00%
F2 125 500 106 84.80%
F3 125 500 222 177.60%
F4 125 500 181 144.80%
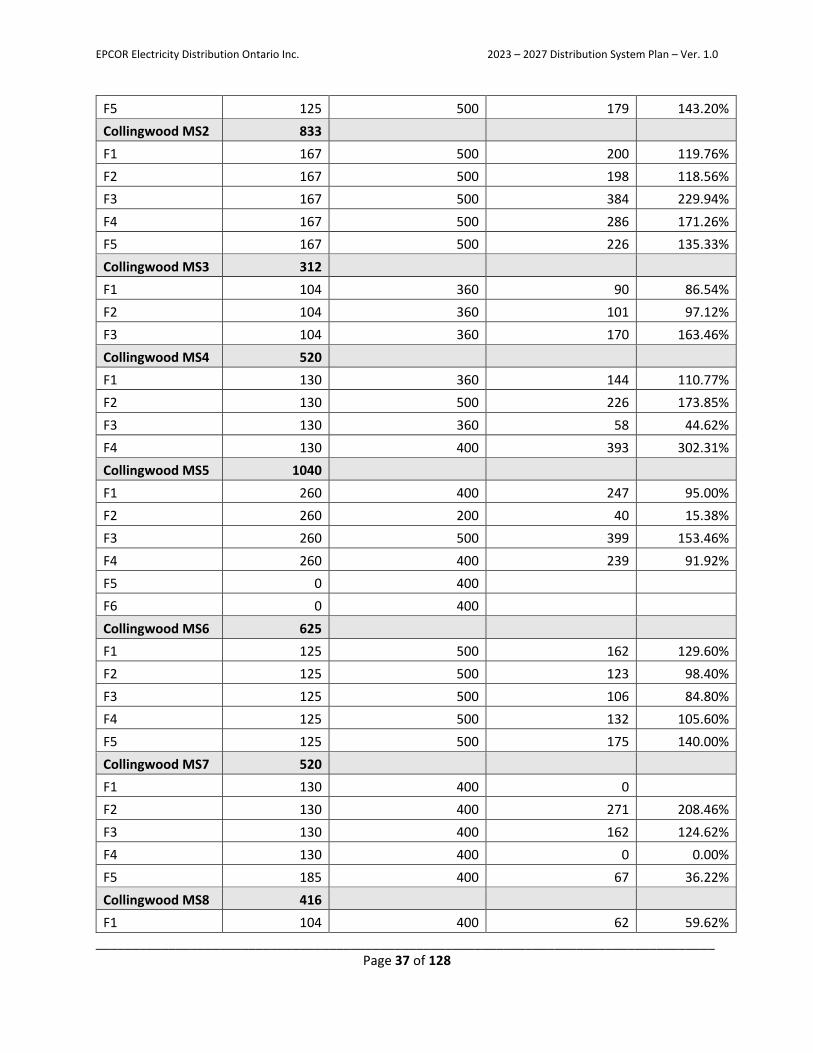
EPCOR Electricity Distribution Ontario Inc. 2023 – 2027 Distribution System Plan – Ver. 1.0
_____________________________________________________________________________________ Page 37 of 128
F5 125 500 179 143.20%
Collingwood MS2 833
F1 167 500 200 119.76%
F2 167 500 198 118.56%
F3 167 500 384 229.94%
F4 167 500 286 171.26%
F5 167 500 226 135.33%
Collingwood MS3 312
F1 104 360 90 86.54%
F2 104 360 101 97.12%
F3 104 360 170 163.46%
Collingwood MS4 520
F1 130 360 144 110.77%
F2 130 500 226 173.85%
F3 130 360 58 44.62%
F4 130 400 393 302.31%
Collingwood MS5 1040
F1 260 400 247 95.00%
F2 260 200 40 15.38%
F3 260 500 399 153.46%
F4 260 400 239 91.92%
F5 0 400
F6 0 400
Collingwood MS6 625
F1 125 500 162 129.60%
F2 125 500 123 98.40%
F3 125 500 106 84.80%
F4 125 500 132 105.60%
F5 125 500 175 140.00%
Collingwood MS7 520
F1 130 400 0
F2 130 400 271 208.46%
F3 130 400 162 124.62%
F4 130 400 0 0.00%
F5 185 400 67 36.22%
Collingwood MS8 416
F1 104 400 62 59.62%
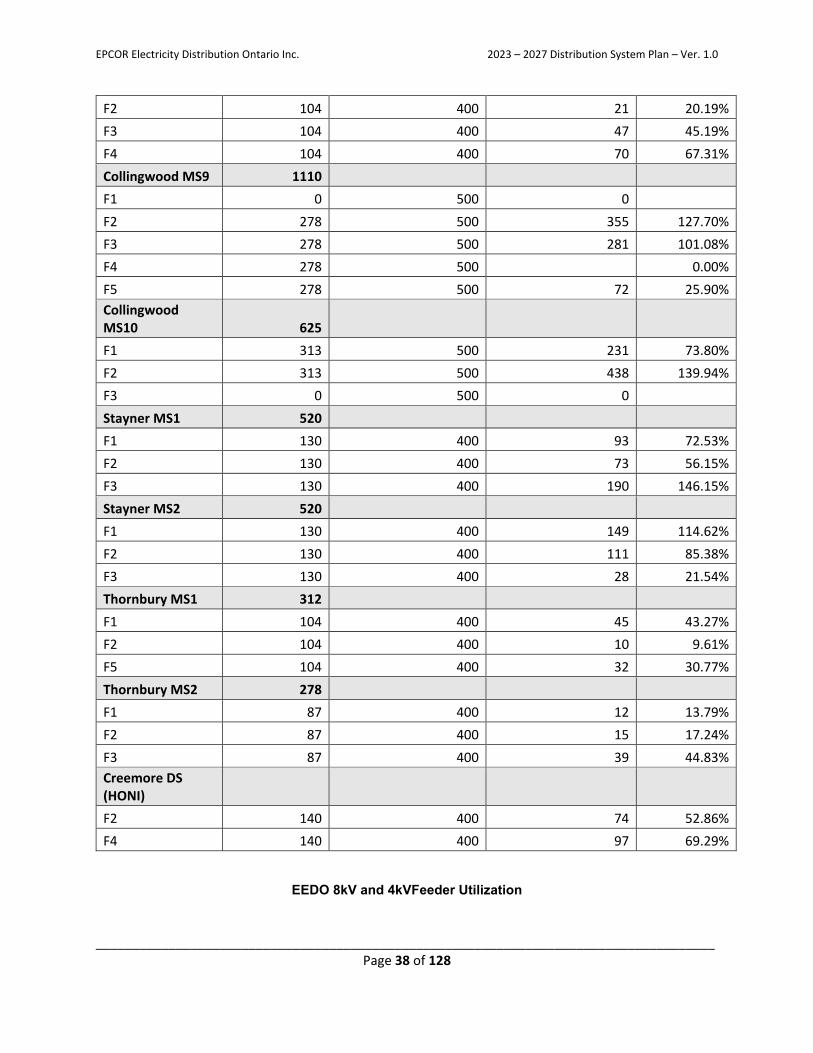
EPCOR Electricity Distribution Ontario Inc. 2023 – 2027 Distribution System Plan – Ver. 1.0
_____________________________________________________________________________________ Page 38 of 128
F2 104 400 21 20.19%
F3 104 400 47 45.19%
F4 104 400 70 67.31%
Collingwood MS9 1110
F1 0 500 0
F2 278 500 355 127.70%
F3 278 500 281 101.08%
F4 278 500 0.00%
F5 278 500 72 25.90%
Collingwood MS10 625
F1 313 500 231 73.80%
F2 313 500 438 139.94%
F3 0 500 0
Stayner MS1 520
F1 130 400 93 72.53%
F2 130 400 73 56.15%
F3 130 400 190 146.15%
Stayner MS2 520
F1 130 400 149 114.62%
F2 130 400 111 85.38%
F3 130 400 28 21.54%
Thornbury MS1 312
F1 104 400 45 43.27%
F2 104 400 10 9.61%
F5 104 400 32 30.77%
Thornbury MS2 278
F1 87 400 12 13.79%
F2 87 400 15 17.24%
F3 87 400 39 44.83%
Creemore DS (HONI)
F2 140 400 74 52.86%
F4 140 400 97 69.29%
EEDO 8kV and 4kVFeeder Utilization
EPCOR Electricity Distribution Ontario Inc. 2023 – 2027 Distribution System Plan – Ver. 1.0
_____________________________________________________________________________________ Page 39 of 128
5.3.3AssetLifecycleOptimizationPoliciesandPracticesThis section of the Distribution System Plan (DSP) provides a high-level overview of EEDO’s asset lifecycle optimization policies and practices.
5.3.3a FormalpoliciesandpracticesEEDO’s policies and practices towards asset lifecycle optimization are derived from EEDO’s Asset Management Policy and Asset Management Objectives. In managing its distribution system assets, EEDO’s main objective can be summarized as to optimize performance of assets at a reasonable cost with due regard for system reliability, public & worker safety and customer service expectations.
Key asset lifecycle practices are:
Asset Register development - EEDO’s GIS is the designated asset register for Field Assets. The asset register is intended to hold/link to asset attribute information as well as linkages to historical financial and non-financial information over each asset’s lifecycle. At the current time the GIS holds locational data, inspections data and maintenance data. It is the intent of EEDO to populate, over time, the GIS with additional attribute data and linkages to non-operational information (i.e. financial, procurement, etc.).
General plant asset information resides with the respective owners of the asset (i.e. fleet assets reside with the Supervisor Hydro Services). The asset register will provide the relevant information for ongoing development and optimization of assets inspection, maintenance, refurbishment and replacement programs, assist with asset planning, assist in meeting regulatory/legislative compliance and IFRS accounting standards. The asset register will aid in cost control through optimization of the asset’s lifecycle.
For example, subdivision cable is generally installed from a common lot of cable and if cable tests and reliability performance indicate end of life for particular cable sections, it is likely that the other cable sections may be in similar condition thereby warranting a full subdivision cable replacement program versus the “whack-a-mole” approach of repairing fault after fault after fault. The asset register (GIS) can identify common asset attributes and historical performance to develop an appropriate scope for the cable replacement program.
Asset Refurbishment /Replacement - EEDO considers a wide range of factors when deciding whether to refurbish or replace a distribution asset, including public and employee safety, service quality, rate impacts, maintenance costs, fault frequency, asset condition, and life expectancy so that investment in replacement plant is a prudent one. Plant is replaced at the end of life when all refurbishment options have been exhausted.
When an asset has reached end of life and the cost of maintenance and/or the frequency of service disruptions have reached an unacceptable or uneconomic level, the asset is identified for refurbishment or replacement. If the malfunction of these identified assets would create a significant safety, reliability or service impact, the assets are replaced within the current year’s budget. Assets that have not reached their end of life are left in service and refurbished as required based on service reliability, condition assessment and regular inspections as required under the Distribution System Code. Fleet and other general plant assets are assessed through in-house developed approaches.
For poles, discretionary replacement priority is based on three primary criteria:
The estimated remaining life of the pole; Customers impacted by pole failure;
EPCOR Electricity Distribution Ontario Inc. 2023 – 2027 Distribution System Plan – Ver. 1.0
_____________________________________________________________________________________ Page 40 of 128
Criticality of pole location
In order to optimize equipment value and minimize replacement costs, EEDO has developed a procedure for re-use of equipment returned from the field. The procedure is in compliance with O. Reg. 22/04, section 6(1) (b) – Approval of Electrical Equipment and ensures that used equipment meet current standards and pose no undue hazard for re-use in new construction. Examples of equipment subject to potential reuse are distribution transformers and line openers. All equipment subject to reuse has to meet certain minimum condition criteria and has to be deemed safe to use by a competent person.
Replacement of end of life plant with new plant will still require the allocation of resources for ongoing O&M purposes. Repair would be the most significant O&M activity impacted by new plant. Certain assets, such as poles, offer few opportunities for repair related activities and generally require replacement when deemed at end of normal life or critically damaged. Other assets such as direct buried cable offer opportunities for repair related activities (e.g. splices) up to a point where further repairs are not warranted due to end of life conditions. In a few areas cable faults will not be repaired due to cable end of life. When faulted, the faulted cable section will be replaced, normally a section between two distribution transformers. For planned cable replacement in a subdivision, new primary cable installed in duct replaces direct buried primary cable and is expected to provide higher reliability and life. This will shift response activity for a cable failure from repair (O&M) to replacement (Capital). If assets approaching end of life are replaced at a rate that maintains equipment class average condition then one would expect little or no change to O&M costs under no growth scenarios but would still see upward O&M cost pressure on positive growth scenarios (more cumulative assets to maintain each year). Replacement rates that improve equipment class average condition could result in lowering certain maintenance activities costs (e.g. pole testing, reactive repairs, etc.). Overall this is expected to put downward pressure on O&M repair related costs.
Asset Inspection and Maintenance – EEDO follows criteria stated in the Distribution System Code, Regulation 22/04 and ESA guidelines in the development and implementation of its asset inspection and maintenance practices that meet its Asset Management Objectives. EEDO maintains the efficiency and reliability of its distribution system through an active inspection, maintenance and asset management program that focuses on customer service, employee safety and cost-effective maintenance, refurbishment and replacement of assets that can no longer meet acceptable utility performance standards. EEDO’s maintenance strategy is, to the extent possible, to minimize reactive and emergency-type work through an effective planned maintenance program, including predictive and preventative actions.
Predictive maintenance activities involve the inspection, testing and servicing of elements of the distribution system. These activities include infrared thermography testing, transformer oil analysis, planned visual inspections, pole testing, cable testing, overhead and pad-mounted switch maintenance. Also included are regular inspection and repair of substation components and ancillary equipment.
Emergency maintenance includes unexpected system repairs to the electrical system that must be addressed immediately. This includes equipment failure repair, storm damage repair, emergency tree trimming and other unplanned repair activities. Some emergency maintenance can be considered reactive maintenance for low cost non-critical assets, not under predictive or preventative maintenance, that when they break down, they can be replaced readily (spares available) and pose no safety Risk.
Predictive and preventative maintenance activities are identified through various methods and sources, primarily through feedback from distribution system operations, manufacturer’s maintenance recommendations, and annual asset Inspections. Predictive and preventative maintenance is performed to ensure equipment continues to provide its essential functionality in a safe manner over its lifecycle. Some
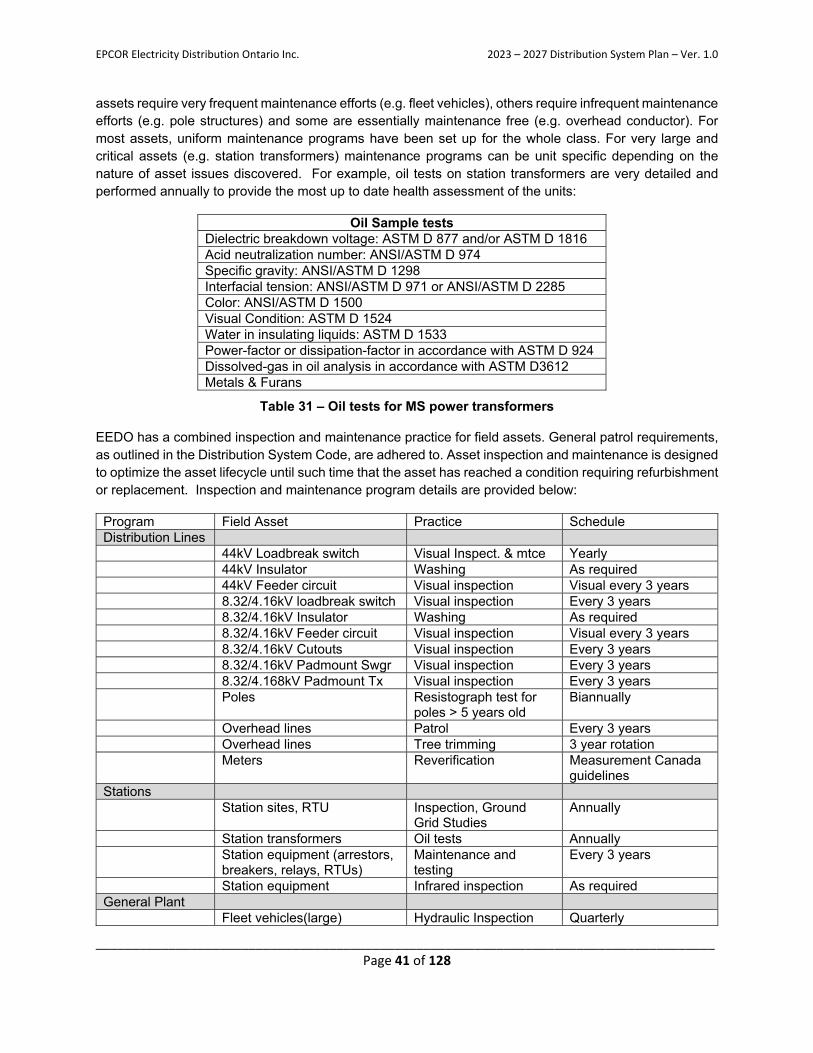
EPCOR Electricity Distribution Ontario Inc. 2023 – 2027 Distribution System Plan – Ver. 1.0
_____________________________________________________________________________________ Page 41 of 128
assets require very frequent maintenance efforts (e.g. fleet vehicles), others require infrequent maintenance efforts (e.g. pole structures) and some are essentially maintenance free (e.g. overhead conductor). For most assets, uniform maintenance programs have been set up for the whole class. For very large and critical assets (e.g. station transformers) maintenance programs can be unit specific depending on the nature of asset issues discovered. For example, oil tests on station transformers are very detailed and performed annually to provide the most up to date health assessment of the units:
Oil Sample tests Dielectric breakdown voltage: ASTM D 877 and/or ASTM D 1816 Acid neutralization number: ANSI/ASTM D 974 Specific gravity: ANSI/ASTM D 1298 Interfacial tension: ANSI/ASTM D 971 or ANSI/ASTM D 2285 Color: ANSI/ASTM D 1500 Visual Condition: ASTM D 1524 Water in insulating liquids: ASTM D 1533 Power-factor or dissipation-factor in accordance with ASTM D 924 Dissolved-gas in oil analysis in accordance with ASTM D3612 Metals & Furans
Table 31 – Oil tests for MS power transformers
EEDO has a combined inspection and maintenance practice for field assets. General patrol requirements, as outlined in the Distribution System Code, are adhered to. Asset inspection and maintenance is designed to optimize the asset lifecycle until such time that the asset has reached a condition requiring refurbishment or replacement. Inspection and maintenance program details are provided below:
Program Field Asset Practice Schedule Distribution Lines 44kV Loadbreak switch Visual Inspect. & mtce Yearly 44kV Insulator Washing As required 44kV Feeder circuit Visual inspection Visual every 3 years 8.32/4.16kV loadbreak switch Visual inspection Every 3 years 8.32/4.16kV Insulator Washing As required 8.32/4.16kV Feeder circuit Visual inspection Visual every 3 years 8.32/4.16kV Cutouts Visual inspection Every 3 years 8.32/4.16kV Padmount Swgr Visual inspection Every 3 years 8.32/4.168kV Padmount Tx Visual inspection Every 3 years Poles Resistograph test for
poles > 5 years old Biannually
Overhead lines Patrol Every 3 years Overhead lines Tree trimming 3 year rotation Meters Reverification Measurement Canada
guidelines Stations Station sites, RTU Inspection, Ground
Grid Studies Annually
Station transformers Oil tests Annually Station equipment (arrestors,
breakers, relays, RTUs) Maintenance and testing
Every 3 years
Station equipment Infrared inspection As required General Plant Fleet vehicles(large) Hydraulic Inspection Quarterly
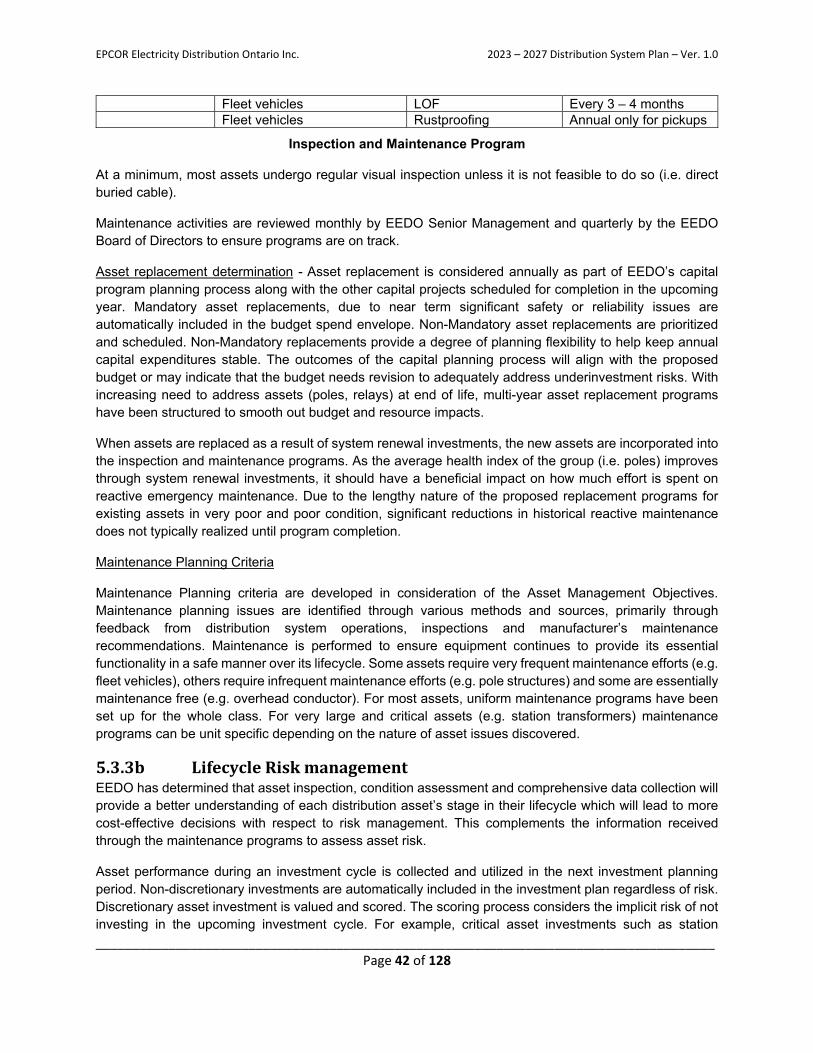
EPCOR Electricity Distribution Ontario Inc. 2023 – 2027 Distribution System Plan – Ver. 1.0
_____________________________________________________________________________________ Page 42 of 128
Fleet vehicles LOF Every 3 – 4 months Fleet vehicles Rustproofing Annual only for pickups
Inspection and Maintenance Program
At a minimum, most assets undergo regular visual inspection unless it is not feasible to do so (i.e. direct buried cable).
Maintenance activities are reviewed monthly by EEDO Senior Management and quarterly by the EEDO Board of Directors to ensure programs are on track.
Asset replacement determination - Asset replacement is considered annually as part of EEDO’s capital program planning process along with the other capital projects scheduled for completion in the upcoming year. Mandatory asset replacements, due to near term significant safety or reliability issues are automatically included in the budget spend envelope. Non-Mandatory asset replacements are prioritized and scheduled. Non-Mandatory replacements provide a degree of planning flexibility to help keep annual capital expenditures stable. The outcomes of the capital planning process will align with the proposed budget or may indicate that the budget needs revision to adequately address underinvestment risks. With increasing need to address assets (poles, relays) at end of life, multi-year asset replacement programs have been structured to smooth out budget and resource impacts.
When assets are replaced as a result of system renewal investments, the new assets are incorporated into the inspection and maintenance programs. As the average health index of the group (i.e. poles) improves through system renewal investments, it should have a beneficial impact on how much effort is spent on reactive emergency maintenance. Due to the lengthy nature of the proposed replacement programs for existing assets in very poor and poor condition, significant reductions in historical reactive maintenance does not typically realized until program completion.
Maintenance Planning Criteria
Maintenance Planning criteria are developed in consideration of the Asset Management Objectives. Maintenance planning issues are identified through various methods and sources, primarily through feedback from distribution system operations, inspections and manufacturer’s maintenance recommendations. Maintenance is performed to ensure equipment continues to provide its essential functionality in a safe manner over its lifecycle. Some assets require very frequent maintenance efforts (e.g. fleet vehicles), others require infrequent maintenance efforts (e.g. pole structures) and some are essentially maintenance free (e.g. overhead conductor). For most assets, uniform maintenance programs have been set up for the whole class. For very large and critical assets (e.g. station transformers) maintenance programs can be unit specific depending on the nature of asset issues discovered.
5.3.3b LifecycleRiskmanagementEEDO has determined that asset inspection, condition assessment and comprehensive data collection will provide a better understanding of each distribution asset’s stage in their lifecycle which will lead to more cost-effective decisions with respect to risk management. This complements the information received through the maintenance programs to assess asset risk.
Asset performance during an investment cycle is collected and utilized in the next investment planning period. Non-discretionary investments are automatically included in the investment plan regardless of risk. Discretionary asset investment is valued and scored. The scoring process considers the implicit risk of not investing in the upcoming investment cycle. For example, critical asset investments such as station

EPCOR Electricity Distribution Ontario Inc. 2023 – 2027 Distribution System Plan – Ver. 1.0
_____________________________________________________________________________________ Page 43 of 128
transformers and 44kV plant will score relatively high on benefit compared to distribution transformer investment due to the higher widespread impact that a failure of a critical asset has. This has also led to the development of proactive replacement strategies for higher risk high cost critical assets (i.e. poles and underground cable) and reactive replacement strategies for lower risk low cost assets (i.e. distribution transformers).
It is evident that in discretionary distribution asset replacement investments, there is a need for a long term smoothed proactive investment program for pole and underground cable. The programs are structured to remain within OEB rate mitigation guidelines and will result in an increasing amount of risk for those assets nearing end of life that await replacement towards the later years of the replacement program. In this sense risk is balanced against the reality of unsustainable rate increases that would be needed to eliminate all asset risk in a short period of time. Assets with the lowest life remaining index in a particular category (i.e. poles, UG cable) are addressed first. Other assets with higher remaining life are deferred to future periods. Individual asset priority position in the program will be managed as more asset information is obtained through ongoing annual inspection and testing so as to optimize replacement risk decisions.
In consideration of EEDO’s Asset Management Objectives and the other drivers of capital planning, it has been determined that multi-year renewal programs for poles with “very poor” and “poor” condition will best balance risk, value and rate impact. Other assets in similar condition will be dealt with on a reactive basis.
Asset Quantity Program length Program Cost Poles 860+ 5+ years $10 M+
Key Renewal Program
The pole replacement program together with the line overhead line replacement projects are expected to replace over 850 of the 1000 poles+ currently in poor or very poor condition during the 2023 – 2027 DSP period. Long term replacement for material fleet and general plant assets will be accompanied by specific business cases as required.
Other assets in “very poor” and “poor” condition will be dealt with on a reactive basis. Long term replacement plans have also been prepared for fleet and other general plant assets.
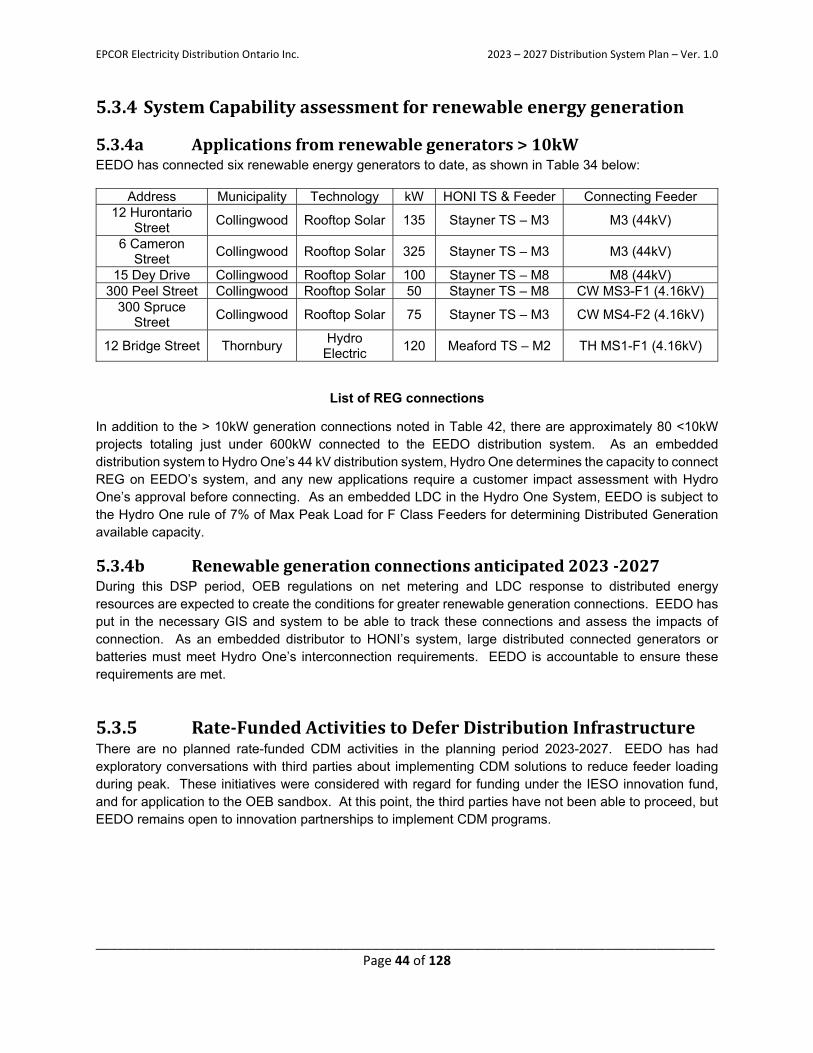
EPCOR Electricity Distribution Ontario Inc. 2023 – 2027 Distribution System Plan – Ver. 1.0
_____________________________________________________________________________________ Page 44 of 128
5.3.4SystemCapabilityassessmentforrenewableenergygeneration
5.3.4a Applicationsfromrenewablegenerators>10kWEEDO has connected six renewable energy generators to date, as shown in Table 34 below:
Address Municipality Technology kW HONI TS & Feeder Connecting Feeder 12 Hurontario
Street Collingwood Rooftop Solar 135 Stayner TS – M3 M3 (44kV)
6 Cameron Street
Collingwood Rooftop Solar 325 Stayner TS – M3 M3 (44kV)
15 Dey Drive Collingwood Rooftop Solar 100 Stayner TS – M8 M8 (44kV) 300 Peel Street Collingwood Rooftop Solar 50 Stayner TS – M8 CW MS3-F1 (4.16kV)
300 Spruce Street
Collingwood Rooftop Solar 75 Stayner TS – M3 CW MS4-F2 (4.16kV)
12 Bridge Street Thornbury Hydro
Electric 120 Meaford TS – M2 TH MS1-F1 (4.16kV)
List of REG connections
In addition to the > 10kW generation connections noted in Table 42, there are approximately 80 <10kW projects totaling just under 600kW connected to the EEDO distribution system. As an embedded distribution system to Hydro One’s 44 kV distribution system, Hydro One determines the capacity to connect REG on EEDO’s system, and any new applications require a customer impact assessment with Hydro One’s approval before connecting. As an embedded LDC in the Hydro One System, EEDO is subject to the Hydro One rule of 7% of Max Peak Load for F Class Feeders for determining Distributed Generation available capacity.
5.3.4b Renewablegenerationconnectionsanticipated2023‐2027During this DSP period, OEB regulations on net metering and LDC response to distributed energy resources are expected to create the conditions for greater renewable generation connections. EEDO has put in the necessary GIS and system to be able to track these connections and assess the impacts of connection. As an embedded distributor to HONI’s system, large distributed connected generators or batteries must meet Hydro One’s interconnection requirements. EEDO is accountable to ensure these requirements are met.
5.3.5 Rate‐FundedActivitiestoDeferDistributionInfrastructureThere are no planned rate-funded CDM activities in the planning period 2023-2027. EEDO has had exploratory conversations with third parties about implementing CDM solutions to reduce feeder loading during peak. These initiatives were considered with regard for funding under the IESO innovation fund, and for application to the OEB sandbox. At this point, the third parties have not been able to proceed, but EEDO remains open to innovation partnerships to implement CDM programs.
EPCOR Electricity Distribution Ontario Inc. 2023 – 2027 Distribution System Plan – Ver. 1.0
_____________________________________________________________________________________ Page 45 of 128
5.4 CapitalExpenditurePlan
EEDO’s Distribution System Plan details the program of system investment decisions developed on the basis of information derived from EEDO’s asset management and capital expenditure planning process. Investments, whether identified by category or by specific project, are justified in whole or in part by reference to specific aspects of EEDO’s asset management and capital expenditure planning process.
EEDO’s Distribution System Plan includes information on prospective investments over a five year forward looking period (2023 – 2027) as well as planned and actual information on investments over the historical five year period (2018 – 2022).
EEDO expects moderate load and customer growth in line with development plans that directly impact EEDO’s service territory. System Access investments will provide for new customer connections over the period of the DSP. This will be accommodated through existing infrastructure.
System Renewal investments (condition based replacement) will ensure that customer service levels with respect to reliability are maintained. Inspection and performance analytics help direct preventive maintenance to specific at-Risk equipment and extend further the safe reliable useful life of all equipment. Major focus will be on pole replacement due to end of life status. Over 860 poles have been determined to be in poor or very poor condition. These poles will be addressed by replacement programs through the DSP period. To optimize the cost of this work, these assets would be renewed based on a health condition assessment, not simply by age.
There are two key concepts related to improving the performance of electrical distribution systems in severe weather situations (climate change impacts): hardening and resiliency. Hardening deals with physical changes (i.e. undergrounding of lines) to make infrastructure less susceptible to severe weather-related damage. Resiliency deals with increasing the ability to recover quickly from damage to distribution infrastructure components or to any of the external systems on which they depend.
A number of line rebuild projects (system renewal) will result in higher strength poles compared to the original installation thereby implicitly “hardening” the line. From an operating perspective, EEDO has enhanced its preventative maintenance practices in the area of vegetation management to mitigate the impacts of severe wind and storm events. The tree trimming program has been set at a 3-year cycle to minimize outage impacts due to severe weather related vegetation contact with overhead lines.
Despite EEDO’s best efforts to maintain a reliable system, the service is still subject to unplanned outages from events like storms where trees fall onto power lines causing a faulted condition. Customer feedback during these outages has demonstrated a desire to resolve these outages faster (resiliency), and to provide more timely information. To improve on this performance, EEDO plans to make system service investments into smart devices such as line sensors and remotely controllable switches to more quickly locate a fault and remotely restore customers. This is also potentially a more cost effective and safe response because there should be less time spent in the field searching for the fault.
EEDO believes that our customer’s want to continue to participate in the opportunities surrounding distributed energy resources such as electric vehicle integration and distributed renewable energy. To prepare for this grid evolution, EEDO has been implementing grid technology solutions such as a digital model of our system that permits for advanced analytics. This technology will be essential to maintain safety and reliability with the complexities introduced by EV charging behaviours and exported energy from
EPCOR Electricity Distribution Ontario Inc. 2023 – 2027 Distribution System Plan – Ver. 1.0
_____________________________________________________________________________________ Page 46 of 128
batteries and solar PV. EEDO has developed a plan to continue to upgrade, modify and keep secure these grid technology solutions in order to maintain pace with the growing distributed energy resources.
EEDO does anticipate some significant General Plant capital expenditures during this DSP period. The first relates to purchasing an O&M building to own rather than the current lease relationship with the Town of Collingwood. The reason for purchasing the building is to become the sole occupant in order to achieve the necessary space for the utility fleet, and prepare for long term growth (business case still being finalized). The second major general plant capital expenditure relates to the renewal of fleet vehicles necessary to deliver a safe and reliable service.
EEDO does not have any specific policy or procedure related to utilizing non-distribution system alternatives for system capacity or operational constraint relief. EEDO’s activities in this area are delivered through the facilitation of distributed generation connection. The accommodation of renewable energy generation projects is not expected to drive any significant system developments over the next five years. In the event that a large system service project is required, EEDO would evaluate if embedded distributed generation or battery energy storage could participate in meeting the system needs.
EEDO actively participates in the Regional Planning process to identify any system capacity or operational constraint relief that can be achieved through cooperative planning and program execution with regional distributors and transmitters.
EEDO notes that non-distribution investments to relieve capacity or operational constraints need to be optimal solutions. The solution must be optimal with respect to the uncertainty of future system loading. The non-distribution system investments need to ensure that distribution system investments can be deferred by a specific time period with certainty. Future uncertainties about local distribution capacity demand need to be factored into the value of the non-distribution system investment.
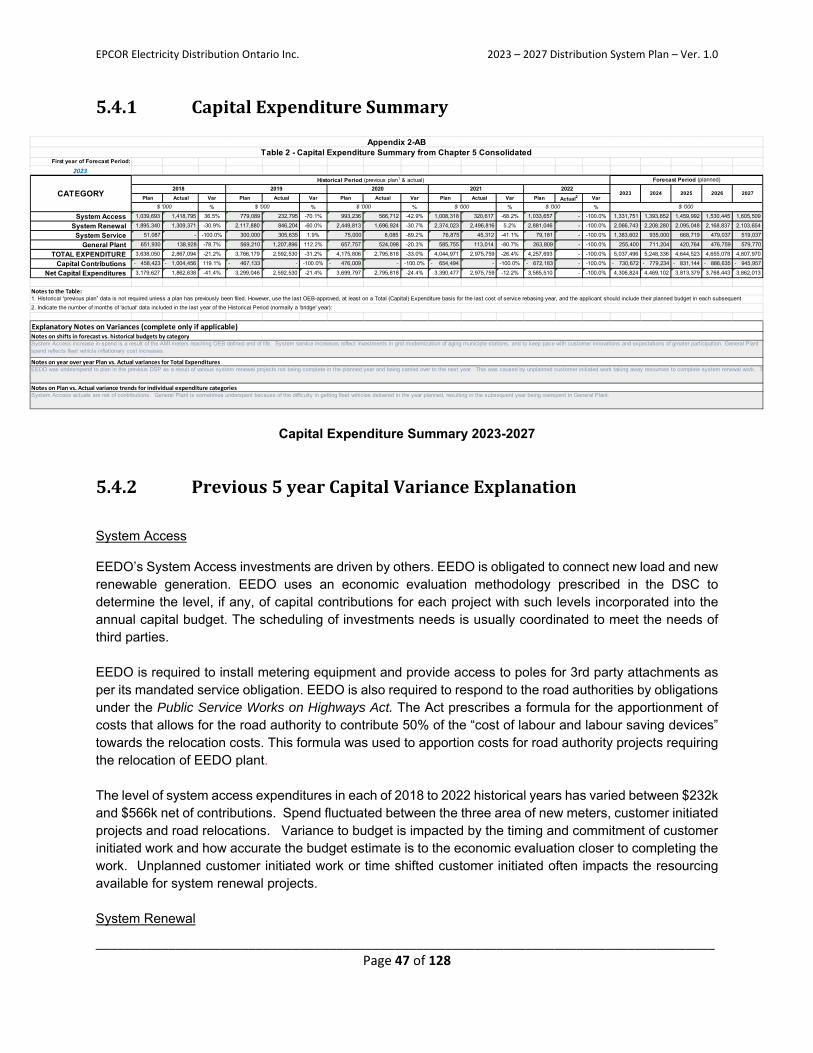
EPCOR Electricity Distribution Ontario Inc. 2023 – 2027 Distribution System Plan – Ver. 1.0
_____________________________________________________________________________________ Page 47 of 128
5.4.1 CapitalExpenditureSummary
Capital Expenditure Summary 2023-2027
5.4.2 Previous5yearCapitalVarianceExplanation
System Access
EEDO’s System Access investments are driven by others. EEDO is obligated to connect new load and new renewable generation. EEDO uses an economic evaluation methodology prescribed in the DSC to determine the level, if any, of capital contributions for each project with such levels incorporated into the annual capital budget. The scheduling of investments needs is usually coordinated to meet the needs of third parties. EEDO is required to install metering equipment and provide access to poles for 3rd party attachments as per its mandated service obligation. EEDO is also required to respond to the road authorities by obligations under the Public Service Works on Highways Act. The Act prescribes a formula for the apportionment of costs that allows for the road authority to contribute 50% of the “cost of labour and labour saving devices” towards the relocation costs. This formula was used to apportion costs for road authority projects requiring the relocation of EEDO plant. The level of system access expenditures in each of 2018 to 2022 historical years has varied between $232k and $566k net of contributions. Spend fluctuated between the three area of new meters, customer initiated projects and road relocations. Variance to budget is impacted by the timing and commitment of customer initiated work and how accurate the budget estimate is to the economic evaluation closer to completing the work. Unplanned customer initiated work or time shifted customer initiated often impacts the resourcing available for system renewal projects. System Renewal
First year of Forecast Period:
2023
Plan Actual Var Plan Actual Var Plan Actual Var Plan Actual Var Plan Actual2 Var
% % % % %
System Access 1,039,693 1,418,795 36.5% 779,089 232,795 -70.1% 993,236 566,712 -42.9% 1,008,318 320,617 -68.2% 1,033,657 - -100.0% 1,331,751 1,393,852 1,459,992 1,530,445 1,605,509
System Renewal 1,895,340 1,309,371 -30.9% 2,117,880 846,204 -60.0% 2,449,813 1,696,924 -30.7% 2,374,023 2,496,816 5.2% 2,881,046 - -100.0% 2,066,743 2,208,280 2,095,048 2,168,837 2,103,654
System Service 51,087 - -100.0% 300,000 305,635 1.9% 75,000 8,085 -89.2% 76,875 45,312 -41.1% 79,181 - -100.0% 1,383,602 935,000 668,719 479,037 519,037
General Plant 651,930 138,928 -78.7% 569,210 1,207,896 112.2% 657,757 524,098 -20.3% 585,755 113,014 -80.7% 263,809 - -100.0% 255,400 711,204 420,764 476,759 579,770
TOTAL EXPENDITURE 3,638,050 2,867,094 -21.2% 3,766,179 2,592,530 -31.2% 4,175,806 2,795,818 -33.0% 4,044,971 2,975,759 -26.4% 4,257,693 - -100.0% 5,037,496 5,248,336 4,644,523 4,655,078 4,807,970
Capital Contributions - 458,423 - 1,004,456 119.1% - 467,133 - -100.0% - 476,009 - -100.0% - 654,494 - -100.0% - 672,183 - -100.0% - 730,672 - 779,234 - 831,144 - 886,635 - 945,957
Net Capital Expenditures 3,179,627 1,862,638 -41.4% 3,299,046 2,592,530 -21.4% 3,699,797 2,795,818 -24.4% 3,390,477 2,975,759 -12.2% 3,585,510 - -100.0% 4,306,824 4,469,102 3,813,379 3,768,443 3,862,013
Appendix 2-ABTable 2 - Capital Expenditure Summary from Chapter 5 Consolidated
CATEGORY
Historical Period (previous plan1 & actual) Forecast Period (planned)
2018
$ '000 $ '000 $ '000
2025 2026 2027
$ '000 $ '000 $ '000
2019 2020 2021 20222023 2024
Notes to the Table:1. Historical “previous plan” data is not required unless a plan has previously been filed. However, use the last OEB-approved, at least on a Total (Capital) Expenditure basis for the last cost of service rebasing year, and the applicant should include their planned budget in each subsequent
System Access actuals are net of contributions. General Plant is sometimes underspent because of the difficulty in getting fleet vehicles delivered in the year planned, resulting in the subsequent year being overspent in General Plant.
Explanatory Notes on Variances (complete only if applicable)Notes on shifts in forecast vs. historical budgets by categorySystem Access increase in spend is a result of the AMI meters reaching OEB defined end of life. System service increases reflect investments in grid modernization of aging municiple stations, and to keep pace with customer innovations and expectations of greater participation. General Plant spend reflects fleet vehicle inflationary cost increases.
Notes on year over year Plan vs. Actual variances for Total ExpendituresEEDO was undesrspend to plan in the previous DSP as a result of various system renewal projects not being complete in the planned year and being carried over to the next year. This was caused by unplanned customer initiated work taking away resources to complete system renewal work. Th
Notes on Plan vs. Actual variance trends for individual expenditure categories
2. Indicate the number of months of 'actual' data included in the last year of the Historical Period (normally a 'bridge' year):
EPCOR Electricity Distribution Ontario Inc. 2023 – 2027 Distribution System Plan – Ver. 1.0
_____________________________________________________________________________________ Page 48 of 128
System renewal is a mix of non-mandatory (planned end of life replacement) and mandatory (emergency replacement) investments. Non-mandatory investments are identified in the Asset Management Plan, prioritized and scheduled. The primary driver of projects in the system renewal bucket are pole line replacements due to poor conditioned poles.
The level of system renewal expenditures in each of 2018 and 2022 historical years has varied between $0.846M and $2.5M. The main driver of variance from plan to actual during this period was driven by carry over projects from previous years that were not completed. EEDO got behind on is renewal projects prior to 2018, driven by the large volume in work from customer initiated (system access) projects between 2015 and 2018. This problem perpetuated throughout the previous DSP period (2018-2022). In 2021, EEDO reset the capital budget and set it based on actual resource capacity rather than trying to include carry over projects. This results in some system renewal projects being deferred to the next DSP period.
During this DSP period, system renewal was also impacted by a pro-longed labour negotiation and covid-19. These two situations impacted some of the internal productivity achieved. In 2021, EEDO started to introduce some new project management controls to better manage cost and schedule. This will improve the likelihood of achieving plan in the system renewal bucket in the next DSP period.
System Service
System Service investments are non-mandatory investments to provide for consistent service delivery and to meet operational objectives. These investments are required to support the expansion, operation and reliability of the distribution system.
The level of system service expenditures in each of 2018 to 2022 historical years has varied between $0 and $300K. The main spend was made in 2019 to replace the aging SCADA system. Spend in subsequent years was to upkeep and maintain the SCADA system and the Smart map and GIS model implemented prior to 2018.
General Plant
General Plant investments are non-mandatory investments, not part of its distribution system (e.g. fleet, tools, land, etc.). Investments in this category are driven by operational and business needs to achieve a safe work place, enhance employee work environments and satisfaction, increase efficiencies and productivity, and enhance customer service and value.
The level of general plant expenditures in each of 2018 to 2022 historical years has varied between $113k and $1.2M. The primary driver of variances related to delays in procurement, manufacture and delivery of a large bucket truck from 2018 to 2019. There have also been delays to fleet replacements in 2021 due to the global supply chain shortage on microchips.
5.4.3 ImpactofsystemcapitalinvestmentonO&Mcosts EEDO’s operations and maintenance strategy is to minimize reactive and emergency-type work through efficient operations and an effective planned maintenance program, including predictive and preventative actions. EEDO’s customer responsiveness and system reliability are monitored continually to ensure that its maintenance strategy is effective. This effort is coordinated with EEDO’s capital project work so that
EPCOR Electricity Distribution Ontario Inc. 2023 – 2027 Distribution System Plan – Ver. 1.0
_____________________________________________________________________________________ Page 49 of 128
where maintenance programs have identified matters which require capital investments, EEDO may adjust its capital spending priorities to address those matters.
Predictive Maintenance - Predictive maintenance activities involve the testing of elements of the distribution system. These activities include infrared thermography testing, transformer oil analysis, planned visual inspections and pole testing. These evaluation tools are all administered using a grid system with appropriate frequency levels. Any identified deficiencies are prioritized and addressed within a suitable time frame.
Preventative Maintenance - Preventative maintenance activities include inspection, servicing and repair of network components. This includes overhead and pad-mounted switch maintenance. Also included are regular inspection and repair of substation components and ancillary equipment. The work is performed using a combination of time and condition-based methodologies. This also includes tree trimming across our operational area on a three year cycle. This is an important element to mitigate the growing climate change risk where increased wind storms are experienced resulting in tree contact unplanned outages. EEDO has entered into a three year MSA with a contractor to procure competitive pricing for this maintenance.
Emergency Maintenance - This item includes unexpected system repairs to the electrical system that must be addressed immediately. The costs include those related to repairs caused by storm damage, emergency tree trimming and on-call premiums. EEDO constantly evaluates its maintenance data to adjust predictive and preventative actions. The ultimate objective is to reduce this emergency maintenance. EEDO uses PowerAssist and EDTI Control Room operations to contact “on call” lineperson and supervisory staff in the event of service problems outside of normal business hours. Investments into System Service grid technologies like line sensors and remotely operated switches will speed up the time it takes to fault isolate and restore customers, lowering the costs associated with emergency maintenance.
Service Work - The majority of costs related to this work pertain to service upgrades requested by customers, and requests to provide safety coverage for work (overhead line cover ups). This includes service disconnections and reconnections by EEDO for all service classes; assisting pre-approved contractors; the making of final connections after Electrical Safety Authority (“ESA”) inspection for service upgrades; and changes of service locations.
Network Control Operations – EEDO maintains a Supervisory Control and Data Acquisition (“SCADA”) system.
Metering - The metering department is responsible for the installation, testing, and commissioning of new and existing simple and complex metering installations. Testing of complex metering installations ensures the accuracy of the installation and verifies meter multipliers for billing purposes. Revenue Protection is another key activity performed by Metering, by proactively investigating potential diversion and theft of power.
Substation Services - Substation services activities address the maintenance of all equipment at EEDO’s 14 substations. This includes both labour costs and non-capital material spending to support both scheduled and emergency maintenance events. As with the maintenance activities, substation maintenance strategy focuses on minimizing, to the extent possible, emergency-type work by improving the effectiveness of EEDO’s planned maintenance program (including predictive and preventative actions) for its substations.
EPCOR Electricity Distribution Ontario Inc. 2023 – 2027 Distribution System Plan – Ver. 1.0
_____________________________________________________________________________________ Page 50 of 128
Operations Area - The Operations area coordinates drafting and design services for capital projects and provides distribution system asset information to many departments within EEDO. Engineering costs are allocated to operations, maintenance, capital, and third party receivable accounts based on total labour, truck and material costs. A standard overhead percentage is set at the beginning of the year for all jobs and adjusted to actual at year end.
Stores/Warehouse - The Stores area is accountable for managing the procurement, control, and movement of materials within EEDO’s service centre. This includes monitoring inventory levels, issuing material receipts, material issues, and material returns as required. The cost of the stores department is allocated to all departmental, capital and third party receivable accounts as an overhead cost based on direct material costs. A standard overhead percentage is set at the beginning of the year and adjusted to actual at year end.
Garage/Transportation Fleet - The Garage and Transportation Fleet area has as one of its objectives keeping maintenance schedules to ensure vehicle reliability and safety, and the minimization of vehicle down time. Vehicle costs are allocated to operations, maintenance, capital and third party receivable accounts based on number of hours used. A standard “cost per hour” is set for all vehicles within the fleet (one rate for passenger vehicles and pickup and another rate for bucket trucks and work platforms).
System investments will result in:
the addition of incremental plant (e.g. new MS, poles, switchgear, transformers, etc.); the relocation/replacement of existing plant (e.g. road widenings); the replacement of end of life plant with new plant (e.g. cables, poles, transformers, etc.) new/replacement system support expenditures (e.g. fleet, software, etc.)
In general, incremental plant additions (e.g. new MS c/w transformer, switchgear, land, etc.) will be integrated into the Asset Management system and will require incremental resources for ongoing O&M purposes. This is expected to put upward pressure on O&M costs. Relocation/replacement of existing plant normally results in an asset being replaced with a similar one, so there would be little or no change to resources for ongoing O&M purposes (i.e. inspections still need to be carried out on a periodic basis as required per the Distribution System Code). There may be some slight life advantages when a working older piece of equipment is replaced with a newer one that would impact on O&M repair related charges. Overall the plan system investments in this category are expected to put neutral pressure on O&M costs. Replacement of end of life plant with new plant will still require the allocation of resources for ongoing O&M purposes. Repair would be the most significant O&M activity impacted by new plant. Certain assets, such as poles, offer few opportunities for repair related activities and generally require replacement when deemed at end of normal life or critically damaged. Other assets such as direct buried cable offer opportunities for repair related activities (e.g. splices) up to a point where further repairs are not warranted due to end of life conditions. In a few areas cable faults will not be repaired due to cable end of life. When faulted, the faulted cable section will be replaced, normally a section between two distribution transformers. For planned cable replacement in a subdivision, new primary cable installed in duct replaces direct buried primary cable and is expected to provide higher reliability and life. This will shift response activity for a cable failure from repair (O&M) to replacement (Capital). If assets approaching end of life are replaced at a rate that maintains equipment class average condition then one would expect little or no change to O&M costs under no growth scenarios but would still see upward O&M cost pressure on positive growth scenarios (more cumulative assets to maintain each year). Replacement rates that improve equipment class average condition could result in lowering certain maintenance activities costs (e.g. pole testing, reactive repairs, etc.). Overall this is expected to put downward pressure on O&M repair related costs.
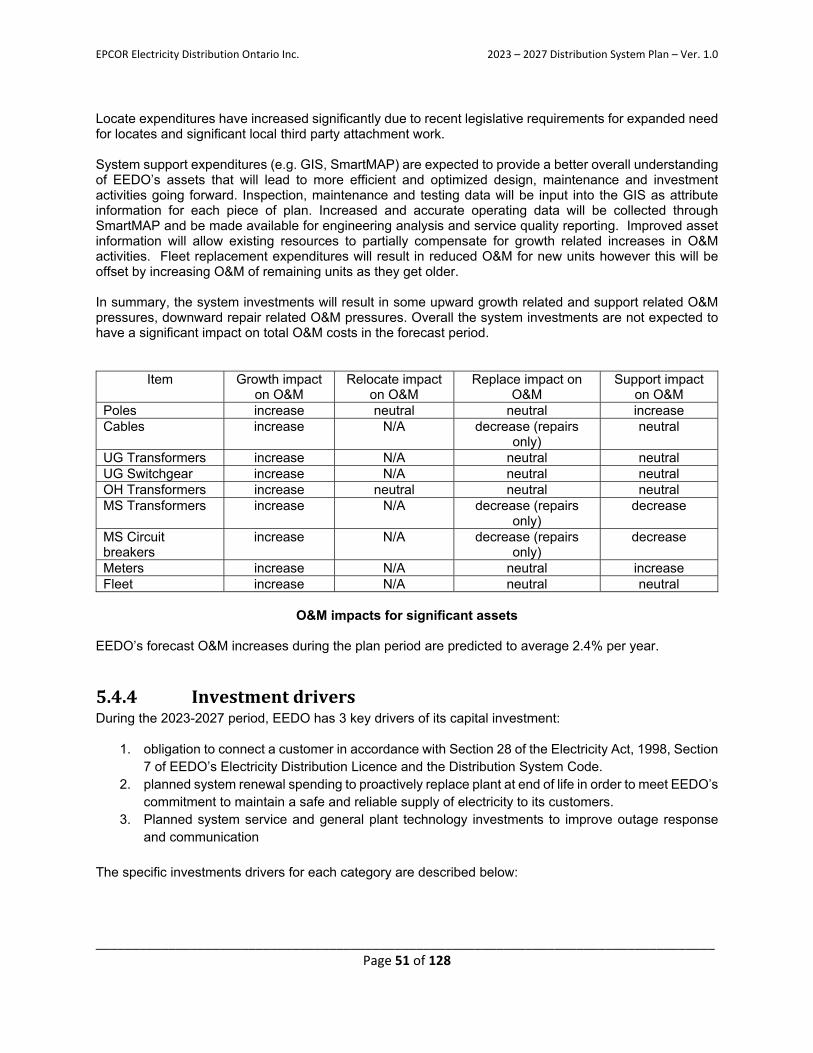
EPCOR Electricity Distribution Ontario Inc. 2023 – 2027 Distribution System Plan – Ver. 1.0
_____________________________________________________________________________________ Page 51 of 128
Locate expenditures have increased significantly due to recent legislative requirements for expanded need for locates and significant local third party attachment work. System support expenditures (e.g. GIS, SmartMAP) are expected to provide a better overall understanding of EEDO’s assets that will lead to more efficient and optimized design, maintenance and investment activities going forward. Inspection, maintenance and testing data will be input into the GIS as attribute information for each piece of plan. Increased and accurate operating data will be collected through SmartMAP and be made available for engineering analysis and service quality reporting. Improved asset information will allow existing resources to partially compensate for growth related increases in O&M activities. Fleet replacement expenditures will result in reduced O&M for new units however this will be offset by increasing O&M of remaining units as they get older. In summary, the system investments will result in some upward growth related and support related O&M pressures, downward repair related O&M pressures. Overall the system investments are not expected to have a significant impact on total O&M costs in the forecast period.
Item Growth impact on O&M
Relocate impact on O&M
Replace impact on O&M
Support impact on O&M
Poles increase neutral neutral increase Cables increase N/A decrease (repairs
only) neutral
UG Transformers increase N/A neutral neutral UG Switchgear increase N/A neutral neutral OH Transformers increase neutral neutral neutral MS Transformers increase N/A decrease (repairs
only) decrease
MS Circuit breakers
increase N/A decrease (repairs only)
decrease
Meters increase N/A neutral increase Fleet increase N/A neutral neutral
O&M impacts for significant assets
EEDO’s forecast O&M increases during the plan period are predicted to average 2.4% per year.
5.4.4 InvestmentdriversDuring the 2023-2027 period, EEDO has 3 key drivers of its capital investment:
1. obligation to connect a customer in accordance with Section 28 of the Electricity Act, 1998, Section 7 of EEDO’s Electricity Distribution Licence and the Distribution System Code.
2. planned system renewal spending to proactively replace plant at end of life in order to meet EEDO’s commitment to maintain a safe and reliable supply of electricity to its customers.
3. Planned system service and general plant technology investments to improve outage response and communication
The specific investments drivers for each category are described below:
EPCOR Electricity Distribution Ontario Inc. 2023 – 2027 Distribution System Plan – Ver. 1.0
_____________________________________________________________________________________ Page 52 of 128
System Access
Customer service requests - continued development of the Towns of Collingwood, Stayner, Thornbury and Creemore requiring new customer connections (site redevelopment; subdivisions)
Meter replacements that have reached their end of life
In summary, forecast employment and population growth in the Towns of Collingwood, Stayner, Thornbury and Creemore, will continue to focus 2023-2027 System Access needs on new subdivision connections, connection upgrades due to site redevelopment, and plant relocation.
System Renewal
Failure Risk - multiyear planned pole replacement programs that address assets in “very poor” and “poor” condition. Historical trend has seen decreasing investments due to resource reallocation to mandatory System Access investments related to third party plant relocations. Forecast investments will increase as resources become available.
High Performance Risks - overhead line rebuilds. Historical investments have been based on sections of line that require complete rebuild (poles, conductors, insulators, etc.) as opposed to dispersed pole replacement works. Forecast investments will continue to target specific sections of line requiring complete rebuild.
Station relay replacements are required to upgrade conditionally poor relays Emergency needs - emergency reactive replacement of distribution system assets (poles,
transformers, switches, switchgear, cable, conductor, insulators, guys, anchors, etc.) due to unanticipated failure, storms, motor vehicle accidents, vandalism, etc.
In summary, system renewal spending will focus on planned proactive pole replacement similar to the last DSP period. Specific high performance risk areas will be prioritized during the 2023-2027 period at increased levels that manage risk of equipment failure while mitigating rate impacts to customers. These areas have been informed by the METSCO condition assessment.
System Service
System operational objectives – investments to maintain system reliability and efficiency of distribution stations. Historical investments needs related to system supervisory have been relatively consistent.
Continued investments into grid technologies such as SmartMap and the underlying GIS electrically connected model will be required. The GIS team has leveraged Esri’s ArcMap software for utility asset database recording, system mapping, analysis, and other geospatial functions to support operational and business needs. Software updates, including security patches for ArcMap, will cease in 2024 and support of ArcMap will be completely phased out by 2026. Anticipating these changes, the GIS team is planning migration to ArcGIS Pro - the next generation Esri GIS desktop software to replace ArcMap.
In addition to upgrading ArcMap, it is also proposed to replace the underlying “Geometric Network “data model with Esri’s “Utility Network” model (UN). The data model defines the “back end” database structure and ArcGIS Pro software is the “front end” where the data is displayed and manipulated. The Utility Network (UN) model offers a digital representation of the network systems that is more accurate, more useful and more reliable than the legacy, antiquated Geometric Network model. The data model migration to UN will modernize GIS utility maintenance and
EPCOR Electricity Distribution Ontario Inc. 2023 – 2027 Distribution System Plan – Ver. 1.0
_____________________________________________________________________________________ Page 53 of 128
functionality, will deliver the full value of the ArcGIS platform, and can result in increased operational efficiency and safety.
Investments into smart devices or line sensors to create better visibility and accuracy in locating potential line faults. There will also be investments into remotely operated SCADA switches to permit for fault isolation and restoration without having to potentially roll a trouble truck.
Station transformer upgrades will be required at our Stayner municipal stations to keep pace to the growing demand and increase capacity.
Station upgrades in both Stayner and Thornbury to establish SCADA visibility on the feeders. This will aid with both fault location and restoration.
Within this DSP period, EEDO could see some significant customer growth on the west side of Collingwood. At this point, the development is not yet committed to, and early phases could be serviced through existing capacity. There is a possible scenario where EEDO has to come back to the OEB with an Incremental Capital Module (ICM) application to build a new substation during this DSP period. The timing of developments in this area are hard to predict, so EEDO does not want to overbuild the system at this time. This decision is made in recognition of the growing capabilities of non-wires alternatives to meet capacity needs.
In summary, system service spending will continue to focus on improving operational performance and increasing capacity.
General Plant
System Maintenance support – replacement of rolling stock; tools. Historical investments have resulted in specific rolling stock and tool replacement as required. Replacement of major fleet units tends to create cost spikes in a particular investment year when compared to the replacement costs of small fleet units. Forecast investments include the replacement of major fleet units in 2020, 2021 and 2023.
Customers have told us that they want improved communications, in particular during outages. Customer’s expectations have changed and there is a more participative nature to their behaviour. To respond to these changing expectations, EEDO plans to invest into improved customer experience enhancements including improving the outage map, improving call in performance, customer portals, and digitizing our customer interactions.
EEDO plans to develop digitized work management processes to cut down on paper and the errors that can be introduced with paper processes. In addition, EEDO operations plans to leverage mobile app technology available today to achieve operational efficiencies.
Non-system Physical plant – office equipment, tools, minor building modifications etc. Historical investments have been relatively steady during the historical period.
EEDO has been working with the Town of Collingwood on a long term accommodation solution. EEDO currently leases space from the Town of Collingwood and shares this building with the water department of the Town. The floor space is very constrained and creates safety risk with the vehicle fleet. EEDO is bound to this lease agreement, but has been in negotiations with the Town to consider a purchase of the existing building and move to sole occupancy by EEDO. From a financial perspective, this would be a move from a lease payment to mortgage or amortization payment. The net impact may require an ICM application within this DSP period. If negotiations are unsuccessful with the Town of Collingwood, EEDO may look at smaller outbuilding in another location for some of its vehicle fleet. At this point, EEDO is not able to address within this DSP given the unknown outcome of the negotiations with the Town. The Town has been reluctant to
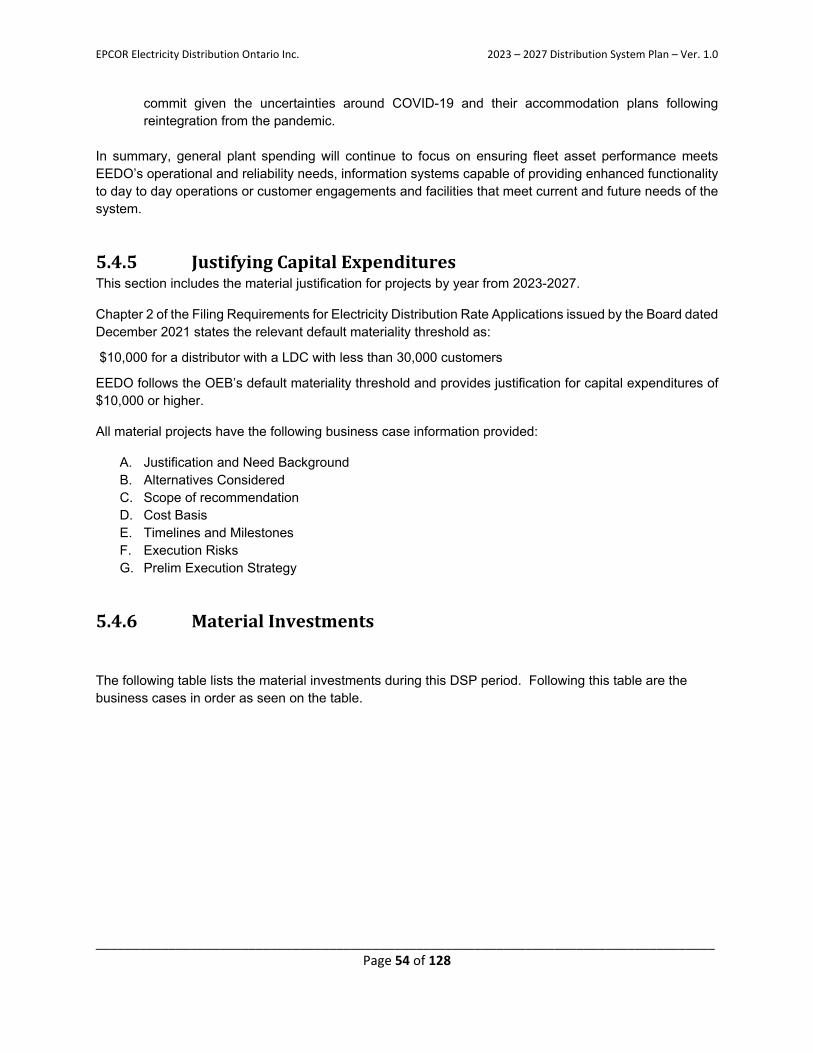
EPCOR Electricity Distribution Ontario Inc. 2023 – 2027 Distribution System Plan – Ver. 1.0
_____________________________________________________________________________________ Page 54 of 128
commit given the uncertainties around COVID-19 and their accommodation plans following reintegration from the pandemic.
In summary, general plant spending will continue to focus on ensuring fleet asset performance meets EEDO’s operational and reliability needs, information systems capable of providing enhanced functionality to day to day operations or customer engagements and facilities that meet current and future needs of the system.
5.4.5 JustifyingCapitalExpendituresThis section includes the material justification for projects by year from 2023-2027.
Chapter 2 of the Filing Requirements for Electricity Distribution Rate Applications issued by the Board dated December 2021 states the relevant default materiality threshold as:
$10,000 for a distributor with a LDC with less than 30,000 customers
EEDO follows the OEB’s default materiality threshold and provides justification for capital expenditures of $10,000 or higher.
All material projects have the following business case information provided:
A. Justification and Need Background B. Alternatives Considered C. Scope of recommendation D. Cost Basis E. Timelines and Milestones F. Execution Risks G. Prelim Execution Strategy
5.4.6 MaterialInvestments
The following table lists the material investments during this DSP period. Following this table are the business cases in order as seen on the table.
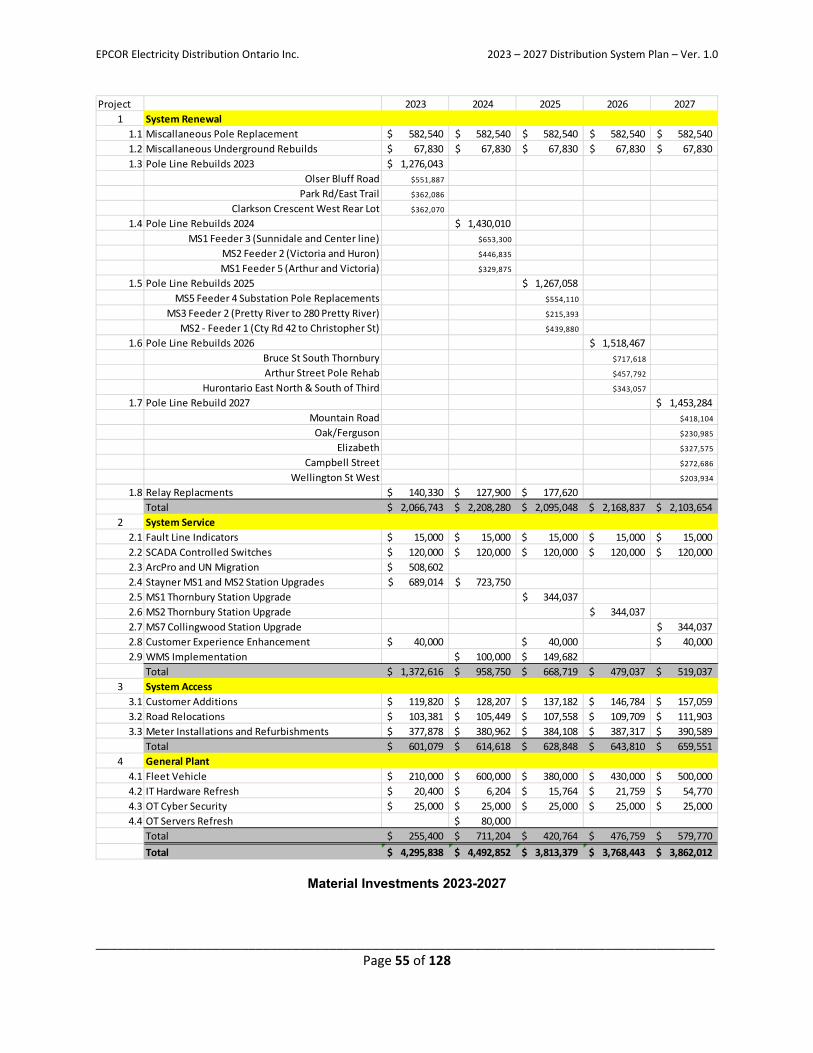
EPCOR Electricity Distribution Ontario Inc. 2023 – 2027 Distribution System Plan – Ver. 1.0
_____________________________________________________________________________________ Page 55 of 128
Material Investments 2023-2027
Project 2023 2024 2025 2026 2027
1 System Renewal
1.1 Miscallaneous Pole Replacement 582,540$ 582,540$ 582,540$ 582,540$ 582,540$
1.2 Miscallaneous Underground Rebuilds 67,830$ 67,830$ 67,830$ 67,830$ 67,830$
1.3 Pole Line Rebuilds 2023 1,276,043$
Olser Bluff Road $551,887
Park Rd/East Trail $362,086
Clarkson Crescent West Rear Lot $362,070
1.4 Pole Line Rebuilds 2024 1,430,010$
MS1 Feeder 3 (Sunnidale and Center line) $653,300
MS2 Feeder 2 (Victoria and Huron) $446,835
MS1 Feeder 5 (Arthur and Victoria) $329,875
1.5 Pole Line Rebuilds 2025 1,267,058$
MS5 Feeder 4 Substation Pole Replacements $554,110
MS3 Feeder 2 (Pretty River to 280 Pretty River) $215,393
MS2 ‐ Feeder 1 (Cty Rd 42 to Christopher St) $439,880
1.6 Pole Line Rebuilds 2026 1,518,467$
Bruce St South Thornbury $717,618
Arthur Street Pole Rehab $457,792
Hurontario East North & South of Third $343,057
1.7 Pole Line Rebuild 2027 1,453,284$
Mountain Road $418,104
Oak/Ferguson $230,985
Elizabeth $327,575
Campbell Street $272,686
Wellington St West $203,934
1.8 Relay Replacments 140,330$ 127,900$ 177,620$
Total 2,066,743$ 2,208,280$ 2,095,048$ 2,168,837$ 2,103,654$
2 System Service
2.1 Fault Line Indicators 15,000$ 15,000$ 15,000$ 15,000$ 15,000$
2.2 SCADA Controlled Switches 120,000$ 120,000$ 120,000$ 120,000$ 120,000$
2.3 ArcPro and UN Migration 508,602$
2.4 Stayner MS1 and MS2 Station Upgrades 689,014$ 723,750$
2.5 MS1 Thornbury Station Upgrade 344,037$
2.6 MS2 Thornbury Station Upgrade 344,037$
2.7 MS7 Collingwood Station Upgrade 344,037$
2.8 Customer Experience Enhancement 40,000$ 40,000$ 40,000$
2.9 WMS Implementation 100,000$ 149,682$
Total 1,372,616$ 958,750$ 668,719$ 479,037$ 519,037$
3 System Access
3.1 Customer Additions 119,820$ 128,207$ 137,182$ 146,784$ 157,059$
3.2 Road Relocations 103,381$ 105,449$ 107,558$ 109,709$ 111,903$
3.3 Meter Installations and Refurbishments 377,878$ 380,962$ 384,108$ 387,317$ 390,589$
Total 601,079$ 614,618$ 628,848$ 643,810$ 659,551$
4 General Plant
4.1 Fleet Vehicle 210,000$ 600,000$ 380,000$ 430,000$ 500,000$
4.2 IT Hardware Refresh 20,400$ 6,204$ 15,764$ 21,759$ 54,770$
4.3 OT Cyber Security 25,000$ 25,000$ 25,000$ 25,000$ 25,000$
4.4 OT Servers Refresh 80,000$
Total 255,400$ 711,204$ 420,764$ 476,759$ 579,770$
Total 4,295,838$ 4,492,852$ 3,813,379$ 3,768,443$ 3,862,012$
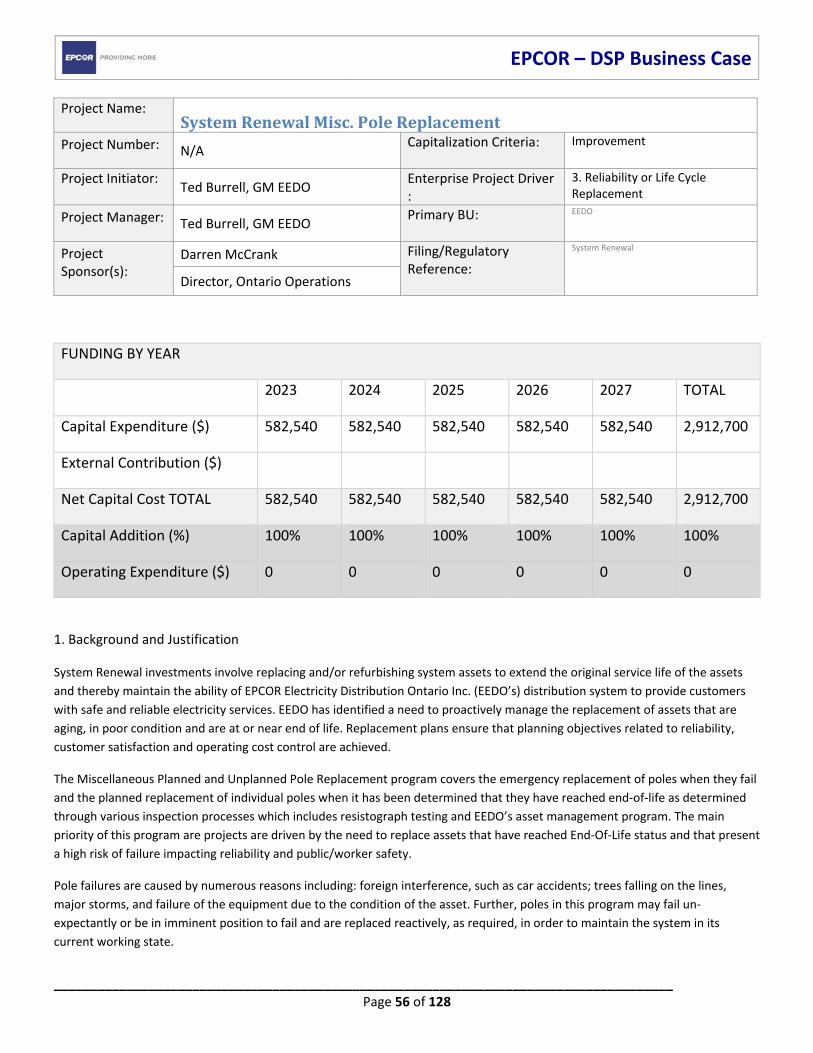
EPCOR – DSP Business Case
_____________________________________________________________________________________ Page 56 of 128
Project Name: SystemRenewalMisc.PoleReplacementProject Number:
N/A Capitalization Criteria:
Improvement
Project Initiator:
Ted Burrell, GM EEDO Enterprise Project Driver :
3. Reliability or Life Cycle Replacement
Project Manager:
Ted Burrell, GM EEDO Primary BU:
EEDO
Project Sponsor(s):
Darren McCrank Filing/Regulatory Reference:
System Renewal
Director, Ontario Operations
1. Background and Justification
System Renewal investments involve replacing and/or refurbishing system assets to extend the original service life of the assets
and thereby maintain the ability of EPCOR Electricity Distribution Ontario Inc. (EEDO’s) distribution system to provide customers
with safe and reliable electricity services. EEDO has identified a need to proactively manage the replacement of assets that are
aging, in poor condition and are at or near end of life. Replacement plans ensure that planning objectives related to reliability,
customer satisfaction and operating cost control are achieved.
The Miscellaneous Planned and Unplanned Pole Replacement program covers the emergency replacement of poles when they fail
and the planned replacement of individual poles when it has been determined that they have reached end‐of‐life as determined
through various inspection processes which includes resistograph testing and EEDO’s asset management program. The main
priority of this program are projects are driven by the need to replace assets that have reached End‐Of‐Life status and that present
a high risk of failure impacting reliability and public/worker safety.
Pole failures are caused by numerous reasons including: foreign interference, such as car accidents; trees falling on the lines,
major storms, and failure of the equipment due to the condition of the asset. Further, poles in this program may fail un‐
expectantly or be in imminent position to fail and are replaced reactively, as required, in order to maintain the system in its
current working state.
FUNDING BY YEAR
2023 2024 2025 2026 2027 TOTAL
Capital Expenditure ($) 582,540 582,540 582,540 582,540 582,540 2,912,700
External Contribution ($)
Net Capital Cost TOTAL 582,540 582,540 582,540 582,540 582,540 2,912,700
Capital Addition (%) 100% 100% 100% 100% 100% 100%
Operating Expenditure ($) 0 0 0 0 0 0
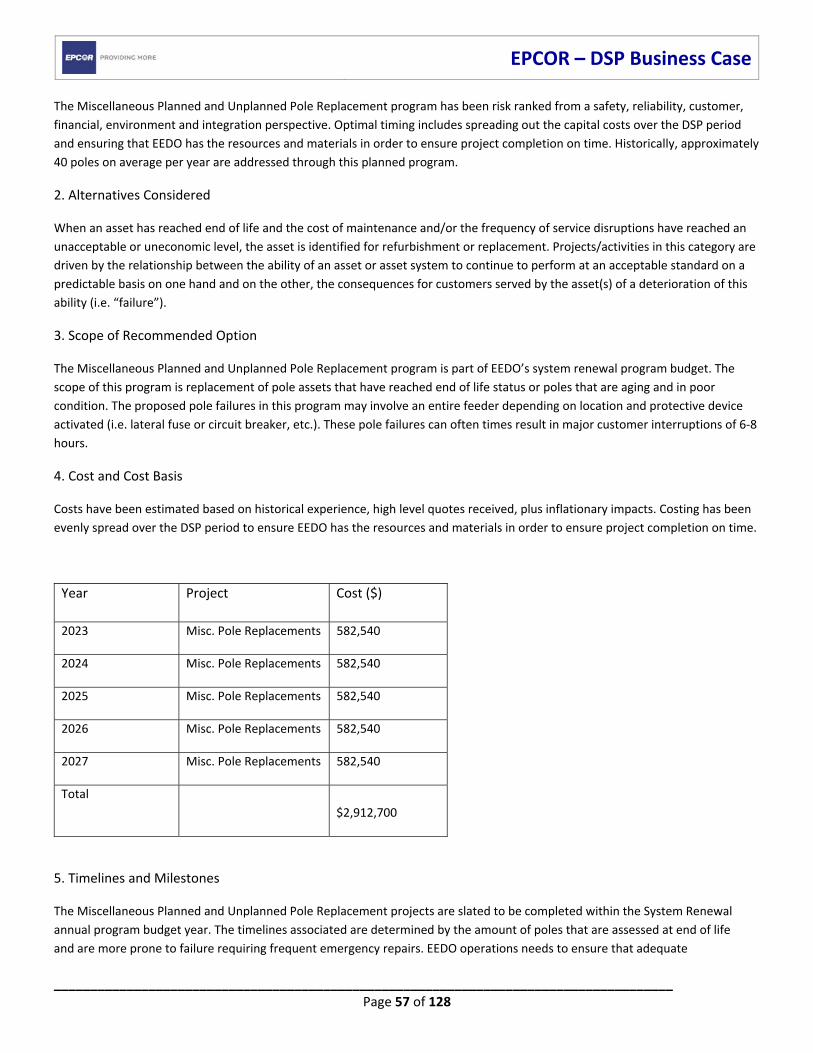
EPCOR – DSP Business Case
_____________________________________________________________________________________ Page 57 of 128
The Miscellaneous Planned and Unplanned Pole Replacement program has been risk ranked from a safety, reliability, customer,
financial, environment and integration perspective. Optimal timing includes spreading out the capital costs over the DSP period
and ensuring that EEDO has the resources and materials in order to ensure project completion on time. Historically, approximately
40 poles on average per year are addressed through this planned program.
2. Alternatives Considered
When an asset has reached end of life and the cost of maintenance and/or the frequency of service disruptions have reached an
unacceptable or uneconomic level, the asset is identified for refurbishment or replacement. Projects/activities in this category are
driven by the relationship between the ability of an asset or asset system to continue to perform at an acceptable standard on a
predictable basis on one hand and on the other, the consequences for customers served by the asset(s) of a deterioration of this
ability (i.e. “failure”).
3. Scope of Recommended Option
The Miscellaneous Planned and Unplanned Pole Replacement program is part of EEDO’s system renewal program budget. The
scope of this program is replacement of pole assets that have reached end of life status or poles that are aging and in poor
condition. The proposed pole failures in this program may involve an entire feeder depending on location and protective device
activated (i.e. lateral fuse or circuit breaker, etc.). These pole failures can often times result in major customer interruptions of 6‐8
hours.
4. Cost and Cost Basis
Costs have been estimated based on historical experience, high level quotes received, plus inflationary impacts. Costing has been
evenly spread over the DSP period to ensure EEDO has the resources and materials in order to ensure project completion on time.
Year Project Cost ($)
2023 Misc. Pole Replacements 582,540
2024 Misc. Pole Replacements 582,540
2025 Misc. Pole Replacements 582,540
2026 Misc. Pole Replacements 582,540
2027 Misc. Pole Replacements 582,540
Total
$2,912,700
5. Timelines and Milestones
The Miscellaneous Planned and Unplanned Pole Replacement projects are slated to be completed within the System Renewal
annual program budget year. The timelines associated are determined by the amount of poles that are assessed at end of life
and are more prone to failure requiring frequent emergency repairs. EEDO operations needs to ensure that adequate
EPCOR – DSP Business Case
_____________________________________________________________________________________ Page 58 of 128
resources and materials are required in order to ensure project completion on time. Approximately 40 poles per year are
addressed through this planned program.
6. Execution Risks
Reliability Planning – Poles are replaced like‐for‐like or upgraded to as per plans for the area
Safety ‐ Poles at End‐Of‐Life represents a safety hazard to staff and the public. End of life status generally implies that pole
structural strength has decreased to levels below the minimum acceptable per CSA Standard for Overhead Construction.
Replacement in accordance with CSA construction standards and in compliance with ESA Reg. 22/04 restores the system to safe
structural and operating condition.
Cost risk is managed by pacing through the forecast period to accommodate annual spending variances in the other investment
categories while maintaining overall budget envelope to maintain current levels of reliability.
Program value and deferral risk are weighed against the ability of the customer to pay. Customer concern about the overall cost of
electricity supports the need to consider rate mitigation efforts while managing risk and smoothing spending over time for non‐
mandatory investments necessary to maintain current service performance levels.
7. Preliminary Execution Strategy
Develop a good request for proposal practice and issue out with plenty of lead time. Once the DSP is approved, EEDO will ensure
that adequate internal and external resources are available for project completion. Municipal consent, emergency locates and
NVCA permits might be required for some pole replacement projects. These approvals will be completed during the engineering
process of the system renewal projects.
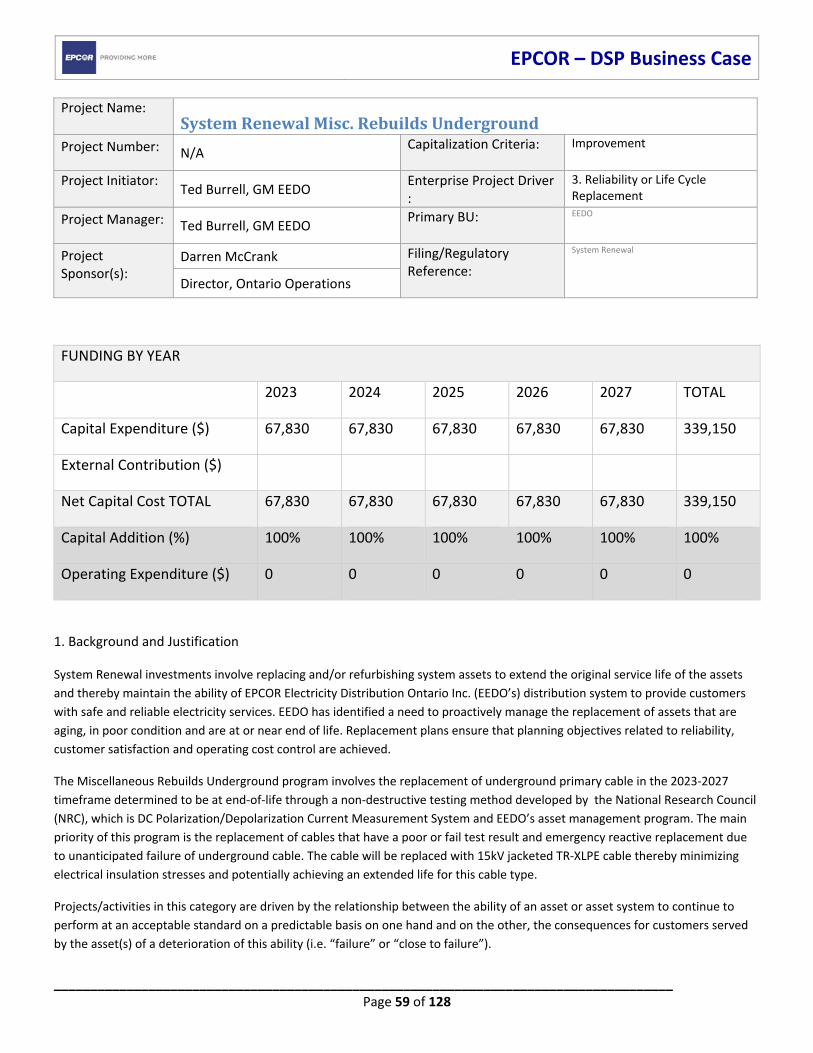
EPCOR – DSP Business Case
_____________________________________________________________________________________ Page 59 of 128
Project Name: SystemRenewalMisc.RebuildsUndergroundProject Number:
N/A Capitalization Criteria:
Improvement
Project Initiator:
Ted Burrell, GM EEDO Enterprise Project Driver :
3. Reliability or Life Cycle Replacement
Project Manager:
Ted Burrell, GM EEDO Primary BU:
EEDO
Project Sponsor(s):
Darren McCrank Filing/Regulatory Reference:
System Renewal
Director, Ontario Operations
1. Background and Justification
System Renewal investments involve replacing and/or refurbishing system assets to extend the original service life of the assets
and thereby maintain the ability of EPCOR Electricity Distribution Ontario Inc. (EEDO’s) distribution system to provide customers
with safe and reliable electricity services. EEDO has identified a need to proactively manage the replacement of assets that are
aging, in poor condition and are at or near end of life. Replacement plans ensure that planning objectives related to reliability,
customer satisfaction and operating cost control are achieved.
The Miscellaneous Rebuilds Underground program involves the replacement of underground primary cable in the 2023‐2027
timeframe determined to be at end‐of‐life through a non‐destructive testing method developed by the National Research Council
(NRC), which is DC Polarization/Depolarization Current Measurement System and EEDO’s asset management program. The main
priority of this program is the replacement of cables that have a poor or fail test result and emergency reactive replacement due
to unanticipated failure of underground cable. The cable will be replaced with 15kV jacketed TR‐XLPE cable thereby minimizing
electrical insulation stresses and potentially achieving an extended life for this cable type.
Projects/activities in this category are driven by the relationship between the ability of an asset or asset system to continue to
perform at an acceptable standard on a predictable basis on one hand and on the other, the consequences for customers served
by the asset(s) of a deterioration of this ability (i.e. “failure” or “close to failure”).
FUNDING BY YEAR
2023 2024 2025 2026 2027 TOTAL
Capital Expenditure ($) 67,830 67,830 67,830 67,830 67,830 339,150
External Contribution ($)
Net Capital Cost TOTAL 67,830 67,830 67,830 67,830 67,830 339,150
Capital Addition (%) 100% 100% 100% 100% 100% 100%
Operating Expenditure ($) 0 0 0 0 0 0
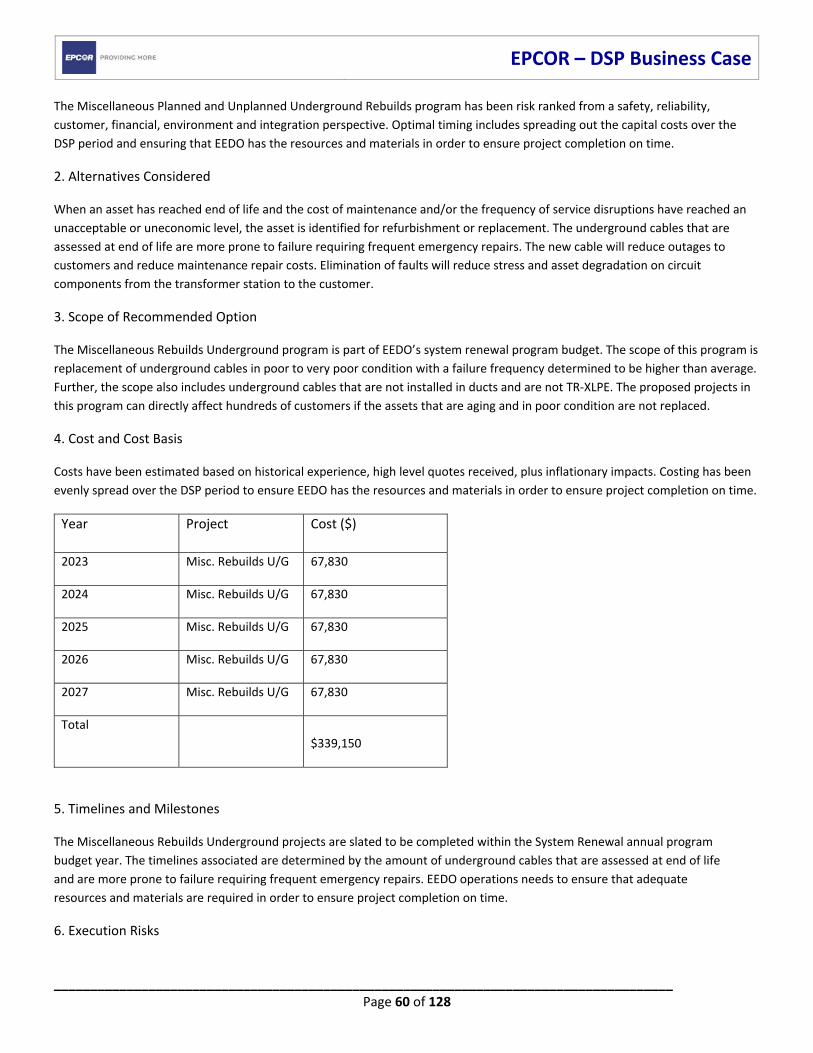
EPCOR – DSP Business Case
_____________________________________________________________________________________ Page 60 of 128
The Miscellaneous Planned and Unplanned Underground Rebuilds program has been risk ranked from a safety, reliability,
customer, financial, environment and integration perspective. Optimal timing includes spreading out the capital costs over the
DSP period and ensuring that EEDO has the resources and materials in order to ensure project completion on time.
2. Alternatives Considered
When an asset has reached end of life and the cost of maintenance and/or the frequency of service disruptions have reached an
unacceptable or uneconomic level, the asset is identified for refurbishment or replacement. The underground cables that are
assessed at end of life are more prone to failure requiring frequent emergency repairs. The new cable will reduce outages to
customers and reduce maintenance repair costs. Elimination of faults will reduce stress and asset degradation on circuit
components from the transformer station to the customer.
3. Scope of Recommended Option
The Miscellaneous Rebuilds Underground program is part of EEDO’s system renewal program budget. The scope of this program is
replacement of underground cables in poor to very poor condition with a failure frequency determined to be higher than average.
Further, the scope also includes underground cables that are not installed in ducts and are not TR‐XLPE. The proposed projects in
this program can directly affect hundreds of customers if the assets that are aging and in poor condition are not replaced.
4. Cost and Cost Basis
Costs have been estimated based on historical experience, high level quotes received, plus inflationary impacts. Costing has been
evenly spread over the DSP period to ensure EEDO has the resources and materials in order to ensure project completion on time.
Year Project Cost ($)
2023 Misc. Rebuilds U/G 67,830
2024 Misc. Rebuilds U/G 67,830
2025 Misc. Rebuilds U/G 67,830
2026 Misc. Rebuilds U/G 67,830
2027 Misc. Rebuilds U/G 67,830
Total
$339,150
5. Timelines and Milestones
The Miscellaneous Rebuilds Underground projects are slated to be completed within the System Renewal annual program
budget year. The timelines associated are determined by the amount of underground cables that are assessed at end of life
and are more prone to failure requiring frequent emergency repairs. EEDO operations needs to ensure that adequate
resources and materials are required in order to ensure project completion on time.
6. Execution Risks
EPCOR – DSP Business Case
_____________________________________________________________________________________ Page 61 of 128
Reliability Planning – All cable will be replaced with 15kV jacketed TR‐XLPE cable. Operations at 5kV will result in minimizing
electrical insulation stresses thereby potentially achieving an extended life for this type of cable.
Safety ‐ Elimination of faults will reduce stress and asset degradation on circuit components from the transformer station to the
customer. Safety risk is also managed by ensuring new cable will be installed per ESA 22/04 standards.
Cost risk is managed by pacing through the forecast period to accommodate annual spending variances in the other investment
categories while maintaining overall budget envelope to maintain current levels of reliability.
Program value and deferral risk are weighed against the ability of the customer to pay. Customer concern about the overall cost of
electricity supports the need to consider rate mitigation efforts while managing risk and smoothing spending over time for non‐
mandatory investments necessary to maintain current service performance levels.
7. Preliminary Execution Strategy
Develop a good request for proposal practice and issue out with plenty of lead time. Once the DSP is approved, EEDO will ensure
that adequate internal and external resources are available for project completion. Approvals for some Miscellaneous Rebuilds
Underground projects are required by the municipalities and counties. These approvals include but are not limited to municipal
consent, road occupancy permit and NVCA permits. These approvals will be completed during the engineering process of the
system renewal projects.
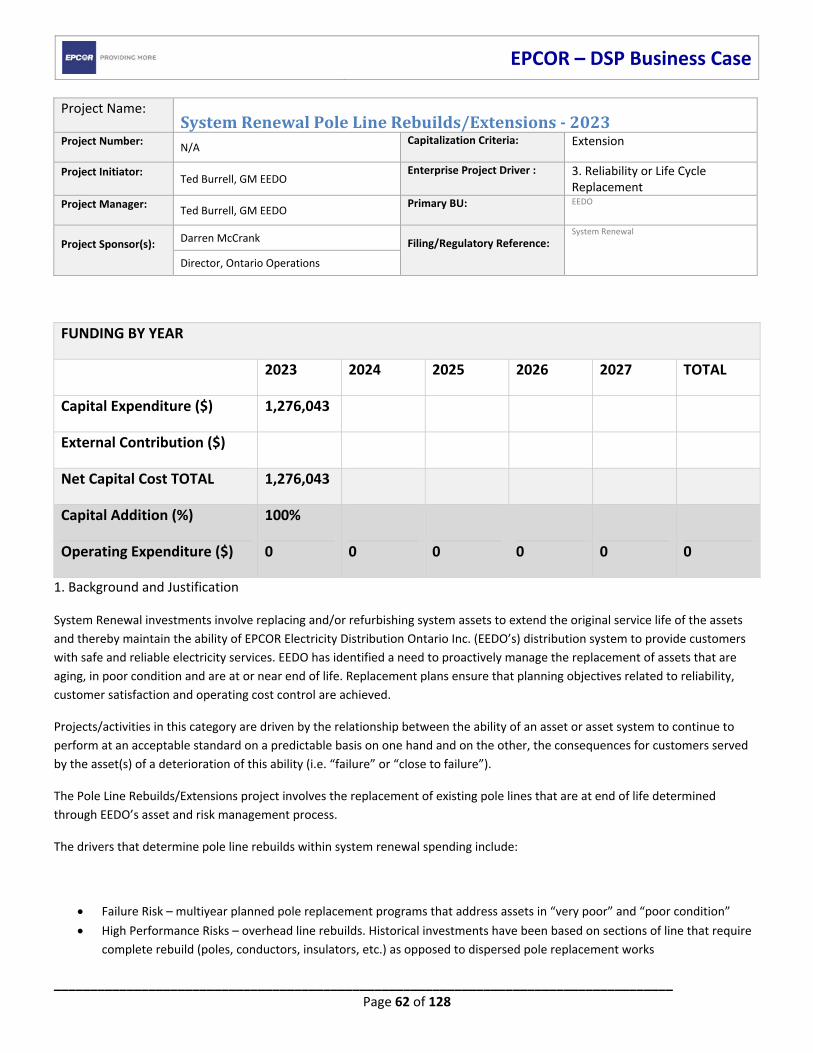
EPCOR – DSP Business Case
_____________________________________________________________________________________ Page 62 of 128
Project Name: SystemRenewalPoleLineRebuilds/Extensions‐2023Project Number:
N/A Capitalization Criteria:
Extension
Project Initiator:
Ted Burrell, GM EEDO Enterprise Project Driver : 3. Reliability or Life Cycle
Replacement Project Manager:
Ted Burrell, GM EEDO Primary BU:
EEDO
Project Sponsor(s):
Darren McCrank Filing/Regulatory Reference:
System Renewal
Director, Ontario Operations
1. Background and Justification
System Renewal investments involve replacing and/or refurbishing system assets to extend the original service life of the assets
and thereby maintain the ability of EPCOR Electricity Distribution Ontario Inc. (EEDO’s) distribution system to provide customers
with safe and reliable electricity services. EEDO has identified a need to proactively manage the replacement of assets that are
aging, in poor condition and are at or near end of life. Replacement plans ensure that planning objectives related to reliability,
customer satisfaction and operating cost control are achieved.
Projects/activities in this category are driven by the relationship between the ability of an asset or asset system to continue to
perform at an acceptable standard on a predictable basis on one hand and on the other, the consequences for customers served
by the asset(s) of a deterioration of this ability (i.e. “failure” or “close to failure”).
The Pole Line Rebuilds/Extensions project involves the replacement of existing pole lines that are at end of life determined
through EEDO’s asset and risk management process.
The drivers that determine pole line rebuilds within system renewal spending include:
Failure Risk – multiyear planned pole replacement programs that address assets in “very poor” and “poor condition”
High Performance Risks – overhead line rebuilds. Historical investments have been based on sections of line that require
complete rebuild (poles, conductors, insulators, etc.) as opposed to dispersed pole replacement works
FUNDING BY YEAR
2023 2024 2025 2026 2027 TOTAL
Capital Expenditure ($) 1,276,043
External Contribution ($)
Net Capital Cost TOTAL 1,276,043
Capital Addition (%) 100%
Operating Expenditure ($) 0 0 0 0 0 0
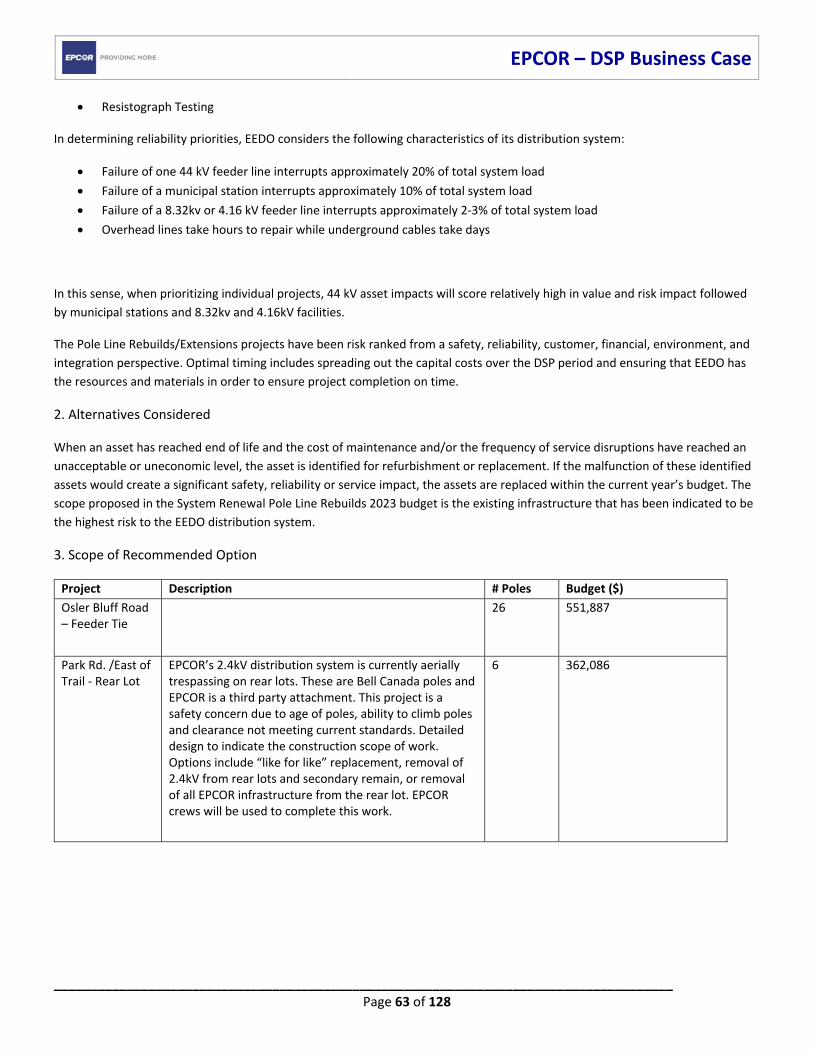
EPCOR – DSP Business Case
_____________________________________________________________________________________ Page 63 of 128
Resistograph Testing
In determining reliability priorities, EEDO considers the following characteristics of its distribution system:
Failure of one 44 kV feeder line interrupts approximately 20% of total system load
Failure of a municipal station interrupts approximately 10% of total system load
Failure of a 8.32kv or 4.16 kV feeder line interrupts approximately 2‐3% of total system load
Overhead lines take hours to repair while underground cables take days
In this sense, when prioritizing individual projects, 44 kV asset impacts will score relatively high in value and risk impact followed
by municipal stations and 8.32kv and 4.16kV facilities.
The Pole Line Rebuilds/Extensions projects have been risk ranked from a safety, reliability, customer, financial, environment, and
integration perspective. Optimal timing includes spreading out the capital costs over the DSP period and ensuring that EEDO has
the resources and materials in order to ensure project completion on time.
2. Alternatives Considered
When an asset has reached end of life and the cost of maintenance and/or the frequency of service disruptions have reached an
unacceptable or uneconomic level, the asset is identified for refurbishment or replacement. If the malfunction of these identified
assets would create a significant safety, reliability or service impact, the assets are replaced within the current year’s budget. The
scope proposed in the System Renewal Pole Line Rebuilds 2023 budget is the existing infrastructure that has been indicated to be
the highest risk to the EEDO distribution system.
3. Scope of Recommended Option
Project Description # Poles Budget ($)
Osler Bluff Road – Feeder Tie
26 551,887
Park Rd. /East of Trail ‐ Rear Lot
EPCOR’s 2.4kV distribution system is currently aerially trespassing on rear lots. These are Bell Canada poles and EPCOR is a third party attachment. This project is a safety concern due to age of poles, ability to climb poles and clearance not meeting current standards. Detailed design to indicate the construction scope of work. Options include “like for like” replacement, removal of 2.4kV from rear lots and secondary remain, or removal of all EPCOR infrastructure from the rear lot. EPCOR crews will be used to complete this work.
6 362,086
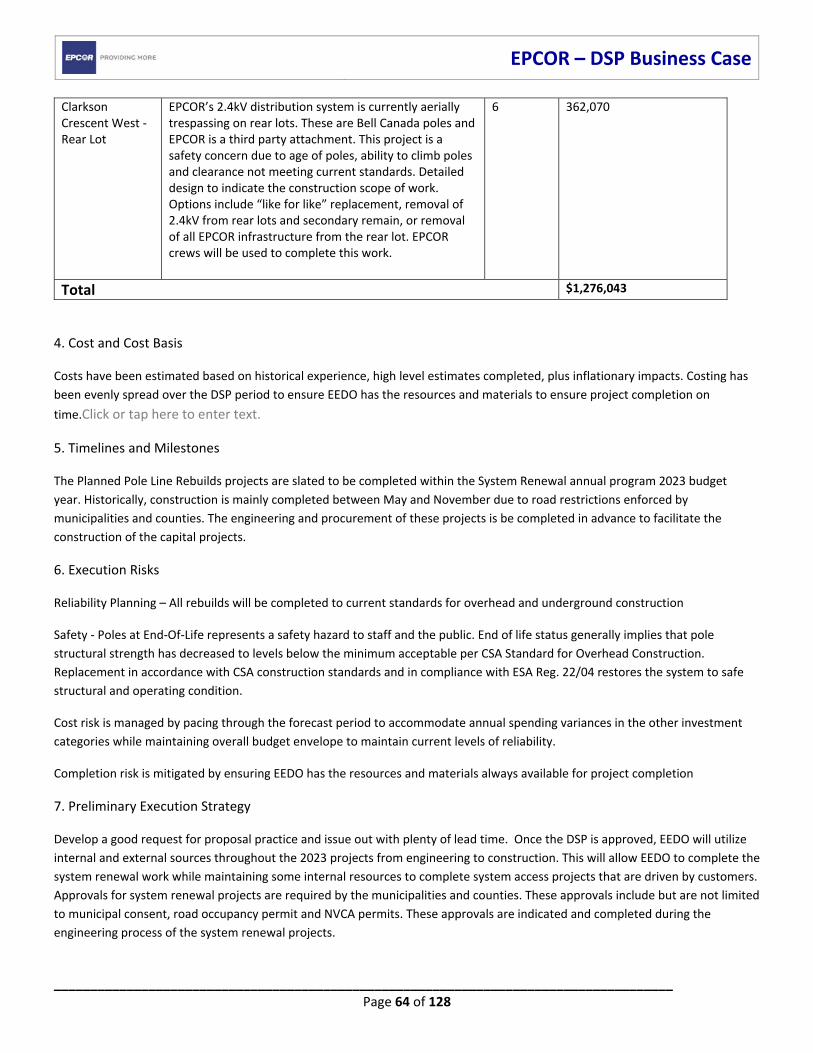
EPCOR – DSP Business Case
_____________________________________________________________________________________ Page 64 of 128
Clarkson Crescent West ‐ Rear Lot
EPCOR’s 2.4kV distribution system is currently aerially trespassing on rear lots. These are Bell Canada poles and EPCOR is a third party attachment. This project is a safety concern due to age of poles, ability to climb poles and clearance not meeting current standards. Detailed design to indicate the construction scope of work. Options include “like for like” replacement, removal of 2.4kV from rear lots and secondary remain, or removal of all EPCOR infrastructure from the rear lot. EPCOR crews will be used to complete this work.
6 362,070
Total $1,276,043
4. Cost and Cost Basis
Costs have been estimated based on historical experience, high level estimates completed, plus inflationary impacts. Costing has
been evenly spread over the DSP period to ensure EEDO has the resources and materials to ensure project completion on
time.Click or tap here to enter text.
5. Timelines and Milestones
The Planned Pole Line Rebuilds projects are slated to be completed within the System Renewal annual program 2023 budget
year. Historically, construction is mainly completed between May and November due to road restrictions enforced by
municipalities and counties. The engineering and procurement of these projects is be completed in advance to facilitate the
construction of the capital projects.
6. Execution Risks
Reliability Planning – All rebuilds will be completed to current standards for overhead and underground construction
Safety ‐ Poles at End‐Of‐Life represents a safety hazard to staff and the public. End of life status generally implies that pole
structural strength has decreased to levels below the minimum acceptable per CSA Standard for Overhead Construction.
Replacement in accordance with CSA construction standards and in compliance with ESA Reg. 22/04 restores the system to safe
structural and operating condition.
Cost risk is managed by pacing through the forecast period to accommodate annual spending variances in the other investment
categories while maintaining overall budget envelope to maintain current levels of reliability.
Completion risk is mitigated by ensuring EEDO has the resources and materials always available for project completion
7. Preliminary Execution Strategy
Develop a good request for proposal practice and issue out with plenty of lead time. Once the DSP is approved, EEDO will utilize
internal and external sources throughout the 2023 projects from engineering to construction. This will allow EEDO to complete the
system renewal work while maintaining some internal resources to complete system access projects that are driven by customers.
Approvals for system renewal projects are required by the municipalities and counties. These approvals include but are not limited
to municipal consent, road occupancy permit and NVCA permits. These approvals are indicated and completed during the
engineering process of the system renewal projects.

EPCOR – DSP Business Case
_____________________________________________________________________________________ Page 65 of 128
Project Name: SystemRenewalPoleLineRebuilds/Extensions‐2024Project Number:
N/A Capitalization Criteria:
Extension
Project Initiator:
Ted Burrell, GM EEDO Enterprise Project Driver : 3. Reliability or Life Cycle
Replacement Project Manager:
Ted Burrell, GM EEDO Primary BU:
EEDO
Project Sponsor(s):
Darren McCrank Filing/Regulatory Reference:
System Renewal
Director, Ontario Operations
1. Background and Justification
System Renewal investments involve replacing and/or refurbishing system assets to extend the original service life of the assets
and thereby maintain the ability of EPCOR Electricity Distribution Ontario Inc. (EEDO’s) distribution system to provide customers
with safe and reliable electricity services. EEDO has identified a need to proactively manage the replacement of assets that are
aging, in poor condition and are at or near end of life. Replacement plans ensure that planning objectives related to reliability,
customer satisfaction and operating cost control are achieved.
Projects/activities in this category are driven by the relationship between the ability of an asset or asset system to continue to
perform at an acceptable standard on a predictable basis on one hand and on the other, the consequences for customers served
by the asset(s) of a deterioration of this ability (i.e. “failure” or “close to failure”).
The Pole Line Rebuilds/Extensions project involves the replacement of existing pole lines that are at end of life determined
through EEDO’s asset and risk management process.
The drivers that determine pole line rebuilds within system renewal spending include:
Failure Risk – multiyear planned pole replacement programs that address assets in “very poor” and “poor condition”
FUNDING BY YEAR
2024 2024 2025 2026 2027 TOTAL
Capital Expenditure ($) 1,430,010
External Contribution ($)
Net Capital Cost TOTAL 1,430,010
Capital Addition (%) 100%
Operating Expenditure ($) 0 0 0 0 0 0
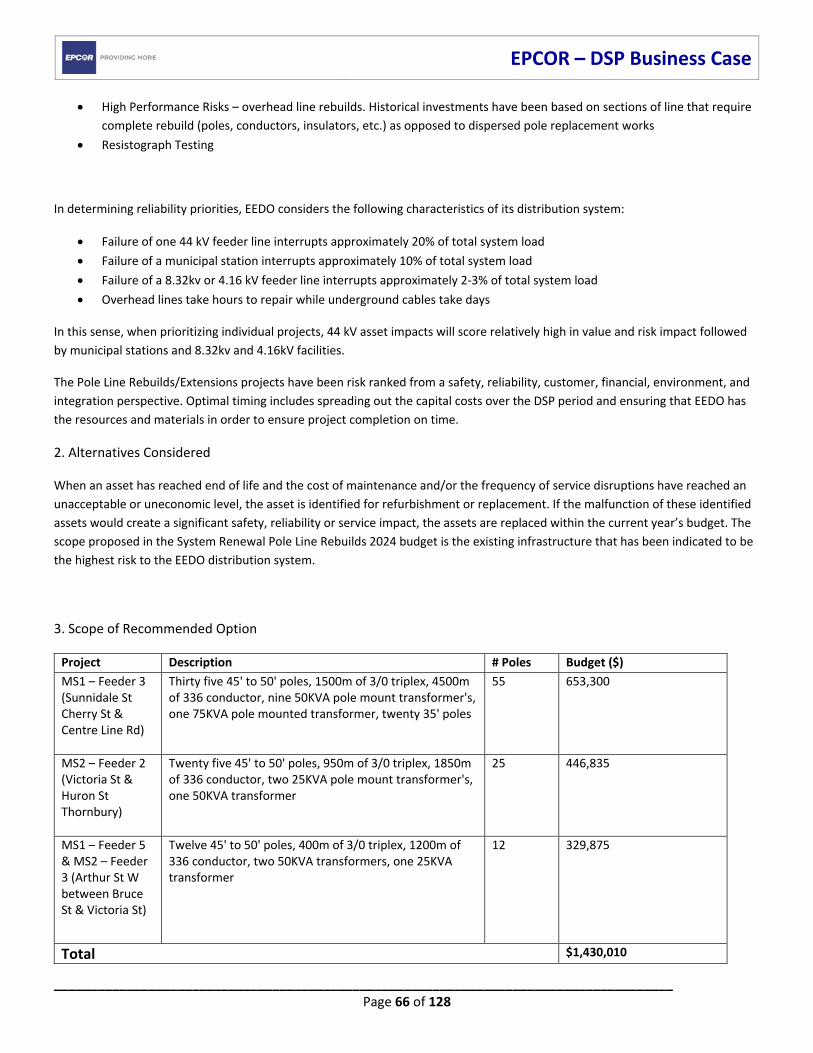
EPCOR – DSP Business Case
_____________________________________________________________________________________ Page 66 of 128
High Performance Risks – overhead line rebuilds. Historical investments have been based on sections of line that require
complete rebuild (poles, conductors, insulators, etc.) as opposed to dispersed pole replacement works
Resistograph Testing
In determining reliability priorities, EEDO considers the following characteristics of its distribution system:
Failure of one 44 kV feeder line interrupts approximately 20% of total system load
Failure of a municipal station interrupts approximately 10% of total system load
Failure of a 8.32kv or 4.16 kV feeder line interrupts approximately 2‐3% of total system load
Overhead lines take hours to repair while underground cables take days
In this sense, when prioritizing individual projects, 44 kV asset impacts will score relatively high in value and risk impact followed
by municipal stations and 8.32kv and 4.16kV facilities.
The Pole Line Rebuilds/Extensions projects have been risk ranked from a safety, reliability, customer, financial, environment, and
integration perspective. Optimal timing includes spreading out the capital costs over the DSP period and ensuring that EEDO has
the resources and materials in order to ensure project completion on time.
2. Alternatives Considered
When an asset has reached end of life and the cost of maintenance and/or the frequency of service disruptions have reached an
unacceptable or uneconomic level, the asset is identified for refurbishment or replacement. If the malfunction of these identified
assets would create a significant safety, reliability or service impact, the assets are replaced within the current year’s budget. The
scope proposed in the System Renewal Pole Line Rebuilds 2024 budget is the existing infrastructure that has been indicated to be
the highest risk to the EEDO distribution system.
3. Scope of Recommended Option
Project Description # Poles Budget ($)
MS1 – Feeder 3 (Sunnidale St Cherry St & Centre Line Rd)
Thirty five 45' to 50' poles, 1500m of 3/0 triplex, 4500m of 336 conductor, nine 50KVA pole mount transformer's, one 75KVA pole mounted transformer, twenty 35' poles
55 653,300
MS2 – Feeder 2 (Victoria St & Huron St Thornbury)
Twenty five 45' to 50' poles, 950m of 3/0 triplex, 1850m of 336 conductor, two 25KVA pole mount transformer's, one 50KVA transformer
25 446,835
MS1 – Feeder 5 & MS2 – Feeder 3 (Arthur St W between Bruce St & Victoria St)
Twelve 45' to 50' poles, 400m of 3/0 triplex, 1200m of 336 conductor, two 50KVA transformers, one 25KVA transformer
12 329,875
Total $1,430,010
EPCOR – DSP Business Case
_____________________________________________________________________________________ Page 67 of 128
4. Cost and Cost Basis
Costs have been estimated based on historical experience, high level estimates completed, plus inflationary impacts. Costing has
been evenly spread over the DSP period to ensure EEDO has the resources and materials to ensure project completion on time.
5. Timelines and Milestones
The Planned Pole Line Rebuilds projects are slated to be completed within the System Renewal annual program 2024 budget
year. Historically, construction is mainly completed between May and November due to road restrictions enforced by
municipalities and counties. The engineering and procurement of these projects is be completed in advance to facilitate the
construction of the capital projects.
6. Execution Risks
Reliability Planning – All rebuilds will be completed to current standards for overhead and underground construction
Safety ‐ Poles at End‐Of‐Life represents a safety hazard to staff and the public. End of life status generally implies that pole
structural strength has decreased to levels below the minimum acceptable per CSA Standard for Overhead Construction.
Replacement in accordance with CSA construction standards and in compliance with ESA Reg. 22/04 restores the system to safe
structural and operating condition.
Cost risk is managed by pacing through the forecast period to accommodate annual spending variances in the other investment
categories while maintaining overall budget envelope to maintain current levels of reliability.
Completion risk is mitigated by ensuring EEDO has the resources and materials always available for project completion
7. Preliminary Execution Strategy
Develop a good request for proposal practice and issue out with plenty of lead time. Once the DSP is approved, EEDO will utilize
internal and external sources throughout the 2024 projects from engineering to construction. This will allow EEDO to complete the
system renewal work while maintaining some internal resources to complete system access projects that are driven by customers.
Approvals for system renewal projects are required by the municipalities and counties. These approvals include but are not limited
to municipal consent, road occupancy permit and NVCA permits. These approvals are indicated and completed during the
engineering process of the system renewal projects.
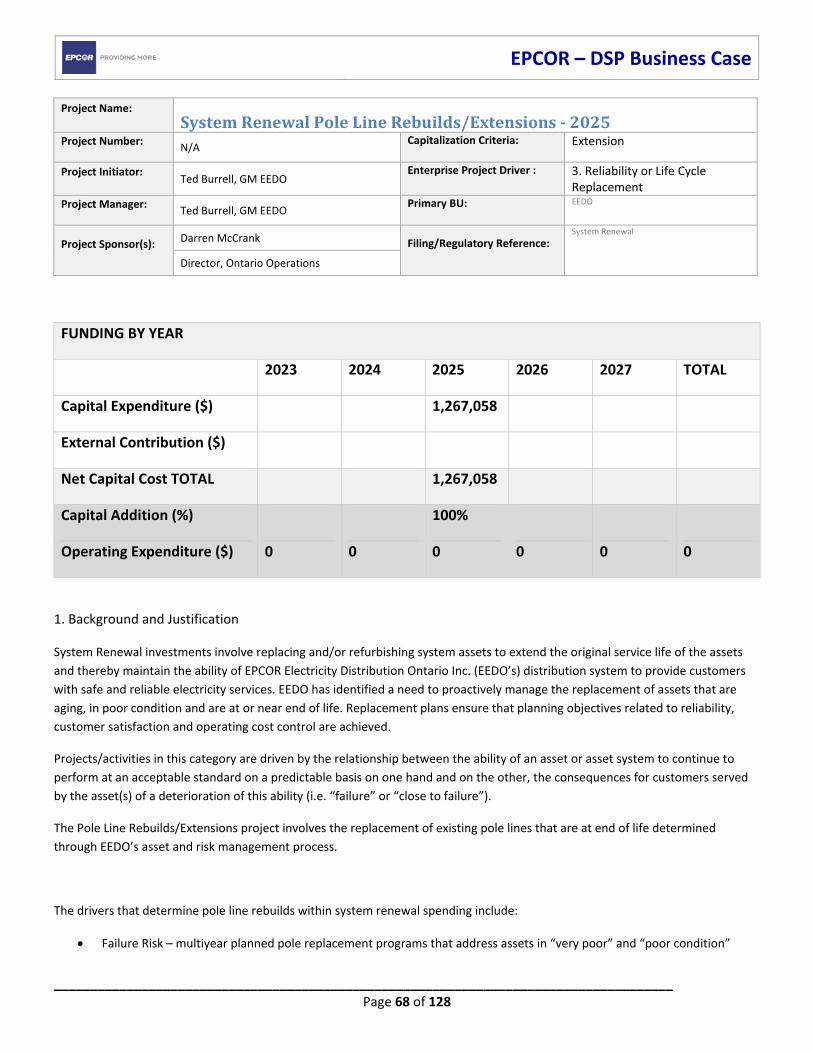
EPCOR – DSP Business Case
_____________________________________________________________________________________ Page 68 of 128
Project Name: SystemRenewalPoleLineRebuilds/Extensions‐2025Project Number:
N/A Capitalization Criteria:
Extension
Project Initiator:
Ted Burrell, GM EEDO Enterprise Project Driver : 3. Reliability or Life Cycle
Replacement Project Manager:
Ted Burrell, GM EEDO Primary BU:
EEDO
Project Sponsor(s):
Darren McCrank Filing/Regulatory Reference:
System Renewal
Director, Ontario Operations
1. Background and Justification
System Renewal investments involve replacing and/or refurbishing system assets to extend the original service life of the assets
and thereby maintain the ability of EPCOR Electricity Distribution Ontario Inc. (EEDO’s) distribution system to provide customers
with safe and reliable electricity services. EEDO has identified a need to proactively manage the replacement of assets that are
aging, in poor condition and are at or near end of life. Replacement plans ensure that planning objectives related to reliability,
customer satisfaction and operating cost control are achieved.
Projects/activities in this category are driven by the relationship between the ability of an asset or asset system to continue to
perform at an acceptable standard on a predictable basis on one hand and on the other, the consequences for customers served
by the asset(s) of a deterioration of this ability (i.e. “failure” or “close to failure”).
The Pole Line Rebuilds/Extensions project involves the replacement of existing pole lines that are at end of life determined
through EEDO’s asset and risk management process.
The drivers that determine pole line rebuilds within system renewal spending include:
Failure Risk – multiyear planned pole replacement programs that address assets in “very poor” and “poor condition”
FUNDING BY YEAR
2023 2024 2025 2026 2027 TOTAL
Capital Expenditure ($) 1,267,058
External Contribution ($)
Net Capital Cost TOTAL 1,267,058
Capital Addition (%) 100%
Operating Expenditure ($) 0 0 0 0 0 0
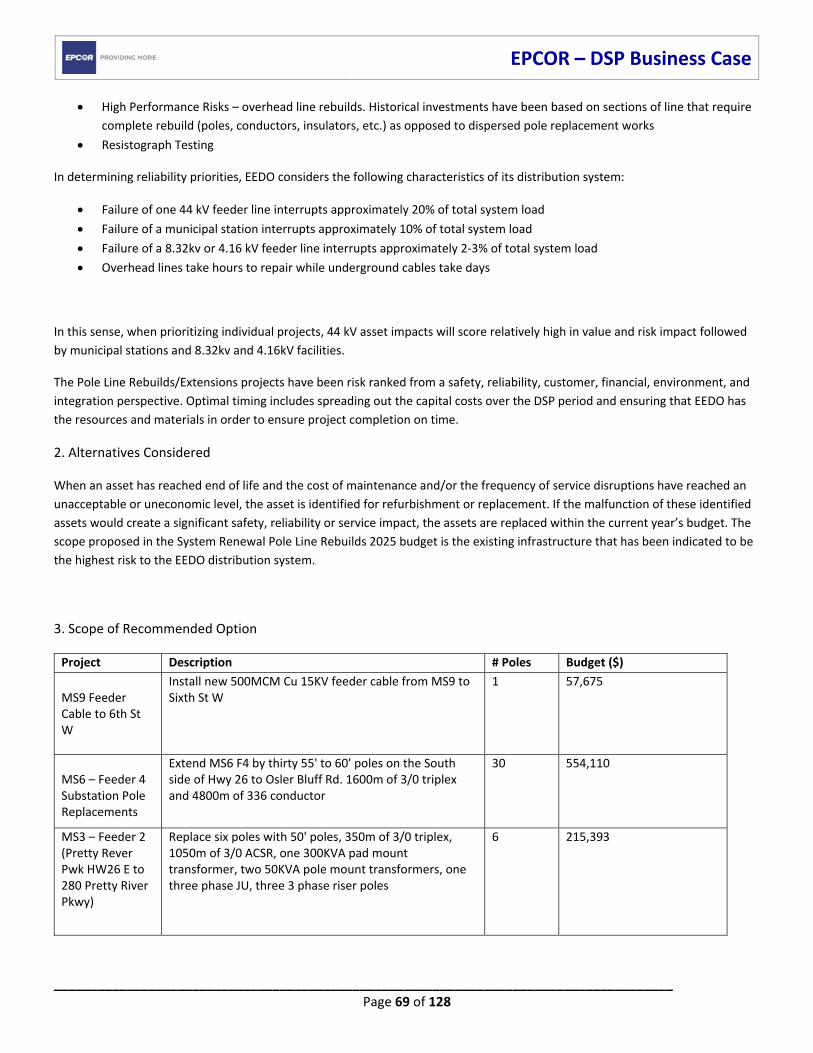
EPCOR – DSP Business Case
_____________________________________________________________________________________ Page 69 of 128
High Performance Risks – overhead line rebuilds. Historical investments have been based on sections of line that require
complete rebuild (poles, conductors, insulators, etc.) as opposed to dispersed pole replacement works
Resistograph Testing
In determining reliability priorities, EEDO considers the following characteristics of its distribution system:
Failure of one 44 kV feeder line interrupts approximately 20% of total system load
Failure of a municipal station interrupts approximately 10% of total system load
Failure of a 8.32kv or 4.16 kV feeder line interrupts approximately 2‐3% of total system load
Overhead lines take hours to repair while underground cables take days
In this sense, when prioritizing individual projects, 44 kV asset impacts will score relatively high in value and risk impact followed
by municipal stations and 8.32kv and 4.16kV facilities.
The Pole Line Rebuilds/Extensions projects have been risk ranked from a safety, reliability, customer, financial, environment, and
integration perspective. Optimal timing includes spreading out the capital costs over the DSP period and ensuring that EEDO has
the resources and materials in order to ensure project completion on time.
2. Alternatives Considered
When an asset has reached end of life and the cost of maintenance and/or the frequency of service disruptions have reached an
unacceptable or uneconomic level, the asset is identified for refurbishment or replacement. If the malfunction of these identified
assets would create a significant safety, reliability or service impact, the assets are replaced within the current year’s budget. The
scope proposed in the System Renewal Pole Line Rebuilds 2025 budget is the existing infrastructure that has been indicated to be
the highest risk to the EEDO distribution system.
3. Scope of Recommended Option
Project Description # Poles Budget ($)
MS9 Feeder Cable to 6th St W
Install new 500MCM Cu 15KV feeder cable from MS9 to Sixth St W
1 57,675
MS6 – Feeder 4 Substation Pole Replacements
Extend MS6 F4 by thirty 55' to 60' poles on the South side of Hwy 26 to Osler Bluff Rd. 1600m of 3/0 triplex and 4800m of 336 conductor
30 554,110
MS3 – Feeder 2 (Pretty Rever Pwk HW26 E to 280 Pretty River Pkwy)
Replace six poles with 50' poles, 350m of 3/0 triplex, 1050m of 3/0 ACSR, one 300KVA pad mount transformer, two 50KVA pole mount transformers, one three phase JU, three 3 phase riser poles
6 215,393
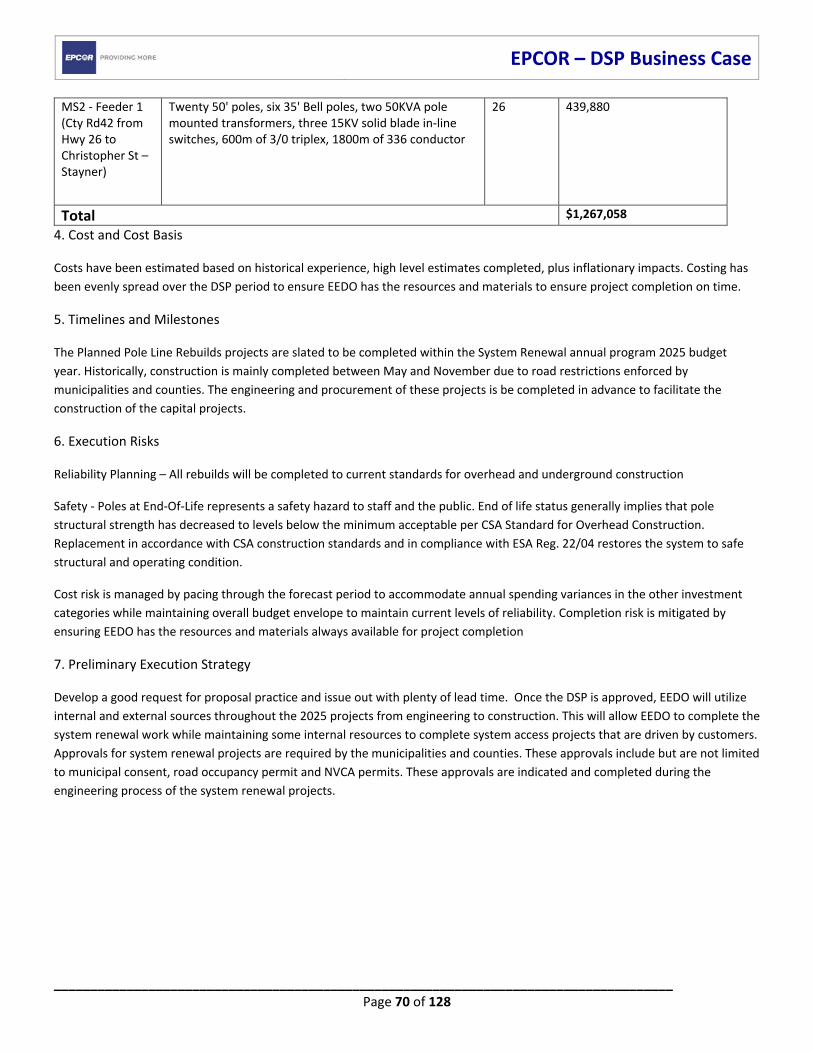
EPCOR – DSP Business Case
_____________________________________________________________________________________ Page 70 of 128
MS2 ‐ Feeder 1 (Cty Rd42 from Hwy 26 to Christopher St – Stayner)
Twenty 50' poles, six 35' Bell poles, two 50KVA pole mounted transformers, three 15KV solid blade in‐line switches, 600m of 3/0 triplex, 1800m of 336 conductor
26 439,880
Total $1,267,058
4. Cost and Cost Basis
Costs have been estimated based on historical experience, high level estimates completed, plus inflationary impacts. Costing has
been evenly spread over the DSP period to ensure EEDO has the resources and materials to ensure project completion on time.
5. Timelines and Milestones
The Planned Pole Line Rebuilds projects are slated to be completed within the System Renewal annual program 2025 budget
year. Historically, construction is mainly completed between May and November due to road restrictions enforced by
municipalities and counties. The engineering and procurement of these projects is be completed in advance to facilitate the
construction of the capital projects.
6. Execution Risks
Reliability Planning – All rebuilds will be completed to current standards for overhead and underground construction
Safety ‐ Poles at End‐Of‐Life represents a safety hazard to staff and the public. End of life status generally implies that pole
structural strength has decreased to levels below the minimum acceptable per CSA Standard for Overhead Construction.
Replacement in accordance with CSA construction standards and in compliance with ESA Reg. 22/04 restores the system to safe
structural and operating condition.
Cost risk is managed by pacing through the forecast period to accommodate annual spending variances in the other investment
categories while maintaining overall budget envelope to maintain current levels of reliability. Completion risk is mitigated by
ensuring EEDO has the resources and materials always available for project completion
7. Preliminary Execution Strategy
Develop a good request for proposal practice and issue out with plenty of lead time. Once the DSP is approved, EEDO will utilize
internal and external sources throughout the 2025 projects from engineering to construction. This will allow EEDO to complete the
system renewal work while maintaining some internal resources to complete system access projects that are driven by customers.
Approvals for system renewal projects are required by the municipalities and counties. These approvals include but are not limited
to municipal consent, road occupancy permit and NVCA permits. These approvals are indicated and completed during the
engineering process of the system renewal projects.
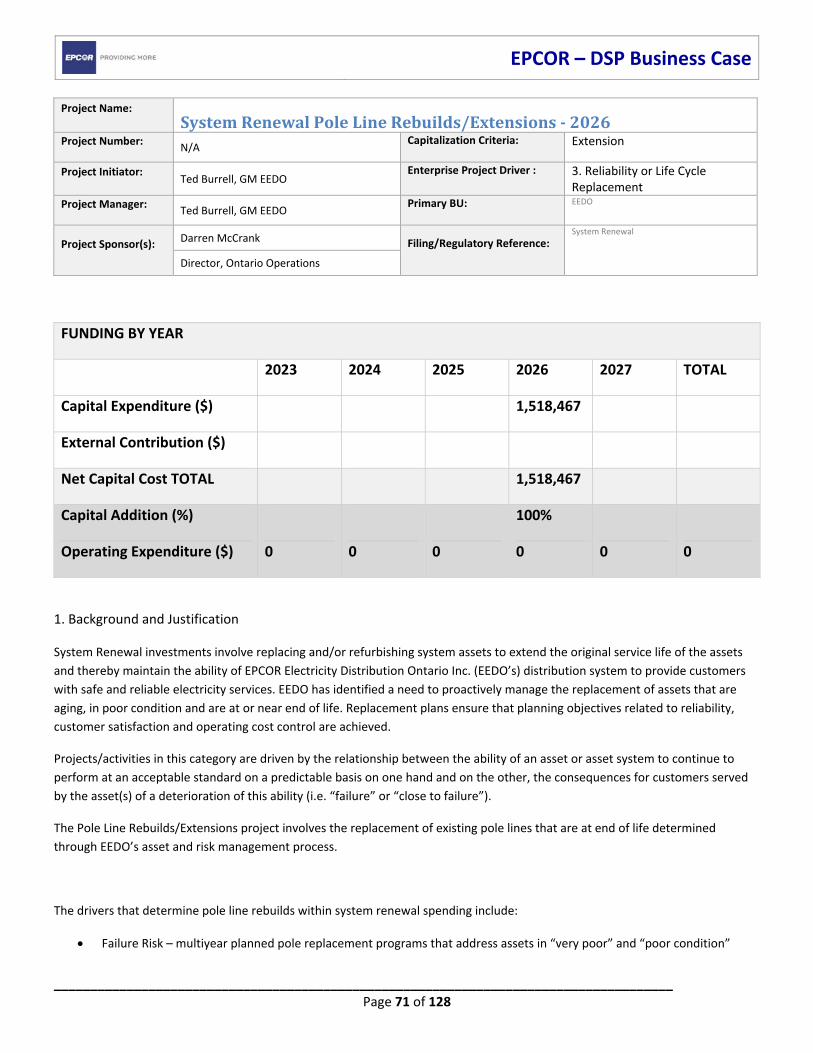
EPCOR – DSP Business Case
_____________________________________________________________________________________ Page 71 of 128
Project Name: SystemRenewalPoleLineRebuilds/Extensions‐2026Project Number:
N/A Capitalization Criteria:
Extension
Project Initiator:
Ted Burrell, GM EEDO Enterprise Project Driver : 3. Reliability or Life Cycle
Replacement Project Manager:
Ted Burrell, GM EEDO Primary BU:
EEDO
Project Sponsor(s):
Darren McCrank Filing/Regulatory Reference:
System Renewal
Director, Ontario Operations
1. Background and Justification
System Renewal investments involve replacing and/or refurbishing system assets to extend the original service life of the assets
and thereby maintain the ability of EPCOR Electricity Distribution Ontario Inc. (EEDO’s) distribution system to provide customers
with safe and reliable electricity services. EEDO has identified a need to proactively manage the replacement of assets that are
aging, in poor condition and are at or near end of life. Replacement plans ensure that planning objectives related to reliability,
customer satisfaction and operating cost control are achieved.
Projects/activities in this category are driven by the relationship between the ability of an asset or asset system to continue to
perform at an acceptable standard on a predictable basis on one hand and on the other, the consequences for customers served
by the asset(s) of a deterioration of this ability (i.e. “failure” or “close to failure”).
The Pole Line Rebuilds/Extensions project involves the replacement of existing pole lines that are at end of life determined
through EEDO’s asset and risk management process.
The drivers that determine pole line rebuilds within system renewal spending include:
Failure Risk – multiyear planned pole replacement programs that address assets in “very poor” and “poor condition”
FUNDING BY YEAR
2023 2024 2025 2026 2027 TOTAL
Capital Expenditure ($) 1,518,467
External Contribution ($)
Net Capital Cost TOTAL 1,518,467
Capital Addition (%) 100%
Operating Expenditure ($) 0 0 0 0 0 0
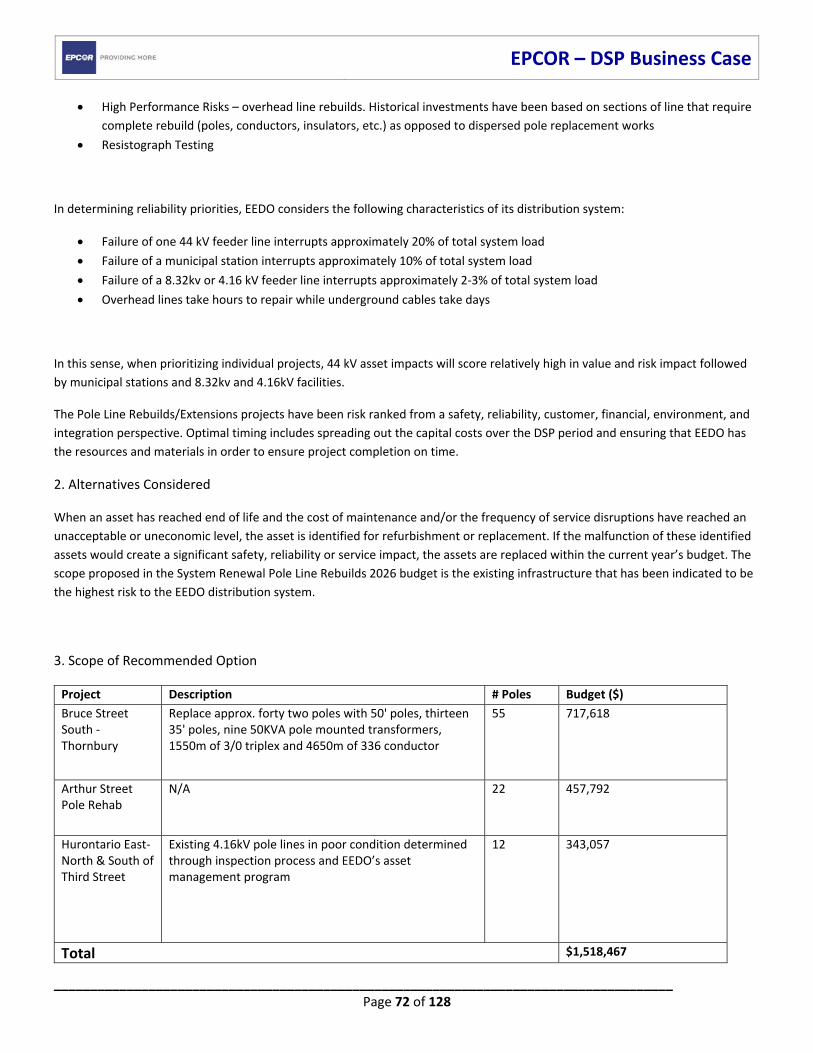
EPCOR – DSP Business Case
_____________________________________________________________________________________ Page 72 of 128
High Performance Risks – overhead line rebuilds. Historical investments have been based on sections of line that require
complete rebuild (poles, conductors, insulators, etc.) as opposed to dispersed pole replacement works
Resistograph Testing
In determining reliability priorities, EEDO considers the following characteristics of its distribution system:
Failure of one 44 kV feeder line interrupts approximately 20% of total system load
Failure of a municipal station interrupts approximately 10% of total system load
Failure of a 8.32kv or 4.16 kV feeder line interrupts approximately 2‐3% of total system load
Overhead lines take hours to repair while underground cables take days
In this sense, when prioritizing individual projects, 44 kV asset impacts will score relatively high in value and risk impact followed
by municipal stations and 8.32kv and 4.16kV facilities.
The Pole Line Rebuilds/Extensions projects have been risk ranked from a safety, reliability, customer, financial, environment, and
integration perspective. Optimal timing includes spreading out the capital costs over the DSP period and ensuring that EEDO has
the resources and materials in order to ensure project completion on time.
2. Alternatives Considered
When an asset has reached end of life and the cost of maintenance and/or the frequency of service disruptions have reached an
unacceptable or uneconomic level, the asset is identified for refurbishment or replacement. If the malfunction of these identified
assets would create a significant safety, reliability or service impact, the assets are replaced within the current year’s budget. The
scope proposed in the System Renewal Pole Line Rebuilds 2026 budget is the existing infrastructure that has been indicated to be
the highest risk to the EEDO distribution system.
3. Scope of Recommended Option
Project Description # Poles Budget ($)
Bruce Street South ‐ Thornbury
Replace approx. forty two poles with 50' poles, thirteen 35' poles, nine 50KVA pole mounted transformers, 1550m of 3/0 triplex and 4650m of 336 conductor
55 717,618
Arthur Street Pole Rehab
N/A 22 457,792
Hurontario East‐ North & South of Third Street
Existing 4.16kV pole lines in poor condition determined through inspection process and EEDO’s asset management program
12 343,057
Total $1,518,467
EPCOR – DSP Business Case
_____________________________________________________________________________________ Page 73 of 128
4. Cost and Cost Basis
Costs have been estimated based on historical experience, high level estimates completed, plus inflationary impacts. Costing has
been evenly spread over the DSP period to ensure EEDO has the resources and materials to ensure project completion on time.
5. Timelines and Milestones
The Planned Pole Line Rebuilds projects are slated to be completed within the System Renewal annual program 2026 budget
year. Historically, construction is mainly completed between May and November due to road restrictions enforced by
municipalities and counties. The engineering and procurement of these projects is be completed in advance to facilitate the
construction of the capital projects.
6. Execution Risks
Reliability Planning – All rebuilds will be completed to current standards for overhead and underground construction
Safety ‐ Poles at End‐Of‐Life represents a safety hazard to staff and the public. End of life status generally implies that pole
structural strength has decreased to levels below the minimum acceptable per CSA Standard for Overhead Construction.
Replacement in accordance with CSA construction standards and in compliance with ESA Reg. 22/04 restores the system to safe
structural and operating condition.
Cost risk is managed by pacing through the forecast period to accommodate annual spending variances in the other investment
categories while maintaining overall budget envelope to maintain current levels of reliability.
Completion risk is mitigated by ensuring EEDO has the resources and materials always available for project completion
7. Preliminary Execution Strategy
Develop a good request for proposal practice and issue out with plenty of lead time. Once the DSP is approved, EEDO will utilize
internal and external sources throughout the 2026 projects from engineering to construction. This will allow EEDO to complete the
system renewal work while maintaining some internal resources to complete system access projects that are driven by customers.
Approvals for system renewal projects are required by the municipalities and counties. These approvals include but are not limited
to municipal consent, road occupancy permit and NVCA permits. These approvals are indicated and completed during the
engineering process of the system renewal projects.
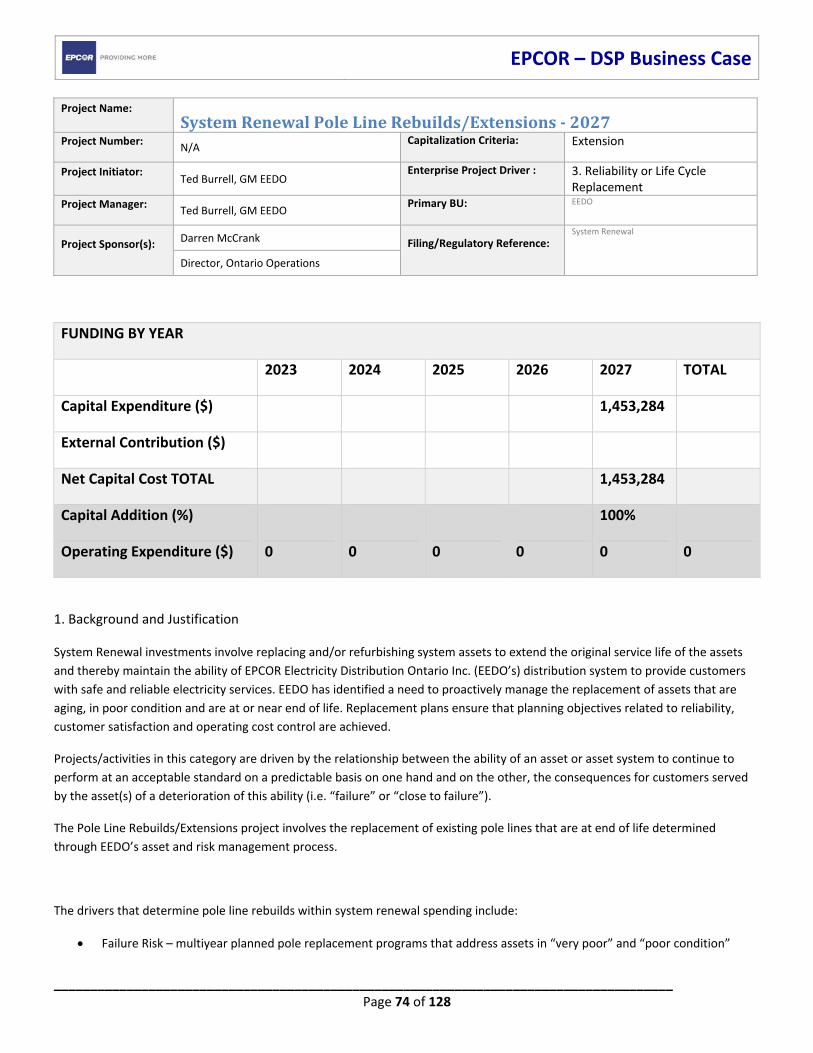
EPCOR – DSP Business Case
_____________________________________________________________________________________ Page 74 of 128
Project Name: SystemRenewalPoleLineRebuilds/Extensions‐2027Project Number:
N/A Capitalization Criteria:
Extension
Project Initiator:
Ted Burrell, GM EEDO Enterprise Project Driver : 3. Reliability or Life Cycle
Replacement Project Manager:
Ted Burrell, GM EEDO Primary BU:
EEDO
Project Sponsor(s):
Darren McCrank Filing/Regulatory Reference:
System Renewal
Director, Ontario Operations
1. Background and Justification
System Renewal investments involve replacing and/or refurbishing system assets to extend the original service life of the assets
and thereby maintain the ability of EPCOR Electricity Distribution Ontario Inc. (EEDO’s) distribution system to provide customers
with safe and reliable electricity services. EEDO has identified a need to proactively manage the replacement of assets that are
aging, in poor condition and are at or near end of life. Replacement plans ensure that planning objectives related to reliability,
customer satisfaction and operating cost control are achieved.
Projects/activities in this category are driven by the relationship between the ability of an asset or asset system to continue to
perform at an acceptable standard on a predictable basis on one hand and on the other, the consequences for customers served
by the asset(s) of a deterioration of this ability (i.e. “failure” or “close to failure”).
The Pole Line Rebuilds/Extensions project involves the replacement of existing pole lines that are at end of life determined
through EEDO’s asset and risk management process.
The drivers that determine pole line rebuilds within system renewal spending include:
Failure Risk – multiyear planned pole replacement programs that address assets in “very poor” and “poor condition”
FUNDING BY YEAR
2023 2024 2025 2026 2027 TOTAL
Capital Expenditure ($) 1,453,284
External Contribution ($)
Net Capital Cost TOTAL 1,453,284
Capital Addition (%) 100%
Operating Expenditure ($) 0 0 0 0 0 0
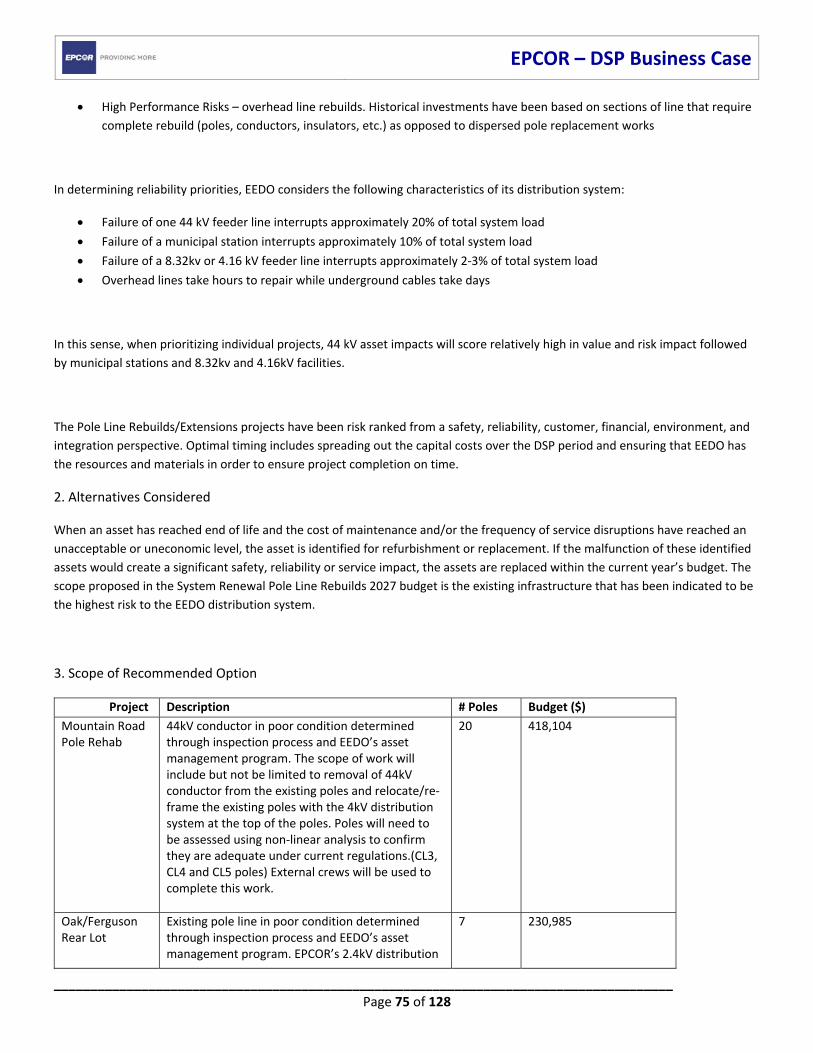
EPCOR – DSP Business Case
_____________________________________________________________________________________ Page 75 of 128
High Performance Risks – overhead line rebuilds. Historical investments have been based on sections of line that require
complete rebuild (poles, conductors, insulators, etc.) as opposed to dispersed pole replacement works
In determining reliability priorities, EEDO considers the following characteristics of its distribution system:
Failure of one 44 kV feeder line interrupts approximately 20% of total system load
Failure of a municipal station interrupts approximately 10% of total system load
Failure of a 8.32kv or 4.16 kV feeder line interrupts approximately 2‐3% of total system load
Overhead lines take hours to repair while underground cables take days
In this sense, when prioritizing individual projects, 44 kV asset impacts will score relatively high in value and risk impact followed
by municipal stations and 8.32kv and 4.16kV facilities.
The Pole Line Rebuilds/Extensions projects have been risk ranked from a safety, reliability, customer, financial, environment, and
integration perspective. Optimal timing includes spreading out the capital costs over the DSP period and ensuring that EEDO has
the resources and materials in order to ensure project completion on time.
2. Alternatives Considered
When an asset has reached end of life and the cost of maintenance and/or the frequency of service disruptions have reached an
unacceptable or uneconomic level, the asset is identified for refurbishment or replacement. If the malfunction of these identified
assets would create a significant safety, reliability or service impact, the assets are replaced within the current year’s budget. The
scope proposed in the System Renewal Pole Line Rebuilds 2027 budget is the existing infrastructure that has been indicated to be
the highest risk to the EEDO distribution system.
3. Scope of Recommended Option
Project Description # Poles Budget ($)
Mountain Road Pole Rehab
44kV conductor in poor condition determined through inspection process and EEDO’s asset management program. The scope of work will include but not be limited to removal of 44kV conductor from the existing poles and relocate/re‐frame the existing poles with the 4kV distribution system at the top of the poles. Poles will need to be assessed using non‐linear analysis to confirm they are adequate under current regulations.(CL3, CL4 and CL5 poles) External crews will be used to complete this work.
20 418,104
Oak/Ferguson Rear Lot
Existing pole line in poor condition determined through inspection process and EEDO’s asset management program. EPCOR’s 2.4kV distribution
7 230,985
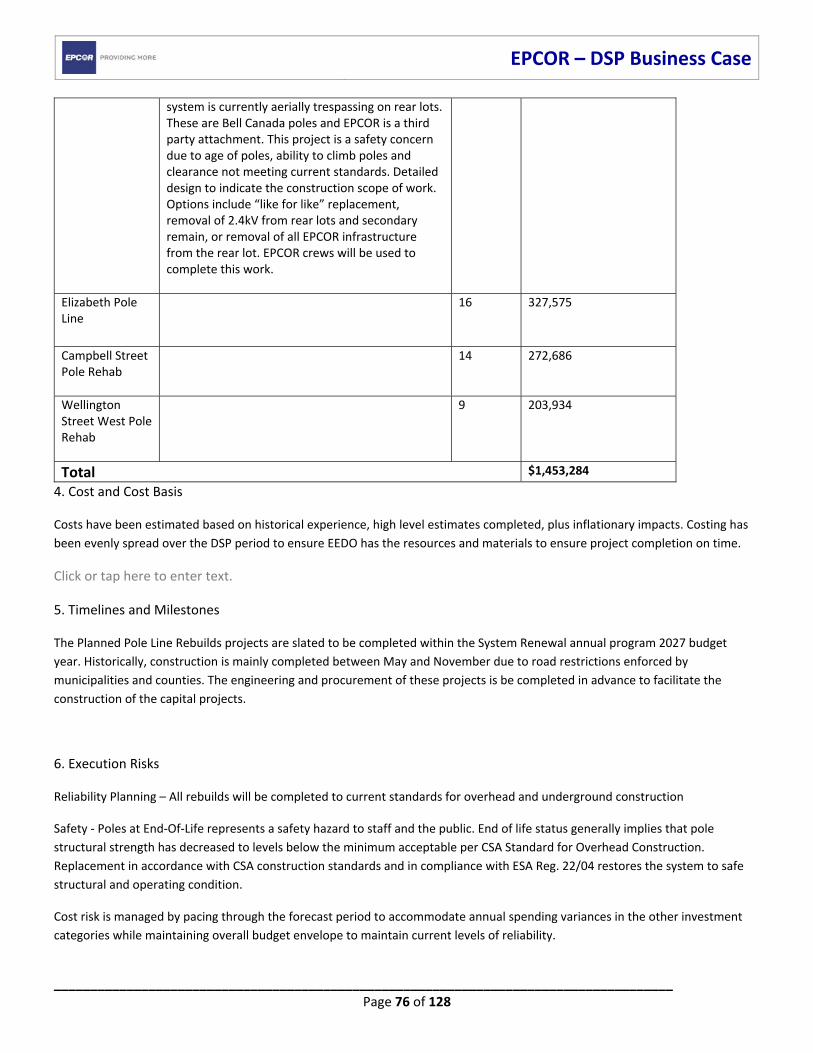
EPCOR – DSP Business Case
_____________________________________________________________________________________ Page 76 of 128
system is currently aerially trespassing on rear lots. These are Bell Canada poles and EPCOR is a third party attachment. This project is a safety concern due to age of poles, ability to climb poles and clearance not meeting current standards. Detailed design to indicate the construction scope of work. Options include “like for like” replacement, removal of 2.4kV from rear lots and secondary remain, or removal of all EPCOR infrastructure from the rear lot. EPCOR crews will be used to complete this work.
Elizabeth Pole Line
16 327,575
Campbell Street Pole Rehab
14 272,686
Wellington Street West Pole Rehab
9 203,934
Total $1,453,284
4. Cost and Cost Basis
Costs have been estimated based on historical experience, high level estimates completed, plus inflationary impacts. Costing has
been evenly spread over the DSP period to ensure EEDO has the resources and materials to ensure project completion on time.
Click or tap here to enter text.
5. Timelines and Milestones
The Planned Pole Line Rebuilds projects are slated to be completed within the System Renewal annual program 2027 budget
year. Historically, construction is mainly completed between May and November due to road restrictions enforced by
municipalities and counties. The engineering and procurement of these projects is be completed in advance to facilitate the
construction of the capital projects.
6. Execution Risks
Reliability Planning – All rebuilds will be completed to current standards for overhead and underground construction
Safety ‐ Poles at End‐Of‐Life represents a safety hazard to staff and the public. End of life status generally implies that pole
structural strength has decreased to levels below the minimum acceptable per CSA Standard for Overhead Construction.
Replacement in accordance with CSA construction standards and in compliance with ESA Reg. 22/04 restores the system to safe
structural and operating condition.
Cost risk is managed by pacing through the forecast period to accommodate annual spending variances in the other investment
categories while maintaining overall budget envelope to maintain current levels of reliability.
EPCOR – DSP Business Case
_____________________________________________________________________________________ Page 77 of 128
Completion risk is mitigated by ensuring EEDO has the resources and materials always available for project completion
7. Preliminary Execution Strategy
Develop a good request for proposal practice and issue out with plenty of lead time. Once the DSP is approved, EEDO will utilize
internal and external sources throughout the 2027 projects from engineering to construction. This will allow EEDO to complete the
system renewal work while maintaining some internal resources to complete system access projects that are driven by customers.
Approvals for system renewal projects are required by the municipalities and counties. These approvals include but are not limited
to municipal consent, road occupancy permit and NVCA permits. These approvals are indicated and completed during the
engineering process of the system renewal projects.
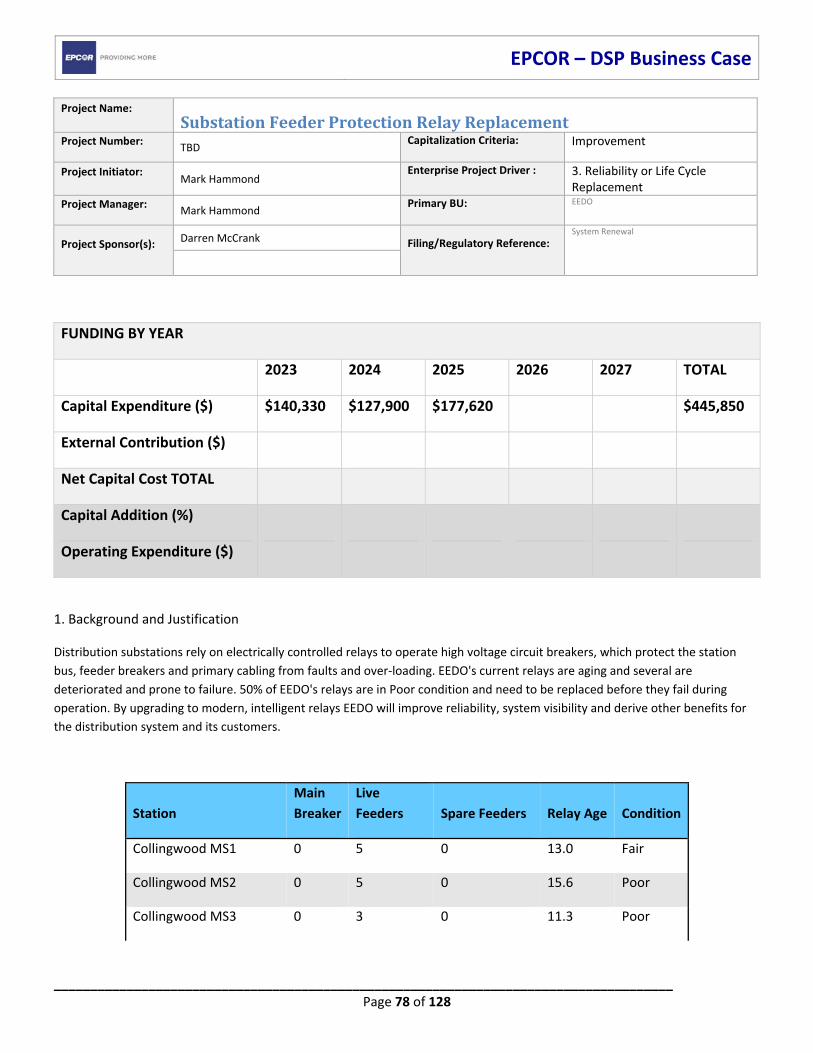
EPCOR – DSP Business Case
_____________________________________________________________________________________ Page 78 of 128
Project Name: SubstationFeederProtectionRelayReplacementProject Number:
TBD Capitalization Criteria:
Improvement
Project Initiator:
Mark Hammond Enterprise Project Driver : 3. Reliability or Life Cycle
Replacement Project Manager:
Mark Hammond Primary BU:
EEDO
Project Sponsor(s):
Darren McCrank Filing/Regulatory Reference:
System Renewal
1. Background and Justification
Distribution substations rely on electrically controlled relays to operate high voltage circuit breakers, which protect the station
bus, feeder breakers and primary cabling from faults and over‐loading. EEDO's current relays are aging and several are
deteriorated and prone to failure. 50% of EEDO's relays are in Poor condition and need to be replaced before they fail during
operation. By upgrading to modern, intelligent relays EEDO will improve reliability, system visibility and derive other benefits for
the distribution system and its customers.
Station
Main
Breaker
Live
Feeders Spare Feeders Relay Age Condition
Collingwood MS1 0 5 0 13.0 Fair
Collingwood MS2 0 5 0 15.6 Poor
Collingwood MS3 0 3 0 11.3 Poor
FUNDING BY YEAR
2023 2024 2025 2026 2027 TOTAL
Capital Expenditure ($) $140,330 $127,900 $177,620 $445,850
External Contribution ($)
Net Capital Cost TOTAL
Capital Addition (%)
Operating Expenditure ($)
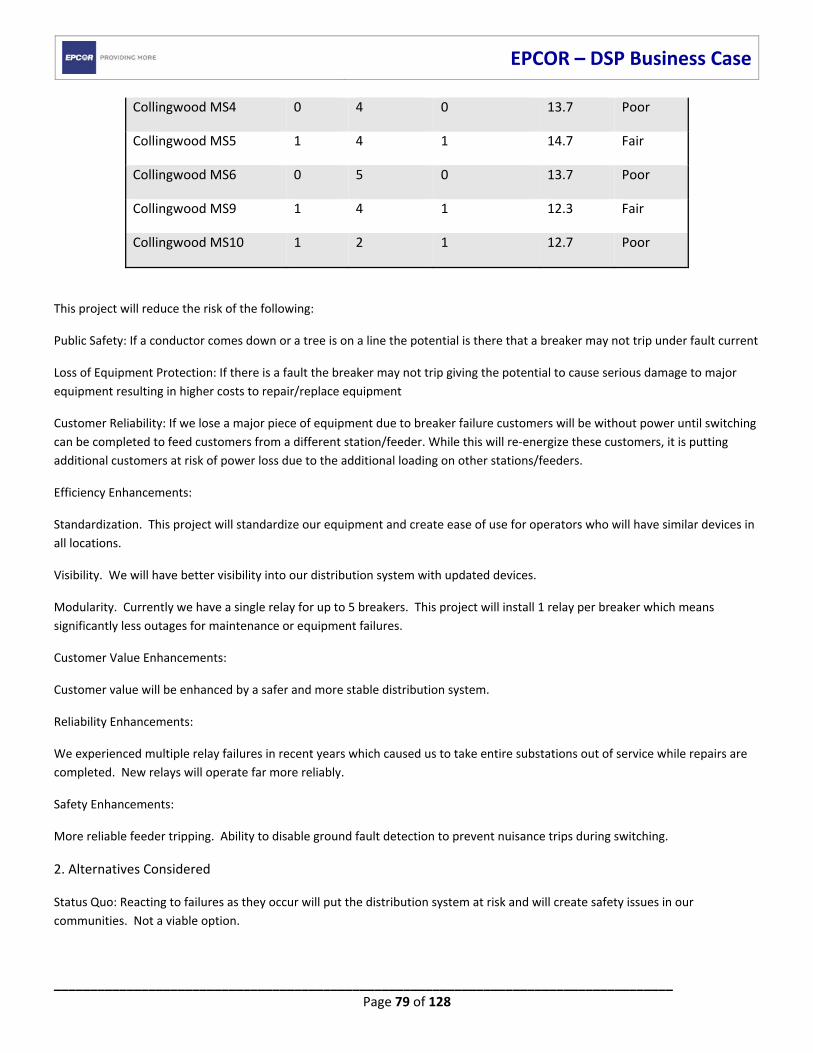
EPCOR – DSP Business Case
_____________________________________________________________________________________ Page 79 of 128
Collingwood MS4 0 4 0 13.7 Poor
Collingwood MS5 1 4 1 14.7 Fair
Collingwood MS6 0 5 0 13.7 Poor
Collingwood MS9 1 4 1 12.3 Fair
Collingwood MS10 1 2 1 12.7 Poor
This project will reduce the risk of the following:
Public Safety: If a conductor comes down or a tree is on a line the potential is there that a breaker may not trip under fault current
Loss of Equipment Protection: If there is a fault the breaker may not trip giving the potential to cause serious damage to major
equipment resulting in higher costs to repair/replace equipment
Customer Reliability: If we lose a major piece of equipment due to breaker failure customers will be without power until switching
can be completed to feed customers from a different station/feeder. While this will re‐energize these customers, it is putting
additional customers at risk of power loss due to the additional loading on other stations/feeders.
Efficiency Enhancements:
Standardization. This project will standardize our equipment and create ease of use for operators who will have similar devices in
all locations.
Visibility. We will have better visibility into our distribution system with updated devices.
Modularity. Currently we have a single relay for up to 5 breakers. This project will install 1 relay per breaker which means
significantly less outages for maintenance or equipment failures.
Customer Value Enhancements:
Customer value will be enhanced by a safer and more stable distribution system.
Reliability Enhancements:
We experienced multiple relay failures in recent years which caused us to take entire substations out of service while repairs are
completed. New relays will operate far more reliably.
Safety Enhancements:
More reliable feeder tripping. Ability to disable ground fault detection to prevent nuisance trips during switching.
2. Alternatives Considered
Status Quo: Reacting to failures as they occur will put the distribution system at risk and will create safety issues in our
communities. Not a viable option.
EPCOR – DSP Business Case
_____________________________________________________________________________________ Page 80 of 128
Pro‐actively replace the DSP modules: These modules are prone to failure and can be pro‐actively replaced. Given the age of the
relays we prefer not to continue to invest in these old units. They are due for lifecycle replacement.
3. Scope of Recommended Option
The replacement program will be delivered over the first 3 years of this filing period at the end of which, EEDO will have an
entirely modern feeder protection system in place. We are going to replace 2 stations each year in order of condition and age.
4. Cost and Cost Basis
Amounts are based on budgetary estimates for industry standard solutions obtained from reputable contractors and include
EEDO’s own costs.
5. Timelines and Milestones
The project will be completed in 2025.
6. Execution Risks
This project is to reduce or eliminate risks that currently exist. This far outweighs the risks of implementation which include:
System Capacity: Stations will need to be out of service during the work resulting in increased load on the rest of the system.
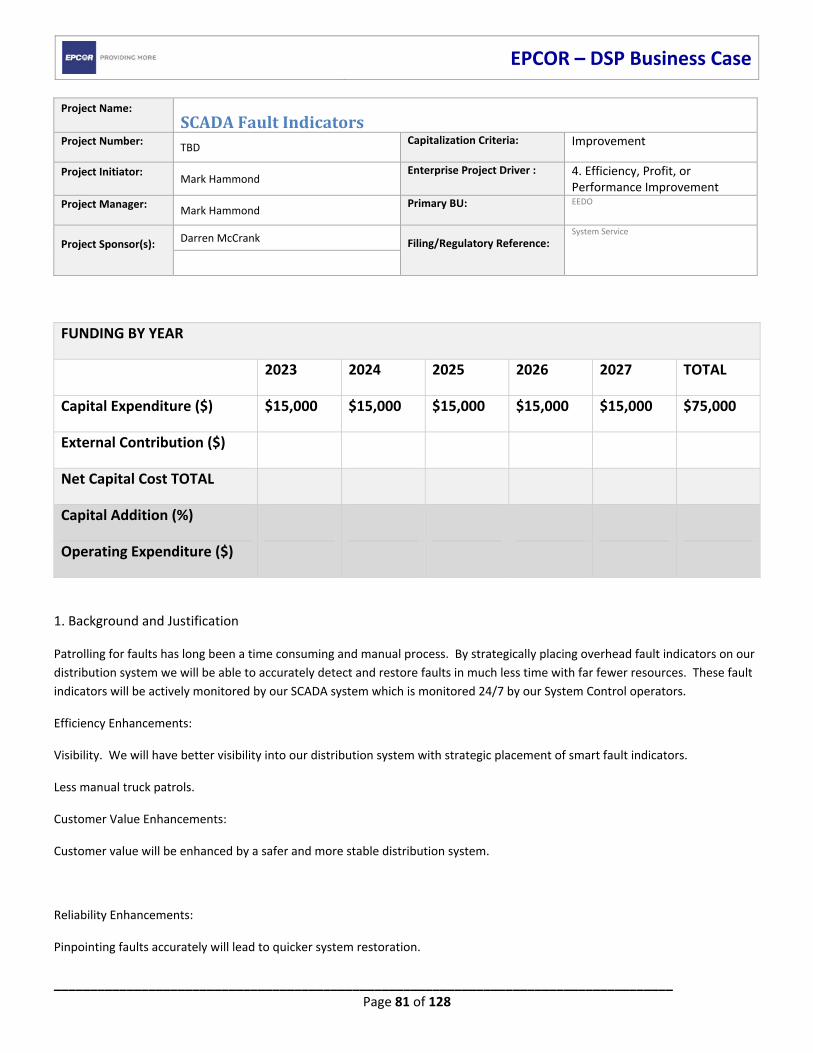
EPCOR – DSP Business Case
_____________________________________________________________________________________ Page 81 of 128
Project Name: SCADAFaultIndicatorsProject Number:
TBD Capitalization Criteria:
Improvement
Project Initiator:
Mark Hammond Enterprise Project Driver : 4. Efficiency, Profit, or
Performance Improvement Project Manager:
Mark Hammond Primary BU:
EEDO
Project Sponsor(s):
Darren McCrank Filing/Regulatory Reference:
System Service
1. Background and Justification
Patrolling for faults has long been a time consuming and manual process. By strategically placing overhead fault indicators on our
distribution system we will be able to accurately detect and restore faults in much less time with far fewer resources. These fault
indicators will be actively monitored by our SCADA system which is monitored 24/7 by our System Control operators.
Efficiency Enhancements:
Visibility. We will have better visibility into our distribution system with strategic placement of smart fault indicators.
Less manual truck patrols.
Customer Value Enhancements:
Customer value will be enhanced by a safer and more stable distribution system.
Reliability Enhancements:
Pinpointing faults accurately will lead to quicker system restoration.
FUNDING BY YEAR
2023 2024 2025 2026 2027 TOTAL
Capital Expenditure ($) $15,000 $15,000 $15,000 $15,000 $15,000 $75,000
External Contribution ($)
Net Capital Cost TOTAL
Capital Addition (%)
Operating Expenditure ($)
EPCOR – DSP Business Case
_____________________________________________________________________________________ Page 82 of 128
Safety Enhancements:
Downed wires will be identified faster so crews can arrive sooner to make the area safe.
2. Alternatives Considered
Status Quo: Keep patrolling. Effective but time consuming and results in longer customer outages.
Non SCADA Fault Indicators: These devices are installed overhead and visibly indicate when they detect faults. This helps when
manually patrolling but doesn’t eliminate the requirement for patrols.
3. Scope of Recommended Option
The program will be delivered over all 5 years of this filing period at the end of which, EEDO will have our entire distribution
system blanketed with fault indicators.
4. Cost and Cost Basis
Amounts are based on budgetary estimates for industry standard solutions obtained from reputable contractors and include
EEDO’s own costs.
5. Timelines and Milestones
The project will be completed in 2027.
6. Execution Risks
This project is to reduce or eliminate risks that currently exist. This far outweighs the risks of implementation.
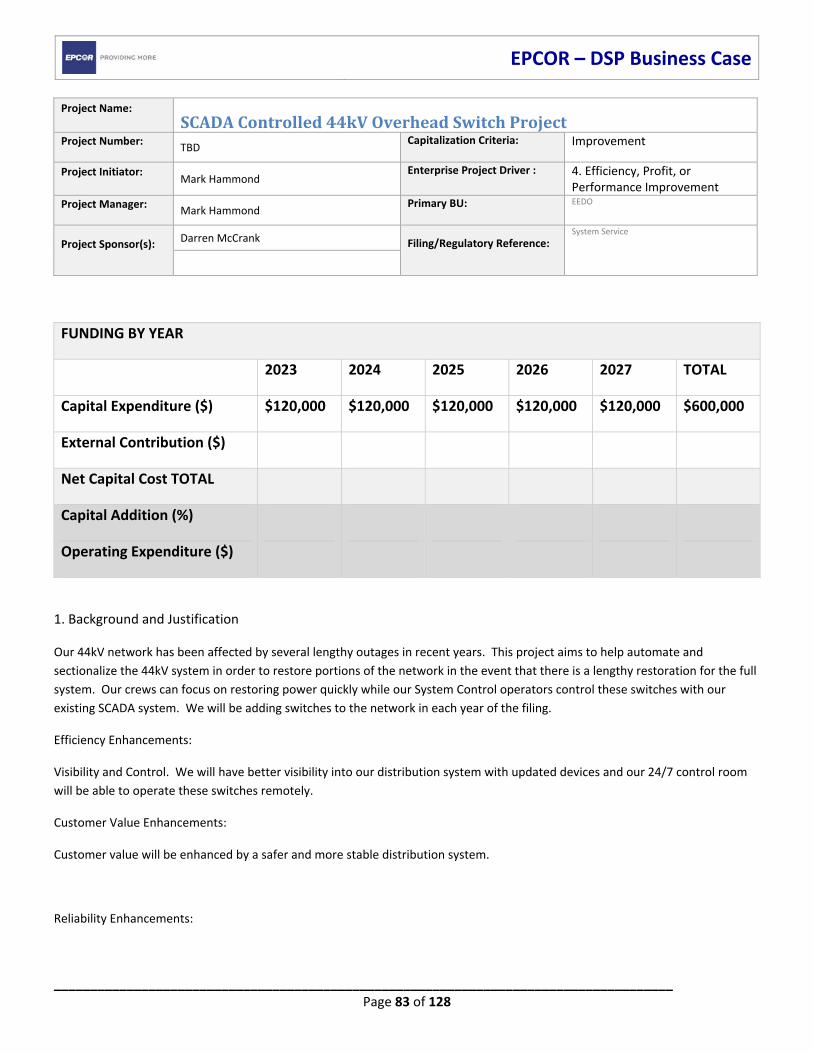
EPCOR – DSP Business Case
_____________________________________________________________________________________ Page 83 of 128
Project Name: SCADAControlled44kVOverheadSwitchProjectProject Number:
TBD Capitalization Criteria:
Improvement
Project Initiator:
Mark Hammond Enterprise Project Driver : 4. Efficiency, Profit, or
Performance Improvement Project Manager:
Mark Hammond Primary BU:
EEDO
Project Sponsor(s):
Darren McCrank Filing/Regulatory Reference:
System Service
1. Background and Justification
Our 44kV network has been affected by several lengthy outages in recent years. This project aims to help automate and
sectionalize the 44kV system in order to restore portions of the network in the event that there is a lengthy restoration for the full
system. Our crews can focus on restoring power quickly while our System Control operators control these switches with our
existing SCADA system. We will be adding switches to the network in each year of the filing.
Efficiency Enhancements:
Visibility and Control. We will have better visibility into our distribution system with updated devices and our 24/7 control room
will be able to operate these switches remotely.
Customer Value Enhancements:
Customer value will be enhanced by a safer and more stable distribution system.
Reliability Enhancements:
FUNDING BY YEAR
2023 2024 2025 2026 2027 TOTAL
Capital Expenditure ($) $120,000 $120,000 $120,000 $120,000 $120,000 $600,000
External Contribution ($)
Net Capital Cost TOTAL
Capital Addition (%)
Operating Expenditure ($)
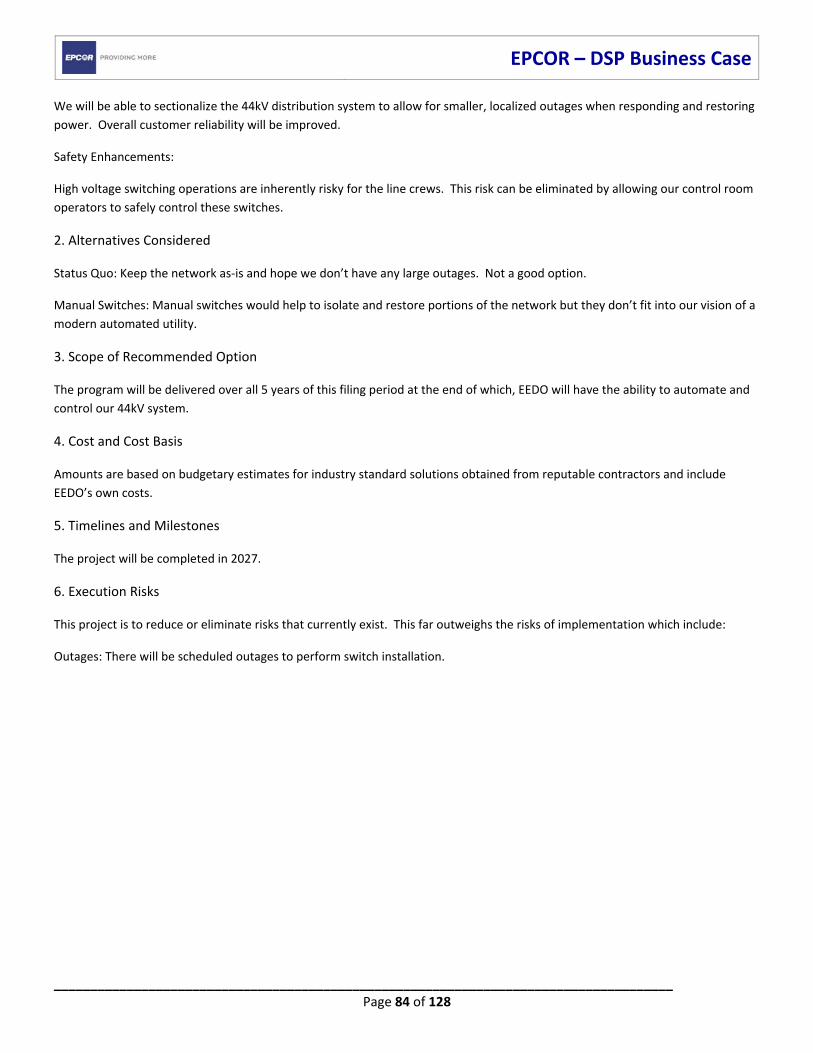
EPCOR – DSP Business Case
_____________________________________________________________________________________ Page 84 of 128
We will be able to sectionalize the 44kV distribution system to allow for smaller, localized outages when responding and restoring
power. Overall customer reliability will be improved.
Safety Enhancements:
High voltage switching operations are inherently risky for the line crews. This risk can be eliminated by allowing our control room
operators to safely control these switches.
2. Alternatives Considered
Status Quo: Keep the network as‐is and hope we don’t have any large outages. Not a good option.
Manual Switches: Manual switches would help to isolate and restore portions of the network but they don’t fit into our vision of a
modern automated utility.
3. Scope of Recommended Option
The program will be delivered over all 5 years of this filing period at the end of which, EEDO will have the ability to automate and
control our 44kV system.
4. Cost and Cost Basis
Amounts are based on budgetary estimates for industry standard solutions obtained from reputable contractors and include
EEDO’s own costs.
5. Timelines and Milestones
The project will be completed in 2027.
6. Execution Risks
This project is to reduce or eliminate risks that currently exist. This far outweighs the risks of implementation which include:
Outages: There will be scheduled outages to perform switch installation.
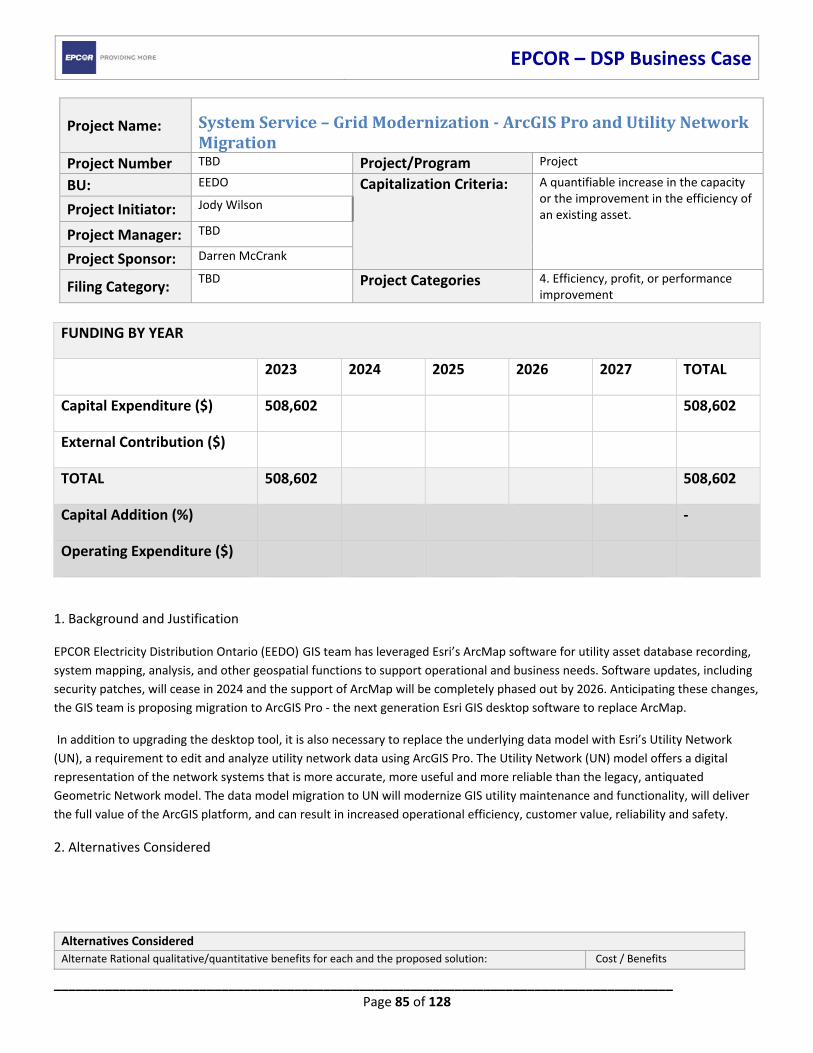
EPCOR – DSP Business Case
_____________________________________________________________________________________ Page 85 of 128
Project Name: SystemService–GridModernization‐ArcGISProandUtilityNetworkMigration
Project Number TBD Project/Program Project
BU: EEDO Capitalization Criteria:
A quantifiable increase in the capacity or the improvement in the efficiency of an existing asset.
Project Initiator: Jody Wilson
Project Manager: TBD
Project Sponsor: Darren McCrank
Filing Category: TBD Project Categories 4. Efficiency, profit, or performance
improvement
1. Background and Justification
EPCOR Electricity Distribution Ontario (EEDO) GIS team has leveraged Esri’s ArcMap software for utility asset database recording,
system mapping, analysis, and other geospatial functions to support operational and business needs. Software updates, including
security patches, will cease in 2024 and the support of ArcMap will be completely phased out by 2026. Anticipating these changes,
the GIS team is proposing migration to ArcGIS Pro ‐ the next generation Esri GIS desktop software to replace ArcMap.
In addition to upgrading the desktop tool, it is also necessary to replace the underlying data model with Esri’s Utility Network
(UN), a requirement to edit and analyze utility network data using ArcGIS Pro. The Utility Network (UN) model offers a digital
representation of the network systems that is more accurate, more useful and more reliable than the legacy, antiquated
Geometric Network model. The data model migration to UN will modernize GIS utility maintenance and functionality, will deliver
the full value of the ArcGIS platform, and can result in increased operational efficiency, customer value, reliability and safety.
2. Alternatives Considered
Alternatives Considered
Alternate Rational qualitative/quantitative benefits for each and the proposed solution: Cost / Benefits
FUNDING BY YEAR
2023 2024 2025 2026 2027 TOTAL
Capital Expenditure ($) 508,602 508,602
External Contribution ($)
TOTAL 508,602 508,602
Capital Addition (%) ‐
Operating Expenditure ($)
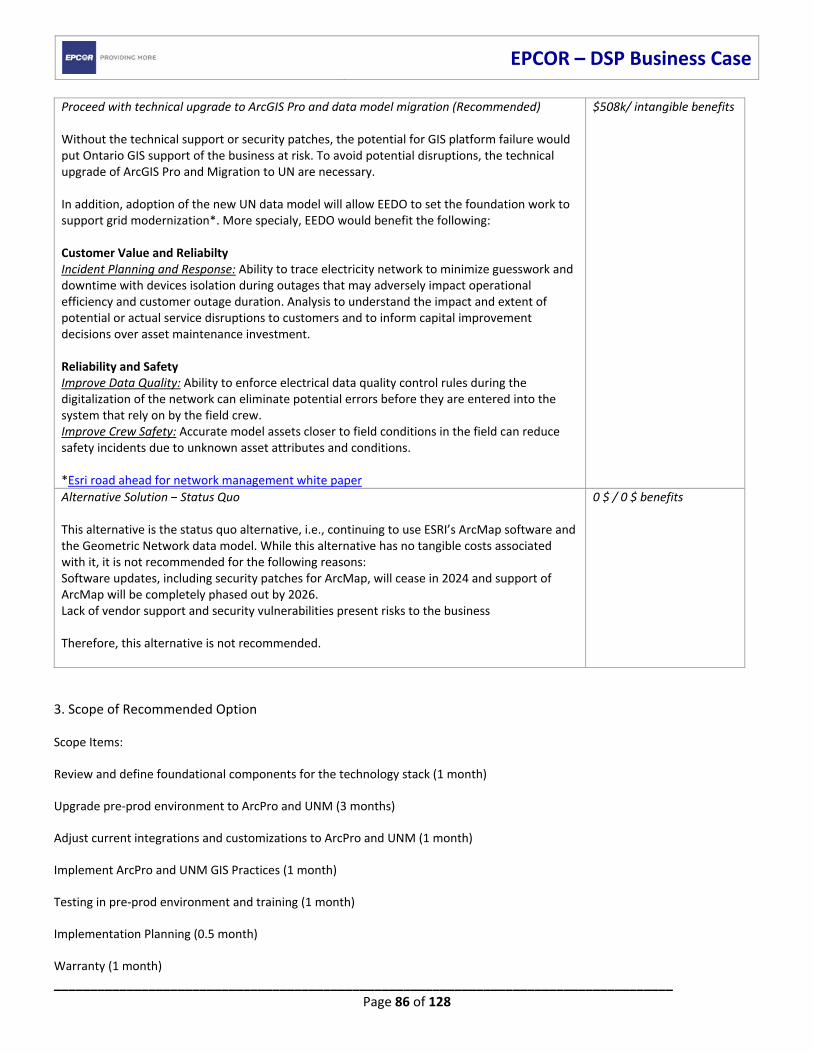
EPCOR – DSP Business Case
_____________________________________________________________________________________ Page 86 of 128
Proceed with technical upgrade to ArcGIS Pro and data model migration (Recommended) Without the technical support or security patches, the potential for GIS platform failure would put Ontario GIS support of the business at risk. To avoid potential disruptions, the technical upgrade of ArcGIS Pro and Migration to UN are necessary. In addition, adoption of the new UN data model will allow EEDO to set the foundation work to support grid modernization*. More specialy, EEDO would benefit the following: Customer Value and Reliabilty Incident Planning and Response: Ability to trace electricity network to minimize guesswork and downtime with devices isolation during outages that may adversely impact operational efficiency and customer outage duration. Analysis to understand the impact and extent of potential or actual service disruptions to customers and to inform capital improvement decisions over asset maintenance investment. Reliability and Safety Improve Data Quality: Ability to enforce electrical data quality control rules during the digitalization of the network can eliminate potential errors before they are entered into the system that rely on by the field crew. Improve Crew Safety: Accurate model assets closer to field conditions in the field can reduce safety incidents due to unknown asset attributes and conditions. *Esri road ahead for network management white paper
$508k/ intangible benefits
Alternative Solution – Status Quo This alternative is the status quo alternative, i.e., continuing to use ESRI’s ArcMap software and the Geometric Network data model. While this alternative has no tangible costs associated with it, it is not recommended for the following reasons: Software updates, including security patches for ArcMap, will cease in 2024 and support of ArcMap will be completely phased out by 2026. Lack of vendor support and security vulnerabilities present risks to the business Therefore, this alternative is not recommended.
0 $ / 0 $ benefits
3. Scope of Recommended Option
Scope Items:
Review and define foundational components for the technology stack (1 month)
Upgrade pre‐prod environment to ArcPro and UNM (3 months)
Adjust current integrations and customizations to ArcPro and UNM (1 month)
Implement ArcPro and UNM GIS Practices (1 month)
Testing in pre‐prod environment and training (1 month)
Implementation Planning (0.5 month)
Warranty (1 month)
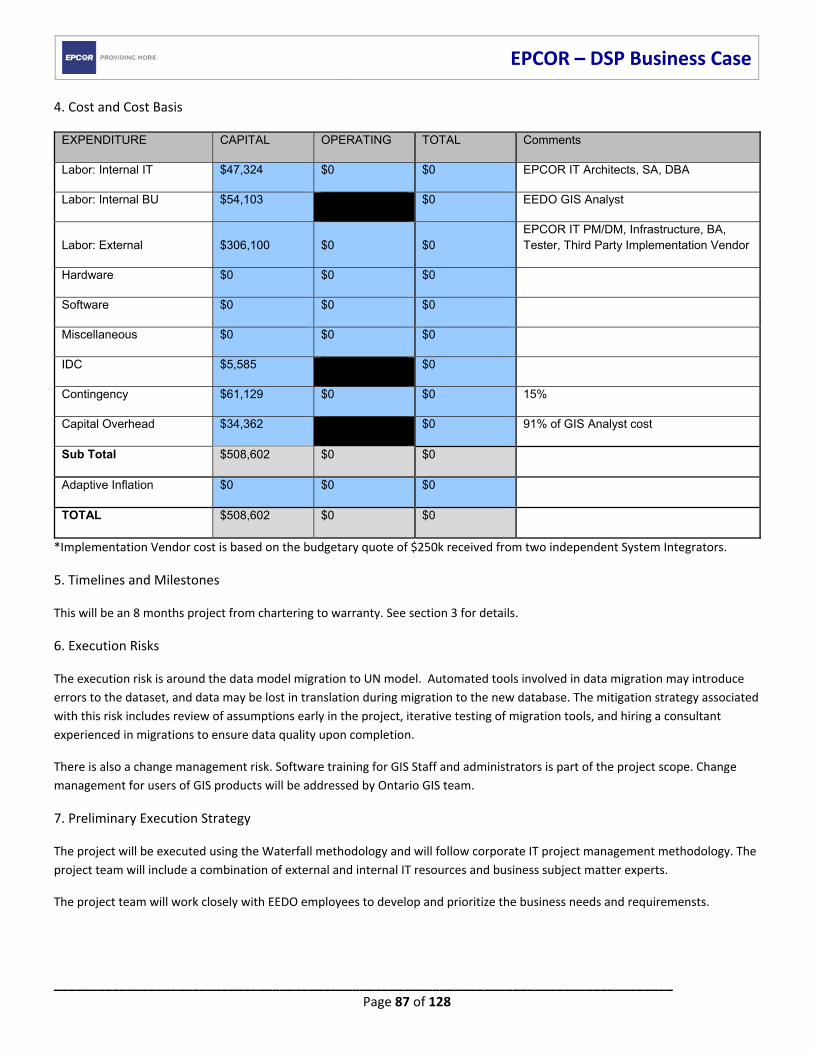
EPCOR – DSP Business Case
_____________________________________________________________________________________ Page 87 of 128
4. Cost and Cost Basis
EXPENDITURE CAPITAL OPERATING TOTAL Comments
Labor: Internal IT $47,324 $0 $0 EPCOR IT Architects, SA, DBA
Labor: Internal BU $54,103 $0 EEDO GIS Analyst
Labor: External $306,100 $0 $0 EPCOR IT PM/DM, Infrastructure, BA, Tester, Third Party Implementation Vendor
Hardware $0 $0 $0
Software $0 $0 $0
Miscellaneous $0 $0 $0
IDC $5,585 $0
Contingency $61,129 $0 $0 15%
Capital Overhead $34,362 $0 91% of GIS Analyst cost
Sub Total $508,602 $0 $0
Adaptive Inflation $0 $0 $0
TOTAL $508,602 $0 $0
*Implementation Vendor cost is based on the budgetary quote of $250k received from two independent System Integrators.
5. Timelines and Milestones
This will be an 8 months project from chartering to warranty. See section 3 for details.
6. Execution Risks
The execution risk is around the data model migration to UN model. Automated tools involved in data migration may introduce
errors to the dataset, and data may be lost in translation during migration to the new database. The mitigation strategy associated
with this risk includes review of assumptions early in the project, iterative testing of migration tools, and hiring a consultant
experienced in migrations to ensure data quality upon completion.
There is also a change management risk. Software training for GIS Staff and administrators is part of the project scope. Change
management for users of GIS products will be addressed by Ontario GIS team.
7. Preliminary Execution Strategy
The project will be executed using the Waterfall methodology and will follow corporate IT project management methodology. The
project team will include a combination of external and internal IT resources and business subject matter experts.
The project team will work closely with EEDO employees to develop and prioritize the business needs and requiremensts.
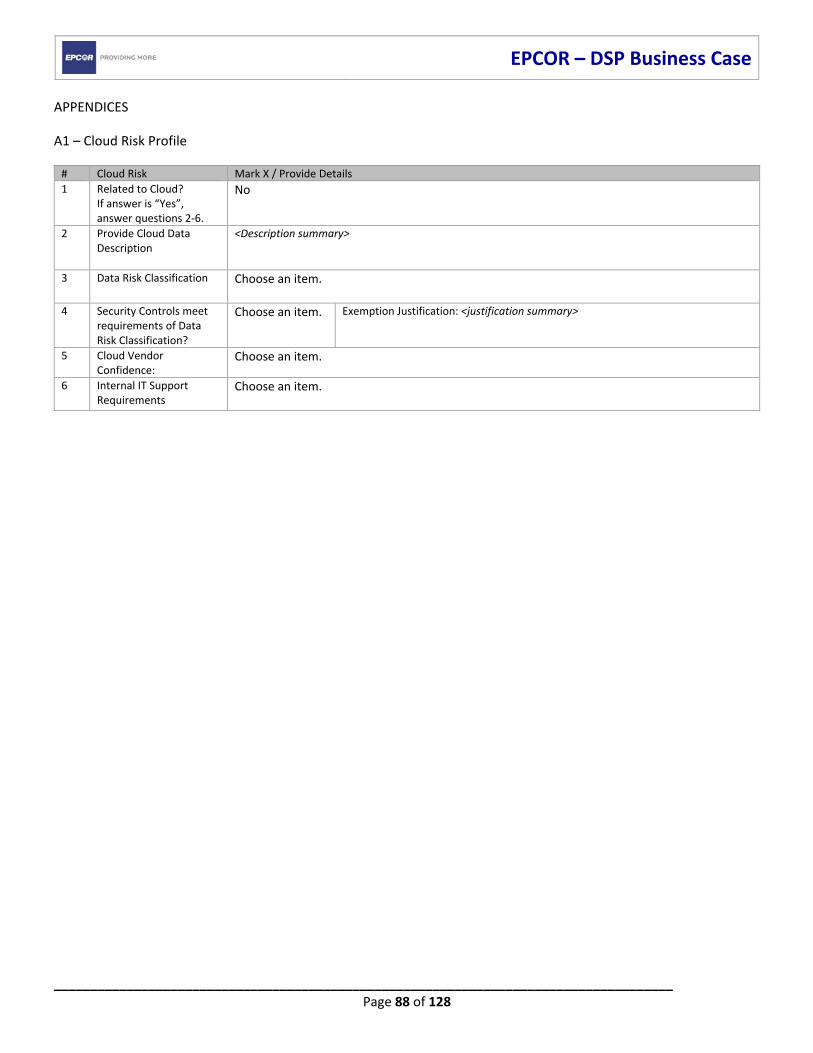
EPCOR – DSP Business Case
_____________________________________________________________________________________ Page 88 of 128
APPENDICES
A1 – Cloud Risk Profile
# Cloud Risk Mark X / Provide Details
1 Related to Cloud? If answer is “Yes”, answer questions 2‐6.
No
2 Provide Cloud Data Description
<Description summary>
3 Data Risk Classification Choose an item.
4 Security Controls meet requirements of Data Risk Classification?
Choose an item.
Exemption Justification: <justification summary>
5 Cloud Vendor Confidence:
Choose an item.
6 Internal IT Support Requirements
Choose an item.
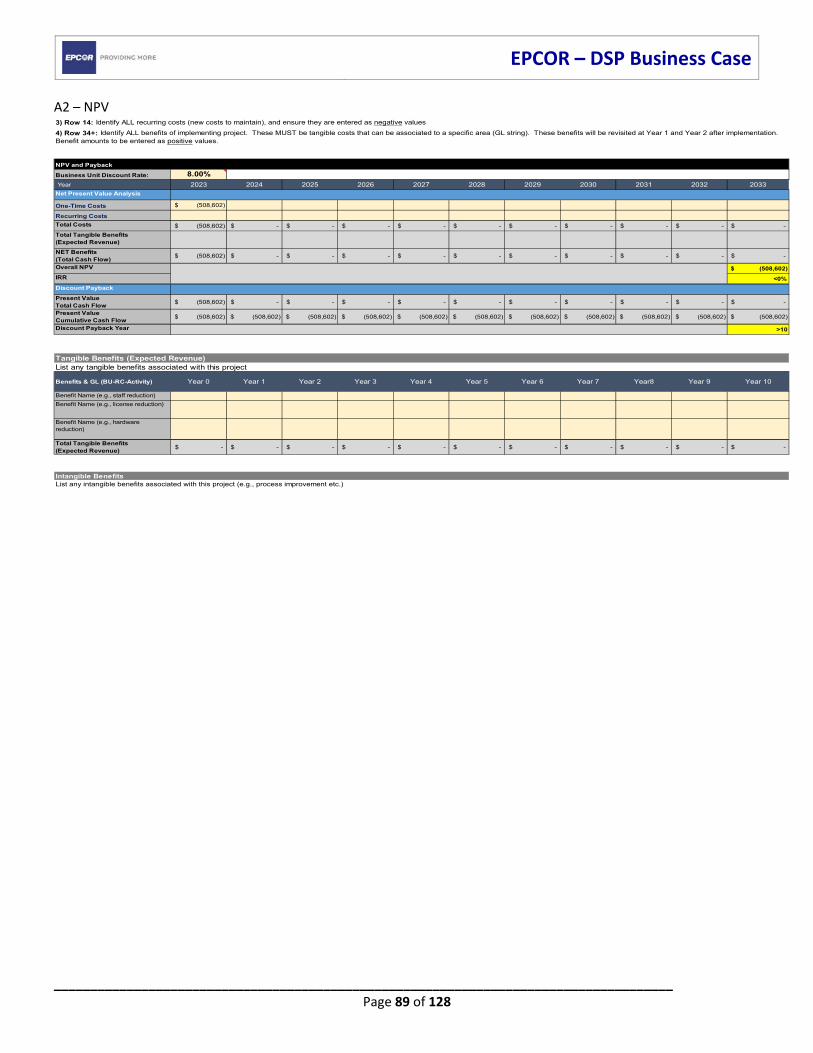
EPCOR – DSP Business Case
_____________________________________________________________________________________ Page 89 of 128
A2 – NPV
NPV and Payback
Business Unit Discount Rate: 8.00%
Year 2023 2024 2025 2026 2027 2028 2029 2030 2031 2032 2033Net Present Value Analysis
One-Time Costs (508,602)$
Recurring Costs
Total Costs (508,602)$ -$ -$ -$ -$ -$ -$ -$ -$ -$ -$
Total Tangible Benefits (Expected Revenue)
NET Benefits (Total Cash Flow)
(508,602)$ -$ -$ -$ -$ -$ -$ -$ -$ -$ -$
Overall NPV (508,602)$
IRR <0%
Discount Payback
Present Value Total Cash Flow
(508,602)$ -$ -$ -$ -$ -$ -$ -$ -$ -$ -$
Present Value Cumulative Cash Flow
(508,602)$ (508,602)$ (508,602)$ (508,602)$ (508,602)$ (508,602)$ (508,602)$ (508,602)$ (508,602)$ (508,602)$ (508,602)$
Discount Payback Year >10
Tangible Benefits (Expected Revenue)List any tangible benefits associated with this project
Benefits & GL (BU-RC-Activity) Year 0 Year 1 Year 2 Year 3 Year 4 Year 5 Year 6 Year 7 Year8 Year 9 Year 10
Benefit Name (e.g., staff reduction)
Benefit Name (e.g., license reduction)
Benefit Name (e.g., hardware reduction)
Total Tangible Benefits (Expected Revenue)
-$ -$ -$ -$ -$ -$ -$ -$ -$ -$ -$
Intangible BenefitsList any intangible benefits associated with this project (e.g., process improvement etc.)
3) Row 14: Identify ALL recurring costs (new costs to maintain), and ensure they are entered as negative values
4) Row 34+: Identify ALL benefits of implementing project. These MUST be tangible costs that can be associated to a specific area (GL string). These benefits will be revisited at Year 1 and Year 2 after implementation. Benefit amounts to be entered as positive values.
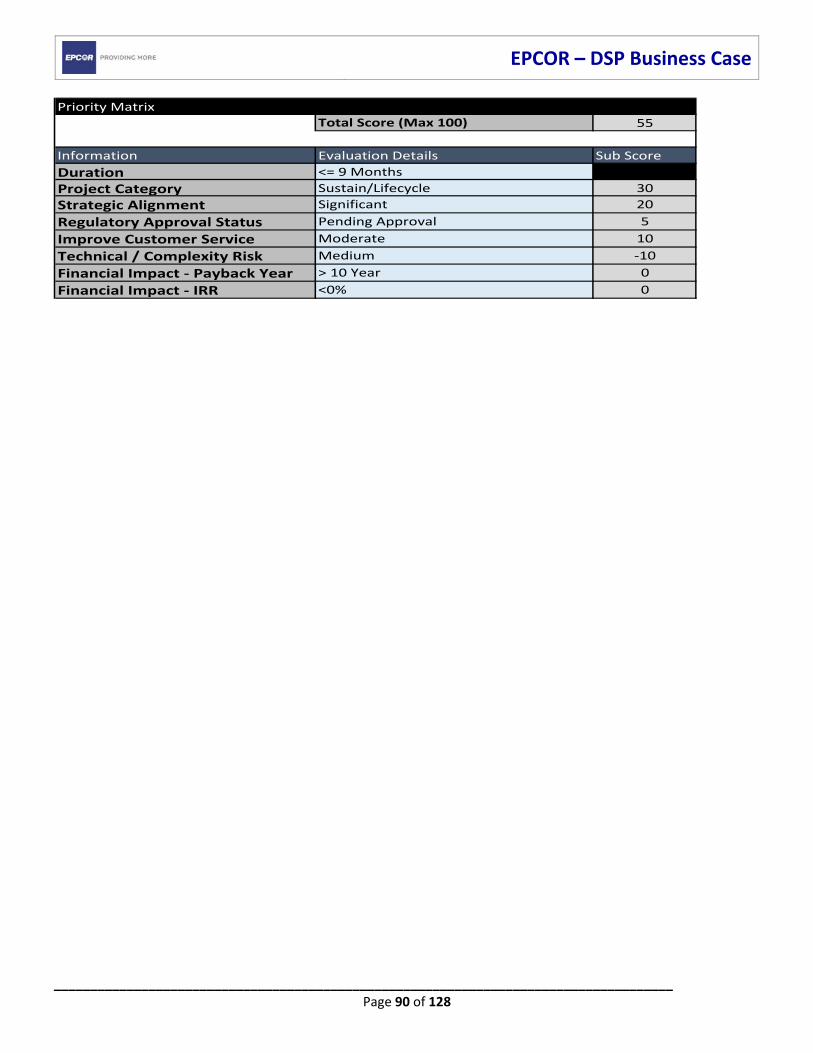
EPCOR – DSP Business Case
_____________________________________________________________________________________ Page 90 of 128
Priority Matrix
Total Score (Max 100) 55
Information Evaluation Details Sub Score
Duration <= 9 Months
Project Category Sustain/Lifecycle 30
Strategic Alignment Significant 20
Regulatory Approval Status Pending Approval 5
Improve Customer Service Moderate 10
Technical / Complexity Risk Medium ‐10
Financial Impact ‐ Payback Year > 10 Year 0
Financial Impact ‐ IRR <0% 0
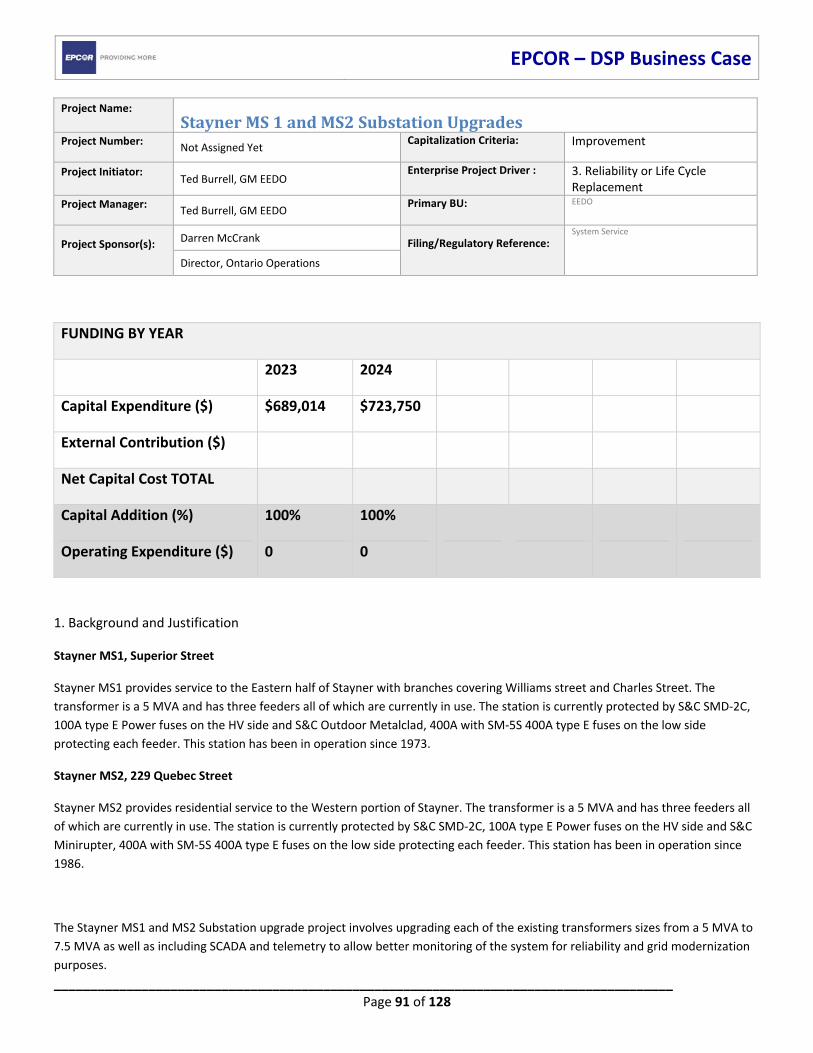
EPCOR – DSP Business Case
_____________________________________________________________________________________ Page 91 of 128
Project Name: StaynerMS1andMS2SubstationUpgradesProject Number:
Not Assigned Yet Capitalization Criteria:
Improvement
Project Initiator:
Ted Burrell, GM EEDO Enterprise Project Driver : 3. Reliability or Life Cycle
Replacement Project Manager:
Ted Burrell, GM EEDO Primary BU:
EEDO
Project Sponsor(s):
Darren McCrank Filing/Regulatory Reference:
System Service
Director, Ontario Operations
1. Background and Justification
Stayner MS1, Superior Street
Stayner MS1 provides service to the Eastern half of Stayner with branches covering Williams street and Charles Street. The
transformer is a 5 MVA and has three feeders all of which are currently in use. The station is currently protected by S&C SMD‐2C,
100A type E Power fuses on the HV side and S&C Outdoor Metalclad, 400A with SM‐5S 400A type E fuses on the low side
protecting each feeder. This station has been in operation since 1973.
Stayner MS2, 229 Quebec Street
Stayner MS2 provides residential service to the Western portion of Stayner. The transformer is a 5 MVA and has three feeders all
of which are currently in use. The station is currently protected by S&C SMD‐2C, 100A type E Power fuses on the HV side and S&C
Minirupter, 400A with SM‐5S 400A type E fuses on the low side protecting each feeder. This station has been in operation since
1986.
The Stayner MS1 and MS2 Substation upgrade project involves upgrading each of the existing transformers sizes from a 5 MVA to
7.5 MVA as well as including SCADA and telemetry to allow better monitoring of the system for reliability and grid modernization
purposes.
FUNDING BY YEAR
2023 2024
Capital Expenditure ($) $689,014 $723,750
External Contribution ($)
Net Capital Cost TOTAL
Capital Addition (%) 100% 100%
Operating Expenditure ($) 0 0
EPCOR – DSP Business Case
_____________________________________________________________________________________ Page 92 of 128
The primary drivers for the transformer and telemetry upgrades include:
Addressing capacity issues and providing the ability to accommodate future proposed growth on both the east and west end
within this community;
Modernizing the substations by providing hold offs and the ability to operate the new breakers through SCADA making them safer
to work on, and more reliable for our customers.
In the Stayner service area, there are two substations which allows for switching between stations/feeders for operational and
maintenance purposes. Station capacity for planning purposes is based on 75% of the normal rating of the station transformers.
Short time fluctuations in demand load would not be expected to exceed the normal rating of the station transformer. When
normal loading exceeds 75% of the transformer rating, the excess amount would be temporarily transferred to another station
with capacity. If this is not possible, due to system constraints or other issues, new facilities would be planned to be constructed.
The existing stations are at max capacity on peak days when feeding the whole Town of Stayner from one substation or the other.
Currently, if one of the 2‐44KV feeders from H1 feeding Stayner is lost or if station maintenance is performed, we are at capacity
to feed the whole Town from one station temporarily. With the continued expected growth in Stayner, some or all of the
customers will be off for the duration in case of the 44KV outage or if system maintenance needs to be performed.
Efficiency Enhancements:
Standardization ‐ This project will standardize our equipment and create ease of use for operators who will have similar devices in
all locations.
Visibility ‐ We will have better visibility into our distribution system with updated devices.
Remote Operations ‐ If a trip event occurs, 24/7 control room operations will be able to remotely operate and close the breaker,
thereby eliminating the need for a lineperson change and close in a fuse.
Customer Value Enhancements:
Customer value will be enhanced by a safer and more stable distribution system.
Reliability Enhancements:
Currently, every nuisance trip requires a crew to travel to the station to re‐fuse. Auto reclosing features for nuisance trips will
eliminate the need for a field crew to travel to a station site thereby allowing for better customer reliability.
Better handling of accommodation for added load and growth without brown outs or overloading the existing transformer.
Safety Enhancements:
More reliable feeder tripping. Ability to disable ground fault detection to prevent nuisance trips during switching.
Eliminate the need for personnel to refuse at the station and close in with live line sticks or operating a gang operating switch.
2. Alternatives Considered
Status Quo – In the Stayner service area, there are two substations which allows for switching between stations/feeders for
operational and maintenance purposes. Currently, in the event of an outage to a particular 44kV feed or during system

EPCOR – DSP Business Case
_____________________________________________________________________________________ Page 93 of 128
maintenance, temporary supply from one station to feed customers typically fed from the other station is provided. Consistent
future load growth in the area will ultimately mean that one of the existing stations alone will not be able to supply to all the
customers. Hence, proposed upgrades to the station transformers are required. Further, existing infrastructure on the station
would not allow for the proposed SCADA implementations. The proposed station upgrades would be required to accommodate
these telemetry implementations.
Upgrade one Substation transformer – In the event of an outage to a particular 44kV feed or during system maintenance, the
substation that is not upgraded will have capacity issues and will not be able to feed the whole town.
Upgrading both Substation transformers but no modernization – This alternative will solve the current and future capacity issues
but there wouldn’t be visibility or safety/reliability aspects associated with modernizing the station.
3. Scope of Recommended Option
The scope of this project is to increase system capacity for the Stayner service area, as well as improve system efficiencies,
reliability and safety for the purpose of grid modernization to suit both current and future growth in operational requirements.
4. Cost and Cost Basis
Costs have been estimated based on high level budgetary quotes received and historical experience, plus inflationary impacts.
Project Cost Breakdown 2023 2024
External Costs (Contractors & Consultants) $626,376 $657,955
Contingency (Total Project = 15%) $62,638 $65,795
Other Costs ‐ Inflation
Total Project Cost $689,014 $723,750
5. Timelines and Milestones
The procurement of the two station transformers along with required SCADA equipment will be major influencing factors in
determining the timing for project execution. Further, it will also be dependent on the timing of annual routine maintenance and
other loading and environment factors. Since one station will be required to pick off the loading of the other station, the timing
would ideally have to be when the overall system load is considerably lower.
6. Execution Risks
Equipment procumbent availability could pose a critical challenge for timely project implementation, given labor and manufactory
shortages resulting in extensively lengthy lead times. Increase station capacity is main driving force for the urgency of this project
execution. Reliability and safety are also key inputs which influences this project’s prioritization. The steady growth and expected
growth in Stayner increases EEDO’s needs for operational and reliability requirements for information systems capable of
providing enhanced functionality to operations and facilities that meet the current and future needs of the system.
7. Preliminary Execution Strategy
EPCOR – DSP Business Case
_____________________________________________________________________________________ Page 94 of 128
Develop a good request for proposal practice and issue with considerably adequate lead time. Once the DSP is approved, EEDO
will ensure that sufficient internal and external resources are available for project completion.
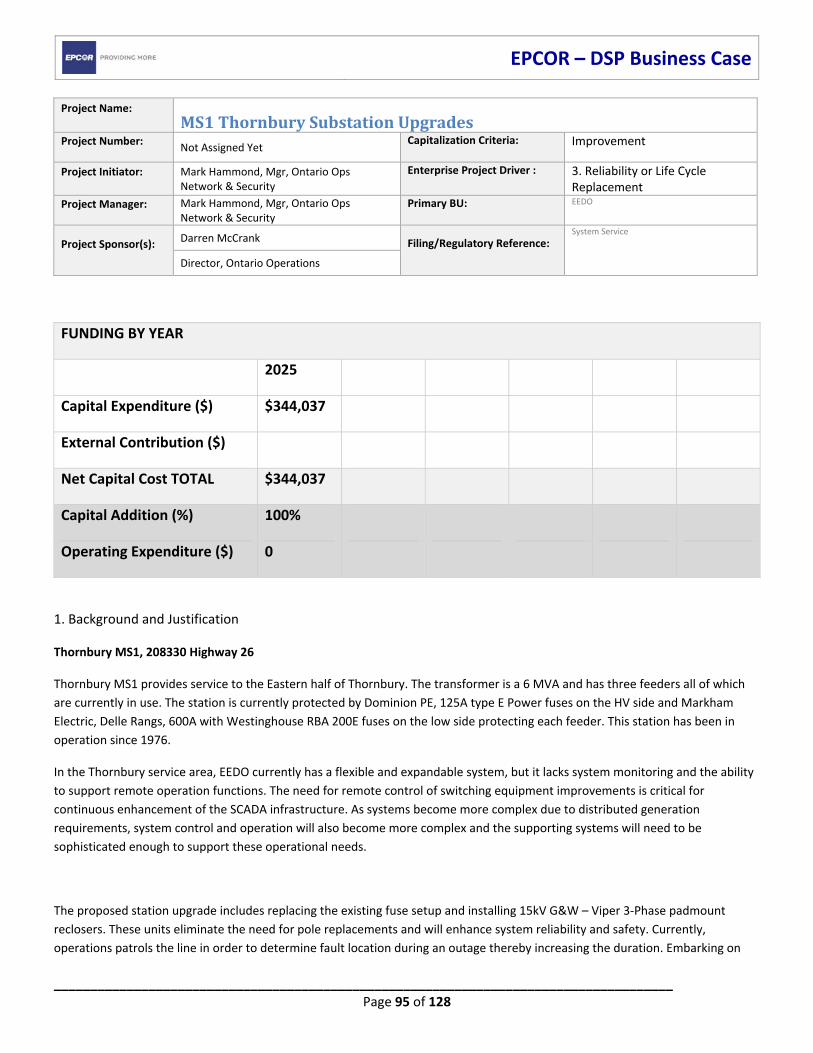
EPCOR – DSP Business Case
_____________________________________________________________________________________ Page 95 of 128
Project Name: MS1ThornburySubstationUpgradesProject Number:
Not Assigned Yet Capitalization Criteria:
Improvement
Project Initiator:
Mark Hammond, Mgr, Ontario Ops Network & Security
Enterprise Project Driver : 3. Reliability or Life Cycle Replacement
Project Manager:
Mark Hammond, Mgr, Ontario Ops Network & Security
Primary BU:
EEDO
Project Sponsor(s):
Darren McCrank Filing/Regulatory Reference:
System Service
Director, Ontario Operations
1. Background and Justification
Thornbury MS1, 208330 Highway 26
Thornbury MS1 provides service to the Eastern half of Thornbury. The transformer is a 6 MVA and has three feeders all of which
are currently in use. The station is currently protected by Dominion PE, 125A type E Power fuses on the HV side and Markham
Electric, Delle Rangs, 600A with Westinghouse RBA 200E fuses on the low side protecting each feeder. This station has been in
operation since 1976.
In the Thornbury service area, EEDO currently has a flexible and expandable system, but it lacks system monitoring and the ability
to support remote operation functions. The need for remote control of switching equipment improvements is critical for
continuous enhancement of the SCADA infrastructure. As systems become more complex due to distributed generation
requirements, system control and operation will also become more complex and the supporting systems will need to be
sophisticated enough to support these operational needs.
The proposed station upgrade includes replacing the existing fuse setup and installing 15kV G&W – Viper 3‐Phase padmount
reclosers. These units eliminate the need for pole replacements and will enhance system reliability and safety. Currently,
operations patrols the line in order to determine fault location during an outage thereby increasing the duration. Embarking on
FUNDING BY YEAR
2025
Capital Expenditure ($) $344,037
External Contribution ($)
Net Capital Cost TOTAL $344,037
Capital Addition (%) 100%
Operating Expenditure ($) 0

EPCOR – DSP Business Case
_____________________________________________________________________________________ Page 96 of 128
this upgrade will reduce system downtime in the event of a fault. Further, the system monitoring support and collaboration with
the smart meter data will provide better system level information and allow more accurate system analysis studies.
Efficiency Enhancements:
Standardization ‐ This project will standardize our equipment and create ease of use for operators who will have similar devices in
all locations.
Visibility ‐ We will have better visibility into our distribution system with updated devices.
Remote Operations ‐ If a trip event occurs, 24/7 control room operations will be able to remotely operate and close the breaker,
thereby eliminating the need for a lineperson change and close in a fuse.
Customer Value Enhancements:
Customer value will be enhanced by a safer and more stable distribution system.
Reliability Enhancements:
Currently, every nuisance trip requires a crew to travel to the station to re‐fuse. Auto reclosing features for nuisance trips will
allow for better customer reliability as this will automatically re‐close eliminating a crew to travel to the station site.
Safety Enhancements:
More reliable feeder tripping. Ability to disable ground fault detection to prevent nuisance trips during switching.
Eliminate the need for personnel to refuse at the station and close in with live line sticks or operating a gang operating switch
2. Alternatives Considered
Status Quo – Continual improvement in Smart Grid capability and annual expenditures to maintain software/hardware
functionality is a requirement in the industry. Maintaining the existing station setup is an option, however, this will result in longer
that desirable outage times for customers. This will not only increase SAIDI performance index bit will also greatly impact system
reliability and safety. Further, maintaining the existing station setup will result in lack of visibility and the capability of remote
operations.
Installing Line Monitors ‐ Regular line monitoring will provide current and voltage readings but will not provide the same level of
detail and visibility as provided through SCADA data.
3. Scope of Recommended Option
This type of SCADA system upgrade is part of EEDO’s system service program budget. The scope of this project is to improve
system efficiencies, reliability and safety for the purpose of grid modernization to suit both current and future growth in
operational requirements.
4. Cost and Cost Basis
Costs have been estimated based on high level quote received during planning in 2021, plus inflationary impacts.

EPCOR – DSP Business Case
_____________________________________________________________________________________ Page 97 of 128
Project Cost Breakdown 2025
External Costs (Contractors & Consultants)
$299,163
Contingency (Total Project = 15%) $44,874
Other Costs ‐ Inflation ‐
Total Project Cost $344,037
5. Timelines and Milestones
The timelines will be determined in conjunction with Operations with regards to annual routine station maintenance,
contractor/consultants and other external/internal factors.
6. Execution Risks
Equipment procurement availability could pose a critical challenge for timely project implementation, given labor and
manufactory shortages resulting in longer that normal lead times. Historical planning outputs have determined that an average
investment of about $100k annually is required for SCADA operational efficiency. Reliability and safety are key considerations in
project prioritization. EEDO’s operational and reliability needs, information systems capable of providing enhanced functionality to
operations and facilities that meet current and future needs of the system.
7. Preliminary Execution Strategy
Develop a good request for proposal practice and issue with considerably adequate lead time. Once the DSP is approved, EEDO
will ensure that sufficient internal and external resources are available for project completion.
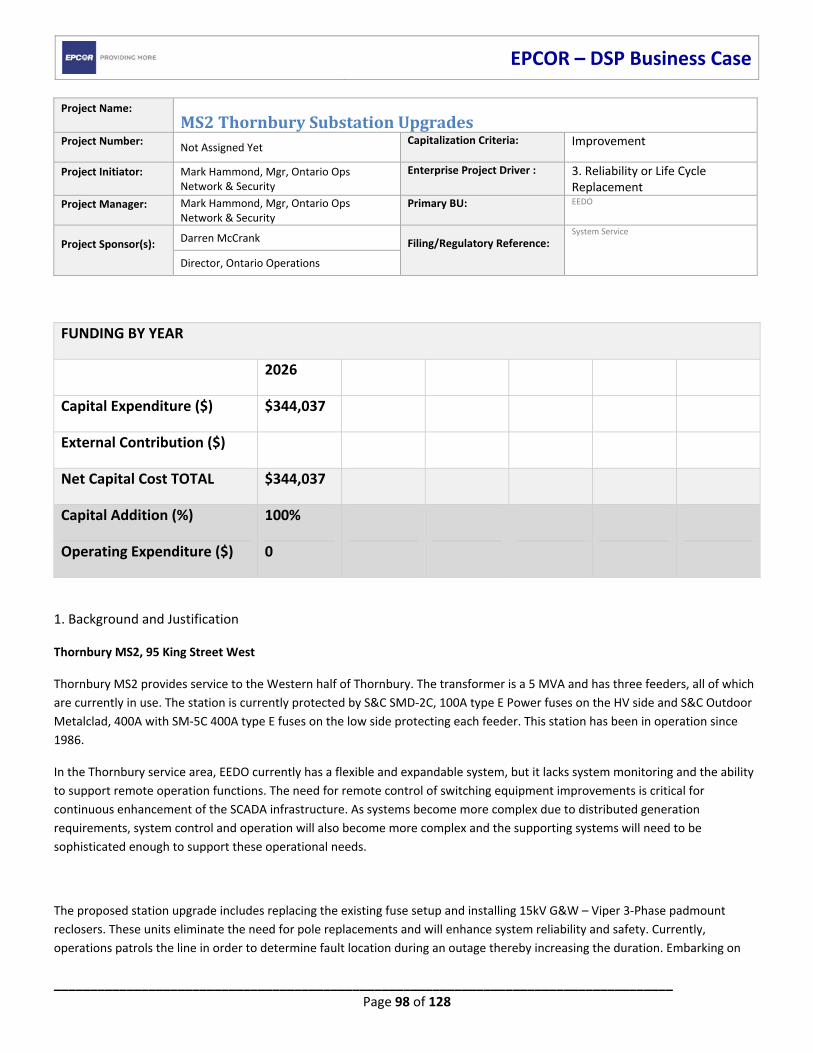
EPCOR – DSP Business Case
_____________________________________________________________________________________ Page 98 of 128
Project Name: MS2ThornburySubstationUpgradesProject Number:
Not Assigned Yet Capitalization Criteria:
Improvement
Project Initiator:
Mark Hammond, Mgr, Ontario Ops Network & Security
Enterprise Project Driver : 3. Reliability or Life Cycle Replacement
Project Manager:
Mark Hammond, Mgr, Ontario Ops Network & Security
Primary BU:
EEDO
Project Sponsor(s):
Darren McCrank Filing/Regulatory Reference:
System Service
Director, Ontario Operations
1. Background and Justification
Thornbury MS2, 95 King Street West
Thornbury MS2 provides service to the Western half of Thornbury. The transformer is a 5 MVA and has three feeders, all of which
are currently in use. The station is currently protected by S&C SMD‐2C, 100A type E Power fuses on the HV side and S&C Outdoor
Metalclad, 400A with SM‐5C 400A type E fuses on the low side protecting each feeder. This station has been in operation since
1986.
In the Thornbury service area, EEDO currently has a flexible and expandable system, but it lacks system monitoring and the ability
to support remote operation functions. The need for remote control of switching equipment improvements is critical for
continuous enhancement of the SCADA infrastructure. As systems become more complex due to distributed generation
requirements, system control and operation will also become more complex and the supporting systems will need to be
sophisticated enough to support these operational needs.
The proposed station upgrade includes replacing the existing fuse setup and installing 15kV G&W – Viper 3‐Phase padmount
reclosers. These units eliminate the need for pole replacements and will enhance system reliability and safety. Currently,
operations patrols the line in order to determine fault location during an outage thereby increasing the duration. Embarking on
FUNDING BY YEAR
2026
Capital Expenditure ($) $344,037
External Contribution ($)
Net Capital Cost TOTAL $344,037
Capital Addition (%) 100%
Operating Expenditure ($) 0
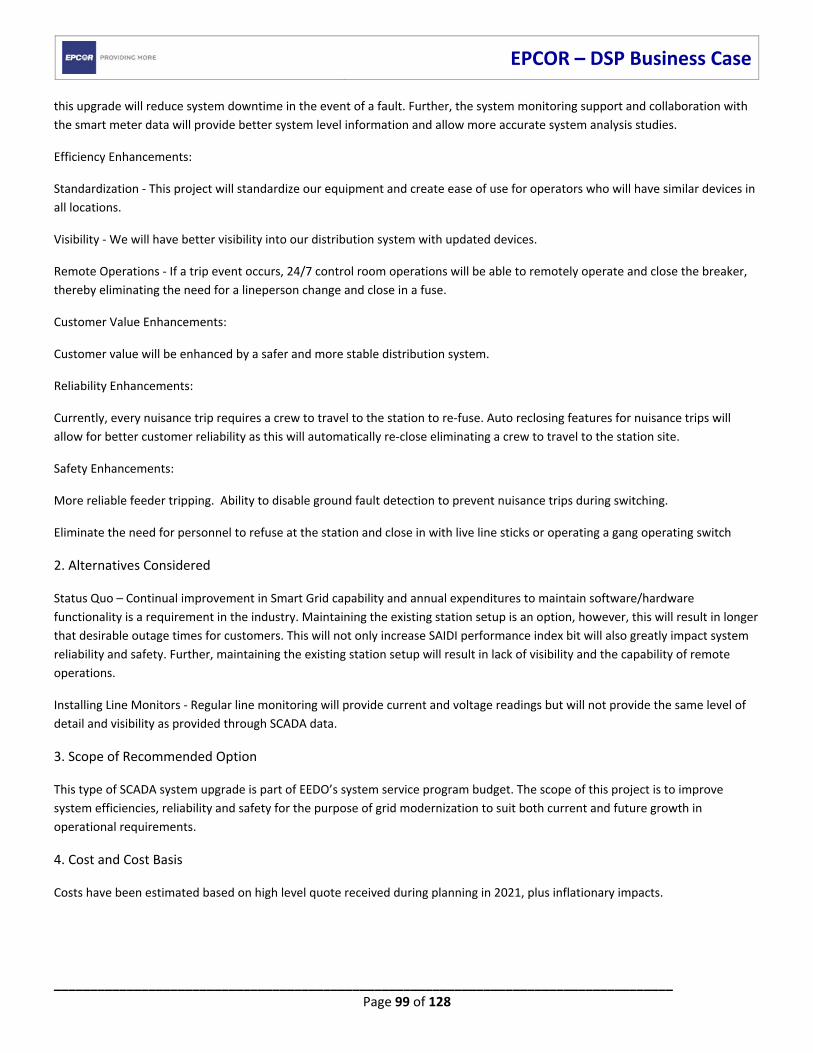
EPCOR – DSP Business Case
_____________________________________________________________________________________ Page 99 of 128
this upgrade will reduce system downtime in the event of a fault. Further, the system monitoring support and collaboration with
the smart meter data will provide better system level information and allow more accurate system analysis studies.
Efficiency Enhancements:
Standardization ‐ This project will standardize our equipment and create ease of use for operators who will have similar devices in
all locations.
Visibility ‐ We will have better visibility into our distribution system with updated devices.
Remote Operations ‐ If a trip event occurs, 24/7 control room operations will be able to remotely operate and close the breaker,
thereby eliminating the need for a lineperson change and close in a fuse.
Customer Value Enhancements:
Customer value will be enhanced by a safer and more stable distribution system.
Reliability Enhancements:
Currently, every nuisance trip requires a crew to travel to the station to re‐fuse. Auto reclosing features for nuisance trips will
allow for better customer reliability as this will automatically re‐close eliminating a crew to travel to the station site.
Safety Enhancements:
More reliable feeder tripping. Ability to disable ground fault detection to prevent nuisance trips during switching.
Eliminate the need for personnel to refuse at the station and close in with live line sticks or operating a gang operating switch
2. Alternatives Considered
Status Quo – Continual improvement in Smart Grid capability and annual expenditures to maintain software/hardware
functionality is a requirement in the industry. Maintaining the existing station setup is an option, however, this will result in longer
that desirable outage times for customers. This will not only increase SAIDI performance index bit will also greatly impact system
reliability and safety. Further, maintaining the existing station setup will result in lack of visibility and the capability of remote
operations.
Installing Line Monitors ‐ Regular line monitoring will provide current and voltage readings but will not provide the same level of
detail and visibility as provided through SCADA data.
3. Scope of Recommended Option
This type of SCADA system upgrade is part of EEDO’s system service program budget. The scope of this project is to improve
system efficiencies, reliability and safety for the purpose of grid modernization to suit both current and future growth in
operational requirements.
4. Cost and Cost Basis
Costs have been estimated based on high level quote received during planning in 2021, plus inflationary impacts.
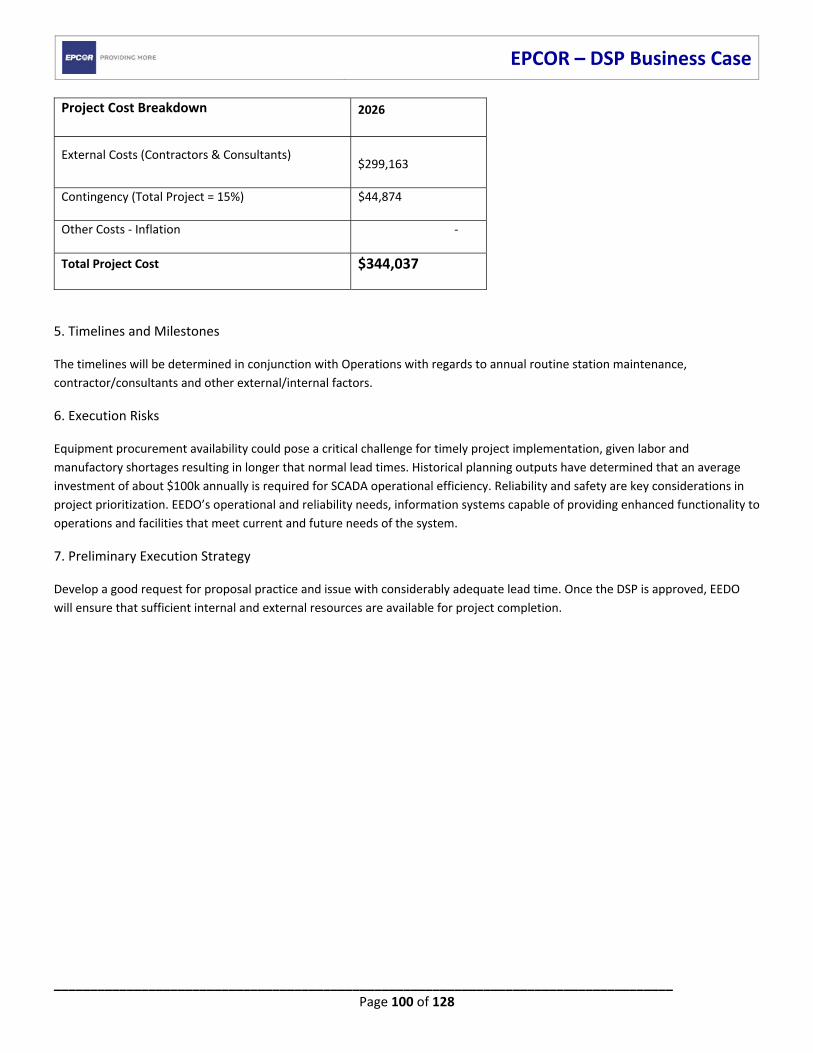
EPCOR – DSP Business Case
_____________________________________________________________________________________ Page 100 of 128
Project Cost Breakdown 2026
External Costs (Contractors & Consultants)
$299,163
Contingency (Total Project = 15%) $44,874
Other Costs ‐ Inflation ‐
Total Project Cost $344,037
5. Timelines and Milestones
The timelines will be determined in conjunction with Operations with regards to annual routine station maintenance,
contractor/consultants and other external/internal factors.
6. Execution Risks
Equipment procurement availability could pose a critical challenge for timely project implementation, given labor and
manufactory shortages resulting in longer that normal lead times. Historical planning outputs have determined that an average
investment of about $100k annually is required for SCADA operational efficiency. Reliability and safety are key considerations in
project prioritization. EEDO’s operational and reliability needs, information systems capable of providing enhanced functionality to
operations and facilities that meet current and future needs of the system.
7. Preliminary Execution Strategy
Develop a good request for proposal practice and issue with considerably adequate lead time. Once the DSP is approved, EEDO
will ensure that sufficient internal and external resources are available for project completion.
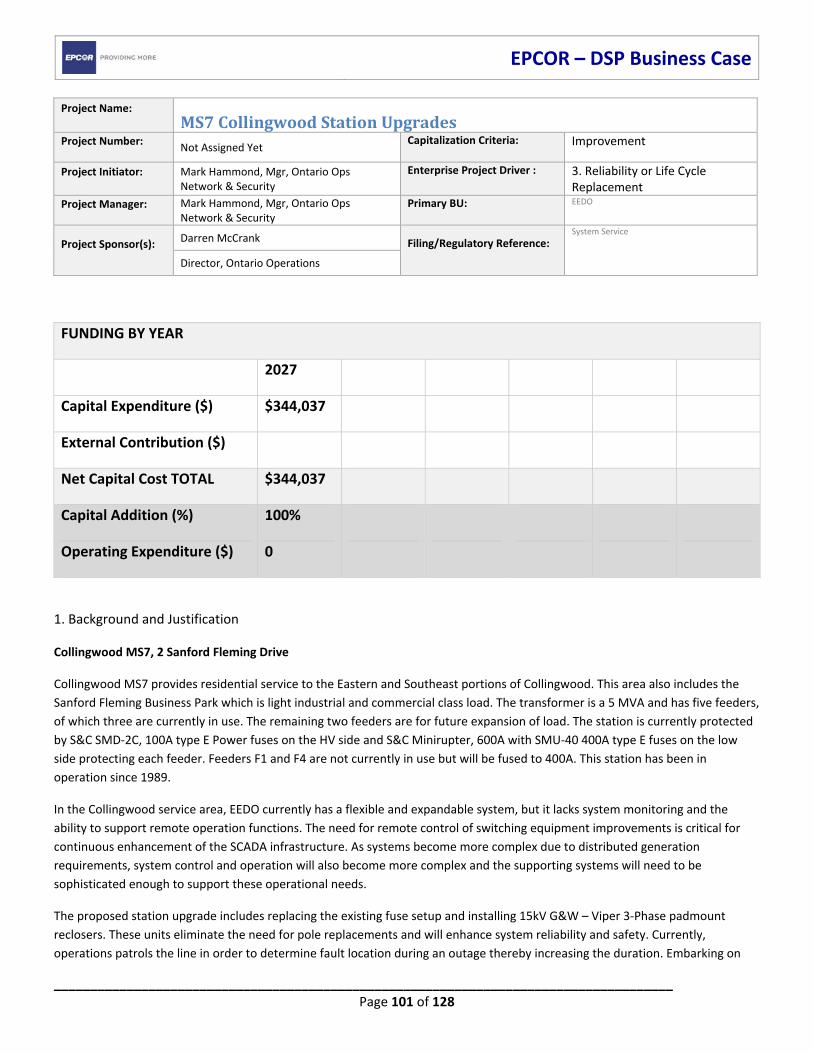
EPCOR – DSP Business Case
_____________________________________________________________________________________ Page 101 of 128
Project Name: MS7CollingwoodStationUpgradesProject Number:
Not Assigned Yet Capitalization Criteria:
Improvement
Project Initiator:
Mark Hammond, Mgr, Ontario Ops Network & Security
Enterprise Project Driver : 3. Reliability or Life Cycle Replacement
Project Manager:
Mark Hammond, Mgr, Ontario Ops Network & Security
Primary BU:
EEDO
Project Sponsor(s):
Darren McCrank Filing/Regulatory Reference:
System Service
Director, Ontario Operations
1. Background and Justification
Collingwood MS7, 2 Sanford Fleming Drive
Collingwood MS7 provides residential service to the Eastern and Southeast portions of Collingwood. This area also includes the
Sanford Fleming Business Park which is light industrial and commercial class load. The transformer is a 5 MVA and has five feeders,
of which three are currently in use. The remaining two feeders are for future expansion of load. The station is currently protected
by S&C SMD‐2C, 100A type E Power fuses on the HV side and S&C Minirupter, 600A with SMU‐40 400A type E fuses on the low
side protecting each feeder. Feeders F1 and F4 are not currently in use but will be fused to 400A. This station has been in
operation since 1989.
In the Collingwood service area, EEDO currently has a flexible and expandable system, but it lacks system monitoring and the
ability to support remote operation functions. The need for remote control of switching equipment improvements is critical for
continuous enhancement of the SCADA infrastructure. As systems become more complex due to distributed generation
requirements, system control and operation will also become more complex and the supporting systems will need to be
sophisticated enough to support these operational needs.
The proposed station upgrade includes replacing the existing fuse setup and installing 15kV G&W – Viper 3‐Phase padmount
reclosers. These units eliminate the need for pole replacements and will enhance system reliability and safety. Currently,
operations patrols the line in order to determine fault location during an outage thereby increasing the duration. Embarking on
FUNDING BY YEAR
2027
Capital Expenditure ($) $344,037
External Contribution ($)
Net Capital Cost TOTAL $344,037
Capital Addition (%) 100%
Operating Expenditure ($) 0

EPCOR – DSP Business Case
_____________________________________________________________________________________ Page 102 of 128
this upgrade will reduce system downtime in the event of a fault. Further, the system monitoring support and collaboration with
the smart meter data will provide better system level information and allow more accurate system analysis studies.
Efficiency Enhancements:
Standardization ‐ This project will standardize our equipment and create ease of use for operators who will have similar devices in
all locations.
Visibility ‐ We will have better visibility into our distribution system with updated devices.
Remote Operations ‐ If a trip event occurs, 24/7 control room operations will be able to remotely operate and close the breaker,
thereby eliminating the need for a lineperson change and close in a fuse.
Customer Value Enhancements:
Customer value will be enhanced by a safer and more stable distribution system.
Reliability Enhancements:
Currently, every nuisance trip requires a crew to travel to the station to re‐fuse. Auto reclosing features for nuisance trips will
allow for better customer reliability as this will automatically re‐close eliminating a crew to travel to the station site.
Safety Enhancements:
More reliable feeder tripping. Ability to disable ground fault detection to prevent nuisance trips during switching.
Eliminate the need for personnel to refuse at the station and close in with live line sticks or operating a gang operating switch
2. Alternatives Considered
Status Quo – Continual improvement in Smart Grid capability and annual expenditures to maintain software/hardware
functionality is a requirement in the industry. Maintaining the existing station setup is an option, however, this will result in longer
that desirable outage times for customers. This will not only increase SAIDI performance index bit will also greatly impact system
reliability and safety. Further, maintaining the existing station setup will result in lack of visibility and the capability of remote
operations.
Installing Line Monitors ‐ Regular line monitoring will provide current and voltage readings but will not provide the same level of
detail and visibility as provided through SCADA data.
3. Scope of Recommended Option
This type of SCADA system upgrade is part of EEDO’s system service program budget. The scope of this project is to improve
system efficiencies, reliability and safety for the purpose of grid modernization to suit both current and future growth in
operational requirements.
4. Cost and Cost Basis
Costs have been estimated based on high level quote received during planning in 2021, plus inflationary impacts.

EPCOR – DSP Business Case
_____________________________________________________________________________________ Page 103 of 128
Project Cost Breakdown 2027
External Costs (Contractors & Consultants)
$299,163
Contingency (Total Project = 15%) $44,874
Other Costs ‐ Inflation ‐
Total Project Cost $344,037
5. Timelines and Milestones
The timelines will be determined in conjunction with Operations with regards to annual routine station maintenance,
contractor/consultants and other external/internal factors.
6. Execution Risks
Equipment procurement availability could pose a critical challenge for timely project implementation, given labor and
manufactory shortages resulting in longer that normal lead times. Historical planning outputs have determined that an average
investment of about $100k annually is required for SCADA operational efficiency. Reliability and safety are key considerations in
project prioritization. EEDO’s operational and reliability needs, information systems capable of providing enhanced functionality to
operations and facilities that meet current and future needs of the system.
7. Preliminary Execution Strategy
Develop a good request for proposal practice and issue with considerably adequate lead time. Once the DSP is approved, EEDO
will ensure that sufficient internal and external resources are available for project completion.
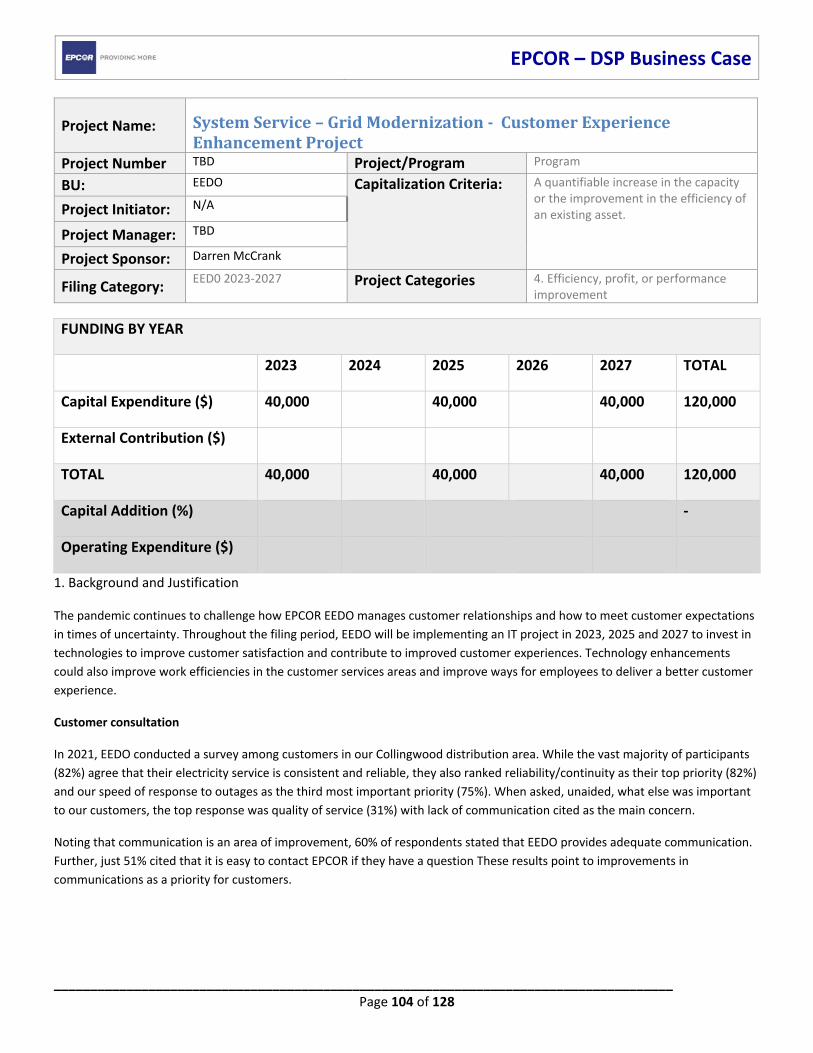
EPCOR – DSP Business Case
_____________________________________________________________________________________ Page 104 of 128
Project Name: SystemService–GridModernization‐CustomerExperienceEnhancementProject
Project Number TBD Project/Program Program
BU: EEDO Capitalization Criteria:
A quantifiable increase in the capacity or the improvement in the efficiency of an existing asset.
Project Initiator: N/A
Project Manager: TBD
Project Sponsor: Darren McCrank
Filing Category: EED0 2023‐2027 Project Categories 4. Efficiency, profit, or performance
improvement
1. Background and Justification
The pandemic continues to challenge how EPCOR EEDO manages customer relationships and how to meet customer expectations
in times of uncertainty. Throughout the filing period, EEDO will be implementing an IT project in 2023, 2025 and 2027 to invest in
technologies to improve customer satisfaction and contribute to improved customer experiences. Technology enhancements
could also improve work efficiencies in the customer services areas and improve ways for employees to deliver a better customer
experience.
Customer consultation
In 2021, EEDO conducted a survey among customers in our Collingwood distribution area. While the vast majority of participants
(82%) agree that their electricity service is consistent and reliable, they also ranked reliability/continuity as their top priority (82%)
and our speed of response to outages as the third most important priority (75%). When asked, unaided, what else was important
to our customers, the top response was quality of service (31%) with lack of communication cited as the main concern.
Noting that communication is an area of improvement, 60% of respondents stated that EEDO provides adequate communication.
Further, just 51% cited that it is easy to contact EPCOR if they have a question These results point to improvements in
communications as a priority for customers.
FUNDING BY YEAR
2023 2024 2025 2026 2027 TOTAL
Capital Expenditure ($) 40,000 40,000 40,000 120,000
External Contribution ($)
TOTAL 40,000 40,000 40,000 120,000
Capital Addition (%) ‐
Operating Expenditure ($)
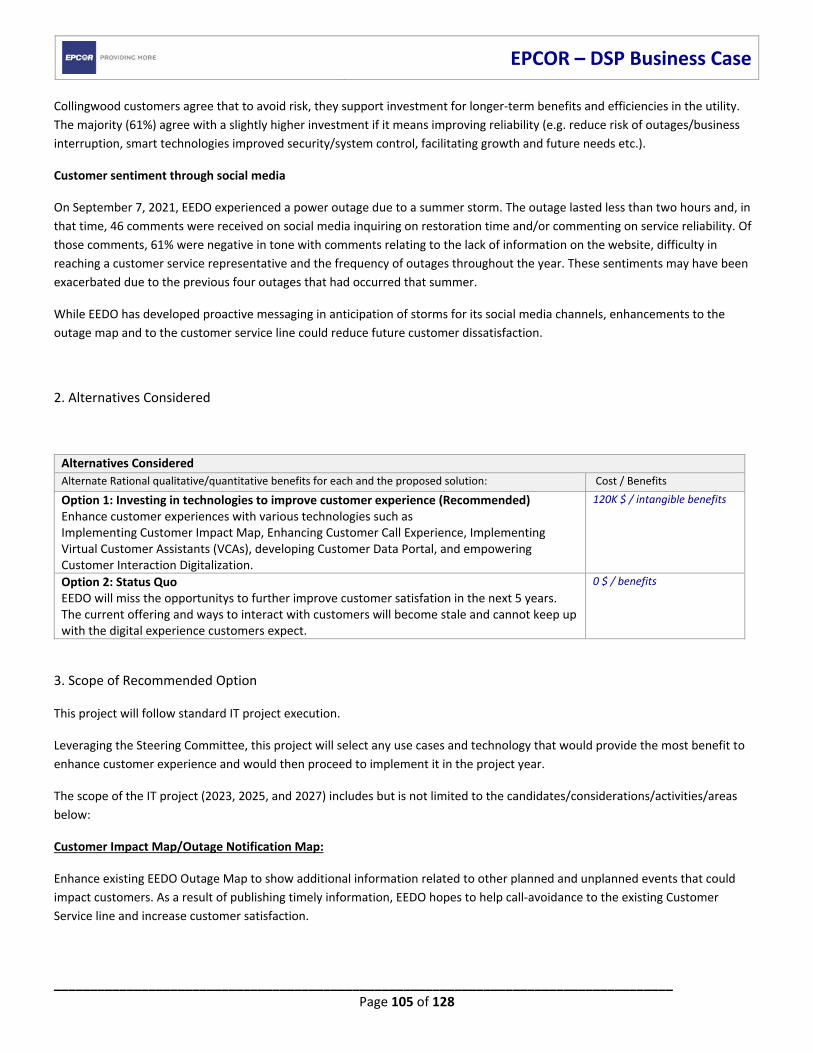
EPCOR – DSP Business Case
_____________________________________________________________________________________ Page 105 of 128
Collingwood customers agree that to avoid risk, they support investment for longer‐term benefits and efficiencies in the utility.
The majority (61%) agree with a slightly higher investment if it means improving reliability (e.g. reduce risk of outages/business
interruption, smart technologies improved security/system control, facilitating growth and future needs etc.).
Customer sentiment through social media
On September 7, 2021, EEDO experienced a power outage due to a summer storm. The outage lasted less than two hours and, in
that time, 46 comments were received on social media inquiring on restoration time and/or commenting on service reliability. Of
those comments, 61% were negative in tone with comments relating to the lack of information on the website, difficulty in
reaching a customer service representative and the frequency of outages throughout the year. These sentiments may have been
exacerbated due to the previous four outages that had occurred that summer.
While EEDO has developed proactive messaging in anticipation of storms for its social media channels, enhancements to the
outage map and to the customer service line could reduce future customer dissatisfaction.
2. Alternatives Considered
Alternatives Considered
Alternate Rational qualitative/quantitative benefits for each and the proposed solution: Cost / Benefits
Option 1: Investing in technologies to improve customer experience (Recommended) Enhance customer experiences with various technologies such as Implementing Customer Impact Map, Enhancing Customer Call Experience, Implementing Virtual Customer Assistants (VCAs), developing Customer Data Portal, and empowering Customer Interaction Digitalization.
120K $ / intangible benefits
Option 2: Status Quo EEDO will miss the opportunitys to further improve customer satisfation in the next 5 years. The current offering and ways to interact with customers will become stale and cannot keep up with the digital experience customers expect.
0 $ / benefits
3. Scope of Recommended Option
This project will follow standard IT project execution.
Leveraging the Steering Committee, this project will select any use cases and technology that would provide the most benefit to
enhance customer experience and would then proceed to implement it in the project year.
The scope of the IT project (2023, 2025, and 2027) includes but is not limited to the candidates/considerations/activities/areas
below:
Customer Impact Map/Outage Notification Map:
Enhance existing EEDO Outage Map to show additional information related to other planned and unplanned events that could
impact customers. As a result of publishing timely information, EEDO hopes to help call‐avoidance to the existing Customer
Service line and increase customer satisfaction.
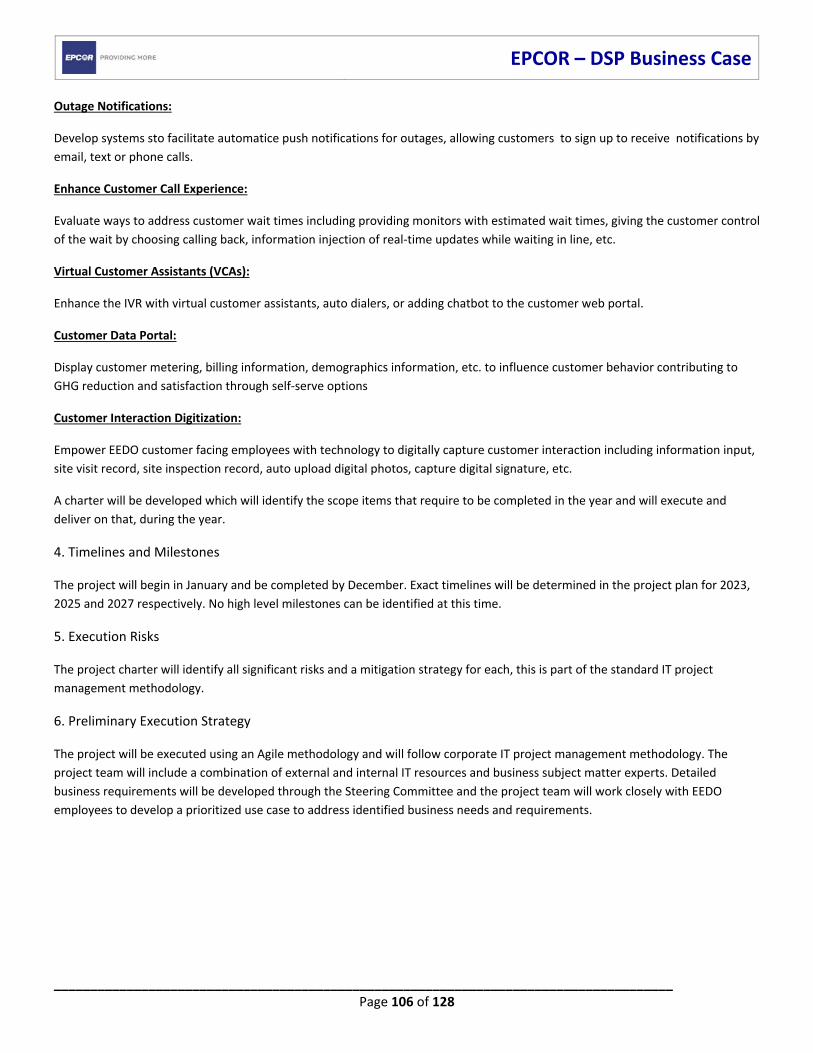
EPCOR – DSP Business Case
_____________________________________________________________________________________ Page 106 of 128
Outage Notifications:
Develop systems sto facilitate automatice push notifications for outages, allowing customers to sign up to receive notifications by
email, text or phone calls.
Enhance Customer Call Experience:
Evaluate ways to address customer wait times including providing monitors with estimated wait times, giving the customer control
of the wait by choosing calling back, information injection of real‐time updates while waiting in line, etc.
Virtual Customer Assistants (VCAs):
Enhance the IVR with virtual customer assistants, auto dialers, or adding chatbot to the customer web portal.
Customer Data Portal:
Display customer metering, billing information, demographics information, etc. to influence customer behavior contributing to
GHG reduction and satisfaction through self‐serve options
Customer Interaction Digitization:
Empower EEDO customer facing employees with technology to digitally capture customer interaction including information input,
site visit record, site inspection record, auto upload digital photos, capture digital signature, etc.
A charter will be developed which will identify the scope items that require to be completed in the year and will execute and
deliver on that, during the year.
4. Timelines and Milestones
The project will begin in January and be completed by December. Exact timelines will be determined in the project plan for 2023,
2025 and 2027 respectively. No high level milestones can be identified at this time.
5. Execution Risks
The project charter will identify all significant risks and a mitigation strategy for each, this is part of the standard IT project
management methodology.
6. Preliminary Execution Strategy
The project will be executed using an Agile methodology and will follow corporate IT project management methodology. The
project team will include a combination of external and internal IT resources and business subject matter experts. Detailed
business requirements will be developed through the Steering Committee and the project team will work closely with EEDO
employees to develop a prioritized use case to address identified business needs and requirements.
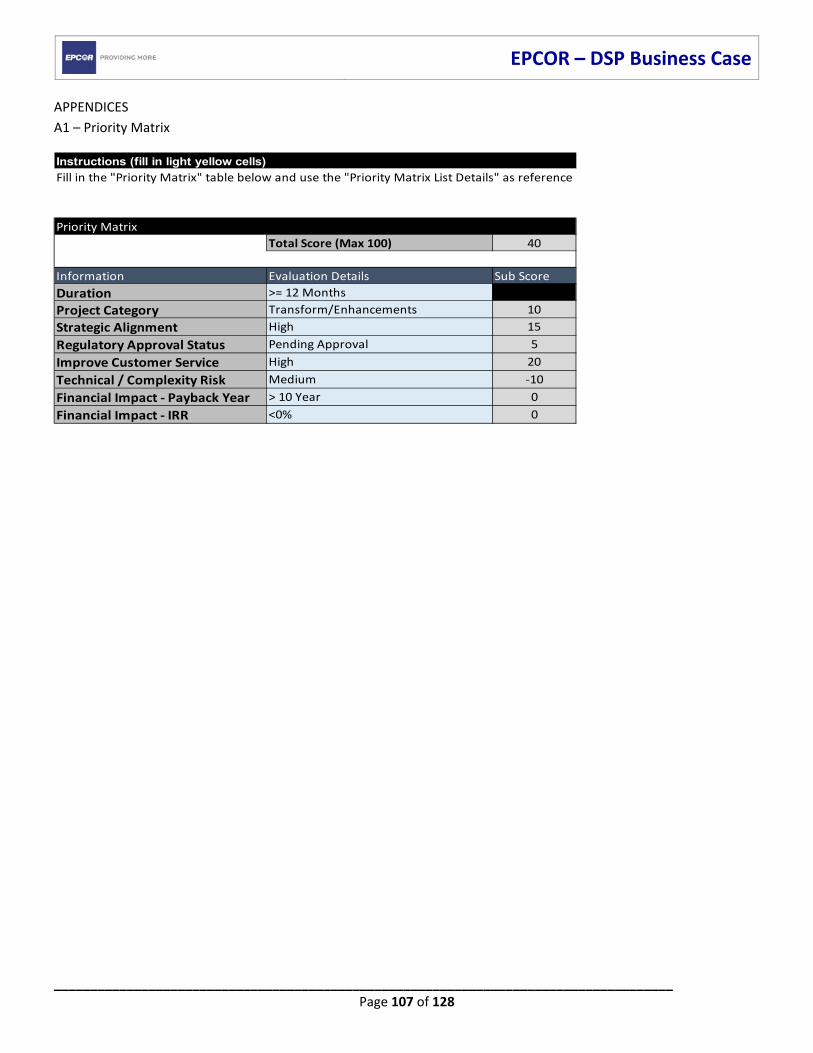
EPCOR – DSP Business Case
_____________________________________________________________________________________ Page 107 of 128
APPENDICES
A1 – Priority Matrix
Instructions (fill in light yellow cells)
Priority Matrix
Total Score (Max 100) 40
Information Evaluation Details Sub Score
Duration >= 12 Months
Project Category Transform/Enhancements 10
Strategic Alignment High 15
Regulatory Approval Status Pending Approval 5
Improve Customer Service High 20
Technical / Complexity Risk Medium ‐10
Financial Impact ‐ Payback Year > 10 Year 0
Financial Impact ‐ IRR <0% 0
Fill in the "Priority Matrix" table below and use the "Priority Matrix List Details" as reference
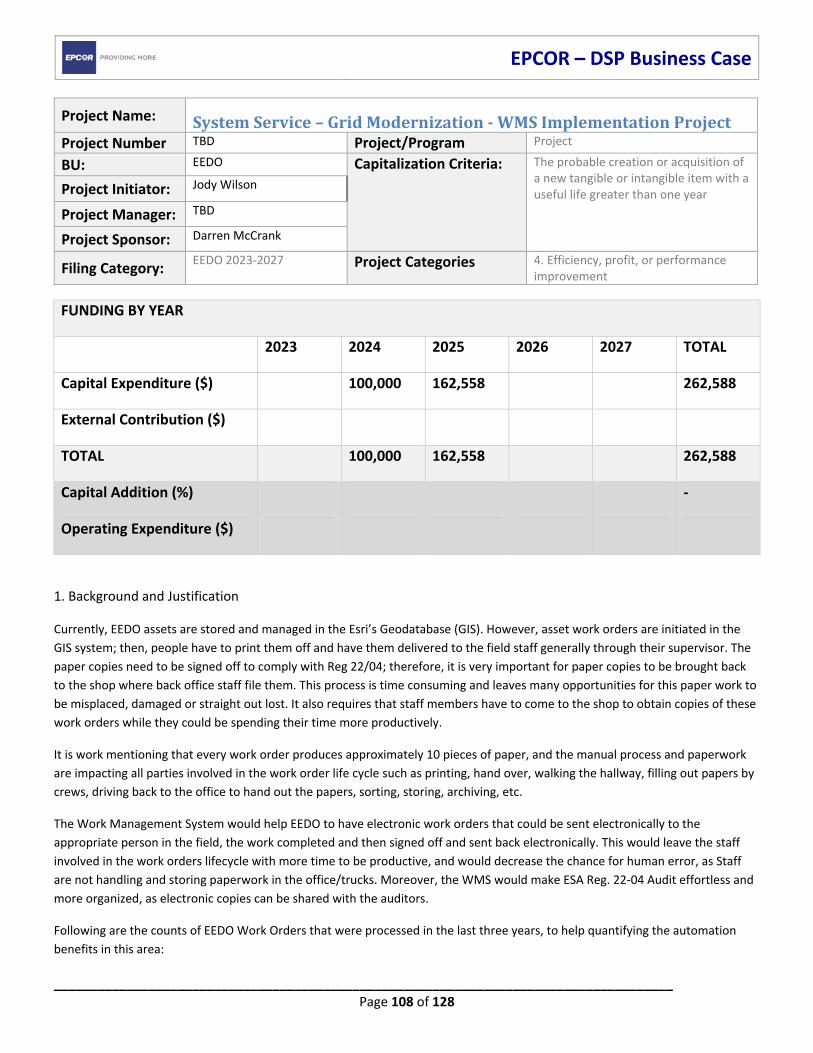
EPCOR – DSP Business Case
_____________________________________________________________________________________ Page 108 of 128
Project Name: SystemService–GridModernization‐WMSImplementationProjectProject Number TBD Project/Program Project
BU: EEDO Capitalization Criteria:
The probable creation or acquisition of a new tangible or intangible item with a useful life greater than one year
Project Initiator: Jody Wilson
Project Manager: TBD
Project Sponsor: Darren McCrank
Filing Category: EEDO 2023‐2027 Project Categories 4. Efficiency, profit, or performance
improvement
1. Background and Justification
Currently, EEDO assets are stored and managed in the Esri’s Geodatabase (GIS). However, asset work orders are initiated in the
GIS system; then, people have to print them off and have them delivered to the field staff generally through their supervisor. The
paper copies need to be signed off to comply with Reg 22/04; therefore, it is very important for paper copies to be brought back
to the shop where back office staff file them. This process is time consuming and leaves many opportunities for this paper work to
be misplaced, damaged or straight out lost. It also requires that staff members have to come to the shop to obtain copies of these
work orders while they could be spending their time more productively.
It is work mentioning that every work order produces approximately 10 pieces of paper, and the manual process and paperwork
are impacting all parties involved in the work order life cycle such as printing, hand over, walking the hallway, filling out papers by
crews, driving back to the office to hand out the papers, sorting, storing, archiving, etc.
The Work Management System would help EEDO to have electronic work orders that could be sent electronically to the
appropriate person in the field, the work completed and then signed off and sent back electronically. This would leave the staff
involved in the work orders lifecycle with more time to be productive, and would decrease the chance for human error, as Staff
are not handling and storing paperwork in the office/trucks. Moreover, the WMS would make ESA Reg. 22‐04 Audit effortless and
more organized, as electronic copies can be shared with the auditors.
Following are the counts of EEDO Work Orders that were processed in the last three years, to help quantifying the automation
benefits in this area:
FUNDING BY YEAR
2023 2024 2025 2026 2027 TOTAL
Capital Expenditure ($) 100,000 162,558 262,588
External Contribution ($)
TOTAL 100,000 162,558 262,588
Capital Addition (%) ‐
Operating Expenditure ($)
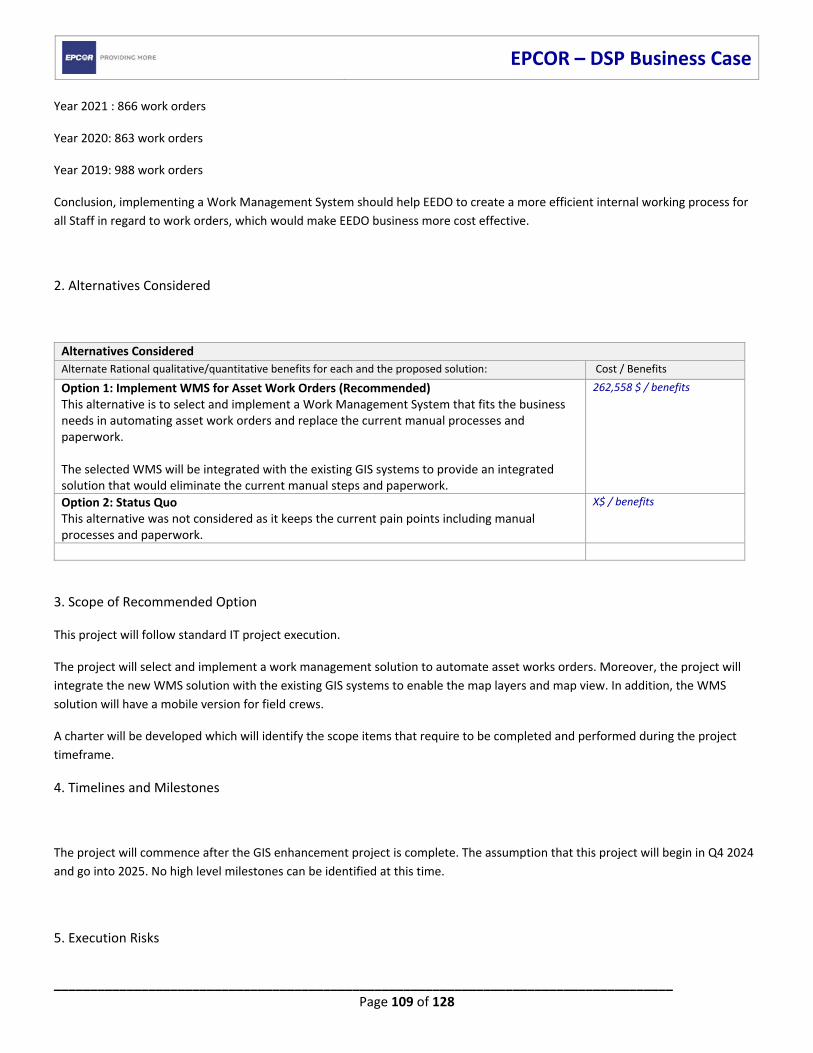
EPCOR – DSP Business Case
_____________________________________________________________________________________ Page 109 of 128
Year 2021 : 866 work orders
Year 2020: 863 work orders
Year 2019: 988 work orders
Conclusion, implementing a Work Management System should help EEDO to create a more efficient internal working process for
all Staff in regard to work orders, which would make EEDO business more cost effective.
2. Alternatives Considered
Alternatives Considered
Alternate Rational qualitative/quantitative benefits for each and the proposed solution: Cost / Benefits
Option 1: Implement WMS for Asset Work Orders (Recommended) This alternative is to select and implement a Work Management System that fits the business needs in automating asset work orders and replace the current manual processes and paperwork. The selected WMS will be integrated with the existing GIS systems to provide an integrated solution that would eliminate the current manual steps and paperwork.
262,558 $ / benefits
Option 2: Status Quo This alternative was not considered as it keeps the current pain points including manual processes and paperwork.
X$ / benefits
3. Scope of Recommended Option
This project will follow standard IT project execution.
The project will select and implement a work management solution to automate asset works orders. Moreover, the project will
integrate the new WMS solution with the existing GIS systems to enable the map layers and map view. In addition, the WMS
solution will have a mobile version for field crews.
A charter will be developed which will identify the scope items that require to be completed and performed during the project
timeframe.
4. Timelines and Milestones
The project will commence after the GIS enhancement project is complete. The assumption that this project will begin in Q4 2024
and go into 2025. No high level milestones can be identified at this time.
5. Execution Risks
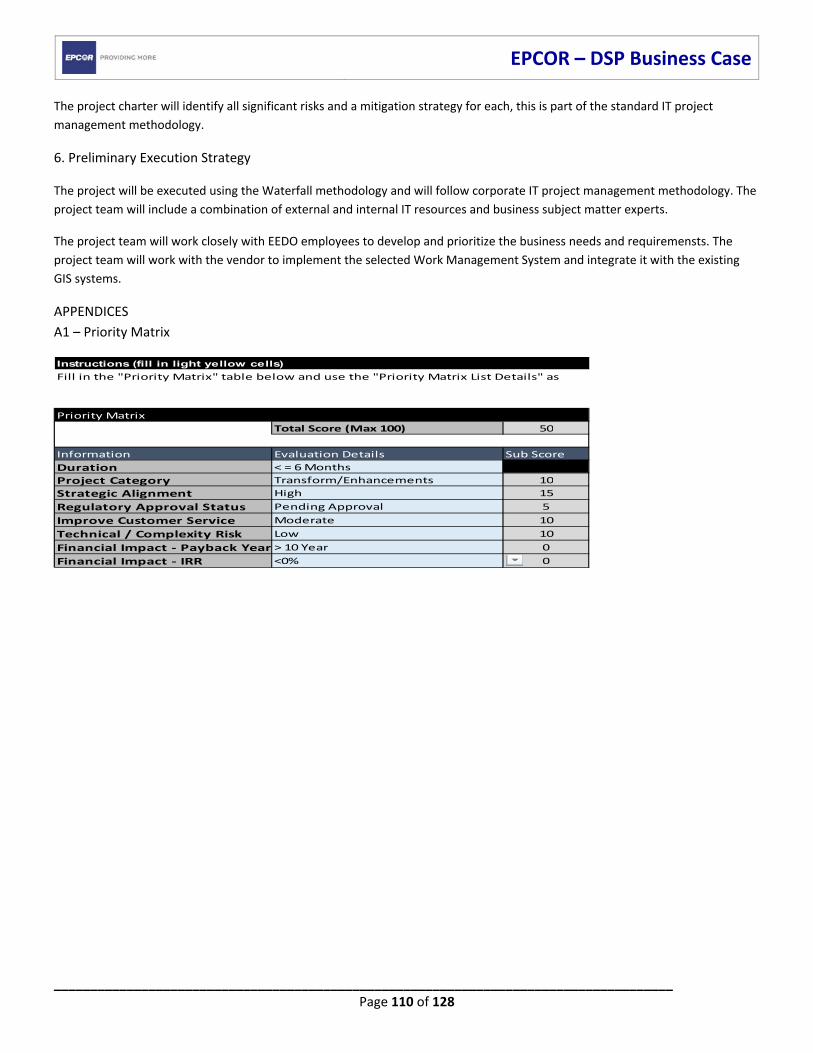
EPCOR – DSP Business Case
_____________________________________________________________________________________ Page 110 of 128
The project charter will identify all significant risks and a mitigation strategy for each, this is part of the standard IT project
management methodology.
6. Preliminary Execution Strategy
The project will be executed using the Waterfall methodology and will follow corporate IT project management methodology. The
project team will include a combination of external and internal IT resources and business subject matter experts.
The project team will work closely with EEDO employees to develop and prioritize the business needs and requiremensts. The
project team will work with the vendor to implement the selected Work Management System and integrate it with the existing
GIS systems.
APPENDICES
A1 – Priority Matrix
Instructions (fill in light yellow cells)
Priority Matrix
Total Score (Max 100) 50
Information Evaluation Details Sub Score
Duration < = 6 Months
Project Category Transform/Enhancements 10
Strategic Alignment High 15
Regulatory Approval Status Pending Approval 5
Improve Customer Service Moderate 10
Technical / Complexity Risk Low 10
Financial Impact ‐ Payback Year > 10 Year 0
Financial Impact ‐ IRR <0% 0
Fill in the "Priority Matrix" table below and use the "Priority Matrix List Details" as
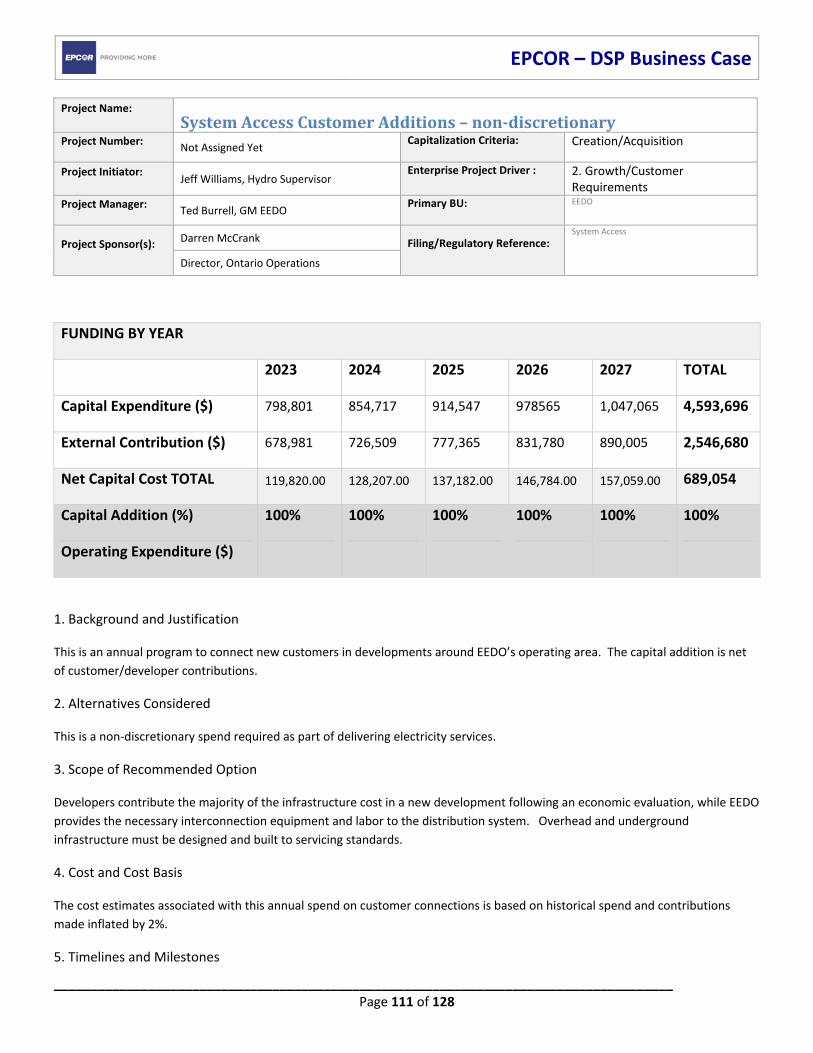
EPCOR – DSP Business Case
_____________________________________________________________________________________ Page 111 of 128
Project Name: SystemAccessCustomerAdditions–non‐discretionaryProject Number:
Not Assigned Yet Capitalization Criteria:
Creation/Acquisition
Project Initiator:
Jeff Williams, Hydro Supervisor Enterprise Project Driver : 2. Growth/Customer
Requirements Project Manager:
Ted Burrell, GM EEDO Primary BU:
EEDO
Project Sponsor(s):
Darren McCrank Filing/Regulatory Reference:
System Access
Director, Ontario Operations
1. Background and Justification
This is an annual program to connect new customers in developments around EEDO’s operating area. The capital addition is net
of customer/developer contributions.
2. Alternatives Considered
This is a non‐discretionary spend required as part of delivering electricity services.
3. Scope of Recommended Option
Developers contribute the majority of the infrastructure cost in a new development following an economic evaluation, while EEDO
provides the necessary interconnection equipment and labor to the distribution system. Overhead and underground
infrastructure must be designed and built to servicing standards.
4. Cost and Cost Basis
The cost estimates associated with this annual spend on customer connections is based on historical spend and contributions
made inflated by 2%.
5. Timelines and Milestones
FUNDING BY YEAR
2023 2024 2025 2026 2027 TOTAL
Capital Expenditure ($) 798,801 854,717 914,547 978565 1,047,065 4,593,696
External Contribution ($) 678,981 726,509 777,365 831,780 890,005 2,546,680
Net Capital Cost TOTAL 119,820.00 128,207.00 137,182.00 146,784.00 157,059.00 689,054
Capital Addition (%) 100% 100% 100% 100% 100% 100%
Operating Expenditure ($)
EPCOR – DSP Business Case
_____________________________________________________________________________________ Page 112 of 128
The timelines associated to this project are determined by the customers and developers.
6. Execution Risks
Primary risks are:
Schedule is subject to customer schedule and approvals
Cost risk is managed by using B2W estimation s/w in engineering, and project managing EEDO’s portion
Financial risks managed by getting a customer contribution calculated using an economic evaluation
Safety risk is managed by inspecting and approving all install infrastructure to EPCOR Specs. and in compliance with ESA Reg 22/04
7. Preliminary Execution Strategy
EEDO must ensure compliance to section 28 of the Electricity Act, meet Regulation 22/04 of the Electrical Safety Act and to
customer satisfaction.
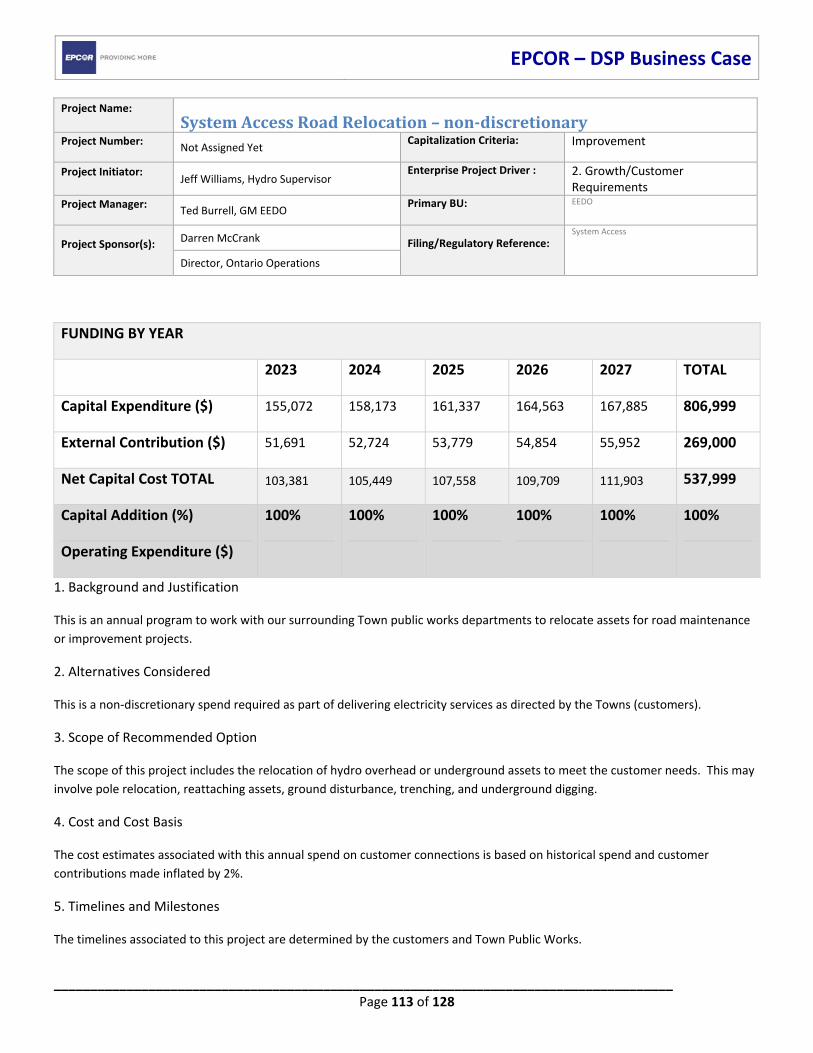
EPCOR – DSP Business Case
_____________________________________________________________________________________ Page 113 of 128
Project Name: SystemAccessRoadRelocation–non‐discretionaryProject Number:
Not Assigned Yet Capitalization Criteria:
Improvement
Project Initiator:
Jeff Williams, Hydro Supervisor Enterprise Project Driver : 2. Growth/Customer
Requirements Project Manager:
Ted Burrell, GM EEDO Primary BU:
EEDO
Project Sponsor(s):
Darren McCrank Filing/Regulatory Reference:
System Access
Director, Ontario Operations
1. Background and Justification
This is an annual program to work with our surrounding Town public works departments to relocate assets for road maintenance
or improvement projects.
2. Alternatives Considered
This is a non‐discretionary spend required as part of delivering electricity services as directed by the Towns (customers).
3. Scope of Recommended Option
The scope of this project includes the relocation of hydro overhead or underground assets to meet the customer needs. This may
involve pole relocation, reattaching assets, ground disturbance, trenching, and underground digging.
4. Cost and Cost Basis
The cost estimates associated with this annual spend on customer connections is based on historical spend and customer
contributions made inflated by 2%.
5. Timelines and Milestones
The timelines associated to this project are determined by the customers and Town Public Works.
FUNDING BY YEAR
2023 2024 2025 2026 2027 TOTAL
Capital Expenditure ($) 155,072 158,173 161,337 164,563 167,885 806,999
External Contribution ($) 51,691 52,724 53,779 54,854 55,952 269,000
Net Capital Cost TOTAL 103,381 105,449 107,558 109,709 111,903 537,999
Capital Addition (%) 100% 100% 100% 100% 100% 100%
Operating Expenditure ($)
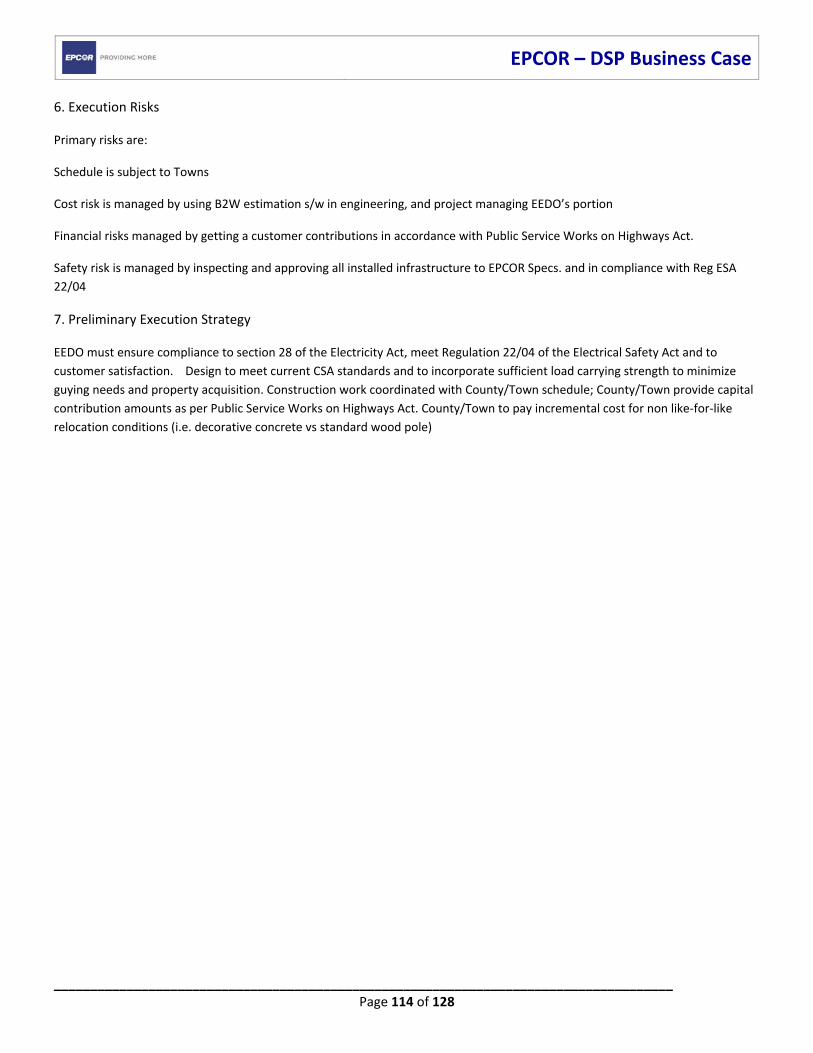
EPCOR – DSP Business Case
_____________________________________________________________________________________ Page 114 of 128
6. Execution Risks
Primary risks are:
Schedule is subject to Towns
Cost risk is managed by using B2W estimation s/w in engineering, and project managing EEDO’s portion
Financial risks managed by getting a customer contributions in accordance with Public Service Works on Highways Act.
Safety risk is managed by inspecting and approving all installed infrastructure to EPCOR Specs. and in compliance with Reg ESA
22/04
7. Preliminary Execution Strategy
EEDO must ensure compliance to section 28 of the Electricity Act, meet Regulation 22/04 of the Electrical Safety Act and to
customer satisfaction. Design to meet current CSA standards and to incorporate sufficient load carrying strength to minimize
guying needs and property acquisition. Construction work coordinated with County/Town schedule; County/Town provide capital
contribution amounts as per Public Service Works on Highways Act. County/Town to pay incremental cost for non like‐for‐like
relocation conditions (i.e. decorative concrete vs standard wood pole)
EPCOR – DSP Business Case
_____________________________________________________________________________________ Page 115 of 128
Project Name: SystemAccessSmartMeterExpenditures–non‐discretionaryProject Number:
Not Assigned Yet Capitalization Criteria:
Extension
Project Initiator:
Dave Lawler, Meter Lead Hand Enterprise Project Driver : 3. Reliability or Life Cycle
Replacement Project Manager:
Ted Burrell, GM EEDO Primary BU:
EEDO
Project Sponsor(s):
Darren McCrank Filing/Regulatory Reference:
System Access
Director, Ontario Operations
1. Background and Justification
This is an annual program to install new meters or test/replace meters at their end of life that need to be certified by
Measurement Canada. The OEB states that meters have a life span of 15 years. Smart meters were first implemented at EEDO in
2008, however those meters were proactively changed out between the years of 2013 to 2015 due to identified issues with those
models. The meters installed between 2009 and 2012 will reach their OEB depreciated end of life in this DSP periods years
between 2024 and 2027.
In 2009, 10855 residential meters and 624 commercial meters were installed. In 2010, 1035 residential meters and 0 commercial
meters were installed. In 2011, 807 residential meters were installed and 90 commercial meters. In 2012, 30 residential meters
were installed and 0 commercial meters.
2. Alternatives Considered
The cost to connect new customers is a non‐discretionary spend required as part of delivering electricity services to residential or
commercial customers.
There are three options to manage the meters that have reached their OEB stated end of life in order to continue to provide end
of life.
FUNDING BY YEAR
2023 2024 2025 2026 2027 TOTAL
Capital Expenditure ($) 377,878 380,962 384,108 387,317 390,589 1,920,854
External Contribution ($)
Net Capital Cost TOTAL 377,878 380,962 384,108 387,317 390,589 1,920,854
Capital Addition (%) 100% 100% 100% 100% 100% 100%
Operating Expenditure ($)
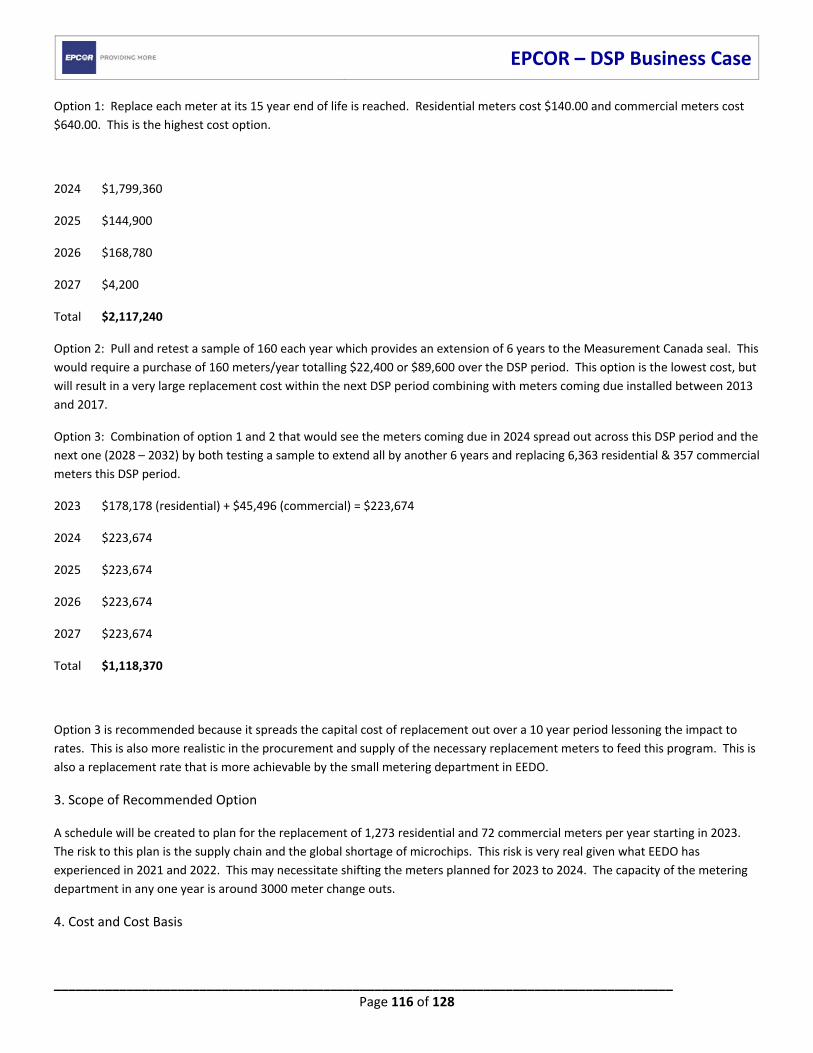
EPCOR – DSP Business Case
_____________________________________________________________________________________ Page 116 of 128
Option 1: Replace each meter at its 15 year end of life is reached. Residential meters cost $140.00 and commercial meters cost
$640.00. This is the highest cost option.
2024 $1,799,360
2025 $144,900
2026 $168,780
2027 $4,200
Total $2,117,240
Option 2: Pull and retest a sample of 160 each year which provides an extension of 6 years to the Measurement Canada seal. This
would require a purchase of 160 meters/year totalling $22,400 or $89,600 over the DSP period. This option is the lowest cost, but
will result in a very large replacement cost within the next DSP period combining with meters coming due installed between 2013
and 2017.
Option 3: Combination of option 1 and 2 that would see the meters coming due in 2024 spread out across this DSP period and the
next one (2028 – 2032) by both testing a sample to extend all by another 6 years and replacing 6,363 residential & 357 commercial
meters this DSP period.
2023 $178,178 (residential) + $45,496 (commercial) = $223,674
2024 $223,674
2025 $223,674
2026 $223,674
2027 $223,674
Total $1,118,370
Option 3 is recommended because it spreads the capital cost of replacement out over a 10 year period lessoning the impact to
rates. This is also more realistic in the procurement and supply of the necessary replacement meters to feed this program. This is
also a replacement rate that is more achievable by the small metering department in EEDO.
3. Scope of Recommended Option
A schedule will be created to plan for the replacement of 1,273 residential and 72 commercial meters per year starting in 2023.
The risk to this plan is the supply chain and the global shortage of microchips. This risk is very real given what EEDO has
experienced in 2021 and 2022. This may necessitate shifting the meters planned for 2023 to 2024. The capacity of the metering
department in any one year is around 3000 meter change outs.
4. Cost and Cost Basis
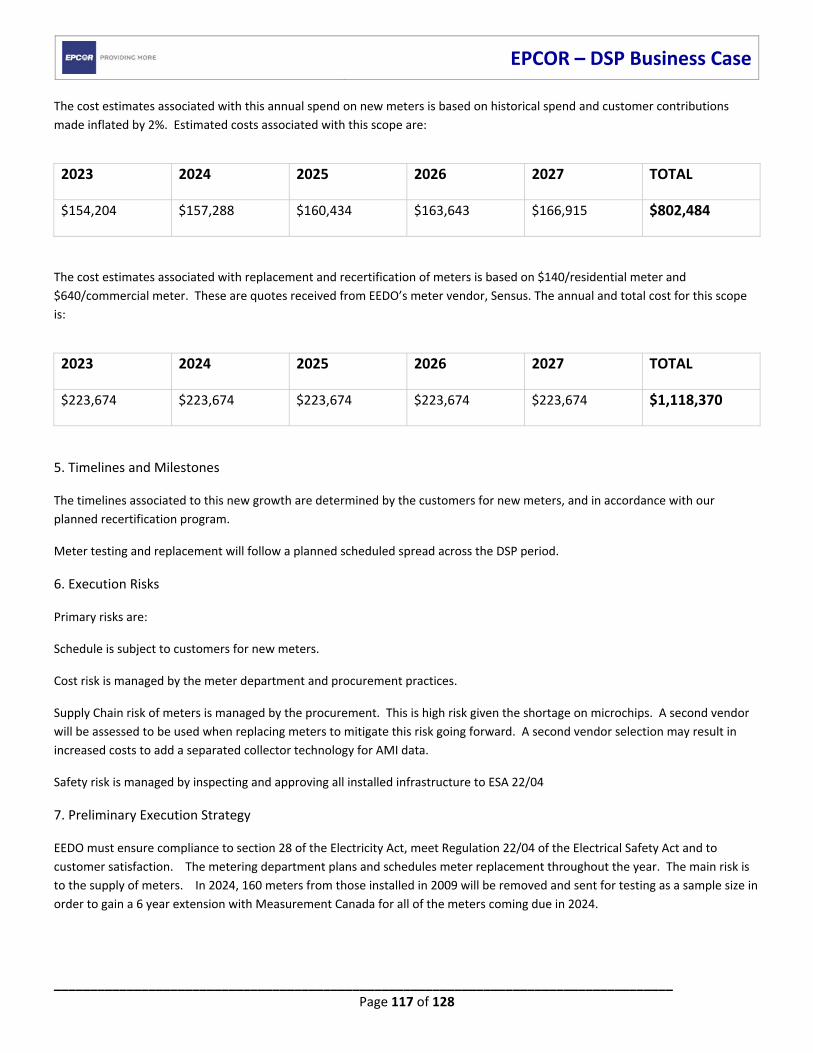
EPCOR – DSP Business Case
_____________________________________________________________________________________ Page 117 of 128
The cost estimates associated with this annual spend on new meters is based on historical spend and customer contributions
made inflated by 2%. Estimated costs associated with this scope are:
The cost estimates associated with replacement and recertification of meters is based on $140/residential meter and
$640/commercial meter. These are quotes received from EEDO’s meter vendor, Sensus. The annual and total cost for this scope
is:
5. Timelines and Milestones
The timelines associated to this new growth are determined by the customers for new meters, and in accordance with our
planned recertification program.
Meter testing and replacement will follow a planned scheduled spread across the DSP period.
6. Execution Risks
Primary risks are:
Schedule is subject to customers for new meters.
Cost risk is managed by the meter department and procurement practices.
Supply Chain risk of meters is managed by the procurement. This is high risk given the shortage on microchips. A second vendor
will be assessed to be used when replacing meters to mitigate this risk going forward. A second vendor selection may result in
increased costs to add a separated collector technology for AMI data.
Safety risk is managed by inspecting and approving all installed infrastructure to ESA 22/04
7. Preliminary Execution Strategy
EEDO must ensure compliance to section 28 of the Electricity Act, meet Regulation 22/04 of the Electrical Safety Act and to
customer satisfaction. The metering department plans and schedules meter replacement throughout the year. The main risk is
to the supply of meters. In 2024, 160 meters from those installed in 2009 will be removed and sent for testing as a sample size in
order to gain a 6 year extension with Measurement Canada for all of the meters coming due in 2024.
2023 2024 2025 2026 2027 TOTAL
$154,204 $157,288 $160,434 $163,643 $166,915 $802,484
2023 2024 2025 2026 2027 TOTAL
$223,674 $223,674 $223,674 $223,674 $223,674 $1,118,370
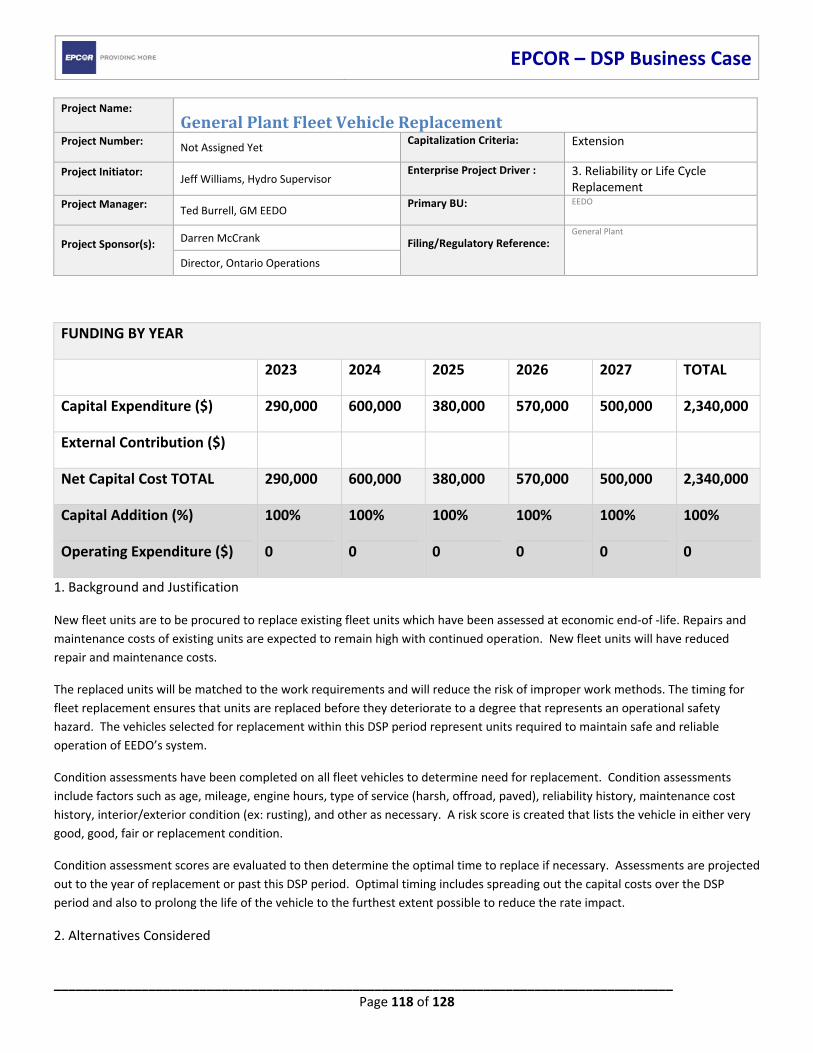
EPCOR – DSP Business Case
_____________________________________________________________________________________ Page 118 of 128
Project Name: GeneralPlantFleetVehicleReplacementProject Number:
Not Assigned Yet Capitalization Criteria:
Extension
Project Initiator:
Jeff Williams, Hydro Supervisor Enterprise Project Driver : 3. Reliability or Life Cycle
Replacement Project Manager:
Ted Burrell, GM EEDO Primary BU:
EEDO
Project Sponsor(s):
Darren McCrank Filing/Regulatory Reference:
General Plant
Director, Ontario Operations
1. Background and Justification
New fleet units are to be procured to replace existing fleet units which have been assessed at economic end‐of ‐life. Repairs and
maintenance costs of existing units are expected to remain high with continued operation. New fleet units will have reduced
repair and maintenance costs.
The replaced units will be matched to the work requirements and will reduce the risk of improper work methods. The timing for
fleet replacement ensures that units are replaced before they deteriorate to a degree that represents an operational safety
hazard. The vehicles selected for replacement within this DSP period represent units required to maintain safe and reliable
operation of EEDO’s system.
Condition assessments have been completed on all fleet vehicles to determine need for replacement. Condition assessments
include factors such as age, mileage, engine hours, type of service (harsh, offroad, paved), reliability history, maintenance cost
history, interior/exterior condition (ex: rusting), and other as necessary. A risk score is created that lists the vehicle in either very
good, good, fair or replacement condition.
Condition assessment scores are evaluated to then determine the optimal time to replace if necessary. Assessments are projected
out to the year of replacement or past this DSP period. Optimal timing includes spreading out the capital costs over the DSP
period and also to prolong the life of the vehicle to the furthest extent possible to reduce the rate impact.
2. Alternatives Considered
FUNDING BY YEAR
2023 2024 2025 2026 2027 TOTAL
Capital Expenditure ($) 290,000 600,000 380,000 570,000 500,000 2,340,000
External Contribution ($)
Net Capital Cost TOTAL 290,000 600,000 380,000 570,000 500,000 2,340,000
Capital Addition (%) 100% 100% 100% 100% 100% 100%
Operating Expenditure ($) 0 0 0 0 0 0
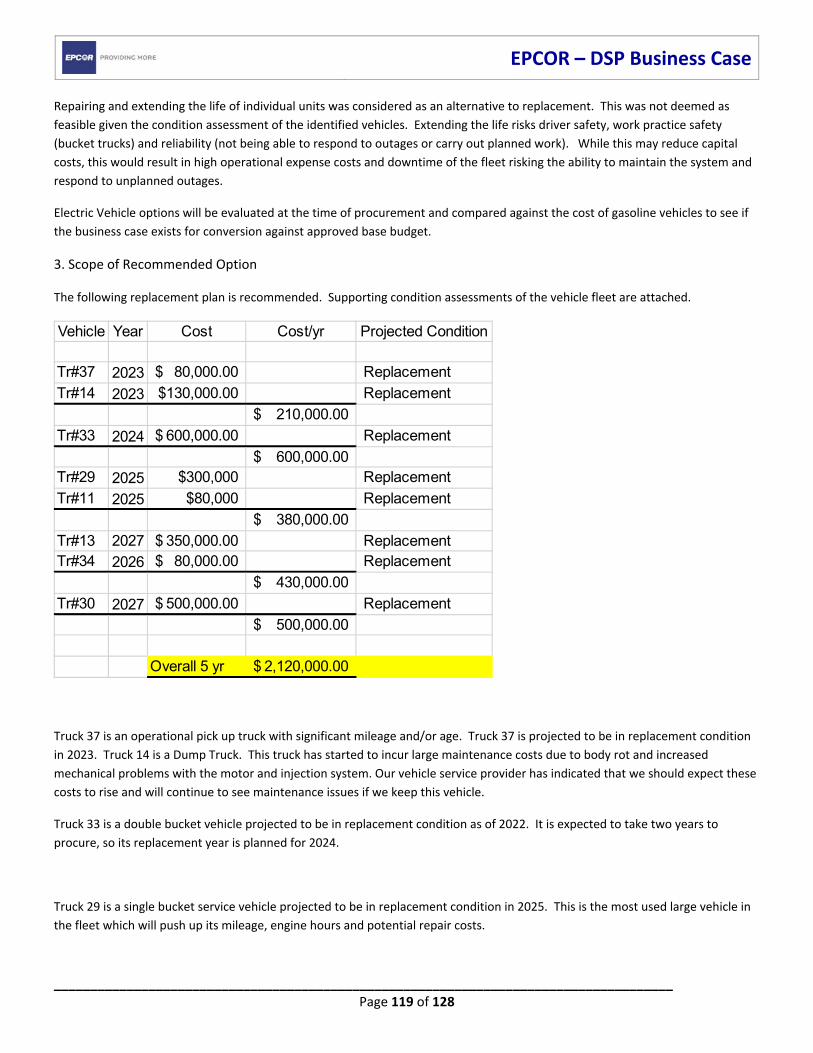
EPCOR – DSP Business Case
_____________________________________________________________________________________ Page 119 of 128
Repairing and extending the life of individual units was considered as an alternative to replacement. This was not deemed as
feasible given the condition assessment of the identified vehicles. Extending the life risks driver safety, work practice safety
(bucket trucks) and reliability (not being able to respond to outages or carry out planned work). While this may reduce capital
costs, this would result in high operational expense costs and downtime of the fleet risking the ability to maintain the system and
respond to unplanned outages.
Electric Vehicle options will be evaluated at the time of procurement and compared against the cost of gasoline vehicles to see if
the business case exists for conversion against approved base budget.
3. Scope of Recommended Option
The following replacement plan is recommended. Supporting condition assessments of the vehicle fleet are attached.
Truck 37 is an operational pick up truck with significant mileage and/or age. Truck 37 is projected to be in replacement condition
in 2023. Truck 14 is a Dump Truck. This truck has started to incur large maintenance costs due to body rot and increased
mechanical problems with the motor and injection system. Our vehicle service provider has indicated that we should expect these
costs to rise and will continue to see maintenance issues if we keep this vehicle.
Truck 33 is a double bucket vehicle projected to be in replacement condition as of 2022. It is expected to take two years to
procure, so its replacement year is planned for 2024.
Truck 29 is a single bucket service vehicle projected to be in replacement condition in 2025. This is the most used large vehicle in
the fleet which will push up its mileage, engine hours and potential repair costs.
Vehicle Year Cost Cost/yr Projected Condition
Tr#37 2023 80,000.00$ Replacement
Tr#14 2023 $130,000.00 Replacement
210,000.00$
Tr#33 2024 600,000.00$ Replacement
600,000.00$ Tr#29 2025 $300,000 Replacement
Tr#11 2025 $80,000 Replacement
380,000.00$
Tr#13 2027 350,000.00$ ReplacementTr#34 2026 80,000.00$ Replacement
430,000.00$
Tr#30 2027 500,000.00$ Replacement
500,000.00$
Overall 5 yr 2,120,000.00$
EPCOR – DSP Business Case
_____________________________________________________________________________________ Page 120 of 128
Truck 11 is an operational pick up truck that will reach replacement condition in 2025. This is based on where this vehicle currently
is positioned in our assessment after 5 years of service and where it will be after an additional 4 years of service with the same
usage. Electric Vehicle options will be evaluated at the time of procurement and compared against the cost of gasoline vehicles to
see if the business case exists for conversion.
Truck 34 is an operational pick up truck with used on a daily basis. Truck 34 is projected to be in replacement condition in 2026.
Electric Vehicle options will be evaluated at the time of procurement and compared against the cost of gasoline vehicles to see if
the business case exists for conversion.
Truck 13 is a 46 foot digger truck used to dig post holes, set poles, and lift transformers. It is projected to be in replacement
condition in 2026. This vehicle was assessed in 2021 and if we project the use of the vehicle to be at least the same, likely it will be
more, over the next 5yrs the vehicle will definitely be in the replacement condition zone. The 62 foot digger is unable to get into
smaller areas requiring the needs for the 46 foot truck.
Truck 30 is a 62 foot digger truck projected to be in replacement condition in 2027. Projections are based on the age the vehicle,
the expected condition of the boom, frame and body of the vehicle (deck had to be replaced in 2021 due to rot) and the mileage
of the vehicle by 2027.
4. Cost and Cost Basis
Costs have been estimated based on historical experience, high level quotes received during planning in 2021, plus inflationary
impacts.
5. Timelines and Milestones
The timelines are listed in section 3. Due to long lead times, procurement starts several years in advance.
6. Execution Risks
Global supply chain remains the number 1 risk associated to the delivery times on these vehicles. Long lead procurement and
good contract management are the methods used to mitigate this risk.
7. Preliminary Execution Strategy
Develop a good request for proposal practice and issue out with plenty of lead time. Once the DSP is approved, EEDO will take
this fleet vehicle replacement plan to our vendors to start the process.
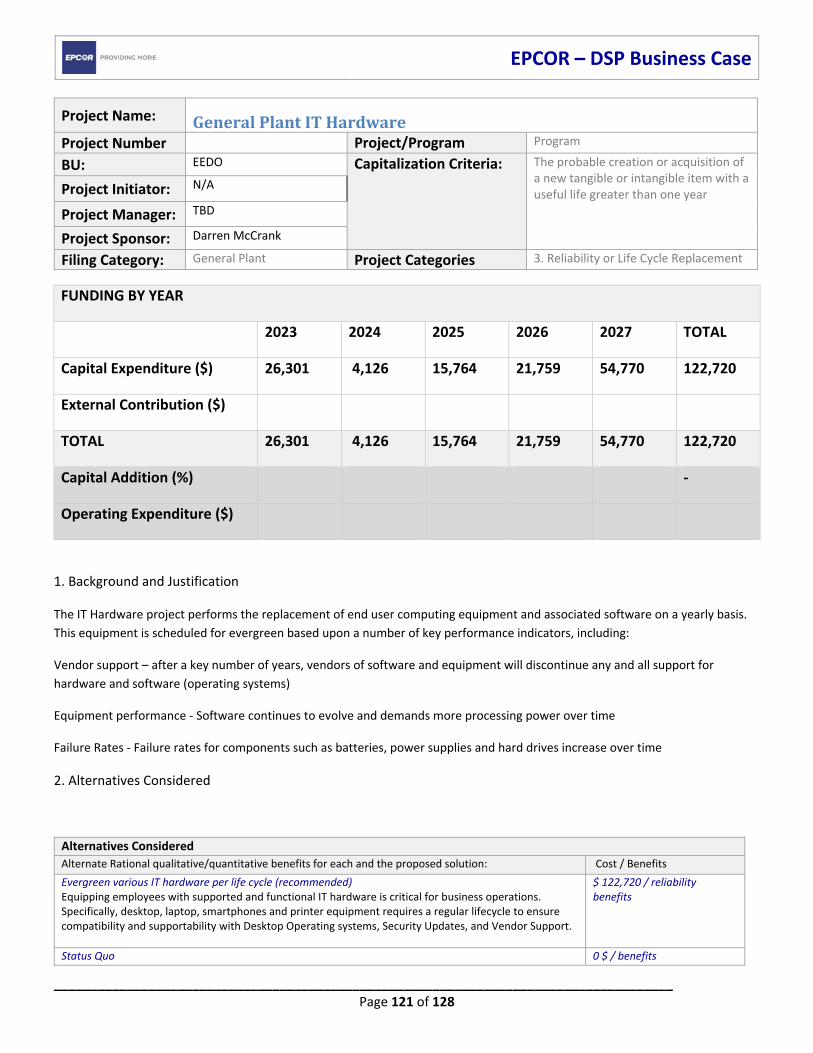
EPCOR – DSP Business Case
_____________________________________________________________________________________ Page 121 of 128
Project Name: GeneralPlantITHardwareProject Number Project/Program Program
BU: EEDO Capitalization Criteria:
The probable creation or acquisition of a new tangible or intangible item with a useful life greater than one year
Project Initiator: N/A
Project Manager: TBD
Project Sponsor: Darren McCrank
Filing Category: General Plant Project Categories 3. Reliability or Life Cycle Replacement
1. Background and Justification
The IT Hardware project performs the replacement of end user computing equipment and associated software on a yearly basis.
This equipment is scheduled for evergreen based upon a number of key performance indicators, including:
Vendor support – after a key number of years, vendors of software and equipment will discontinue any and all support for
hardware and software (operating systems)
Equipment performance ‐ Software continues to evolve and demands more processing power over time
Failure Rates ‐ Failure rates for components such as batteries, power supplies and hard drives increase over time
2. Alternatives Considered
Alternatives Considered
Alternate Rational qualitative/quantitative benefits for each and the proposed solution: Cost / Benefits
Evergreen various IT hardware per life cycle (recommended) Equipping employees with supported and functional IT hardware is critical for business operations. Specifically, desktop, laptop, smartphones and printer equipment requires a regular lifecycle to ensure compatibility and supportability with Desktop Operating systems, Security Updates, and Vendor Support.
$ 122,720 / reliability benefits
Status Quo 0 $ / benefits
FUNDING BY YEAR
2023 2024 2025 2026 2027 TOTAL
Capital Expenditure ($) 26,301 4,126 15,764 21,759 54,770 122,720
External Contribution ($)
TOTAL 26,301 4,126 15,764 21,759 54,770 122,720
Capital Addition (%) ‐
Operating Expenditure ($)
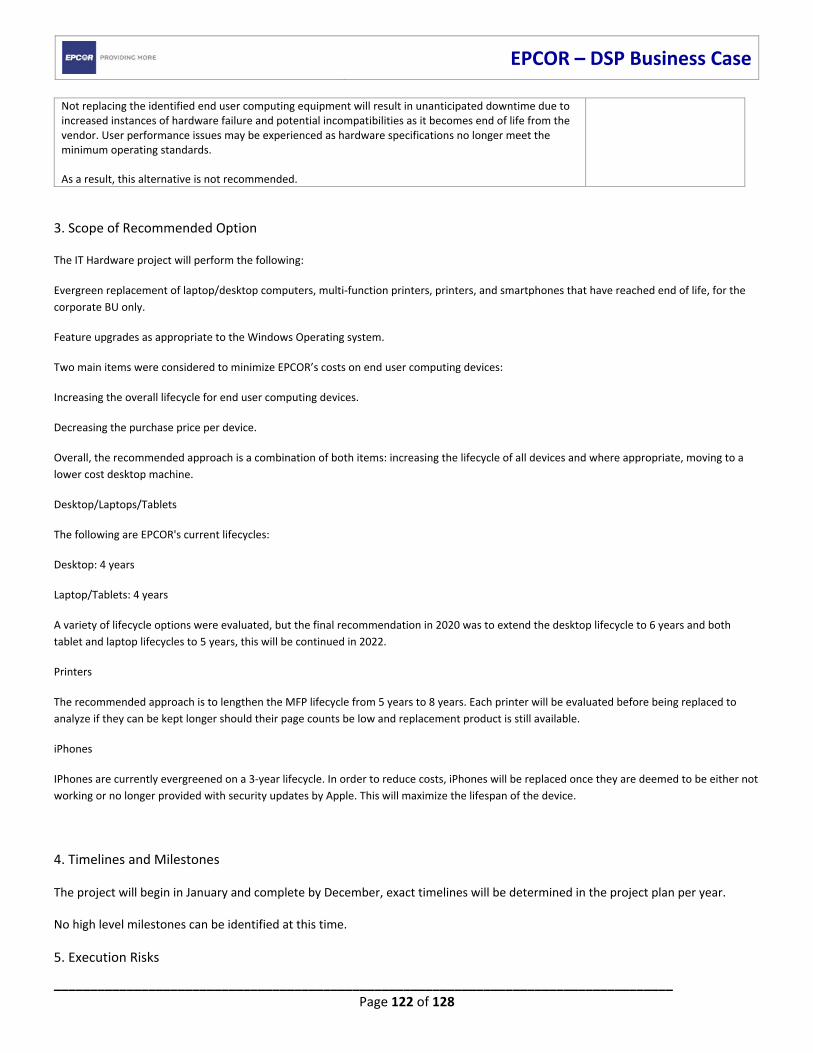
EPCOR – DSP Business Case
_____________________________________________________________________________________ Page 122 of 128
Not replacing the identified end user computing equipment will result in unanticipated downtime due to increased instances of hardware failure and potential incompatibilities as it becomes end of life from the vendor. User performance issues may be experienced as hardware specifications no longer meet the minimum operating standards. As a result, this alternative is not recommended.
3. Scope of Recommended Option
The IT Hardware project will perform the following:
Evergreen replacement of laptop/desktop computers, multi‐function printers, printers, and smartphones that have reached end of life, for the
corporate BU only.
Feature upgrades as appropriate to the Windows Operating system.
Two main items were considered to minimize EPCOR’s costs on end user computing devices:
Increasing the overall lifecycle for end user computing devices.
Decreasing the purchase price per device.
Overall, the recommended approach is a combination of both items: increasing the lifecycle of all devices and where appropriate, moving to a
lower cost desktop machine.
Desktop/Laptops/Tablets
The following are EPCOR's current lifecycles:
Desktop: 4 years
Laptop/Tablets: 4 years
A variety of lifecycle options were evaluated, but the final recommendation in 2020 was to extend the desktop lifecycle to 6 years and both
tablet and laptop lifecycles to 5 years, this will be continued in 2022.
Printers
The recommended approach is to lengthen the MFP lifecycle from 5 years to 8 years. Each printer will be evaluated before being replaced to
analyze if they can be kept longer should their page counts be low and replacement product is still available.
iPhones
IPhones are currently evergreened on a 3‐year lifecycle. In order to reduce costs, iPhones will be replaced once they are deemed to be either not
working or no longer provided with security updates by Apple. This will maximize the lifespan of the device.
4. Timelines and Milestones
The project will begin in January and complete by December, exact timelines will be determined in the project plan per year.
No high level milestones can be identified at this time.
5. Execution Risks
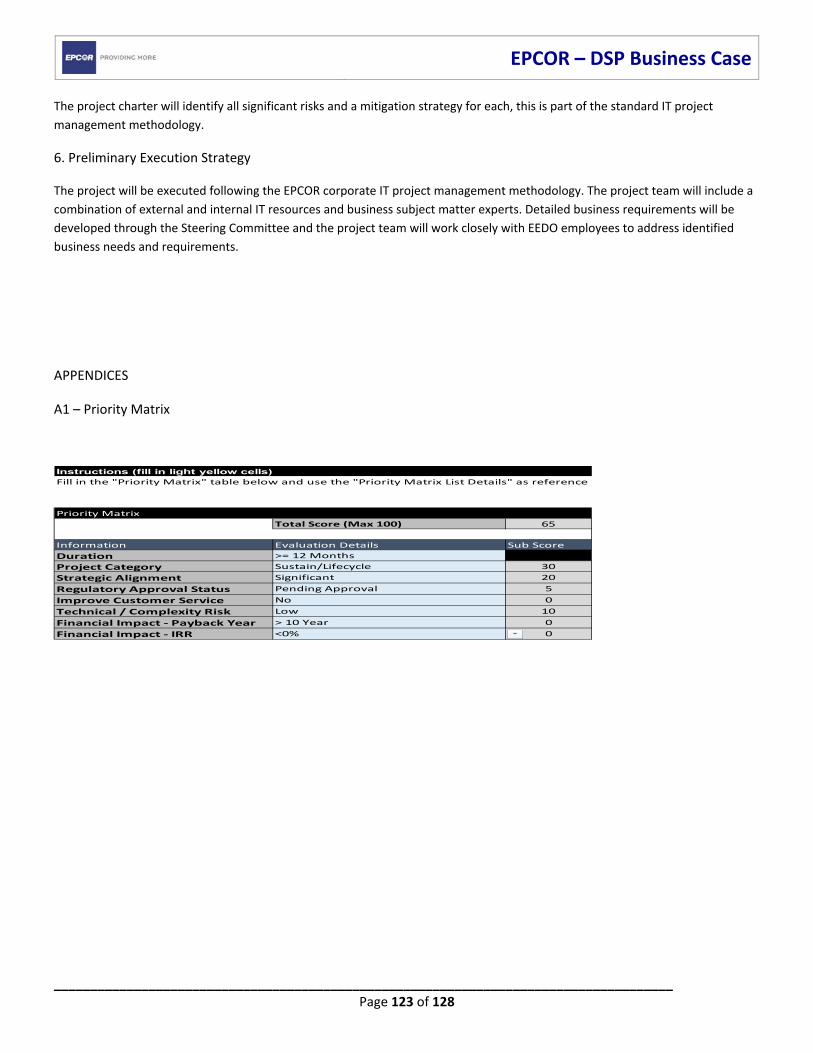
EPCOR – DSP Business Case
_____________________________________________________________________________________ Page 123 of 128
The project charter will identify all significant risks and a mitigation strategy for each, this is part of the standard IT project
management methodology.
6. Preliminary Execution Strategy
The project will be executed following the EPCOR corporate IT project management methodology. The project team will include a
combination of external and internal IT resources and business subject matter experts. Detailed business requirements will be
developed through the Steering Committee and the project team will work closely with EEDO employees to address identified
business needs and requirements.
APPENDICES
A1 – Priority Matrix
Instructions (fill in light yellow cells)
Priority Matrix
Total Score (Max 100) 65
Information Evaluation Details Sub Score
Duration >= 12 Months
Project Category Sustain/Lifecycle 30
Strategic Alignment Significant 20
Regulatory Approval Status Pending Approval 5
Improve Customer Service No 0
Technical / Complexity Risk Low 10
Financial Impact ‐ Payback Year > 10 Year 0
Financial Impact ‐ IRR <0% 0
Fill in the "Priority Matrix" table below and use the "Priority Matrix List Details" as reference
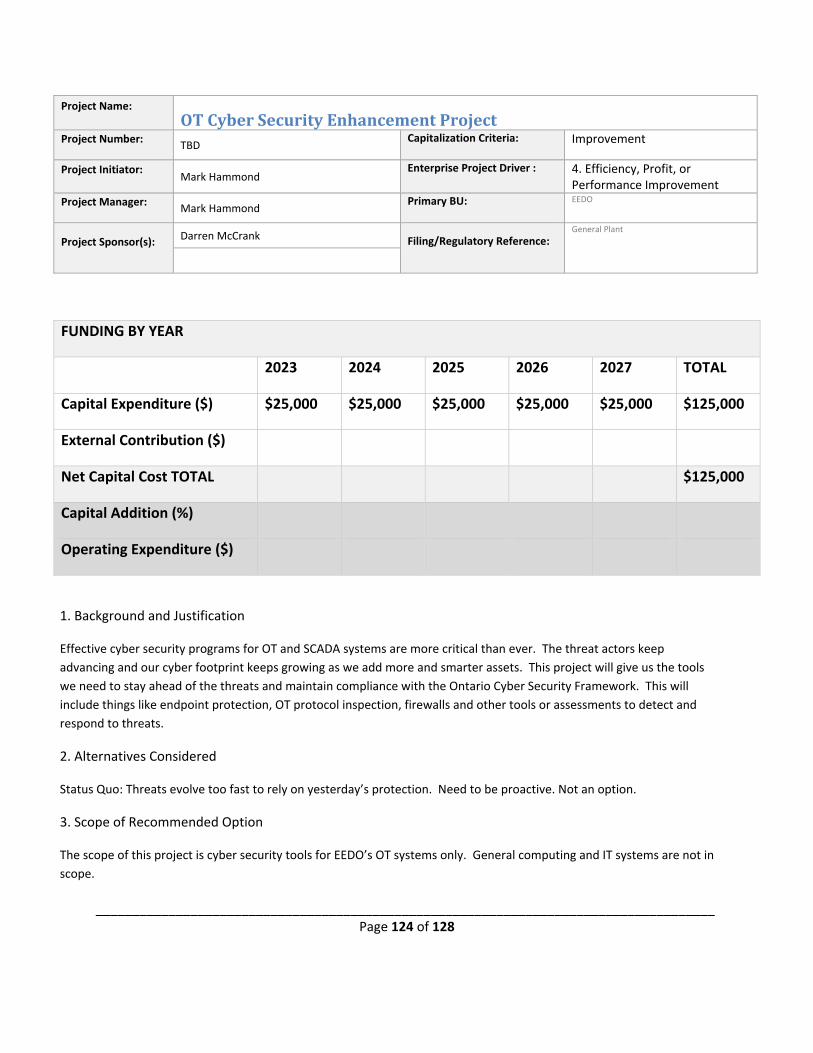
_____________________________________________________________________________________ Page 124 of 128
Project Name: OTCyberSecurityEnhancementProjectProject Number:
TBD Capitalization Criteria:
Improvement
Project Initiator:
Mark Hammond Enterprise Project Driver : 4. Efficiency, Profit, or
Performance Improvement Project Manager:
Mark Hammond Primary BU:
EEDO
Project Sponsor(s):
Darren McCrank Filing/Regulatory Reference:
General Plant
1. Background and Justification
Effective cyber security programs for OT and SCADA systems are more critical than ever. The threat actors keep
advancing and our cyber footprint keeps growing as we add more and smarter assets. This project will give us the tools
we need to stay ahead of the threats and maintain compliance with the Ontario Cyber Security Framework. This will
include things like endpoint protection, OT protocol inspection, firewalls and other tools or assessments to detect and
respond to threats.
2. Alternatives Considered
Status Quo: Threats evolve too fast to rely on yesterday’s protection. Need to be proactive. Not an option.
3. Scope of Recommended Option
The scope of this project is cyber security tools for EEDO’s OT systems only. General computing and IT systems are not in
scope.
FUNDING BY YEAR
2023 2024 2025 2026 2027 TOTAL
Capital Expenditure ($) $25,000 $25,000 $25,000 $25,000 $25,000 $125,000
External Contribution ($)
Net Capital Cost TOTAL $125,000
Capital Addition (%)
Operating Expenditure ($)
EPCOR – DSP Business Case
_____________________________________________________________________________________ Page 125 of 128
4. Cost and Cost Basis
Amounts are based on budgetary estimates for industry standard solutions obtained from reputable contractors and
include EEDO’s own costs.
5. Timelines and Milestones
The project will be completed in 2027.
6. Execution Risks
This project is to reduce or eliminate risks that currently exist. This far outweighs the risks of implementation.
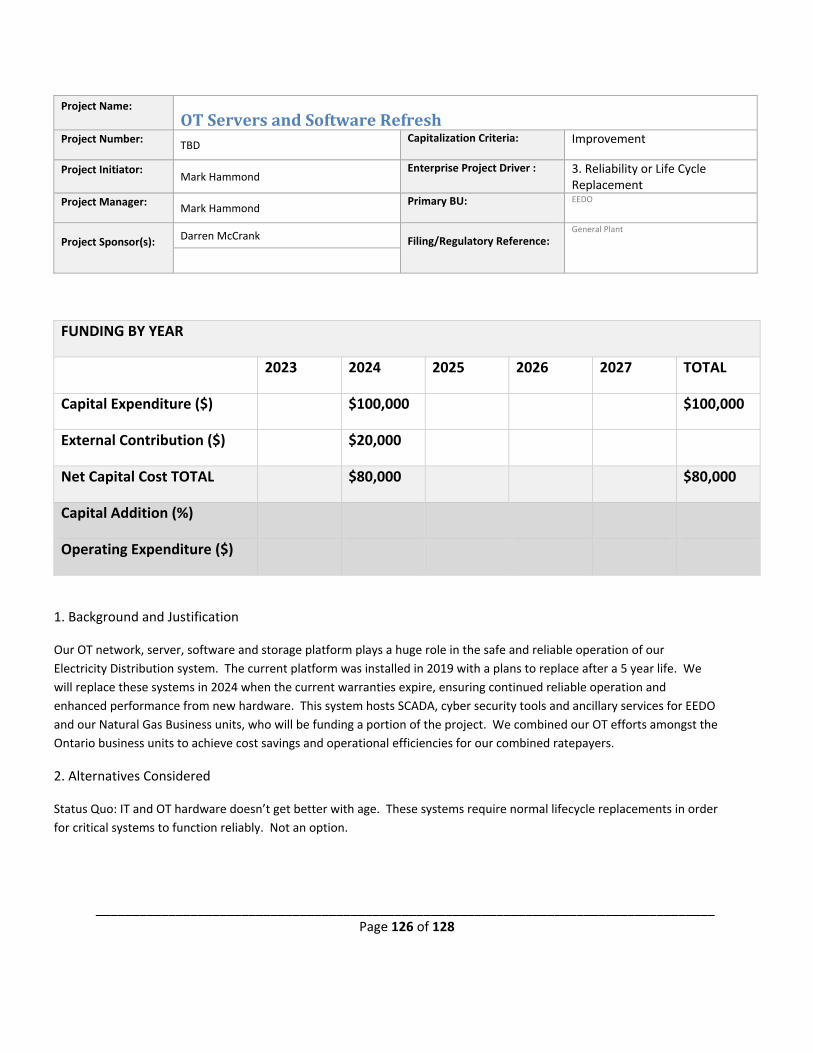
_____________________________________________________________________________________ Page 126 of 128
Project Name: OTServersandSoftwareRefreshProject Number:
TBD Capitalization Criteria:
Improvement
Project Initiator:
Mark Hammond Enterprise Project Driver : 3. Reliability or Life Cycle
Replacement Project Manager:
Mark Hammond Primary BU:
EEDO
Project Sponsor(s):
Darren McCrank Filing/Regulatory Reference:
General Plant
1. Background and Justification
Our OT network, server, software and storage platform plays a huge role in the safe and reliable operation of our
Electricity Distribution system. The current platform was installed in 2019 with a plans to replace after a 5 year life. We
will replace these systems in 2024 when the current warranties expire, ensuring continued reliable operation and
enhanced performance from new hardware. This system hosts SCADA, cyber security tools and ancillary services for EEDO
and our Natural Gas Business units, who will be funding a portion of the project. We combined our OT efforts amongst the
Ontario business units to achieve cost savings and operational efficiencies for our combined ratepayers.
2. Alternatives Considered
Status Quo: IT and OT hardware doesn’t get better with age. These systems require normal lifecycle replacements in order
for critical systems to function reliably. Not an option.
FUNDING BY YEAR
2023 2024 2025 2026 2027 TOTAL
Capital Expenditure ($) $100,000
$100,000
External Contribution ($) $20,000
Net Capital Cost TOTAL $80,000 $80,000
Capital Addition (%)
Operating Expenditure ($)
EPCOR – DSP Business Case
_____________________________________________________________________________________ Page 127 of 128
Purchasing extended warranties for existing hardware: Extended warranties are useful for quickly restoring failed systems
and providing support and patches, but they do nothing to prevent failures before they occur. We wish to avoid failure
from aging systems with new hardware.
3. Scope of Recommended Option
This project will have EEDO acquire and install a new OT network and server system in 2024. We will migrate the existing
SCADA system software.
4. Cost and Cost Basis
Amounts are based on budgetary estimates for industry standard solutions obtained from reputable contractors and
include EEDO’s own costs.
5. Timelines and Milestones
The project will be completed in 2024.
6. Execution Risks
This project is to reduce or eliminate risks that currently exist. This far outweighs the risks of implementation.
EPCOR – DSP Business Case
_____________________________________________________________________________________ Page 128 of 128
Appendices
METSCOAssetConditionAssessment
VehicleFleetConditionAssessment
EEDOCustomerSurveyResults
EPCOR Ontario Asset Condition Assessment
METSCO Energy Solutions #215; 2550 Matheson Blvd. E, Mississauga, ON, L4W 4Z1
Phone: 905–232–7300 Website: metsco.ca
P a g e | 1
EPCOR Ontario Asset Condition Assessment
METSCO Energy Solutions #215; 2550 Matheson Blvd. E, Mississauga, ON, L4W 4Z1
Phone: 905–232–7300 Website: metsco.ca
P a g e | 2
<page left blank intentionally>
EPCOR Ontario Asset Condition Assessment
METSCO Energy Solutions #215; 2550 Matheson Blvd. E, Mississauga, ON, L4W 4Z1
Phone: 905–232–7300 Website: metsco.ca
P a g e | 3
__________________________________________________________________________________
ASSET CONDITION ASSESSMENT
__________________________________________________________________________________
Prepared by
METSCO Report no. 21-133-001-IFR
August 18th, 2021
EPCOR Ontario Asset Condition Assessment
METSCO Energy Solutions #215; 2550 Matheson Blvd. E, Mississauga, ON, L4W 4Z1
Phone: 905–232–7300 Website: metsco.ca
P a g e | 4
Disclaimer
This 2021 report has been prepared by METSCO Energy Solutions Inc. (“METSCO”) for
EPCOR Electricity Distribution Ontario (EPCOR Ontario). Neither EPCOR Ontario, nor
METSCO, nor any other person acting on their behalf makes any warranty, expressed or
implied, or assumes any legal responsibility for the accuracy of any information or for the
completeness or usefulness of any process disclosed or results presented, or accepts
liability for the use, or damages resulting from the use, thereof. Any reference in this report
to any specific process or service by trade name, trademark, manufacturer, or otherwise
does not necessarily constitute or imply its endorsement or recommendation by EPCOR
Ontario or METSCO.
EPCOR Ontario Asset Condition Assessment
METSCO Energy Solutions #215; 2550 Matheson Blvd. E, Mississauga, ON, L4W 4Z1
Phone: 905–232–7300 Website: metsco.ca
P a g e | 5
Asset Condition Assessment Report 2021
August 20th, 2021
Study By: Syeda Fatima Associate, Asset Management Analytics Ben Krett Analyst, Asset Management Analytics
Review & Approval:
Kurtis Martin-Sturmey, P.Eng. Manager, Infrastructure Advisory
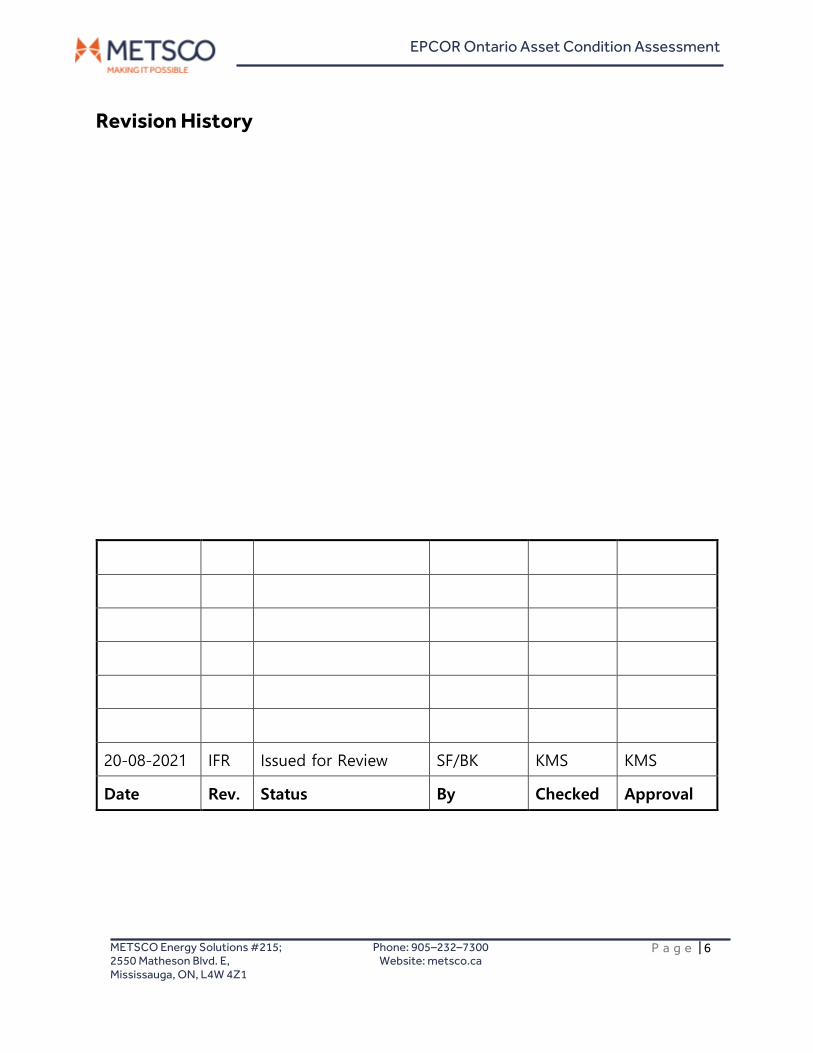
EPCOR Ontario Asset Condition Assessment
METSCO Energy Solutions #215; 2550 Matheson Blvd. E, Mississauga, ON, L4W 4Z1
Phone: 905–232–7300 Website: metsco.ca
P a g e | 6
Revision History
20-08-2021 IFR Issued for Review SF/BK KMS KMS
Date Rev. Status By Checked Approval
EPCOR Ontario Asset Condition Assessment
METSCO Energy Solutions #215; 2550 Matheson Blvd. E, Mississauga, ON, L4W 4Z1
Phone: 905–232–7300 Website: metsco.ca
P a g e | 7
Executive Summary
Context of the Study
EPCOR Electricity Distribution Ontario (“EPCOR Ontario”) is an electricity distributor
operating a system made up of 14 substations delivering electricity to approximately 20,000
residential and commercial customers in the Town of Collingwood, the Village of Stayner,
the Village of Creemore, and a portion of the Town of Blue Mountains. EPCOR Ontario
engaged METSCO Energy Solutions Ins. (“METSCO”) to prepare an Asset Condition
Assessment (“ACA”) study for a selection of the assets comprising EPCOR Ontario’s
distribution system. The ACA is required as one of the key inputs for the preparation of
EPCOR Ontario’s five-year Distribution System Plan (“DSP”), developed in accordance with
the filing requirements for electricity distributors enacted by the Ontario Energy Board
(“OEB”).
Scope of the Study
METSCO’s work included review and consolidation of the client’s data sets, analysis of
EPCOR Ontario’s asset records to calculate the Health Index Values, and preparation of the
final document. In total METSCO assessed and calculated Health Index values for the
following asset classes:
• Distribution Wood Poles
• Distribution Concrete Poles
• Distribution Aluminum Poles
• Station Power Transformers (oil-filled and FR3-filled)
All asset condition data used in the study is maintained by EPCOR Ontario as part of its
regular asset management practices. The ACA results are based on condition data recorded
by EPCOR Ontario and its contractors up to the end of May 2021. This information was
provided to METSCO between June and July 2021.
Methodology and Findings
For all asset classes that underwent assessment, METSCO used a consistent scale of asset
health from Very Good to Very Poor. The numerical Health Index (“HI”) corresponding to
each condition category serves as an indicator of an asset’s remaining life, expressed as a
percentage. Table 0-1 presents the HI ranges corresponding to each condition score, along
with their corresponding implications as to the follow-up actions required by the asset
manager at EPCOR Ontario.
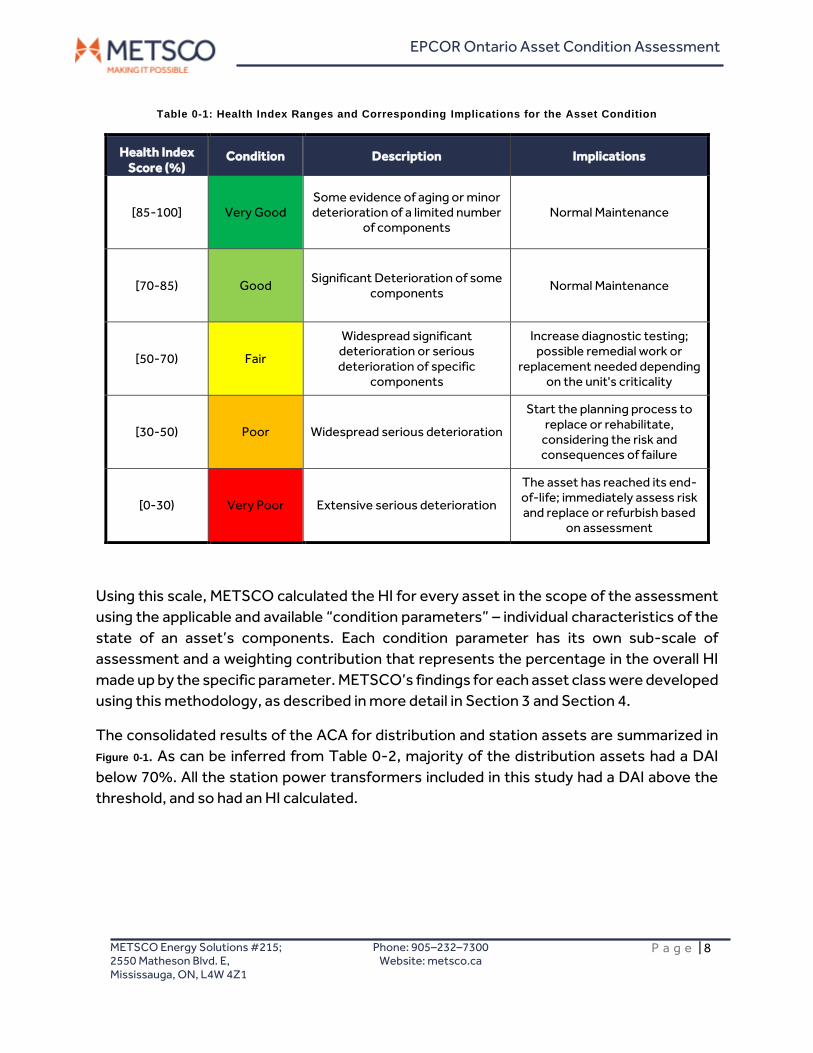
EPCOR Ontario Asset Condition Assessment
METSCO Energy Solutions #215; 2550 Matheson Blvd. E, Mississauga, ON, L4W 4Z1
Phone: 905–232–7300 Website: metsco.ca
P a g e | 8
Table 0-1: Health Index Ranges and Corresponding Implications for the Asset Condition
Health Index Score (%)
Condition Description Implications
[85-100] Very Good Some evidence of aging or minor deterioration of a limited number
of components Normal Maintenance
[70-85) Good Significant Deterioration of some
components Normal Maintenance
[50-70) Fair
Widespread significant deterioration or serious deterioration of specific
components
Increase diagnostic testing; possible remedial work or
replacement needed depending on the unit's criticality
[30-50) Poor Widespread serious deterioration
Start the planning process to replace or rehabilitate,
considering the risk and consequences of failure
[0-30) Very Poor Extensive serious deterioration
The asset has reached its end-of-life; immediately assess risk and replace or refurbish based
on assessment
Using this scale, METSCO calculated the HI for every asset in the scope of the assessment
using the applicable and available “condition parameters” – individual characteristics of the
state of an asset’s components. Each condition parameter has its own sub-scale of
assessment and a weighting contribution that represents the percentage in the overall HI
made up by the specific parameter. METSCO’s findings for each asset class were developed
using this methodology, as described in more detail in Section 3 and Section 4.
The consolidated results of the ACA for distribution and station assets are summarized in
Figure 0-1. As can be inferred from Table 0-2, majority of the distribution assets had a DAI
below 70%. All the station power transformers included in this study had a DAI above the
threshold, and so had an HI calculated.
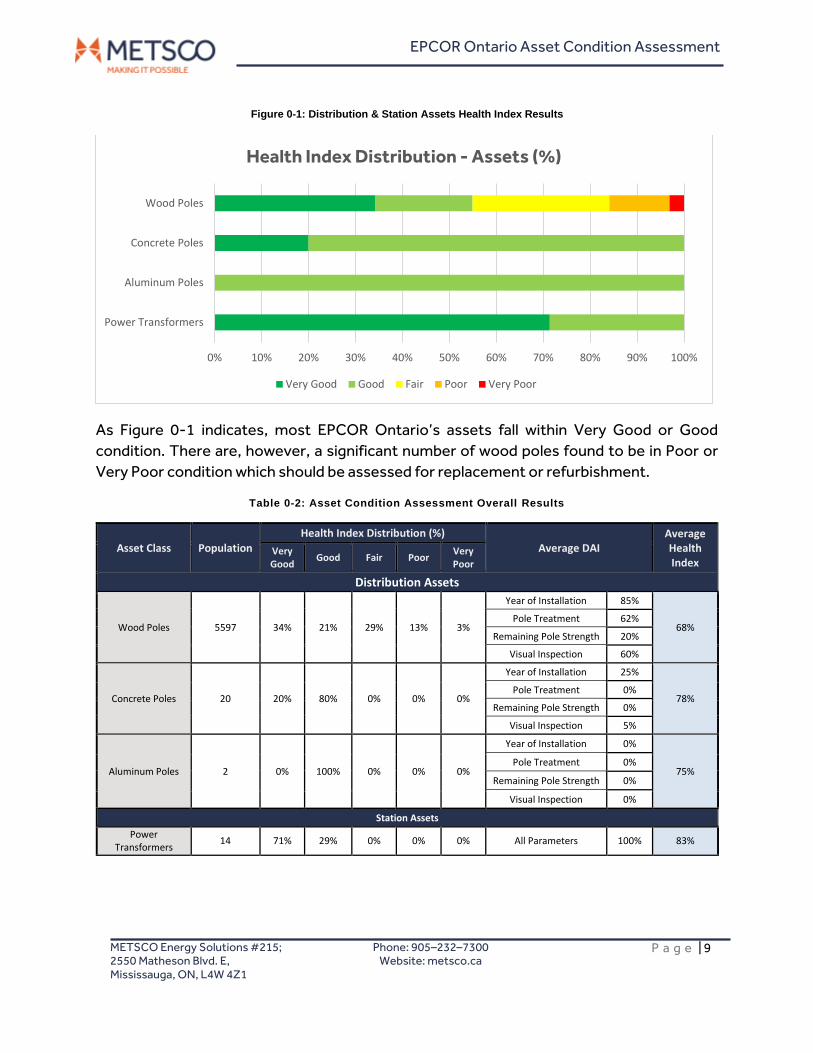
EPCOR Ontario Asset Condition Assessment
METSCO Energy Solutions #215; 2550 Matheson Blvd. E, Mississauga, ON, L4W 4Z1
Phone: 905–232–7300 Website: metsco.ca
P a g e | 9
Figure 0-1: Distribution & Station Assets Health Index Results
As Figure 0-1 indicates, most EPCOR Ontario’s assets fall within Very Good or Good
condition. There are, however, a significant number of wood poles found to be in Poor or
Very Poor condition which should be assessed for replacement or refurbishment.
Table 0-2: Asset Condition Assessment Overall Results
Asset Class Population
Health Index Distribution (%)
Average DAI Average Health Index
Very Good
Good Fair Poor Very Poor
Distribution Assets
Wood Poles 5597 34% 21% 29% 13% 3%
Year of Installation 85%
68% Pole Treatment 62%
Remaining Pole Strength 20%
Visual Inspection 60%
Concrete Poles 20 20% 80% 0% 0% 0%
Year of Installation 25%
78% Pole Treatment 0%
Remaining Pole Strength 0%
Visual Inspection 5%
Aluminum Poles 2 0% 100% 0% 0% 0%
Year of Installation 0%
75% Pole Treatment 0%
Remaining Pole Strength 0%
Visual Inspection 0%
Station Assets
Power Transformers
14 71% 29% 0% 0% 0% All Parameters 100% 83%
0% 10% 20% 30% 40% 50% 60% 70% 80% 90% 100%
Wood Poles
Concrete Poles
Aluminum Poles
Power Transformers
Health Index Distribution - Assets (%)
Very Good Good Fair Poor Very Poor
EPCOR Ontario Asset Condition Assessment
METSCO Energy Solutions #215; 2550 Matheson Blvd. E, Mississauga, ON, L4W 4Z1
Phone: 905–232–7300 Website: metsco.ca
P a g e | 10
EPCOR Ontario’s Current Health Index Maturity and Continuous Improvement
Overall, EPCOR Ontario’s asset data collection practices are sufficiently robust to enable
calculation of the recommended ACA that is consistent with industry best practices for the
asset classes in this study. EPCOR Ontario would benefit from enhanced documentation of
its asset inspection and maintenance practices using mobile workforce tools connected to
a Centralized Maintenance Management System.
For the wood poles analyzed, there are some opportunities to improve the data availability
and data quality. EPCOR Ontario aimed at conducting resistograph test on all distribution
wood poles that are older than 20 years of age. Currently, EPCOR Ontario houses
resistograph test data for just one-third of the total in-service wood pole population under
consideration. It was identified that majority of the wood poles beyond 20 years of age were
not tested, and some wood poles tested were younger than 20 years of age. Over the
following years, EPCOR Ontario can look to consistently produce resistograph test results
for wood poles older than 20 years of age.
Additionally, about one-fifth of the wood poles under consideration had both installation
and manufacture dates unknown. To calculate pole service age, these data deficiencies
were supplemented by applying a predictive analytics algorithm to predict pole
manufacture years. Several inputs were used as main predictors to run this algorithm such
as pole height, pole class, pole type, pole coordinates, etc. Few of these predictor fields
were also missing allowing for subsequent data assumptions and the pole ages were
calculated. It is recommended that EPCOR Ontario look to fill in these data gaps in future as
old, archived poles are being replaced by new poles in-field.
The power transformers included in this assessment had a very high data availability index,
and hence, a full analysis could be done without any assumptions. Power transformer data
is currently collected via paper forms, which should be automatically digitized in the future.
In providing these recommendations, METSCO is cognizant of the fact that regulated
utilities are facing cost constraints across numerous facets of their operations, while
contending with the effects of aging infrastructure, changing climate, evolving customer
needs, and many other priorities. As such, an adoption of any incremental enhancement to
the existing asset data collection practices must be grounded in management’s assessment
of the incremental value of such enhancements, relative to the opportunity cost of
advancements elsewhere in the utility’s operations. METSCO makes this observation to
highlight its position that the sole fact of a gap between a utility’s current process state and
the industry best practices need not necessarily indicate that an action to remedy that gap
is required in short order.
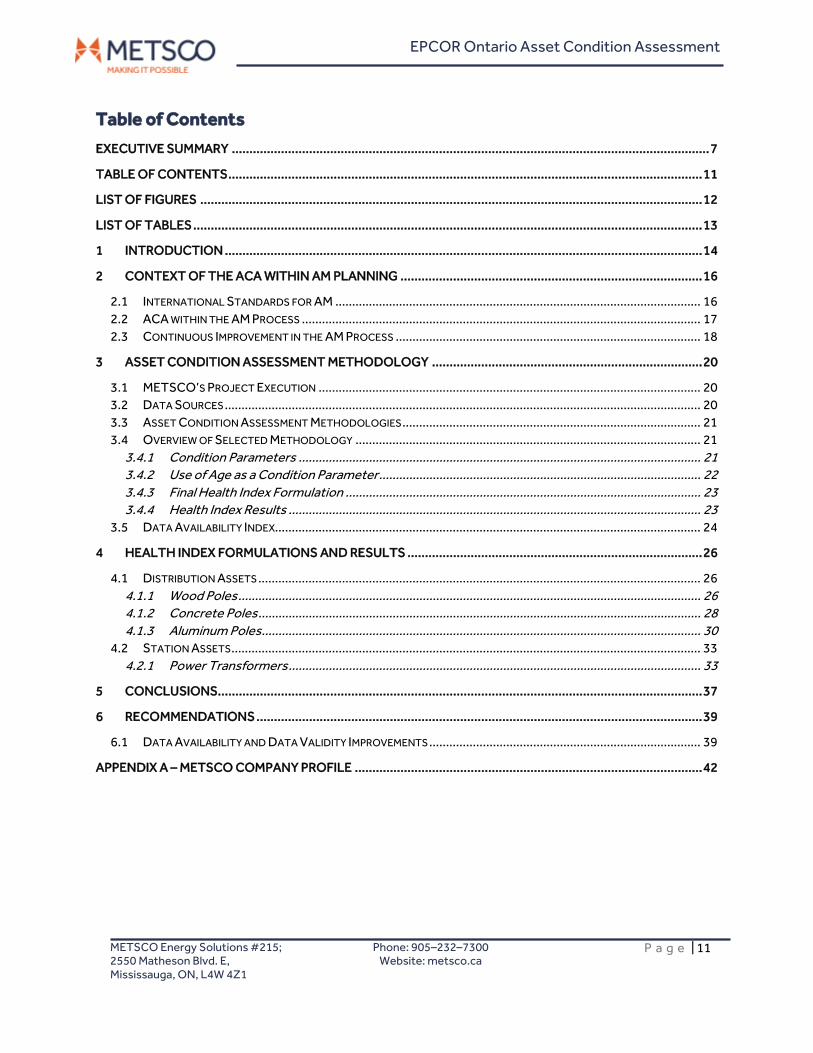
EPCOR Ontario Asset Condition Assessment
METSCO Energy Solutions #215; 2550 Matheson Blvd. E, Mississauga, ON, L4W 4Z1
Phone: 905–232–7300 Website: metsco.ca
P a g e | 11
Table of Contents
EXECUTIVE SUMMARY ........................................................................................................................................ 7
TABLE OF CONTENTS ....................................................................................................................................... 11
LIST OF FIGURES ............................................................................................................................................... 12
LIST OF TABLES ................................................................................................................................................. 13
1 INTRODUCTION ........................................................................................................................................ 14
2 CONTEXT OF THE ACA WITHIN AM PLANNING ...................................................................................... 16
2.1 INTERNATIONAL STANDARDS FOR AM ............................................................................................................. 16 2.2 ACA WITHIN THE AM PROCESS ....................................................................................................................... 17 2.3 CONTINUOUS IMPROVEMENT IN THE AM PROCESS ........................................................................................... 18
3 ASSET CONDITION ASSESSMENT METHODOLOGY ............................................................................. 20
3.1 METSCO’S PROJECT EXECUTION .................................................................................................................. 20 3.2 DATA SOURCES .............................................................................................................................................. 20 3.3 ASSET CONDITION ASSESSMENT METHODOLOGIES ......................................................................................... 21 3.4 OVERVIEW OF SELECTED METHODOLOGY ....................................................................................................... 21
3.4.1 Condition Parameters ........................................................................................................................ 21 3.4.2 Use of Age as a Condition Parameter ................................................................................................ 22 3.4.3 Final Health Index Formulation .......................................................................................................... 23 3.4.4 Health Index Results ........................................................................................................................... 23
3.5 DATA AVAILABILITY INDEX............................................................................................................................... 24
4 HEALTH INDEX FORMULATIONS AND RESULTS .................................................................................... 26
4.1 DISTRIBUTION ASSETS .................................................................................................................................... 26 4.1.1 Wood Poles .......................................................................................................................................... 26 4.1.2 Concrete Poles .................................................................................................................................... 28 4.1.3 Aluminum Poles ................................................................................................................................... 30
4.2 STATION ASSETS ............................................................................................................................................ 33 4.2.1 Power Transformers ........................................................................................................................... 33
5 CONCLUSIONS.......................................................................................................................................... 37
6 RECOMMENDATIONS ............................................................................................................................... 39
6.1 DATA AVAILABILITY AND DATA VALIDITY IMPROVEMENTS ................................................................................. 39
APPENDIX A – METSCO COMPANY PROFILE ................................................................................................... 42
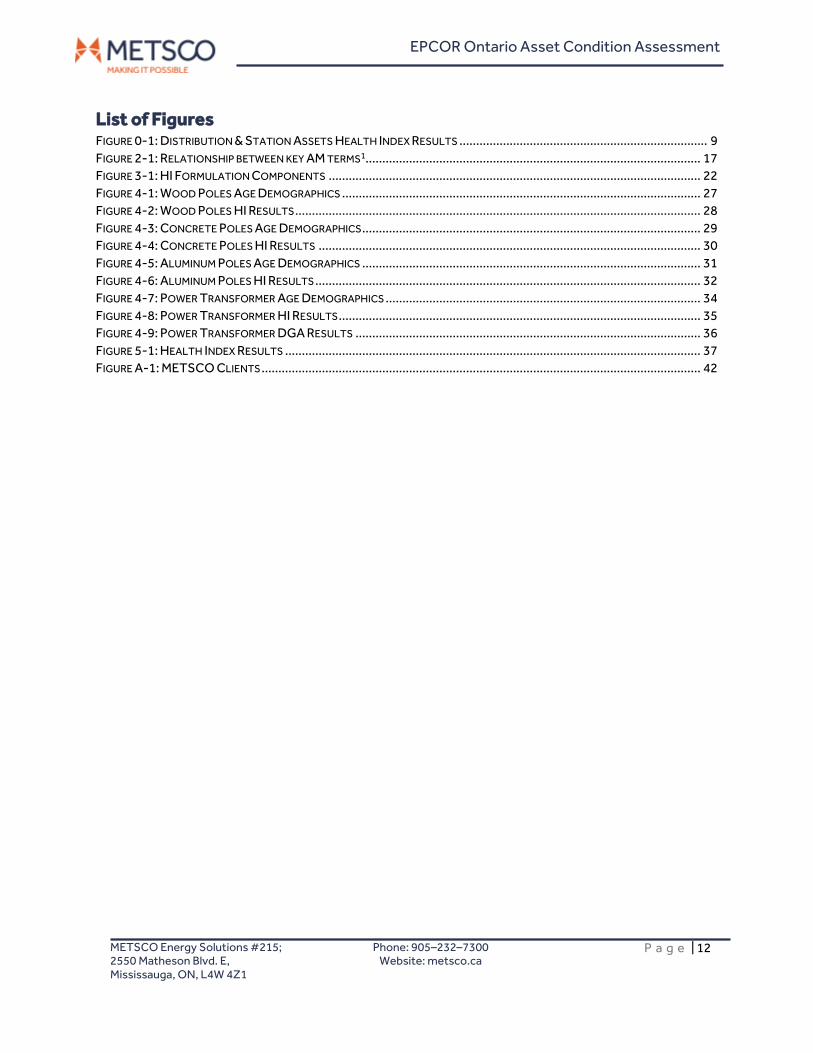
EPCOR Ontario Asset Condition Assessment
METSCO Energy Solutions #215; 2550 Matheson Blvd. E, Mississauga, ON, L4W 4Z1
Phone: 905–232–7300 Website: metsco.ca
P a g e | 12
List of Figures FIGURE 0-1: DISTRIBUTION & STATION ASSETS HEALTH INDEX RESULTS .......................................................................... 9
FIGURE 2-1: RELATIONSHIP BETWEEN KEY AM TERMS1 .................................................................................................... 17
FIGURE 3-1: HI FORMULATION COMPONENTS ............................................................................................................... 22
FIGURE 4-1: WOOD POLES AGE DEMOGRAPHICS ........................................................................................................... 27
FIGURE 4-2: WOOD POLES HI RESULTS ......................................................................................................................... 28
FIGURE 4-3: CONCRETE POLES AGE DEMOGRAPHICS ..................................................................................................... 29
FIGURE 4-4: CONCRETE POLES HI RESULTS .................................................................................................................. 30
FIGURE 4-5: ALUMINUM POLES AGE DEMOGRAPHICS ..................................................................................................... 31
FIGURE 4-6: ALUMINUM POLES HI RESULTS ................................................................................................................... 32
FIGURE 4-7: POWER TRANSFORMER AGE DEMOGRAPHICS .............................................................................................. 34
FIGURE 4-8: POWER TRANSFORMER HI RESULTS ............................................................................................................ 35
FIGURE 4-9: POWER TRANSFORMER DGA RESULTS ....................................................................................................... 36
FIGURE 5-1: HEALTH INDEX RESULTS ............................................................................................................................ 37
FIGURE A-1: METSCO CLIENTS ................................................................................................................................... 42
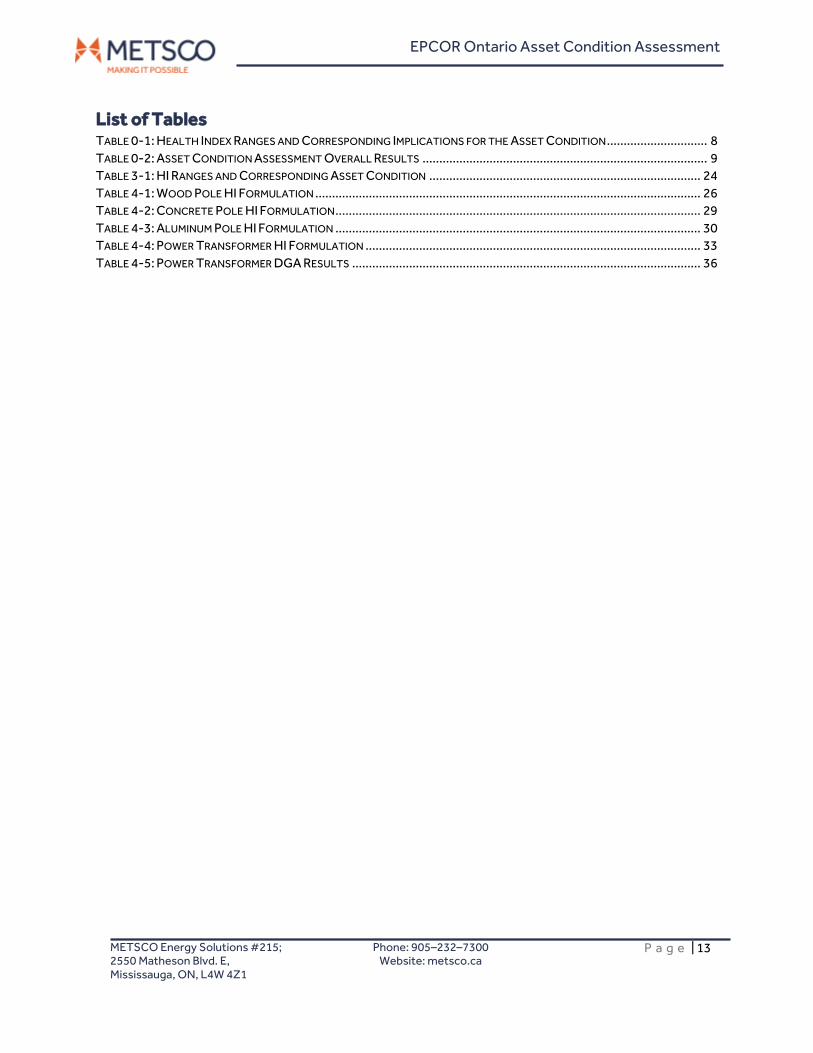
EPCOR Ontario Asset Condition Assessment
METSCO Energy Solutions #215; 2550 Matheson Blvd. E, Mississauga, ON, L4W 4Z1
Phone: 905–232–7300 Website: metsco.ca
P a g e | 13
List of Tables TABLE 0-1: HEALTH INDEX RANGES AND CORRESPONDING IMPLICATIONS FOR THE ASSET CONDITION .............................. 8 TABLE 0-2: ASSET CONDITION ASSESSMENT OVERALL RESULTS ..................................................................................... 9 TABLE 3-1: HI RANGES AND CORRESPONDING ASSET CONDITION ................................................................................. 24 TABLE 4-1: WOOD POLE HI FORMULATION ................................................................................................................... 26 TABLE 4-2: CONCRETE POLE HI FORMULATION ............................................................................................................. 29 TABLE 4-3: ALUMINUM POLE HI FORMULATION ............................................................................................................. 30 TABLE 4-4: POWER TRANSFORMER HI FORMULATION .................................................................................................... 33 TABLE 4-5: POWER TRANSFORMER DGA RESULTS ........................................................................................................ 36
EPCOR Ontario Asset Condition Assessment
METSCO Energy Solutions #215; 2550 Matheson Blvd. E, Mississauga, ON, L4W 4Z1
Phone: 905–232–7300 Website: metsco.ca
P a g e | 14
1 Introduction METSCO Energy Solutions Inc. (“METSCO”) is an industry expert in Asset Condition
Assessment (“ACA”) and Asset Management (“AM”) practices due to our extensive
experience in conducting ACAs, developing AM plans, and implementing AM frameworks for
transmission and distribution utilities across North America. METSCO’s collective record of
experience in these areas is among the most extensive in the world, with our AM
frameworks gaining acceptance across multiple regulatory jurisdictions. A selection of
METSCO’s past projects is attached as Appendix A to this report.
EPCOR Electricity Distribution Ontario (“EPCOR Ontario”) is an electricity distributor
delivering electricity to approximately 20,000 residential and commercial customers in the
Town of Collingwood, the Village of Stayner, the Village of Creemore, and a portion of the
Town of Blue Mountains. EPCOR Ontario engaged METSCO to prepare an ACA study for a
selection of the assets comprising EPCOR Ontario’s distribution system. The ACA is
required as one of the key inputs for the preparation of EPCOR Ontario’s five-year
Distribution System Plan (“DSP”), developed in accordance with the filing requirements for
electricity distributors enacted by the Ontario Energy Board (“OEB”). The study’s primary
objective is to objectively determine the condition of EPCOR Ontario’s assets as a key step
in the capital expenditure process for renewal investments. Supplementary objectives
include preparing the ACA results to be used for EPCOR Ontario’s upcoming rate filing as
well as to continuously improve EPCOR Ontario’s AM framework.
A unique ACA methodology is applied to distribution poles (wood, concrete, composite)
station power transformers (oil-filled and FR3-filled). The adoption of the ACA methodology
requires identifying end-of-life criteria for various components associated with each asset
type, followed by periodic asset inspections and recording of asset condition to identify the
assets most at risk at reaching the end-of-life criteria over the planning horizon. Each
criterion represents a factor that is influential, to a specific degree, in determining an asset’s
(or its component’s) condition relative to its potential failure. These components and tests
are weighted based on their importance in determining the assets’ end-of-life.
The assets covered in the report include the following major asset classes:
• Distribution Wood Poles
• Distribution Concrete Poles
• Distribution Composite Poles
• Station Power Transformers (oil-filled and FR3-filled)
All the asset condition data is maintained by EPCOR Ontario as part of its regular AM and
maintenance practices. All condition information was collected by EPCOR Ontario and its
EPCOR Ontario Asset Condition Assessment
METSCO Energy Solutions #215; 2550 Matheson Blvd. E, Mississauga, ON, L4W 4Z1
Phone: 905–232–7300 Website: metsco.ca
P a g e | 15
contractors up to the end of May 2021. This data was transmitted to METSCO between
June and July 2021 to complete the ACA.
The report is organized into six sections including this introductory section:
• Section 2 summarizes the ISO 5500X AM standards, discusses how the ACA fits into the overall AM framework; and provides an overview of METSCO’s ACA methodology;
• Section 3 summarizes the asset Health Index (“HI”) calculation methodology;
• Section 4 provides the Condition Assessment methodology framework and
assessment for each of the identified asset classes;
• Section 5 provides METSCO’s conclusions; and
• Section 6 summarizes METSCO’s recommendations for EPCOR Ontario on data
collection improvements for continuous improvement efforts for the ACA.
EPCOR Ontario Asset Condition Assessment
METSCO Energy Solutions #215; 2550 Matheson Blvd. E, Mississauga, ON, L4W 4Z1
Phone: 905–232–7300 Website: metsco.ca
P a g e | 16
2 Context of the ACA within AM Planning The ACA is a key step in developing an asset replacement strategy. By evaluating the
current set of available data related to the condition of in-service assets comprising an
organization’s asset portfolio, condition scores for each asset are determined. The ACA
involves the collection, consolidation, and utilization of the results within an organizational
AM framework for the purposes of objectively quantifying and managing the risks of its
asset portfolio. The level of degradation of an asset, its configuration within the system, and
its corresponding likelihood of failure feed directly into the risk evaluation process, which
identifies asset candidates for intervention (i.e., replacement or refurbishment). Assets are
then grouped into program and project scopes that are evaluated and prioritized.
The ACA is designed to provide insights into the current state of an organization’s asset
base, the risks associated with identified degradation, approaches to managing this
degradation within the current AM framework, and how to best make use of these results to
extract the optimal value from the asset portfolio going forward.
2.1 International Standards for AM
The following paragraphs serve as a brief introduction to the ISO standards and provide a
brief overview of the applicability of AM standards within an entity.
The industry standard for AM planning is outlined in the ISO 5500X series of standards,
which encompass ISO 55000, ISO 55001, and ISO 55002. Each business entity finds itself at
one of the three main stages along the AM journey:
1. Exploratory stage - entities looking to establish and set up an AM system;
2. Advancement stage - entities looking to realize more value from an asset base; and
3. Continuous improvement stage - those looking to assess and progressively enhance
an AM system already in place for avenues of improvement.
Given that AM is a continuous journey, ISO 5500X remains continuously relevant within an
organization; providing an objective, evidence-based framework against which the
organizations can assess the managerial decisions relating to their purpose, operating
context, and financial constraints over the different stages of their existence.1
An asset is any item or entity that has a value to the organization. This can be actual or
potential value, in a monetary or otherwise intangible sense (e.g., public safety). The
hierarchy of an AM framework begins with the asset portfolio, containing all known
information regarding the assets, sits as the fundamental core of an organization. The ACA
1 ISO 55000 – Asset management – Overview, principles and terminology
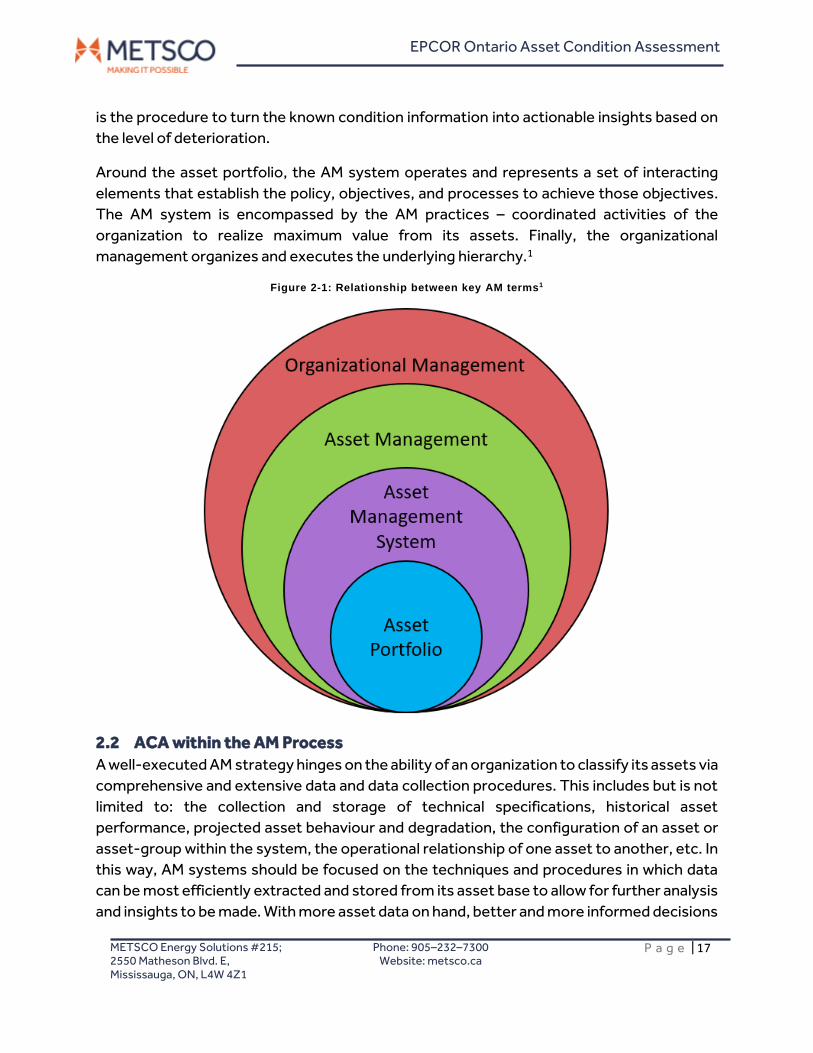
EPCOR Ontario Asset Condition Assessment
METSCO Energy Solutions #215; 2550 Matheson Blvd. E, Mississauga, ON, L4W 4Z1
Phone: 905–232–7300 Website: metsco.ca
P a g e | 17
is the procedure to turn the known condition information into actionable insights based on
the level of deterioration.
Around the asset portfolio, the AM system operates and represents a set of interacting
elements that establish the policy, objectives, and processes to achieve those objectives.
The AM system is encompassed by the AM practices – coordinated activities of the
organization to realize maximum value from its assets. Finally, the organizational
management organizes and executes the underlying hierarchy.1
Figure 2-1: Relationship between key AM terms1
2.2 ACA within the AM Process
A well-executed AM strategy hinges on the ability of an organization to classify its assets via
comprehensive and extensive data and data collection procedures. This includes but is not
limited to: the collection and storage of technical specifications, historical asset
performance, projected asset behaviour and degradation, the configuration of an asset or
asset-group within the system, the operational relationship of one asset to another, etc. In
this way, AM systems should be focused on the techniques and procedures in which data
can be most efficiently extracted and stored from its asset base to allow for further analysis
and insights to be made. With more asset data on hand, better and more informed decisions
EPCOR Ontario Asset Condition Assessment
METSCO Energy Solutions #215; 2550 Matheson Blvd. E, Mississauga, ON, L4W 4Z1
Phone: 905–232–7300 Website: metsco.ca
P a g e | 18
can be made to realize greater benefits and reduce the risk across the asset portfolio
managed by an organization.2
AM is fundamentally grounded in a risk-based evaluation of continued value. The
overarching goal of an AM process it to quantify all assets risk by their probability and impact
(where possible) and then look to minimize these risks through AM operations and
procedures. The ACA quantifies the condition of each asset under study and is an
appropriate indicator of its failure probability. Making asset replacement decisions directly
based on the ACA results constitutes a condition-based intervention strategy.
AM practices can help quantify and drive strategic decisions. A better understanding of the
asset portfolio and how it is performing within an organization will allow for optimal
decision-making. This is largely due to best AM practices being a fundamentally risk-based
approach, which lends it to be a structured framework for creating financial plans driven by
data. AM practices should also have goals in mind when framing asset investments, changes
in asset configuration, or acquisition of new assets. This can include better technical
compliance, increased safety, increased reliability, or increased financial performance of the
asset base. ISO 55002 states explicitly that all asset portfolio improvements should be
assessed via a risk-based approach prior to being implemented.2 The criticality of the asset
determines its failure impact. A risk-based asset intervention strategy should consider both
the probability and impact in the decision-making process.
2.3 Continuous Improvement in the AM Process
The application of rigorous AM processes can produce multiple types of benefits for an
organization including, but not limited to: realized financial profits, better classified and
managed risk among assets, better-informed investment decisions, demonstrated
compliance among the asset base, increased public and worker safety, and corporate
sustainability.1
AM processes are ideally integrated throughout the entire organization. This requires a
well-documented AM framework that is shared between all relevant agents. In this way, the
organization stands to benefit the most from its internal resources, whether it be via
technical experts, those operating and maintaining the assets or those with an
understanding of the financial operations and constraints on the organization as a whole. As
a future-state goal, utilities and other organizations alike should strive to document their
AM guiding principles within a Strategic Asset Management Plan (“SAMP”). The SAMP
should be used as a guide for the organization to apply its AM principles and practices for its
specific use case. Distribution of the SAMP should be well-publicized within an organization
and updated on a regular basis, in order to best quantify the most current and
2 ISO 55002 – Asset management – Management systems – Guidelines for the application of ISO 55001
EPCOR Ontario Asset Condition Assessment
METSCO Energy Solutions #215; 2550 Matheson Blvd. E, Mississauga, ON, L4W 4Z1
Phone: 905–232–7300 Website: metsco.ca
P a g e | 19
comprehensive AM practices being implemented. Just as the asset base performance is
subject to an in-depth review, the AM process and system should be reviewed with the same
rigor.1
AM should be regarded as a fluid process. Adopting a framework and an idealized set of
practices does not bind the organization or restrict its agency. With time, the goal of any AM
system is to continually improve and realize benefits within the organization through better
management of its asset portfolio. Continually improved asset data and data collection
procedures, updated SAMPs, and further integration into all aspects of an organization’s
activities as it grows and changes over time should be the goal of any AM framework.2
EPCOR Ontario Asset Condition Assessment
METSCO Energy Solutions #215; 2550 Matheson Blvd. E, Mississauga, ON, L4W 4Z1
Phone: 905–232–7300 Website: metsco.ca
P a g e | 20
3 Asset Condition Assessment Methodology
3.1 METSCO’s Project Execution
METSCO’s execution path in completing the ACA study can be is a four-phase procedure:
1. Initial information gathering – including regular check-in calls with the Subject Matter
Experts (SMEs) from EPCOR Ontario to understand the system configuration and
layout of the two asset classes under consideration, collect the range of available
condition data from their internal databases at the beginning of the analysis, and
confirm the key assumptions regarding these condition factors.
2. Data Analysis – using the outputs of the previous phase to digitize and link different
data resources; cleansing and processing this data and using verified assumptions to
fill in the missing data gaps.
3. HI, Data Availability Index (DAI) and Data Validity Index (DVI) calculation – upon
confirming the integrity of its condition dataset along with the accuracy of
assumptions made in its preparation, METSCO calculated the Health Indices, DAI and
DVI for the two asset classes by implementing the HI framework logic on ENGIN.
4. Results Reporting – the final phase of the project scope was the creation of the ACA
report.
3.2 Data Sources
To assess the demographics and establish the unit population of EPCOR Ontario’s system
assets, METSCO was provided with EPCOR Ontario’s asset demographic data from its
current Geographic Information System (“GIS”). These data came from EPCOR Ontario’s
corporate asset registries containing information on asset manufacturing, installation,
treatments, and test results. The ESRI database served as the primary asset library that
contained critical asset information such as age and unique identifiers.
To assess the condition of EPCOR Ontario’s system, METSCO was provided with available
asset inspection and maintenance data for the asset classes in scope. Various sources hold
records of EPCOR Ontario’s inspection and maintenance activities. Most of these data
came from primary sources such as equipment inspection forms completed by EPCOR
Ontario’s staff or contractors, or the results of specific tests such as the Dissolved Gas
Analysis (“DGA”) for station power transformer oil and Resistograph testing for distribution
wood poles.
EPCOR Ontario Asset Condition Assessment
METSCO Energy Solutions #215; 2550 Matheson Blvd. E, Mississauga, ON, L4W 4Z1
Phone: 905–232–7300 Website: metsco.ca
P a g e | 21
3.3 Asset Condition Assessment Methodologies
Prior to completing an ACA, a methodology needs to be selected for the current entity. The
four most common methodologies that can be employed to assess the condition of the
system health include:
1. Additive models – asset degradation factors and scores are used to independently
calculate a score for each individual asset, with the HI representing a weighted
average of all individual scores from 0 to 100;
2. Gateway models – select parameters deemed to be most impactful on the asset’s
overall functionality act as “gates” to drive the overall condition of an asset, by
effectively “deflating” the scores of other (less impactful) components;
3. Subtractive models – consider that a relatively Poor condition for any of several
major assets within a broader system of assets could act as a sufficient justification
to drive investments into the entire system; and
4. Multiplicative models – a HI that dynamically shifts the calculation towards specific
degradation factors, if they are a leading indicator to show that an asset is failing.
The additive and gateway models are typically used for assessing individual assets, whereas
the subtractive and multiplicative models are typically used for aggregate and composite
system-level assessments. The latter models are still in an early stage and require extensive
refinement and validation to confirm their applicability. The gateway model assigns gates to
criteria or asset subcomponents which are difficult or expensive to replace and maintain,
and/or are known to be a major cause of asset malfunctioning. This methodology is
commonly used in conjunction with the additive model for major assets such as wood poles,
where a “gate” score will act to reduce the HI due to a low recorded score for a given
criterion. For example, if the remaining strength of a wood pole is less than 60%, the final HI
for that asset is halved.
In general, most distribution utilities employ an additive model with select gateway model
elements. METSCO selected this approach when conducting the ACA, which is in alignment
with most of EPCOR Ontario’s peer utilities.
3.4 Overview of Selected Methodology
3.4.1 Condition Parameters
To calculate the HI for an asset, formulations are developed based on condition parameters
that can be expected to contribute to the degradation and eventual failure of that asset. A
weight is assigned to each condition parameter to indicate the amount of influence the
condition has on the overall health of the asset. Figure 3-1 exemplifies an HI formulation
table.
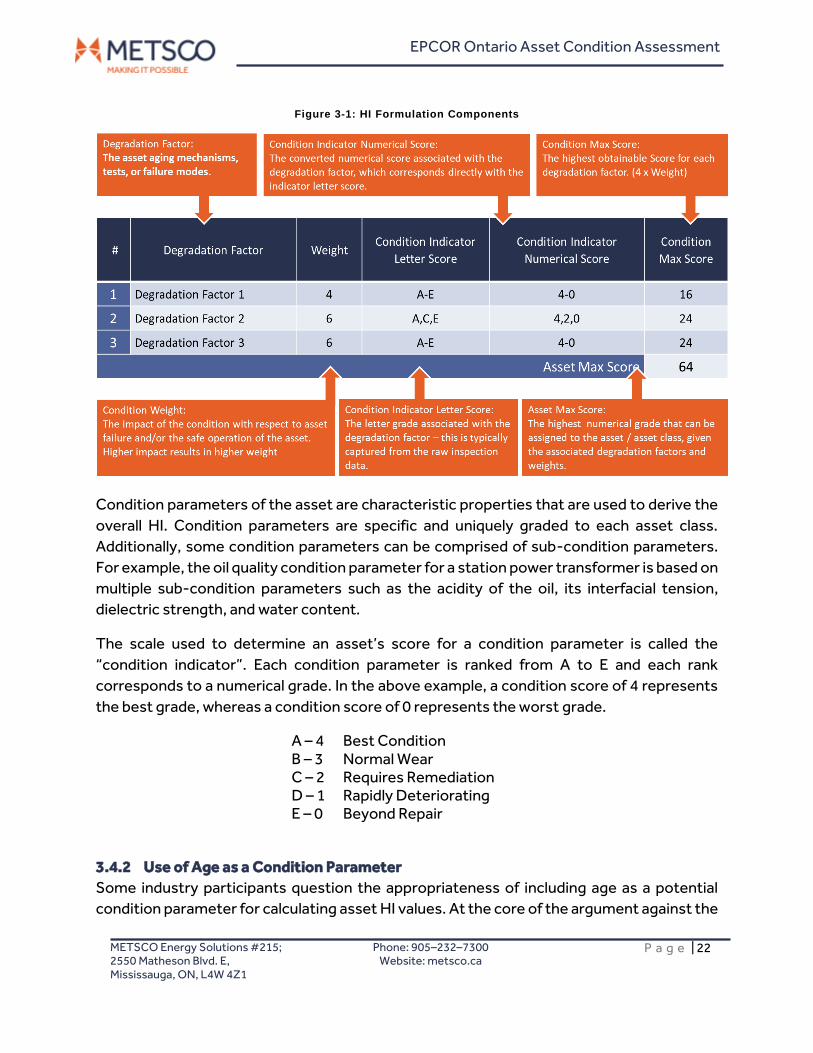
EPCOR Ontario Asset Condition Assessment
METSCO Energy Solutions #215; 2550 Matheson Blvd. E, Mississauga, ON, L4W 4Z1
Phone: 905–232–7300 Website: metsco.ca
P a g e | 22
Figure 3-1: HI Formulation Components
Condition parameters of the asset are characteristic properties that are used to derive the
overall HI. Condition parameters are specific and uniquely graded to each asset class.
Additionally, some condition parameters can be comprised of sub-condition parameters.
For example, the oil quality condition parameter for a station power transformer is based on
multiple sub-condition parameters such as the acidity of the oil, its interfacial tension,
dielectric strength, and water content.
The scale used to determine an asset’s score for a condition parameter is called the
“condition indicator”. Each condition parameter is ranked from A to E and each rank
corresponds to a numerical grade. In the above example, a condition score of 4 represents
the best grade, whereas a condition score of 0 represents the worst grade.
A – 4 Best Condition B – 3 Normal Wear C – 2 Requires Remediation D – 1 Rapidly Deteriorating E – 0 Beyond Repair
3.4.2 Use of Age as a Condition Parameter
Some industry participants question the appropriateness of including age as a potential
condition parameter for calculating asset HI values. At the core of the argument against the
EPCOR Ontario Asset Condition Assessment
METSCO Energy Solutions #215; 2550 Matheson Blvd. E, Mississauga, ON, L4W 4Z1
Phone: 905–232–7300 Website: metsco.ca
P a g e | 23
use of age in calculating asset condition is the notion that age implies a linear degradation
path for an asset that does not always match the actual experience in the field.
While some assets lose their structural integrity faster than would be expected with the
passage of time, others, such as those with limited exposure to natural environmental
factors, or those that benefitted from regular predictive and corrective maintenance, may
retain their original condition for a longer period of time than age-based degradation would
imply.
In recognition of the argument as to the limitations of age-based condition scoring,
METSCO limits the instances where it relies on only age as a parameter explicitly
incorporated into the HI formulation. In some cases, however, the limited number of
condition parameters available for calculation of asset health makes age a useful proxy for
the important factors that the analysis would not otherwise capture. In other cases, such as
when assessing condition of complex equipment containing a number of internal
mechanical components that degrade with continuous operation and the state of which
cannot be assessed without destructive testing, age represents an important component
of asset health calculation irrespective of the number of other factors that may be available
for analysis.
3.4.3 Final Health Index Formulation
The final HI, which is a function of the condition scores and weightings, is calculated based
on the following formula:
𝐻𝐼 = (∑ 𝑊𝑒𝑖𝑔ℎ𝑡𝑖 ∗ 𝑁𝑢𝑚𝑒𝑟𝑖𝑐𝑎𝑙 𝐺𝑟𝑎𝑑𝑒𝑖𝑖=1
𝑇𝑜𝑡𝑎𝑙 𝑆𝑐𝑜𝑟𝑒) 𝑥 100%
Where i corresponds to the condition parameter number, and the HI is a percentage
representing the remaining life of the asset.
A gating approach is used for condition parameters that have a significant influence on the
health of an asset. If the condition parameter that has been flagged as a gating parameter is
below a pre-defined threshold value, the overall HI is reduced by 50%. This approach
enables utilities to efficiently flag severely degraded assets through identification of
condition parameters acknowledged to be critical indicators of overall asset health.
3.4.4 Health Index Results
METSCO’s assessment of asset condition uses a consistent five-point scale along the
expected degradation path for every asset, ranging from Very Good to Very Poor. To assign
each asset into one of the categories, METSCO constructs an HI formulation for each asset
class, which captures information on individual degradation factors contributing to that
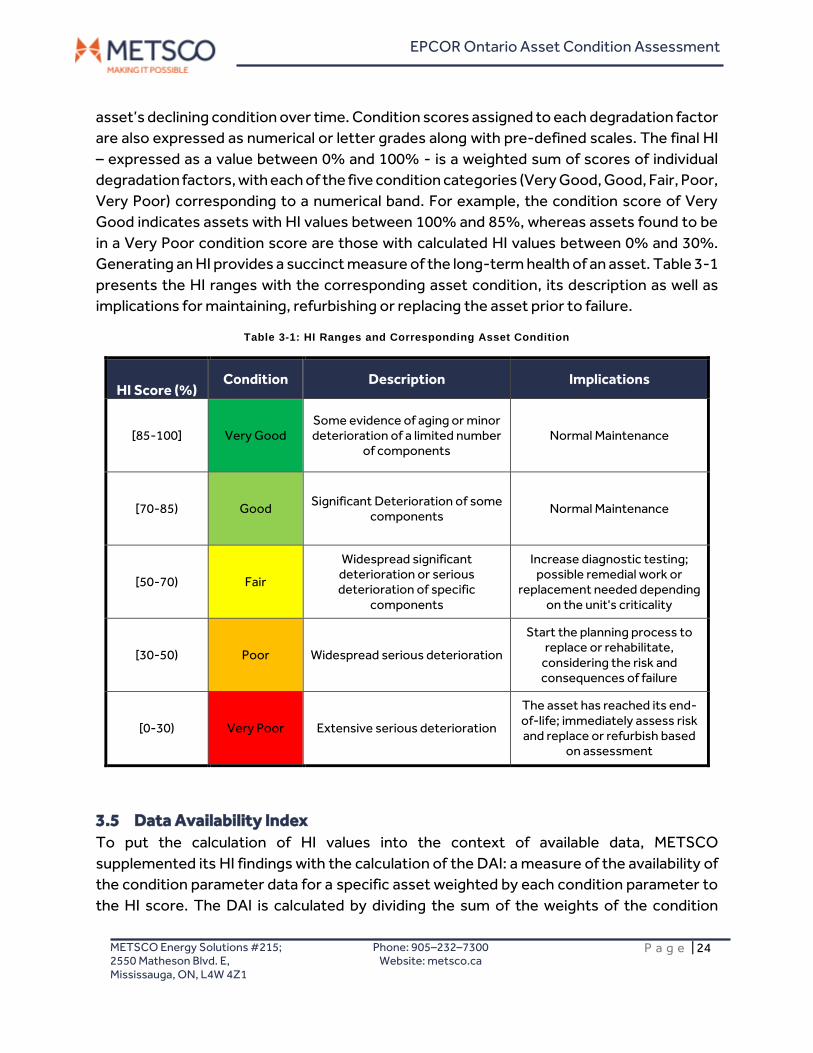
EPCOR Ontario Asset Condition Assessment
METSCO Energy Solutions #215; 2550 Matheson Blvd. E, Mississauga, ON, L4W 4Z1
Phone: 905–232–7300 Website: metsco.ca
P a g e | 24
asset’s declining condition over time. Condition scores assigned to each degradation factor
are also expressed as numerical or letter grades along with pre-defined scales. The final HI
– expressed as a value between 0% and 100% - is a weighted sum of scores of individual
degradation factors, with each of the five condition categories (Very Good, Good, Fair, Poor,
Very Poor) corresponding to a numerical band. For example, the condition score of Very
Good indicates assets with HI values between 100% and 85%, whereas assets found to be
in a Very Poor condition score are those with calculated HI values between 0% and 30%.
Generating an HI provides a succinct measure of the long-term health of an asset. Table 3-1
presents the HI ranges with the corresponding asset condition, its description as well as
implications for maintaining, refurbishing or replacing the asset prior to failure.
Table 3-1: HI Ranges and Corresponding Asset Condition
HI Score (%) Condition Description Implications
[85-100] Very Good Some evidence of aging or minor deterioration of a limited number
of components Normal Maintenance
[70-85) Good Significant Deterioration of some
components Normal Maintenance
[50-70) Fair
Widespread significant deterioration or serious deterioration of specific
components
Increase diagnostic testing; possible remedial work or
replacement needed depending on the unit's criticality
[30-50) Poor Widespread serious deterioration
Start the planning process to replace or rehabilitate,
considering the risk and consequences of failure
[0-30) Very Poor Extensive serious deterioration
The asset has reached its end-of-life; immediately assess risk and replace or refurbish based
on assessment
3.5 Data Availability Index
To put the calculation of HI values into the context of available data, METSCO
supplemented its HI findings with the calculation of the DAI: a measure of the availability of
the condition parameter data for a specific asset weighted by each condition parameter to
the HI score. The DAI is calculated by dividing the sum of the weights of the condition
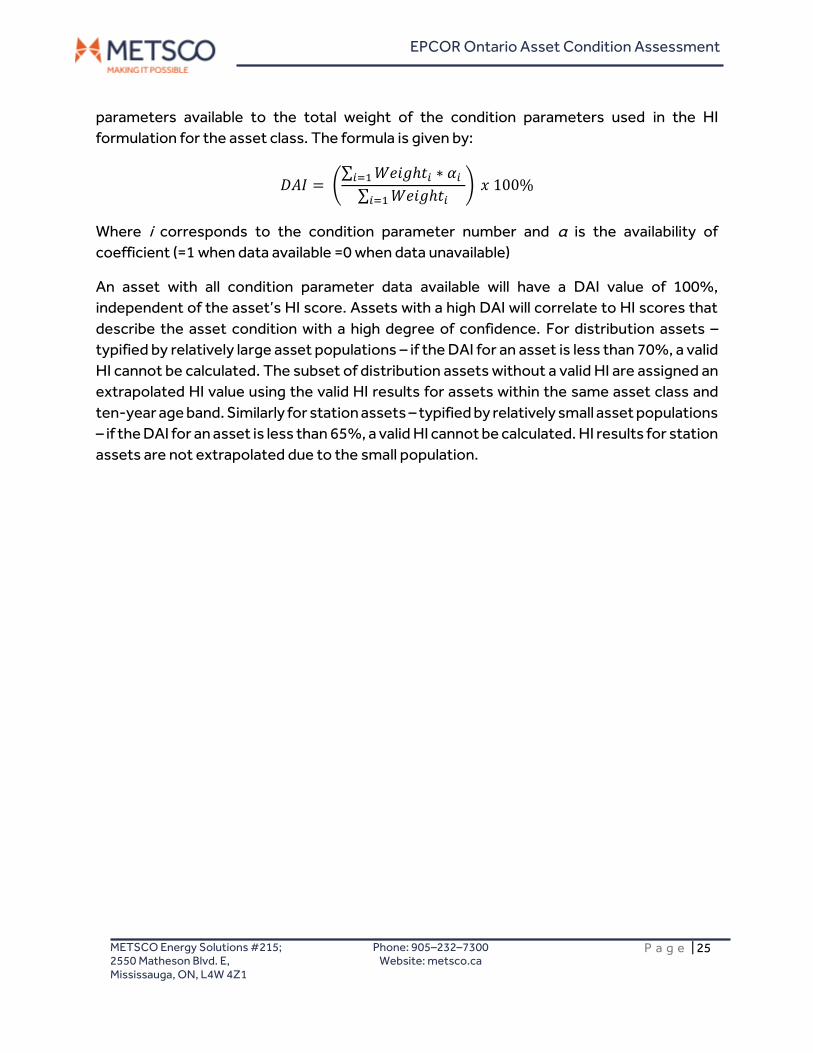
EPCOR Ontario Asset Condition Assessment
METSCO Energy Solutions #215; 2550 Matheson Blvd. E, Mississauga, ON, L4W 4Z1
Phone: 905–232–7300 Website: metsco.ca
P a g e | 25
parameters available to the total weight of the condition parameters used in the HI
formulation for the asset class. The formula is given by:
𝐷𝐴𝐼 = (∑ 𝑊𝑒𝑖𝑔ℎ𝑡𝑖 ∗ 𝛼𝑖𝑖=1
∑ 𝑊𝑒𝑖𝑔ℎ𝑡𝑖𝑖=1) 𝑥 100%
Where i corresponds to the condition parameter number and α is the availability of
coefficient (=1 when data available =0 when data unavailable)
An asset with all condition parameter data available will have a DAI value of 100%,
independent of the asset’s HI score. Assets with a high DAI will correlate to HI scores that
describe the asset condition with a high degree of confidence. For distribution assets –
typified by relatively large asset populations – if the DAI for an asset is less than 70%, a valid
HI cannot be calculated. The subset of distribution assets without a valid HI are assigned an
extrapolated HI value using the valid HI results for assets within the same asset class and
ten-year age band. Similarly for station assets – typified by relatively small asset populations
– if the DAI for an asset is less than 65%, a valid HI cannot be calculated. HI results for station
assets are not extrapolated due to the small population.
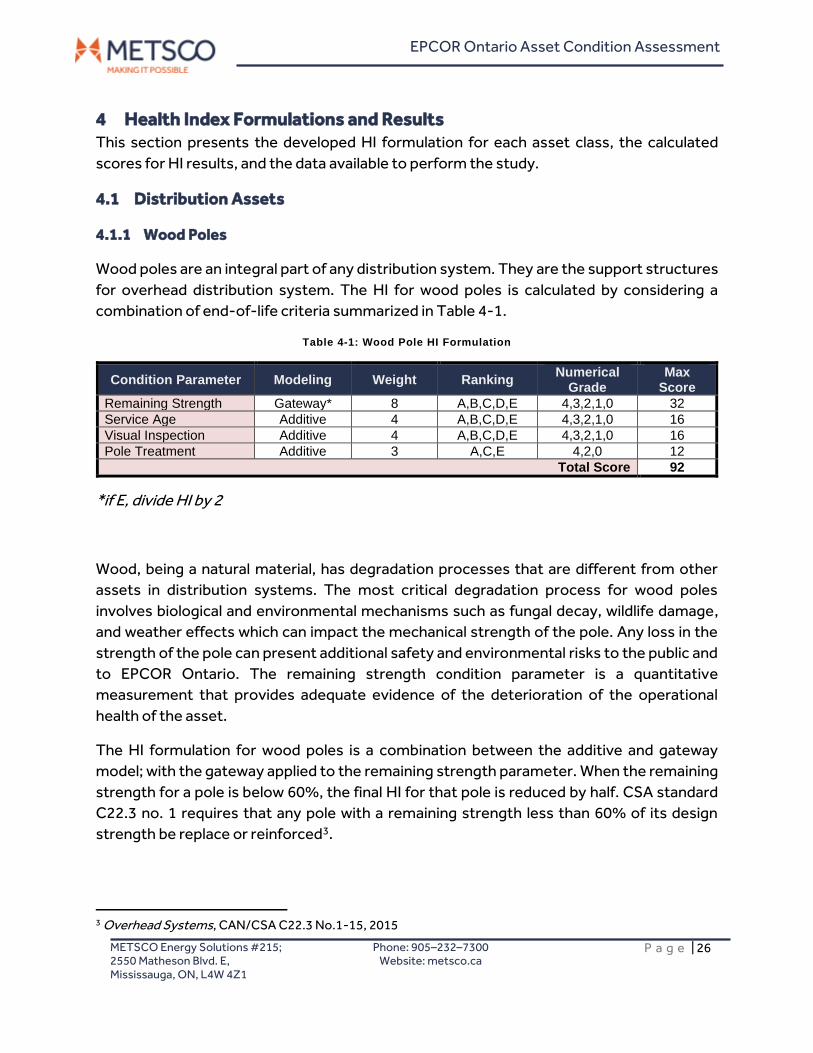
EPCOR Ontario Asset Condition Assessment
METSCO Energy Solutions #215; 2550 Matheson Blvd. E, Mississauga, ON, L4W 4Z1
Phone: 905–232–7300 Website: metsco.ca
P a g e | 26
4 Health Index Formulations and Results This section presents the developed HI formulation for each asset class, the calculated
scores for HI results, and the data available to perform the study.
4.1 Distribution Assets
4.1.1 Wood Poles
Wood poles are an integral part of any distribution system. They are the support structures
for overhead distribution system. The HI for wood poles is calculated by considering a
combination of end-of-life criteria summarized in Table 4-1.
Table 4-1: Wood Pole HI Formulation
Condition Parameter Modeling Weight Ranking Numerical
Grade Max
Score
Remaining Strength Gateway* 8 A,B,C,D,E 4,3,2,1,0 32
Service Age Additive 4 A,B,C,D,E 4,3,2,1,0 16
Visual Inspection Additive 4 A,B,C,D,E 4,3,2,1,0 16
Pole Treatment Additive 3 A,C,E 4,2,0 12
Total Score 92
*if E, divide HI by 2
Wood, being a natural material, has degradation processes that are different from other
assets in distribution systems. The most critical degradation process for wood poles
involves biological and environmental mechanisms such as fungal decay, wildlife damage,
and weather effects which can impact the mechanical strength of the pole. Any loss in the
strength of the pole can present additional safety and environmental risks to the public and
to EPCOR Ontario. The remaining strength condition parameter is a quantitative
measurement that provides adequate evidence of the deterioration of the operational
health of the asset.
The HI formulation for wood poles is a combination between the additive and gateway
model; with the gateway applied to the remaining strength parameter. When the remaining
strength for a pole is below 60%, the final HI for that pole is reduced by half. CSA standard
C22.3 no. 1 requires that any pole with a remaining strength less than 60% of its design
strength be replace or reinforced3.
3 Overhead Systems, CAN/CSA C22.3 No.1-15, 2015
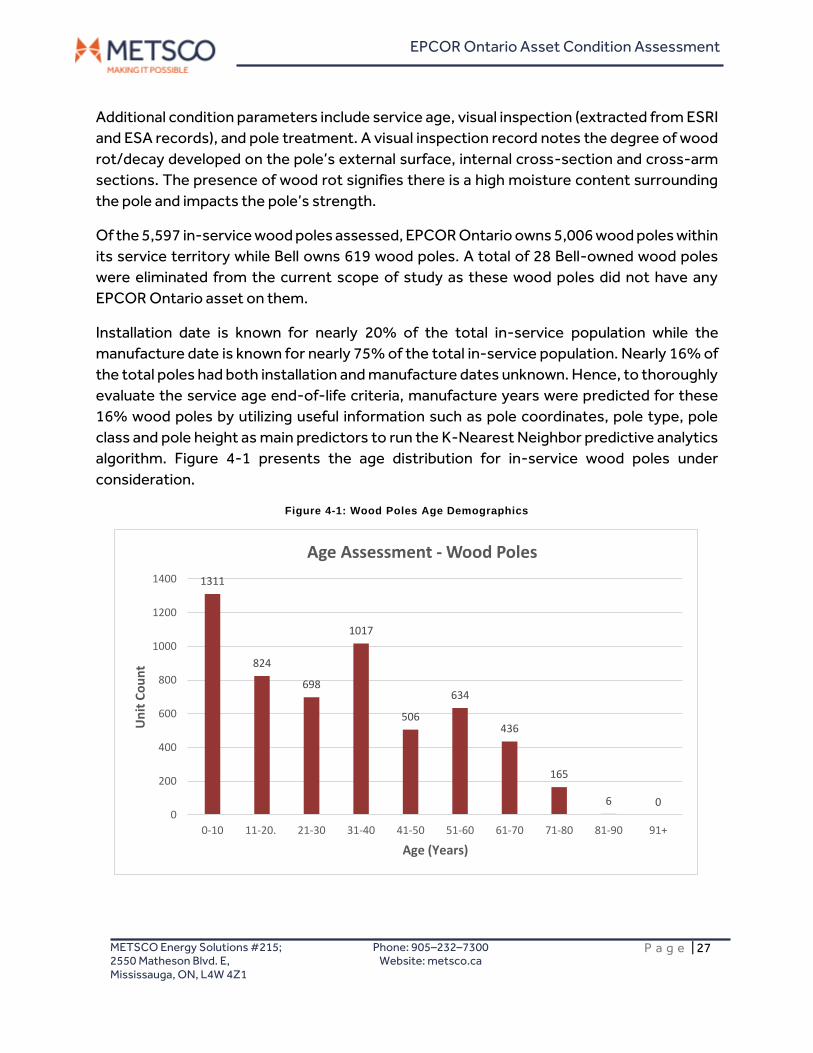
EPCOR Ontario Asset Condition Assessment
METSCO Energy Solutions #215; 2550 Matheson Blvd. E, Mississauga, ON, L4W 4Z1
Phone: 905–232–7300 Website: metsco.ca
P a g e | 27
Additional condition parameters include service age, visual inspection (extracted from ESRI
and ESA records), and pole treatment. A visual inspection record notes the degree of wood
rot/decay developed on the pole’s external surface, internal cross-section and cross-arm
sections. The presence of wood rot signifies there is a high moisture content surrounding
the pole and impacts the pole’s strength.
Of the 5,597 in-service wood poles assessed, EPCOR Ontario owns 5,006 wood poles within
its service territory while Bell owns 619 wood poles. A total of 28 Bell-owned wood poles
were eliminated from the current scope of study as these wood poles did not have any
EPCOR Ontario asset on them.
Installation date is known for nearly 20% of the total in-service population while the
manufacture date is known for nearly 75% of the total in-service population. Nearly 16% of
the total poles had both installation and manufacture dates unknown. Hence, to thoroughly
evaluate the service age end-of-life criteria, manufacture years were predicted for these
16% wood poles by utilizing useful information such as pole coordinates, pole type, pole
class and pole height as main predictors to run the K-Nearest Neighbor predictive analytics
algorithm. Figure 4-1 presents the age distribution for in-service wood poles under
consideration.
Figure 4-1: Wood Poles Age Demographics
1311
824
698
1017
506
634
436
165
6 00
200
400
600
800
1000
1200
1400
0-10 11-20. 21-30 31-40 41-50 51-60 61-70 71-80 81-90 91+
Un
it C
ou
nt
Age (Years)
Age Assessment - Wood Poles
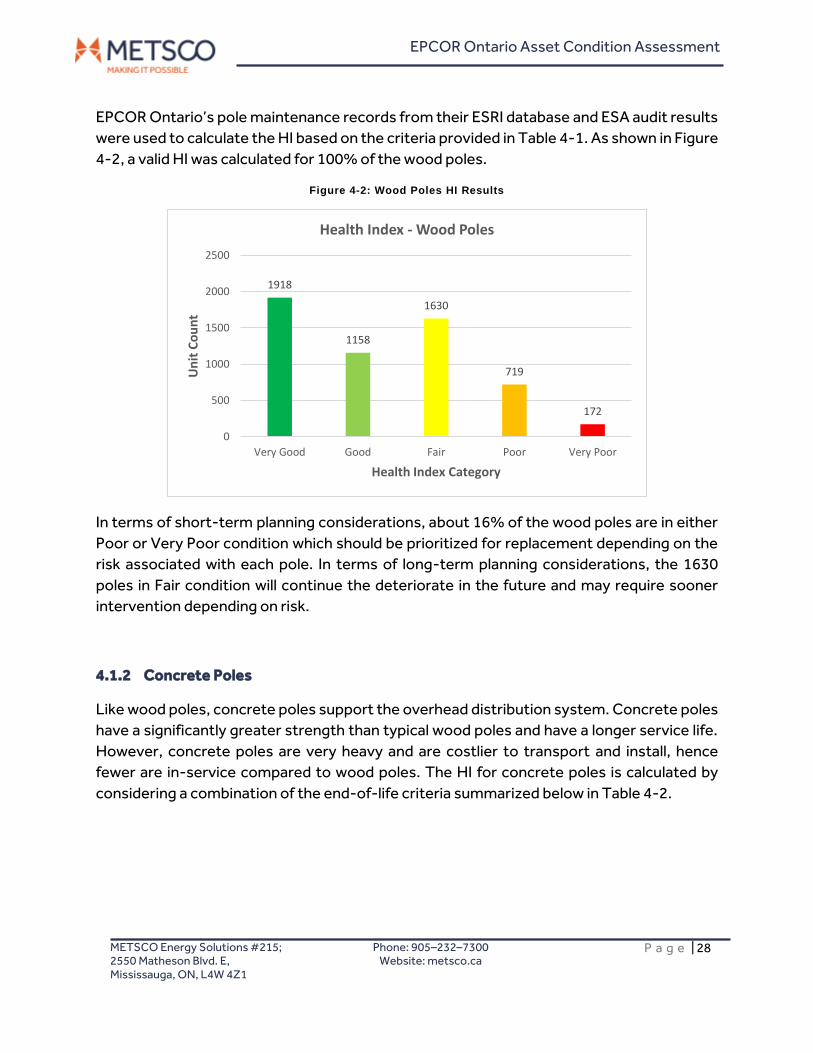
EPCOR Ontario Asset Condition Assessment
METSCO Energy Solutions #215; 2550 Matheson Blvd. E, Mississauga, ON, L4W 4Z1
Phone: 905–232–7300 Website: metsco.ca
P a g e | 28
EPCOR Ontario’s pole maintenance records from their ESRI database and ESA audit results
were used to calculate the HI based on the criteria provided in Table 4-1. As shown in Figure
4-2, a valid HI was calculated for 100% of the wood poles.
Figure 4-2: Wood Poles HI Results
In terms of short-term planning considerations, about 16% of the wood poles are in either
Poor or Very Poor condition which should be prioritized for replacement depending on the
risk associated with each pole. In terms of long-term planning considerations, the 1630
poles in Fair condition will continue the deteriorate in the future and may require sooner
intervention depending on risk.
4.1.2 Concrete Poles
Like wood poles, concrete poles support the overhead distribution system. Concrete poles
have a significantly greater strength than typical wood poles and have a longer service life.
However, concrete poles are very heavy and are costlier to transport and install, hence
fewer are in-service compared to wood poles. The HI for concrete poles is calculated by
considering a combination of the end-of-life criteria summarized below in Table 4-2.
1918
1158
1630
719
172
0
500
1000
1500
2000
2500
Very Good Good Fair Poor Very Poor
Un
it C
ou
nt
Health Index Category
Health Index - Wood Poles
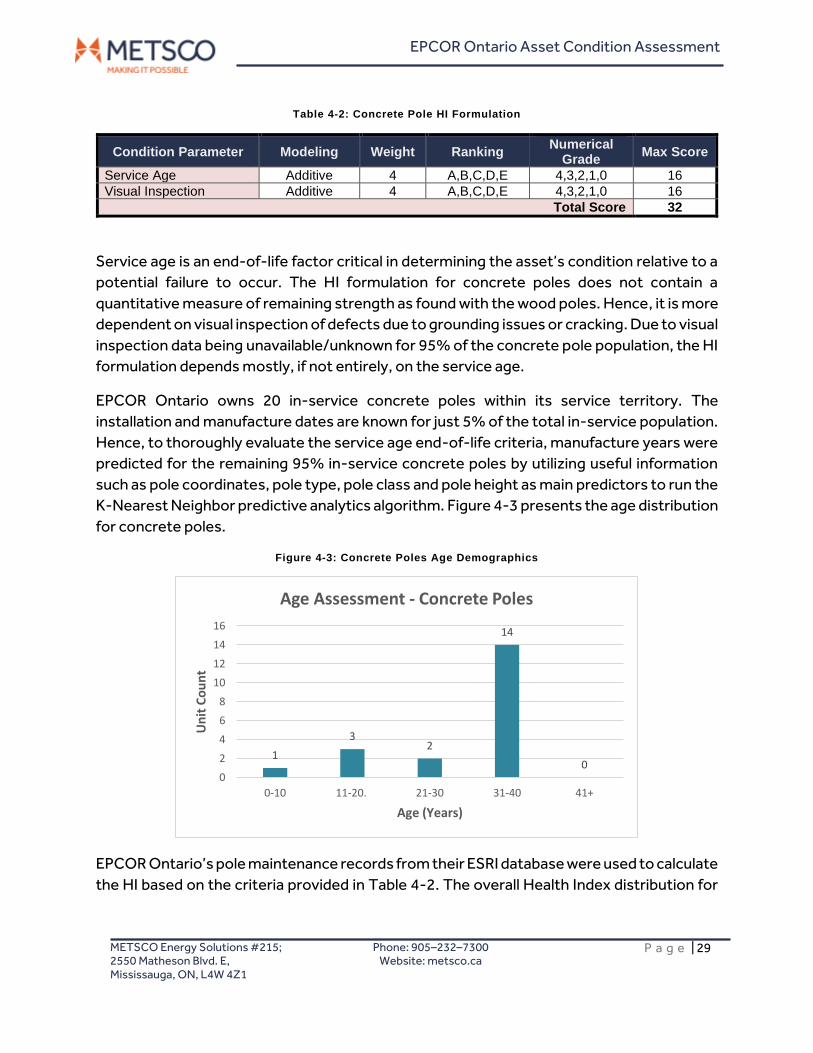
EPCOR Ontario Asset Condition Assessment
METSCO Energy Solutions #215; 2550 Matheson Blvd. E, Mississauga, ON, L4W 4Z1
Phone: 905–232–7300 Website: metsco.ca
P a g e | 29
Table 4-2: Concrete Pole HI Formulation
Condition Parameter Modeling Weight Ranking Numerical
Grade Max Score
Service Age Additive 4 A,B,C,D,E 4,3,2,1,0 16
Visual Inspection Additive 4 A,B,C,D,E 4,3,2,1,0 16
Total Score 32
Service age is an end-of-life factor critical in determining the asset’s condition relative to a
potential failure to occur. The HI formulation for concrete poles does not contain a
quantitative measure of remaining strength as found with the wood poles. Hence, it is more
dependent on visual inspection of defects due to grounding issues or cracking. Due to visual
inspection data being unavailable/unknown for 95% of the concrete pole population, the HI
formulation depends mostly, if not entirely, on the service age.
EPCOR Ontario owns 20 in-service concrete poles within its service territory. The
installation and manufacture dates are known for just 5% of the total in-service population.
Hence, to thoroughly evaluate the service age end-of-life criteria, manufacture years were
predicted for the remaining 95% in-service concrete poles by utilizing useful information
such as pole coordinates, pole type, pole class and pole height as main predictors to run the
K-Nearest Neighbor predictive analytics algorithm. Figure 4-3 presents the age distribution
for concrete poles.
Figure 4-3: Concrete Poles Age Demographics
EPCOR Ontario’s pole maintenance records from their ESRI database were used to calculate
the HI based on the criteria provided in Table 4-2. The overall Health Index distribution for
1
32
14
00
2
4
6
8
10
12
14
16
0-10 11-20. 21-30 31-40 41+
Un
it C
ou
nt
Age (Years)
Age Assessment - Concrete Poles
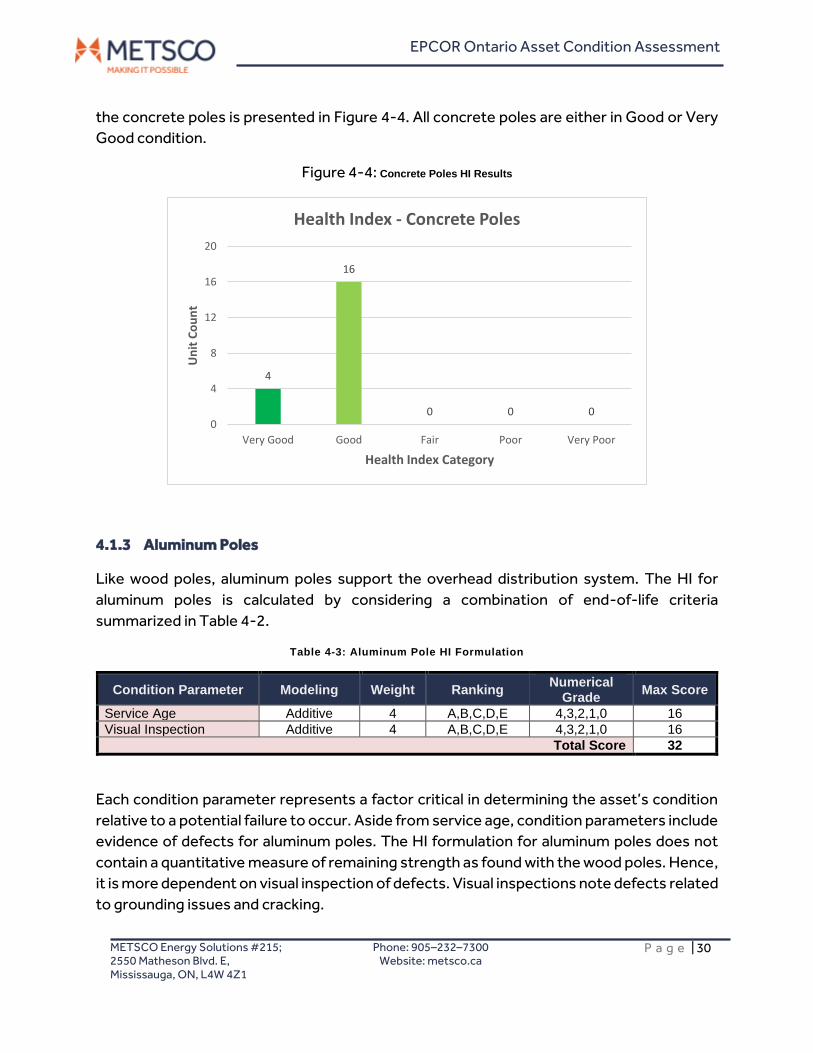
EPCOR Ontario Asset Condition Assessment
METSCO Energy Solutions #215; 2550 Matheson Blvd. E, Mississauga, ON, L4W 4Z1
Phone: 905–232–7300 Website: metsco.ca
P a g e | 30
the concrete poles is presented in Figure 4-4. All concrete poles are either in Good or Very
Good condition.
Figure 4-4: Concrete Poles HI Results
4.1.3 Aluminum Poles
Like wood poles, aluminum poles support the overhead distribution system. The HI for
aluminum poles is calculated by considering a combination of end-of-life criteria
summarized in Table 4-2.
Table 4-3: Aluminum Pole HI Formulation
Condition Parameter Modeling Weight Ranking Numerical
Grade Max Score
Service Age Additive 4 A,B,C,D,E 4,3,2,1,0 16
Visual Inspection Additive 4 A,B,C,D,E 4,3,2,1,0 16
Total Score 32
Each condition parameter represents a factor critical in determining the asset’s condition
relative to a potential failure to occur. Aside from service age, condition parameters include
evidence of defects for aluminum poles. The HI formulation for aluminum poles does not
contain a quantitative measure of remaining strength as found with the wood poles. Hence,
it is more dependent on visual inspection of defects. Visual inspections note defects related
to grounding issues and cracking.
4
16
0 0 00
4
8
12
16
20
Very Good Good Fair Poor Very Poor
Un
it C
ou
nt
Health Index Category
Health Index - Concrete Poles
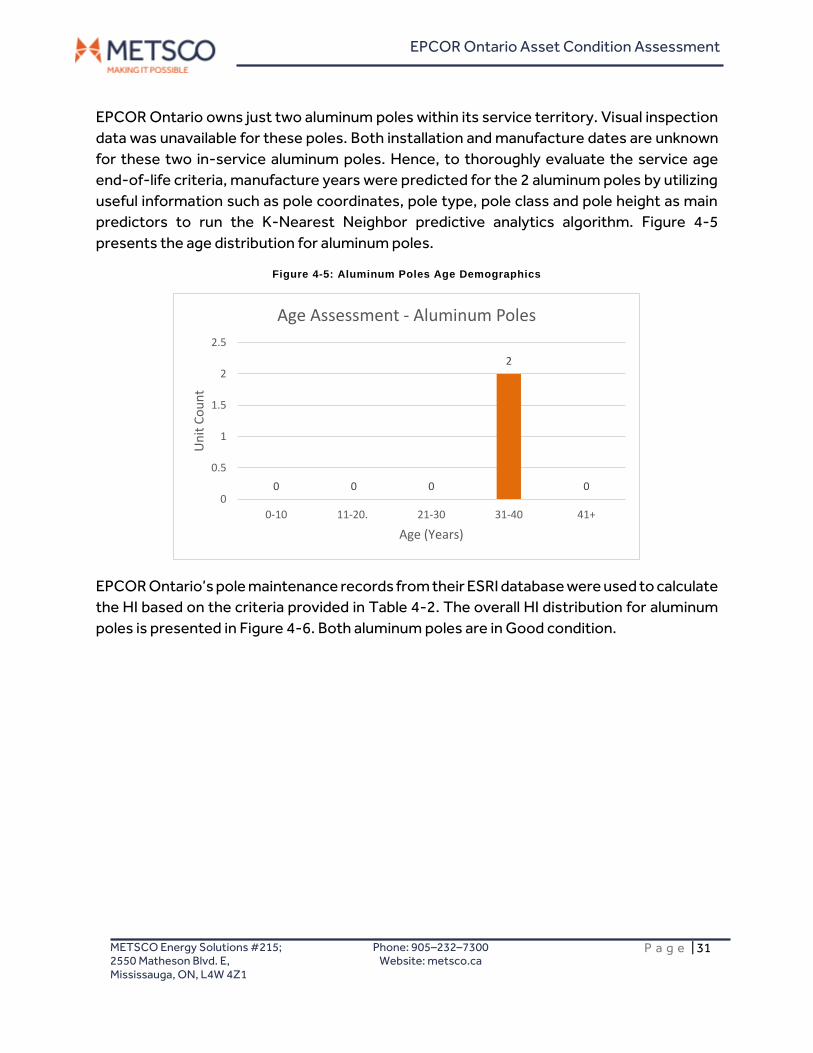
EPCOR Ontario Asset Condition Assessment
METSCO Energy Solutions #215; 2550 Matheson Blvd. E, Mississauga, ON, L4W 4Z1
Phone: 905–232–7300 Website: metsco.ca
P a g e | 31
EPCOR Ontario owns just two aluminum poles within its service territory. Visual inspection
data was unavailable for these poles. Both installation and manufacture dates are unknown
for these two in-service aluminum poles. Hence, to thoroughly evaluate the service age
end-of-life criteria, manufacture years were predicted for the 2 aluminum poles by utilizing
useful information such as pole coordinates, pole type, pole class and pole height as main
predictors to run the K-Nearest Neighbor predictive analytics algorithm. Figure 4-5
presents the age distribution for aluminum poles.
Figure 4-5: Aluminum Poles Age Demographics
EPCOR Ontario’s pole maintenance records from their ESRI database were used to calculate
the HI based on the criteria provided in Table 4-2. The overall HI distribution for aluminum
poles is presented in Figure 4-6. Both aluminum poles are in Good condition.
0 0 0
2
00
0.5
1
1.5
2
2.5
0-10 11-20. 21-30 31-40 41+
Un
it C
ou
nt
Age (Years)
Age Assessment - Aluminum Poles
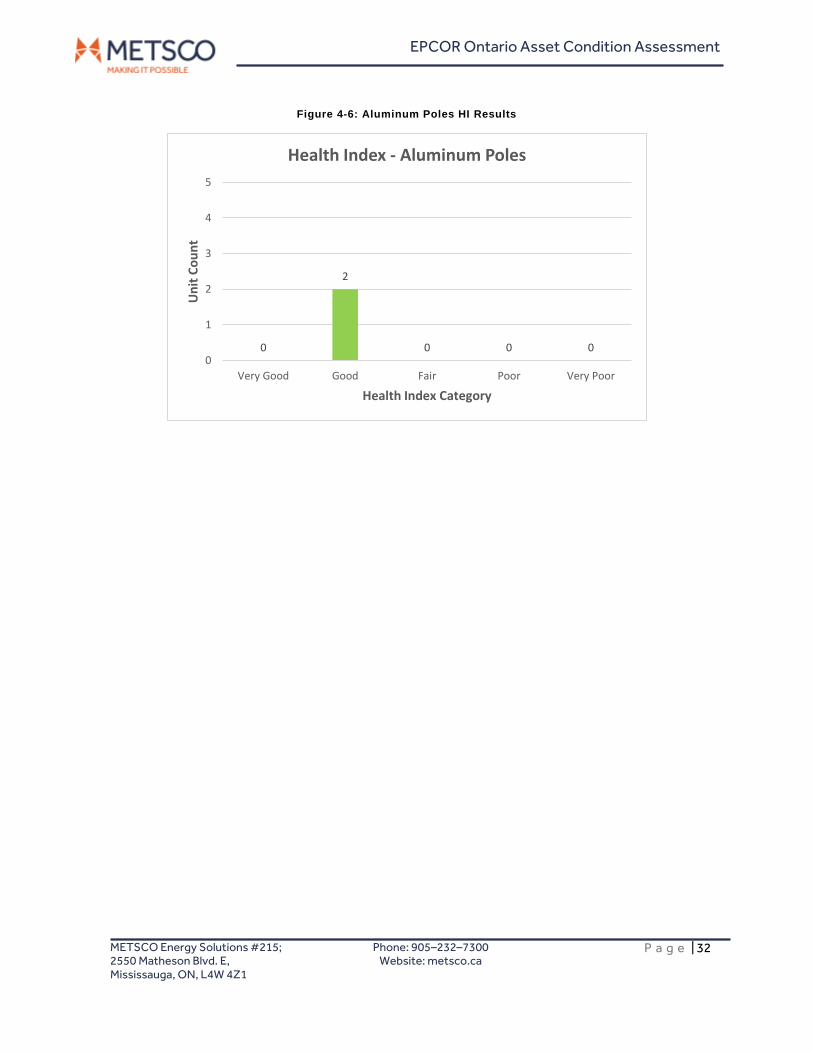
EPCOR Ontario Asset Condition Assessment
METSCO Energy Solutions #215; 2550 Matheson Blvd. E, Mississauga, ON, L4W 4Z1
Phone: 905–232–7300 Website: metsco.ca
P a g e | 32
Figure 4-6: Aluminum Poles HI Results
0
2
0 0 00
1
2
3
4
5
Very Good Good Fair Poor Very Poor
Un
it C
ou
nt
Health Index Category
Health Index - Aluminum Poles
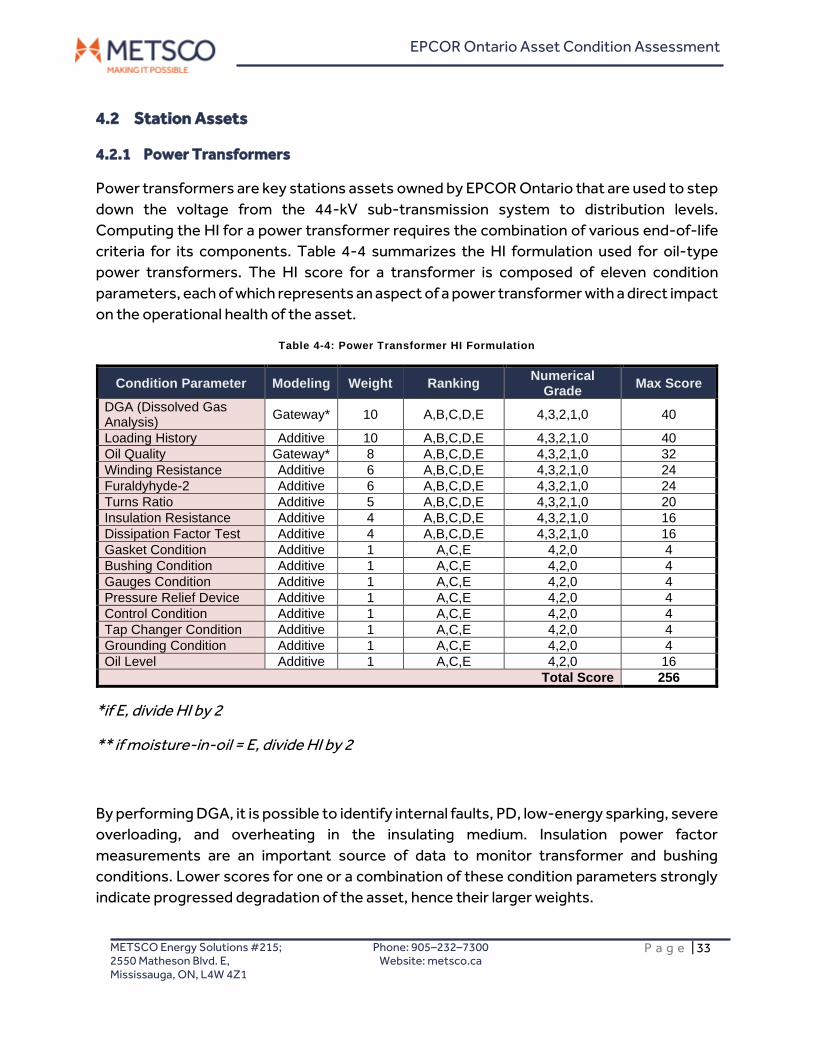
EPCOR Ontario Asset Condition Assessment
METSCO Energy Solutions #215; 2550 Matheson Blvd. E, Mississauga, ON, L4W 4Z1
Phone: 905–232–7300 Website: metsco.ca
P a g e | 33
4.2 Station Assets
4.2.1 Power Transformers
Power transformers are key stations assets owned by EPCOR Ontario that are used to step
down the voltage from the 44-kV sub-transmission system to distribution levels.
Computing the HI for a power transformer requires the combination of various end-of-life
criteria for its components. Table 4-4 summarizes the HI formulation used for oil-type
power transformers. The HI score for a transformer is composed of eleven condition
parameters, each of which represents an aspect of a power transformer with a direct impact
on the operational health of the asset.
Table 4-4: Power Transformer HI Formulation
Condition Parameter Modeling Weight Ranking Numerical
Grade Max Score
DGA (Dissolved Gas Analysis)
Gateway* 10 A,B,C,D,E 4,3,2,1,0 40
Loading History Additive 10 A,B,C,D,E 4,3,2,1,0 40
Oil Quality Gateway* 8 A,B,C,D,E 4,3,2,1,0 32
Winding Resistance Additive 6 A,B,C,D,E 4,3,2,1,0 24
Furaldyhyde-2 Additive 6 A,B,C,D,E 4,3,2,1,0 24
Turns Ratio Additive 5 A,B,C,D,E 4,3,2,1,0 20
Insulation Resistance Additive 4 A,B,C,D,E 4,3,2,1,0 16
Dissipation Factor Test Additive 4 A,B,C,D,E 4,3,2,1,0 16
Gasket Condition Additive 1 A,C,E 4,2,0 4
Bushing Condition Additive 1 A,C,E 4,2,0 4
Gauges Condition Additive 1 A,C,E 4,2,0 4
Pressure Relief Device Additive 1 A,C,E 4,2,0 4
Control Condition Additive 1 A,C,E 4,2,0 4
Tap Changer Condition Additive 1 A,C,E 4,2,0 4
Grounding Condition Additive 1 A,C,E 4,2,0 4
Oil Level Additive 1 A,C,E 4,2,0 16
Total Score 256
*if E, divide HI by 2
** if moisture-in-oil = E, divide HI by 2
By performing DGA, it is possible to identify internal faults, PD, low-energy sparking, severe
overloading, and overheating in the insulating medium. Insulation power factor
measurements are an important source of data to monitor transformer and bushing
conditions. Lower scores for one or a combination of these condition parameters strongly
indicate progressed degradation of the asset, hence their larger weights.
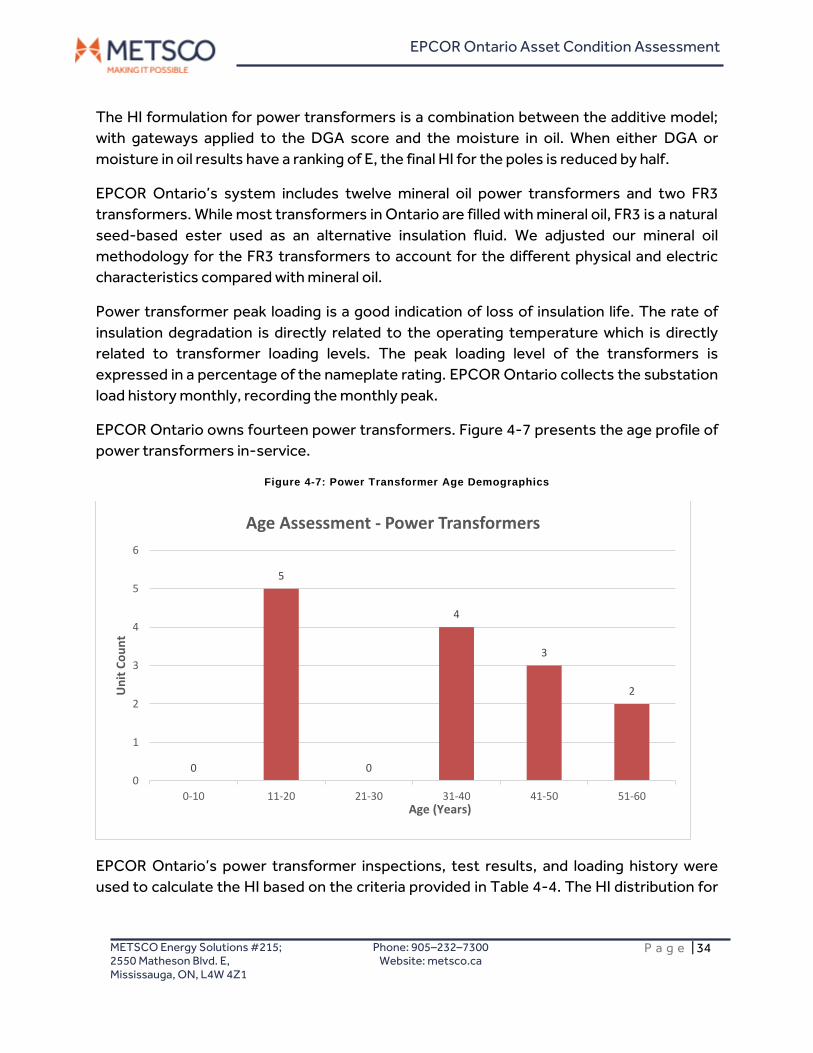
EPCOR Ontario Asset Condition Assessment
METSCO Energy Solutions #215; 2550 Matheson Blvd. E, Mississauga, ON, L4W 4Z1
Phone: 905–232–7300 Website: metsco.ca
P a g e | 34
The HI formulation for power transformers is a combination between the additive model;
with gateways applied to the DGA score and the moisture in oil. When either DGA or
moisture in oil results have a ranking of E, the final HI for the poles is reduced by half.
EPCOR Ontario’s system includes twelve mineral oil power transformers and two FR3
transformers. While most transformers in Ontario are filled with mineral oil, FR3 is a natural
seed-based ester used as an alternative insulation fluid. We adjusted our mineral oil
methodology for the FR3 transformers to account for the different physical and electric
characteristics compared with mineral oil.
Power transformer peak loading is a good indication of loss of insulation life. The rate of
insulation degradation is directly related to the operating temperature which is directly
related to transformer loading levels. The peak loading level of the transformers is
expressed in a percentage of the nameplate rating. EPCOR Ontario collects the substation
load history monthly, recording the monthly peak.
EPCOR Ontario owns fourteen power transformers. Figure 4-7 presents the age profile of
power transformers in-service.
Figure 4-7: Power Transformer Age Demographics
EPCOR Ontario’s power transformer inspections, test results, and loading history were
used to calculate the HI based on the criteria provided in Table 4-4. The HI distribution for
0
5
0
4
3
2
0
1
2
3
4
5
6
0-10 11-20 21-30 31-40 41-50 51-60
Un
it C
ou
nt
Age (Years)
Age Assessment - Power Transformers
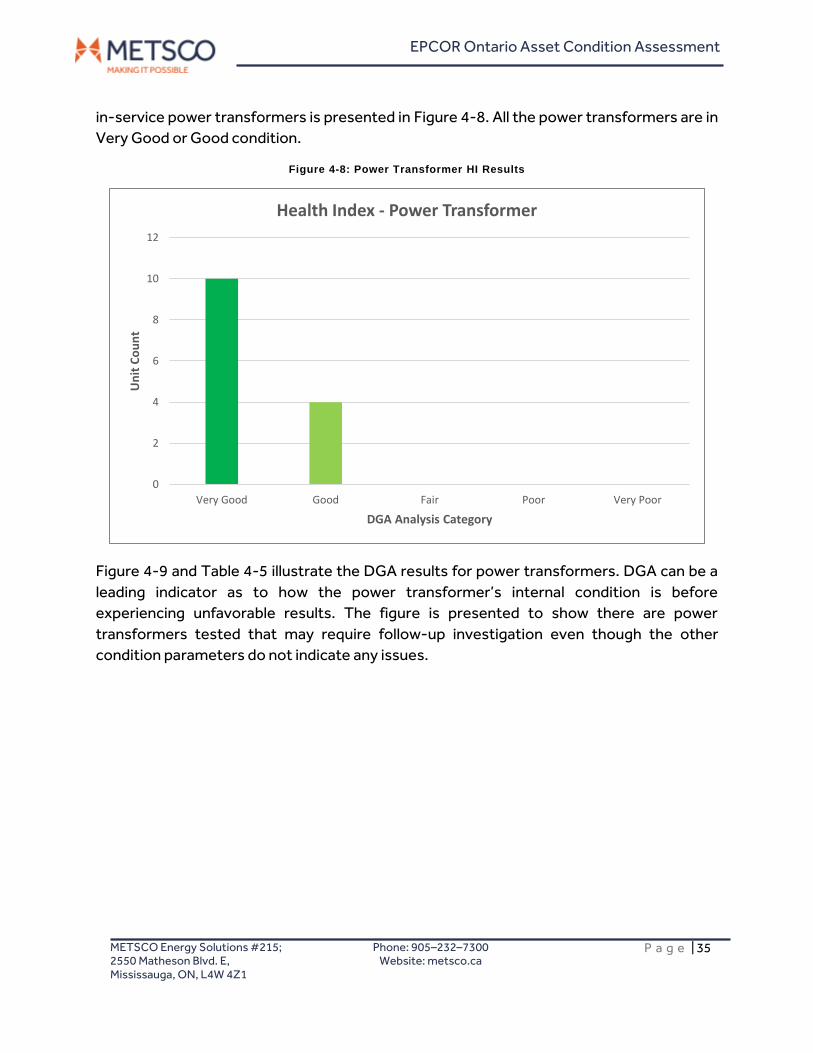
EPCOR Ontario Asset Condition Assessment
METSCO Energy Solutions #215; 2550 Matheson Blvd. E, Mississauga, ON, L4W 4Z1
Phone: 905–232–7300 Website: metsco.ca
P a g e | 35
in-service power transformers is presented in Figure 4-8. All the power transformers are in
Very Good or Good condition.
Figure 4-8: Power Transformer HI Results
Figure 4-9 and Table 4-5 illustrate the DGA results for power transformers. DGA can be a
leading indicator as to how the power transformer’s internal condition is before
experiencing unfavorable results. The figure is presented to show there are power
transformers tested that may require follow-up investigation even though the other
condition parameters do not indicate any issues.
0
2
4
6
8
10
12
Very Good Good Fair Poor Very Poor
Un
it C
ou
nt
DGA Analysis Category
Health Index - Power Transformer
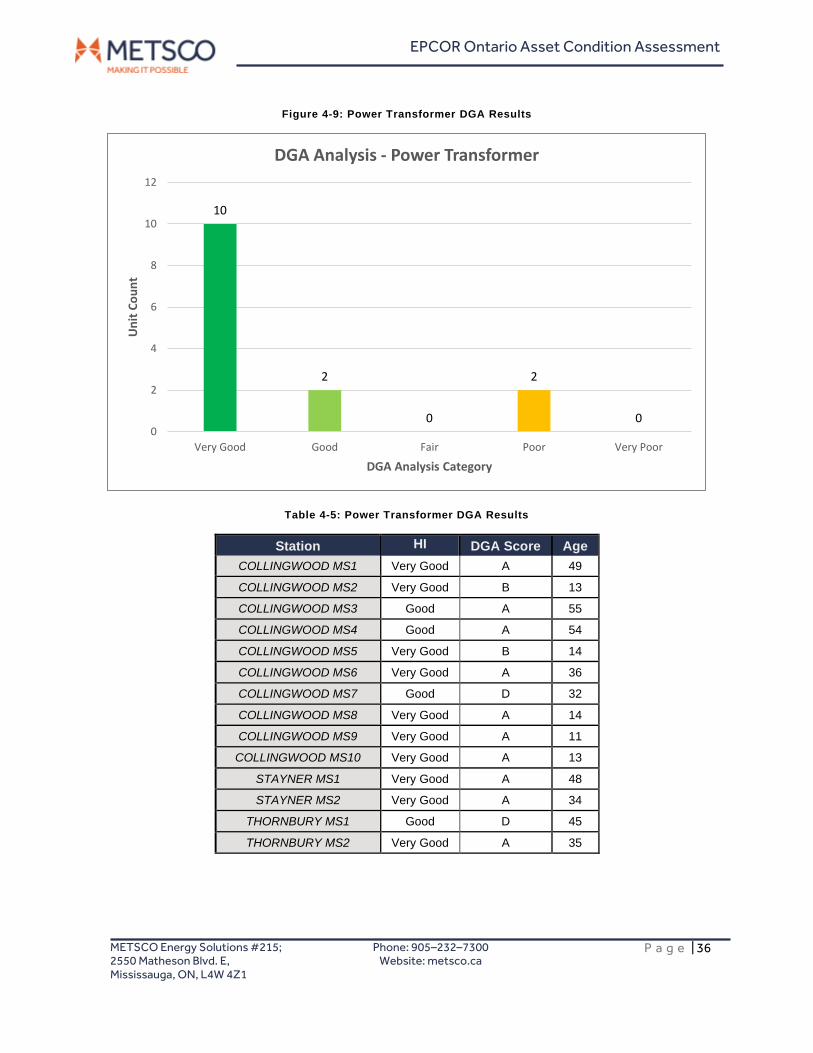
EPCOR Ontario Asset Condition Assessment
METSCO Energy Solutions #215; 2550 Matheson Blvd. E, Mississauga, ON, L4W 4Z1
Phone: 905–232–7300 Website: metsco.ca
P a g e | 36
Figure 4-9: Power Transformer DGA Results
Table 4-5: Power Transformer DGA Results
Station HI DGA Score Age
COLLINGWOOD MS1 Very Good A 49
COLLINGWOOD MS2 Very Good B 13
COLLINGWOOD MS3 Good A 55
COLLINGWOOD MS4 Good A 54
COLLINGWOOD MS5 Very Good B 14
COLLINGWOOD MS6 Very Good A 36
COLLINGWOOD MS7 Good D 32
COLLINGWOOD MS8 Very Good A 14
COLLINGWOOD MS9 Very Good A 11
COLLINGWOOD MS10 Very Good A 13
STAYNER MS1 Very Good A 48
STAYNER MS2 Very Good A 34
THORNBURY MS1 Good D 45
THORNBURY MS2 Very Good A 35
10
2
0
2
00
2
4
6
8
10
12
Very Good Good Fair Poor Very Poor
Un
it C
ou
nt
DGA Analysis Category
DGA Analysis - Power Transformer
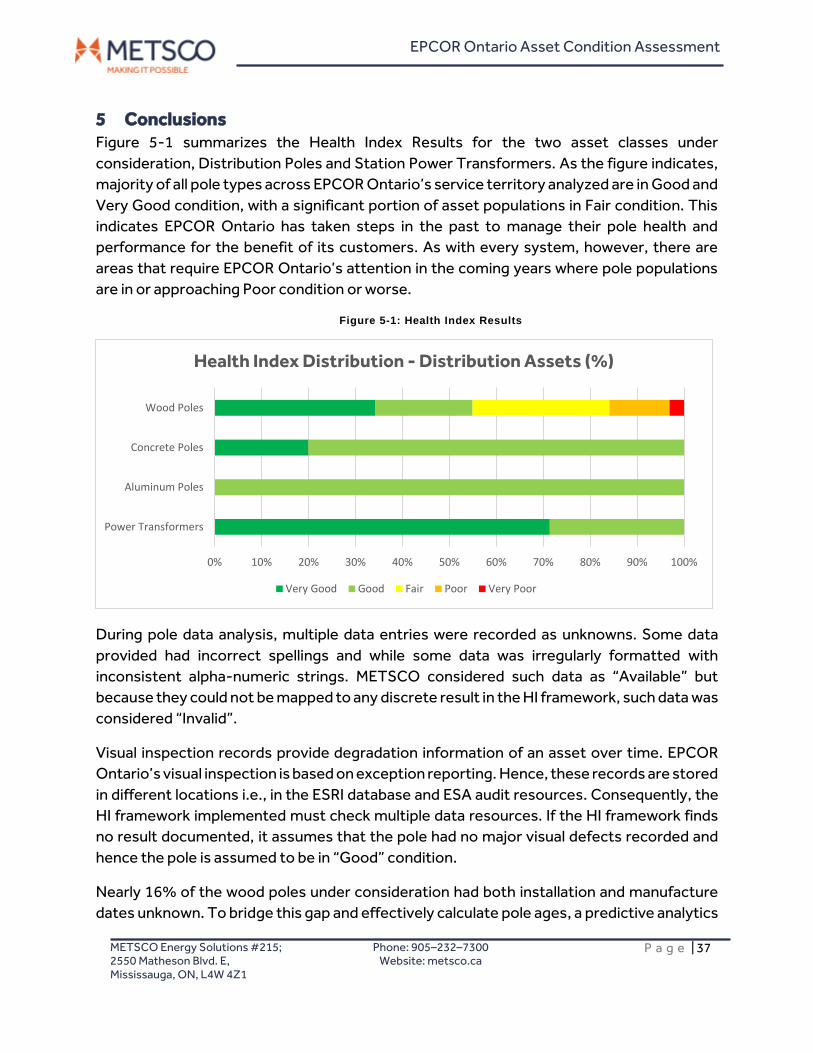
EPCOR Ontario Asset Condition Assessment
METSCO Energy Solutions #215; 2550 Matheson Blvd. E, Mississauga, ON, L4W 4Z1
Phone: 905–232–7300 Website: metsco.ca
P a g e | 37
5 Conclusions Figure 5-1 summarizes the Health Index Results for the two asset classes under
consideration, Distribution Poles and Station Power Transformers. As the figure indicates,
majority of all pole types across EPCOR Ontario’s service territory analyzed are in Good and
Very Good condition, with a significant portion of asset populations in Fair condition. This
indicates EPCOR Ontario has taken steps in the past to manage their pole health and
performance for the benefit of its customers. As with every system, however, there are
areas that require EPCOR Ontario’s attention in the coming years where pole populations
are in or approaching Poor condition or worse.
Figure 5-1: Health Index Results
During pole data analysis, multiple data entries were recorded as unknowns. Some data
provided had incorrect spellings and while some data was irregularly formatted with
inconsistent alpha-numeric strings. METSCO considered such data as “Available” but
because they could not be mapped to any discrete result in the HI framework, such data was
considered “Invalid”.
Visual inspection records provide degradation information of an asset over time. EPCOR
Ontario’s visual inspection is based on exception reporting. Hence, these records are stored
in different locations i.e., in the ESRI database and ESA audit resources. Consequently, the
HI framework implemented must check multiple data resources. If the HI framework finds
no result documented, it assumes that the pole had no major visual defects recorded and
hence the pole is assumed to be in “Good” condition.
Nearly 16% of the wood poles under consideration had both installation and manufacture
dates unknown. To bridge this gap and effectively calculate pole ages, a predictive analytics
0% 10% 20% 30% 40% 50% 60% 70% 80% 90% 100%
Wood Poles
Concrete Poles
Aluminum Poles
Power Transformers
Health Index Distribution - Distribution Assets (%)
Very Good Good Fair Poor Very Poor
EPCOR Ontario Asset Condition Assessment
METSCO Energy Solutions #215; 2550 Matheson Blvd. E, Mississauga, ON, L4W 4Z1
Phone: 905–232–7300 Website: metsco.ca
P a g e | 38
algorithm was applied to predict pole manufacture years, which was then used to calculate
pole ages. Several inputs were used as main predictors to run this algorithm such as pole
height, pole class, pole type, pole coordinates, etc. Few of these predictor fields were also
missing allowing for subsequent data assumptions and the pole ages were calculated.
EPCOR Ontario aimed at conducting resistograph test on all distribution wood poles that
are older than 20 years of age. Resistograph test data provided was applicable for
approximately 28% of the total in-service wood pole population under consideration (i.e.
5,597 wood poles). It was identified that majority of the wood poles beyond 20 years of age
were not tested, and some wood poles tested were younger than 20 years of age.
Figure 5-1 indicates that all station power transformers analysed were either in Very Good
or Good conditions. This further indicates that EPCOR Ontario has taken steps in the past
to manage their asset health and performance for the benefit of its customers. EPCOR
Ontario’s data collection for power transformers meant that the data was highly available,
and hence no assumptions were adopted while building the HI framework.
EPCOR Ontario Asset Condition Assessment
METSCO Energy Solutions #215; 2550 Matheson Blvd. E, Mississauga, ON, L4W 4Z1
Phone: 905–232–7300 Website: metsco.ca
P a g e | 39
6 Recommendations A complete ACA framework for EPCOR Ontario represents an integral component of its
broader AM framework, enabling it to proactively manage its distribution assets and ensure
that the right actions are taken for the right assets at the right time. This framework
leveraged the information captured from maintenance and audit records, creating an
essential linkage between the ongoing maintenance activities and the capital investment
decision-making process. Leveraging the HI insights allows for EPCOR Ontario’s
investment decision-making to be further enhanced with the current information regarding
the state of the assets. There are also further opportunities to introduce new data collected,
improve on data availability and data validity, and continuously improve the ACA framework.
For select asset classes, a recommended HI formulation was used for EPCOR Ontario’s ACA
framework. The recommendations listed in the following subsection are based on improving
the ACA framework over time and should not be interpreted as suggesting that immediate
action is warranted.
6.1 Data Availability and Data Validity Improvements
Data availability and data validity is critical to produce prudent, accurate, and justified
decision-making outputs. It represents the single most important element that can
influence the degree to which the AM decision-making relies on objective factors.
Companies understand that it is critical to execute continuous improvement procedures
through an AM data lifecycle, such that data gaps and inaccuracies can be addressed and
mitigated. In the case of this ACA, the quality of the HI is dependent on the available data.
For condition parameters with low data availability and low data validity, METSCO
recommends that EPCOR Ontario continue collecting the information related to these data
points more robustly.
Additionally, for an asset to have a valid HI, it must meet a minimum 70% of available data
across the condition parameters used in the HI formulation for distribution assets and 65%
for station assets. As part of future improvement opportunities, it is recommended that
EPCOR Ontario continue capturing asset data for condition parameters that are currently
available for a small proportion of the asset population, such that valid Health Indices can be
produced across the population. It is expected that with every passing year, the inspection
record database will continue to grow, allowing for Health Indices to be calculated for the
remaining population.
METSCO advises EPCOR Ontario to consider collecting accurate hammer test results and
pole leaning characteristics such that the current HI framework for distribution poles can be
EPCOR Ontario Asset Condition Assessment
METSCO Energy Solutions #215; 2550 Matheson Blvd. E, Mississauga, ON, L4W 4Z1
Phone: 905–232–7300 Website: metsco.ca
P a g e | 40
further expanded to include condition parameters of wood rot and out-of-plumb
characteristics. Additionally, EPCOR Ontario can plan to conduct the resistograph testing
on all wood poles that are beyond 20 years of age to evaluate remaining pole strengths
accurately.
METSCO recommends EPCOR Ontario to consider performing a more robust,
comprehensive Visual Inspection reporting for their total in-service pole population and
have this data stored in a digitized format as one master resource in five-level grade (e.g.,
from Very Good to Very Poor) as doing so can provide more defined segregation between
assets that need immediate attention and those that can still be in-service without
intervention in the short term.
METSCO recommends that EPCOR Ontario continue to work on mitigating the existing
data gaps and data inconsistencies, such that more degradation parameters can be
assigned actual grades, thus expanding the sample size of valid HI, and capturing all possible
degradation of the evaluated assets. EPCOR Ontario’s testing, inspection, and maintenance
programs are well-positioned to continue to capture this information more
comprehensively and recording it using processes and technologies in place within the
organization.
METSCO recommends that EPCOR Ontario request a more digitally available format for
their power transformer test results in the future, so that future ongoing analysis can be
automated and made more efficient. Currently, many test results are in the form of digital
PDF documents, which require an additional step to be converted to a format where data
analysis is possible.
METSCO recommends that EPCOR Ontario continue to measure the loading history of their
power transformers. In this study, the analysis was performed on six months of peak loading
data, but best practices suggest two years of loading history analysis. If EPCOR Ontario
maintains its current loading data gathering process, the accuracy of this condition
parameter will improve over time.
Additionally, it is highly recommended that EPCOR Ontario consider expanding the current
scope of ACA study from the two asset classes analyzed to include other distribution and
station assets. This could include prioritizing distribution transformers, pad-mounted
switchgear, and underground cables on the distribution side and station circuit breakers,
station switchgear, station back-up supply, and station cables/risers on the station side.
The scope of current ACA study could be further extrapolated to other assets such as
overhead switches, overhead conductors, line reclosers, station service transformers, and
protection relays in future. Consequently, as more asset class-specific condition data is
collected, METSCO can look to expand its current HI framework and evaluate Health Indices
EPCOR Ontario Asset Condition Assessment
METSCO Energy Solutions #215; 2550 Matheson Blvd. E, Mississauga, ON, L4W 4Z1
Phone: 905–232–7300 Website: metsco.ca
P a g e | 41
for the different asset classes under consideration. EPCOR Ontario can utilize this
information to calibrate their maintenance practices and accordingly develop investment
plans for projects involving these asset classes.
EPCOR Ontario Asset Condition Assessment
METSCO Energy Solutions #215; 2550 Matheson Blvd. E, Mississauga, ON, L4W 4Z1
Phone: 905–232–7300 Website: metsco.ca
P a g e | 42
Appendix A – METSCO Company Profile METSCO Energy Solutions Inc. is a Canadian corporation which started its operations on the
market in 2006. METSCO is engaged in the business of providing consulting and project
management services to electricity generating, transmission, and distribution companies,
major industrial and commercial users of electricity, as well as municipalities and
constructors on lighting services, asset management, and construction audits. Our head
office is located in Toronto, ON and our western office is located in Calgary, AB. Through our
network of associates, we provide consulting services to power sector clients around the
world. A small subset of our major clients is shown in the figure below.
Figure A-1: METSCO Clients
METSCO has been leading the industry in Asset Condition Assessment and Asset
Management practices for over ten years. Our founders are the pioneers of the first Health
Index methodology for power equipment in North America as well as the most robust risk-
based analytics on the market today for high-voltage assets. METSCO has since completed
hundreds of asset condition assessments, asset management plans, and asset
management framework implementations. Our collective record of experience in these
EPCOR Ontario Asset Condition Assessment
METSCO Energy Solutions #215; 2550 Matheson Blvd. E, Mississauga, ON, L4W 4Z1
Phone: 905–232–7300 Website: metsco.ca
P a g e | 43
areas is the largest in the world, with ours being the only practice with widespread
acceptance across regulatory jurisdictions. METSCO has worked with over 100 different
utilities through its tenure, and as such, has been exposed and introduced to practices and
unique challenges from a variety of entities, environments, and geographies. When a client
chooses METSCO to work on improving Asset Management practices, it is choosing the
industry-leading standard, rigorously tested and refined on a continued basis. Our experts
have developed, supported, managed, led and sat on stand defending their own DSPs as
utility staff giving METSCO the qualified expertise to provide its service to EPCOR Ontario.
In addition to our work in the area of asset health assessments and lifecycle enhancement,
our services span a broad common utility issue area, including planning and asset
management, design, construction supervision, project management, commissioning,
troubleshooting operating problems, investigating asset failures and providing training and
technology transfer.
Our founders and leaders are pioneers in their respective fields. The fundamental electrical
utility-grade engineering services we provide include:
• Power sector process engineering and improvement • Fixed Asset Investment Planning – development of economic investment plans • Regulatory Proceeding Support • Power System Planning and Studies – identifying system constraints • Smart Grid Development – from planning to implementation of leading
technologies • Asset Performance and Asset Management • Distribution and Transmission System Design • Mentoring, Training, and Technical Resource Development • Health Index Validation and Development • Business Case Development • Owners Engineering Services
• Risk Modeling – Asset Lifecycle and Risk Assessment
EPCOR Ontario Asset Condition Assessment
METSCO Energy Solutions #215; 2550 Matheson Blvd. E, Mississauga, ON, L4W 4Z1
Phone: 905–232–7300 Website: metsco.ca
P a g e | 44
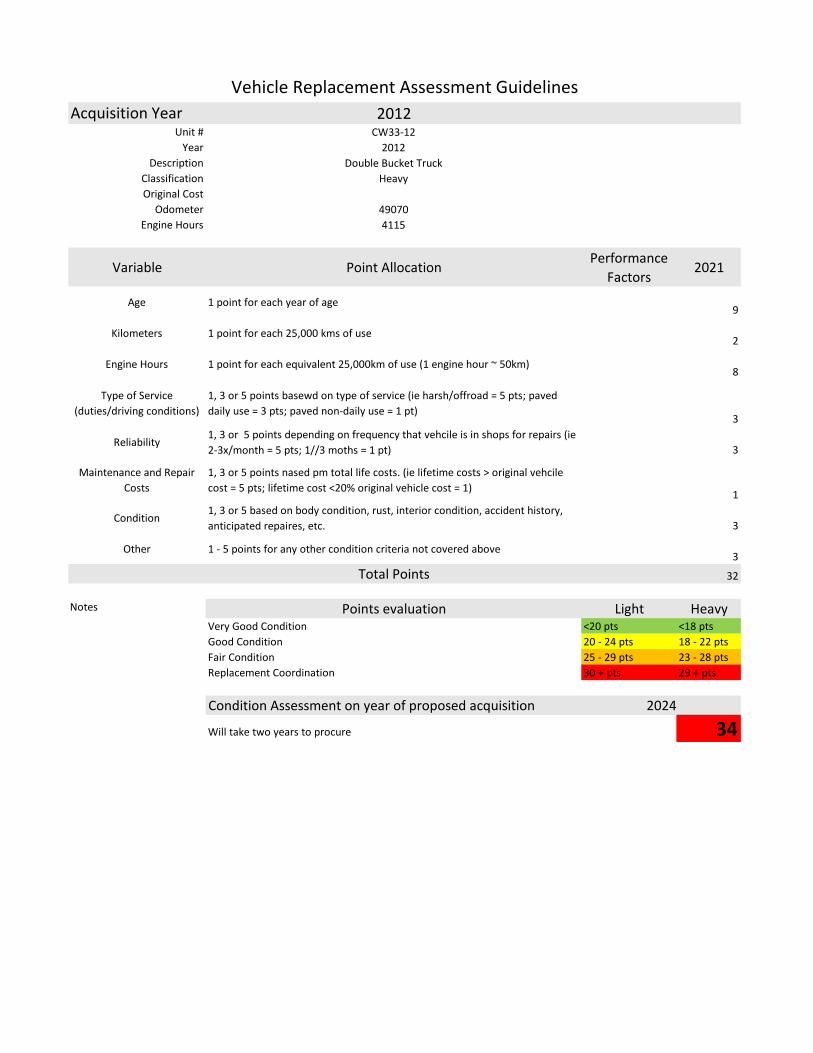
Acquisition Year 2012Unit # CW33-12
Year 2012Description Double Bucket Truck
Classification HeavyOriginal Cost
Odometer 49070Engine Hours 4115
Variable Point AllocationPerformance
Factors2021
Age 1 point for each year of age9
Kilometers 1 point for each 25,000 kms of use2
Engine Hours 1 point for each equivalent 25,000km of use (1 engine hour ~ 50km)8
Type of Service (duties/driving conditions)
1, 3 or 5 points basewd on type of service (ie harsh/offroad = 5 pts; paved daily use = 3 pts; paved non-daily use = 1 pt)
3
Reliability1, 3 or 5 points depending on frequency that vehcile is in shops for repairs (ie 2-3x/month = 5 pts; 1//3 moths = 1 pt) 3
Maintenance and Repair Costs
1, 3 or 5 points nased pm total life costs. (ie lifetime costs > original vehcile cost = 5 pts; lifetime cost <20% original vehicle cost = 1) 1
Condition1, 3 or 5 based on body condition, rust, interior condition, accident history, anticipated repaires, etc. 3
Other 1 - 5 points for any other condition criteria not covered above3
Total Points 32
Points evaluation Light HeavyVery Good Condition <20 pts <18 ptsGood Condition 20 - 24 pts 18 - 22 ptsFair Condition 25 - 29 pts 23 - 28 ptsReplacement Coordination 30 + pts 29 + pts
Condition Assessment on year of proposed acquisition
Will take two years to procure 0 34
Vehicle Replacement Assessment Guidelines
Notes
2024

Acquisition Year 2010Unit # CW30-10
Year 2010Description Line Truck
Classification HeavyOriginal Cost
Odometer 21876Engine Hours 1869
Variable Point AllocationPerformance
Factors2021
Age 1 point for each year of age11
Kilometers 1 point for each 25,000 kms of use0
Engine Hours 1 point for each equivalent 25,000km of use (1 engine hour ~ 50km)3
Type of Service (duties/driving conditions)
1, 3 or 5 points basewd on type of service (ie harsh/offroad = 5 pts; paved daily use = 3 pts; paved non-daily use = 1 pt)
3
Reliability1, 3 or 5 points depending on frequency that vehcile is in shops for repairs (ie 2-3x/month = 5 pts; 1//3 moths = 1 pt) 1
Maintenance and Repair Costs
1, 3 or 5 points nased pm total life costs. (ie lifetime costs > original vehcile cost = 5 pts; lifetime cost <20% original vehicle cost = 1) 1
Condition1, 3 or 5 based on body condition, rust, interior condition, accident history, anticipated repaires, etc. 1
Other 1 - 5 points for any other condition criteria not covered above2
Total Points 22
Points evaluation Light HeavyVery Good Condition <20 pts <18 ptsGood Condition 20 - 24 pts 18 - 22 ptsFair Condition 25 - 29 pts 23 - 28 ptsReplacement Coordination 30 + pts 29 + pts
Condition Assessment on year of proposed acquisition
5 more years of service, 25K of mileage 0 29
Vehicle Replacement Assessment Guidelines
Notes
2027
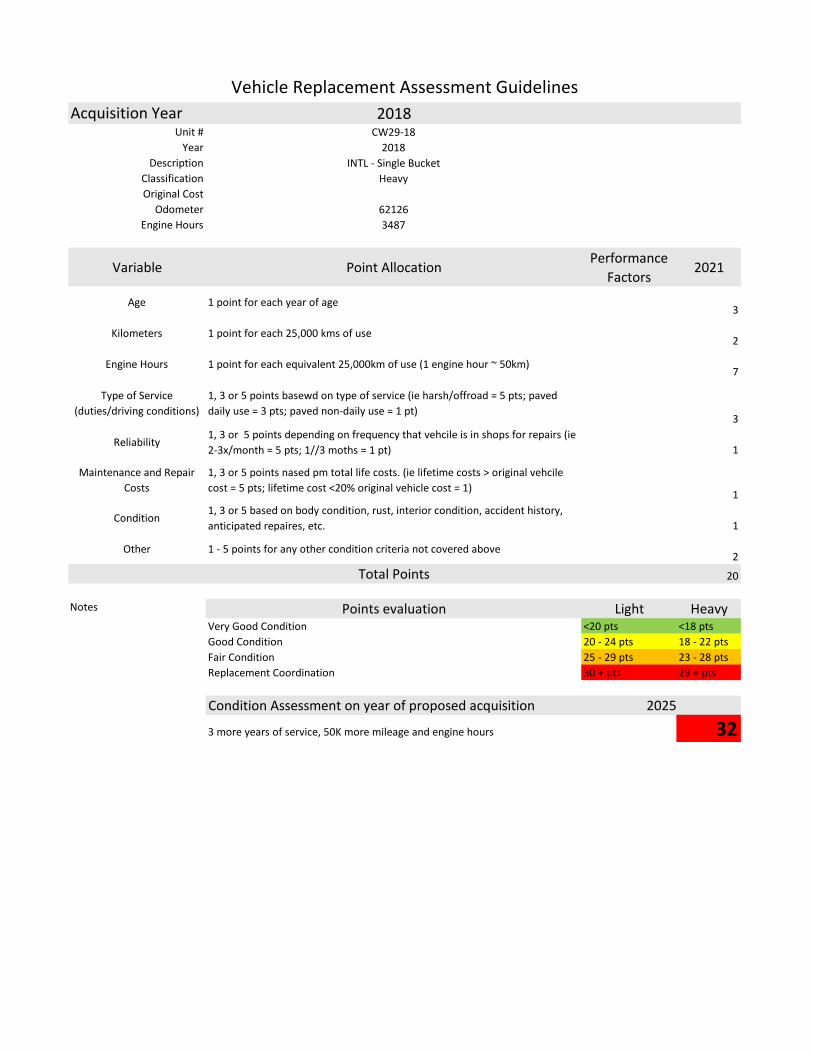
Acquisition Year 2018Unit # CW29-18
Year 2018Description INTL - Single Bucket
Classification HeavyOriginal Cost
Odometer 62126Engine Hours 3487
Variable Point AllocationPerformance
Factors2021
Age 1 point for each year of age3
Kilometers 1 point for each 25,000 kms of use2
Engine Hours 1 point for each equivalent 25,000km of use (1 engine hour ~ 50km)7
Type of Service (duties/driving conditions)
1, 3 or 5 points basewd on type of service (ie harsh/offroad = 5 pts; paved daily use = 3 pts; paved non-daily use = 1 pt)
3
Reliability1, 3 or 5 points depending on frequency that vehcile is in shops for repairs (ie 2-3x/month = 5 pts; 1//3 moths = 1 pt) 1
Maintenance and Repair Costs
1, 3 or 5 points nased pm total life costs. (ie lifetime costs > original vehcile cost = 5 pts; lifetime cost <20% original vehicle cost = 1) 1
Condition1, 3 or 5 based on body condition, rust, interior condition, accident history, anticipated repaires, etc. 1
Other 1 - 5 points for any other condition criteria not covered above2
Total Points 20
Points evaluation Light HeavyVery Good Condition <20 pts <18 ptsGood Condition 20 - 24 pts 18 - 22 ptsFair Condition 25 - 29 pts 23 - 28 ptsReplacement Coordination 30 + pts 29 + pts
Condition Assessment on year of proposed acquisition
3 more years of service, 50K more mileage and engine hours 0 32
Vehicle Replacement Assessment Guidelines
Notes
2025
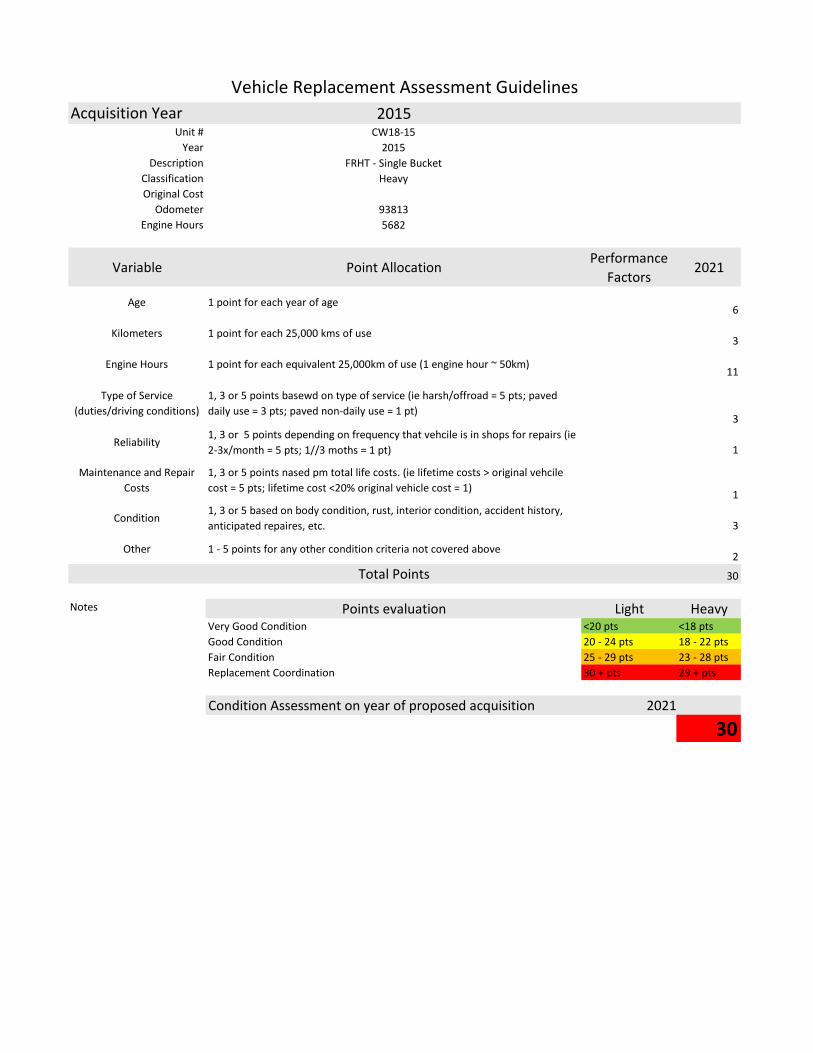
Acquisition Year 2015Unit # CW18-15
Year 2015Description FRHT - Single Bucket
Classification HeavyOriginal Cost
Odometer 93813Engine Hours 5682
Variable Point AllocationPerformance
Factors2021
Age 1 point for each year of age6
Kilometers 1 point for each 25,000 kms of use3
Engine Hours 1 point for each equivalent 25,000km of use (1 engine hour ~ 50km)11
Type of Service (duties/driving conditions)
1, 3 or 5 points basewd on type of service (ie harsh/offroad = 5 pts; paved daily use = 3 pts; paved non-daily use = 1 pt)
3
Reliability1, 3 or 5 points depending on frequency that vehcile is in shops for repairs (ie 2-3x/month = 5 pts; 1//3 moths = 1 pt) 1
Maintenance and Repair Costs
1, 3 or 5 points nased pm total life costs. (ie lifetime costs > original vehcile cost = 5 pts; lifetime cost <20% original vehicle cost = 1) 1
Condition1, 3 or 5 based on body condition, rust, interior condition, accident history, anticipated repaires, etc. 3
Other 1 - 5 points for any other condition criteria not covered above2
Total Points 30
Points evaluation Light HeavyVery Good Condition <20 pts <18 ptsGood Condition 20 - 24 pts 18 - 22 ptsFair Condition 25 - 29 pts 23 - 28 ptsReplacement Coordination 30 + pts 29 + pts
Condition Assessment on year of proposed acquisition
0 30
Vehicle Replacement Assessment Guidelines
Notes
2021

Acquisition Year 2004Unit # CW14-04
Year 2004Description FORD - Small Dump Truck
Classification HeavyOriginal Cost
Odometer 64983Engine Hours 935
Variable Point AllocationPerformance
Factors2021
Age 1 point for each year of age17
Kilometers 1 point for each 25,000 kms of use2
Engine Hours 1 point for each equivalent 25,000km of use (1 engine hour ~ 50km)1
Type of Service (duties/driving conditions)
1, 3 or 5 points basewd on type of service (ie harsh/offroad = 5 pts; paved daily use = 3 pts; paved non-daily use = 1 pt)
0
Reliability1, 3 or 5 points depending on frequency that vehcile is in shops for repairs (ie 2-3x/month = 5 pts; 1//3 moths = 1 pt) 0
Maintenance and Repair Costs
1, 3 or 5 points nased pm total life costs. (ie lifetime costs > original vehcile cost = 5 pts; lifetime cost <20% original vehicle cost = 1) 3
Condition1, 3 or 5 based on body condition, rust, interior condition, accident history, anticipated repaires, etc. 3
Other 1 - 5 points for any other condition criteria not covered above2
Total Points 28
Points evaluation Light HeavyVery Good Condition <20 pts <18 ptsGood Condition 20 - 24 pts 18 - 22 ptsFair Condition 25 - 29 pts 23 - 28 ptsReplacement Coordination 30 + pts 29 + pts
Condition Assessment on year of proposed acquisition
6 more years of service 0 29
Vehicle Replacement Assessment Guidelines
Notes
2023

Acquisition Year 2017Unit # CW13-17
Year 2017Description FRHT - Line Truck
Classification HeavyOriginal Cost
Odometer 26088Engine Hours 2029
Variable Point AllocationPerformance
Factors2021
Age 1 point for each year of age4
Kilometers 1 point for each 25,000 kms of use1
Engine Hours 1 point for each equivalent 25,000km of use (1 engine hour ~ 50km)4
Type of Service (duties/driving conditions)
1, 3 or 5 points basewd on type of service (ie harsh/offroad = 5 pts; paved daily use = 3 pts; paved non-daily use = 1 pt)
3
Reliability1, 3 or 5 points depending on frequency that vehcile is in shops for repairs (ie 2-3x/month = 5 pts; 1//3 moths = 1 pt) 1
Maintenance and Repair Costs
1, 3 or 5 points nased pm total life costs. (ie lifetime costs > original vehcile cost = 5 pts; lifetime cost <20% original vehicle cost = 1) 1
Condition1, 3 or 5 based on body condition, rust, interior condition, accident history, anticipated repaires, etc. 1
Other 1 - 5 points for any other condition criteria not covered above1
Total Points 16
Points evaluation Light HeavyVery Good Condition <20 pts <18 ptsGood Condition 20 - 24 pts 18 - 22 ptsFair Condition 25 - 29 pts 23 - 28 ptsReplacement Coordination 30 + pts 29 + pts
Condition Assessment on year of proposed acquisition
5 more years of service, 25K more mileage 0 29
Vehicle Replacement Assessment Guidelines
Notes
2026
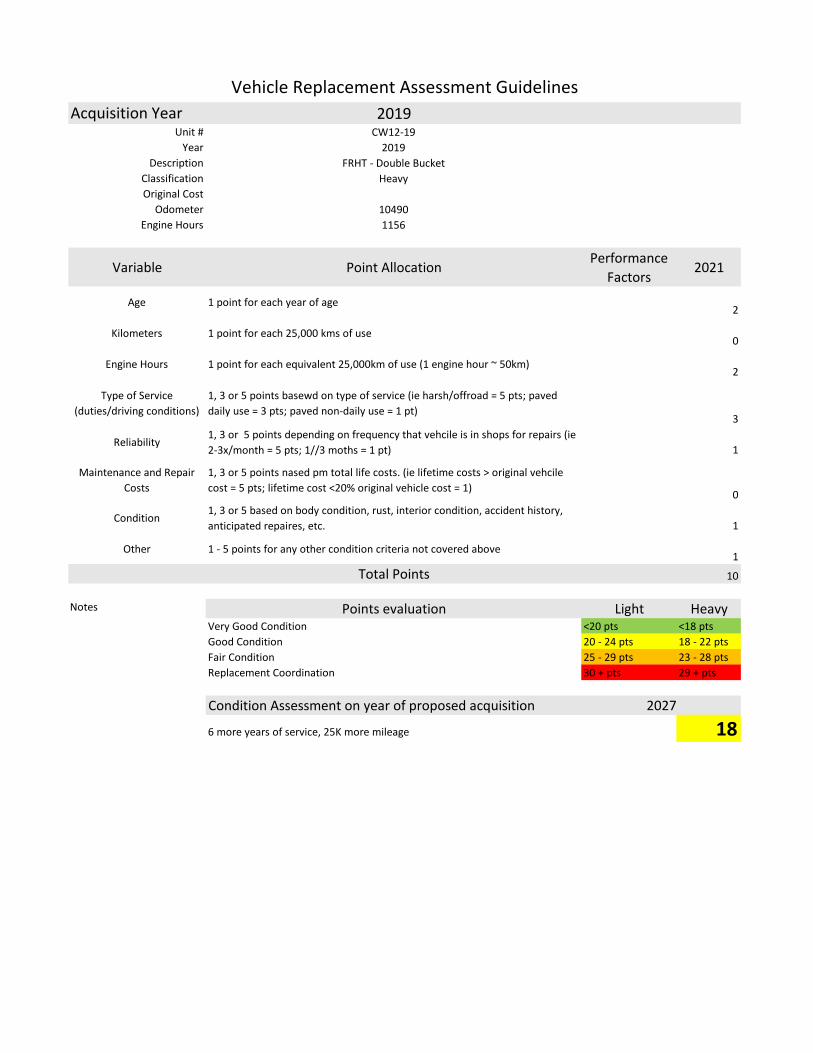
Acquisition Year 2019Unit # CW12-19
Year 2019Description FRHT - Double Bucket
Classification HeavyOriginal Cost
Odometer 10490Engine Hours 1156
Variable Point AllocationPerformance
Factors2021
Age 1 point for each year of age2
Kilometers 1 point for each 25,000 kms of use0
Engine Hours 1 point for each equivalent 25,000km of use (1 engine hour ~ 50km)2
Type of Service (duties/driving conditions)
1, 3 or 5 points basewd on type of service (ie harsh/offroad = 5 pts; paved daily use = 3 pts; paved non-daily use = 1 pt)
3
Reliability1, 3 or 5 points depending on frequency that vehcile is in shops for repairs (ie 2-3x/month = 5 pts; 1//3 moths = 1 pt) 1
Maintenance and Repair Costs
1, 3 or 5 points nased pm total life costs. (ie lifetime costs > original vehcile cost = 5 pts; lifetime cost <20% original vehicle cost = 1) 0
Condition1, 3 or 5 based on body condition, rust, interior condition, accident history, anticipated repaires, etc. 1
Other 1 - 5 points for any other condition criteria not covered above1
Total Points 10
Points evaluation Light HeavyVery Good Condition <20 pts <18 ptsGood Condition 20 - 24 pts 18 - 22 ptsFair Condition 25 - 29 pts 23 - 28 ptsReplacement Coordination 30 + pts 29 + pts
Condition Assessment on year of proposed acquisition
6 more years of service, 25K more mileage 0 18
Vehicle Replacement Assessment Guidelines
Notes
2027
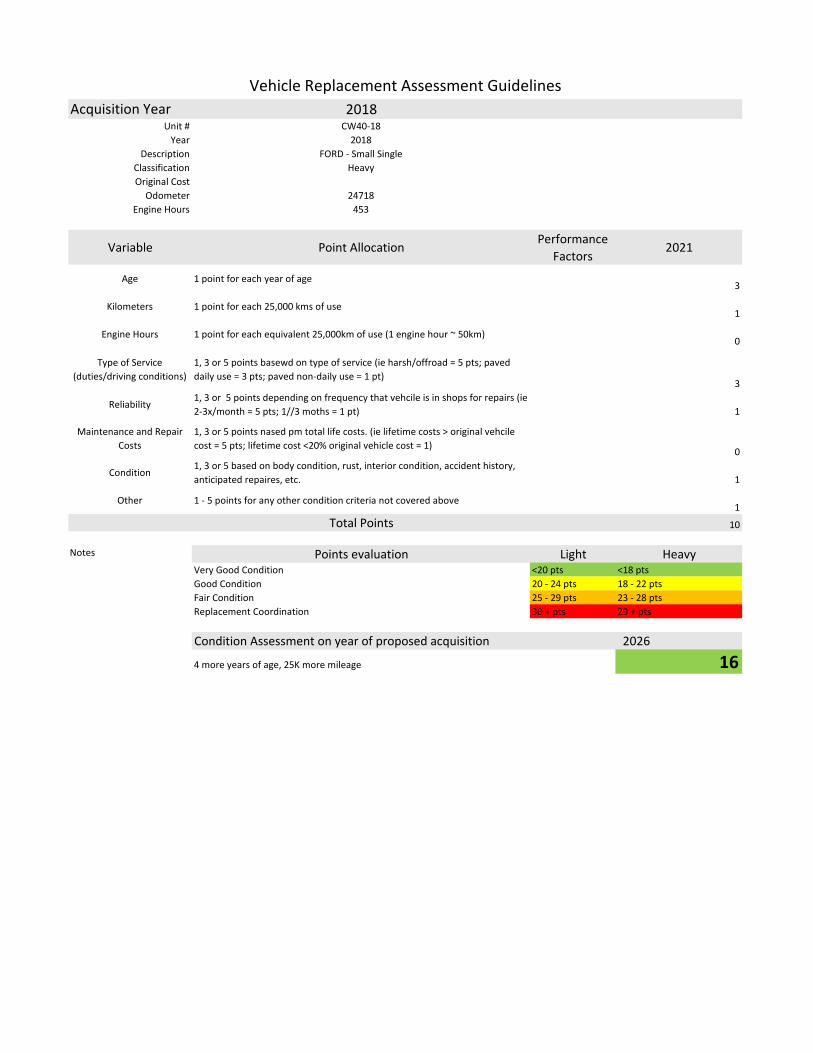
Acquisition Year 2018Unit # CW40-18
Year 2018Description FORD - Small Single
Classification HeavyOriginal Cost
Odometer 24718Engine Hours 453
Variable Point Allocation Performance Factors
2021
Age 1 point for each year of age3
Kilometers 1 point for each 25,000 kms of use1
Engine Hours 1 point for each equivalent 25,000km of use (1 engine hour ~ 50km)0
Type of Service (duties/driving conditions)
1, 3 or 5 points basewd on type of service (ie harsh/offroad = 5 pts; paved daily use = 3 pts; paved non-daily use = 1 pt)
3
Reliability1, 3 or 5 points depending on frequency that vehcile is in shops for repairs (ie 2-3x/month = 5 pts; 1//3 moths = 1 pt) 1
Maintenance and Repair Costs
1, 3 or 5 points nased pm total life costs. (ie lifetime costs > original vehcile cost = 5 pts; lifetime cost <20% original vehicle cost = 1) 0
Condition1, 3 or 5 based on body condition, rust, interior condition, accident history, anticipated repaires, etc. 1
Other 1 - 5 points for any other condition criteria not covered above1
Total Points 10
Points evaluation Light HeavyVery Good Condition <20 pts <18 ptsGood Condition 20 - 24 pts 18 - 22 ptsFair Condition 25 - 29 pts 23 - 28 ptsReplacement Coordination 30 + pts 29 + pts
Condition Assessment on year of proposed acquisition
4 more years of age, 25K more mileage 0 16
Vehicle Replacement Assessment Guidelines
Notes
2026
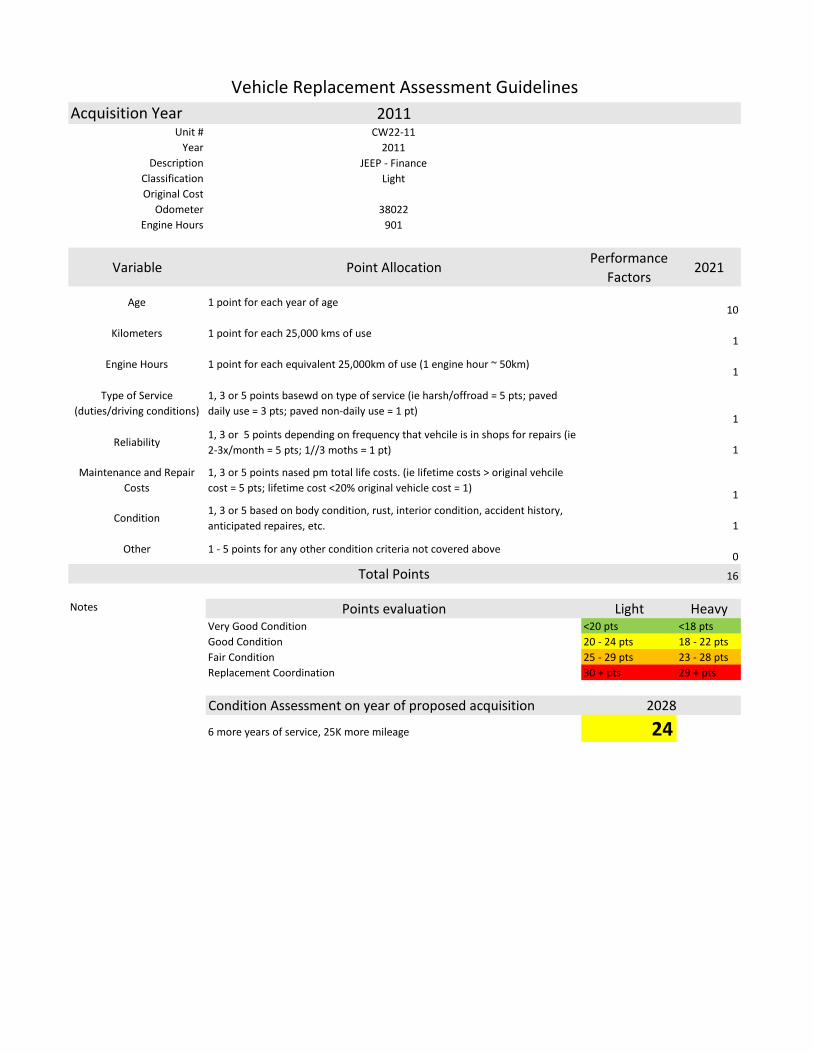
Acquisition Year 2011Unit # CW22-11
Year 2011Description JEEP - Finance
Classification LightOriginal Cost
Odometer 38022Engine Hours 901
Variable Point AllocationPerformance
Factors2021
Age 1 point for each year of age10
Kilometers 1 point for each 25,000 kms of use1
Engine Hours 1 point for each equivalent 25,000km of use (1 engine hour ~ 50km)1
Type of Service (duties/driving conditions)
1, 3 or 5 points basewd on type of service (ie harsh/offroad = 5 pts; paved daily use = 3 pts; paved non-daily use = 1 pt)
1
Reliability1, 3 or 5 points depending on frequency that vehcile is in shops for repairs (ie 2-3x/month = 5 pts; 1//3 moths = 1 pt) 1
Maintenance and Repair Costs
1, 3 or 5 points nased pm total life costs. (ie lifetime costs > original vehcile cost = 5 pts; lifetime cost <20% original vehicle cost = 1) 1
Condition1, 3 or 5 based on body condition, rust, interior condition, accident history, anticipated repaires, etc. 1
Other 1 - 5 points for any other condition criteria not covered above0
Total Points 16
Points evaluation Light HeavyVery Good Condition <20 pts <18 ptsGood Condition 20 - 24 pts 18 - 22 ptsFair Condition 25 - 29 pts 23 - 28 ptsReplacement Coordination 30 + pts 29 + pts
Condition Assessment on year of proposed acquisition
6 more years of service, 25K more mileage 24 0
Vehicle Replacement Assessment Guidelines
Notes
2028

Acquisition Year 2014Unit # CW15-14
Year 2014Description DODGE - Journey
Classification LightOriginal Cost
Odometer 92390Engine Hours 2344
Variable Point AllocationPerformance
Factors2021
Age 1 point for each year of age7
Kilometers 1 point for each 25,000 kms of use3
Engine Hours 1 point for each equivalent 25,000km of use (1 engine hour ~ 50km)4
Type of Service (duties/driving conditions)
1, 3 or 5 points basewd on type of service (ie harsh/offroad = 5 pts; paved daily use = 3 pts; paved non-daily use = 1 pt)
3
Reliability1, 3 or 5 points depending on frequency that vehcile is in shops for repairs (ie 2-3x/month = 5 pts; 1//3 moths = 1 pt) 3
Maintenance and Repair Costs
1, 3 or 5 points nased pm total life costs. (ie lifetime costs > original vehcile cost = 5 pts; lifetime cost <20% original vehicle cost = 1) 3
Condition1, 3 or 5 based on body condition, rust, interior condition, accident history, anticipated repaires, etc. 3
Other 1 - 5 points for any other condition criteria not covered above1
Total Points 27
Points evaluation Light HeavyVery Good Condition <20 pts <18 ptsGood Condition 20 - 24 pts 18 - 22 ptsFair Condition 25 - 29 pts 23 - 28 ptsReplacement Coordination 30 + pts 29 + pts
Condition Assessment on year of proposed acquisition
27 0
Vehicle Replacement Assessment Guidelines
Notes
To be replaced 2022

Acquisition Year 2019Unit # CW36-19
Year 2019Description JEEP - Ops
Classification LightOriginal Cost
Odometer 19992Engine Hours 1312
Variable Point AllocationPerformance
Factors2021
Age 1 point for each year of age2
Kilometers 1 point for each 25,000 kms of use1
Engine Hours 1 point for each equivalent 25,000km of use (1 engine hour ~ 50km)2
Type of Service (duties/driving conditions)
1, 3 or 5 points basewd on type of service (ie harsh/offroad = 5 pts; paved daily use = 3 pts; paved non-daily use = 1 pt)
1
Reliability1, 3 or 5 points depending on frequency that vehcile is in shops for repairs (ie 2-3x/month = 5 pts; 1//3 moths = 1 pt) 1
Maintenance and Repair Costs
1, 3 or 5 points nased pm total life costs. (ie lifetime costs > original vehcile cost = 5 pts; lifetime cost <20% original vehicle cost = 1) 1
Condition1, 3 or 5 based on body condition, rust, interior condition, accident history, anticipated repaires, etc. 1
Other 1 - 5 points for any other condition criteria not covered above0
Total Points 9
Points evaluation Light HeavyVery Good Condition <20 pts <18 ptsGood Condition 20 - 24 pts 18 - 22 ptsFair Condition 25 - 29 pts 23 - 28 ptsReplacement Coordination 30 + pts 29 + pts
Condition Assessment on year of proposed acquisition
6 more years of service, 50K more mileage 19 0
Vehicle Replacement Assessment Guidelines
Notes
2027
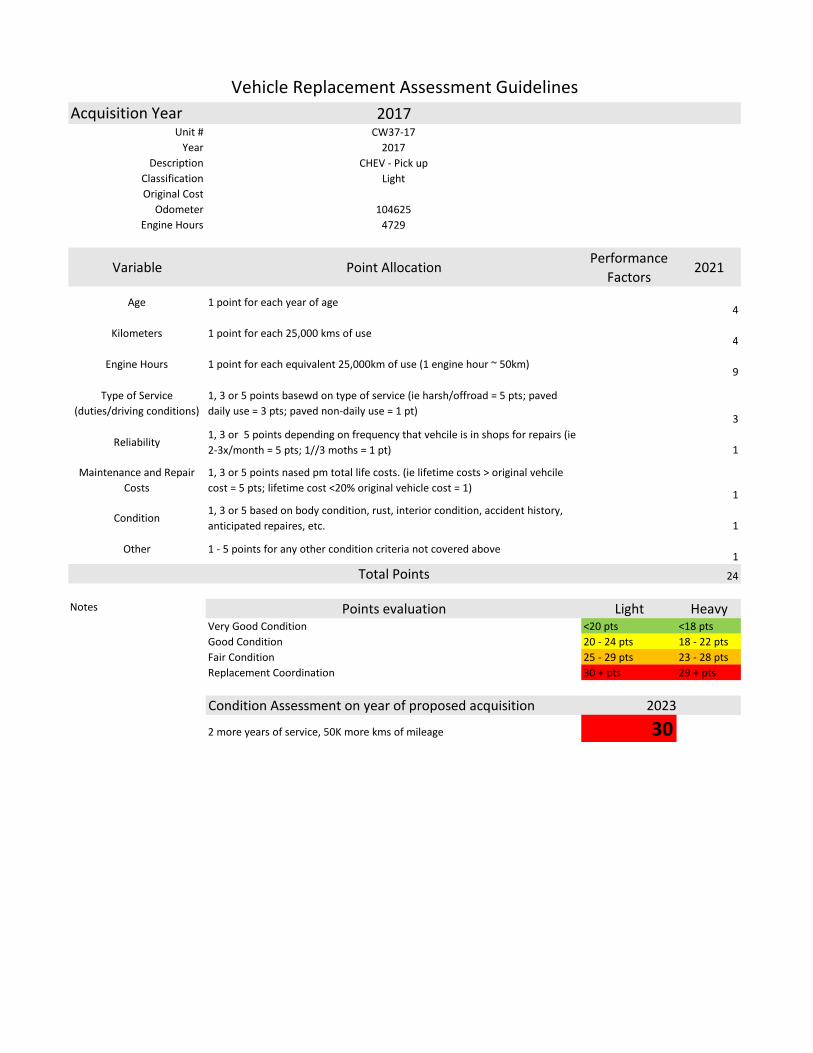
Acquisition Year 2017Unit # CW37-17
Year 2017Description CHEV - Pick up
Classification LightOriginal Cost
Odometer 104625Engine Hours 4729
Variable Point AllocationPerformance
Factors2021
Age 1 point for each year of age4
Kilometers 1 point for each 25,000 kms of use4
Engine Hours 1 point for each equivalent 25,000km of use (1 engine hour ~ 50km)9
Type of Service (duties/driving conditions)
1, 3 or 5 points basewd on type of service (ie harsh/offroad = 5 pts; paved daily use = 3 pts; paved non-daily use = 1 pt)
3
Reliability1, 3 or 5 points depending on frequency that vehcile is in shops for repairs (ie 2-3x/month = 5 pts; 1//3 moths = 1 pt) 1
Maintenance and Repair Costs
1, 3 or 5 points nased pm total life costs. (ie lifetime costs > original vehcile cost = 5 pts; lifetime cost <20% original vehicle cost = 1) 1
Condition1, 3 or 5 based on body condition, rust, interior condition, accident history, anticipated repaires, etc. 1
Other 1 - 5 points for any other condition criteria not covered above1
Total Points 24
Points evaluation Light HeavyVery Good Condition <20 pts <18 ptsGood Condition 20 - 24 pts 18 - 22 ptsFair Condition 25 - 29 pts 23 - 28 ptsReplacement Coordination 30 + pts 29 + pts
Condition Assessment on year of proposed acquisition
2 more years of service, 50K more kms of mileage 30 0
Vehicle Replacement Assessment Guidelines
Notes
2023

Acquisition Year 2019Unit # CW34-19
Year 2019Description Ford - Pick up
Classification LightOriginal Cost
Odometer 47660Engine Hours 2681
Variable Point AllocationPerformance
Factors2021
Age 1 point for each year of age2
Kilometers 1 point for each 25,000 kms of use1
Engine Hours 1 point for each equivalent 25,000km of use (1 engine hour ~ 50km)5
Type of Service (duties/driving conditions)
1, 3 or 5 points basewd on type of service (ie harsh/offroad = 5 pts; paved daily use = 3 pts; paved non-daily use = 1 pt)
3
Reliability1, 3 or 5 points depending on frequency that vehcile is in shops for repairs (ie 2-3x/month = 5 pts; 1//3 moths = 1 pt) 1
Maintenance and Repair Costs
1, 3 or 5 points nased pm total life costs. (ie lifetime costs > original vehcile cost = 5 pts; lifetime cost <20% original vehicle cost = 1) 1
Condition1, 3 or 5 based on body condition, rust, interior condition, accident history, anticipated repaires, etc. 1
Other 1 - 5 points for any other condition criteria not covered above1
Total Points 15
Points evaluation Light HeavyVery Good Condition <20 pts <18 ptsGood Condition 20 - 24 pts 18 - 22 ptsFair Condition 25 - 29 pts 23 - 28 ptsReplacement Coordination 30 + pts 29 + pts
Condition Assessment on year of proposed acquisition
2 more years of service, 75K more mileage 35 0
Vehicle Replacement Assessment Guidelines
Notes
2026

Acquisition Year 2014Unit # CW32-14
Year 2014Description DODGE - Pick up
Classification LightOriginal Cost
Odometer 185903Engine Hours 4812
Variable Point AllocationPerformance
Factors2021
Age 1 point for each year of age7
Kilometers 1 point for each 25,000 kms of use7
Engine Hours 1 point for each equivalent 25,000km of use (1 engine hour ~ 50km)9
Type of Service (duties/driving conditions)
1, 3 or 5 points basewd on type of service (ie harsh/offroad = 5 pts; paved daily use = 3 pts; paved non-daily use = 1 pt)
3
Reliability1, 3 or 5 points depending on frequency that vehcile is in shops for repairs (ie 2-3x/month = 5 pts; 1//3 moths = 1 pt) 1
Maintenance and Repair Costs
1, 3 or 5 points nased pm total life costs. (ie lifetime costs > original vehcile cost = 5 pts; lifetime cost <20% original vehicle cost = 1) 1
Condition1, 3 or 5 based on body condition, rust, interior condition, accident history, anticipated repaires, etc. 1
Other 1 - 5 points for any other condition criteria not covered above1
Total Points 30
Points evaluation Light HeavyVery Good Condition <20 pts <18 ptsGood Condition 20 - 24 pts 18 - 22 ptsFair Condition 25 - 29 pts 23 - 28 ptsReplacement Coordination 30 + pts 29 + pts
Condition Assessment on year of proposed acquisition
30 0
Vehicle Replacement Assessment Guidelines
Notes
To be replaced 2022

Acquisition Year 2014Unit # CW31-14
Year 2014Description DODGE - Pick up
Classification LightOriginal Cost
Odometer 153882Engine Hours 6844
Variable Point AllocationPerformance
Factors2021
Age 1 point for each year of age7
Kilometers 1 point for each 25,000 kms of use6
Engine Hours 1 point for each equivalent 25,000km of use (1 engine hour ~ 50km)13
Type of Service (duties/driving conditions)
1, 3 or 5 points basewd on type of service (ie harsh/offroad = 5 pts; paved daily use = 3 pts; paved non-daily use = 1 pt)
3
Reliability1, 3 or 5 points depending on frequency that vehcile is in shops for repairs (ie 2-3x/month = 5 pts; 1//3 moths = 1 pt) 1
Maintenance and Repair Costs
1, 3 or 5 points nased pm total life costs. (ie lifetime costs > original vehcile cost = 5 pts; lifetime cost <20% original vehicle cost = 1) 1
Condition1, 3 or 5 based on body condition, rust, interior condition, accident history, anticipated repaires, etc. 3
Other 1 - 5 points for any other condition criteria not covered above1
Total Points 35
Points evaluation Light HeavyVery Good Condition <20 pts <18 ptsGood Condition 20 - 24 pts 18 - 22 ptsFair Condition 25 - 29 pts 23 - 28 ptsReplacement Coordination 30 + pts 29 + pts
Condition Assessment on year of proposed acquisition
35 0
Vehicle Replacement Assessment Guidelines
Notes
To be replaced 2022

Acquisition Year 2011Unit # CW16-11
Year 2011Description GMC - Pick up
Classification LightOriginal Cost
Odometer 83022Engine Hours 1856
Variable Point AllocationPerformance
Factors2021
Age 1 point for each year of age10
Kilometers 1 point for each 25,000 kms of use3
Engine Hours 1 point for each equivalent 25,000km of use (1 engine hour ~ 50km)3
Type of Service (duties/driving conditions)
1, 3 or 5 points basewd on type of service (ie harsh/offroad = 5 pts; paved daily use = 3 pts; paved non-daily use = 1 pt)
3
Reliability1, 3 or 5 points depending on frequency that vehcile is in shops for repairs (ie 2-3x/month = 5 pts; 1//3 moths = 1 pt) 3
Maintenance and Repair Costs
1, 3 or 5 points nased pm total life costs. (ie lifetime costs > original vehcile cost = 5 pts; lifetime cost <20% original vehicle cost = 1) 3
Condition1, 3 or 5 based on body condition, rust, interior condition, accident history, anticipated repaires, etc. 5
Other 1 - 5 points for any other condition criteria not covered above3
Total Points 33
Points evaluation Light HeavyVery Good Condition <20 pts <18 ptsGood Condition 20 - 24 pts 18 - 22 ptsFair Condition 25 - 29 pts 23 - 28 ptsReplacement Coordination 30 + pts 29 + pts
Condition Assessment on year of proposed acquisition
33 0
Vehicle Replacement Assessment Guidelines
Notes
To be replaced 2022
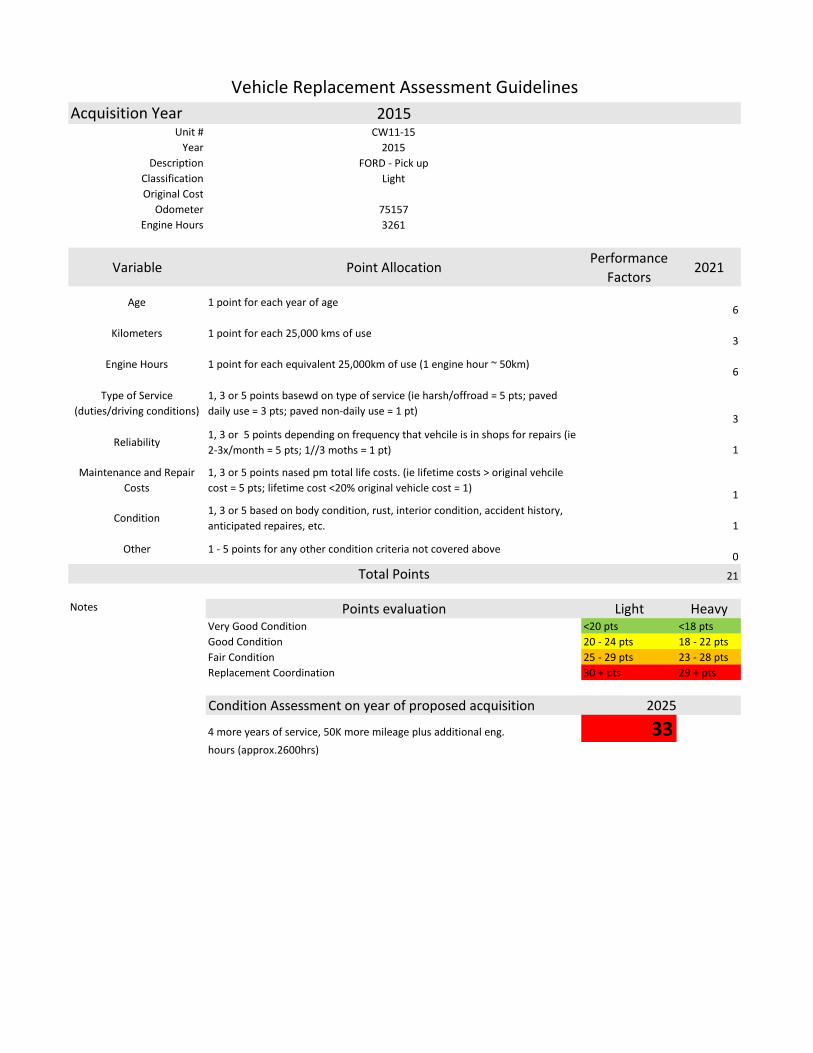
Acquisition Year 2015Unit # CW11-15
Year 2015Description FORD - Pick up
Classification LightOriginal Cost
Odometer 75157Engine Hours 3261
Variable Point AllocationPerformance
Factors2021
Age 1 point for each year of age6
Kilometers 1 point for each 25,000 kms of use3
Engine Hours 1 point for each equivalent 25,000km of use (1 engine hour ~ 50km)6
Type of Service (duties/driving conditions)
1, 3 or 5 points basewd on type of service (ie harsh/offroad = 5 pts; paved daily use = 3 pts; paved non-daily use = 1 pt)
3
Reliability1, 3 or 5 points depending on frequency that vehcile is in shops for repairs (ie 2-3x/month = 5 pts; 1//3 moths = 1 pt) 1
Maintenance and Repair Costs
1, 3 or 5 points nased pm total life costs. (ie lifetime costs > original vehcile cost = 5 pts; lifetime cost <20% original vehicle cost = 1) 1
Condition1, 3 or 5 based on body condition, rust, interior condition, accident history, anticipated repaires, etc. 1
Other 1 - 5 points for any other condition criteria not covered above0
Total Points 21
Points evaluation Light HeavyVery Good Condition <20 pts <18 ptsGood Condition 20 - 24 pts 18 - 22 ptsFair Condition 25 - 29 pts 23 - 28 ptsReplacement Coordination 30 + pts 29 + pts
Condition Assessment on year of proposed acquisition
4 more years of service, 50K more mileage plus additional eng. 33 0hours (approx.2600hrs)
Vehicle Replacement Assessment Guidelines
Notes
2025
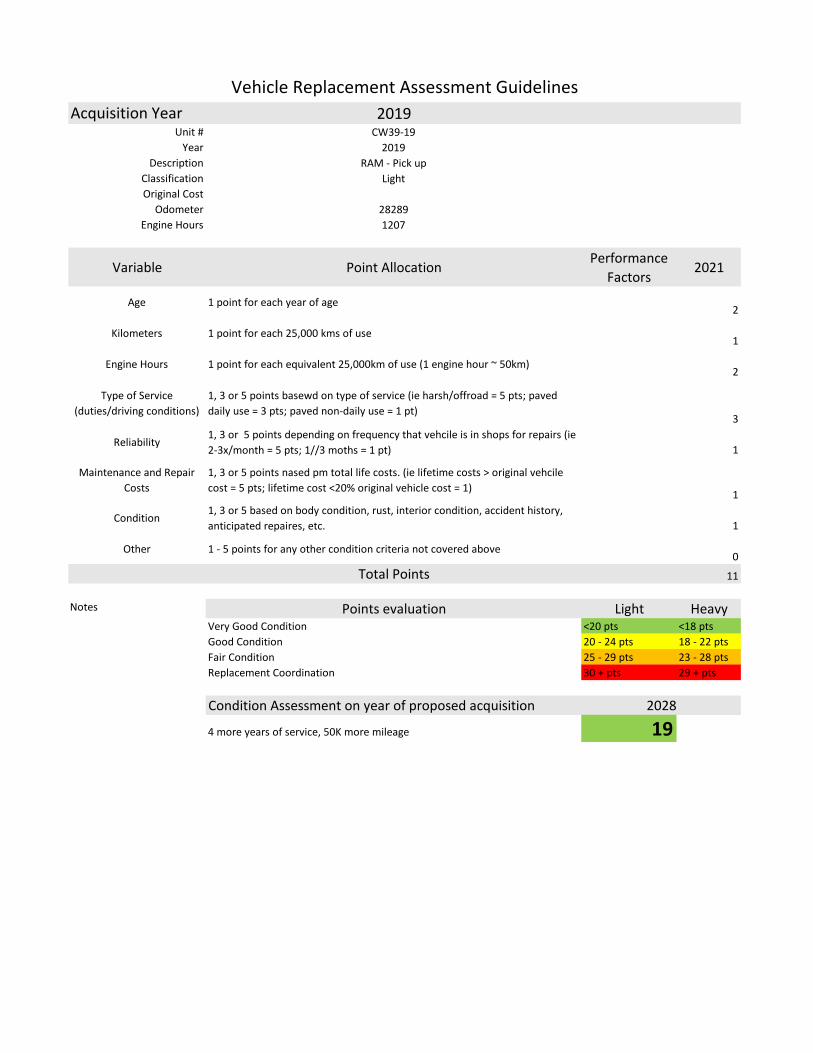
Acquisition Year 2019Unit # CW39-19
Year 2019Description RAM - Pick up
Classification LightOriginal Cost
Odometer 28289Engine Hours 1207
Variable Point AllocationPerformance
Factors2021
Age 1 point for each year of age2
Kilometers 1 point for each 25,000 kms of use1
Engine Hours 1 point for each equivalent 25,000km of use (1 engine hour ~ 50km)2
Type of Service (duties/driving conditions)
1, 3 or 5 points basewd on type of service (ie harsh/offroad = 5 pts; paved daily use = 3 pts; paved non-daily use = 1 pt)
3
Reliability1, 3 or 5 points depending on frequency that vehcile is in shops for repairs (ie 2-3x/month = 5 pts; 1//3 moths = 1 pt) 1
Maintenance and Repair Costs
1, 3 or 5 points nased pm total life costs. (ie lifetime costs > original vehcile cost = 5 pts; lifetime cost <20% original vehicle cost = 1) 1
Condition1, 3 or 5 based on body condition, rust, interior condition, accident history, anticipated repaires, etc. 1
Other 1 - 5 points for any other condition criteria not covered above0
Total Points 11
Points evaluation Light HeavyVery Good Condition <20 pts <18 ptsGood Condition 20 - 24 pts 18 - 22 ptsFair Condition 25 - 29 pts 23 - 28 ptsReplacement Coordination 30 + pts 29 + pts
Condition Assessment on year of proposed acquisition
4 more years of service, 50K more mileage 19 0
Vehicle Replacement Assessment Guidelines
Notes
2028
Collingwood, Ontario
November 2021
Community Consultation Survey
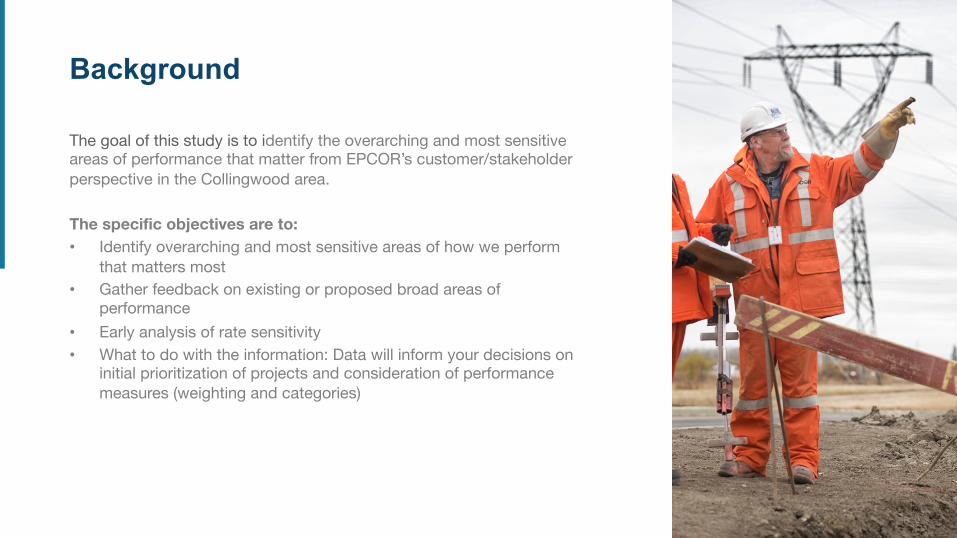
Background
The goal of this study is to identify the overarching and most sensitive areas of performance that matter from EPCOR’s customer/stakeholder perspective in the Collingwood area.
The specific objectives are to:• Identify overarching and most sensitive areas of how we perform
that matters most• Gather feedback on existing or proposed broad areas of
performance• Early analysis of rate sensitivity• What to do with the information: Data will inform your decisions on
initial prioritization of projects and consideration of performance measures (weighting and categories)
Methodology
An online survey was programmed by Stone-Olafson, who supplied EPCOR with a traceable link to be deployed to customers in the Collingwood Area. EPCOR also utilized local media to advertise the survey and created a vanity link that automatically directed customers to the survey itself. The survey was in field November 18-December 8, 2021.
A total of n=818 EPCOR customers in Collingwood, Creamore, Straynor, and Thornbury completed the survey, resulting in a margin of error of +/-3.4%, 19 times out of 20.
A total of n=362 residential customers completed the survey, n=210 multi-residential customers, and n=10 commercial customers. Note, this is a small sample size, thus caution is required when analysing the results. Responses are not statistically valid although they are directional in nature.
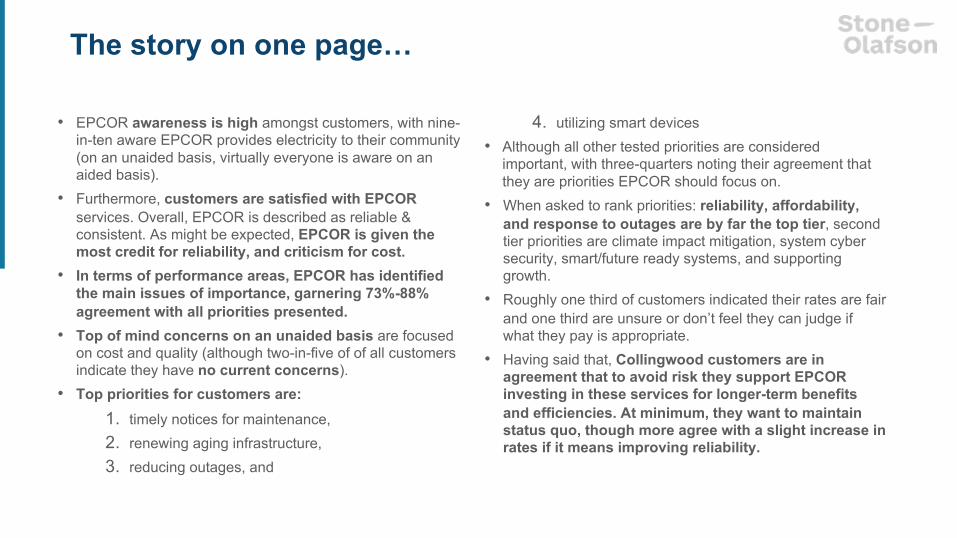
• EPCOR awareness is high amongst customers, with nine-in-ten aware EPCOR provides electricity to their community (on an unaided basis, virtually everyone is aware on an aided basis).
• Furthermore, customers are satisfied with EPCOR services. Overall, EPCOR is described as reliable & consistent. As might be expected, EPCOR is given the most credit for reliability, and criticism for cost.
• In terms of performance areas, EPCOR has identified the main issues of importance, garnering 73%-88% agreement with all priorities presented.
• Top of mind concerns on an unaided basis are focused on cost and quality (although two-in-five of of all customers indicate they have no current concerns).
• Top priorities for customers are: 1. timely notices for maintenance, 2. renewing aging infrastructure, 3. reducing outages, and
4. utilizing smart devices • Although all other tested priorities are considered
important, with three-quarters noting their agreement that they are priorities EPCOR should focus on.
• When asked to rank priorities: reliability, affordability, and response to outages are by far the top tier, second tier priorities are climate impact mitigation, system cyber security, smart/future ready systems, and supporting growth.
• Roughly one third of customers indicated their rates are fair and one third are unsure or don’t feel they can judge if what they pay is appropriate.
• Having said that, Collingwood customers are in agreement that to avoid risk they support EPCOR investing in these services for longer-term benefits and efficiencies. At minimum, they want to maintain status quo, though more agree with a slight increase in rates if it means improving reliability.
The story on one page…
Awareness & Satisfaction Ratings November, 2021
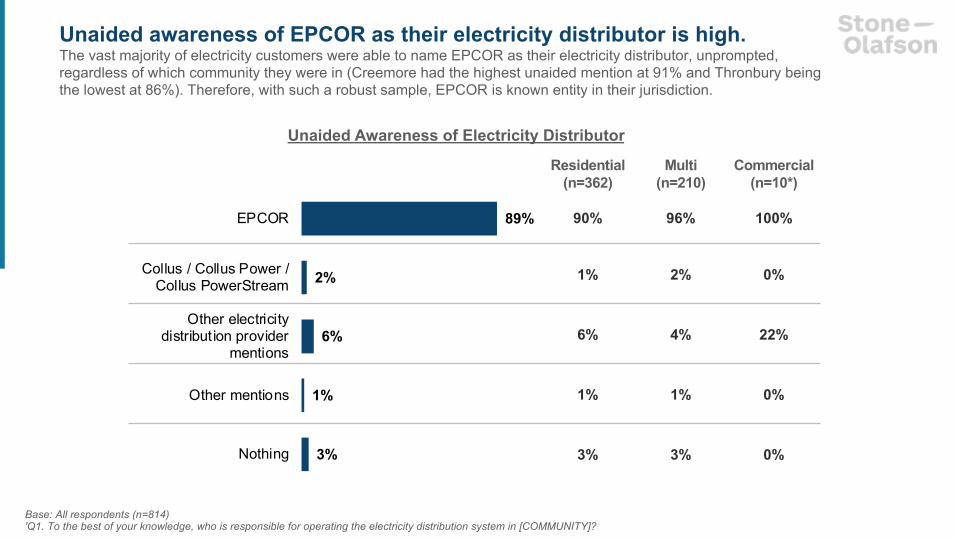
Residential (n=362)
Multi(n=210)
Commercial (n=10*)
90% 96% 100%
1% 2% 0%
6% 4% 22%
1% 1% 0%
3% 3% 0%
Unaided awareness of EPCOR as their electricity distributor is high.The vast majority of electricity customers were able to name EPCOR as their electricity distributor, unprompted, regardless of which community they were in (Creemore had the highest unaided mention at 91% and Thronbury being the lowest at 86%). Therefore, with such a robust sample, EPCOR is known entity in their jurisdiction.
Base: All respondents (n=814)'Q1. To the best of your knowledge, who is responsible for operating the electricity distribution system in [COMMUNITY]?
Unaided Awareness of Electricity Distributor
89%
2%
6%
1%
3%
EPCOR
Collus / Collus Power /Collus PowerStream
Other electricitydistribution provider
mentions
Other mentions
Nothing
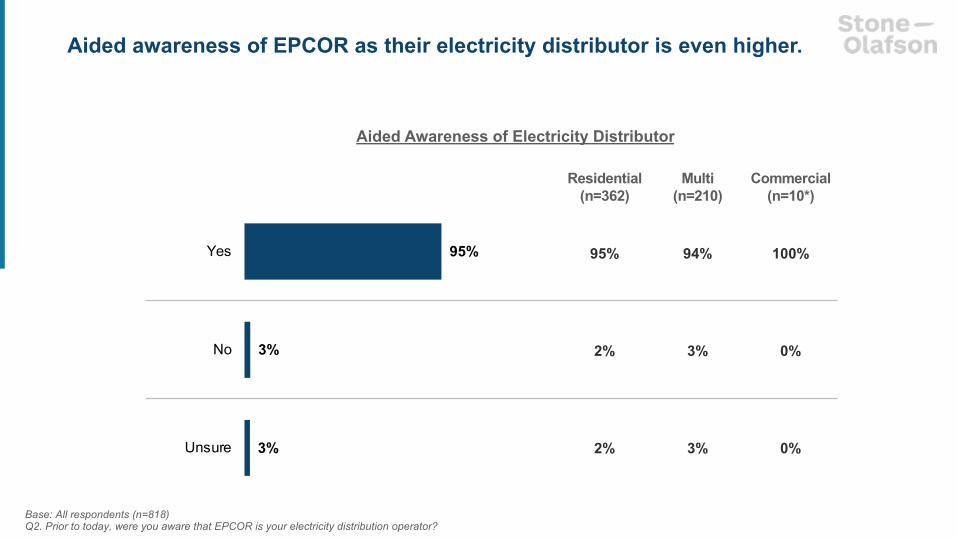
Residential (n=362)
Multi(n=210)
Commercial (n=10*)
95% 94% 100%
2% 3% 0%
2% 3% 0%
Aided awareness of EPCOR as their electricity distributor is even higher.
Base: All respondents (n=818)Q2. Prior to today, were you aware that EPCOR is your electricity distribution operator?
Aided Awareness of Electricity Distributor
95%
3%
3%
Yes
No
Unsure
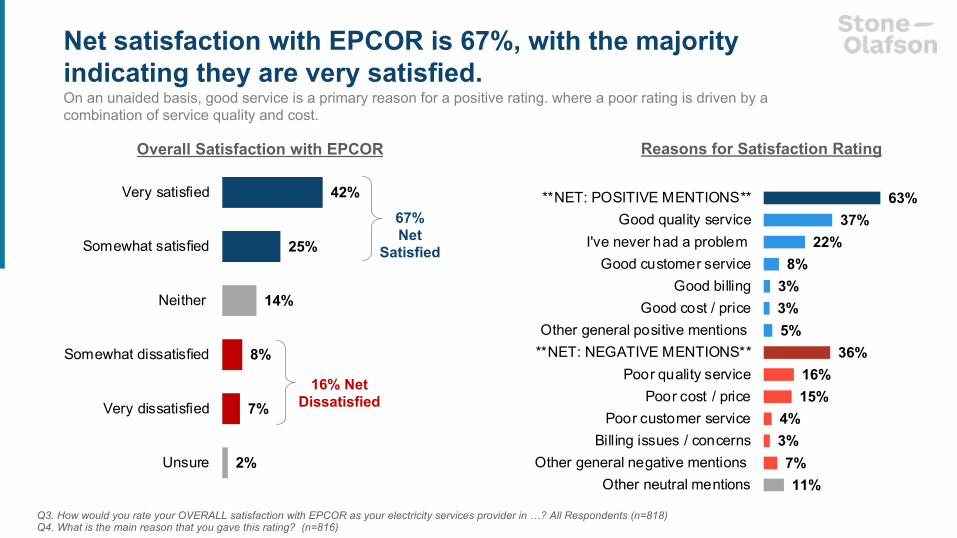
Net satisfaction with EPCOR is 67%, with the majority indicating they are very satisfied. On an unaided basis, good service is a primary reason for a positive rating. where a poor rating is driven by a combination of service quality and cost.
Q3. How would you rate your OVERALL satisfaction with EPCOR as your electricity services provider in …? All Respondents (n=818)Q4. What is the main reason that you gave this rating? (n=816)
Overall Satisfaction with EPCOR
2%
7%
8%
14%
25%
42%
Unsure
Very dissatisfied
Somewhat dissatisfied
Neither
Somewhat satisfied
Very satisfied 63%37%
22%8%
3%3%5%
36%16%15%
4%3%7%11%
**NET: POSITIVE MENTIONS**Good quality service
I've never had a problemGood customer service
Good billingGood cost / price
Other general positive mentions**NET: NEGATIVE MENTIONS**
Poor quality servicePoor cost / price
Poor customer serviceBilling issues / concerns
Other general negative mentionsOther neutral mentions
Reasons for Satisfaction Rating
67% Net
Satisfied
16% NetDissatisfied
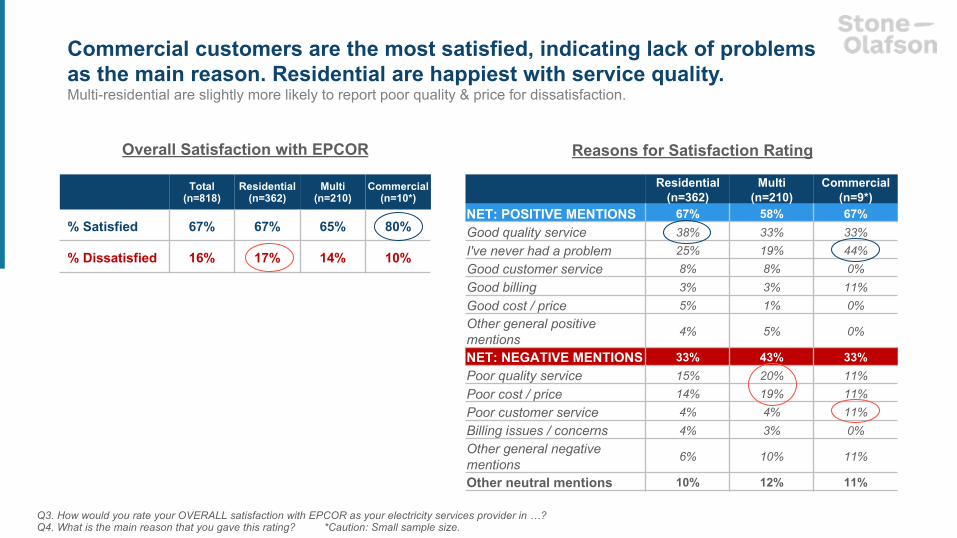
Commercial customers are the most satisfied, indicating lack of problems as the main reason. Residential are happiest with service quality. Multi-residential are slightly more likely to report poor quality & price for dissatisfaction.
Total (n=818)
Residential (n=362)
Multi(n=210)
Commercial (n=10*)
% Satisfied 67% 67% 65% 80%
% Dissatisfied 16% 17% 14% 10%
Overall Satisfaction with EPCOR Reasons for Satisfaction Rating
Residential (n=362)
Multi(n=210)
Commercial (n=9*)
NET: POSITIVE MENTIONS 67% 58% 67%Good quality service 38% 33% 33%I've never had a problem 25% 19% 44%Good customer service 8% 8% 0%Good billing 3% 3% 11%Good cost / price 5% 1% 0%Other general positive mentions 4% 5% 0%
NET: NEGATIVE MENTIONS 33% 43% 33%Poor quality service 15% 20% 11%Poor cost / price 14% 19% 11%Poor customer service 4% 4% 11%Billing issues / concerns 4% 3% 0%Other general negative mentions 6% 10% 11%
Other neutral mentions 10% 12% 11%
Q3. How would you rate your OVERALL satisfaction with EPCOR as your electricity services provider in …? Q4. What is the main reason that you gave this rating? *Caution: Small sample size.
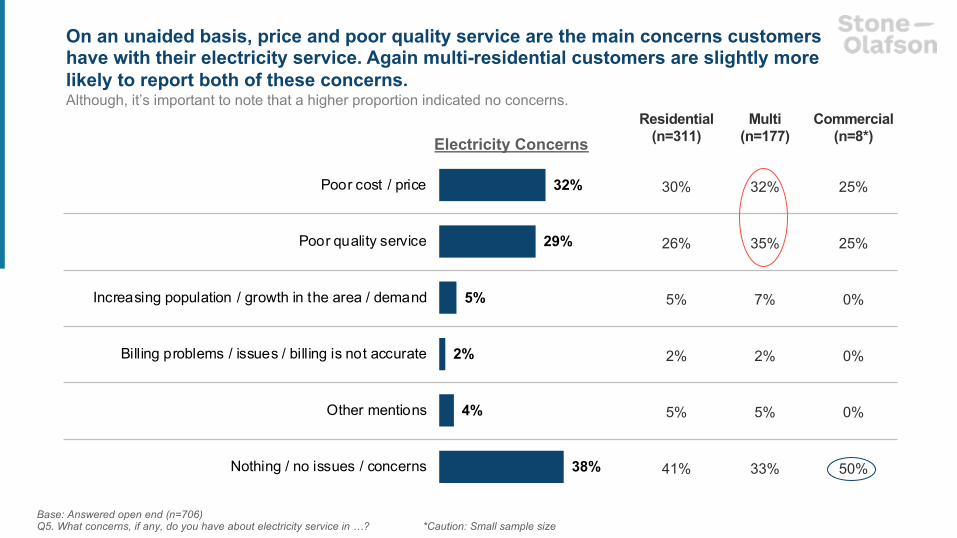
Residential (n=311)
Multi(n=177)
Commercial (n=8*)
30% 32% 25%
26% 35% 25%
5% 7% 0%
2% 2% 0%
5% 5% 0%
41% 33% 50%
On an unaided basis, price and poor quality service are the main concerns customers have with their electricity service. Again multi-residential customers are slightly more likely to report both of these concerns.Although, it’s important to note that a higher proportion indicated no concerns.
Base: Answered open end (n=706)Q5. What concerns, if any, do you have about electricity service in …? *Caution: Small sample size
32%
29%
5%
2%
4%
38%
Poor cost / price
Poor quality service
Increasing population / growth in the area / demand
Billing problems / issues / billing is not accurate
Other mentions
Nothing / no issues / concerns
Electricity Concerns
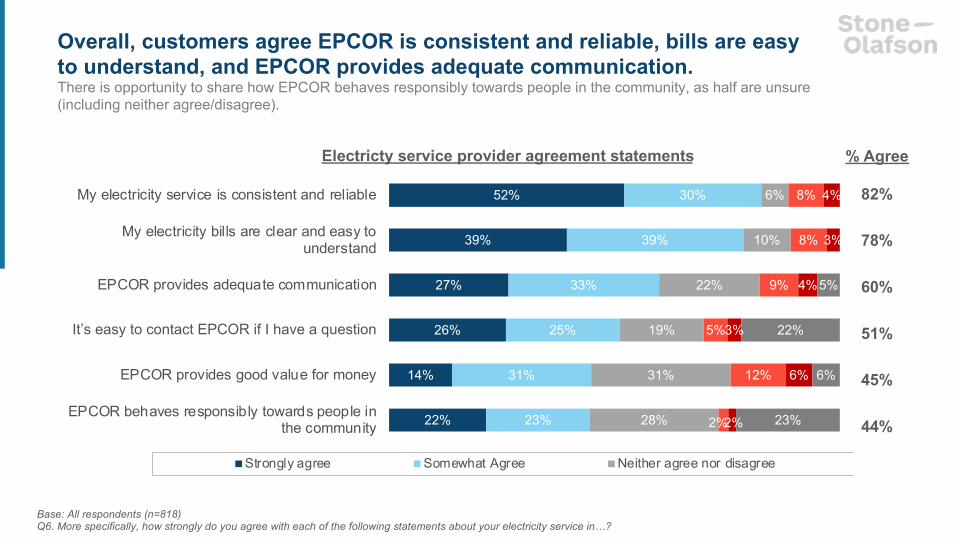
Overall, customers agree EPCOR is consistent and reliable, bills are easy to understand, and EPCOR provides adequate communication. There is opportunity to share how EPCOR behaves responsibly towards people in the community, as half are unsure (including neither agree/disagree).
Base: All respondents (n=818)Q6. More specifically, how strongly do you agree with each of the following statements about your electricity service in…?
Electricty service provider agreement statements
52%
39%
27%
26%
14%
22%
30%
39%
33%
25%
31%
23%
6%
10%
22%
19%
31%
28%
8%
8%
9%
5%
12%
2%
4%
3%
4%
3%
6%
2%
5%
22%
6%
23%
My electricity service is consistent and reliable
My electricity bills are clear and easy tounderstand
EPCOR provides adequate communication
It’s easy to contact EPCOR if I have a question
EPCOR provides good value for money
EPCOR behaves responsibly towards people inthe community
Strongly agree Somewhat Agree Neither agree nor disagree
% Agree
82%
78%
60%
51%
45%
44%
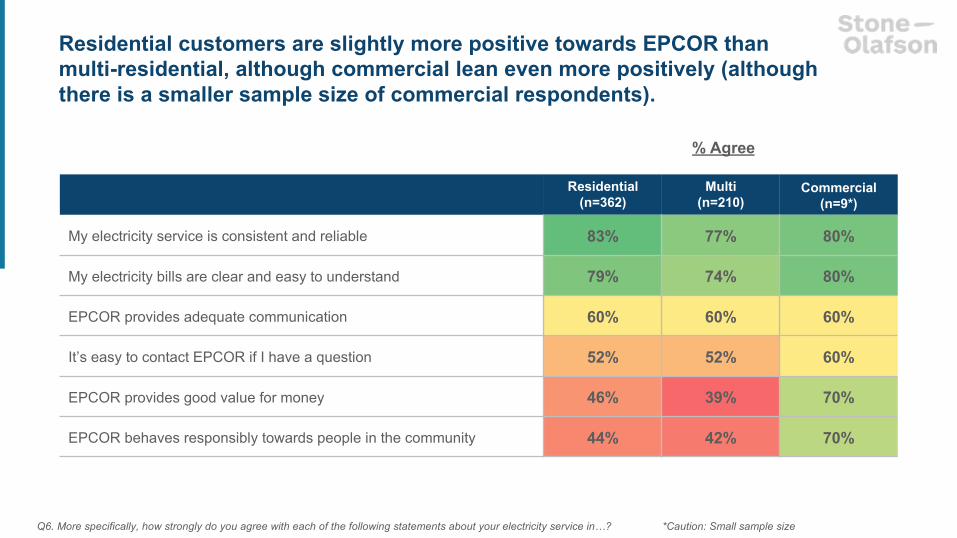
Residential customers are slightly more positive towards EPCOR than multi-residential, although commercial lean even more positively (although there is a smaller sample size of commercial respondents).
% Agree
Q6. More specifically, how strongly do you agree with each of the following statements about your electricity service in…? *Caution: Small sample size
Residential (n=362)
Multi(n=210)
Commercial (n=9*)
My electricity service is consistent and reliable 83% 77% 80%
My electricity bills are clear and easy to understand 79% 74% 80%
EPCOR provides adequate communication 60% 60% 60%
It’s easy to contact EPCOR if I have a question 52% 52% 60%
EPCOR provides good value for money 46% 39% 70%
EPCOR behaves responsibly towards people in the community 44% 42% 70%
Significance of Performance Areas/Possible Impacts
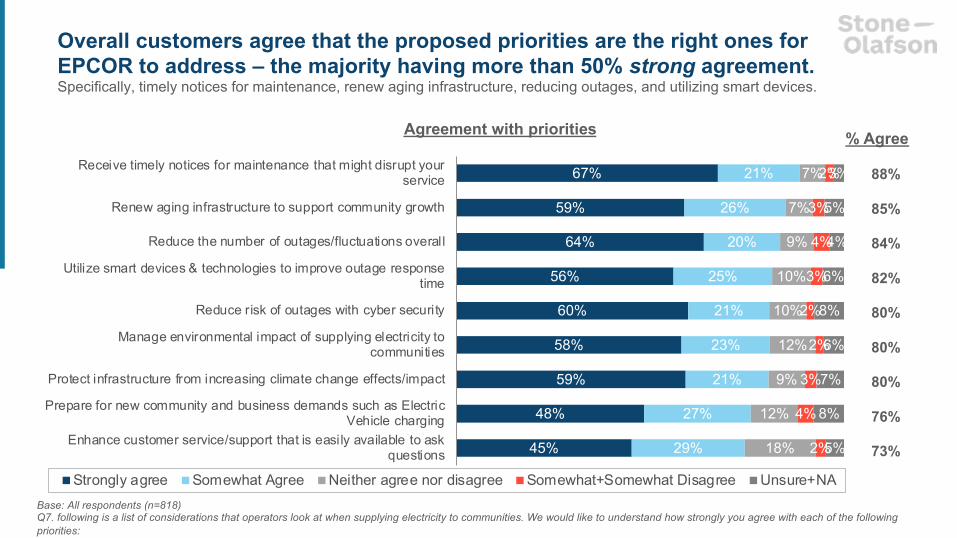
Overall customers agree that the proposed priorities are the right ones for EPCOR to address – the majority having more than 50% strong agreement. Specifically, timely notices for maintenance, renew aging infrastructure, reducing outages, and utilizing smart devices.
Base: All respondents (n=818)Q7. following is a list of considerations that operators look at when supplying electricity to communities. We would like to understand how strongly you agree with each of the following priorities:
Agreement with priorities
67%
59%
64%
56%
60%
58%
59%
48%
45%
21%
26%
20%
25%
21%
23%
21%
27%
29%
7%
7%
9%
10%
10%
12%
9%
12%
18%
2%
3%
4%
3%
2%
2%
3%
4%
2%
3%
5%
4%
6%
8%
6%
7%
8%
5%
Receive timely notices for maintenance that might disrupt yourservice
Renew aging infrastructure to support community growth
Reduce the number of outages/fluctuations overall
Utilize smart devices & technologies to improve outage responsetime
Reduce risk of outages with cyber security
Manage environmental impact of supplying electricity tocommunities
Protect infrastructure from increasing climate change effects/impact
Prepare for new community and business demands such as ElectricVehicle charging
Enhance customer service/support that is easily available to askquestions
Strongly agree Somewhat Agree Neither agree nor disagree Somewhat+Somewhat Disagree Unsure+NA
% Agree
88%
85%
84%
82%
80%
80%
80%
76%
73%
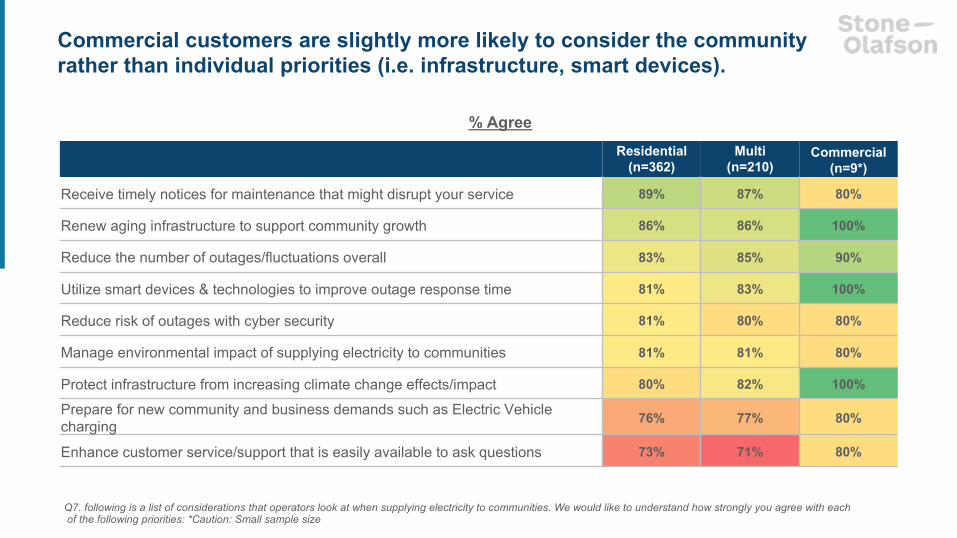
Commercial customers are slightly more likely to consider the community rather than individual priorities (i.e. infrastructure, smart devices).
Q7. following is a list of considerations that operators look at when supplying electricity to communities. We would like to understand how strongly you agree with eachof the following priorities: *Caution: Small sample size
% AgreeResidential
(n=362)Multi
(n=210)Commercial
(n=9*)
Receive timely notices for maintenance that might disrupt your service 89% 87% 80%
Renew aging infrastructure to support community growth 86% 86% 100%
Reduce the number of outages/fluctuations overall 83% 85% 90%
Utilize smart devices & technologies to improve outage response time 81% 83% 100%
Reduce risk of outages with cyber security 81% 80% 80%
Manage environmental impact of supplying electricity to communities 81% 81% 80%
Protect infrastructure from increasing climate change effects/impact 80% 82% 100%
Prepare for new community and business demands such as Electric Vehicle charging 76% 77% 80%
Enhance customer service/support that is easily available to ask questions 73% 71% 80%
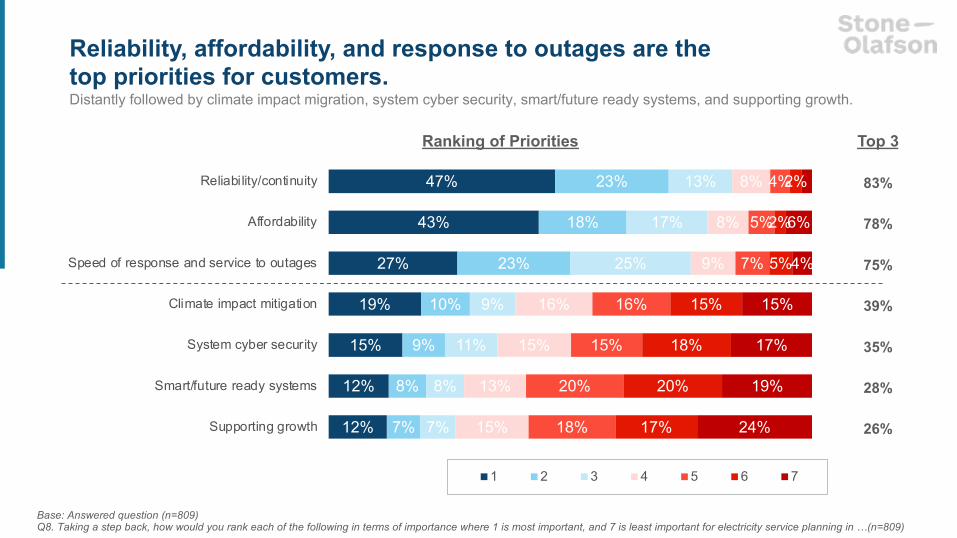
Reliability, affordability, and response to outages are the top priorities for customers. Distantly followed by climate impact migration, system cyber security, smart/future ready systems, and supporting growth.
Base: Answered question (n=809)Q8. Taking a step back, how would you rank each of the following in terms of importance where 1 is most important, and 7 is least important for electricity service planning in …(n=809)
Ranking of Priorities
47%
43%
27%
19%
15%
12%
12%
23%
18%
23%
10%
9%
8%
7%
13%
17%
25%
9%
11%
8%
7%
8%
8%
9%
16%
15%
13%
15%
4%
5%
7%
16%
15%
20%
18%
2%
2%
5%
15%
18%
20%
17%
6%
4%
15%
17%
19%
24%
Reliability/continuity
Affordability
Speed of response and service to outages
Climate impact mitigation
System cyber security
Smart/future ready systems
Supporting growth
1 2 3 4 5 6 7
Top 3
83%
78%
75%
39%
35%
28%
26%
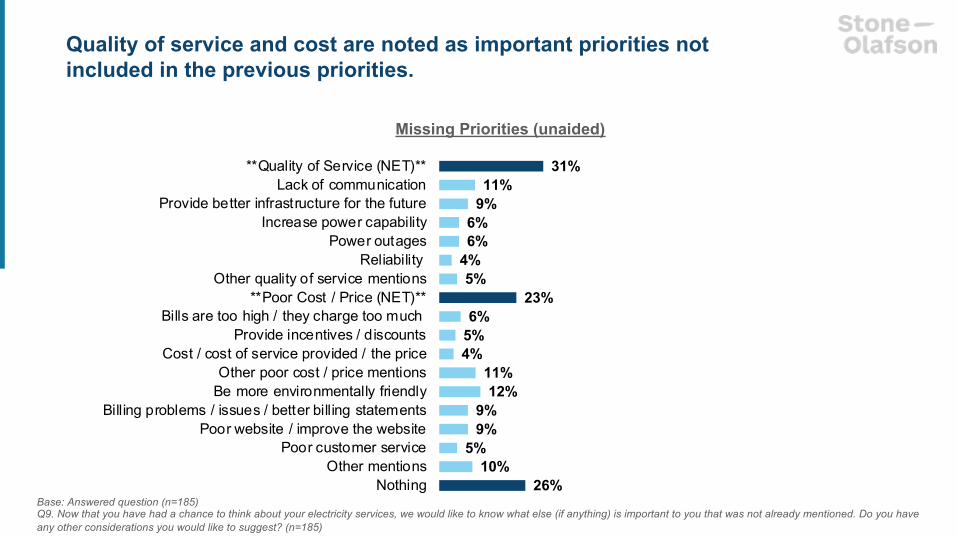
Quality of service and cost are noted as important priorities not included in the previous priorities.
Base: Answered question (n=185)Q9. Now that you have had a chance to think about your electricity services, we would like to know what else (if anything) is important to you that was not already mentioned. Do you have any other considerations you would like to suggest? (n=185)
Missing Priorities (unaided)
31%11%
9%6%6%
4%5%
23%6%
5%4%
11%12%
9%9%
5%10%
26%
**Quality of Service (NET)**Lack of communication
Provide better infrastructure for the futureIncrease power capability
Power outagesReliability
Other quality of service mentions**Poor Cost / Price (NET)**
Bills are too high / they charge too muchProvide incentives / discounts
Cost / cost of service provided / the priceOther poor cost / price mentions
Be more environmentally friendlyBilling problems / issues / better billing statements
Poor website / improve the websitePoor customer service
Other mentionsNothing

Cost Sensitivity
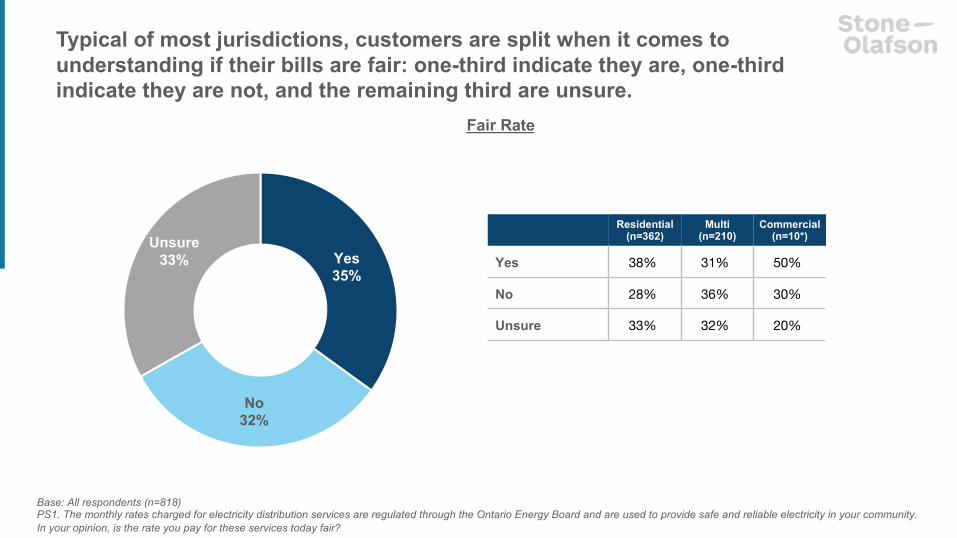
Yes35%
No32%
Unsure33%
Typical of most jurisdictions, customers are split when it comes to understanding if their bills are fair: one-third indicate they are, one-third indicate they are not, and the remaining third are unsure.
Base: All respondents (n=818)PS1. The monthly rates charged for electricity distribution services are regulated through the Ontario Energy Board and are used to provide safe and reliable electricity in your community. In your opinion, is the rate you pay for these services today fair?
Fair Rate
Residential (n=362)
Multi(n=210)
Commercial (n=10*)
Yes 38% 31% 50%
No 28% 36% 30%
Unsure 33% 32% 20%
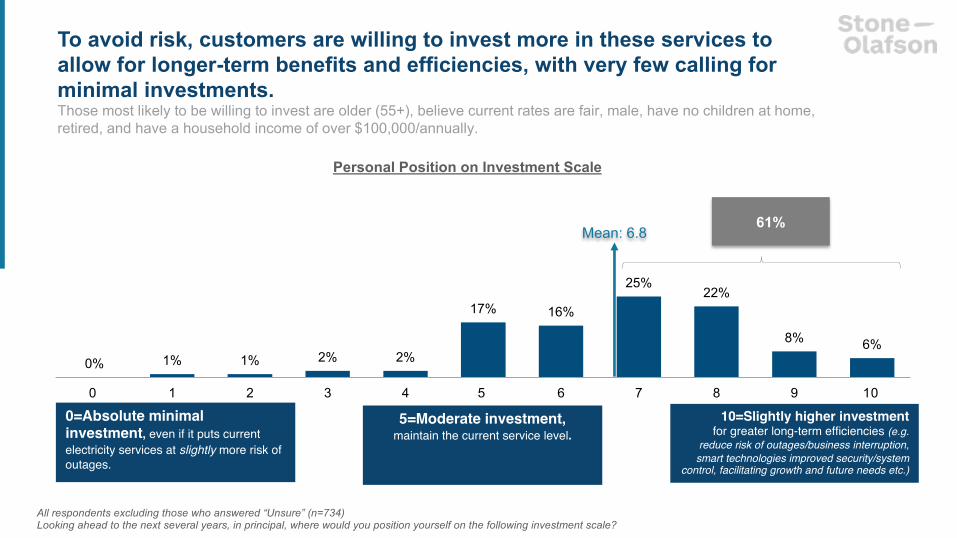
6%8%
22%25%
16%17%
2%2%1%1%0%
109876543210
All respondents excluding those who answered “Unsure” (n=734)Looking ahead to the next several years, in principal, where would you position yourself on the following investment scale?
61% Mean: 6.8
To avoid risk, customers are willing to invest more in these services to allow for longer-term benefits and efficiencies, with very few calling for minimal investments.Those most likely to be willing to invest are older (55+), believe current rates are fair, male, have no children at home, retired, and have a household income of over $100,000/annually.
Personal Position on Investment Scale
0=Absolute minimal investment, even if it puts current electricity services at slightly more risk of outages.
5=Moderate investment, maintain the current service level.
10=Slightly higher investment for greater long-term efficiencies (e.g.
reduce risk of outages/business interruption, smart technologies improved security/system
control, facilitating growth and future needs etc.)
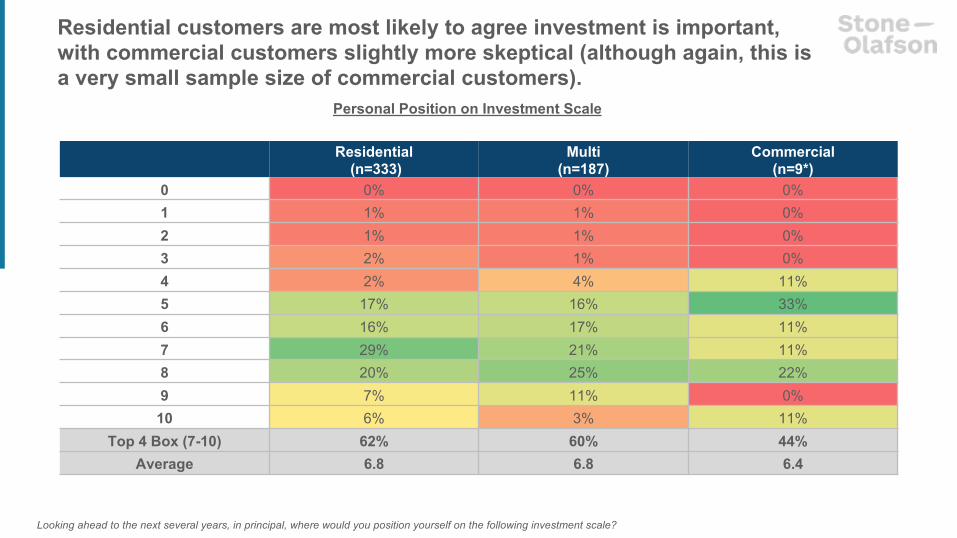
Residential customers are most likely to agree investment is important, with commercial customers slightly more skeptical (although again, this is a very small sample size of commercial customers).
Looking ahead to the next several years, in principal, where would you position yourself on the following investment scale?
Personal Position on Investment Scale
Residential(n=333)
Multi(n=187)
Commercial (n=9*)
0 0% 0% 0%1 1% 1% 0%2 1% 1% 0%3 2% 1% 0%4 2% 4% 11%5 17% 16% 33%6 16% 17% 11%7 29% 21% 11%8 20% 25% 22%9 7% 11% 0%
10 6% 3% 11%Top 4 Box (7-10) 62% 60% 44%
Average 6.8 6.8 6.4

Demographics
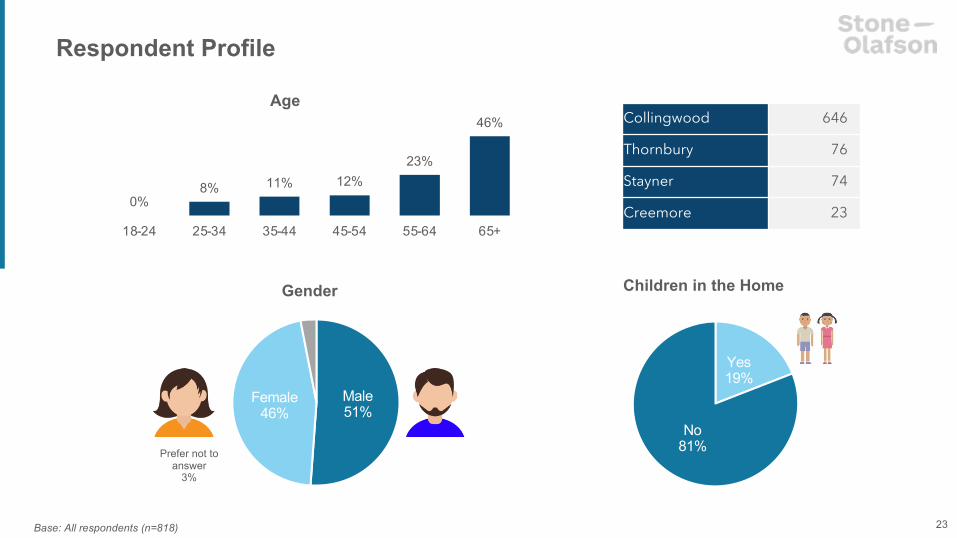
Male51%
Female46%
Prefer not to answer
3%
0%8% 11% 12%
23%
46%
18-24 25-34 35-44 45-54 55-64 65+
Gender
Respondent Profile
Age
Children in the Home
Base: All respondents (n=818) 23
Yes19%
No81%
Collingwood 646
Thornbury 76
Stayner 74
Creemore 23
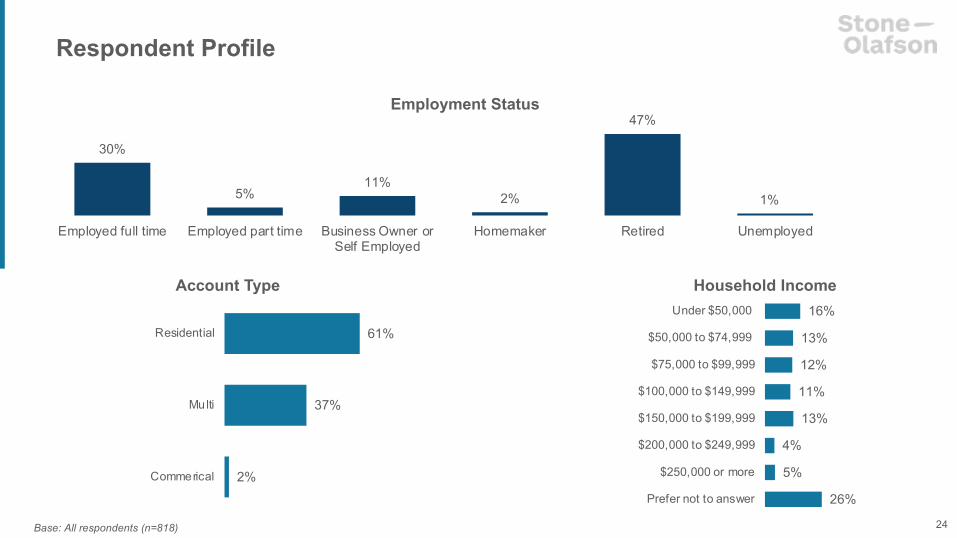
30%
5%11%
2%
47%
1%
Employed full time Employed part time Business Owner orSelf Employed
Homemaker Retired Unemployed
Account Type
Respondent Profile
Employment Status
Household Income16%
13%
12%
11%
13%
4%
5%
26%
Under $50,000
$50,000 to $74,999
$75,000 to $99,999
$100,000 to $149,999
$150,000 to $199,999
$200,000 to $249,999
$250,000 or more
Prefer not to answer
Base: All respondents (n=818) 24
61%
37%
2%
Residential
Multi
Commerical

Understanding people. It’s what we do.
Related Documents


![2021.5 2022 2023.8 2023 2024.3 2024.9 2025 2026 2027 …œª来年表.pdf2021.5 2022 2023.8 2023 2024.3 2024.9 2025 2026 2027 rsm3 ('pss)] (iss) [.iaxa) 20224.1 2025 2026.10.1 2027.3.31](https://static.cupdf.com/doc/110x72/60af2346f0739e21b26a2daa/20215-2022-20238-2023-20243-20249-2025-2026-2027-oeepdf-20215-2022.jpg)

