Draft Annual Budget of Kareeberg Municipality 2017/18 to 2019/20 MEDIUM TERM REVENUE AND EXPENDITURE FORECASTS VISION A SUSTAINABLE, AFFORDABLE and DEVELOPMENTAL QUALITY SERVICE for ALL MISSION WE WLL ACHIEVE OUR VISION BY ENSURING THAT WE: Provide a continuous and constant service Provide a better level of service for our basket of services Provide value for money that will be maintained by the municipality Improve existing infrastructure and create new opportunities for all Copies of this document can be viewed: At each municipal office At www.kareeberg.co.za

Welcome message from author
This document is posted to help you gain knowledge. Please leave a comment to let me know what you think about it! Share it to your friends and learn new things together.
Transcript
Draft Annual Budget of
Kareeberg Municipality
2017/18 to 2019/20
MEDIUM TERM REVENUE ANDEXPENDITURE FORECASTS
VISION
A SUSTAINABLE, AFFORDABLE and DEVELOPMENTAL QUALITY SERVICE for ALL
MISSION
WE WLL ACHIEVE OUR VISION BY ENSURING THAT WE:Provide a continuous and constant service
Provide a better level of service for our basket of servicesProvide value for money that will be maintained by the municipality
Improve existing infrastructure and create new opportunities for all
Copies of this document can be viewed:At each municipal officeAt www.kareeberg.co.za
Kareeberg Municipality 2017-2018 Annual Budget and MTREF
PART 1 – ANNUAL BUDGET …………………………………………………………………………….1
INTRODUCTION ……………………………………………………………………………………………………….. 11.1 MAYOR‟S REPORT …………………………………………………………………………………….. 21.2 COUNCIL RESOLUTIONS …………………………………………………………………………………….. 41.3 EXECUTIVE SUMMARY …………………………………………………………………………………….. 51.4 OPERATING REVENUE FRAMEWORK ……………………………………………………………………..61.5 OPERATING EXPENDITURE FRAMEWORK ……………………………………………………………………..121.6 CAPITAL EXPENDITURE ……………………………………………………………………………………..131.7 ANNUAL BUDGET TABLES ……………………………………………………………………………………….13
PART 2 – SUPPORTING DOCUMENTATION …………………………………………………….31
2.1 OVERVIEW OF THE ANNUAL BUDGET PROCESS …………………………………………………….312.2 OVERVIEW OF ALIGNMENT OF ANNUAL BUDGET WITH IDP ………………………………..332.3 MEASURABLE PERFORMANCE OBJECTIVES AND INDICATORS ………………………………..392.4 OVERVIEW OF BUDGET RELATED-POLICIES …………………………………………………….462.5 OVERVIEW OF BUDGET ASSUMPTIONS …………………………………………………………………….462.6 OVERVIEW OF BUDGET FUNDING …………………………………………………………………………….472.7 EXPENDITURE ON GRANTS AND RECONCILIATIONS OF UNSPENT FUNDS …………….552.8 COUNCILLOR AND EMPLOYEE BENEFITS ……………………………………………………………………..572.9 MONTHLY TARGETS FOR REVENUE, EXPENDITURE AND CASH FLOW ……………………………….602.10 CONTRACTS HAVING FUTURE BUDGETARY IMPLICATIONS ……………………………….652.11 CAPITAL EXPENDITURE DETAILS …………………………………………………………………………….652.12 ANNUAL BIDGETS AND SDBIP'S - INTERNAL DEPARTMENT ……………………………….762.13 LEGISLATION COMPLIANCE STATUS ……………………………………………………………………..882.14 OTHER SUPPORTING DOCUMENTS ……………………………………………………………………..892.15 MUNICIPAL MANAGER‟S QUALITY CERTIFICATE …………………………………………………….116
List of Tables
Table 1 Consolidated Overview of the 2017/18 MTREF 5Table 2 Summary of revenue classified by main revenue source 7Table 3 Percentage growth in revenue by main revenue source 8Table 4 Operating Transfers and Grant Receipts 8Table 5 Comparison of proposed rates to levied for the 2017/18 financial year 9Table 6 Proposed Water Tariffs 10Table 7 Proposed Electricity Tariffs 10Table 8 Comparison between current sanitation charges and increases 10Table 9 Waste removal and impact of tariff increases 11MBRR Table SA14 – Household bills 11Table 10 Summary of operating expenditure by standard classification item 12Table 11 2011/12 Medium-term capital budget per vote 13MBRR Table A1 - Budget Summary 14MBRR Table A2 - Budgeted Financial Performance (revenue and expenditure by standard classification) 16MBRR Table A3 - Budgeted Financial Performance (revenue and expenditure by municipal vote) 17Table 12 Surplus/(Deficit) calculations for the trading services 18
MBRR Table A4 - Budgeted Financial Performance (revenue and expenditure) 19MBRR Table A5 - Budgeted Capital Expenditure by vote, standard classification and funding source 21MBRR Table A6 - Budgeted Financial Position 23MBRR Table A7 - Budgeted Cash Flow Statement 25MBRR Table A8 - Cash Backed Reserves/Accumulated Surplus Reconciliation 26MBRR Table A9 - Asset Management 27MBRR Table A10 - Basic Service Delivery Measurement 29Table 13 IDP Strategic Objectives 34MBRR Table SA4 - Reconciliation between the IDP strategic objectives and budgeted revenue 36MBRR Table SA5 - Reconciliation between the IDP strategic objectives and budgeted operating expenditure 37MBRR Table SA6 - Reconciliation between the IDP strategic objectives and budgeted capital expenditure 38MBRR Table SA7 - Measurable performance objectives 39MBRR Table SA8 - Performance indicators and benchmarks 44Table 14 Breakdown of operating revenue over the medium-term 47MBRR SA15 – Detail Investment Information 48MBRR SA16 – Investment particulars by maturity 48
March 2017 i
Kareeberg Municipality 2017-2018 Annual Budget and MTREF
Table 15 Breakdown of funding composition of the 2017/2018 medium-term capital programme 49MBRR Table SA 17 - Detail of borrowings 49MBRR Table SA 18 - Capital transfers and grant receipts 50MBRR Table A7 - Budget cash flow statement 51MBRR Table A8 - Cash backed reserves/accumulated surplus reconciliation 52MBRR SA10 – Funding compliance measurement 53MBRR SA19 - Expenditure on transfers and grant programmes 55MBRR SA 20 - Reconciliation between of transfers, grant receipts and unspent funds 56MBRR SA22 - Summary of councillor and staff benefits 57MBRR SA23 - Salaries, allowances and benefits (political office bearers/councillors/ senior managers) 58MBRR SA24 – Summary of personnel numbers 59MBRR SA25 - Budgeted monthly revenue and expenditure 60MBRR SA26 - Budgeted monthly revenue and expenditure (municipal vote) 61MBRR SA27 - Budgeted monthly revenue and expenditure (standard classification) 62MBRR SA28 - Budgeted monthly capital expenditure (municipal vote) 63MBRR SA29 - Budgeted monthly capital expenditure (standard classification) 63MBRR SA30 - Budgeted monthly cash flow 64MBRR SA 34a - Capital expenditure on new assets by asset class 65MBRR SA34b - Capital expenditure on the renewal of existing assets by asset class 67MBRR SA34c - Repairs and maintenance expenditure by asset class 69MBRR SA34d- Depriciation by asset class 71MBRR SA35 - Future financial implications of the capital budget 73MBRR SA36 - Detailed capital budget per municipal vote 74MBRR SA37 - Projects delayed from previous financial year 75
767778798081828384858687
MBRR Table SA1 - Supporting detail to budgeted financial performance 89MBRR Table SA2 – Matrix financial performance budget (revenue source/expenditure type and department) 91MBRR Table SA3 – Supporting detail to Statement of Financial Position 92MBRR Table SA9 – Social, economic and demographic statistics and assumptions 93MBRR Table SA32 – List of external mechanisms 93MBRR Table SA11 – Property rates summary 94MBRR Table SA12a – Property rates by category (current year) 95MBRR Table SA12b – Property rates by category (budget year) 96MBRR Table SA13a – Service tariffs by category 97MBRR Table SA13b – Service tariffs by category - explanatory 98MBRR Table SA21 – Transfers and grants made by the municipality 99MBRR Table SA33 – Contracts having future budgetary implications 100
March 2017 ii
Table 15 - Executive and council - operating revenue by source, expenditure by type and total capital Table 16 - Budget and Treasury - operating revenue by source, expenditure by type and total capital Table 17 - Corporate Services - operating revenue by source, expenditure by type and total capital Table 18 - Health - operating revenue by source, expenditure by type and total capital Table 19 - Community Services - operating revenue by source, expenditure by type and total capital Table 20 - Public safety - operating revenue by source, expenditure by type and total capital Table 21 - Sport and recreation - operating revenue by source, expenditure by type and total capital Table 22 - Solid Waste Management - operating revenue by source, expenditure by type and total capital Table 23 - Waste Water Management - operating revenue by source, expenditure by type and total capital Table 24 - Road Transport - operating revenue by source, expenditure by type and total capital Table 25 - Water - operating revenue by source, expenditure by type and total capital Table 26 - Electricity - operating revenue by source, expenditure by type and total capital
Kareeberg Municipality 2017-2018 Annual Budget and MTREF
Charts
Chart A5(a) - Revenue by source - Major 101Chart A5(b) - Revenue by source - Major - source trend 101Chart A6 - Revenue by source - Minor 101Chart A7 - Expenditure by type - Major 102Chart A7 - Expenditure by type - Minor 102Chart A3 - Revenue by standard classification 103Chart A4 - Expenditure by standard classification 103Chart A11 - Capital expenditure by standard classification 104Chart A9 - Capital expenditure by municipal vote - Major 104Chart A10 - Capital expenditure by municipal vote - Minor 105Chart A12 - Capital expenditure by municipal vote - Major -trend 1052017/18 Budget year - capital expenditure program per vote 1062017/18 MTREF - 3 year total - capital expenditure program per vote 106Chart A13 - capital funding by source 107Chart A14 - IDP strategic objectives - revenue 108Chart A15 - IDP strategic objectives - expenditure 108Chart A16 - IDP strategic objectives - capital expenditure 108Chart A14 - IDP strategic objectives - capital expenditure 109Chart A22 - Service charges - revenue % change 109Chart A18 - revenue collection 109Chart A19 - distribution losses 110Chart A21 - expenditure analysis of total revenue 110
Annexures
Annexure 1 - Table of property ratres valuations and billing 111Annexure 2 - Service tariffs 112Annexure 3 - Miscellanious tariffs 114
Kareeberg Municipality 2017-2018 Annual Budget and MTREF
Abbreviations and Acronyms
ASGISA Accelerated and Shared Growth InitiativeCFO Chief Financial OfficerCPI Consumer Price IndexCRRF Capital Replacement Reserve FundDBSA Development Bank of South AfricaDoRA Division of Revenue ActDWA Department of Water AffairsEE Employment EquityFBS Free basic servicesGAMAP Generally Accepted Municipal Accounting PracticeGRAP General Recognised Accounting PracticeHR Human ResourcesIDP Integrated Development StrategyIT Information Technologykℓ kilolitrekm kilometreKPA Key Performance AreaKPI Key Performance IndicatorkWh kilowattℓ litreLED Local Economic DevelopmentMBRR Municipal Budget and Reporting RegulationMFMA Municipal Financial Management Act programmeMIG Municipal Infrastructure GrantMM Municipal ManagerMPRA Municipal Properties Rates ActMSA Municipal Systems ActMTEF Medium-term Expenditure FrameworkMTREF Medium-term Revenue and Expenditure FrameworkNERSA National Electricity Regulator South AfricaNGO Non-Governmental organisationsNKPIs National Key Performance IndicatorsNT National TreasuryPBO Public Benefit OrganisationsPMS Performance Management SystemPPE Property Plant and EquipmentRDP Reconstruction and Devlopment ProgrammeSALGA South African Local Government AssociationSAPS South African Police ServiceSCMP Supply Chain Management PolicySDBIP Service Delivery Budget Implementation PlanSMME Small Micro and Medium Enterprises
March 2017 iv
Kareeberg Municipality 2017-2018 Annual Budget and MTREF
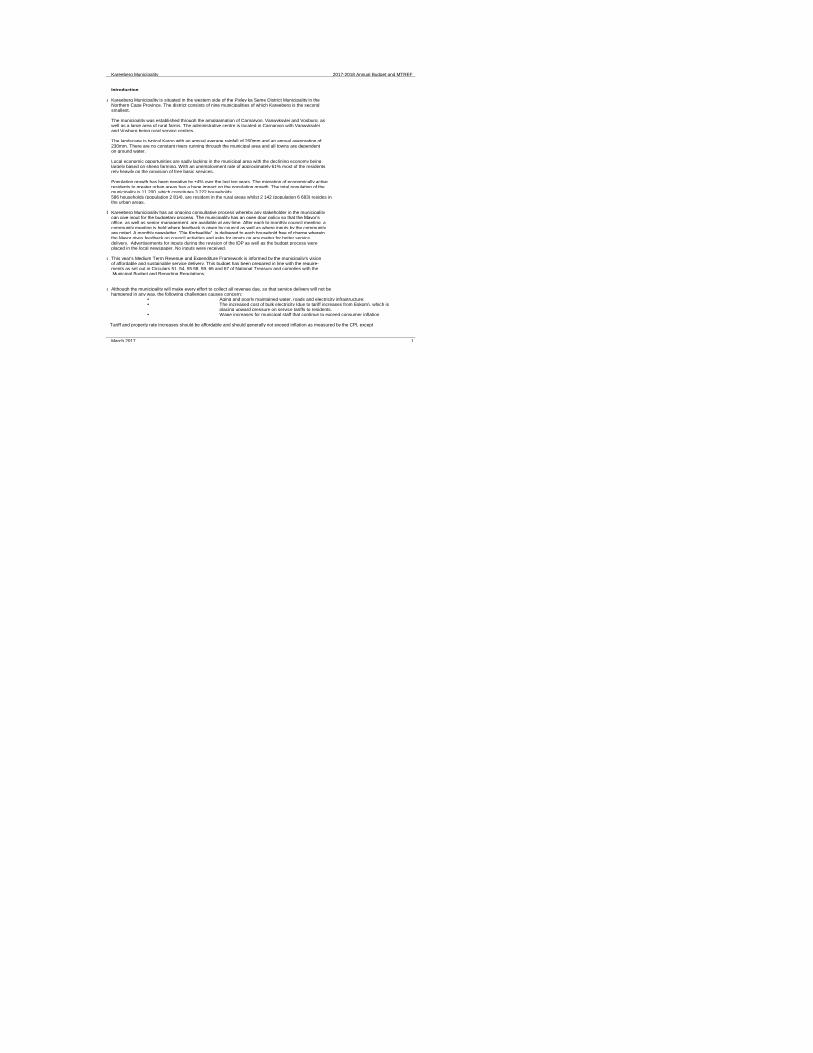
Introduction
a Kareeberg Municipality is situated in the western side of the Pixley ka Seme District Municipality in theNorthern Cape Province. The district consists of nine municipalities of which Kareeberg is the secondsmallest.
The municipality was established through the amalgamation of Carnarvon, Vanwyksvlei and Vosburg, aswell as a large area of rural farms. The administrative centre is located in Carnarvon with Vanwyksvleiand Vosburg being rural service centres.
The landscape is typical Karoo with an annual average rainfall of 260mm and an annual avaporation of 230mm. There are no constant rivers running through the municipal area and all towns are dependenton ground water.
Local economic opportunities are sadly lacking in the municipal area with the declining economy beinglargely based on sheep farming. With an unemployment rate of approximately 61% most of the residentsrely heavily on the provision of free basic services.
Population growth has been negative by ±4% over the last ten years. The migration of economically activeresidents to greater urban areas has a huge impact on the population growth. The total population of the municipality is 11 200, which constitutes 3 222 households.586 households (population 2 814), are resident in the rural areas whilst 2 142 (population 6 683) resides inthe urban areas.
b Kareeberg Municipality has an ongoing consultative process whereby any stakeholder in the municipality can give input for the budgetary process. The municipality has an open door policy so that the Mayor’s office, as well as senior management, are available at any time. After each bi-monthly council meeting a community meeting is held where feedback is given by council as well as where inputs by the community are noted. A monthly newsletter, “Die Korbeeltjie”, is delivered to each household free of charge wherein the Mayor gives feedback on council activities and asks for inputs on any matter for better service delivery. Advertisements for inputs during the revision of the IDP as well as the budget process were placed in the local newspaper. No inputs were received.
c This year's Medium Term Revenue and Expenditure Framework is informed by the municipaliy's visionof affordable and sustainable service delivery. This budget has been prepared in line with the require-ments as set out in Circulars 51, 54, 55,58, 59, 66 and 67 of National Treasury and complies with the Municipal Budget and Reporting Regulations.
d Although the municipality will make every effort to collect all revenue due, so that service delivery will not be hampered in any way, the following challenges causes concern:
• Aging and poorly maintained water, roads and electricity infrastructure;• The increased cost of bulk electricity (due to tariff increases from Eskom), which is
placing upward pressure on service tariffs to residents.• Wage increases for municipal staff that continue to exceed consumer inflation
March 2017 1
Tariff and property rate increases should be affordable and should generally not exceed inflation as measured by the CPI, except
Kareeberg Municipality 2017-2018 Annual Budget and MTREF
1.1 Mayor's Report
No Mayoral report available.
Part 1 – Draft Annual Budget
March 2017 2Kareeberg Municipality 2017-2018 Annual Budget and MTREF
BURGEMEESTER
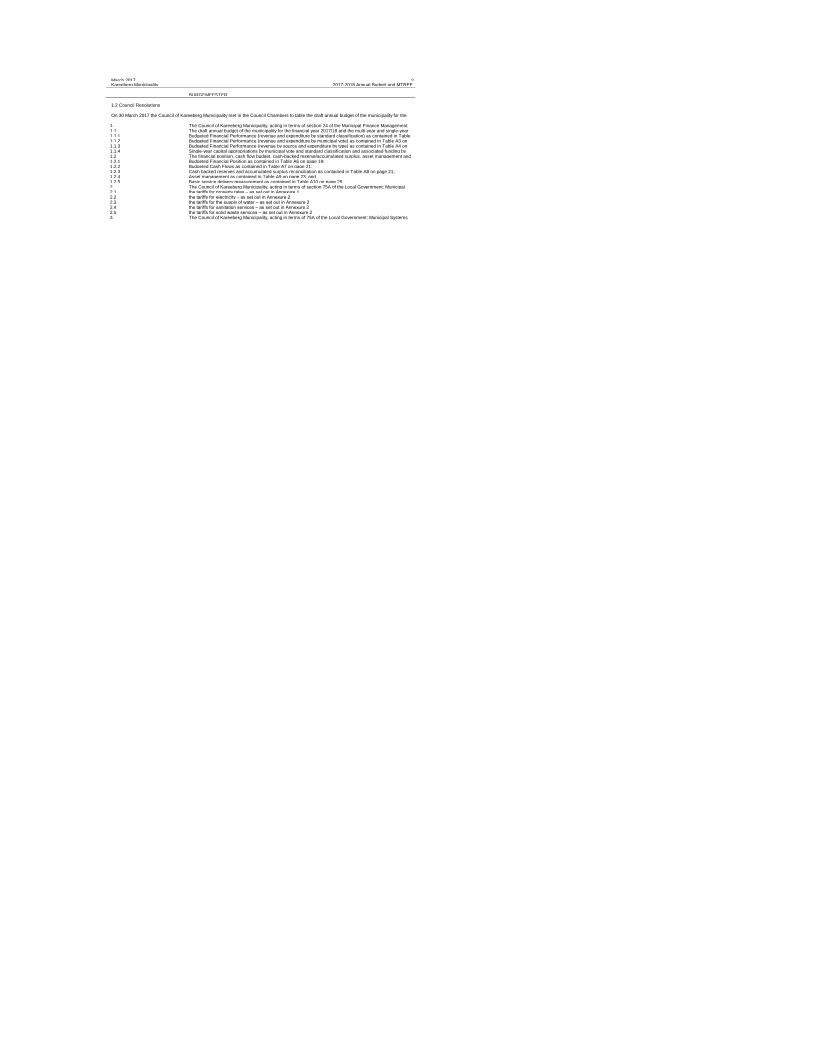
1.2 Council Resolutions
1.1.1 1.1.11.1.21.1.31.1.41.2 1.2.1 Budgeted Financial Position as contained in Table A6 on page 19;1.2.2 Budgeted Cash Flows as contained in Table A7 on page 21;1.2.31.2.4 Asset management as contained in Table A9 on page 23; and1.2.5 Basic service delivery measurement as contained in Table A10 on page 25.2.2.1 the tariffs for property rates – as set out in Annexure 1,2.2 the tariffs for electricity – as set out in Annexure 22.3 the tariffs for the supply of water – as set out in Annexure 22.4 the tariffs for sanitation services – as set out in Annexure 22.5 the tariffs for solid waste services – as set out in Annexure 23.
Budgeted Financial Performance (revenue and expenditure by municipal vote) as contained in Table A3 on Budgeted Financial Performance (revenue by source and expenditure by type) as contained in Table A4 on Single-year capital appropriations by municipal vote and standard classification and associated funding by The financial position, cash flow budget, cash-backed reserve/accumulated surplus, asset management and
Cash backed reserves and accumulated surplus reconciliation as contained in Table A8 on page 21;
The Council of Kareeberg Municipality, acting in terms of section 75A of the Local Government: Municipal
The Council of Kareeberg Municipality, acting in terms of 75A of the Local Government: Municipal Systems
On 30 March 2017 the Council of Kareeberg Municipality met in the Council Chambers to table the draft annual budget of the municipality for the
The Council of Kareeberg Municipality, acting in terms of section 24 of the Municipal Finance Management The draft annual budget of the municipality for the financial year 2017/18 and the multi-year and single-year Budgeted Financial Performance (revenue and expenditure by standard classification) as contained in Table

1.3 Executive Summary
Availability of affordable capital
Table 1 Consolidated Overview of the 2017/18 MTREF
March 2017 #REF!
The application of sound financial management principles for the compilation of the municipalit’s financial plan is essential and critical to ensure The main challenges experienced during the compilation of the 2017 - 2018 MTREF can be summarised as follows:
The ongoing difficulties in the national and local economy; Aging and poorly maintained water, roads and electricity infrastructure;
There will be no budget allocated to national and provincial funded projects unless the necessary grants to the In view of the aforementioned, the following table is a consolidated overview of the proposed 2017/18 Medium-term Revenue and Expenditure
The increased cost of bulk electricity (due to tariff increases from Eskom), which is placing upward pressure Wage increases for municipal staff that continue to exceed consumer inflation, as well as the need to fill
The following budget principles and guidelines directly informed the compilation of the 2017 - 2018 MTREF: The 2016/17 Adjustments Budget priorities and targets, as well as the base line allocations contained in that Intermediate service level standards were used to inform the measurable objectives, targets and backlog Tariff and property rate increases should be affordable and should generally not exceed inflation as measured
Description
R
Adjusted
Budget
2016/17
Budget Year
2017/18
Budget Year
+1 2018/19
Budget Year
+2 2019/20
Total Revenue 83 198 749 109 066 382 117 671 872 118 454 548
Total Operating Expenditure 59 771 839 63 624 612 70 453 020 75 386 232
Surplus/(Deficit) for the year 23 426 910 45 441 770 47 218 852 43 068 316
Total Capital Expenditure - Standard 56 912 976 98 776 057 106 348 329 103 795 126
2017/18 Medium Term Revenue &
Expenditure Framework
Kareeberg Municipality 2017-2018 Annual Budget and MTREF1.4 Operating Revenue Framework
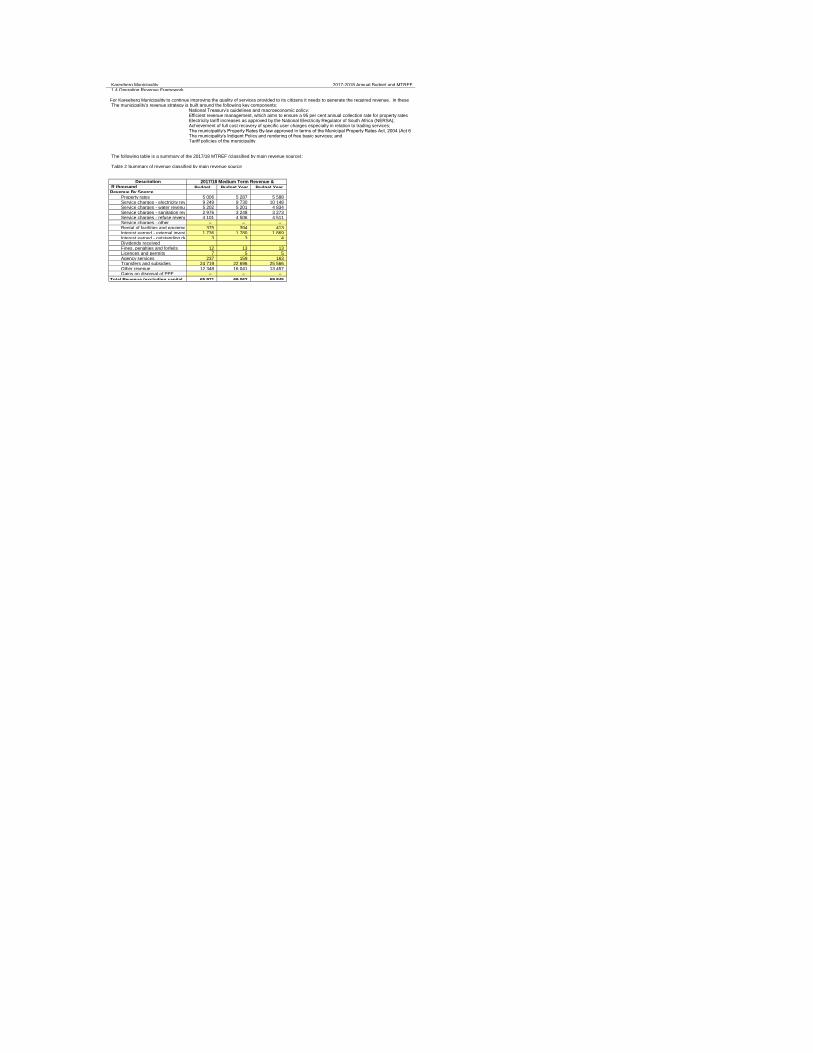
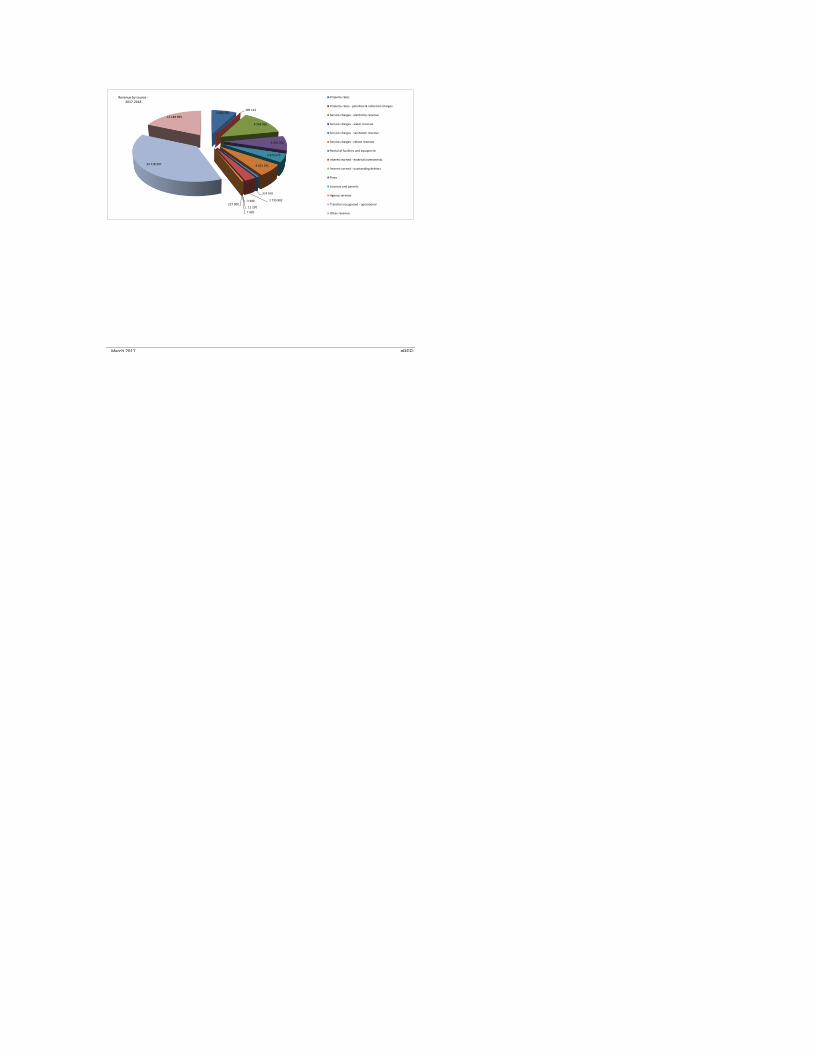
Table 2 Summary of revenue classified by main revenue source
Description
R thousand Budget Budget Year Budget Year Revenue By Source
Property rates 5 006 5 287 5 588 Service charges - electricity revenue 9 249 9 730 10 148 Service charges - water revenue 5 202 5 201 4 834 Service charges - sanitation revenue 2 976 3 248 3 273 Service charges - refuse revenue 4 101 4 506 4 511 Service charges - other – – – Rental of facilities and equipment 375 394 413 Interest earned - external investments 1 736 1 780 1 869 Interest earned - outstanding debtors 3 3 4 Dividends receivedFines, penalties and forfeits 12 13 13 Licences and permits 7 5 5 Agency services 237 159 163 Transfers and subsidies 24 719 22 696 25 566 Other revenue 12 348 16 041 13 457 Gains on disposal of PPE – – –
Total Revenue (excluding capital 65 971 69 062 69 845
For Kareeberg Municipality to continue improving the quality of services provided to its citizens it needs to generate the required revenue. In these The municipality’s revenue strategy is built around the following key components:
National Treasury’s guidelines and macroeconomic policy; Efficient revenue management, which aims to ensure a 95 per cent annual collection rate for property rates Electricity tariff increases as approved by the National Electricity Regulator of South Africa (NERSA); Achievement of full cost recovery of specific user charges especially in relation to trading services; The municipality’s Property Rates By-law approved in terms of the Municipal Property Rates Act, 2004 (Act 6 The municipality’s Indigent Policy and rendering of free basic services; and Tariff policies of the municipality
The following table is a summary of the 2017/18 MTREF (classified by main revenue source):
2017/18 Medium Term Revenue &
March 2017 #REF!
5 006 305 199 113
9 248 965
5 201 765
2 975 575
4 101 241
374 970
1 735 802 3 300
12 230
7 420
237 000
24 718 997
12 148 699
Property rates
Property rates - penalties & collection charges
Service charges - electricity revenue
Service charges - water revenue
Service charges - sanitation revenue
Service charges - refuse revenue
Rental of facilities and equipment
Interest earned - external investments
Interest earned - outstanding debtors
Fines
Licences and permits
Agency services
Transfers recognised - operational
Other revenue
Revenue by source -2017-2018
Kareeberg Municipality 2017-2018 Annual Budget and MTREF
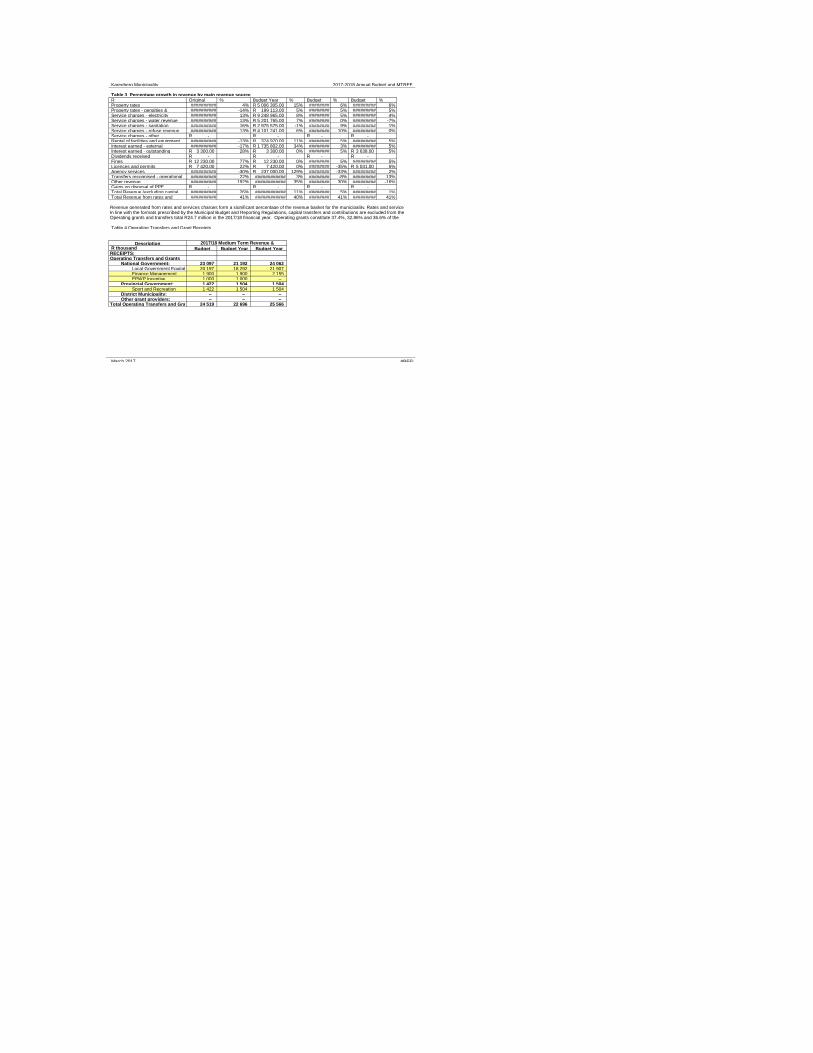
Table 3 Percentage growth in revenue by main revenue sourceR Original % Budget Year % Budget % Budget % Property rates ########## 4% 5 006 305.00R 15% ######## 6% ######### 6% Property rates - penalties & ########## -14% 199 113.00R 5% ######## 5% ######### 5% Service charges - electricity ########## 13% 9 248 965.00R 8% ######## 5% ######### 4% Service charges - water revenue ########## 13% 5 201 765.00R 7% ######## 0% ######### -7% Service charges - sanitation ########## 16% 2 975 575.00R -1% ######## 9% ######### 1% Service charges - refuse revenue ########## 13% 4 101 241.00R 6% ######## 10% ######### 0% Service charges - other -R -R -R -R Rental of facilities and equipment ########## -13% 374 970.00R 11% ######## 5% ######### 5% Interest earned - external ########## -17% 1 735 802.00R 34% ######## 3% ######### 5% Interest earned - outstanding 3 300.00R 28% 3 300.00R 0% ######## 5% 3 638.00R 5% Dividends received -R -R -R -R Fines 12 230.00R 77% 12 230.00R 0% ######## 5% ######### 5% Licences and permits 7 420.00R 22% 7 420.00R 0% ######## -35% 5 031.00R 5% Agency services ########## -30% 237 000.00R 129% ######## -33% ######### 2% Transfers recognised - operational ########## 22% ############ 3% ######## -8% ######### 13% Other revenue ########## 192% ############ 35% ######## 30% ######### -16% Gains on disposal of PPE -R -R -R -R Total Revenue (excluding capital ########## 26% ############ 11% ######## 5% ######### 1% Total Revenue from rates and ########## 41% ############ 40% ######## 41% ######### 41%
Table 4 Operating Transfers and Grant Receipts
DescriptionR thousand Budget Budget Year Budget Year RECEIPTS:Operating Transfers and Grants
National Government: 23 097 21 192 24 062 Local Government Equitable Share20 197 18 292 21 907 Finance Management 1 900 1 900 2 155 EPWP Incentive 1 000 1 000 –
Provincial Government: 1 422 1 504 1 504 Sport and Recreation 1 422 1 504 1 504
District Municipality: – – – Other grant providers: – – –
Total Operating Transfers and Grants 24 519 22 696 25 566
March 2017 #REF!
Revenue generated from rates and services charges form a significant percentage of the revenue basket for the municipality. Rates and service In line with the formats prescribed by the Municipal Budget and Reporting Regulations, capital transfers and contributions are excluded from the Operating grants and transfers total R24.7 million in the 2017/18 financial year. Operating grants constitute 37.4%, 32.86% and 36.6% of the
2017/18 Medium Term Revenue &

Kareeberg Municipality 2017-2018 Annual Budget and MTREF
The tariff setting process relating to service charges is set out as follows.
Property Rates
• Council affords agriculture a further rebate for the following criteria:• 5% if no municipal road borders the property;• 5% if no sewarage is connected to the property• 5% if the municipality does not supply elictricity to the property• 5% if the municipality does not supply water to the property• 5% if the municipality does not supply refuse removal to the property• 5% if the owner contributes substantially to job creation• 5% if the owner supplies acceptable standard of water services to the farm workers
March 2017 #REF!
Tariff-setting is a pivotal and strategic part of the compilation of any budget. When rates, tariffs and other charges were revised, local economic National Treasury continues to encourage municipalities to keep increases in rates, tariffs and other charges as low as possible. Excessive It must also be appreciated that the consumer price index, as measured by CPI, is not a good measure of the cost increases of goods and services
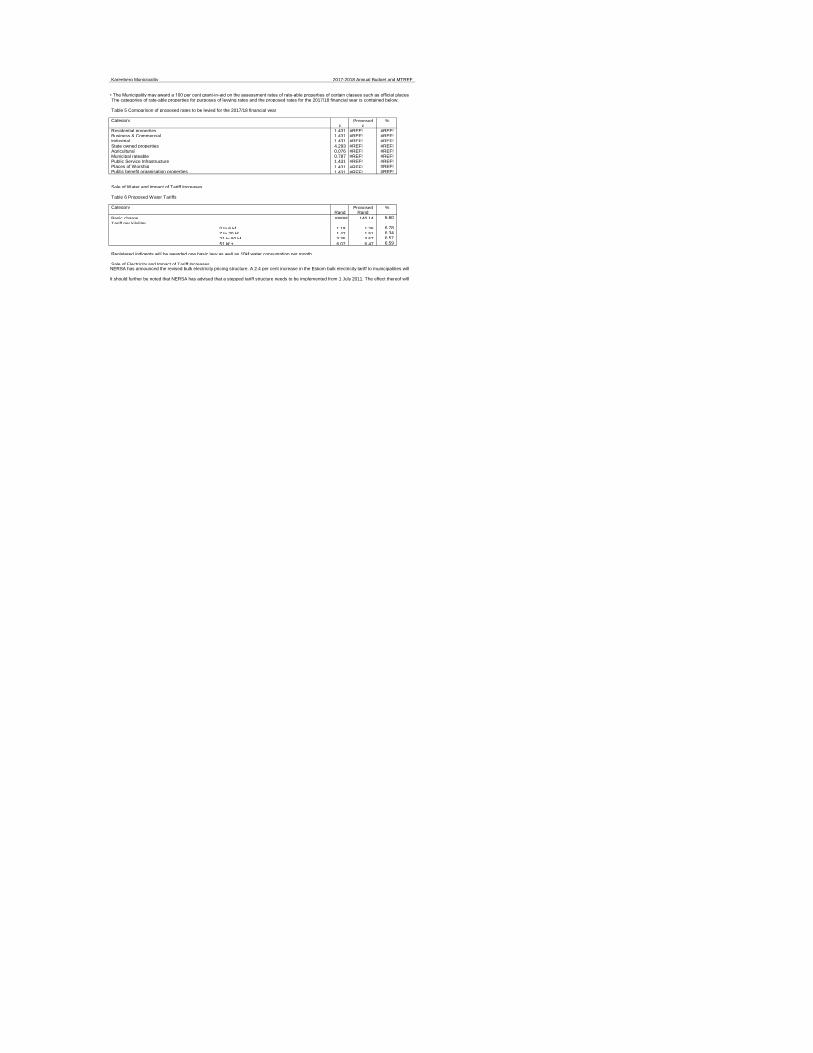
• The first R15 000 of the market value of a property used for residential purposes is excluded from the rate-able value (Section 17(h) of the • The rating of agricultural properties have been phased in. The ratio for these properties have been set at 1 : 0.100. The second valuation roll will be implemented from 1 July 2013. An increase of 25% is expected in the valuation. Tariffs wilL decrease by 28% for all owners except agriculture, who's tariffs will increase by 9.48%. Rate payers will be affected according to the
Kareeberg Municipality 2017-2018 Annual Budget and MTREF
Table 5 Comparison of proposed rates to be levied for the 2017/18 financial year
Category Proposed % c c
Residential properties 1.431 #REF! #REF!Business & Commercial 1.431 #REF! #REF!Industrial 1.431 #REF! #REF!State owned properties 4.293 #REF! #REF!Agricultural 0.076 #REF! #REF!Municipal rateable 0.787 #REF! #REF!Public Service Infrastructure 1.431 #REF! #REF!Places of Worship 1.431 #REF! #REF!Public benefit organisation properties 1.431 #REF! #REF!
Sale of Water and Impact of Tariff Increases
Table 6 Proposed Water Tariffs
Category Proposed % Rand Rand
Basic charge ##### 140.14 6.60
Tariff per kiloliter0 to 6 kℓ 1.18 1.26 6.78
7 to 20 kℓ 1.42 1.51 6.34
21 to 50 kℓ 3.35 3.57 6.57
51 kℓ + 6.07 6.47 6.59
Registered indigents will be awarded one basic levy as well as 10kℓ water consumption per month.
Sale of Electricity and Impact of Tariff Increases
• The Municipality may award a 100 per cent grant-in-aid on the assessment rates of rate-able properties of certain classes such as official places The categories of rate-able properties for purposes of levying rates and the proposed rates for the 2017/18 financial year is contained below:
NERSA has announced the revised bulk electricity pricing structure. A 2.4 per cent increase in the Eskom bulk electricity tariff to municipalities will
It should further be noted that NERSA has advised that a stepped tariff structure needs to be implemented from 1 July 2011. The effect thereof will
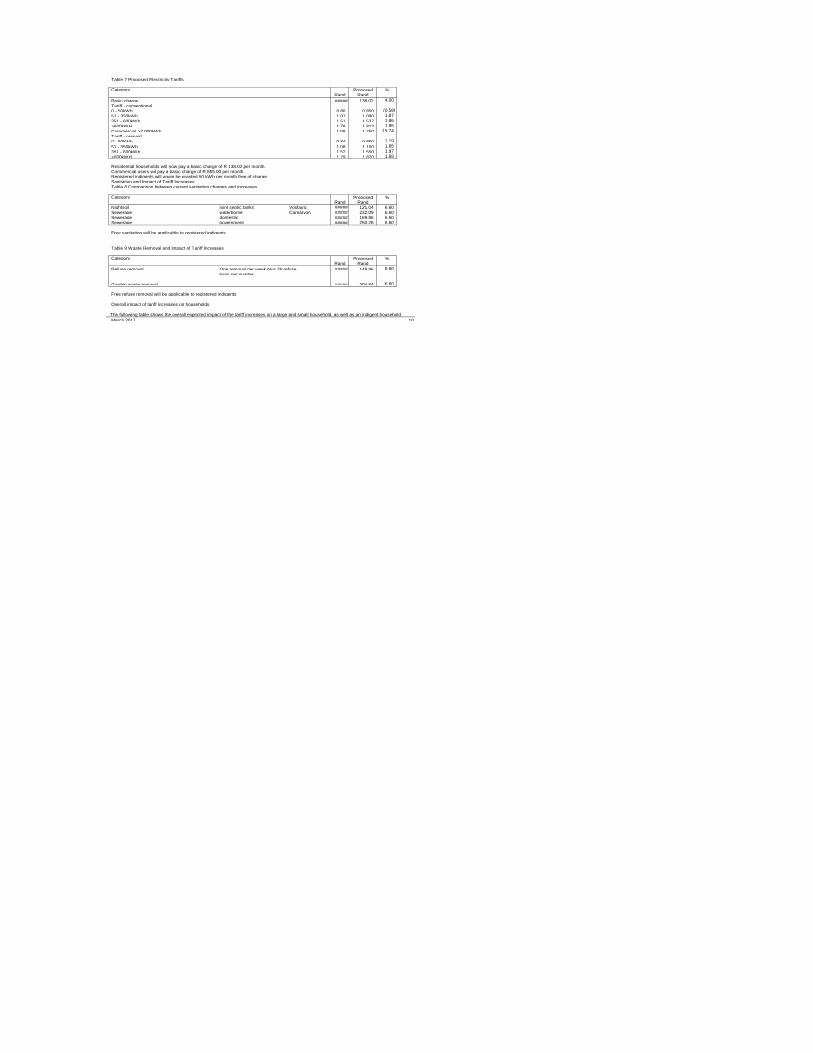
Table 7 Proposed Electricity Tariffs
Category Proposed % Rand Rand
Basic charge ##### 138.02 4.00
Tariff - conventional0 - 50kWh 0.86 0.850 (0.58)
51 - 350kWh 1.07 1.090 1.87
351 - 600kWh 1.51 1.537 1.86
>600kWH 1.78 1.813 1.85
Commercial >2 000kWh 1.08 1.250 15.74
Tariff - prepaid0 - 50kWh 0.84 0.850 1.19
51 - 350kWh 1.08 1.100 1.85
351 - 600kWh 1.52 1.550 1.97
>600kWH 1.79 1.820 1.68
Registered indigents will again be granted 50 kWh per month free of charge. Sanitation and Impact of Tariff IncreasesTable 8 Comparison between current sanitation charges and increases
Category Proposed % Rand Rand
Nightsoil joint septic tanks Vosburg ##### 121.04 6.60 Sewerage waterborne Carnarvon ##### 232.09 6.60 Sewerage domestic ##### 169.86 6.60 Sewerage government ##### 250.28 6.60
Free sanitation will be applicable to registered indigents
Table 9 Waste Removal and Impact of Tariff Increases
Category Proposed % Rand Rand
Refuse removal One removal per week plus 26 refuse ##### 149.96 6.60
bags per quarter
Garden waste removal ##### 204.84 6.60
Free refuse removal will be applicable to registered indigents
Overall impact of tariff increases on households
March 2017 10
Residential households will now pay a basic charge of R 138.02 per month. Commercial users wil pay a basic charge of R 855.00 per month.
The following table shows the overall expected impact of the tariff increases on a large and small household, as well as an indigent household

Kareeberg Municipality 2017-2018 Annual Budget and MTREF
MBRR Table SA14 – Household bills
March 2017 11

Kareeberg Municipality 2017-2018 Annual Budget and MTREF
1.5 Operating Expenditure Framework
Table 10 Summary of operating expenditure by standard classification item
DescriptionR thousand Budget Budget Year Budget Year Expenditure By Type
Employee related costs 21 002 22 482 22 893 Remuneration of councillors 2 490 2 639 2 797 Debt impairment 2 394 2 856 2 956 Depreciation & asset impairment 3 681 6 154 7 185 Finance charges 145 1 118 1 274 Bulk purchases 10 912 11 812 13 023 Other materials 1 446 1 469 1 915 Contracted services 2 394 1 930 2 149 Transfers and subsidies 10 095 9 402 10 843 Other expenditure 10 364 10 592 10 351 Loss on disposal of PPE – – –
Total Expenditure 64 921 70 453 75 386
March 2017 12
The following table is a high level summary of the 2017/18 budget and MTREF (classified per main type of operating expenditure):
The budgeted allocation for employee related costs for the 2013/14 financial year totals R13.9 million, which equals 30.9 per cent(29.15 in 2017/18) The wage curve agreement has been implimented, which resulted in an increase of 7.33 per cent in employee related costs.The cost associated with the remuneration of councillors is determined by the Minister of Co-operative Governance and Traditional Affairs in The provision of debt impairment was determined based on an annual collection rate of 95 per cent and the fact that indigents are sudsidised fully. Provision for depreciation and asset impairment has been informed by the Municipality's Asset Management Policy. Budget appropriations in this
2017/18 Medium Term Revenue &
Bulk purchases are directly informed by the purchase of electricity from Eskom. The annual price increases have been factored into the budget Other materials as well as contracted services comprises the cost of repairs and maintenance. Although this strategic imperative remains a priority The budgeted cost of free basic services for 2017-2018 is R 10 355 266. The number of households budgeted for remain the same at 1 448.Other expenditure comprises of various line items relating to the daily operations of the municipality. This group of expenditure has also been
21 001 756
2 490 137 2 393 527
3 681 354
10 912 085
1 446 048
2 393 619
10 094 545
9 064 799 2 000
Employee related costsRemuneration of councillorsDebt impairmentDepreciation & asset impairmentBulk purchasesOther materialsContracted servicesTransfers and grantsOther expenditureLoss on disposal of PPE
Expenditure by type - 2017-2018
Kareeberg Municipality 2017-2018 Annual Budget and MTREF
Free Basic Services: Basic Social Services Package
1.6 Capital expenditure
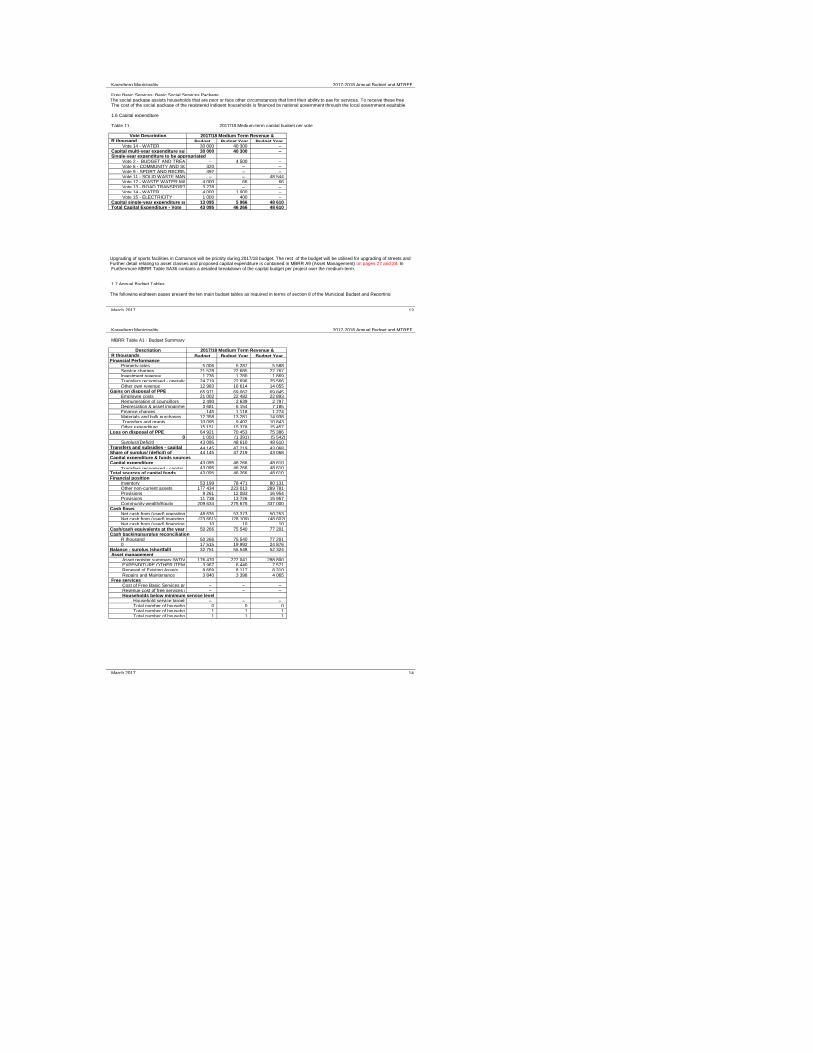
Table 11 2017/18 Medium-term capital budget per vote
Vote DescriptionR thousand Budget Budget Year Budget Year
Vote 14 - WATER 30 000 40 300 – Capital multi-year expenditure sub-total 30 000 40 300 – Single-year expenditure to be appropriated
Vote 2 - BUDGET AND TREASURY OFFICE– 4 500 – Vote 6 - COMMUNITY AND SOCIAL SERVICES320 – – Vote 9 - SPORT AND RECREATION 497 – – Vote 11 - SOLID WASTE MANAGEMENT – – 48 544 Vote 12 - WASTE WATER MANAGEMENT4 000 66 66 Vote 13 - ROAD TRANSPORT 3 278 – – Vote 14 - WATER 4 000 1 000 – Vote 15 - ELECTRICITY 1 000 400 –
Capital single-year expenditure sub-total13 095 5 966 48 610 Total Capital Expenditure - Vote 43 095 46 266 48 610
1.7 Annual Budget Tables
March 2017 13
Kareeberg Municipality 2017-2018 Annual Budget and MTREF
MBRR Table A1 - Budget Summary
DescriptionR thousands Budget Budget Year Budget Year Financial Performance
Property rates 5 006 5 287 5 588 Service charges 21 528 22 685 22 767 Investment revenue 1 736 1 780 1 869 Transfers recognised - operational 24 719 22 696 25 566 Other own revenue 12 983 16 614 14 055
Gains on disposal of PPE 65 971 69 062 69 845 Employee costs 21 002 22 482 22 893 Remuneration of councillors 2 490 2 639 2 797 Depreciation & asset impairment 3 681 6 154 7 185 Finance charges 145 1 118 1 274 Materials and bulk purchases 12 358 13 281 14 938 Transfers and grants 10 095 9 402 10 843 Other expenditure 15 151 15 378 15 457
Loss on disposal of PPE 64 921 70 453 75 386 0 1 050 (1 391) (5 542)
Surplus/(Deficit) 43 095 48 610 48 610 Transfers and subsidies - capital 44 145 47 219 43 068 Share of surplus/ (deficit) of 44 145 47 219 43 068 Capital expenditure & funds sourcesCapital expenditure 43 095 46 266 48 610
Transfers recognised - capital 43 095 46 266 48 610 Total sources of capital funds 43 095 46 266 48 610 Financial position
Inventory 53 199 78 471 80 131 Other non-current assets 177 434 223 013 289 781 Provisions 9 261 12 083 16 954 Provisions 11 738 13 726 15 957 Community wealth/Equity 209 634 275 675 337 000
Cash flowsNet cash from (used) operating 48 635 53 373 50 253 Net cash from (used) investing (23 661) (28 109) (48 602) Net cash from (used) financing 10 10 10
Cash/cash equivalents at the year beg 50 266 75 540 77 201 Cash backing/surplus reconciliation
R thousand 50 266 75 540 77 201 0 17 515 19 992 24 876
Balance - surplus (shortfall) 32 751 55 548 52 324 Asset management
Asset register summary (WDV) 176 470 222 041 288 800 EXPENDITURE OTHER ITEMS 3 967 6 440 7 571 Renewal of Existing Assets 8 669 8 117 8 310 Repairs and Maintenance 3 840 3 398 4 065
Free servicesCost of Free Basic Services provided – – – Revenue cost of free services provided – – – Households below minimum service level
Household service targets – – – Total number of households 0 0 0 Total number of households 1 1 1 Total number of households 1 1 1
March 2017 14
Upgrading of sports facilities in Carnarvon will be priority during 2017/18 budget. The rest of the budget will be utilised for upgrading of streets and Further detail relating to asset classes and proposed capital expenditure is contained in MBRR A9 (Asset Management) on pages 27 and 28. In Furthermore MBRR Table SA36 contains a detailed breakdown of the capital budget per project over the medium-term.
The following eighteen pages present the ten main budget tables as required in terms of section 8 of the Municipal Budget and Reporting
The social package assists households that are poor or face other circumstances that limit their ability to pay for services. To receive these free The cost of the social package of the registered indigent households is financed by national government through the local government equitable
2017/18 Medium Term Revenue &
2017/18 Medium Term Revenue &

Kareeberg Municipality 2017-2018 Annual Budget and MTREF
Explanatory notes to MBRR Table A1 - Budget Summary
b. Capital expenditure is balanced by capital funding sources, of whichTransfers recognised is reflected on the Financial Performance Budget;
March 2017 15
1. Table A1 is a budget summary and provides a concise overview of the municipality's budget from all of the major financial perspectives 2. The table provides an overview of the amounts approved by Council for operating performance, resources deployed to capital expenditure, 3. Financial management reforms emphasises the importance of the municipal budget being funded. This requires the simultaneous assessment of
a. The operating surplus/deficit (after Total Expenditure) is negative over the MTREF due to depreciation of
4. The Cash backing/surplus reconciliation shows that the municipality anticipates cash backing to be adequate over the MTREF 5. Even though the Council is placing great emphasis on securing the financial sustainability of the municipality, this is not being done at the 6.Census 2011 figures include households from rural farm areas where the municipality has no jurisdiction.

Kareeberg Municipality 2017-2018 Annual Budget and MTREF
MBRR Table A2 - Budgeted Financial Performance (revenue and expenditure by standard classification)
Functional Classification DescriptionR thousand Budget Budget Year Budget Year Revenue - Functional
Governance and administration 50 703 43 574 43 580 Executive and council 25 497 14 716 16 485 Finance and administration 25 207 28 857 27 095 Internal audit – – –
Community and public safety 1 447 1 530 1 531 Community and social services 1 429 1 511 1 511 Sport and recreation 17 18 19 Public safety 1 1 1 Housing – – – Health – – –
Economic and environmental services 2 2 2 Planning and development – – – Road transport 2 2 2 Environmental protection – – –
Trading services 56 915 72 566 73 341 Energy sources 10 258 11 179 11 890 Water management 39 411 48 147 47 607 Waste water management 2 976 6 117 6 548 Waste management 4 270 7 124 7 296
Other – – – Total Revenue - Functional 109 066 117 672 118 455 Expenditure - Functional
Governance and administration 34 562 38 413 41 243 Executive and council 21 313 22 545 23 649 Finance and administration 13 249 15 868 17 594 Internal audit – – –
Community and public safety 3 803 3 622 3 852 Community and social services 2 538 2 937 3 104 Sport and recreation 1 106 569 624 Public safety 104 59 64 Housing – – – Health 54 57 61
Economic and environmental services4 883 4 127 4 680 Planning and development – – – Road transport 4 883 4 127 4 680 Environmental protection – – –
Trading services 21 673 24 292 25 611 Energy sources 11 772 12 920 13 978 Water management 1 813 3 019 2 414 Waste water management 4 462 4 856 5 431 Waste management 3 625 3 496 3 788
Other – – – Total Expenditure - Functional 64 921 70 453 75 386 Surplus/(Deficit) for the year 44 145 47 219 43 068
2017/18 Medium Term Revenue &

March 2017 16
Kareeberg Municipality 2017-2018 Annual Budget and MTREF
MBRR Table A3 - Budgeted Financial Performance (revenue and expenditure by municipal vote)Vote Description
R thousand Budget Budget Year Budget Year Revenue by Vote
Vote 1 - EXECUTIVE AND COUNCIL25 497 14 716 16 485 Vote 2 - BUDGET AND TREASURY OFFICE25 207 28 857 27 095 Vote 3 - CORPORATE SERVICES – – – Vote 4 - PLANNING AND DEVELOPMENT– – – Vote 5 - HEALTH – – – Vote 6 - COMMUNITY AND SOCIAL SERVICES1 429 1 511 1 511 Vote 7 - HOUSING – – – Vote 8 - PUBLIC SAFETY 1 1 1 Vote 9 - SPORT AND RECREATION 17 18 19 Vote 10 - ENVIRONMENTAL PROTECTION– – – Vote 11 - SOLID WASTE MANAGEMENT4 270 7 124 7 296 Vote 12 - WASTE WATER MANAGEMENT2 976 6 117 6 548 Vote 13 - ROAD TRANSPORT 2 2 2 Vote 14 - WATER 39 411 48 147 47 607 Vote 15 - ELECTRICITY 10 258 11 179 11 890
Total Revenue by Vote 109 066 117 672 118 455 Expenditure by Vote to be appropriated
Vote 1 - EXECUTIVE AND COUNCIL21 313 22 545 23 649 Vote 2 - BUDGET AND TREASURY OFFICE10 123 12 710 14 226 Vote 3 - CORPORATE SERVICES 3 126 3 158 3 368 Vote 4 - PLANNING AND DEVELOPMENT– – – Vote 5 - HEALTH 54 57 61 Vote 6 - COMMUNITY AND SOCIAL SERVICES2 538 2 937 3 104 Vote 7 - HOUSING – – – Vote 8 - PUBLIC SAFETY 104 59 64 Vote 9 - SPORT AND RECREATION 1 106 569 624 Vote 10 - ENVIRONMENTAL PROTECTION– – – Vote 11 - SOLID WASTE MANAGEMENT3 625 3 496 3 788 Vote 12 - WASTE WATER MANAGEMENT4 462 4 856 5 431 Vote 13 - ROAD TRANSPORT 4 883 4 127 4 680 Vote 14 - WATER 1 813 3 019 2 414 Vote 15 - ELECTRICITY 11 772 12 920 13 978
Total Expenditure by Vote 64 921 70 453 75 386 Surplus/(Deficit) for the year 44 145 47 219 43 068
1. Table A2 is a view of the budgeted financial performance in relation to revenue and expenditure per standard classification. The modified GFS
2. Note the Total Revenue on this table includes capital revenues (Transfers recognised – capital) and so does not balance to the operating
3. Note that as a general principle the revenues for the Trading Services should exceed their expenditures. The table highlights that this is the case 4. Other functions that show a deficit between revenue and expenditure are being financed from rates revenues and surpluses generated from
Explanatory notes to MBRR Table A2 - Budgeted Financial Performance (revenue and expenditure by standard classification)
2017/18 Medium Term Revenue &
March 2017 17
Kareeberg Municipality 2017-2018 Annual Budget and MTREF
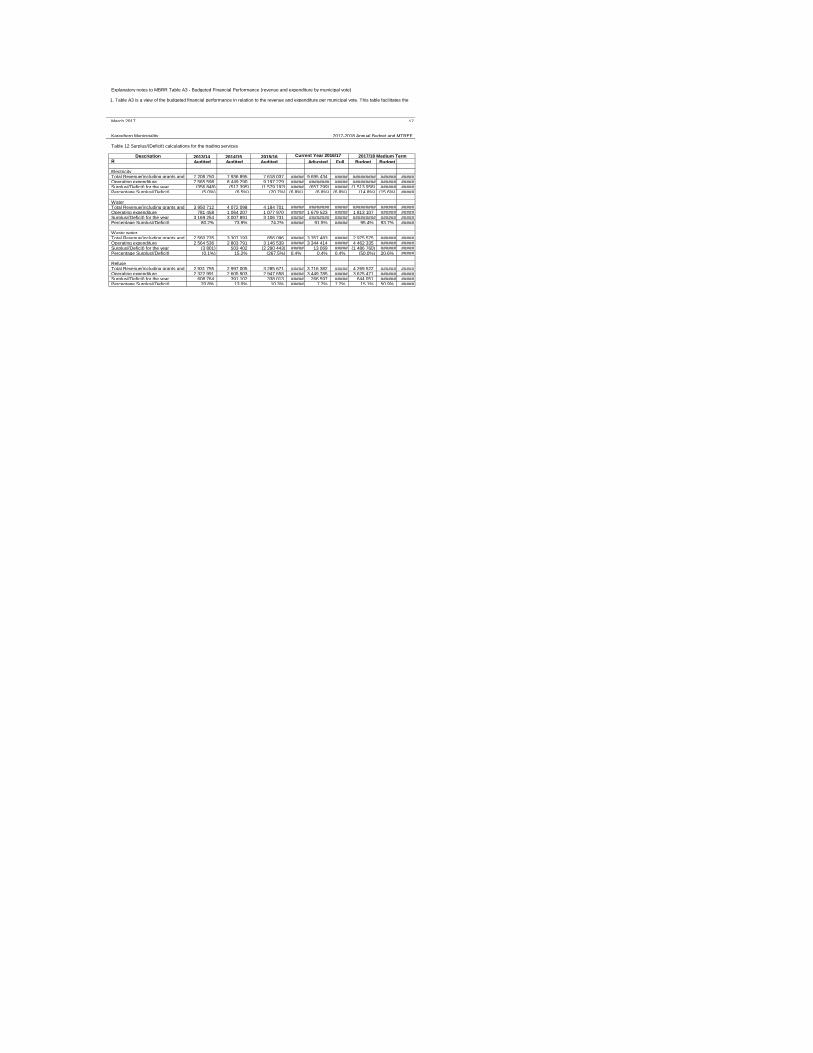
Table 12 Surplus/(Deficit) calculations for the trading services
Description 2013/14 2014/15 2015/16 R Audited Audited Audited Adjusted Full Budget Budget
ElectricityTotal Revenue(including grants and transfers)7 208 750 7 936 895 7 618 037 ##### 9 695 434 ##### ######### ###### #####Operating expenditure 7 565 598 8 449 290 9 197 229 ##### ######## ##### ######### ###### #####Surplus/(Deficit) for the year (356 848) (512 395) (1 579 192) ##### (657 299) ##### (1 513 958) ###### #####Percentage Surplus/(Deficit) (5.0%) (6.5%) (20.7%) (6.8%) (6.8%) (6.8%) (14.8%) (15.6%) #####
WaterTotal Revenue(including grants and transfers)3 950 712 4 072 098 4 184 701 ##### ######## ##### ######### ###### #####Operating expenditure 781 458 1 064 207 1 077 970 ##### 1 679 523 ##### 1 813 107 ###### #####Surplus/(Deficit) for the year 3 169 254 3 007 891 3 106 731 ##### ######## ##### ######### ###### #####Percentage Surplus/(Deficit) 80.2% 73.9% 74.2% ##### 91.5% ##### 95.4% 93.7% #####
Waste waterTotal Revenue(including grants and transfers)2 560 735 3 307 193 856 096 ##### 3 357 483 ##### 2 975 575 ###### #####Operating expenditure 2 564 536 2 803 791 3 146 539 ##### 3 344 414 ##### 4 462 335 ###### #####Surplus/(Deficit) for the year (3 801) 503 402 (2 290 443) ##### 13 069 ##### (1 486 760) ###### #####Percentage Surplus/(Deficit) (0.1%) 15.2% (267.5%) 0.4% 0.4% 0.4% (50.0%) 20.6% #####
RefuseTotal Revenue(including grants and transfers)2 931 755 2 997 005 3 285 671 ##### 3 716 382 ##### 4 269 522 ###### #####Operating expenditure 2 322 991 2 605 903 2 947 658 ##### 3 449 785 ##### 3 625 471 ###### #####Surplus/(Deficit) for the year 608 764 391 102 338 013 ##### 266 597 ##### 644 051 ###### #####Percentage Surplus/(Deficit) 20.8% 13.0% 10.3% ##### 7.2% 7.2% 15.1% 50.9% #####
Explanatory notes to MBRR Table A3 - Budgeted Financial Performance (revenue and expenditure by municipal vote)
1. Table A3 is a view of the budgeted financial performance in relation to the revenue and expenditure per municipal vote. This table facilitates the
Current Year 2016/17 2017/18 Medium Term
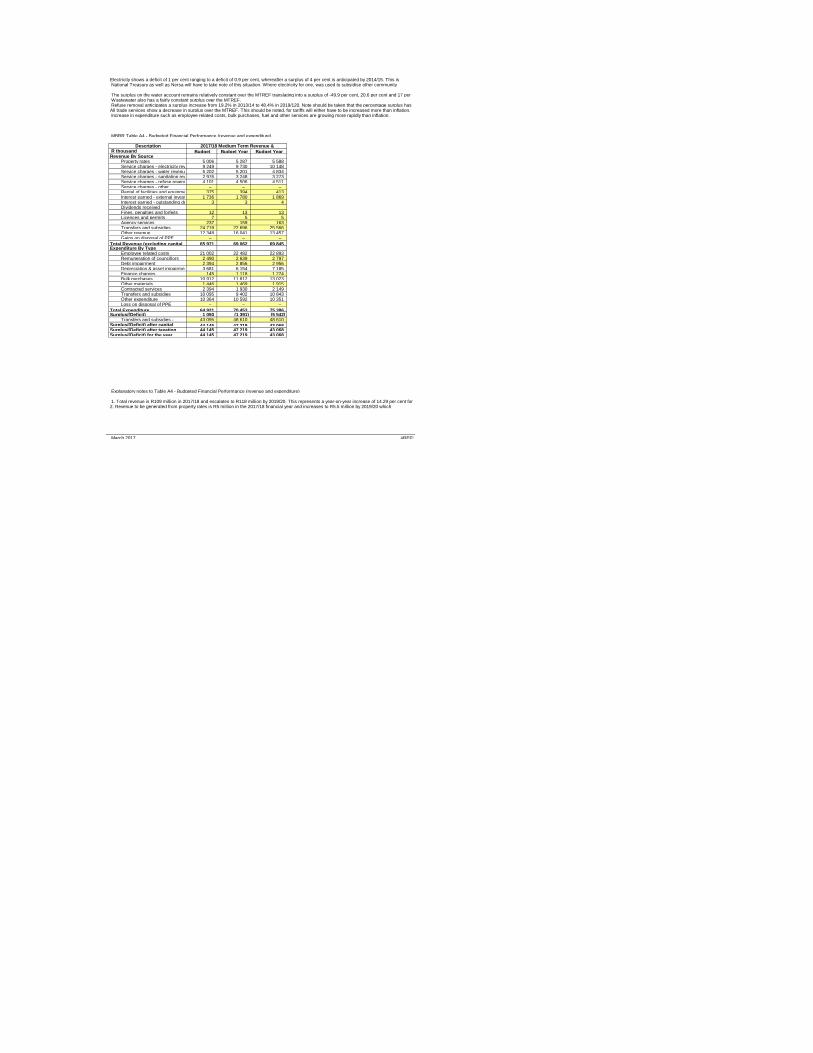
MBRR Table A4 - Budgeted Financial Performance (revenue and expenditure)
DescriptionR thousand Budget Budget Year Budget Year Revenue By Source
Property rates 5 006 5 287 5 588 Service charges - electricity revenue 9 249 9 730 10 148 Service charges - water revenue 5 202 5 201 4 834 Service charges - sanitation revenue 2 976 3 248 3 273 Service charges - refuse revenue 4 101 4 506 4 511 Service charges - other – – – Rental of facilities and equipment 375 394 413 Interest earned - external investments 1 736 1 780 1 869 Interest earned - outstanding debtors 3 3 4 Dividends receivedFines, penalties and forfeits 12 13 13 Licences and permits 7 5 5 Agency services 237 159 163 Transfers and subsidies 24 719 22 696 25 566 Other revenue 12 348 16 041 13 457 Gains on disposal of PPE – – –
Total Revenue (excluding capital 65 971 69 062 69 845 Expenditure By Type
Employee related costs 21 002 22 482 22 893 Remuneration of councillors 2 490 2 639 2 797 Debt impairment 2 394 2 856 2 956 Depreciation & asset impairment 3 681 6 154 7 185 Finance charges 145 1 118 1 274 Bulk purchases 10 912 11 812 13 023 Other materials 1 446 1 469 1 915 Contracted services 2 394 1 930 2 149 Transfers and subsidies 10 095 9 402 10 843 Other expenditure 10 364 10 592 10 351 Loss on disposal of PPE – – –
Total Expenditure 64 921 70 453 75 386 Surplus/(Deficit) 1 050 (1 391) (5 542)
Transfers and subsidies - 43 095 48 610 48 610 Surplus/(Deficit) after capital 44 145 47 219 43 068 Surplus/(Deficit) after taxation 44 145 47 219 43 068 Surplus/(Deficit) for the year 44 145 47 219 43 068
Explanatory notes to Table A4 - Budgeted Financial Performance (revenue and expenditure)
March 2017 #REF!
Refuse removal anticipates a surplus increase from 19.2% in 2013/14 to 48.4% in 2019/120. Note should be taken that the percentage surplus has All trade services show a decrease in surplus over the MTREF. This should be noted, for tariffs will either have to be increased more than inflation, Increase in expenditure such as employee related costs, bulk purchases, fuel and other services are growing more rapidly than inflation.
1. Total revenue is R109 million in 2017/18 and escalates to R118 million by 2019/20. This represents a year-on-year increase of 14.29 per cent for 2. Revenue to be generated from property rates is R5 million in the 2017/18 financial year and increases to R5.5 million by 2019/20 which
2017/18 Medium Term Revenue &
Electricity shows a deficit of 1 per cent ranging to a deficit of 0.9 per cent, whereafter a surplus of 4 per cent is anticipated by 2014/15. This is National Treasury as well as Nersa will have to take note of this situation. Where electricity for one, was used to subsidise other community
The surplus on the water account remains relatively constant over the MTREF translating into a surplus of -49.9 per cent, 20.6 per cent and 17 per Wastewater also has a fairly constant surplus over the MTREF.
Kareeberg Municipality 2017-2018 Annual Budget and MTREF
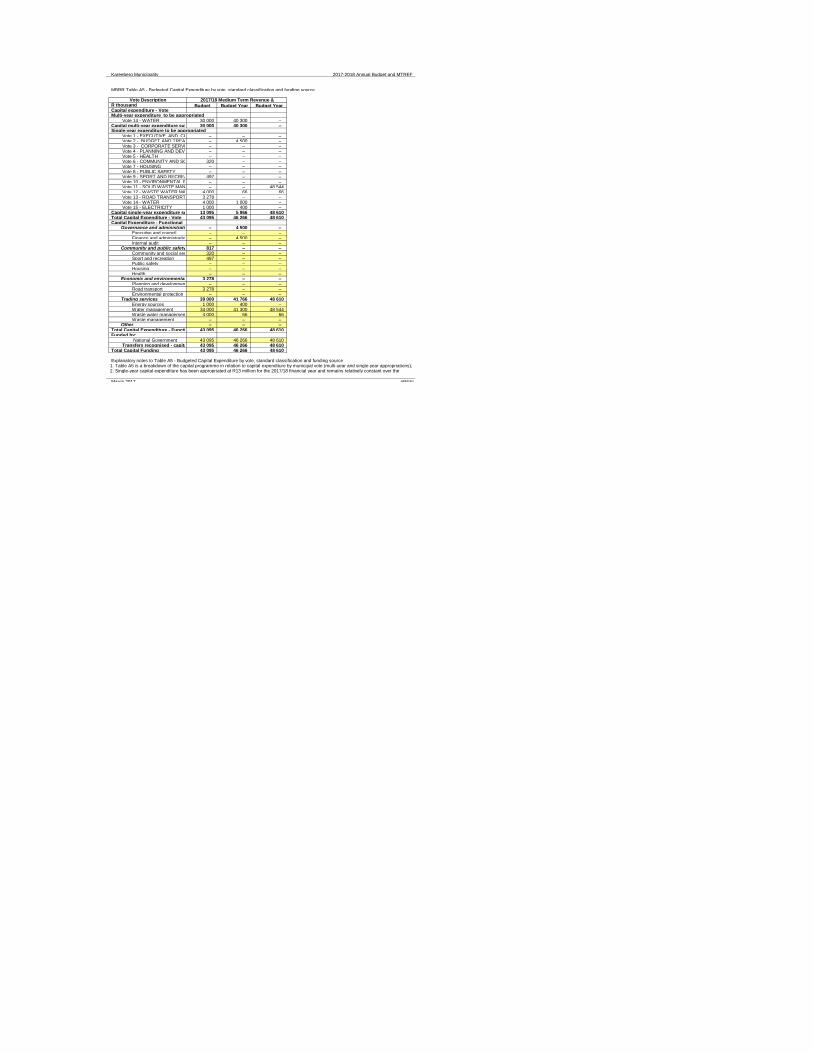
MBRR Table A5 - Budgeted Capital Expenditure by vote, standard classification and funding source
Vote DescriptionR thousand Budget Budget Year Budget Year Capital expenditure - VoteMulti-year expenditure to be appropriated
Vote 14 - WATER 30 000 40 300 – Capital multi-year expenditure sub-total 30 000 40 300 – Single-year expenditure to be appropriated
Vote 1 - EXECUTIVE AND COUNCIL – – – Vote 2 - BUDGET AND TREASURY OFFICE– 4 500 – Vote 3 - CORPORATE SERVICES – – – Vote 4 - PLANNING AND DEVELOPMENT– – – Vote 5 - HEALTH – – – Vote 6 - COMMUNITY AND SOCIAL SERVICES320 – – Vote 7 - HOUSING – – – Vote 8 - PUBLIC SAFETY – – – Vote 9 - SPORT AND RECREATION 497 – – Vote 10 - ENVIRONMENTAL PROTECTION– – – Vote 11 - SOLID WASTE MANAGEMENT – – 48 544 Vote 12 - WASTE WATER MANAGEMENT4 000 66 66 Vote 13 - ROAD TRANSPORT 3 278 – – Vote 14 - WATER 4 000 1 000 – Vote 15 - ELECTRICITY 1 000 400 –
Capital single-year expenditure sub-total13 095 5 966 48 610 Total Capital Expenditure - Vote 43 095 46 266 48 610 Capital Expenditure - Functional
Governance and administration – 4 500 – Executive and council – – – Finance and administration – 4 500 – Internal audit – – –
Community and public safety 817 – – Community and social services 320 – – Sport and recreation 497 – – Public safety – – – Housing – – – Health – – –
Economic and environmental services3 278 – – Planning and development – – – Road transport 3 278 – – Environmental protection – – –
Trading services 39 000 41 766 48 610 Energy sources 1 000 400 – Water management 34 000 41 300 48 544 Waste water management 4 000 66 66 Waste management – – –
Other – – – Total Capital Expenditure - Functional 43 095 46 266 48 610 Funded by:
National Government 43 095 46 266 48 610 Transfers recognised - capital 43 095 46 266 48 610
Total Capital Funding 43 095 46 266 48 610
March 2017 #REF!
2017/18 Medium Term Revenue &
Explanatory notes to Table A5 - Budgeted Capital Expenditure by vote, standard classification and funding source 1. Table A5 is a breakdown of the capital programme in relation to capital expenditure by municipal vote (multi-year and single-year appropriations); 2. Single-year capital expenditure has been appropriated at R13 million for the 2017/18 financial year and remains relatively constant over the

Kareeberg Municipality 2017-2018 Annual Budget and MTREF
March 2017 #REF!
5. The capital programme is funded from national and provincial grants and transfers. 3. Unlike multi-year capital appropriations, single-year appropriations relate to expenditure that will be incurred in the specific budget year such as

Kareeberg Municipality 2017-2018 Annual Budget and MTREFMBRR Table A6 - Budgeted Financial Position
DescriptionR thousand Budget Budget Year Budget Year ASSETSCurrent assets
Cash 1 538 1 538 1 538 Call investment deposits 48 728 74 001 75 662 Consumer debtors 2 894 2 894 2 894 Other debtors 30 30 30 Current portion of long-term receivables 8 8 7 Inventory – – –
Total current assets 53 199 78 471 80 131 Non current assets
Long-term receivables 31 23 17 Investments – – – Investment property 15 482 15 482 15 482 Investment in Associate – – – Property, plant and equipment 160 984 206 555 273 314 Agricultural – – – Biological – – – Intangible 4 4 4 Other non-current assets 933 948 964
Total non current assets 177 434 223 013 289 781 TOTAL ASSETS 230 633 301 483 369 912 LIABILITIESCurrent liabilities
Bank overdraft – – – Borrowing – – – Consumer deposits 380 390 400 Trade and other payables 7 222 10 034 14 895 Provisions 1 659 1 659 1 659
Total current liabilities 9 261 12 083 16 954 Non current liabilities
Borrowing – – – Provisions 11 738 13 726 15 957
Total non current liabilities 11 738 13 726 15 957 TOTAL LIABILITIES 20 999 25 809 32 911 NET ASSETS 209 634 275 675 337 000 COMMUNITY WEALTH/EQUITY
Accumulated Surplus/(Deficit) 198 248 264 289 325 615 Reserves 11 386 11 386 11 386
TOTAL COMMUNITY WEALTH/EQUITY 209 634 275 675 337 000
March 2017 #REF!
2017/18 Medium Term Revenue &

Kareeberg Municipality 2017-2018 Annual Budget and MTREF
Explanatory notes to Table A6 - Budgeted Financial Position
• Call investments deposits;• Consumer debtors;• Property, plant and equipment;• Trade and other payables;• Provisions non current;• Changes in net assets; and• Reserves
March 2017 #REF!
Kareeberg Municipality 2017-2018 Annual Budget and MTREF
MBRR Table A7 - Budgeted Cash Flow Statement
DescriptionR thousand Budget Budget Year Budget Year CASH FLOW FROM OPERATING ACTIVITIESReceipts
Property rates 3 675 3 880 4 101 Service charges 20 451 21 550 21 628 Other revenue 12 679 16 295 13 720 Government - operating 24 719 22 696 25 566 Government - capital 43 095 48 610 48 610 Interest 1 566 1 784 1 873 Dividends – – –
PaymentsSuppliers and employees (47 310) (50 924) (53 129) Finance charges (145) (1 118) (1 274) Transfers and Grants (10 095) (9 402) (10 843)
NET CASH FROM/(USED) OPERATING ACTIVITIES48 635 53 373 50 253 CASH FLOWS FROM INVESTING ACTIVITIESReceipts
Proceeds on disposal of PPE – – – Decrease (Increase) in non-current debtors8 8 8 Decrease (increase) other non-current receivables– – – Decrease (increase) in non-current investments– – –
PaymentsCapital assets (23 669) (28 117) (48 610)
NET CASH FROM/(USED) INVESTING ACTIVITIES(23 661) (28 109) (48 602) CASH FLOWS FROM FINANCING ACTIVITIESReceipts
Short term loans – – – Borrowing long term/refinancing – – – Increase (decrease) in consumer deposits10 10 10
PaymentsRepayment of borrowing – – –
NET CASH FROM/(USED) FINANCING ACTIVITIES10 10 10 NET INCREASE/ (DECREASE) IN CASH HELD24 984 25 273 1 661
Cash/cash equivalents at the year begin:25 282 50 266 75 540 Cash/cash equivalents at the year end:50 266 75 540 77 201
2017/18 Medium Term Revenue &
2. It shows the expected level of cash in-flow versus cash out-flow that is likely to result from the implementation of the budget. 3. It can be seen that the cash levels of the municipality fell significantly over the 2009/10 to 2010/11 period owing directly to a net decrease in cash 4. The approved 2017/18 MTREF csh and cash equivalents of R50 million for the 2017/18 financial year, while it increases for the outer years to
1. Table A6 is consistent with international standards of good financial management practice, and improves understandability for councillors and 2. This format of presenting the statement of financial position is aligned to GRAP1, which is generally aligned to the international version which 3. MBRR Table A6 is supported by an extensive table of notes (SA3 which can be found on pages 64, 65 and 66) providing a detailed analysis of
4. The municipal equivalent of equity is Community Wealth/Equity. The justification is that ownership and the net assets of the municipality belong 5. Any movement on the Budgeted Financial Performance or the Capital Budget will inevitably impact on the Budgeted Financial Position. As an
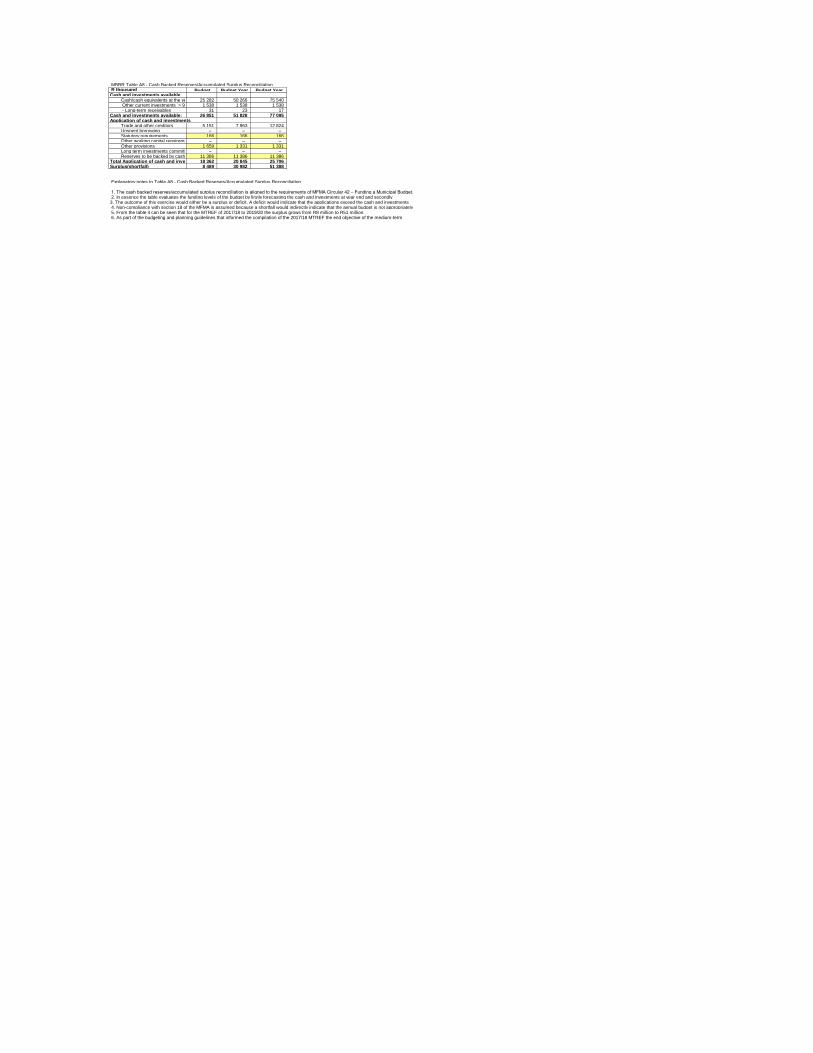
MBRR Table A8 - Cash Backed Reserves/Accumulated Surplus ReconciliationR thousand Budget Budget Year Budget Year Cash and investments available
Cash/cash equivalents at the year beg 25 282 50 266 75 540 Other current investments > 90 days 1 538 1 538 1 538 - Long-term receivables 31 23 17
Cash and investments available: 26 851 51 828 77 095 Application of cash and investments
Trade and other creditors 5 151 7 963 12 824 Unspent borrowing – – – Statutory requirements 166 166 166 Other working capital requirements – – – Other provisions 1 659 1 331 1 331 Long term investments committed – – – Reserves to be backed by cash/investments11 386 11 386 11 386
Total Application of cash and investments:18 362 20 845 25 706 Surplus(shortfall) 8 489 30 982 51 388
Explanatory notes to Table A8 - Cash Backed Reserves/Accumulated Surplus Reconciliation
6. As part of the budgeting and planning guidelines that informed the compilation of the 2017/18 MTREF the end objective of the medium-term
1. The cash backed reserves/accumulated surplus reconciliation is aligned to the requirements of MFMA Circular 42 – Funding a Municipal Budget. 2. In essence the table evaluates the funding levels of the budget by firstly forecasting the cash and investments at year end and secondly 3. The outcome of this exercise would either be a surplus or deficit. A deficit would indicate that the applications exceed the cash and investments 4. Non-compliance with section 18 of the MFMA is assumed because a shortfall would indirectly indicate that the annual budget is not appropriately 5. From the table it can be seen that for the MTREF of 2017/18 to 2019/20 the surplus grows from R8 million to R51 million.
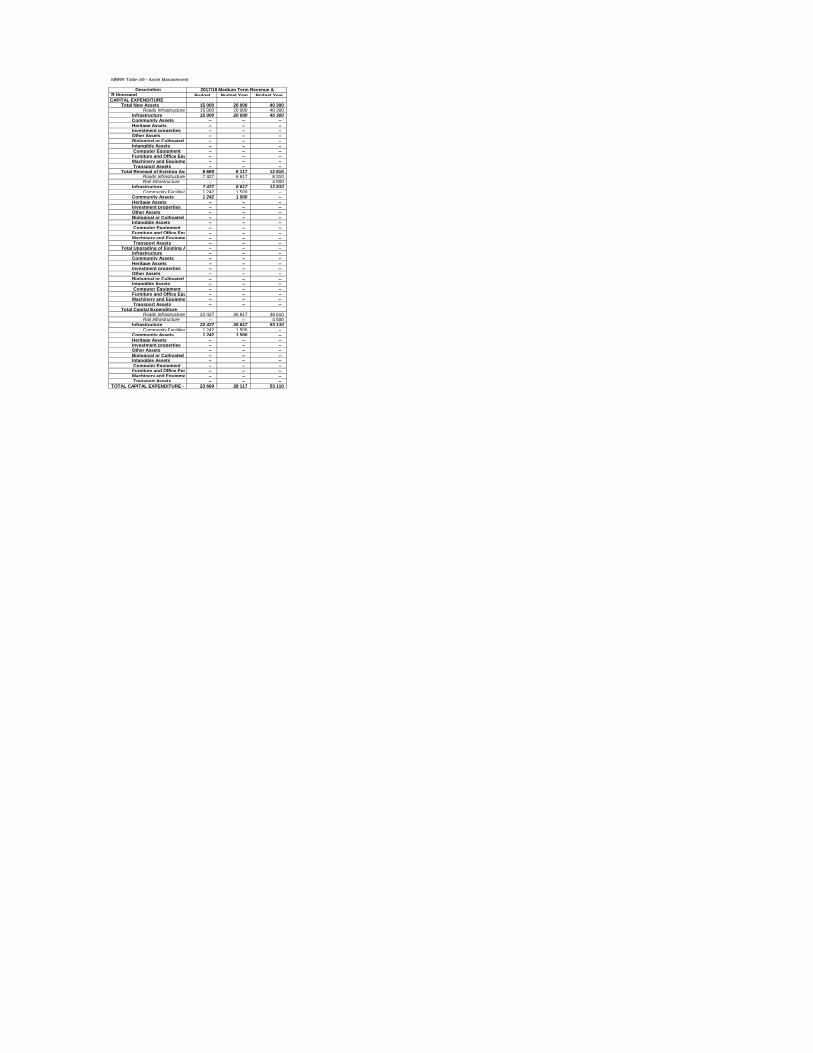
MBRR Table A9 - Asset Management
DescriptionR thousand Budget Budget Year Budget Year CAPITAL EXPENDITURE
Total New Assets 15 000 20 000 40 300 Roads Infrastructure 15 000 20 000 40 300
Infrastructure 15 000 20 000 40 300 Community Assets – – – Heritage Assets – – – Investment properties – – – Other Assets – – – Biological or Cultivated Assets – – – Intangible Assets – – – Computer Equipment – – – Furniture and Office Equipment – – – Machinery and Equipment – – – Transport Assets – – –
Total Renewal of Existing Assets 8 669 8 117 12 810 Roads Infrastructure 7 427 6 617 8 310 Rail Infrastructure – – 4 500
Infrastructure 7 427 6 617 12 810 Community Facilities 1 242 1 500 –
Community Assets 1 242 1 500 – Heritage Assets – – – Investment properties – – – Other Assets – – – Biological or Cultivated Assets – – – Intangible Assets – – – Computer Equipment – – – Furniture and Office Equipment – – – Machinery and Equipment – – – Transport Assets – – –
Total Upgrading of Existing Assets – – – Infrastructure – – – Community Assets – – – Heritage Assets – – – Investment properties – – – Other Assets – – – Biological or Cultivated Assets – – – Intangible Assets – – – Computer Equipment – – – Furniture and Office Equipment – – – Machinery and Equipment – – – Transport Assets – – –
Total Capital ExpenditureRoads Infrastructure 22 427 26 617 48 610 Rail Infrastructure – – 4 500
Infrastructure 22 427 26 617 53 110 Community Facilities 1 242 1 500 –
Community Assets 1 242 1 500 – Heritage Assets – – – Investment properties – – – Other Assets – – – Biological or Cultivated Assets – – – Intangible Assets – – – Computer Equipment – – – Furniture and Office Equipment – – – Machinery and Equipment – – – Transport Assets – – –
TOTAL CAPITAL EXPENDITURE - Asset class23 669 28 117 53 110
2017/18 Medium Term Revenue &
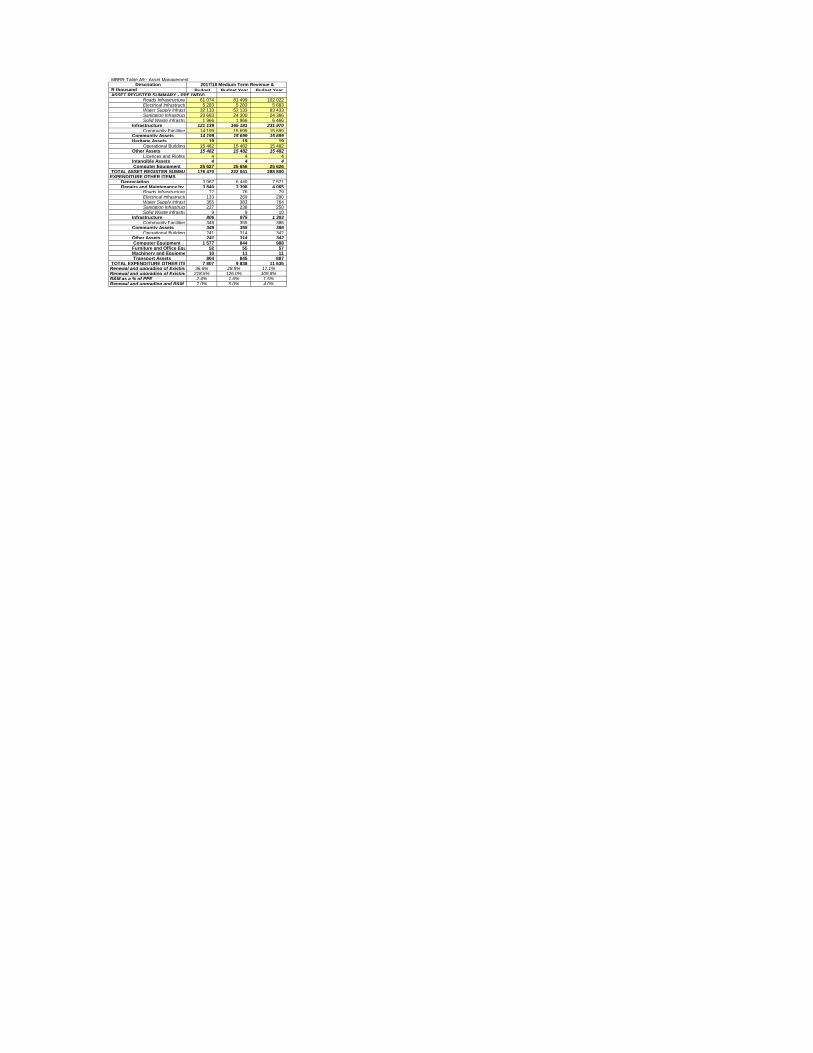
MBRR Table A9 - Asset ManagementDescription
R thousand Budget Budget Year Budget Year ASSET REGISTER SUMMARY - PPE (WDV)
Roads Infrastructure 61 074 81 499 102 022 Electrical Infrastructure 5 283 5 283 5 683 Water Supply Infrastructure32 133 52 133 93 433 Sanitation Infrastructure 20 683 24 300 24 366 Solid Waste Infrastructure 1 966 1 966 6 466
Infrastructure 121 139 165 181 231 970 Community Facilities 14 199 15 699 15 699
Community Assets 14 199 15 699 15 699 Heritage Assets 19 19 19
Operational Buildings 15 482 15 482 15 482 Other Assets 15 482 15 482 15 482
Licences and Rights 4 4 4 Intangible Assets 4 4 4 Computer Equipment 25 627 25 656 25 626
TOTAL ASSET REGISTER SUMMARY - PPE (WDV)176 470 222 041 288 800 EXPENDITURE OTHER ITEMS
Depreciation 3 967 6 440 7 571 Repairs and Maintenance by Asset Class3 840 3 398 4 065
Roads Infrastructure 72 76 79 Electrical Infrastructure 133 269 290 Water Supply Infrastructure 365 383 764 Sanitation Infrastructure 227 238 250 Solid Waste Infrastructure 9 9 10
Infrastructure 806 975 1 393 Community Facilities 349 355 386
Community Assets 349 355 386 Operational Buildings 241 314 342
Other Assets 241 314 342 Computer Equipment 1 577 844 988 Furniture and Office Equipment 52 55 57 Machinery and Equipment 10 11 11 Transport Assets 804 845 887
TOTAL EXPENDITURE OTHER ITEMS 7 807 9 838 11 635 Renewal and upgrading of Existing Assets as % of total capex36.6% 28.9% 17.1%Renewal and upgrading of Existing Assets as % of deprecn218.5% 126.0% 109.8%R&M as a % of PPE 2.4% 1.6% 1.5%Renewal and upgrading and R&M as a % of PPE7.0% 5.0% 4.0%
2017/18 Medium Term Revenue &
Explanatory notes to Table A9 - Asset Management
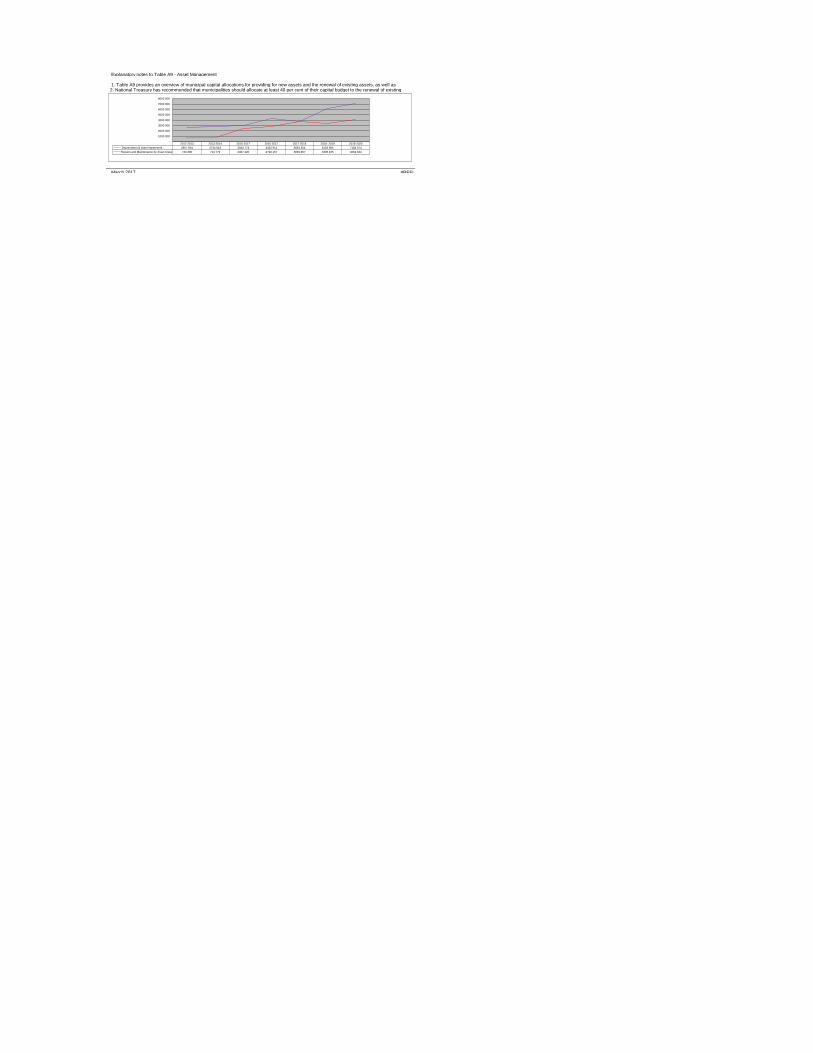
March 2017 #REF!
1. Table A9 provides an overview of municipal capital allocations for providing for new assets and the renewal of existing assets, as well as 2. National Treasury has recommended that municipalities should allocate at least 40 per cent of their capital budget to the renewal of existing
2012-2013 2013-2014 2016-2017 2016-2017 2017-2018 2018- 2019 2019-2020
Depreciation & asset impairment 2657 654 2734 043 3043 774 4322 911 3681 354 6153 895 7184 674
Repairs and Maintenance by Asset Class 734 386 714 779 2487 420 2792 167 3839 667 3398 435 4064 624
-
1000 000
2000 000
3000 000
4000 000
5000 000
6000 000
7000 000
8000 000
Kareeberg Municipality 2017-2018 Annual Budget and MTREF
MBRR Table A10 - Basic Service Delivery Measurement
Budget Budget Year Budget Year Household service targetsWater:
Piped water inside dwelling 1 188 1 188 1 188 Piped water inside yard (but not in dwelling)806 806 806 Using public tap (at least min.service level)160 160 160 Other water supply (at least min.service level)1 068 1 068 1 068
Minimum Service Level and Above sub-total 3 222 3 222 3 222 Total number of households 3 222 3 222 3 222 Sanitation/sewerage:
Flush toilet (connected to sewerage) 665 665 665 Flush toilet (with septic tank) 994 994 994 Pit toilet (ventilated) 335 335 335 Other toilet provisions (> min.service level)1 068 1 068 1 068
Using public tap (< min.service level) 3 062 3 062 3 062 Bucket toilet 160 160 160
Total number of households 160 160 160 Sanitation/sewerage: 3 222 3 222 3 222 Energy:
Electricity (at least min.service level) 962 962 962 Electricity - prepaid (min.service level) 2 586 2 586 2 586
Using public tap (< min.service level) 3 548 3 548 3 548 Other energy sources 891 891 891
Total number of households 891 891 891 Sanitation/sewerage: 4 439 4 439 4 439 Refuse:
Removed at least once a week 2 331 2 331 2 331 Using public tap (< min.service level) 2 331 2 331 2 331
Other rubbish disposal 891 891 891 Total number of households 891 891 891
Sanitation/sewerage: 3 222 3 222 3 222
MBRR Table A10 - Basic Service Delivery Measurement
Budget Budget Year Budget Year Cost of Free Basic Services provided - Formal Settlements (R'000)
Water (6 kilolitres per indigent household per month)– – – Sanitation (free sanitation service to indigent households)– – – Electricity/other energy (50kwh per indigent household per month)– – – Refuse (removed once a week for indigent households)– – –
Cost of Free Basic Services provided - Informal Formal Settlements (R'000)– – – Total cost of FBS provided – – – Highest level of free service provided per household
Property rates (R value threshold) – – – Water (kilolitres per household per month) 10 10 10 Sanitation (kilolitres per household per month)– – – Sanitation (Rand per household per month)232 247 272 Electricity (kwh per household per month) 50 50 50 Refuse (average litres per week) 150 160 176
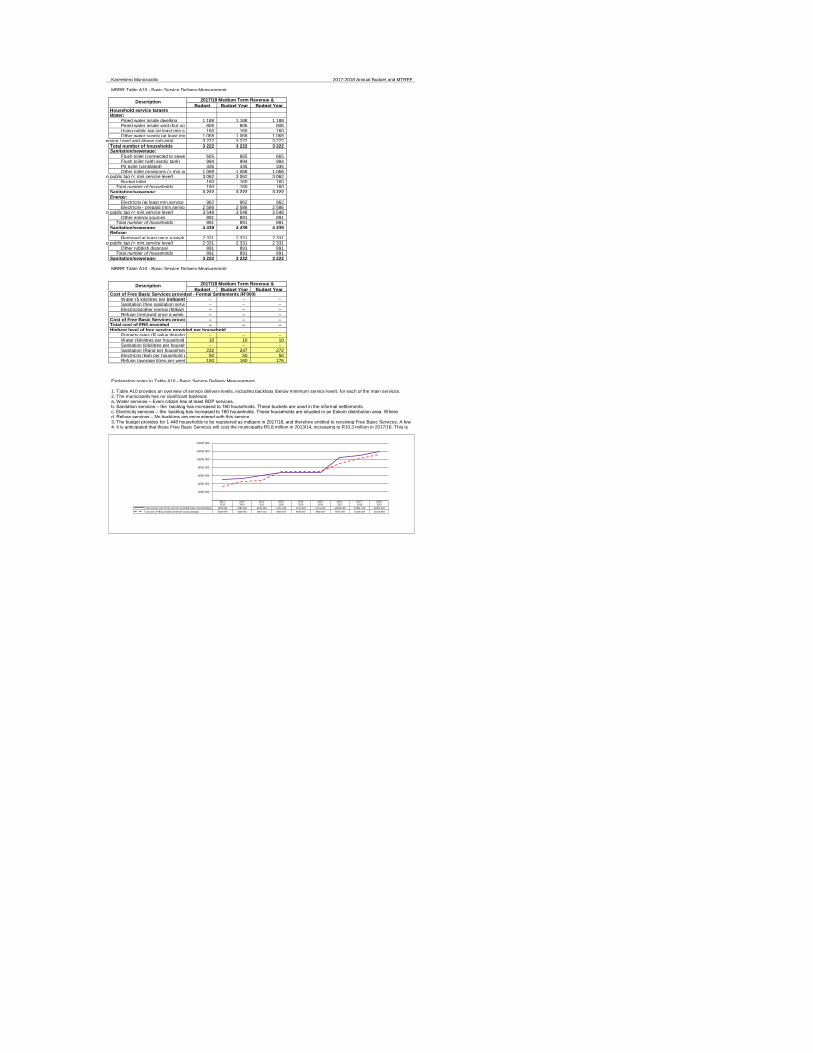
Explanatory notes to Table A10 - Basic Service Delivery Measurement
2. The municipality has no significant backlogsa. Water services – Every citizen has at least RDP services.
d. Refuse services – No backlogs are encountered with this service. 3. The budget provides for 1 448 households to be registered as indigent in 2017/18, and therefore entitled to receiving Free Basic Services. A few 4. It is anticipated that these Free Basic Services will cost the municipality R5.8 million in 2013/14, increasing to R10.3 million in 2017/18. This is
1. Table A10 provides an overview of service delivery levels, including backlogs (below minimum service level), for each of the main services.
Description 2017/18 Medium Term Revenue &
Description 2017/18 Medium Term Revenue &
b. Sanitation services – the backlog has increased to 160 households. These buckets are used in the informal settlements. c. Electricity services – the backlog has increased to 160 households. These households are situated in an Eskom distribution area. Where
2012-2013
2013-2014
2014-2015
2015-2016
2015-2016
2015-2016
2016 -2017
2017 -2018
2018-2019
Total revenue cost of free services provided (total social package) 4999 904 5383 500 6015 629 6741 240 6741 240 6741 240 10368 509 10991 762 11994 903
Total cost of FBS provided (minimum social package) 3408 979 4628 951 4867 044 6930 547 6930 547 6930 547 9073 786 10136 487 11184 893
-
2000 000
4000 000
6000 000
8000 000
10000 000
12000 000
14000 000
Kareeberg Municipality 2017-2018 Annual Budget and MTREF
2.1 Overview of the annual budget process
••••
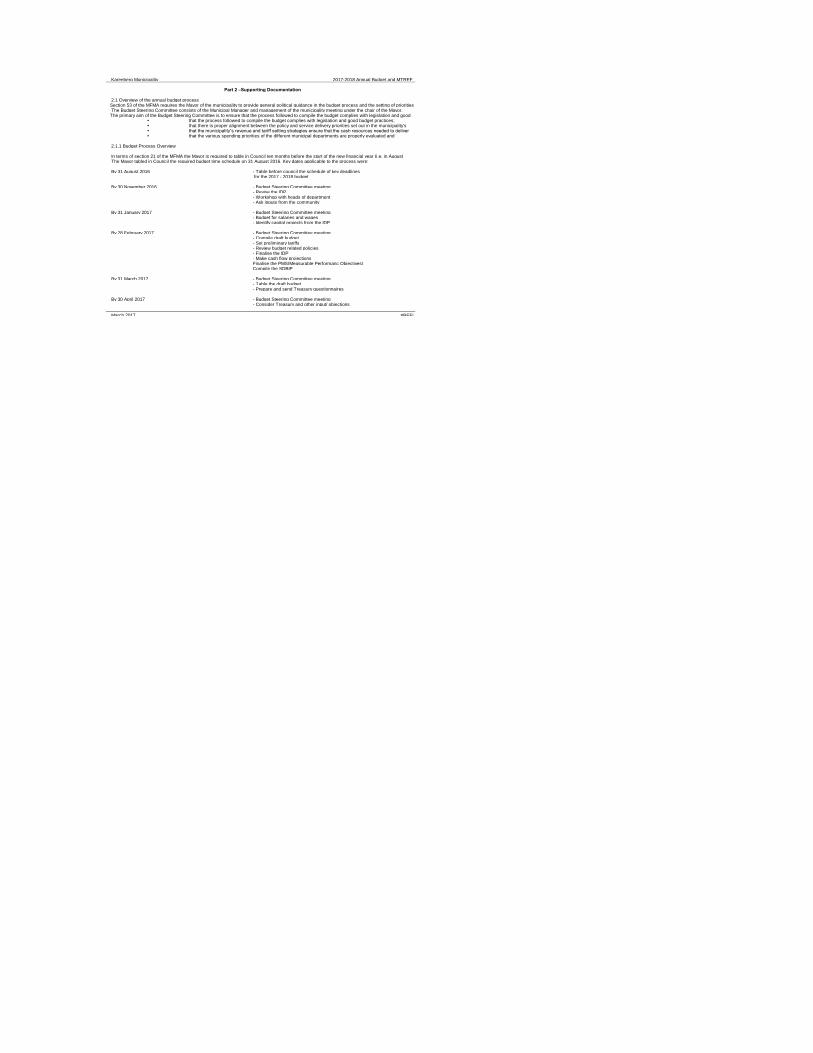
2.1.1 Budget Process Overview
By 31 August 2016 - Table before council the schedule of key deadlines for the 2017 - 2018 budget
By 30 November 2016 - Budget Steering Committee meeting- Revise the IDP- Workshop with heads of department- Ask inputs from the community
By 31 January 2017 - Budget Steering Committee meeting- Budget for salaries and wages- Identify capital projects from the IDP
By 28 February 2017 - Budget Steering Committee meeting- Compile draft budget- Set preliminary tariffs- Review budget related policies- Finalise the IDP- Make cash flow projectionsFinalise the PMS(Measurable Performanc Objectives)Compile the SDBIP
By 31 March 2017 - Budget Steering Committee meeting- Table the draft budget- Prepare and send Treasury questionnaires
By 30 April 2017 - Budget Steering Committee meeting- Consider Treasury and other input/ objections
March 2017 #REF!
Part 2 –Supporting Documentation
that the various spending priorities of the different municipal departments are properly evaluated and
In terms of section 21 of the MFMA the Mayor is required to table in Council ten months before the start of the new financial year (i.e. in August The Mayor tabled in Council the required budget time schedule on 31 August 2016. Key dates applicable to the process were:
Section 53 of the MFMA requires the Mayor of the municipality to provide general political guidance in the budget process and the setting of priorities The Budget Steering Committee consists of the Municipal Manager and management of the municipality meeting under the chair of the Mayor. The primary aim of the Budget Steering Committee is to ensure that the process followed to compile the budget complies with legislation and good
that the process followed to compile the budget complies with legislation and good budget practices; that there is proper alignment between the policy and service delivery priorities set out in the municipality's that the municipality‟s revenue and tariff setting strategies ensure that the cash resources needed to deliver

Kareeberg Municipality 2017-2018 Annual Budget and MTREF
By 31 May 2017 - Budget Steering Committee meeting- Finalise the community participation process- Table the budget for adoption- Table the SDBIP to be noted by council- Adopt the budget- Adopt the IDP- Adopt amendments to budget related policies
By 30 March 2017 - Mayor approves SDBIP-All performance management contracts completed and signed- Prepare and send Treasury questionnaires
2.1.2 IDP and Service Delivery and Budget Implementation Plan
2.1.3 Financial Modelling and Key Planning Drivers
The following key factors and planning strategies have informed the compilation of the 2017/18 MTREF:
• Policy priorities and strategic objectives• Asset maintenance• Economic climate and trends (i.e inflation, Eskom increases, household debt)• The approved 2016/17 adjustments budget and performance against the SDBIP• Cash Flow Management Strategy• Debtor payment levels• The need for tariff increases versus the ability of the community to pay for services;• Improved and sustainable service delivery
2.1.4 Community Consultation
March 2017 #REF!
All documents in the appropriate format (electronic and printed) were provided to National Treasury, and other national and provincial departments
The municipality's IDP is its principal strategic planning instrument, which directly guides and informs its planning, budget, management and
The draft 2017/18 MTREF was tabled before council on 30 March 2017. The draft 2017/18 MTREF, as tabled before Council on 30 March 2017 for community consultation,was published on the municipality's website, and
Kareeberg Municipality 2017-2018 Annual Budget and MTREF
2.2 Overview of alignment of annual budget with IDP
The national and provincial priorities, policies and strategies of importance include amongst others:• Green Paper on National Strategic Planning of 2009;• Government Programme of Action;• Development Facilitation Act of 1995;• Provincial Growth and Development Strategy (GGDS);• National and Provincial spatial development perspectives;• Relevant sector plans such as transportation, legislation and policy;• National Key Performance Indicators (NKPIs);• Accelerated and Shared Growth Initiative (ASGISA);• National 2014 Vision;• National Spatial Development Perspective (NSDP);• The National Priority Outcomes.
March 2017 #REF!
The Constitution mandates local government with the responsibility to exercise local developmental and cooperative governance. The eradication of Integrated developmental planning in the South African context is amongst others, an approach to planning aimed at involving the municipality and It is important that the IDP developed by municipalities correlate with National and Provincial intent. It must aim to co-ordinate the work of local and The aim of this revision cycle was to develop and coordinate a coherent plan to improve the quality of life for all the people living in the area, also
The Constitution requires local government to relate its management, budgeting and planning functions to its objectives. This gives a clear

Kareeberg Municipality 2017-2018 Annual Budget and MTREF
Table 13 IDP Strategic Objectives
March 2017 #REF!
The following table highlights the IDP's five strategic objectives for the 2017/18 MTREF and further planning refinements that have directly informed
2013/14 Medium Term Revenue & Expenditure Framework
1. Basic Service Delivery
1.1 Sewerage
1.2 Refuse removal
1.3 Elec tr ic ity Administ rat ion
1.4 Elec tr ic ity Generat ion
1.5 Elec tr ic ity Dist r ibut ion
1.6 Water Storage
1.7 Water Dist r ibut ion
1.8 Cemetry
1.9 Offic ial Housing
1.10 Main Roads
1.11 Commonage
1.12 Munic ipal Buildings
1.13 Public Works
1.14 Parks and Gardens
1.15 Pound
1.16 Streets and Pavements
1.17 Swimming Pool
1.18 Airpor t
1.19 Caravan Park
1.20 Abat toir
2. Good Governance and Public Par t ic ipat ion
2.1 Execut ive and Counc il
2.2 Corporate Services
3. Munic ipal Financ ial Viabil i ty
3.1 Rates
3.2 Budget and Treasury Office
4. Munic ipal Inst itut ional Development and Transformat ion
4.1 Library
4.2 Health
4.3 Museum
4.4 Nature Reserve
5. Local Economic Development
5.1 Fire Service
5.2 Civil Defence
5.3 Traffic and l icenc ing
Funding Source 2013/14 2014/15 2015/16
1 Upgrading of streets * Municipal Infrastructure Grant 2,000,000.00R
8 Water pipe line Regional Bulk Infrastructure Grant 15,000,000.00R 13,700,000.00R
9 High mast lighting in town 200,000.00R
12 Upgrading cemetery * Municipal Infrastructure Grant 200,000.00R
1 Upgrading of streets * Municipal Infrastructure Grant 1,189,000.00R
6 Upgrading of sport facilities * Municipal Infrastructure Grant 4,500,000.00R
16 Taxi rank 500,000.00R
17 Upgrading water network 1,000,000.00R
18 Commonage 1,533,000.00R
20 Tarring airstrip 3,000,000.00R
23 Upgrading refuse site 7,850,000.00R
25 Speed bumps in neighborhoods 300,000.00R
26 Management of heritage site 1,000,000.00R
27 Steel refuse bins in neighborhoods 500,000.00R
29 Housing project * 12 000 000
30 Kareeberg festival * 100 000
31 Fly-inn * 100 000
8 Upgrading streets * Municipal Infrastructure Grant 1,000,000.00R
9 Upgrading cemetery * Municipal Infrastructure Grant 200,000.00R
11 Housing project * 12 000 000
9,089,000.00R 22,850,000.00R 21,733,000.00R
Projects Per Town
Funded Projects
Vanwyksvlei
Carnarvon
Vosburg
Totals of Funding Required per Financial
Year

Kareeberg Municipality 2017-2018 Annual Budget and MTREF
March 2017 #REF!
2016/17 2017/18
2 Cleaning of the solid waste in put latrines 500 000
3 Tarring of the Vanwyksvlei/Copperton road 150 000 000
4 Public ablution facilities in town 200 000
5 Upgrading of commonage 1 000 000
6 Permanent ambulance service 500 000
10 Railway services from Calvinia to Hutchinson 100 000 000
11 Tree planting project 100 000
2 Tourism centre 15 000 000
3 Cemeteries fencing and ablution facilities 200 000
4 Ablution facilities hawkers 200 000
5 Bonteheuwel crèche 2 000 000
7 Schietfontein development 2 000 000
8 Public ablution facilities in town 200 000
9 Town entrances 200 000
10 Development of the nature reserve 10 000 000
11 Advertisement boards in town 100 000
12 Traffic lights and signs 2 000 000
13 Health Services: Doctors at clinics and more
personnel 1 000 000
14 Sport development, specifically golf
development for local people 100 000
15 Agave project 3 000 000
17 Upgrading water network 2 000 000 1 000 000
18 Commonage 1 467 000
19 Fire brigade 2 000 000
20 Tarring airstrip
21 Solar geyser project 2 000 000
22 Servicing of additional sites 2 000 000
24 More business sites in neighborhoods 2 000 000
25 Speed bumps in neighborhoods
26 Management of heritage site
27 Steel refuse bins in neighborhoods
28 Community Hall
29 Housing project * 12 000 000
1 Business sites 800 000
2 Solar energy-electricity and heating(solar geysers) 1 000 000
3 Additional commonage 3 000 000
4 Upgrading of sport facilities 500 000
5 Rite river weir blocked-cleaning 300 000
6 Waste recycling project 100 000
7 Women farming project 1 000 000
11 Housing project * 15 000 000
12 Upgrading water network 2 000 000
Projects Per Town
Unfunded Projects
Vanwyksvlei
Carnarvon
Vosburg

Kareeberg Municipality 2017-2018 Annual Budget and MTREF
MBRR Table SA4 - Reconciliation between the IDP strategic objectives and budgeted revenue
Strategic Objective GoalR thousand Budget Year Budget Year Basic Service Delivery 12.1 - 5 684 6 117 6 548 Basic Service Delivery 11.1 - 6 886 7 124 7 296 Basic Service Delivery 15.1 - 11 461 11 179 ###### Basic Service Delivery 14.2 - Water 42 057 48 147 ###### Basic Service Delivery 6.1 - 6 6 7 Basic Service Delivery 2.1 - Official 6 6 7 Basic Service Delivery 2.3 - 270 284 298 Basic Service Delivery 2.4 - 85 89 93 Basic Service Delivery 13.2 - Public 0 0 0 Basic Service Delivery 9.2 - Parks 0 0 0 Basic Service Delivery 8.3 - Pound 1 1 1 Basic Service Delivery 13.3 - 0 0 0 Basic Service Delivery 9.3 - 9 9 10 Basic Service Delivery 2.6 - Airport 0 0 0 Basic Service Delivery 9.4 - 3 3 3 Basic Service Delivery 12.1 - 42 598 44 706 ######
Allocations to other prioritiesGains on disposal of PPE 109 066 117 672 #####
March 2017 #REF!
2017/18 Medium Term Revenue &

Kareeberg Municipality 2017-2018 Annual Budget and MTREF
MBRR Table SA5 - Reconciliation between the IDP strategic objectives and budgeted operating expenditure
Strategic Objective GoalR thousand Budget Year Budget Year Basic Service Delivery 12.1 - 4 461 4 856 5 431 Basic Service Delivery 11.1 - 3 625 3 496 3 788 Basic Service Delivery 15.1 - 11 772 12 920 ###### Basic Service Delivery 14.2 - Water 1 817 3 019 2 414 Basic Service Delivery 6.1 - 246 247 266 Basic Service Delivery 2.1 - Official 206 4 6 Good Governance and Public 13.1 - Main 27 565 28 861 ###### Basic Service Delivery 2.3 - 200 71 75 Basic Service Delivery 2.4 - 330 349 389 Basic Service Delivery 13.2 - Public 3 067 2 518 2 942 Basic Service Delivery 9.2 - Parks 695 398 431 Basic Service Delivery 8.3 - Pound 42 46 51 Basic Service Delivery 13.3 - 1 352 1 237 1 352 Basic Service Delivery 9.3 - 87 89 94 Basic Service Delivery 2.6 - Airport 128 24 26 Basic Service Delivery 9.4 - 28 29 30 Basic Service Delivery 2.7 - Abattoir 1 1 1 Local Economic Development 525 383 400 Allocations to other priorities 8 777 11 902 ######Loss on disposal of PPE 64 921 70 453 #####
March 2017 #REF!
2017/18 Medium Term Revenue &
Kareeberg Municipality 2017-2018 Annual Budget and MTREF
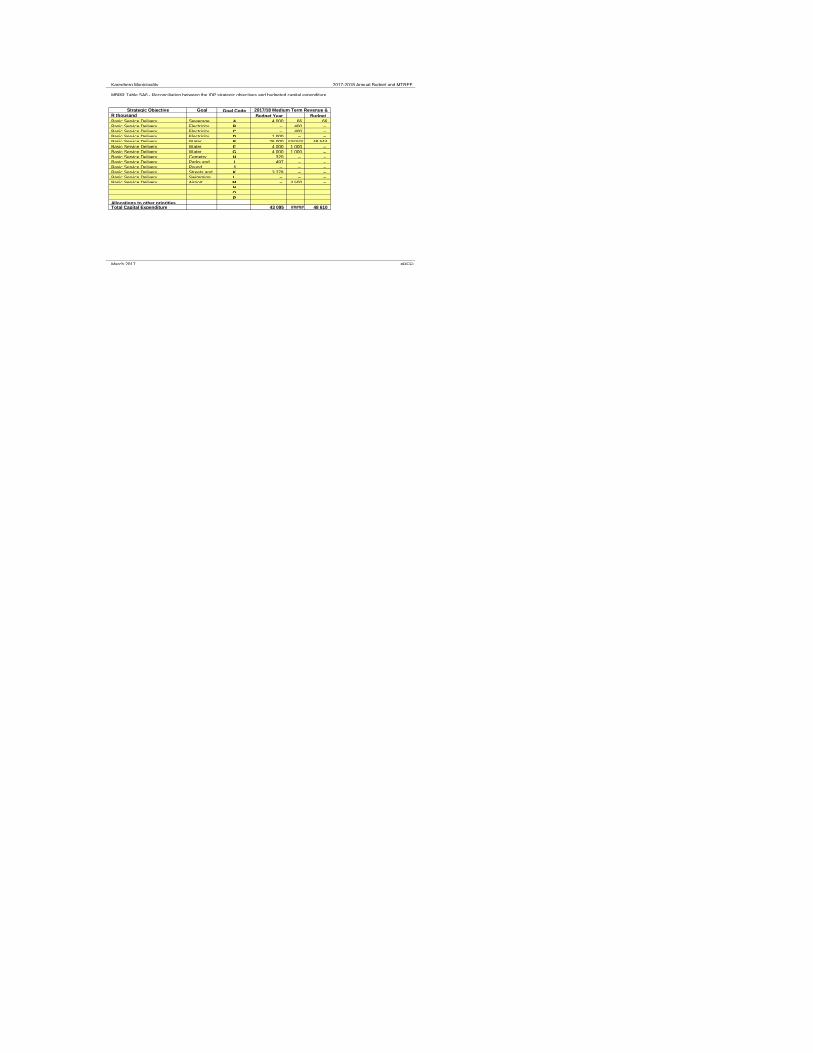
MBRR Table SA6 - Reconciliation between the IDP strategic objectives and budgeted capital expenditure
Strategic Objective Goal Goal Code R thousand Budget Year Budget Basic Service Delivery Sewerage A 4 000 66 66 Basic Service Delivery Electricity B – 400 – Basic Service Delivery Electricity C – 400 – Basic Service Delivery Electricity D 1 000 – – Basic Service Delivery Water E 26 000 ###### 48 544 Basic Service Delivery Water F 4 000 1 000 – Basic Service Delivery Water G 4 000 1 000 – Basic Service Delivery Cemetry H 320 – – Basic Service Delivery Parks and I 497 – – Basic Service Delivery Pound J – – – Basic Service Delivery Streets and K 3 278 – – Basic Service Delivery Swimming L – – – Basic Service Delivery Airport M – 4 500 –
N O P
Allocations to other prioritiesTotal Capital Expenditure 43 095 ##### 48 610
March 2017 #REF!
2017/18 Medium Term Revenue &
Kareeberg Municipality 2017-2018 Annual Budget and MTREF
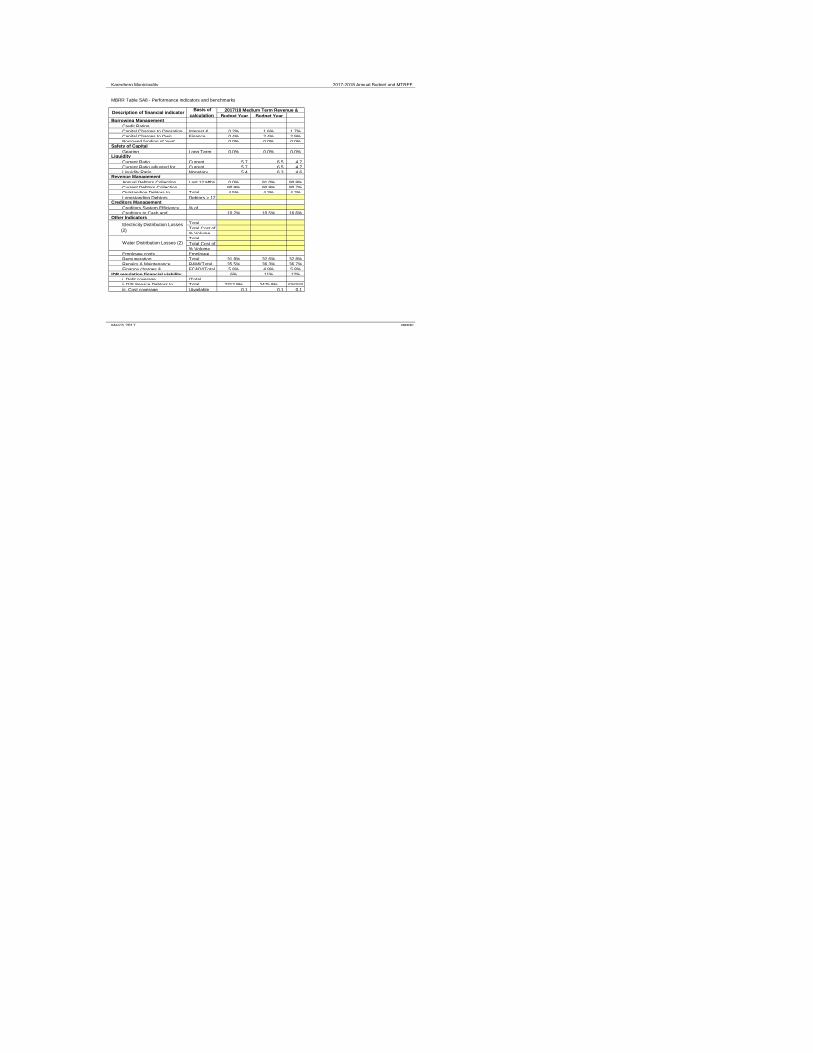
MBRR Table SA8 - Performance indicators and benchmarks
Budget Year Budget Year Borrowing Management
Credit Rating Capital Charges to Operating Interest & 0.2% 1.6% 1.7% Capital Charges to Own Finance 0.4% 2.4% 2.9% Borrowed funding of 'own' 0.0% 0.0% 0.0%
Safety of Capital
Gearing Long Term 0.0% 0.0% 0.0% Liquidity
Current Ratio Current 5.7 6.5 4.7 Current Ratio adjusted for Current 5.7 6.5 4.7 Liquidity Ratio Monetary 5.4 6.3 4.6
Revenue Management
Annual Debtors Collection Last 12 Mths 0.0% 91.0% 90.9% Current Debtors Collection 90.9% 90.9% 90.7% Outstanding Debtors to Total 4.5% 4.3% 4.2% Longstanding Debtors Debtors > 12
Creditors Management
Creditors System Efficiency % of Creditors to Cash and 10.2% 10.5% 16.6%
Other Indicators
Total Total Cost of % Volume Total Total Cost of % Volume
Employee costs Employee Remuneration Total 31.8% 32.6% 32.8% Repairs & Maintenance R&M/(Total 35.5% 36.3% 36.7% Finance charges & FC&D/(Total 5.8% 4.9% 5.8%
IDP regulation financial viability 6% 11% 12% i. Debt coverage (Total ii.O/S Service Debtors to Total 2312.9% 2475.8% ###### iii. Cost coverage (Available 0.1 0.1 0.1
March 2017 #REF!
Description of financial indicator Basis of
calculation
2017/18 Medium Term Revenue &
Electricity Distribution Losses
(2)
Water Distribution Losses (2)
Kareeberg Municipality 2017-2018 Annual Budget and MTREF
2.3.1 Performance indicators and benchmarks
2.3.1.1 Borrowing Management
The municipality does not foresee any borrowing during the MTREF.
2.3.1.2 Safety of Capital
2.3.1.3 Liquidity
2.3.1.4 Revenue Management
2.3.1.5 Creditors Management
2.3.1.6 Other Indicators
2.3.2 Free Basic Services: basic social services package for indigent households
March 2017 #REF!
Gearing: no borrowing will be undertaken.
Current ratio is a measure of the current assets divided by the current liabilities. For the 2017/18 MTREF the current ratio is 5.74 in the 2017/18 The liquidity ratio is a measure of the ability of the municipality to utilize cash and cash equivalents to erase or redeem its current liabilities
The revenue value chain must be streamlined by ensuring accurate billing, customer service, credit control and debt collection.
The municipality has managed to ensure that creditors are settled within the legislated 30 days of invoice. By applying daily cash flow management
The electricity distribution losses remain fairly constant since 2009/10. The initiatives to ensure these targets are achieved include managing illegal Employee costs as a percentage of operating revenue is declining over the MTREF. This is primarily owing to the high increase in bulk purchases Rrepairs and maintenance as percentage of operating revenue remains fairly constant over the MTREF.
The social package assists residents that have difficulty paying for services and are registered as indigent households in terms of the Indigent For the 2017/18 financial year 1 448 registered indigents have been provided for in the budget. In terms of the municipality's indigent policy Further detail relating to the number of households receiving free basic services, the cost of free basic services, highest level of free basic services Note that the number of households in informal areas that receive free services and the cost of these services (e.g. the provision of water through
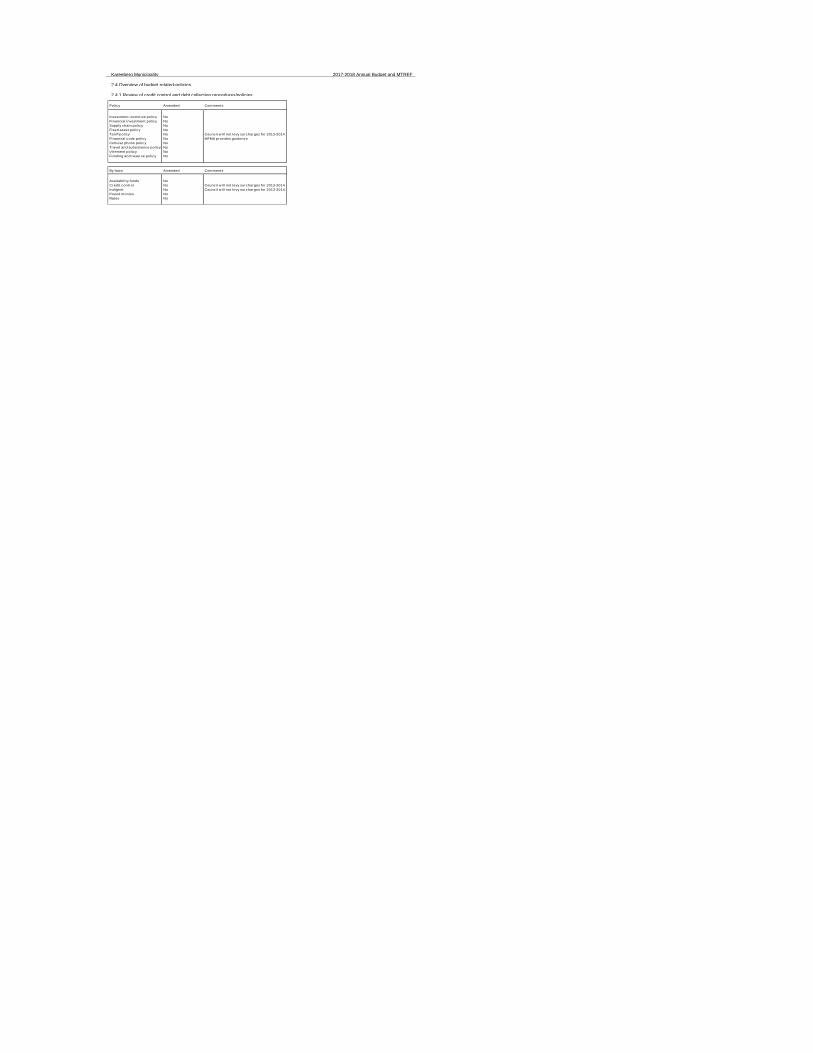
Kareeberg Municipality 2017-2018 Annual Budget and MTREF
2.4 Overview of budget related-policies
2.4.1 Review of credit control and debt collection procedures/policies
Policy Amended Comments
Investment incent ive policy No
Financ ial investment policy No
Supply chain policy No
Fixed asset policy No
Tar iff policy No Council w il l not levy surcharges for 2013-2014
Financ ial code policy No MFMA provides guidence
Cellular phone policy No
Travel and subsistence policy No
Virement policy No
Funding and reserve policy No
By-laws Amended Comments
Availabil i ty funds No
Credit control No Council w il l not levy surcharges for 2013-2014
Indigent No Council w il l not levy surcharges for 2013-2014
Pound monies No
Rates No
2.5 Overview of budget assumptions
2.5.1 External factors
2.5.2 General inflation outlook and its impact on the municipal activitiesThere are five key factors that have been taken into consideration in the compilation of the 2017/18 MTREF:
• National Government macro economic targets;• The general inflationary outlook and the impact on municipality's residents and businesses;• The impact of municipal cost drivers;• The increase in prices for bulk electricity; and•
March 2017 #REF!
Due to the economic slowdown, financial resources are limited due to reduced payment levels by consumers. This has resulted in declining cash
The increase in the cost of remuneration.
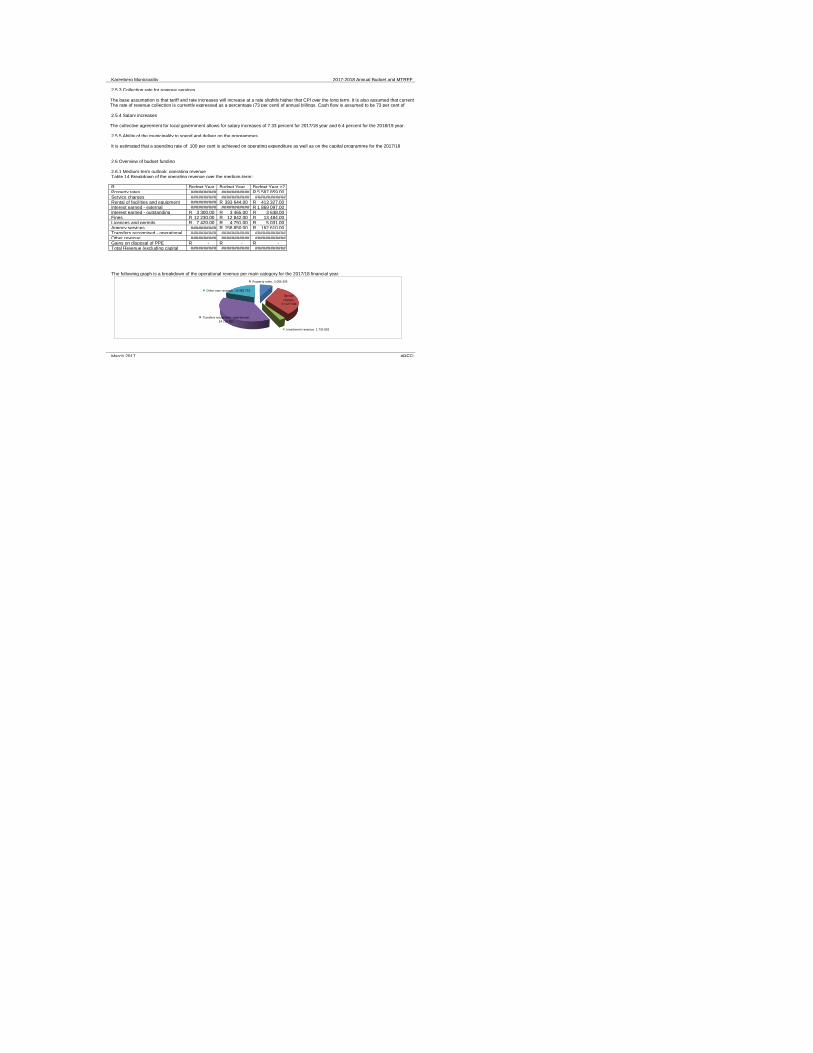
Kareeberg Municipality 2017-2018 Annual Budget and MTREF
2.5.3 Collection rate for revenue services
2.5.4 Salary increases
2.5.5 Ability of the municipality to spend and deliver on the programmes
2.6 Overview of budget funding
2.6.1 Medium-term outlook: operating revenueTable 14 Breakdown of the operating revenue over the medium-term:
R Budget Year Budget Year Budget Year +2 Property rates ########## ########### 5 587 859.00R Service charges ########## ########### ############ Rental of facilities and equipment ########## 393 644.00R 413 327.00R Interest earned - external ########## ########### 1 869 097.00R Interest earned - outstanding 3 300.00R 3 465.00R 3 638.00R Fines 12 230.00R 12 842.00R 13 484.00R Licences and permits 7 420.00R 4 791.00R 5 031.00R Agency services ########## 158 850.00R 162 610.00R Transfers recognised - operational ########## ########### ############ Other revenue ########## ########### ############ Gains on disposal of PPE -R -R -R Total Revenue (excluding capital ########## ########### ############
March 2017 #REF!
The base assumption is that tariff and rate increases will increase at a rate slightly higher that CPI over the long term. It is also assumed that current The rate of revenue collection is currently expressed as a percentage (73 per cent) of annual billings. Cash flow is assumed to be 73 per cent of
The collective agreement for local government allows for salary increases of 7.33 percent for 2017/18 year and 6.4 percent for the 2018/19 year.
It is estimated that a spending rate of 100 per cent is achieved on operating expenditure as well as on the capital programme for the 2017/18
The following graph is a breakdown of the operational revenue per main category for the 2017/18 financial year.
Property rates, 5 006 305
Service charges,
21 527 546
Investment revenue, 1 735 802
Transfers recognised - operational, 24 718 997
Other own revenue, 12 982 732
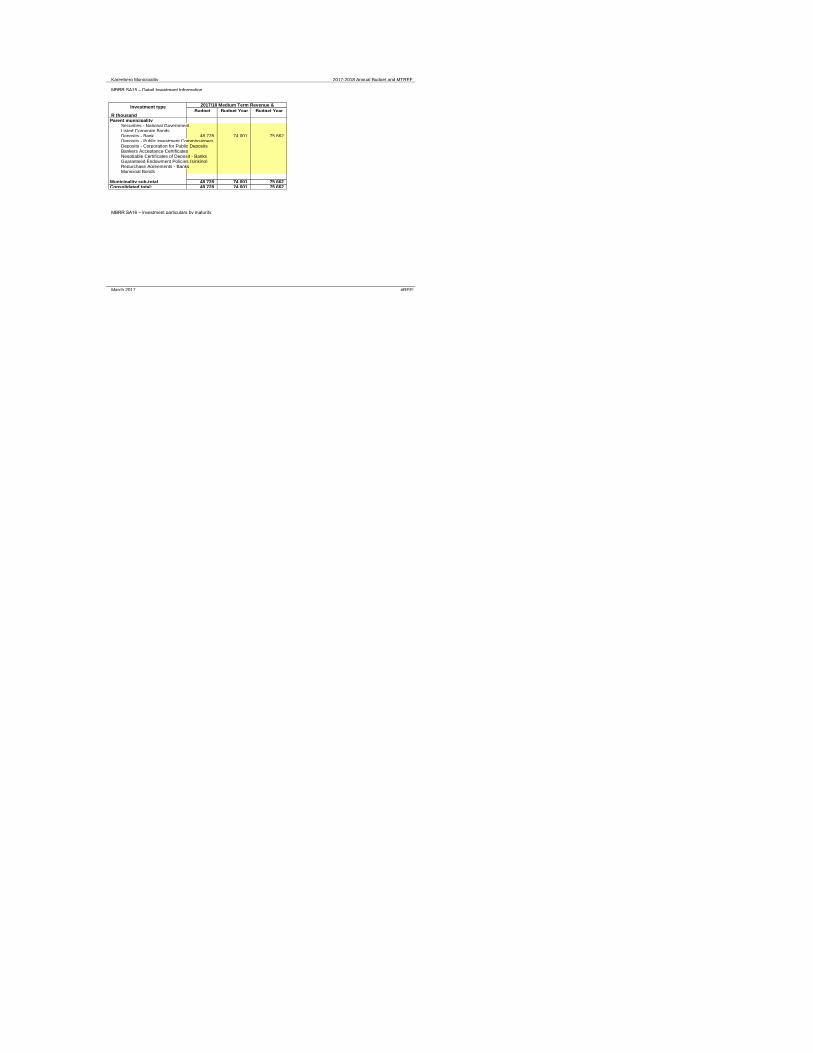
Kareeberg Municipality 2017-2018 Annual Budget and MTREF
MBRR SA15 – Detail Investment Information
Budget Budget Year Budget Year R thousandParent municipality
Securities - National GovernmentListed Corporate BondsDeposits - Bank 48 728 74 001 75 662 Deposits - Public Investment CommissionersDeposits - Corporation for Public DepositsBankers Acceptance CertificatesNegotiable Certificates of Deposit - BanksGuaranteed Endowment Policies (sinking)Repurchase Agreements - BanksMunicipal Bonds
Municipality sub-total 48 728 74 001 75 662 Consolidated total: 48 728 74 001 75 662
MBRR SA16 – Investment particulars by maturity
March 2017 #REF!
Investment type 2017/18 Medium Term Revenue &
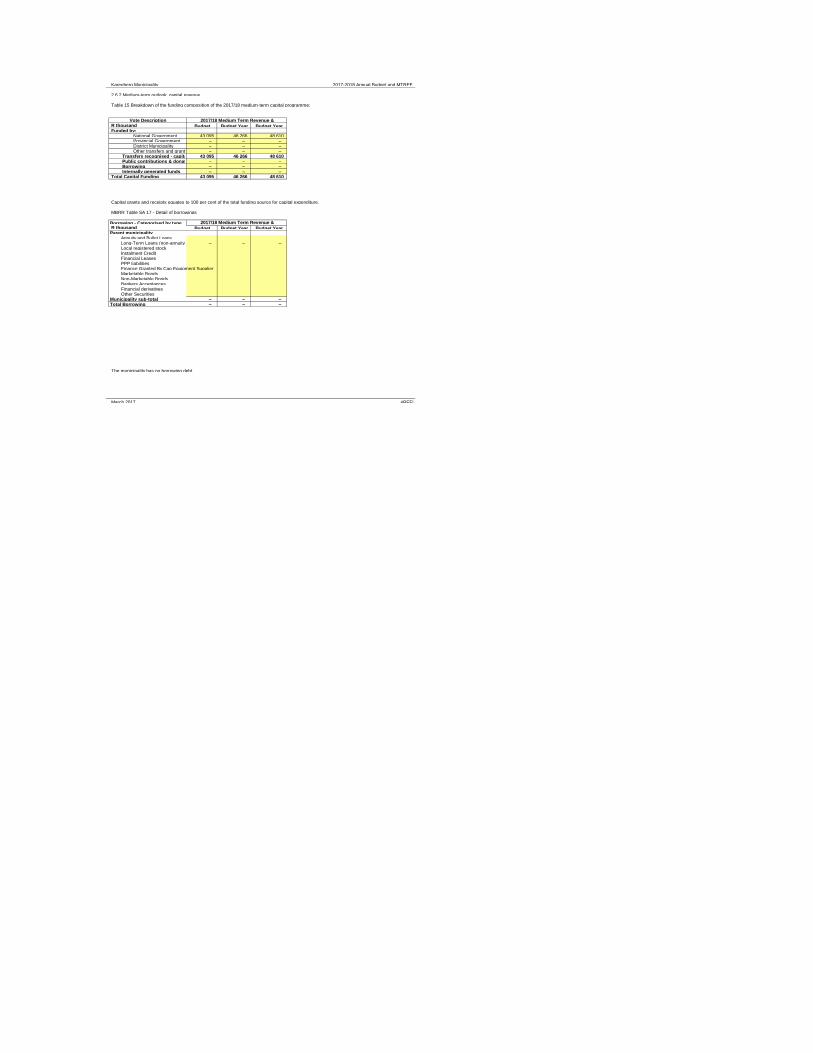
Kareeberg Municipality 2017-2018 Annual Budget and MTREF
2.6.2 Medium-term outlook: capital revenue
Vote DescriptionR thousand Budget Budget Year Budget Year Funded by:
National Government 43 095 46 266 48 610 Provincial Government – – – District Municipality – – – Other transfers and grants – – –
Transfers recognised - capital 43 095 46 266 48 610 Public contributions & donations – – – Borrowing – – – Internally generated funds – – –
Total Capital Funding 43 095 46 266 48 610
Capital grants and receipts equates to 100 per cent of the total funding source for capital expenditure.
MBRR Table SA 17 - Detail of borrowings
Borrowing - Categorised by typeR thousand Budget Budget Year Budget Year Parent municipality
Annuity and Bullet LoansLong-Term Loans (non-annuity) – – – Local registered stockInstalment CreditFinancial LeasesPPP liabilitiesFinance Granted By Cap Equipment SupplierMarketable BondsNon-Marketable BondsBankers AcceptancesFinancial derivativesOther Securities
Municipality sub-total – – – Total Borrowing – – –
The municipality has no borrowing debt.
March 2017 #REF!
Table 15 Breakdown of the funding composition of the 2017/18 medium-term capital programme:
2017/18 Medium Term Revenue &
2017/18 Medium Term Revenue &
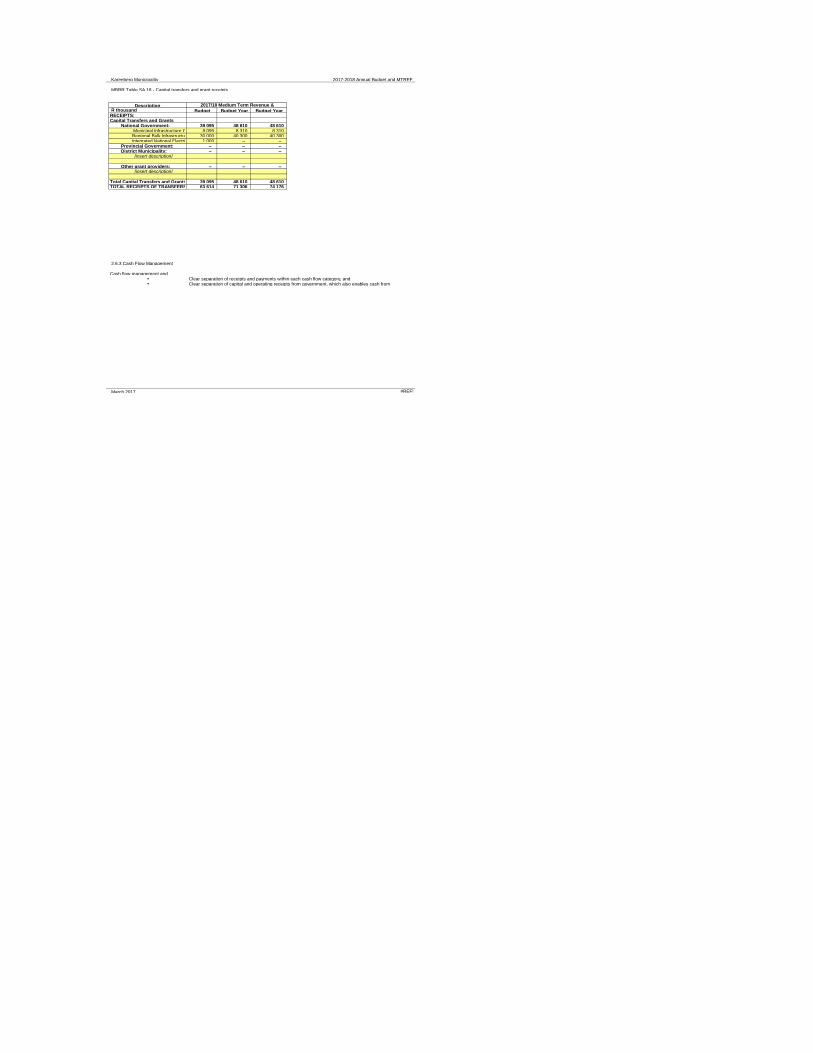
Kareeberg Municipality 2017-2018 Annual Budget and MTREF
MBRR Table SA 18 - Capital transfers and grant receipts
DescriptionR thousand Budget Budget Year Budget Year RECEIPTS:Capital Transfers and Grants
National Government: 39 095 48 610 48 610 Municipal Infrastructure Grant (MIG)8 095 8 310 8 310 Regional Bulk Infrastructure 30 000 40 300 40 300 Integrated National Electrification Programme1 000 – –
Provincial Government: – – – District Municipality: – – –
[insert description]
Other grant providers: – – – [insert description]
Total Capital Transfers and Grants 39 095 48 610 48 610 TOTAL RECEIPTS OF TRANSFERS & GRANTS63 614 71 306 74 176
2.6.3 Cash Flow Management
Cash flow management and ••
March 2017 #REF!
Clear separation of receipts and payments within each cash flow category; and Clear separation of capital and operating receipts from government, which also enables cash from
2017/18 Medium Term Revenue &

Kareeberg Municipality 2017-2018 Draft Annual Budget MTREF
MBRR Table A7 - Budget cash flow statement
DescriptionR thousand Budget Budget Year Budget Year CASH FLOW FROM OPERATING ACTIVITIESReceipts
Property rates 3 675 3 880 4 101 Service charges 20 451 21 550 21 628 Other revenue 12 679 16 295 13 720 Government - operating 24 719 22 696 25 566 Government - capital 43 095 48 610 48 610 Interest 1 566 1 784 1 873 Dividends – – –
PaymentsSuppliers and employees (47 310) (50 924) (53 129) Finance charges (145) (1 118) (1 274) Transfers and Grants (10 095) (9 402) (10 843)
NET CASH FROM/(USED) OPERATING ACTIVITIES48 635 53 373 50 253 CASH FLOWS FROM INVESTING ACTIVITIESReceipts
Proceeds on disposal of PPE – – – Decrease (Increase) in non-current debtors8 8 8 Decrease (increase) other non-current receivables– – – Decrease (increase) in non-current investments– – –
PaymentsCapital assets (23 669) (28 117) (48 610)
NET CASH FROM/(USED) INVESTING ACTIVITIES(23 661) (28 109) (48 602) CASH FLOWS FROM FINANCING ACTIVITIESReceipts
Short term loans – – – Borrowing long term/refinancing – – – Increase (decrease) in consumer deposits10 10 10
PaymentsRepayment of borrowing – – –
NET CASH FROM/(USED) FINANCING ACTIVITIES10 10 10 NET INCREASE/ (DECREASE) IN CASH HELD24 984 25 273 1 661
Cash/cash equivalents at the year begin:25 282 50 266 75 540 Cash/cash equivalents at the year end:50 266 75 540 77 201
If the assumptions realise, cash flow will remain fairly constant over the MTREF.
2.6.4 Cash Backed Reserves/Accumulated Surplus Reconciliation
• What are the predicted cash and investments that are available at the end of the budget year?• How are those funds used?• What is the net funds available or funding shortfall?
March 2017 #REF!
This following table meets the requirements of MFMA Circular 42 which deals with the funding of a municipal budget in accordance with sections 18
A surplus would indicate the cash-backed accumulated surplus that was/is available. A shortfall (applications > cash and investments) is indicative
2017/18 Medium Term Revenue &
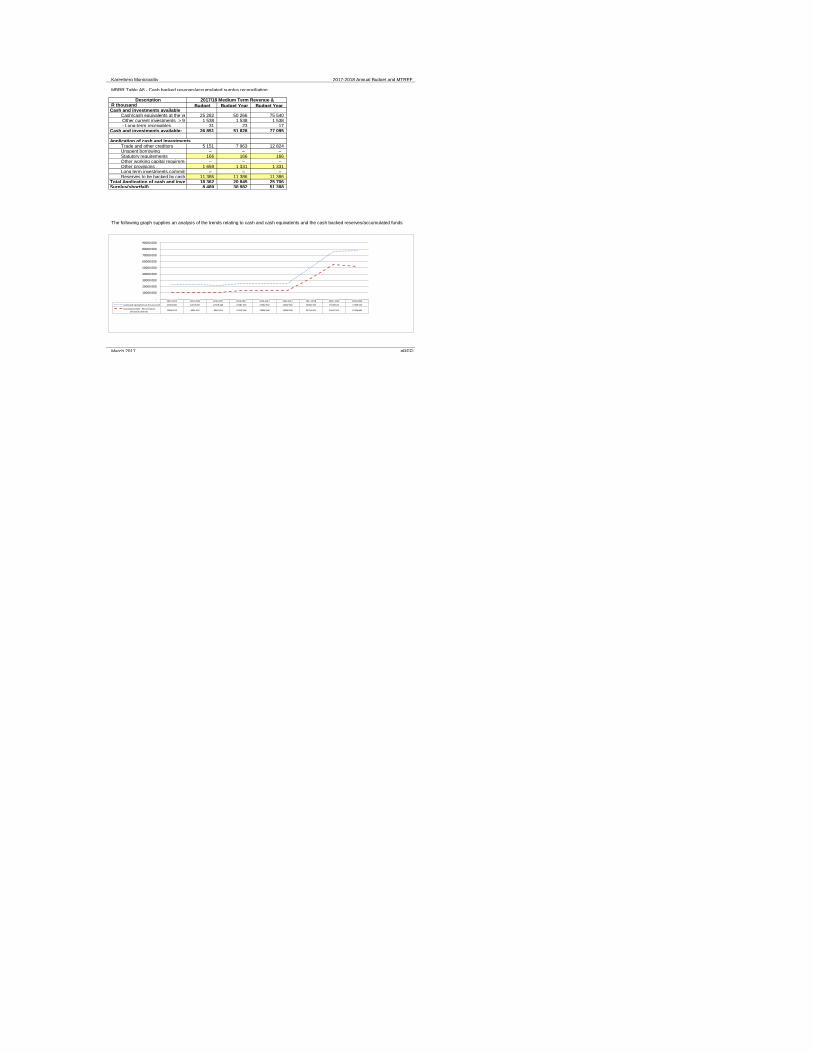
Kareeberg Municipality 2017-2018 Annual Budget and MTREF
MBRR Table A8 - Cash backed reserves/accumulated surplus reconciliation
DescriptionR thousand Budget Budget Year Budget Year Cash and investments available
Cash/cash equivalents at the year beg 25 282 50 266 75 540 Other current investments > 90 days 1 538 1 538 1 538 - Long-term receivables 31 23 17
Cash and investments available: 26 851 51 828 77 095
Application of cash and investmentsTrade and other creditors 5 151 7 963 12 824 Unspent borrowing – – – Statutory requirements 166 166 166 Other working capital requirements – – – Other provisions 1 659 1 331 1 331 Long term investments committed – – – Reserves to be backed by cash/investments11 386 11 386 11 386
Total Application of cash and investments:18 362 20 845 25 706 Surplus(shortfall) 8 489 30 982 51 388
March 2017 #REF!
The following graph supplies an analysis of the trends relating to cash and cash equivalents and the cash backed reserves/accumulated funds
2017/18 Medium Term Revenue &
2012-2013 2013-2014 2016-2017 2016-2017 2016-2017 2016-2017 2017-2018 2018- 2019 2019-2020
Cash/cash equivalents at the year end 23203 492 22612 007 22376 446 25282 302 25282 302 25282 302 50266 332 75539 612 77200 502
Surplus(shortfall) - Reconciliationof funds & reserves
10956 913 9924 319 9943 974 13118 166 13068 166 13068 166 32750 401 55547 591 52324 481
-
10000 000
20000 000
30000 000
40000 000
50000 000
60000 000
70000 000
80000 000
90000 000
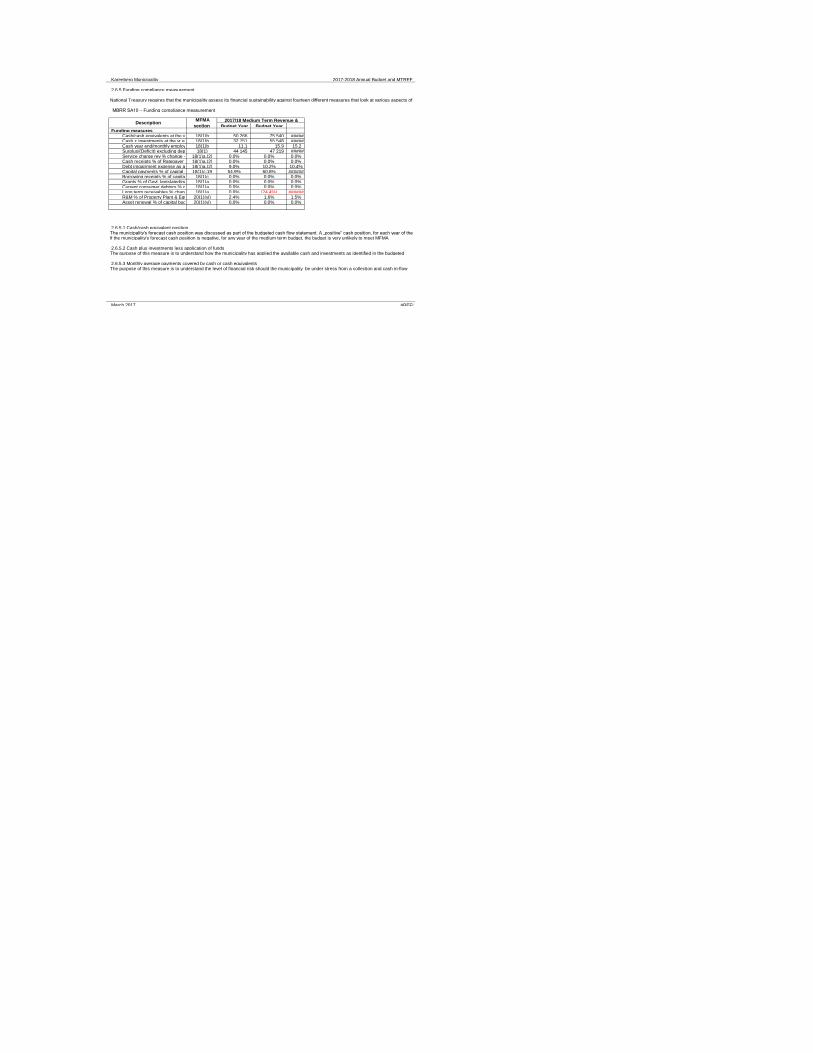
Kareeberg Municipality 2017-2018 Annual Budget and MTREF
2.6.5 Funding compliance measurement
MBRR SA10 – Funding compliance measurement
Budget Year Budget Year Funding measures
Cash/cash equivalents at the year end - R'00018(1)b 50 266 75 540 #####Cash + investments at the yr end less applications - R'00018(1)b 32 751 55 548 #####Cash year end/monthly employee/supplier payments18(1)b 11.1 15.9 15.2 Surplus/(Deficit) excluding depreciation offsets: R'00018(1) 44 145 47 219 #####Service charge rev % change - macro CPIX target exclusive18(1)a,(2) 0.0% 0.0% 0.0%Cash receipts % of Ratepayer & Other revenue18(1)a,(2) 0.0% 0.0% 0.0%Debt impairment expense as a % of total billable revenue18(1)a,(2) 9.0% 10.2% 10.4%Capital payments % of capital expenditure18(1)c;19 54.9% 60.8% ######Borrowing receipts % of capital expenditure (excl. transfers)18(1)c 0.0% 0.0% 0.0%Grants % of Govt. legislated/gazetted allocations18(1)a 0.0% 0.0% 0.0%Current consumer debtors % change - incr(decr)18(1)a 0.0% 0.0% 0.0%Long term receivables % change - incr(decr)18(1)a 0.0% (24.4%) ######R&M % of Property Plant & Equipment20(1)(vi) 2.4% 1.6% 1.5%Asset renewal % of capital budget 20(1)(vi) 0.0% 0.0% 0.0%
2.6.5.1 Cash/cash equivalent position
2.6.5.2 Cash plus investments less application of funds
2.6.5.3 Monthly average payments covered by cash or cash equivalents
March 2017 #REF!
National Treasury requires that the municipality assess its financial sustainability against fourteen different measures that look at various aspects of
Description MFMA
section
2017/18 Medium Term Revenue &
The municipality's forecast cash position was discussed as part of the budgeted cash flow statement. A „positive‟ cash position, for each year of the If the municipality's forecast cash position is negative, for any year of the medium term budget, the budget is very unlikely to meet MFMA
The purpose of this measure is to understand how the municipality has applied the available cash and investments as identified in the budgeted
The purpose of this measure is to understand the level of financial risk should the municipality be under stress from a collection and cash in-flow
Kareeberg Municipality 2017-2018 Annual Budget and MTREF
2.6.5.4 Surplus/deficit excluding depreciation offsets
2.6.5.5 Property Rates/service charge revenue as a percentage increase less macro inflation target
2.6.5.6 Cash receipts as a percentage of ratepayer and other revenue
2.6.5.7 Debt impairment expense as a percentage of billable revenue
2.6.5.8 Capital payments percentage of capital expenditure
2.6.5.9 Borrowing as a percentage of capital expenditure (excluding transfers, grants and contributions)Council will not borrow for the MTREF.
2.6.5.10 Transfers/grants revenue as a percentage of Government transfers/grants available
2.6.5.11 Consumer debtors change (Current and Non-current)
2.6.5.12 Repairs and maintenance expenditure level
March 2017 #REF!
This factor is a macro measure of the rate at which funds are „collected‟. This measure is intended to analyse the underlying assumed collection
This factor measures whether the provision for debt impairment is being adequately funded and is based on the underlying assumption that the
The purpose of this measure is to determine whether the timing of payments has been taken into consideration when forecasting the cash position.
The purpose of this measurement is mainly to ensure that all available transfers from national and provincial government have been budgeted for. A
The purpose of these measures are to ascertain whether budgeted reductions in outstanding debtors are realistic. There are 2 measures shown for
This measure must be considered important within the context of the funding measures criteria because a trend that indicates insufficient funds are
The main purpose of this measure is to understand if the revenue levels are sufficient to conclude that the community is making a sufficient
The purpose of this measure is to understand whether the municipality is contributing appropriately to the achievement of national inflation targets.
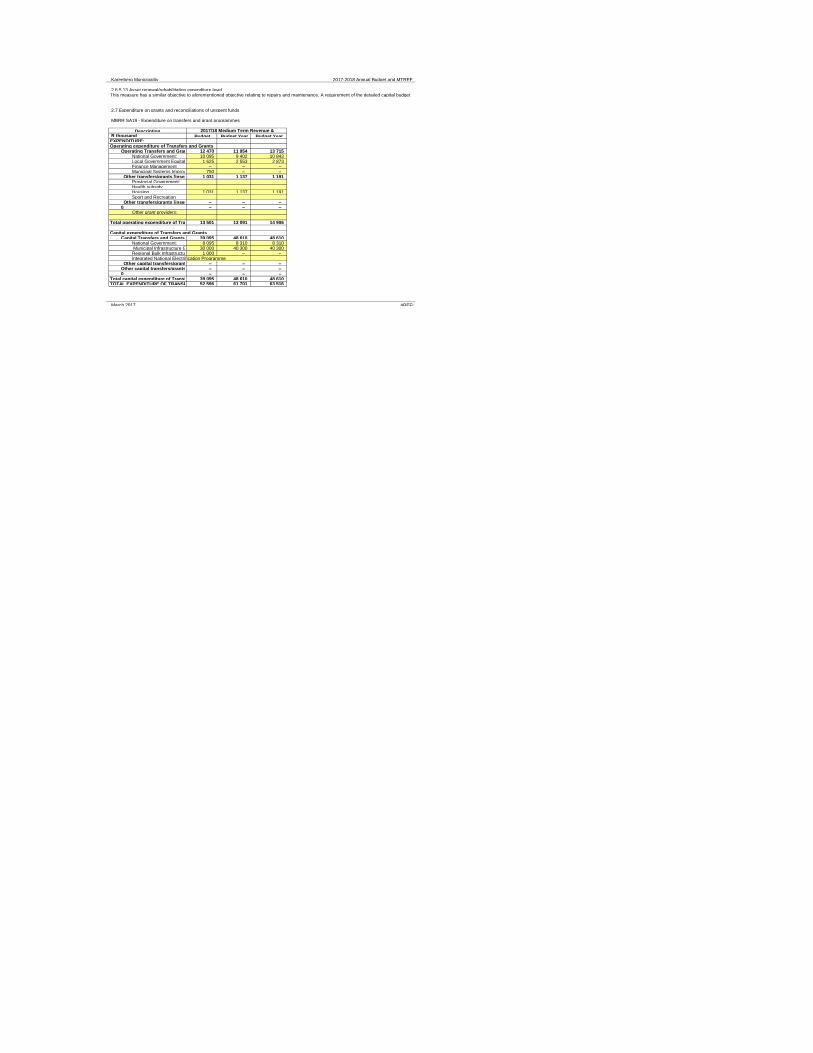
Kareeberg Municipality 2017-2018 Annual Budget and MTREF
2.6.5.13 Asset renewal/rehabilitation expenditure level
2.7 Expenditure on grants and reconciliations of unspent funds
MBRR SA19 - Expenditure on transfers and grant programmes
DescriptionR thousand Budget Budget Year Budget Year EXPENDITURE:Operating expenditure of Transfers and Grants
Operating Transfers and Grants 12 470 11 954 13 715 National Government: 10 095 9 402 10 843 Local Government Equitable Share1 625 2 553 2 873 Finance Management – – – Municipal Systems Improvement 750 – –
Other transfers/grants [insert description]1 031 1 137 1 191 Provincial Government:Health subsidyHousing 1 031 1 137 1 191 Sport and Recreation
Other transfers/grants [insert description]– – – 0 – – –
Other grant providers:
Total operating expenditure of Transfers and Grants:13 501 13 091 14 906
Capital expenditure of Transfers and GrantsCapital Transfers and Grants 39 095 48 610 48 610
National Government: 8 095 8 310 8 310 Municipal Infrastructure Grant (MIG)30 000 40 300 40 300 Regional Bulk Infrastructure 1 000 – – Integrated National Electrification Programme
Other capital transfers/grants [insert desc]– – – Other capital transfers/grants [insert description]– – – 0 – – –
Total capital expenditure of Transfers and Grants39 095 48 610 48 610 TOTAL EXPENDITURE OF TRANSFERS AND GRANTS52 596 61 701 63 516
March 2017 #REF!
This measure has a similar objective to aforementioned objective relating to repairs and maintenance. A requirement of the detailed capital budget
2017/18 Medium Term Revenue &
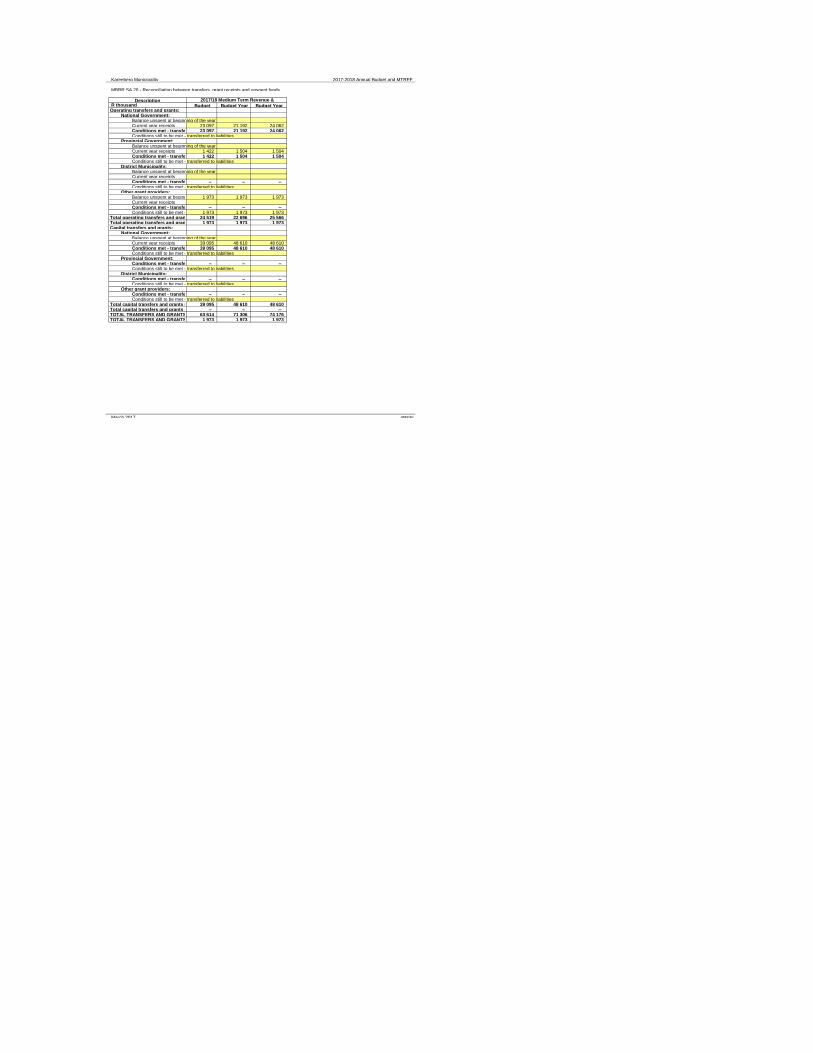
Kareeberg Municipality 2017-2018 Annual Budget and MTREF
MBRR SA 20 - Reconciliation between transfers, grant receipts and unspent funds
DescriptionR thousand Budget Budget Year Budget Year Operating transfers and grants:
National Government:Balance unspent at beginning of the yearCurrent year receipts 23 097 21 192 24 062 Conditions met - transferred to revenue23 097 21 192 24 062 Conditions still to be met - transferred to liabilities
Provincial Government:Balance unspent at beginning of the yearCurrent year receipts 1 422 1 504 1 504 Conditions met - transferred to revenue1 422 1 504 1 504 Conditions still to be met - transferred to liabilities
District Municipality:Balance unspent at beginning of the yearCurrent year receiptsConditions met - transferred to revenue– – – Conditions still to be met - transferred to liabilities
Other grant providers:Balance unspent at beginning of the year1 973 1 973 1 973 Current year receiptsConditions met - transferred to revenue– – – Conditions still to be met - transferred to liabilities1 973 1 973 1 973
Total operating transfers and grants revenue24 519 22 696 25 566 Total operating transfers and grants - CTBM1 973 1 973 1 973 Capital transfers and grants:
National Government:Balance unspent at beginning of the yearCurrent year receipts 39 095 48 610 48 610 Conditions met - transferred to revenue39 095 48 610 48 610 Conditions still to be met - transferred to liabilities
Provincial Government:Conditions met - transferred to revenue– – – Conditions still to be met - transferred to liabilities
District Municipality:Conditions met - transferred to revenue– – – Conditions still to be met - transferred to liabilities
Other grant providers:Conditions met - transferred to revenue– – – Conditions still to be met - transferred to liabilities
Total capital transfers and grants revenue39 095 48 610 48 610 Total capital transfers and grants - CTBM – – – TOTAL TRANSFERS AND GRANTS REVENUE63 614 71 306 74 176 TOTAL TRANSFERS AND GRANTS - CTBM1 973 1 973 1 973
March 2017 #REF!
2017/18 Medium Term Revenue &
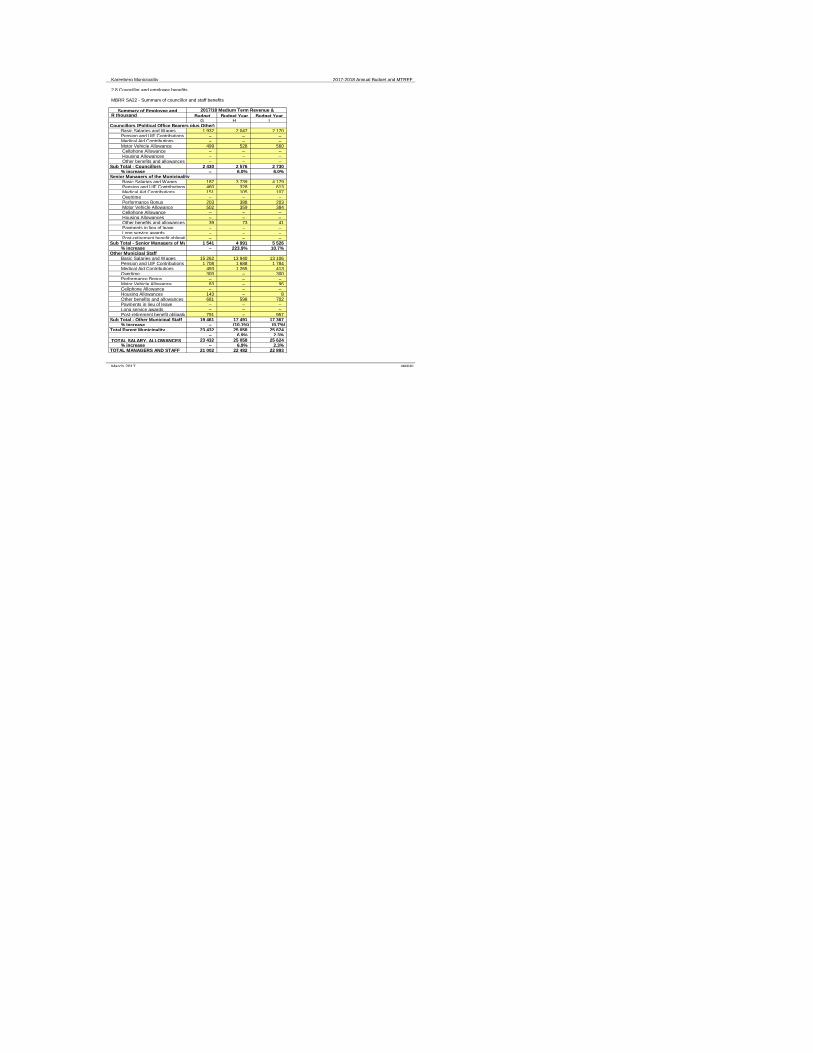
Kareeberg Municipality 2017-2018 Annual Budget and MTREF
2.8 Councillor and employee benefits
MBRR SA22 - Summary of councillor and staff benefits
Summary of Employee and R thousand Budget Budget Year Budget Year
G H ICouncillors (Political Office Bearers plus Other)
Basic Salaries and Wages 1 932 2 047 2 170 Pension and UIF Contributions – – – Medical Aid Contributions – – – Motor Vehicle Allowance 499 528 560 Cellphone Allowance – – – Housing Allowances – – – Other benefits and allowances – – –
Sub Total - Councillors 2 430 2 576 2 730 % increase – 6.0% 6.0%
Senior Managers of the MunicipalityBasic Salaries and Wages 187 3 739 4 179 Pension and UIF Contributions 460 328 613 Medical Aid Contributions 151 105 107 Overtime – – – Performance Bonus 203 388 203 Motor Vehicle Allowance 502 359 384 Cellphone Allowance – – – Housing Allowances – – – Other benefits and allowances 39 73 41 Payments in lieu of leave – – – Long service awards – – – Post-retirement benefit obligations – – –
Sub Total - Senior Managers of Municipality1 541 4 991 5 526 % increase – 223.9% 10.7%
Other Municipal StaffBasic Salaries and Wages 15 262 13 940 13 106 Pension and UIF Contributions 1 708 1 688 1 784 Medical Aid Contributions 493 1 265 413 Overtime 300 – 300 Performance Bonus – – – Motor Vehicle Allowance 83 – 96 Cellphone Allowance – – – Housing Allowances 143 – 8 Other benefits and allowances 681 598 702 Payments in lieu of leave – – – Long service awards – – – Post-retirement benefit obligations 791 – 957
Sub Total - Other Municipal Staff 19 461 17 491 17 367 % increase – (10.1%) (0.7%)
Total Parent Municipality 23 432 25 058 25 624 – 6.9% 2.3%
TOTAL SALARY, ALLOWANCES 23 432 25 058 25 624 % increase – 6.9% 2.3%
TOTAL MANAGERS AND STAFF 21 002 22 482 22 893
March 2017 #REF!
2017/18 Medium Term Revenue &

Kareeberg Municipality 2017-2018 Annual Budget and MTREF
MBRR SA23 - Salaries, allowances and benefits (political office bearers/councillors/ senior managers)
Disclosure of Salaries, Contributions In- Total Rand per annum 1. 2. Councillors
Speaker 1 752 351 – ##### 1 077 975 Chief Whip 1 – – – – Executive Mayor 1 – – – – Deputy Executive Mayor – – – – Executive Committee 2 – – – – Total for all other councillors 10 1 179 229 – ##### 1 512 846
Total Councillors 15 1 931 580 – ##### 2 590 821 Senior Managers of the Municipality
Municipal Manager (MM) 1 1 104 528 11 577 – 64 689 1 180 794 Chief Finance Officer 1 703 840 225 992 ##### 43 567 1 140 574 Chief Operational Manager 1 738 026 233 812 ##### 50 720 1 189 733 Head: Corporate Services 1 703 840 178 926 ##### 43 567 1 093 508
Total Senior Managers of the Municipality 4 3 250 234 650 307 ##### 202 543 4 604 609
TOTAL COST OF COUNCILLOR, 19 5 181 814 650 307 ##### 202 543 7 195 430
March 2017 #REF!
No. Salary
Allowa
Performan

Kareeberg Municipality 2017-2018 Annual Budget and MTREF
MBRR SA24 – Summary of personnel numbers
Summary of Personnel NumbersNumber Positions Permanent Contract Positions Municipal Council and Boards of Municipal Entities
Councillors (Political Office Bearers plus Other Councillors)7 7 – 7 7 – 7 7 – Board Members of municipal entities – – – – – – – – –
Municipal employees – – – – – – – – – Municipal Manager and Senior Managers 4 3 1 4 3 1 4 3 1 Other Managers 3 3 – 3 3 – 3 3 – Professionals – – – – – – – – –
Finance – – – – – – – – – Spatial/town planning – – – – – – – – – Information Technology – – – – – – – – – Roads – – – – – – – – – Electricity – – – – – – – – – Water – – – – – – – – – Sanitation – – – – – – – – – Refuse – – – – – – – – – Other – – – – – – – – –
Technicians 17 17 – 17 17 – 17 17 – Finance – – – – – – – – – Spatial/town planning – – – – – – – – – Information Technology – – – – – – – – – Roads – – – – – – – – – Electricity – – – – – – – – – Water – – – – – – – – – Sanitation – – – – – – – – – Refuse – – – – – – – – – Other 17 17 – 17 17 – 17 17 –
Clerks (Clerical and administrative) 15 15 – 15 15 – 15 15 – Service and sales workers – – – – – – – – – Skilled agricultural and fishery workers – – – – – – – – – Craft and related trades – – – – – – – – – Plant and Machine Operators 9 9 – 15 15 – 15 15 – Elementary Occupations 42 42 – 31 31 – 31 31 –
TOTAL PERSONNEL NUMBERS 97 96 1 92 91 1 92 91 1 % increase (5.2%) (5.2%) – – – –
Total municipal employees headcount 68 67 1 61 60 1 63 62 1 Finance personnel headcount 9 9 – 11 11 – 9 9 – Human Resources personnel headcount 3 3 – 3 3 – 3 3 –
March 2017 #REF!
2015/16 Current Year 2016/17 Budget Year 2017/18
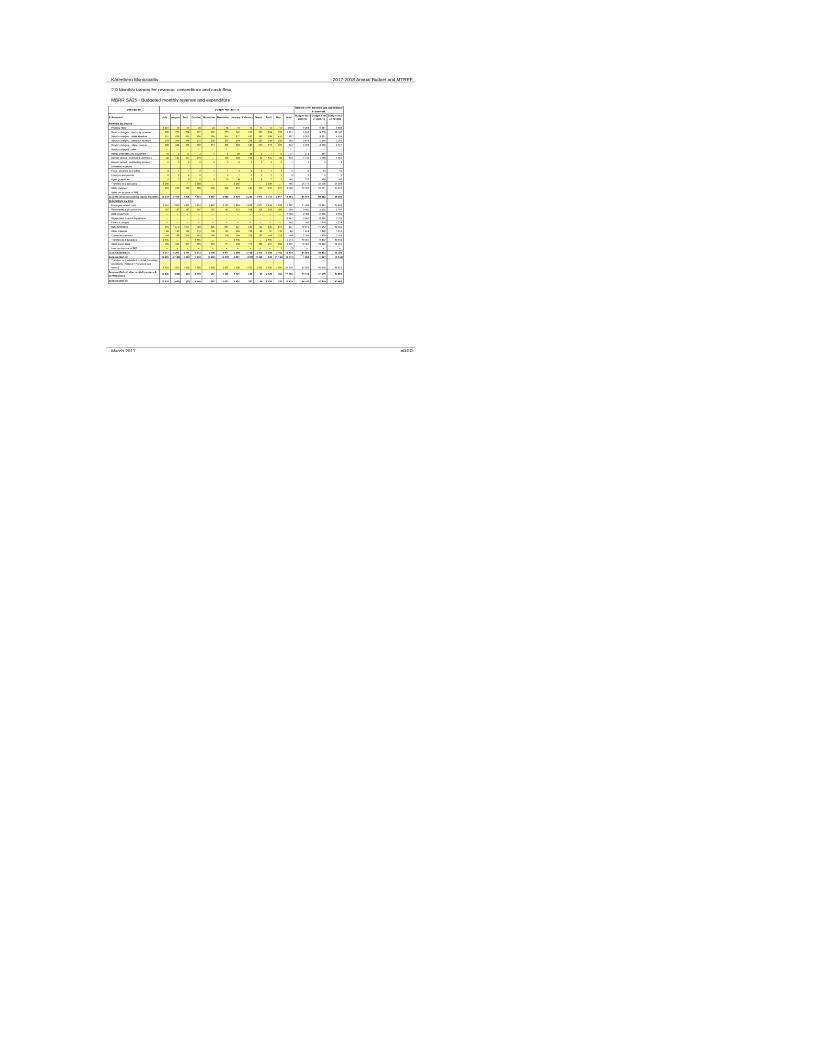
Kareeberg Municipality 2017-2018 Annual Budget and MTREF
2.9 Monthly targets for revenue, expenditure and cash flow
MBRR SA25 - Budgeted monthly revenue and expenditure
March 2017 #REF!
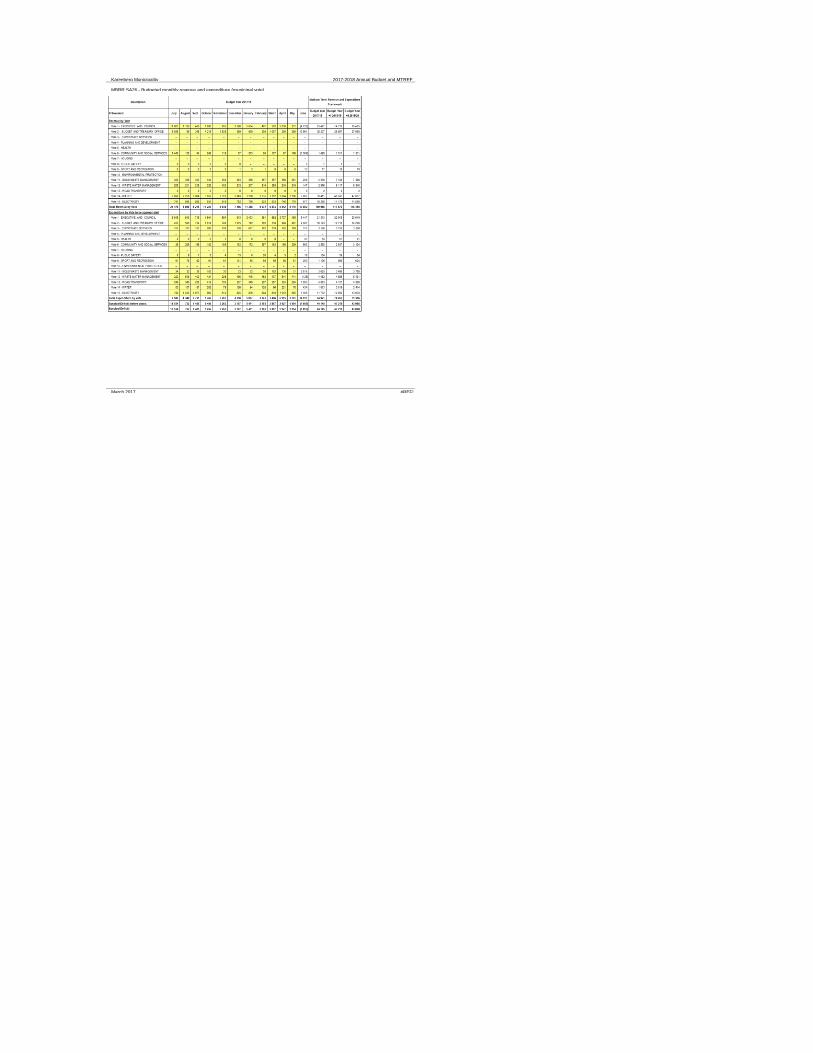
Kareeberg Municipality 2017-2018 Annual Budget and MTREF
MBRR SA26 - Budgeted monthly revenue and expenditure (municipal vote)
March 2017 #REF!

Kareeberg Municipality 2017-2018 Annual Budget and MTREF
MBRR SA27 - Budgeted monthly revenue and expenditure (standard classification)
MBRR SA28 - Budgeted monthly capital expenditure (municipal vote)

MBRR SA29 - Budgeted monthly capital expenditure (standard classification)
March 2017 #REF!
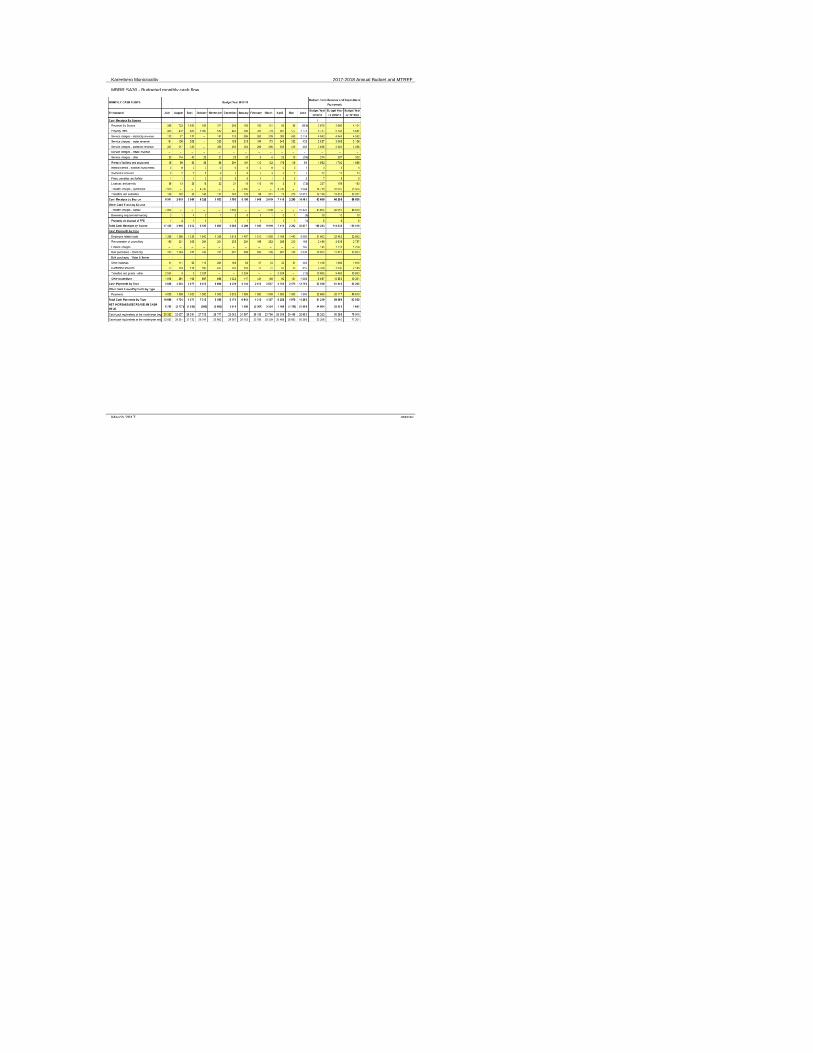
Kareeberg Municipality 2017-2018 Annual Budget and MTREF
MBRR SA30 - Budgeted monthly cash flow
March 2017 #REF!
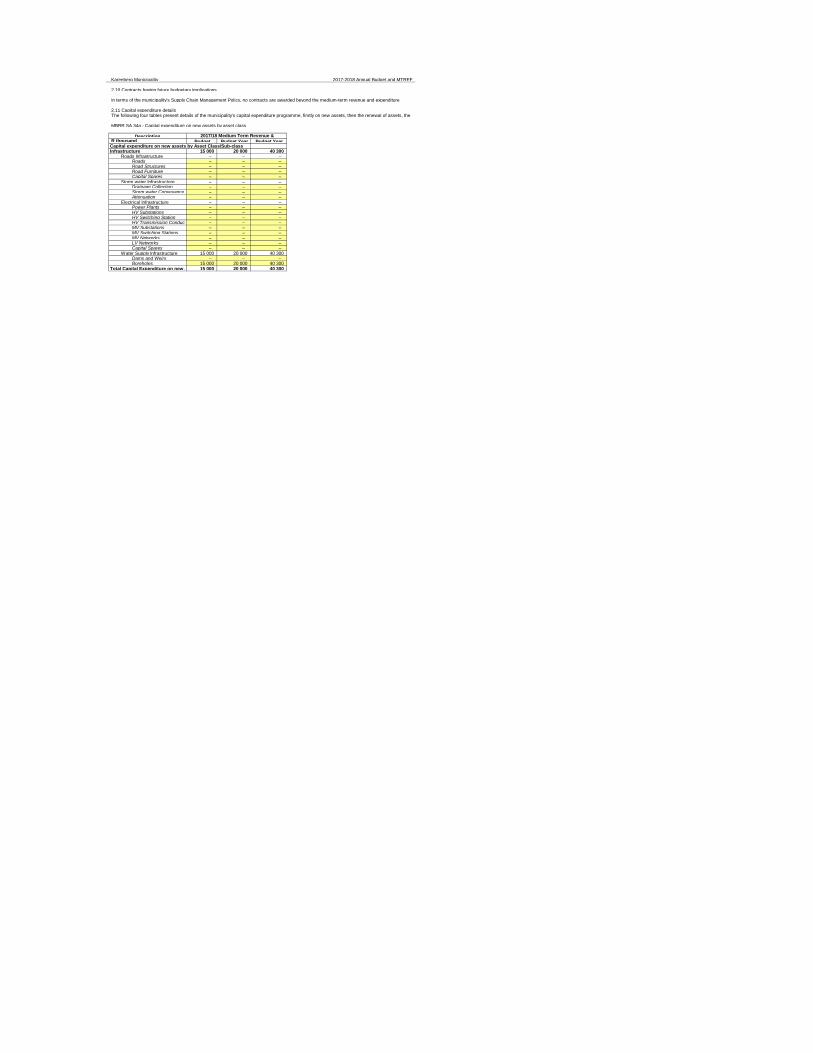
Kareeberg Municipality 2017-2018 Annual Budget and MTREF
2.10 Contracts having future budgetary implications
2.11 Capital expenditure details
MBRR SA 34a - Capital expenditure on new assets by asset class
DescriptionR thousand Budget Budget Year Budget Year Capital expenditure on new assets by Asset Class/Sub-classInfrastructure 15 000 20 000 40 300
Roads Infrastructure – – – Roads – – – Road Structures – – – Road Furniture – – – Capital Spares – – –
Storm water Infrastructure – – – Drainage Collection – – – Storm water Conveyance – – – Attenuation – – –
Electrical Infrastructure – – – Power Plants – – – HV Substations – – – HV Switching Station – – – HV Transmission Conductors – – – MV Substations – – – MV Switching Stations – – – MV Networks – – – LV Networks – – – Capital Spares – – –
Water Supply Infrastructure 15 000 20 000 40 300 Dams and Weirs – – – Boreholes 15 000 20 000 40 300
Total Capital Expenditure on new assets 15 000 20 000 40 300
In terms of the municipality's Supply Chain Management Policy, no contracts are awarded beyond the medium-term revenue and expenditure
The following four tables present details of the municipality's capital expenditure programme, firstly on new assets, then the renewal of assets, the
2017/18 Medium Term Revenue &

MBRR SA 34b - Capital expenditure on new assets by asset class
DescriptionR thousand Budget Budget Year Budget Year Capital expenditure on renewal of existing assets by Asset Class/Sub-classInfrastructure 7 427 6 617 8 310
Roads Infrastructure 4 150 3 000 2 344 Roads 4 150 3 000 2 344
Storm water Infrastructure – – – Electrical Infrastructure 1 000 – 400
HV Transmission Conductors 1 000 – 400 Water Supply Infrastructure – – 1 000
Distribution – – 1 000 Sanitation Infrastructure 2 277 3 617 66
Pump Station – – – Reticulation 2 277 3 617 66
Solid Waste Infrastructure – – 4 500 Capital Spares – – 4 500
Community Assets 1 242 1 500 – Community Facilities – – – Sport and Recreation Facilities 1 242 1 500 –
Indoor Facilities – – – Outdoor Facilities 1 242 1 500 – Capital Spares – – –
Heritage assets – – – Investment properties – – –
Revenue Generating – – – Improved Property – – – Unimproved Property – – –
Non-revenue Generating – – – Improved Property – – – Unimproved Property – – –
Other assets – – – Housing – – –
Biological or Cultivated Assets – – – Intangible Assets – – – Computer Equipment – – – Furniture and Office Equipment – – – Machinery and Equipment – – – Transport Assets – – – Libraries – – – Zoo's, Marine and Non-biological Animals – – – Total Capital Expenditure on renewal of existing assets 8 669 8 117 8 310
2017/18 Medium Term Revenue &
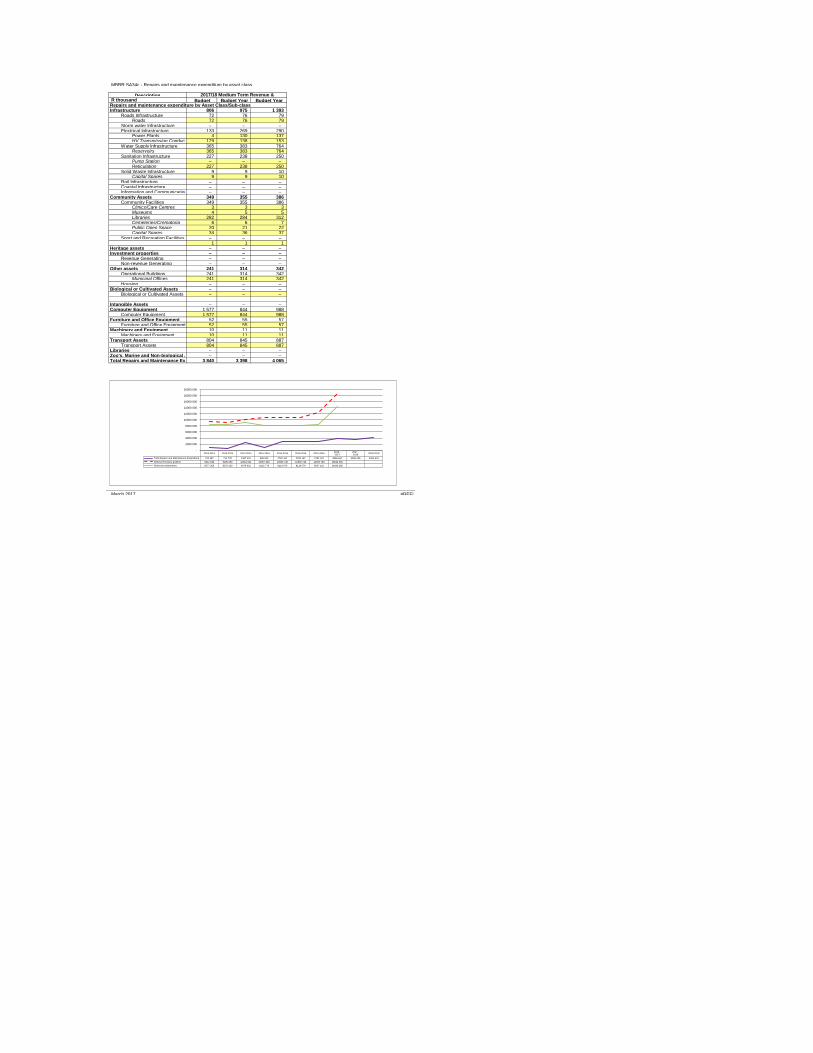
MBRR SA34c - Repairs and maintenance expenditure by asset class
DescriptionR thousand Budget Budget Year Budget Year Repairs and maintenance expenditure by Asset Class/Sub-classInfrastructure 806 975 1 393
Roads Infrastructure 72 76 79 Roads 72 76 79
Storm water Infrastructure – – – Electrical Infrastructure 133 269 290
Power Plants 4 130 137 HV Transmission Conductors 129 138 153
Water Supply Infrastructure 365 383 764 Reservoirs 365 383 764
Sanitation Infrastructure 227 238 250 Pump Station – – – Reticulation 227 238 250
Solid Waste Infrastructure 9 9 10 Capital Spares 9 9 10
Rail Infrastructure – – – Coastal Infrastructure – – – Information and Communication Infrastructure– – –
Community Assets 349 355 386 Community Facilities 349 355 386
Clinics/Care Centres 3 3 3 Museums 4 5 5 Libraries 282 284 312 Cemeteries/Crematoria 6 6 7 Public Open Space 20 21 22 Capital Spares 34 36 37
Sport and Recreation Facilities – – – 1 1 1
Heritage assets – – – Investment properties – – –
Revenue Generating – – – Non-revenue Generating – – –
Other assets 241 314 342 Operational Buildings 241 314 342
Municipal Offices 241 314 342 Housing – – –
Biological or Cultivated Assets – – – Biological or Cultivated Assets – – –
Intangible Assets – – – Computer Equipment 1 577 844 988
Computer Equipment 1 577 844 988 Furniture and Office Equipment 52 55 57
Furniture and Office Equipment 52 55 57 Machinery and Equipment 10 11 11
Machinery and Equipment 10 11 11 Transport Assets 804 845 887
Transport Assets 804 845 887 Libraries – – – Zoo's, Marine and Non-biological Animals – – – Total Repairs and Maintenance Expenditure3 840 3 398 4 065
March 2017 #REF!
2017/18 Medium Term Revenue &
2013-2014 2013-2014 2014-2015 2015-2016 2015-2016 2015-2016 2015-20162016 -2017
2017 -2018
2018-2019
Total Repairs and Maintenance Expenditure 734 387 714 779 2487 415 985 000 2792 167 2792 167 2792 167 3959 667 3398 435 4064 624
National Treasury guidline 9311 596 9285 099 10061 001 10907 946 10906 746 10906 746 12506 783 18644 906
Deferred maintenance 8577 209 8570 320 9076 001 8115 779 8114 579 8114 579 8547 116 14580 282
-
2000 000
4000 000
6000 000
8000 000
10000 000
12000 000
14000 000
16000 000
18000 000
20000 000
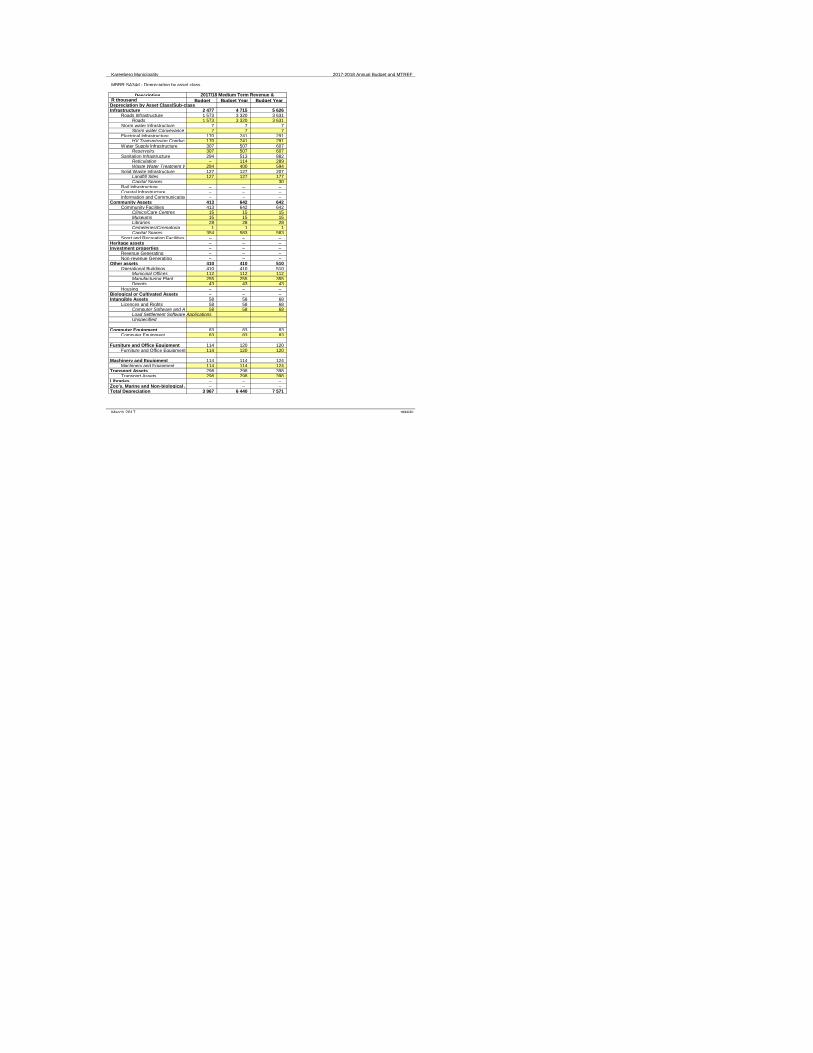
Kareeberg Municipality 2017-2018 Annual Budget and MTREF
MBRR SA34d - Depreciation by asset class
DescriptionR thousand Budget Budget Year Budget Year Depreciation by Asset Class/Sub-classInfrastructure 2 477 4 715 5 626
Roads Infrastructure 1 573 3 320 3 631 Roads 1 573 3 320 3 631
Storm water Infrastructure 7 7 7 Storm water Conveyance 7 7 7
Electrical Infrastructure 170 241 291 HV Transmission Conductors 170 241 291
Water Supply Infrastructure 307 507 607 Reservoirs 307 507 607
Sanitation Infrastructure 294 513 882 Reticulation – 114 289 Waste Water Treatment Works 294 400 594
Solid Waste Infrastructure 127 127 207 Landfill Sites 127 127 177 Capital Spares 30
Rail Infrastructure – – – Coastal Infrastructure – – – Information and Communication Infrastructure– – –
Community Assets 413 642 642 Community Facilities 413 642 642
Clinics/Care Centres 15 15 15 Museums 15 15 15 Libraries 28 28 28 Cemeteries/Crematoria 1 1 1 Capital Spares 354 583 583
Sport and Recreation Facilities – – – Heritage assets – – – Investment properties – – –
Revenue Generating – – – Non-revenue Generating – – –
Other assets 410 410 510 Operational Buildings 410 410 510
Municipal Offices 112 112 112 Manufacturing Plant 255 255 355 Depots 43 43 43
Housing – – – Biological or Cultivated Assets – – – Intangible Assets 58 58 68
Licences and Rights 58 58 68 Computer Software and Applications 58 58 68 Load Settlement Software ApplicationsUnspecified
Computer Equipment 83 83 83 Computer Equipment 83 83 83
Furniture and Office Equipment 114 120 120 Furniture and Office Equipment 114 120 120
Machinery and Equipment 114 114 124 Machinery and Equipment 114 114 124
Transport Assets 298 298 398 Transport Assets 298 298 398
Libraries – – – Zoo's, Marine and Non-biological Animals – – – Total Depreciation 3 967 6 440 7 571
March 2017 #REF!
2017/18 Medium Term Revenue &
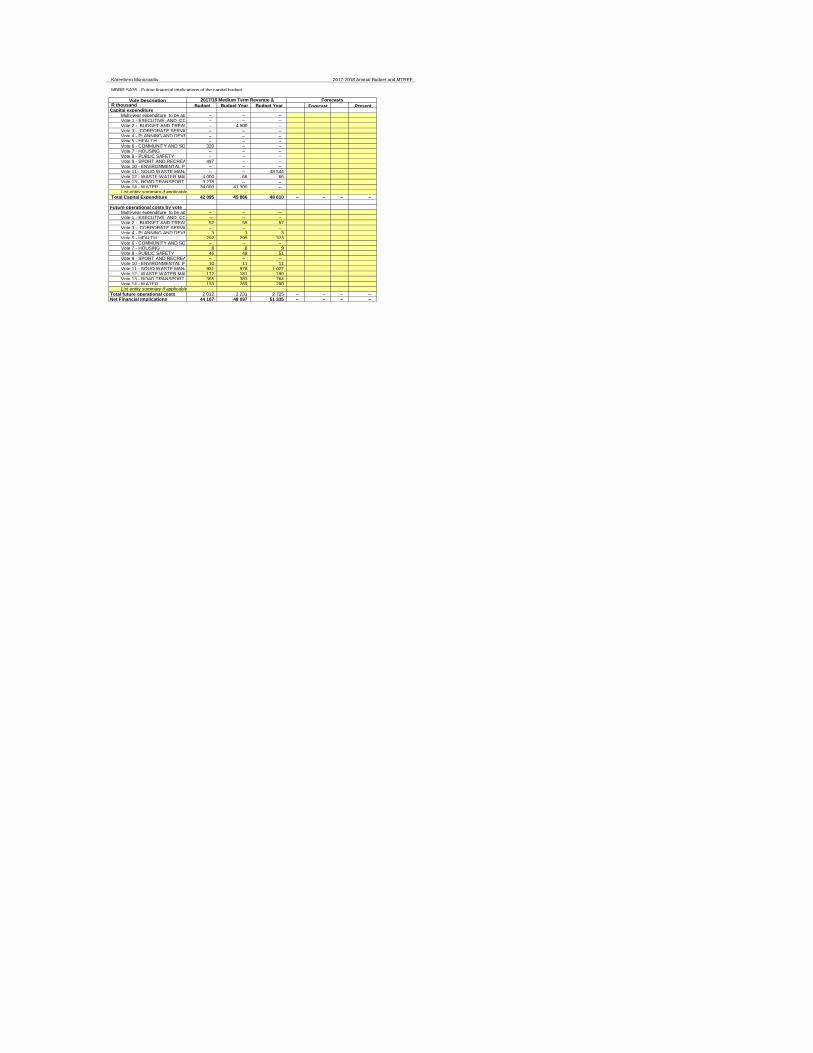
Kareeberg Municipality 2017-2018 Annual Budget and MTREF
MBRR SA35 - Future financial implications of the capital budget
Vote DescriptionR thousand Budget Budget Year Budget Year Forecast Present Capital expenditure
Multi-year expenditure to be appropriated – – – Vote 1 - EXECUTIVE AND COUNCIL – – – Vote 2 - BUDGET AND TREASURY OFFICE– 4 500 – Vote 3 - CORPORATE SERVICES – – – Vote 4 - PLANNING AND DEVELOPMENT– – – Vote 5 - HEALTH – – – Vote 6 - COMMUNITY AND SOCIAL SERVICES320 – – Vote 7 - HOUSING – – – Vote 8 - PUBLIC SAFETY – – – Vote 9 - SPORT AND RECREATION 497 – – Vote 10 - ENVIRONMENTAL PROTECTION– – – Vote 11 - SOLID WASTE MANAGEMENT – – 48 544 Vote 12 - WASTE WATER MANAGEMENT4 000 66 66 Vote 13 - ROAD TRANSPORT 3 278 – – Vote 14 - WATER 34 000 41 300 – List entity summary if applicable
Total Capital Expenditure 42 095 45 866 48 610 – – – –
Future operational costs by voteMulti-year expenditure to be appropriated – – – Vote 1 - EXECUTIVE AND COUNCIL – – – Vote 2 - BUDGET AND TREASURY OFFICE52 55 57 Vote 3 - CORPORATE SERVICES – – – Vote 4 - PLANNING AND DEVELOPMENT 3 3 3 Vote 5 - HEALTH 292 295 323 Vote 6 - COMMUNITY AND SOCIAL SERVICES– – – Vote 7 - HOUSING 8 8 9 Vote 8 - PUBLIC SAFETY 46 48 51 Vote 9 - SPORT AND RECREATION – – – Vote 10 - ENVIRONMENTAL PROTECTION10 11 11 Vote 11 - SOLID WASTE MANAGEMENT931 978 1 027 Vote 12 - WASTE WATER MANAGEMENT172 181 190 Vote 13 - ROAD TRANSPORT 365 383 764 Vote 14 - WATER 133 269 290 List entity summary if applicable
Total future operational costs 2 012 2 231 2 725 – – – – Net Financial Implications 44 107 48 097 51 335 – – – –
2017/18 Medium Term Revenue & Forecasts
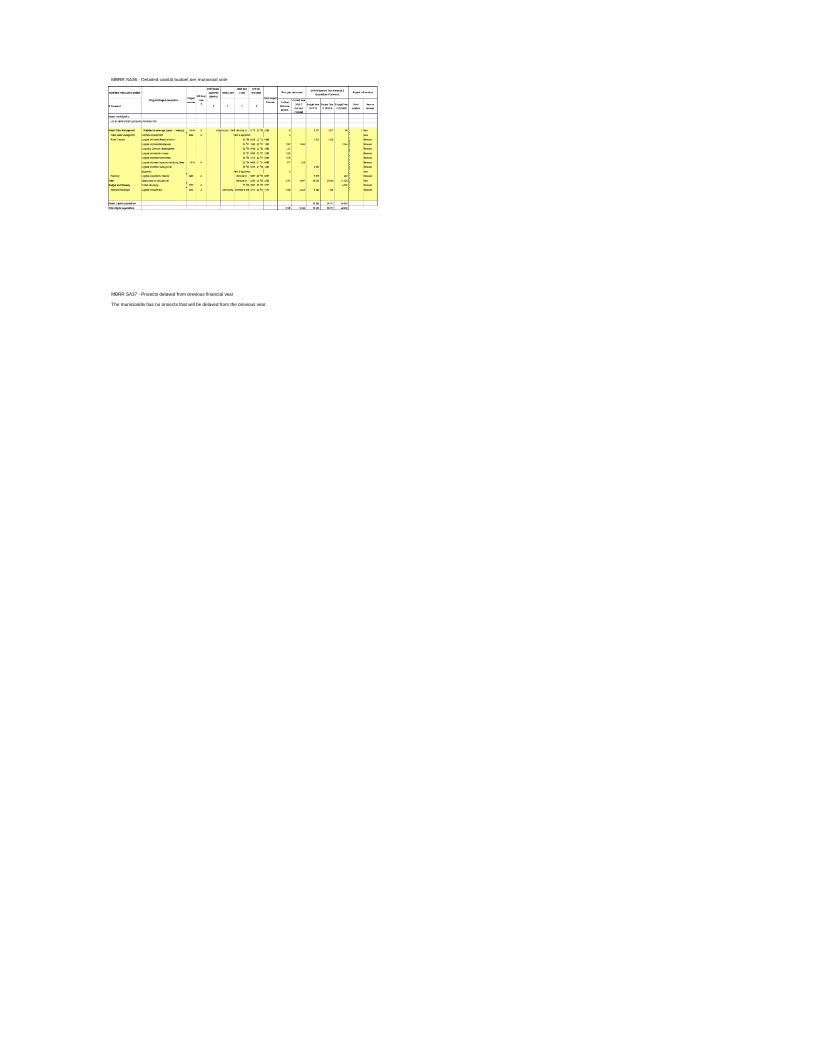
MBRR SA36 - Detailed capital budget per municipal vote
MBRR SA37 - Projects delayed from previous financial year
The municipality has no projects that will be delayed from the previous year.
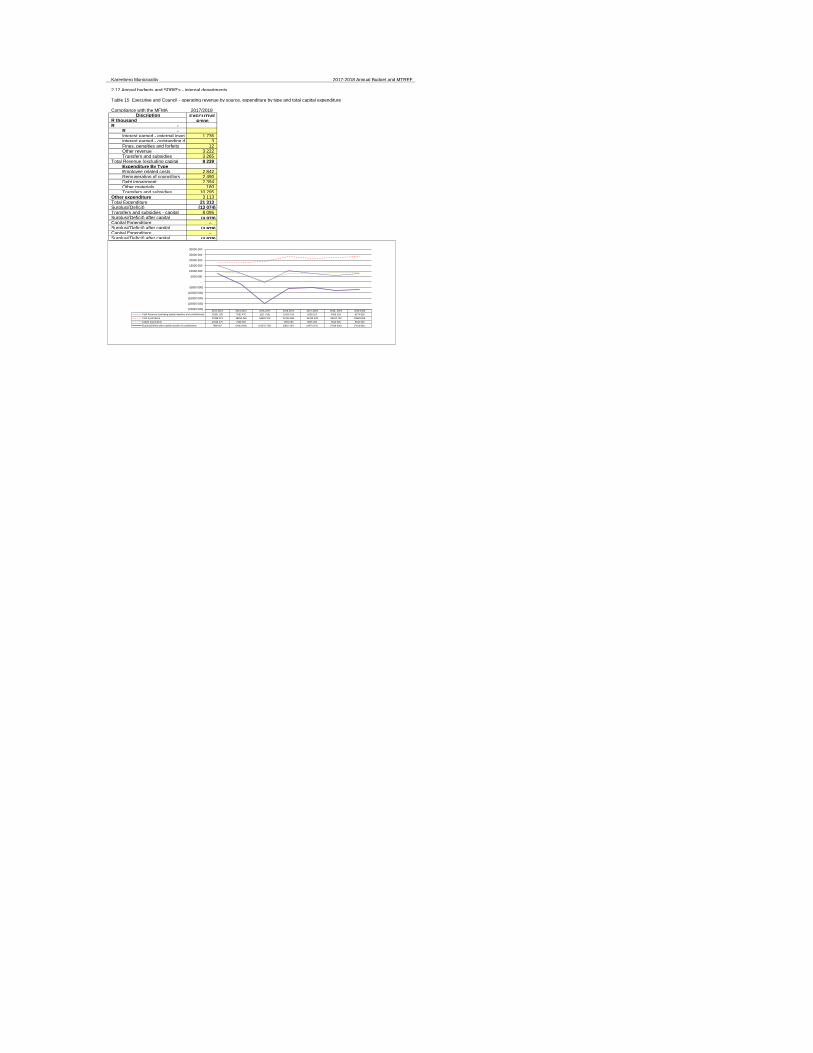
Kareeberg Municipality 2017-2018 Annual Budget and MTREF
2.12 Annual budgets and SDBIP's - internal departments
Compliance with the MFMA 2017/2018Discription EXECUTIVE
R thousand R'000 -R -R
Interest earned - external investments 1 736 Interest earned - outstanding debtors 3 Fines, penalties and forfeits 12 Other revenue 3 222 Transfers and subsidies 3 265
Total Revenue (excluding capital 8 239 Expenditure By TypeEmployee related costs 2 842 Remuneration of councillors 2 490 Debt impairment 2 394 Other materials 180 Transfers and subsidies 10 295
Other expenditure 3 113 Total Expenditure 21 313 Surplus/(Deficit) (13 074) Transfers and subsidies - capital 8 095 Surplus/(Deficit) after capital (4 979) Capital Expenditure – Surplus/(Deficit) after capital (4 979) Capital Expenditure – Surplus/(Deficit) after capital (4 979)
Table 15 Executive and Council - operating revenue by source, expenditure by type and total capital expenditure
2012-2013 2013-2014 2016-2017 2016-2017 2017-2018 2018- 2019 2019-2020
Total Revenue (excluding capital transfers and contributions) 15361 155 7662 470 (811 419) 10415 419 8238 812 6406 164 8174 828
Total Expenditure 17898 373 18234 463 18559 373 23746 586 21313 133 22544 710 23648 659
Capital expenditure 10026 175 7928 000 - 7669 000 8095 000 8310 000 8310 000
Surplus/(Deficit) after capital transfers & contributions 7488 957 (2643 993) (19370 792) (5662 167) (4979 321) (7828 546) (7163 831)
(25000 000)
(20000 000)
(15000 000)
(10000 000)
(5000 000)
-
5000 000
10000 000
15000 000
20000 000
25000 000
30000 000
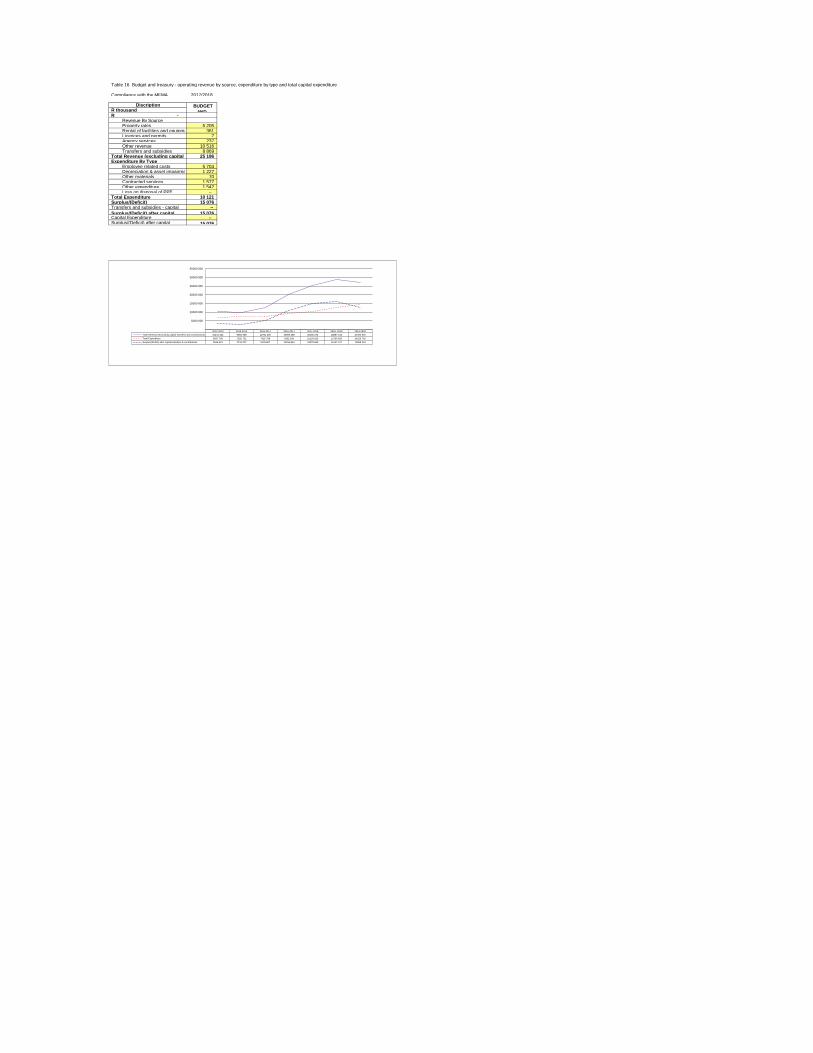
Compliance with the MFMA 2017/2018
DiscriptionR thousand
-R Revenue By SourceProperty rates 5 205 Rental of facilities and equipment 361 Licences and permits 7 Agency services 237 Other revenue 10 516 Transfers and subsidies 8 869
Total Revenue (excluding capital transfers and contributions)25 196 Expenditure By Type
Employee related costs 5 704 Depreciation & asset impairment 1 227 Other materials 70 Contracted services 1 577 Other expenditure 1 542 Loss on disposal of PPE –
Total Expenditure 10 121 Surplus/(Deficit) 15 076 Transfers and subsidies - capital –
Surplus/(Deficit) after capital 15 076 Capital Expenditure – Surplus/(Deficit) after capital 15 076
BUDGET
AND
Table 16 Budget and treasury - operating revenue by source, expenditure by type and total capital expenditure
2012-2013 2013-2014 2016-2017 2016-2017 2017-2018 2018- 2019 2019-2020
Total Revenue (excluding capital transfers and contributions) 10244 322 9984 958 12751 605 19959 258 25196 273 28857 343 27094 976
Total Expenditure 6697 709 7265 731 7625 798 9192 394 10120 623 12709 926 14225 742
Surplus/(Deficit) after capital transfers & contributions 3546 613 2719 227 5125 807 10766 864 15075 650 16147 417 12869 234
-
5000 000
10000 000
15000 000
20000 000
25000 000
30000 000
35000 000
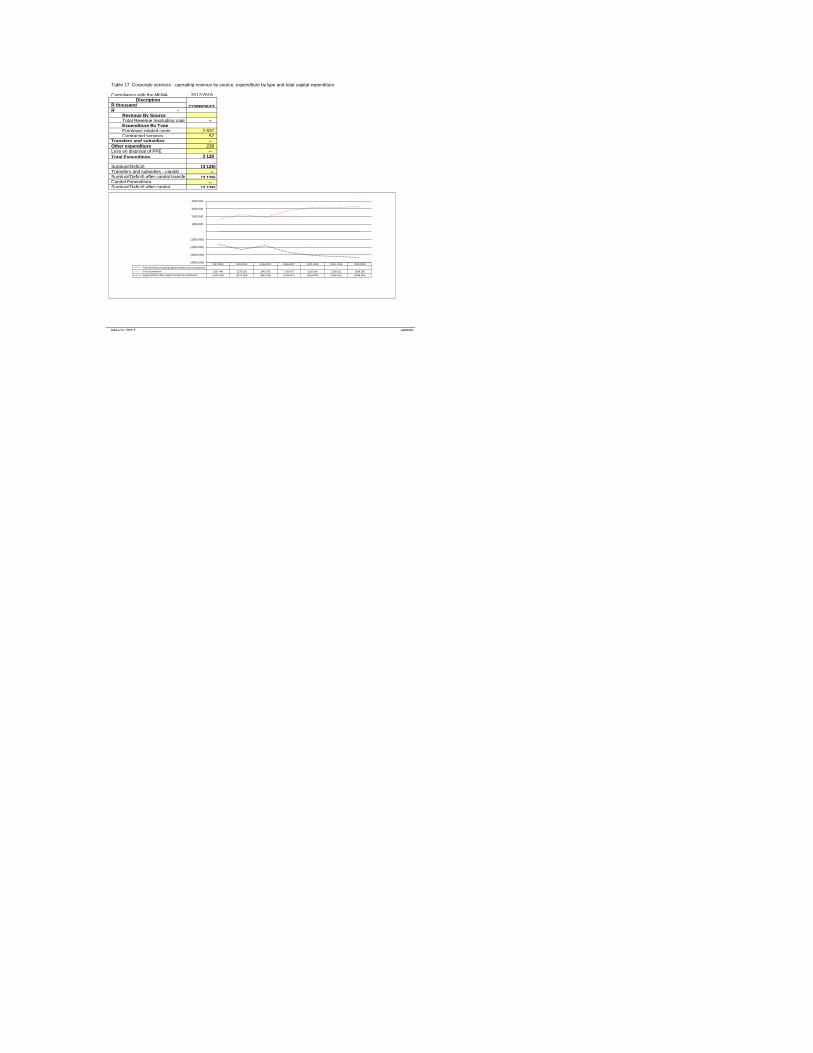
Compliance with the MFMA 2017/2018Discription
R thousand-R
Revenue By SourceTotal Revenue (excluding capital transfers and contributions)– Expenditure By TypeEmployee related costs 2 837 Contracted services 52
Transfers and subsidies – Other expenditure 238 Loss on disposal of PPE –
Total Expenditure 3 126
Surplus/(Deficit) (3 126) Transfers and subsidies - capital – Surplus/(Deficit) after capital transfers & contributions(3 126) Capital Expenditure – Surplus/(Deficit) after capital (3 126)
March 2017 #REF!
CORPORAT
Table 17 Corporate services - operating revenue by source, expenditure by type and total capital expenditure
2012-2013 2013-2014 2016-2017 2016-2017 2017-2018 2018- 2019 2019-2020
Total Revenue (excluding capital transfers and contributions) - - - - - - -
Total Expenditure 1657 440 2276 118 1841 242 2736 507 3126 099 3158 161 3368 266
Surplus/(Deficit) after capital transfers & contributions (1657 440) (2276 118) (1841 242) (2736 507) (3126 099) (3158 161) (3368 266)
(4000 000)
(3000 000)
(2000 000)
(1000 000)
-
1000 000
2000 000
3000 000
4000 000
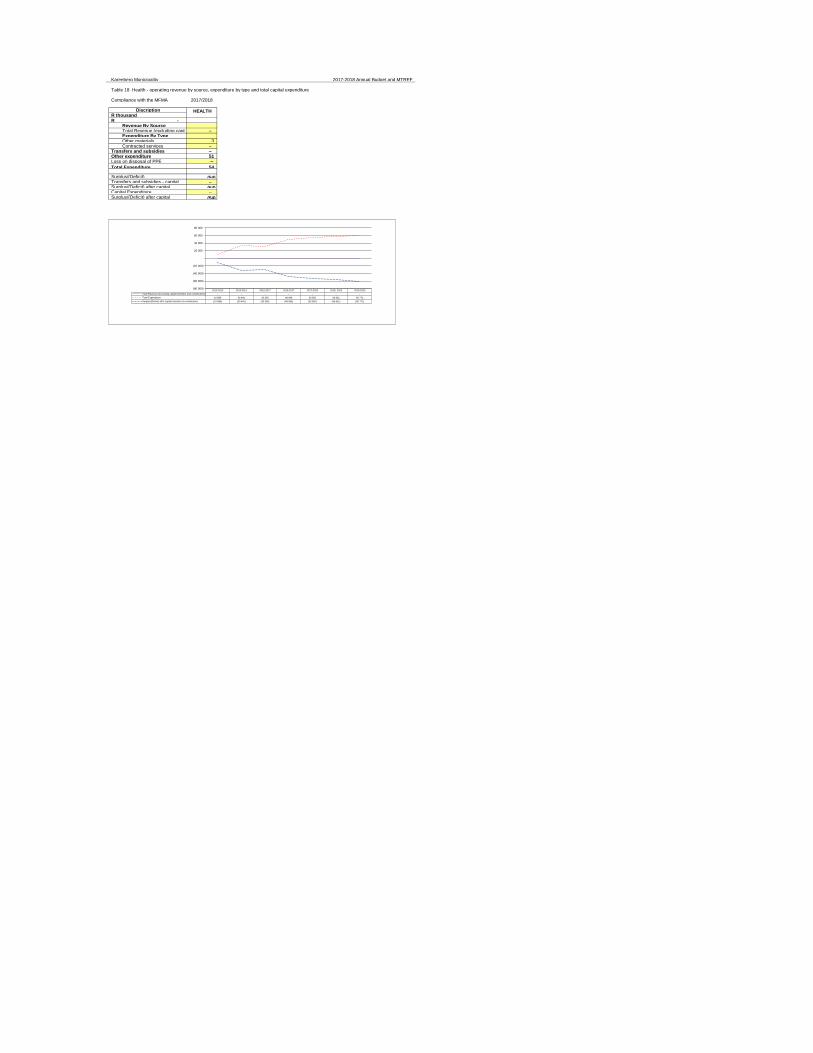
Kareeberg Municipality 2017-2018 Annual Budget and MTREF
Compliance with the MFMA 2017/2018
DiscriptionR thousand
-R Revenue By SourceTotal Revenue (excluding capital transfers and contributions)– Expenditure By TypeOther materials 3 Contracted services –
Transfers and subsidies – Other expenditure 51 Loss on disposal of PPE –
Total Expenditure 54
Surplus/(Deficit) (54) Transfers and subsidies - capital – Surplus/(Deficit) after capital (54) Capital Expenditure – Surplus/(Deficit) after capital (54)
HEALTH
Table 18 Health - operating revenue by source, expenditure by type and total capital expenditure
2012-2013 2013-2014 2016-2017 2016-2017 2017-2018 2018- 2019 2019-2020
Total Revenue (excluding capital transfers and contributions) - - - - - - -
Total Expenditure 10 885 33 441 30 355 48 966 53 955 56 651 60 771
Surplus/(Deficit) after capital transfers & contributions (10 885) (33 441) (30 355) (48 966) (53 955) (56 651) (60 771)
(80 000)
(60 000)
(40 000)
(20 000)
-
20 000
40 000
60 000
80 000

Compliance with the MFMA 2017/2018
DiscriptionR thousand
-R Revenue By SourceRental of facilities and equipment 1 Fines, penalties and forfeits 0 Other revenue 1 422 Transfers and subsidies 6
Gains on disposal of PPE – Total Revenue (excluding 1 429 Expenditure By TypeEmployee related costs 1 568 Other materials 10 Contracted services 282
Transfers and subsidies – Other expenditure 678 Loss on disposal of PPE –
Total Expenditure 2 538
Surplus/(Deficit) (1 109) Transfers and subsidies - capital -R Surplus/(Deficit) after capital (1 109) Capital Expenditure (320) Surplus/(Deficit) after capital (1 429)
March 2017 #REF!
COMMUNIT
Table 19 Community services - operating revenue by source, expenditure by type and total capital expenditure
2012-2013 2013-2014 2016-2017 2016-2017 2017-2018 2018- 2019 2019-2020
Total Revenue (excluding capital transfers and contributions) 8 186 13 345 13 369 6 650 1428 650 1510 983 1511 332
Total Expenditure 974 837 1127 754 1063 244 1374 982 2538 032 2936 911 3103 791
Surplus/(Deficit) after capital transfers & contributions (966 651) (1114 409) (1049 875) (1368 332) (1109 382) (1425 928) (1592 459)
(2000 000)
(1000 000)
-
1000 000
2000 000
3000 000
4000 000
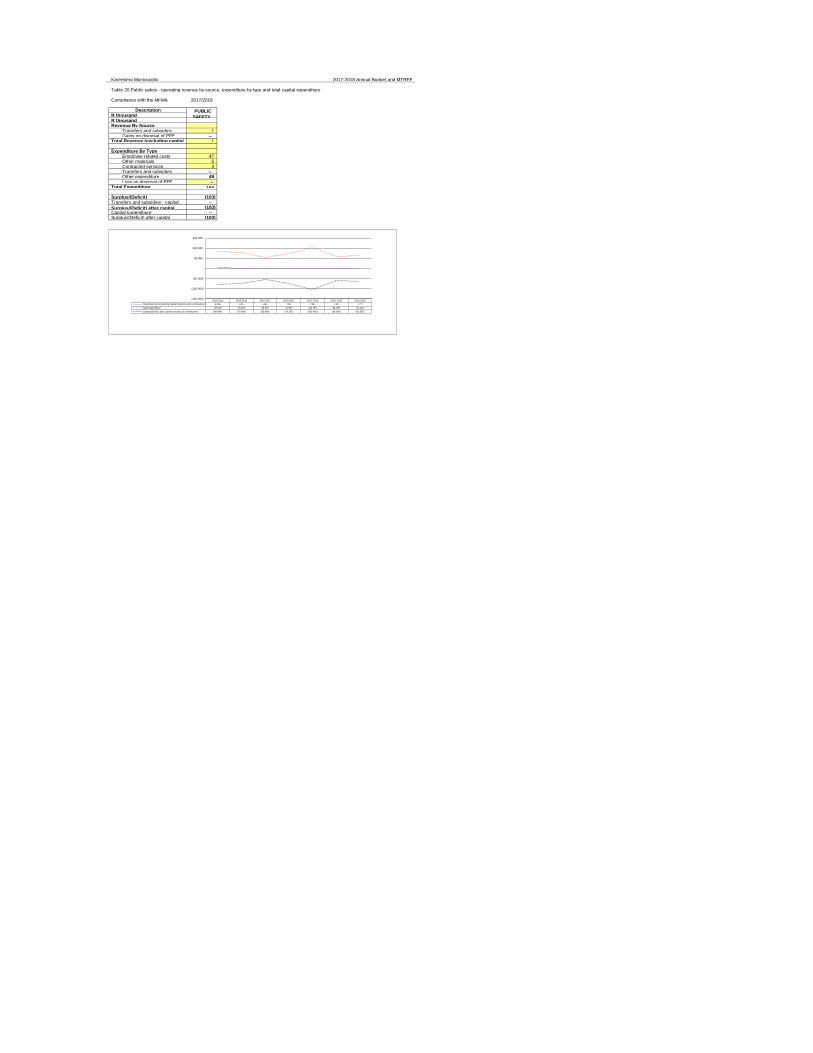
Kareeberg Municipality 2017-2018 Annual Budget and MTREF
Compliance with the MFMA 2017/2018
DescriptionR thousandR thousandRevenue By Source
Transfers and subsidies 1 Gains on disposal of PPE –
Total Revenue (excluding capital 1
Expenditure By TypeEmployee related costs 47 Other materials 5 Contracted services 3 Transfers and subsidies – Other expenditure 49 Loss on disposal of PPE –
Total Expenditure 104
Surplus/(Deficit) (103) Transfers and subsidies - capital –
Surplus/(Deficit) after capital (103) Capital Expenditure – Surplus/(Deficit) after capital (103)
PUBLIC
SAFETY
Table 20 Public safety - operating revenue by source, expenditure by type and total capital expenditure
2012-2013 2013-2014 2016-2017 2016-2017 2017-2018 2018- 2019 2019-2020
Total Revenue (excluding capital transfers and contributions) 4 015 675 620 705 705 740 777
Total Expenditure 84 919 76 667 56 576 74 942 104 197 58 746 64 164
Surplus/(Deficit) after capital transfers & contributions (80 904) (75 992) (55 956) (74 237) (103 492) (58 006) (63 387)
(150 000)
(100 000)
(50 000)
-
50 000
100 000
150 000
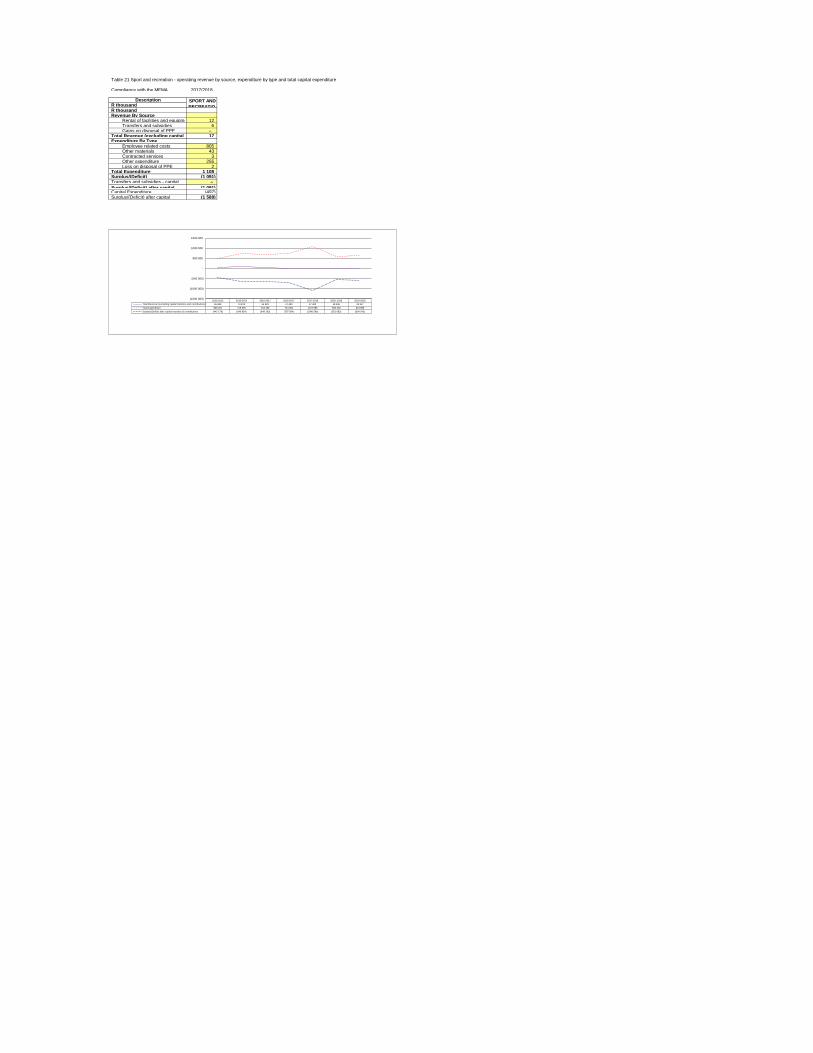
Compliance with the MFMA 2017/2018
DescriptionR thousandR thousandRevenue By Source
Rental of facilities and equipment 12 Transfers and subsidies 6 Gains on disposal of PPE –
Total Revenue (excluding capital 17 Expenditure By Type
Employee related costs 805 Other materials 43 Contracted services 3 Other expenditure 255 Loss on disposal of PPE 2
Total Expenditure 1 108 Surplus/(Deficit) (1 091) Transfers and subsidies - capital –
Surplus/(Deficit) after capital (1 091) Capital Expenditure (497) Surplus/(Deficit) after capital (1 588)
SPORT AND
RECREATIO
Table 21 Sport and recreation - operating revenue by source, expenditure by type and total capital expenditure
2012-2013 2013-2014 2016-2017 2016-2017 2017-2018 2018- 2019 2019-2020
Total Revenue (excluding capital transfers and contributions) 65 843 74 874 55 323 17 400 17 400 18 345 19 317
Total Expenditure 508 022 715 828 703 486 724 964 1107 986 569 428 623 559
Surplus/(Deficit) after capital transfers & contributions (442 179) (640 954) (648 163) (707 564) (1090 586) (551 083) (604 242)
(1500 000)
(1000 000)
(500 000)
-
500 000
1000 000
1500 000

Kareeberg Municipality 2017-2018 Annual Budget and MTREF
Compliance with the MFMA 2017/2018
DiscriptionR thousand
-R Revenue By Source
Service charges - refuse revenue 4 101 Other revenue 2 784 Transfers and subsidies 1
Total Revenue (excluding capital 6 886 Expenditure By Type
Employee related costs 2 889 Finance charges 145 Contracted services 10 Other expenditure 582
Total Expenditure 3 625 Surplus/(Deficit) 3 261 Transfers and subsidies - capital –
Surplus/(Deficit) after capital 3 261 Capital Expenditure – Surplus/(Deficit) after capital 3 261
SOLID
WASTE
Table 22 Solid waste management - operating revenue by source, expenditure by type and total capital expenditure
2012-2013 2013-2014 2016-2017 2016-2017 2017-2018 2018- 2019 2019-2020
Total Revenue (excluding capital transfers and contributions) 4992 711 5181 670 5601 372 6170 967 6886 024 7123 818 7296 330
Total Expenditure 2484 610 2605 903 2947 653 3449 785 3625 471 3496 144 3787 716
Surplus/(Deficit) after capital transfers & contributions 2508 101 2575 767 2653 719 2721 182 3260 553 3627 674 3508 614
-
1000 000
2000 000
3000 000
4000 000
5000 000
6000 000
7000 000
8000 000

Compliance with the MFMA 2017/2018
DescriptionR thousandR thousandRevenue By Source
Service charges - sanitation revenue 2 976 Other revenue 2 709
Total Revenue (excluding capital 5 684 Expenditure By Type
Employee related costs 1 682 Depreciation & asset impairment 1 227 Other materials 704 Contracted services 227 Other expenditure 621
Total Expenditure 4 461 Surplus/(Deficit) 1 224 Transfers and subsidies - capital –
Surplus/(Deficit) after capital 1 224 Capital Expenditure (4 000) Surplus/(Deficit) after capital (2 776)
WASTE
WATER
Table 23 Waste water management - operating revenue by source, expenditure by type and total capital expenditure
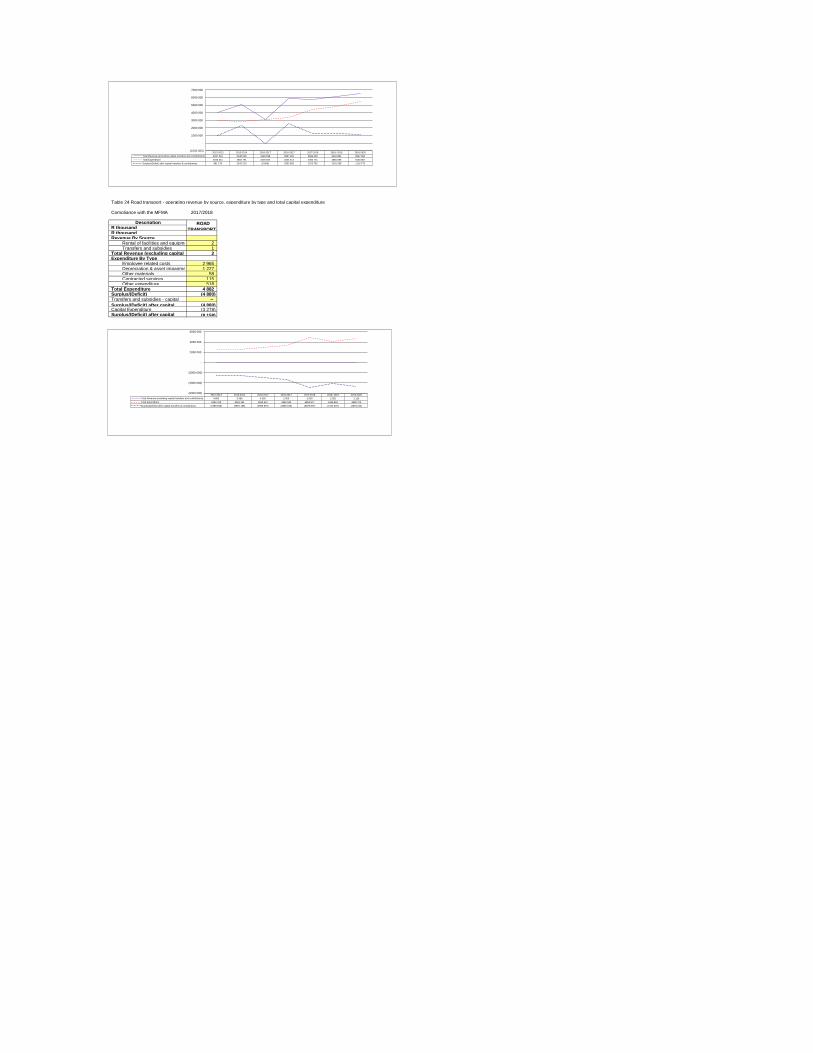
Compliance with the MFMA 2017/2018
DescriptionR thousandR thousandRevenue By Source
Rental of facilities and equipment 2 Transfers and subsidies 1
Total Revenue (excluding capital 2 Expenditure By Type
Employee related costs 2 965 Depreciation & asset impairment 1 227 Other materials 58 Contracted services 115 Other expenditure 518
Total Expenditure 4 882 Surplus/(Deficit) (4 880) Transfers and subsidies - capital –
Surplus/(Deficit) after capital (4 880) Capital Expenditure (3 278) Surplus/(Deficit) after capital (8 158)
ROAD
TRANSPORT
Table 24 Road transport - operating revenue by source, expenditure by type and total capital expenditure
2012-2013 2013-2014 2016-2017 2016-2017 2017-2018 2018- 2019 2019-2020
Total Revenue (excluding capital transfers and contributions) 4037 521 5146 006 3140 698 5897 019 5684 493 6116 881 6547 660
Total Expenditure 3046 351 2803 791 3146 504 3344 414 4460 731 4855 596 5430 887
Surplus/(Deficit) after capital transfers & contributions 991 170 2342 215 (5 806) 2552 605 1223 762 1261 285 1116 773
(1000 000)
-
1000 000
2000 000
3000 000
4000 000
5000 000
6000 000
7000 000
2012-2013 2013-2014 2016-2017 2016-2017 2017-2018 2018- 2019 2019-2020
Total Revenue (excluding capital transfers and contributions) 4 860 3 966 6 050 2 000 2 000 2 025 2 126
Total Expenditure 2494 708 2561 101 2959 447 3382 043 4881 877 4126 862 4680 370
Surplus/(Deficit) after capital transfers & contributions (2489 848) (2557 135) (2953 397) (3380 043) (4879 877) (4124 837) (4678 244)
(6000 000)
(4000 000)
(2000 000)
-
2000 000
4000 000
6000 000
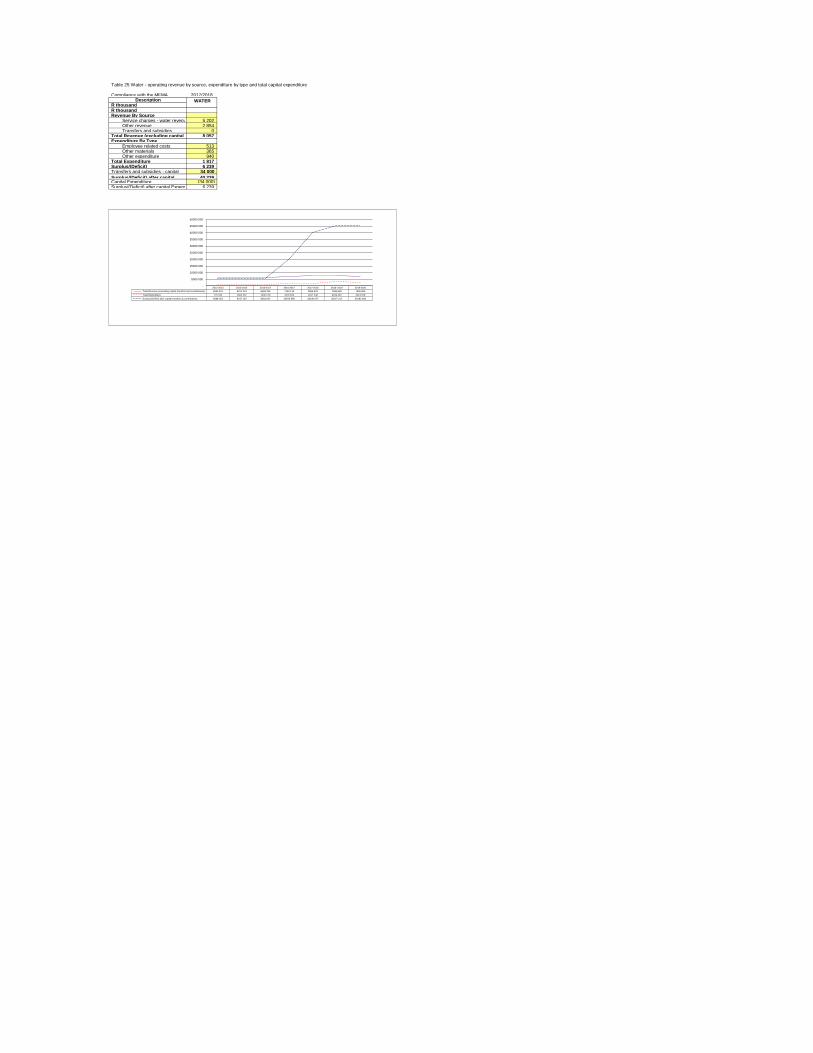
Compliance with the MFMA 2017/2018Description
R thousandR thousandRevenue By Source
Service charges - water revenue 5 202 Other revenue 2 854 Transfers and subsidies 0
Total Revenue (excluding capital 8 057 Expenditure By Type
Employee related costs 513 Other materials 365 Other expenditure 940
Total Expenditure 1 817 Surplus/(Deficit) 6 239 Transfers and subsidies - capital 34 000
Surplus/(Deficit) after capital 40 239 Capital Expenditure (34 000)Surplus/(Deficit) after capital Expenses 6 239
WATER
Table 25 Water - operating revenue by source, expenditure by type and total capital expenditure
2012-2013 2013-2014 2016-2017 2016-2017 2017-2018 2018- 2019 2019-2020
Total Revenue (excluding capital transfers and contributions) 6063 315 6311 374 6558 326 7253 118 8056 523 7846 659 7306 905
Total Expenditure 775 152 1064 207 1205 279 1679 523 1817 246 3019 442 2413 979
Surplus/(Deficit) after capital transfers & contributions 5288 163 5247 167 5353 047 20573 595 40239 277 45127 217 45192 926
-
5000 000
10000 000
15000 000
20000 000
25000 000
30000 000
35000 000
40000 000
45000 000
50000 000

Kareeberg Municipality 2017-2018 Annual Budget and MTREF
Compliance with the MFMA 2017/2018
DescriptionR thousandR thousandRevenue By Source
Service charges - electricity revenue 9 249 Other revenue 1 211 Transfers and subsidies 1
Total Revenue (excluding capital 10 461 Expenditure By Type
Employee related costs 447 Bulk purchases 10 912 Other materials 8 Contracted services 125 Other expenditure 280
Total Expenditure 11 772 Surplus/(Deficit) (1 312) Transfers and subsidies - capital 1 000
Surplus/(Deficit) after capital (312) Capital Expenditure (1 000)Surplus/(Deficit) after capital Expenses (1 312)
ELECTRICIT
Table 26 Electricity - operating revenue by source, expenditure by type and total capital expenditure
2012-2013 2013-2014 2016-2017 2016-2017 2017-2018 2018- 2019 2019-2020
Total Revenue (excluding capital transfers and contributions) 7943 042 8728 785 8465 284 9807 216 10460 502 11178 914 11890 297
Total Expenditure 7596 113 8449 290 9197 397 10352 736 11772 014 12920 440 13978 327
Surplus/(Deficit) after capital transfers & contributions 346 929 279 495 (732 113) 454 480 (311 512) (1741 526) (2088 030)
(4000 000)
(2000 000)
-
2000 000
4000 000
6000 000
8000 000
10000 000
12000 000
14000 000
16000 000
2.13 Legislation compliance status
1. In year reporting
2. Internship programme
3. Budget and Treasury OfficeThe Budget and Treasury Office has been established in accordance with the MFMA.4. Audit CommitteeAn Audit Committee has been established and is fully functional5. Service Delivery and Implementation Plan
6. Annual ReportThe annual report is compiled in terms of the MFMA and National Treasury requirements7. MFMA TrainingMFMA training has not yet commenced.8. Policies
The municipality is participating in the Municipal Financial Management Internship programme and has employed two interns undergoing training in
The detailed SDBIP document,directly aligned and informed by the 2017 - 2018 MTREF, has been tabled and is ready for approval by the Mayor.
An amendment of the Municipal Property Rates Regulations as published in Government Notice 363 of 27 March 2009, was announced in
Compliance with the MFMA implementation requirements have been substantially adhered to through the following activities:
Reporting to National Treasury in electronic format was fully complied with on a monthly basis. Section 71 reporting to the Mayor (within 10 working
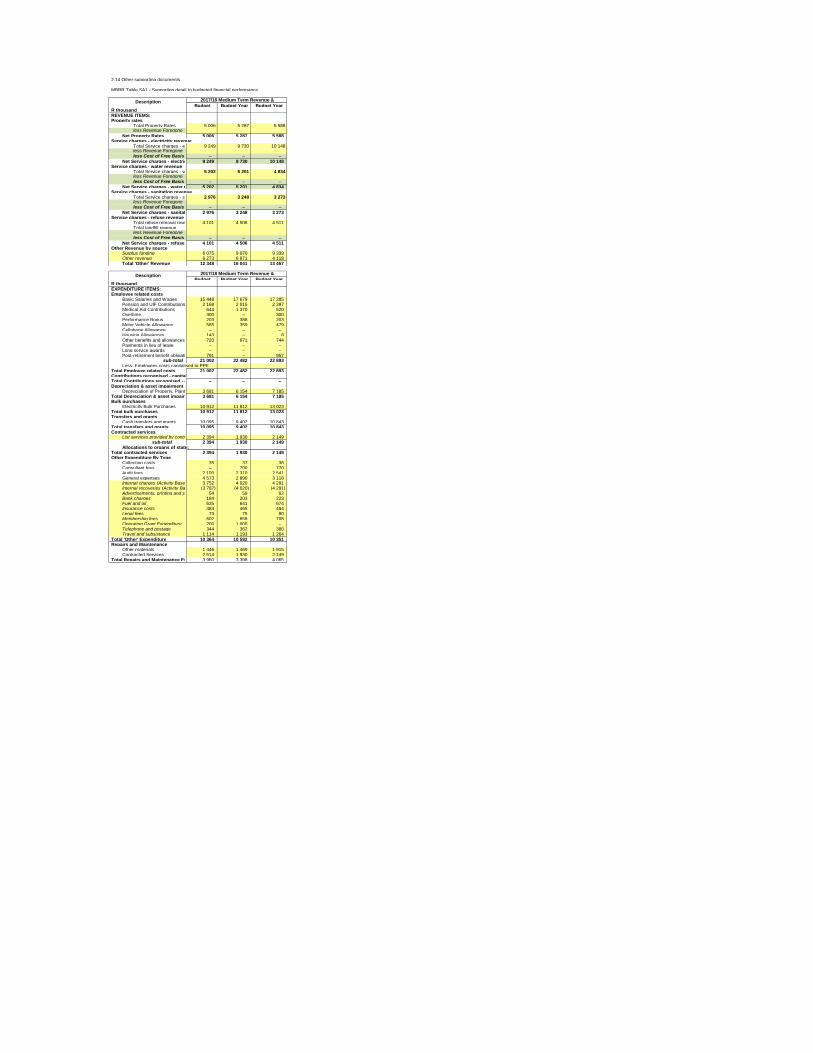
2.14 Other supporting documents
MBRR Table SA1 - Supporting detail to budgeted financial performance
Budget Budget Year Budget Year R thousandREVENUE ITEMS:Property rates
Total Property Rates 5 006 5 287 5 588 less Revenue Foregone
Net Property Rates 5 006 5 287 5 588 Service charges - electricity revenue
Total Service charges - electricity revenue9 249 9 730 10 148 less Revenue Foregone less Cost of Free Basis – – –
Net Service charges - electricity revenue9 249 9 730 10 148 Service charges - water revenue
Total Service charges - water revenue5 202 5 201 4 834 less Revenue Foregone less Cost of Free Basis – – –
Net Service charges - water revenue 5 202 5 201 4 834 Service charges - sanitation revenue
Total Service charges - sanitation revenue2 976 3 248 3 273 less Revenue Foregone less Cost of Free Basis – – –
Net Service charges - sanitation revenue2 976 3 248 3 273 Service charges - refuse revenue
Total refuse removal revenue 4 101 4 506 4 511 Total landfill revenue less Revenue Foregone less Cost of Free Basis – – –
Net Service charges - refuse revenue4 101 4 506 4 511 Other Revenue by source
Surplus funding 6 075 9 070 9 339 Other revenue 6 273 6 971 4 118 Total 'Other' Revenue 12 348 16 041 13 457
Budget Budget Year Budget Year R thousandEXPENDITURE ITEMS:Employee related costs
Basic Salaries and Wages 15 448 17 679 17 285 Pension and UIF Contributions 2 168 2 015 2 397 Medical Aid Contributions 644 1 370 520 Overtime 300 – 300 Performance Bonus 203 388 203 Motor Vehicle Allowance 585 359 479 Cellphone Allowance – – – Housing Allowances 143 – 8 Other benefits and allowances 720 671 744 Payments in lieu of leave – – – Long service awards – – – Post-retirement benefit obligations 791 – 957
sub-total 21 002 22 482 22 893 Less: Employees costs capitalised to PPE
Total Employee related costs 21 002 22 482 22 893 Contributions recognised - capitalTotal Contributions recognised - capital – – – Depreciation & asset impairment
Depreciation of Property, Plant & Equipment3 681 6 154 7 185 Total Depreciation & asset impairment 3 681 6 154 7 185 Bulk purchases
Electricity Bulk Purchases 10 912 11 812 13 023 Total bulk purchases 10 912 11 812 13 023 Transfers and grants
Cash transfers and grants 10 095 9 402 10 843 Total transfers and grants 10 095 9 402 10 843 Contracted services
List services provided by contract 2 394 1 930 2 149 sub-total 2 394 1 930 2 149
Allocations to organs of state:Total contracted services 2 394 1 930 2 149 Other Expenditure By Type
Collection costs 35 37 38 Consultant fees – 700 770 Audit fees 2 100 2 310 2 541 General expenses 4 573 2 890 3 118 Internal charges (Activity Based Costing )3 752 4 020 4 291 Internal recoveries (Activity Based Costing )(3 787) (4 020) (4 291) Advertisements, printing and stationery 54 59 62 Bank charges 184 203 223 Fuel and oil 635 641 674 Insurance costs 484 465 494 Legal fees 73 75 80 Membership fees 602 658 708 Operating Grant Expenditure 200 1 000 – Telephone and postage 344 362 380 Travel and subsistance 1 114 1 193 1 264
Total 'Other' Expenditure 10 364 10 592 10 351 Repairs and Maintenance
Other materials 1 446 1 469 1 915 Contracted Services 2 514 1 930 2 149
Total Repairs and Maintenance Expenditure3 960 3 398 4 065
Description 2017/18 Medium Term Revenue &
Description 2017/18 Medium Term Revenue &
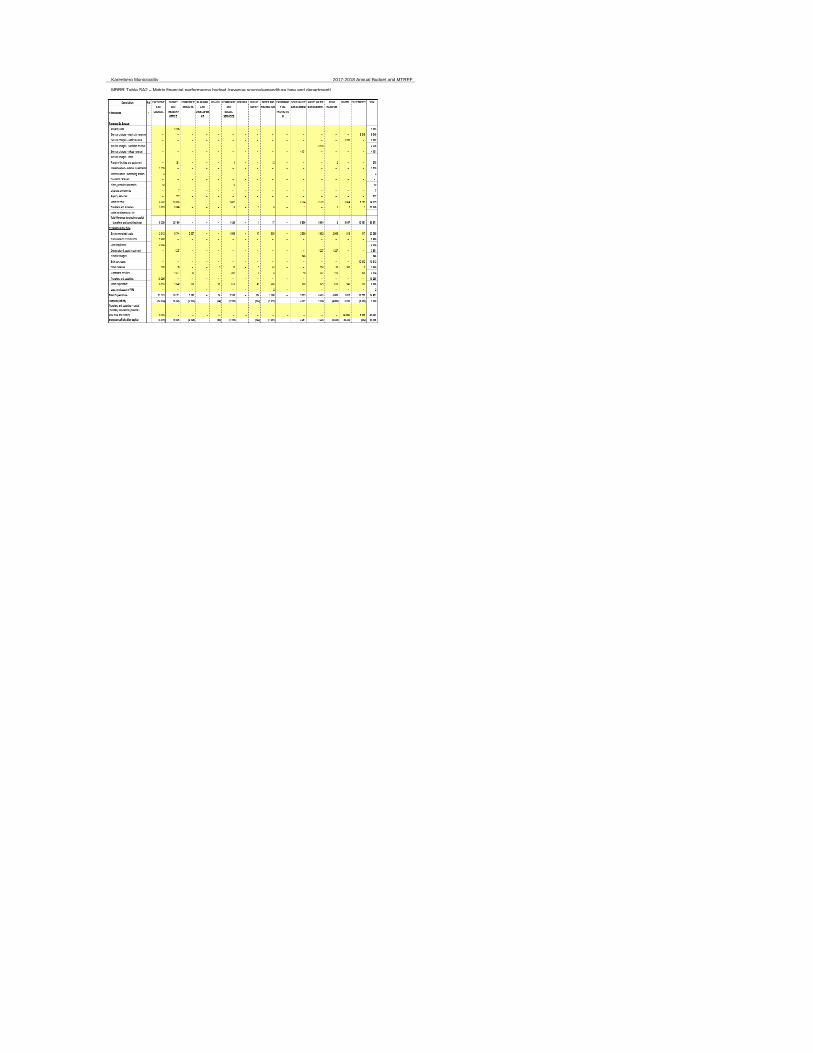
Kareeberg Municipality 2017-2018 Annual Budget and MTREF
MBRR Table SA2 – Matrix financial performance budget (revenue source/expenditure type and department)
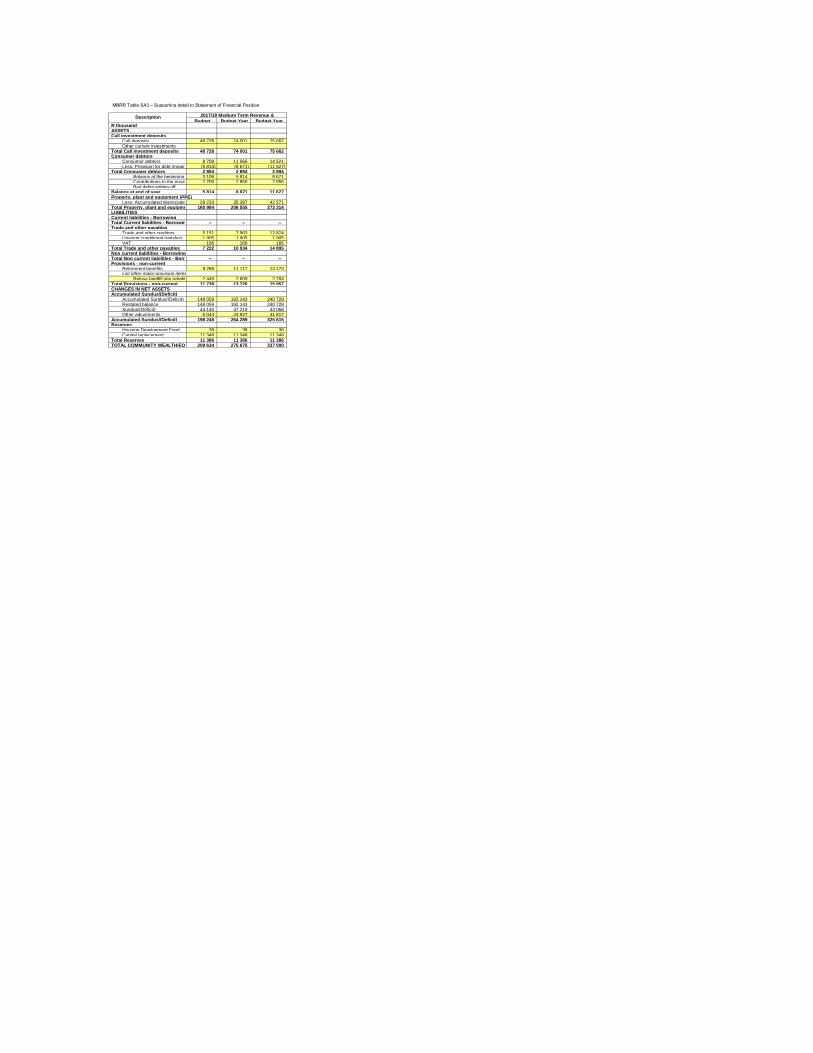
MBRR Table SA3 – Supporting detail to Statement of Financial Position
Budget Budget Year Budget Year R thousandASSETSCall investment deposits
Call deposits 48 728 74 001 75 662 Other current investments
Total Call investment deposits 48 728 74 001 75 662 Consumer debtors
Consumer debtors 8 709 11 565 14 521 Less: Provision for debt impairment (5 814) (8 671) (11 627)
Total Consumer debtors 2 894 2 894 2 894 Balance at the beginning of the year3 106 5 814 8 671 Contributions to the provision 2 709 2 856 2 956 Bad debts written off
Balance at end of year 5 814 8 671 11 627 Property, plant and equipment (PPE)
Less: Accumulated depreciation 29 233 35 387 42 571 Total Property, plant and equipment (PPE)160 984 206 555 273 314 LIABILITIESCurrent liabilities - BorrowingTotal Current liabilities - Borrowing – – – Trade and other payables
Trade and other creditors 5 151 7 963 12 824 Unspent conditional transfers 1 905 1 905 1 905 VAT 166 166 166
Total Trade and other payables 7 222 10 034 14 895 Non current liabilities - BorrowingTotal Non current liabilities - Borrowing – – – Provisions - non-current
Retirement benefits 9 288 11 117 13 173 List other major provision items
Refuse landfill site rehabilitation 2 449 2 609 2 784 Total Provisions - non-current 11 738 13 726 15 957 CHANGES IN NET ASSETSAccumulated Surplus/(Deficit)
Accumulated Surplus/(Deficit) - opening balance148 059 192 143 240 729 Restated balance 148 059 192 143 240 729 Surplus/(Deficit) 44 145 47 219 43 068 Other adjustments 6 044 24 927 41 817
Accumulated Surplus/(Deficit) 198 248 264 289 325 615 Reserves
Housing Development Fund 38 38 38 Capital replacement 11 348 11 348 11 348
Total Reserves 11 386 11 386 11 386 TOTAL COMMUNITY WEALTH/EQUITY 209 634 275 675 337 000
Description 2017/18 Medium Term Revenue &
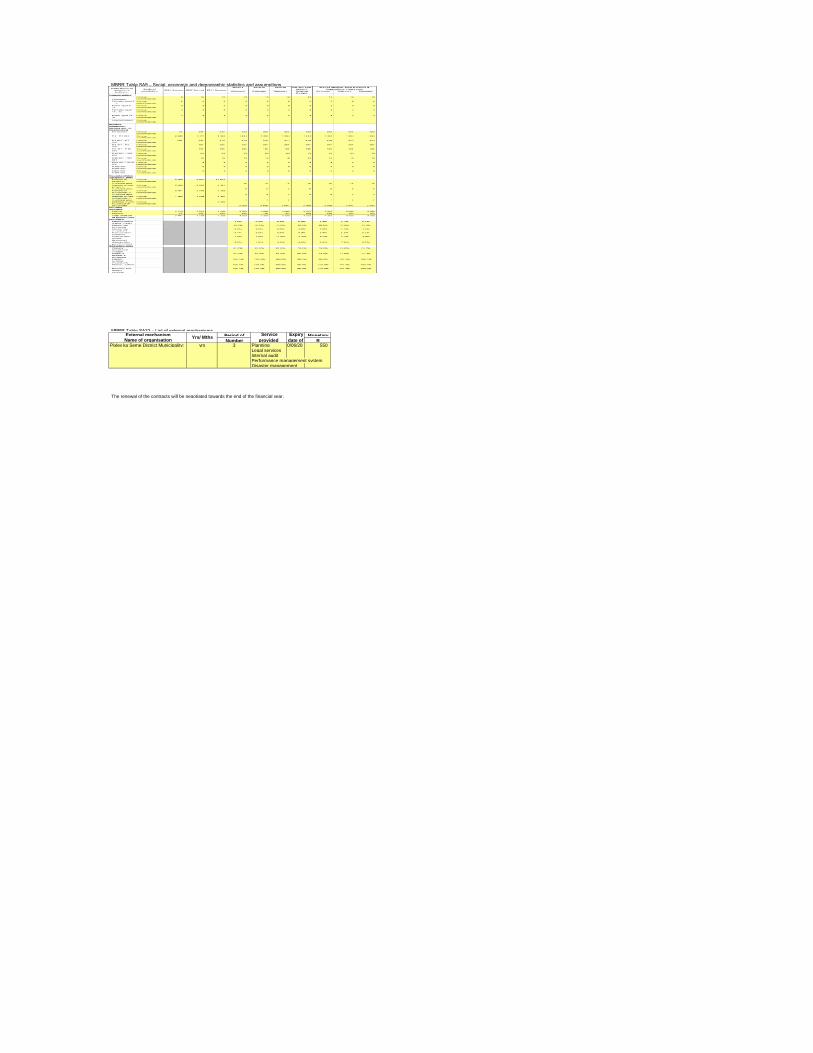
MBRR Table SA9 – Social, economic and demographic statistics and assumptions
MBRR Table SA32 – List of external mechanismsExternal mechanism Period of Monetary Name of organisation Number R
Pixley ka Seme District Municipality: yrs 3 Planning 30/06/2017 550 Legal servicesInternal auditPerformance management systemDisaster management
The renewal of the contracts will be negotiated towards the end of the financial year.
Yrs/ Mths Service
provided
Expiry
date of

Kareeberg Municipality 2017-2018 Annual Budget and MTREF
MBRR Table SA11 – Property rates summary
March 2017 #REF!
Description 2009/10 2010/11 2011/12 Current Year 2012/13 2013/14
R Audited
Outcome
Audited
Outcome
Audited
Outcome
Original
Budget
Adjusted
Budget
Full Year
Forecast
Budget Year
2013/14
Budget Year
+1 2014/15
Budget Year +2
2015/16
Valuation:
Date of v aluation: 01/07/2008 01/07/2008 01/07/2008 01/07/2008
Financial y ear v aluation used 01/07/2009 01/07/2009 01/07/2009 01/07/2009 01/07/2013
Municipal by -law s s6 in place? (Y/N) y es y es y es y es y es
Municipal/assistant v aluer appointed? (Y/N) y es y es y es y es y es
Municipal partnership s38 used? (Y/N)
No. of assistant v aluers (FTE) 1 1 1 1 1 1 1 1 1
No. of data collectors (FTE)
No. of internal v aluers (FTE)
No. of ex ternal v aluers (FTE) 1 1 1 1 1 1 1 1 1
No. of additional v aluers (FTE)
Valuation appeal board established? (Y/N) y es y es y es y es y es
Implementation time of new v aluation roll (mths)
No. of properties
No. of sectional title v alues - - - -
No. of unreasonably difficult properties s7(2) - - - -
No. of supplementary v aluations 1 1 1 1 1 1 1
No. of v aluation roll amendments
No. of objections by rate pay ers 338 - - -
No. of appeals by rate pay ers 1 - - -
No. of successful objections 338 - - -
No. of successful objections > 10%
Supplementary v aluation
Public serv ice infrastructure v alue (Rm) 837,700 837,700 837,700 837,700 837,700 837,700 176,657,500 176,657,500 176,657,500
Municipality ow ned property v alue (Rm) 35,430,600 35,430,600 35,430,600 35,430,600 35,430,600 35,430,600 35,430,600 35,430,600 35,430,600
Valuation reductions:
Valuation reductions-public infrastructure (Rm) 837,700 837,700 837,700 837,700 837,700 176,657,500 176,657,500 176,657,500
Valuation reductions-nature reserv es/park (Rm)
Valuation reductions-mineral rights (Rm)
Valuation reductions-R15,000 threshold (Rm) 25,628,600 25,628,600 25,930,800 25,930,800 25,930,800 25,930,800 23,164,600 23,164,600 23,164,600
Valuation reductions-public w orship (Rm) 9,684,200 9,405,800 10,287,600 10,287,600 10,287,600 10,287,600 11,100,100 11,100,100 11,100,100
Valuation reductions-other (Rm) 39,127,800 43,093,900 43,093,900 43,093,900 43,093,900 43,093,900 22,925,700 22,925,700 22,925,700
Total valuation reductions: 74,440,600 78,966,000 80,150,000 80,150,000 80,150,000 80,150,000 233,847,900 233,847,900 233,847,900
Total v alue used for rating (Rm) 1,546,639,550 1,513,824,300 1,543,556,950 1,513,824,300 1,513,824,300 1,513,824,300 1,942,337,400 1,942,337,400 1,942,337,400
Total land v alue (Rm)
Total v alue of improv ements (Rm)
Total market v alue (Rm) 1,546,639,550 1,513,824,300 1,543,556,950 1,513,824,300 1,513,824,300 1,513,824,300 1,942,337,400 1,942,337,400 1,942,337,400
Rating:
Residential rate used to determine rate for other
categories? (Y/N) y es y es y es y es y es
Differential rates used? (Y/N) no
Limit on annual rate increase (s20)? (Y/N) no
Special rating area used? (Y/N) no
Phasing-in properties s21 (number) -
Rates policy accompany ing budget? (Y/N)
Fix ed amount minimum v alue (R'000)
Non-residential prescribed ratio s19? (%)
Rate revenue:
Rate rev enue budget (R) 9,530,911 7,099,537 3,884,684 4,526,502 4,526,502 4,526,502 5,005,060 6,074,335 6,747,599
Rate rev enue ex pected to collect (R) 3,892,838 3,908,466 3,878,347 4,526,502 4,526,502 4,318,455 5,005,060 6,074,335 6,747,599
Ex pected cash collection rate (%) 100.00 90.00 81.00 81.00 81.00 73.00 73.00 73.00 73.00
Special rating areas (R)
Rebates, ex emptions - indigent (R)
Rebates, ex emptions - pensioners (R)
Rebates, ex emptions - bona fide farm. (R) 447,545 450,076 448,191 450,076 450,076 521,204 624,008 791,127 920,885
Rebates, ex emptions - other (R) 1,317,652 1,340,825 1,286,915 1,490,225 1,490,225 1,269,788 1,507,309 1,507,549 1,502,020
Phase-in reductions/discounts (R) 3,859,361 1,281,745 426,848 - - - - - -
Total rebates,exemptns,reductns,discs (R'000) 5,624,558 3,072,646 2,161,954 1,940,301 1,940,301 1,790,992 2,131,317 2,298,676 2,422,905

Kareeberg Municipality 2017-2018 Annual Budget and MTREF
MBRR Table SA12(a) – Property rates summary(current year)
Description
Resi. Indust. Bus. &
Comm.
Farm props. State-owned Muni props. Public
service infra.
Private
owned towns
Formal &
Informal
Settle.
Comm.
Land
State trust
land
Section
8(2)(n) (note
1)
Protect.
Areas
National
Monum/ts
Public
benefit
organs.
Mining
Props.
Current Year 2012/13
Valuation:
No. of properties 2,425 430 30 334 1 130 1 30
No. of sectional title property v alues
No. of unreasonably difficult properties s7(2)
No. of supplementary v aluations 1
Supplementary v aluation (Rm)
No. of v aluation roll amendments
No. of objections by rate-pay ers
No. of appeals by rate-pay ers
No. of appeals by rate-pay ers finalised
No. of successful objections
No. of successful objections > 10%
Estimated no. of properties not v alued
Years since last v aluation (select) 3
Frequency of v aluation (select) 4
Method of v aluation used (select) Market Market Market Market Market Market Market Market Market
Base of v aluation (select)
Phasing-in properties s21 (number)
Combination of rating ty pes used? (Y/N)
Flat rate used? (Y/N) No No No No No No No No No
Is balance rated by uniform rate/v ariable rate?
Valuation reductions:
Valuation reductions-public infrastructure (Rm) 837,700
Valuation reductions-nature reserv es/park (Rm)
Valuation reductions-mineral rights (Rm)
Valuation reductions-R15,000 threshold (Rm) 25,628,600
Valuation reductions-public w orship (Rm) 10,287,600
Valuation reductions-other (Rm) 35,430,600 165,000 3,261,200
Total valuation reductions: 25,628,600 - - - - 35,430,600 837,700 - 165,000 - - - - - 13,548,800 -
Total v alue used for rating (Rm) 176,743,100 1,286,453,750 20,802,800 35,430,600 837,700 165,000 9,907,800 13,548,800
Total land v alue (Rm)
Total v alue of improv ements (Rm)
Total market v alue (Rm) 176,743,100 1,286,453,750 20,802,800 35,430,600 837,700 165,000 9,907,800 13,548,800
Rating:
Av erage rate 0.017600 0.001160 0.035200 0.017600 0.004400 0.017600 0.009680 0.017600
Rate rev enue budget (R '000) 3,110,679 - - 1,492,286 732,166 623,579 3,685 - 2,904 95,908 - - - - 238,459 -
Rate rev enue ex pected to collect (R'000) 1,942,676 - - 710,223 581,732 -0 -0 - - 70,012 - - - - -0 -
Ex pected cash collection rate (%) 95.0% 80.0% 80.0%
Special rating areas (R'000)
Rebates, ex emptions - indigent (R'000) 411,497
Rebates, ex emptions - pensioners (R'000)
Rebates, ex emptions - bona fide farm. (R'000) 461,512
Rebates, ex emptions - other (R'000) 133,521 566,890 3,350 2,640 216,780
Phase-in reductions/discounts (R'000) 427,745
Total rebates,exemptns,reductns,discs (R'000) 411,497 - - 889,257 133,521 566,890 3,350 - 2,640 - - - - - 216,780 -

Kareeberg Municipality 2017-2018 Annual Budget and MTREF
MBRR Table SA12(b) – Property rates by category(budget year)
March 2017 #REF!
Description
Resi. Indust. Bus. &
Comm.
Farm props. State-owned Muni props. Public
service infra.
Private
owned towns
Formal &
Informal
Settle.
Comm.
Land
State trust
land
Section
8(2)(n) (note
1)
Protect.
Areas
National
Monum/ts
Public
benefit
organs.
Mining
Props.
Budget Year 2013/14
Valuation:
No. of properties 2,425 430 30 334 1 130 1 30
No. of sectional title property v alues
No. of unreasonably difficult properties s7(2)
No. of supplementary v aluations 1 1 1 1 1 1 1 1
Supplementary v aluation (Rm)
No. of v aluation roll amendments
No. of objections by rate-pay ers
No. of appeals by rate-pay ers
No. of appeals by rate-pay ers finalised
No. of successful objections
No. of successful objections > 10%
Estimated no. of properties not v alued
Years since last v aluation (select) 1
Frequency of v aluation (select) 4 4
Method of v aluation used (select) Market
Base of v aluation (select)
Phasing-in properties s21 (number)
Combination of rating ty pes used? (Y/N) No
Flat rate used? (Y/N) No
Is balance rated by uniform rate/v ariable rate?
Valuation reductions:
Valuation reductions-public infrastructure (Rm) 176,657,500
Valuation reductions-nature reserv es/park (Rm)
Valuation reductions-mineral rights (Rm)
Valuation reductions-R15,000 threshold (Rm) 23,074,600 90,000
Valuation reductions-public w orship (Rm) 11,100,100
Valuation reductions-other (Rm) 19,551,300 249,800 3,124,600
Total valuation reductions: 23,074,600 - - - 90,000 19,551,300 176,657,500 - 249,800 - - - - - 14,224,700 -
Total v alue used for rating (Rm) 284,662,600 1,403,846,200 19,841,300 19,551,300 176,657,500 249,800 14,040,900 23,487,800
Total land v alue (Rm)
Total v alue of improv ements (Rm)
Total market v alue (Rm) 284,662,600 1,403,846,200 19,841,300 19,551,300 176,657,500 249,800 14,040,900 23,487,800
Rating:
Av erage rate 0.0127 0.0013 0.0253 0.0127 0.0032 0.0127 0.0070 0.0127
Rate rev enue budget (R '000) 3,607,244 - - 1,782,885 502,779 247,715 560,004 - 3,164 102,078 - - - - 297,594 -
Rate rev enue ex pected to collect (R'000) 2,419,835 - - 843,346 399,955 -0 0 - -0 74,517 - - - - 0 -
Ex pected cash collection rate (%) 73.0% 73.0% 100.0% 73.0%
Special rating areas (R'000)
Rebates, ex emptions - indigent (R'000) 292,401
Rebates, ex emptions - pensioners (R'000)
Rebates, ex emptions - bona fide farm. (R'000) 624,008
Rebates, ex emptions - other (R'000) 3,608 102,824 247,715 560,004 3,164 297,594
Phase-in reductions/discounts (R'000)
Total rebates,exemptns,reductns,discs (R'000) 292,401 - - 627,616 102,824 247,715 560,004 - 3,164 - - - - - 297,594 -

Kareeberg Municipality 2017-2018 Annual Budget and MTREF
MBRR Table SA13a – Service tariffs by category
March 2017 #REF!
Budget Year
2013/14
Budget Year
+1 2014/15
Budget Year
+2 2015/16
Property rates (rate in the Rand)
Residential properties 1.600 1.600 1.600 1.760 1.267 1.521 1.673
Residential properties - v acant land
Formal/informal settlements 1.600 1.600 1.600 1.760 1.267 1.521 1.673
Small holdings
Farm properties - used 0.400 0.400 0.400 0.116 0.127 0.152 0.176
Farm properties - not used
Industrial properties
Business and commercial properties
Communal land - residential
Communal land - small holdings
Communal land - farm property 0.880 0.880 0.880 0.968 0.697 0.836 0.920
Communal land - business and commercial
Communal land - other
State-ow ned properties 3.200 3.200 3.200 3.520 2.534 3.041 3.345
Municipal properties 1.600 1.600 1.600 1.760 1.267 1.521 1.673
Public serv ice infrastructure 0.400 0.400 0.400 0.440 0.317 0.380 0.418
Priv ately ow ned tow ns serv iced by the
ow ner
State trust land
Restitution and redistribution properties
Protected areas
National monuments properties
Exemptions, reductions and rebates (Rands)
Residential properties
R15 000 threshhold rebate 15,000 15,000 15,000 457,966 294,681 353,617 388,979
General residential rebate
Indigent rebate or ex emption
Pensioners/social grants rebate or ex emption
Temporary relief rebate or ex emption
Bona fide farmers rebate or ex emption 35% rebate 450,258 460,990 448,191 521,204 624,008 791,127 920,885
Other rebates or exemptions 3,992,858 1,450,636 560,774 147,405 104,152 124,445 135,597
Water tariffs
Domestic
Basic charge/fix ed fee (Rands/month) 93.56 98.24 104.13 110.38 117.00 131.04 142.83
Serv ice point - v acant land (Rands/month) 18.86 19.80 20.99 22.25 23.59 26.42 28.80
Water usage - flat rate tariff (c/kl)
Water usage - life line tariff (describe structure)
Water usage - Block 1 (c/kl) 0 - 6kl 0.84 0.88 0.93 0.99 1.05 1.18 1.29
Water usage - Block 2 (c/kl) 7 - 20kl 1.01 1.06 1.12 1.19 1.26 1.41 1.54
Water usage - Block 3 (c/kl) 21 - 50kl 2.38 2.50 2.65 2.81 2.98 3.34 3.64
Water usage - Block 4 (c/kl) 51kℓ + 4.32 4.54 4.81 5.10 5.41 6.06 6.61
Other
Current
Year 2012/13
2013/14 Medium Term Revenue &
Expenditure Framework Description
Provide description of tariff
structure where appropriate 2009/10 2010/11 2011/12
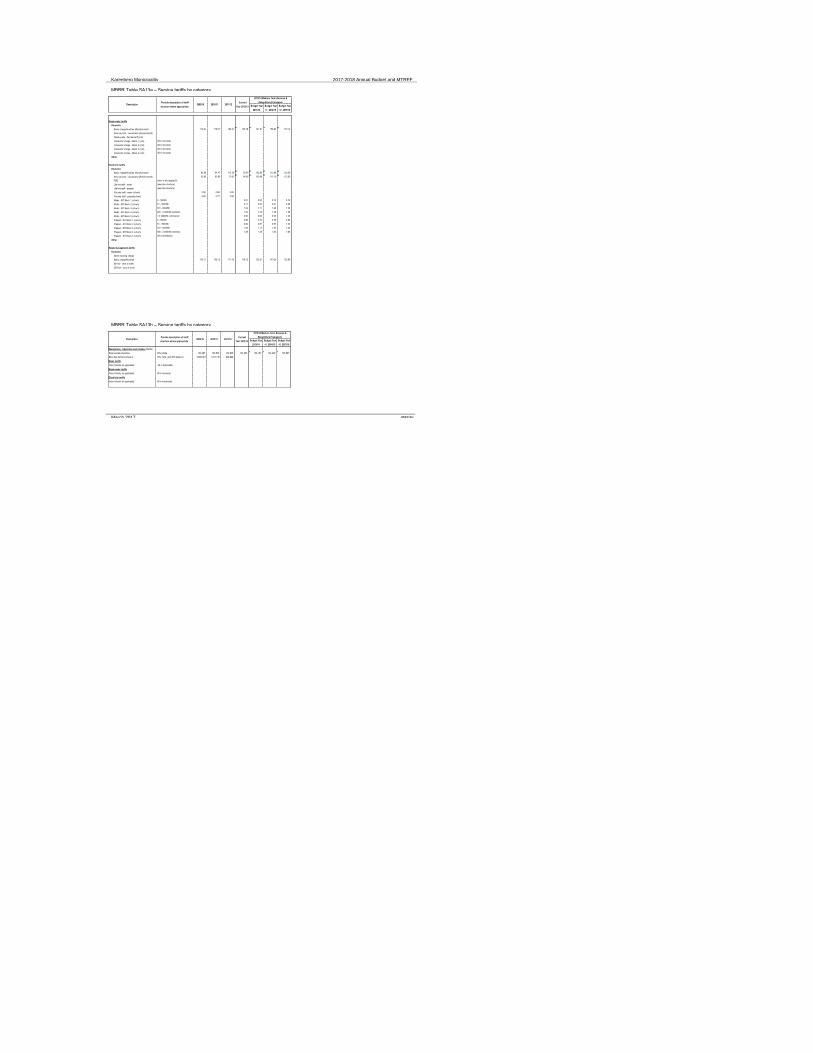
Kareeberg Municipality 2017-2018 Annual Budget and MTREF
MBRR Table SA13a – Service tariffs by category
MBRR Table SA13b – Service tariffs by category
March 2017 #REF!
Budget Year
2013/14
Budget Year
+1 2014/15
Budget Year
+2 2015/16
Current
Year 2012/13
2013/14 Medium Term Revenue &
Expenditure Framework Description
Provide description of tariff
structure where appropriate 2009/10 2010/11 2011/12
Waste water tariffs
Domestic
Basic charge/fix ed fee (Rands/month) 113.40 119.07 126.21 133.78 141.81 158.83 173.12
Serv ice point - v acant land (Rands/month)
Waste w ater - flat rate tariff (c/kl)
Volumetric charge - Block 1 (c/kl) (fill in structure)
Volumetric charge - Block 2 (c/kl) (fill in structure)
Volumetric charge - Block 3 (c/kl) (fill in structure)
Volumetric charge - Block 4 (c/kl) (fill in structure)
Other
Electricity tariffs
Domestic
Basic charge/fix ed fee (Rands/month) 80.06 94.47 113.36 95.00 102.60 113.89 125.28
Serv ice point - v acant land (Rands/month) 53.90 63.60 76.32 94.09 100.68 111.75 122.93
FBE (how is this targeted?)
Life-line tariff - meter (describe structure)
Life-line tariff - prepaid (describe structure)
Flat rate tariff - meter (c/kwh) 0.58 0.68 0.82
Flat rate tariff - prepaid(c/kwh) 0.65 0.77 0.92
Meter - IBT Block 1 (c/kw h) 0 - 50kWh 0.61 0.65 0.72 0.78
Meter - IBT Block 2 (c/kw h) 51 - 350kWh 0.77 0.82 0.91 0.98
Meter - IBT Block 3 (c/kw h) 351 - 600kWh 1.04 1.11 1.23 1.33
Meter - IBT Block 4 (c/kw h) 600 - 2 000kWh domestic 1.24 1.33 1.48 1.59
Meter - IBT Block 5 (c/kw h) > 2 000kWk commercial 0.80 0.86 0.95 1.03
Prepaid - IBT Block 1 (c/kw h) 0 - 50kWh 0.66 0.70 0.78 0.84
Prepaid - IBT Block 2 (c/kw h) 51 - 350kWh 0.82 0.87 0.97 1.04
Prepaid - IBT Block 3 (c/kw h) 351 - 600kWh 1.09 1.17 1.30 1.40
Prepaid - IBT Block 4 (c/kw h) 600 - 2 000kWh domestic 1.29 1.38 1.53 1.65
Prepaid - IBT Block 5 (c/kw h) (fill in thresholds)
Other
Waste management tariffs
Domestic
Street cleaning charge
Basic charge/fix ed fee 100.11 105.12 111.43 118.12 125.21 140.24 152.86
80l bin - once a w eek
250l bin - once a w eek
Budget Year
2013/14
Budget Year
+1 2014/15
Budget Year
+2 2015/16
Exemptions, reductions and rebates (Rands)
State-owned properties 20% rebate 133,497 133,520 133,926 147,405 104,152 124,445 135,597
Bona fide farmers phase in 75%, 50%, and 25% phase in 3,859,361 1,317,116 426,848
Water tariffs
[Insert blocks as applicable] (fill in thresholds)
Waste water tariffs
[Insert blocks as applicable] (fill in structure)
Electricity tariffs
[Insert blocks as applicable] (fill in thresholds)
Current
Year 2012/13
2013/14 Medium Term Revenue &
Expenditure Framework Description
Provide description of tariff
structure where appropriate 2009/10 2010/11 2011/12
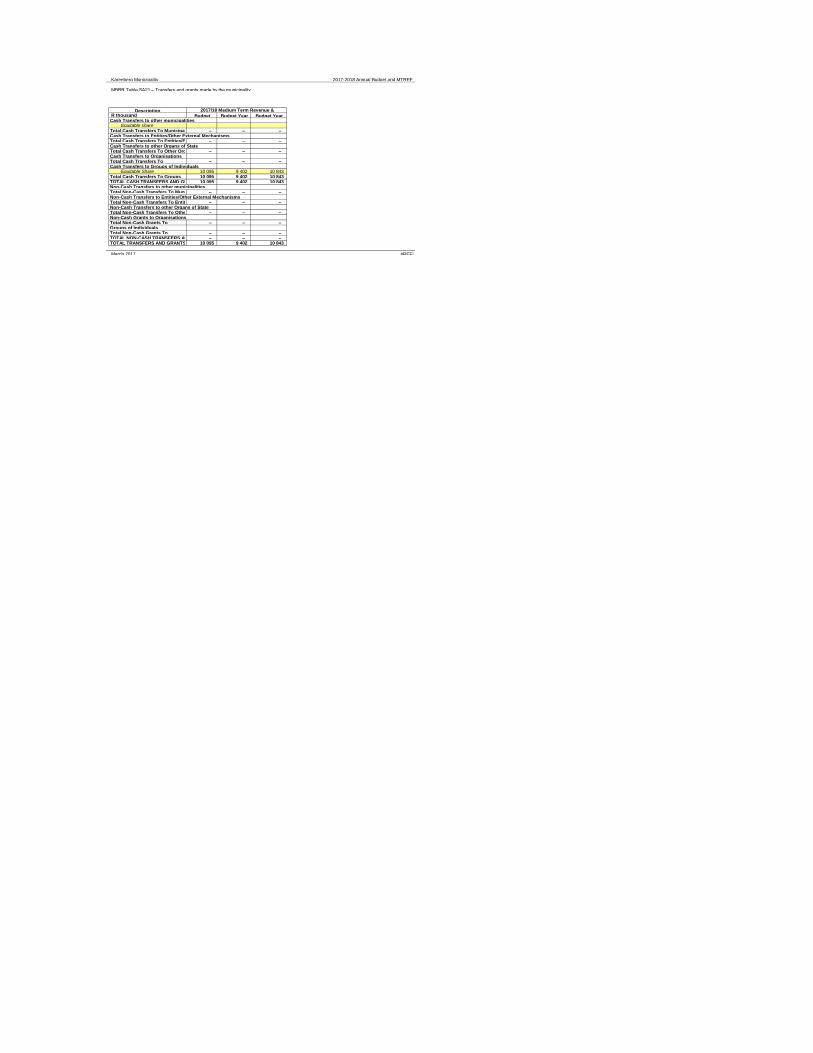
Kareeberg Municipality 2017-2018 Annual Budget and MTREF
MBRR Table SA21 – Transfers and grants made by the municipality
DescriptionR thousand Budget Budget Year Budget Year Cash Transfers to other municipalities
Equitable shareTotal Cash Transfers To Municipalities: – – – Cash Transfers to Entities/Other External MechanismsTotal Cash Transfers To Entities/Ems' – – – Cash Transfers to other Organs of StateTotal Cash Transfers To Other Organs Of State:– – – Cash Transfers to OrganisationsTotal Cash Transfers To – – – Cash Transfers to Groups of Individuals
Equitable Share 10 095 9 402 10 843 Total Cash Transfers To Groups 10 095 9 402 10 843 TOTAL CASH TRANSFERS AND GRANTS10 095 9 402 10 843 Non-Cash Transfers to other municipalitiesTotal Non-Cash Transfers To Municipalities: – – – Non-Cash Transfers to Entities/Other External MechanismsTotal Non-Cash Transfers To Entities/Ems' – – – Non-Cash Transfers to other Organs of StateTotal Non-Cash Transfers To Other Organs Of State:– – – Non-Cash Grants to OrganisationsTotal Non-Cash Grants To – – – Groups of IndividualsTotal Non-Cash Grants To – – – TOTAL NON-CASH TRANSFERS AND GRANTS– – – TOTAL TRANSFERS AND GRANTS 10 095 9 402 10 843
March 2017 #REF!
2017/18 Medium Term Revenue &

Kareeberg Municipality 2017-2018 Annual Budget and MTREF
MBRR Table SA33 – Contracts having future budgetary implications
Kareeberg Municipality 2017-2018 Annual Budget and MTREF
10/11 AUD 11/12 AUD 12/13 AUD CY 13/14 BUD CY 13/14 ADJ CY 13/14 FCST CY 13/14 ACT Budget Year 14/15 Budget Year +1 15/16 Budget Year +2 16/17
Property rates 3908465.65 3878346.51 4318455.7 5005060 5005060 5005060 5005060 4141323 4514882.4 4658228.8
Service charges - electricity revenue 5514194 6631019 6882383 8094551 8094551 8094551 8094551 7980926 8496283 8842647
Transfers recognised - capital 8770142.89 10088203.31 14437056.62 9089000 9089000 9089000 9089000 19848000 28364000 8101000
Service charges - water revenue 3100112 3386633 3624406 3788771 3788771 3788771 3788771 4137237 3870145 4142017
Transfers recognised 20822137.17 18771962.02 17561873.33 17728000 17728000 17728000 17728000 20489000 22366000 23674000
0
10000000
20000000
30000000
40000000
50000000
60000000
70000000
80000000
Rm
Revenue by Source - Major - Chart A5(a)
Transfers recognised Service charges - water revenue Transfers recognised - capital Service charges - electricity revenue Property rates
10/11 AUD 20822137.17 3100112 8770142.89 5514194 3908465.65
11/12 AUD 18771962.02 3386633 10088203.31 6631019 3878346.51
12/13 AUD 17561873.33 3624406 14437056.62 6882383 4318455.7
CY 13/14 BUD 17728000 3788771 9089000 8094551 5005060
CY 13/14 ADJ 17728000 3788771 9089000 8094551 5005060
CY 13/14 FCST 17728000 3788771 9089000 8094551 5005060
CY 13/14 ACT 17728000 3788771 9089000 8094551 5005060
Budget Year 14/15 20489000 4137237 19848000 7980926 4141323
Budget Year +1 15/16 22366000 3870145 28364000 8496283 4514882.4
Budget Year +2 16/17 23674000 4142017 8101000 8842647 4658228.8
0
5000000
10000000
15000000
20000000
25000000
30000000
Rm
Revenue by Source - Major - Chart A5(b) - source trend
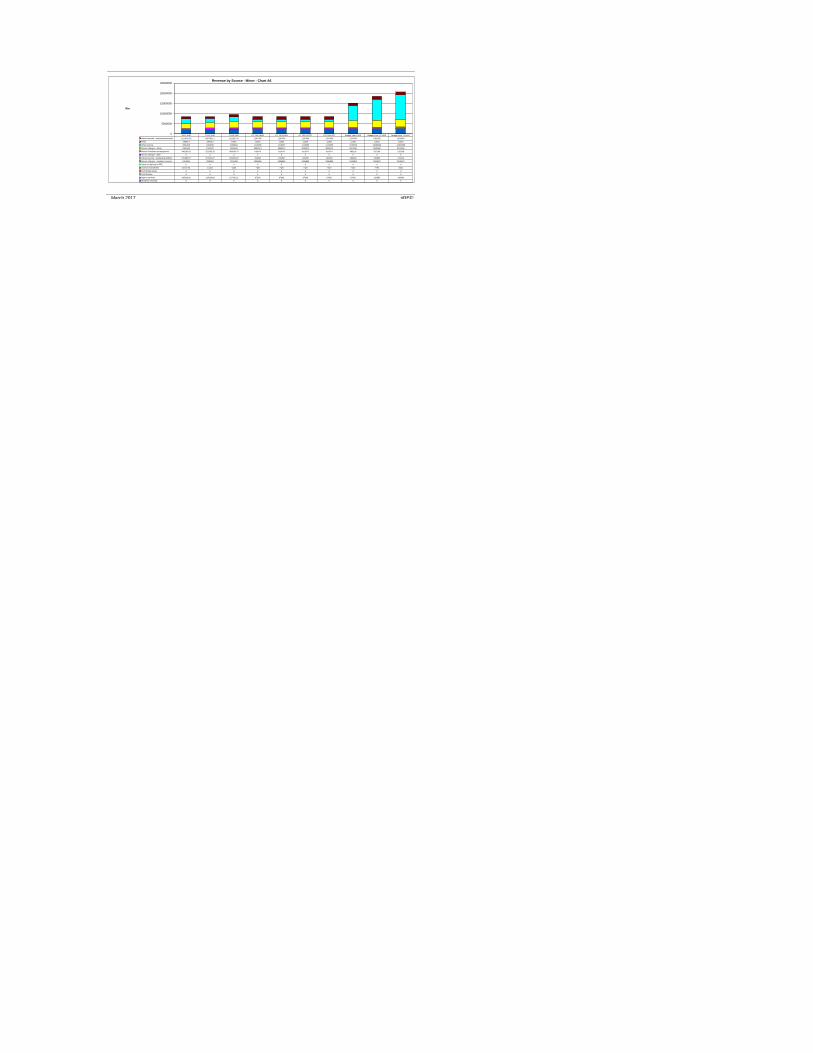
March 2017 #REF!
10/11 AUD 11/12 AUD 12/13 AUD CY 13/14 BUD CY 13/14 ADJ CY 13/14 FCST CY 13/14 ACT Budget Year 14/15 Budget Year +1 15/16 Budget Year +2 16/17
Interest earned - external investments 1115642.38 928766.11 1212532.41 1297000 1297000 1297000 1297000 1297000 1361850 1429943
Fines 19652.2 22806.2 10841 12230 12230 12230 12230 12230 12842 13484
Other revenue 2090158 1903535 2398664 1119356 1119357 1119356 1119356 7240558 10360206 12305458
Service charges - refuse 2584520 2780237 2930618 3095374 3095374 3095374 3095374 3421030 3500648 3475266
Rental of facilities and equipment 448165.03 522383.28 495039.74 410674 410674 410674 410674 483118 507199 532558
Service charges - other 0 0 0 0 0 0 0 0 0 0
Interest earned - outstanding debtors 252385.97 207044.07 183258.92 193300 193300 193300 193300 193300 202965 213113
Service charges - sanitation revenue 1924834 2058501 2234498 2336896 2336896 2336896 2336896 2478859 2503602 2578673
Gains on disposal of PPE 0 0 0 0 0 0 0 0 0 0
Licences and permits 14737.45 11202 6426 7420 7420 7420 7420 7420 7791 8181
Contributed assets 0 0 0 0 0 0 0 0 0 0
Contributions 0 0 0 0 0 0 0 0 0 0
Agency services 105016.92 119539.68 127432.31 97000 97000 97000 97000 97000 101850 106943
Dividends received 0 0 0 0 0 0 0 0 0 0
0
5000000
10000000
15000000
20000000
25000000
Rm
Revenue by Source - Minor - Chart A6

Kareeberg Municipality 2017-2018 Annual Budget and MTREF
March 2017 #REF!
10/11 AUD 11/12 AUD 12/13 AUD CY 13/14 BUD CY 13/14 ADJ CY 13/14 FCST CY 13/14 ACT Budget Year 14/15 Budget Year +1 15/16 Budget Year +2 16/17
Employee related costs 10521713.31 11014436 12463235.91 13915173 13915173 13915173 13915173 15378405 16656223.2 17745211.2
Bulk purchases 4806897.52 6283488.93 7035969.23 7906633 7906633 7906633 7906633 8543845 9529380 10515049
Other expenditure 12657868.36 12412032.74 11180025.96 10092977 10092977 10092977 10092977 12019191 11416201 12404258
Depreciation & asset impairment 2763059.93 2920111.34 2562068.89 1943709 1943709 1943709 1943709 3671152 3739614 4487538
0
5000000
10000000
15000000
20000000
25000000
30000000
35000000
40000000
45000000
50000000
Rm
Expenditure by Type - Major - Chart A7
Depreciation & asset impairment Other expenditure Bulk purchases Employee related costs
10/11 AUD 2763059.93 12657868.36 4806897.52 10521713.31
11/12 AUD 2920111.34 12412032.74 6283488.93 11014436
12/13 AUD 2562068.89 11180025.96 7035969.23 12463235.91
CY 13/14 BUD 1943709 10092977 7906633 13915173
CY 13/14 ADJ 1943709 10092977 7906633 13915173
CY 13/14 FCST 1943709 10092977 7906633 13915173
CY 13/14 ACT 1943709 10092977 7906633 13915173
Budget Year 14/15 3671152 12019191 8543845 15378405
Budget Year +1 15/16 3739614 11416201 9529380 16656223.2
Budget Year +2 16/17 4487538 12404258 10515049 17745211.2
0
2000000
4000000
6000000
8000000
10000000
12000000
14000000
16000000
18000000
20000000
Rm
Expenditure by Type - Major - Chart A7
10/11 AUD 11/12 AUD 12/13 AUD CY 13/14 BUD CY 13/14 ADJ CY 13/14 FCST CY 13/14 ACT Budget Year 14/15 Budget Year +1 15/16 Budget Year +2 16/17
Finance charges 734206 826755 1378119.85 531013 531013 531013 531013 531013 658587 1768990.4
Contracted services 231846.89 191862.44 304784.59 521400 521400 521400 521400 541400 573280 610760
Debt impairment 167488 0 491255 225000 225000 225000 225000 2339501.67 2456476.67 2579300.67
Grants and subsidies 6888136 7436334 7408903 7535741 7535741 7535741 7535741 8302311.27 12793911 12152894
Remuneration of councillors 1516564.89 1604252.3 1692488.76 1880786 1880786 1880786 1880786 2018982 2127580 2242373
Loss on disposal of PPE 15944 5700 33933.2 2000 2000 2000 2000 2000 2100 2205
Other materials 514056.88 523495.87 429602.02 431200 431200 431200 431200 431200 452911 671933
0
5000000
10000000
15000000
20000000
25000000
Rm
Expenditure by Type - Minor - Chart A7
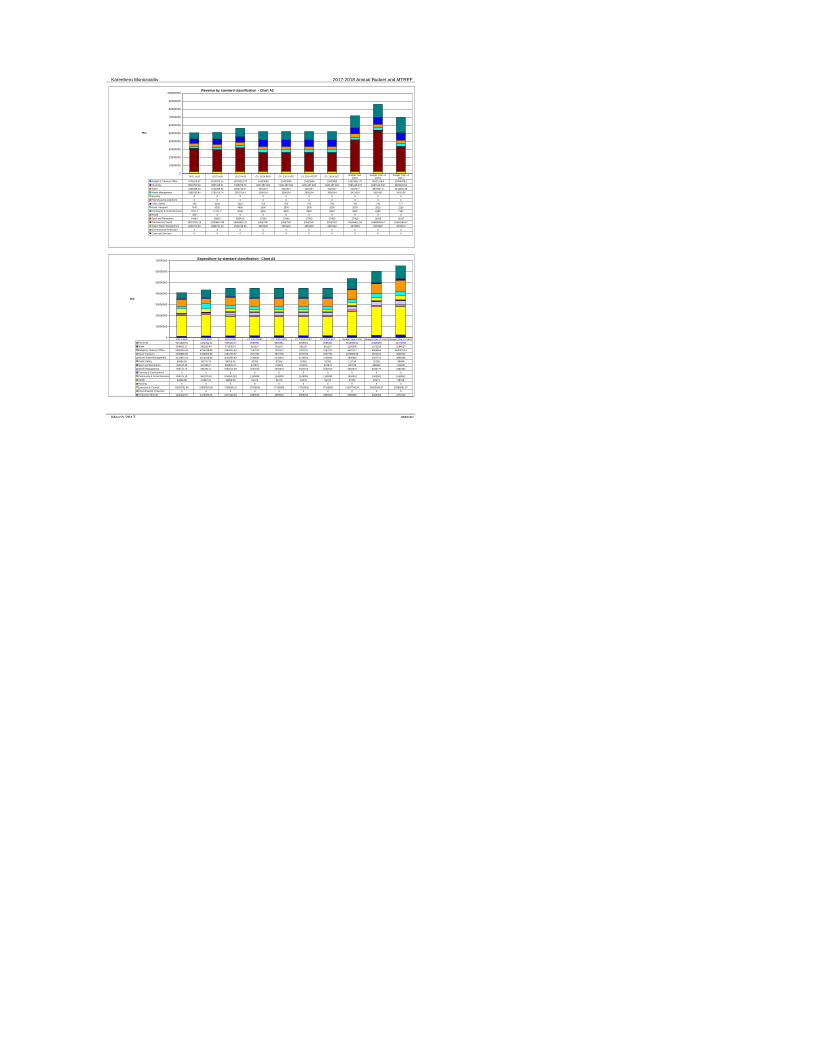
Kareeberg Municipality 2017-2018 Annual Budget and MTREF
March 2017 #REF!
10/11 AUD 11/12 AUD 12/13 AUD CY 13/14 BUD CY 13/14 ADJ CY 13/14 FCST CY 13/14 ACTBudget Year
14/15Budget Year +1
15/16Budget Year +2
16/17
Budget & Treasury Office 7479145.37 8119374.14 10332219.77 10423650 10423650 10423650 10423650 14623861.73 16321416.4 19706478.2
Electricity 5840750.03 6957425.31 7208749.76 8421487.483 8421487.483 8421487.483 8421487.483 7981626.274 8497019.796 8843420.52
Water 3426488.04 3713009.93 3950712.07 4115447 4115447 4115447 4115447 4137677 3870607.2 4142502.48
Waste Management 2585290.84 2781413.74 2931754.4 3096154 3096154 3096154 3096154 3421810 3501467 3476126
Housing 0 0 0 0 0 0 0 0 0 0
Planning & Development 0 0 0 0 0 0 0 0 0 0
Public Safety 780 3510 4015 705 705 705 705 705 740 777
Road Transport 7640 6020 4860 2000 2000 2000 2000 2000 2025 2126
Community & Social Services 7297.2 11121.2 8186 6650 6650 6650 6650 6650 6983 7332
Health 200 0 0 0 0 0 0 0 0 0
Sport and Recreation 44464 48910 65843.5 17900 17900 17900 17900 17400 18345 19317
Executive & Council 29027035.79 27284657.88 29356410.17 23527507 23527507 23527507 23527507 39156411.94 51448058.67 31304760.67
Waste Water Management 2251070.33 2384737.15 2560734.96 2663132 2663132 2663132 2663132 2478859 2503602 2578673
Environmental Protection 0 0 0 0 0 0 0 0 0 0
Corporate Services 0 0 0 0 0 0 0 0 0 0
0
10000000
20000000
30000000
40000000
50000000
60000000
70000000
80000000
90000000
100000000
Rm
Revenue by standard classification - Chart A3
10/11 AUD 11/12 AUD 12/13 AUD CY 13/14 BUD CY 13/14 ADJ CY 13/14 FCST CY 13/14 ACT Budget Year 14/15 Budget Year +1 15/16 Budget Year +2 16/17
Electricity 5351628.52 7202314.23 7596123.07 8506361 8506361 8506361 8506361 9310584.02 10328250 11371948
Water 866420.17 565252.49 775038.07 901237 901237 901237 901237 1166396 1275158 1584025
Budget & Treasury Office 6093050.28 4795188.68 7449001.63 7267012 7267012 7267012 7267012 8432117 8498566 10303752.4
Road Transport 2289586.86 4333963.89 2494723.87 2672753 2672753 2672753 2672753 2970895.98 3510194 3909762
Waste Water Management 4123951.03 3164038.58 3046359.93 2146634 2146634 2146634 2146634 2805582 3307712 3695659
Public Safety 69586.98 80776.78 84925.59 82355 82355 82355 82355 111134 91269 98484
Sport and Recreation 452510.38 611960.17 508035.37 570873 570873 570873 570873 687128 688560 739438
Waste Management 566744.73 596194.11 2484615.69 2502913 2502913 2502913 2502913 3082570 3283770 3486482
Planning & Development 0 0 0 0 0 0 0 0 0 0
Community & Social Services 893475.19 965270.53 974850.023 1149099 1149099 1149099 1149099 1369344 1462061 1558841
Health 20892.88 21587.31 10886.63 21476 21476 21476 21476 57255 63171 68728
Housing 0 0 0 0 0 0 0 0 0 0
Executive & Council 18840751.46 19505528.96 17898381.9 17265906 17265906 17265906 17265906 21697748.94 25665498.87 25988691.87
Environmental Protection 0 0 0 0 0 0 0 0 0 0
Corporate Services 1249182.87 1376393.08 1657444.64 1899013 1899013 1899013 1899013 2088246 2232054 2374702
0
10000000
20000000
30000000
40000000
50000000
60000000
70000000
Rm
Expenditure by standard classification - Chart A4

Kareeberg Municipality 2017-2018 Annual Budget and MTREF
March 2017 #REF!
10/11 AUD 11/12 AUD 12/13 AUD CY 13/14 BUD CY 13/14 ADJ CY 13/14 FCST CY 13/14 ACT Budget Year 14/15Budget Year +1
15/16Budget Year +2
16/17
Planning & Development 0 0 0 0 0 0 0 0 0 0
Housing 0 0 0 0 0 0 0 0 0 0
Water 2036999.38 0 311637.9 0 0 0 0 12000000 20406000 1000000
Electricity 2939052.81 395 1119585.32 0 0 0 0 500000 0 400000
Road Transport 4316906.81 7611964 12746834 4189000 4189000 4189000 4189000 2750000 0 2201000
Waste Water Management 1346926.18 2267533.45 0 0 0 0 0 750000 0 0
Budget & Treasury Office 534990.63 231606.75 13853 0 0 0 0 0 0 4500000
Waste Management 1377431.46 0 0 0 0 0 0 0 3000000 0
Community & Social Services 54072 113611.24 262531.38 400000 400000 400000 400000 800000 0 0
Sport and Recreation 27100 26450 45150 4500000 4500000 4500000 4500000 3048000 4958000 0
Health 0 0 0 0 0 0 0 0 0 0
Executive & Council 0 0 0 0 0 0 0 0 0 0
Public Safety 0 0 0 0 0 0 0 0 0 0
Environmental Protection 0 0 0 0 0 0 0 0 0 0
Corporate Services 0 0 0 0 0 0 0 0 0 0
0
500000
1000000
1500000
2000000
2500000
3000000
3500000
4000000
4500000
5000000
Rm
Capital expenditure by Standard Classification - Chart A11
10/11 AUD 11/12 AUD 12/13 AUD CY 13/14 BUD CY 13/14 ADJ CY 13/14 FCST CY 13/14 ACT Budget Year 14/15 Budget Year +1 15/16 Budget Year +2 16/17
ROAD TRANSPORT 4316906.81 7611964 12746834 4189000 4189000 4189000 4189000 2750000 0 2201000
ELECTRICITY 2939052.81 395 1119585.32 0 0 0 0 500000 0 400000
WATER 2036999.38 0 311637.9 0 0 0 0 12000000 20406000 1000000
0
500000
1000000
1500000
2000000
2500000
3000000
3500000
4000000
4500000
5000000
Rm
Capital expenditure by Municipal Vote (Major) - Chart A9
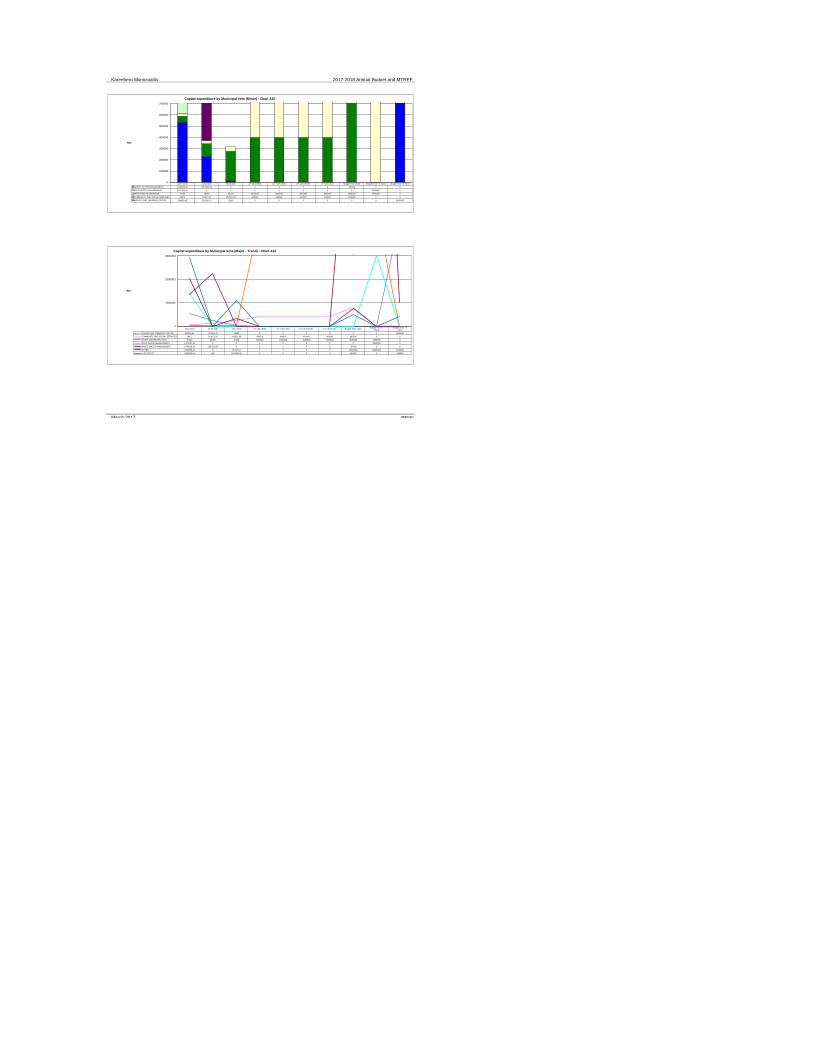
Kareeberg Municipality 2017-2018 Annual Budget and MTREF
March 2017 #REF!
10/11 AUD 11/12 AUD 12/13 AUD CY 13/14 BUD CY 13/14 ADJ CY 13/14 FCST CY 13/14 ACT Budget Year 14/15 Budget Year +1 15/16 Budget Year +2 16/17
WASTE WATER MANAGEMENT 1346926.18 2267533.45 0 0 0 0 0 750000 0 0
SOLID WASTE MANAGEMENT 1377431.46 0 0 0 0 0 0 0 3000000 0
SPORT AND RECREATION 27100 26450 45150 4500000 4500000 4500000 4500000 3048000 4958000 0
COMMUNITY AND SOCIAL SERVICES 54072 113611.24 262531.38 400000 400000 400000 400000 800000 0 0
BUDGET AND TREASURY OFFICE 534990.63 231606.75 13853 0 0 0 0 0 0 4500000
0
100000
200000
300000
400000
500000
600000
700000
Rm
Capital expenditure by Municipal Vote (Minor) - Chart A10
10/11 AUD 11/12 AUD 12/13 AUD CY 13/14 BUD CY 13/14 ADJ CY 13/14 FCST CY 13/14 ACT Budget Year 14/15Budget Year +1
15/16Budget Year +2
16/17
BUDGET AND TREASURY OFFICE 534990.63 231606.75 13853 0 0 0 0 0 0 4500000
COMMUNITY AND SOCIAL SERVICES 54072 113611.24 262531.38 400000 400000 400000 400000 800000 0 0
SPORT AND RECREATION 27100 26450 45150 4500000 4500000 4500000 4500000 3048000 4958000 0
SOLID WASTE MANAGEMENT 1377431.46 0 0 0 0 0 0 0 3000000 0
WASTE WATER MANAGEMENT 1346926.18 2267533.45 0 0 0 0 0 750000 0 0
WATER 2036999.38 0 311637.9 0 0 0 0 12000000 20406000 1000000
ELECTRICITY 2939052.81 395 1119585.32 0 0 0 0 500000 0 400000
0
1000000
2000000
3000000
Rm
Capital expenditure by Municipal Vote (Major - Trend) - Chart A12

Kareeberg Municipality 2017-2018 Annual Budget and MTREF
March 2017 #REF!
BUDGET AND TREASURY OFFICE0.0%
COMMUNITY AND SOCIAL SERVICES4.0%
SPORT AND RECREATION15.4%
SOLID WASTE MANAGEMENT0.0%
WASTE WATER MANAGEMENT3.8%
WATER60%
ROAD TRANSPORT13.9% ELECTRICITY
2.5%
2016/17 Budget YearCapital expenditure program per vote
BUDGET AND TREASURY OFFICE8.1%
COMMUNITY AND SOCIAL SERVICES1.4%SPORT AND RECREATION
14.4%
SOLID WASTE MANAGEMENT5.4%
WASTE WATER MANAGEMENT0.0%
WATER60%
ROAD TRANSPORT8.9%ELECTRICITY
1.6%
2016/17 MTREF (3 year total)Capital expenditure program per vote
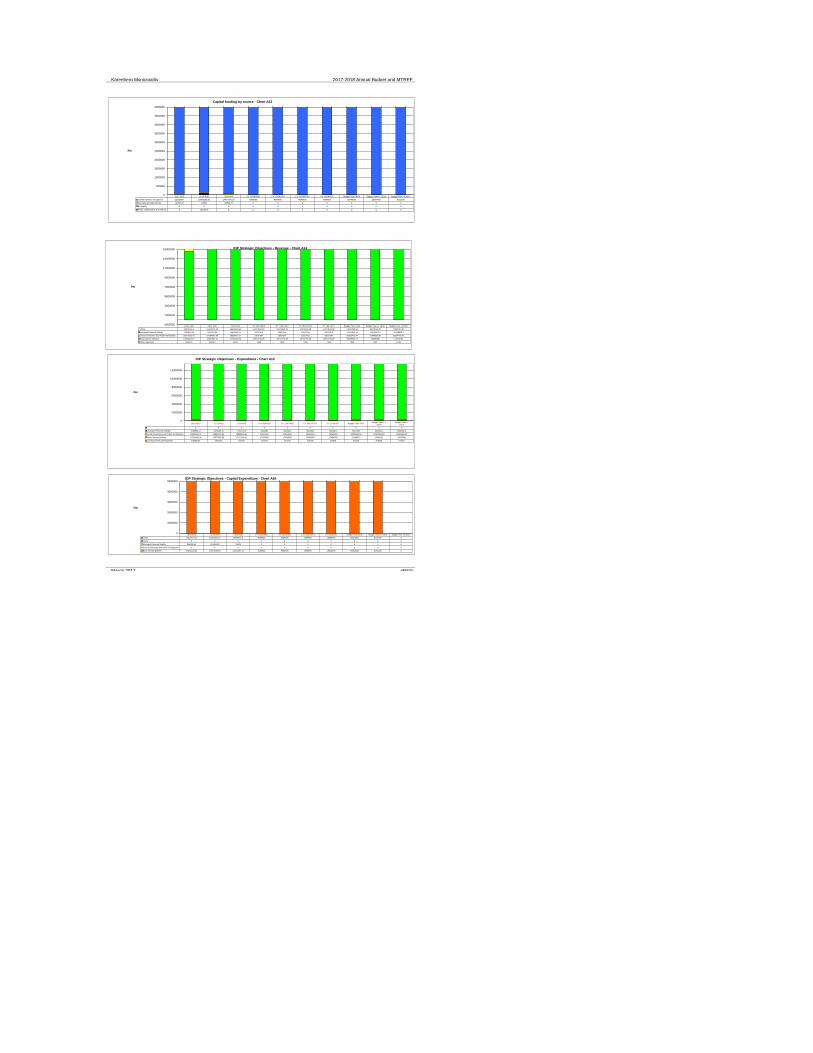
Kareeberg Municipality 2017-2018 Annual Budget and MTREF
March 2017 #REF!
10/11 AUD 11/12 AUD 12/13 AUD CY 13/14 BUD CY 13/14 ADJ CY 13/14 FCST CY 13/14 ACT Budget Year 14/15 Budget Year +1 15/16 Budget Year +2 16/17
Capital transfers recognised 12592687 10088202.92 14437056.35 9089000 9089000 9089000 9089000 19848000 28364000 8101000
Internally generated funds 40792.31 42060 62534.47 0 0 0 0 0 0 0
Borrowing 0 0 0 0 0 0 0 0 0 0
Public contributions & donations 0 121296.9 0 0 0 0 0 0 0 0
0
500000
1000000
1500000
2000000
2500000
3000000
3500000
4000000
4500000
5000000
Rm
Capital funding by source - Chart A13
10/11 AUD 11/12 AUD 12/13 AUD CY 13/14 BUD CY 13/14 ADJ CY 13/14 FCST CY 13/14 ACT Budget Year 14/15 Budget Year +1 15/16 Budget Year +2 16/17
check 50670161.6 51310179.35 56423485.63 52274632.48 52274632.48 52274632.48 52274632.48 71827000.94 86170264.07 70081512.87
Municipal Financial Viability 7053699.34 7624710.86 9861891.03 10027076 10027076 10027076 10027076 14154343.73 15828422.4 19188836.2
Good Governance and Public Participation 29027035.79 27284657.88 29356410.17 23527507 23527507 23527507 23527507 39156411.94 51448058.67 31304760.67
Basic Service Delivery 14553924.27 16367534.41 17154063.43 18712719.48 18712719.48 18712719.48 18712719.48 18508915.27 18886086 19579781
Other objectives 35502.2 33276.2 51121 7330 7330 7330 7330 7330 7697 8135
-1000000
1000000
3000000
5000000
7000000
9000000
11000000
13000000
15000000
Rm
IDP Strategic Objectives - Revenue - Chart A14
10/11 AUD 11/12 AUD 12/13 AUD CY 13/14 BUD CY 13/14 ADJ CY 13/14 FCST CY 13/14 ACT Budget Year 14/15Budget Year +1
15/16Budget Year +2
16/17
0 0 0 0 0 0 0 0 0 0
Municipal Financial Viability 5785059.17 4526350.25 7176117.92 6963362 6963362 6963362 6963362 8027398 8080942 9835495.4
Good Governance and Public Participation 20089934.33 20881922.04 19555826.54 19164919 19164919 19164919 19164919 23785994.94 27897552.87 28363393.87
Basic Service Delivery 13789499.36 16574585.58 17112392.52 17466585 17466585 17466585 17466585 20268570 22660212 25097461
Local Economic Development 238966.84 189225.5 167812 215048 215048 215048 215048 244126 258348 273517
0
2000000
4000000
6000000
8000000
10000000
12000000
Rm
IDP Strategic Objectives - Expenditure - Chart A15
10/11 AUD 11/12 AUD 12/13 AUD CY 13/14 BUD CY 13/14 ADJ CY 13/14 FCST CY 13/14 ACT Budget Year 14/15 Budget Year +1 15/16 Budget Year +2 16/17
check 12633479.27 10251560.44 14499591.6 9089000 9089000 9089000 19848000 28364000 8101000 0
check 0 0 0 0 0 0 0 0 0 0
Municipal Financial Viability 534990.63 110309.85 13853 0 0 0 0 0 0 0
Good Governance and Public Participation 0 0 0 0 0 0 0 0 0 0
Basic Service Delivery 12044416.64 10027639.35 14223207.22 9089000 9089000 9089000 19848000 28364000 8101000 0
0
1000000
2000000
3000000
4000000
5000000
Rm
IDP Strategic Objectives - Capital Expenditure - Chart A16

Kareeberg Municipality 2017-2018 Annual Budget and MTREF
March 2017 #REF!
10/11 AUD 11/12 AUD 12/13 AUD CY 13/14 BUD CY 13/14 ADJ CY 13/14 FCST CY 13/14 ACT Budget Year 14/15 Budget Year +1 15/16 Budget Year +2 16/17
Cash Flow - Op. Activities 4487192 10552104 16027313.78 7468018 7468018 7468018 7468018 21589452.06 29623038.05 9548711.274
Cash Flow - Investing (used) -12611314 -10121570.66 -14441447.57 -9079955 -9079955 -9079955 -9079955 -19838955 -28354955 -8091955
Cash Flow - Financing 19210 24370 15360 29000 29000 29000 29000 29000 29000 29000
-4500000
-2500000
-500000
1500000
3500000
Rm
IDP Strategic Objectives - Revenue - Chart A14
10/11 AUD 11/12 AUD 12/13 AUD CY 13/14 BUD CY 13/14 ADJ CY 13/14 FCST CY 13/14 ACTBudget Year
14/15Budget Year +1
15/16Budget Year +2
16/17
% incr total service charges (incl prop rates) 0 0.095687137 0.065293654 0.116029797 0.116029797 0.116029797 0.116029797 -0.007164475 0.032917493 0.0355748
% incr Property Tax 0 -0.019054876 0.10318645 0.154870557 0.154870557 0.154870557 0.154870557 -0.166261217 0.088439352 0.032522054
% incr Service charges - electricity revenue 0 0.2025364 0.037907296 0.176126205 0.176126205 0.176126205 0.176126205 -0.014037221 0.064573585 0.040766533
% incr Service charges - water revenue 0 0.09242279 0.070209261 0.0453495 0.0453495 0.0453495 0.0453495 0.09197336 -0.064558061 0.070248531
% incr Service charges - sanitation revenue 0 0.069443391 0.085497651 0.045825953 0.045825953 0.045825953 0.045825953 0.060748531 0.009981608 0.029985197
% incr Service charges - refuse 0 0.075726634 0.054089274 0.056218859 0.056218859 0.056218859 0.056218859 0.105207319 0.023273108 -0.007250658
% incr in Service charges - other 0 0 0 0 0 0 0 0 0 0
-0.2
-0.15
-0.1
-0.05
0
0.05
0.1
0.15
0.2
Rm
Service charges - Revenue % change - Chart A22
10/11 AUD 11/12 AUD 12/13 AUD CY 13/14 BUD CY 13/14 ADJ CY 13/14 FCST CY 13/14 ACT Budget Year 14/15 Budget Year +1 15/16 Budget Year +2 16/17
Annual Debtors Collection 0 0.46896638 1.142374156 0.942417568 0.900606863 0.900606867 0.900606863 0.900606863 0.922705376 0.931585073
O/S Debtors to Revenue 0 0.050076649 0.051828378 0.140294736 0.140294733 0.140294736 0.140294736 0.116386843 0.075720137 0.006935912
0
0.2
0.4
0.6
0.8
1Revenue collection - Chart A18

Kareeberg Municipality 2017-2018 Annual Budget and MTREF
March 2017 #REF!
10/11 AUD 11/12 AUD 12/13 AUD CY 13/14 BUD CY 13/14 ADJ CY 13/14 FCST CY 13/14 ACT Budget Year 14/15 Budget Year +1 15/16 Budget Year +2 16/17
Electricity 0.1353 0.142873993 0.145780144 0.1296 0.1296 0.1296 0.1296 0.1066 0.1066 0.1066
Water 0 0 0 0 0 0 0 0 0 0
0
0.2
0.4
0.6
0.8
1
Distribution losses - Chart A19
10/11 AUD 11/12 AUD 12/13 AUD CY 13/14 BUD CY 13/14 ADJ CY 13/14 FCST CY 13/14 ACT Budget Year 14/15 Budget Year +1 15/16 Budget Year +2 16/17
Employee costs 0.251114752 0.267198164 0.296839631 0.322217653 0.322217646 0.322217653 0.322217653 0.295858033 0.288138728 0.286303076
Remuneration 0.036194848 0.038917405 0.040310377 0.043551198 0.043551197 0.043551198 0.043551198 0.038842262 0.036805354 0.036178678
Repairs & Maintenance 0.012268655 0.012699437 0.010231926 0.009984802 0.009984802 0.009984802 0.009984802 0.008295658 0.007834981 0.010841037
Finance charges & Depreciation 0.083466926 0.090894877 0.093844342 0.05730429 0.057304289 0.05730429 0.05730429 0.080843512 0.076085198 0.100943478
0
0.1
0.2
0.3
0.4
Expenditure analysis (of Total Revenue) - Chart A21
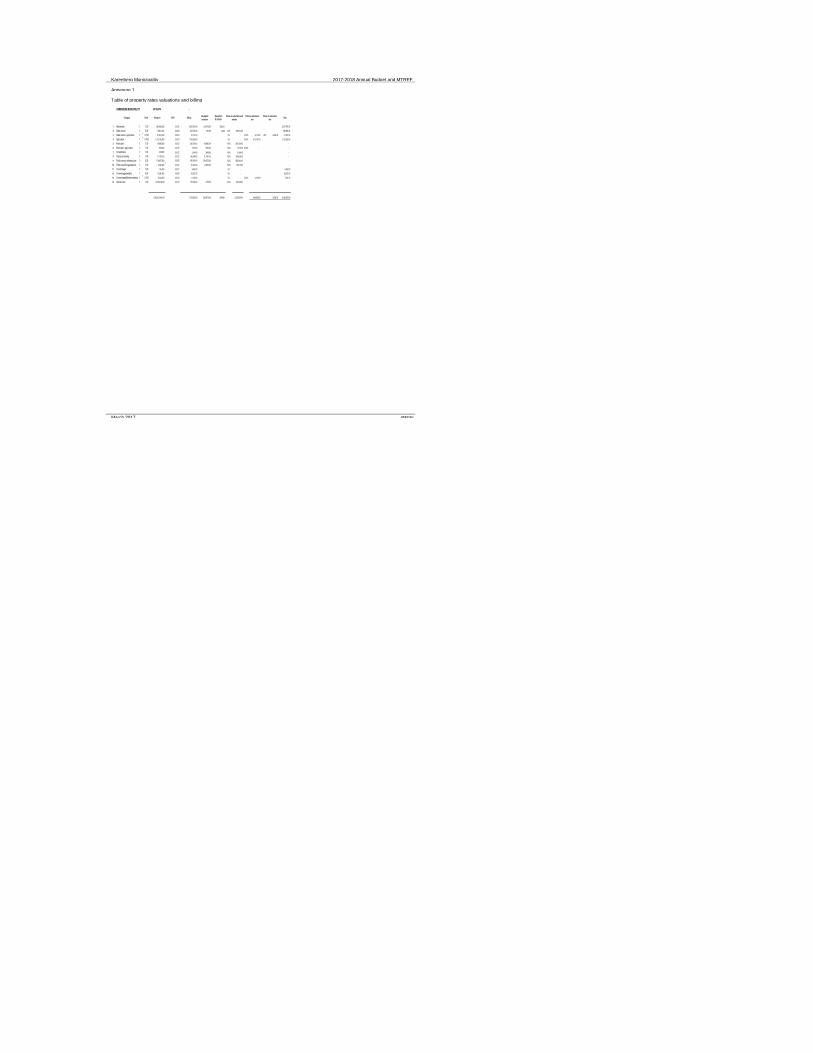
Kareeberg Municipality 2017-2018 Annual Budget and MTREF
Annexure 1
Table of property rates valuations and billing
March 2017 #REF!
KAREEBERG MUNICIPALITY 2013-2014 -
Category Ratio Valuation Tafiff Billing Exempted
valuation
Exemption
R 15 000 < Total
1 Residential 1 : 1.00 284,662,600 0.0127 3,607,244.00 23,074,600 292,401 3,347,757.00
2 State owned 1 : 2.00 19,841,300 0.0253 502,720.00 90,000 2,280 20% 100,544.00 399,896.00
3 State owned - agriculture 1 : 0.100 21,851,400 0.0013 27,751.00 0% - 35.0% 9,712.00 20% 3,608.00 14,431.00
4 Agriculture 1 : 0.100 1,372,750,600 0.0013 1,743,393.00 0% - 35.0% 610,187.00 1,133,206.00
5 Municipal 1 : 1.00 18,998,000 0.0127 240,704.00 18,998,000 100% 240,704.00 -
6 Municipal - agriculture 1 : 1.00 553,300 0.0127 7,010.00 553,300 100% 7,010.00 35.0% - -
7 Schietfontein 1 : 1.00 249,800 0.0127 3,164.00 249,800 100% 3,164.00 -
8 Places of worship 1 : 1.00 11,100,100 0.0127 140,638.00 11,100,100 100% 140,638.00 -
9 Public service infrastructure 1 : 0.25 176,657,500 0.0032 560,004.00 176,657,500 100% 560,004.00 -
10 Public benefit organizations 1 : 1.00 2,384,000 0.0127 30,210.00 2,384,000 100% 30,210.00 -
11 Commonage 1 : 1.00 750,000 0.0127 9,502.00 0% - 9,502.00
12 Commonage(rentals) 1 : 0.55 13,290,900 0.0070 92,637.00 0% - 92,637.00
13 Commonage(Boshmansberg) 1 : 0.100 9,244,200 0.0013 11,740.00 0% - 35.0% 4,109.00 7,631.00
14 Sports clubs 1 : 1.00 10,003,700.00 0.0127 126,746.00 740,600 100% 126,746.00 -
1,942,337,400.00 7,103,463.00 233,847,900 294,681 1,209,020.00 624,008.00 3,608.00 5,005,060.00
Phase in reductions and
rebates
Phase in reductions
and
Phase in reductions
and

Kareeberg Municipality 2017-2018 Annual Budget and MTREF
Annexure 2
SANITATION SERVICES
Nightsoil
Nightsoil R101.06 per user per month per service.
Refuse
R125.21 per user per month per service.
Sewarage
R193.77 per month (Scheme, Bonteheuwel) R2,501.13per month (Carel van Zyl)
Vacuum tanks
R141.81 per suction.R208.95 per suction - Government.PLUS 100% after hours
Government - R750.34 per month (School and Hospital - Carnarvon).ACVV - R100.00 per month (Old Age Home - Carnarvon).Municipal – R156.10 per suction.
Garden waste
R171.02 per load
ELECTRICITYDomestic user
A monthly charge of R102.60 per user plus cent per kWh usage as indicated below.
Churches, Halls, Sport Clubs and Agricultural Union
A monthly charge of R107.00 per user plus cent per kWh usage as indicated below.
Schools, School Hostels and Old Aged Homes
A monthly charge of R535.00 per user plus cent per kWh usage as indicated below.
Other users (commercial)
A monthly charge of R535.00 per user plus cent per kWh usage as indicated below.
Category cent
Tariff - conventional
0 - 50kWh 85.00 51 - 350kWh #####351 - 600kWh #####>600kWH #####Commercial >2 000kWh #####Tariff - prepaid
0 - 50kWh 85.00 51 - 350kWh #####351 - 600kWh #####>600kWH #####
March 2017 #REF!

Kareeberg Municipality 2017-2018 Annual Budget and MTREF
Annexure 2
TELKOM booths
A monthly charge of R90,78
Availability Charges
Municipal usage
R0.93 per kWh.
WATER
Availability Charges
R 23.59 per month.
R 41,69 per user per month where such user is only serviced by a stand pipe.
Where no water metres are installed.: R 61.01 per month.
A monthly levy of R 140.00 per user PLUS
Usage
0 - 6 kl.: 1.26R 7 - 20 kl.: 1.51R 21 - 50 kl.: 3.57R Above 50 kl.: 6.47R
Municipal usage: R0.66 per kl.
NOTE: All tariffs exclude VAT.
March 2017 #REF!
R100.68 per month payable by the owner of each property with or without improvements who is not connected to the council’s electricity distribution
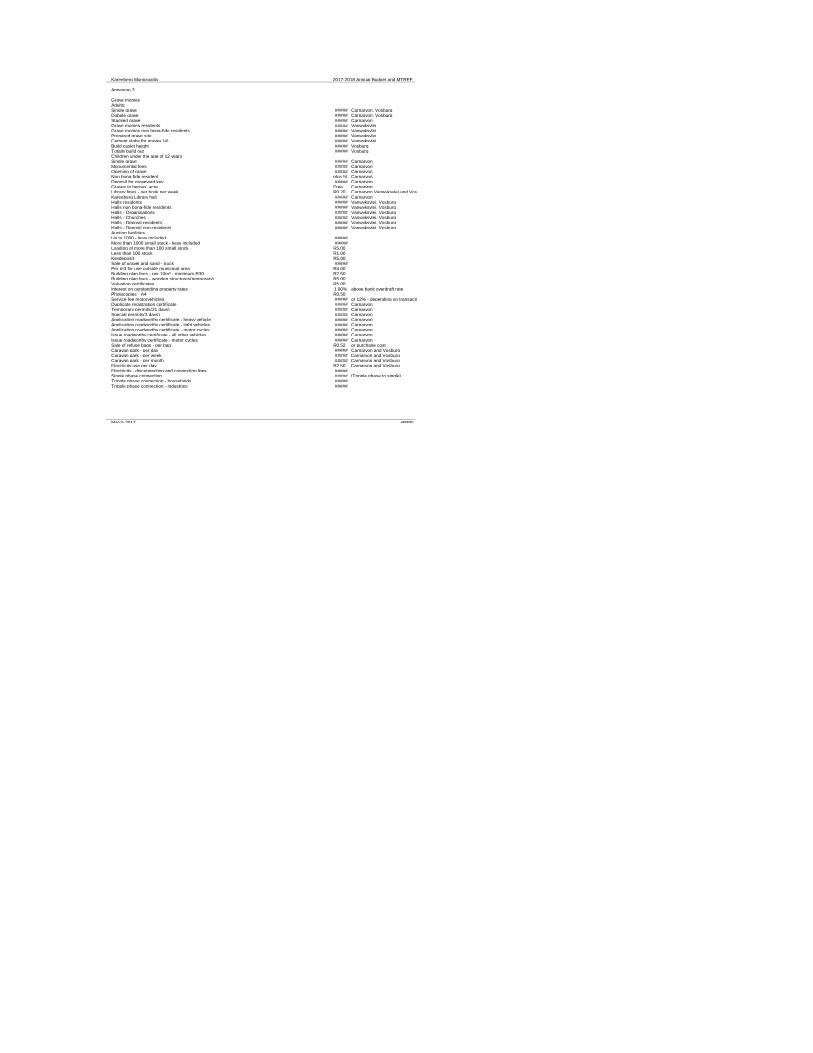
Kareeberg Municipality 2017-2018 Annual Budget and MTREF
Annexure 3
Grave moniesAdults:Single grave ##### Carnarvon, VosburgDobule grave ##### Carnarvon, VosburgStacked grave ##### CarnarvonGrave monies residents ##### VanwyksvleiGrave monies non bona-fide residents ##### VanwyksvleiPrepared grave site ##### VanwyksvleiCement slabs for graves (4) ##### VanwyksvleiBuild caskit height ##### VosburgTotally build out ##### VosburgChildren under the age of 12 yearsSingle grave ##### CarnarvonMonumental fees ##### CarnarvonOpening of grave ##### CarnarvonNon bona-fide resident plus 50%CarnarvonDeposit for graveyard key ##### CarnarvonGraves in heroes' acre Free CarnarvonLibrary fines - per book per week 0.20R Carnarvon,Vanwyksvlei and VosburgKareeberg Library hall ##### CarnarvonHalls residents ##### Vanwyksvlei, VosburgHalls non bona-fide residents ##### Vanwyksvlei, VosburgHalls - Organisations ##### Vanwyksvlei, VosburgHalls - Churches ##### Vanwyksvlei, VosburgHalls - Deposit residents ##### Vanwyksvlei, VosburgHalls - Deposit non-residents ##### Vanwyksvlei, VosburgAuction facilitiesUp to 1000 - keys included #####More than 1000 small stock - keys included #####Loading of more than 100 small stock 5.00R Less than 100 stock 1.00R Keydeposit 5.00R Sale of gravel and sand - truck #####Per m3 for use outside municipal area 4.00R Building plan fees - per 10m² - minimum R30 2.50R Building plan fees - wooden structures(temporary) 5.00R Valuation certificates 5.00R Interest on outstanding property rates 1.00% above bank overdraft ratePhotocopies - A4 0.50R Service fee motorvehicles ##### or 12% - depending on transactionDuplicate registration certificate ##### CarnarvonTemporary permits(21 days) ##### CarnarvonSpecial permits(3 days) ##### CarnarvonApplication roadworthy certificate - heavy vehicle ##### CarnarvonApplication roadworthy certificate - light vehicles ##### CarnarvonApplication roadworthy certificate - motor cycles ##### CarnarvonIssue roadworthy certificate - all other vehicles ##### CarnarvonIssue roadworthy certificate - motor cycles ##### CarnarvonSale of refuse bags - per bag 0.52R or purchase costCaravan park - per day ##### Carnarvon and VosburgCaravan park - per week ##### Carnarvon and VosburgCaravan park - per month ##### Carnarvon and VosburgElectricity use per day 2.50R Carnarvon and VosburgElectricity - disconnection and connection fees #####Single phase connection ##### (Tripple phase to single)Tripple phase connection - households #####Tripple phase connection - industries #####
March 2017 #REF!

Kareeberg Municipality 2017-2018 Annual Budget and MTREF
Annexure 3
Change of single to tripple phase (consumer )- Households #####- Industries #####Registration certificate - electrician(Section 73)per registration 3.00R Registration certificate - electrician(Section 73)per renewal 2.00R Temporary registration certificate - electrician #####Water - disconnection and connection fees #####Water - house connection #####Testing of meter Actual costs of SABS
Pump of drains outside Municipal area 5.00R per km plus Consumer deposits #####Game nets - per day #####Concession use #####Application for resoning #####Application for deviation - up to 500 m² #####Application for deviation - 500 - 750 m² #####Application for deviation - larger than 750 m² #####Appication for subdivision #####Trade lisences - only application fees - item 1 and 2 #####Trade lisences - only application fees - item 3 #####Swimming pool 2.00R Grazing rights - per month (2 horses/donkeys) 3.00R Administration fees - number plates 5.00R Hawkers fee - per day #####Use of vehicle testing terain(2 hours) #####Stand rent 5.00R VanwyksvleiInsurance self build housing 7.70R VanwyksvleiRent - council home - per month ##### VanwyksvleiRent club house ##### VosburgDeposit clubhouse ##### VosburgRent sports grounds ##### VosburgRent - council home - per month ##### VosburgRent - council hut 1 and 2 - per month ##### VosburgRent - council hut 3 - per month ##### VosburgRent - council hut 1 - room - per month ##### VosburgFaxes received 6.00R VosburgIrrigation water - per month per erf ##### VosburgReplacement of fuses during working hours ##### VosburgReplacement of fuses after hours ##### Vosburg
NOTE: All tariffs exclude VAT.
March 2017 #REF!
Kareeberg Municipality 2017-2018 Annual Budget and MTREF
2.14 Municipal manager’s quality certificate
W. de BruinMunicipal Manager of Kareeberg Municipality (NC074)Signature ______________________________________________Date _____________________________
I, Willem de Bruin, municipal manager of Kareeberg Municipality, hereby certify that the draft annual budget and supporting documentation have
Related Documents