Welcome message from author
This document is posted to help you gain knowledge. Please leave a comment to let me know what you think about it! Share it to your friends and learn new things together.
Transcript

Applied Studies in Agribusiness and Commerce
Official Periodical of the International MBA Networkin Agribusiness and Commerce AGRIMBA
Vol. 8. Numbers 2–3. 2014
2
Editor in Chief:
Prof. Dr. dr. Hc. Wim Heijman, Wageningen University, The Netherlands
Deputy Editor:
Prof. Dr. dr. Hc. András Nábrádi, University of Debrecen, Hungary
Executive Editorial Board:
Dr. Andrei Babenko, Tomsk State University, Russia, Dr. Elena Kovtun National University of Life and Environmental Sciences of Ukraine, Ukraine
Dr. Erdenechuluun Tumur Mongolian State University, Mongolia, Dr. Guzalia Klychova, Kazan State Agrarian University, Russia,Dr. Ivana Ticha, Czech University of Life Sciences Prague, Czeh Republik, Dr. Josip Juracak, University of Zagreb, Croatia
Dr. Kalna Dubinyuk Tetyana, NULES Kiev, Ukraine, Dr. Ksenia Matveeva, Kazan State Agrarian University, RussiaDr. László Kárpáti, California Consulting, Ltd. Hungary, Dr. Mario Njavro, University of Zagreb, Croatia,
Dr. Olena Slavkova, Sumy National Agrarian University, Ukraine, Dr. Olga Lisova , Stavropol State Agrarian University, RussiaDr. Shamil Validov, Kazan Federal University, Russia, Dr. Svyatoslav Serikov, Stavropol State Agrarian University, Russia
Dr. Tatiana Litvinenko, Belgorod State Agricultural Academy, Russia, Prof. Dr. David McKenzie, Scotland Rural College, Aberdeen, UKProf. Dr. dr. Hc. Peter Bielik, Slovak Univerity of Agriculture, Slovakia, Prof. Dr. Breslavets Pavel, Belgorod State Agricultural Academy, Russia
Prof. Dr. Bruce Ahrendsen, University of Arkansas Fayetteville, USA, Prof. Dr. dr. Hc. Jan Hron, Czech University of Life Sciences Prague, Czeh Republic
Prof. Dr. Dragoljub Janković, Mediterranean University, Montenegro, Prof. Dr. Edward Majewski, University of Life Sciences Warsaw, Poland
Prof. Dr. Zorica Vasilević, University of Belgrade, Serbia
Honorary Editors:
Dr. Akimi Fujimoto, Tokio University of Agriculture, Japan, Dr. Garth Entwistle, Scotland Rural College, Aberdeen, UK,Dr. Jim Booth, Aberdeen, Scotland, UK, Dr. Judit Ipate, Romanian Academy of Sciences CSRAB, Bucharest, Romania
Dr. Mary McCarthy, University College Cork, Ireland, Dr. Ranjith Ihalanayake, Victoria University, Melbourne, Australia, Dr. Robert Kowalski, University of Wolverhampton, UK, Dr. Simon Heath, ICA, Gent, Belgium,
Prof. Dr Drago Cvijanović, Balkan Scientific Association of Agricultural Economists, SerbiaProf. Dr. Ajay Kr. Singh, Delhi School of Professional Studies and Research Delhi, India,
Prof. Dr. Anu Singh, Guru Gobind Singh Indraprastha University, India, Prof. Dr. Csaba Forgács, Corvinus Universty, HungaryProf. Dr. Danilo Tomic, Serbian Association of Agricultural Economists, Belgrade, Serbia,
Prof. Dr. dr. Hc. Harald von Witzke, Humbold University, Berlin, Germany, Prof. Dr. dr. Hc. Mark Cochran, University of Arkansas, Fayetteville USA, Prof. Dr. dr. mpx. Hc. Dr. Csaba Csáki, Corvinus University, Budapest, Hungary, Prof. Dr. dr. mpx. Hc. József Popp, University of Debrecen, Hungary,
Prof. Dr. Drago Cvijanović, Balkan Scientific Association of Agricultural Economists, Serbia Prof. Dr. Elena Botezat, University of Oradea, Romania, Prof. Dr. Govind Prasad Acharya, Tribhuvan University, Kathmandu Nepal, Prof. Dr. Harry Bremmers, Wageningen University, The Netherlands,
Prof. Dr. K.V. Bhanu Murthy, University of Delhi, India, Prof. Dr. Mária Vincze, University of Babes Bolyai, Cluj, Napoca, Romania, Prof. Dr. Nebojsa Novković, University of Novi Sad, Serbia, Prof. Dr. Patrick De Groote, Hasselt University, Belgium,Prof. Dr. Qin Fu, Chinese Academy of Agricultural Sciences, Bejing, China, Prof. Dr. Ramesh B., Goa University, India,
Prof. Dr. Reiner Doluschitz, Hohenheim University, Stuttgart, Germany, Prof. Dr. Slobodan Ceranić, University of Belgrade, Serbia,Prof. Dr. Xavier Gellynck, University Gent, Belgium, Prof. Dr. Zoltán Lakner, Corvinus University, Hungary
Prof. Dr. Zoltán Szakály, University of Debrecen, Hungary
Reviewer Board:
Dr. Andras Nabradi; Dr. Attila Bai; Dr. Erika Könyves; Dr. Hajnalka Madai; Dr. Ildikó Dékánné Orbán; Dr. János Felföldi; Dr. Josip Juracak; Dr. Katalin Takácsné György; Dr. László Stündl;
Dr. Judit Katonáné Kovács; Krisztián Kovács; Prof. Dr. Bruce Ahrendsen; Prof. Dr. Danilo Tomić; Dr. László Szöllôsi; Dr. Lászó Váradi; Dr. Miklós Pakurár; Dr. Orsolya Szigeti; Dr. Péter Balogh;
Dr. Szabolcs Duleba; Dr. Vörös Péter; Dr. Zsolt Csapó; Dr. Zsolt Polerecki; Fodor Zoltán; Prof. Dr. dr. Hc.Wim Heijman; Prof. Dr. Harry Bremmers; Prof. Dr. Zorica Vasiljević
English Editor:
Dr. Troy B. Wiwczaroski, University of Debrecen, HungaryGeorge Seel, University of Debrecen, Hungary
Associate Editor:
Krisztián Kovács, University of Debrecen, HungaryThis number is published with the financial support of
University of Debrecen, Faculty of Economics and Business, Hungary
APPLIED STUDIES IN AGRIBUSINESS AND COMMERCEOfficial Periodical of the International MBA Network in Agribusiness and Commerce
Editorial office: Debrecen University, H-4015 P.O. Box 36.Phone, fax: + (36-52) 526-935
Executive publisher: Agroinform Publishing House Hungary – www.agroinform.huTypography: Opal System Graphics www.opalsystem.com
HU-ISSN 1789-221X – Electronic Version: ISSN 1789-7874Home Page: http://www.apstract.net @ E-mail: [email protected]
Listed by the following directories: AgEcon search, LogEc, RePec, IDEAS, Cabell’s Directoties, CitEc
3
ContentsSCIENTIFIC PAPERS
Potential of vertical and horizontal integration in the hungarian fish Product chain István Szűcs & László Szőllősi . . . . . . . . . . . . . . . . . . . . . . . . . . . . . . . . . . . . . . . . . . . . . . . . . . . . . . . . . . . . . . . . . . . . . . . . . . . . . . 5
some thoughts on the rePayment methods of hungarian household forex loans Barbara Sepsi & Veronika Fenyves . . . . . . . . . . . . . . . . . . . . . . . . . . . . . . . . . . . . . . . . . . . . . . . . . . . . . . . . . . . . . . . . . . . . . . . . . . 17
the Possibilities of energetic aPPlicability and economic evaluation of graPe in the szentantalfa townshiP József Brazsil, Gábor Pintér & Mihály Veszelka . . . . . . . . . . . . . . . . . . . . . . . . . . . . . . . . . . . . . . . . . . . . . . . . . . . . . . . . . . . . . . . . 25
a comParative analysis of the Profitability of PineaPPle-mango blend and PineaPPle fruit juice Processing in ghana Michael K. Asante & John K. M. Kuwornu . . . . . . . . . . . . . . . . . . . . . . . . . . . . . . . . . . . . . . . . . . . . . . . . . . . . . . . . . . . . . . . . . . . . . 33
the characteristics of consumer attitudes in the food market in hungary Mihály Soós, Sára Szabó & Zoltán Szakály . . . . . . . . . . . . . . . . . . . . . . . . . . . . . . . . . . . . . . . . . . . . . . . . . . . . . . . . . . . . . . . . . . . . 43
examination of enterPreneurshiP ecosystem in debrecen from the direction of oPen innovation sPaces Adrienn Horváth . . . . . . . . . . . . . . . . . . . . . . . . . . . . . . . . . . . . . . . . . . . . . . . . . . . . . . . . . . . . . . . . . . . . . . . . . . . . . . . . . . . . . . . . . 51
concePtions and misconcePtions of hostels worldwide Réka Somlai . . . . . . . . . . . . . . . . . . . . . . . . . . . . . . . . . . . . . . . . . . . . . . . . . . . . . . . . . . . . . . . . . . . . . . . . . . . . . . . . . . . . . . . . . . . . . 61
oPtimised dairy cow feeding economy in hungary András Halász & Edit Jónás . . . . . . . . . . . . . . . . . . . . . . . . . . . . . . . . . . . . . . . . . . . . . . . . . . . . . . . . . . . . . . . . . . . . . . . . . . . . . . . 69
technical efficiency analysis of maize Production: evidence from ghana Beatrice Bempomaa . . . . . . . . . . . . . . . . . . . . . . . . . . . . . . . . . . . . . . . . . . . . . . . . . . . . . . . . . . . . . . . . . . . . . . . . . . . . . . . . . . . . . . 73
on the conveyor belt of Public emPloyment Programs between 2009 and 2013 in hajdúböszörmény Judit Oláh & Andrea Szabó . . . . . . . . . . . . . . . . . . . . . . . . . . . . . . . . . . . . . . . . . . . . . . . . . . . . . . . . . . . . . . . . . . . . . . . . . . . . . . . . . 81
the labour market Position of PeoPle with disabilities and with a reduced work caPacity after the change of regime Balázs-Földi Emese . . . . . . . . . . . . . . . . . . . . . . . . . . . . . . . . . . . . . . . . . . . . . . . . . . . . . . . . . . . . . . . . . . . . . . . . . . . . . . . . . . . . . . . 89
the economic efficiency of aPPle Production in terms of Post-harvest technology Viktor Szabó . . . . . . . . . . . . . . . . . . . . . . . . . . . . . . . . . . . . . . . . . . . . . . . . . . . . . . . . . . . . . . . . . . . . . . . . . . . . . . . . . . . . . . . . . . . . . 99
the effect of logistic controlling on business Processes Szilvia Berek Méhesné . . . . . . . . . . . . . . . . . . . . . . . . . . . . . . . . . . . . . . . . . . . . . . . . . . . . . . . . . . . . . . . . . . . . . . . . . . . . . . . . . . . . . 107
consumer aPProach of health and ayurveda Sára Szabó, Viktória Szente, Zoltán Szakály & András Nábrádi . . . . . . . . . . . . . . . . . . . . . . . . . . . . . . . . . . . . . . . . . . . . . . . . . . . . 113
defining the strategic objectives of hungarian mutton Product chain and elements of marketing strategy in the beginning of the second decade of the century András Nábrádi, Béla Cehla, Orsolya Szigeti & Zoltán Szakály . . . . . . . . . . . . . . . . . . . . . . . . . . . . . . . . . . . . . . . . . . . . . . . . . . . . 119
hungarian sPirits Pálinka as a “hungaricum” i . literature review and Practical approaches Imre Milán Harcsa, András Nábrádi & Ildikó Tar . . . . . . . . . . . . . . . . . . . . . . . . . . . . . . . . . . . . . . . . . . . . . . . . . . . . . . . . . . . . . . . 133
economic, Practical imPacts of Precision farming – with esPecial regard to harvesting Ágnes Szolnoki & András Nábrádi . . . . . . . . . . . . . . . . . . . . . . . . . . . . . . . . . . . . . . . . . . . . . . . . . . . . . . . . . . . . . . . . . . . . . . . . . . . 141
dairy farms efficiency analysis before the quota system abolishment Krisztián Kovács . . . . . . . . . . . . . . . . . . . . . . . . . . . . . . . . . . . . . . . . . . . . . . . . . . . . . . . . . . . . . . . . . . . . . . . . . . . . . . . . . . . . . . . . . 147
INFORMATION FOR AUTHORS . . . . . . . . . . . . . . . . . . . . . . . . . . . . . . . . . . . . . . . . . . . . . . . . . . . . . . . . . . . . . . . . . . . . . . . . . . . . 159
APSTRACT Vol. 8. Number 2–3. 2014 pages 5–15 ISSN 1789-7874
Introduction
It has become evident by now that marine and inland catch-ments of fish cannot be increased any further, and that the global demand for fish and fishery products is increasingly becoming to be satisfied with products coming from the aqua-cultures. As a consequence of this and several other factors, aquaculture – i.e. the production of aquatic organisms – has by now become the most rapidly developing sector of food industry in the world.
The fish production sector in Hungary has three indepen-dent sub-sectors: (1) aquaculture (extensive and intensive), (2) inland fisheries (fulfilling commercial, recreational and restocking functions) and (3) fish processing and trade. These areas are also included in the CFP1 and the EMFF2 of the Eu-ropean Commission. The two major fields of aquaculture are (a) extensive pond fish farming and (b) intensive industrial fish production. While the former type of production is large-ly exposed to risks caused by the weather, the production of the latter type can fully be programmed, which makes a big difference between them. Another base of national fish pro-cessing is provided by the direct economic utilization of the
production potentials of the natural waters (as large as 141 thousand hectares), which serves two major production aims: (a) commerce and (b) recreation. Fish processing in Hungary is mainly directed at primary processing which implies a low level of added value creation, though. The per capita fish con-sumption in Hungary keeps, slowly though, increasing year by year (5.1 kg/capita/year). This is significantly below the EU average (23.3 kg/capita/year), and ranks our country the last but one on the list of the 27 EU states (EU EC, 2012).
Domestic fish production sector to date is responsible for some 2.5–2.8% of the gross output (GO) of domestic live-stock production in Hungary, and for about 1% of the total of the GO of domestic agricultural production. In terms of gross added value (GVA), the GVA of the entire fish produc-tion sector3 in year 2011 totalled 3.6 billion HUF. This equals 0.015% of the GVA of the entire national economy; 0.34% of the GVA of agriculture; and 2.4% of the GVA of livestock production. The significance of the fish production sector, however, reaches far beyond what these figures may indicate: it provides the underpinning of a number of supplies and ser-vices sectors, of the predominant part of the entire recreational fishing and angling sector, and of several environment and
Potential of vertical and horizontal integration
in the hungarian fish Product chainIstván Szűcs & László Szőllősi
University of Debrecen
Abstract: After the economic and political transformation, the output and resource utilization of the Hungarian fish production sector decreased less than in other livestock sectors, and it managed to preserve its income position. As a consequence of the relatively low level of the implemented innovative developments, though, for all the EU assistance available the cooperation efforts did not prove to be very efficient. The relatively favourable income position of several farms led them to a kind of “leisureliness”, and as a result, the level of the applied production technology in many cases did not even reach that of the 1970s. All these circumstances led to the degradation of the innovations and to the expiration of the horizontal and vertical integrations in the sector, leaving the commercial and cooperation forms being typical in an otherwise stabile classical free-market environment. Problems were further increased – amongst other things – by the volatile cereal prices, 27% VAT rate, and the introduction of road toll. After long years, certain farms were to face losses, and the decline of profitability at sectorial level, thus the need for innovation and producers’ co-operations has become imperative. As a solution option to these problems, a model of a product chain containing both horizontal and vertical elements and comprising the entire sector has been developed. Present study introduces this new model, which is established on foreign examples primarily, but takes the Hungarian specialities into account too.
Keywords: aquaculture and fisheries, fish product chain, innovation, cooperation, horizontal and vertical integration
Applied Studies in Agribusiness and Commerce – APSTRACTAgroinform Publishing House, Budapest scientific PaPers
1 Common Fisheries Policy 2 European Maritime and Fisheries Fund 3 Including aquaculture and inland fisheries
6 IstvánSzűcs&LászlóSzőllősi
APSTRACT Vol. 8. Number 2–3. 2014 pages 5–15 ISSN 1789-7874
nature preservation programs coupled with all their implied economic and social outputs.
Fish in Hungary in recent years has been predominantly produced by extensive fish ponds, and by intensive fish farms using geothermic energy in the first place. The decline of ma-rine fishing, though, will probably open new market potentials for closed recirculating fish production systems that use water as a medium of production. Aquacultures in Hungary produce mainly Common carp, herbivorous fish species (Bighead carp and Silver carp, Grass carp) and predatory fish (European cat-fish, Pikeperch, Pike) feeding on the natural food supplies of the fish ponds and on supplementary feed. The most important product of domestic intensive fish production using complete feedstuffs is the African catfish, but the volume of Sturgeon produced by similar technology also keeps increasing.
Some 85–88% of the 14–16 thousand tons of the domes-tic fish for food production in Hungary comes from the pond fish cultures (26.1 thousand active water surface areas); the remaining volume is produced by intensive fish production systems (mainly RAR systems) using advanced production technologies. While the annual volume of the output of the aquacultures in Hungary is heavily affected by the whether due to the large share of pond systems, the actual output aver-age has been showing a moderately rising tendency over the past 5–10 years. In terms of statistics, the gross output of fish production sector in 2012 totalled nearly 21.5 million tons, 15 thousand tons of which were contributed by fish for food with 2 349 tons of that coming from intensive production systems (Bojtárné 2013).
The fish production sector in Hungary is only partly capa-ble of satisfying current customers demand for fish – Common carp and other carp species (cyprinids), and African catfish in the first place –, especially so in terms of assortment and qual-ity. The ever growing customer demand, therefore, can only be satisfied by the importation of fish and fisheries products. The volume of imports of fish and fisheries products exceeds exports by 14 times both in terms of quantity and value.
Fortunately, the political and economic changes taking place in Hungary in the nineties did not hit the fish production sector (gross output, production infrastructure etc.) as heavily as the other sectors of the livestock husbandry. The organi-zational frames and the market channels of the fish produc-tion sector, however, were significantly restructured. Due to the solid technological background and to the survival of the product chains established in the early eighties, though, fish production sector managed to sustain its profitability, relying basically on the pond fish production. The privatization of the fish ponds that used to be owned by earlier cooperatives and state farms proved to be successful in the nineties; most of them were bought up by professional investors, which was interpreted by many as a “guarantee of future success”. For all the domestic consumption stuck at a low level, the absorp-
tion capacity of the domestic market remained to be stable and reliable thanks to the secure international export markets (Germany, Poland, e.g.) and due to the dropping out of some larger competitor companies (failed business management and new trustees, e.g. in Biharugra). The appearance of the multinational retail chains caused certain temporary prob-lems to the specific profitability of the sector, the growth of the “angling market”, however, was able to provide ample compensation for these losses. There were some undesirable processes going on, though, like the relatively low level of innovative developments and the inefficient attempts of co-operation (e.g. the formation of producer groups). For all the available EU subsidization schemes (FIFG4, EFF5), these problems persisted, which in the case of many relatively prof-itable companies led to the loss of motivation to develop, and in turn, resulted that many of the applied technologies of the day were found to be even below the level of the 1970s. As a rule, this led to the withdrawal of the innovations in the sec-tor, and to the collapse of the vertical and horizontal integra-tive relationships. Thus, the sector appeared to be producing those patterns of commerce and cooperation that were char-acteristic of the classical open market capitalism. Similarly to other sectors of agriculture, willingness to cooperate is rather low even today (Takács et al. 2013). However, this is exact-ly the opposite of what happened in the Western countries, where the existing mechanisms and cooperation modes of vertical and horizontal coordination (producer organizations, technical platforms, and clusters e.g.) have grown stronger and more sophisticated.
By now, the sector has lost or is losing its most important export markets for several reasons: Poland has recovered from the KHV6 epidemics, fish production sector subsidized by the EFF funds in Romania began to produce, the capacity of pond fish farms in Croatia has substantially been increased due to EU funding, owing to its relatively low logistics charges Czech Republic has practically no competitors in the German market, and so on. These problems are made even more severe by the high level, unpredictability and volatility of the grain prices, by the 27% high level of VAT, and by the introduc-tion of the road toll, to mention just the most important of the causes. After a long time, having to encounter losses and face the reduction of their profitability at sectoral level, some busi-nesses began to show willingness to innovate and cooperate in order to “survive”.
The primary objective of this survey paper is to investigate the mode of the formation of a vertical type of integration that incorporates the entire chain of the production, and to reveal the positive and negative impacts of such on the entire sector. The secondary objective of our paper is to make a complex overview of the theoretical background of the integration re-garding to the food chain especially, because we can find too many conflicts between the general theories.
4 Financial Instrument for Fisheries Guidance5 European Fisheries Fund6 Koi Herpes Virus disease
PotentialofverticalandhorizontalintegrationintheHungarianfishproductchain 7
APSTRACT Vol. 8. Number 2–3. 2014 pages 5–15 ISSN 1789-7874
Materials and methods
After a short overview of the concept of integration, we will survey those major problem points of the sector that can be combated by the creation of an integration model covering the whole product chain. This will be followed by the analysis of a theoretical version of the integration model, and its potential feasibility.
The data and information that underpin the survey were re-trieved primarily from secondary sources, like sector specific materials, studies and papers, and conference publications. The structured compilation of the problem points was largely furthered by the thematic workshop organized by Szűcs I., co-author of this survey paper, at the Research Institute of Fisher-ies and Irrigation in 2013. Further on, interviews were made with the managers of several fish producing enterprises and with representatives of professional groups.
The identification of the problem points was followed by the development of an integration model that contains verti-cal and horizontal elements, is extended to the entire product chain, and is based on partial capital uniformity. We believe that this model will be able to provide an efficient tool to cure the problems that currently exist. The key elements affecting the feasibility of the model are the presence of mutual “confi-dence” among the actors of the product chain, and the subsi-dization potentials provided by the EMFF in the 2014–2020 planning period. The novel model demonstrated herein is un-derpinned by international examples primarily, but has been adapted to the Hungarian particularities at the same time. The key elements of the model are: (1) fish feed production, (2) centralized stocking material/fingerling production, (3) fish production (extensive and intensive) coupled with ecological services, (4) complex, i.e. primary and secondary fish process-ing, (5) sales on a common platform, (6) mass catering ser-vices, (7) community marketing activities, (8) cluster based on technological platforms and product chain.
Theoretical background of the integration
Kornai (1984) differentiates 4 clear-cut types of the coordina-tion mechanisms, such as: (1) bureaucratic coordination, (2) market based coordination, (3) ethical coordination (reciproc-ity), and (4) aggressive coordination. Bureaucratic coordina-tion is characterized by hierarchical relationships; the legal regulation of the interactions is typically administered in the form of directives. This hierarchical relationship can be of a monetary type, where the coordinated party is financially de-pendent on the superior party. The central body gives instruc-tions, withholds certain assets or incomes, and redistributes (allocates) them according to some kind of principle, either in an arbitrary or in ethical ways. Market based coordina-tion, typically, takes place between seller and buyer, there is a transfer of finances and goods between the parties; the two parties are equal, they enter into market relationships on their own will in order to obtain mutual benefits, and observe the competitive open market environment. The rules, therefore,
are based on common interests, and the relationships have a monetary character. Of ethical coordination is typical that the parties are equal, they enter into a relationship on their own will, their motives are one-sided (charity) and mutual, money does not play a direct role, i.e. the relationships do not have a monetary character. In aggressive type coordination the par-ties are not equal, rough demonstration of power and abuse of dominant position are acknowledged elements of the rela-tionship, coordination is exercised via instructions. This type of coordination provides benefits only for one of the parties; the aggressive coordinator party may take up monopolistic or oligopolic market positions. There has never existed a society in the history of mankind entirely and exclusively operated by one or the other type of the 4 modes of cooperation. The aggressive and ethical types are considered to have the deep-est roots going back in the early history, but bureaucratic and market based coordination are also known to have a long past history. In real life, these modes of coordination exist side by side. The societies and economies of many centuries have pro-duced an extremely wide variety and combination of these core types, and old combinations keep being outcompeted by novel ones all the time. The science of historical causality analysis deals with the investigation of the interrelationship between the social/economic environments and the actual dominating type of the cooperation modes in that given environment, and the share and relative importance of the individual core types in that given combination (Kornai 1984).
According to Bárány et al. (2013), relationships of integra-tion and cooperation are based on the supply chains and on the product chains. The product chain is defined as the complexity of the enterprises taking part in a production process, and the technological, financial, legal and organizational interrelation-ships that take part between them. Every product appears as the actor of a production chain (abstraction), the actors can be iden-tified, their number can be quantified, their market power can be assessed, and their relationships in terms of commodity trading and finances can be qualified. The enterprises and the consum-ers have common interests in that the demands are satisfied by them in an uninterrupted and smooth way. In order to ensure this, however, there is required more than just a problem-free relationship of integration and cooperation between the actors of the supply chain: there is a need for the unproblematic al-location of tasks, and smoothly going coordination within the supply chain, too (Bárány et al. 2013).
Different authors give different – narrower vs. broader – definitions of vertical coordination and vertical integration. Fertő (1996) finds that the international and the Hungarian in-terpretations of vertical integration differ in that the Hungarian definition handles the vertical interpretation and the vertical coordination as synonymous notions. We do not support this view. We claim that vertical interpretation and vertical coor-dination are not identical notions: they are different in terms of content. Szentirmay & Gergely (2005) find that most of the literature sources in Hungary interpret vertical coordina-tion mechanisms as such marketing systems whose primary, almost single driving force is the realization of market benefits through cooperation between the actors of the product chain.
8 IstvánSzűcs&LászlóSzőllősi
APSTRACT Vol. 8. Number 2–3. 2014 pages 5–15 ISSN 1789-7874
Makrovszky (2004) also concludes that the literature sources dealing with the integration of the product chains view prod-uct chain relationships and product chain integration, and/or their characteristics from different angles. He presumes that „the product chain integration is a type of a chain of market relations that embodies the market based and market directed allocation of the responsibilities and tasks between the actors of the product chain, and that uses integration as a tool of the improvement of competitiveness of the parties”.
Bárány et al. (2013) understand coordination as the cooper-ation of the stakeholders toward the achievement of set goals. Integration, on the other hand, is a type of – minimum one year, more often medium- or long-term contractual – coopera-tion that observes the mutual economic interests of the parties, and in which one of the parties i.e. the integrator guarantees market and/or production security for the other i.e. integrated party. Moreover, the integrator gives expert and/or fiscal ad-vice to the integrated partner or partner organizations (Juhász 1999; Bárány et al. 2013). Csete et al. (1996), and Hajdu & Lakner (1999) also supports this view of contract based verti-cal integration between two or more enterprises with different profiles.
Martinez (1999) gives the following definitions of vertical coordination and integration: Vertical coordination: Includes all the ways of synchronizing vertical stages of a marketing system (for example, open market prices, contracting, strate-gic alliances, and vertical integration). Vertical integration: Method of vertical coordination representing the greatest degree of control that a firm can gain over another stage of production. Coordination of two or more stages occurs under common ownership via management directive.
Barkema & Drabensott (1995) differentiate two types of vertical coordination according to the participating members: internal and external coordination. In an external coordination the flow of the products and information takes place between external enterprises (independent actors of the economy), whereas in internal coordination the individual elements of the product chain are comprised by a given enterprise. Szen-tirmay & Gergely (2005) recognize vertical integration as one of the extreme examples of vertical (internal) coordination in which the individual stages are concentrated in an economic organization. This means that of the different types of coor-dination mechanisms of the food industry product chain, the vertical type of integration proves to be the one showing the highest level of harmonization, and which is today, in most of the cases, centred in independent economic entities. Clement (1997) differentiates contractual and ownership types of inte-gration having similar characteristics as shown above.
Integration can be of horizontal (cooperation of organi-zations with uniform production profiles), or vertical types (comprising the successive stages of the activities of a given product chain), or the combination of these. In a market econ-omy environment, integrational relations – basically – are also operated on a market basis; they are driven by financial and economic incentives, and are, at the same time, regulated by legal provisions. Horizontal integration between the parties can be established via contracts, without influencing the ex-
isting individual organizational frames. Examples of this can be seen in the past history of the food industry in Hungary – and in the international practice of today – when agricultural producers cooperate in order to implement technical develop-ments, or to find markets for their products. Cooperation, for example, can provide an up-to-the-point institutional realiza-tion of this version. The known types of horizontal integration are such as: (1) integration aimed at the organization of the uniform production/service activities on a common basis, (2) producers’ organizations aimed at sales activities exclusively, (3) producers’ organizations aimed at purchasing and selling activities. Vertical integration is a type of economic organi-zation that comprises more than one phase of the production process stretching from the raw material to the end-product, and that is characterized by capital uniformity and/or by the comprehensive uniformity of the interests of the parties. In terms of the position taken by the integrator in the sequence, we can differentiate downstream (forward), and upstream (backward) types of integration. In animal production it is usually the processor who takes the position of the integrator, but there are also international examples of foodstuff produc-ers, or the producers of genetic breeding stock or stock for fattening playing the role of integrators (Bárány et al. 2013).
Both agriculture and the food processing industry are in-terested in the vertical type organization of the food indus-try, however different their motives are. Relying on literature sources (Bowring 1957; Czégai 1989; Hobbs 2000; Szentir-may 2003; Manning & Baines 2004; Szentirmay & Gergely 2005; Begum 2005; Bamiro et al. 2006; Khoi 2007; Soosay et al. 2008; Szőllősi 2008) we can arrive at the following conclu-sions: The vertical type of integration has advantages in that it has a lower requirement for current assets; it has a higher influence on the prices; it provides higher security of the pres-ervation and penetration of the markets; the uninterrupted nature of production ensures uniform, high quality and large quantities of products. It is important that the requirement for the quality assurance and traceability of the entire food pro-duction chain has by now become of special importance. Ver-tical integration can provide better bargaining positions and higher security of production and sales for the members of the integration when it gets down to the negotiations with the representatives of external retail and wholesale companies; also, it provides a higher efficiency of the marketing costs, and a better flow of information throughout the system. Due to the magnitude and concentration of the product supplies, the risks of the integrated small producers will reduce. Due to the coherence of the actions, incomes within the fish product chain are more likely to be levelled; the incomes generated by the phases that produce higher added value are distributed in a proportional fashion. By linking the individual elements of the product chain, their profit making potentials add up, which provides for the maximization of the profits at the enterprise level. The output of the individual elements of the product chain is certain to be utilized as the input of the subsequent stage. The costs of the input products can be minimized, which improves cost efficiency. There are better conditions provided for the continual technical and product development
PotentialofverticalandhorizontalintegrationintheHungarianfishproductchain 9
APSTRACT Vol. 8. Number 2–3. 2014 pages 5–15 ISSN 1789-7874
activities. The coordinated and more advantageous acquisi-tion of the capital resources of the developments is a special advantage, and also, there is a better chance of meeting the requirements and using the benefits of state funded projects.
Farkasné (1997) and Szentirmay (2003) voice common opinions in that it is the financing system that gives the prin-ciple cohesive power of the integration chains. In agreement with this, and considering the major advantages of integration from the point of view of business management, Széles (2003) attributes special importance to current assets financing. Due to the low level of the income earning capacities and financ-ing difficulties of the farm businesses, integration centres of these are formed in places where there is an availability of pre-financing, lending and borrowing instruments.
Csete et al. (1996) presumes that the integrations are aimed to compete for more advantageous market positions on a com-mon platform than the members would be able to achieve in individual competitions. In this context, we can say that the integrations strive to maximize their joint profits, which is supported by the higher performance, the uniform level of quality and better cost-benefit ratios in comparison with the external competitors, which, in turn, is the result of the optimization of the coherent operation of the entire produc-tion chain. From this it follows that looking at the integrations from the economic point of view, their significance lies in the improvement of the quality, performance and efficiency; in the maintenance of firm market positions in an efficiency ori-ented competing environment; in taking advantage of capi-tal concentration and asset sparing; in the reduction of risks linked to uncertainty; in the continuity of activities and prod-uct developments; in taking advantage of profits derived from the specialization underpinned by the division of labour and responsibilities, and on cooperation; better financing options; the institutional concentration of the issues of services, pro-motions, standardization, quality assurance, and international relationships.
To round up the issue of the integration, we can conclude that due to the intensified competition on the markets, the en-terprises are urged to cooperate, which in turn leads to the concentration of the assets, of expertise, and of market roles and sizes. As a result, there is a certain type of capital unifor-mity produced “sealing” the different types of activities to-gether, which is embodied in a vertical type of structure. The interests of the individual “cost” and “profit” centres – fully or partly – cease to exist, and the dynamics of the changes brings about a new and more efficient type of system. When there is a high level of capital uniformity, each of the activity phases down to the point of output sales functions as a pool of “cost centres” that are united by the uniformity of the capital within a single framework. This is the point when the require-ments of high level professional management and quality as-surance i.e. the harmonization and optimal utilization of the production capacities are being met. There is only one single “profit centre” left, the one of the sales of the outputs. This
centre is responsible for the maximization of the incomes, for the strengthening of the market positions, for the provision of market growth, and for the reinvestment of the “cash” from the sales in the “cost centre” points of the product chain.
We tend to support the viewpoints of Barkema & Draben-sott (1995) and Szentirmay & Gergely (2005) noting, though, that we do not think that coordination along a product chain is a synonym to vertical integration. The coordination mecha-nisms described by Kornai (1984) can be found both in the horizontal and vertical types of integration, but their propor-tionate importance varies according to the actual type of in-tegration. In other word, the coordination mechanisms of an actually operating product chain with partial or full uniformity of capitals will most often contain the traits of the aggressive, bureaucratic, ethical, and market based types of coordination at the same time. We can also conclude that a product chain cannot be considered a vertically integrated product chain i.e. a vertical type of integration if the individual actors (elements) of that chain are linked by market coordination i.e. a seller-buyer relationship only, and if that chain is operated solely by the „invisible hand” of the Adam Smith’s 18th century con-cept.
We presume that effective horizontal and vertical integra-tions can be developed (1) by an organic process (spontaneous development), or (2) by inducing processes, in many cases, however, as a consequence of economic pressure. In the lat-ter case, it is the integrator organization/company (a process-ing enterprise, or the proprietor of a „genetic” property, or a foodstuff producing/trading company) itself that brings about the integration, and typically, appears as owner in each of the elements of the product chain. The actor who develops an en-tire integration is motivated primarily by the inherent possi-bilities of reducing risks linked to the production, supply and sales. Our experiences show that only vertical and horizontal integrations with partial or complete capital uniformity of the participating actors are the ones that can be successful in the long run.
Results and discussion
Current concerns of the fish product chainOne of the weaknesses of the sector lies in the current state of the general production infrastructure and technology (earth structures, built structures, machinery, technical equipment etc.). Unlike other sectors of agriculture, the production pro-cesses of the fish production sector are only partially mecha-nized, which entails a very low level of technical efficiency.
Among the problematic issues of domestic pond fish pro-duction is that the ponds are predominated by cyprinids cul-tures and there is a relatively low proportion of more valuable predatory fish found; there are significant losses seen in many places due to the high number of thefts and to damage caused
7 Environmental Management Program of Fisheries
10 IstvánSzűcs&LászlóSzőllősi
APSTRACT Vol. 8. Number 2–3. 2014 pages 5–15 ISSN 1789-7874
by birds, especially losses caused by the extreme population growth of the great cormorant and pygmy cormorant. It also has to be noted that the ecological services provided by the inland fisheries are only rarely returned (EMPF7): The fish ponds in Hungary were built more than 50 years ago, and the maintenance of their cultivation condition is not satisfactory. The applied keeping and feeding technologies in many of them are found to be below the standard of the 70s-80s of last century; and the professional capabilities of the farmers are often unsatisfactory. The requirements of the KHV represent a real threat to the sector, too.
The selling prices show a high volatility in terms of both time and place, which is especially true of the Common carp. Both price setter and price taker enterprises are present in the marketplace, but the selling transactions in many cases do not appear to be invoiced. Most of the producers have weak bar-gaining positions, forced sales, therefore, are not rarely found in November and early December, mostly as a consequence of the insufficiency of the storage capacities. Fish food products have a VAT rate of 27%, which is outstandingly high taken the rest of the EU states, and is the primary obstacle of the for-malization (clearance) of the economy of the sector. Another problem is that while the pond-side selling prices have been stabilized at the level of those ten years ago, the production costs (foodstuffs, labour, gasoline, electricity, water supply, and logistics) have increased substantially.
The cost of water supply is one of the crucial concerns of the sector. Fish farmers in the neighbouring countries – our competitors in the market – are charged significantly less for water supplies, which ruins our effective income potentials and price setting positions very heavily. In many places, our producers depend upon monopolistic service providing com-panies, not to mention that many of them are to face serious difficulties with recharging the ponds in arid seasons. Due to the governmental provisions of substantial charge refunding, water supply charges in 2014 ceased to be a heavy burden for the Hungarian fish production sector any longer. As declared in the relevant law, the agricultural producers are authorized to use water supplies for their operations free of charge, which applies to the fish production sector, too. The actors of the sector strongly hope that the provisions will continue to be in force in the long term.
As regards the market issues, the relatively low level of domestic fish consumption is associated with an even lower level of domestic fish production, which is extremely season dependent and is dominantly restricted to month December. It is a problem of the demand side that fish products have little popularity among the consumers, most of them have little information about fish dishes except for the traditional ones. This gives promotions an extremely high importance. The lack of sophisticated product promotions is apparent both at the national and regional levels, the responsibility for this lies with each of the local actors of the product chain.
The majority of the processing companies produce a nar-row range of fish products, of that mostly products with low added values. Except for a few companies, the utilization rate of capacities is low, which is also true of the level of applied
technologies leading to a relatively high level of specific fixed costs. The processing technologies and equipment commonly used in the neighbouring countries are not in general use in Hungary; the different phases of the processing are predomi-nantly done by hand. All these problems sum up to induce relatively high production costs paired with low added values. Yet another issue of concern is the need of the continual up-dating of the hygiene conditions of the processing factories to comply with the requirements of the food security standards.
As a follow up of the 37th Scientific Conference on Fisher-ies and Aquacultures of Szarvas, 2013, the actors of the prod-uct chain issued the Declaration of Szarvas (2013) which con-cludes the following: “After the economic transition period, the fish production sector in Hungary – unlike others sectors of the animal husbandry – was uniquely capable of preserv-ing its size and importance, moreover, it was capable of re-newing and improving itself. By now, however, the situation has changed, and the sector is suffering from a competitive disadvantage against the competitor fish production sector of the neighbouring countries, and being in a crisis, it is facing severe market and economic difficulties. The responsibility to combat these difficulties lies with the producers, the produc-ers’ organizations and other actors of the sector in the first place, but there are several points of concern, however, that require governmental intervention to be settled.”
We claim that there is a need to strengthen the cooperation among, and develop the integration of the actors of the prod-uct chain in order to provide for the more efficient utilization of the market potentials. The fish producers must be encour-aged to join the food quality assurance systems, to observe the community provisions, to install the informational backup support tools of production and sales, and to jointly step up in the markets.
Potentials of vertical and horizontal integration in the Hungarian fish product chain
Vertical integration is common in many fields of the food in-dustry, the individual sectors, however may have significant differences. In a classical example of fish meat production it is a concentrated fish processing enterprise that steps up as the integrator of the producers. As Isaksen et al. (2007) sum-marizes, managers of fish processing firms are subject to an almost stochastic supply of the most important input factor; namely fish. Uncertainty is also persistent in the other end of the value chain, where prices and output fluctuate heavily. This underlines the need for vertical integration.
One of the most important drivers of the success of the export-oriented, intensive Pangasius production in Vietnam over the past 10 years was underpinned by the setting up of the integrated production system (Belton et al. 2011): the ver-tical integration systems between fish farmers and processing/export firms have dramatically shifted toward long-term con-tract coordination. Among a number of driving forces for this shift, the level of risk faced by primary producers, stringent quality requirements for processing and changes in production
PotentialofverticalandhorizontalintegrationintheHungarianfishproductchain 11
APSTRACT Vol. 8. Number 2–3. 2014 pages 5–15 ISSN 1789-7874
technology have been the main ones (Hobbs 2000). As Khoi (2007) claims, the processing/export firms should forge strate-gic partnerships and develop closer coordination relationships with their suppliers, because investment in quality manage-ment is crucial to improve customers’ satisfaction and bring benefits for all the chain actors.
A well operating vertical integration is similar to a sym-biotic relationship, since it provides advantages both for the integrating and the integrated parties alike. It is advantageous for the integrator, on the one hand, for the reason that the inte-gration enables them ensure the inputs in a given quality, un-der given payment conditions and in given instalments. On the other hand, it is advantageous for the integrated party because integration provides them predictability, security of sales, and allows reducing their own working capital tie-ups (Herman-sen et al. 2011). This is ensured by the integrator by provid-ing contracted extension services for the integrated party, by pre-financing the production, in many cases by providing the fingerlings and feedstuff for fattening, and by guaranteeing the acceptance and off-site transfers of the finished stock of fish. In case an all-round integration is achieved among the parties, every subsequent vertical element of the chain neces-sarily becomes part of the integration chain on the basis of common interests and/or capital uniformity: (1) the produc-tion/distribution of the means of production, and the distribu-tion of keeping technologies; (2) the distribution of the tech-nologies of feedstuff growing and production, and feeding; (3) selection/breeding operations, the production of parent and milter brood-stock fish; (4) propagation and incubation; (5) juvenile stock rearing; (6) fish rearing/fattening; (7) primary and secondary processing; (8) transportation and logistics; (9) trading. In such integration, each of the elements of the chain appears as a “cost centre”, with the trading activity phase be-ing the sole “profit centre”.
Currently, the domestic fish product chain is made up by nationally owned enterprises with individual equity interests, though, and each of them act both as a “cost” and as a “profit” centre. They are characterized by spontaneously settled deals, interim price agreements, and elementary price-fixing cartels between the market actors – worth of note is that all this is taking place in a competitive open market environment. This type of product chain was common with most of the food pro-duction chains in Europe back in the early 1900s, but those have succeeded in undergoing an organic process of develop-ment. In general, the need for coordination is pushed forward by the intensified competition in the marketplace, by the vul-nerability of the individual members of the product chain, and by the lowering rates of profitability, which causes the capital, the expertise, the commodity stocks, and in the final issue, the market importance to become concentrated. It was quite common, that the concentration and integration of the produc-tion chains were in temporal terms preceded by the concentra-tion taking place in the retail trade sector. The concentration process of the customers and competitors is of substantially a larger scale than that of the producers’ organizations of the Hungarian fish production sector, not to mention that the dom-inant position of the retail trade is quite obvious.
Sectoral integration can be developed on the basis of a high level or complete uniformity of the capitals, but it can just as well be achieved at levels significantly lower than these. We are convinced that only complete uniformity of capital can provide for the success of integration in the long run. It is a general experience in Hungary that the competing mar-ket actors (small-scale fish farms, fish processing enterprises, etc.) – who show a price accepting attitude in the market – are unwilling to enter into medium- and long-term cooperations on their own will unless they are forced to by some exter-nal circumstances (better chances of subsidization, market pressure, a drastic drop of profitability etc.). Potential risks, for example, are not big enough threats for the majority of the domestic fish producers to urge them to set up a joint fish processing enterprise, and to operate it as a joint profit centre in the form of an Ltd or cooperative. They will, however, be aware that such cooperation forms are successfully operated by their international competitors, and that these cooperations will sooner or later most definitely outcompete them in the market, yet, they tend to settle the problem by concluding that “the conditions are completely different there”.
In this chapter we will describe two integration varieties: (1) one based on complete uniformity of capital, and (2) one having only partial capital uniformity. By definition, (1) in a company with a complete uniformity of capital, the entire fish product chain – from the foodstuff production through the processing to trade – is controlled by a single proprietor or group of proprietors. The proprietor is interested in each of the phases of the product chain, which allows for the avoid-ance of conflicts in the distribution of the incomes, and for the realization of optimal returns of the investments in the in-dividual phases. The distribution of the incomes, of course, can take different shapes. There is the possibility of handling each individual element of the chain as an individual “profit centre”, in which case internal accounting pricing is applied in relations between the individual elements. It is important, that internal accounting pricing within the product chain facilitates the optimization of the cash flow, which in turn, will contribute – by means of liquidity – to the maintenance and growth of the competitiveness of the product chain. The product chain can also be operated by applying the cost price setting on the semi-finished products (the internal accounting price in this case is equal to the cost price), in which case there is only one single “profit centre” formed, i.e. the end-point one of processing. In accordance with the proprietary inter-ests, the different elements of the product chain are financed by the profit generating branches. In this scheme, instead of being responsible for profit maximization, the lower levels of the product chain are interested in minimizing the costs and in assuring the quality standards of the inputs, given that the profitability and competitiveness of the entire product chain rests upon the production of outputs with high added values. It must be noted, though, that in addition to producing high quality inputs for the processing stage, the production of high quality feed mixes and fingerlings is just as important. Further advantages of the integrated product chain with capital unifor-mity are summed up as follows:
12 IstvánSzűcs&LászlóSzőllősi
APSTRACT Vol. 8. Number 2–3. 2014 pages 5–15 ISSN 1789-7874
– The quality control, the provision of food security, animal health, and product traceability can all be made more ef-ficient when organized along a product chain. The whole-chain supervision and the process-based approach can be applied more efficiently when the production of high qual-ity output is a primary issue. The “from-pond-to-plate” and, vice versa “from-plate-to-pond” approach can be better ob-served.
– The proprietor is capable of gaining a comprehensive view of the integrated product chain controlled by him, which al-lows him to adapt the entire production chain to the actual market conditions, which in turn, facilitates the satisfaction of the customers’ demands at a higher quality level and at more competitive prices.
– Better bargaining positions can be achieved both in the input (feedstuffs) and output (fish products) phases of the product chain. Given that the conflict of interests within the inte-grated product chain has already been eliminated, these are the only vulnerable phases left.
– There is a large potential involved in the RDI activities, since they appear to be much more efficient when imple-mented throughout the product chain rather than just in giv-en individual segments. (Except for some instances, innova-tion as for now does not appear to be one of the strengths of the domestic fish production sector.)
– Due to the shortness of the biological cycle, the produc-tion, and the product transportation needs to be optimized. A closed system can offer more simple ways for the achieve-ment of this aim: there is a way to reduce the costs of logis-tics and storage, and to bring the organization of the produc-tion to an optimal level.
– Given that the management of the product chain is central-ized, as a result of the resultant economy of scale, the overall costs can be reduced.
– There is a possibility of achieving optimal business sizes (at company, enterprise and premises levels), of harmonizing the individual stages, and ensuring economies of scale.
– There is an easier way of outsourcing certain activities (cleaning, disinfecting) in order to improve efficiency, pri-marily in terms of labour costs.In our view, the integration model (1) of the above outlined
type is typically formed when the product chain there appears a large and capital intensive multinational company interested in foodstuff production, or fish processing, or there appears a powerful financial investor.
The establishment of an institutional form aimed at the asserting of the market interests of the fish production sec-tor has long been an issue of debate among the actors of the sector. Considering that the currently persisting problems of the product chain originate primarily from the difficulties of the availability of markets for the products, rather than from the production itself, we support the establishment of an inte-grator organization having a trading house type philosophy, and embodied in the (2) integration model with partial capital uniformity. The central concept of the trading house, though, should go hand in hand with satisfying the demands placed
on the integrator of the sector. The cooperation is aimed to ensure the sustainability of the production by the marketing of improved and healthy commodities with competitive profit margins, and by the achieving of the most advantageous mar-ket conditions.
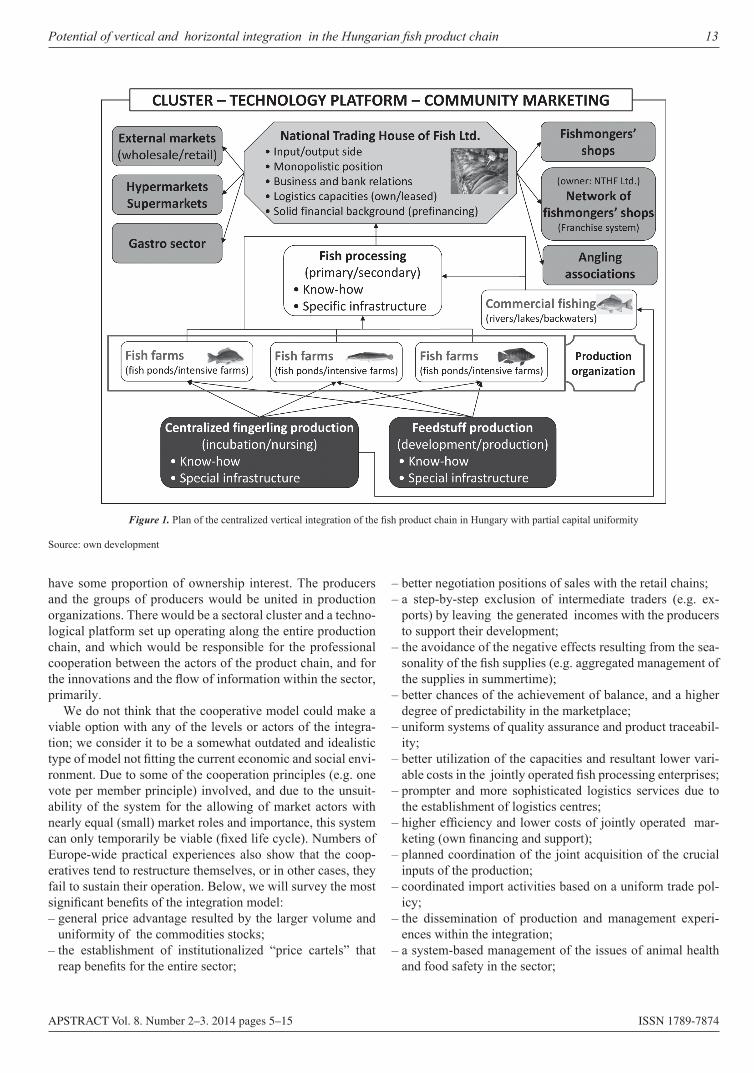
The business group type integration model organized on the basis of partial capital uniformity is demonstrated by Fig-ure 1. The central element of the model involves the trading activities carried out by the National Trading House of Fish Ltd. (NTHF Ltd.) functioning as a “profit centre”. This is the organization that will directly appear throughout the entire output (except for direct marketing) market, and in the most important input markets, including financial markets as well. It fulfils, naturally, a monopolistic position, and has direct contacts with the most significant buyers (e.g. angling asso-ciations, retail chains, the gastro sector, fishmongers’, external markets). It has a solid financial background, has safe relation-ships with the financial institutions and insurance companies, has access to updated market information, and is involved in warehouse activities. Furthermore, it operates an own fran-chise network of fishmongers’ shops wherein services are pro-vided by the regional premises that are either owned or leased properties. The trading centre serves the fish producers and foodstuff producers with wholesale stocks of grains and other types of foodstuffs. It operates logistics services on owned and leased bases. It has an ownership interest in its own net-work of fishmongers’ shops and in some of the most important fish processing enterprises. If need be, the NTHF Ltd. could provide pre-financing for the production activities (fish pro-duction, fishing, fish processing, feed production, stocking material/fingerling production). It would also be responsible for operating a comprehensive system of quality assurance and product traceability; it would dispose of trademarks, and would coordinate the community marketing activities. Due to its monopolistic market position, it would be able to achieve higher and less volatile output selling prices, and due to its size, it would be able to ensure lower and more predictable purchase prices of the inputs.
Another important issue is that of the ownership. Accord-ing to the logic of the model, neither of the actors would be allowed to acquire majority ownership of any of the key quasi community enterprises operating as “cost centres”. Examples of these are companies dealing with stocking material/fin-gerling production and breeding, that would be operating an extension network of keeping technologies; companies deal-ing with foodstuff production and operating an extension network of feeding technologies providing services for the fish producing farms. The major owners of the system would be the fish producing/processing/fishing enterprises and the independent fish processing factories, which means that they would make up 100% ownership of the NTHF Ltd. The fish producers would be the owners of the feedstuff producing companies (Ltd.), the fish producing and the fishing enter-prises would own the companies (Ltd.) responsible for the selection/breeding and stocking material/fingerling produc-tion; in the latter one, however, the NTHF Ltd. would also
PotentialofverticalandhorizontalintegrationintheHungarianfishproductchain 13
APSTRACT Vol. 8. Number 2–3. 2014 pages 5–15 ISSN 1789-7874
have some proportion of ownership interest. The producers and the groups of producers would be united in production organizations. There would be a sectoral cluster and a techno-logical platform set up operating along the entire production chain, and which would be responsible for the professional cooperation between the actors of the product chain, and for the innovations and the flow of information within the sector, primarily.
We do not think that the cooperative model could make a viable option with any of the levels or actors of the integra-tion; we consider it to be a somewhat outdated and idealistic type of model not fitting the current economic and social envi-ronment. Due to some of the cooperation principles (e.g. one vote per member principle) involved, and due to the unsuit-ability of the system for the allowing of market actors with nearly equal (small) market roles and importance, this system can only temporarily be viable (fixed life cycle). Numbers of Europe-wide practical experiences also show that the coop-eratives tend to restructure themselves, or in other cases, they fail to sustain their operation. Below, we will survey the most significant benefits of the integration model:– general price advantage resulted by the larger volume and
uniformity of the commodities stocks;– the establishment of institutionalized “price cartels” that
reap benefits for the entire sector;
– better negotiation positions of sales with the retail chains;– a step-by-step exclusion of intermediate traders (e.g. ex-
ports) by leaving the generated incomes with the producers to support their development;
– the avoidance of the negative effects resulting from the sea-sonality of the fish supplies (e.g. aggregated management of the supplies in summertime);
– better chances of the achievement of balance, and a higher degree of predictability in the marketplace;
– uniform systems of quality assurance and product traceabil-ity;
– better utilization of the capacities and resultant lower vari-able costs in the jointly operated fish processing enterprises;
– prompter and more sophisticated logistics services due to the establishment of logistics centres;
– higher efficiency and lower costs of jointly operated mar-keting (own financing and support);
– planned coordination of the joint acquisition of the crucial inputs of the production;
– coordinated import activities based on a uniform trade pol-icy;
– the dissemination of production and management experi-ences within the integration;
– a system-based management of the issues of animal health and food safety in the sector;
Figure 1. Plan of the centralized vertical integration of the fish product chain in Hungary with partial capital uniformity
Source: own development
14 IstvánSzűcs&LászlóSzőllősi
APSTRACT Vol. 8. Number 2–3. 2014 pages 5–15 ISSN 1789-7874
– comprehensive sectoral information system;– due to the more effective management of the liquidity prob-
lems that might occur due to the cyclicality of the produc-tion, the difficulties caused by occasional derailments of the sales markets (overproduction, drastic price drops) can be avoided;The founding members make their actual markets available
for the NTHF Ltd., and thus, only those producers that are cur-rently using the regulated market channels can get “authoriza-tion” to enter the fish market. Another important requirement is the provision of the traceability of the products from the pro-ducers to the customers (from-pond-to plate), for the reason that the customers are keen to be informed of the country of the origin, of the circumstances of the production of the fish they buy. Of special concern are the issues of medicines (pre-ventive and curative) and hormones uses, the application of the performance enhancers, and the use of genetically modi-fied foodstuffs, et cetera. These requirements are relatively easy to be met (and documented) by the larger pond fish farms; the smaller ones, however, may have to face difficulties that tend to increase with the reduction of the size of the farm. The principles of the organization have to be implemented on two platforms: the production within a given community has to be carried out on a uniform technological base, on the one hand, which provides for the documentation of the conditions of the production (keeping, feeding, and treatments), which in turn, is the guarantee of the safety of the production process. On the other hand, producers are expected to organize themselves so they can step up with ample stocks of commodities in the mar-ket. There is an integrator required to organize and coordinate the production, to buy up and process the fish, and to sell them in the market.
Conclusions
Given the current economic environment, getting organized is a primary interest of the Hungarian fish producers. We be-lieve that the problems of the domestic fish production sector cannot be solved unless the entire product chain is taken into consideration. The consumers’ demands cannot be satisfied in an efficient and competitive way, and the fisheries products cannot find safe markets unless the activities of the producers, processors and traders are coordinated. These considerations, at the same time, urge the need for the research of the product chain relationships, for the continued investigation of the val-ue generation and submarket processes of the fish production sector, similarly to what is taking place in other sectors of the animal husbandry (Szőllősi 2009; Cehla et al. 2012).
If the production is to be sustained and the competitiveness of the sector is to be maintained, a higher than the currently existing level of integration (vertical and/or horizontal) has to be achieved. These efforts can be well furthered by the re-sources of the 2014–2020 planning period of the European Union (EMFF), which provide 50% funding intensity for the investments in the product chain.
According to the present level of the Hungarian process-ing industry and the present level of cooperation among the stakeholders requires substantial changes that requires great efforts. We know well that our proposed centralized vertical integration is a little bit “idealistic model” that can’t be es-tablished short term without common accordance, none the less it is a real solution for the problems of the Hungarian fish product chain.
References
Bamiro OM, Dayo OAP & Momoh S (2006): Vertical integra-tion and technical efficiency in poultry (egg) industry in Ogun and Oyo States, Nigeria. International Journal of Poultry Science 5 (12), 1164–1171.Bárány L, Pupos T & Szőllősi L (2013): Az integráció kap csolódó kérdései. In.: Versenyképes brojlerhizlalás (Szerk.: Bárány L., Pupos T., Szőllősi L.), Szaktudás Kiadó Ház Zrt., Budapest, 71–79.Begum IA (2005): An assessment of vertically integrated contract poultry farming: A case study in Banglades. International Journal of Poultry Science 4 (3), 167–176.Belton B, Little DC & Sinh LX (2011): The social relations of cat-fish production in Vietnam. Geoforum 42, 567–577.Bojtárné LM (2013): Statisztikai Jelentések, Lehalászás Jelentés 2012. év. XVIII. évfolyam 2013, Agrárgazdasági Kutató Intézet. Budapest, 1–44. Available at: https://www.aki.gov.hu/publikaciok/publikacio/a:116/Jelent%C3%A9s+a++hal%C3%A1szatr%C3%B3lBowring JR (1957): Discussion: An appraisal of vertical integration in the broiler industry. Journal of Farm Economics 39 (5), 1497–1499.Barkema A & Drabenstott M (1995): The many paths of vertical coordination: Structural implications for U.S. food system. Agribusi-ness 11, 483–492.Cehla B, Kovács S, Wolfová M, Komlósi I & Nábrádi,A (2012): Factors influencing the gross value added in the sheep production chain. Apstract 6 (5), 141–146.Clement EW (1997): Vertical integration comparsion: beef, pork and poultry. Western Agricultural Economics Association. 1997 An-nual Meeting, July 13–16, 1997, Reno/Sparks, Nevada. 6. p. Avail-able at: http://ageconsearch.umn.edu/bitstream/35759/1/waeasp21.pdf.Czégai M (1989): Vertikumok a Kecskeméti Magyar–Szovjet Barát-ság Termelőszövetkezetben. Gazdálkodás 33 (7), 37–40.Csete L, Horn P & Papócsi L (1996): Integráció az agrárgazdaság-ban. Gazdálkodás 60 (5), 1–6.EU EC (2012): Facts and figures on the Common Fisheries Policy. European Union, Luxembourg, 2012.Farkasné Fekete M (1997): Integráció és finanszírozás a me ző gaz-da ság ban. Gazdálkodás 61 (4), 42–45.Fertő I (1996): Vertikális koordináció a mezőgazdaságban. Közgaz-dasági Szemle 63, 957–971.Hajdu I-né & Lakner Z (szerk.) (1999): Az élelmiszeripar gaz-daságtana. Mezőgazdasági Szaktudás Kiadó. Budapest. 54–56.Hermansen Ø, Isaksen JR & Dreyer B (2011): Challenging spatial and seasonal distribution of fish landings – Experiences from verti-
PotentialofverticalandhorizontalintegrationintheHungarianfishproductchain 15
APSTRACT Vol. 8. Number 2–3. 2014 pages 5–15 ISSN 1789-7874
cally integrated trawlers and delivery obligations in Norway. Marine Policy. 36, 206–213.Hobbs, JE (2000): Closer vertical coordination in agri-food supply chain: a conceptual framework and some preliminary evidence. Sup-ply Chain Management. 5 (3), 131–142.Isaksen, JR, Dreyer, B & Grønhaug, K (2007): Vertical integra-tion and performance – The impact of measurements and industry. 22. p. Available at: http://munin.uit.no/bitstream/handle/10037/2546/paper_3.pdf?sequence=2.Juhász A (1999): A vertikális kapcsolatok változásai a zöldség-gyümölcs ágazatban. Agrárgazdasági Tanulmányok, 1999 (10) AKII, Budapest.Khoi, LND (2007): Vertical integration as an alternative governance structure of value chain quality management: The Case of Pangasius Industry in the Mekong River Delta, Vietnam, CAS Discussion Paper No. 55. Available at: http://webh01.ua.ac.be/cas/pdf/cas55.pdf.Kornai J (1984): Bürokratikus és piaci koordináció, Értekezések-Emlékezések, Akadémiai Kiadó, Budapest, 39 p. ISBN 963-05-3865-2Manning L & Baines RN (2004): Globalisation: A study of the poul-try-meat supply chain. British Food Journal 106 (10–11), 819–836.Markovszky Gy (2004): A termékpálya integrációk vizsgálatának lehetőségei. Gazdálkodás 68 (3), 25–31.Martinez SW (1999): Vertical coordination in the pork and broi-ler industries: Implications for pork and chicken products. Food and Rural Economics Division, Economic Research Service, USDA. Agricultural Economic Report No. 777. 43. p. Avai lable at: http://ageconsearch.umn.edu/bitstream/34031/1/ae990777.pdf.
Soosay CA, Hyland PW & Ferrer M (2008): Supply chain collabo-ration: capabilities for continuous innovation. Supply Chain Man-agement 13 (2), 160–169.
Szarvasi Deklaráció (2013): A szarvasi Halászati Tudományos Tanácskozás állásfoglalása. 37. Halászati Tudományos Tanácskozás. Szarvas, 2013. május 31. 2. p. Available at: http://www.haki.hu/ index.cgi?rx=&nyelv=hu&item=&searchwords2=&menuparam4=1&menuparam5=127.
Szentirmay A (2003): Koncentráció és vertikális integráció az európai és a hazai baromfiiparban. Gazdálkodás 67 (3), 25–33.
Szentirmay A & Gergely I (2005): Vertikális integrációk az élelmi-szer gazdaságban. Gazdálkodás 69 (2), 63–71.
Széles Gy (2003): Az integráció üzemgazdasági összefüggései. Gazdálkodás 67 (4), 28–36.
Szőllősi L (2008): A vágócsirke vertikum modellezése és gazdasági elemzése egy, az Észak-alföldi régióban működő integráció ala-pján. Értekezés a doktori (PhD) fokozat megszerzése érdekében a Gazdálkodás- és szervezéstudományok tudományágban. Debreceni Egyetem Ihrig Károly Gazdálkodás- és Szervezéstudományok Dok-tori Iskola. Debrecen. 192. p.
Szőllősi L (2009): The Operation of the Hungarian Broiler Product Chain. Apstract 3 (5–6), 47–50.
Takács I, Takácsné György K, Baranyai Zs (2013): The role of trust in cooperation between farmers – the outcomes of a survey in Békés county. Apstract 6 (5), 103–1
APSTRACT Vol. 8. Number 2–3. 2014 pages 17–23 ISSN 1789-7874
Introduction
A wide range of offers are available in borrowing from a credit institution nowadays. Foreign currency based loans were also available in 1990s, but their growth became significant only after 2005. These loans were mostly denominated in Swiss Franc, Euro and Japanese Yen (Balás–Nagy 2010). After 2008, 66% of the loans were denominated in foreign currency, which meant a high level of foreign exposure (MNB).
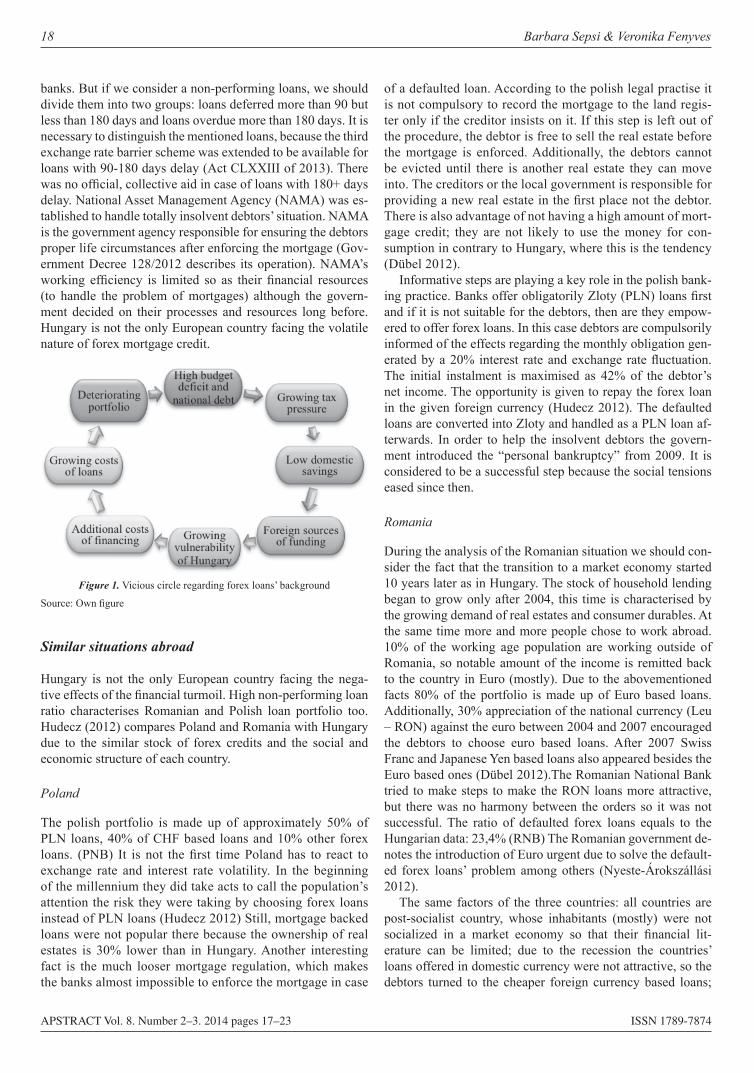
High budget deficit and national debt (out of which a sig-nificant part is also denominated in foreign currency) char-acterized the Hungarian economy. It is not unusual that the government’s response was to levy taxes, but it happened parallel to increasing unemployment rates (Burgerné 2011). Consequently, people did not have the capacity to save money, which led to the lack of internal savings, making banks less well-funded. The demand of capital made the banks turn to foreign funding. Lower liquidity of the population is also ap-peared in growing application for loans (7Sigma 2010) and spending freely usable mortgage credits to consumption, tak-ing a maturity risk besides the already existing interest and exchange risks (Holmár 2012). This way foreign exposure continuously increased, which reflected in the CDS-spreads and the ratings of Hungary (Varga 2008).
Thanks to the abovementioned negative facts the foreign sources became more and more expensive; moreover, there was not still any internal saving tendency. The additional costs were passed on to the debtors in a way interest rates were increased (which is strictly regulated since then thanks to Act CXLVIII of 2011). It was getting harder and harder to pay the growing costs of the loans. Furthermore, the debtors were also the victim of the depreciation of Forint this time, which altogether resulted in the deterioration of the portfolio. The ratio of non-performing loans is considered to be high in Hungary. The bad quality of the loan portfolio can charge extra costs to the government – originating unexpected ex-penses – leading higher budget deficit and national debt than expected (Figure 1).
What is happening with forex loans?
In the present economic situation a forex loan could have sev-eral outcomes thanks to the aids carried out by the banks and the government. If there was no delay or less than 90 days, debtors could choose from the first and second edition of “exchange-rate barrier” or the early repayment (Act LXXV of 2011). There were also restructuring opportunities offered by
Some ThoughTS on The RepaymenT meThodS of hungaRian
houSehold foRex loanS1
Barbara Sepsi & Veronika Fenyves
University of Debrecen
Abstract: Nowadays the volatility of exchange rates and the macroeconomic changes strongly affect the monthly instalments of the debtors. The growth of delayed forex loans - mostly denominated in Swiss Franc and Euro - can include a high risk, which as a part of a vicious circle can ruin Hungary’s economic situation and even the country’s external judgement. Steps were taken to handle the problem of the forex loans but their result is questionable. In this paper different repayment methods are compared in different economic scenarios. More precisely, the third edition of exchange-rate barrier and income based repayment are analysed in an optimistic realistic and pessimistic scenario. This article is aiming to quantify and interpret the difference between each repayment methods regarding different scenarios. Based on the results suggestions are made how to eliminate efficiently currency exposure from the continuously deteriorating portfolio.
Keywords: forex loans, delayed loans, repayment methods, exchange-rate barrier, income based repayment, Euro, Swiss Franc
Applied Studies in Agribusiness and Commerce – APSTRACTAgroinform Publishing House, Budapest ScienTific papeRS
1 This research was supported by the European Union and the State of Hungary, co-financed by the European Social Fund in the framework of TÁMOP 4.2.4. A/2-11-1-2012-0001 ‘National Excellence Program – Elaborating and operating an inland student and researcher personal support system, was realised with personal support
18 Barbara Sepsi & Veronika Fenyves
APSTRACT Vol. 8. Number 2–3. 2014 pages 17–23 ISSN 1789-7874
banks. But if we consider a non-performing loans, we should divide them into two groups: loans deferred more than 90 but less than 180 days and loans overdue more than 180 days. It is necessary to distinguish the mentioned loans, because the third exchange rate barrier scheme was extended to be available for loans with 90-180 days delay (Act CLXXIII of 2013). There was no offi cial, collective aid in case of loans with 180+ days delay. National Asset Management Agency (NAMA) was es-tablished to handle totally insolvent debtors’ situation. NAMA is the government agency responsible for ensuring the debtors proper life circumstances after enforcing the mortgage (Gov-ernment Decree 128/2012 describes its operation). NAMA’s working effi ciency is limited so as their fi nancial resources (to handle the problem of mortgages) although the govern-ment decided on their processes and resources long before. Hungary is not the only European country facing the volatile nature of forex mortgage credit.
Similar situations abroad
Hungary is not the only European country facing the nega-tive effects of the fi nancial turmoil. High non-performing loan ratio characterises Romanian and Polish loan portfolio too. Hudecz (2012) compares Poland and Romania with Hungary due to the similar stock of forex credits and the social and economic structure of each country.
Poland
The polish portfolio is made up of approximately 50% of PLN loans, 40% of CHF based loans and 10% other forex loans. (PNB) It is not the fi rst time Poland has to react to exchange rate and interest rate volatility. In the beginning of the millennium they did take acts to call the population’s attention the risk they were taking by choosing forex loans instead of PLN loans (Hudecz 2012) Still, mortgage backed loans were not popular there because the ownership of real estates is 30% lower than in Hungary. Another interesting fact is the much looser mortgage regulation, which makes the banks almost impossible to enforce the mortgage in case
of a defaulted loan. According to the polish legal practise it is not compulsory to record the mortgage to the land regis-ter only if the creditor insists on it. If this step is left out of the procedure, the debtor is free to sell the real estate before the mortgage is enforced. Additionally, the debtors cannot be evicted until there is another real estate they can move into. The creditors or the local government is responsible for providing a new real estate in the fi rst place not the debtor. There is also advantage of not having a high amount of mort-gage credit; they are not likely to use the money for con-sumption in contrary to Hungary, where this is the tendency (Dübel 2012).
Informative steps are playing a key role in the polish bank-ing practice. Banks offer obligatorily Zloty (PLN) loans fi rst and if it is not suitable for the debtors, then are they empow-ered to offer forex loans. In this case debtors are compulsorily informed of the effects regarding the monthly obligation gen-erated by a 20% interest rate and exchange rate fl uctuation. The initial instalment is maximised as 42% of the debtor’s net income. The opportunity is given to repay the forex loan in the given foreign currency (Hudecz 2012). The defaulted loans are converted into Zloty and handled as a PLN loan af-terwards. In order to help the insolvent debtors the govern-ment introduced the “personal bankruptcy” from 2009. It is considered to be a successful step because the social tensions eased since then.
Romania
During the analysis of the Romanian situation we should con-sider the fact that the transition to a market economy started 10 years later as in Hungary. The stock of household lending began to grow only after 2004, this time is characterised by the growing demand of real estates and consumer durables. At the same time more and more people chose to work abroad. 10% of the working age population are working outside of Romania, so notable amount of the income is remitted back to the country in Euro (mostly). Due to the abovementioned facts 80% of the portfolio is made up of Euro based loans. Additionally, 30% appreciation of the national currency (Leu – RON) against the euro between 2004 and 2007 encouraged the debtors to choose euro based loans. After 2007 Swiss Franc and Japanese Yen based loans also appeared besides the Euro based ones (Dübel 2012).The Romanian National Bank tried to make steps to make the RON loans more attractive, but there was no harmony between the orders so it was not successful. The ratio of defaulted forex loans equals to the Hungarian data: 23,4% (RNB) The Romanian government de-notes the introduction of Euro urgent due to solve the default-ed forex loans’ problem among others (Nyeste-Árokszállási 2012).
The same factors of the three countries: all countries are post-socialist country, whose inhabitants (mostly) were not socialized in a market economy so that their fi nancial lit-erature can be limited; due to the recession the countries’ loans offered in domestic currency were not attractive, so the debtors turned to the cheaper foreign currency based loans;
Figure 1. Vicious circle regarding forex loans’ background
Source: Own fi gure
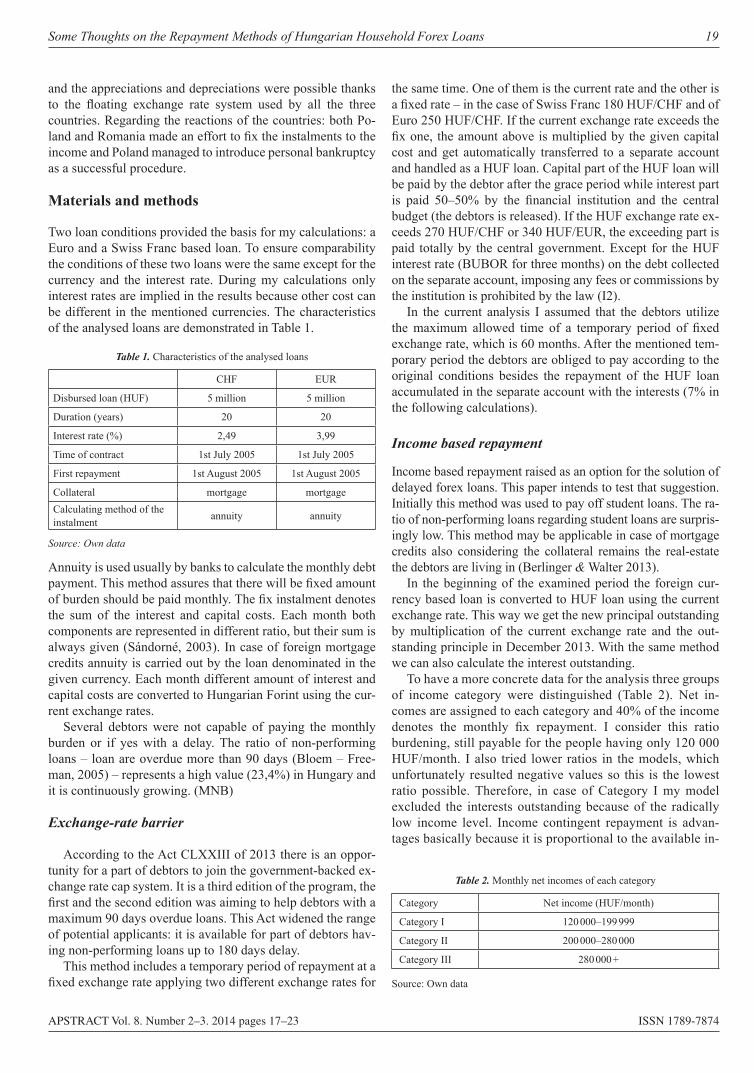
Some Thoughts on the Repayment Methods of Hungarian Household Forex Loans 19
APSTRACT Vol. 8. Number 2–3. 2014 pages 17–23 ISSN 1789-7874
and the appreciations and depreciations were possible thanks to the floating exchange rate system used by all the three countries. Regarding the reactions of the countries: both Po-land and Romania made an effort to fix the instalments to the income and Poland managed to introduce personal bankruptcy as a successful procedure.
Materials and methods
Two loan conditions provided the basis for my calculations: a Euro and a Swiss Franc based loan. To ensure comparability the conditions of these two loans were the same except for the currency and the interest rate. During my calculations only interest rates are implied in the results because other cost can be different in the mentioned currencies. The characteristics of the analysed loans are demonstrated in Table 1.
Source: Own data
Annuity is used usually by banks to calculate the monthly debt payment. This method assures that there will be fixed amount of burden should be paid monthly. The fix instalment denotes the sum of the interest and capital costs. Each month both components are represented in different ratio, but their sum is always given (Sándorné, 2003). In case of foreign mortgage credits annuity is carried out by the loan denominated in the given currency. Each month different amount of interest and capital costs are converted to Hungarian Forint using the cur-rent exchange rates.
Several debtors were not capable of paying the monthly burden or if yes with a delay. The ratio of non-performing loans – loan are overdue more than 90 days (Bloem – Free-man, 2005) – represents a high value (23,4%) in Hungary and it is continuously growing. (MNB)
Exchange-rate barrier
According to the Act CLXXIII of 2013 there is an oppor-tunity for a part of debtors to join the government-backed ex-change rate cap system. It is a third edition of the program, the first and the second edition was aiming to help debtors with a maximum 90 days overdue loans. This Act widened the range of potential applicants: it is available for part of debtors hav-ing non-performing loans up to 180 days delay.
This method includes a temporary period of repayment at a fixed exchange rate applying two different exchange rates for
the same time. One of them is the current rate and the other is a fixed rate – in the case of Swiss Franc 180 HUF/CHF and of Euro 250 HUF/CHF. If the current exchange rate exceeds the fix one, the amount above is multiplied by the given capital cost and get automatically transferred to a separate account and handled as a HUF loan. Capital part of the HUF loan will be paid by the debtor after the grace period while interest part is paid 50–50% by the financial institution and the central budget (the debtors is released). If the HUF exchange rate ex-ceeds 270 HUF/CHF or 340 HUF/EUR, the exceeding part is paid totally by the central government. Except for the HUF interest rate (BUBOR for three months) on the debt collected on the separate account, imposing any fees or commissions by the institution is prohibited by the law (I2).
In the current analysis I assumed that the debtors utilize the maximum allowed time of a temporary period of fixed exchange rate, which is 60 months. After the mentioned tem-porary period the debtors are obliged to pay according to the original conditions besides the repayment of the HUF loan accumulated in the separate account with the interests (7% in the following calculations).
Income based repayment
Income based repayment raised as an option for the solution of delayed forex loans. This paper intends to test that suggestion. Initially this method was used to pay off student loans. The ra-tio of non-performing loans regarding student loans are surpris-ingly low. This method may be applicable in case of mortgage credits also considering the collateral remains the real-estate the debtors are living in (Berlinger & Walter 2013).
In the beginning of the examined period the foreign cur-rency based loan is converted to HUF loan using the current exchange rate. This way we get the new principal outstanding by multiplication of the current exchange rate and the out-standing principle in December 2013. With the same method we can also calculate the interest outstanding.
To have a more concrete data for the analysis three groups of income category were distinguished (Table 2). Net in-comes are assigned to each category and 40% of the income denotes the monthly fix repayment. I consider this ratio burdening, still payable for the people having only 120 000 HUF/month. I also tried lower ratios in the models, which unfortunately resulted negative values so this is the lowest ratio possible. Therefore, in case of Category I my model excluded the interests outstanding because of the radically low income level. Income contingent repayment is advan-tages basically because it is proportional to the available in-
Table 1. Characteristics of the analysed loans
CHF EUR
Disbursed loan (HUF) 5 million 5 million
Duration (years) 20 20
Interest rate (%) 2,49 3,99
Time of contract 1st July 2005 1st July 2005
First repayment 1st August 2005 1st August 2005
Collateral mortgage mortgageCalculating method of the instalment annuity annuity
Table 2. Monthly net incomes of each category
Category Net income (HUF/month)
Category I 120 000–199 999
Category II 200 000–280 000
Category III 280 000 +
Source: Own data
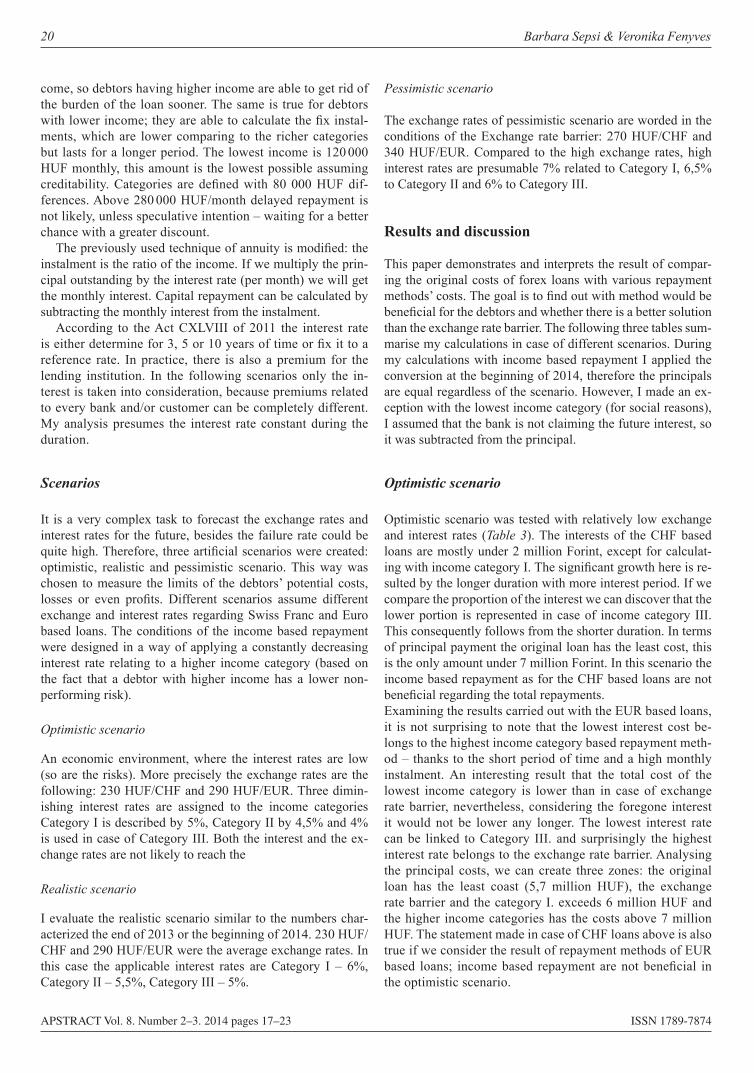
20 Barbara Sepsi & Veronika Fenyves
APSTRACT Vol. 8. Number 2–3. 2014 pages 17–23 ISSN 1789-7874
come, so debtors having higher income are able to get rid of the burden of the loan sooner. The same is true for debtors with lower income; they are able to calculate the fix instal-ments, which are lower comparing to the richer categories but lasts for a longer period. The lowest income is 120 000 HUF monthly, this amount is the lowest possible assuming creditability. Categories are defined with 80 000 HUF dif-ferences. Above 280 000 HUF/month delayed repayment is not likely, unless speculative intention – waiting for a better chance with a greater discount.
The previously used technique of annuity is modified: the instalment is the ratio of the income. If we multiply the prin-cipal outstanding by the interest rate (per month) we will get the monthly interest. Capital repayment can be calculated by subtracting the monthly interest from the instalment.
According to the Act CXLVIII of 2011 the interest rate is either determine for 3, 5 or 10 years of time or fix it to a reference rate. In practice, there is also a premium for the lending institution. In the following scenarios only the in-terest is taken into consideration, because premiums related to every bank and/or customer can be completely different. My analysis presumes the interest rate constant during the duration.
Scenarios
It is a very complex task to forecast the exchange rates and interest rates for the future, besides the failure rate could be quite high. Therefore, three artificial scenarios were created: optimistic, realistic and pessimistic scenario. This way was chosen to measure the limits of the debtors’ potential costs, losses or even profits. Different scenarios assume different exchange and interest rates regarding Swiss Franc and Euro based loans. The conditions of the income based repayment were designed in a way of applying a constantly decreasing interest rate relating to a higher income category (based on the fact that a debtor with higher income has a lower non-performing risk).
Optimistic scenario
An economic environment, where the interest rates are low (so are the risks). More precisely the exchange rates are the following: 230 HUF/CHF and 290 HUF/EUR. Three dimin-ishing interest rates are assigned to the income categories Category I is described by 5%, Category II by 4,5% and 4% is used in case of Category III. Both the interest and the ex-change rates are not likely to reach the
Realistic scenario
I evaluate the realistic scenario similar to the numbers char-acterized the end of 2013 or the beginning of 2014. 230 HUF/CHF and 290 HUF/EUR were the average exchange rates. In this case the applicable interest rates are Category I – 6%, Category II – 5,5%, Category III – 5%.
Pessimistic scenario
The exchange rates of pessimistic scenario are worded in the conditions of the Exchange rate barrier: 270 HUF/CHF and 340 HUF/EUR. Compared to the high exchange rates, high interest rates are presumable 7% related to Category I, 6,5% to Category II and 6% to Category III.
Results and discussion
This paper demonstrates and interprets the result of compar-ing the original costs of forex loans with various repayment methods’ costs. The goal is to find out with method would be beneficial for the debtors and whether there is a better solution than the exchange rate barrier. The following three tables sum-marise my calculations in case of different scenarios. During my calculations with income based repayment I applied the conversion at the beginning of 2014, therefore the principals are equal regardless of the scenario. However, I made an ex-ception with the lowest income category (for social reasons), I assumed that the bank is not claiming the future interest, so it was subtracted from the principal.
Optimistic scenario
Optimistic scenario was tested with relatively low exchange and interest rates (Table 3). The interests of the CHF based loans are mostly under 2 million Forint, except for calculat-ing with income category I. The significant growth here is re-sulted by the longer duration with more interest period. If we compare the proportion of the interest we can discover that the lower portion is represented in case of income category III. This consequently follows from the shorter duration. In terms of principal payment the original loan has the least cost, this is the only amount under 7 million Forint. In this scenario the income based repayment as for the CHF based loans are not beneficial regarding the total repayments.Examining the results carried out with the EUR based loans, it is not surprising to note that the lowest interest cost be-longs to the highest income category based repayment meth-od – thanks to the short period of time and a high monthly instalment. An interesting result that the total cost of the lowest income category is lower than in case of exchange rate barrier, nevertheless, considering the foregone interest it would not be lower any longer. The lowest interest rate can be linked to Category III. and surprisingly the highest interest rate belongs to the exchange rate barrier. Analysing the principal costs, we can create three zones: the original loan has the least coast (5,7 million HUF), the exchange rate barrier and the category I. exceeds 6 million HUF and the higher income categories has the costs above 7 million HUF. The statement made in case of CHF loans above is also true if we consider the result of repayment methods of EUR based loans; income based repayment are not beneficial in the optimistic scenario.
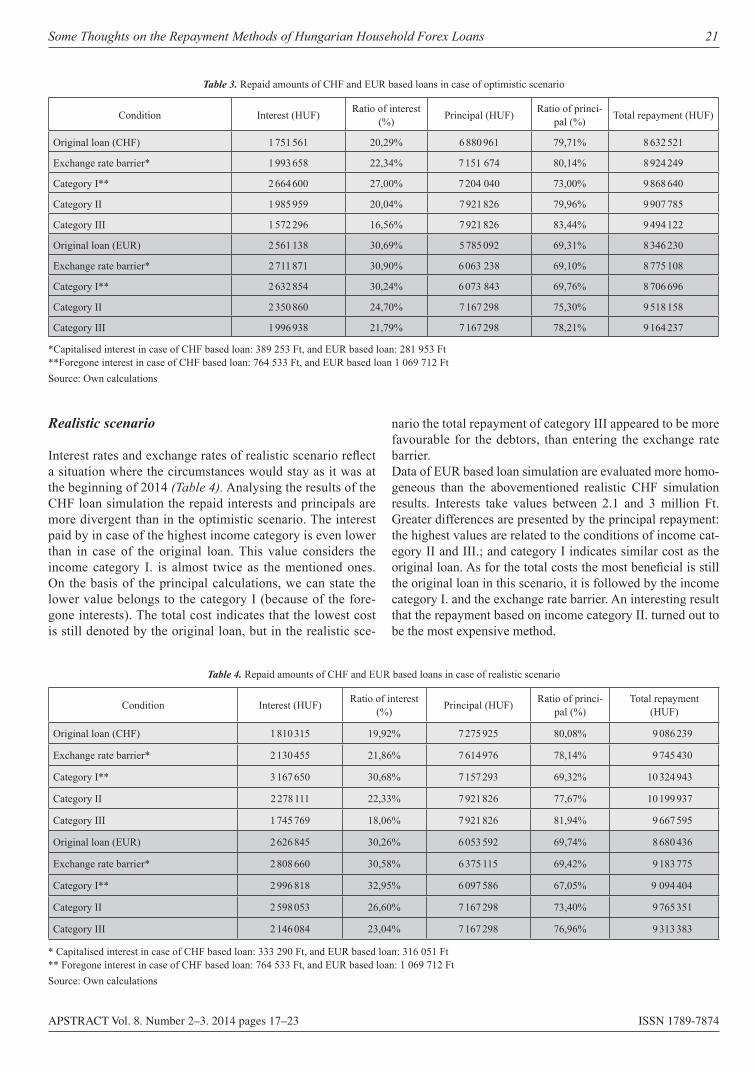
Some Thoughts on the Repayment Methods of Hungarian Household Forex Loans 21
APSTRACT Vol. 8. Number 2–3. 2014 pages 17–23 ISSN 1789-7874
Realistic scenario
Interest rates and exchange rates of realistic scenario reflect a situation where the circumstances would stay as it was at the beginning of 2014 (Table 4). Analysing the results of the CHF loan simulation the repaid interests and principals are more divergent than in the optimistic scenario. The interest paid by in case of the highest income category is even lower than in case of the original loan. This value considers the income category I. is almost twice as the mentioned ones. On the basis of the principal calculations, we can state the lower value belongs to the category I (because of the fore-gone interests). The total cost indicates that the lowest cost is still denoted by the original loan, but in the realistic sce-
nario the total repayment of category III appeared to be more favourable for the debtors, than entering the exchange rate barrier.Data of EUR based loan simulation are evaluated more homo-geneous than the abovementioned realistic CHF simulation results. Interests take values between 2.1 and 3 million Ft. Greater differences are presented by the principal repayment: the highest values are related to the conditions of income cat-egory II and III.; and category I indicates similar cost as the original loan. As for the total costs the most beneficial is still the original loan in this scenario, it is followed by the income category I. and the exchange rate barrier. An interesting result that the repayment based on income category II. turned out to be the most expensive method.
Table 3. Repaid amounts of CHF and EUR based loans in case of optimistic scenario
Condition Interest (HUF) Ratio of interest (%) Principal (HUF) Ratio of princi-
pal (%) Total repayment (HUF)
Original loan (CHF) 1 751 561 20,29% 6 880 961 79,71% 8 632 521
Exchange rate barrier* 1 993 658 22,34% 7 151 674 80,14% 8 924 249
Category I** 2 664 600 27,00% 7 204 040 73,00% 9 868 640
Category II 1 985 959 20,04% 7 921 826 79,96% 9 907 785
Category III 1 572 296 16,56% 7 921 826 83,44% 9 494 122
Original loan (EUR) 2 561 138 30,69% 5 785 092 69,31% 8 346 230
Exchange rate barrier* 2 711 871 30,90% 6 063 238 69,10% 8 775 108
Category I** 2 632 854 30,24% 6 073 843 69,76% 8 706 696
Category II 2 350 860 24,70% 7 167 298 75,30% 9 518 158
Category III 1 996 938 21,79% 7 167 298 78,21% 9 164 237
*Capitalised interest in case of CHF based loan: 389 253 Ft, and EUR based loan: 281 953 Ft**Foregone interest in case of CHF based loan: 764 533 Ft, and EUR based loan 1 069 712 FtSource: Own calculations
Table 4. Repaid amounts of CHF and EUR based loans in case of realistic scenario
Condition Interest (HUF) Ratio of interest (%) Principal (HUF) Ratio of princi-
pal (%)Total repayment
(HUF)
Original loan (CHF) 1 810 315 19,92% 7 275 925 80,08% 9 086 239
Exchange rate barrier* 2 130 455 21,86% 7 614 976 78,14% 9 745 430
Category I** 3 167 650 30,68% 7 157 293 69,32% 10 324 943
Category II 2 278 111 22,33% 7 921 826 77,67% 10 199 937
Category III 1 745 769 18,06% 7 921 826 81,94% 9 667 595
Original loan (EUR) 2 626 845 30,26% 6 053 592 69,74% 8 680 436
Exchange rate barrier* 2 808 660 30,58% 6 375 115 69,42% 9 183 775
Category I** 2 996 818 32,95% 6 097 586 67,05% 9 094 404
Category II 2 598 053 26,60% 7 167 298 73,40% 9 765 351
Category III 2 146 084 23,04% 7 167 298 76,96% 9 313 383
* Capitalised interest in case of CHF based loan: 333 290 Ft, and EUR based loan: 316 051 Ft** Foregone interest in case of CHF based loan: 764 533 Ft, and EUR based loan: 1 069 712 FtSource: Own calculations
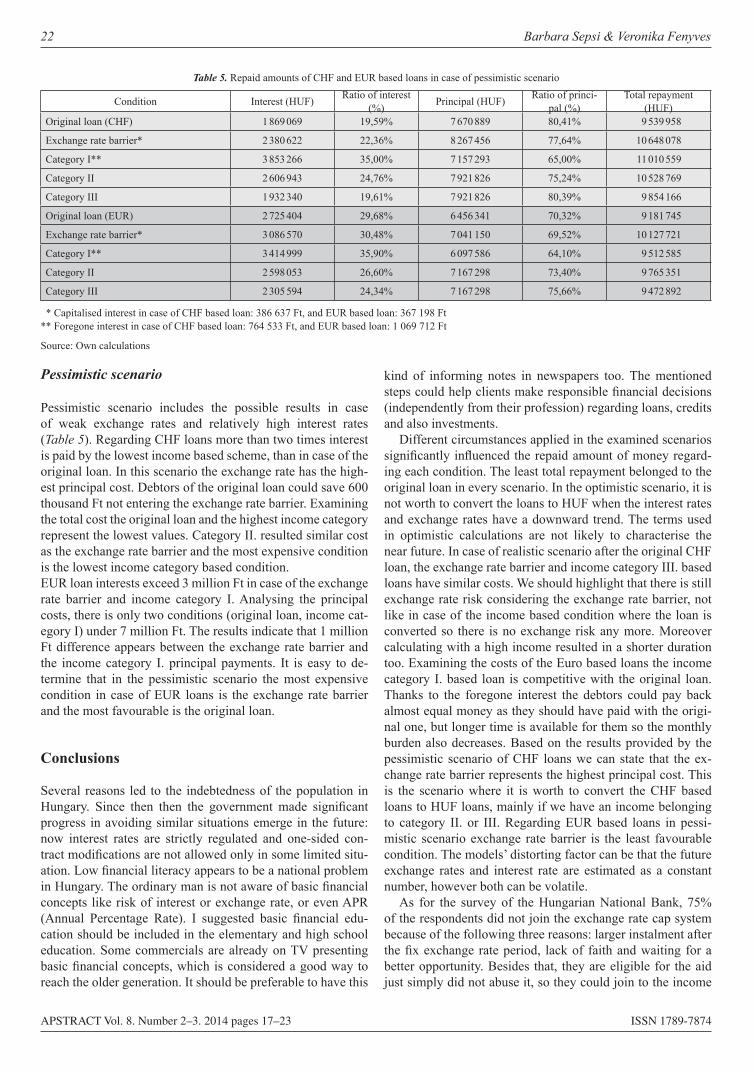
22 Barbara Sepsi & Veronika Fenyves
APSTRACT Vol. 8. Number 2–3. 2014 pages 17–23 ISSN 1789-7874
Pessimistic scenario
Pessimistic scenario includes the possible results in case of weak exchange rates and relatively high interest rates (Table 5). Regarding CHF loans more than two times interest is paid by the lowest income based scheme, than in case of the original loan. In this scenario the exchange rate has the high-est principal cost. Debtors of the original loan could save 600 thousand Ft not entering the exchange rate barrier. Examining the total cost the original loan and the highest income category represent the lowest values. Category II. resulted similar cost as the exchange rate barrier and the most expensive condition is the lowest income category based condition.EUR loan interests exceed 3 million Ft in case of the exchange rate barrier and income category I. Analysing the principal costs, there is only two conditions (original loan, income cat-egory I) under 7 million Ft. The results indicate that 1 million Ft difference appears between the exchange rate barrier and the income category I. principal payments. It is easy to de-termine that in the pessimistic scenario the most expensive condition in case of EUR loans is the exchange rate barrier and the most favourable is the original loan.
Conclusions
Several reasons led to the indebtedness of the population in Hungary. Since then then the government made significant progress in avoiding similar situations emerge in the future: now interest rates are strictly regulated and one-sided con-tract modifications are not allowed only in some limited situ-ation. Low financial literacy appears to be a national problem in Hungary. The ordinary man is not aware of basic financial concepts like risk of interest or exchange rate, or even APR (Annual Percentage Rate). I suggested basic financial edu-cation should be included in the elementary and high school education. Some commercials are already on TV presenting basic financial concepts, which is considered a good way to reach the older generation. It should be preferable to have this
kind of informing notes in newspapers too. The mentioned steps could help clients make responsible financial decisions (independently from their profession) regarding loans, credits and also investments.
Different circumstances applied in the examined scenarios significantly influenced the repaid amount of money regard-ing each condition. The least total repayment belonged to the original loan in every scenario. In the optimistic scenario, it is not worth to convert the loans to HUF when the interest rates and exchange rates have a downward trend. The terms used in optimistic calculations are not likely to characterise the near future. In case of realistic scenario after the original CHF loan, the exchange rate barrier and income category III. based loans have similar costs. We should highlight that there is still exchange rate risk considering the exchange rate barrier, not like in case of the income based condition where the loan is converted so there is no exchange risk any more. Moreover calculating with a high income resulted in a shorter duration too. Examining the costs of the Euro based loans the income category I. based loan is competitive with the original loan. Thanks to the foregone interest the debtors could pay back almost equal money as they should have paid with the origi-nal one, but longer time is available for them so the monthly burden also decreases. Based on the results provided by the pessimistic scenario of CHF loans we can state that the ex-change rate barrier represents the highest principal cost. This is the scenario where it is worth to convert the CHF based loans to HUF loans, mainly if we have an income belonging to category II. or III. Regarding EUR based loans in pessi-mistic scenario exchange rate barrier is the least favourable condition. The models’ distorting factor can be that the future exchange rates and interest rate are estimated as a constant number, however both can be volatile.
As for the survey of the Hungarian National Bank, 75% of the respondents did not join the exchange rate cap system because of the following three reasons: larger instalment after the fix exchange rate period, lack of faith and waiting for a better opportunity. Besides that, they are eligible for the aid just simply did not abuse it, so they could join to the income
Table 5. Repaid amounts of CHF and EUR based loans in case of pessimistic scenario
Condition Interest (HUF) Ratio of interest (%) Principal (HUF) Ratio of princi-
pal (%)Total repayment
(HUF)Original loan (CHF) 1 869 069 19,59% 7 670 889 80,41% 9 539 958
Exchange rate barrier* 2 380 622 22,36% 8 267 456 77,64% 10 648 078
Category I** 3 853 266 35,00% 7 157 293 65,00% 11 010 559
Category II 2 606 943 24,76% 7 921 826 75,24% 10 528 769
Category III 1 932 340 19,61% 7 921 826 80,39% 9 854 166
Original loan (EUR) 2 725 404 29,68% 6 456 341 70,32% 9 181 745
Exchange rate barrier* 3 086 570 30,48% 7 041 150 69,52% 10 127 721
Category I** 3 414 999 35,90% 6 097 586 64,10% 9 512 585
Category II 2 598 053 26,60% 7 167 298 73,40% 9 765 351
Category III 2 305 594 24,34% 7 167 298 75,66% 9 472 892
* Capitalised interest in case of CHF based loan: 386 637 Ft, and EUR based loan: 367 198 Ft** Foregone interest in case of CHF based loan: 764 533 Ft, and EUR based loan: 1 069 712 Ft
Source: Own calculations
Some Thoughts on the Repayment Methods of Hungarian Household Forex Loans 23
APSTRACT Vol. 8. Number 2–3. 2014 pages 17–23 ISSN 1789-7874
based repayment. Debtors choosing this method can calculate their instalments monthly, because it is fixed to their salary and it grows only if they are better off. Moreover, they can complete the payments even before it was planned. With the income based repayment the debtors can calculate with a fix instalment every month and it is harmony with the govern-ment’s strategy to eliminate exchange risk and uncertainty from the portfolios.
ReferencesBalás T & Nagy M (2010): A devizahitelek átváltása forint hite lekre. Hitelintézeti szemle. Vol. 9. No. 5., p. 416–430.
Berlinger E & Walter Gy (2013): Unortodox javaslat a deviza és forintalapú jelzáloghitelek rendezésére. Hitelintézeti Szemle. Vol. 12. No. 6., p. 469–493.
Bloem AM. & Freeman R (2005): The Treatment of Non per forming Loans. Eighteenth Meeting of the IMF Committee on Balance of Payments Statistics Washington, D.C., June 27–July 1 p.15.
Burgerné Gimes A (2011): A kelet-közép-európai országok válsága a globális krízis tükrében – válaszok a válságra. Statisztikai szemle. Vol. 89. No. 6., p. 645–666.
Dübel HJ (2012): CEE Mortgage Market Regulation. Berlin. 83.p.
Holmár K (2012): Mérlegen a valóság, avagy a hazai devizahitelezés nyertesei és/vagy vesztesei. Hitelintézeti szemle. Special Issue. p. 33–43.
Hudecz A (2012): Párhuzamos történetek. Közgazdasági szemle. Vol. LIX.. April., p. 349–411.Marsi E (2012): A magyar bankrendszer teljesítményének értékelése a közép-kelet-európai bankrendszerek tükrében. Hitelintézeti szemle. Vol. 11. No. 6., p. 516–530. Nyeste O & Árokszállási Z (2012): Devizahitelezés Magyar orszá-gon – régiós makrogazdasági, fiskális és monetáris politikai meg-köze lítés ben. Bp. Magyar Bankszövetség. p. 154–171.Sándorné Új É (2003): Pénzügyek a gyakorlatban. Pécs. Penta Únió Oktatási Centrum, 347.p.Varga L. (2008): A magyar szuverén CDS-szpredek in for má ció tar-tal ma. MNB-studies 78. p.307Sigma Kft. (2010): Egy piaci kudarc története – okok, körülmények, tanulságok A hazai lakossági hitelpiac tíz éve, Study (GVH VKK/3/2009), Bp. p. 42.Romanian National Bank (RNB) Statistics http://www.bnro.ro/Loans-and-Deposits-by-County-3211.aspxPolish National Bank (PNB) Statistics http://www.nbp.pl/homen.aspx?f=/en/statystyka/naleznosci/naleznosci.htmlMNB (Hungarian National Bank) Financial Stability Reports 2005–2014 http://english.mnb.hu/Root/ENMNB/Kiadvanyok/mnben_stabilMNB (Hungarian National Bank): Guide to the regulation concerning FX lending in Hungary https://felugyelet.mnb.hu/data/cms2408096/ESRB_guidelines_compliance.pdfAct CXLVIII of 2011 (Hungary)Act LXXV of 2011 (Hungary)Act CLXXIII of 2013 (Hungary)Government Decree 128/2012
APSTRACT Vol. 8. Number 2–3. 2014 pages 25–32 ISSN 1789-7874
Introduction
Energy production based on biomass in Hungary
Most of the currently operational coal power plants in Hun-gary were built in the 1950s shortly after the Second World War. A large fraction of those power plants was meant for processing high sulfur content coal mined in Hungary. Using locally mined coal was preferable for self-sustainability, de-creased unemployment rates, but in the same time was heavily polluting the air. After the breakup of the Soviet Union and the democratic change in Hungary due to globalization self sustainability became less important. Instead, first economic sustainability and later, due to Hungary’s EU membership, the environmental impact was more central. As a consequence, coal mines were shut down one after another in Hungary. Al-most 50 years old power plants built with obsolete technol-ogy had to be either modernized or shut down. Internaliza-tion of external costs and the introduction of carbon dioxide quotas had a large economic impact on the faith of coal plants. Changing to biomass fuel on the other hand gave a new hope for these old facilities.
After the turn of the millennia due to developments forced by economical and legal regulations caused the massive use of wood chips, sawmill shavings and even sawdust as fuel. Due to increasing fuel consumption in power plants the interest and demand in solid biomass type raw fuel has increased and so did their price.
In the second half of 2003 the Ajka plant of the Bakonyi Hőerőmű Plc switched to biomass-fuel with two boilers. This step wasn’t unique in Hungary, since the Mátravidék plant started mixed fueling with lignin and biomass, the Pannon CHP (formerly Pécsi CHP), the Borsodi CHP in Kazincbar-cika and the Tiszapalkonyai CHP in Tiszaújváros also started burning biomass. Reasons were subsistence and diversifica-tion of operations as the power plant emission requirements were substantially stricter. These plants currently buying fuel from neighboring forestry industries, but the providers’ circle and the utilized fuel types are widening.
The main potential clients for providing biomass are forest-ry industry, agricultural farming and local governments, but some sawmills and furniture manufacturers are considered as well. Utilizing the following byproducts can provide an op-portunity for decreasing costs for those in the fields as well as a small increase in wages. Byproduct utilization however could not only generate income for farmers, but also for other biomass providers, like local governments.
According to the 2001/77 EU directives as part of the battle to minimize the effects of global climate change the strategy of Hungary in using renewable sources for electric power production was described in the Electric Power Law of 2001 and The Central Heating Law of 2005. According to the re-lated 56/2002. (XII. 29.) GKM regulation it was mandatory to purchase available electric power generated by using renew-able sources and this wasn’t changed in the new law passed in 2007.
The PossibiliTies of energeTic APPlicAbiliTy And economic evAluATion
of grAPe in The szenTAnTAlfA TownshiPJózsef Brazsil, Gábor Pintér & Mihály Veszelka
Pannon University, Georgikon School, Keszthely
Abstract: Energy production has become one of the key problems in the recent years. Hungary is lacking fossil fuels, but could play a leading role of biomass utilization in Europe. In the concept of biomass not only main-, but by-products (e.g. grape) are be included. Since farmers face a variety of difficulties in disposing of garpe from plantation sites it would be beneficial to encourage grape use in energy production. In our opinion due to varying transportation costs it is crucial to investigate the amount of potentially usable grape both for the whole country and in local township levels. Our economic studies were done on the Szentantalfa Township’s Balatonfüred-Csopak Vine Region. According to our findings the total amount of grape generated in the township theoretically amounts to 5.28 TJ exploitable that would operate a 360 kW boiler for a whole heating period (6 months). In our opinion the appearance of local energy production based on grape could significantly raise the ability of the future potential income of townships.
Keywords: grape, wine county, energy, agricultural byproduct
Applied Studies in Agribusiness and Commerce – APSTRACTAgroinform Publishing House, Budapest scienTific PAPers
26 József Brazsil, Gábor Pintér & Mihály Veszelka
APSTRACT Vol. 8. Number 2–3. 2014 pages 25–32 ISSN 1789-7874
Agricultural byproducts
Hungary has excellent natural resources for agriculture. We produce large amounts of plant-based biomass every year. Thus, there is a production of a variety of related byproducts, which should be utilized for energy production. Currently there are contradicting estimates for the amount of agricul-tural byproducts: Bai (2001) claims 7–8 million tons yearly, while according to Gyulai (2007) this number could be as high as 10 million tons/year of which 40–45% is usable for en-ergy. Nevertheless the same conclusion can be drawn from the various estimates: Hungary produces a significant amount of agricultural byproducts.
Agricultural byproducts can be categorized according to the goals of their utilization (e. g. forage, fertilization, utiliza-tion in energy production, etc.). It is practical to further divide the category of energy production capable byproducts into two subcategories based on their burning-properties: arbore-als and non-arboreals. Woody plants can be burned together with regular firewood, while non-arboreals require specialized burners and boilers. Further, it has to be taken into consider-ation whether their usage is appropriate with the current tech-nology or that will be available through future developments.
Grape, as an arboreal agricultural byproduct can be burned together with biomass. In our opinion a country, like Hungary, in need of energy import can’t afford to consider biomass us-age solely for main products. In Hungary it is a strategically important goal to utilize byproducts within biomass as well. Since those materials are not the main targets of production without interest they are considered unnecessary waste and their disposal creates extra cost for the farmers.
In case interest materializes toward agricultural byproducts for their utilization in energy production it is already a benefit if the farmers don’t have to dispose of them as this cost-low-ering factor can appear as profit.
Wine grape farming in Hungary
In order to secure its own well being, the expectations of the ever-growing humanity are constantly increasing towards na-ture. Today, besides food production and supply energy pro-duction and supply comes into focus. Hungary is poor in fos-sil fuels, but capable of rich biomass production. In Central- Europe our country could bear a potential leading role in biomass production not only considering main, but also by-products. Without adequate interest in the materials generated besides the main products, i.e. not byproduct but waste is pro-duced, farmers’ aim at cost effective disposal. According to our study, currently vine is widely considered as waste instead of falling into the byproduct category.
The main goal of the authors is to determine the amount of usable vine locally, for a particular township under investiga-tion.
Wine grape farming is one of the successful branches of the Hungarian agriculture. Its success originates from envi-ronmental factors; historical vine regions in Hungary are well or excellently suited for wine farming. If we consider the in-
dividual wine regions and townships, we can conclude that the variety provides the appeal of main products. Besides the excellence of the agro-economic potential, however, there are societal challenges waiting to be dealt with. The production of wine grape is connected with human factors in a variety of aspects. The need for human labor and capital funding is high, the monetary fund lockup, investing time and potential return time is long, markets are unpredictable and highly variable and finally the legal regulations frequently change. The town-ship system formed by the directive of the EU regulates the production, handling and selling of the main products (grape and wine) and the disposal of subsequently produced byprod-ucts (rape, tartar, etc.). In wine grape farming and production however a significant amount of vine is realized of which han-dling and disposal regulations are less elaborated. In regards of plant material (vine) handling obtained during pruning it is rather prohibitions that are currently in effect. As derived from cross compliance rules it is forbidden to dispose of vine at the end of the fields.
Even experts in the production line of winemaking have no clear understanding of the amount of vine (by)produced, not to mention that the literature almost never mentions it.
The amount of vine and the yield of wine grape are posi-tively correlated, as it is recognized by traditional folk wis-dom in proverbs. However this correlation is not simple as multiple factors (geographic location, age of the plantation, actual rainfall, etc.) influence the yield of wine grape making it difficult to quantify.
Handling and disposing of vine
Vine produced during the pruning process has to be removed for its interference with production as well as the potential cause of plant health issues. Removal of one is practical be-fore the period of germination or sprouting to avoid physical damage to plants.
There are three basic routes for vine disposal, all three hav-ing some associated costs. – Mixing in with the soil: the vine is shred and spread over
the plantation and mixed in at the next phase for replenish-ing nutrients. Besides the cost of shredding, the drawback of this method is the potential for creating a preferred environ-ment for bacteria and viruses to overwinter and reinfect the plantation.
– With storage: this method replaced the widely utilized, but now forbidden burning of vine. The farmer disposes of the vine at an unused location, which biodegrades in a few years time. Cheap (no shredding cost), but requires relatively big space.
– The farmer could sell or utilize (provided the availability of proper equipment) the produced vine for energy production. In this case the vine is transported trussed or shredded.According to Pintér’s (2012) related calculations in the 22
wine regions of Hungary approximately 132.5 thousand tons of vine is produced yearly. This would mean about 2 million GJ energy (as a comparison 43 GJ/year is used for heating an
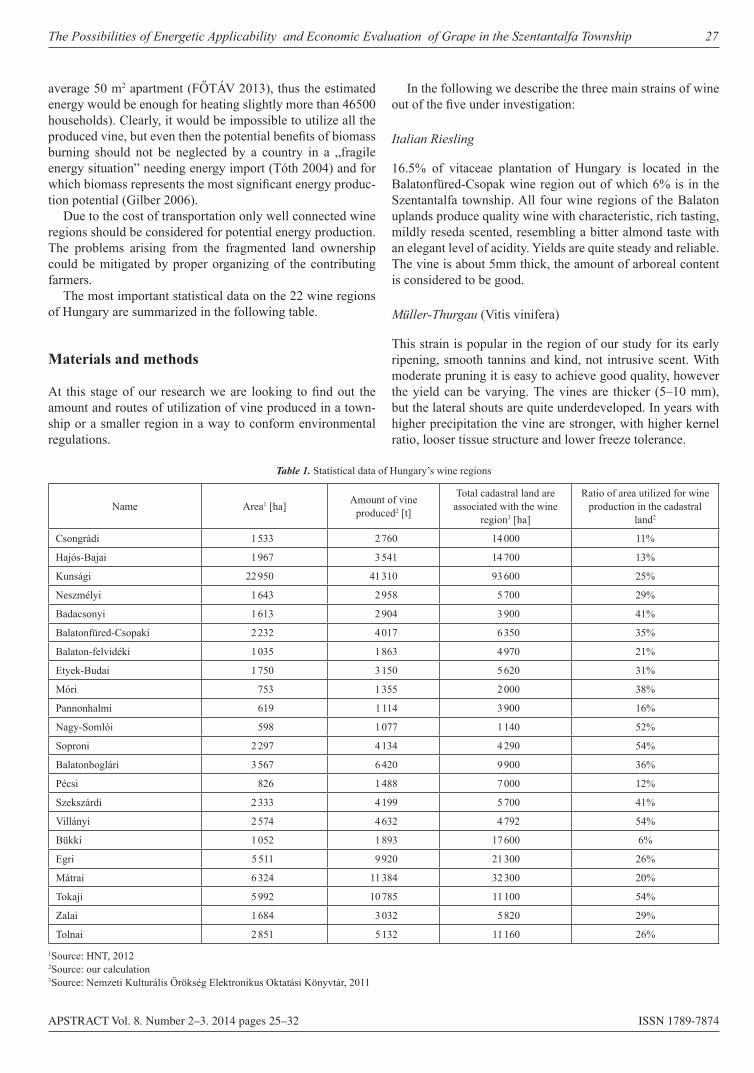
The Possibilities of Energetic Applicability and Economic Evaluation of Grape in the Szentantalfa Township 27
APSTRACT Vol. 8. Number 2–3. 2014 pages 25–32 ISSN 1789-7874
average 50 m2 apartment (FŐTÁV 2013), thus the estimated energy would be enough for heating slightly more than 46500 households). Clearly, it would be impossible to utilize all the produced vine, but even then the potential benefits of biomass burning should not be neglected by a country in a „fragile energy situation” needing energy import (Tóth 2004) and for which biomass represents the most significant energy produc-tion potential (Gilber 2006).
Due to the cost of transportation only well connected wine regions should be considered for potential energy production. The problems arising from the fragmented land ownership could be mitigated by proper organizing of the contributing farmers.
The most important statistical data on the 22 wine regions of Hungary are summarized in the following table.
Materials and methods
At this stage of our research we are looking to find out the amount and routes of utilization of vine produced in a town-ship or a smaller region in a way to conform environmental regulations.
In the following we describe the three main strains of wine out of the five under investigation:
Italian Riesling
16.5% of vitaceae plantation of Hungary is located in the Balatonfüred-Csopak wine region out of which 6% is in the Szentantalfa township. All four wine regions of the Balaton uplands produce quality wine with characteristic, rich tasting, mildly reseda scented, resembling a bitter almond taste with an elegant level of acidity. Yields are quite steady and reliable. The vine is about 5mm thick, the amount of arboreal content is considered to be good.
Müller-Thurgau (Vitis vinifera)
This strain is popular in the region of our study for its early ripening, smooth tannins and kind, not intrusive scent. With moderate pruning it is easy to achieve good quality, however the yield can be varying. The vines are thicker (5–10 mm), but the lateral shouts are quite underdeveloped. In years with higher precipitation the vine are stronger, with higher kernel ratio, looser tissue structure and lower freeze tolerance.
Table 1. Statistical data of Hungary’s wine regions
Name Area1 [ha] Amount of vine produced2 [t]
Total cadastral land are associated with the wine
region3 [ha]
Ratio of area utilized for wine production in the cadastral
land2
Csongrádi 1 533 2 760 14 000 11%
Hajós-Bajai 1 967 3 541 14 700 13%
Kunsági 22 950 41 310 93 600 25%
Neszmélyi 1 643 2 958 5 700 29%
Badacsonyi 1 613 2 904 3 900 41%
Balatonfüred-Csopaki 2 232 4 017 6 350 35%
Balaton-felvidéki 1 035 1 863 4 970 21%
Etyek-Budai 1 750 3 150 5 620 31%
Móri 753 1 355 2 000 38%
Pannonhalmi 619 1 114 3 900 16%
Nagy-Somlói 598 1 077 1 140 52%
Soproni 2 297 4 134 4 290 54%
Balatonboglári 3 567 6 420 9 900 36%
Pécsi 826 1 488 7 000 12%
Szekszárdi 2 333 4 199 5 700 41%
Villányi 2 574 4 632 4 792 54%
Bükki 1 052 1 893 17 600 6%
Egri 5 511 9 920 21 300 26%
Mátrai 6 324 11 384 32 300 20%
Tokaji 5 992 10 785 11 100 54%
Zalai 1 684 3 032 5 820 29%
Tolnai 2 851 5 132 11 160 26%
1Source: HNT, 20122Source: our calculation3Source: Nemzeti Kulturális Örökség Elektronikus Oktatási Könyvtár, 2011
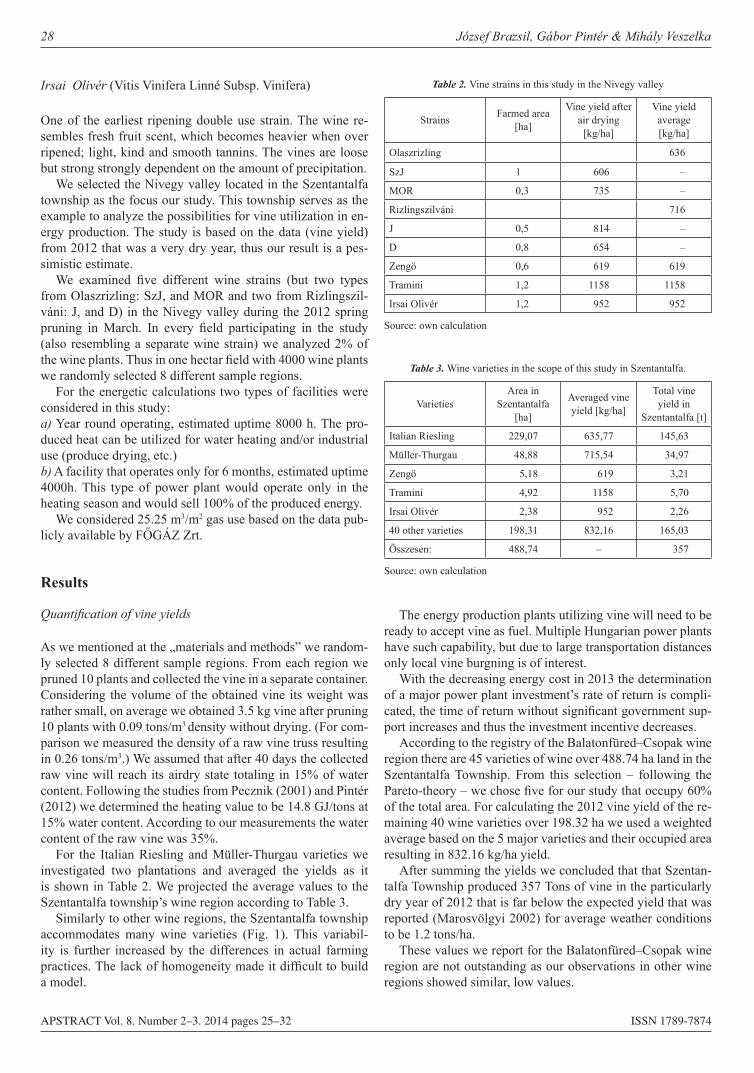
28 József Brazsil, Gábor Pintér & Mihály Veszelka
APSTRACT Vol. 8. Number 2–3. 2014 pages 25–32 ISSN 1789-7874
Irsai Olivér (Vitis Vinifera Linné Subsp. Vinifera)
One of the earliest ripening double use strain. The wine re-sembles fresh fruit scent, which becomes heavier when over ripened; light, kind and smooth tannins. The vines are loose but strong strongly dependent on the amount of precipitation.
We selected the Nivegy valley located in the Szentantalfa township as the focus our study. This township serves as the example to analyze the possibilities for vine utilization in en-ergy production. The study is based on the data (vine yield) from 2012 that was a very dry year, thus our result is a pes-simistic estimate.
We examined five different wine strains (but two types from Olaszrizling: SzJ, and MOR and two from Rizlingszil-váni: J, and D) in the Nivegy valley during the 2012 spring pruning in March. In every field participating in the study (also resembling a separate wine strain) we analyzed 2% of the wine plants. Thus in one hectar field with 4000 wine plants we randomly selected 8 different sample regions.
For the energetic calculations two types of facilities were considered in this study:a) Year round operating, estimated uptime 8000 h. The pro-duced heat can be utilized for water heating and/or industrial use (produce drying, etc.)b) A facility that operates only for 6 months, estimated uptime 4000h. This type of power plant would operate only in the heating season and would sell 100% of the produced energy.
We considered 25.25 m3/m2 gas use based on the data pub-licly available by FŐGÁZ Zrt.
Results
Quantification of vine yields
As we mentioned at the „materials and methods” we random-ly selected 8 different sample regions. From each region we pruned 10 plants and collected the vine in a separate container. Considering the volume of the obtained vine its weight was rather small, on average we obtained 3.5 kg vine after pruning 10 plants with 0.09 tons/m3 density without drying. (For com-parison we measured the density of a raw vine truss resulting in 0.26 tons/m3.) We assumed that after 40 days the collected raw vine will reach its airdry state totaling in 15% of water content. Following the studies from Pecznik (2001) and Pintér (2012) we determined the heating value to be 14.8 GJ/tons at 15% water content. According to our measurements the water content of the raw vine was 35%.
For the Italian Riesling and Müller-Thurgau varieties we investigated two plantations and averaged the yields as it is shown in Table 2. We projected the average values to the Szentantalfa township’s wine region according to Table 3.
Similarly to other wine regions, the Szentantalfa township accommodates many wine varieties (Fig. 1). This variabil-ity is further increased by the differences in actual farming practices. The lack of homogeneity made it difficult to build a model.
The energy production plants utilizing vine will need to be ready to accept vine as fuel. Multiple Hungarian power plants have such capability, but due to large transportation distances only local vine burgning is of interest.
With the decreasing energy cost in 2013 the determination of a major power plant investment’s rate of return is compli-cated, the time of return without significant government sup-port increases and thus the investment incentive decreases.
According to the registry of the Balatonfüred–Csopak wine region there are 45 varieties of wine over 488.74 ha land in the Szentantalfa Township. From this selection – following the Pareto-theory – we chose five for our study that occupy 60% of the total area. For calculating the 2012 vine yield of the re-maining 40 wine varieties over 198.32 ha we used a weighted average based on the 5 major varieties and their occupied area resulting in 832.16 kg/ha yield.
After summing the yields we concluded that that Szentan-talfa Township produced 357 Tons of vine in the particularly dry year of 2012 that is far below the expected yield that was reported (Marosvölgyi 2002) for average weather conditions to be 1.2 tons/ha.
These values we report for the Balatonfüred–Csopak wine region are not outstanding as our observations in other wine regions showed similar, low values.
Table 2. Vine strains in this study in the Nivegy valley
Strains Farmed area [ha]
Vine yield after air drying
[kg/ha]
Vine yield average [kg/ha]
Olaszrizling 636
SzJ 1 606 –
MOR 0,3 735 –
Rizlingszilváni 716
J 0,5 814 –
D 0,8 654 –
Zengő 0,6 619 619
Tramini 1,2 1158 1158
Irsai Olivér 1,2 952 952
Source: own calculation
Table 3. Wine varieties in the scope of this study in Szentantalfa.
VarietiesArea in
Szentantalfa [ha]
Averaged vine yield [kg/ha]
Total vine yield in
Szentantalfa [t]
Italian Riesling 229,07 635,77 145,63
Müller-Thurgau 48,88 715,54 34,97
Zengő 5,18 619 3,21
Tramini 4,92 1158 5,70
Irsai Olivér 2,38 952 2,26
40 other varieties 198,31 832,16 165,03
Összesen: 488,74 – 357
Source: own calculation
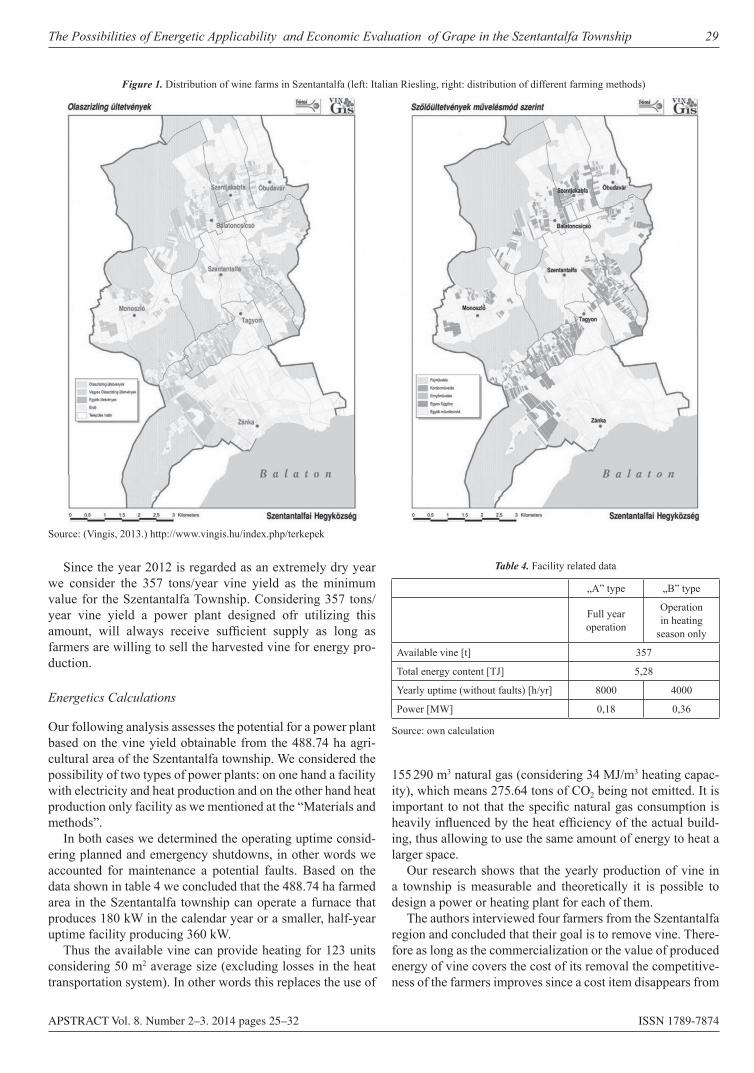
The Possibilities of Energetic Applicability and Economic Evaluation of Grape in the Szentantalfa Township 29
APSTRACT Vol. 8. Number 2–3. 2014 pages 25–32 ISSN 1789-7874
Since the year 2012 is regarded as an extremely dry year we consider the 357 tons/year vine yield as the minimum value for the Szentantalfa Township. Considering 357 tons/year vine yield a power plant designed ofr utilizing this amount, will always receive suffi cient supply as long as farmers are willing to sell the harvested vine for energy pro-duction.
Energetics Calculations
Our following analysis assesses the potential for a power plant based on the vine yield obtainable from the 488.74 ha agri-cultural area of the Szentantalfa township. We considered the possibility of two types of power plants: on one hand a facility with electricity and heat production and on the other hand heat production only facility as we mentioned at the “Materials and methods”.
In both cases we determined the operating uptime consid-ering planned and emergency shutdowns, in other words we accounted for maintenance a potential faults. Based on the data shown in table 4 we concluded that the 488.74 ha farmed area in the Szentantalfa township can operate a furnace that produces 180 kW in the calendar year or a smaller, half-year uptime facility producing 360 kW.
Thus the available vine can provide heating for 123 units considering 50 m2 average size (excluding losses in the heat transportation system). In other words this replaces the use of
155 290 m3 natural gas (considering 34 MJ/m3 heating capac-ity), which means 275.64 tons of CO2 being not emitted. It is important to not that the specifi c natural gas consumption is heavily infl uenced by the heat effi ciency of the actual build-ing, thus allowing to use the same amount of energy to heat a larger space.
Our research shows that the yearly production of vine in a township is measurable and theoretically it is possible to design a power or heating plant for each of them.
The authors interviewed four farmers from the Szentantalfa region and concluded that their goal is to remove vine. There-fore as long as the commercialization or the value of produced energy of vine covers the cost of its removal the competitive-ness of the farmers improves since a cost item disappears from
Figure 1. Distribution of wine farms in Szentantalfa (left: Italian Riesling, right: distribution of different farming methods)
Source: (Vingis, 2013.) http://www.vingis.hu/index.php/terkepek
Table 4. Facility related data
„A” type „B” type
Full year operation
Operation in heating
season only
Available vine [t] 357
Total energy content [TJ] 5,28
Yearly uptime (without faults) [h/yr] 8000 4000
Power [MW] 0,18 0,36
Source: own calculation
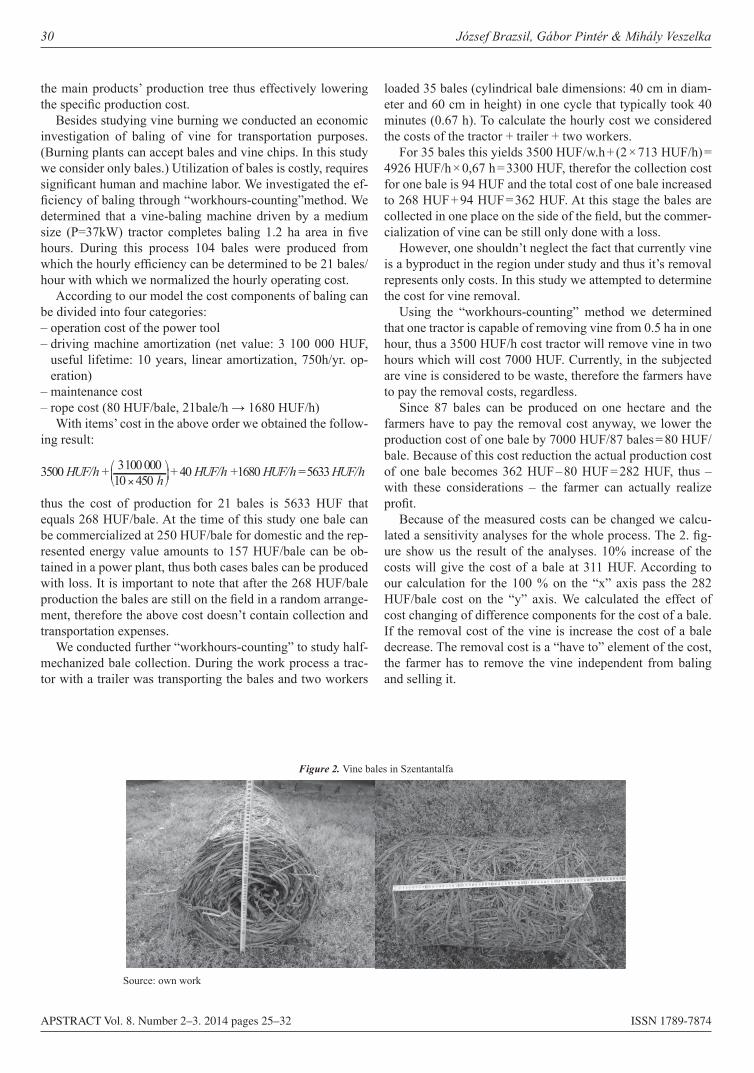
30 József Brazsil, Gábor Pintér & Mihály Veszelka
APSTRACT Vol. 8. Number 2–3. 2014 pages 25–32 ISSN 1789-7874
the main products’ production tree thus effectively lowering the specifi c production cost.
Besides studying vine burning we conducted an economic investigation of baling of vine for transportation purposes. (Burning plants can accept bales and vine chips. In this study we consider only bales.) Utilization of bales is costly, requires signifi cant human and machine labor. We investigated the ef-fi ciency of baling through “workhours-counting”method. We determined that a vine-baling machine driven by a medium size (P=37kW) tractor completes baling 1.2 ha area in fi ve hours. During this process 104 bales were produced from which the hourly effi ciency can be determined to be 21 bales/hour with which we normalized the hourly operating cost.
According to our model the cost components of baling can be divided into four categories:– operation cost of the power tool – driving machine amortization (net value: 3 100 000 HUF,
useful lifetime: 10 years, linear amortization, 750h/yr. op-eration)
– maintenance cost– rope cost (80 HUF/bale, 21bale/h → 1680 HUF/h)
With items’ cost in the above order we obtained the follow-ing result:
3500 HUF/h + 310000010 450 h
+ 40 HUF/h +1680 HUF/h =5633 HUF/h
thus the cost of production for 21 bales is 5633 HUF that equals 268 HUF/bale. At the time of this study one bale can be commercialized at 250 HUF/bale for domestic and the rep-resented energy value amounts to 157 HUF/bale can be ob-tained in a power plant, thus both cases bales can be produced with loss. It is important to note that after the 268 HUF/bale production the bales are still on the fi eld in a random arrange-ment, therefore the above cost doesn’t contain collection and transportation expenses.
We conducted further “workhours-counting” to study half-mechanized bale collection. During the work process a trac-tor with a trailer was transporting the bales and two workers
loaded 35 bales (cylindrical bale dimensions: 40 cm in diam-eter and 60 cm in height) in one cycle that typically took 40 minutes (0.67 h). To calculate the hourly cost we considered the costs of the tractor + trailer + two workers.
For 35 bales this yields 3500 HUF/w.h + (2 × 713 HUF/h) =4926 HUF/h × 0,67 h = 3300 HUF, therefor the collection cost for one bale is 94 HUF and the total cost of one bale increased to 268 HUF + 94 HUF = 362 HUF. At this stage the bales are collected in one place on the side of the fi eld, but the commer-cialization of vine can be still only done with a loss.
However, one shouldn’t neglect the fact that currently vine is a byproduct in the region under study and thus it’s removal represents only costs. In this study we attempted to determine the cost for vine removal.
Using the “workhours-counting” method we determined that one tractor is capable of removing vine from 0.5 ha in one hour, thus a 3500 HUF/h cost tractor will remove vine in two hours which will cost 7000 HUF. Currently, in the subjected are vine is considered to be waste, therefore the farmers have to pay the removal costs, regardless.
Since 87 bales can be produced on one hectare and the farmers have to pay the removal cost anyway, we lower the production cost of one bale by 7000 HUF/87 bales = 80 HUF/bale. Because of this cost reduction the actual production cost of one bale becomes 362 HUF – 80 HUF = 282 HUF, thus – with these considerations – the farmer can actually realize profi t.
Because of the measured costs can be changed we calcu-lated a sensitivity analyses for the whole process. The 2. fi g-ure show us the result of the analyses. 10% increase of the costs will give the cost of a bale at 311 HUF. According to our calculation for the 100 % on the “x” axis pass the 282 HUF/bale cost on the “y” axis. We calculated the effect of cost changing of difference components for the cost of a bale.If the removal cost of the vine is increase the cost of a bale decrease. The removal cost is a “have to” element of the cost, the farmer has to remove the vine independent from baling and selling it.
Figure 2. Vine bales in Szentantalfa
Source: own work
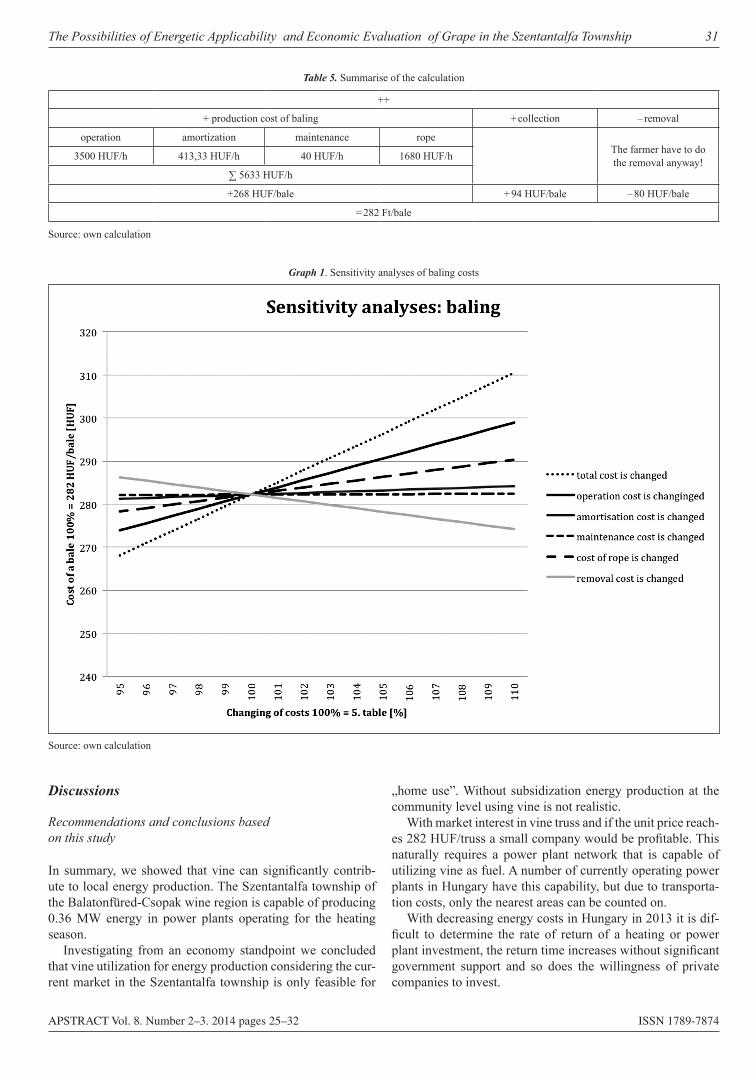
The Possibilities of Energetic Applicability and Economic Evaluation of Grape in the Szentantalfa Township 31
APSTRACT Vol. 8. Number 2–3. 2014 pages 25–32 ISSN 1789-7874
Discussions
Recommendations and conclusions based on this study
In summary, we showed that vine can significantly contrib-ute to local energy production. The Szentantalfa township of the Balatonfüred-Csopak wine region is capable of producing 0.36 MW energy in power plants operating for the heating season.
Investigating from an economy standpoint we concluded that vine utilization for energy production considering the cur-rent market in the Szentantalfa township is only feasible for
„home use”. Without subsidization energy production at the community level using vine is not realistic.
With market interest in vine truss and if the unit price reach-es 282 HUF/truss a small company would be profitable. This naturally requires a power plant network that is capable of utilizing vine as fuel. A number of currently operating power plants in Hungary have this capability, but due to transporta-tion costs, only the nearest areas can be counted on.
With decreasing energy costs in Hungary in 2013 it is dif-ficult to determine the rate of return of a heating or power plant investment, the return time increases without significant government support and so does the willingness of private companies to invest.
Table 5. Summarise of the calculation
++
+ production cost of baling + collection – removal
operation amortization maintenance ropeThe farmer have to do the removal anyway!3500 HUF/h 413,33 HUF/h 40 HUF/h 1680 HUF/h
∑ 5633 HUF/h
+268 HUF/bale + 94 HUF/bale – 80 HUF/bale
= 282 Ft/bale
Source: own calculation
Graph 1. Sensitivity analyses of baling costs
Source: own calculation
32 József Brazsil, Gábor Pintér & Mihály Veszelka
APSTRACT Vol. 8. Number 2–3. 2014 pages 25–32 ISSN 1789-7874
References
Bai A & Zsuffa L (2001): A biomassza tüzelési célú hasznosítása, Fűtéstechnika, megújuló energiaforrások, IV. évf. 2001. febr. p. 81–84.Connected GKM regulation to the Law CX, Electric Energy (VET) Hungary, in 2001. 56/2002. (XII. 29.)DIRECTIVE 2001/77/EC of the European Parlament and of the coun-cil of 27 September 2001, on the promotion of electricity produced from renewable energy sources in the internal electricity marketFŐTÁV Zrt. honlapja: http://www.fotav.hu/fotav-zrt/tarifatablazat/lakossagi-ugyfelek/ (2013. 04. 16.)Gilber J (szerk.) (2006): Magyarország energiapolitikai tézisei 2006–2030, Magyar Villamos Művek Közleményei, 43, (különszám), pp. 63Gyulai I (2007): A biomassza-dilemma, Magyar Ter mé szet vé dők Szövetsége, Budapest, pp. 35.Hegyközségek Nemzeti Tanácsa (HNT) honlapja (www.hnt.hu), ezen belül: http://www.hnt.hu/index.php?option=com_content&view=category&layout=blog&id=94&Itemid=526, (2012. 03. 06.)
Law CX, Electric Energy (VET) Hungary, in 2001.Law LXXXVI, Electric Energy (VET) Hungary, in 2007.Law of XVIII. Central Heating, Hungary, in 2005.Marosvölgyi B (2002): A potenciális energiaforrások, (in Bai) A bio-massza felhasználása, Szaktudás Kiadó Ház, Budapest, p. 90–97.Nemzeti Kulturális Örökség Elektronikus Oktatási Könyvtár: http://www.sulinet.hu/oroksegtar/data/telepulesek_ertekei/Villany/pages/villany_borvidekek/004_magyarorszag_borvidekei.htm (2012. 01. 27.)Pecznik P (2001): Biomassza: a régi-új energiaforrás III. rész, Agrárágazat Mezőgazdasági Havilap, 2001. 11. 03.Pintér G (2012): Egyes mezőgazdasági melléktermékek energetikai hasznosításának lehetőségei Magyarországon, PhD disszertáció, PE-Georgikon Kar, Keszthely, p. 32–34.Tóth L (2004): Energia és környezet. In Sembery P., Tóth L. (szerk.) (2004): Hagyományos és megújuló energiák. Szak tu dás Kiadó Ház, BudapestVingis Szőlő-Térinformatika, http://www.vingis.hu/index.php/terkepek (2013. 11. 14.)
APSTRACT Vol. 8. Number 2–3. 2014 pages 33–42 ISSN 1789-7874
1. Introduction
1.1 Background
Codex Alimentarius defines juice as “unfermented but fer-mentable juice intended for direct consumption, obtained by the mechanical process from sound, ripe fruits, preserved ex-clusively by physical means (FAO 1992). Pineapple and pas-sion fruits are the most popular juices to date but others may increase in popularity. The global market for juice products was estimated to be about 50 billion liters in the 1990s (FAO 1999). Banana juice is made using traditional methods for beer/spirit production but it is not widely sold as juice, most at times it is blended with other fruits juices. In general, juice can also be made from a mixture of fruits although this is not widely done at present due to high costs involved.
Fruits can be consumed fresh or processed into various forms. Pineapple and mango juice are the most popular prod-uct due to its fruity aroma, fragrance and flavor and is purport-edly the most widely consumed fresh fruit in the world with production exceeding 17 million metric tons a year (FAOSTAT
2007).Mangoes are produced in over 90 countries worldwide, Asia accounts for approximately 77% of global mango pro-duction and the Americas and Africa approximately 13% and 9% respectively (FAOSTAT 2007).
In 2005 world production of mango was estimated at 28.51 million metric tons. Between 1996 and 2005, production grew at annual rate of 2.6% (FAOSTAT 2007). Over the last decade prices of fruits are declining about 50% because the fruits are available in most countries but prices could increase with proper promotional effort. There is evidence that processed fruit market is increasing (Sauco 2004).
Juice manufactures face competition from producers who buy imported flavor concentrates and dilute them to make fruit drinks that are much cheaper. Consequently, the production and marketing of fruit juice should focus on the fact that they are made from fresh fruits with no additives. Further, the cost of equipment to form and seal cartons is too high for small scale producers and they are only sold under license. Cheaper alternatives including plastic pots with seeded foil lids are available as alternatives to bottles. Some processors also mar-ket juice in polythene sachets. Preservation is by pasteuriza-
A compArAtive AnAlysis of the profitAbility of pineApple-mAngo
blend And pineApple fruit juice processing in ghAnA
Michael K. Asante & John K. M. Kuwornu
University of Ghana, Department of Agricultural Economics and Agribusiness
Abstract: This study analyzes the profitability of fruit juice processing using data from Kudors Fruit Juice Limited at Kasoa in Ghana. The cost involved in fruit juice processing (which includes the capital cost and the operating cost) was obtained from the Company. This study compares the profitability of blend (i.e. fruit juice made up of pineapple and mango blend) with that of pineapple juice alone. The viability of the project was determined using the discounted measures of project worth: Benefit-Cost Ratio (BCR), Net Present Value (NPV) and Internal Rate of Return (IRR). The empirical results reveal that pineapple juice processing had a BCR of 1.03 which means that going into the pineapple juice processing is profitable. The value of the NPV (GHS11,728.00) and IRR (23%) further confirms that pineapple juice processing is profitable because the NPV is positive and the IRR is greater than the discounted factor (21%). The results also showed that it is more profitable to invest in the blend (pineapple and mango blend) than the pineapple juice alone as it yields a BCR of 1.36 which was greater than the BCR of 1.03 for the pineapple juice only. Furthermore, the value of the NPV (GHS176,831.00) which is greater than the pineapple juice only, suggests that the blend is more profitable even though the IRR for both are the same. Moreover, it is also more likely to recover capital investment earlier in the processing of the blend than when one goes into pineapple juice processing only, because the net cash flow in year 2 (GHS 58,146.00) for the blend is more than triple that of the pineapple juice only (GHS17,826.00).These results have policy implications for the development of Agribusinesses in Ghana.
Keywords: profitability, fruit juice processing, Kudors fruit juice limited, NPV, BCR, IRR, Ghana
Applied Studies in Agribusiness and Commerce – APSTRACTAgroinform Publishing House, Budapest scientific pApers
34 Michael K. Asante & John K. M. Kuwornu
APSTRACT Vol. 8. Number 2–3. 2014 pages 33–42 ISSN 1789-7874
tion and natural activity of the juice. Some types of juice (e.g. melon juice) have low levels of acid and this can be increased by adding citric acid to give a pH below 3.5–4.0. Although some producers add a preservative such as sodium benzoate to ensure a long shelf life, this is not necessary if the juice is properly processed. Juice can be extracted from fruits in a number of ways, depending on the hardness of the raw materi-al. Harder fruits such as pineapple are peeled and pulped using a liquidizer and pressed to extract juice. Fresh and processed pineapple is found all over the world. For every five pine-apples produced two are sold on the international market and processed pineapple product such as juice, largely dominates this markets, accounting for 80% of the total trade (Morgan et. al. 2005). Producers usually prefer to sell their produce to ex-porters because of the high price offered and traders who sell on the local markets offer the lowest (African Study Mono-graph 2004). Citrus fruits and juices are excellent sources of vitamin C containing more than the minimum daily require-ment of 60mg of vitamin C in 240ml of juice (USDA 2000).
Fruit juice provides a notable amount of iron which pro-duces healthy red blood cells to transport oxygen throughout the body. Citrus fruits and juices are also a good source of fo-lic acid, vitamin B, thiamine and potassium (Nagy et al. 1993; Brown 2000). A daily glass of fruit juice supplies 20% of daily iron needs of a person (www.livestrong.com). Fruit juice is very important in improving the memory and concentration, reducing mental weakness and in curing the problem of heavy bleeding during menstruation (www.drgranny.com).
Tema, Accra and Nsawam are the locations of major fruits processing companies in Ghana. Nkulenu industries a pioneer fruit processing company, for example dominated the local market during the 1970’s through to the 1980’s with its’ mixed products. Astek Fruit Processing also extended the market and began to control a significant market share with its fresh man-go and pineapple juice brands.
The problem of price fluctuations of Ghana’s traditional ex-port such as minerals, cocoa and timber has called for diversi-fication in agricultural productionto expand her export prod-uct base. Fruits are ubiquitous in most temperate and tropical zones. There may be ample raw materials available for short seasons, which mostly go waste due to lack of processing fa-cilities (Brown 2000).
In Ghana heavy post-harvest losses are annually recorded in fruit and vegetable production resulting in lower prices of ag-ricultural products in the peak season and higher prices in the lean season. It has becomes necessary that post-harvest losses of fruits be addressed so as to increase their shelf lives as the processing industry lacks the capacity to increase production at a particular time to meet excessive demand by consumers.
Ghana is yet to tap into the rich potentials of the fruit pro-cessing which has great benefit for the consumer, producer and country as a whole. The processing industry’s declining state in the country is due to the excessive import of processed fruits coupled with the inability of farmers and other business-men to acquire processing plants for fruits despite its high de-mand locally and on the international market. Therefore, there is the need for Ghana to increase her processing base to enable
the country tap into some of these opportunities both interna-tionally and locally. Consumption of fruit juice in Ghana has become popular and increasing daily. For instance, the do-mestic market for fruit juice has become strong because Gha-naian consumers increasingly appreciate the natural taste and health benefits of Ghana’s own agricultural products. Further, it is believed that fruit juice are the most consumed beverage next to water, however, approximately 70% of these products are imported, and estimates reveal that 10.4 million liters of fruits juice is consumed yearly (Fruit Processors and Market-ers Association of Ghana (FPMAG 2011).
The objectives of the study are three fold. First, to esti-mate the cost and benefits involved in fruit juice processing at Kudors Fruit Juice Limited. Second, to determine the profit-ability of fruit juice processing at Kudors Fruit Juice Limited, while comparing the profitability of pineapple and mango blend with pineapple fruit juice processing. Third, to assess and rank the constraints affecting fruit juice processing of Ku-dors Fruit Juice Limited.
The justification of this study is to serve as a source of in-formation for fresh fruit producers (farmers), policy makers and entrepreneurs who would like to go into fruit juice pro-cessing. This study will also add to the body of knowledge about the profitability of fruit processing.
1.2 Literature review
Indigenous fruits are those which are native to Africa, where they have originated and evolved over centuries (Center for Tropical Agriculture (CTA) 2007).These are different from exotic fruits, such as citrus and even mango, which have been imported from other continents, although they may now be quite commonly grown in many areas. Across sub-Saharan Africa, a wide variety of indigenous fruit trees are valuable to the diets and incomes of local communities, particularly dur-ing times of potential household food insecurity, for example, during the rainy season when crops are not yet ready for har-vest and stored supplies have run low. Also, many indigenous fruit trees are able to withstand hot, dry conditions as the fruits provide an essential food source. The baobab for example is found throughout Africa at low altitudes and during drought periods, the fruits provide a valued source of vitamins and minerals, but often underutilized (Center for Tropical Agri-culture (CTA) 2007).
Most indigenous fruit trees generally grow wild. The fruits are harvested and eaten at home, sold at the market or pro-cessed into jams and juices to add additional value. However, many fruit trees are used for more than just their fruits. Trees grown on the homestead provide important shade for crops. Leaves may be used for fodder or as compost. Leaves, fruits and other tree parts may also be used for medicinal purposes. The bark is often used for fibre and the timber for furniture, construction of fences etc (Center for Tropical Agriculture (CTA) 2007).
All the processes for fruit juice products require that the juice or pulp is first extracted from the fruit. The juice is
A comparative analysis of the profitability of pineapple-mango blend and pineapple fruit juice processing in Ghana 35
APSTRACT Vol. 8. Number 2–3. 2014 pages 33–42 ISSN 1789-7874
extracted either by pressing the fruit or by mashing it and then pressing the juice out. Juice extracted is used in the prepara-tion of jams and jellies, fruit juices, fruits in syrup and pick-les (Appiagyei 2010). Processing is the transformation of raw produce into a product which is different physically, chemi-cally and nutritionally.
Pande (2009) stated that processing of fruit and vegetables is getting higher attention for enabling farmers to get higher price for the produce. Potentially each large number of fruits grown in Ghana could be used to make large range of prod-ucts, including dried fruit (pineapple and banana for export), fruit wines (especially pineapple), fried snacks (banana or potato chips), juices (pineapple), squashes and cordials. The high demand for these products has led to strong competition as more and more small-scale processors start to produce these products. Companies for example, Blue Skies and individuals also produce cuts fruits for sale, fruits such as pawpaw, pine-apple and at times dried mango are commonly found on the Ghanaian market.
Internationally, countries like the U.S, India are into large scale processing of fruits into various forms. Altman and Eite-man (2009) stated that about 1.8 million tonnes of watermelon were produced in the U.S. in 2007 and 362,874 tonneswere abandoned as culled crop which represent about 20% of pro-duction. In recent studies in the U.S, it was revealed that the culled watermelon has significant potential for use as a sugar source to produce ethanol. Thus, the 362,874 tonnes of culled watermelon from 2007 could be used to produce about 14 mil-lion litres of ethanol.
Global efforts to establish and improve consumer health protection have led to increased governmental and regulatory oversight in the field of food safety (UNIDO 2004). While most people presume the foods they eat are safe, several re-cent food safety events have eroded this confidence and led to demands from the public for additional protective measures to be enacted to establish the rights of consumers to safe food. Dauthy (1995) stated that the scope of this protection has ex-panded beyond the practices of the food manufacturers and now extends all the way back to the farm gate. Thus, it is es-sential that safety be embodied in food products from produc-tion through consumption, from the farm to the table (food chain approach). All stakeholders in the food chain, including the supply side (producers, transporters, processors, and mer-chants), the government inspection and regulatory authorities and consumers will now have responsibilities and obligations to ensure the safety of food products and protect consumer health (UNIDO 2004).
For enforcement purposes, the Codex Commission has developed several guidelines and food standards. There are today approximately 250 standards and specific requirements for individual foods, groups of foods, and other provisions, e.g., hygiene, contaminants, labeling and food additives. En-forcement of food control has evolved from the traditional focus on inspection of final products and removal of unsafe food from the market to the current holistic and preventive approach, which relies more on system control. This system-atic approach to the identification, assessment, and control of
hazards is known as the Hazard Analysis and Critical Control Point (HACCP) system. The introduction of a HACCP-based food safety system may be difficult for small-scale fruit pro-cessing enterprises and will be best achieved by coordination between the food industry, educational and training organiza-tions, and governing authorities (Leid and Salvosa 2008).
In Ghana, Standards are set by Ghana Standard Board for fruit juice enterprises. These standards are set in terms of quality, flavor, package and appearance. According to a draft of Ghana Standard Board Specification of juices (DGS 571 WDI), fruit juice is an unfermented but fermentable non-alco-holic drink intended for direct consumption. It is obtained by mechanical process from sound ripe fruit and the juice is either preserved exclusively by physical means or by preservatives.
Juice quality may be referred to as the characteristics which are evaluated by organoleptic and other physical appearance such as colour, flavour, texture, size and appearance. Also in packaging, the water capacity of the package should be the volume of distilled water at 20 degrees celcius and the seal package should not be able to hold this when completely filled. Moreover, the appearance of the fruit juice should be of uniform colour and hence there should be no ring formation present at the neck of the container.
Machiraju (2001) stated that benefit–cost analysis is con-cerned with the examination of a project from the view point of maximization of net benefit. Profitability can be measured on yearly basis or over or the lifespan of an investment whiles the lifespan profitability measure is employed to enable in re-source allocation decision (Ross et al. 2001). Return on as-serts, profit margin and return on equity are also well known profitability measures (Ross et al. 2001).
Once cost and benefits has been identified, if they are to be compared, they must be valued. Underlying all financial analysis is the assumption that prices reflect value, or can be adjusted to do so (Gittinger 1996).
Cost can be categorized into fixed cost and variable cost. In financial analysis, cost is classified into initial cost of in-vestment and operational cost (Gittinger 1996). Capital cost is the cost of items needed for the establishment of a project. In general, capital costs usually cover such items as land, build-ings, site preparation and other civil costs, plant and equip-ment installation and testing, vehicles and working capital. Contingency allowance is provided, which is simply added to the cost of the item to which it relates. Operational costs are those incurred in operating and maintaining the project. They are usually the raw materials, labor, water and fuel, transport and maintenance (Gittinger 1996).
Estimating benefits and cost in a timely manner is very dif-ficult. Benefits are often defined as follows: Tangible benefits which may be reasonably quantified and measured in mone-tary terms; and Intangible benefits that may be quantified oth-erwise or identified and described subjectively. The minimum costs that must be determined are those that specifically are used for comparison to the benefits. These include the follow-ing: The current operating costs or the cost of operating in to-day’s circumstances; and Future period costs that are expected and can be planned for; Intangible cost may be difficult to
36 Michael K. Asante & John K. M. Kuwornu
APSTRACT Vol. 8. Number 2–3. 2014 pages 33–42 ISSN 1789-7874
quantify. These costs are often omitted if quantification would contribute little to the decision making process.
Dasguptaet al. (1974) stated that investment criteria in the systematic evaluation of a project are numerous, some of which include the benefit–cost ratio approach, payback period approach, net present value approach, internal rate of return approach, and domestic resource cost approach, minimum capital–output ratio approach and so on.
The rest of the study is organized as follows. Section 2 pres-ents the methodology; section 3 presents the empirical results, and section 4 presents the conclusions and recommendations.
2. Methodology
2.1 Methods of Analysis
This study employed the Net Present Value (the discounting approach) in its decision as to whether the project is viable. Net Present Value (NPV) basically refers to present value of future cash flows discounted at the opportunity cost of capital minus(net of) the initial investment.
Net Present Value was used because the idea of NPV is to try to express all future values in terms of the present. Thus, to make the values occurring at different times comparable at least with respect to time. Some of its merits are; easy to cal-culate, easy to understand and interpret, it saves time among others. However, despite its advantages, there are some flaws as far as NPV is concerned, some of which include the choice of interest rate. The choice of interest rate is a problem that cuts across all the other investment criteria. However, its ad-vantages are more overwhelming as compared to the internal rate of return which is somewhat cumbersome to follow. The decision rule is that, if the NPV is greater than zero we accept the project but if NPV is less than zero then we reject.
Also the benefit cost (BCR) ratio was used in this study. The decision rule is that we accept the project if the BCR ≥ 1 and when the cost and benefit streams are discounted at the opportunity cost of capital. Thus if BCR > 1 it implies that Fruit juice processing is profitable, if BCR < 1 it implies not profitable and if BCR = 1, the investment break even (Git-tinger, 1996).
Lastly the internal rate of return (IRR) was also employed in the study. The internal rate of return is the discount rate that makes the NPV of the project or investment equals zero (Boardman, 2006). The decision rule is to accept independent projects with IRR ≥ the opportunity cost of capital or the dis-count rate (Gittinger, 1996).
2.2 Theoretical framework
2.2.1 Budgetary approach
Simple budgetary approach was used to calculate the total cost, total revenue and net return.
TC = TFC + TVC (1)
Where TC denotes total Cost; TFC denotes total fixed Cost; TVC denotes total Variable Cost; TR denotes total revenue; TR denotes selling price per liter of fruit juice × total output.
Net Profit = TR – TC (2)
2.2.2 Computation of Actual Total Revenue
Total revenue was calculated by multiplying the quantity of fruit juice produced by the price of juice.
TR = QM × PM (3)Where TR denotes total Revenue; QM denotes quantity of crates sold; PM denotes per unit price of crate.
2.2.3 Computation of Total Cost
The computation of the total cost included all types of variable and fixed cost items involved in the fruit juice processing.
The total cost is estimated as:TC = ∑PxiXi + TFC (4)Where TC denotes total Cost; Xi denotes quantity of vari-
able input; Pxi denotes per unit price of variable input; TFC denotes total fixed Cost.
The net revenue or profit (NR) in monetary terms is the difference between estimated cost and total revenue for the period.
NR = TR – TC (5)Where TC denotes total Cost; and TR denotes total revenue.
2.2.4 Depreciation
Depreciation is the reduction in the value of an asset over a period of time. The value of an asset at the end of its expect-ed useful life is known as its salvage value. The straight line method of depreciation was employed because of its simplic-ity and the ability to reflect the historical cost of assets un-der consideration. The straight line method of depreciation is specified as follows: OC – SVD = –––––––
N (6)Where D denotes depreciation on capital item; OC denotes
original Cost of item; SV denotes savage value; and N denotes expected useful life of capital.
2.2.5 Estimating the Project worth
The following Discounted measures of project worth were used to estimate the worth.
2.2.5.1 Benefit Cost Ratio
Benefit Cost Ratio (BCR) == +
+n
tt
t
tt
rCrB
0 )1/()1/(
(7)Where Bt denotes benefits in year t; Ct denotes cost in year
t; r denotes cost of capital; t denotes number of years. The decision rule is that we accept the project if BCR ≥ 1
when the cost and benefit streams are discounted at the op-portunity cost of capital. Thus, if BCR > 1 it implies that Fruit
A comparative analysis of the profitability of pineapple-mango blend and pineapple fruit juice processing in Ghana 37
APSTRACT Vol. 8. Number 2–3. 2014 pages 33–42 ISSN 1789-7874
juice processing is profitable, if BCR < 1it implies not prof-itable and if BCR = 1, the investment break even (Gittinger, 1996).
2.2.5.2 Net Present Value
Net present value (NPV) is the present worth of the incre-mental net benefit or incremental cash flow stream (Gittinger, 1996). =
= +=
nt
tttt
rCBNPV
1 )1( (8)Where Bt denotes benefits in year t; Ct denotes cost in year
t; n denotes investment lifespan; t denotes time measured in years, r denotes cost of capital.
The decision rule is to accept the project if NPV is positive. This means that the project is viable and in cases where two or more investment show positive NPV’s the one with the high-est NPV is preferable, when NPV = 0 means the investment breaks even (Gittinger, 1996).
2.2.5.3 Internal rate of return (IRR)
This is the discount rate that makes the NPV of project or investment equals zero (Boardman, 2006). Thus,
0)1(1
=+
==
=
nt
tttt
rCBNPV
(9)
However, there is a problem with this method which makes it difficult to use. It involves a lot of try and error with differ-ent discount rates until you get the one that makes the NPV = 0. Nevertheless an alternative and easier method exist which is by interpolation. The actual rate is found by interpolation be-tween two discount rates that gives small positive and nega-tive NPVs. The rule of interpolation is given as:
�I�R�R = �L�D�R+�D �N�P�V�L�D�R
�N�P�V�H�D�R + �N�P�V�L�D�R (10)
Where LDR denotes lower discount rate; HDR denotes higher discount rate; NPVLDR denotes Net Present value at low-er discount rate; NPVHDR denotes Net Present value at higher discount rate; D denotes the difference between discount rates.
The decision rule is to accept independent projects with IRR ≥ the opportunity cost of capital or the discount rate (Git-tinger 1996). This implies that when IRR is > the cost of capi-tal, it implies that the project is viable, when IRR = cost of capital, it implies the project will break even. However when the IRR < cost of capital, it implies the project is not viable.
2.3 Underlying Assumptions and Project Operation rate
Profitability estimation was based on some assumptions in order to provide the framework for consistent analysis. The following assumptions were made: I. The project life is 11 years starting from year zero to year
ten; year zero being the year of acquiring the machinery
and installing the plant necessary for production. There-fore, there was no production in year zero.
II. The plant capacity is 20 metric tonnes per day. Processing is done six days a week, excluding public holidays result-ing in a total of 300 working days in a year.
III. Actual processing of fruit takes 3days whiles the remain-ing 3 days are used for other activities that are not di-rectly involved in the juice processing. Therefore, the firm has 300 working days. Thus, in a year 150 days are used for actual processing whiles the other 150 days are used for other activities that take place before and after processing.
IV. The conversion rate for pineapple is 0.6 tonne of juice per tonne of fresh fruit whiles that of mango is 0.4 tonne of juice per tonne of fresh mango. A tonne of pineapple fruit cost GHS 500.00 and a tonne of mango cost GHS1000.00.
V. The prices of the cost items are kept constant over the project life. Additionally total cost is commensurate with the increase in the use of plant capacity.
VI. Operation rate of the project is at 70% of plant capacity in year 1 and increases to 90% in the third and fourth years and to 100% in the fifth year. It means that by the fifth year the firm was operating at full capacity up to the end of the project life.
Contingency is at 5% of cost and the residual value of the capital elements is estimated at 10% of the original cost of the items, the cost of disposal of capital assets is at 10% of residual value. The straight line method of depreciation was used to depreciate the items.
2.4 Data collection through Interview with the Manager of Kudors Fruit Juice Limited
In this study, primary data was obtained through a structured questionnaire and personal interview with the manager. The interviews took place at the premises of the firm as this pro-vided a chance to observe practically how fruit processing was done. The questionnaire was designed to cover the location of the firm and kinds of fruits being processed. It also included the cost of production, variable cost, labor cost and output level of the firm.
2.5 Study Area
Kudors fruit juice limited is located at Kasoa in the Awutu-Senya- East in the central region of Ghana.Awutu-Senya-East District with its capital Kasoa was carved from Ewutu Senya and forms part of the new districts and municipalities created in the year 2012 and were inaugurated at their various loca-tions simultaneously on the 28th June, 2012 (www.ghanadis-tricts.com).
Awutu-Senya-East District is a new district; hence the as-sembly is in the process of collecting relevant data concerning its location and size; topography and drainage; climate and
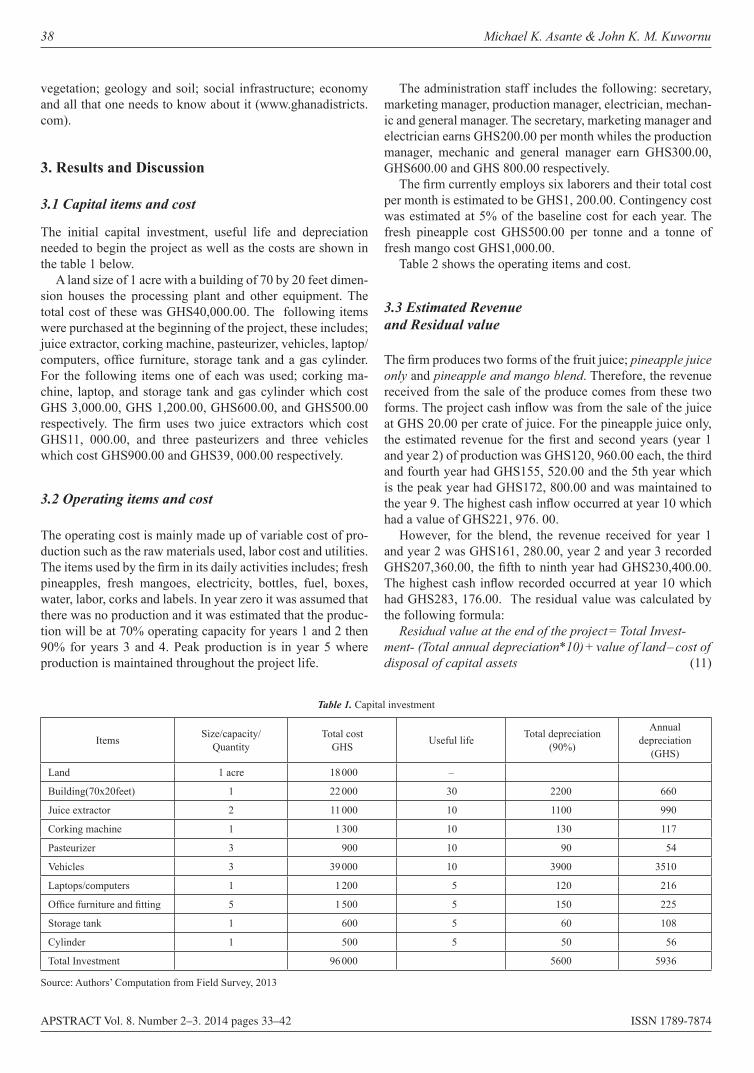
38 Michael K. Asante & John K. M. Kuwornu
APSTRACT Vol. 8. Number 2–3. 2014 pages 33–42 ISSN 1789-7874
vegetation; geology and soil; social infrastructure; economy and all that one needs to know about it (www.ghanadistricts.com).
3. Results and Discussion
3.1 Capital items and cost
The initial capital investment, useful life and depreciation needed to begin the project as well as the costs are shown in the table 1 below.
A land size of 1 acre with a building of 70 by 20 feet dimen-sion houses the processing plant and other equipment. The total cost of these was GHS40,000.00. The following items were purchased at the beginning of the project, these includes; juice extractor, corking machine, pasteurizer, vehicles, laptop/computers, office furniture, storage tank and a gas cylinder. For the following items one of each was used; corking ma-chine, laptop, and storage tank and gas cylinder which cost GHS 3,000.00, GHS 1,200.00, GHS600.00, and GHS500.00 respectively. The firm uses two juice extractors which cost GHS11, 000.00, and three pasteurizers and three vehicles which cost GHS900.00 and GHS39, 000.00 respectively.
3.2 Operating items and cost
The operating cost is mainly made up of variable cost of pro-duction such as the raw materials used, labor cost and utilities. The items used by the firm in its daily activities includes; fresh pineapples, fresh mangoes, electricity, bottles, fuel, boxes, water, labor, corks and labels. In year zero it was assumed that there was no production and it was estimated that the produc-tion will be at 70% operating capacity for years 1 and 2 then 90% for years 3 and 4. Peak production is in year 5 where production is maintained throughout the project life.
The administration staff includes the following: secretary, marketing manager, production manager, electrician, mechan-ic and general manager. The secretary, marketing manager and electrician earns GHS200.00 per month whiles the production manager, mechanic and general manager earn GHS300.00, GHS600.00 and GHS 800.00 respectively.
The firm currently employs six laborers and their total cost per month is estimated to be GHS1, 200.00. Contingency cost was estimated at 5% of the baseline cost for each year. The fresh pineapple cost GHS500.00 per tonne and a tonne of fresh mango cost GHS1,000.00.
Table 2 shows the operating items and cost.
3.3 Estimated Revenue and Residual value
The firm produces two forms of the fruit juice; pineapple juice only and pineapple and mango blend. Therefore, the revenue received from the sale of the produce comes from these two forms. The project cash inflow was from the sale of the juice at GHS 20.00 per crate of juice. For the pineapple juice only, the estimated revenue for the first and second years (year 1 and year 2) of production was GHS120, 960.00 each, the third and fourth year had GHS155, 520.00 and the 5th year which is the peak year had GHS172, 800.00 and was maintained to the year 9. The highest cash inflow occurred at year 10 which had a value of GHS221, 976. 00.
However, for the blend, the revenue received for year 1 and year 2 was GHS161, 280.00, year 2 and year 3 recorded GHS207,360.00, the fifth to ninth year had GHS230,400.00. The highest cash inflow recorded occurred at year 10 which had GHS283, 176.00. The residual value was calculated by the following formula:
Residual value at the end of the project = Total Invest-ment- (Total annual depreciation*10) + value of land – cost of disposal of capital assets (11)
Table 1. Capital investment
Items Size/capacity/ Quantity
Total costGHS Useful life Total depreciation
(90%)
Annual depreciation
(GHS)
Land 1 acre 18 000 –
Building(70x20feet) 1 22 000 30 2200 660
Juice extractor 2 11 000 10 1100 990
Corking machine 1 1 300 10 130 117
Pasteurizer 3 900 10 90 54
Vehicles 3 39 000 10 3900 3510
Laptops/computers 1 1 200 5 120 216
Office furniture and fitting 5 1 500 5 150 225
Storage tank 1 600 5 60 108
Cylinder 1 500 5 50 56
Total Investment 96 000 5600 5936
Source: Authors’ Computation from Field Survey, 2013
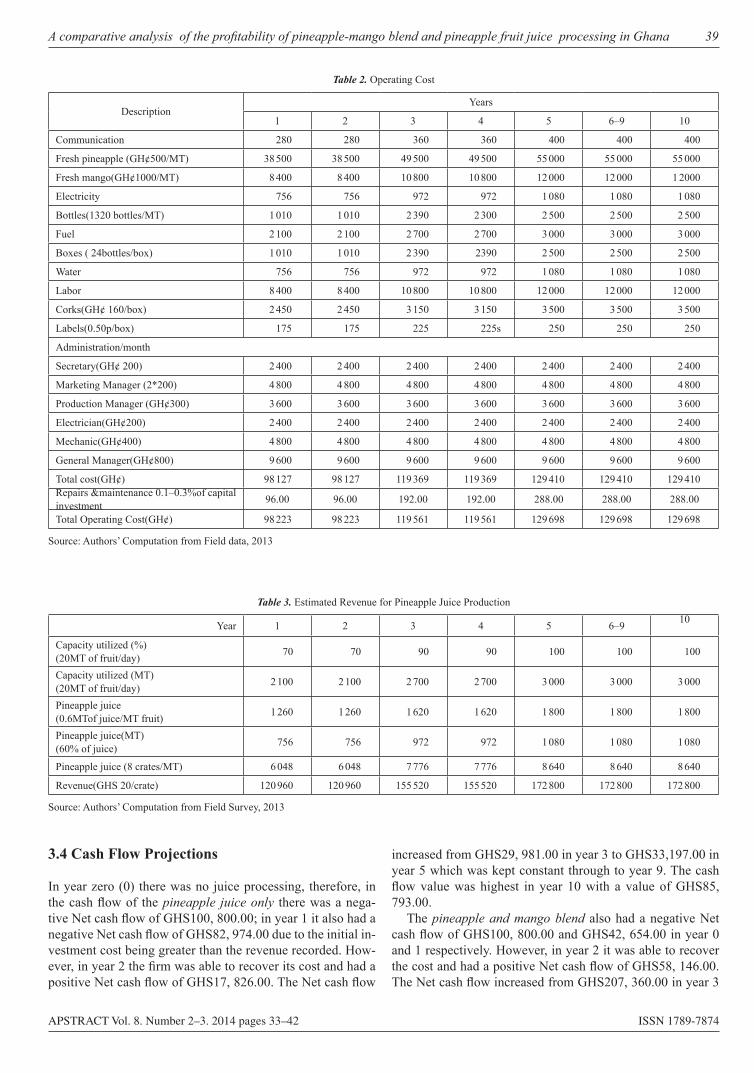
A comparative analysis of the profitability of pineapple-mango blend and pineapple fruit juice processing in Ghana 39
APSTRACT Vol. 8. Number 2–3. 2014 pages 33–42 ISSN 1789-7874
3.4 Cash Flow Projections
In year zero (0) there was no juice processing, therefore, in the cash flow of the pineapple juice only there was a nega-tive Net cash flow of GHS100, 800.00; in year 1 it also had a negative Net cash flow of GHS82, 974.00 due to the initial in-vestment cost being greater than the revenue recorded. How-ever, in year 2 the firm was able to recover its cost and had a positive Net cash flow of GHS17, 826.00. The Net cash flow
increased from GHS29, 981.00 in year 3 to GHS33,197.00 in year 5 which was kept constant through to year 9. The cash flow value was highest in year 10 with a value of GHS85, 793.00.
The pineapple and mango blend also had a negative Net cash flow of GHS100, 800.00 and GHS42, 654.00 in year 0 and 1 respectively. However, in year 2 it was able to recover the cost and had a positive Net cash flow of GHS58, 146.00. The Net cash flow increased from GHS207, 360.00 in year 3
Table 2. Operating Cost
Description Years
1 2 3 4 5 6–9 10
Communication 280 280 360 360 400 400 400
Fresh pineapple (GH¢500/MT) 38 500 38 500 49 500 49 500 55 000 55 000 55 000
Fresh mango(GH¢1000/MT) 8 400 8 400 10 800 10 800 12 000 12 000 1 2000
Electricity 756 756 972 972 1 080 1 080 1 080
Bottles(1320 bottles/MT) 1 010 1 010 2 390 2 300 2 500 2 500 2 500
Fuel 2 100 2 100 2 700 2 700 3 000 3 000 3 000
Boxes ( 24bottles/box) 1 010 1 010 2 390 2390 2 500 2 500 2 500
Water 756 756 972 972 1 080 1 080 1 080
Labor 8 400 8 400 10 800 10 800 12 000 12 000 12 000
Corks(GH¢ 160/box) 2 450 2 450 3 150 3 150 3 500 3 500 3 500
Labels(0.50p/box) 175 175 225 225s 250 250 250
Administration/month
Secretary(GH¢ 200) 2 400 2 400 2 400 2 400 2 400 2 400 2 400
Marketing Manager (2*200) 4 800 4 800 4 800 4 800 4 800 4 800 4 800
Production Manager (GH¢300) 3 600 3 600 3 600 3 600 3 600 3 600 3 600
Electrician(GH¢200) 2 400 2 400 2 400 2 400 2 400 2 400 2 400
Mechanic(GH¢400) 4 800 4 800 4 800 4 800 4 800 4 800 4 800
General Manager(GH¢800) 9 600 9 600 9 600 9 600 9 600 9 600 9 600
Total cost(GH¢) 98 127 98 127 119 369 119 369 129 410 129 410 129 410Repairs &maintenance 0.1–0.3%of capital investment 96.00 96.00 192.00 192.00 288.00 288.00 288.00
Total Operating Cost(GH¢) 98 223 98 223 119 561 119 561 129 698 129 698 129 698
Source: Authors’ Computation from Field data, 2013
Table 3. Estimated Revenue for Pineapple Juice Production
Year 1 2 3 4 5 6–9 10
Capacity utilized (%) (20MT of fruit/day) 70 70 90 90 100 100 100
Capacity utilized (MT) (20MT of fruit/day) 2 100 2 100 2 700 2 700 3 000 3 000 3 000
Pineapple juice (0.6MTof juice/MT fruit) 1 260 1 260 1 620 1 620 1 800 1 800 1 800
Pineapple juice(MT) (60% of juice) 756 756 972 972 1 080 1 080 1 080
Pineapple juice (8 crates/MT) 6 048 6 048 7 776 7 776 8 640 8 640 8 640
Revenue(GHS 20/crate) 120 960 120 960 155 520 155 520 172 800 172 800 172 800
Source: Authors’ Computation from Field Survey, 2013
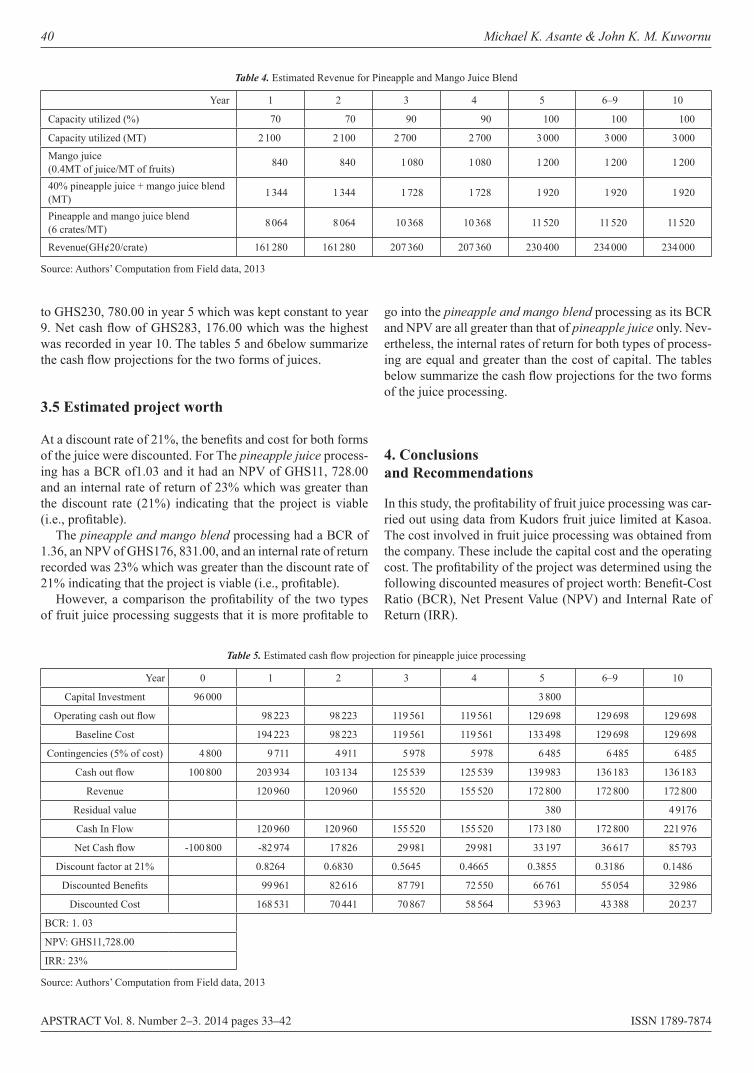
40 Michael K. Asante & John K. M. Kuwornu
APSTRACT Vol. 8. Number 2–3. 2014 pages 33–42 ISSN 1789-7874
to GHS230, 780.00 in year 5 which was kept constant to year 9. Net cash flow of GHS283, 176.00 which was the highest was recorded in year 10. The tables 5 and 6below summarize the cash flow projections for the two forms of juices.
3.5 Estimated project worth
At a discount rate of 21%, the benefits and cost for both forms of the juice were discounted. For The pineapple juice process-ing has a BCR of1.03 and it had an NPV of GHS11, 728.00 and an internal rate of return of 23% which was greater than the discount rate (21%) indicating that the project is viable (i.e., profitable).
The pineapple and mango blend processing had a BCR of 1.36, an NPV of GHS176, 831.00, and an internal rate of return recorded was 23% which was greater than the discount rate of 21% indicating that the project is viable (i.e., profitable).
However, a comparison the profitability of the two types of fruit juice processing suggests that it is more profitable to
go into the pineapple and mango blend processing as its BCR and NPV are all greater than that of pineapple juice only. Nev-ertheless, the internal rates of return for both types of process-ing are equal and greater than the cost of capital. The tables below summarize the cash flow projections for the two forms of the juice processing.
4. Conclusions and Recommendations
In this study, the profitability of fruit juice processing was car-ried out using data from Kudors fruit juice limited at Kasoa. The cost involved in fruit juice processing was obtained from the company. These include the capital cost and the operating cost. The profitability of the project was determined using the following discounted measures of project worth: Benefit-Cost Ratio (BCR), Net Present Value (NPV) and Internal Rate of Return (IRR).
Table 4. Estimated Revenue for Pineapple and Mango Juice Blend
Year 1 2 3 4 5 6–9 10
Capacity utilized (%) 70 70 90 90 100 100 100
Capacity utilized (MT) 2 100 2 100 2 700 2 700 3 000 3 000 3 000
Mango juice(0.4MT of juice/MT of fruits) 840 840 1 080 1 080 1 200 1 200 1 200
40% pineapple juice + mango juice blend (MT) 1 344 1 344 1 728 1 728 1 920 1 920 1 920
Pineapple and mango juice blend (6 crates/MT) 8 064 8 064 10 368 10 368 11 520 11 520 11 520
Revenue(GH¢20/crate) 161 280 161 280 207 360 207 360 230 400 234 000 234 000
Source: Authors’ Computation from Field data, 2013
Table 5. Estimated cash flow projection for pineapple juice processing
Year 0 1 2 3 4 5 6–9 10
Capital Investment 96 000 3 800
Operating cash out flow 98 223 98 223 119 561 119 561 129 698 129 698 129 698
Baseline Cost 194 223 98 223 119 561 119 561 133 498 129 698 129 698
Contingencies (5% of cost) 4 800 9 711 4 911 5 978 5 978 6 485 6 485 6 485
Cash out flow 100 800 203 934 103 134 125 539 125 539 139 983 136 183 136 183
Revenue 120 960 120 960 155 520 155 520 172 800 172 800 172 800
Residual value 380 4 9176
Cash In Flow 120 960 120 960 155 520 155 520 173 180 172 800 221 976
Net Cash flow -100 800 -82 974 17 826 29 981 29 981 33 197 36 617 85 793
Discount factor at 21% 0.8264 0.6830 0.5645 0.4665 0.3855 0.3186 0.1486
Discounted Benefits 99 961 82 616 87 791 72 550 66 761 55 054 32 986
Discounted Cost 168 531 70 441 70 867 58 564 53 963 43 388 20 237
BCR: 1. 03
NPV: GHS11,728.00
IRR: 23%
Source: Authors’ Computation from Field data, 2013
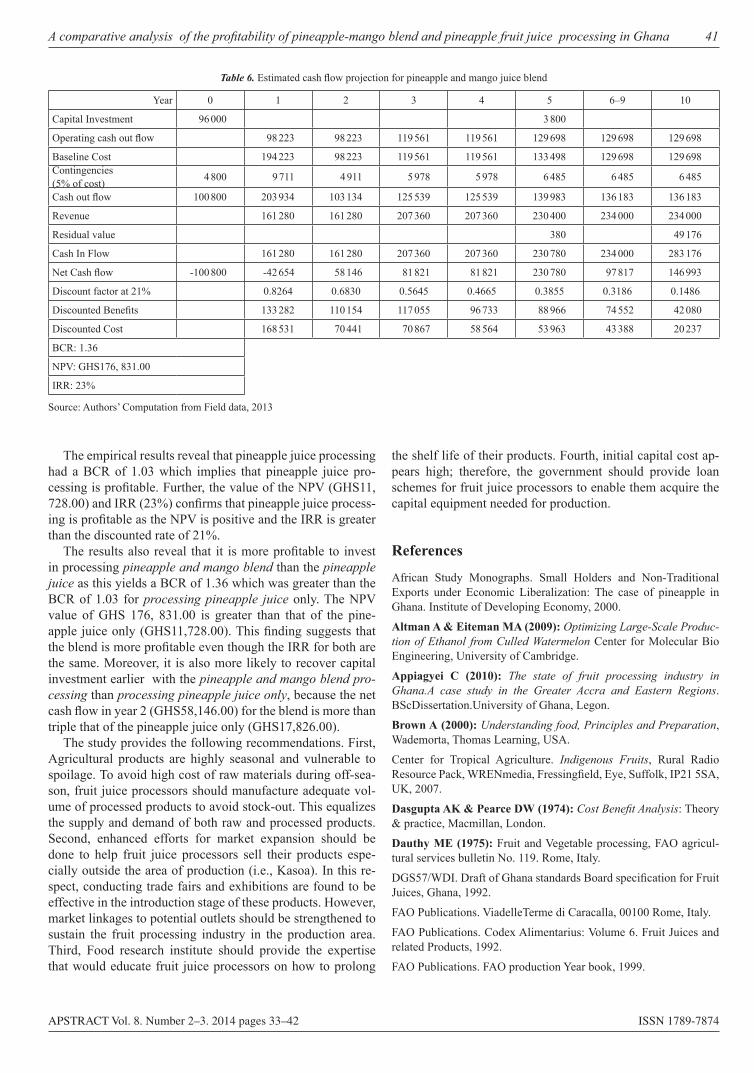
A comparative analysis of the profitability of pineapple-mango blend and pineapple fruit juice processing in Ghana 41
APSTRACT Vol. 8. Number 2–3. 2014 pages 33–42 ISSN 1789-7874
The empirical results reveal that pineapple juice processing had a BCR of 1.03 which implies that pineapple juice pro-cessing is profitable. Further, the value of the NPV (GHS11, 728.00) and IRR (23%) confirms that pineapple juice process-ing is profitable as the NPV is positive and the IRR is greater than the discounted rate of 21%.
The results also reveal that it is more profitable to invest in processing pineapple and mango blend than the pineapple juice as this yields a BCR of 1.36 which was greater than the BCR of 1.03 for processing pineapple juice only. The NPV value of GHS 176, 831.00 is greater than that of the pine-apple juice only (GHS11,728.00). This finding suggests that the blend is more profitable even though the IRR for both are the same. Moreover, it is also more likely to recover capital investment earlier with the pineapple and mango blend pro-cessing than processing pineapple juice only, because the net cash flow in year 2 (GHS58,146.00) for the blend is more than triple that of the pineapple juice only (GHS17,826.00).
The study provides the following recommendations. First, Agricultural products are highly seasonal and vulnerable to spoilage. To avoid high cost of raw materials during off-sea-son, fruit juice processors should manufacture adequate vol-ume of processed products to avoid stock-out. This equalizes the supply and demand of both raw and processed products.Second, enhanced efforts for market expansion should be done to help fruit juice processors sell their products espe-cially outside the area of production (i.e., Kasoa). In this re-spect, conducting trade fairs and exhibitions are found to be effective in the introduction stage of these products. However, market linkages to potential outlets should be strengthened to sustain the fruit processing industry in the production area. Third, Food research institute should provide the expertise that would educate fruit juice processors on how to prolong
the shelf life of their products. Fourth, initial capital cost ap-pears high; therefore, the government should provide loan schemes for fruit juice processors to enable them acquire the capital equipment needed for production.
References
African Study Monographs. Small Holders and Non-Traditional Exports under Economic Liberalization: The case of pineapple in Ghana. Institute of Developing Economy, 2000.
Altman A & Eiteman MA (2009): Optimizing Large-Scale Produc-tion of Ethanol from Culled Watermelon Center for Molecular Bio Engineering, University of Cambridge.
Appiagyei C (2010): The state of fruit processing industry in Ghana.A case study in the Greater Accra and Eastern Regions.BScDissertation.University of Ghana, Legon.
Brown A (2000): Understanding food, Principles and Preparation, Wademorta, Thomas Learning, USA.
Center for Tropical Agriculture. Indigenous Fruits, Rural Radio Resource Pack, WRENmedia, Fressingfield, Eye, Suffolk, IP21 5SA, UK, 2007.
Dasgupta AK & Pearce DW (1974): Cost Benefit Analysis: Theory & practice, Macmillan, London.
Dauthy ME (1975): Fruit and Vegetable processing, FAO agricul-tural services bulletin No. 119. Rome, Italy.
DGS57/WDI. Draft of Ghana standards Board specification for Fruit Juices, Ghana, 1992.
FAO Publications. ViadelleTerme di Caracalla, 00100 Rome, Italy.
FAO Publications. Codex Alimentarius: Volume 6. Fruit Juices and related Products, 1992.
FAO Publications. FAO production Year book, 1999.
Table 6. Estimated cash flow projection for pineapple and mango juice blend
Year 0 1 2 3 4 5 6–9 10
Capital Investment 96 000 3 800
Operating cash out flow 98 223 98 223 119 561 119 561 129 698 129 698 129 698
Baseline Cost 194 223 98 223 119 561 119 561 133 498 129 698 129 698Contingencies (5% of cost) 4 800 9 711 4 911 5 978 5 978 6 485 6 485 6 485
Cash out flow 100 800 203 934 103 134 125 539 125 539 139 983 136 183 136 183
Revenue 161 280 161 280 207 360 207 360 230 400 234 000 234 000
Residual value 380 49 176
Cash In Flow 161 280 161 280 207 360 207 360 230 780 234 000 283 176
Net Cash flow -100 800 -42 654 58 146 81 821 81 821 230 780 97 817 146 993
Discount factor at 21% 0.8264 0.6830 0.5645 0.4665 0.3855 0.3186 0.1486
Discounted Benefits 133 282 110 154 117 055 96 733 88 966 74 552 42 080
Discounted Cost 168 531 70 441 70 867 58 564 53 963 43 388 20 237
BCR: 1.36
NPV: GHS176, 831.00
IRR: 23%
Source: Authors’ Computation from Field data, 2013
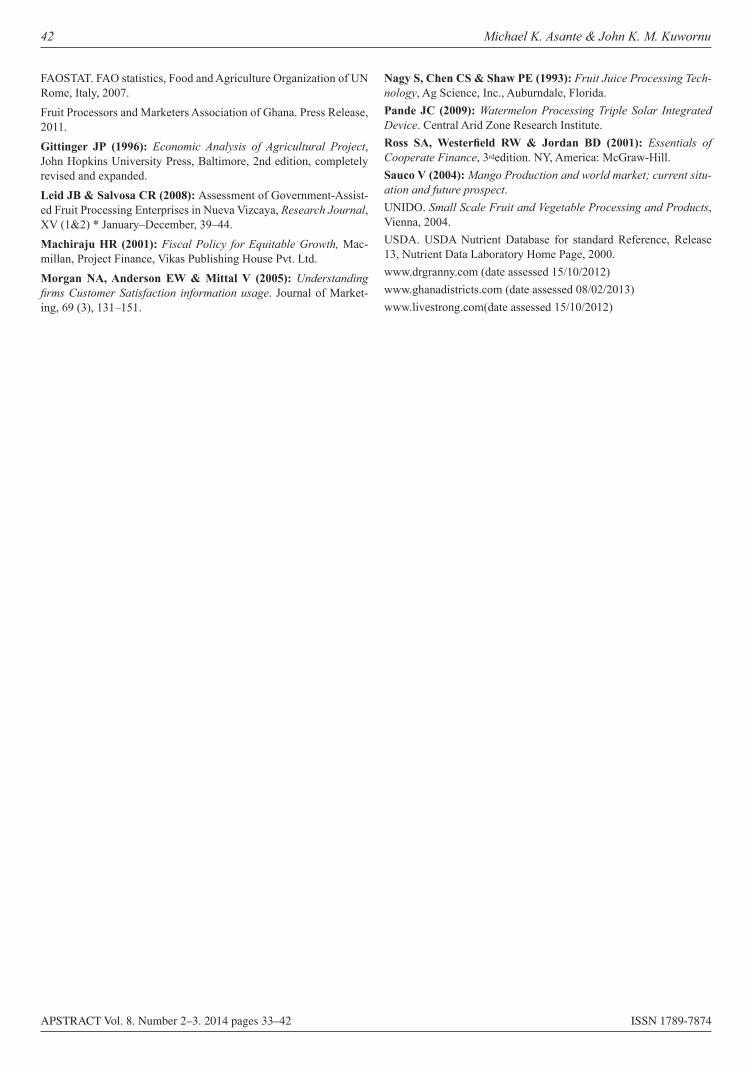
42 Michael K. Asante & John K. M. Kuwornu
APSTRACT Vol. 8. Number 2–3. 2014 pages 33–42 ISSN 1789-7874
FAOSTAT. FAO statistics, Food and Agriculture Organization of UN Rome, Italy, 2007.Fruit Processors and Marketers Association of Ghana. Press Release, 2011.Gittinger JP (1996): Economic Analysis of Agricultural Project, John Hopkins University Press, Baltimore, 2nd edition, completely revised and expanded.Leid JB & Salvosa CR (2008): Assessment of Government-Assist-ed Fruit Processing Enterprises in Nueva Vizcaya, Research Journal, XV (1&2) * January–December, 39–44.Machiraju HR (2001): Fiscal Policy for Equitable Growth, Mac-millan, Project Finance, Vikas Publishing House Pvt. Ltd.Morgan NA, Anderson EW & Mittal V (2005): Understanding firms Customer Satisfaction information usage. Journal of Market-ing, 69 (3), 131–151.
Nagy S, Chen CS & Shaw PE (1993): Fruit Juice Processing Tech-nology, Ag Science, Inc., Auburndale, Florida.Pande JC (2009): Watermelon Processing Triple Solar Integrated Device. Central Arid Zone Research Institute.Ross SA, Westerfield RW & Jordan BD (2001): Essentials of Cooperate Finance, 3rdedition. NY, America: McGraw-Hill.Sauco V (2004): Mango Production and world market; current situ-ation and future prospect.UNIDO. Small Scale Fruit and Vegetable Processing and Products, Vienna, 2004.USDA. USDA Nutrient Database for standard Reference, Release 13, Nutrient Data Laboratory Home Page, 2000.www.drgranny.com (date assessed 15/10/2012)www.ghanadistricts.com (date assessed 08/02/2013)www.livestrong.com(date assessed 15/10/2012)
APSTRACT Vol. 8. Number 2–3. 2014 pages 43–49 ISSN 1789-7874
Introduction
In accordance with nowadays’ consumer trends health and environmental protection are in the centre of research and de-velopment efforts of leading food producers. Beside the tech-nological developments, however, marketing has an essential role in this industry as the health protecting foods are able to exert their positive effect only with conscious food con-sumption behaviour. The trends of health and sustainability have already appeared in Hungary as well (Rácz 2013) but responsible corporate culture and marketing activity should take into account the education of health conscious lifestyle whom double objective, i.e. increasing market share and de-veloping consumers’ health status combines economic and social benefits.
The health behaviour is a compound system whom ele-ments are the conscious food consumption, the physical activity, the mental health, the avoidance of harmful excise goods, and the hygiene, in addition, it is necessary to be pres-ent in the individual life as part of the lifestyle. The preven-tive health risk behaviour is a continuous, conscious behav-iour, while the health risk behaviour (smoking) is typically emotional, influenced by unconscious factors (Bíró 2008; Szakály 2011). Thus exploring and/or bringing up their own, health conscious consumer base provides an advantage for the firms aiming to prevail on the health market, but for this it is essential to know the underlying contexts of health con-sumption.
Literature review
Nutritional Status
In respect of the energy quantity ingested in the body with the daily nutrition, when the ingested energy quantity is consumed in an amount necessary for the life processes of our body and for covering our physical energy consumption, it is considered as an energy balance. If the quantity of in-gested energy exceeds the quantity of the consumed energy, a positive energy balance develops, if it does not reach the quantity of consumed energy, a negative energy balance de-velops. These two cases could explain the development of the overweight and the malnutrition. Due to the permanent positive energy balance (i.e. more energy is ingested in the body than is consumed for a long time) the energy quantity stored in the body in form of fat increases. Depending on the extent of the body fat accumulation, the status is called underweight, overweight, and obesity which has been called illness since 1998 by the WHO (World Health Organisation) (Csányi 2010).
According to the announcement of the WHO in 2008, 1.4 billion overweight people lived in the world regarding the population over 20 years, and among them more than 200 million men and 300 million women can be seen as obese. In the period of 1980 and 2008 the extent of overweight ap-proximately doubled in the European regions of the World Health Organisation. This ratio was 58.3% among the adult
The CharaCTerisTiCs of Consumer aTTiTudes in The food markeT
in hungaryMihály Soós, Sára Szabó & Zoltán Szakály
University of Debrecen
Abstract: The objective of our research was to examine the health status and health behaviour of the Hungarian population in relation of food consumption by identifying relationships between the underlying factors. In our research we used the objective factors from secondary data concerning nutritional status and body image as a framework for the interpretation of the examined relationship of eating attitudes and body attitudes. We chose survey as our test method, it was carried out on a national representative sample of 1000 people. After the examination of the factor structure of the two attitude measuring questionnaire, five consumer groups have been identified by the cluster analysis. The five clusters are: Uncontrolled Impulse Eaters, Dissatisfied Tense, Uninterested, Overweight Impulse Eaters and Conscious Consumers. This segmentation based on eating attitudes and body attitudes could serve as a guidance for health marketing experts and the manufacturers of health protective food to determine and address their target group.
Keywords: body attitudes, eating attitudes, health, segmentation
Applied Studies in Agribusiness and Commerce – APSTRACTAgroinform Publishing House, Budapest sCienTifiC papers
44 Mihály Soós, Sára Szabó & Zoltán Szakály
APSTRACT Vol. 8. Number 2–3. 2014 pages 43–49 ISSN 1789-7874
men, and 51.2% among the adult women. In the countries of the European Union 30-70% of the population struggle with the problem of overweight, and 10-30% can be regarded as obese (WHO 2003; WHO 2014).
According to the Hungarian results of the European Popu-lation Health Survey conducted in 2009 in Hungary 53.7% of the population (over 15 years) shows a higher body mass than recommended (Szakály 2011). Based on the data provided by GFK (2005) 45% of the population is satisfied with their weight, 37% of them would like to decrease it, and 7% would increase it.
The judgement method of the adult population’s body mass is the calculation of the Body Mass Index (BMI) (Rodler 2008). The method of determining the BMI score is to divide the body mass of the focal person by the square of the body height expressed in meter, and its unit of measure is kg/m2 (Csányi 2010). Today BMI is the standard method of measur-ing the body mass as it strongly correlates with the total fat mass and is less dependent on the body height.
44.7% of the Hungarian adult population belongs to the group with a recommended BMI, 1.96% is of underweight, and 53.24% is of overweight from which 17.73% is obese. The overweight and the obesity are risk factors of the develop-ment of further non-infectious diseases such as cardiovascular diseases, malignant tumours, diabetes and its complications, and osteoporosis (Bhattoa et al. 2009). Before the examina-tion of tendencies of certain diseases concerning the Hungar-ian population we present the perceived and real health sta-tus of Hungarians, the last one is described worldwide by the macro level indicators of life expectancy at birth and mortality rates (Szakály 2011).
Despite the fact that Hungary occupies one of the last places in the rank of the EU-28 member states, the population perceives its health status much more favourable than the re-ality. The difference in the real and the perceived (subjective) health status is influenced by the socio-demographic, social, economic, and cultural environments of individuals as well. In their research Szakály et al. (2006) also examined the subjec-tive perception of health. Based on the findings of the popula-tion survey the rate of those who consider their health as over average was 53.1%, and that of those who consider it as ’both good and bad’ was 37.1%. This survey also resulted in the higher rate of positive health perception by men than women (Szakály 2011).
Body image and its perception
Under body image we mean the sum of psychological, behav-ioural, neurophysiological factors related to the individual’s own body. Its examination is important because one of the most essential cause of changing the weight is the dissatis-faction with the body image. Individual perception of body image is influenced by the estimation of one’s own body size (perception), the emotion provoked by the body shape and size (feeling), and the perception related to the attractiveness of the body (thought). The ideal body image stemming from the media, and the opinion and attitudes of family members and
peers also influence the perception of the individual’s body image (Grogan 2006; Probst et al. 2008; Czeglédi et al. 2009).
Grogan (2008) examined the perception of the body im-age in several aspects, and based on these we can conclude that satisfaction of women with their body image differs from that of men, however, the same stereotypes are present re-lated to the overweight people. Cash (1990) observed in his research conducted in the U.S. that this differentiation oc-curs already in childhood, causing children less like playing with overweight peers. This stereotype can be detected also in adulthood, overweight persons are less active, can be less loaded with hard work as well as they are less successful, less athletic, and less popular than their thinner counterparts (Lewis et al. 1997; Grogan, 2008). The judgment of people with normal body mass and of thin persons is more positive in the area of health, fitness, energy level, and self-control as well than that of the overweight people, who are considered to be gentle and caring. The strength and intensity of stigma-tisation is related to e.g. depression and negative self-esteem (Czeglédi 2009).
Similar to the satisfaction of women with their body im-age, the image considered real and ideal is different in case of men (75%) as well. The highest difference in the perception of body image in case of women and men is that while women uniformly consider the thinner shape as ideal, men desire to increase and decrease their body mass thus develop a different body image almost fifty-fifty. In the research conducted by Frederic et al. (2005) ideal body image in case of Americans, French, and Australians is extremely more muscular than the reality, and beside this they also consider the men shape de-sirable for women being more muscular or with higher body mass than theirs. In case of the elder men (over 45 years) the higher body mass and the overweight is more accepted than in case of younger men. 29% of adult men is dissatisfied with his body image. 24% of them would change his upper body, 41% his torso, and 18% his lower body. Only 10% of respon-dents answered being dissatisfied with the whole body image in general. Examining the reasons of the change 72% of re-spondents would increase his musculature to feel better in his skin, and 80% would feel better if his current musculature was more developed (Grogan 2008).
Methods
For the accomplishment of the objectives of our research a na-tionwide representative questionnaire survey of 1000 people was started in Hungary. In course of the sampling represen-tativeness was ensured a priori in case of each region, thus the structure of the sample entirely meets the quota set by the KSH previously (quota sampling).
Selection of settlements in each region was conducted by draw (simple random sampling) In case of the selected settle-ments the random walk method was used that ensures a total randomness for the selection of the appropriate respondents. In the second step the person appropriate for the interview was selected among the residents of the households with using the
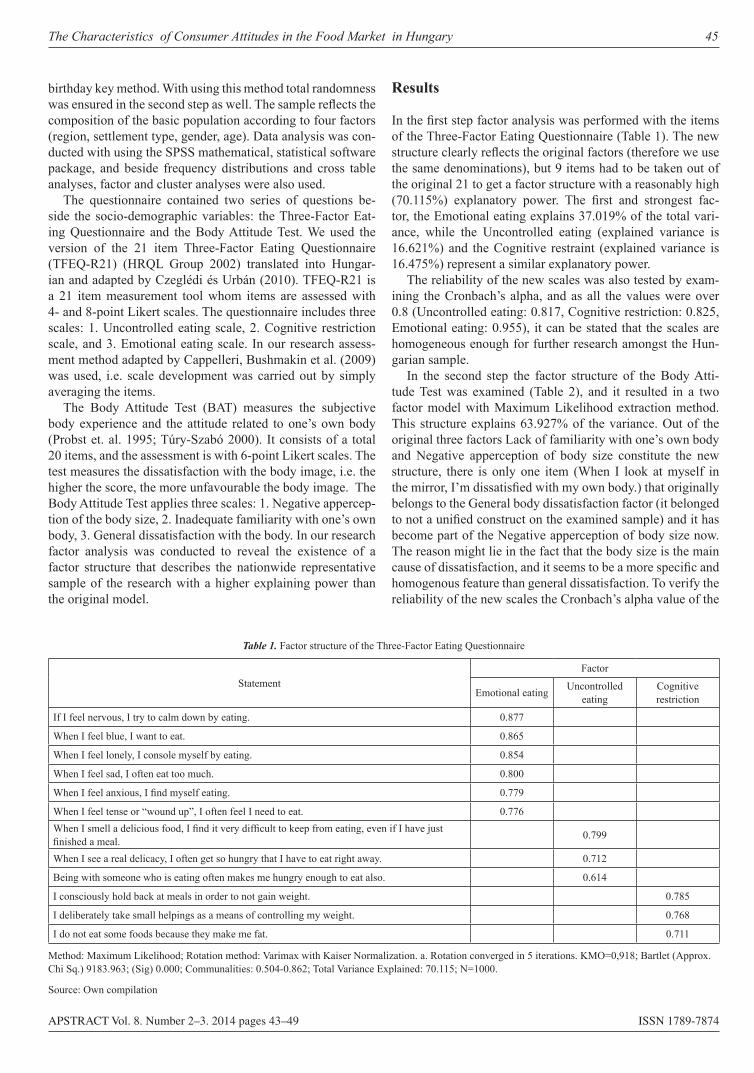
The Characteristics of Consumer Attitudes in the Food Market in Hungary 45
APSTRACT Vol. 8. Number 2–3. 2014 pages 43–49 ISSN 1789-7874
birthday key method. With using this method total randomness was ensured in the second step as well. The sample reflects the composition of the basic population according to four factors (region, settlement type, gender, age). Data analysis was con-ducted with using the SPSS mathematical, statistical software package, and beside frequency distributions and cross table analyses, factor and cluster analyses were also used.
The questionnaire contained two series of questions be-side the socio-demographic variables: the Three-Factor Eat-ing Questionnaire and the Body Attitude Test. We used the version of the 21 item Three-Factor Eating Questionnaire (TFEQ-R21) (HRQL Group 2002) translated into Hungar-ian and adapted by Czeglédi és Urbán (2010). TFEQ-R21 is a 21 item measurement tool whom items are assessed with 4- and 8-point Likert scales. The questionnaire includes three scales: 1. Uncontrolled eating scale, 2. Cognitive restriction scale, and 3. Emotional eating scale. In our research assess-ment method adapted by Cappelleri, Bushmakin et al. (2009) was used, i.e. scale development was carried out by simply averaging the items.
The Body Attitude Test (BAT) measures the subjective body experience and the attitude related to one’s own body (Probst et. al. 1995; Túry-Szabó 2000). It consists of a total 20 items, and the assessment is with 6-point Likert scales. The test measures the dissatisfaction with the body image, i.e. the higher the score, the more unfavourable the body image. The Body Attitude Test applies three scales: 1. Negative appercep-tion of the body size, 2. Inadequate familiarity with one’s own body, 3. General dissatisfaction with the body. In our research factor analysis was conducted to reveal the existence of a factor structure that describes the nationwide representative sample of the research with a higher explaining power than the original model.
Results
In the first step factor analysis was performed with the items of the Three-Factor Eating Questionnaire (Table 1). The new structure clearly reflects the original factors (therefore we use the same denominations), but 9 items had to be taken out of the original 21 to get a factor structure with a reasonably high (70.115%) explanatory power. The first and strongest fac-tor, the Emotional eating explains 37.019% of the total vari-ance, while the Uncontrolled eating (explained variance is 16.621%) and the Cognitive restraint (explained variance is 16.475%) represent a similar explanatory power.
The reliability of the new scales was also tested by exam-ining the Cronbach’s alpha, and as all the values were over 0.8 (Uncontrolled eating: 0.817, Cognitive restriction: 0.825, Emotional eating: 0.955), it can be stated that the scales are homogeneous enough for further research amongst the Hun-garian sample.
In the second step the factor structure of the Body Atti-tude Test was examined (Table 2), and it resulted in a two factor model with Maximum Likelihood extraction method. This structure explains 63.927% of the variance. Out of the original three factors Lack of familiarity with one’s own body and Negative apperception of body size constitute the new structure, there is only one item (When I look at myself in the mirror, I’m dissatisfied with my own body.) that originally belongs to the General body dissatisfaction factor (it belonged to not a unified construct on the examined sample) and it has become part of the Negative apperception of body size now. The reason might lie in the fact that the body size is the main cause of dissatisfaction, and it seems to be a more specific and homogenous feature than general dissatisfaction. To verify the reliability of the new scales the Cronbach’s alpha value of the
Table 1. Factor structure of the Three-Factor Eating Questionnaire
StatementFactor
Emotional eating Uncontrolled eating
Cognitive restriction
If I feel nervous, I try to calm down by eating. 0.877
When I feel blue, I want to eat. 0.865
When I feel lonely, I console myself by eating. 0.854
When I feel sad, I often eat too much. 0.800
When I feel anxious, I find myself eating. 0.779
When I feel tense or “wound up”, I often feel I need to eat. 0.776 When I smell a delicious food, I find it very difficult to keep from eating, even if I have just finished a meal. 0.799
When I see a real delicacy, I often get so hungry that I have to eat right away. 0.712
Being with someone who is eating often makes me hungry enough to eat also. 0.614
I consciously hold back at meals in order to not gain weight. 0.785
I deliberately take small helpings as a means of controlling my weight. 0.768
I do not eat some foods because they make me fat. 0.711
Method: Maximum Likelihood; Rotation method: Varimax with Kaiser Normalization. a. Rotation converged in 5 iterations. KMO=0,918; Bartlet (Approx. Chi Sq.) 9183.963; (Sig) 0.000; Communalities: 0.504-0.862; Total Variance Explained: 70.115; N=1000.
Source: Own compilation
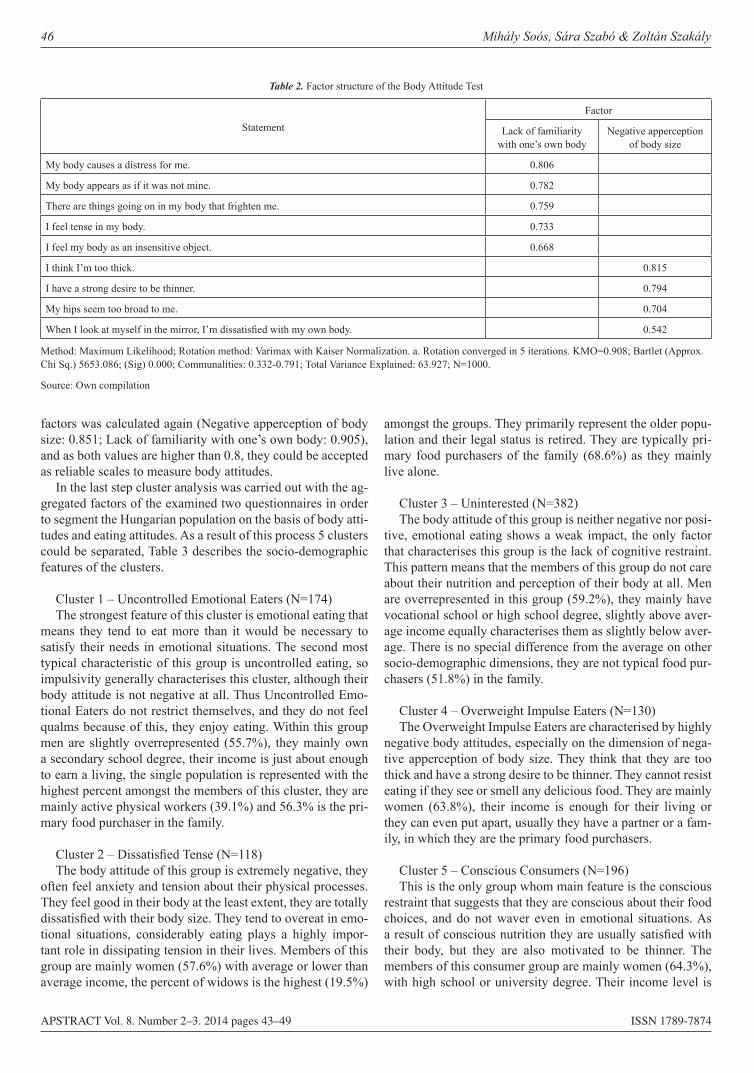
46 Mihály Soós, Sára Szabó & Zoltán Szakály
APSTRACT Vol. 8. Number 2–3. 2014 pages 43–49 ISSN 1789-7874
factors was calculated again (Negative apperception of body size: 0.851; Lack of familiarity with one’s own body: 0.905), and as both values are higher than 0.8, they could be accepted as reliable scales to measure body attitudes.
In the last step cluster analysis was carried out with the ag-gregated factors of the examined two questionnaires in order to segment the Hungarian population on the basis of body atti-tudes and eating attitudes. As a result of this process 5 clusters could be separated, Table 3 describes the socio-demographic features of the clusters.
Cluster 1 – Uncontrolled Emotional Eaters (N=174)The strongest feature of this cluster is emotional eating that
means they tend to eat more than it would be necessary to satisfy their needs in emotional situations. The second most typical characteristic of this group is uncontrolled eating, so impulsivity generally characterises this cluster, although their body attitude is not negative at all. Thus Uncontrolled Emo-tional Eaters do not restrict themselves, and they do not feel qualms because of this, they enjoy eating. Within this group men are slightly overrepresented (55.7%), they mainly own a secondary school degree, their income is just about enough to earn a living, the single population is represented with the highest percent amongst the members of this cluster, they are mainly active physical workers (39.1%) and 56.3% is the pri-mary food purchaser in the family.
Cluster 2 – Dissatisfied Tense (N=118)The body attitude of this group is extremely negative, they
often feel anxiety and tension about their physical processes. They feel good in their body at the least extent, they are totally dissatisfied with their body size. They tend to overeat in emo-tional situations, considerably eating plays a highly impor-tant role in dissipating tension in their lives. Members of this group are mainly women (57.6%) with average or lower than average income, the percent of widows is the highest (19.5%)
amongst the groups. They primarily represent the older popu-lation and their legal status is retired. They are typically pri-mary food purchasers of the family (68.6%) as they mainly live alone.
Cluster 3 – Uninterested (N=382)The body attitude of this group is neither negative nor posi-
tive, emotional eating shows a weak impact, the only factor that characterises this group is the lack of cognitive restraint. This pattern means that the members of this group do not care about their nutrition and perception of their body at all. Men are overrepresented in this group (59.2%), they mainly have vocational school or high school degree, slightly above aver-age income equally characterises them as slightly below aver-age. There is no special difference from the average on other socio-demographic dimensions, they are not typical food pur-chasers (51.8%) in the family.
Cluster 4 – Overweight Impulse Eaters (N=130)The Overweight Impulse Eaters are characterised by highly
negative body attitudes, especially on the dimension of nega-tive apperception of body size. They think that they are too thick and have a strong desire to be thinner. They cannot resist eating if they see or smell any delicious food. They are mainly women (63.8%), their income is enough for their living or they can even put apart, usually they have a partner or a fam-ily, in which they are the primary food purchasers.
Cluster 5 – Conscious Consumers (N=196)This is the only group whom main feature is the conscious
restraint that suggests that they are conscious about their food choices, and do not waver even in emotional situations. As a result of conscious nutrition they are usually satisfied with their body, but they are also motivated to be thinner. The members of this consumer group are mainly women (64.3%), with high school or university degree. Their income level is
Table 2. Factor structure of the Body Attitude Test
StatementFactor
Lack of familiarity with one’s own body
Negative apperception of body size
My body causes a distress for me. 0.806
My body appears as if it was not mine. 0.782
There are things going on in my body that frighten me. 0.759
I feel tense in my body. 0.733
I feel my body as an insensitive object. 0.668
I think I’m too thick. 0.815
I have a strong desire to be thinner. 0.794
My hips seem too broad to me. 0.704
When I look at myself in the mirror, I’m dissatisfied with my own body. 0.542
Method: Maximum Likelihood; Rotation method: Varimax with Kaiser Normalization. a. Rotation converged in 5 iterations. KMO=0.908; Bartlet (Approx. Chi Sq.) 5653.086; (Sig) 0.000; Communalities: 0.332-0.791; Total Variance Explained: 63.927; N=1000.
Source: Own compilation
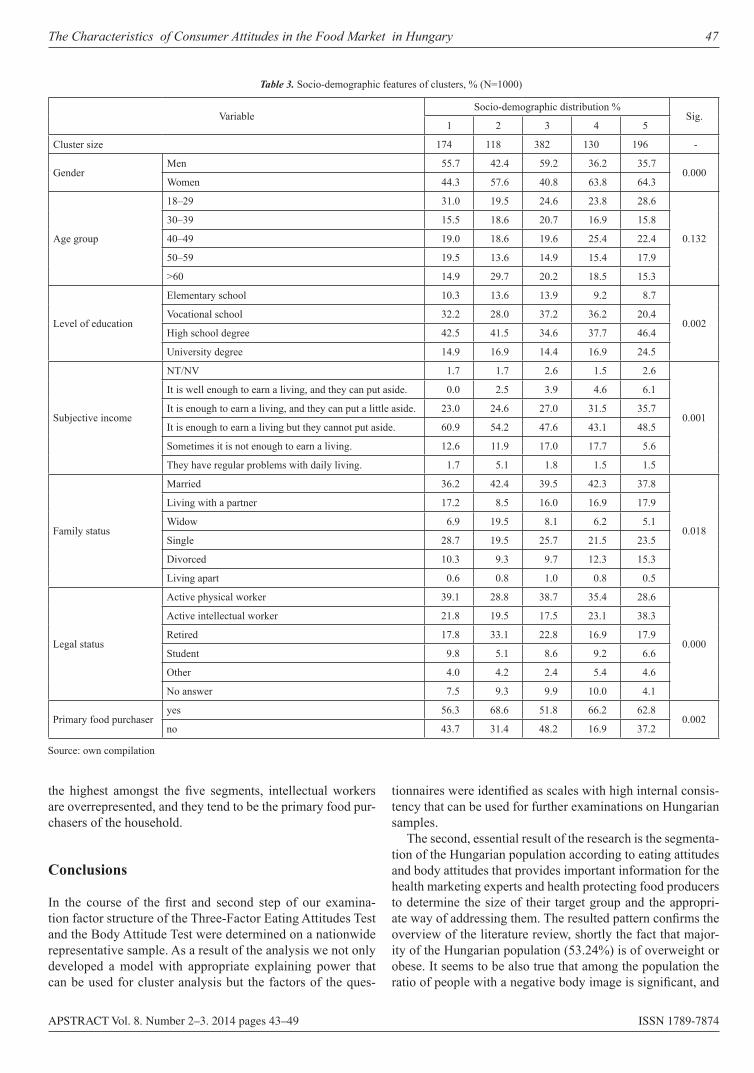
The Characteristics of Consumer Attitudes in the Food Market in Hungary 47
APSTRACT Vol. 8. Number 2–3. 2014 pages 43–49 ISSN 1789-7874
the highest amongst the five segments, intellectual workers are overrepresented, and they tend to be the primary food pur-chasers of the household.
Conclusions
In the course of the first and second step of our examina-tion factor structure of the Three-Factor Eating Attitudes Test and the Body Attitude Test were determined on a nationwide representative sample. As a result of the analysis we not only developed a model with appropriate explaining power that can be used for cluster analysis but the factors of the ques-
tionnaires were identified as scales with high internal consis-tency that can be used for further examinations on Hungarian samples.
The second, essential result of the research is the segmenta-tion of the Hungarian population according to eating attitudes and body attitudes that provides important information for the health marketing experts and health protecting food producers to determine the size of their target group and the appropri-ate way of addressing them. The resulted pattern confirms the overview of the literature review, shortly the fact that major-ity of the Hungarian population (53.24%) is of overweight or obese. It seems to be also true that among the population the ratio of people with a negative body image is significant, and
Table 3. Socio-demographic features of clusters, % (N=1000)
VariableSocio-demographic distribution %
Sig.1 2 3 4 5
Cluster size 174 118 382 130 196 -
GenderMen 55.7 42.4 59.2 36.2 35.7
0.000Women 44.3 57.6 40.8 63.8 64.3
Age group
18–29 31.0 19.5 24.6 23.8 28.6
0.132
30–39 15.5 18.6 20.7 16.9 15.8
40–49 19.0 18.6 19.6 25.4 22.4
50–59 19.5 13.6 14.9 15.4 17.9
>60 14.9 29.7 20.2 18.5 15.3
Level of education
Elementary school 10.3 13.6 13.9 9.2 8.7
0.002Vocational school 32.2 28.0 37.2 36.2 20.4
High school degree 42.5 41.5 34.6 37.7 46.4
University degree 14.9 16.9 14.4 16.9 24.5
Subjective income
NT/NV 1.7 1.7 2.6 1.5 2.6
0.001
It is well enough to earn a living, and they can put aside. 0.0 2.5 3.9 4.6 6.1
It is enough to earn a living, and they can put a little aside. 23.0 24.6 27.0 31.5 35.7
It is enough to earn a living but they cannot put aside. 60.9 54.2 47.6 43.1 48.5
Sometimes it is not enough to earn a living. 12.6 11.9 17.0 17.7 5.6
They have regular problems with daily living. 1.7 5.1 1.8 1.5 1.5
Family status
Married 36.2 42.4 39.5 42.3 37.8
0.018
Living with a partner 17.2 8.5 16.0 16.9 17.9
Widow 6.9 19.5 8.1 6.2 5.1
Single 28.7 19.5 25.7 21.5 23.5
Divorced 10.3 9.3 9.7 12.3 15.3
Living apart 0.6 0.8 1.0 0.8 0.5
Legal status
Active physical worker 39.1 28.8 38.7 35.4 28.6
0.000
Active intellectual worker 21.8 19.5 17.5 23.1 38.3
Retired 17.8 33.1 22.8 16.9 17.9
Student 9.8 5.1 8.6 9.2 6.6
Other 4.0 4.2 2.4 5.4 4.6
No answer 7.5 9.3 9.9 10.0 4.1
Primary food purchaseryes 56.3 68.6 51.8 66.2 62.8
0.002no 43.7 31.4 48.2 16.9 37.2
Source: own compilation
48 Mihály Soós, Sára Szabó & Zoltán Szakály
APSTRACT Vol. 8. Number 2–3. 2014 pages 43–49 ISSN 1789-7874
considering the body image, women tend to perceive them-selves more negatively.
38.2% of the population is seen as Uninterested, they to-tally reject the conscious nutrition, and this does not cause a body discomfort feeling for them that could have a motivating effect, thus this group is the hardest to communicate with. The other hard-to-reach group is the cluster of Uncontrolled Emo-tional Eaters (17.4%) who use eating as a stress reduction tool in negative emotional situations, and this satisfies them (ac-cording to the examined variables), i.e. they entirely consider eating as a source of pleasure. The combined size of the two groups hard-to-reach in terms of health behaviour is 55.6%, i.e. majority of consumers belong to this category.
The Dissatisfied Tense group is in a quite bad situation ac-cording to their subjective feelings in terms of body image and eating attitudes but this perception is articulated in the form of anxiety and dissatisfaction, thus they are aware of their status, and they would likely be willing to change due to the tension pressure, but the producer targeting this group has to provide effective solutions to reduce anxiety. According to the income status of the target group it does not worth to target the premi-um category, and information and distribution channels should be developed based on the needs of the elder consumers. In a marketing perspective this is not an optimal, health conscious group in a good financial position but by the implementation of a relevant strategy significant market share can be gained as 11.8% of the Hungarian population belongs to this group.
The Overweight Impulse Eaters’ group (13%) character-ised by higher financial potential and significant motivation, thus can be reached more easily, but to gain their loyalty spe-cial attention should be devoted to them due to their impulse consumption. The desire to be thinner and the emotional and uncontrolled eating are present at the same time. It is likely that this consumer segment is the primary target group of the so called fashion diets: they purchase it, they try it but they quickly give it up if the method demands perseverance, and long-term life style changes. In their case the stress should be put on retaining them instead of addressing them.
The primary target group of health protecting foods, i.e. the Conscious Eaters’ group is almost 20%. The members of the cluster have likely changed their nutrition habits in the past and they have maintained it for a long time as they are not characterised by the emotional eating. According to their financial status they can afford even the premium category products, and if they are affected by them convincingly, they even purchase them as they are the primary purchasers in the household. It is likely that the members of this group are who react first to the rallying call of ’health’, they can be met in lifestyle clubs, fitness events, and at screening tests. These consumers can be convinced by scientific arguments, and are loyal for a long time.
References
Bhattoa HP & Balogh Á: A férfiosteoporosis előfordulási gya ko ri-sá gát befolyásoló tényezők és a D-vitamin-ellátottáguk vizsgálata. (A Magyar Osteoporosis és Osteoarthropologiai Társaság/MOOT 18. Kongresszusa.) Ca&Csont, 12 (2): 57–76
Bíró Gy (2008): A hazai zsiradékfogyasztás változásának közegész-ségügyi hatásai. Élelmezési Ipar. 62 (5): 137–141.
Cappelleri JC, Bushmakin AG, Gerber RA, Leidy NK, Sexton CC, Lowe MR & Karlsson J (2009): Psychometric analysis of the Three-Factor Eating Question- naire-R21: results from a large diverse sample of obese and non-obese participants. International Journal of Obesity. (33): 611–620.
Cash T & Pruzinsky T. (1990): Body images: Developement, deviance and change. New York: Guilford Papers.
Czeglédi E, Urbán R & Rigó A (2009): Elhízás és testképpel való elégedettség. Magyar Pszichológiai Szemle, Akadémiai Kiadó, Budapest. 2 (64): 313–337.
Czeglédi E & Urbán R (2010): A Háromfaktoros Evési Kérdőív (Three-Factor Eating Questionnare Revised 21-Item) hazai adap-tációja. Magyar Pszichológiai Szemle, Akadémiai Kiadó, Budapest. 3 (65): 463–494.
Csányi T (2010): A fizikai aktivitás és egészség fiatal korban. Egész-ség fej lesz tés. 51 (1–2): 43–48.
Frederick DA, Fessler, DMT & Haselton MG (2005): Do represen-tations of male muscularity differ in men’s an women’s magazines? Body Image: An International Journal of Research. 2 (1): 81–86.
Grogan S (2006): Body image and health: Contemporary Perspectives. Journal of Health Psychology. 11 (4): 523–530.
HRQL Group (2010): TFEQ-R21. Manuscript. Göteborg University on-Campus Company, Göteborg, Sweden, 2002. In: Czeglédi E.–Urbán R.: A Háromfaktoros Evési Kérdőív (Three-Factor Eating Questionnare Revised 21-Item) hazai adaptációja. Magyar Pszichológiai Szemle, Akadémiai Kiadó, Budapest 3 (65): 463–494.
Lewis RJ, Cash TF, Jacobi L & Bubb-Lewis C (1997): Prejudice toward fat people: The development and validation of the antifat attitudes test. Obesity Research. 5 (4): 610–619.
Probst M, Pieters G & Vanderlinden J (2008): Evaluation of body experience questionnaires in eating disorders in female patients (AN/BN) and nonclinical participants. International Journal of Eating Dis-orders. 41 (7): 657–665.
Probst M, Vanderlinden W, Van Coppenolle H & Vanderlinden J (1995): The Body Attitude Test for patients with an eating disorder: psychometric characteristics of a new questionnaire. Eating Disor-ders. 3: 133–144.
Rácz G. (2013): Az értékek változásának és a fenntartható fejlődés trend jé nek hatása a hazai élelmiszerfogyasztásra. PhD értekezés, Szent István Egyetem, Gazdálkodás és Szervezéstudományok Doktori Iskola.
The Characteristics of Consumer Attitudes in the Food Market in Hungary 49
APSTRACT Vol. 8. Number 2–3. 2014 pages 43–49 ISSN 1789-7874
Rodler I (2008): Élelmezés- és táplálkozás-egészségtan. Medicina Könyv kiadó Zrt., Budapest. 41–532.Szakály Z, Szigeti O, Szente V & Sándor J (2006): Az egész-ségtudatos fogyasztói magatartás elemzése a light termékek piacán. Kaposvári Egyetem GTK – Market&Fact. 1–80.Túry F & Szabó P (2000): A táplálkozási magatartás zavarai: az anorexia nervosa és a bulimia nervosa. Medicina Könyvkiadó, Budapest.Szakály Z (2011): Táplálkozásmarketing. Mezőgazda Kiadó, Budapest. 1–202.URL: http://www.who.int/features/factfiles/obesity/facts/en/index.html
WHO: Integrated WHO Nutrition Global Databases User-defined customized data function. WHO: Physical status: The use and interpretation of anthropometry.Sára Szabó, PhD student, Department of Marketing and Trade, Faculty of Economic Science, Kaposvár University, (Kaposvár)Mihály Soós, assistant lecturer, Institute of Marketing and Commerce, Faculty of Applied Economics and Rural Development, University of Debrecen (Debrecen)Zoltán Szakály, professor, Institute of Marketing and Commerce, Faculty of Applied Economics and Rural Development, University of Debrecen (Debrecen)
APSTRACT Vol. 8. Number 2–3. 2014 pages 51–59 ISSN 1789-7874
1. Introduction
The competitiveness of the European Union in the field of research and development and innovation (R&D&I) reflects a long-term deterioration in global steps. The regional and structural differences of R&D&I and particularly of R&D have further increased during the last decade. The so-called European paradox means the contradiction that in Europe out-standing scientific results are achieved, the practical results of innovation are more moderate. This has impacts certainly on Central and Eastern Europe and Hungary. In spite of the world economic crisis, most of the developed countries in the European Union, as well as the EU itself, are endeavouring to increase the R&D support.
In Hungary there are three major problems relating to R&D&I, such as the weaknesses of university-academy, governmental, national and international knowledge bases,
knowledge generation; knowledge transfer (technology trans-fer, lack of other transfer mechanisms) and knowledge ap-plication. The European Union’s framework programme for R&D development between 2014 and 2020, called the Hori-zont 2020 strategy, set the objective of significantly increas-ing the R&D resources available at the Union level” (Ministry for National Economy 2013). The aim of my research is to establish a HUB operating as an open innovation space. The R&D&I strategy of the European Union may form a basis for this, and it may harmonize with the economic development plan of Debrecen. The development such an innovative space forming a bridge may have a relevant impact in our region from the practical aspect as well. In my opinion, this shows something new than the already existing open innovation space in this way it would be worth developing it in Debrecen.
“The innovation process and its scientific approach went through a fundamental change during the past years. After
Examination of EntErprEnEurship EcosystEm in DEbrEcEn from thE DirEction
of opEn innovation spacEsAdrienn Horváth
University of Debrecen
Abstract: Innovation is not just a technology, but it is rather a comprehensive vision of what the future should look like and which requires changes in many ambits. Innovation is driven by people’s needs, ambitions and dreams, and it is necessary that people at different positions in the society change the way they work and live. Innovation, as a result of human interactions, often fails because people do not understand each other, as they belong to different worlds which have their own languages and cultures. While innovation system-like thinking recognizes that the needs are a good mix of factors for innovation, it is hard to establish the perfect mix beforehand: innovation systems and policies need to be adaptive” (Klerkx, Mierlo & Leeuwis 2012).I tried to bring this complex vision to our future. The actuality of the topic is provided by the fact that we are in the period of the development of digital industrial revolution, on the peak of the technology innovations, slowly resulting in the revolutions of the machines. These technological innovations, trends, equipment or new technological achievements often make our work easier, or they may replace us, and will bring changes transforming the world with them. At present era, the availability and use of the relevant knowledge is essential. In Western Europe and in other more developed countries different spaces provide places for evolving various trends, applying the acquired knowledge, e.g. development of Silicon Valley, polices, clusters, co-workings. These innovative spaces may form a bridge for evolving a global, international or regional technology and knowledge transfer, sharing our knowledge and developing our competitiveness. They may be the engine of a “new world”.The entrepreneurship ecosystem in Debrecen was investigated regarding the presence of open innovation spaces. Though Debrecen has already had open innovation spaces, it does not have space operating as HUB. „HUB is a global platform, where people from all corners of the planet connect and engage in collaborative action to realize enterprising ideas for a better world” (HUB GMBH 2012). Furthermore, I studied the fact that why the creation of HUB in Debrecen is reasonable concerning every sector, and what characteristics this space may have. In order to analyze my hypotheses, I used questionnaires made by Delphi survey. During the process experts of this field were asked in two turns. Selecting the experts occurred on the basis of Helix model.
Keywords: innovation, open innovation, HUB, Delphi survey method, Helix model
Applied Studies in Agribusiness and Commerce – APSTRACTAgroinform Publishing House, Budapest sciEntific papErs
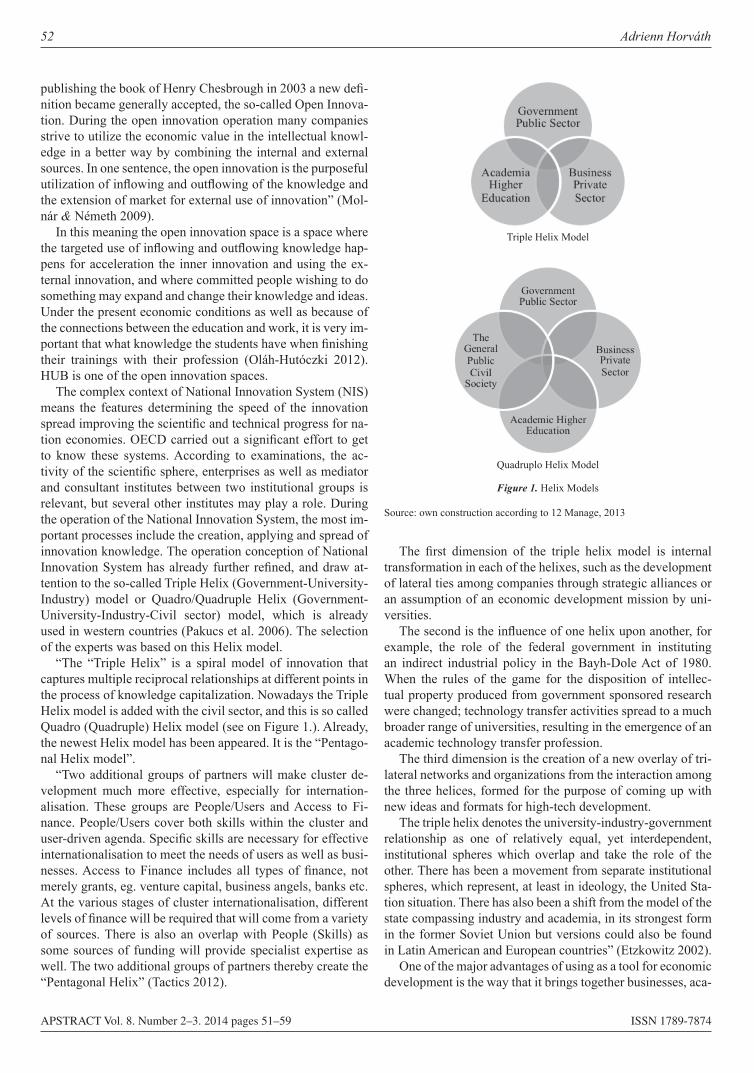
52 Adrienn Horváth
APSTRACT Vol. 8. Number 2–3. 2014 pages 51–59 ISSN 1789-7874
publishing the book of Henry Chesbrough in 2003 a new defi-nition became generally accepted, the so-called Open Innova-tion. During the open innovation operation many companies strive to utilize the economic value in the intellectual knowl-edge in a better way by combining the internal and external sources. In one sentence, the open innovation is the purposeful utilization of inflowing and outflowing of the knowledge and the extension of market for external use of innovation” (Mol-nár & Németh 2009).
In this meaning the open innovation space is a space where the targeted use of inflowing and outflowing knowledge hap-pens for acceleration the inner innovation and using the ex-ternal innovation, and where committed people wishing to do something may expand and change their knowledge and ideas. Under the present economic conditions as well as because of the connections between the education and work, it is very im-portant that what knowledge the students have when finishing their trainings with their profession (Oláh-Hutóczki 2012). HUB is one of the open innovation spaces.
The complex context of National Innovation System (NIS) means the features determining the speed of the innovation spread improving the scientific and technical progress for na-tion economies. OECD carried out a significant effort to get to know these systems. According to examinations, the ac-tivity of the scientific sphere, enterprises as well as mediator and consultant institutes between two institutional groups is relevant, but several other institutes may play a role. During the operation of the National Innovation System, the most im-portant processes include the creation, applying and spread of innovation knowledge. The operation conception of National Innovation System has already further refined, and draw at-tention to the so-called Triple Helix (Government-University-Industry) model or Quadro/Quadruple Helix (Government-University-Industry-Civil sector) model, which is already used in western countries (Pakucs et al. 2006). The selection of the experts was based on this Helix model.
“The “Triple Helix” is a spiral model of innovation that captures multiple reciprocal relationships at different points in the process of knowledge capitalization. Nowadays the Triple Helix model is added with the civil sector, and this is so called Quadro (Quadruple) Helix model (see on Figure 1.). Already, the newest Helix model has been appeared. It is the “Pentago-nal Helix model”.
“Two additional groups of partners will make cluster de-velopment much more effective, especially for internation-alisation. These groups are People/Users and Access to Fi-nance. People/Users cover both skills within the cluster and user-driven agenda. Specific skills are necessary for effective internationalisation to meet the needs of users as well as busi-nesses. Access to Finance includes all types of finance, not merely grants, eg. venture capital, business angels, banks etc. At the various stages of cluster internationalisation, different levels of finance will be required that will come from a variety of sources. There is also an overlap with People (Skills) as some sources of funding will provide specialist expertise as well. The two additional groups of partners thereby create the “Pentagonal Helix” (Tactics 2012).
The first dimension of the triple helix model is internal transformation in each of the helixes, such as the development of lateral ties among companies through strategic alliances or an assumption of an economic development mission by uni-versities.
The second is the influence of one helix upon another, for example, the role of the federal government in instituting an indirect industrial policy in the Bayh-Dole Act of 1980. When the rules of the game for the disposition of intellec-tual property produced from government sponsored research were changed; technology transfer activities spread to a much broader range of universities, resulting in the emergence of an academic technology transfer profession.
The third dimension is the creation of a new overlay of tri-lateral networks and organizations from the interaction among the three helices, formed for the purpose of coming up with new ideas and formats for high-tech development.
The triple helix denotes the university-industry-government relationship as one of relatively equal, yet interdependent, institutional spheres which overlap and take the role of the other. There has been a movement from separate institutional spheres, which represent, at least in ideology, the United Sta-tion situation. There has also been a shift from the model of the state compassing industry and academia, in its strongest form in the former Soviet Union but versions could also be found in Latin American and European countries” (Etzkowitz 2002).
One of the major advantages of using as a tool for economic development is the way that it brings together businesses, aca-
Triple Helix Model
Quadruplo Helix Model
Figure 1. Helix Models
Source: own construction according to 12 Manage, 2013
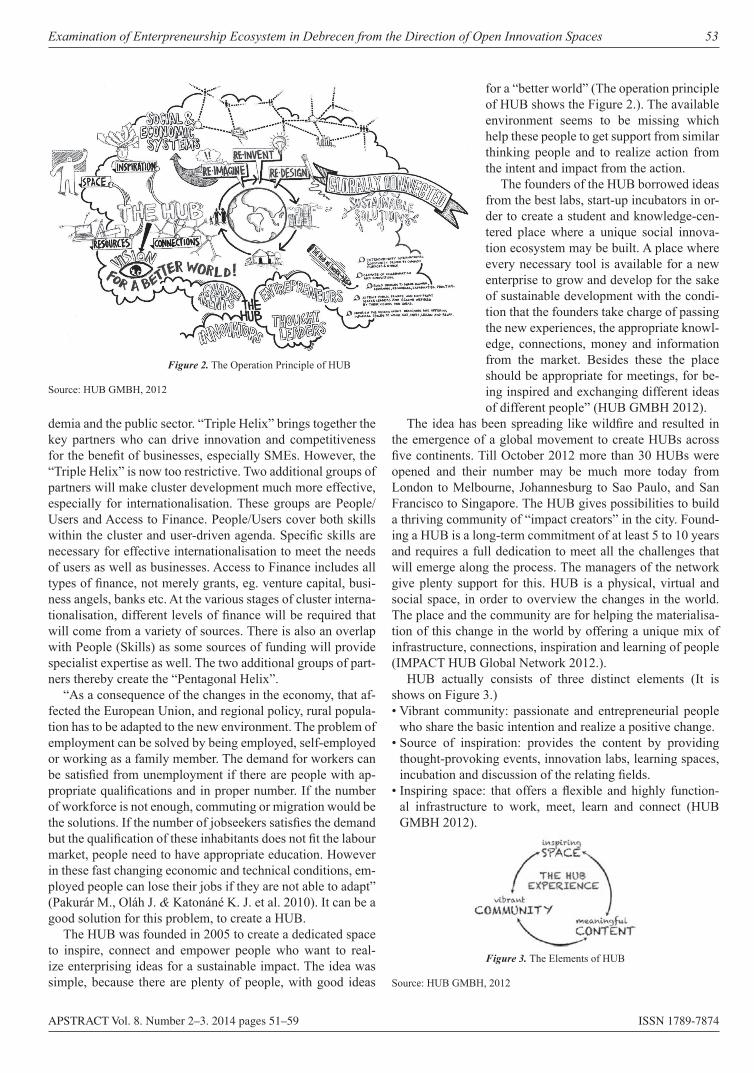
Examination of Enterpreneurship Ecosystem in Debrecen from the Direction of Open Innovation Spaces 53
APSTRACT Vol. 8. Number 2–3. 2014 pages 51–59 ISSN 1789-7874
demia and the public sector. “Triple Helix” brings together the key partners who can drive innovation and competitiveness for the benefit of businesses, especially SMEs. However, the “Triple Helix” is now too restrictive. Two additional groups of partners will make cluster development much more effective, especially for internationalisation. These groups are People/Users and Access to Finance. People/Users cover both skills within the cluster and user-driven agenda. Specific skills are necessary for effective internationalisation to meet the needs of users as well as businesses. Access to Finance includes all types of finance, not merely grants, eg. venture capital, busi-ness angels, banks etc. At the various stages of cluster interna-tionalisation, different levels of finance will be required that will come from a variety of sources. There is also an overlap with People (Skills) as some sources of funding will provide specialist expertise as well. The two additional groups of part-ners thereby create the “Pentagonal Helix”.
“As a consequence of the changes in the economy, that af-fected the European Union, and regional policy, rural popula-tion has to be adapted to the new environment. The problem of employment can be solved by being employed, self-employed or working as a family member. The demand for workers can be satisfied from unemployment if there are people with ap-propriate qualifications and in proper number. If the number of workforce is not enough, commuting or migration would be the solutions. If the number of jobseekers satisfies the demand but the qualification of these inhabitants does not fit the labour market, people need to have appropriate education. However in these fast changing economic and technical conditions, em-ployed people can lose their jobs if they are not able to adapt” (Pakurár M., Oláh J. & Katonáné K. J. et al. 2010). It can be a good solution for this problem, to create a HUB.
The HUB was founded in 2005 to create a dedicated space to inspire, connect and empower people who want to real-ize enterprising ideas for a sustainable impact. The idea was simple, because there are plenty of people, with good ideas
for a “better world” (The operation principle of HUB shows the Figure 2.). The available environment seems to be missing which help these people to get support from similar thinking people and to realize action from the intent and impact from the action.
The founders of the HUB borrowed ideas from the best labs, start-up incubators in or-der to create a student and knowledge-cen-tered place where a unique social innova-tion ecosystem may be built. A place where every necessary tool is available for a new enterprise to grow and develop for the sake of sustainable development with the condi-tion that the founders take charge of passing the new experiences, the appropriate knowl-edge, connections, money and information from the market. Besides these the place should be appropriate for meetings, for be-ing inspired and exchanging different ideas of different people” (HUB GMBH 2012).
The idea has been spreading like wildfire and resulted in the emergence of a global movement to create HUBs across five continents. Till October 2012 more than 30 HUBs were opened and their number may be much more today from London to Melbourne, Johannesburg to Sao Paulo, and San Francisco to Singapore. The HUB gives possibilities to build a thriving community of “impact creators” in the city. Found-ing a HUB is a long-term commitment of at least 5 to 10 years and requires a full dedication to meet all the challenges that will emerge along the process. The managers of the network give plenty support for this. HUB is a physical, virtual and social space, in order to overview the changes in the world. The place and the community are for helping the materialisa-tion of this change in the world by offering a unique mix of infrastructure, connections, inspiration and learning of people (IMPACT HUB Global Network 2012.).
HUB actually consists of three distinct elements (It is shows on Figure 3.)• Vibrant community: passionate and entrepreneurial people
who share the basic intention and realize a positive change.• Source of inspiration: provides the content by providing
thought-provoking events, innovation labs, learning spaces, incubation and discussion of the relating fields.
• Inspiring space: that offers a flexible and highly function-al infrastructure to work, meet, learn and connect (HUB GMBH 2012).
Figure 2. The Operation Principle of HUB
Source: HUB GMBH, 2012
Figure 3. The Elements of HUB
Source: HUB GMBH, 2012
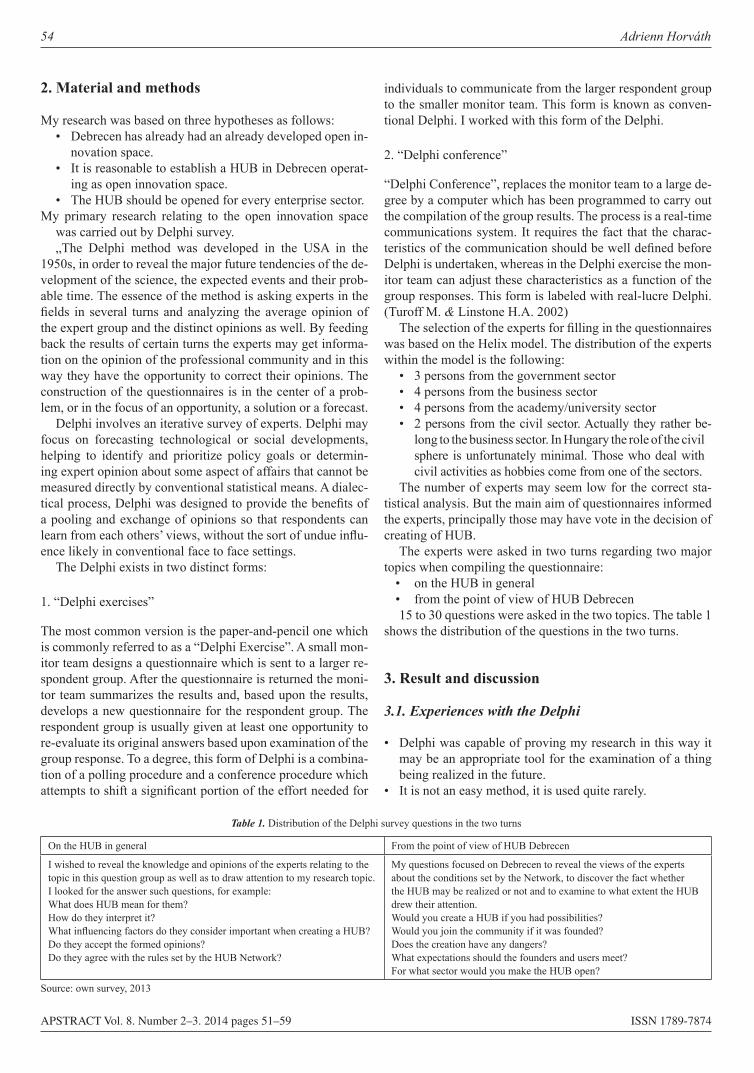
54 Adrienn Horváth
APSTRACT Vol. 8. Number 2–3. 2014 pages 51–59 ISSN 1789-7874
2. Material and methods
My research was based on three hypotheses as follows:• Debrecen has already had an already developed open in-
novation space.• It is reasonable to establish a HUB in Debrecen operat-
ing as open innovation space.• The HUB should be opened for every enterprise sector.
My primary research relating to the open innovation space was carried out by Delphi survey.„The Delphi method was developed in the USA in the
1950s, in order to reveal the major future tendencies of the de-velopment of the science, the expected events and their prob-able time. The essence of the method is asking experts in the fields in several turns and analyzing the average opinion of the expert group and the distinct opinions as well. By feeding back the results of certain turns the experts may get informa-tion on the opinion of the professional community and in this way they have the opportunity to correct their opinions. The construction of the questionnaires is in the center of a prob-lem, or in the focus of an opportunity, a solution or a forecast.
Delphi involves an iterative survey of experts. Delphi may focus on forecasting technological or social developments, helping to identify and prioritize policy goals or determin-ing expert opinion about some aspect of affairs that cannot be measured directly by conventional statistical means. A dialec-tical process, Delphi was designed to provide the benefits of a pooling and exchange of opinions so that respondents can learn from each others’ views, without the sort of undue influ-ence likely in conventional face to face settings.
The Delphi exists in two distinct forms:
1. “Delphi exercises”
The most common version is the paper-and-pencil one which is commonly referred to as a “Delphi Exercise”. A small mon-itor team designs a questionnaire which is sent to a larger re-spondent group. After the questionnaire is returned the moni-tor team summarizes the results and, based upon the results, develops a new questionnaire for the respondent group. The respondent group is usually given at least one opportunity to re-evaluate its original answers based upon examination of the group response. To a degree, this form of Delphi is a combina-tion of a polling procedure and a conference procedure which attempts to shift a significant portion of the effort needed for
individuals to communicate from the larger respondent group to the smaller monitor team. This form is known as conven-tional Delphi. I worked with this form of the Delphi.
2. “Delphi conference”
“Delphi Conference”, replaces the monitor team to a large de-gree by a computer which has been programmed to carry out the compilation of the group results. The process is a real-time communications system. It requires the fact that the charac-teristics of the communication should be well defined before Delphi is undertaken, whereas in the Delphi exercise the mon-itor team can adjust these characteristics as a function of the group responses. This form is labeled with real-lucre Delphi. (Turoff M. & Linstone H.A. 2002)
The selection of the experts for filling in the questionnaires was based on the Helix model. The distribution of the experts within the model is the following:
• 3 persons from the government sector• 4 persons from the business sector• 4 persons from the academy/university sector• 2 persons from the civil sector. Actually they rather be-
long to the business sector. In Hungary the role of the civil sphere is unfortunately minimal. Those who deal with civil activities as hobbies come from one of the sectors.
The number of experts may seem low for the correct sta-tistical analysis. But the main aim of questionnaires informed the experts, principally those may have vote in the decision of creating of HUB.
The experts were asked in two turns regarding two major topics when compiling the questionnaire:
• on the HUB in general• from the point of view of HUB Debrecen15 to 30 questions were asked in the two topics. The table 1
shows the distribution of the questions in the two turns.
3. Result and discussion
3.1. Experiences with the Delphi
• Delphi was capable of proving my research in this way it may be an appropriate tool for the examination of a thing being realized in the future.
• It is not an easy method, it is used quite rarely.
Table 1. Distribution of the Delphi survey questions in the two turns
On the HUB in general From the point of view of HUB Debrecen
I wished to reveal the knowledge and opinions of the experts relating to the topic in this question group as well as to draw attention to my research topic. I looked for the answer such questions, for example: What does HUB mean for them? How do they interpret it?What influencing factors do they consider important when creating a HUB?Do they accept the formed opinions?Do they agree with the rules set by the HUB Network?
My questions focused on Debrecen to reveal the views of the experts about the conditions set by the Network, to discover the fact whether the HUB may be realized or not and to examine to what extent the HUB drew their attention.Would you create a HUB if you had possibilities?Would you join the community if it was founded?Does the creation have any dangers?What expectations should the founders and users meet?For what sector would you make the HUB open?
Source: own survey, 2013
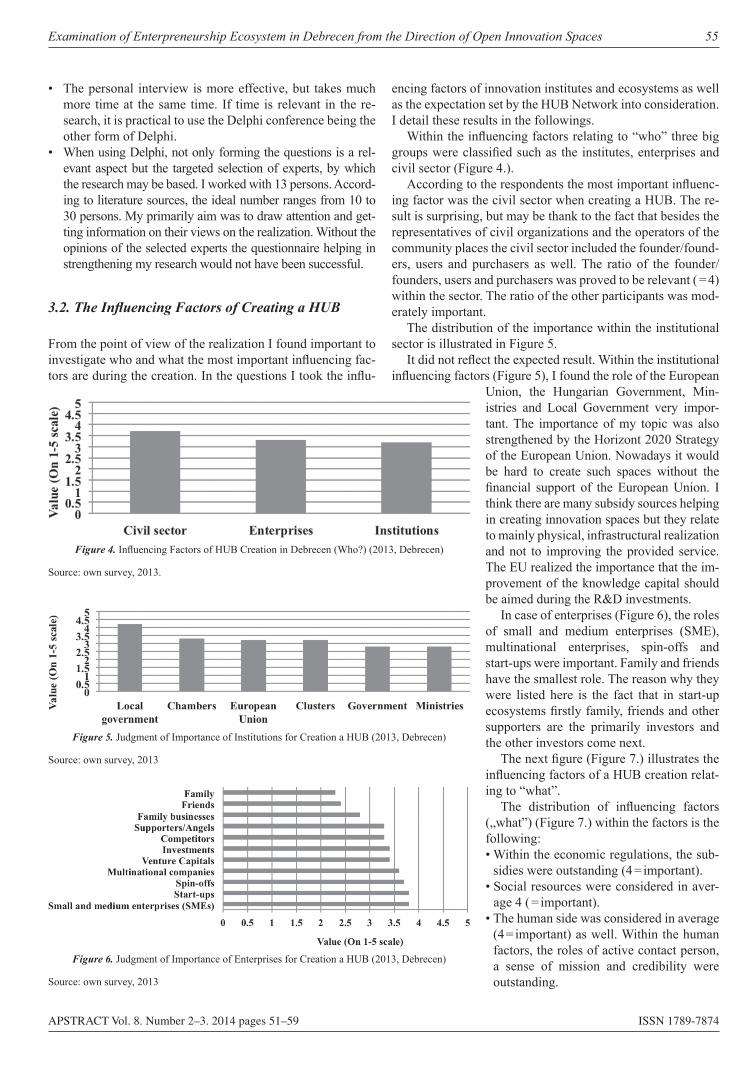
Examination of Enterpreneurship Ecosystem in Debrecen from the Direction of Open Innovation Spaces 55
APSTRACT Vol. 8. Number 2–3. 2014 pages 51–59 ISSN 1789-7874
• The personal interview is more effective, but takes much more time at the same time. If time is relevant in the re-search, it is practical to use the Delphi conference being the other form of Delphi.
• When using Delphi, not only forming the questions is a rel-evant aspect but the targeted selection of experts, by which the research may be based. I worked with 13 persons. Accord-ing to literature sources, the ideal number ranges from 10 to 30 persons. My primarily aim was to draw attention and get-ting information on their views on the realization. Without the opinions of the selected experts the questionnaire helping in strengthening my research would not have been successful.
3.2. The Influencing Factors of Creating a HUB
From the point of view of the realization I found important to investigate who and what the most important influencing fac-tors are during the creation. In the questions I took the influ-
encing factors of innovation institutes and ecosystems as well as the expectation set by the HUB Network into consideration. I detail these results in the followings.
Within the influencing factors relating to “who” three big groups were classified such as the institutes, enterprises and civil sector (Figure 4.).
According to the respondents the most important influenc-ing factor was the civil sector when creating a HUB. The re-sult is surprising, but may be thank to the fact that besides the representatives of civil organizations and the operators of the community places the civil sector included the founder/found-ers, users and purchasers as well. The ratio of the founder/founders, users and purchasers was proved to be relevant ( = 4) within the sector. The ratio of the other participants was mod-erately important.
The distribution of the importance within the institutional sector is illustrated in Figure 5.
It did not reflect the expected result. Within the institutional influencing factors (Figure 5), I found the role of the European
Union, the Hungarian Government, Min-istries and Local Government very impor-tant. The importance of my topic was also strengthened by the Horizont 2020 Strategy of the European Union. Nowadays it would be hard to create such spaces without the financial support of the European Union. I think there are many subsidy sources helping in creating innovation spaces but they relate to mainly physical, infrastructural realization and not to improving the provided service. The EU realized the importance that the im-provement of the knowledge capital should be aimed during the R&D investments.
In case of enterprises (Figure 6), the roles of small and medium enterprises (SME), multinational enterprises, spin-offs and start-ups were important. Family and friends have the smallest role. The reason why they were listed here is the fact that in start-up ecosystems firstly family, friends and other supporters are the primarily investors and the other investors come next.
The next figure (Figure 7.) illustrates the influencing factors of a HUB creation relat-ing to “what”.
The distribution of influencing factors („what”) (Figure 7.) within the factors is the following:• Within the economic regulations, the sub-
sidies were outstanding (4 = important).• Social resources were considered in aver-
age 4 ( = important).• The human side was considered in average
(4 = important) as well. Within the human factors, the roles of active contact person, a sense of mission and credibility were outstanding.
Figure 4. Influencing Factors of HUB Creation in Debrecen (Who?) (2013, Debrecen)
Source: own survey, 2013.
Figure 5. Judgment of Importance of Institutions for Creation a HUB (2013, Debrecen)
Source: own survey, 2013
Figure 6. Judgment of Importance of Enterprises for Creation a HUB (2013, Debrecen)
Source: own survey, 2013
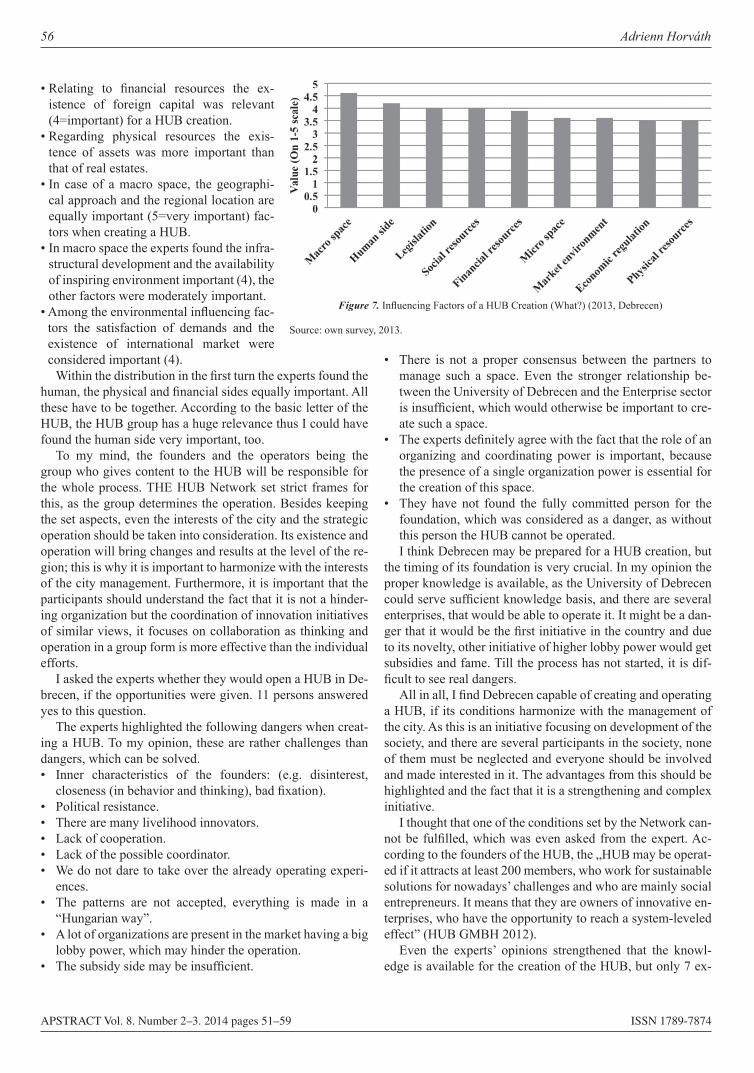
56 Adrienn Horváth
APSTRACT Vol. 8. Number 2–3. 2014 pages 51–59 ISSN 1789-7874
• Relating to financial resources the ex-istence of foreign capital was relevant (4=important) for a HUB creation.
• Regarding physical resources the exis-tence of assets was more important than that of real estates.
• In case of a macro space, the geographi-cal approach and the regional location are equally important (5=very important) fac-tors when creating a HUB.
• In macro space the experts found the infra-structural development and the availability of inspiring environment important (4), the other factors were moderately important.
• Among the environmental influencing fac-tors the satisfaction of demands and the existence of international market were considered important (4).
Within the distribution in the first turn the experts found the human, the physical and financial sides equally important. All these have to be together. According to the basic letter of the HUB, the HUB group has a huge relevance thus I could have found the human side very important, too.
To my mind, the founders and the operators being the group who gives content to the HUB will be responsible for the whole process. THE HUB Network set strict frames for this, as the group determines the operation. Besides keeping the set aspects, even the interests of the city and the strategic operation should be taken into consideration. Its existence and operation will bring changes and results at the level of the re-gion; this is why it is important to harmonize with the interests of the city management. Furthermore, it is important that the participants should understand the fact that it is not a hinder-ing organization but the coordination of innovation initiatives of similar views, it focuses on collaboration as thinking and operation in a group form is more effective than the individual efforts.
I asked the experts whether they would open a HUB in De-brecen, if the opportunities were given. 11 persons answered yes to this question.
The experts highlighted the following dangers when creat-ing a HUB. To my opinion, these are rather challenges than dangers, which can be solved.• Inner characteristics of the founders: (e.g. disinterest,
closeness (in behavior and thinking), bad fixation).• Political resistance.• There are many livelihood innovators.• Lack of cooperation.• Lack of the possible coordinator.• We do not dare to take over the already operating experi-
ences.• The patterns are not accepted, everything is made in a
“Hungarian way”.• A lot of organizations are present in the market having a big
lobby power, which may hinder the operation.• The subsidy side may be insufficient.
• There is not a proper consensus between the partners to manage such a space. Even the stronger relationship be-tween the University of Debrecen and the Enterprise sector is insufficient, which would otherwise be important to cre-ate such a space.
• The experts definitely agree with the fact that the role of an organizing and coordinating power is important, because the presence of a single organization power is essential for the creation of this space.
• They have not found the fully committed person for the foundation, which was considered as a danger, as without this person the HUB cannot be operated.I think Debrecen may be prepared for a HUB creation, but
the timing of its foundation is very crucial. In my opinion the proper knowledge is available, as the University of Debrecen could serve sufficient knowledge basis, and there are several enterprises, that would be able to operate it. It might be a dan-ger that it would be the first initiative in the country and due to its novelty, other initiative of higher lobby power would get subsidies and fame. Till the process has not started, it is dif-ficult to see real dangers.
All in all, I find Debrecen capable of creating and operating a HUB, if its conditions harmonize with the management of the city. As this is an initiative focusing on development of the society, and there are several participants in the society, none of them must be neglected and everyone should be involved and made interested in it. The advantages from this should be highlighted and the fact that it is a strengthening and complex initiative.
I thought that one of the conditions set by the Network can-not be fulfilled, which was even asked from the expert. Ac-cording to the founders of the HUB, the „HUB may be operat-ed if it attracts at least 200 members, who work for sustainable solutions for nowadays’ challenges and who are mainly social entrepreneurs. It means that they are owners of innovative en-terprises, who have the opportunity to reach a system-leveled effect” (HUB GMBH 2012).
Even the experts’ opinions strengthened that the knowl-edge is available for the creation of the HUB, but only 7 ex-
Figure 7. Influencing Factors of a HUB Creation (What?) (2013, Debrecen)
Source: own survey, 2013.
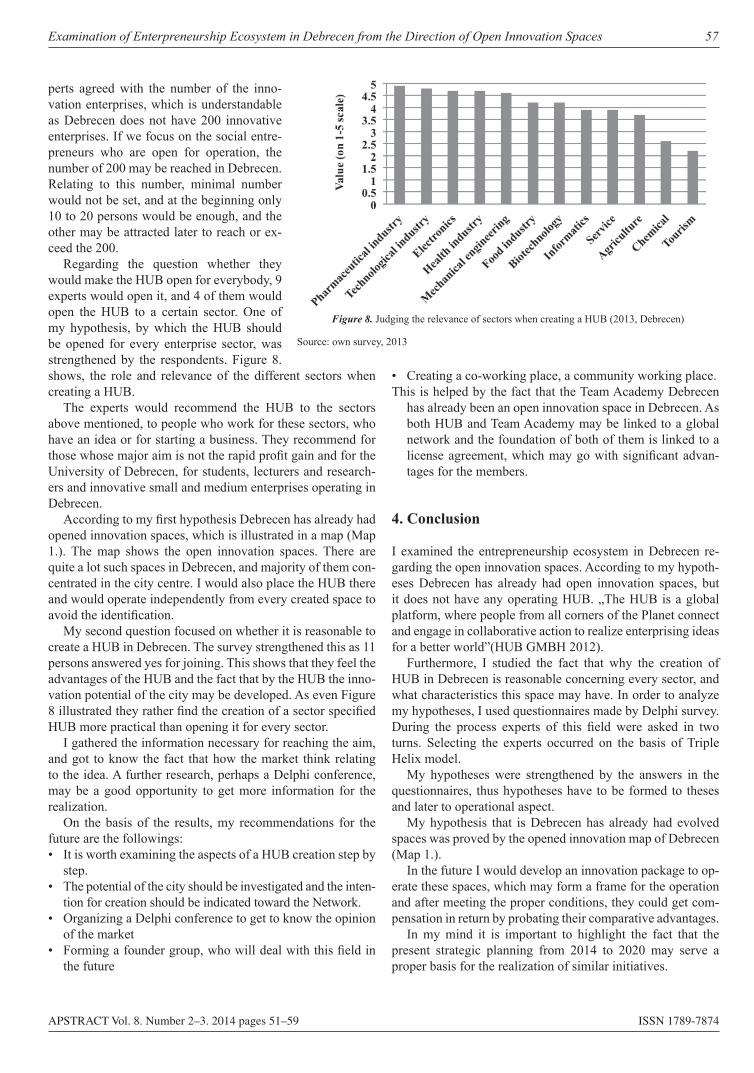
Examination of Enterpreneurship Ecosystem in Debrecen from the Direction of Open Innovation Spaces 57
APSTRACT Vol. 8. Number 2–3. 2014 pages 51–59 ISSN 1789-7874
perts agreed with the number of the inno-vation enterprises, which is understandable as Debrecen does not have 200 innovative enterprises. If we focus on the social entre-preneurs who are open for operation, the number of 200 may be reached in Debrecen. Relating to this number, minimal number would not be set, and at the beginning only 10 to 20 persons would be enough, and the other may be attracted later to reach or ex-ceed the 200.
Regarding the question whether they would make the HUB open for everybody, 9 experts would open it, and 4 of them would open the HUB to a certain sector. One of my hypothesis, by which the HUB should be opened for every enterprise sector, was strengthened by the respondents. Figure 8. shows, the role and relevance of the different sectors when creating a HUB.
The experts would recommend the HUB to the sectors above mentioned, to people who work for these sectors, who have an idea or for starting a business. They recommend for those whose major aim is not the rapid profit gain and for the University of Debrecen, for students, lecturers and research-ers and innovative small and medium enterprises operating in Debrecen.
According to my first hypothesis Debrecen has already had opened innovation spaces, which is illustrated in a map (Map 1.). The map shows the open innovation spaces. There are quite a lot such spaces in Debrecen, and majority of them con-centrated in the city centre. I would also place the HUB there and would operate independently from every created space to avoid the identification.
My second question focused on whether it is reasonable to create a HUB in Debrecen. The survey strengthened this as 11 persons answered yes for joining. This shows that they feel the advantages of the HUB and the fact that by the HUB the inno-vation potential of the city may be developed. As even Figure 8 illustrated they rather find the creation of a sector specified HUB more practical than opening it for every sector.
I gathered the information necessary for reaching the aim, and got to know the fact that how the market think relating to the idea. A further research, perhaps a Delphi conference, may be a good opportunity to get more information for the realization.
On the basis of the results, my recommendations for the future are the followings:• It is worth examining the aspects of a HUB creation step by
step.• The potential of the city should be investigated and the inten-
tion for creation should be indicated toward the Network.• Organizing a Delphi conference to get to know the opinion
of the market• Forming a founder group, who will deal with this field in
the future
• Creating a co-working place, a community working place.This is helped by the fact that the Team Academy Debrecen
has already been an open innovation space in Debrecen. As both HUB and Team Academy may be linked to a global network and the foundation of both of them is linked to a license agreement, which may go with significant advan-tages for the members.
4. Conclusion
I examined the entrepreneurship ecosystem in Debrecen re-garding the open innovation spaces. According to my hypoth-eses Debrecen has already had open innovation spaces, but it does not have any operating HUB. „The HUB is a global platform, where people from all corners of the Planet connect and engage in collaborative action to realize enterprising ideas for a better world”(HUB GMBH 2012).
Furthermore, I studied the fact that why the creation of HUB in Debrecen is reasonable concerning every sector, and what characteristics this space may have. In order to analyze my hypotheses, I used questionnaires made by Delphi survey. During the process experts of this field were asked in two turns. Selecting the experts occurred on the basis of Triple Helix model.
My hypotheses were strengthened by the answers in the questionnaires, thus hypotheses have to be formed to theses and later to operational aspect.
My hypothesis that is Debrecen has already had evolved spaces was proved by the opened innovation map of Debrecen (Map 1.).
In the future I would develop an innovation package to op-erate these spaces, which may form a frame for the operation and after meeting the proper conditions, they could get com-pensation in return by probating their comparative advantages.
In my mind it is important to highlight the fact that the present strategic planning from 2014 to 2020 may serve a proper basis for the realization of similar initiatives.
Figure 8. Judging the relevance of sectors when creating a HUB (2013, Debrecen)
Source: own survey, 2013
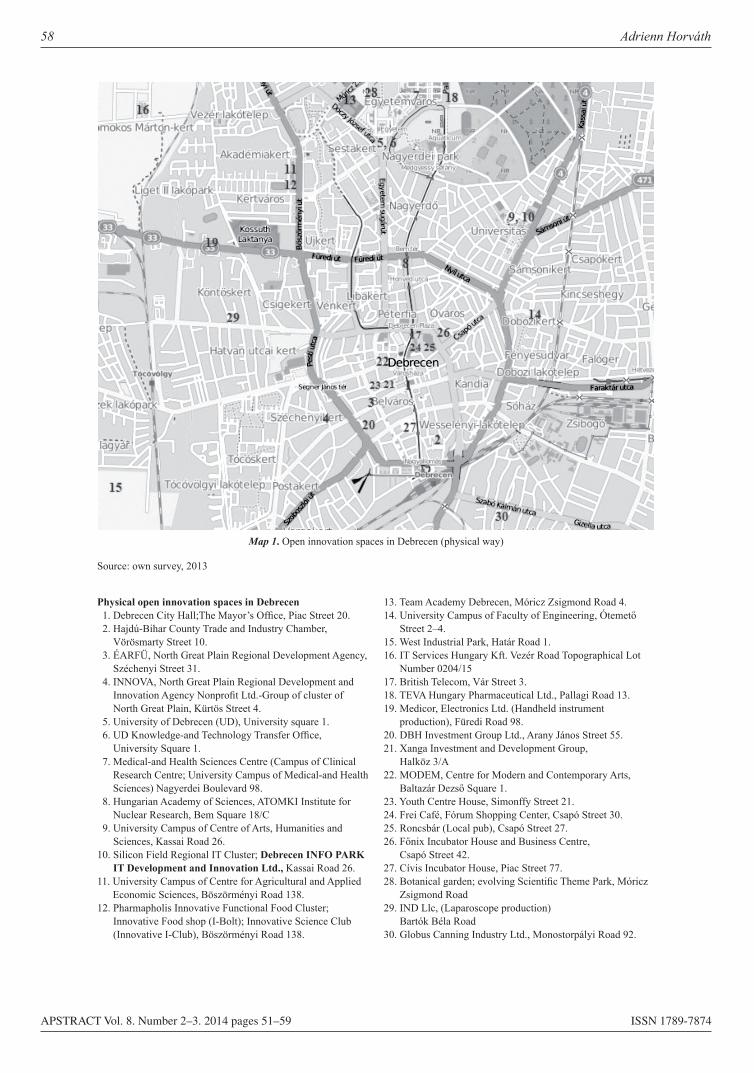
58 Adrienn Horváth
APSTRACT Vol. 8. Number 2–3. 2014 pages 51–59 ISSN 1789-7874
Physical open innovation spaces in Debrecen 1. Debrecen City Hall;The Mayor’s Office, Piac Street 20. 2. Hajdú-Bihar County Trade and Industry Chamber,
Vörösmarty Street 10. 3. ÉARFÜ, North Great Plain Regional Development Agency,
Széchenyi Street 31. 4. INNOVA, North Great Plain Regional Development and
Innovation Agency Nonprofit Ltd.-Group of cluster of North Great Plain, Kürtös Street 4.
5. University of Debrecen (UD), University square 1. 6. UD Knowledge-and Technology Transfer Office,
University Square 1. 7. Medical-and Health Sciences Centre (Campus of Clinical
Research Centre; University Campus of Medical-and Health Sciences) Nagyerdei Boulevard 98.
8. Hungarian Academy of Sciences, ATOMKI Institute for Nuclear Research, Bem Square 18/C
9. University Campus of Centre of Arts, Humanities and Sciences, Kassai Road 26.
10. Silicon Field Regional IT Cluster; Debrecen INFO PARK IT Development and Innovation Ltd., Kassai Road 26.
11. University Campus of Centre for Agricultural and Applied Economic Sciences, Böszörményi Road 138.
12. Pharmapholis Innovative Functional Food Cluster; Innovative Food shop (I-Bolt); Innovative Science Club (Innovative I-Club), Böszörményi Road 138.
13. Team Academy Debrecen, Móricz Zsigmond Road 4.14. University Campus of Faculty of Engineering, Ótemető
Street 2–4.15. West Industrial Park, Határ Road 1.16. IT Services Hungary Kft. Vezér Road Topographical Lot
Number 0204/1517. British Telecom, Vár Street 3.18. TEVA Hungary Pharmaceutical Ltd., Pallagi Road 13.19. Medicor, Electronics Ltd. (Handheld instrument
production), Füredi Road 98.20. DBH Investment Group Ltd., Arany János Street 55.21. Xanga Investment and Development Group,
Halköz 3/A22. MODEM, Centre for Modern and Contemporary Arts,
Baltazár Dezső Square 1.23. Youth Centre House, Simonffy Street 21.24. Frei Café, Fórum Shopping Center, Csapó Street 30.25. Roncsbár (Local pub), Csapó Street 27.26. Főnix Incubator House and Business Centre,
Csapó Street 42.27. Cívis Incubator House, Piac Street 77.28. Botanical garden; evolving Scientific Theme Park, Móricz
Zsigmond Road29. IND Llc, (Laparoscope production)
Bartók Béla Road30. Globus Canning Industry Ltd., Monostorpályi Road 92.
Map 1. Open innovation spaces in Debrecen (physical way)
Source: own survey, 2013
Examination of Enterpreneurship Ecosystem in Debrecen from the Direction of Open Innovation Spaces 59
APSTRACT Vol. 8. Number 2–3. 2014 pages 51–59 ISSN 1789-7874
References
HUB GMBH: 2012. Invitation Booklet. Available: http://www.impacthub.net
Pakurár M, Oláh J, Kovács D, Katonáné Kovács J & Szabó A (2010): New Sources of Employment to Promote the Wealth Gener-ating Capacity of Rural Communities. EU Framework 7 project No. 211605, Deliverable 5.1.1., 77. p.
Pakucs J & Papanek G (2006): Innováció menedzsment kézikönyv. (Innovation-management Handbook). Magyar Innovációs Szövetség. Budapest
TACTICS: 2012. Cluster Internationalisation Handbook. Available: http://www.reglab.se/klusterutveckling/wp-content/uploads/2012/03 /Cluster-Internationalization-handbook-the-printed-version.pdf
Ministry for National Economy: 2013. Investment in Future. National Research and Development and Innovation Strategy. Available: http://www.nih.gov.hu/strategy/national-rdi-strategy/hungarian-rdi-strategy
OECD Background Report: 2007. National system of innovation in Hungary. Available: http://www.nih.gov.hu/nemzetkozi-tevekenyseg/oecd/oecd-background-report
Molnár I & Németh G (2009): Egyetemi szellemi tulajdon-védelem és ipari kapcsolatok a nyílt innovációs közegben: Open Access vagy monopoljogok? (Academic intellectual property-protection and industrial connection in open innovation spaces: Open Access or
monopoly rights?). Iparjogvédelmi és Szerzői Jogi Szemle, Bu da-pest. 4. 114. évfolyam. 5. számOláh J & Hutóczki R (2012): A Debreceni Egyetem emberi erőforrás tanácsadó szakán végzett hallgatók pályakezdők munkaerő piaci esélyei Magyarországon. (Labour market possibility in Debrecen of graduator in University of Debrecen on major of Human Resource Counselling). Közgazdász Fórum Romániai Magyar Közgazdász Társaság – Babes Bólyai Tudományegyetem Közgazdaság- és Gaz-dál ko dás tu do má nyi Kar közös szakmai közlönye XV. évf. 107. sz. 2012/4 27-40.p12 MANAGE: 2013. Success Factors of Economic Clusters. Avail-able: http://www.12manage.com/forum.asp?TB=porter_diamond_model&S=61Etzkowitz H (2002): The Triple Helix of University-Industry-Gov-ernment Implications for Policy and Evaluation. Available: http://www.sister.nu/pdf/wp_11.pdfIMPACT HUB Global Network: 2012. Available: http://www.impacthub.net/Klerkx L, Mierlo Van B & Leeuwis C (2012): Evolution of systems approaches to agricultural innovation: concepts, analysis and inter-ventions. Available: http://www.academia.edu/1569316/Evolution_of_systems_approaches_to_agricultural_innovation_Concepts_analysis_and_interventionsTuroff M & Linstone HA (2002): The Delphi Method: Techniques and Applications. Available: http://is.njit.edu/pubs/delphibook/ch1.html
APSTRACT Vol. 8. Number 2–3. 2014 pages 61–67 ISSN 1789-7874
Introduction
The first youth hostel opened in 1912 in Altena Castle in Ger-many. It was located outside of the city center, had bunk beds, a kitchen and communal areas. The guests were supposed to manage the hostel themselves. They did chores, cleaned, and made their own beds. The first hostels offered free accom-modation in exchange for cleaning and maintenance. Since then, only a few changes have been made to this system. They have moved into the city center, guests are charged a small fee for the usage, but the general look and communal atmosphere is still as it was before. Today, most hostels still have bunk beds, although many of them now offer a private room as well. Guests are also supposed to clean up after themselves, at least in the kitchen or in communal areas. The social atmosphere has become one of the most important aspect of hostels, there-fore many of them organize events which enable guests to meet each other which creates a friendly, cosmopolitan atmo-sphere. (Reulecke & Stambolis 2009)
In recent years, hostels have become one of the most pop-ular accommodation types among youth travelers. Student accommodations and hostels have the highest average guest numbers (Tourism Research and Marketing 2014). According
to Diego Saez-Gil, “Youth travel is one of the fastest grow-ing markets of the tourism industry” (Saez-Gil, 2014) which implies the importance of a significant growth of the hostel industry. In 2002, 50% of the young travelers chose to stay in hostels, increasing to 60% in 2007. Forecasts suggest that 500 million overnights will be booked in hostels annually in 2015, which has increased from 300 million in 2007. (Richards, 2008) Bed occupancy increased from 57% in 2010 to 59% in 2013. (Tourism Research and Marketing 2014)
The New Horizons III Survey reports that the number of beds in hostels has nearly doubled since 2011 (Tourism Re-search and Marketing 2013). In spite of this growth, there are still some misconceptions about what exactly a hostel is. Pres-ent research is inspired to study the conceptions and miscon-ceptions of hostels in eight different countries.
The Psychology of Stereotypes and Misconceptions
There are three guidelines to understand the definition of ste-reotypes: Stereotypes are aids to explanation, Stereotypes are energy-saving devices and Stereotypes are shared group be-
ConCeptions and MisConCeptions of Hostels WorldWide
Réka Somlai
Casa España Hostel, Madrid SpainSzent István Egyetem
Abstract: Present research is inspired to study the conceptions and misconceptions of hostels in eight different countries (Spain, United States, United Kingdom, Germany, Hungary, Venezuela, China, Australia). The outcome of the research reports that the participants in the United States, United Kingdom, Germany and in Hungary define hostels as youth accommodations, Spanish participants as cheap hotels and Venezuelans call them homeless shelters. The majority of the participants of all the above mentioned countries determine that the most important difference between hostels and hotels is the price. Americans, English, Germans, and Hungarians believe that a night would cost between 10 and 30 Euro in an average hostel, while Spaniards and Venezuelans say it would be under 10 Euro. Most respondents agree that hostels are; located in the city center, great places to socialize, offer safe accommodation, staying in there allows guests to save up money, and they are popular choices among travelers. American and English participants think hostels are only for people who like to party. Spaniards and Venezuelans think, hostels are outside of the city center. Spanish and English participants believe that hostels are too cheap to be able to offer a good service. Most participants say, the low price would be the main reason to stay in a hostel. Americans, English and Germans also think that other values are important besides the price: fun, the opportunity to meet people and atmosphere. In spite of all the above, most participants think people would rather stay in a hotel than in a hostel. Stereotypes evolve in different ways, which also explains how misconceptions about hostels developed.
Keywords: conceptions and misconceptions, definition of a hostel, price, shared facilities, dormitory, communal areas
Applied Studies in Agribusiness and Commerce – APSTRACTAgroinform Publishing House, Budapest sCientifiC papers
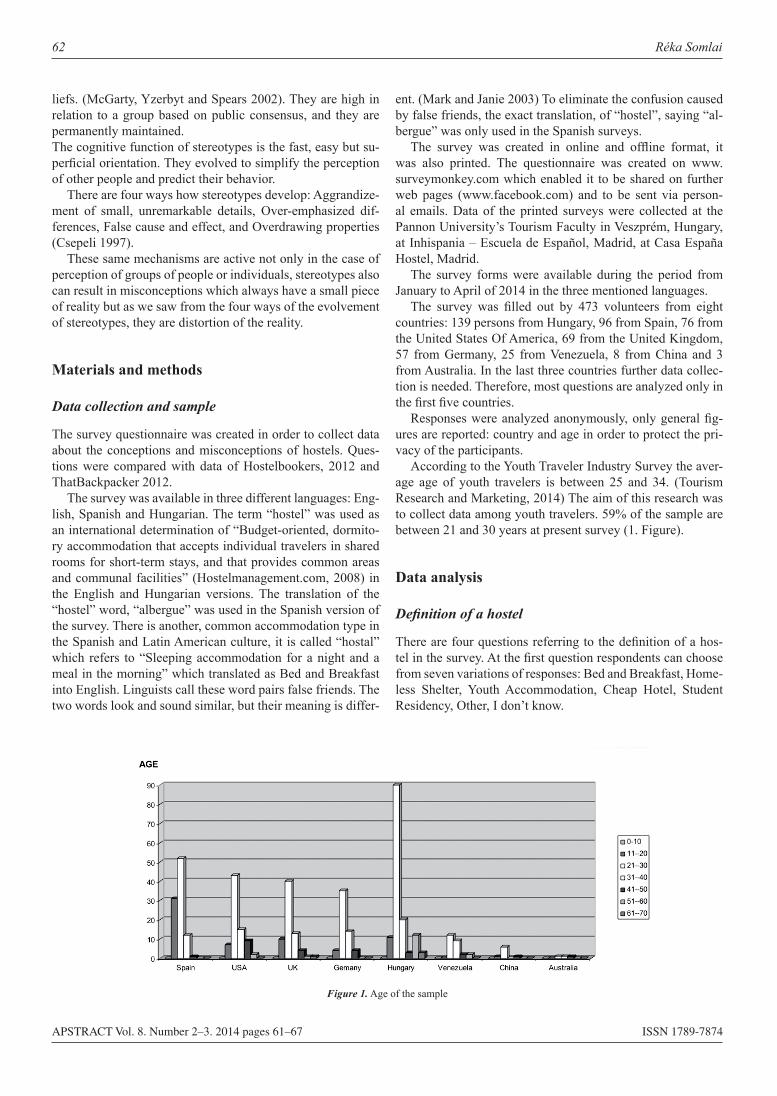
62 Réka Somlai
APSTRACT Vol. 8. Number 2–3. 2014 pages 61–67 ISSN 1789-7874
liefs. (McGarty, Yzerbyt and Spears 2002). They are high in relation to a group based on public consensus, and they are permanently maintained.The cognitive function of stereotypes is the fast, easy but su-perficial orientation. They evolved to simplify the perception of other people and predict their behavior.
There are four ways how stereotypes develop: Aggrandize-ment of small, unremarkable details, Over-emphasized dif-ferences, False cause and effect, and Overdrawing properties (Csepeli 1997).
These same mechanisms are active not only in the case of perception of groups of people or individuals, stereotypes also can result in misconceptions which always have a small piece of reality but as we saw from the four ways of the evolvement of stereotypes, they are distortion of the reality.
Materials and methods
Data collection and sample
The survey questionnaire was created in order to collect data about the conceptions and misconceptions of hostels. Ques-tions were compared with data of Hostelbookers, 2012 and ThatBackpacker 2012.
The survey was available in three different languages: Eng-lish, Spanish and Hungarian. The term “hostel” was used as an international determination of “Budget-oriented, dormito-ry accommodation that accepts individual travelers in shared rooms for short-term stays, and that provides common areas and communal facilities” (Hostelmanagement.com, 2008) in the English and Hungarian versions. The translation of the “hostel” word, “albergue” was used in the Spanish version of the survey. There is another, common accommodation type in the Spanish and Latin American culture, it is called “hostal” which refers to “Sleeping accommodation for a night and a meal in the morning” which translated as Bed and Breakfast into English. Linguists call these word pairs false friends. The two words look and sound similar, but their meaning is differ-
ent. (Mark and Janie 2003) To eliminate the confusion caused by false friends, the exact translation, of “hostel”, saying “al-bergue” was only used in the Spanish surveys.
The survey was created in online and offline format, it was also printed. The questionnaire was created on www.surveymonkey.com which enabled it to be shared on further web pages (www.facebook.com) and to be sent via person-al emails. Data of the printed surveys were collected at the Pannon University’s Tourism Faculty in Veszprém, Hungary, at Inhispania – Escuela de Español, Madrid, at Casa España Hostel, Madrid.
The survey forms were available during the period from January to April of 2014 in the three mentioned languages.
The survey was filled out by 473 volunteers from eight countries: 139 persons from Hungary, 96 from Spain, 76 from the United States Of America, 69 from the United Kingdom, 57 from Germany, 25 from Venezuela, 8 from China and 3 from Australia. In the last three countries further data collec-tion is needed. Therefore, most questions are analyzed only in the first five countries.
Responses were analyzed anonymously, only general fig-ures are reported: country and age in order to protect the pri-vacy of the participants.
According to the Youth Traveler Industry Survey the aver-age age of youth travelers is between 25 and 34. (Tourism Research and Marketing, 2014) The aim of this research was to collect data among youth travelers. 59% of the sample are between 21 and 30 years at present survey (1. Figure).
Data analysis
Definition of a hostel
There are four questions referring to the definition of a hos-tel in the survey. At the first question respondents can choose from seven variations of responses: Bed and Breakfast, Home-less Shelter, Youth Accommodation, Cheap Hotel, Student Residency, Other, I don’t know.
Figure 1. Age of the sample
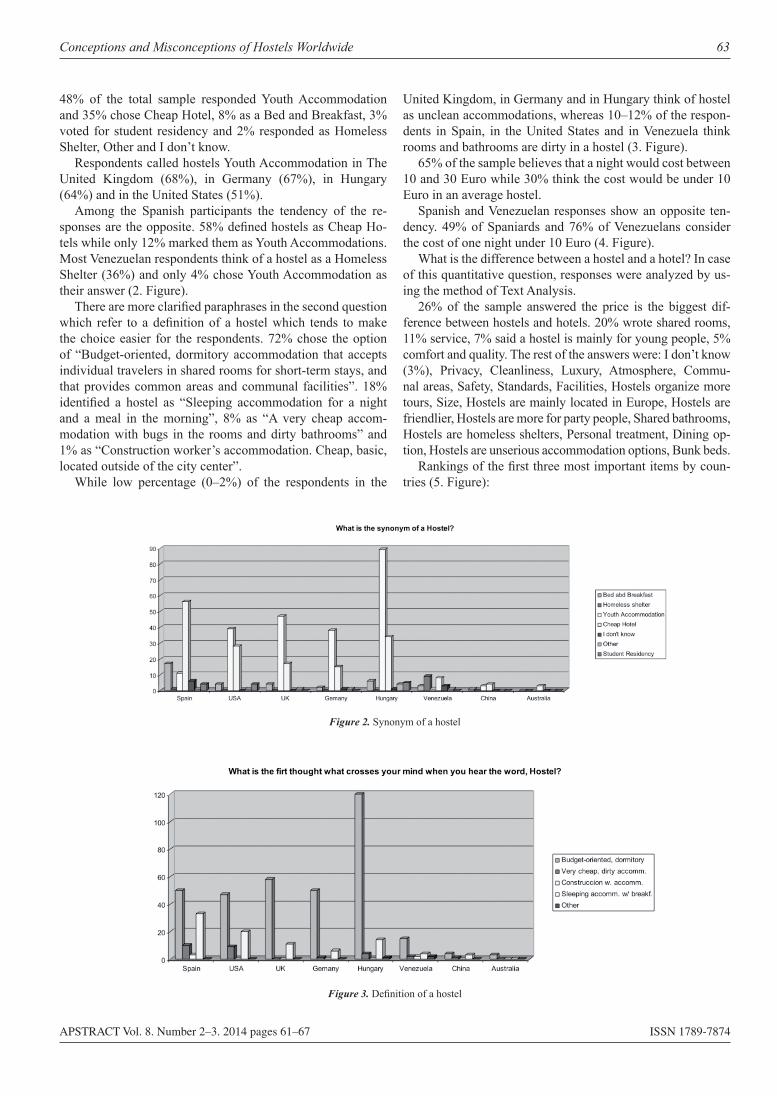
Conceptions and Misconceptions of Hostels Worldwide 63
APSTRACT Vol. 8. Number 2–3. 2014 pages 61–67 ISSN 1789-7874
48% of the total sample responded Youth Accommodation and 35% chose Cheap Hotel, 8% as a Bed and Breakfast, 3% voted for student residency and 2% responded as Homeless Shelter, Other and I don’t know.
Respondents called hostels Youth Accommodation in The United Kingdom (68%), in Germany (67%), in Hungary (64%) and in the United States (51%).
Among the Spanish participants the tendency of the re-sponses are the opposite. 58% defined hostels as Cheap Ho-tels while only 12% marked them as Youth Accommodations. Most Venezuelan respondents think of a hostel as a Homeless Shelter (36%) and only 4% chose Youth Accommodation as their answer (2. Figure).
There are more clarified paraphrases in the second question which refer to a definition of a hostel which tends to make the choice easier for the respondents. 72% chose the option of “Budget-oriented, dormitory accommodation that accepts individual travelers in shared rooms for short-term stays, and that provides common areas and communal facilities”. 18% identified a hostel as “Sleeping accommodation for a night and a meal in the morning”, 8% as “A very cheap accom-modation with bugs in the rooms and dirty bathrooms” and 1% as “Construction worker’s accommodation. Cheap, basic, located outside of the city center”.
While low percentage (0–2%) of the respondents in the
United Kingdom, in Germany and in Hungary think of hostel as unclean accommodations, whereas 10–12% of the respon-dents in Spain, in the United States and in Venezuela think rooms and bathrooms are dirty in a hostel (3. Figure).
65% of the sample believes that a night would cost between 10 and 30 Euro while 30% think the cost would be under 10 Euro in an average hostel.
Spanish and Venezuelan responses show an opposite ten-dency. 49% of Spaniards and 76% of Venezuelans consider the cost of one night under 10 Euro (4. Figure).
What is the difference between a hostel and a hotel? In case of this quantitative question, responses were analyzed by us-ing the method of Text Analysis.
26% of the sample answered the price is the biggest dif-ference between hostels and hotels. 20% wrote shared rooms, 11% service, 7% said a hostel is mainly for young people, 5% comfort and quality. The rest of the answers were: I don’t know (3%), Privacy, Cleanliness, Luxury, Atmosphere, Commu-nal areas, Safety, Standards, Facilities, Hostels organize more tours, Size, Hostels are mainly located in Europe, Hostels are friendlier, Hostels are more for party people, Shared bathrooms, Hostels are homeless shelters, Personal treatment, Dining op-tion, Hostels are unserious accommodation options, Bunk beds.
Rankings of the first three most important items by coun-tries (5. Figure):
Figure 2. Synonym of a hostel
Figure 3. Definition of a hostel
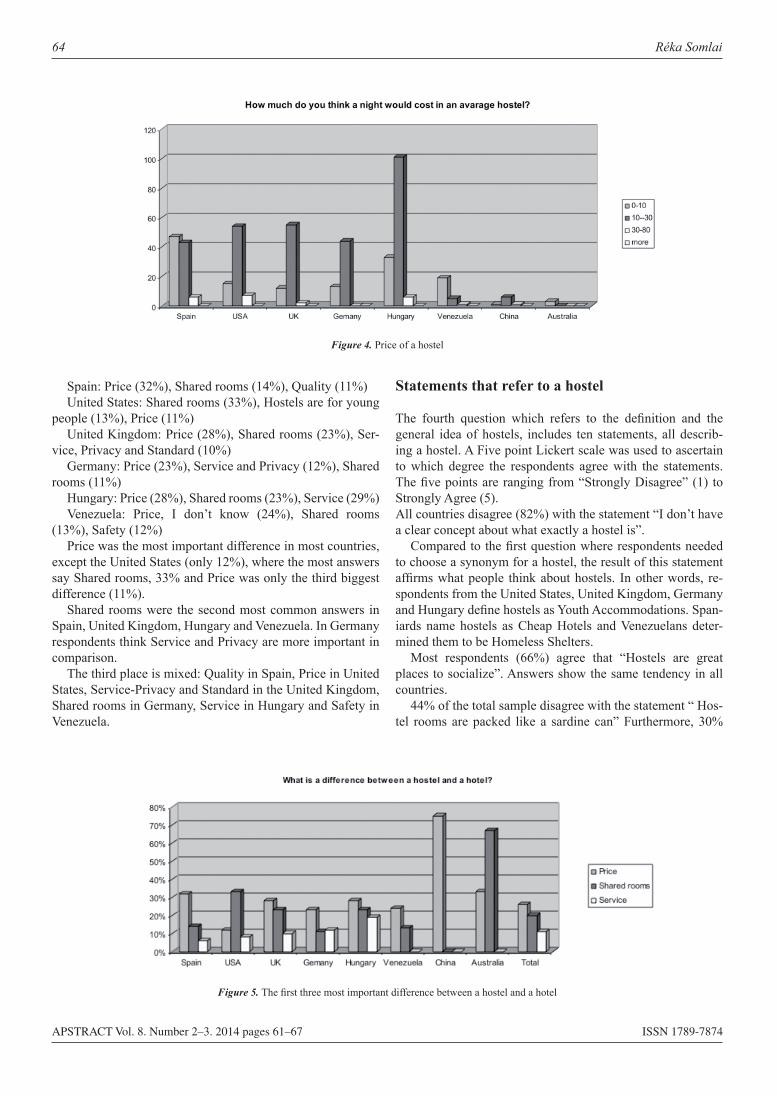
64 Réka Somlai
APSTRACT Vol. 8. Number 2–3. 2014 pages 61–67 ISSN 1789-7874
Spain: Price (32%), Shared rooms (14%), Quality (11%)United States: Shared rooms (33%), Hostels are for young
people (13%), Price (11%)United Kingdom: Price (28%), Shared rooms (23%), Ser-
vice, Privacy and Standard (10%)Germany: Price (23%), Service and Privacy (12%), Shared
rooms (11%)Hungary: Price (28%), Shared rooms (23%), Service (29%)Venezuela: Price, I don’t know (24%), Shared rooms
(13%), Safety (12%)Price was the most important difference in most countries,
except the United States (only 12%), where the most answers say Shared rooms, 33% and Price was only the third biggest difference (11%).
Shared rooms were the second most common answers in Spain, United Kingdom, Hungary and Venezuela. In Germany respondents think Service and Privacy are more important in comparison.
The third place is mixed: Quality in Spain, Price in United States, Service-Privacy and Standard in the United Kingdom, Shared rooms in Germany, Service in Hungary and Safety in Venezuela.
Statements that refer to a hostel
The fourth question which refers to the definition and the general idea of hostels, includes ten statements, all describ-ing a hostel. A Five point Lickert scale was used to ascertain to which degree the respondents agree with the statements. The five points are ranging from “Strongly Disagree” (1) to Strongly Agree (5).All countries disagree (82%) with the statement “I don’t have a clear concept about what exactly a hostel is”.
Compared to the first question where respondents needed to choose a synonym for a hostel, the result of this statement affirms what people think about hostels. In other words, re-spondents from the United States, United Kingdom, Germany and Hungary define hostels as Youth Accommodations. Span-iards name hostels as Cheap Hotels and Venezuelans deter-mined them to be Homeless Shelters.
Most respondents (66%) agree that “Hostels are great places to socialize”. Answers show the same tendency in all countries.
44% of the total sample disagree with the statement “ Hos-tel rooms are packed like a sardine can” Furthermore, 30%
Figure 4. Price of a hostel
Figure 5. The first three most important difference between a hostel and a hotel
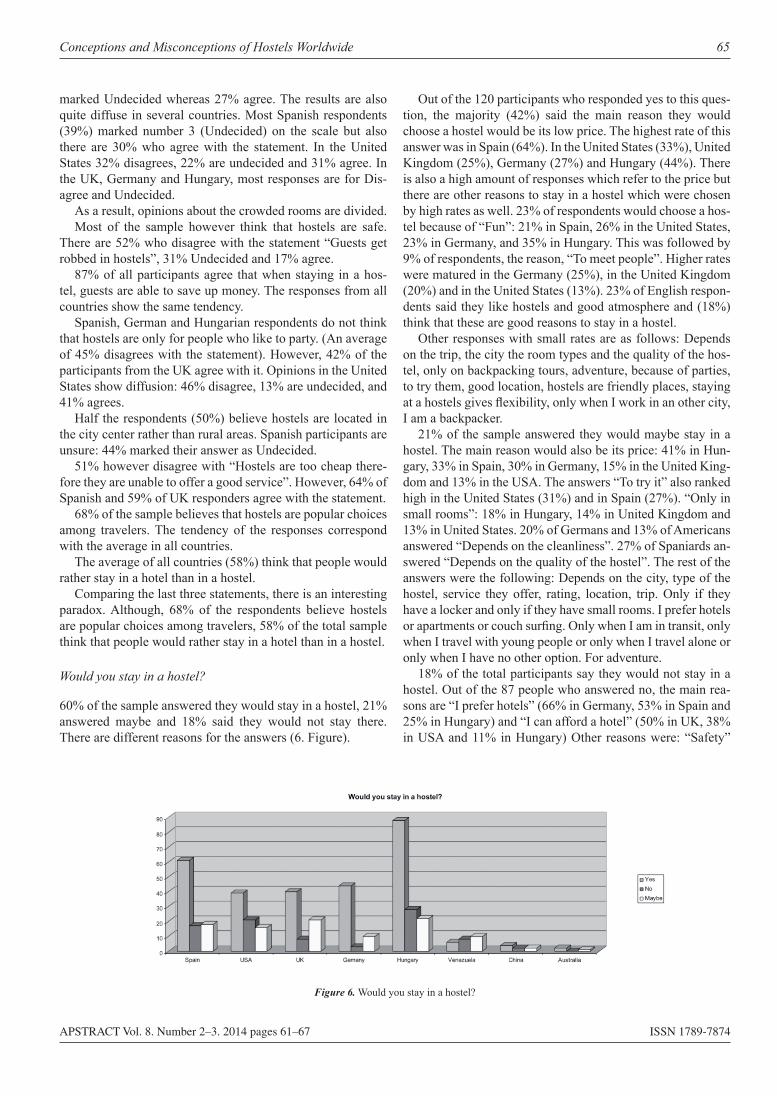
Conceptions and Misconceptions of Hostels Worldwide 65
APSTRACT Vol. 8. Number 2–3. 2014 pages 61–67 ISSN 1789-7874
marked Undecided whereas 27% agree. The results are also quite diffuse in several countries. Most Spanish respondents (39%) marked number 3 (Undecided) on the scale but also there are 30% who agree with the statement. In the United States 32% disagrees, 22% are undecided and 31% agree. In the UK, Germany and Hungary, most responses are for Dis-agree and Undecided.
As a result, opinions about the crowded rooms are divided.Most of the sample however think that hostels are safe.
There are 52% who disagree with the statement “Guests get robbed in hostels”, 31% Undecided and 17% agree.
87% of all participants agree that when staying in a hos-tel, guests are able to save up money. The responses from all countries show the same tendency.
Spanish, German and Hungarian respondents do not think that hostels are only for people who like to party. (An average of 45% disagrees with the statement). However, 42% of the participants from the UK agree with it. Opinions in the United States show diffusion: 46% disagree, 13% are undecided, and 41% agrees.
Half the respondents (50%) believe hostels are located in the city center rather than rural areas. Spanish participants are unsure: 44% marked their answer as Undecided.
51% however disagree with “Hostels are too cheap there-fore they are unable to offer a good service”. However, 64% of Spanish and 59% of UK responders agree with the statement.
68% of the sample believes that hostels are popular choices among travelers. The tendency of the responses correspond with the average in all countries.
The average of all countries (58%) think that people would rather stay in a hotel than in a hostel.
Comparing the last three statements, there is an interesting paradox. Although, 68% of the respondents believe hostels are popular choices among travelers, 58% of the total sample think that people would rather stay in a hotel than in a hostel.
Would you stay in a hostel?
60% of the sample answered they would stay in a hostel, 21% answered maybe and 18% said they would not stay there. There are different reasons for the answers (6. Figure).
Out of the 120 participants who responded yes to this ques-tion, the majority (42%) said the main reason they would choose a hostel would be its low price. The highest rate of this answer was in Spain (64%). In the United States (33%), United Kingdom (25%), Germany (27%) and Hungary (44%). There is also a high amount of responses which refer to the price but there are other reasons to stay in a hostel which were chosen by high rates as well. 23% of respondents would choose a hos-tel because of “Fun”: 21% in Spain, 26% in the United States, 23% in Germany, and 35% in Hungary. This was followed by 9% of respondents, the reason, “To meet people”. Higher rates were matured in the Germany (25%), in the United Kingdom (20%) and in the United States (13%). 23% of English respon-dents said they like hostels and good atmosphere and (18%) think that these are good reasons to stay in a hostel.
Other responses with small rates are as follows: Depends on the trip, the city the room types and the quality of the hos-tel, only on backpacking tours, adventure, because of parties, to try them, good location, hostels are friendly places, staying at a hostels gives flexibility, only when I work in an other city, I am a backpacker.
21% of the sample answered they would maybe stay in a hostel. The main reason would also be its price: 41% in Hun-gary, 33% in Spain, 30% in Germany, 15% in the United King-dom and 13% in the USA. The answers “To try it” also ranked high in the United States (31%) and in Spain (27%). “Only in small rooms”: 18% in Hungary, 14% in United Kingdom and 13% in United States. 20% of Germans and 13% of Americans answered “Depends on the cleanliness”. 27% of Spaniards an-swered “Depends on the quality of the hostel”. The rest of the answers were the following: Depends on the city, type of the hostel, service they offer, rating, location, trip. Only if they have a locker and only if they have small rooms. I prefer hotels or apartments or couch surfing. Only when I am in transit, only when I travel with young people or only when I travel alone or only when I have no other option. For adventure.
18% of the total participants say they would not stay in a hostel. Out of the 87 people who answered no, the main rea-sons are “I prefer hotels” (66% in Germany, 53% in Spain and 25% in Hungary) and “I can afford a hotel” (50% in UK, 38% in USA and 11% in Hungary) Other reasons were: “Safety”
Figure 6. Would you stay in a hostel?
66 Réka Somlai
APSTRACT Vol. 8. Number 2–3. 2014 pages 61–67 ISSN 1789-7874
(25% in UK, 17% in Spain and 14% In USA), “Privacy” (14% in Hungary, 13% in UK, 10% in USA), Cleanliness, quality, I heard bad stories, I don’t know hostels, I don’t like hostels, hostels are uncomfortable, I prefer Couch surfing, I have bad experience, hostels are for homeless people.
The Psychology of Stereotypes and Misconceptions – explanation and examples
Consequently, stereotypes evolve four different ways, which can also explain how misconceptions are developed in rela-tion to hostels. All stereotypes are based on reality, but reality gets deformed by the four mentioned mechanism.
There was no agreement or disagreement if hostel rooms are crowded. The majority of responders marked “Undecid-ed”, which implies uncertainty. The reality of this statement is that there are shared rooms in hostels, the aggrandizement of a detail is that many beds in a room results in crowded rooms. According to the statistical data, hostels tend to create rooms with less beds, also en-suite facilities were presented in two out of three establishments in 2012, which means this misconception will most likely be refuted in the next few years. (The Youth Travel Accommodation Industry Survey, 2014)
As an answer to the question about the difference between a hostel and a hotel, there are many over-emphasized differ-ences: a hostel is cheap, while a hotel is expensive. A hostel is unclean, a hotel is clean. A hostel doesn’t offer any facilities while hotels do. These harsh opposite pairs are the results of over-emphasizing. As a result of the growth of the popularity of hostels, not only are the structure of the rooms changing, also many of them are improving their facilities by opening a bar or a restaurant. In addition, by offering communal facili-ties like rooms, bathrooms, kitchen, they are used more often, therefore they require more regular cleaning, which indicates that hostels are not as unclean accommodations as misconcep-tions of Spanish and English participants mention.
Although, the majority of the participants say that guests do not get robbed in hostels. A great percentage also responded that they would not stay in a hostel because they are unsafe because of the shared rooms. There might be a chance that some items disappear but this can not be blamed on the shared rooms. In fact, most hostels offer a personal locker in shared rooms. This mechanism is the false cause and effect.
It is a fact that there is a higher occurrence of meeting peo-ple who like to party in a hostel, but it does not mean that hos-tels are only for people, who like to party as most American and English responses implicate overdrawing properties.
Conclusions
All in all, there are some differences in how people perceive hostels in the examined countries.The majority of respondents in all countries define hostels as Youth Accommodations except of Spain, where most of re-sponders believe hostels are Cheap Hotels and in Venezuela,
where hostels are identified as Homeless Shelters. The an-swers got affirmed when 82% of the total sample disagreed with the statement “I don’t have a clear concept about what exactly a hostel is”
As it was mentioned, the confusion between the words of “hostel” and “hostal” was eliminated by using only the term “albergue” in the Spanish surveys. Consequently, hostels as the classical accommodation types are still not in mind of Spanish youth travelers.
Most participants think hostels are Budget-oriented accom-modations with shared facilities.
In the United States, United Kingdom, Germany and in Hungary most answers participate that a night would cost be-tween 10 and 30 Euro in an average hostel.
All countries participants said the price is the main differ-ence between a hostel and a hotel.
Although, some responses in the different countries vary from the average. Most respondents rather think “Hostels are for people who like to party” in the United Kingdom and in the United States. These answers get affirmed in the last question, where participants in the same countries re-plied they would choose to stay in a hostel because of the parties.
None the less the average answers describe hostels as great places to stay and they are popular choices among travelers. Furthermore, most respondents would stay in a hostel because of its price. Those who answered, they would not stay in hos-tels, the main reason was also financially based (I can afford better).
By reviewing all answers, responders gave great impor-tance to money: price is the most important difference be-tween hostels and hotels, staying in a hostel gives the oppor-tunity to save up money.
In summary, the outcome of present research points out some misconceptions about hostels, which implies the need for more publicity, marketing and advertisement in the sec-tor of Youth Travel. Comparing the misconceptions with the result of the latest statistical reports, there is a tendency of growth and development in the youth travel sector which can result in the disappearance of the misconceptions in the fol-lowing few years.
References
Csepeli Gy (1997): Szociálpszichológia. Osiris, Bu da pest.McGarty C, Yzerbyt VY and Spears R (2002): Stereotypes as Explanations.The formation of meaningful beliefs about social groups. Cam bridge University Press, Cambridge.http://catdir.loc.gov/catdir/samples/cam033/2002073438.pdf (20. April 2014)Saez-Gil D (2014): 10 things you might not know about the youth travel market WYSE Travel Confederation, 25. February 2014.http://wysetc.org/2014/02/25/10-things-you-might-not-know-about-the-youth-travel-market/ (20. April 2014)
Conceptions and Misconceptions of Hostels Worldwide 67
APSTRACT Vol. 8. Number 2–3. 2014 pages 61–67 ISSN 1789-7874
“Hostel managers discuss definition of the word hostel” (2008). HostelManagement.com. p. 12. http://www.hostelmanagement.com/forums/definition-of-hostel.html (20. April 2014)Richards G (2011): The Youth Travel Accommodation Industry Survey. Executive Summary Volume 5. STAY WYSE Associationhttp://wysetc.files.wordpress.com/2014/01/yta-industry-survey-vol5-executive-summary.pdf (20. April 2014)Reulecke J & Stambolis B (2009): 100 Jahre Jugendherber-gen 1909–2009 : Anfänge, Wandlungen, Rück- und Ausblicke. History of hostels. Klartext, Essen.Aronoff M & Rees-Miller J (2003): Language Arts & Disciplines. 2nd rev ed. London: Oxford.Tourism Research and Marketing (2013): Executive Summary – Youth Travel Accommodation Usage Report.
Based on the findings on New Horizons III Survey. STAY WYSE: Australiah t t p : / / w y s e t c . f i l e s . w o r d p r e s s . c o m / 2 0 1 3 / 1 2 /newhorizonsacommodation-execsumm-v1.pdf (20. April 2014)Tourism Research and Marketing (2014): The Youth Travel Accommodation Industry Survey. Executive Summary. Volume 7. STAY WYSE Associationhttp://staywysetest.files.wordpress.com/2014/04/7th-youth-travel-accommodation-industry-survey-executive-summary.pdf (20. April 2014)UNWTO/WYSE Travel Confederation (2008): Youth Travel Matters: Understanding the Global Phenomenon of Youth Travel. UNWTO: Madrid http://issuu.com/ldaly/docs/youth_travel_matters_report# (20. April 2014)
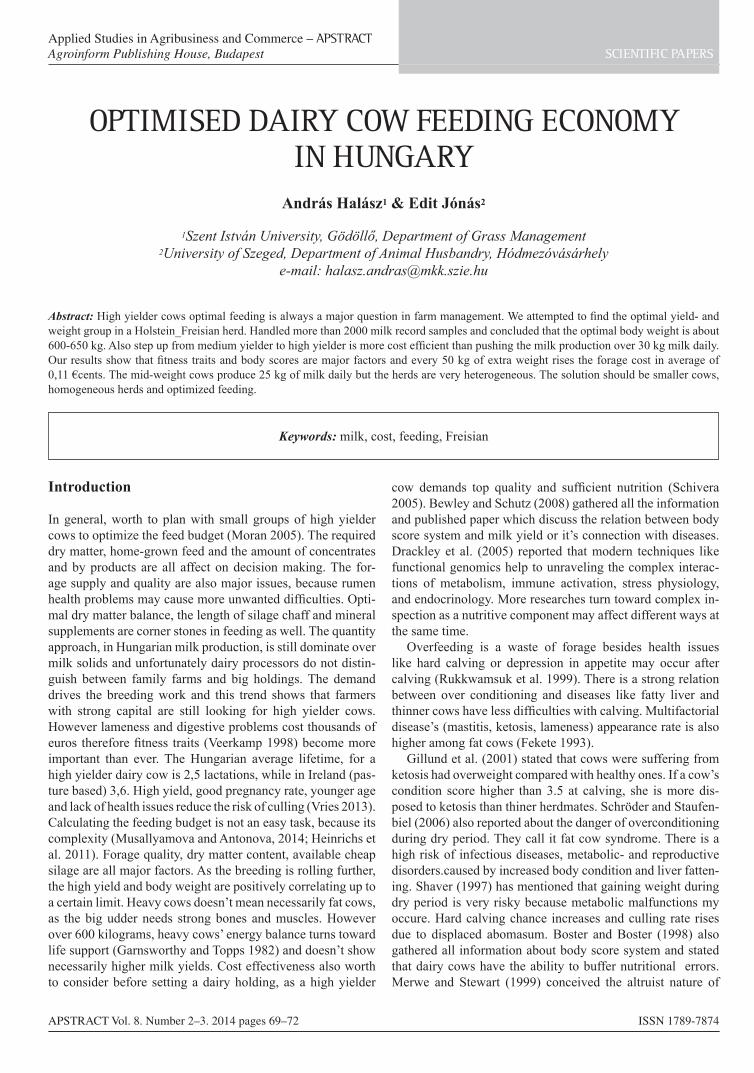
APSTRACT Vol. 8. Number 2–3. 2014 pages 69–72 ISSN 1789-7874
Introduction
In general, worth to plan with small groups of high yielder cows to optimize the feed budget (Moran 2005). The required dry matter, home-grown feed and the amount of concentrates and by products are all affect on decision making. The for-age supply and quality are also major issues, because rumen health problems may cause more unwanted difficulties. Opti-mal dry matter balance, the length of silage chaff and mineral supplements are corner stones in feeding as well. The quantity approach, in Hungarian milk production, is still dominate over milk solids and unfortunately dairy processors do not distin-guish between family farms and big holdings. The demand drives the breeding work and this trend shows that farmers with strong capital are still looking for high yielder cows. However lameness and digestive problems cost thousands of euros therefore fitness traits (Veerkamp 1998) become more important than ever. The Hungarian average lifetime, for a high yielder dairy cow is 2,5 lactations, while in Ireland (pas-ture based) 3,6. High yield, good pregnancy rate, younger age and lack of health issues reduce the risk of culling (Vries 2013). Calculating the feeding budget is not an easy task, because its complexity (Musallyamova and Antonova, 2014; Heinrichs et al. 2011). Forage quality, dry matter content, available cheap silage are all major factors. As the breeding is rolling further, the high yield and body weight are positively correlating up to a certain limit. Heavy cows doesn’t mean necessarily fat cows, as the big udder needs strong bones and muscles. However over 600 kilograms, heavy cows’ energy balance turns toward life support (Garnsworthy and Topps 1982) and doesn’t show necessarily higher milk yields. Cost effectiveness also worth to consider before setting a dairy holding, as a high yielder
cow demands top quality and sufficient nutrition (Schivera 2005). Bewley and Schutz (2008) gathered all the information and published paper which discuss the relation between body score system and milk yield or it’s connection with diseases. Drackley et al. (2005) reported that modern techniques like functional genomics help to unraveling the complex interac-tions of metabolism, immune activation, stress physiology, and endocrinology. More researches turn toward complex in-spection as a nutritive component may affect different ways at the same time.
Overfeeding is a waste of forage besides health issues like hard calving or depression in appetite may occur after calving (Rukkwamsuk et al. 1999). There is a strong relation between over conditioning and diseases like fatty liver and thinner cows have less difficulties with calving. Multifactorial disease’s (mastitis, ketosis, lameness) appearance rate is also higher among fat cows (Fekete 1993).
Gillund et al. (2001) stated that cows were suffering from ketosis had overweight compared with healthy ones. If a cow’s condition score higher than 3.5 at calving, she is more dis-posed to ketosis than thiner herdmates. Schröder and Staufen-biel (2006) also reported about the danger of overconditioning during dry period. They call it fat cow syndrome. There is a high risk of infectious diseases, metabolic- and reproductive disorders.caused by increased body condition and liver fatten-ing. Shaver (1997) has mentioned that gaining weight during dry period is very risky because metabolic malfunctions my occure. Hard calving chance increases and culling rate rises due to displaced abomasum. Boster and Boster (1998) also gathered all information about body score system and stated that dairy cows have the ability to buffer nutritional errors. Merwe and Stewart (1999) conceived the altruist nature of
Optimised dairy cOw feeding ecOnOmy in Hungary
András Halász1 & Edit Jónás2
1Szent István University, Gödöllő, Department of Grass Management2University of Szeged, Department of Animal Husbandry, Hódmezóvásárhely
e-mail: [email protected]
Abstract: High yielder cows optimal feeding is always a major question in farm management. We attempted to find the optimal yield- and weight group in a Holstein_Freisian herd. Handled more than 2000 milk record samples and concluded that the optimal body weight is about 600-650 kg. Also step up from medium yielder to high yielder is more cost efficient than pushing the milk production over 30 kg milk daily. Our results show that fitness traits and body scores are major factors and every 50 kg of extra weight rises the forage cost in average of 0,11 €cents. The mid-weight cows produce 25 kg of milk daily but the herds are very heterogeneous. The solution should be smaller cows, homogeneous herds and optimized feeding.
Keywords: milk, cost, feeding, Freisian
Applied Studies in Agribusiness and Commerce – APSTRACTAgroinform Publishing House, Budapest scientific papers
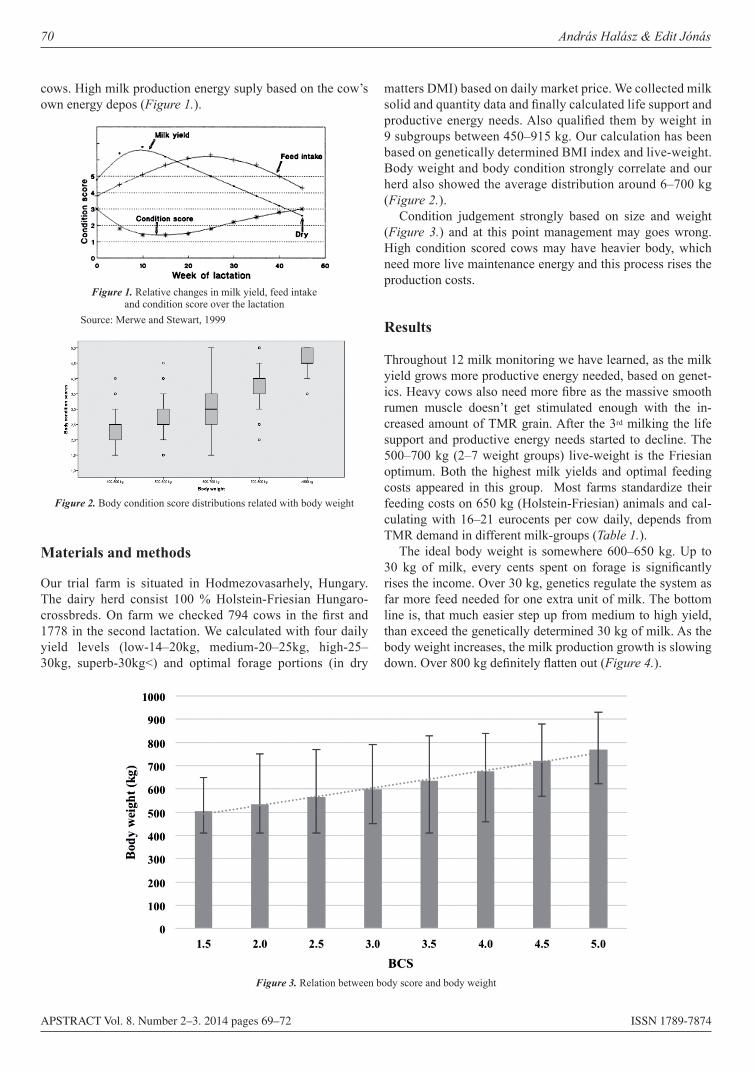
APSTRACT Vol. 8. Number 2–3. 2014 pages 69–72 ISSN 1789-7874
70 András Halász & Edit Jónás
cows. High milk production energy suply based on the cow’s own energy depos (Figure 1.).
Materials and methods
Our trial farm is situated in Hodmezovasarhely, Hungary. The dairy herd consist 100 % Holstein-Friesian Hungaro-crossbreds. On farm we checked 794 cows in the first and 1778 in the second lactation. We calculated with four daily yield levels (low-14–20kg, medium-20–25kg, high-25–30kg, superb-30kg<) and optimal forage portions (in dry
matters DMI) based on daily market price. We collected milk solid and quantity data and finally calculated life support and productive energy needs. Also qualified them by weight in 9 subgroups between 450–915 kg. Our calculation has been based on genetically determined BMI index and live-weight. Body weight and body condition strongly correlate and our herd also showed the average distribution around 6–700 kg (Figure 2.).
Condition judgement strongly based on size and weight (Figure 3.) and at this point management may goes wrong. High condition scored cows may have heavier body, which need more live maintenance energy and this process rises the production costs.
Results
Throughout 12 milk monitoring we have learned, as the milk yield grows more productive energy needed, based on genet-ics. Heavy cows also need more fibre as the massive smooth rumen muscle doesn’t get stimulated enough with the in-creased amount of TMR grain. After the 3rd milking the life support and productive energy needs started to decline. The 500–700 kg (2–7 weight groups) live-weight is the Friesian optimum. Both the highest milk yields and optimal feeding costs appeared in this group. Most farms standardize their feeding costs on 650 kg (Holstein-Friesian) animals and cal-culating with 16–21 eurocents per cow daily, depends from TMR demand in different milk-groups (Table 1.).
The ideal body weight is somewhere 600–650 kg. Up to 30 kg of milk, every cents spent on forage is significantly rises the income. Over 30 kg, genetics regulate the system as far more feed needed for one extra unit of milk. The bottom line is, that much easier step up from medium to high yield, than exceed the genetically determined 30 kg of milk. As the body weight increases, the milk production growth is slowing down. Over 800 kg definitely flatten out (Figure 4.).
Figure 1. Relative changes in milk yield, feed intake and condition score over the lactation
Source: Merwe and Stewart, 1999
Figure 2. Body condition score distributions related with body weight
Figure 3. Relation between body score and body weight
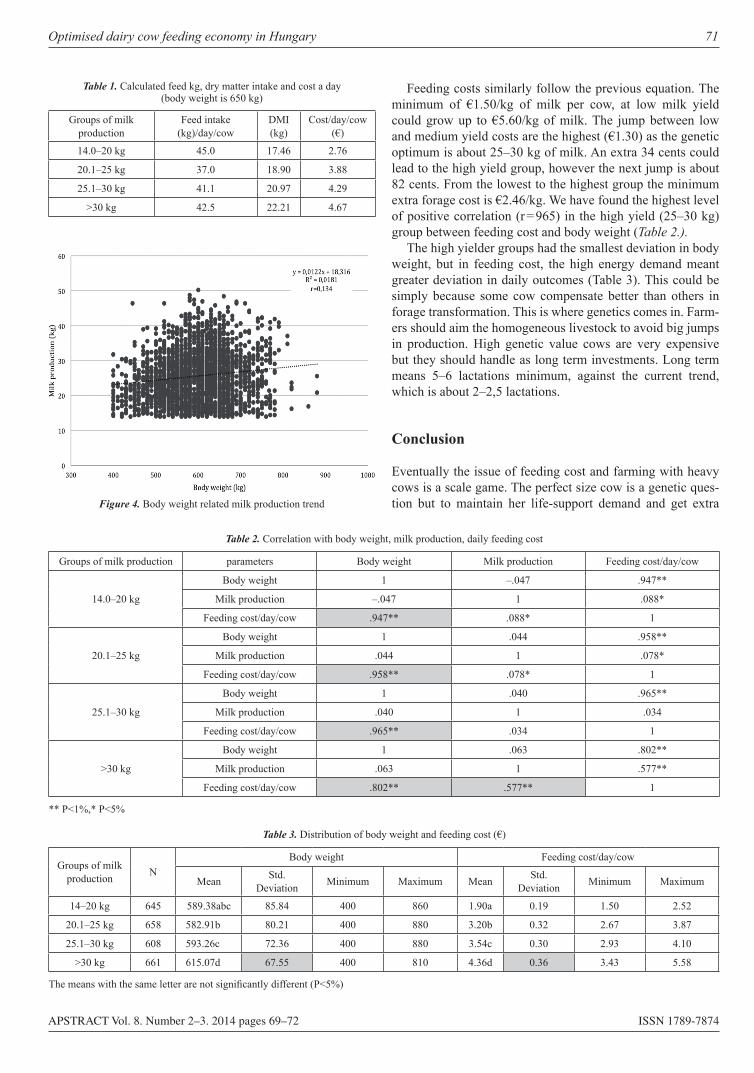
Optimised dairy cow feeding economy in Hungary 71
APSTRACT Vol. 8. Number 2–3. 2014 pages 69–72 ISSN 1789-7874
Feeding costs similarly follow the previous equation. The minimum of €1.50/kg of milk per cow, at low milk yield could grow up to €5.60/kg of milk. The jump between low and medium yield costs are the highest (€1.30) as the genetic optimum is about 25–30 kg of milk. An extra 34 cents could lead to the high yield group, however the next jump is about 82 cents. From the lowest to the highest group the minimum extra forage cost is €2.46/kg. We have found the highest level of positive correlation (r = 965) in the high yield (25–30 kg) group between feeding cost and body weight (Table 2.).
The high yielder groups had the smallest deviation in body weight, but in feeding cost, the high energy demand meant greater deviation in daily outcomes (Table 3). This could be simply because some cow compensate better than others in forage transformation. This is where genetics comes in. Farm-ers should aim the homogeneous livestock to avoid big jumps in production. High genetic value cows are very expensive but they should handle as long term investments. Long term means 5–6 lactations minimum, against the current trend, which is about 2–2,5 lactations.
Conclusion
Eventually the issue of feeding cost and farming with heavy cows is a scale game. The perfect size cow is a genetic ques-tion but to maintain her life-support demand and get extra
Table 1. Calculated feed kg, dry matter intake and cost a day (body weight is 650 kg)
Groups of milk production
Feed intake (kg)/day/cow
DMI (kg)
Cost/day/cow (€)
14.0–20 kg 45.0 17.46 2.76
20.1–25 kg 37.0 18.90 3.88
25.1–30 kg 41.1 20.97 4.29
>30 kg 42.5 22.21 4.67
Figure 4. Body weight related milk production trend
Table 2. Correlation with body weight, milk production, daily feeding cost
Groups of milk production parameters Body weight Milk production Feeding cost/day/cow
14.0–20 kg
Body weight 1 –.047 .947**
Milk production –.047 1 .088*
Feeding cost/day/cow .947** .088* 1
20.1–25 kg
Body weight 1 .044 .958**
Milk production .044 1 .078*
Feeding cost/day/cow .958** .078* 1
25.1–30 kg
Body weight 1 .040 .965**
Milk production .040 1 .034
Feeding cost/day/cow .965** .034 1
>30 kg
Body weight 1 .063 .802**
Milk production .063 1 .577**
Feeding cost/day/cow .802** .577** 1
** P<1%,* P<5%
Table 3. Distribution of body weight and feeding cost (€)
Groups of milk production N
Body weight Feeding cost/day/cow
Mean Std. Deviation Minimum Maximum Mean Std.
Deviation Minimum Maximum
14–20 kg 645 589.38abc 85.84 400 860 1.90a 0.19 1.50 2.52
20.1–25 kg 658 582.91b 80.21 400 880 3.20b 0.32 2.67 3.87
25.1–30 kg 608 593.26c 72.36 400 880 3.54c 0.30 2.93 4.10
>30 kg 661 615.07d 67.55 400 810 4.36d 0.36 3.43 5.58
The means with the same letter are not significantly different (P<5%)
APSTRACT Vol. 8. Number 2–3. 2014 pages 69–72 ISSN 1789-7874
72 András Halász & Edit Jónás
profit is an environmental and feeding issue. Our results sug-gest that most of the mid-sized hungarian dairy farms work with slightly heavier cows than cost effectivness considers. The daily practice of the last decades has selected cows to 550–650 kg. This weight is optimal to produce 25 kg of milk in avarage. However this weight range has wide deviation and most of the dairy livestock is very heterogeneous. We have proved that there is a strong regression (R2 =0.64–0.93) in ev-ery groups with weight and forage costs. Every 50 kg of body weight results 0.005–0.215 €cents growth in forage finances.
References
Bewley JM PAS & Schutz MM (2008): Review: An interdisciplin-ary review of body condition scoring for dairy cattle. The Profes-sional Animal Scientist 24, pp. 507–529.Broster WH & Broster VJ (1998): Body score of dairy cows. Jour-nal of Dairy Research (65), pp. 155–173.Drackley JK, Dann HM, Douglas GN, Guretzky NA, J Litherland NB, Underwood JP, Loor JJ (2005): Physiological and pathologi-cal adaptations in dairy cows that may increase susceptibility tope-riparturient diseases and disorders. Ital.J.Anim.Sci. 4, pp. 323–344.Garnsworthy PC & Topps JH (1982): The effect of body condition of dairy cows at calving on their food intake and performance when given complete diets. Animal Production 35 (01), pp. 113–119. DOI: http://dx.doi.org/10.1017/S0003356100000878 Gillund P, Reksen O, Gröhn YT & Karlberg K (2001): Body Con-dition Related to Ketosis and Reproductive Performance in Norwe-gian Dairy Cows. J. Dairy Sci. 84, pp.1390–1396.Heinrichs J, Suárez J & Jones C (2011): Feed efficiency in dairy heifers. Penn State Extension, DAS 2011-184. http://extension.psu.edu/animals/dairy/nutrition/heifers/heifer-feeding-and-management/feed-efficiency-in-dairy-heifers
Merwe BJ & Stewart PG (1999): Conditioning scoring of dairy cowshttp://www.kzndae.gov.za/enza/agriculture/agricpublications/productionguidelines/dairyinginkwazulunatal/conditionscoring ofdairycows.aspx, Last visited: 2015.02.09.Moran J (2005): Tropical dairy farming: feeding management for small holder dairy farmers in the humid tropics. http://www.publish.csiro.au/?act=view_file&file_id=SA0501191.pdfMusallyamova MF & Antonova NV (2014): Calculation of product costs of dairy cattle breeding in Russia. Mediterranean Journal of Social Sciences 5 (24), pp. 403–406. ISSN 2039-2117 (online), ISSN 2039-9340 (print), Doi:10.5901/mjss.2014.v5n24p403Rukkwamsuk T, Kruip TA & Wensing T (1999): Relationship be-tween overfeeding and overconditioning in the dry period and the problems of high producing dairy cows during the postparturient pe-riod. Vet Q 21(3), pp. 71–7.Schivera D. (2005): Getting a family cow … lots to consider.http://www.mofga.org/Publications/MaineOrganicFarmerGardener/Winter20052006/FamilyCow/tabid/1116/Default.aspx. Last visited: 2015.02.02.Schröder UJ & Staufenbiel R (2006): Invited review: Methods to determine body fat reserves in the dairy cow with special regard to ultrasonographic measurement of backfat thickness. J. Dairy Sci. 89, pp. 1–14.Shaver RD (1997): Nutritional risk factors in the etiology of left dis-placed abomasum in dairy cows: A review. Journal of Dairy Science 80, pp. 2449–2453.Veerkamp RF (1998): Selection for economic efficiency of dairy cattle using information on live weight and feed intake: A review. Journal of Dairy Science 81 (4), pp.: 1109–1119.Vries A (2013): Cow longevity economics: The cost benefit of keep-ing the cow in the herd. http://www.milkproduction.com/Library/Sci-entific-articles/Management/Cow-longevity-economics-The-cost-benefit-of-keeping-the-cow-in-the-herd/. Last visited: 2015.02.02.
APSTRACT Vol. 8. Number 2–3. 2014 pages 73–79 ISSN 1789-7874
Introduction
Agriculture plays a vital role when it comes to the growth and development of the Ghanaian economy. This sector en-sures poverty reduction especially for the rural communities by generating employment and income to farmers. Again, the agricultural sector guarantees the availability of food. This becomes an important factor when dealing with domes-tic inflation because it arises as a result of increases in food prices. Agriculture contributes significantly to the nation’s Gross Domestic Product (GDP) although it contribution has been declining recently. According to Ghana Statistical Ser-vice (2013) report at basic prices, agriculture’s contribution to GDP in 2008 was 31.0 and this figure rose to 31.8 in 2009. However, these figures fell to 29.8, 25.3, 22.7 and 21.3 percent for 2010, 2011, 2012 and 2013 respectively. Taking initiatives to promote the growth of the agricultural sector is one of the most effective ways of reducing poverty, hunger and malnutri-tion. In the pursuit to enhance agricultural productivity, it is imperative that we come out with a road map through which that goal could be achieved. This leaves us with the questions: do we enhance productivity through the introduction of new technologies or do we improve existing technologies? Over the years much attention has been given to the development
and the adoption of new technologies. This initiative is be-lieved to enhance farm output and increase income levels of farmers. However, growth in output cannot only be achieved through technological innovation but also through the effi-ciency in which such technologies are used. This has made researchers and policy makers recognise the importance of ef-ficiency as a way of fostering production. Empirical evidence shows that the gap between actual and potential outputs could be closed by utilising minimum inputs to achieve a possible maximum output (Audibert 1997).
In the Ejura-Sekyedumase District of Ghana, the agricul-tural sector serves as the main source of employment and in-come generation for the people. Maize is the major type of food crop grown and the District is the principal producer of maize in the Ashanti region. Facts from the Statistics, Re-search and Information Directorate of the district shows that estimated cropped area (HA) of maize has been increasing since 2006 but the estimated output in metric tonnes has been declining. The estimated cropped area in hectares increased from 11,951 in 2006 to 13,486 in 2007 and to 17,500 in 2008. In contrast, output in metric tonnes declined from 30,833 in 2006 to 28,861 in 2007 and to 24,419 in 2008 (MoFA 2013). One would presume that as area under crop cultivation of maize increases so would output but this is not the case. This
Technical efficiency analysis of Maize ProducTion: evidence froM GhanaBeatrice Bempomaa & Henry de-Graft Acquah
Department of Agricultural Economics and Extension, University of Cape Coast, Ghana
Abstract: The study applies the single-stage modelling stochastic frontier approach to investigate the performance of maize farmers in the Ejura-Sekyedumase District of Ghana. It estimates the level of technical efficiency and its determinants for 306 maize farmers. Findings indicated that land, labour and fertilizer influenced output positively whilst agrochemicals and seeds affected output negatively. A wide variation in output was also found among producers of maize. The study further revealed that age, sex and off-farm work activities were significant determinants of technical inefficiencies in production. Results from the maximum likelihood estimate of the frontier model showed that averagely, farmers were 67% technically efficient, implying that 33% of maize yield was not realized. The return to scale which measures the productivity level of farmers was 1.22, suggesting that the farmers are operating at an increasing returns to scale.
Keywords: Technical Efficiency, Productivity, Stochastic Frontier, Elasticity, Return to Scale
Applied Studies in Agribusiness and Commerce – APSTRACTAgroinform Publishing House, Budapest scienTific PaPers
74 Beatrice Bempomaa & Henry de-Graft Acquah
APSTRACT Vol. 8. Number 2–3. 2014 pages 73–79 ISSN 1789-7874
phenomenon may arise as a result of inefficiencies leading to variations in output. Differences in yields can arise between and amongst farmers who have the same farming locations, same seed varieties, soil type and equal amount of fertiliser. The cause of variation in output is as a result of the differ-ences in management practices followed by the farmers. The presence of gaps in efficiency means that output could be in-creased without requiring additional conventional inputs and without the need for new technology. If this is the case, then empirical measure of technical efficiency in maize production is necessary in order to determine the extent of the gains that could be obtained by improving performance in agricultural production with a given technology.
A lot of work has been carried out in maize production. Mostly these researches are related on how to improve maize yields by looking at pest and disease resistant variety, nutri-tional quality variety and access to financial institution among others (Morris, Tripp and Dankyi 1999; Bio 2010 and Kpo-tor 2012). However, much work has not been done when it comes to investigating technical efficiency of maize produc-tion in Ejura-Sekyedumase where a lot of maize production is undertaken. It is on these premises that this study investigates technical efficiency in maize production and derives policy implications.
This study therefore examines technical efficiency and its determinants in Ghanaian maize production. Specifically, the study seeks to (1) estimate the level of technical efficiency in maize production; (2) identify the factors that influence tech-nical efficiency; (3) estimate the productivity level of maize farmers.
Materials and methods
Technical efficiency measurements have to do with the com-parison of actual performance to optimal performance. Since the true frontier is not known an empirical approximation normally referred to as “best-practice” frontier is required. This can be done by using the parametric or the non-paramet-ric technique (Berger and Humphery, 1997). The estimation of technical efficiency comprises two main methods, namely, the parametric approach and the non-parametric approach. However, this study employs the parametric approach. An example of the parametric approach is the stochastic frontier approach. The stochastic frontier function, an improved mod-el of estimating technical efficiency was developed indepen-dently by Aigner, Lovell and Schmidt (1977) and Meeusen and van de Broeck (1977). The model incorporates an error term which is a component of statistical noise and technical inefficiencies. The disintegration of the error term makes this technique more preferable to others. The random errors are assumed to be independently and identically distributed. It also assumes a stochastic relationship between inputs and the output produced. Thus, it allows the assumption that devia-tions from the frontier are due to inefficiencies and noise in the data. However, the assumption of a-priori distributional
forms for the inefficiency component and the imposition of an explicit functional form for the underlying technology is a major flaw for the stochastic frontier analysis. Literature highly recommends the use of stochastic frontier analysis in agricultural production as a result of its inherent nature of uncertainty (Ezeh, 2004)
Sample Size and Data Analysis
The simple random sampling technique was used to select 306 maize farmers from the Ejura Sekyedumase District. The ana-lytical tools used for this study were descriptive statistics and the stochastic frontier model. The R programming software was used to analyse the data. The stochastic frontier model was estimated using the frontier package in R.
Analytical Model for Estimating Technical Efficiency
Due to the nature of agricultural production, the stochastic frontier model which was independently put forward by Aign-er et al. (1977) and Meeusen et al. (1977) was used for the estimation of technical efficiency. This allows stochastic noise and producer’s inefficiency to be accounted for at the same time. For cross-sectional data, the stochastic frontier function is given as:
Yi = f (X i ; )exp( i ) = f (X i ; )exp(Vi U i ),i ==1,2,..., N (1)Where Yi denotes the level of output for the ith farmer; Xi
denotes a vector of inputs; β denotes a vector of unknown parameters to be estimated; εi denotes the composed error term consisting of two independent elements Vi and Ui such that εi = (Vi – Ui). Vi denotes the stochastic noise and other factors beyond the farmers control; Ui denotes the ineffi-ciency error term which is non-negative. This makes it pos-sible for all observations to lie on or below the stochastic production frontier (Coelli, Rao, O’Donnell and Battese, 2005). Furthermore, it is assumed that the two-sided error Vi is identically and independently distributed (iid) with a mean of zero and a variance of σ2
v. Also, Vi and Ui are dis-tributed independent of each other and of the independent variables. Following from equation (1), technical efficiency can then be specified as:
T i =f (X i ; ).exp vi ui{ }
f (X i ; ).exp vi{ }=
= e p ui{ } (2)Equation 2 defines technical efficiency as the ratio of the
observed output to the frontier output. Technical efficiency takes a value between zero and one. Thus, 0 ≤ TEi ≤ 1. If ui = 0, then the production firm is 100% efficient and if ui > 0, then there is some inefficiency.
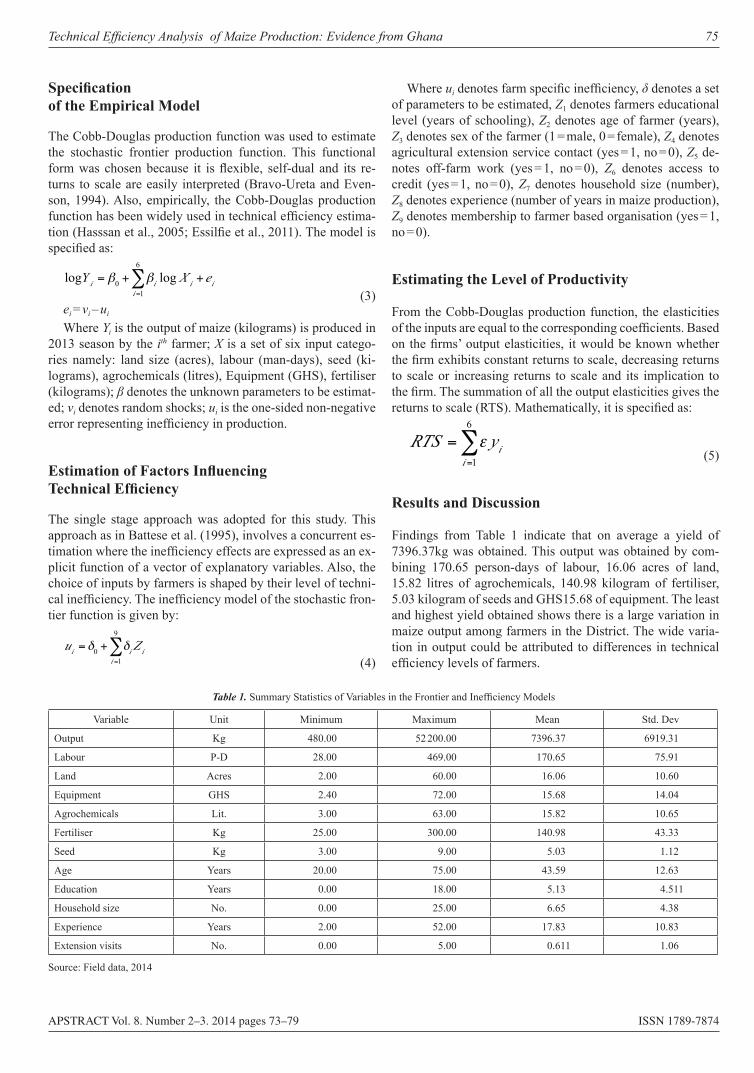
Technical Efficiency Analysis of Maize Production: Evidence from Ghana 75
APSTRACT Vol. 8. Number 2–3. 2014 pages 73–79 ISSN 1789-7874
Specification of the Empirical Model
The Cobb-Douglas production function was used to estimate the stochastic frontier production function. This functional form was chosen because it is flexible, self-dual and its re-turns to scale are easily interpreted (Bravo-Ureta and Even-son, 1994). Also, empirically, the Cobb-Douglas production function has been widely used in technical efficiency estima-tion (Hasssan et al., 2005; Essilfie et al., 2011). The model is specified as:
logYi = 0 + ii =1
6
log X i +ei
(3)ei = vi – ui
Where Yi is the output of maize (kilograms) is produced in 2013 season by the ith farmer; X is a set of six input catego-ries namely: land size (acres), labour (man-days), seed (ki-lograms), agrochemicals (litres), Equipment (GHS), fertiliser (kilograms); β denotes the unknown parameters to be estimat-ed; vi denotes random shocks; ui is the one-sided non-negative error representing inefficiency in production.
Estimation of Factors Influencing Technical Efficiency
The single stage approach was adopted for this study. This approach as in Battese et al. (1995), involves a concurrent es-timation where the inefficiency effects are expressed as an ex-plicit function of a vector of explanatory variables. Also, the choice of inputs by farmers is shaped by their level of techni-cal inefficiency. The inefficiency model of the stochastic fron-tier function is given by:
ui = 0 + ii =1
9
Z i
(4)
Where ui denotes farm specific inefficiency, δ denotes a set of parameters to be estimated, Z1 denotes farmers educational level (years of schooling), Z2 denotes age of farmer (years), Z3 denotes sex of the farmer (1 = male, 0 = female), Z4 denotes agricultural extension service contact (yes = 1, no = 0), Z5 de-notes off-farm work (yes = 1, no = 0), Z6 denotes access to credit (yes = 1, no = 0), Z7 denotes household size (number), Z8 denotes experience (number of years in maize production), Z9 denotes membership to farmer based organisation (yes = 1, no = 0).
Estimating the Level of Productivity
From the Cobb-Douglas production function, the elasticities of the inputs are equal to the corresponding coefficients. Based on the firms’ output elasticities, it would be known whether the firm exhibits constant returns to scale, decreasing returns to scale or increasing returns to scale and its implication to the firm. The summation of all the output elasticities gives the returns to scale (RTS). Mathematically, it is specified as:
RTS = yii =1
6
(5)
Results and Discussion
Findings from Table 1 indicate that on average a yield of 7396.37kg was obtained. This output was obtained by com-bining 170.65 person-days of labour, 16.06 acres of land, 15.82 litres of agrochemicals, 140.98 kilogram of fertiliser, 5.03 kilogram of seeds and GHS15.68 of equipment. The least and highest yield obtained shows there is a large variation in maize output among farmers in the District. The wide varia-tion in output could be attributed to differences in technical efficiency levels of farmers.
Table 1. Summary Statistics of Variables in the Frontier and Inefficiency Models
Variable Unit Minimum Maximum Mean Std. Dev
Output Kg 480.00 52 200.00 7396.37 6919.31
Labour P-D 28.00 469.00 170.65 75.91
Land Acres 2.00 60.00 16.06 10.60
Equipment GHS 2.40 72.00 15.68 14.04
Agrochemicals Lit. 3.00 63.00 15.82 10.65
Fertiliser Kg 25.00 300.00 140.98 43.33
Seed Kg 3.00 9.00 5.03 1.12
Age Years 20.00 75.00 43.59 12.63
Education Years 0.00 18.00 5.13 4.511
Household size No. 0.00 25.00 6.65 4.38
Experience Years 2.00 52.00 17.83 10.83
Extension visits No. 0.00 5.00 0.611 1.06
Source: Field data, 2014
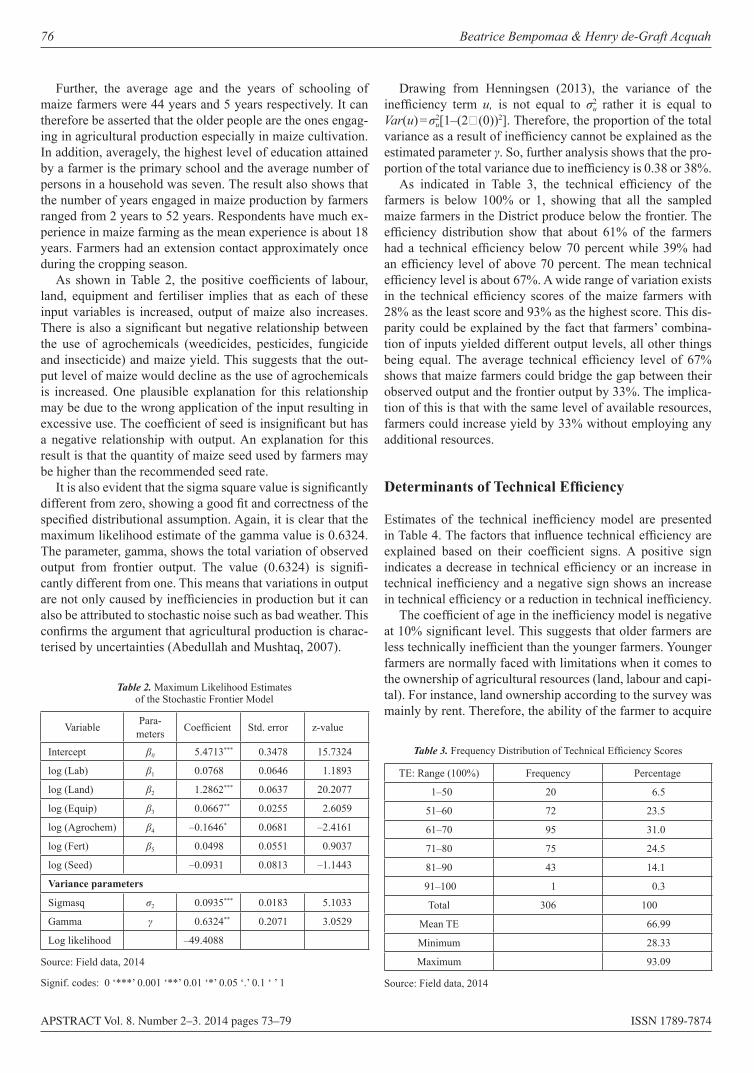
76 Beatrice Bempomaa & Henry de-Graft Acquah
APSTRACT Vol. 8. Number 2–3. 2014 pages 73–79 ISSN 1789-7874
Further, the average age and the years of schooling of maize farmers were 44 years and 5 years respectively. It can therefore be asserted that the older people are the ones engag-ing in agricultural production especially in maize cultivation. In addition, averagely, the highest level of education attained by a farmer is the primary school and the average number of persons in a household was seven. The result also shows that the number of years engaged in maize production by farmers ranged from 2 years to 52 years. Respondents have much ex-perience in maize farming as the mean experience is about 18 years. Farmers had an extension contact approximately once during the cropping season.
As shown in Table 2, the positive coefficients of labour, land, equipment and fertiliser implies that as each of these input variables is increased, output of maize also increases. There is also a significant but negative relationship between the use of agrochemicals (weedicides, pesticides, fungicide and insecticide) and maize yield. This suggests that the out-put level of maize would decline as the use of agrochemicals is increased. One plausible explanation for this relationship may be due to the wrong application of the input resulting in excessive use. The coefficient of seed is insignificant but has a negative relationship with output. An explanation for this result is that the quantity of maize seed used by farmers may be higher than the recommended seed rate.
It is also evident that the sigma square value is significantly different from zero, showing a good fit and correctness of the specified distributional assumption. Again, it is clear that the maximum likelihood estimate of the gamma value is 0.6324. The parameter, gamma, shows the total variation of observed output from frontier output. The value (0.6324) is signifi-cantly different from one. This means that variations in output are not only caused by inefficiencies in production but it can also be attributed to stochastic noise such as bad weather. This confirms the argument that agricultural production is charac-terised by uncertainties (Abedullah and Mushtaq, 2007).
Drawing from Henningsen (2013), the variance of the inefficiency term u, is not equal to σ2
u rather it is equal to Var(u) = σ2
u[1–(2ϕ(0))2]. Therefore, the proportion of the total variance as a result of inefficiency cannot be explained as the estimated parameter γ. So, further analysis shows that the pro-portion of the total variance due to inefficiency is 0.38 or 38%.
As indicated in Table 3, the technical efficiency of the farmers is below 100% or 1, showing that all the sampled maize farmers in the District produce below the frontier. The efficiency distribution show that about 61% of the farmers had a technical efficiency below 70 percent while 39% had an efficiency level of above 70 percent. The mean technical efficiency level is about 67%. A wide range of variation exists in the technical efficiency scores of the maize farmers with 28% as the least score and 93% as the highest score. This dis-parity could be explained by the fact that farmers’ combina-tion of inputs yielded different output levels, all other things being equal. The average technical efficiency level of 67% shows that maize farmers could bridge the gap between their observed output and the frontier output by 33%. The implica-tion of this is that with the same level of available resources, farmers could increase yield by 33% without employing any additional resources.
Determinants of Technical Efficiency
Estimates of the technical inefficiency model are presented in Table 4. The factors that influence technical efficiency are explained based on their coefficient signs. A positive sign indicates a decrease in technical efficiency or an increase in technical inefficiency and a negative sign shows an increase in technical efficiency or a reduction in technical inefficiency.
The coefficient of age in the inefficiency model is negative at 10% significant level. This suggests that older farmers are less technically inefficient than the younger farmers. Younger farmers are normally faced with limitations when it comes to the ownership of agricultural resources (land, labour and capi-tal). For instance, land ownership according to the survey was mainly by rent. Therefore, the ability of the farmer to acquire
Table 2. Maximum Likelihood Estimates of the Stochastic Frontier Model
Variable Para-meters Coefficient Std. error z-value
Intercept β0 5.4713*** 0.3478 15.7324
log (Lab) β1 0.0768 0.0646 1.1893
log (Land) β2 1.2862*** 0.0637 20.2077
log (Equip) β3 0.0667** 0.0255 2.6059
log (Agrochem) β4 –0.1646* 0.0681 –2.4161
log (Fert) β5 0.0498 0.0551 0.9037
log (Seed) –0.0931 0.0813 –1.1443
Variance parameters
Sigmasq σ2 0.0935*** 0.0183 5.1033
Gamma γ 0.6324** 0.2071 3.0529
Log likelihood –49.4088
Source: Field data, 2014
Signif. codes: 0 ‘***’ 0.001 ‘**’ 0.01 ‘*’ 0.05 ‘.’ 0.1 ‘ ’ 1
Table 3. Frequency Distribution of Technical Efficiency Scores
TE: Range (100%) Frequency Percentage
1–50 20 6.5
51–60 72 23.5
61–70 95 31.0
71–80 75 24.5
81–90 43 14.1
91–100 1 0.3
Total 306 100
Mean TE 66.99
Minimum 28.33
Maximum 93.09
Source: Field data, 2014
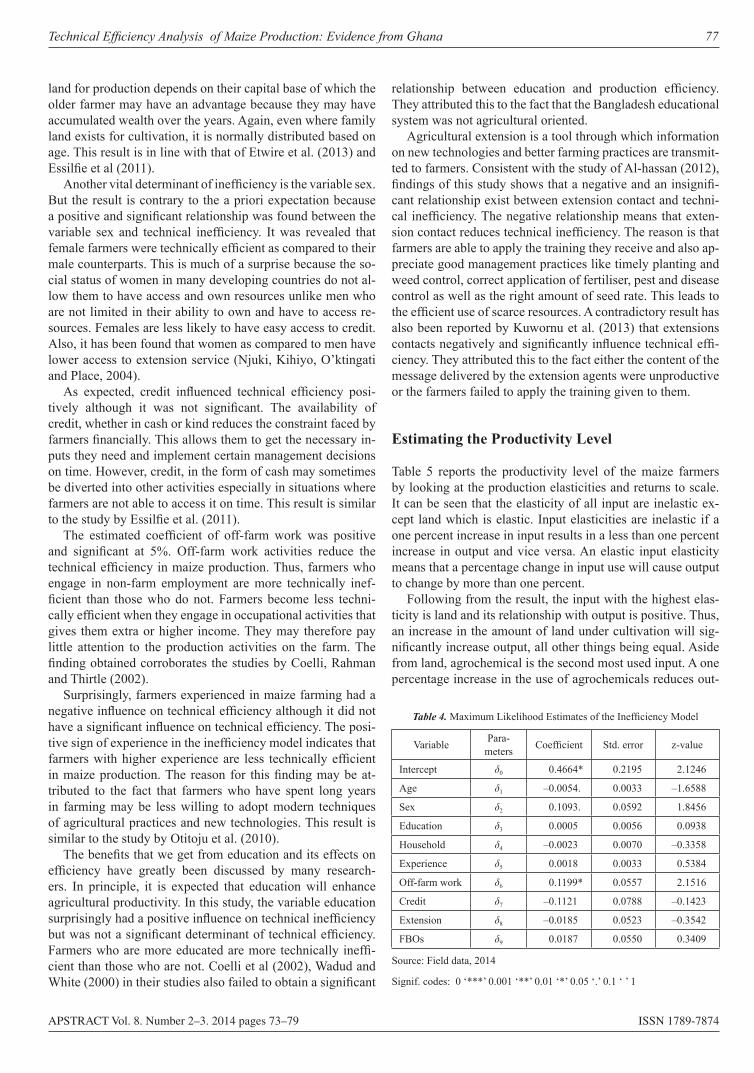
Technical Efficiency Analysis of Maize Production: Evidence from Ghana 77
APSTRACT Vol. 8. Number 2–3. 2014 pages 73–79 ISSN 1789-7874
land for production depends on their capital base of which the older farmer may have an advantage because they may have accumulated wealth over the years. Again, even where family land exists for cultivation, it is normally distributed based on age. This result is in line with that of Etwire et al. (2013) and Essilfie et al (2011).
Another vital determinant of inefficiency is the variable sex. But the result is contrary to the a priori expectation because a positive and significant relationship was found between the variable sex and technical inefficiency. It was revealed that female farmers were technically efficient as compared to their male counterparts. This is much of a surprise because the so-cial status of women in many developing countries do not al-low them to have access and own resources unlike men who are not limited in their ability to own and have to access re-sources. Females are less likely to have easy access to credit. Also, it has been found that women as compared to men have lower access to extension service (Njuki, Kihiyo, O’ktingati and Place, 2004).
As expected, credit influenced technical efficiency posi-tively although it was not significant. The availability of credit, whether in cash or kind reduces the constraint faced by farmers financially. This allows them to get the necessary in-puts they need and implement certain management decisions on time. However, credit, in the form of cash may sometimes be diverted into other activities especially in situations where farmers are not able to access it on time. This result is similar to the study by Essilfie et al. (2011).
The estimated coefficient of off-farm work was positive and significant at 5%. Off-farm work activities reduce the technical efficiency in maize production. Thus, farmers who engage in non-farm employment are more technically inef-ficient than those who do not. Farmers become less techni-cally efficient when they engage in occupational activities that gives them extra or higher income. They may therefore pay little attention to the production activities on the farm. The finding obtained corroborates the studies by Coelli, Rahman and Thirtle (2002).
Surprisingly, farmers experienced in maize farming had a negative influence on technical efficiency although it did not have a significant influence on technical efficiency. The posi-tive sign of experience in the inefficiency model indicates that farmers with higher experience are less technically efficient in maize production. The reason for this finding may be at-tributed to the fact that farmers who have spent long years in farming may be less willing to adopt modern techniques of agricultural practices and new technologies. This result is similar to the study by Otitoju et al. (2010).
The benefits that we get from education and its effects on efficiency have greatly been discussed by many research-ers. In principle, it is expected that education will enhance agricultural productivity. In this study, the variable education surprisingly had a positive influence on technical inefficiency but was not a significant determinant of technical efficiency. Farmers who are more educated are more technically ineffi-cient than those who are not. Coelli et al (2002), Wadud and White (2000) in their studies also failed to obtain a significant
relationship between education and production efficiency. They attributed this to the fact that the Bangladesh educational system was not agricultural oriented.
Agricultural extension is a tool through which information on new technologies and better farming practices are transmit-ted to farmers. Consistent with the study of Al-hassan (2012), findings of this study shows that a negative and an insignifi-cant relationship exist between extension contact and techni-cal inefficiency. The negative relationship means that exten-sion contact reduces technical inefficiency. The reason is that farmers are able to apply the training they receive and also ap-preciate good management practices like timely planting and weed control, correct application of fertiliser, pest and disease control as well as the right amount of seed rate. This leads to the efficient use of scarce resources. A contradictory result has also been reported by Kuwornu et al. (2013) that extensions contacts negatively and significantly influence technical effi-ciency. They attributed this to the fact either the content of the message delivered by the extension agents were unproductive or the farmers failed to apply the training given to them.
Estimating the Productivity Level
Table 5 reports the productivity level of the maize farmers by looking at the production elasticities and returns to scale. It can be seen that the elasticity of all input are inelastic ex-cept land which is elastic. Input elasticities are inelastic if a one percent increase in input results in a less than one percent increase in output and vice versa. An elastic input elasticity means that a percentage change in input use will cause output to change by more than one percent.
Following from the result, the input with the highest elas-ticity is land and its relationship with output is positive. Thus, an increase in the amount of land under cultivation will sig-nificantly increase output, all other things being equal. Aside from land, agrochemical is the second most used input. A one percentage increase in the use of agrochemicals reduces out-
Table 4. Maximum Likelihood Estimates of the Inefficiency Model
Variable Para-meters Coefficient Std. error z-value
Intercept δ0 0.4664* 0.2195 2.1246
Age δ1 –0.0054. 0.0033 –1.6588
Sex δ2 0.1093. 0.0592 1.8456
Education δ3 0.0005 0.0056 0.0938
Household δ4 –0.0023 0.0070 –0.3358
Experience δ5 0.0018 0.0033 0.5384
Off-farm work δ6 0.1199* 0.0557 2.1516
Credit δ7 –0.1121 0.0788 –0.1423
Extension δ8 –0.0185 0.0523 –0.3542
FBOs δ9 0.0187 0.0550 0.3409
Source: Field data, 2014
Signif. codes: 0 ‘***’ 0.001 ‘**’ 0.01 ‘*’ 0.05 ‘.’ 0.1 ‘ ’ 1
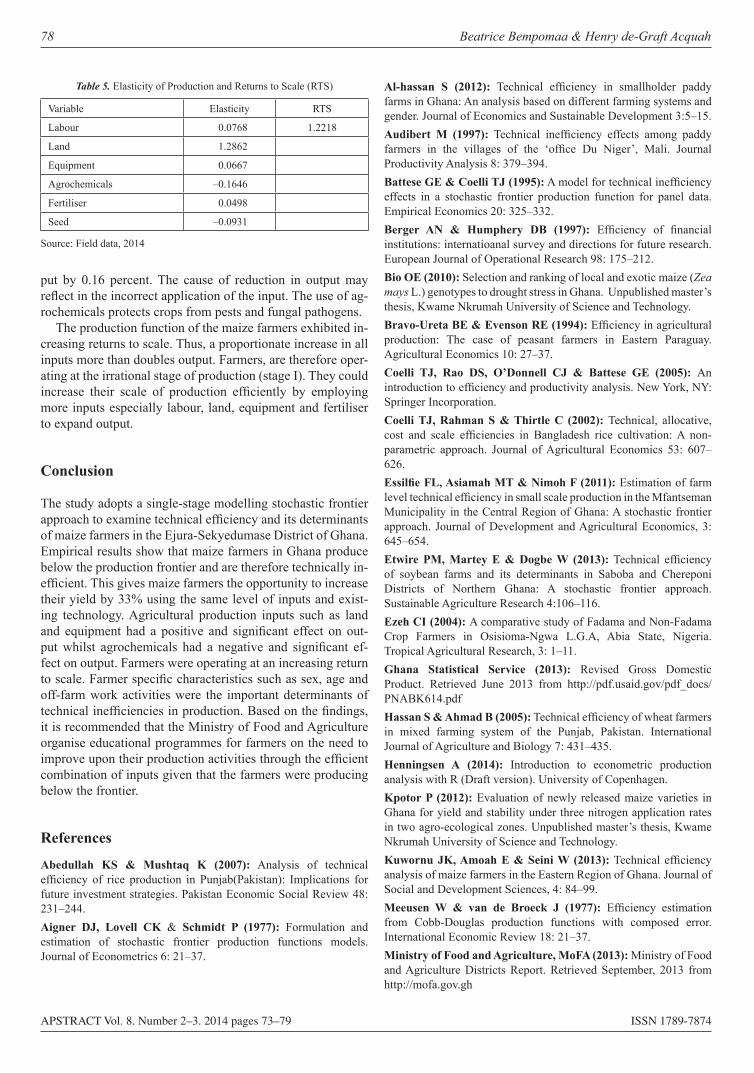
78 Beatrice Bempomaa & Henry de-Graft Acquah
APSTRACT Vol. 8. Number 2–3. 2014 pages 73–79 ISSN 1789-7874
put by 0.16 percent. The cause of reduction in output may reflect in the incorrect application of the input. The use of ag-rochemicals protects crops from pests and fungal pathogens.
The production function of the maize farmers exhibited in-creasing returns to scale. Thus, a proportionate increase in all inputs more than doubles output. Farmers, are therefore oper-ating at the irrational stage of production (stage I). They could increase their scale of production efficiently by employing more inputs especially labour, land, equipment and fertiliser to expand output.
Conclusion
The study adopts a single-stage modelling stochastic frontier approach to examine technical efficiency and its determinants of maize farmers in the Ejura-Sekyedumase District of Ghana. Empirical results show that maize farmers in Ghana produce below the production frontier and are therefore technically in-efficient. This gives maize farmers the opportunity to increase their yield by 33% using the same level of inputs and exist-ing technology. Agricultural production inputs such as land and equipment had a positive and significant effect on out-put whilst agrochemicals had a negative and significant ef-fect on output. Farmers were operating at an increasing return to scale. Farmer specific characteristics such as sex, age and off-farm work activities were the important determinants of technical inefficiencies in production. Based on the findings, it is recommended that the Ministry of Food and Agriculture organise educational programmes for farmers on the need to improve upon their production activities through the efficient combination of inputs given that the farmers were producing below the frontier.
References
Abedullah KS & Mushtaq K (2007): Analysis of technical efficiency of rice production in Punjab(Pakistan): Implications for future investment strategies. Pakistan Economic Social Review 48: 231–244.Aigner DJ, Lovell CK & Schmidt P (1977): Formulation and estimation of stochastic frontier production functions models. Journal of Econometrics 6: 21–37.
Al-hassan S (2012): Technical efficiency in smallholder paddy farms in Ghana: An analysis based on different farming systems and gender. Journal of Economics and Sustainable Development 3:5–15.Audibert M (1997): Technical inefficiency effects among paddy farmers in the villages of the ‘office Du Niger’, Mali. Journal Productivity Analysis 8: 379–394.Battese GE & Coelli TJ (1995): A model for technical inefficiency effects in a stochastic frontier production function for panel data. Empirical Economics 20: 325–332.Berger AN & Humphery DB (1997): Efficiency of financial institutions: internatioanal survey and directions for future research. European Journal of Operational Research 98: 175–212.Bio OE (2010): Selection and ranking of local and exotic maize (Zea mays L.) genotypes to drought stress in Ghana. Unpublished master’s thesis, Kwame Nkrumah University of Science and Technology.Bravo-Ureta BE & Evenson RE (1994): Efficiency in agricultural production: The case of peasant farmers in Eastern Paraguay. Agricultural Economics 10: 27–37.Coelli TJ, Rao DS, O’Donnell CJ & Battese GE (2005): An introduction to efficiency and productivity analysis. New York, NY: Springer Incorporation.Coelli TJ, Rahman S & Thirtle C (2002): Technical, allocative, cost and scale efficiencies in Bangladesh rice cultivation: A non-parametric approach. Journal of Agricultural Economics 53: 607–626.Essilfie FL, Asiamah MT & Nimoh F (2011): Estimation of farm level technical efficiency in small scale production in the Mfantseman Municipality in the Central Region of Ghana: A stochastic frontier approach. Journal of Development and Agricultural Economics, 3: 645–654.Etwire PM, Martey E & Dogbe W (2013): Technical efficiency of soybean farms and its determinants in Saboba and Chereponi Districts of Northern Ghana: A stochastic frontier approach. Sustainable Agriculture Research 4:106–116.Ezeh CI (2004): A comparative study of Fadama and Non-Fadama Crop Farmers in Osisioma-Ngwa L.G.A, Abia State, Nigeria. Tropical Agricultural Research, 3: 1–11.Ghana Statistical Service (2013): Revised Gross Domestic Product. Retrieved June 2013 from http://pdf.usaid.gov/pdf_docs/PNABK614.pdfHassan S & Ahmad B (2005): Technical efficiency of wheat farmers in mixed farming system of the Punjab, Pakistan. International Journal of Agriculture and Biology 7: 431–435.Henningsen A (2014): Introduction to econometric production analysis with R (Draft version). University of Copenhagen.Kpotor P (2012): Evaluation of newly released maize varieties in Ghana for yield and stability under three nitrogen application rates in two agro-ecological zones. Unpublished master’s thesis, Kwame Nkrumah University of Science and Technology.Kuwornu JK, Amoah E & Seini W (2013): Technical efficiency analysis of maize farmers in the Eastern Region of Ghana. Journal of Social and Development Sciences, 4: 84–99.Meeusen W & van de Broeck J (1977): Efficiency estimation from Cobb-Douglas production functions with composed error. International Economic Review 18: 21–37.Ministry of Food and Agriculture, MoFA (2013): Ministry of Food and Agriculture Districts Report. Retrieved September, 2013 from http://mofa.gov.gh
Table 5. Elasticity of Production and Returns to Scale (RTS)
Variable Elasticity RTS
Labour 0.0768 1.2218
Land 1.2862
Equipment 0.0667
Agrochemicals –0.1646
Fertiliser 0.0498
Seed –0.0931
Source: Field data, 2014
Technical Efficiency Analysis of Maize Production: Evidence from Ghana 79
APSTRACT Vol. 8. Number 2–3. 2014 pages 73–79 ISSN 1789-7874
Morris ML, Tripp R & Dankyi AA (1999): Adoption and impacts of improved maize production technology: A case study of the Ghana grains development project. Economics Program. Mexico, D. F.: CIMMYT.Njuki JM, Kihiyo VM, O’ktingati A & Place F (2004): Male and female labour in an agroforestry system in the central highlands of Kenya: Correcting the misconception. International Journal of Agricultural Resources, Governance and Ecology 3: 154–170.
Otitoju MA & Arene CJ (2010): Constraints and determinants of technical efficiency in medium-scale soybean production in Benue State, Nigeria. African Journal of Agricultural Research 5: 2276–2280.Wadud A & White B (2000): Farm household efficiency in Bangladesh: A comparison of stochastic frontier and DEA methods. Applied Economics 32: 1665–1673.
APSTRACT Vol. 8. Number 2–3. 2014 pages 81–88 ISSN 1789-7874
1. Introduction
One of the worldwide problems of our modern society is un-employment. The unemployment rate in the European Union reflected a relative constancy from 2002 till 2006, when a radical decrease happened. The lowest rate of unemployment was detected in 2008, a year before the crises, showing a rate of 6%. The explosion of the crises affected even the unem-ployment rate of the European Union, it increased by 1,6% in 2009, by 2,3% in 2010 and 2011 compared to the value in 2008. This increase stopped in 2011, which might cause some optimism; the unemployment rate was 8,3% both in 2010 and 2011. Even this small rate of optimism disappeared as the unemployment rate reached 9,1% in 2012, which means that almost a growth of 1% happened during one year (Eurostat 2013).
Though there is not any way to cease this problem, one of the basic tasks of every nation economy is to deal with the un-employment, to relieve the passing-by stresses by the passive unemployment supply system, but the most important fact is to raise the employment level by the help of active employment policy tools and labour market services and by integration to
work in Hungary and abroad as well (Oláh 2012). Kis (2012) points out that human resources are not only factors of the economy but also fields to be developed in many respects (e.g. employment and income, see, for instance, Kis 2008). The ne-cessity of the government’s intervention is inevitable. During the economic crises Active Labour Market Policies (ALMP) became popular among the utilized economic political inter-ventions. Their history dates back to the descending period of the fourth Kondratieff cycle (the oil crises of the 1970s), when governments were forced to take anti-cyclical actions because of the insufficiency of the labour market. By the tools introduced in the OECD countries, the allocation function of the labour market was wished to increase from public sources (Dar–Tzannatos, 1999). From the very beginning the aim of the ALMPs was to temporary reintegrate unemployed people to work, to maintain and develop working skills and to im-prove the efficiency of the relating services (Employment out-look 1993). Essentially it is a kind of artificial improver of the statistics, as the unemployment rate may be reduced by the number of those involved in the active programs; furthermore, it relieves the overload of the support systems and the evolved social stresses as well. In case of strict economic and social
On the COnveyOr Belt Of PuBliC emPlOyment PrOgrams Between
2009 and 2013 in hajdúBöszörményJudit Oláh1 & Andrea Szabó2
1University of Debrecen Faculty of Economics and BusinessInstitute of Appleid Informatics and Logistics, Department of Logistics Management
2Széchenyi István Agricultural and Foodindustry Vocational School, Hajdúböszörmény
Abstract: Present study focuses on the national and European popularity of public employment programs within the Active Labour Market Policies (ALMP) between 2009 and 2013, and emphasizes the lack of their transitive effects by two national empirical researches. It is a crucial question at either the governmental level or the local level or even at the level of the people that after the participation whether the supported employees can find a job, whether the programs have transitive effects or the possibility of re-employment is greater. 50% one-time participation defined in the first hypothesis was examined in two empirical studies. In the first case this ratio was verified neither in input sampling (45,6%) nor in output sampling (40,83%). In case of the sampling in 2013 it was successful (78%). In Hajdúböszörmény revealing the situation of the labour market we concluded that practically people after the supported employment have minimal chance to find a job, there are still negative tendencies in the primary market, and local government tries to struggle with the price by utilizing public employment as a single tool. The two empirical sampling drew the attention that the lower the transitive effects of the examined programs are, the stronger the phenomenon of locking-in and rotating is.
Keywords: unemployment rate, active labour market policies, government’s intervention, public work, re-integration to employment
Applied Studies in Agribusiness and Commerce – APSTRACTAgroinform Publishing House, Budapest sCientifiC PaPers
82 Judit Oláh & Andrea Szabó
APSTRACT Vol. 8. Number 2–3. 2014 pages 81–88 ISSN 1789-7874
crises this tool may easily become the toy of the politics, as it shows something all at once, but does not generate any result in the long run.
In the examined period from 2009 till 2013 the importance of ALMPs is proved by the fact that the Europe 2020 strategy contains plans for developing totally new tools (EC, 2010). The diversity of the ALMP varies by countries, but the most common programs, regarding the inputs and the number of the participants, include the education programs (general, techni-cal, work), employment supporting programs (wage support etc), and public employment (Dar, Tzannatos 1999; Boone, Ouurs 2004; Hudomiet, Kézdi, 2008). Nowadays public em-ployment was highlighted with a different focus in certain countries of the European Union, regarding the inputs and the size of the concerned target group or the differentiation of the tool, which is detailed in Koltai (2013)’s analysis more.
Public Employment in Hungary
In the examined period the high European unemployment tendency is typical even to Hungary; the ratio of the regis-tered unemployed in the official National Employment Ser-vice (NES) was 12,3% in February 2009 compared to the economic active population, and it has been 15% in the same period of the year since 2010 (NES, 2009–2013). On the other hand the Central Statistical Office (CSO)/ILO used a rate of 10,0% in 2009 for international comparisons, 11,2% in 2010, and this rate hardly decreased since then (CSO, 2012). It was highlighted as economic news when this value decreased below 10% in the summer of 2013. All these might be the results of the seasonality of the unemployment or the effects of certain interventions (Internet, 1). The ratio of people be-ing long-term registered changes depending on these (2009: 28,5% 2012: 21,1%, 2013: 27,1%), or a jobseeker gets into the public employment relation, by which he or she becomes employed as due to the Labour Code it is a special job rela-tions, and it may be counted to the service period basing the old-age pension. All in all high unemployment may be still detected behind the movement of the economic active popula-tion and the statistical tendencies.
In the dimension of the intervention and the employment two centralized, widespread national programs are expedient to detail being relevant from the aspect of this study. Instead of the former public employment forms (public work, public aimed work, public benefit work) the Pathway to Work pro-gram (PWP) was introduced in April 2009, which is similar to the universal programs typical to the Northern and continental Europe in an international way (Hudomiet, Kézdi 2008). Its highlighted aim was to involve long-term unemployed people, who are able to work and receives well-fare benefits from lo-cal governments, into work in a more intensive way, by pay-ing regular wages. Practically it differentiated the target group of people who previously received regularly social assistance and besides the classical benefit it determined the participants, receiving “availability support recipient” (AS) by the title cash benefit of active ages, who may be involved into the program.
In the level of the realization the local governments striving to employ more people receiving 95% subsidy were forced to draw up annual public employment plan. Regarding the num-bers 103 247 persons took part in the program in 2009, while in the whole frame of public employment only 140 thousands persons worked in a supported status, which is much lower compared to the previous years, and it did not ceased the la-bour surplus (Tajti 2009). The Pathway to Work was ceased after the change of the government, and according to analyses, it did not meet the requirements. The cessation of the program may be detected in the statistics of the NES, as after the expiry of the labour contracts near 660 thousand persons (15%) were registered in February 2010 (NES, 2010). Minimal ratio of the concerned was reintegrated in the primary labour market, thus its transitive effect was weak, and it contributed to the evolvement of such a life strategy which stimulated the gain of the benefit by this permanent job opportunity, and it might strengthen the locking-in the public employment. According to the technical term named as “locking-in effect” people after participating in the program give up searching for jobs and be-come in a more unfavourable situation from the point of view of job-seeking than at the beginning. Both international and national researches proved this fact that in case of education or public employment programs after multiple-participation, the people become dependent on these programs causing an undesirable trap (Boone, Ours 2004; Hudomiet, Kézdi 2008; Csoba et al. 2010; Szabó 2013).
The Orbán-government continued the organization of the public employment in the same centralized structure. It an-nounced the National Public Employment Program on the 1st of January in 2011, which determined aims were to estab-lish the legal frame of the value generating public employ-ment, to involve working-age population and jobseekers into work and to enhance employment. Contrary to the previous view, the following types may be differentiated: short-term public employment (1 to 4 months, daily 4 hours), long-term public employment (12 months, daily 6 to 8 hours), national programs (for force majeure cases, budgetary agencies, e.g. Disaster Management Inspectorate, national parks, forestry), subsidy for serving the mobility of public employment. The START sample project was also introduced, which provided some possibilities for the organizers to employ people receiv-ing wage replacing benefit (the successor of availability sup-port) or jobseekers within several profile (value generating employment, agricultural sample project, sub-regional start-work, energy production, carrying out public tasks, ceasing illegal waste disposal sites etc.) On the basis of the yearly analysis on the active tools, the number of people involved in public employment was 265 607 in 2011, which is twice as much as it was two years earlier. This increased further, as 311 511 persons were registered in 2012 (NES 2012). As a comparison it must be highlighted that during the period of Pathway to Work it was typical that the inactive people became unemployed, since 2011 the movement in the active population that is the employed and jobseeking status in the statistics has changed (Kézdi 2011). Monitoring researches were hardly carried out on the structure of the presently op-
On the Conveyor Belt of Public Employment Programs between 2009 and 2013 in Hajdúböszörmény 83
APSTRACT Vol. 8. Number 2–3. 2014 pages 81–88 ISSN 1789-7874
erating public employment, which would aim at detecting the change of the labour market situation of the onetime partici-pants, but the probability of the success transitive effect is minimal.
To sum up neither this system served the reintegration; nevertheless it tried to hide the ever-growing unemployment in the name of the work-based society.
2. Material and method
It was revealed in the Introduction that the national public employment programs between 2009 and 2013 have been extremely popular, the number of those who were concerned increased; on the other hand the transitive effects of the pro-grams are doubtful. Whether what ratio of the program’s participants will become public employed again in case of a certain settlement? The empirical researches were carried out in Hajdúböszörmény, where surveys were done among the participants of the Pathway to Work Program in 2009 and Start-Work sub-regional sample project in 2013. It is impor-tant to highlight the fact that though they are samples of two questionnaire-based panel studies of different objectives, the availability or the lack of the transitive effect may be inves-tigated jointly along the set hypotheses. This is caused by mainly the negative and stagnating labor market situation as the primarily market is closed, and the number of new, not supported jobs are minimal. It is presumable that the severity of the government relating to the insurance and welfare-based supply system will further orient the active-aged job-seekers towards the public employment form. All these are strength-ened by an analysis based on secondary sources, and the first hypothesis was form along this: more than 50% of the respon-dents have already taken part in public employment once. The second one connects to this: it is presumable that the majority of the asked do not reject the opportunity of supported re-employment. The re-employment is a recurring process in the history of the national programs, but while the supply system was less sanctioned and concerned a more homogeneous tar-get group earlier, till today the market and economic condi-tions have changed.
The first sampling derives from a program evaluation re-search in Hajdúböszörmény where measuring the input in No-vember 2009 was followed by monitoring the labor market change (output) of the participants during a longitudinal panel analysis after two and a half years. When carrying out the sur-vey 50% of the Pathway to Work participants was asked and the response rate consisting of 191 persons was representative regarding the independent variable of sex and age as well as the size of the created 4 labor groups compared to the full number of the employed in the examined month. Analyzing several principle components the socio-demographic fea-tures (sex, age, education, family status), the profit structure of the households, the employment history and job-seeking techniques etc. of the participants were revealed. In this pa-per the participations in public employment prior 2009 and its explanatory variables are detailed and the ratio of re-em-
ployment being relevant from the result of output measure is summarized.
The second sampling occurred in the same city, but it aimed at examining the participants in the start work sample program in 2013. Questionnaires and managerial critical in-terviews were used again during this new analysis. Regarding the structure of the questionnaire it consisted of a general data sheet and questions defined on the basis of the hypotheses in connection with the given target group. The questions were mainly multiple choice questions. The investigated program started on the 1st of March, the survey was carried out in May among the public employed who were the soonest referred in this year. The project elements in the start sample program in 2013 may be divided into two larger fields. One of them relates to program elements of social features, the other field is in connection with economic efficiency. The questionnaire contained 37 questions and altogether 30,7% (300 persons) of the public employed (987 persons) being involved in the program filled them in.
3. Results and discussion
Though the two samplings relate to different periods, the neg-ative tendencies have been still prevailing in the labour mar-ket in Hajdúböszörmény since 2009 and the role of the local government in employment has further decreased. First, the tendency of the number of job-seekers based on registration was summarized in Table 1. On the basis of our calculation the change in the number of the registered people decreased by 11% in a monthly average in a year between 2009 and 2012, but the seasonal mid-year fluctuation of the data has to be considered as well or it is necessary to deal with the attrac-tive effect of the published public employment programs, as after their start a part of the people got into employment legal relations. Highlighting a concrete example thank to the sub-regional sample projects in 2012 altogether 840 persons were involved for the whole year, thus the average change in the number reached 15% compared to the year 2011. At the same time by the end of the program 2814 persons were registered again in January 2013 (NES 2013).
The problem may be further investigated by comparing the national and settlement-leveled relative indicators, which reflect the ratio of job-seekers from the working-age popula-tion. This value is much higher in 2012 in Hajdúböszörmény (1,2%), in this way the decline caused by the economic cri-sis still depresses this rural settlement and there are relatively more people without any job. At the same time regarding the regional and county data the settlement is in a much more fa-vourable situation as for example the neighboring Hajdúhad-ház this ratio is 2,9.
Second, the public employment has to be scrutinized, which is considered as a popular tool for improving the statis-tics and reveals the employment and social-political endeavor of the actual government. In the work-based society as already mentioned in the Introduction the welfare benefits were got along a stricter control on the basis of “work instead of aid”
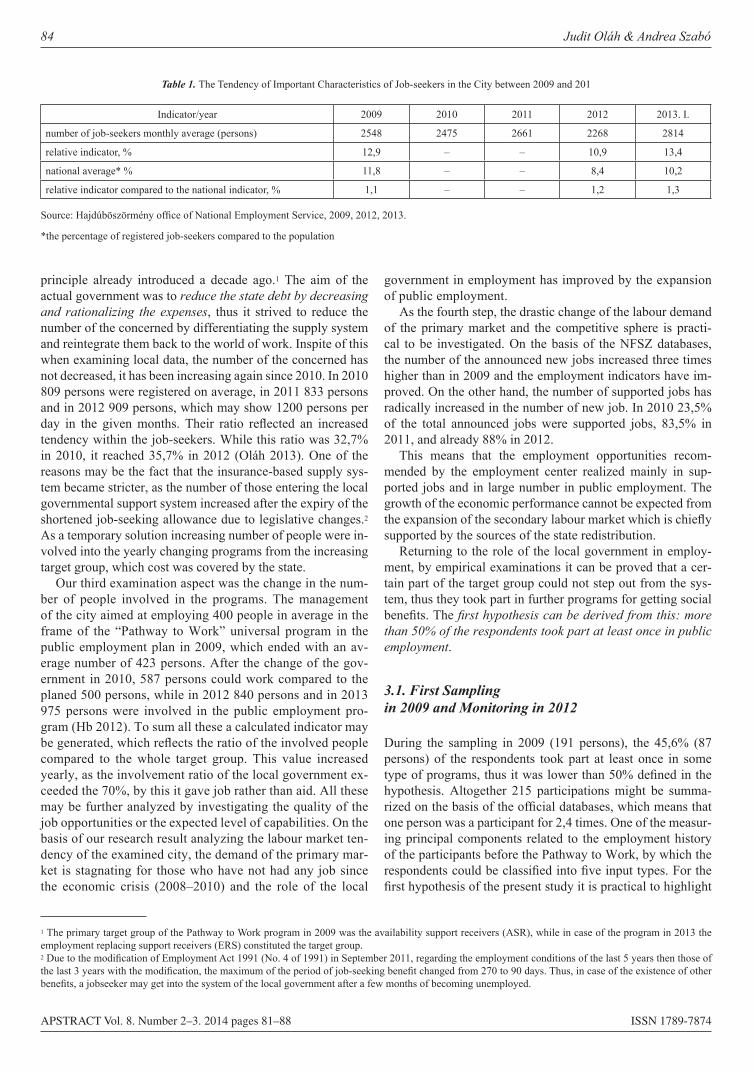
84 Judit Oláh & Andrea Szabó
APSTRACT Vol. 8. Number 2–3. 2014 pages 81–88 ISSN 1789-7874
principle already introduced a decade ago.1 The aim of the actual government was to reduce the state debt by decreasing and rationalizing the expenses, thus it strived to reduce the number of the concerned by differentiating the supply system and reintegrate them back to the world of work. Inspite of this when examining local data, the number of the concerned has not decreased, it has been increasing again since 2010. In 2010 809 persons were registered on average, in 2011 833 persons and in 2012 909 persons, which may show 1200 persons per day in the given months. Their ratio reflected an increased tendency within the job-seekers. While this ratio was 32,7% in 2010, it reached 35,7% in 2012 (Oláh 2013). One of the reasons may be the fact that the insurance-based supply sys-tem became stricter, as the number of those entering the local governmental support system increased after the expiry of the shortened job-seeking allowance due to legislative changes.2 As a temporary solution increasing number of people were in-volved into the yearly changing programs from the increasing target group, which cost was covered by the state.
Our third examination aspect was the change in the num-ber of people involved in the programs. The management of the city aimed at employing 400 people in average in the frame of the “Pathway to Work” universal program in the public employment plan in 2009, which ended with an av-erage number of 423 persons. After the change of the gov-ernment in 2010, 587 persons could work compared to the planed 500 persons, while in 2012 840 persons and in 2013 975 persons were involved in the public employment pro-gram (Hb 2012). To sum all these a calculated indicator may be generated, which reflects the ratio of the involved people compared to the whole target group. This value increased yearly, as the involvement ratio of the local government ex-ceeded the 70%, by this it gave job rather than aid. All these may be further analyzed by investigating the quality of the job opportunities or the expected level of capabilities. On the basis of our research result analyzing the labour market ten-dency of the examined city, the demand of the primary mar-ket is stagnating for those who have not had any job since the economic crisis (2008–2010) and the role of the local
government in employment has improved by the expansion of public employment.
As the fourth step, the drastic change of the labour demand of the primary market and the competitive sphere is practi-cal to be investigated. On the basis of the NFSZ databases, the number of the announced new jobs increased three times higher than in 2009 and the employment indicators have im-proved. On the other hand, the number of supported jobs has radically increased in the number of new job. In 2010 23,5% of the total announced jobs were supported jobs, 83,5% in 2011, and already 88% in 2012.
This means that the employment opportunities recom-mended by the employment center realized mainly in sup-ported jobs and in large number in public employment. The growth of the economic performance cannot be expected from the expansion of the secondary labour market which is chiefly supported by the sources of the state redistribution.
Returning to the role of the local government in employ-ment, by empirical examinations it can be proved that a cer-tain part of the target group could not step out from the sys-tem, thus they took part in further programs for getting social benefits. The first hypothesis can be derived from this: more than 50% of the respondents took part at least once in public employment.
3.1. First Sampling in 2009 and Monitoring in 2012
During the sampling in 2009 (191 persons), the 45,6% (87 persons) of the respondents took part at least once in some type of programs, thus it was lower than 50% defined in the hypothesis. Altogether 215 participations might be summa-rized on the basis of the official databases, which means that one person was a participant for 2,4 times. One of the measur-ing principal components related to the employment history of the participants before the Pathway to Work, by which the respondents could be classified into five input types. For the first hypothesis of the present study it is practical to highlight
Table 1. The Tendency of Important Characteristics of Job-seekers in the City between 2009 and 201
Indicator/year 2009 2010 2011 2012 2013. I.
number of job-seekers monthly average (persons) 2548 2475 2661 2268 2814
relative indicator, % 12,9 – – 10,9 13,4
national average* % 11,8 – – 8,4 10,2
relative indicator compared to the national indicator, % 1,1 – – 1,2 1,3
Source: Hajdúböszörmény office of National Employment Service, 2009, 2012, 2013.
*the percentage of registered job-seekers compared to the population
1 The primary target group of the Pathway to Work program in 2009 was the availability support receivers (ASR), while in case of the program in 2013 the employment replacing support receivers (ERS) constituted the target group.2 Due to the modification of Employment Act 1991 (No. 4 of 1991) in September 2011, regarding the employment conditions of the last 5 years then those of the last 3 years with the modification, the maximum of the period of job-seeking benefit changed from 270 to 90 days. Thus, in case of the existence of other benefits, a jobseeker may get into the system of the local government after a few months of becoming unemployed.
On the Conveyor Belt of Public Employment Programs between 2009 and 2013 in Hajdúböszörmény 85
APSTRACT Vol. 8. Number 2–3. 2014 pages 81–88 ISSN 1789-7874
several results on the rotating group. 56 (29,3%) of the 191 persons belonged to this group, who called themselves as pub-lic workers, who fulfill public objectives and got aids. Every of them belongs to the already mentioned 87 persons.
Those people were classified into this type who worked in the secondary market before the program in 2009, or received passive supply. Analyzing their socio-demographic features, the ratio of men is 73,2% (41 persons), which is higher by 25% compared to the value (57,6%) typical to the sample. In case of the 56 persons, the ratio of the certain age groups was almost equal, for example the number of people under 28 years old (14 persons, 25%) was the same as those above 49 years of age. It cannot be assumed that exit from a program and entering to another one relates to a certain age group, for example to people above 50 years of age being in the most dangerous situation in the primary labour market.
5 of the 56 respondents did not finish their studies in prima-ry school, 21 persons have a basic level of education (37,5%), and those who completed a specialized school reflects almost the same ratio (22 persons, 39,2%) and 8 persons graduated from high school from which 7 were women. All in all, the highest level of education of the members in the group is at the level of technical school (85,7%).
On the basis of the variable of family status, the group is heterogeneous, most of them are single (18 persons, 32,1%), the number of men is twice as much than that of women, they were followed by the married (14 persons), the divorced (12 persons) and those who live in partnership (9 persons). The size of the households changed from 1 to 12 members, large families with children (8 persons) and multigenerational families belonged to this group. The history of the employ-ment reflected rather a heterogeneous view on the fact that who and how got into the swirl of the public employment and the “work instead of aid” of supply system. The majority of people already getting aids for more than 5 years (34 persons) could not remember all these. According to them they were used to the temporary opportunities of public employment, and the Pathway to Work served not novelty but further op-portunity to continue the ordinary work and security for the elderly people (10. 15. 74. 95. 102. 118.3). The so-called lock-ing-in effect proved to be evolved among them, which might be strengthened by the sex, education or ethnic affiliation as an independent socio-demographic variable.
Summarizing the results of the first input sampling we con-cluded that the first hypothesis might be rejected. It must be highlighted, however, that the ratio of the men (73,2%) in the rotating group is extremely high and those who concerned have mainly (85,7%) technical education. The locking-in ef-fect is likely among them, thus they will be public employees again.
Two and a half years later (2012) the same sample of 191 persons was monitored by a longitudinal panel study. During an impact assessment aiming at revealing the re-integration the output of labour market was analyzed. The only thing be-
ing relevant from the aspect of this paper is that how many persons are known as newly public employees. On the basis of the panel study 78 persons, being 40,83% of the sample, worked for a supported job within the START work program.
The ratio of men was extremely high among the re-em-ployed (51 persons, 65,4%), twice as high as the ratio of women (27 persons, 34,6%). All these differed from the input values of the sample (a sample of 191 persons, the ratio of men is 57,6%), in this way correlations might be revealed. By using crosstabs it turned out that 92,1% (47 persons) of the men have maximum technical education, and the ratio of the graduated is only 7,9% (4 persons). Contrary to this, the difference in the educational level between the sexes is for the women, as the ratio of those who graduated is near five times higher in women (37,1%). The second cause and effect connection is true between the variables of sex and input as 52,9% (27 persons) of the men worked in a supported em-ployment even before 2009. They were rotating in the devil’s trap of the public employment and supply systems. 78 persons are between 20 and 55 years of age, the average age is 38,8 years. The distribution of the ages is relatively homogeneous here as well, in this way it is not true that the locking-in effect is stronger in case of certain ages. In harmony with the input measures, the rotating status is independent from the ages, as people under 28 years of age (18 persons) stayed in the system just like the older unemployed (19 persons of 49–55 years of age).
Every second person (38 ones) of the whole group have a technical educational level, the ratio of those having pri-mary education is 26,9% (21 persons), while 5 persons did not finish the primary school. To sum up 82% of the public employed finished maximum technical school, which is paral-lel to the educational level of those (85,7%) who belong to the input type of the rotating group. Most of them are singles (24 persons, 30,8%). The presence of the married (19 persons) and the divorced (20 persons) is similar (24,4%), and just like in case of the whole sample, the ratio of men of the married is higher (78,9%).
When revealing the history of their employment it turned out that 35 persons (44,8%) of the 78 persons who were public employed during the output measuring in 2012 worked in the same supported form before the program of 2009, in this way they belonged to the input type (56 persons) of the rotating group. According to the official registrations, everybody took part in a program at least once (1–10 programs per one per-son), moreover, 9 persons worked for three times, while 1 per-son worked already in 10 programs (166.). Summarizing the number of the participations (2000–2009), they were referred for 93 times, which means 2,65 occasion per one person. Summing up the time of the program and the period of wel-fare supply won again after it, 1 person have been rotating in the system at least for 6 years. The ratio of men was extremely high among the 35 persons (27 persons, 77,1%). At the same time regarding the educational level this group is more ho-
3 The number relates to the number of the questionnaires.
86 Judit Oláh & Andrea Szabó
APSTRACT Vol. 8. Number 2–3. 2014 pages 81–88 ISSN 1789-7874
mogeneous, as a part of the group (51,4%, 18 persons) has a technical educational level, the other part (42,8%, 15 persons) finished only primary school. Only two young women hav-ing university degree belonged to them, who got into a public aimed or public program as entrants in 2007–2008 and have been working there with short break since then.
At last thank to the different research methods (question-naire-based survey, field work, brigade discussions etc.) it turned out that in case of the rotating group a developed hi-erarchy exists (“elite core”) in the certain building/communal work group, to which the new entrants adjust, while those who were concerned in institutes were given tasks with greater re-sponsibility. The reason is the fact that due to their good work-ing performance the organizers of the system considered them as stable labourforce and they were involved in any programs in order to insure their livelihood as well. From the aspect of the impact assessment, the dependence on tools and locking-in effect might be come to life. Many sociological studies drew the attention to the fact that the system of the public employment is in the trap of the maintainers’ and organizers’ interests, which may conserve the social and labour-market condition of certain groups (Csáki et al. 2007; Váradi 2009; Csoba et. al. 2010).
Summarizing all these output results the survey carried out two and a half years later may be considered as parallel to the input values. In both cases the re-employment may be detected in men independent from the age having maximum technical educational level. The one-time participation of 50% defined in the hypothesis was not verified in the input measure of the sample, at the same time it turned out that in both cases the locking-in effect, the possibility of the further re-employment, is really strong.
3.2. Another Sampling in 2013
As we mentioned in the methodology part 300 persons were asked during the realization of the sub-regional project in 2013. On the basis of the first hypothesis, the justification of the previous participations was a repeated expectation. 78% (234 persons) of the participants said that during the last 5 years they were previously public employed at least once, by which the hypothesis was proved in this case. As there was not any chance to carry out any control test, the number of the real participants cannot be based on precise official data. 70% of the 234 persons is men (165 persons), which ratio differs from the input ratio of the sample of 300 persons, as 110 women (36,6%) and 190 men (63,3%) filled in the questionnaires. The reason was firstly the task profile of the public employment program, as the working tasks of the projects suppose mainly men labourforce based on the feature. Narrowing the sample on the basis of the hypothesis regarding the age, the ratio of people between 36 to 50 years is a little higher than the others as less participants under 28 years took part compared to the data of the Pathway to Work program. It is important to high-light that the two samplings cannot be compared to each other because the selection system of the participants of the pro-
grams changed, thus different age categories were used during the two samplings. Despite these it is relevant to highlight that the public employer is not stimulated by any discounts as in case of employers of the primarily labour market where they get more subsidies when employing people of certain ages. People are rather chosen according to the task profile, where sex and education are dominant (Csoba 2010a).
The highest educational level reflects a heterogeneous con-dition but the tendency is true even here that the ratio of people having primary education level or lower level than that is high (72 persons, 31%), as the employment opportunities of the un-qualified in the primary market is minimal. People having any profession constituted the other group (111 persons, 47%), whose occurrence was higher among the one-time participants compared to the whole sample. The reason is the labour need of the projects as well, as the management of the city handles value-generating employment with high priority as well as the stimulation of becoming self-supporting harmonizing with the objectives of the government. Highlighting a concrete ex-ample in case of the agricultural plant production project or public road maintenance it is important to employ people hav-ing agricultural or building industrial qualification instead of people hired for fulfilling the classical public cleaning tasks. There are re-employed people among those having secondary education (51 persons, 21%), who were employed for insti-tutional administrative tasks, as professional managers (work organizers, team leaders) or for carrying out educational tasks. Due to the newest legislative severity, the acceptance of the public employment opportunity has become compulsory for those getting welfare benefits: “…the act makes compulsory to accept any job one level lower than the educational level; furthermore, it is compulsory to accept every recommended job regardless educational qualification, including the pub-lic work as well. When it is neglected, the subsidy replacing employment ensured by the local governments is sanctioned ceased (No. 4 Act of 1991, 25. § (2)).
The supposition of re-participation is further strengthened by the fact that 54% (161 persons) of the 300 persons worked as public employees for three times or more, thus the major-ity of the 234 persons were employed for several times. It is clear just in case of the previous sampling that the ratio of people is high who cannot return the primary market after one participation. It must be highlighted, though, that these are two different samples, in this way there is not any correla-tions between the ratios. Looking for reasons, it is practical to strengthen the result of the secondary analysis, by which the public employment has become primary employment type in the case of the examined local-government. Beside the fact that public employment goes with several positive effects with respect to the employers, on the basis of the survey rotat-ing people who locked-in the public employment return to the primary labour market in a more difficult way. The return to the primary labour market is difficult because they do not have any time for job-seeking, and the participants in the program are used to the seasonality of public employment. They wait for starting a program for even several months without active job-seeking. Regarding the second sampling the justification
On the Conveyor Belt of Public Employment Programs between 2009 and 2013 in Hajdúböszörmény 87
APSTRACT Vol. 8. Number 2–3. 2014 pages 81–88 ISSN 1789-7874
of the statement is proved by the result relating to the length of the period spent in public employ-ment (Figure 1).
126 respondents (42%) of the sample consisting of 300 persons have been taking part in public employment programs for more than 2 years with more or less interruptions. 54% of the basic population has already taken part in 3 programs, 21% (64 persons) have been public employed for 1 to 2 years, 13% (40 persons) for 6 to 12 months and 23% (70 per-sons) for 0 to 6 months.
The second hypothesis is the following basing on the pre-viously mentioned facts:
It might be presumed that the majority of the asked do not reject the opportunity of supported re-employment.
3.3. First Sampling in 2009
In case of the sample of 191 persons, the question related to the fact that if they had the opportunity to work as public em-ployers again in 2010, whether they would undertake it. 45% (87 persons) of the respondents would willingly continue the present job even getting such a low salary, because it helps in self-assessment and see their work important. 13% (26 per-sons) said that they have not any other choice, they have to accept it again and only 5% rejected it totally. It is interest-ing that in the largest group of the respondents every second person worked in public employment firstly in 2009 and the answers reflected an optimistic attitude and active job-seeking behavior. In total the ratio of those who reject the employment is minimal, which is caused by the negative labour market ten-dencies, as well as the lack of other typed permanent liveli-hood opportunities.
3.4. The Other Sampling in 2013
The sampling of 300 persons happened in 2013, when the eco-nomic conditions and employment opportunities are likewise limited, though the reached success of the government can-not be neglected. The opportunity of re-employment was also listed in the questionnaire, and the received answers proves the expectations fully as the ratio of those who accept the op-portunity is extremely high (57%, 170 persons). Although an announced full-time job would be the most attractive solution for everyone, they showed an accepting behavior towards a newer supported job. The public employment is considered as the best probation, especially for women having graduation got into the institutions of the public sphere. In their opin-ions in the period of public servant appointments the selection from the known and well-tried workers will become necessary
and possible. Here we have to return to the result of the first hypothesis as the risk of locking-in and rotation is improved by this. The interest of the organizers is clear by which those who are competent take the legislative rules into consider-ations and concentrate on the fact that they should employ job-seekers into start work program, lasting for at least 12 months, who performed in harmony with the expectations during their previous public employment. As the acceptance of the public employment is compulsory, according to the leg-islative rules, it is a further reason for the returning participa-tion. Because sample projects require higher ratio of technical workers and secondary educational people, the same people get into the programs due to the lack of the announcement to primary labour market.
During the research interviews were made with the special-ists of the labour office as well as with the organizers of the public employment. They strengthened the popularity of the employment form as due to the lack of other job opportunities the demand from job-seekers extremely increased.
4. Conclusion
In the first research there was a chance to carry out input and output measures within a longitudinal panel test, which result of impact assessment highlighted the fact that ratio of men was extremely high independently from the age among the re-employed in both surveys and they have mainly technical education. These statements relating to sex and education are strengthened by other empirical researches as well. Csaba et al. (2010) carried out the evaluation of labour market pro-grams with complex control groups within the TÁMOP 1.3.1. highlighted program. Using a sample of more than 1500 per-sons from more sub-regions, they analyzed the public employ-ment as an active input and output variable. According to their results the effects of these programs to sexes and education is differentiated, as their returning participants are mainly men having primary education or lower level of education.
On the basis of our further results the locking-in effect may be detected in case of both of the samplings, which is proved even by the research of Hudomiet and Kézdi (2008) or Csoba et al. (2010). Regarding this last one, one third of the people
Figure 1. Introduction of the investigated sample
Source: own data gathering, n = 300
88 Judit Oláh & Andrea Szabó
APSTRACT Vol. 8. Number 2–3. 2014 pages 81–88 ISSN 1789-7874
in the sample took part in public employment programs regu-larly. The rotation is especially detected in men, who rotate back to the public employment as seasonal workers in a cer-tain period of the year. According to the complex study after participating 5 to 6 times in public employment, there is hard-ly any chance for the open labour market output. Dependence evolves and there is not any initiating behavior. The longer somebody rotates in the system, the less motivated he or she will be. On the basis of the control group examination after the third supported employment the trap situation of public employment may evolve, called the locking-in effect, when people get into a situation, which is more unfavourable than the starting position (Csoba et al., 2010; Hudomiet–Kézdi, 2008).
The local government of Hajdúbsözörmény should cooper-ate more closely with the minority government, civil organi-sations and relevant labour offices during the preparation and implementation of public employment programmes (Oláh, 2014).
As a conclusion of the two micro-leveled examinations, the primary labour market is closed, there are not any new jobs in a typical rural settlement, where the unemployment rate is not dominant from the national aspect. Local government in-volves people into programs again due to the lack of better opportunities. People getting aid are liable to accept it in order to save the entitlement of welfare supplies.
References
Boone J & Ours J (2004): Effective Active Labor Market Policies. The Institute for the Study of Labor (IZA), Discussion Paper No. 1335. Bonn, pp. 40. http://ftp.iza.org/dp1335.pdfCsáki R, Csánk I, Kis J, Turbucz M & Végh M (2007): A mun-kaerőpiactól való távolmaradás vizsgálata Deszk, Kübekháza, Tiszasziget, Újszentiván településeken. In: Város és vidéke telepü-lésszociológiai tanulmányok. 2003–2006 (szerk.) Rácz A., Szeged, pp. 223.Csoba J (2010): Segély helyett munka. In: A közfoglalkoztatás for-mái és sajátosságai. Szociológiai Szemle. 1. sz. pp. 26–52.Csoba J, Nagy Z & Szabó F (2010): Aktív eszközök, munka erő-piaci programok kontrollcsoportos, többváltozós értékelése. ÁFSZ megbízásából TÁMOP 1.3.1. kiemelt program 3.2. A foglalkoztatás-politikai döntések megalapozása, Debrecen, pp. 160. Dar A & Tzannatos Z (1999): Active Labor Mar-ket Programs: A review of the Evidence from Evalua-tions. World Bank, SP Discussion Paper N. 9901., pp.86.http://rru.worldbank.org/documents/toolkits/labor/toolkit/pdf/refer-ence/Dar_Tzannatos_1999_854C0.pdfEC (2010): Active labor market policies for the EU2020-strategy: ways to move forward. 26 October, 2010 http://ec.europa.eu/social/main.jsp?catId=88&langId=hu&eventsId=281&furtherEvents=yesEMPLOYMENT OUTLOOK (1993): Active labour market poli-cies: assessing macroeconomic and microeconomic effects In: Em-ployment Outlook 1993, Part 2, OECD, pp. 42. http://www.oecd.org/dataoecd/59/23/2485416.pdf
Internet 1 (2013): Csökkent a munkanélküliség. 2013. július. http://www.hrportal.hu/hr/tovabb-csokkent-a-munkanelkuliseg-20131029.htmln EUROSTAT (2013): Eurostat- Unemployment statistics. 2013. ok-tóber.http://epp.eurostat.ec.europa.eu/statistics_explained/index.php/Un-employment_statisticsHudomiet P & Kézdi G (2008): Az aktív munkaerő-piaci progra-mok nemzetközi tapasztalatai. Kormányzás, Közpénzügyek, Szabá-lyozás. 3 évf. 1. sz. pp. 3–37. http://www.kormanyzas.hu/081/01_Hudomiet-Kezdi.pdfKézdi G (2011): Foglalkoztatáspolitikai programok hatásvizsgálata In: Munkaerőpiaci Tükör 2011. MTA közgazdaságtudományi Inté-zet, Budapest, pp. 41–72.Kis K (2008): Employment and income in the Hódmezővásárhely micro-region. Agrár- és Vidékfejlesztési Szemle. Vol. 3. (1) pp. 1–5. Kis K (2012): A vidéki erőforrások helyzete és szerepe a Hódmező-vásárhelyi kistérség gazdaságában. Doktori (PhD) értekezés, Debre-ceni Egyetem. 215.Koltai L (2013): A közfoglalkoztatás szerepe válság idején az euró-pai országokban. Munkaügyi Szemle. 1 sz. pp. 27–38. KSH (2012): Hazai munkanélküliség ráta 2010–2012 között. http://www.ksh.hu/docs/hun/xstadat/xstadat_eves/i_qlf017.htmlOláh J (2012): A közfoglalkoztatottság javításának lehetőségei Hajdúdorogon. A Virtuális Intézet Közép-Európa Kutatására Közle-ményei. IV. évf. 2. sz. (No.8.) A sorozat 1. Gazdálkodás- és szerve-zéstudományi tematikus szám, Szeged, pp. 9–16. Oláh J (2013): A foglalkoztatottság aktuális kérdései az Észak-alföl-di Régióban. Debreceni Egyetem. Habilitációs értekezés. 114.Oláh J (2014): The role and importance of public employment programmes: the case of Hajdúböszörmény micro-region, Hungary, Studies in Agricultural Economics, 116 (2014) Agrárgazdasági Kuta-tó Intézet, Budapest, pp. 131–139.NES (2009–2013): Munkanélküliségi ráta a gazdaságilag aktív né-pességhez viszonyítva, havi részletes adatai adatott év februárjában. http://nfsz.munka.hu/engine.aspx?page=full_afsz_havi_reszletes_adatok_2011http://nfsz.munka.hu/engine.aspx?page=full_afsz_havi_reszletes_adatok_2012http://nfsz.munka.hu/engine.aspx?page=full_afsz_havi_reszletes_adatok_2013http://nfsz.munka.hu/engine.aspx?page=full_afsz_havi_reszletes_adatok_2009NES (2013): Településsoros adat, munkanélküliségi ráta 2013. február Hajdúböszörmény. http://nfsz.munka.hu/engine.aspx?page=full_afsz_stat_telepules_adatok_2013Szabó A (2013): A közfoglalkoztatás a gazdasági ciklusok kontex-tusában. Phd dolgozat, Ihrig Károly Gazdálkodás- és Szervezéstudo-mányok Doktori Iskola, Debrecen, pp. 222Tajti J (2009): Aktív foglalkoztatáspolitikai eszközök működése 2009-ben. Foglalkoztatási és Szociális Hivatal, Budapest pp. 67 www.afsz.hu/resource.aspx?ResourceID=stati_foglalk...eszk_2009.pdfVáradi M (2009): Az Út a Munkához program hatásvizsgálatának eredményei. Kutatási Összefoglaló, MTA Térségfejlesztési Kutatá-sok Osztálya, Budapest, pp. 31
APSTRACT Vol. 8. Number 2–3. 2014 pages 89–97 ISSN 1789-7874
Background
In the period before the change of regime, the socialist state apparatus tried to resolve the problems of people with dis-abilities and with a changed work capacity within its own framework.
According to the laws, occupational rehabilitation was the employer’s responsibility. (no 33/1963. (XII. 3) order of the Government; no 2014/1967. (III. 29) resolution of the Gov-ernment; no 1/1967. (XI. 22.) MüM-EüM-PM joint order of the Minister of Labour, the Minister of Health and the Min-ister of Finance on the resolution of the situation of workers with a reduced work capacity).The company was obliged to establish the Corporate Committee Dedicated to People with a Reduced Work Capacity (hereinafter referred to as the reha-bilitation committee), which was responsible for organising workplace rehabilitation, retraining of the employee, transfor-mation of the workplace, new job training, etc. (Kálmán and Könczei 2002).
The ever growing number of disability pensioners since 1967, i.e. following the adoption of the Disability Pension Order, indicated that the provision of working conditions, which are appropriate with respect to the capacities and state of the person, was an important task at the level of legisla-
tion, but real efforts were not made for the realisation thereof. According to findings of Kálmán and Könczei (2002), due to the undeveloped and defective nature of the rehabilitation system, the concerned parties (economic actors and persons who may be rehabilitated) are not interested in the operation of the system, either. At the same time, a typical phenomenon of this period is that the person who became disability pen-sioner subsequently fled to the second economy under “self-employment”.
The operational anomalies of the disability system caused budgetary difficulties already in the eighties, therefore the government of that period set as a target the necessary reduc-tion of the number of people with permanent disabilities in order to restore financial equilibrium in Hungary.
By its resolution adopted in 1986, the Council of Minis-ters set itself the task of correcting the definition of permanent disability and the work capacity reduction assessment system and creating the interest of employees with a reduced work capacity for rehabilitation, the higher responsibility of eco-nomic entities and the 3% mandatory employment of workers with a reduced work capacity.The government’s objective: to reduce the number of people who are disability pensioners and are able to work, but do not work or do not work in the state sector, by determining an absolute sum of disability pension
The labour markeT posiTion of people wiTh disabiliTies and wiTh a reduced work capaciTy afTer The change of
regimeBalázs-Földi Emese
University of DebrecenIhrig Károly Doctoral School of Management and Business Administration
Abstract: The study aims at exploring, based on an overview of the professional literature, the economic, social and employment policy situation which characterised the period from the change of regime to 10 years thereafter and concerned people with disabilities and with a reduced work capacity, as well as, the institutions and instruments influencing the related labour market demand and supply. It discusses those initiatives too which aim at increasing the economic activities of the related disadvantaged group.The topicality of the study comes from the fact that in the past few years the government has put a number of stricter legislation into force to strengthen the labour market position of people with disabilities and with a reduced work capacity in Hungary. Notwithstanding, the affected group still has low economic activity. In its background there is partially the economic-social situation and approach which characterised the transition period, as well as, the weak efficiency of the rehabilitation system, which was forming that time.
Keywords: disability, reduced work capacity, labour market institutions and instruments, change of regime
Applied Studies in Agribusiness and Commerce – APSTRACTAgroinform Publishing House, Budapest scienTific papers
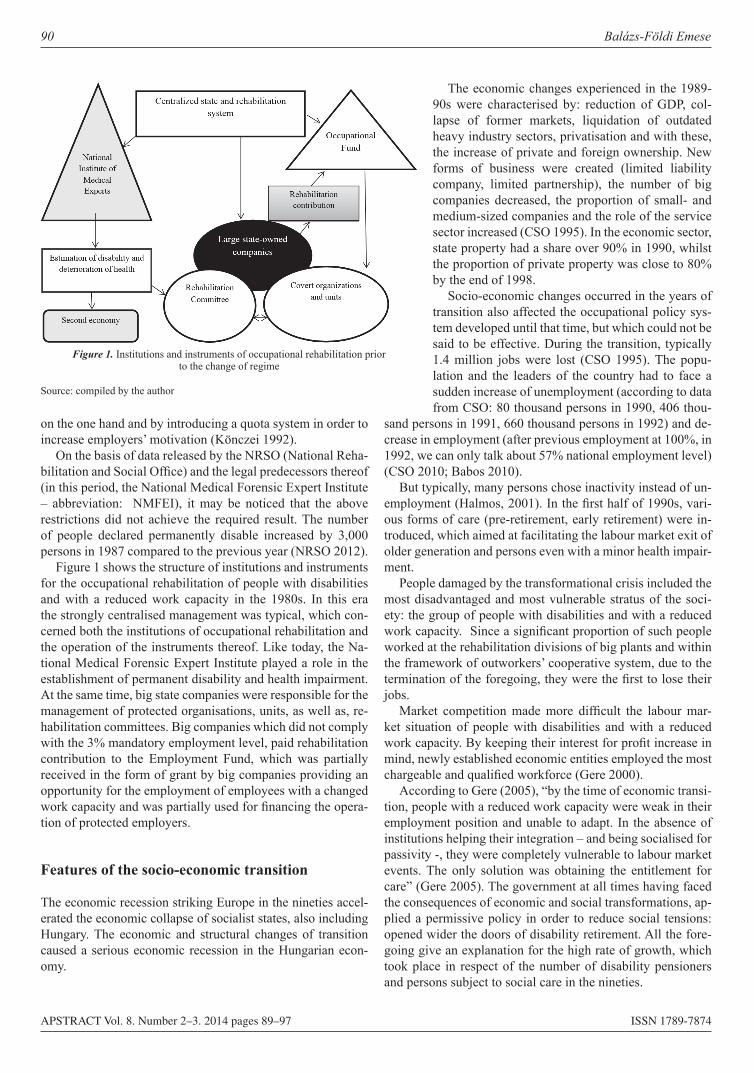
90 Balázs-Földi Emese
APSTRACT Vol. 8. Number 2–3. 2014 pages 89–97 ISSN 1789-7874
on the one hand and by introducing a quota system in order to increase employers’ motivation (Könczei 1992).
On the basis of data released by the NRSO (National Reha-bilitation and Social Office) and the legal predecessors thereof (in this period, the National Medical Forensic Expert Institute – abbreviation: NMFEI), it may be noticed that the above restrictions did not achieve the required result. The number of people declared permanently disable increased by 3,000 persons in 1987 compared to the previous year (NRSO 2012).
Figure 1 shows the structure of institutions and instruments for the occupational rehabilitation of people with disabilities and with a reduced work capacity in the 1980s. In this era the strongly centralised management was typical, which con-cerned both the institutions of occupational rehabilitation and the operation of the instruments thereof. Like today, the Na-tional Medical Forensic Expert Institute played a role in the establishment of permanent disability and health impairment. At the same time, big state companies were responsible for the management of protected organisations, units, as well as, re-habilitation committees. Big companies which did not comply with the 3% mandatory employment level, paid rehabilitation contribution to the Employment Fund, which was partially received in the form of grant by big companies providing an opportunity for the employment of employees with a changed work capacity and was partially used for financing the opera-tion of protected employers.
Features of the socio-economic transition
The economic recession striking Europe in the nineties accel-erated the economic collapse of socialist states, also including Hungary. The economic and structural changes of transition caused a serious economic recession in the Hungarian econ-omy.
The economic changes experienced in the 1989-90s were characterised by: reduction of GDP, col-lapse of former markets, liquidation of outdated heavy industry sectors, privatisation and with these, the increase of private and foreign ownership. New forms of business were created (limited liability company, limited partnership), the number of big companies decreased, the proportion of small- and medium-sized companies and the role of the service sector increased (CSO 1995). In the economic sector, state property had a share over 90% in 1990, whilst the proportion of private property was close to 80% by the end of 1998.
Socio-economic changes occurred in the years of transition also affected the occupational policy sys-tem developed until that time, but which could not be said to be effective. During the transition, typically 1.4 million jobs were lost (CSO 1995). The popu-lation and the leaders of the country had to face a sudden increase of unemployment (according to data from CSO: 80 thousand persons in 1990, 406 thou-
sand persons in 1991, 660 thousand persons in 1992) and de-crease in employment (after previous employment at 100%, in 1992, we can only talk about 57% national employment level) (CSO 2010; Babos 2010).
But typically, many persons chose inactivity instead of un-employment (Halmos, 2001). In the first half of 1990s, vari-ous forms of care (pre-retirement, early retirement) were in-troduced, which aimed at facilitating the labour market exit of older generation and persons even with a minor health impair-ment.
People damaged by the transformational crisis included the most disadvantaged and most vulnerable stratus of the soci-ety: the group of people with disabilities and with a reduced work capacity. Since a significant proportion of such people worked at the rehabilitation divisions of big plants and within the framework of outworkers’ cooperative system, due to the termination of the foregoing, they were the first to lose their jobs.
Market competition made more difficult the labour mar-ket situation of people with disabilities and with a reduced work capacity. By keeping their interest for profit increase in mind, newly established economic entities employed the most chargeable and qualified workforce (Gere 2000).
According to Gere (2005), “by the time of economic transi-tion, people with a reduced work capacity were weak in their employment position and unable to adapt. In the absence of institutions helping their integration – and being socialised for passivity -, they were completely vulnerable to labour market events. The only solution was obtaining the entitlement for care” (Gere 2005). The government at all times having faced the consequences of economic and social transformations, ap-plied a permissive policy in order to reduce social tensions: opened wider the doors of disability retirement. All the fore-going give an explanation for the high rate of growth, which took place in respect of the number of disability pensioners and persons subject to social care in the nineties.
Figure 1. Institutions and instruments of occupational rehabilitation prior to the change of regime
Source: compiled by the author
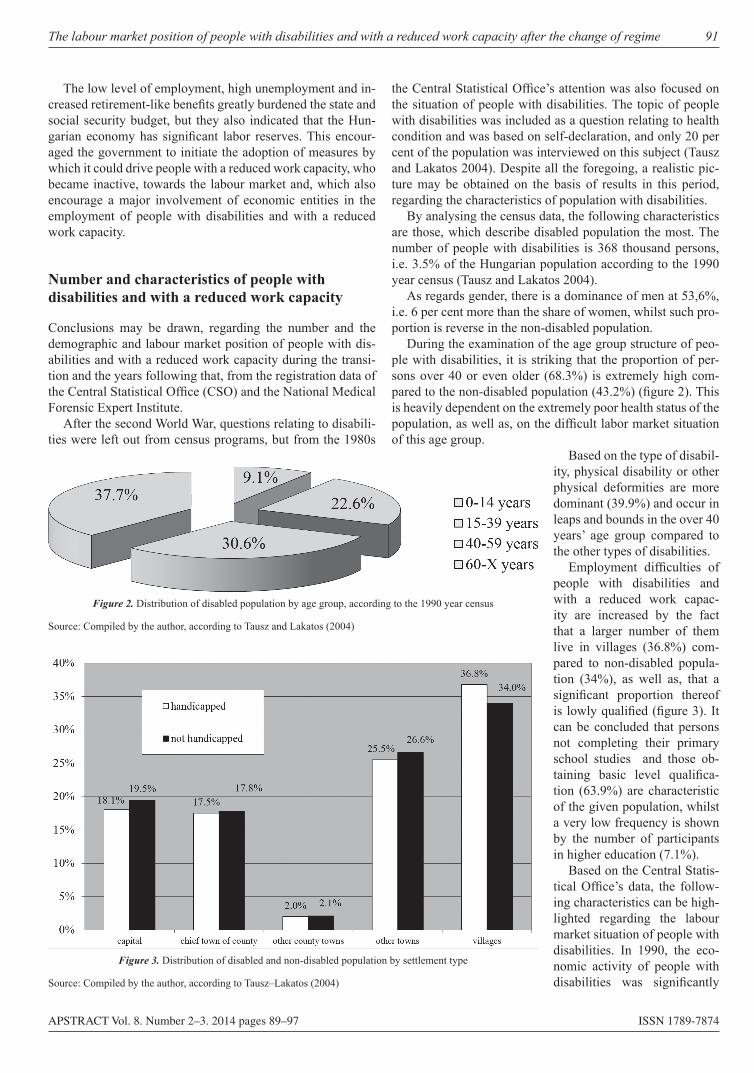
The labour market position of people with disabilities and with a reduced work capacity after the change of regime 91
APSTRACT Vol. 8. Number 2–3. 2014 pages 89–97 ISSN 1789-7874
The low level of employment, high unemployment and in-creased retirement-like benefits greatly burdened the state and social security budget, but they also indicated that the Hun-garian economy has significant labor reserves. This encour-aged the government to initiate the adoption of measures by which it could drive people with a reduced work capacity, who became inactive, towards the labour market and, which also encourage a major involvement of economic entities in the employment of people with disabilities and with a reduced work capacity.
Number and characteristics of people with disabilities and with a reduced work capacity
Conclusions may be drawn, regarding the number and the demographic and labour market position of people with dis-abilities and with a reduced work capacity during the transi-tion and the years following that, from the registration data of the Central Statistical Office (CSO) and the National Medical Forensic Expert Institute.
After the second World War, questions relating to disabili-ties were left out from census programs, but from the 1980s
the Central Statistical Office’s attention was also focused on the situation of people with disabilities. The topic of people with disabilities was included as a question relating to health condition and was based on self-declaration, and only 20 per cent of the population was interviewed on this subject (Tausz and Lakatos 2004). Despite all the foregoing, a realistic pic-ture may be obtained on the basis of results in this period, regarding the characteristics of population with disabilities.
By analysing the census data, the following characteristics are those, which describe disabled population the most. The number of people with disabilities is 368 thousand persons, i.e. 3.5% of the Hungarian population according to the 1990 year census (Tausz and Lakatos 2004).
As regards gender, there is a dominance of men at 53,6%, i.e. 6 per cent more than the share of women, whilst such pro-portion is reverse in the non-disabled population.
During the examination of the age group structure of peo-ple with disabilities, it is striking that the proportion of per-sons over 40 or even older (68.3%) is extremely high com-pared to the non-disabled population (43.2%) (figure 2). This is heavily dependent on the extremely poor health status of the population, as well as, on the difficult labor market situation of this age group.
Based on the type of disabil-ity, physical disability or other physical deformities are more dominant (39.9%) and occur in leaps and bounds in the over 40 years’ age group compared to the other types of disabilities.
Employment difficulties of people with disabilities and with a reduced work capac-ity are increased by the fact that a larger number of them live in villages (36.8%) com-pared to non-disabled popula-tion (34%), as well as, that a significant proportion thereof is lowly qualified (figure 3). It can be concluded that persons not completing their primary school studies and those ob-taining basic level qualifica-tion (63.9%) are characteristic of the given population, whilst a very low frequency is shown by the number of participants in higher education (7.1%).
Based on the Central Statis-tical Office’s data, the follow-ing characteristics can be high-lighted regarding the labour market situation of people with disabilities. In 1990, the eco-nomic activity of people with disabilities was significantly
Figure 2. Distribution of disabled population by age group, according to the 1990 year census
Source: Compiled by the author, according to Tausz and Lakatos (2004)
Figure 3. Distribution of disabled and non-disabled population by settlement type
Source: Compiled by the author, according to Tausz–Lakatos (2004)
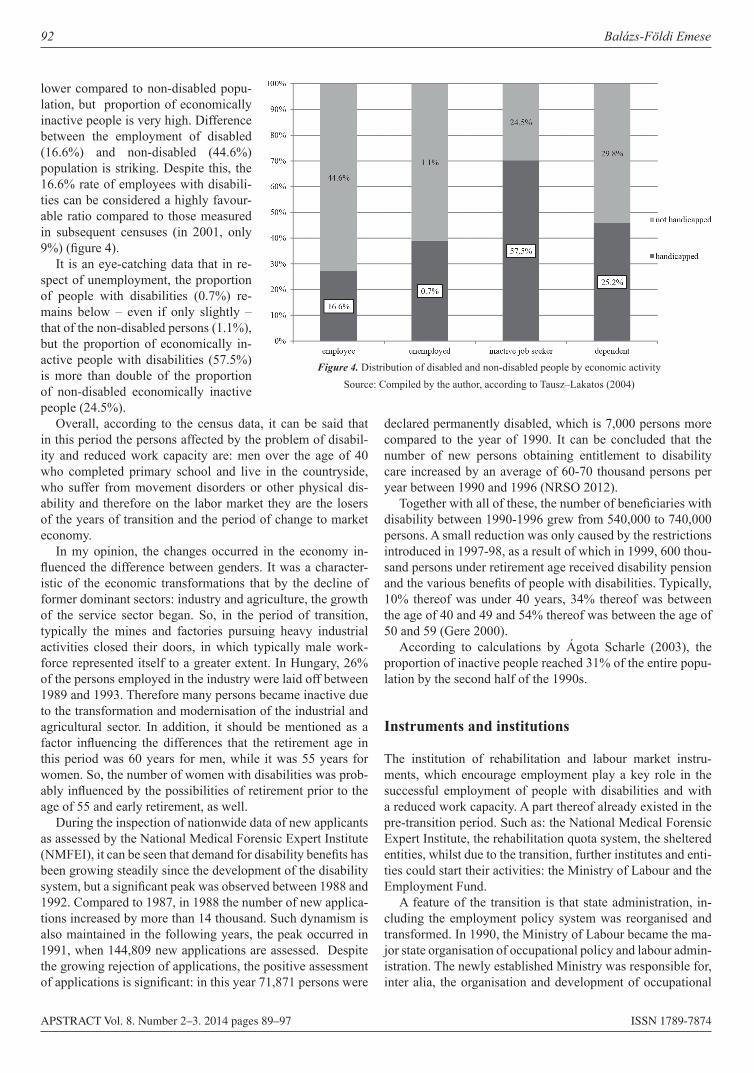
92 Balázs-Földi Emese
APSTRACT Vol. 8. Number 2–3. 2014 pages 89–97 ISSN 1789-7874
lower compared to non-disabled popu-lation, but proportion of economically inactive people is very high. Difference between the employment of disabled (16.6%) and non-disabled (44.6%) population is striking. Despite this, the 16.6% rate of employees with disabili-ties can be considered a highly favour-able ratio compared to those measured in subsequent censuses (in 2001, only 9%) (figure 4).
It is an eye-catching data that in re-spect of unemployment, the proportion of people with disabilities (0.7%) re-mains below – even if only slightly – that of the non-disabled persons (1.1%), but the proportion of economically in-active people with disabilities (57.5%) is more than double of the proportion of non-disabled economically inactive people (24.5%).
Overall, according to the census data, it can be said that in this period the persons affected by the problem of disabil-ity and reduced work capacity are: men over the age of 40 who completed primary school and live in the countryside, who suffer from movement disorders or other physical dis-ability and therefore on the labor market they are the losers of the years of transition and the period of change to market economy.
In my opinion, the changes occurred in the economy in-fluenced the difference between genders. It was a character-istic of the economic transformations that by the decline of former dominant sectors: industry and agriculture, the growth of the service sector began. So, in the period of transition, typically the mines and factories pursuing heavy industrial activities closed their doors, in which typically male work-force represented itself to a greater extent. In Hungary, 26% of the persons employed in the industry were laid off between 1989 and 1993. Therefore many persons became inactive due to the transformation and modernisation of the industrial and agricultural sector. In addition, it should be mentioned as a factor influencing the differences that the retirement age in this period was 60 years for men, while it was 55 years for women. So, the number of women with disabilities was prob-ably influenced by the possibilities of retirement prior to the age of 55 and early retirement, as well.
During the inspection of nationwide data of new applicants as assessed by the National Medical Forensic Expert Institute (NMFEI), it can be seen that demand for disability benefits has been growing steadily since the development of the disability system, but a significant peak was observed between 1988 and 1992. Compared to 1987, in 1988 the number of new applica-tions increased by more than 14 thousand. Such dynamism is also maintained in the following years, the peak occurred in 1991, when 144,809 new applications are assessed. Despite the growing rejection of applications, the positive assessment of applications is significant: in this year 71,871 persons were
declared permanently disabled, which is 7,000 persons more compared to the year of 1990. It can be concluded that the number of new persons obtaining entitlement to disability care increased by an average of 60-70 thousand persons per year between 1990 and 1996 (NRSO 2012).
Together with all of these, the number of beneficiaries with disability between 1990-1996 grew from 540,000 to 740,000 persons. A small reduction was only caused by the restrictions introduced in 1997-98, as a result of which in 1999, 600 thou-sand persons under retirement age received disability pension and the various benefits of people with disabilities. Typically, 10% thereof was under 40 years, 34% thereof was between the age of 40 and 49 and 54% thereof was between the age of 50 and 59 (Gere 2000).
According to calculations by Ágota Scharle (2003), the proportion of inactive people reached 31% of the entire popu-lation by the second half of the 1990s.
Instruments and institutions
The institution of rehabilitation and labour market instru-ments, which encourage employment play a key role in the successful employment of people with disabilities and with a reduced work capacity. A part thereof already existed in the pre-transition period. Such as: the National Medical Forensic Expert Institute, the rehabilitation quota system, the sheltered entities, whilst due to the transition, further institutes and enti-ties could start their activities: the Ministry of Labour and the Employment Fund.
A feature of the transition is that state administration, in-cluding the employment policy system was reorganised and transformed. In 1990, the Ministry of Labour became the ma-jor state organisation of occupational policy and labour admin-istration. The newly established Ministry was responsible for, inter alia, the organisation and development of occupational
Figure 4. Distribution of disabled and non-disabled people by economic activitySource: Compiled by the author, according to Tausz–Lakatos (2004)
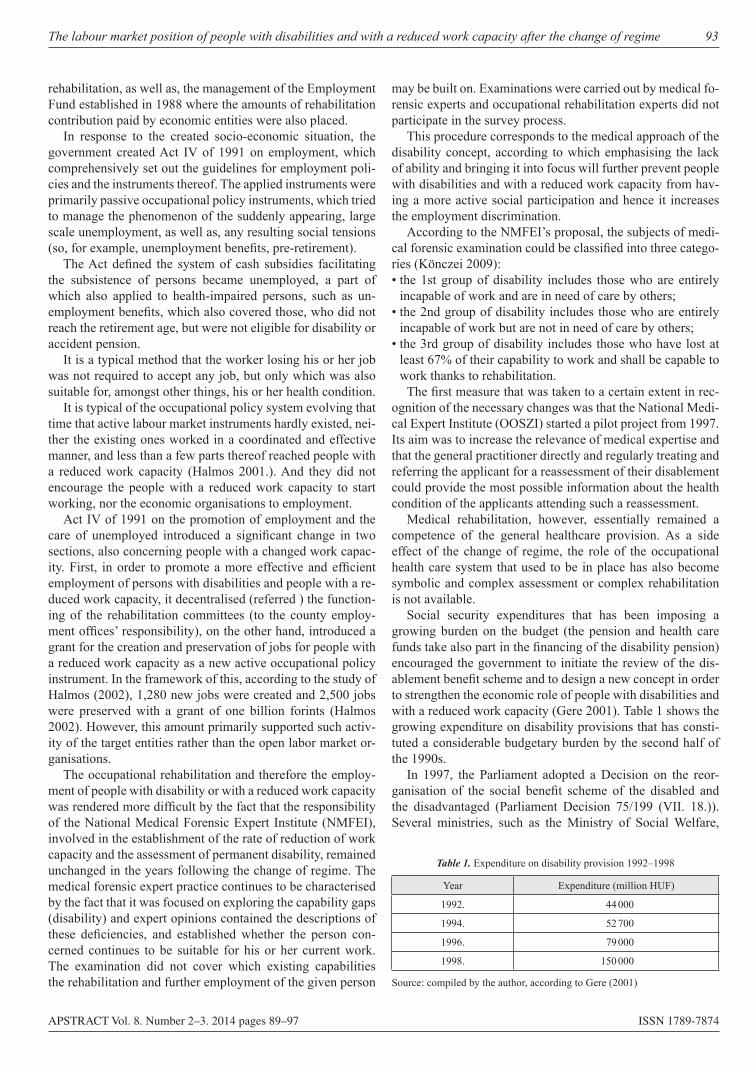
The labour market position of people with disabilities and with a reduced work capacity after the change of regime 93
APSTRACT Vol. 8. Number 2–3. 2014 pages 89–97 ISSN 1789-7874
rehabilitation, as well as, the management of the Employment Fund established in 1988 where the amounts of rehabilitation contribution paid by economic entities were also placed.
In response to the created socio-economic situation, the government created Act IV of 1991 on employment, which comprehensively set out the guidelines for employment poli-cies and the instruments thereof. The applied instruments were primarily passive occupational policy instruments, which tried to manage the phenomenon of the suddenly appearing, large scale unemployment, as well as, any resulting social tensions (so, for example, unemployment benefits, pre-retirement).
The Act defined the system of cash subsidies facilitating the subsistence of persons became unemployed, a part of which also applied to health-impaired persons, such as un-employment benefits, which also covered those, who did not reach the retirement age, but were not eligible for disability or accident pension.
It is a typical method that the worker losing his or her job was not required to accept any job, but only which was also suitable for, amongst other things, his or her health condition.
It is typical of the occupational policy system evolving that time that active labour market instruments hardly existed, nei-ther the existing ones worked in a coordinated and effective manner, and less than a few parts thereof reached people with a reduced work capacity (Halmos 2001.). And they did not encourage the people with a reduced work capacity to start working, nor the economic organisations to employment.
Act IV of 1991 on the promotion of employment and the care of unemployed introduced a significant change in two sections, also concerning people with a changed work capac-ity. First, in order to promote a more effective and efficient employment of persons with disabilities and people with a re-duced work capacity, it decentralised (referred ) the function-ing of the rehabilitation committees (to the county employ-ment offices’ responsibility), on the other hand, introduced a grant for the creation and preservation of jobs for people with a reduced work capacity as a new active occupational policy instrument. In the framework of this, according to the study of Halmos (2002), 1,280 new jobs were created and 2,500 jobs were preserved with a grant of one billion forints (Halmos 2002). However, this amount primarily supported such activ-ity of the target entities rather than the open labor market or-ganisations.
The occupational rehabilitation and therefore the employ-ment of people with disability or with a reduced work capacity was rendered more difficult by the fact that the responsibility of the National Medical Forensic Expert Institute (NMFEI), involved in the establishment of the rate of reduction of work capacity and the assessment of permanent disability, remained unchanged in the years following the change of regime. The medical forensic expert practice continues to be characterised by the fact that it was focused on exploring the capability gaps (disability) and expert opinions contained the descriptions of these deficiencies, and established whether the person con-cerned continues to be suitable for his or her current work. The examination did not cover which existing capabilities the rehabilitation and further employment of the given person
may be built on. Examinations were carried out by medical fo-rensic experts and occupational rehabilitation experts did not participate in the survey process.
This procedure corresponds to the medical approach of the disability concept, according to which emphasising the lack of ability and bringing it into focus will further prevent people with disabilities and with a reduced work capacity from hav-ing a more active social participation and hence it increases the employment discrimination.
According to the NMFEI’s proposal, the subjects of medi-cal forensic examination could be classified into three catego-ries (Könczei 2009):• the 1st group of disability includes those who are entirely
incapable of work and are in need of care by others;• the 2nd group of disability includes those who are entirely
incapable of work but are not in need of care by others;• the 3rd group of disability includes those who have lost at
least 67% of their capability to work and shall be capable to work thanks to rehabilitation.
The first measure that was taken to a certain extent in rec-ognition of the necessary changes was that the National Medi-cal Expert Institute (OOSZI) started a pilot project from 1997. Its aim was to increase the relevance of medical expertise and that the general practitioner directly and regularly treating and referring the applicant for a reassessment of their disablement could provide the most possible information about the health condition of the applicants attending such a reassessment.
Medical rehabilitation, however, essentially remained a competence of the general healthcare provision. As a side effect of the change of regime, the role of the occupational health care system that used to be in place has also become symbolic and complex assessment or complex rehabilitation is not available.
Social security expenditures that has been imposing a growing burden on the budget (the pension and health care funds take also part in the financing of the disability pension) encouraged the government to initiate the review of the dis-ablement benefit scheme and to design a new concept in order to strengthen the economic role of people with disabilities and with a reduced work capacity (Gere 2001). Table 1 shows the growing expenditure on disability provisions that has consti-tuted a considerable budgetary burden by the second half of the 1990s.
In 1997, the Parliament adopted a Decision on the reor-ganisation of the social benefit scheme of the disabled and the disadvantaged (Parliament Decision 75/199 (VII. 18.)). Several ministries, such as the Ministry of Social Welfare,
Table 1. Expenditure on disability provision 1992–1998
Year Expenditure (million HUF)
1992. 44 000
1994. 52 700
1996. 79 000
1998. 150 000
Source: compiled by the author, according to Gere (2001)
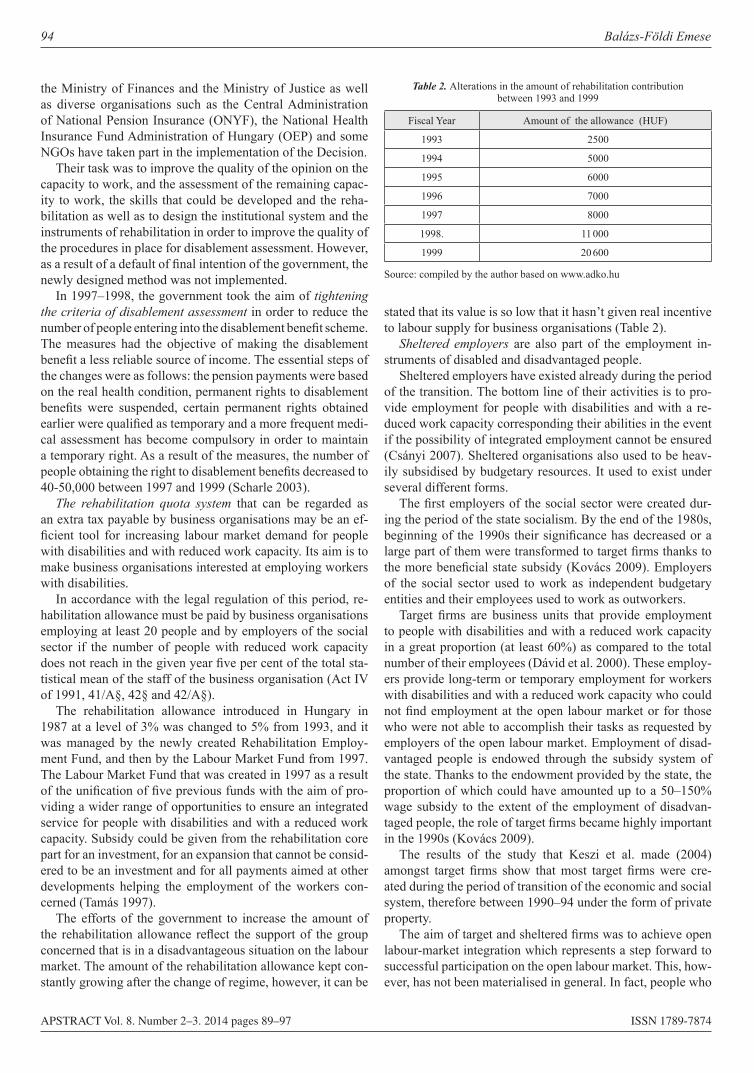
94 Balázs-Földi Emese
APSTRACT Vol. 8. Number 2–3. 2014 pages 89–97 ISSN 1789-7874
the Ministry of Finances and the Ministry of Justice as well as diverse organisations such as the Central Administration of National Pension Insurance (ONYF), the National Health Insurance Fund Administration of Hungary (OEP) and some NGOs have taken part in the implementation of the Decision.
Their task was to improve the quality of the opinion on the capacity to work, and the assessment of the remaining capac-ity to work, the skills that could be developed and the reha-bilitation as well as to design the institutional system and the instruments of rehabilitation in order to improve the quality of the procedures in place for disablement assessment. However, as a result of a default of final intention of the government, the newly designed method was not implemented.
In 1997–1998, the government took the aim of tightening the criteria of disablement assessment in order to reduce the number of people entering into the disablement benefit scheme. The measures had the objective of making the disablement benefit a less reliable source of income. The essential steps of the changes were as follows: the pension payments were based on the real health condition, permanent rights to disablement benefits were suspended, certain permanent rights obtained earlier were qualified as temporary and a more frequent medi-cal assessment has become compulsory in order to maintain a temporary right. As a result of the measures, the number of people obtaining the right to disablement benefits decreased to 40-50,000 between 1997 and 1999 (Scharle 2003).
The rehabilitation quota system that can be regarded as an extra tax payable by business organisations may be an ef-ficient tool for increasing labour market demand for people with disabilities and with reduced work capacity. Its aim is to make business organisations interested at employing workers with disabilities.
In accordance with the legal regulation of this period, re-habilitation allowance must be paid by business organisations employing at least 20 people and by employers of the social sector if the number of people with reduced work capacity does not reach in the given year five per cent of the total sta-tistical mean of the staff of the business organisation (Act IV of 1991, 41/A§, 42§ and 42/A§).
The rehabilitation allowance introduced in Hungary in 1987 at a level of 3% was changed to 5% from 1993, and it was managed by the newly created Rehabilitation Employ-ment Fund, and then by the Labour Market Fund from 1997. The Labour Market Fund that was created in 1997 as a result of the unification of five previous funds with the aim of pro-viding a wider range of opportunities to ensure an integrated service for people with disabilities and with a reduced work capacity. Subsidy could be given from the rehabilitation core part for an investment, for an expansion that cannot be consid-ered to be an investment and for all payments aimed at other developments helping the employment of the workers con-cerned (Tamás 1997).
The efforts of the government to increase the amount of the rehabilitation allowance reflect the support of the group concerned that is in a disadvantageous situation on the labour market. The amount of the rehabilitation allowance kept con-stantly growing after the change of regime, however, it can be
stated that its value is so low that it hasn’t given real incentive to labour supply for business organisations (Table 2).
Sheltered employers are also part of the employment in-struments of disabled and disadvantaged people.
Sheltered employers have existed already during the period of the transition. The bottom line of their activities is to pro-vide employment for people with disabilities and with a re-duced work capacity corresponding their abilities in the event if the possibility of integrated employment cannot be ensured (Csányi 2007). Sheltered organisations also used to be heav-ily subsidised by budgetary resources. It used to exist under several different forms.
The first employers of the social sector were created dur-ing the period of the state socialism. By the end of the 1980s, beginning of the 1990s their significance has decreased or a large part of them were transformed to target firms thanks to the more beneficial state subsidy (Kovács 2009). Employers of the social sector used to work as independent budgetary entities and their employees used to work as outworkers.
Target firms are business units that provide employment to people with disabilities and with a reduced work capacity in a great proportion (at least 60%) as compared to the total number of their employees (Dávid et al. 2000). These employ-ers provide long-term or temporary employment for workers with disabilities and with a reduced work capacity who could not find employment at the open labour market or for those who were not able to accomplish their tasks as requested by employers of the open labour market. Employment of disad-vantaged people is endowed through the subsidy system of the state. Thanks to the endowment provided by the state, the proportion of which could have amounted up to a 50–150% wage subsidy to the extent of the employment of disadvan-taged people, the role of target firms became highly important in the 1990s (Kovács 2009).
The results of the study that Keszi et al. made (2004) amongst target firms show that most target firms were cre-ated during the period of transition of the economic and social system, therefore between 1990–94 under the form of private property.
The aim of target and sheltered firms was to achieve open labour-market integration which represents a step forward to successful participation on the open labour market. This, how-ever, has not been materialised in general. In fact, people who
Table 2. Alterations in the amount of rehabilitation contribution between 1993 and 1999
Fiscal Year Amount of the allowance (HUF)
1993 2500
1994 5000
1995 6000
1996 7000
1997 8000
1998. 11 000
1999 20 600
Source: compiled by the author based on www.adko.hu
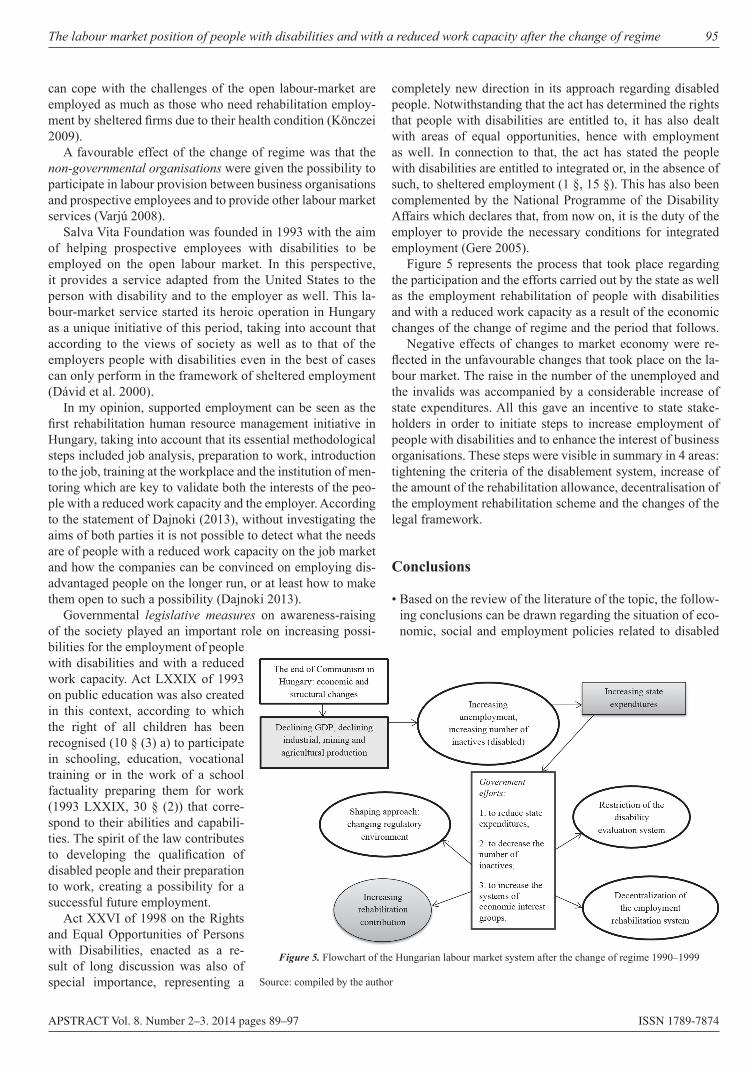
The labour market position of people with disabilities and with a reduced work capacity after the change of regime 95
APSTRACT Vol. 8. Number 2–3. 2014 pages 89–97 ISSN 1789-7874
can cope with the challenges of the open labour-market are employed as much as those who need rehabilitation employ-ment by sheltered firms due to their health condition (Könczei 2009).
A favourable effect of the change of regime was that the non-governmental organisations were given the possibility to participate in labour provision between business organisations and prospective employees and to provide other labour market services (Varjú 2008).
Salva Vita Foundation was founded in 1993 with the aim of helping prospective employees with disabilities to be employed on the open labour market. In this perspective, it provides a service adapted from the United States to the person with disability and to the employer as well. This la-bour-market service started its heroic operation in Hungary as a unique initiative of this period, taking into account that according to the views of society as well as to that of the employers people with disabilities even in the best of cases can only perform in the framework of sheltered employment (Dávid et al. 2000).
In my opinion, supported employment can be seen as the first rehabilitation human resource management initiative in Hungary, taking into account that its essential methodological steps included job analysis, preparation to work, introduction to the job, training at the workplace and the institution of men-toring which are key to validate both the interests of the peo-ple with a reduced work capacity and the employer. According to the statement of Dajnoki (2013), without investigating the aims of both parties it is not possible to detect what the needs are of people with a reduced work capacity on the job market and how the companies can be convinced on employing dis-advantaged people on the longer run, or at least how to make them open to such a possibility (Dajnoki 2013).
Governmental legislative measures on awareness-raising of the society played an important role on increasing possi-bilities for the employment of people with disabilities and with a reduced work capacity. Act LXXIX of 1993 on public education was also created in this context, according to which the right of all children has been recognised (10 § (3) a) to participate in schooling, education, vocational training or in the work of a school factuality preparing them for work (1993 LXXIX, 30 § (2)) that corre-spond to their abilities and capabili-ties. The spirit of the law contributes to developing the qualification of disabled people and their preparation to work, creating a possibility for a successful future employment.
Act XXVI of 1998 on the Rights and Equal Opportunities of Persons with Disabilities, enacted as a re-sult of long discussion was also of special importance, representing a
completely new direction in its approach regarding disabled people. Notwithstanding that the act has determined the rights that people with disabilities are entitled to, it has also dealt with areas of equal opportunities, hence with employment as well. In connection to that, the act has stated the people with disabilities are entitled to integrated or, in the absence of such, to sheltered employment (1 §, 15 §). This has also been complemented by the National Programme of the Disability Affairs which declares that, from now on, it is the duty of the employer to provide the necessary conditions for integrated employment (Gere 2005).
Figure 5 represents the process that took place regarding the participation and the efforts carried out by the state as well as the employment rehabilitation of people with disabilities and with a reduced work capacity as a result of the economic changes of the change of regime and the period that follows.
Negative effects of changes to market economy were re-flected in the unfavourable changes that took place on the la-bour market. The raise in the number of the unemployed and the invalids was accompanied by a considerable increase of state expenditures. All this gave an incentive to state stake-holders in order to initiate steps to increase employment of people with disabilities and to enhance the interest of business organisations. These steps were visible in summary in 4 areas: tightening the criteria of the disablement system, increase of the amount of the rehabilitation allowance, decentralisation of the employment rehabilitation scheme and the changes of the legal framework.
Conclusions
• Based on the review of the literature of the topic, the follow-ing conclusions can be drawn regarding the situation of eco-nomic, social and employment policies related to disabled
Figure 5. Flowchart of the Hungarian labour market system after the change of regime 1990–1999
Source: compiled by the author
96 Balázs-Földi Emese
APSTRACT Vol. 8. Number 2–3. 2014 pages 89–97 ISSN 1789-7874
and disadvantaged people and also regarding the related in-stitutional background and instruments influencing the sup-ply and demand on the labour market for the period of the change of regime and during the 10 following yearsAs a re-sult of the socio-economic regime change, the old economic structure that used to ensure the employment of people with a reduced work capacity does no longer exist. The group that is concerned has become more of a victim of the negative effects of the changes. The workforce that was laid off has not joined the group of the unemployed but that of the inac-tives instead.
• Changes following the change of regime further enhanced the labour market disadvantages and discrimination of workers with disabilities and with a reduced work capacity.
• Instead of integration to the labour market, it is segregation that is becoming more important as a result of economic downturn, structural changes and the deterioration of labour market opportunities of workers with disabilities and with a reduced work capacity. Disabled and disadvantaged work-ers, even in the best case, take part in sheltered employment, provided by target firms where the opportunity to progress towards open labour-market is neither in the interest of the employee, nor in that of the employer thanks to the hiatus of the previous system for economic incentive.
• Active employment measures preventing unemployment of people with a reduced work capacity are under represented – practically, it is only the wage subsidy that exist and also serves mostly the enlargement of the circle of sheltered em-ployers.
• The employment quota system (rehabilitation allowance), due to its low value is not a real incentive for business or-ganisations.
• As a result of structural changes of the economy, demand for workforce is concentrated on cheap, young, trained and healthy workers due to the surplus of workforce.
• The newly created and implemented system motivated nei-ther the people with disabilities and with a reduced work capacity nor participants of the open labour market to take a more active role in business and to develop employment.
• Still no comprehensive and complex system has been estab-lished that would support and help the employment reha-bilitation and introduction to employment of workers with disabilities and with a reduced work capacity as well as their remaining on the post. Such aspirations were only present from the second half of the 1990s, but no real emphasis has been put on creating the interests of business participants.
• In the absence of system harmonisation the labour market opportunities of people with disabilities and with a reduced work capacity could not have been increased efficiently until the Millennium. Such economic and social attitude as well as human knowledge were absent that would have been indis-pensable for a change. The driving force behind the changes was the possibility to join the European Union, as well as, the fulfilment thereof.
In conclusion, it can be stated that at the time of the change of regime, and during the period of the following 10 years, people with disabilities and with a reduced work capacity did
not encounter significant changes in their position on the la-bour market, and even efficient employment rehabilitation did not take place. Some efforts, however, can be detected from the side of the government, aiming at making business organi-sations interested in increasing employment of the group that is concerned.
References
Babos Zs (2001): Túlélési stratégiák [Survival strategies]. In Szak-képzési Szemle [Vocational Training Review] Year 26. n° 1. pp. 68–86.Csányi Zs (2007): Foglalkoztatja? Útmutató fogyatékkal élő személyek felvételéhez és alkalmazásához vezetők, HR szakemberek és munkatársak számára. [Are you employing...? A guide for managers, HR specialists and staff members on how to hire and employ people with disabilities]. Salva Vita Foundation, Budapest Dajnoki K (2013): Védett szervezetek megítélése a HR tükrében [The Evaluation of Sheltered Organisations from the Perspective of HR]. Humán Innovációs Szemle [Human Innovation Review], Year 4, n° 1–2, (December 2013), Kaposvár, pp. 6–19.Dávid A et al. (2000): Támogatott foglalkoztatás. Ér tel mi sérült munkavállalók a nyílt munkaerő-piacon. [Sheltered employment. Mentally disabled workers at the open labour market.] Handbook. Salva Vita Foundation, BudapestGere I (2000): A megváltozott munkaképességű személyek foglal-koztatását segítő állami támogatások. [State subsidies helping the employment of people] with a reduced work capacity. Final report of a study. In: Állami támogatások és célszervezetek: az ezredforduló rendszerének tanulságai. [State subsidies and target firms: instruc-tions of a system of the millenium.] Edited by: György KÖNCZEI (2009) Fogyatékosságtudományi Tanulmányok [Disability Studies] Eötvös Lóránd University, Bárczi Gusztáv Faculty of Special Educa-tion, Budapest, pp.6–56.Gere I (2001): A megváltozott munkaképességű emberek bekap-csolása a munka világába. [Reintegration of disadvantaged people to the world of employment.] In: EU-konform fog lal koz ta tás po li ti-ka. A hazai foglalkoztatáspolitika átalakítása a közösségi gya kor lat-nak megfelelően. [EU-conform employment policy. Trans formation of domestic employment policy in compliance with practice of the EU member states.] Compilation of studies. Edited by: Mária FREY. OFA Budapest pp. 221–245.Gere I (2005): Foglalkoztatási stratégia a tartósan akadályozott em-berek integrációja érdekében. [Employment strategy aiming the in-tegration of people with long-term disablement.] In: Állami támo-gatások és célszervezetek: az ezredforduló rendszerének tanulsá-gai. [State subsidies and target firms: instructions of a system of the millenium.] Edited by: György KÖNCZEI (2009) Fogyatékosság-tudományi Tanulmányok [Disability Studies] Eötvös Lóránd Uni-versity, Bárczi Gusztáv Faculty of Special Education, Budapest, pp. 187–212.Halmos Cs (2001): Munkaügyi rendszerváltás II. rész. A munkaerő-piac jellemzői a kilencvenes években. [Regime change in labour issues, Part II. Characteristics of the labour market in the 1990s.] Humánpolitikai Szemle [Review of Human resources), Year 12, Issue n° 12, pp. 13–29.Halmos Cs (2002): Munkaügyi rendszerváltás IV. rész. A kilencve-nes évtized foglalkoztatáspolitikájának értékelése. [Regime change in labour issues, Part IV. Assessment of the 1990s from the point
The labour market position of people with disabilities and with a reduced work capacity after the change of regime 97
APSTRACT Vol. 8. Number 2–3. 2014 pages 89–97 ISSN 1789-7874
of view of employment policy.] Humánpolitikai Szemle [Review of Human resources), Year 13, Issue n° 2, pp. 20–28.Keszi R et al. (2004): A célszervezetek körében készült kérdőíves felmérés eredményei. Empirikus elemzés. [Results of the survey on target firms. Empirical analysis.] In: Állami támogatások és célszervezetek: az ezredforduló rendszerének tanulságai. [State subsidies and target firms: instructions of a system of the millenium.] Edited by: György Könczei (2009) Fogyatékosságtudományi Tanulmányok [Disability Studies] Eötvös Lóránd University, Bárczi Gusztáv Faculty of Special Education, Budapest, pp. 56–126.Kovács G (2009): Fogyatékossággal élő emberek szociális foglal-koztatása. [Social employment of disabled people.] Note. Eötvös Lóránd University, Bárczi Gusztáv Faculty of Special Education, BudapestKálmán Zs & Könczei Gy (2002): A Taigetosztól az esélyegyen-lőségig [From Taigetos to equal opportunities], Osiris Publishing, BudapestKönczei Gy (1992): Fogyatékosok a társadalomban. [Disabled people in society.] Gondolat Publishing, Budapest.Könczei Gy (editor) (2009): Munkacsoport a megváltozott mun-kaképességű és rokkant személyek társadalombiztosítási és szoci-ális ellátórendszerének átalakításáról. Elemzés és reformjavaslat a 90-es évek gyakorlata alapján a 2000-rel kezdődő tíz évre. [Working group on the reorganization of the social benefit and social security scheme of people with disabilities and with a reduced work capac-ity. Analysis and proposal on reform for the decade starting in 2000, based on the practice of the 1990s.] In: Foglalkozási rehabilitáció Magyarországon: a szabályozás múltja, jelene, jövője. [Employment rehabilitation in Hungary: past, present and future of employment.] Fogyatékosságtudományi Tanulmányok [Disability Studies]. Eötvös Lóránd University, Bárczi Gusztáv Faculty of Special Education, BudapestKSH (1995): Magyarország a rendszerváltás óta [Hungary since the regime change]. Hungarian Central Statistical Office, Budapest
KSH (2010): Magyarország 1989–2009. A változások tükrében [Hungary 1989–2009. In light of the changes.] Hungarian Central Statistical Office, BudapestScharle Á (2003): Munkaerőpiac és versenyképesség [Labour market and competitiveness]. Study of the research entitled “Gazdasági versenyképesség: helyzetkép és az állami beavatkozás lehetőségei” [Economic competitiveness: overview and possibilities of state intervention]. PM Kutatási Füzetek [Ministry of Finance, Study booklets] Issue n° 4. Ministry of Finance. BudapestTamás I (1997): Act IV of 1991 on job assistance and unemploy-ment benefits modified by Act CVII of 1996. Humánpolitikai Szemle [Review of Human resources), Year 8, Issue n° 3, pp.12–27.National Office for Rehabilitation and Social Affairs (2012): Report on the professional work of the Office in 2012. Volume I.Downloaded from: www.nrszh.kormany.hu/download/9/96/00000/beszamolo jelentés 2012.pdf, on the following date: 18th June 2014Tausz K & Lakatos M (2004): Situation of the disabled. Statisztikai Szemle (Statistical Review), Year 82, Issue n°4, pp. 370–391.Varjú T (2008): A megváltozott munkaképességű mun ka vál lalók fog lalkoztatásának támogatása Magyarországon. (Employment support of disadvantaged workers in Hungary.) Study. REVITA Foun dation. DebrecenAct IV of 1991 on job assistance and unemployment benefits Act LXXIX of 1993 on public educationAct XXVI of 1998 on the Rights and Equal Opportunities of Persons with DisabilitiesGovernment Decision n° 33/1963 (XII.3), Order of the Government n° 2014/1967.(III.29), Joint Order n° 1/1967.(XI.22) of the Minister of Labour, the Minister of Health and the Minister of Finance on the resolution of the situation of disadvantaged workersDecision n° 8/1983 (VI. 29.) of the Minister of Health and the Minister of Finance on the employment and social care of disadvantaged people.

APSTRACT Vol. 8. Number 2–3. 2014 pages 99–106 ISSN 1789-7874
1. Introduction, objectives
Fruit cultivation plays a key role in the agriculture of Hungary, which is also proven by the fact that it employs significant number of workforce and resources worth billions; it provides 8–10% of cultivations gross production value (Z. Kiss 2003). Domestic crop lands are continuously decreasing, while there were 41 000 hectare apple plantations in 2000, it is now not more than 26 000 hectare. Due to the plantations, remarkably heterogeneous quality and worse product security the annual amount is fluctuating between 300 and 800 thousand tons and profitability is critical in the majority of the processing plants (Fruitveb 2013).
Recently, market prices in fruit sector have been decreas-ing or stagnating, selling security has become hectic and ever growing performance of producers is needed to ensure and ef-ficient production (Lakner and Apáti, 2010). Raising the level of post-harvest processes is an option to improve economic efficiency, with which sales could be extended, such goods could be produced that fulfil the consumers’ expectations and have a decent quality and appearance, moreover the aver-age selling prices can be significantly improved (Doluschitz 2001; Möhring et. al. 2007).
Due to the formerly deducted reasons the main objective of this study is to give a scientifically grounded answer to the following questions:• How and to what extent do the existence of post harvest
technology and infrastructure influence the economic and investment efficiency of apple production?
• Which plant model, namely which combination of produc-tion and post-harvest could result the most effective produc-tion?
With reference to the abovementioned main objectives the following hypotheses were settled:• The existence of post-harvest technology could significantly
improve the economic efficiency of production.• The best investment efficiency rate is generated by the high-
est degree of post-harvest supply, i.e. the simultaneous ex-istence of plantation, storage, sorting, ranking and packing.
To accomplish the objectives above the following specific tasks are need to be accomplished first:• Definition and specification of the most frequent types of
processing plants as the combination of production and post-harvest technology.
• Determination of the investment costs as initial equity re-quirement in case of each plant type.
The economic efficiency of apple producTion in Terms of posT‑harvesT Technology
Viktor Szabó
University Debrecen
Abstract: This study analyses how the level of postharvest technology’s development influences the economic efficiency of apple production with the help of a deterministic simulation model based on primary data gathering in producer undertakings. To accomplish our objectives and to support our hypotheses three processing plant types are included in the model: firstly apple production with no postharvest and prompt sale after the harvest, secondly parallel production and storage combined with an extended selling period and thirdly production and entire postharvest infrastructure (storage, sorting-ranking, packing) with the highest level of goods production and continuous sales. Based on our results it can be stated that the parallel production (plantation) and cold storage, so the second case is proved to be totally inefficient, considering that the establishment of a cold storage carries enormously high costs with resulting a relative low plus profit compared to the first type of processing plant. The reason for this is that this type is selling bulk goods without sorting-grading or packaging; storage itself – as a means of continuously servicing the market – is not covered properly by the consumers. Absolute efficiency ranking cannot be established regarding the other two processing plants: plantation without post-harvest infrastructure resulting lower NPV, but a more favourable IRR, DPP and PI as developing a plantation and a whole post-harvest infrastructure.
Keywords: apple, economic efficiency, post-harvest, apple producing processing plant type
Applied Studies in Agribusiness and Commerce – APSTRACTAgroinform Publishing House, Budapest scienTific papers
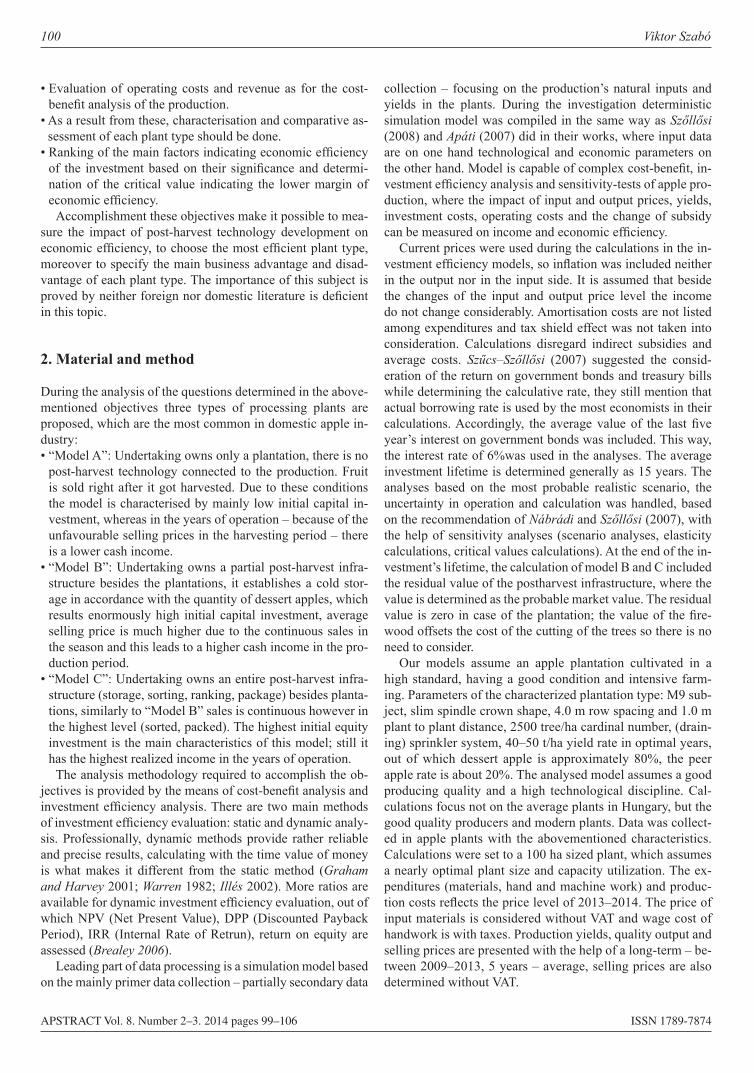
100 Viktor Szabó
APSTRACT Vol. 8. Number 2–3. 2014 pages 99–106 ISSN 1789-7874
• Evaluation of operating costs and revenue as for the cost-benefit analysis of the production.
• As a result from these, characterisation and comparative as-sessment of each plant type should be done.
• Ranking of the main factors indicating economic efficiency of the investment based on their significance and determi-nation of the critical value indicating the lower margin of economic efficiency.
Accomplishment these objectives make it possible to mea-sure the impact of post-harvest technology development on economic efficiency, to choose the most efficient plant type, moreover to specify the main business advantage and disad-vantage of each plant type. The importance of this subject is proved by neither foreign nor domestic literature is deficient in this topic.
2. Material and method
During the analysis of the questions determined in the above-mentioned objectives three types of processing plants are proposed, which are the most common in domestic apple in-dustry:• “Model A”: Undertaking owns only a plantation, there is no
post-harvest technology connected to the production. Fruit is sold right after it got harvested. Due to these conditions the model is characterised by mainly low initial capital in-vestment, whereas in the years of operation – because of the unfavourable selling prices in the harvesting period – there is a lower cash income.
• “Model B”: Undertaking owns a partial post-harvest infra-structure besides the plantations, it establishes a cold stor-age in accordance with the quantity of dessert apples, which results enormously high initial capital investment, average selling price is much higher due to the continuous sales in the season and this leads to a higher cash income in the pro-duction period.
• “Model C”: Undertaking owns an entire post-harvest infra-structure (storage, sorting, ranking, package) besides planta-tions, similarly to “Model B” sales is continuous however in the highest level (sorted, packed). The highest initial equity investment is the main characteristics of this model; still it has the highest realized income in the years of operation.
The analysis methodology required to accomplish the ob-jectives is provided by the means of cost-benefit analysis and investment efficiency analysis. There are two main methods of investment efficiency evaluation: static and dynamic analy-sis. Professionally, dynamic methods provide rather reliable and precise results, calculating with the time value of money is what makes it different from the static method (Graham and Harvey 2001; Warren 1982; Illés 2002). More ratios are available for dynamic investment efficiency evaluation, out of which NPV (Net Present Value), DPP (Discounted Payback Period), IRR (Internal Rate of Retrun), return on equity are assessed (Brealey 2006).
Leading part of data processing is a simulation model based on the mainly primer data collection – partially secondary data
collection – focusing on the production’s natural inputs and yields in the plants. During the investigation deterministic simulation model was compiled in the same way as Szőllősi (2008) and Apáti (2007) did in their works, where input data are on one hand technological and economic parameters on the other hand. Model is capable of complex cost-benefit, in-vestment efficiency analysis and sensitivity-tests of apple pro-duction, where the impact of input and output prices, yields, investment costs, operating costs and the change of subsidy can be measured on income and economic efficiency.
Current prices were used during the calculations in the in-vestment efficiency models, so inflation was included neither in the output nor in the input side. It is assumed that beside the changes of the input and output price level the income do not change considerably. Amortisation costs are not listed among expenditures and tax shield effect was not taken into consideration. Calculations disregard indirect subsidies and average costs. Szűcs–Szőllősi (2007) suggested the consid-eration of the return on government bonds and treasury bills while determining the calculative rate, they still mention that actual borrowing rate is used by the most economists in their calculations. Accordingly, the average value of the last five year’s interest on government bonds was included. This way, the interest rate of 6%was used in the analyses. The average investment lifetime is determined generally as 15 years. The analyses based on the most probable realistic scenario, the uncertainty in operation and calculation was handled, based on the recommendation of Nábrádi and Szőllősi (2007), with the help of sensitivity analyses (scenario analyses, elasticity calculations, critical values calculations). At the end of the in-vestment’s lifetime, the calculation of model B and C included the residual value of the postharvest infrastructure, where the value is determined as the probable market value. The residual value is zero in case of the plantation; the value of the fire-wood offsets the cost of the cutting of the trees so there is no need to consider.
Our models assume an apple plantation cultivated in a high standard, having a good condition and intensive farm-ing. Parameters of the characterized plantation type: M9 sub-ject, slim spindle crown shape, 4.0 m row spacing and 1.0 m plant to plant distance, 2500 tree/ha cardinal number, (drain-ing) sprinkler system, 40–50 t/ha yield rate in optimal years, out of which dessert apple is approximately 80%, the peer apple rate is about 20%. The analysed model assumes a good producing quality and a high technological discipline. Cal-culations focus not on the average plants in Hungary, but the good quality producers and modern plants. Data was collect-ed in apple plants with the abovementioned characteristics. Calculations were set to a 100 ha sized plant, which assumes a nearly optimal plant size and capacity utilization. The ex-penditures (materials, hand and machine work) and produc-tion costs reflects the price level of 2013–2014. The price of input materials is considered without VAT and wage cost of handwork is with taxes. Production yields, quality output and selling prices are presented with the help of a long-term – be-tween 2009–2013, 5 years – average, selling prices are also determined without VAT.
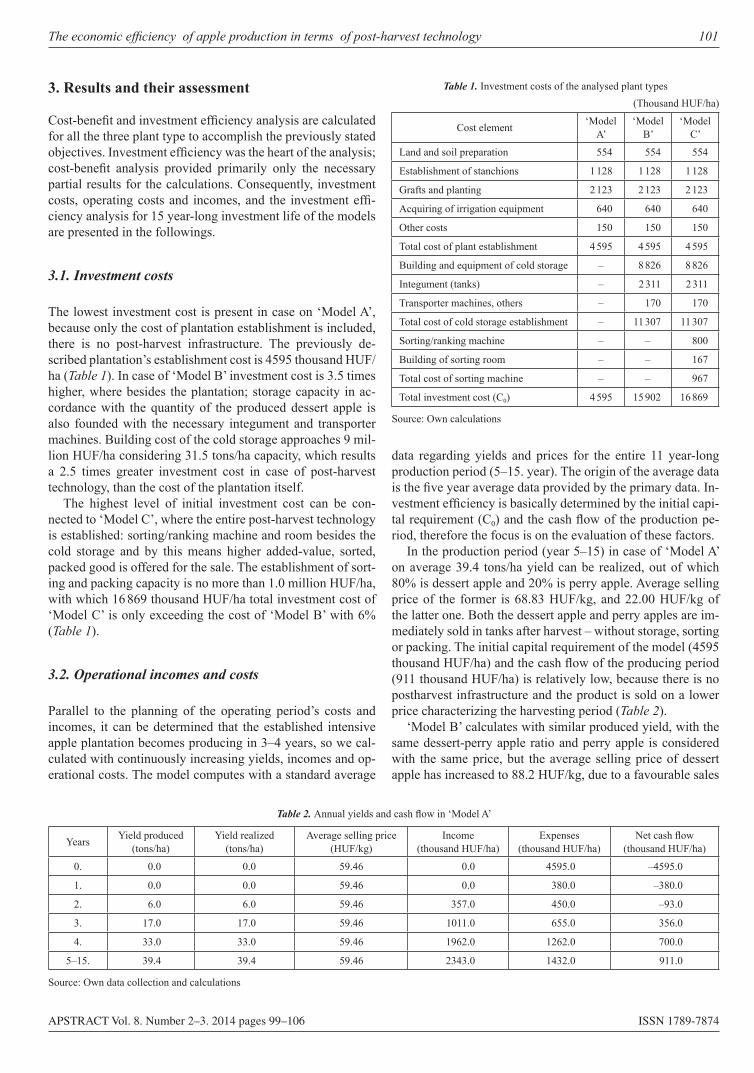
The economic efficiency of apple production in terms of post‑harvest technology 101
APSTRACT Vol. 8. Number 2–3. 2014 pages 99–106 ISSN 1789-7874
3. Results and their assessment
Cost-benefit and investment efficiency analysis are calculated for all the three plant type to accomplish the previously stated objectives. Investment efficiency was the heart of the analysis; cost-benefit analysis provided primarily only the necessary partial results for the calculations. Consequently, investment costs, operating costs and incomes, and the investment effi-ciency analysis for 15 year-long investment life of the models are presented in the followings.
3.1. Investment costs
The lowest investment cost is present in case on ‘Model A’, because only the cost of plantation establishment is included, there is no post-harvest infrastructure. The previously de-scribed plantation’s establishment cost is 4595 thousand HUF/ha (Table 1). In case of ‘Model B’ investment cost is 3.5 times higher, where besides the plantation; storage capacity in ac-cordance with the quantity of the produced dessert apple is also founded with the necessary integument and transporter machines. Building cost of the cold storage approaches 9 mil-lion HUF/ha considering 31.5 tons/ha capacity, which results a 2.5 times greater investment cost in case of post-harvest technology, than the cost of the plantation itself.
The highest level of initial investment cost can be con-nected to ‘Model C’, where the entire post-harvest technology is established: sorting/ranking machine and room besides the cold storage and by this means higher added-value, sorted, packed good is offered for the sale. The establishment of sort-ing and packing capacity is no more than 1.0 million HUF/ha, with which 16 869 thousand HUF/ha total investment cost of ‘Model C’ is only exceeding the cost of ‘Model B’ with 6% (Table 1).
3.2. Operational incomes and costs
Parallel to the planning of the operating period’s costs and incomes, it can be determined that the established intensive apple plantation becomes producing in 3–4 years, so we cal-culated with continuously increasing yields, incomes and op-erational costs. The model computes with a standard average
data regarding yields and prices for the entire 11 year-long production period (5–15. year). The origin of the average data is the five year average data provided by the primary data. In-vestment efficiency is basically determined by the initial capi-tal requirement (C0) and the cash flow of the production pe-riod, therefore the focus is on the evaluation of these factors.
In the production period (year 5–15) in case of ‘Model A’ on average 39.4 tons/ha yield can be realized, out of which 80% is dessert apple and 20% is perry apple. Average selling price of the former is 68.83 HUF/kg, and 22.00 HUF/kg of the latter one. Both the dessert apple and perry apples are im-mediately sold in tanks after harvest – without storage, sorting or packing. The initial capital requirement of the model (4595 thousand HUF/ha) and the cash flow of the producing period (911 thousand HUF/ha) is relatively low, because there is no postharvest infrastructure and the product is sold on a lower price characterizing the harvesting period (Table 2).
‘Model B’ calculates with similar produced yield, with the same dessert-perry apple ratio and perry apple is considered with the same price, but the average selling price of dessert apple has increased to 88.2 HUF/kg, due to a favourable sales
Table 1. Investment costs of the analysed plant types(Thousand HUF/ha)
Cost element ‘Model A’
‘Model B’
‘Model C’
Land and soil preparation 554 554 554
Establishment of stanchions 1 128 1 128 1 128
Grafts and planting 2 123 2 123 2 123
Acquiring of irrigation equipment 640 640 640
Other costs 150 150 150
Total cost of plant establishment 4 595 4 595 4 595
Building and equipment of cold storage – 8 826 8 826
Integument (tanks) – 2 311 2 311
Transporter machines, others – 170 170
Total cost of cold storage establishment – 11 307 11 307
Sorting/ranking machine – – 800
Building of sorting room – – 167
Total cost of sorting machine – – 967
Total investment cost (C0) 4 595 15 902 16 869
Source: Own calculations
Table 2. Annual yields and cash flow in ‘Model A’
Years Yield produced(tons/ha)
Yield realized(tons/ha)
Average selling price(HUF/kg)
Income(thousand HUF/ha)
Expenses(thousand HUF/ha)
Net cash flow(thousand HUF/ha)
0. 0.0 0.0 59.46 0.0 4595.0 –4595.0
1. 0.0 0.0 59.46 0.0 380.0 –380.0
2. 6.0 6.0 59.46 357.0 450.0 –93.0
3. 17.0 17.0 59.46 1011.0 655.0 356.0
4. 33.0 33.0 59.46 1962.0 1262.0 700.0
5–15. 39.4 39.4 59.46 2343.0 1432.0 911.0
Source: Own data collection and calculations
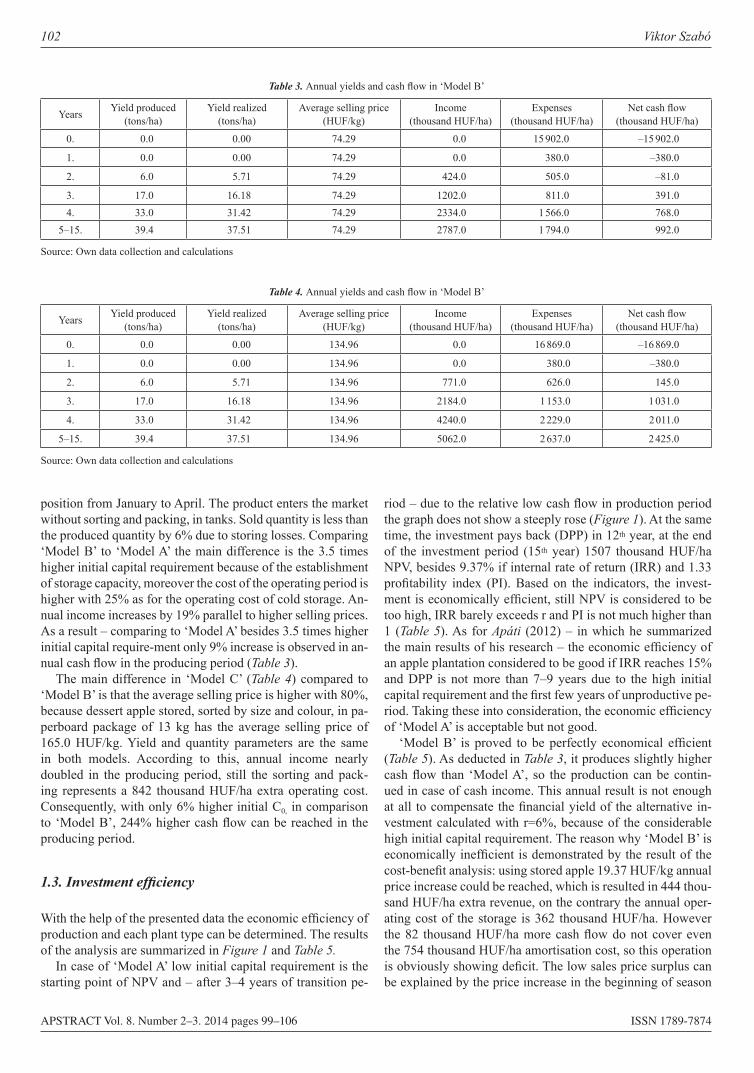
102 Viktor Szabó
APSTRACT Vol. 8. Number 2–3. 2014 pages 99–106 ISSN 1789-7874
position from January to April. The product enters the market without sorting and packing, in tanks. Sold quantity is less than the produced quantity by 6% due to storing losses. Comparing ‘Model B’ to ‘Model A’ the main difference is the 3.5 times higher initial capital requirement because of the establishment of storage capacity, moreover the cost of the operating period is higher with 25% as for the operating cost of cold storage. An-nual income increases by 19% parallel to higher selling prices. As a result – comparing to ‘Model A’ besides 3.5 times higher initial capital require-ment only 9% increase is observed in an-nual cash flow in the producing period (Table 3).
The main difference in ‘Model C’ (Table 4) compared to ‘Model B’ is that the average selling price is higher with 80%, because dessert apple stored, sorted by size and colour, in pa-perboard package of 13 kg has the average selling price of 165.0 HUF/kg. Yield and quantity parameters are the same in both models. According to this, annual income nearly doubled in the producing period, still the sorting and pack-ing represents a 842 thousand HUF/ha extra operating cost. Consequently, with only 6% higher initial C0, in comparison to ‘Model B’, 244% higher cash flow can be reached in the producing period.
1.3. Investment efficiency
With the help of the presented data the economic efficiency of production and each plant type can be determined. The results of the analysis are summarized in Figure 1 and Table 5.
In case of ‘Model A’ low initial capital requirement is the starting point of NPV and – after 3–4 years of transition pe-
riod – due to the relative low cash flow in production period the graph does not show a steeply rose (Figure 1). At the same time, the investment pays back (DPP) in 12th year, at the end of the investment period (15th year) 1507 thousand HUF/ha NPV, besides 9.37% if internal rate of return (IRR) and 1.33 profitability index (PI). Based on the indicators, the invest-ment is economically efficient, still NPV is considered to be too high, IRR barely exceeds r and PI is not much higher than 1 (Table 5). As for Apáti (2012) – in which he summarized the main results of his research – the economic efficiency of an apple plantation considered to be good if IRR reaches 15% and DPP is not more than 7–9 years due to the high initial capital requirement and the first few years of unproductive pe-riod. Taking these into consideration, the economic efficiency of ‘Model A’ is acceptable but not good.
‘Model B’ is proved to be perfectly economical efficient (Table 5). As deducted in Table 3, it produces slightly higher cash flow than ‘Model A’, so the production can be contin-ued in case of cash income. This annual result is not enough at all to compensate the financial yield of the alternative in-vestment calculated with r=6%, because of the considerable high initial capital requirement. The reason why ‘Model B’ is economically inefficient is demonstrated by the result of the cost-benefit analysis: using stored apple 19.37 HUF/kg annual price increase could be reached, which is resulted in 444 thou-sand HUF/ha extra revenue, on the contrary the annual oper-ating cost of the storage is 362 thousand HUF/ha. However the 82 thousand HUF/ha more cash flow do not cover even the 754 thousand HUF/ha amortisation cost, so this operation is obviously showing deficit. The low sales price surplus can be explained by the price increase in the beginning of season
Table 3. Annual yields and cash flow in ‘Model B’
Years Yield produced(tons/ha)
Yield realized(tons/ha)
Average selling price(HUF/kg)
Income(thousand HUF/ha)
Expenses(thousand HUF/ha)
Net cash flow(thousand HUF/ha)
0. 0.0 0.00 74.29 0.0 15 902.0 –15 902.0
1. 0.0 0.00 74.29 0.0 380.0 –380.0
2. 6.0 5.71 74.29 424.0 505.0 –81.0
3. 17.0 16.18 74.29 1202.0 811.0 391.04. 33.0 31.42 74.29 2334.0 1 566.0 768.0
5–15. 39.4 37.51 74.29 2787.0 1 794.0 992.0
Source: Own data collection and calculations
Table 4. Annual yields and cash flow in ‘Model B’
Years Yield produced(tons/ha)
Yield realized(tons/ha)
Average selling price(HUF/kg)
Income(thousand HUF/ha)
Expenses(thousand HUF/ha)
Net cash flow(thousand HUF/ha)
0. 0.0 0.00 134.96 0.0 16 869.0 –16 869.0
1. 0.0 0.00 134.96 0.0 380.0 –380.0
2. 6.0 5.71 134.96 771.0 626.0 145.0
3. 17.0 16.18 134.96 2184.0 1 153.0 1 031.0
4. 33.0 31.42 134.96 4240.0 2 229.0 2 011.0
5–15. 39.4 37.51 134.96 5062.0 2 637.0 2 425.0
Source: Own data collection and calculations
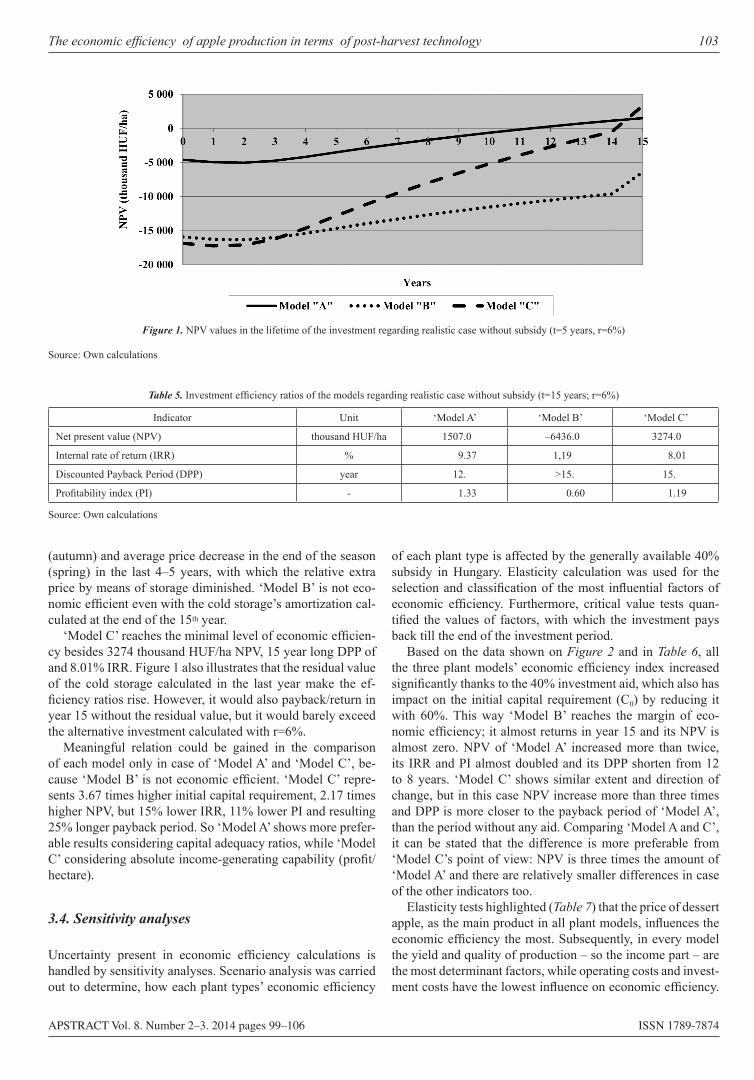
The economic efficiency of apple production in terms of post‑harvest technology 103
APSTRACT Vol. 8. Number 2–3. 2014 pages 99–106 ISSN 1789-7874
(autumn) and average price decrease in the end of the season (spring) in the last 4–5 years, with which the relative extra price by means of storage diminished. ‘Model B’ is not eco-nomic efficient even with the cold storage’s amortization cal-culated at the end of the 15th year.
‘Model C’ reaches the minimal level of economic efficien-cy besides 3274 thousand HUF/ha NPV, 15 year long DPP of and 8.01% IRR. Figure 1 also illustrates that the residual value of the cold storage calculated in the last year make the ef-ficiency ratios rise. However, it would also payback/return in year 15 without the residual value, but it would barely exceed the alternative investment calculated with r=6%.
Meaningful relation could be gained in the comparison of each model only in case of ‘Model A’ and ‘Model C’, be-cause ‘Model B’ is not economic efficient. ‘Model C’ repre-sents 3.67 times higher initial capital requirement, 2.17 times higher NPV, but 15% lower IRR, 11% lower PI and resulting 25% longer payback period. So ‘Model A’ shows more prefer-able results considering capital adequacy ratios, while ‘Model C’ considering absolute income-generating capability (profit/hectare).
3.4. Sensitivity analyses
Uncertainty present in economic efficiency calculations is handled by sensitivity analyses. Scenario analysis was carried out to determine, how each plant types’ economic efficiency
of each plant type is affected by the generally available 40% subsidy in Hungary. Elasticity calculation was used for the selection and classification of the most influential factors of economic efficiency. Furthermore, critical value tests quan-tified the values of factors, with which the investment pays back till the end of the investment period.
Based on the data shown on Figure 2 and in Table 6, all the three plant models’ economic efficiency index increased significantly thanks to the 40% investment aid, which also has impact on the initial capital requirement (C0) by reducing it with 60%. This way ‘Model B’ reaches the margin of eco-nomic efficiency; it almost returns in year 15 and its NPV is almost zero. NPV of ‘Model A’ increased more than twice, its IRR and PI almost doubled and its DPP shorten from 12 to 8 years. ‘Model C’ shows similar extent and direction of change, but in this case NPV increase more than three times and DPP is more closer to the payback period of ‘Model A’, than the period without any aid. Comparing ‘Model A and C’, it can be stated that the difference is more preferable from ‘Model C’s point of view: NPV is three times the amount of ‘Model A’ and there are relatively smaller differences in case of the other indicators too.
Elasticity tests highlighted (Table 7) that the price of dessert apple, as the main product in all plant models, influences the economic efficiency the most. Subsequently, in every model the yield and quality of production – so the income part – are the most determinant factors, while operating costs and invest-ment costs have the lowest influence on economic efficiency.
Figure 1. NPV values in the lifetime of the investment regarding realistic case without subsidy (t=5 years, r=6%)
Source: Own calculations
Table 5. Investment efficiency ratios of the models regarding realistic case without subsidy (t=15 years; r=6%)
Indicator Unit ‘Model A’ ‘Model B’ ‘Model C’
Net present value (NPV) thousand HUF/ha 1507.0 –6436.0 3274.0
Internal rate of return (IRR) % 9.37 1,19 8.01
Discounted Payback Period (DPP) year 12. >15. 15.
Profitability index (PI) - 1.33 0.60 1.19
Source: Own calculations
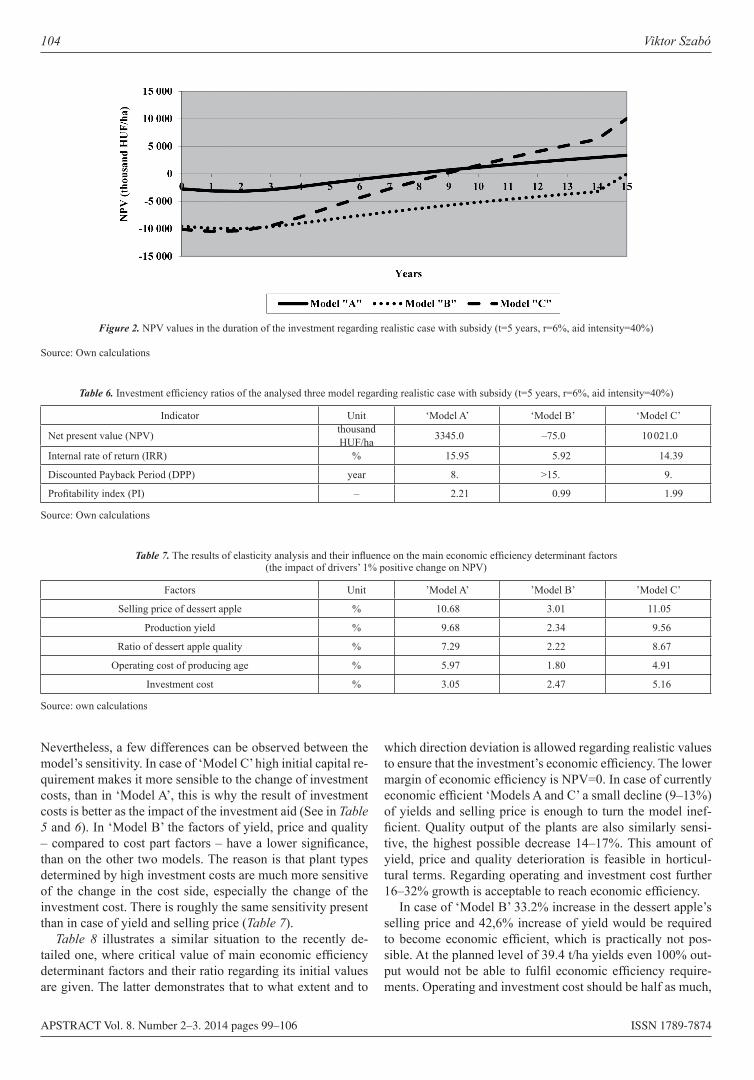
104 Viktor Szabó
APSTRACT Vol. 8. Number 2–3. 2014 pages 99–106 ISSN 1789-7874
Nevertheless, a few differences can be observed between the model’s sensitivity. In case of ‘Model C’ high initial capital re-quirement makes it more sensible to the change of investment costs, than in ‘Model A’, this is why the result of investment costs is better as the impact of the investment aid (See in Table 5 and 6). In ‘Model B’ the factors of yield, price and quality – compared to cost part factors – have a lower significance, than on the other two models. The reason is that plant types determined by high investment costs are much more sensitive of the change in the cost side, especially the change of the investment cost. There is roughly the same sensitivity present than in case of yield and selling price (Table 7).
Table 8 illustrates a similar situation to the recently de-tailed one, where critical value of main economic efficiency determinant factors and their ratio regarding its initial values are given. The latter demonstrates that to what extent and to
which direction deviation is allowed regarding realistic values to ensure that the investment’s economic efficiency. The lower margin of economic efficiency is NPV=0. In case of currently economic efficient ‘Models A and C’ a small decline (9–13%) of yields and selling price is enough to turn the model inef-ficient. Quality output of the plants are also similarly sensi-tive, the highest possible decrease 14–17%. This amount of yield, price and quality deterioration is feasible in horticul-tural terms. Regarding operating and investment cost further 16–32% growth is acceptable to reach economic efficiency.
In case of ‘Model B’ 33.2% increase in the dessert apple’s selling price and 42,6% increase of yield would be required to become economic efficient, which is practically not pos-sible. At the planned level of 39.4 t/ha yields even 100% out-put would not be able to fulfil economic efficiency require-ments. Operating and investment cost should be half as much,
Figure 2. NPV values in the duration of the investment regarding realistic case with subsidy (t=5 years, r=6%, aid intensity=40%)
Source: Own calculations
Table 6. Investment efficiency ratios of the analysed three model regarding realistic case with subsidy (t=5 years, r=6%, aid intensity=40%)
Indicator Unit ‘Model A’ ‘Model B’ ‘Model C’
Net present value (NPV) thousand HUF/ha 3345.0 –75.0 10 021.0
Internal rate of return (IRR) % 15.95 5.92 14.39
Discounted Payback Period (DPP) year 8. >15. 9.
Profitability index (PI) – 2.21 0.99 1.99
Source: Own calculations
Table 7. The results of elasticity analysis and their influence on the main economic efficiency determinant factors (the impact of drivers’ 1% positive change on NPV)
Factors Unit ’Model A’ ’Model B’ ’Model C’
Selling price of dessert apple % 10.68 3.01 11.05
Production yield % 9.68 2.34 9.56
Ratio of dessert apple quality % 7.29 2.22 8.67
Operating cost of producing age % 5.97 1.80 4.91
Investment cost % 3.05 2.47 5.16
Source: own calculations
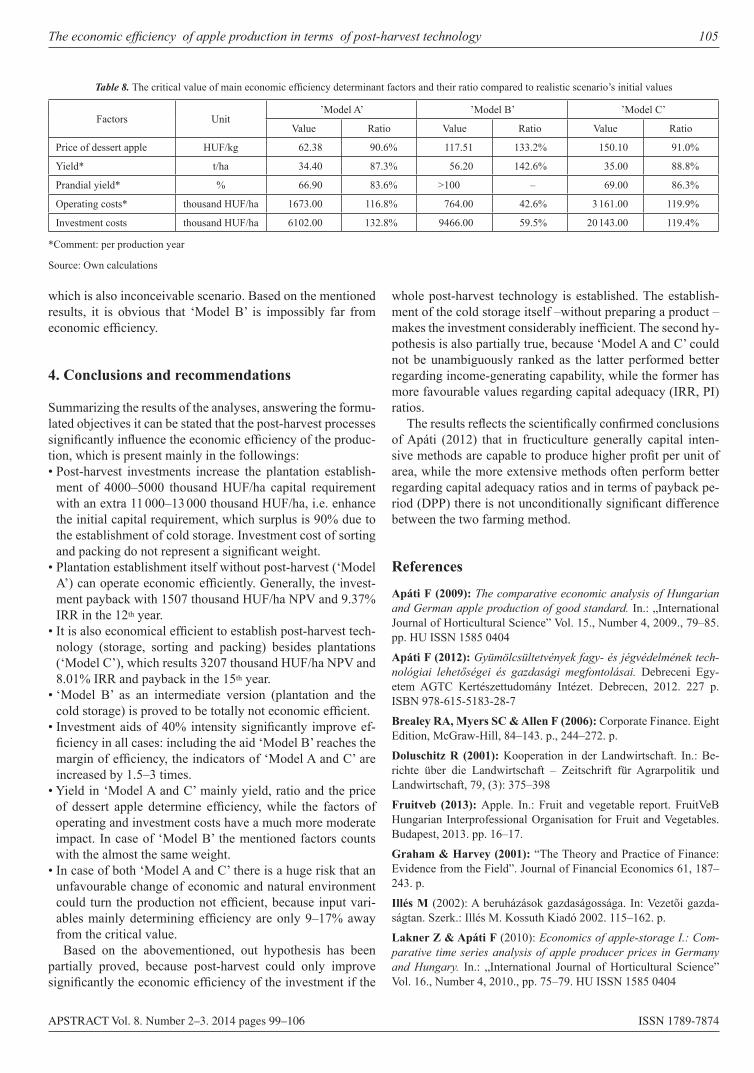
The economic efficiency of apple production in terms of post‑harvest technology 105
APSTRACT Vol. 8. Number 2–3. 2014 pages 99–106 ISSN 1789-7874
which is also inconceivable scenario. Based on the mentioned results, it is obvious that ‘Model B’ is impossibly far from economic efficiency.
4. Conclusions and recommendations
Summarizing the results of the analyses, answering the formu-lated objectives it can be stated that the post-harvest processes significantly influence the economic efficiency of the produc-tion, which is present mainly in the followings:• Post-harvest investments increase the plantation establish-
ment of 4000–5000 thousand HUF/ha capital requirement with an extra 11 000–13 000 thousand HUF/ha, i.e. enhance the initial capital requirement, which surplus is 90% due to the establishment of cold storage. Investment cost of sorting and packing do not represent a significant weight.
• Plantation establishment itself without post-harvest (‘Model A’) can operate economic efficiently. Generally, the invest-ment payback with 1507 thousand HUF/ha NPV and 9.37% IRR in the 12th year.
• It is also economical efficient to establish post-harvest tech-nology (storage, sorting and packing) besides plantations (‘Model C’), which results 3207 thousand HUF/ha NPV and 8.01% IRR and payback in the 15th year.
• ‘Model B’ as an intermediate version (plantation and the cold storage) is proved to be totally not economic efficient.
• Investment aids of 40% intensity significantly improve ef-ficiency in all cases: including the aid ‘Model B’ reaches the margin of efficiency, the indicators of ‘Model A and C’ are increased by 1.5–3 times.
• Yield in ‘Model A and C’ mainly yield, ratio and the price of dessert apple determine efficiency, while the factors of operating and investment costs have a much more moderate impact. In case of ‘Model B’ the mentioned factors counts with the almost the same weight.
• In case of both ‘Model A and C’ there is a huge risk that an unfavourable change of economic and natural environment could turn the production not efficient, because input vari-ables mainly determining efficiency are only 9–17% away from the critical value.
Based on the abovementioned, out hypothesis has been partially proved, because post-harvest could only improve significantly the economic efficiency of the investment if the
whole post-harvest technology is established. The establish-ment of the cold storage itself –without preparing a product – makes the investment considerably inefficient. The second hy-pothesis is also partially true, because ‘Model A and C’ could not be unambiguously ranked as the latter performed better regarding income-generating capability, while the former has more favourable values regarding capital adequacy (IRR, PI) ratios.
The results reflects the scientifically confirmed conclusions of Apáti (2012) that in fructiculture generally capital inten-sive methods are capable to produce higher profit per unit of area, while the more extensive methods often perform better regarding capital adequacy ratios and in terms of payback pe-riod (DPP) there is not unconditionally significant difference between the two farming method.
References
Apáti F (2009): The comparative economic analysis of Hungarian and German apple production of good standard. In.: „International Journal of Horticultural Science” Vol. 15., Number 4, 2009., 79–85. pp. HU ISSN 1585 0404
Apáti F (2012): Gyümölcsültetvények fagy‑ és jégvédelmének tech‑nológiai lehetőségei és gazdasági megfontolásai. Debreceni Egy-etem AGTC Kertészettudomány Intézet. Debrecen, 2012. 227 p. ISBN 978-615-5183-28-7
Brealey RA, Myers SC & Allen F (2006): Corporate Finance. Eight Edition, McGraw-Hill, 84–143. p., 244–272. p.
Doluschitz R (2001): Kooperation in der Landwirtschaft. In.: Be-richte über die Landwirtschaft – Zeitschrift für Agrarpolitik und Landwirtschaft, 79, (3): 375–398
Fruitveb (2013): Apple. In.: Fruit and vegetable report. FruitVeB Hungarian Interprofessional Organisation for Fruit and Vegetables. Budapest, 2013. pp. 16–17.
Graham & Harvey (2001): “The Theory and Practice of Finance: Evidence from the Field”. Journal of Financial Economics 61, 187–243. p.
Illés M (2002): A beruházások gazdaságossága. In: Vezetői gaz da-ság tan. Szerk.: Illés M. Kossuth Kiadó 2002. 115–162. p.
Lakner Z & Apáti F (2010): Economics of apple‑storage I.: Com‑parative time series analysis of apple producer prices in Germany and Hungary. In.: „International Journal of Horticultural Science” Vol. 16., Number 4, 2010., pp. 75–79. HU ISSN 1585 0404
Table 8. The critical value of main economic efficiency determinant factors and their ratio compared to realistic scenario’s initial values
Factors Unit’Model A’ ’Model B’ ’Model C’
Value Ratio Value Ratio Value Ratio
Price of dessert apple HUF/kg 62.38 90.6% 117.51 133.2% 150.10 91.0%
Yield* t/ha 34.40 87.3% 56.20 142.6% 35.00 88.8%
Prandial yield* % 66.90 83.6% >100 – 69.00 86.3%
Operating costs* thousand HUF/ha 1673.00 116.8% 764.00 42.6% 3 161.00 119.9%
Investment costs thousand HUF/ha 6102.00 132.8% 9466.00 59.5% 20 143.00 119.4%
*Comment: per production year
Source: Own calculations
106 Viktor Szabó
APSTRACT Vol. 8. Number 2–3. 2014 pages 99–106 ISSN 1789-7874
Möhring A, Lauber S & Anken T (2007): Relevanz der über-betrieb li chen Zusammenarbeit in der Landwirtschaft. Kostensen-kung – wie hoch ist das Potential wirklich?. 30: In for ma tionsta gung Agrarökonomie, 13.09.2007, Tänikon, Et ten hausen.Nábrádi A & Szőllősi L (2007): „Key aspects of investment analysis” In: Applied Studies in Agribusiness and Commerce (AP-STRACT) 1: (1) 2007. pp. 53–56. Agroinform Publishing House, HU-ISSN 1789-221XSzőllősi L (2008): „A vágócsirke termékpálya 2007. évi költség és jövedelem viszonyai” In.: Baromfi Ágazat 8: (4) 2008/4. december, Budapest, pp. 4–12.
Szűcs I & Szőllősi L (2008): „A beruházások ökonómiai megítélése” In.: Üzemtan I. (Szerk.: Nábrádi A.–Pupos T.–Takácsné György K.) Szaktudás Kiadó Ház, Budapest, 2008. 3.2.3.3. fejezet, pp. 46–59. ISBN 978-963-9736-91-7; ISBN 978-963-9736-90-0-ö
Warren MF (1982): Financial Management for Farmers, the Basic Techniques of ‘Money Farming’. Third Edition, Stanly Thornes Ltd, 240–246., 259–260. p.
Z Kiss L (2003): A gyümölcstermesztés feltételrendszere. In.: A gyü-mölcs termesztés, -tárolás, -értékesítés szervezése és ökonómiája. (Szerk.: Z. Kiss). Mezőgazda Kiadó. Budapest, 2003. 13. p.
APSTRACT Vol. 8. Number 2–3. 2014 pages 107–111 ISSN 1789-7874
Introduction
The centralized position of logistics is an essential condition for the operation of modern enterprises due to competition. Logistics can reach its final objective only if it enables an ever quicker and higher level of customer service. At the same time, companies can become ever more efficient in minimiz-ing their costs without a decrease in the quality of their pro-duction or service (Vántus 2012). The ever increasing market competition requires greater organizational and operational efficiency, and flexible adaptation to the new situations gener-ated by external-internal environmental changes.
The system approach, the significant cost reduction and profit increasing effect coupled with scientific methodology are the main characteristics of well-designed and functioning logistics.
With the complex approach of logistic systems, organiza-tions can get feedback enabling them to overview and coor-dinate their activities and making them more adaptive to the environment. These conditions ensure that business organiza-tions can continuously control their activities, possess up-to-date information, and respond to changes.
One of the great disadvantages of big systems is their com-plexity; it is not easy to have precise and up-to-date knowl-edge about the system’s processes to focus the organization in a good direction. The periodic review of systems provides
operational safety, which is essential for smooth manage-ment.
Logistic activities can be considered successful if the implementation of individual sub processes are adequately and professionally synchronized, and the flow of materials and information is clear (Cooper 1994). Without control and feedback, a system does not operate as planned, and the orga-nization can become defunct. Adaptation to the competition makes the continuous review and reorganization of the enter-prise indispensable (Méhesné 2011).
Logistic controlling is a management subsystem built on the integrated logistic system of organizations which provides feedback and control for the management. The characteristics of corporate controlling and relevant definitions are discussed hereinafter. The market of logistic controlling software is de-veloping significantly; only the reluctance of enterprises in-hibits the faster spreading of these technologies (BusinessFlex 2013).
Controlling is a method for obtaining information, which promotes reaching the enterprise’s objectives through the leadership, control and feedback based on the results of plan-fact comparisons.” (Schwalbe 1990). Controlling “is a sub-system coordinating planning, control, information supply; the connection of planning and accounting from the point of view of management, cost and result management” (Maczó and Horváth 2001). Controlling can greatly increase the ef-
The effecT of LogisTic conTroLLing on Business Processes
Szilvia Berek Méhesné
College of SzolnokEconomic Financial and Management Department
Abstract: The increase in the significance of logistics can be attributed to two major reasons: the increasing cost sensitivity of companies and the necessity for the higher fulfilment of customer needs. Logistic controlling is a tool of management used to coordinate logistic activities and to reach logistic managerial decisions by providing information through the analysis of the system. The up-to-date and precise information that can be gained from the logistic controlling system helps the management in the preparation of decisions, and the adaptation to environmental conditions. With these activities, logistic controlling makes the enterprises more efficient and successful. Taking the above into consideration, I carried out a survey on why commercial entities decided on the introduction and application of a logistic controlling system, what conditions are necessary for the introduction of a logistic controlling system, and what experiences the users gained by the application. Positive effects of logistic controlling were proved on operations, and the introduction and application of logistic controlling were analysed.
Keywords: logistics, controlling, flexibility, efficiency, success
Applied Studies in Agribusiness and Commerce – APSTRACTAgroinform Publishing House, Budapest scienTific PaPers
108 Szilvia Berek Méhesné
APSTRACT Vol. 8. Number 2–3. 2014 pages 107–111 ISSN 1789-7874
ficiency of business activities (Boda and Szlávik 2001, Boda and Szlávik 2005).
A subsystem of “the organizational ’Internal Management System’ based on cost sensitivity, which synchronizes the en-vironment, strategy and structure of the organization. A tool and philosophy providing an integrated system for planning, reporting and information supply” (Nagy and Galántai 2010).
The above concepts make it obvious that the task of cor-porate controlling is to reach the organizational objectives defined by the management. It is a management subsystem which, through its information supply, enables the knowledge of corporate processes and their results, thus ensuring that the management reaches the right decision regarding opera-tions, future planning and the occasional review (Vántus and Hagymássy 2014).
Based on the above, it can be stated that efficient organiza-tions cannot lack the the data feedback and control of the lo-gistic system. The compliance with these requirements is pro-vided by logistics controlling, whose objective is two-sided:
• permanent control, plan-fact comparison of costs and performances, and
• obtaining, organising and providing information for de-cision support (Francsovics 2005).
Logistic activities are characterised mainly by the cost data, performance data and logistic parameters.
A questionnaire survey was conducted to know the reasons and results of the application of logistics controlling, and to investigate its significance as a managerial support tool in de-cision making.
Materials and methods
The scope of the research is comprised of Hungarian enter-prises which have a significant controlling and logistic con-trolling system in their organization. The sample of the exami-nation, 124 enterprises, includes enterprises from agriculture, industry and service supply sectors based on national econom-ic classification.
An important aspect in sample selection was that organiza-tions were chosen independently from their size; the selection was based on their logistic characteristics.
The examination is based on the questionnaire designed specially for this research containing both closed and open questions (Rubin-Babbie 2010).
The questionnaire is built upon three main topics:• the first contains the data of the person filling out the
questionnaire; • the second contains questions describing the organiza-
tion, while • the third part presents the logistics and controlling data
related to the enterprise; this is the interview itself.The questionnaires were filled out via Internet or through
personal interviews. I attached a letter of invitation to the questionnaires sent via Internet and e-mail. I collected 87.9% of the questionnaires via Internet, while in 12.1% of cases a personal interview was conducted. The low ratio of per-
sonal interviews is due to the territorial deconcentration of the firms.
In the research, co-workers of the organizations employed in the area of controlling or other closely connected areas took part to ensure that their answers would be relevant to the sur-vey.
Results and discussion
The organizations taking part in the research were organised into three main groups based on their industrial classification and the purpose of their main activity. In this way compa-nies of agriculture, industry and service industry were distin-guished.
Approximately, half (50.8%) of the examined organizations carry out industrial activities. These are followed by organiza-tions operating in the service industry, whose ratio is 46%, and the agricultural enterprises with 3.2%. Taking the size of the organization into consideration, the percentage of medium-sized (57.2%) and large enterprises (26.6%) is relevant.
In this case, the percentage of organizations with agricul-tural profile in the examined sample is not relevant, as there are no large enterprises; only micro-, small- and medium-sized enterprises are in the sample. Because of their ratio be-ing negligible from the point of view of the research, agricul-tural enterprises were taken out of the sample and only the organizations active in the industrial and service sectors were examined.
The examined enterprises are active in four counties. 38.4% of the enterprises are in Pest County. This is not sur-prising, since most of the organizations active in the Hungar-ian industrial and service sector are concentrated around the capital. The overwhelming majority of large enterprises could also be found in this area. Jász-Nagykun-Szolnok County is in second place with 21.6%; Hajdú-Bihar County contributed 20.9% and Békés County 19.1% of the examined organiza-tions in the research.
The presentation of the location of organizations is signifi-cant, because besides the well-developed Pest County, under-developed areas from the countryside can also be found in the research. The positive effect of logistic controlling on organi-zations is not localized in an enterprise as a separate entity; it also affects the external environment through products, con-nections and employees. According to this, positive results are not only sensed by the organization but also its environment, through which the certain development of a given area can also take place.
In the research, the features of logistic controlling might indicate generalization, through which the consequences can be considered true even in a wider sphere. Accordingly, the results of the research support the widespread application of logistic controlling systems.
The size classification of the examined organizations based on the number of employees:
• Micro enterprise: –9 people,• Small enterprise: 10–49 people,
The Effect of Logistic Controlling on Business Processes 109
APSTRACT Vol. 8. Number 2–3. 2014 pages 107–111 ISSN 1789-7874
• Medium-sized enterprise: 50–249 people,• Large enterprise: 250– people.The main aspect of defining the sample was the presence
of controlling activity, so organizations were chosen from all size categories.
One of the fundamental requirements of a logistic control-ling system is flexibility. Software developers did not put to-gether a template, but a system that can be easily tailored to the needs of the organization. Due to this flexibility, logistic controlling systems are widely used among enterprises, re-gardless of the organizational profile. A much more crucial point of the introduction of the system is the existence of the adequate IT background, since it ensures the smooth applica-tion of a logistic controlling system (Andrews et al. 2003). Due to the flexibility of the logistic software, logistic control-ling can be applied in all organizations. The question is thus: what is the size of an organization from which the application of a logistic system is feasible?
Correlation analysis was performed to determine the rela-tionship between the size of the organization and the usage of the logistic controlling system. The accepted guidelines for interpreting correlation coefficients are the following: zero in-dicates no relationship, values between zero and 0.3 a weak relationship, values between 0.3 and 0.7 a moderate relation-ship, and values between 0.7 and 1.0 indicate a strong linear relationship between the two factors.
The age of the examined organizations differed greatly; companies founded from 1950 onward can be found in the survey. The distribution of the examined organizations based on their age is as follows:
• 1950–1960: 5.0%• 1961–1970: 11.7%• 1971–1980: 7.5%• 1981–1990: 20.0%• 1991–2000: 45.8%• 2001–2010: 10.0%From the above it is well visible that the overwhelming
majority of the organizations taking part in the research were founded after 1991, but it can also be observed that the sample contained elements from all age groups. There is no relation-ship between the age of an organization and the application of the logistic controlling system (r = –0.08). Accordingly, it is proven that the logistic controlling system is available for every business organization regardless of its age, and the us-age of the logistic controlling system depends on the intent of the management.
Regarding the reasons for application of logistic control-ling systems, some factors are to be highlighted. Logistic controlling systems penetrate into the whole organization. With the increasingly complex development of logistics, en-terprises would like to trace these complicated processes, as the up-to-date and precise knowledge of logistic processes of the organizations become important. A multidisciplinary ap-proach is needed for successful application of logistic control-ling (Illés 2011).
Logistics can have a stimulative effect on organizations if the management is able to trace the activities of the enterprise.
Accordingly, enterprises cannot lack the traceability of com-plicated processes affecting the whole organization.
The organizations participating in the survey mentioned the followings as reasons for the introduction of logistic control-ling:
• gaining information, becoming informed about process-es occurring in the organization,
• the necessity of up-to-date information for efficient op-eration,
• correction of problems through the precise knowledge of processes,
• providing opportunity for intervention, adjustment, and elimination of wastes in processes.
In order to carry out efficient and successful work, the management has to possess information about all details of the organization’s processes to solve the problems. To ensure efficient operation, the management has to be provided with up-to-date and adequate information (Kaplan and Atkinson 2003).
The application of a logistic controlling system enables the management to intervene and correct processes. Before the application of a logistic controlling system there was no alternative to intervene in the process, the problem became obvious only after the operation. As a result, the organization suffered serious damages because of not responding on time. The introduction of a logistic controlling system enables inter-vention during the process, as well as mitigation and abolish-ment of damages caused by possibly arising problems (Horst et al. 1993).
A logistics controlling system transfers its up-to-date and exact information to the users in the form of reports. Reports can be queried by the appliers at regular intervals, but getting ad hoc information is also possible. The significance of fre-quency of queries depends on the profile of organizations. In production, queries are more frequent since there is a greater chance for problems arising during the process; thus, a higher level of control becomes necessary.
The data content of queries can also change depending on for what purpose the user wants to use the report. The flex-ibility of a logistics controlling system becomes proven also in cases, in which through a wide inspection into the system of organizational processes, data is ensured.
A fundamental criterion for successful business operation is the accessibility, quantity, quality and utilizability of the in-formation, which is defined by its data content. Efficient busi-ness – as I already mentioned before – requires “informatics, which extremely quickly collects, evaluates market, customer feedback and their data through its software, thus enabling the flexible adaptation of the company” (Knoll 2002). Various ITs provide access to information, which are fundamental pre-conditions for the introduction of controlling systems. 89.7% of the organizations examined applying controlling systems adopted logistic controlling. The aims of the information sys-tem from the management’s point of view are: management of the companies’ information assets, increase in efficiency, and improvement of competitiveness (Némon et al. 2006). A well managed information system increases the level of customer
110 Szilvia Berek Méhesné
APSTRACT Vol. 8. Number 2–3. 2014 pages 107–111 ISSN 1789-7874
service, decreases expenses, makes processes faster and more efficient, enables leaders to focus on long term problems in-stead of operative tasks, and increases flexibility (Hajós et al. 2007).
The introduction of the system may result in problems, which have to be corrected within the shortest possible time-frame, so that the logistics controlling system can have a real positive effect on the operation. After introducing the logistic controlling system, 35.1% of the enterprises experienced dif-ficulties. They faced problems with the following tasks:
• finding the key performance indicators for relevant feed-back,
• producing a database necessary for the establishment of indicators, and
• utilizing the gained information efficiently.The establishment of key performance indicators is an
important part of the introduction of logistic controlling sys-tems, since the formation and reaching of strategic objectives requires information. The adequately created indicators can transfer information to the management, enabling them to un-derstand and control the processes in the organization. The analysis of the obtained information can lead to new ideas, resulting in continuous improvement of logistic processes. If the indicators are not formed properly, the obtained informa-tion cannot be used efficiently because their data content is not significant.
About a quarter of the examined organizations (25.8%) changed their controlling systems. The reasons to introduce a new controlling system are the following:
• controlling system not adequately operated,• lack of synchronized operation between the organization
and the applied controlling system,• choice of a better, more modern controlling system.The introduction of the applied controlling system is a pro-
cess beginning with the precise definition of strategic objec-tives. This is followed by the creation of the right indicators and the planning of the process of strategic and operative con-trolling. After this, the target software is chosen and incorpo-rated into the organization. Should any of these steps be left out, there will be hardships even during the selection of the suitable software.
However, the overwhelming majority of the enterprises applying the system (64.9%) could introduce logistics con-trolling system without any errors. Those applying logistic controlling systems have realized numerous positive effects since the introduction. The most typical effect of the appli-cation is that feedback resulted in increased level of orga-nizations’ logistic performance by 87.4%. The operation of enterprises became more cost efficient for 77% of the users. Better adaptation to the market (62.1%), faster logistic op-erations (13.8%), and more flexible organizational operations (26.4%) were the main outcomes of the logistic controlling development.
Logistic controlling has a complex effect on organizations. It was realized that 74.4% of organizations experiencing an improvement in operations through its application are active in industry, while 25.6% are in the service sector. The exam-
ined organizations had significant positive changes in three ar-eas. The introduction of the logistic controlling increased the revenue (88.4%), decreased the value of inventory (58.1%), and reduced the cost (65.1%). Based on the previous results, logistic controlling has a greater effect on the industrial sector than on the service sector. The logistic controlling has positive effects on many areas of the organization, improving the ef-ficiency of the whole system.
The rate of positive changes due to logistic controlling differs across the sectors of the economy. The organizations active in the industrial area experienced a higher increase in revenue (5–10%), and decrease in inventory value (20–25%) than the service sector.
The rate of improvements is the same in industry and ser-vices in cost reduction, since both sectors realized a 10–15% cost decrease as a result of the application of logistic control-ling system. The decrease was in the level of direct variable costs linked to production and services. The sum of logistic costs amounts to approximately half of these costs (52–55% in the industry, 40–45% in the service sector).To get a more precise picture about the positive effects of logistic control-ling systems, the development of unit logistic costs was ana-lysed. After applying the logistic controlling, 35.8% of the organizations reported positive changes in unit costs, while 36.7% did not realize improvement. Enterprises experienc-ing improvement decreased their unit logistic costs by 23.3%, while the others’ logistic costs stagnated. In the industrial area 20.0%, in the service sector 3.3% realized a decrease in their unit logistic costs, the rate of which was fluctuating between 15–25% in industry and 10–15% in services.
The above can result in contradiction, since approximately half of those applying logistic controlling did not experience improvement in cost data. All the organizations realized nu-merous positive effects as a result of feedback: improved level of logistic performance of the organization, more cost efficient operations, better adaptation to the market, quicker logistic operations and more flexible organizational operations. The reason is the complex effect of the logistic controlling system, which does not obviously or primarily affect logistic and other costs. It primarily improves corporate operation since, based on its feedback, it enables the management to review, improve and correct the processes.
In order to get a complete picture about the logistic perfor-mance of the organizations, the logistic costs of those not ap-plying logistic controlling at all were also investigated. At the moment, 27.5% (48% industry, 52% services) of the organiza-tions do not apply logistic controlling at all. The development of unit logistic costs of these companies fluctuates widely. In the industrial sector these costs increased in the case of 43.6% of organizations, stagnated in the case of 43.6% and decreased in the case of only 12.8%. Regarding service, the stagnation of these costs was the highest, in the case of 58.0%. 30.0% of those not applying logistic controlling decreased these costs, while in the case of 12.0% the unit logistic costs increased. The specific logistic cost, at the organizations without logistic controlling, stagnated in 52% of the enterprises, increased in 27%, and decreased in 21% of the organizations.
The Effect of Logistic Controlling on Business Processes 111
APSTRACT Vol. 8. Number 2–3. 2014 pages 107–111 ISSN 1789-7874
Conclusions and recommendations
It becomes more and more evident for managers that the im-portance of logistics is increasing. In order to maintain the long term success of organizations – because of the complicat-ed material and informational processes – there is demand for transparent, easily queryable, quickly answering information systems that serve precise information. Transparent manage-ment, profit maximization and cost minimization are expected from the competitive enterprises.
Based on the research it can be stated that an overwhelming majority of the organizations taking part in the survey (72.5%) have applied logistic controlling system, which greatly con-tributed to the decrease in unit logistic costs and inventory, giving continuous information to the management and ensur-ing the opportunity for intervention.
One of the fundamental requirements of a logistic control-ling system is flexibility. Software developers established a system which can be easily incorporated into the organization, and thus can be easily adapted to the needs of the enterprise, taking structural features into consideration. Due to this flex-ibility, logistic controlling systems are widespread among en-terprises regardless of organizational profile.
Upon examining the possible connection between the age of companies and the application of organizational control-ling systems, it can be concluded that there is no connection between the two factors. Accordingly, the application of the system can be adapted into any organization where a need for this appears.
The need for the application of logistic controlling occurred in different forms among the examined organizations. Logis-tic controlling systems provide precise information about pro-duction and service processes, enabling the management to control, intervene and correct operation.
Based on the obtained results, logistics controlling sys-tems lived up to the expectations of managers. Their positive effects on organizational operation and more efficient man-agement were experienced by all users, but differences were found in the development of the unit logistic costs. About half of the organizations that applied logistic controlling decreased unit logistic costs. The cost reduction in the industrial sector was more significant than it was in the service sector.
According to the results, the application of logistic control-ling system contributes to efficient operations, and it supports the management in reaching long-term success.
References
Andrews D, Nonnecke B & Preece J (2003): Electronic survey methodology: a case study in reaching hard-to-involve internet users. International Journal of Human-Computer Interaction, 16, 185–210.
Boda Gy & Szlávik P (2001): Kontrolling rendszerek ter ve zé se. KJK–Kerszöv Kiadó, Budapest, 409 pp.Boda Gy & Szlávik P (2005): Kontrolling rendszerek. Budapest, KJK–KERSZÖV Jogi és Üzleti Kiadó Kft., 450 pp.Businessflex: A logisztikai kontrolling, Downloaded: 2013-07-10, http://www.google.hu/url?sa=t&rct=j&q=&esrc=s&frm=1&source=web&cd=2&ved=0CDkQFjAB&url=http%3A%2F%2Fwww.businessflex.hu%2Findex.php%3Foption%3Dcom_phocadownload%26view%3Dcategory%26download%3D19%3Abusnessflexlogisztikaikontrollingalapjaipdf%26id%3D9%3Aa-businessflex-es-a-logisztikai-kontrolling&ei=dkndUZnvDM6rPMLXgPgP&usg=AFQjCNFFLiCpM1iFLtLRdK4d8ZTigo19nw&sig2=Ni_Km3LfCRROrW-gT9o2Xg) Cooper J (1994): Logistic and distribution planning strategies for management. Kogan Page, London (UK)Frankovics A (2005): A controlling fejlődésének sajátosságai, PhD. értekezés, Budapest, 76 p.Hajós L, Pakurár M & Berde Cs (2007): Szervezés és logisztika. Szaktudás Kiadó Ház Zrt., Budapest, 195 pp.Horst Günter H & Kissing H (1993): Controlling – das Unterneh-men mit Zahlen führen. Weka-Verlag, Fachverlag für Unternehmens-recht, Management, Technik. ZürichIllés B (2011): Logisztika a tudományban és a gazdaságban, Mis-kol ci Egyetem, Multidiszciplináris tudományok, I. kötet 1. szám, pp. 11–20 pp.Kaplan RS & Atkinson AA (2003): Vezetői üzleti gazdaságtan. Panem Kft., BudapestKnoll I (2002): Logisztika–Gazdaság–Társadalom. Kovásznai Kiadó, Budapest, 121 pp.Maczó K & Horváth E (2001): Controlling a gyakorlatban. Verlag Dashöfer Szakkiadó Kft., 27 p.Méhesné Berek Sz (2011): The contact of logistics and controlling. Global Management Conference, Accounting, 04–07 May 2011, Gödöllő, ISBN: 978-963-269-233-3, L. Vasa-H. Nagy, Szent István University, Gödöllő. Szent István University, pp. 87–96 pp.Nagy M & Galántai T (2010): Az operatív kontrolling szerepe a vállalakozások gyakorlati működésében, Plain Consult Kkt., Down-loa ded: 2013-07-10, www.plainconsult.hu, http://www.kocsis florakft.hu/images/hirek/Operativ_kontrolling_Galantai_Tamas.pdf Némon Z, Sebestyén L, Vörösmarty Gy (2006): Logisztika Fo lya ma tok az ellátási láncban. Kereskedelmi és Idegenforgalmi To-vább kép ző Kft., Budapest, 388 pp.Schwalbe H (1990): Gyakorlati marketing kis- és középvállalko-zások számára. KJK Kiadó, BudapestVántus A (2012): Az állattartó telepek műszaki felszereltségének szervezettségi hatása Mosonmagyaróvár XXXIV Óvári Tudományos Nap CD.Vántus A & Hagymássy Z (2014): Connection between human resource and technical equipment and importance of these factors in production Taylor Gazdálkodás- és Szervezéstudományi folyóirat A Virtuális Intézet Közép-Európa Kutatására Közleményei VI: 3–4. No.16–17 134–139 pp.
APSTRACT Vol. 8. Number 2–3. 2014 pages 113–118 ISSN 1789-7874
Introduction
The most ancient health concepts interpret health from a holis-tic approach. They regard intrapersonal, interpersonal and en-vironmental balance as a unity. The health concept in Europe has gone through on several changes during the past centuries. Along with the development of sciences in the nineteenth cen-tury the biomedical view of health became the most accepted view on the Continent. The concept that health is equal to the absence of disease (Almedom and Glandon 2007) leads back to that historical period. During the past century the devel-opment of humanities added several aspects to that view. In 1946 the WHO (1992) published a more complex definition: “Health is a state of complete physical, mental and social well-being and not merely the absence of disease or infirmity.” We shall admit that it is still the most common definition of health, but several problems occurred when it was attempted to put into practice. It turned out that a state of complete physical, mental and social well-being is very difficult to maintain and it stands closer to the definition of happiness than of health. It has several consequences, for example, while health should be considered as a positive and universal human right it causes difficulties to consider happiness as a positive right simply
because it cannot be delivered on a person by any social action (Saracci 1997). The WHO had to reconstruct its definition to emphasize the process and resource characteristics of health. “Health is a resource for everyday life, not the objective of liv-ing; it is a positive concept, emphasizing social and personal resources as well as physical capabilities” (WHO 1984). To-day the most accepted scientific definition of health includes several dimensions and the capability to achieve and main-tain health. As it is so, to maintain health needs a continuous awareness and activity. “Health is a condition which is char-acterised by anatomical integrity, ability to perform, personal values, family, work and community involvement, the ability to cope with physical, biological and social stress, feelings of well-being and exemption from risks of diseases and early death” (Tringer 2002).
The multidimensional approach of health is important in practice because these dimensions are is dynamic interac-tions as well, and interventions that have an impact in one area affects other areas as well. For example it is a proven fact that emotional well-being has a profound impact on car-diovascular health (Williams et al. 1999). The social dimen-sion contributes significantly to understanding the expected health consequences and the treatment of many diseases such
Consumer ApproACh of heAlth And AyurvedA
Sára Szabó1, Viktória Szente1, Zoltán Szakály2 & András Nábrádi2
1Kaposvár University2University of Debrecen
Abstract: The aim of this study was to explore the differences of health interpretation between people with ayurvedic approach and non ayurvedic but health conscious approach. While Ayurveda has a holistic approach to health, the European medicine focuses on its physical aspects (bio-medicinal model). Although theoretically a complex interpretation of health (bio-psycho-social model) is the most accepted in Hungary, we examined whether it prevails on a practical level.We carried out a representative survey (N=1000) to examine the health-related knowledge and behaviour of the Hungarian population. To achieve deeper understanding of the subject, we carried out two focus group discussions. We selected health conscious people in the first group and ayurvedic oriented people in the second group to compare their attitudes towards health. The results showed that the majority of the Hungarian population (83,2%) have recognised that health is more than a bio-medicinal approach, it is built up of physical, psychological, mental and social factors, but in most cases we found huge gaps between recognition and action. During discussions the ayurvedic oriented group construed an interpretation that contained all the five health dimensions of WHO and mentioned spirituality as an additional dimension, while the health conscious group mainly emphasized physical health. We also asked the participants about their own health behaviour and found the same pattern.It can be stated that the Hungarian population theoretically admits an integrative model of health but it does not appear in their health behaviour. It seems that ayurvedic orientation contributes to bringing knowledge to practice. Ayurvedic oriented people have a more complex interpretation of health and are willing to do more for their health, so they are a good target group for prevention campaigns and health care services. It also suggests that the spread of ayurvedic approach could contribute to better health behaviour in Hungary.
Keywords: consumer habit of ayurvedic/non ayurvedic oriented people, health interpretation, health-related behaviour, 1000 questioner
Applied Studies in Agribusiness and Commerce – APSTRACTAgroinform Publishing House, Budapest sCientifiC pApers
114 Sára Szabó, Viktória Szente, Zoltán Szakály, András Nábrádi
APSTRACT Vol. 8. Number 2–3. 2014 pages 113–118 ISSN 1789-7874
as several types of cancer, cardiovascular disease, immune function (Callaghan and Morrisey 1993; Uchino, Cacioppo and Kiecolt-Glaser 1996). The social support also has a posi-tive impact on health behaviour, self-esteem and optimism (McNicholas 2002). Spirituality had a significant impact on depressive symptom severity in a sample of terminally ill pa-tients with cancer and AIDS (Nelson et al. 2002). Feher and Maly (1999) showed that spirituality can help in coping with breast cancer. Religious and spiritual faith provided respon-dents with the emotional support necessary to deal with their breast cancer (91%), with social support (70%), and with the ability to make meaning in their everyday life, particularly during their cancer experience (64%). High level of spiritu-ality helps to cope with different forms of eating disorders (Hawks, Goudy and Gast 2003), and finally we would like of mention the study of White, Hawks and Gast (1999) that showed positive correlation between self-esteem, locus of control and health behaviour factors. Thus, certain dimensions of health cannot be interpreted by themselves, the certain fac-tors have special impacts on each other, general health condi-tion and health behaviour as well.
It can be established on the developmental line of health definitions that it has been enriched by several scientific per-spectives during the past century, but in its view it turned back to the holistic approach. The question might arise: if the sci-entific way of thinking has gone through such an impressive development then why the Hungarian healthcare does not ap-ply the holistic therapies. We argue that it is one issue to solve the problem on the level of scientific discussion, and it is an-other one to change the therapy practice in the national health-care and people’s attitude towards health and healthcare.
Ayurveda is very special from that aspect. In the ayurvedic practice we cannot draw such a developmental line of health definitions since it is based on 5000-year-old knowledge and it has not changed in any relevant aspects either on theo-retical, or on practical level. It is essential to establish when examining ayurveda that the holistic view of human health and therapies has never been separated into solely physical, psychological treatments (Frawley 2006). From the ayurvedic perspective the Atman (Self in Euorpean psychology) is sur-rounded by five “sheathes” or koshas, they contain physical, vital, mental, intellectual and conscious qualities of the per-son. This concept is probably the closest to Carl Jung’s (Jung 1936) personality theory in European psychology. Ayurvedic diagnosis and treatment never loses sight of the basic prin-ciple that in all human beings these koshas are in dynamic interaction and the disease occurs when the balance is broken within or between the koshas. Ayurveda also emphasizes the importance of general prevention, so it belongs to the positive health approaches.
The aim of this study was to explore the differences of health interpretation between people with ayurvedic ap-proach and non ayurvedic but health conscious approach. While Ayurveda has a holistic approach to health, the Euro-pean medicine focuses on its physical aspects (bio-medici-nal model). Although theoretically a complex interpretation of health (bio-psycho-social model) is the most accepted in
Hungary, we examined whether it prevails on a practical level. In our research we examined the health concepts and healthcare activities of the Hungarian population to find out which of the above mentioned levels are the consumers’ ac-tual health concepts. We also examined the health concepts of an ayurvedic oriented group to see how the perspective of ay-urveda appears amongst the ayurvedic oriented Hungarians and how they consider the further introduction of ayurveda in Hungary.
Method
In order to get a complex understanding of the topic our re-search contained both qualitative and quantitative methods. We examined the health interpretation and health-related behaviour with a questionnaire. 1000 respondents were in-volved in a nationwide representative survey. The sampling was carried out by random walking. Within the households the interviewer chose the respondents with a so-called birthday key in order to ensure the randomness. The data collection was carried out personally in the homes of the interviewees. The interviewer entered the replies on the questionnaire in order to avoid misunderstanding and unfilled questions. To increase reliability the interviewers were randomly checked by supervisors. The survey contained closed questions only (polar questions and scale questions). The data were analysed by SPSS 20 statistical software.
In the qualitative part we carried out two focus group dis-cussions. We selected health conscious people in the first group and ayurvedic oriented people in the second group to compare their attitudes towards health and to examine their health-related behaviour. The scenario contained three main topics: interpretation of health, health-related behaviour and ayurveda.
Results
Results of quantitative researchThe questionnaire contained three blocks of questions beside the background variables. The first block of questions referred to the health interpretation of the respondents. We offered 12 interpretations and asked the participants to tell what they mean by health concept out of the listed interpretations. They were allowed to mark more than one option. Diagram 1 shows the results of this question block.
According to the answers illustrated by Diagram 1 it can be assumed that the respondents do not have an outstanding preference towards any of the interpretations. Most of the con-sumers marked the family health, healthy lifestyle, absence of disease, child health and healthy nutrition followed by the complex interpretations of health like physical, psychologi-cal, and mental harmony and the physical, psychological men-tal and social harmony. The results prove that the concept of health is in relation with the concept of family, and that the
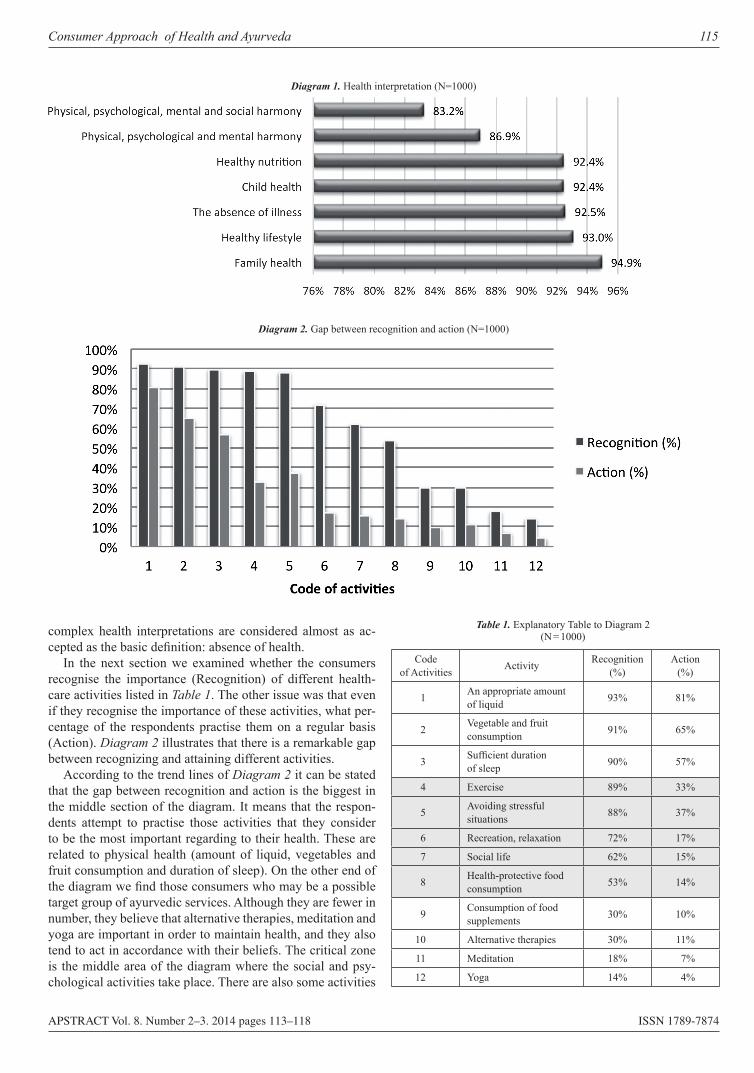
Consumer Approach of Health and Ayurveda 115
APSTRACT Vol. 8. Number 2–3. 2014 pages 113–118 ISSN 1789-7874
complex health interpretations are considered almost as ac-cepted as the basic definition: absence of health.
In the next section we examined whether the consumers recognise the importance (Recognition) of different health-care activities listed in Table 1. The other issue was that even if they recognise the importance of these activities, what per-centage of the respondents practise them on a regular basis (Action). Diagram 2 illustrates that there is a remarkable gap between recognizing and attaining different activities.
According to the trend lines of Diagram 2 it can be stated that the gap between recognition and action is the biggest in the middle section of the diagram. It means that the respon-dents attempt to practise those activities that they consider to be the most important regarding to their health. These are related to physical health (amount of liquid, vegetables and fruit consumption and duration of sleep). On the other end of the diagram we find those consumers who may be a possible target group of ayurvedic services. Although they are fewer in number, they believe that alternative therapies, meditation and yoga are important in order to maintain health, and they also tend to act in accordance with their beliefs. The critical zone is the middle area of the diagram where the social and psy-chological activities take place. There are also some activities
Diagram 1. Health interpretation (N=1000)
Diagram 2. Gap between recognition and action (N=1000)
Table 1. Explanatory Table to Diagram 2 (N = 1000)
Code of Activities Activity Recognition
(%)Action
(%)
1 An appropriate amount of liquid 93% 81%
2 Vegetable and fruit consumption 91% 65%
3 Sufficient duration of sleep 90% 57%
4 Exercise 89% 33%
5 Avoiding stressful situations 88% 37%
6 Recreation, relaxation 72% 17%
7 Social life 62% 15%
8 Health-protective food consumption 53% 14%
9 Consumption of food supplements 30% 10%
10 Alternative therapies 30% 11%
11 Meditation 18% 7%
12 Yoga 14% 4%
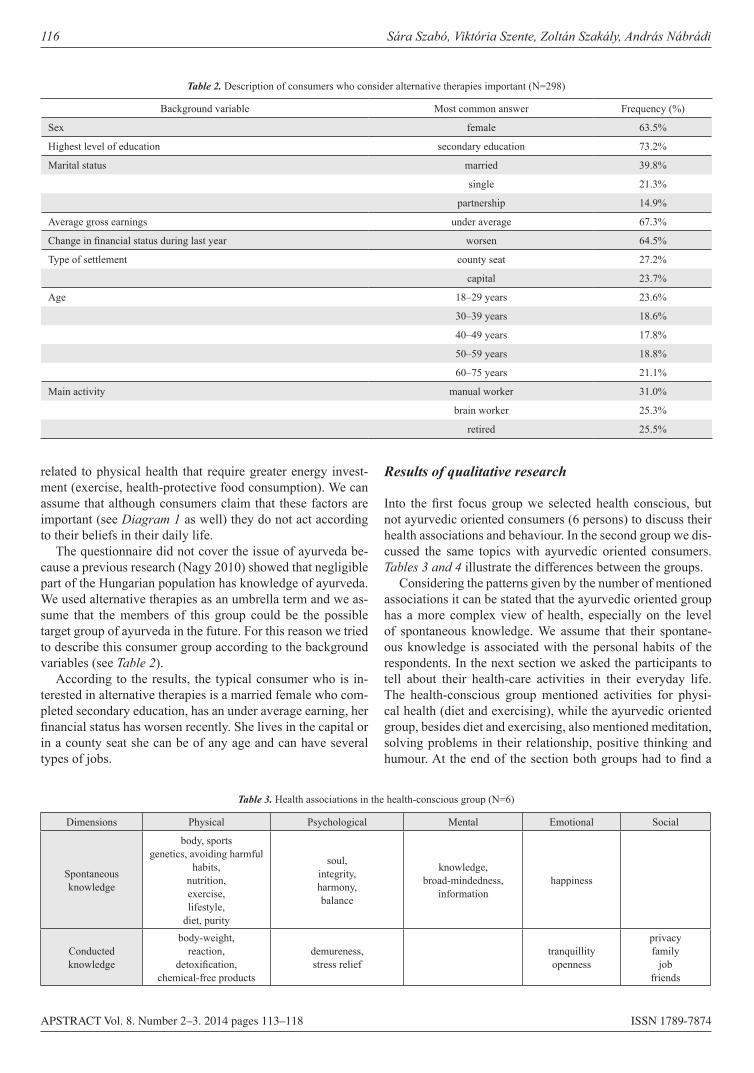
116 Sára Szabó, Viktória Szente, Zoltán Szakály, András Nábrádi
APSTRACT Vol. 8. Number 2–3. 2014 pages 113–118 ISSN 1789-7874
related to physical health that require greater energy invest-ment (exercise, health-protective food consumption). We can assume that although consumers claim that these factors are important (see Diagram 1 as well) they do not act according to their beliefs in their daily life.
The questionnaire did not cover the issue of ayurveda be-cause a previous research (Nagy 2010) showed that negligible part of the Hungarian population has knowledge of ayurveda. We used alternative therapies as an umbrella term and we as-sume that the members of this group could be the possible target group of ayurveda in the future. For this reason we tried to describe this consumer group according to the background variables (see Table 2).
According to the results, the typical consumer who is in-terested in alternative therapies is a married female who com-pleted secondary education, has an under average earning, her financial status has worsen recently. She lives in the capital or in a county seat she can be of any age and can have several types of jobs.
Results of qualitative research
Into the first focus group we selected health conscious, but not ayurvedic oriented consumers (6 persons) to discuss their health associations and behaviour. In the second group we dis-cussed the same topics with ayurvedic oriented consumers. Tables 3 and 4 illustrate the differences between the groups.
Considering the patterns given by the number of mentioned associations it can be stated that the ayurvedic oriented group has a more complex view of health, especially on the level of spontaneous knowledge. We assume that their spontane-ous knowledge is associated with the personal habits of the respondents. In the next section we asked the participants to tell about their health-care activities in their everyday life. The health-conscious group mentioned activities for physi-cal health (diet and exercising), while the ayurvedic oriented group, besides diet and exercising, also mentioned meditation, solving problems in their relationship, positive thinking and humour. At the end of the section both groups had to find a
Table 2. Description of consumers who consider alternative therapies important (N=298)
Background variable Most common answer Frequency (%)
Sex female 63.5%
Highest level of education secondary education 73.2%
Marital status married 39.8%
single 21.3%
partnership 14.9%
Average gross earnings under average 67.3%
Change in financial status during last year worsen 64.5%
Type of settlement county seat 27.2%
capital 23.7%
Age 18–29 years 23.6%
30–39 years 18.6%
40–49 years 17.8%
50–59 years 18.8%
60–75 years 21.1%
Main activity manual worker 31.0%
brain worker 25.3%
retired 25.5%
Table 3. Health associations in the health-conscious group (N=6)
Dimensions Physical Psychological Mental Emotional Social
Spontaneous knowledge
body, sportsgenetics, avoiding harmful
habits,nutrition,exercise,lifestyle,
diet, purity
soul,integrity,harmony,balance
knowledge,broad-mindedness,
informationhappiness
Conducted knowledge
body-weight,reaction,
detoxification,chemical-free products
demureness,stress relief
tranquillityopenness
privacyfamily
jobfriends
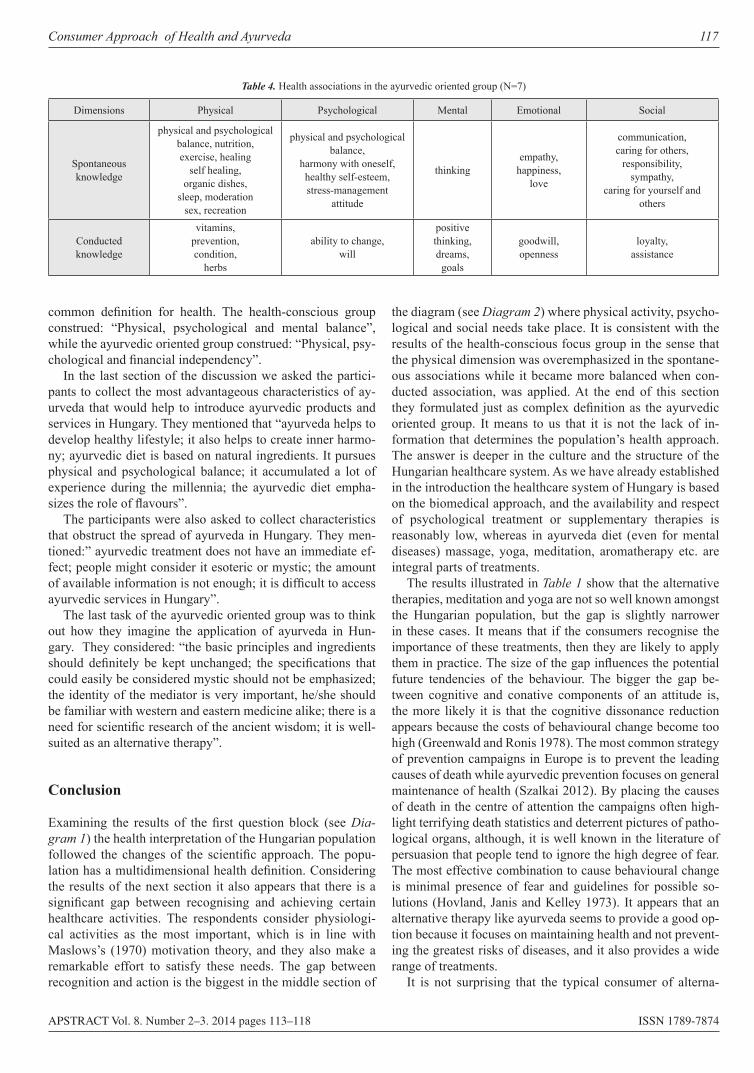
Consumer Approach of Health and Ayurveda 117
APSTRACT Vol. 8. Number 2–3. 2014 pages 113–118 ISSN 1789-7874
common definition for health. The health-conscious group construed: “Physical, psychological and mental balance”, while the ayurvedic oriented group construed: “Physical, psy-chological and financial independency”.
In the last section of the discussion we asked the partici-pants to collect the most advantageous characteristics of ay-urveda that would help to introduce ayurvedic products and services in Hungary. They mentioned that “ayurveda helps to develop healthy lifestyle; it also helps to create inner harmo-ny; ayurvedic diet is based on natural ingredients. It pursues physical and psychological balance; it accumulated a lot of experience during the millennia; the ayurvedic diet empha-sizes the role of flavours”.
The participants were also asked to collect characteristics that obstruct the spread of ayurveda in Hungary. They men-tioned:” ayurvedic treatment does not have an immediate ef-fect; people might consider it esoteric or mystic; the amount of available information is not enough; it is difficult to access ayurvedic services in Hungary”.
The last task of the ayurvedic oriented group was to think out how they imagine the application of ayurveda in Hun-gary. They considered: “the basic principles and ingredients should definitely be kept unchanged; the specifications that could easily be considered mystic should not be emphasized; the identity of the mediator is very important, he/she should be familiar with western and eastern medicine alike; there is a need for scientific research of the ancient wisdom; it is well-suited as an alternative therapy”.
Conclusion
Examining the results of the first question block (see Dia-gram 1) the health interpretation of the Hungarian population followed the changes of the scientific approach. The popu-lation has a multidimensional health definition. Considering the results of the next section it also appears that there is a significant gap between recognising and achieving certain healthcare activities. The respondents consider physiologi-cal activities as the most important, which is in line with Maslows’s (1970) motivation theory, and they also make a remarkable effort to satisfy these needs. The gap between recognition and action is the biggest in the middle section of
the diagram (see Diagram 2) where physical activity, psycho-logical and social needs take place. It is consistent with the results of the health-conscious focus group in the sense that the physical dimension was overemphasized in the spontane-ous associations while it became more balanced when con-ducted association, was applied. At the end of this section they formulated just as complex definition as the ayurvedic oriented group. It means to us that it is not the lack of in-formation that determines the population’s health approach. The answer is deeper in the culture and the structure of the Hungarian healthcare system. As we have already established in the introduction the healthcare system of Hungary is based on the biomedical approach, and the availability and respect of psychological treatment or supplementary therapies is reasonably low, whereas in ayurveda diet (even for mental diseases) massage, yoga, meditation, aromatherapy etc. are integral parts of treatments.
The results illustrated in Table 1 show that the alternative therapies, meditation and yoga are not so well known amongst the Hungarian population, but the gap is slightly narrower in these cases. It means that if the consumers recognise the importance of these treatments, then they are likely to apply them in practice. The size of the gap influences the potential future tendencies of the behaviour. The bigger the gap be-tween cognitive and conative components of an attitude is, the more likely it is that the cognitive dissonance reduction appears because the costs of behavioural change become too high (Greenwald and Ronis 1978). The most common strategy of prevention campaigns in Europe is to prevent the leading causes of death while ayurvedic prevention focuses on general maintenance of health (Szalkai 2012). By placing the causes of death in the centre of attention the campaigns often high-light terrifying death statistics and deterrent pictures of patho-logical organs, although, it is well known in the literature of persuasion that people tend to ignore the high degree of fear. The most effective combination to cause behavioural change is minimal presence of fear and guidelines for possible so-lutions (Hovland, Janis and Kelley 1973). It appears that an alternative therapy like ayurveda seems to provide a good op-tion because it focuses on maintaining health and not prevent-ing the greatest risks of diseases, and it also provides a wide range of treatments.
It is not surprising that the typical consumer of alterna-
Table 4. Health associations in the ayurvedic oriented group (N=7)
Dimensions Physical Psychological Mental Emotional Social
Spontaneous knowledge
physical and psychological balance, nutrition,exercise, healing
self healing,organic dishes,
sleep, moderationsex, recreation
physical and psychological balance,
harmony with oneself,healthy self-esteem,stress-management
attitude
thinkingempathy,
happiness,love
communication,caring for others,
responsibility,sympathy,
caring for yourself and others
Conducted knowledge
vitamins,prevention,condition,
herbs
ability to change,will
positive thinking,dreams,
goals
goodwill,openness
loyalty,assistance
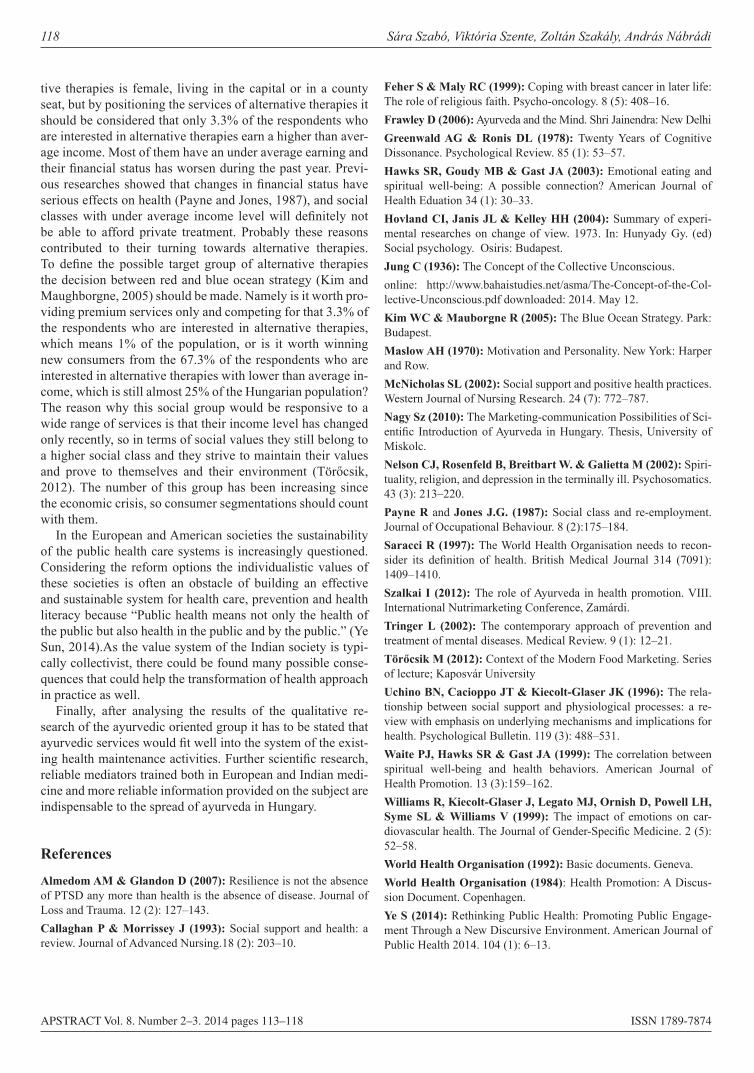
118 Sára Szabó, Viktória Szente, Zoltán Szakály, András Nábrádi
APSTRACT Vol. 8. Number 2–3. 2014 pages 113–118 ISSN 1789-7874
tive therapies is female, living in the capital or in a county seat, but by positioning the services of alternative therapies it should be considered that only 3.3% of the respondents who are interested in alternative therapies earn a higher than aver-age income. Most of them have an under average earning and their financial status has worsen during the past year. Previ-ous researches showed that changes in financial status have serious effects on health (Payne and Jones, 1987), and social classes with under average income level will definitely not be able to afford private treatment. Probably these reasons contributed to their turning towards alternative therapies. To define the possible target group of alternative therapies the decision between red and blue ocean strategy (Kim and Maughborgne, 2005) should be made. Namely is it worth pro-viding premium services only and competing for that 3.3% of the respondents who are interested in alternative therapies, which means 1% of the population, or is it worth winning new consumers from the 67.3% of the respondents who are interested in alternative therapies with lower than average in-come, which is still almost 25% of the Hungarian population? The reason why this social group would be responsive to a wide range of services is that their income level has changed only recently, so in terms of social values they still belong to a higher social class and they strive to maintain their values and prove to themselves and their environment (Törőcsik, 2012). The number of this group has been increasing since the economic crisis, so consumer segmentations should count with them.
In the European and American societies the sustainability of the public health care systems is increasingly questioned. Considering the reform options the individualistic values of these societies is often an obstacle of building an effective and sustainable system for health care, prevention and health literacy because “Public health means not only the health of the public but also health in the public and by the public.” (Ye Sun, 2014).As the value system of the Indian society is typi-cally collectivist, there could be found many possible conse-quences that could help the transformation of health approach in practice as well.
Finally, after analysing the results of the qualitative re-search of the ayurvedic oriented group it has to be stated that ayurvedic services would fit well into the system of the exist-ing health maintenance activities. Further scientific research, reliable mediators trained both in European and Indian medi-cine and more reliable information provided on the subject are indispensable to the spread of ayurveda in Hungary.
References
Almedom AM & Glandon D (2007): Resilience is not the absence of PTSD any more than health is the absence of disease. Journal of Loss and Trauma. 12 (2): 127–143.Callaghan P & Morrissey J (1993): Social support and health: a review. Journal of Advanced Nursing.18 (2): 203–10.
Feher S & Maly RC (1999): Coping with breast cancer in later life: The role of religious faith. Psycho-oncology. 8 (5): 408–16.Frawley D (2006): Ayurveda and the Mind. Shri Jainendra: New DelhiGreenwald AG & Ronis DL (1978): Twenty Years of Cognitive Dissonance. Psychological Review. 85 (1): 53–57.Hawks SR, Goudy MB & Gast JA (2003): Emotional eating and spiritual well-being: A possible connection? American Journal of Health Eduation 34 (1): 30–33.Hovland CI, Janis JL & Kelley HH (2004): Summary of experi-mental researches on change of view. 1973. In: Hunyady Gy. (ed) Social psychology. Osiris: Budapest.Jung C (1936): The Concept of the Collective Unconscious. online: http://www.bahaistudies.net/asma/The-Concept-of-the-Col-lective-Unconscious.pdf downloaded: 2014. May 12.Kim WC & Mauborgne R (2005): The Blue Ocean Strategy. Park: Budapest.Maslow AH (1970): Motivation and Personality. New York: Harper and Row.McNicholas SL (2002): Social support and positive health practices. Western Journal of Nursing Research. 24 (7): 772–787.Nagy Sz (2010): The Marketing-communication Possibilities of Sci-entific Introduction of Ayurveda in Hungary. Thesis, University of Miskolc.Nelson CJ, Rosenfeld B, Breitbart W. & Galietta M (2002): Spiri-tuality, religion, and depression in the terminally ill. Psychosomatics. 43 (3): 213–220.Payne R and Jones J.G. (1987): Social class and re-employment. Journal of Occupational Behaviour. 8 (2):175–184.Saracci R (1997): The World Health Organisation needs to recon-sider its definition of health. British Medical Journal 314 (7091): 1409–1410. Szalkai I (2012): The role of Ayurveda in health promotion. VIII. International Nutrimarketing Conference, Zamárdi.Tringer L (2002): The contemporary approach of prevention and treatment of mental diseases. Medical Review. 9 (1): 12–21.Törőcsik M (2012): Context of the Modern Food Marketing. Series of lecture; Kaposvár UniversityUchino BN, Cacioppo JT & Kiecolt-Glaser JK (1996): The rela-tionship between social support and physiological processes: a re-view with emphasis on underlying mechanisms and implications for health. Psychological Bulletin. 119 (3): 488–531.Waite PJ, Hawks SR & Gast JA (1999): The correlation between spiritual well-being and health behaviors. American Journal of Health Promotion. 13 (3):159–162.Williams R, Kiecolt-Glaser J, Legato MJ, Ornish D, Powell LH, Syme SL & Williams V (1999): The impact of emotions on car-diovascular health. The Journal of Gender-Specific Medicine. 2 (5): 52–58.World Health Organisation (1992): Basic documents. Geneva.World Health Organisation (1984): Health Promotion: A Discus-sion Document. Copenhagen. Ye S (2014): Rethinking Public Health: Promoting Public Engage-ment Through a New Discursive Environment. American Journal of Public Health 2014. 104 (1): 6–13.
APSTRACT Vol. 8. Number 2–3. 2014 pages 119–132 ISSN 1789-7874
Introduction and literature review
The significance of the sheep sector might differ in terms of continents, countries as a result of the structure and develop-ment of economy and agriculture; however, the relevance of sheep as a utility animal should be unquestioned. The current performance of the sheep sector is rightly classified as an es-sential part of global animal husbandry.
Sheep can be found in all continents; the species is rich in varieties, all the products are utilizable and sheep lends itself
as the raw material of valuable, sometimes luxury category goods. Sheep, as small ruminants, utilize grasslands and al-though they are periodically kept in stalls, their keeping is en-vironmental-friendly. In contrast with all the positive aspects of the sector, the number of these animal species drops world-wide, in the European Union and in Hungary as well. Out of the four main sheep products (meat, fleece, milk and pelt), meat is the primary product in several parts of the world, espe-cially in areas of temperate climate, and the relevance of meat production grows all over the world (Morris 2009). The ratio
Defining the Strategic ObjectiveS Of hungarian MuttOn PrODuct chain anD eleMentS Of Marketing Strategy in the beginning Of the SecOnD DecaDe
Of the centuryAndrás Nábrádi, Béla Cehla, Orsolya Szigeti & Zoltán Szakály
University of Debrecen, Hungary
Summary: The sheep sector is regarded to be a “black sheep” in Hungary, both in terms of economy and marketing. On one hand, the sector is not easily traceable as available relevant data are partial and infected by the effects of black market or underground economy; on the other hand, there are no clear, concrete statistical data or surveys on consumption either. The present study attempts to dissolve the above anomalies and present findings by fact-based model calculations and actual marketing surveys. The fact-based model developed and used for more than 200 variables verifies the correctness of economic calculations. Original examinations were performed by Béla Cehla, doctoral candidate, in 2000–2011. The marketing survey, although not in full accordance with statistical requirements, was carried out in 2012 and it processed relevant data authentically.
The main conclusions are the following: It is clear so far that genetic basis should primarily be evolved in the industry, as it is the factor that mainly contributes to profitability and price-type factors come only following it.Genetic modification is achievable by changing breeds or crossbreeding. The findings of product chain level sensitivity analysis have provided clues that the added value generated in the sector is already determined during slaughter lamb production and progeny influences this value in approximately 80%. Critical points are feed conversion ratio and the relating price of lamb feed, which influence added values by 2.7–2.9%. The remaining factors affect added value through feeding costs, although not considerably.
The following activities can boost interest in the market of sheep products:• Comprehensive market research • Stimulation of cultural development by product-tasting, exchanging information and recipes • Development of supply in accordance with demand • Identification of target markets, positioning products • Diversification of product range • Community trade mark to guarantee excellent quality and Hungarian origin • Selection of credible poster faces, organization of advertising campaigns
Keywords: Mutton product chain, strategic objectives, economic efficiency, marketing strategy in Hungarian mutton products
Applied Studies in Agribusiness and Commerce – APSTRACTAgroinform Publishing House, Budapest Scientific PaPerS
120 András Nábrádi, Béla Cehla, Orsolya Szigeti & Zoltán Szakály
APSTRACT Vol. 8. Number 2–3. 2014 pages 119–132 ISSN 1789-7874
of sheep population is gradually reducing within the number of utility animals globally and in the European Union (EU) and the role of the sector in meat production and trade shows a declining tendency simultaneously.
Whereas in 2007 the number of sheep population was 1.11 billion in the world, this number reduced to 1.07 by 2009. A similar tendency emerges in the EU, where the number of sheep population decreased by almost 15 million animals dur-ing the past 15 years (FAO, EUROSTAT).
Sheep breeding has a long tradition in Hungary; however, its share out of the total agricultural production value is mere-ly 1%. The share of sheep farming out of products of animal origin is 2%, which lags behind its share before the political transformation considerably, when it exceeded 4%. Similarly, the significance of domestic sheep faming and its commercial role have been diminishing for years, as it is confirmed by the reduction of population number in domestic sheep stock (844 000 ewes KSH /Central Statistical Office/, 2011a, Cehla et al.; Nábrádi et al.).
The current situation and potential future developments of sheep sector are fundamentally determined by the efficiency of production, the judgement of sheep products and the struc-ture of production in the sector.
More than 87% of sheep bred in Hungary belong to the Hungarian Merino species kept under half-intensive farming technologies. The dominance of the Merino species and the resulting market situation made the small-weight slaughter lamb, produced under half-intensive circumstances, the single marketable product of domestic sheep farming much in de-mand in the Italian slaughter lamb market.
Consequently, export orientation targeting mainly Italian markets is characteristic of the industry, which markets live lambs almost entirely. Domestic demand for the products of the sheep sector is minimal, approximately about 0.38 kg/per-son/year, which is outstandingly low as compared to domestic meat consumption.
The focal problem of Hungarian sheep sector is its deterio-rating competitiveness, its low efficiency in added value and innovation which hinder sustainability in the long run. The basic problem can be broken down into three areas: social and societal, economic, market related and environmental prob-lems (Nábrádi 2009, 2011; Nábrádi et al. 2012; Cehla 2011; Cehla at al. 2012).
The unfavourable nature of these factors led to low outputs, the stagnation of domestic consumption and to low income-generating capacity in the sector in the past years.
The EU has been the net importer of sheep meat for years; its import-export balance is about 201 thousand t.
The prevailing shortage of products provides Hungary with market opportunities which have only been exploited in the area of slaughter lamb export. In addition to slaughter lamb sales, our market potentials are boundless in the market of mut-ton-based processed meat products into EU member and non-member states as well (Lebanon, Switzerland, and Japan etc.).
All the above are confirmed by the fact that the growth of slaughters in 2010 (sheep 15%, lamb 38%) expedited the mas-sive boost of mutton export. Consequently, Hungarian mutton
processing and sales for foreign markets might improve the existing unfavourable situation. For the precise assessment of the economic significance of the sector, our study attempts to explore the volume of value added generated in certain phases of the production chain, which requires the determination of these phases in the sector. Parallel to this, as domestic demand for sheep products is extremely low (Nábrádi 2009; Fenyves et al. 2010), market research has been carried out to unveil the tendencies on demand and supply correlations.
Material and method
As for economic analyses, our study has applied the methods used by the “Debrecen Applied Economics School” and their improved versions. In terms of marketing, the widely acknowl-edged methods successfully used by the “Food Marketing Workgroup”, University of Kaposvár for years were incorpo-rated in our analysis.
The objective evaluation of product chain phases was car-ried out by using the research of B. Cehla 2011, based on ear-lier publication of Szőllősi (2009), on the grounds of stochas-tic and deterministic, realistic model calculations for three primary areas (raw material production, slaughterhouse pro-cessing, domestic consumption and sales in foreign markets).
The core of the analytical system was to simulate economic efficiency (typical of the years 2000–2011) on more than 200 real data-based input variables. All the calculations are built on physical data and expenses related to them express the characteristics of reality. The stochastic simulation includes correlations among functions which were submitted to rig-orous professional verification. Modelling and the “Monte Carlo” simulation method expedited the quantification of risk, i.e. a quasi-deterministic model was converted into a stochas-tic one.
The findings of sensitivity analyses from modelling made the identification of factors which significantly affect the added value (all these have been analyzed by the methodol-ogy of descriptive statistics) possible. The next step was the definition of the added value function by matching, which re-quired a set of numerous input combinations out of produc-tion factors obtained during simulations. Revenues and vary-ing input values were gained from physical data in the case of all sub-modules. On one hand, these allowed to identify the impact of prices and output on earning; on the other hand, to determine the effect of varying outputs given by output on earnings and costs. Modelling and its calculations for realistic values have been prepared several hundred thousand times. This was necessary for the analysis of all potential changes and their realistic values within the meaning of “large num-bers”. Being aware of the above mentioned, we have formed our opinion for the preparation of decision-making in relation to the Hungarian sheep sector.
The two key methods of marketing-based primary mar-ket research are quantitative and qualitative data collection. Qualitative market research provides rather indicative (it is not for generalization) than statistically reliable results, which
Defining the Strategic Objectives of Hungarian Mutton Product Chain and Elements of Marketing Strategy … 121
APSTRACT Vol. 8. Number 2–3. 2014 pages 119–132 ISSN 1789-7874
are obtained through two highly accepted methods: individual and focus group interviews. The findings of qualitative market research are of exploratory nature and they are usually not suitable for statistical analysis; information is textual and can-not be quantified (Scipione 1994; Malhotra 2001).
Individual in-depth interviews were used to reveal the opinion of the supply side in the market and focus group in-terviews to explore consumers’ attitude. The simultaneous ap-plication of the two methods lent itself for the comparison of demand and supply, and through this we could develop the elements of a potential marketing strategy.
The subject of the deep interview was the head of a Hun-ga rian mutton-processing plant, who is a well-renowned, re-spected expert. The areas of the draft in-depth interview were the following: the position of the sector, lamb and mutton con-sumption, definition of target consumer groups, market posi-tioning, the elements of product, price, marketing and com-munication strategy.
The first step in the organization of focus groups was to ask potential consumers to fill in a test-survey (Scipione 1994; Malhotra 2001), which classified the participants in various groups by several aspects (e.g. participation in earlier projects of market research). Another viewpoint was to have a certain level of information about mutton and sheep milk: only those people were recruited who had already tasted and preferred the preparations of the category.
The focus point scenario was suitable to reveal consumer mentality in depth. First preferences and attitudes concerning mutton and sheep milk were questioned, followed by ques-tions about the knowledge of the two product categories. Finally, respondents could taste mutton and sheep milk prod-ucts and the elements of the marketing strategy were outlined.
Results
Phases of the mutton production chain and its sales channels
The Quantified Agribusiness Value Chain of mutton can be broken down into three phases (Figure 1.) The first phase is raw material production, which showed a massive de-cline in the past years. Although in 2000 892 098 slaughter lambs were sold in foreign markets (Juh Terméktanács, Sheep Product Council), this number dropped to 600 000 by 2008 and has practically remained the same so far. The situation of the sector is further aggravated by the obligation of electronic tagging introduced in 2010, which exerts additional burdens on farmers (400HUF/lamb).
The number of sheep farms has plunged markedly and the number of ewes has showed a simultaneous setback. Juhász (2009) claims that the following tendency looms in relation to the reduction of population number: the number of animals radically drops in stock farms with larger animals (above 500 ewes or rather 1000 ewes), primarily resulting in the gradual decline of Hungarian ewe population.
In agreement with ideas of Nábrádi (2012, 2011, 2009), Fenyves et al. (2012), Madai et al. (2009), Cehla et al. (2011, 2012), this is due to the gradual decrease of ewe population, the low level of sheep farm concentration, insufficient profit-ability, the lack of processed products and the unfavourable utilization of the species.
In 2010 there were 6862 sheep farmers in Hungary (MJKSZ, 2010), who owned 844 000 ewes. The progeny of this ewe population, with frequent farrowing, calculating with the farrowing ratio of 100% and 1 weaned lamb per ewe, is 844 thousand lambs. The ratio of mortality, calculating with 5% means 42.2 thousand ewes. If the livestock is improved properly, culling of 15–17% can be calculated, which in this instance appears as slaughter animal in Hungarian mutton markets.
The replacement of slaughtered ewes, with a culling rate of 17%, requires presumably 143 480 ewe lambs annually. Overall, the domestic sheep sector offers 660 thousand lambs for the purpose of slaughter lamb export as commodity sup-ply, assuming that sheep breeders improve their livestock ev-ery year. For the identification of the precise number of live-stock refreshment the periodical information note of MJKSZ (Association of Hungarian Sheep and Goat Breeders) was re-viewed, which highlighted that the number of ewe lambs for further breeding differed widely from calculated data. As the number of actually remaining ewe lambs was almost one fifth of that defined by Cehla (2011), Hungarian sheep population is likely to be regarded ageing.
The average weight of slaughter lambs for EU markets (90% Italy) is 20–20 kg/animal, so live weight has become measurable in export commodity supply (in live weight), and its value was 13 860 t in 2010. The commodity supply of domestic consumption includes cull slaughter lambs, mut-ton import and some thousands of slaughter lambs which are officially slaughtered in two slaughterhouses in Hungary. Domestic consumption consists of 3889 cull sheep and 100 t of slaughter lambs given in carcase.
The second phase includes slaughterhouses and process-ing plants. Currently there is only one sheep slaughterhouse in Hungary, which performs not only cutting but processing as well. The bony and boneless products of this slaughterhouse (lamb, pre-cool vacuum packed, half-oven ready, raw sliced and diced lamb) can be ordered and purchased all over the country, mostly in hyper and supermarkets (60%). Moreover, restaurants, hospitals and hotels (25%), wholesalers in Budapest (15) buy these products (Kukovics 2008). Naturally, several slaughterhouses assume slaughtering and deboning services in Hungary, but their number is minimal and practi-cally they are not indicated in statistical data. In addition, the statistics does not include slaughters performed in households or sheep farms, although dishes prepared of mutton look back to long traditions in certain regions.
In several sheep farms the majority of culling activities usu-ally takes place before major festivities, as most consumers in rural areas purchase mutton for the festive board directly from shepherds. For the sake of completeness, import mutton was included in the second phase.
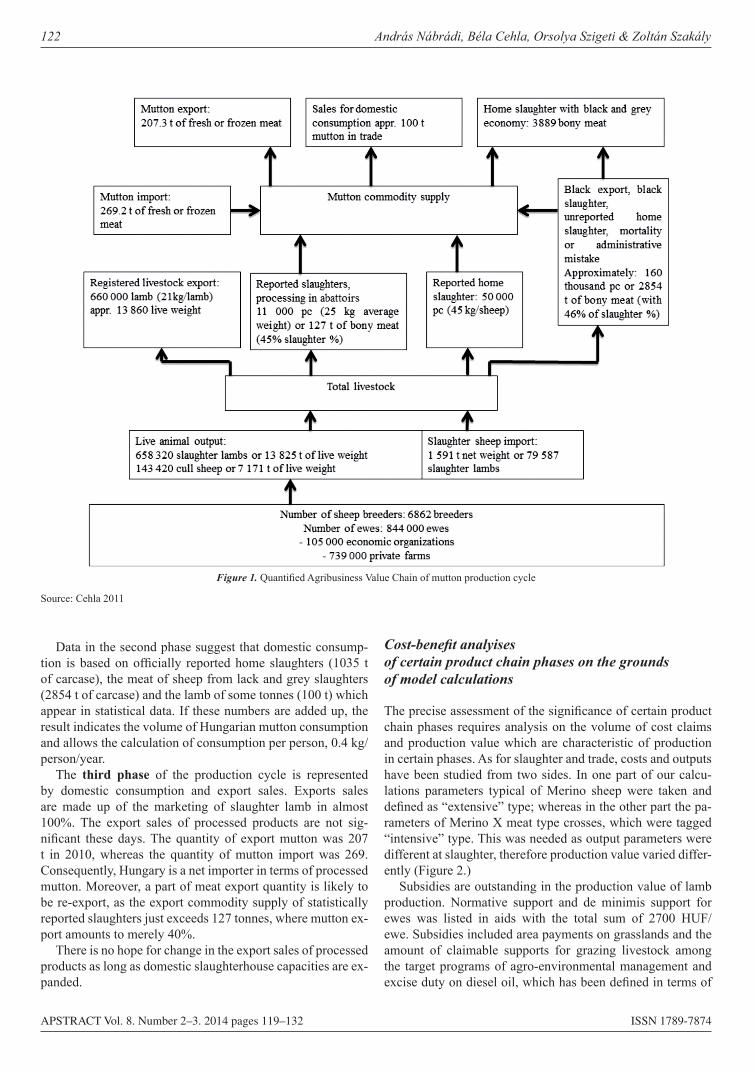
122 András Nábrádi, Béla Cehla, Orsolya Szigeti & Zoltán Szakály
APSTRACT Vol. 8. Number 2–3. 2014 pages 119–132 ISSN 1789-7874
Data in the second phase suggest that domestic consump-tion is based on officially reported home slaughters (1035 t of carcase), the meat of sheep from lack and grey slaughters (2854 t of carcase) and the lamb of some tonnes (100 t) which appear in statistical data. If these numbers are added up, the result indicates the volume of Hungarian mutton consumption and allows the calculation of consumption per person, 0.4 kg/person/year.
The third phase of the production cycle is represented by domestic consumption and export sales. Exports sales are made up of the marketing of slaughter lamb in almost 100%. The export sales of processed products are not sig-nificant these days. The quantity of export mutton was 207 t in 2010, whereas the quantity of mutton import was 269. Consequently, Hungary is a net importer in terms of processed mutton. Moreover, a part of meat export quantity is likely to be re-export, as the export commodity supply of statistically reported slaughters just exceeds 127 tonnes, where mutton ex-port amounts to merely 40%.
There is no hope for change in the export sales of processed products as long as domestic slaughterhouse capacities are ex-panded.
Cost-benefit analyises of certain product chain phases on the grounds of model calculations
The precise assessment of the significance of certain product chain phases requires analysis on the volume of cost claims and production value which are characteristic of production in certain phases. As for slaughter and trade, costs and outputs have been studied from two sides. In one part of our calcu-lations parameters typical of Merino sheep were taken and defined as “extensive” type; whereas in the other part the pa-rameters of Merino X meat type crosses, which were tagged “intensive” type. This was needed as output parameters were different at slaughter, therefore production value varied differ-ently (Figure 2.)
Subsidies are outstanding in the production value of lamb production. Normative support and de minimis support for ewes was listed in aids with the total sum of 2700 HUF/ewe. Subsidies included area payments on grasslands and the amount of claimable supports for grazing livestock among the target programs of agro-environmental management and excise duty on diesel oil, which has been defined in terms of
Figure 1. Quantified Agribusiness Value Chain of mutton production cycle
Source: Cehla 2011
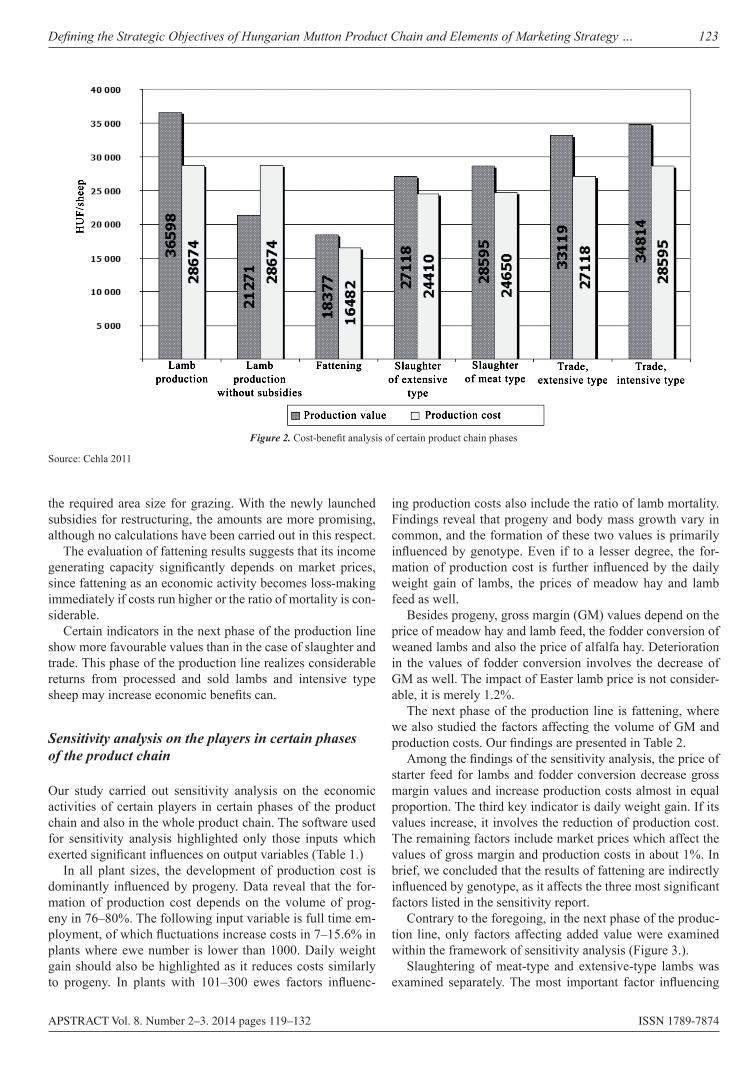
Defining the Strategic Objectives of Hungarian Mutton Product Chain and Elements of Marketing Strategy … 123
APSTRACT Vol. 8. Number 2–3. 2014 pages 119–132 ISSN 1789-7874
the required area size for grazing. With the newly launched subsidies for restructuring, the amounts are more promising, although no calculations have been carried out in this respect.
The evaluation of fattening results suggests that its income generating capacity significantly depends on market prices, since fattening as an economic activity becomes loss-making immediately if costs run higher or the ratio of mortality is con-siderable.
Certain indicators in the next phase of the production line show more favourable values than in the case of slaughter and trade. This phase of the production line realizes considerable returns from processed and sold lambs and intensive type sheep may increase economic benefits can.
Sensitivity analysis on the players in certain phases of the product chain
Our study carried out sensitivity analysis on the economic activities of certain players in certain phases of the product chain and also in the whole product chain. The software used for sensitivity analysis highlighted only those inputs which exerted significant influences on output variables (Table 1.)
In all plant sizes, the development of production cost is dominantly influenced by progeny. Data reveal that the for-mation of production cost depends on the volume of prog-eny in 76–80%. The following input variable is full time em-ployment, of which fluctuations increase costs in 7–15.6% in plants where ewe number is lower than 1000. Daily weight gain should also be highlighted as it reduces costs similarly to progeny. In plants with 101–300 ewes factors influenc-
ing production costs also include the ratio of lamb mortality. Findings reveal that progeny and body mass growth vary in common, and the formation of these two values is primarily influenced by genotype. Even if to a lesser degree, the for-mation of production cost is further influenced by the daily weight gain of lambs, the prices of meadow hay and lamb feed as well.
Besides progeny, gross margin (GM) values depend on the price of meadow hay and lamb feed, the fodder conversion of weaned lambs and also the price of alfalfa hay. Deterioration in the values of fodder conversion involves the decrease of GM as well. The impact of Easter lamb price is not consider-able, it is merely 1.2%.
The next phase of the production line is fattening, where we also studied the factors affecting the volume of GM and production costs. Our findings are presented in Table 2.
Among the findings of the sensitivity analysis, the price of starter feed for lambs and fodder conversion decrease gross margin values and increase production costs almost in equal proportion. The third key indicator is daily weight gain. If its values increase, it involves the reduction of production cost. The remaining factors include market prices which affect the values of gross margin and production costs in about 1%. In brief, we concluded that the results of fattening are indirectly influenced by genotype, as it affects the three most significant factors listed in the sensitivity report.
Contrary to the foregoing, in the next phase of the produc-tion line, only factors affecting added value were examined within the framework of sensitivity analysis (Figure 3.).
Slaughtering of meat-type and extensive-type lambs was examined separately. The most important factor influencing
Figure 2. Cost-benefit analysis of certain product chain phases
Source: Cehla 2011
Production value Production cost
Lambproduction
Lambproduction
without subsidies
HU
F/sh
eep
Fattening Slaughterof extensive
type
Slaughterof meat type
Trade,extensive type
Trade,intensive type
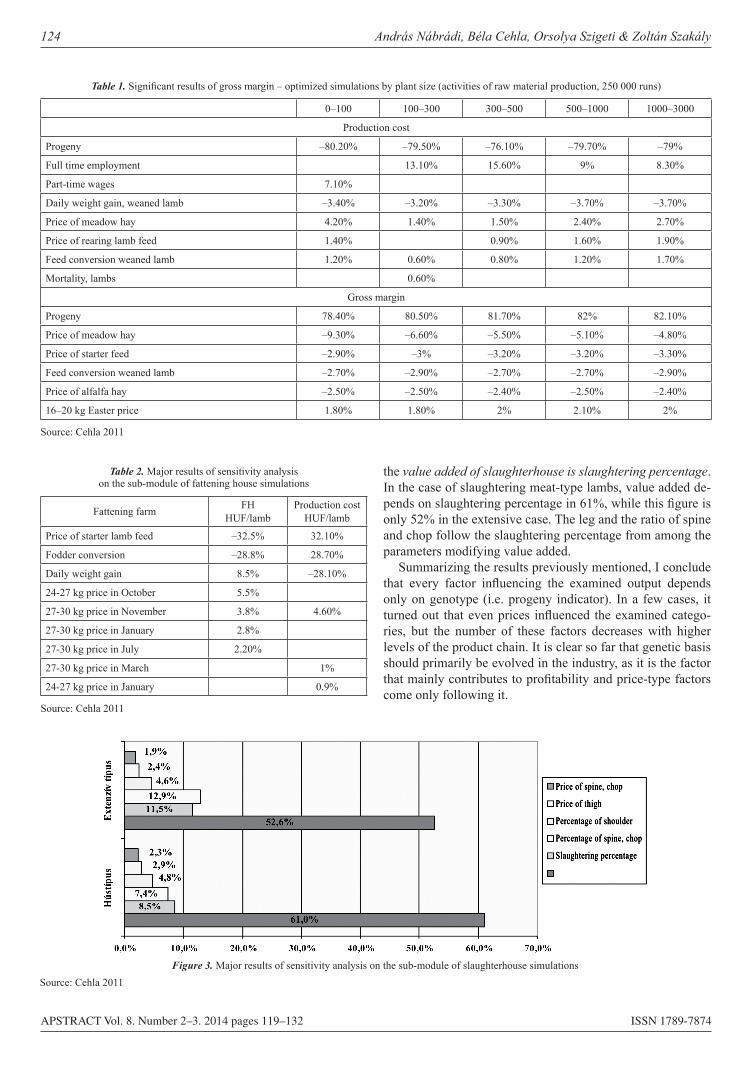
124 András Nábrádi, Béla Cehla, Orsolya Szigeti & Zoltán Szakály
APSTRACT Vol. 8. Number 2–3. 2014 pages 119–132 ISSN 1789-7874
the value added of slaughterhouse is slaughtering percentage. In the case of slaughtering meat-type lambs, value added de-pends on slaughtering percentage in 61%, while this figure is only 52% in the extensive case. The leg and the ratio of spine and chop follow the slaughtering percentage from among the parameters modifying value added.
Summarizing the results previously mentioned, I conclude that every factor influencing the examined output depends only on genotype (i.e. progeny indicator). In a few cases, it turned out that even prices influenced the examined catego-ries, but the number of these factors decreases with higher levels of the product chain. It is clear so far that genetic basis should primarily be evolved in the industry, as it is the factor that mainly contributes to profitability and price-type factors come only following it.
Table 1. Significant results of gross margin – optimized simulations by plant size (activities of raw material production, 250 000 runs)
0–100 100–300 300–500 500–1000 1000–3000
Production cost
Progeny –80.20% –79.50% –76.10% –79.70% –79%
Full time employment 13.10% 15.60% 9% 8.30%
Part-time wages 7.10%
Daily weight gain, weaned lamb –3.40% –3.20% –3.30% –3.70% –3.70%
Price of meadow hay 4.20% 1.40% 1.50% 2.40% 2.70%
Price of rearing lamb feed 1.40% 0.90% 1.60% 1.90%
Feed conversion weaned lamb 1.20% 0.60% 0.80% 1.20% 1.70%
Mortality, lambs 0.60%
Gross margin
Progeny 78.40% 80.50% 81.70% 82% 82.10%
Price of meadow hay –9.30% –6.60% –5.50% –5.10% –4.80%
Price of starter feed –2.90% –3% –3.20% –3.20% –3.30%
Feed conversion weaned lamb –2.70% –2.90% –2.70% –2.70% –2.90%
Price of alfalfa hay –2.50% –2.50% –2.40% –2.50% –2.40%
16–20 kg Easter price 1.80% 1.80% 2% 2.10% 2%
Source: Cehla 2011
Table 2. Major results of sensitivity analysis on the sub-module of fattening house simulations
Fattening farm FH HUF/lamb
Production cost HUF/lamb
Price of starter lamb feed –32.5% 32.10%
Fodder conversion –28.8% 28.70%
Daily weight gain 8.5% –28.10%
24-27 kg price in October 5.5%
27-30 kg price in November 3.8% 4.60%
27-30 kg price in January 2.8%
27-30 kg price in July 2.20%
27-30 kg price in March 1%
24-27 kg price in January 0.9%
Source: Cehla 2011
Figure 3. Major results of sensitivity analysis on the sub-module of slaughterhouse simulationsSource: Cehla 2011
Price of spine, chop
Price of thigh
Percentage of shoulder
Percentage of spine, chop
Slaughtering percentage
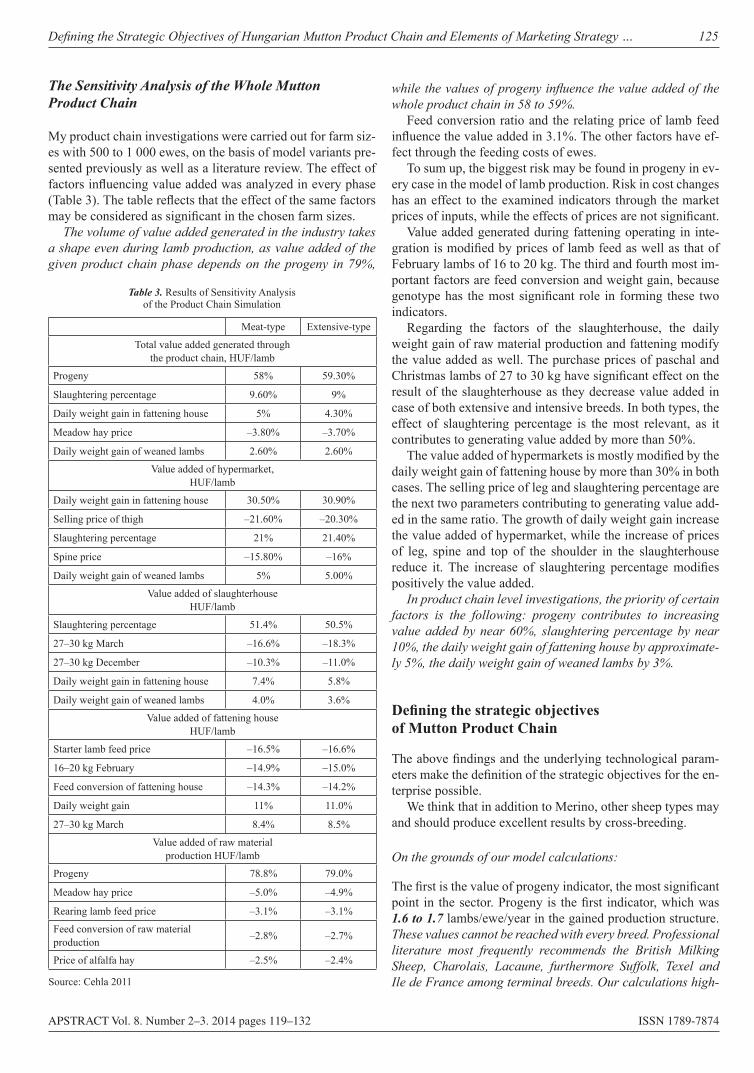
Defining the Strategic Objectives of Hungarian Mutton Product Chain and Elements of Marketing Strategy … 125
APSTRACT Vol. 8. Number 2–3. 2014 pages 119–132 ISSN 1789-7874
The Sensitivity Analysis of the Whole Mutton Product Chain
My product chain investigations were carried out for farm siz-es with 500 to 1 000 ewes, on the basis of model variants pre-sented previously as well as a literature review. The effect of factors influencing value added was analyzed in every phase (Table 3). The table reflects that the effect of the same factors may be considered as significant in the chosen farm sizes.
The volume of value added generated in the industry takes a shape even during lamb production, as value added of the given product chain phase depends on the progeny in 79%,
while the values of progeny influence the value added of the whole product chain in 58 to 59%.
Feed conversion ratio and the relating price of lamb feed influence the value added in 3.1%. The other factors have ef-fect through the feeding costs of ewes.
To sum up, the biggest risk may be found in progeny in ev-ery case in the model of lamb production. Risk in cost changes has an effect to the examined indicators through the market prices of inputs, while the effects of prices are not significant.
Value added generated during fattening operating in inte-gration is modified by prices of lamb feed as well as that of February lambs of 16 to 20 kg. The third and fourth most im-portant factors are feed conversion and weight gain, because genotype has the most significant role in forming these two indicators.
Regarding the factors of the slaughterhouse, the daily weight gain of raw material production and fattening modify the value added as well. The purchase prices of paschal and Christmas lambs of 27 to 30 kg have significant effect on the result of the slaughterhouse as they decrease value added in case of both extensive and intensive breeds. In both types, the effect of slaughtering percentage is the most relevant, as it contributes to generating value added by more than 50%.
The value added of hypermarkets is mostly modified by the daily weight gain of fattening house by more than 30% in both cases. The selling price of leg and slaughtering percentage are the next two parameters contributing to generating value add-ed in the same ratio. The growth of daily weight gain increase the value added of hypermarket, while the increase of prices of leg, spine and top of the shoulder in the slaughterhouse reduce it. The increase of slaughtering percentage modifies positively the value added.
In product chain level investigations, the priority of certain factors is the following: progeny contributes to increasing value added by near 60%, slaughtering percentage by near 10%, the daily weight gain of fattening house by approximate-ly 5%, the daily weight gain of weaned lambs by 3%.
Defining the strategic objectives of Mutton Product Chain
The above findings and the underlying technological param-eters make the definition of the strategic objectives for the en-terprise possible.
We think that in addition to Merino, other sheep types may and should produce excellent results by cross-breeding.
On the grounds of our model calculations:
The first is the value of progeny indicator, the most significant point in the sector. Progeny is the first indicator, which was 1.6 to 1.7 lambs/ewe/year in the gained production structure. These values cannot be reached with every breed. Professional literature most frequently recommends the British Milking Sheep, Charolais, Lacaune, furthermore Suffolk, Texel and Ile de France among terminal breeds. Our calculations high-
Table 3. Results of Sensitivity Analysis of the Product Chain Simulation
Meat-type Extensive-type
Total value added generated through the product chain, HUF/lamb
Progeny 58% 59.30%
Slaughtering percentage 9.60% 9%
Daily weight gain in fattening house 5% 4.30%
Meadow hay price –3.80% –3.70%
Daily weight gain of weaned lambs 2.60% 2.60%
Value added of hypermarket, HUF/lamb
Daily weight gain in fattening house 30.50% 30.90%
Selling price of thigh –21.60% –20.30%
Slaughtering percentage 21% 21.40%
Spine price –15.80% –16%
Daily weight gain of weaned lambs 5% 5.00%
Value added of slaughterhouse HUF/lamb
Slaughtering percentage 51.4% 50.5%
27–30 kg March –16.6% –18.3%
27–30 kg December –10.3% –11.0%
Daily weight gain in fattening house 7.4% 5.8%
Daily weight gain of weaned lambs 4.0% 3.6%
Value added of fattening house HUF/lamb
Starter lamb feed price –16.5% –16.6%
16–20 kg February –14.9% –15.0%
Feed conversion of fattening house –14.3% –14.2%
Daily weight gain 11% 11.0%
27–30 kg March 8.4% 8.5%
Value added of raw material production HUF/lamb
Progeny 78.8% 79.0%
Meadow hay price –5.0% –4.9%
Rearing lamb feed price –3.1% –3.1%
Feed conversion of raw material production –2.8% –2.7%
Price of alfalfa hay –2.5% –2.4%
Source: Cehla 2011
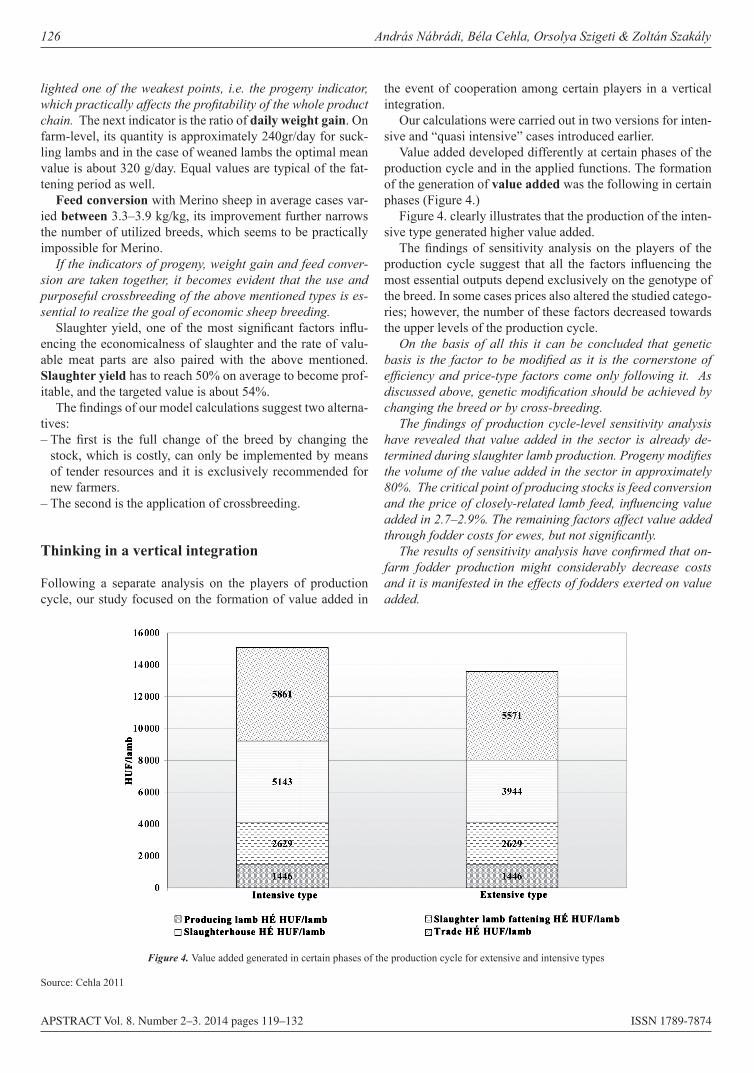
126 András Nábrádi, Béla Cehla, Orsolya Szigeti & Zoltán Szakály
APSTRACT Vol. 8. Number 2–3. 2014 pages 119–132 ISSN 1789-7874
lighted one of the weakest points, i.e. the progeny indicator, which practically affects the profitability of the whole product chain. The next indicator is the ratio of daily weight gain. On farm-level, its quantity is approximately 240gr/day for suck-ling lambs and in the case of weaned lambs the optimal mean value is about 320 g/day. Equal values are typical of the fat-tening period as well.
Feed conversion with Merino sheep in average cases var-ied between 3.3–3.9 kg/kg, its improvement further narrows the number of utilized breeds, which seems to be practically impossible for Merino.
If the indicators of progeny, weight gain and feed conver-sion are taken together, it becomes evident that the use and purposeful crossbreeding of the above mentioned types is es-sential to realize the goal of economic sheep breeding.
Slaughter yield, one of the most significant factors influ-encing the economicalness of slaughter and the rate of valu-able meat parts are also paired with the above mentioned. Slaughter yield has to reach 50% on average to become prof-itable, and the targeted value is about 54%.
The findings of our model calculations suggest two alterna-tives: – The first is the full change of the breed by changing the
stock, which is costly, can only be implemented by means of tender resources and it is exclusively recommended for new farmers.
– The second is the application of crossbreeding.
Thinking in a vertical integration
Following a separate analysis on the players of production cycle, our study focused on the formation of value added in
the event of cooperation among certain players in a vertical integration.
Our calculations were carried out in two versions for inten-sive and “quasi intensive” cases introduced earlier.
Value added developed differently at certain phases of the production cycle and in the applied functions. The formation of the generation of value added was the following in certain phases (Figure 4.)
Figure 4. clearly illustrates that the production of the inten-sive type generated higher value added.
The findings of sensitivity analysis on the players of the production cycle suggest that all the factors influencing the most essential outputs depend exclusively on the genotype of the breed. In some cases prices also altered the studied catego-ries; however, the number of these factors decreased towards the upper levels of the production cycle.
On the basis of all this it can be concluded that genetic basis is the factor to be modified as it is the cornerstone of efficiency and price-type factors come only following it. As discussed above, genetic modification should be achieved by changing the breed or by cross-breeding.
The findings of production cycle-level sensitivity analysis have revealed that value added in the sector is already de-termined during slaughter lamb production. Progeny modifies the volume of the value added in the sector in approximately 80%. The critical point of producing stocks is feed conversion and the price of closely-related lamb feed, influencing value added in 2.7–2.9%. The remaining factors affect value added through fodder costs for ewes, but not significantly.
The results of sensitivity analysis have confirmed that on-farm fodder production might considerably decrease costs and it is manifested in the effects of fodders exerted on value added.
Figure 4. Value added generated in certain phases of the production cycle for extensive and intensive types
Source: Cehla 2011
HU
F/la
mb
Intensive type
Producing lamb HÉ HUF/lambSlaughterhouse HÉ HUF/lamb
Extensive type
Slaughter lamb fattening HÉ HUF/lambTrade HÉ HUF/lamb
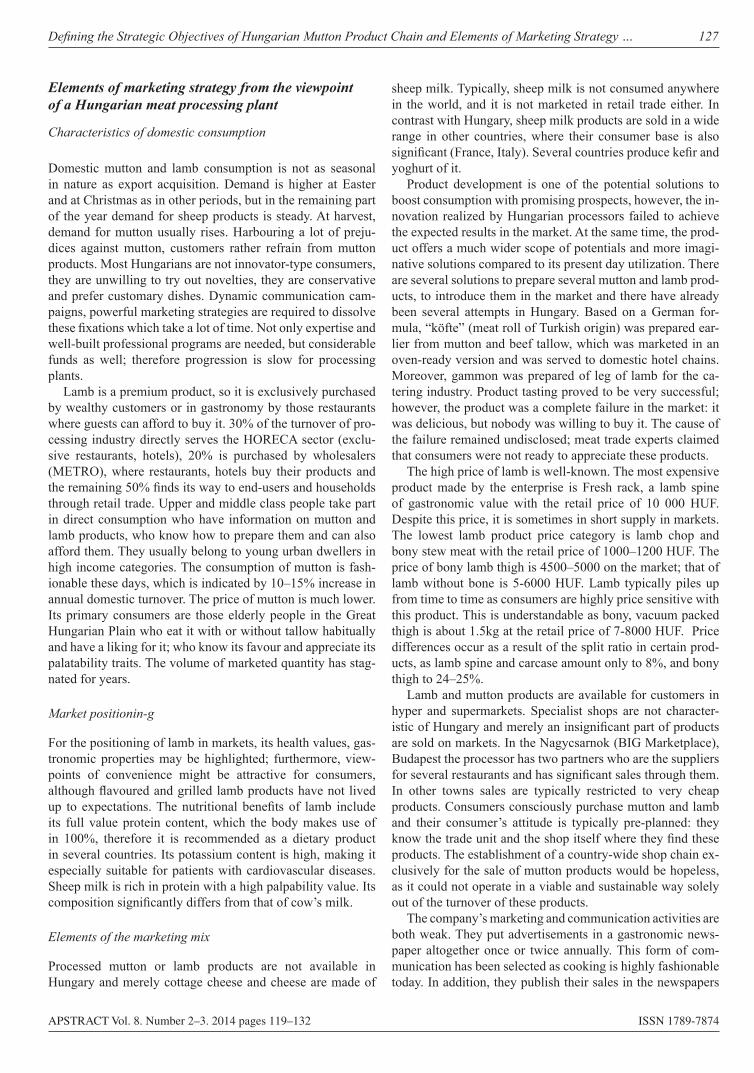
Defining the Strategic Objectives of Hungarian Mutton Product Chain and Elements of Marketing Strategy … 127
APSTRACT Vol. 8. Number 2–3. 2014 pages 119–132 ISSN 1789-7874
Elements of marketing strategy from the viewpoint of a Hungarian meat processing plant
Characteristics of domestic consumption
Domestic mutton and lamb consumption is not as seasonal in nature as export acquisition. Demand is higher at Easter and at Christmas as in other periods, but in the remaining part of the year demand for sheep products is steady. At harvest, demand for mutton usually rises. Harbouring a lot of preju-dices against mutton, customers rather refrain from mutton products. Most Hungarians are not innovator-type consumers, they are unwilling to try out novelties, they are conservative and prefer customary dishes. Dynamic communication cam-paigns, powerful marketing strategies are required to dissolve these fixations which take a lot of time. Not only expertise and well-built professional programs are needed, but considerable funds as well; therefore progression is slow for processing plants.
Lamb is a premium product, so it is exclusively purchased by wealthy customers or in gastronomy by those restaurants where guests can afford to buy it. 30% of the turnover of pro-cessing industry directly serves the HORECA sector (exclu-sive restaurants, hotels), 20% is purchased by wholesalers (METRO), where restaurants, hotels buy their products and the remaining 50% finds its way to end-users and households through retail trade. Upper and middle class people take part in direct consumption who have information on mutton and lamb products, who know how to prepare them and can also afford them. They usually belong to young urban dwellers in high income categories. The consumption of mutton is fash-ionable these days, which is indicated by 10–15% increase in annual domestic turnover. The price of mutton is much lower. Its primary consumers are those elderly people in the Great Hungarian Plain who eat it with or without tallow habitually and have a liking for it; who know its favour and appreciate its palatability traits. The volume of marketed quantity has stag-nated for years.
Market positionin-g
For the positioning of lamb in markets, its health values, gas-tronomic properties may be highlighted; furthermore, view-points of convenience might be attractive for consumers, although flavoured and grilled lamb products have not lived up to expectations. The nutritional benefits of lamb include its full value protein content, which the body makes use of in 100%, therefore it is recommended as a dietary product in several countries. Its potassium content is high, making it especially suitable for patients with cardiovascular diseases. Sheep milk is rich in protein with a high palpability value. Its composition significantly differs from that of cow’s milk.
Elements of the marketing mix
Processed mutton or lamb products are not available in Hungary and merely cottage cheese and cheese are made of
sheep milk. Typically, sheep milk is not consumed anywhere in the world, and it is not marketed in retail trade either. In contrast with Hungary, sheep milk products are sold in a wide range in other countries, where their consumer base is also significant (France, Italy). Several countries produce kefir and yoghurt of it.
Product development is one of the potential solutions to boost consumption with promising prospects, however, the in-novation realized by Hungarian processors failed to achieve the expected results in the market. At the same time, the prod-uct offers a much wider scope of potentials and more imagi-native solutions compared to its present day utilization. There are several solutions to prepare several mutton and lamb prod-ucts, to introduce them in the market and there have already been several attempts in Hungary. Based on a German for-mula, “köfte” (meat roll of Turkish origin) was prepared ear-lier from mutton and beef tallow, which was marketed in an oven-ready version and was served to domestic hotel chains. Moreover, gammon was prepared of leg of lamb for the ca-tering industry. Product tasting proved to be very successful; however, the product was a complete failure in the market: it was delicious, but nobody was willing to buy it. The cause of the failure remained undisclosed; meat trade experts claimed that consumers were not ready to appreciate these products.
The high price of lamb is well-known. The most expensive product made by the enterprise is Fresh rack, a lamb spine of gastronomic value with the retail price of 10 000 HUF. Despite this price, it is sometimes in short supply in markets. The lowest lamb product price category is lamb chop and bony stew meat with the retail price of 1000–1200 HUF. The price of bony lamb thigh is 4500–5000 on the market; that of lamb without bone is 5-6000 HUF. Lamb typically piles up from time to time as consumers are highly price sensitive with this product. This is understandable as bony, vacuum packed thigh is about 1.5kg at the retail price of 7-8000 HUF. Price differences occur as a result of the split ratio in certain prod-ucts, as lamb spine and carcase amount only to 8%, and bony thigh to 24–25%.
Lamb and mutton products are available for customers in hyper and supermarkets. Specialist shops are not character-istic of Hungary and merely an insignificant part of products are sold on markets. In the Nagycsarnok (BIG Marketplace), Budapest the processor has two partners who are the suppliers for several restaurants and has significant sales through them. In other towns sales are typically restricted to very cheap products. Consumers consciously purchase mutton and lamb and their consumer’s attitude is typically pre-planned: they know the trade unit and the shop itself where they find these products. The establishment of a country-wide shop chain ex-clusively for the sale of mutton products would be hopeless, as it could not operate in a viable and sustainable way solely out of the turnover of these products.
The company’s marketing and communication activities are both weak. They put advertisements in a gastronomic news-paper altogether once or twice annually. This form of com-munication has been selected as cooking is highly fashionable today. In addition, they publish their sales in the newspapers
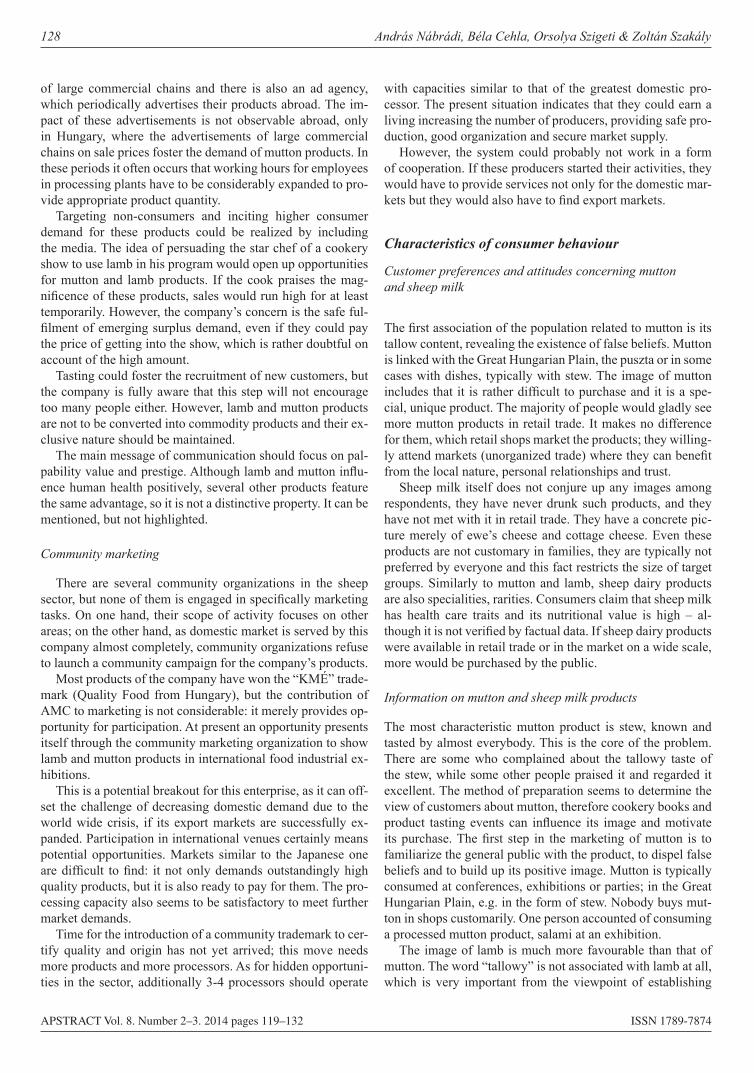
128 András Nábrádi, Béla Cehla, Orsolya Szigeti & Zoltán Szakály
APSTRACT Vol. 8. Number 2–3. 2014 pages 119–132 ISSN 1789-7874
of large commercial chains and there is also an ad agency, which periodically advertises their products abroad. The im-pact of these advertisements is not observable abroad, only in Hungary, where the advertisements of large commercial chains on sale prices foster the demand of mutton products. In these periods it often occurs that working hours for employees in processing plants have to be considerably expanded to pro-vide appropriate product quantity.
Targeting non-consumers and inciting higher consumer demand for these products could be realized by including the media. The idea of persuading the star chef of a cookery show to use lamb in his program would open up opportunities for mutton and lamb products. If the cook praises the mag-nificence of these products, sales would run high for at least temporarily. However, the company’s concern is the safe ful-filment of emerging surplus demand, even if they could pay the price of getting into the show, which is rather doubtful on account of the high amount.
Tasting could foster the recruitment of new customers, but the company is fully aware that this step will not encourage too many people either. However, lamb and mutton products are not to be converted into commodity products and their ex-clusive nature should be maintained.
The main message of communication should focus on pal-pability value and prestige. Although lamb and mutton influ-ence human health positively, several other products feature the same advantage, so it is not a distinctive property. It can be mentioned, but not highlighted.
Community marketing
There are several community organizations in the sheep sector, but none of them is engaged in specifically marketing tasks. On one hand, their scope of activity focuses on other areas; on the other hand, as domestic market is served by this company almost completely, community organizations refuse to launch a community campaign for the company’s products.
Most products of the company have won the “KMÉ” trade-mark (Quality Food from Hungary), but the contribution of AMC to marketing is not considerable: it merely provides op-portunity for participation. At present an opportunity presents itself through the community marketing organization to show lamb and mutton products in international food industrial ex-hibitions.
This is a potential breakout for this enterprise, as it can off-set the challenge of decreasing domestic demand due to the world wide crisis, if its export markets are successfully ex-panded. Participation in international venues certainly means potential opportunities. Markets similar to the Japanese one are difficult to find: it not only demands outstandingly high quality products, but it is also ready to pay for them. The pro-cessing capacity also seems to be satisfactory to meet further market demands.
Time for the introduction of a community trademark to cer-tify quality and origin has not yet arrived; this move needs more products and more processors. As for hidden opportuni-ties in the sector, additionally 3-4 processors should operate
with capacities similar to that of the greatest domestic pro-cessor. The present situation indicates that they could earn a living increasing the number of producers, providing safe pro-duction, good organization and secure market supply.
However, the system could probably not work in a form of cooperation. If these producers started their activities, they would have to provide services not only for the domestic mar-kets but they would also have to find export markets.
Characteristics of consumer behaviour
Customer preferences and attitudes concerning mutton and sheep milk
The first association of the population related to mutton is its tallow content, revealing the existence of false beliefs. Mutton is linked with the Great Hungarian Plain, the puszta or in some cases with dishes, typically with stew. The image of mutton includes that it is rather difficult to purchase and it is a spe-cial, unique product. The majority of people would gladly see more mutton products in retail trade. It makes no difference for them, which retail shops market the products; they willing-ly attend markets (unorganized trade) where they can benefit from the local nature, personal relationships and trust.
Sheep milk itself does not conjure up any images among respondents, they have never drunk such products, and they have not met with it in retail trade. They have a concrete pic-ture merely of ewe’s cheese and cottage cheese. Even these products are not customary in families, they are typically not preferred by everyone and this fact restricts the size of target groups. Similarly to mutton and lamb, sheep dairy products are also specialities, rarities. Consumers claim that sheep milk has health care traits and its nutritional value is high – al-though it is not verified by factual data. If sheep dairy products were available in retail trade or in the market on a wide scale, more would be purchased by the public.
Information on mutton and sheep milk products
The most characteristic mutton product is stew, known and tasted by almost everybody. This is the core of the problem. There are some who complained about the tallowy taste of the stew, while some other people praised it and regarded it excellent. The method of preparation seems to determine the view of customers about mutton, therefore cookery books and product tasting events can influence its image and motivate its purchase. The first step in the marketing of mutton is to familiarize the general public with the product, to dispel false beliefs and to build up its positive image. Mutton is typically consumed at conferences, exhibitions or parties; in the Great Hungarian Plain, e.g. in the form of stew. Nobody buys mut-ton in shops customarily. One person accounted of consuming a processed mutton product, salami at an exhibition.
The image of lamb is much more favourable than that of mutton. The word “tallowy” is not associated with lamb at all, which is very important from the viewpoint of establishing
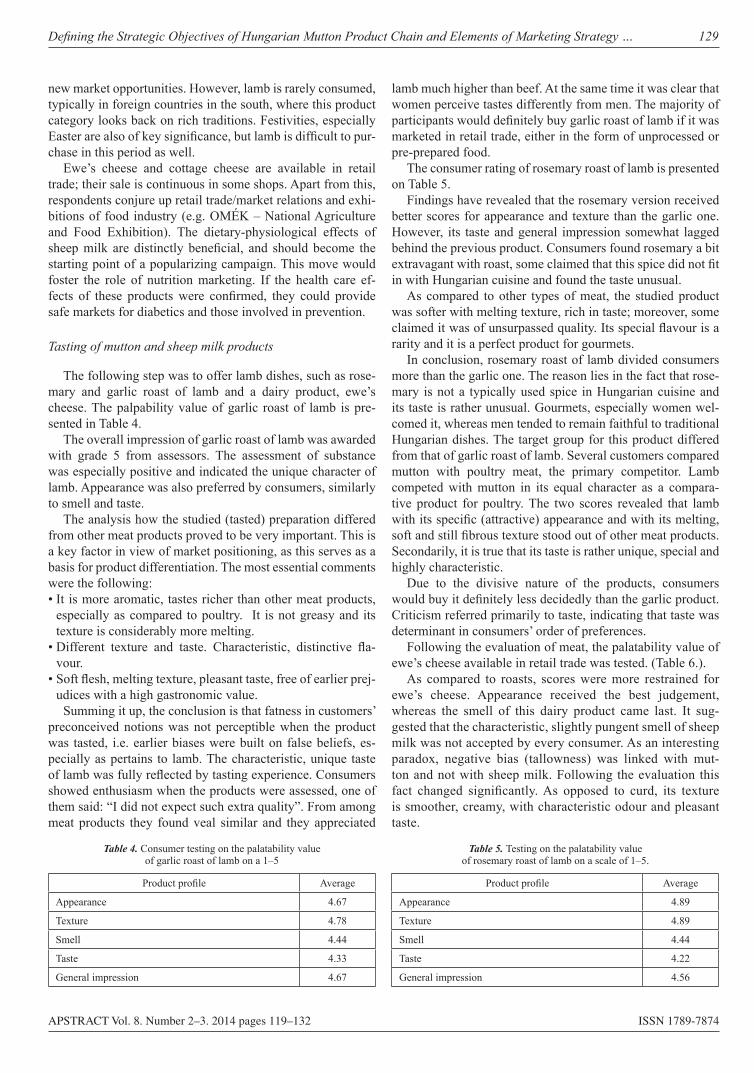
Defining the Strategic Objectives of Hungarian Mutton Product Chain and Elements of Marketing Strategy … 129
APSTRACT Vol. 8. Number 2–3. 2014 pages 119–132 ISSN 1789-7874
new market opportunities. However, lamb is rarely consumed, typically in foreign countries in the south, where this product category looks back on rich traditions. Festivities, especially Easter are also of key significance, but lamb is difficult to pur-chase in this period as well.
Ewe’s cheese and cottage cheese are available in retail trade; their sale is continuous in some shops. Apart from this, respondents conjure up retail trade/market relations and exhi-bitions of food industry (e.g. OMÉK – National Agriculture and Food Exhibition). The dietary-physiological effects of sheep milk are distinctly beneficial, and should become the starting point of a popularizing campaign. This move would foster the role of nutrition marketing. If the health care ef-fects of these products were confirmed, they could provide safe markets for diabetics and those involved in prevention.
Tasting of mutton and sheep milk products
The following step was to offer lamb dishes, such as rose-mary and garlic roast of lamb and a dairy product, ewe’s cheese. The palpability value of garlic roast of lamb is pre-sented in Table 4.
The overall impression of garlic roast of lamb was awarded with grade 5 from assessors. The assessment of substance was especially positive and indicated the unique character of lamb. Appearance was also preferred by consumers, similarly to smell and taste.
The analysis how the studied (tasted) preparation differed from other meat products proved to be very important. This is a key factor in view of market positioning, as this serves as a basis for product differentiation. The most essential comments were the following: • It is more aromatic, tastes richer than other meat products,
especially as compared to poultry. It is not greasy and its texture is considerably more melting.
• Different texture and taste. Characteristic, distinctive fla-vour.
• Soft flesh, melting texture, pleasant taste, free of earlier prej-udices with a high gastronomic value.
Summing it up, the conclusion is that fatness in customers’ preconceived notions was not perceptible when the product was tasted, i.e. earlier biases were built on false beliefs, es-pecially as pertains to lamb. The characteristic, unique taste of lamb was fully reflected by tasting experience. Consumers showed enthusiasm when the products were assessed, one of them said: “I did not expect such extra quality”. From among meat products they found veal similar and they appreciated
lamb much higher than beef. At the same time it was clear that women perceive tastes differently from men. The majority of participants would definitely buy garlic roast of lamb if it was marketed in retail trade, either in the form of unprocessed or pre-prepared food.
The consumer rating of rosemary roast of lamb is presented on Table 5.
Findings have revealed that the rosemary version received better scores for appearance and texture than the garlic one. However, its taste and general impression somewhat lagged behind the previous product. Consumers found rosemary a bit extravagant with roast, some claimed that this spice did not fit in with Hungarian cuisine and found the taste unusual.
As compared to other types of meat, the studied product was softer with melting texture, rich in taste; moreover, some claimed it was of unsurpassed quality. Its special flavour is a rarity and it is a perfect product for gourmets.
In conclusion, rosemary roast of lamb divided consumers more than the garlic one. The reason lies in the fact that rose-mary is not a typically used spice in Hungarian cuisine and its taste is rather unusual. Gourmets, especially women wel-comed it, whereas men tended to remain faithful to traditional Hungarian dishes. The target group for this product differed from that of garlic roast of lamb. Several customers compared mutton with poultry meat, the primary competitor. Lamb competed with mutton in its equal character as a compara-tive product for poultry. The two scores revealed that lamb with its specific (attractive) appearance and with its melting, soft and still fibrous texture stood out of other meat products. Secondarily, it is true that its taste is rather unique, special and highly characteristic.
Due to the divisive nature of the products, consumers would buy it definitely less decidedly than the garlic product. Criticism referred primarily to taste, indicating that taste was determinant in consumers’ order of preferences.
Following the evaluation of meat, the palatability value of ewe’s cheese available in retail trade was tested. (Table 6.).
As compared to roasts, scores were more restrained for ewe’s cheese. Appearance received the best judgement, whereas the smell of this dairy product came last. It sug-gested that the characteristic, slightly pungent smell of sheep milk was not accepted by every consumer. As an interesting paradox, negative bias (tallowness) was linked with mut-ton and not with sheep milk. Following the evaluation this fact changed significantly. As opposed to curd, its texture is smoother, creamy, with characteristic odour and pleasant taste.
Table 4. Consumer testing on the palatability value of garlic roast of lamb on a 1–5
Product profile Average
Appearance 4.67
Texture 4.78
Smell 4.44
Taste 4.33
General impression 4.67
Table 5. Testing on the palatability value of rosemary roast of lamb on a scale of 1–5.
Product profile Average
Appearance 4.89
Texture 4.89
Smell 4.44
Taste 4.22
General impression 4.56
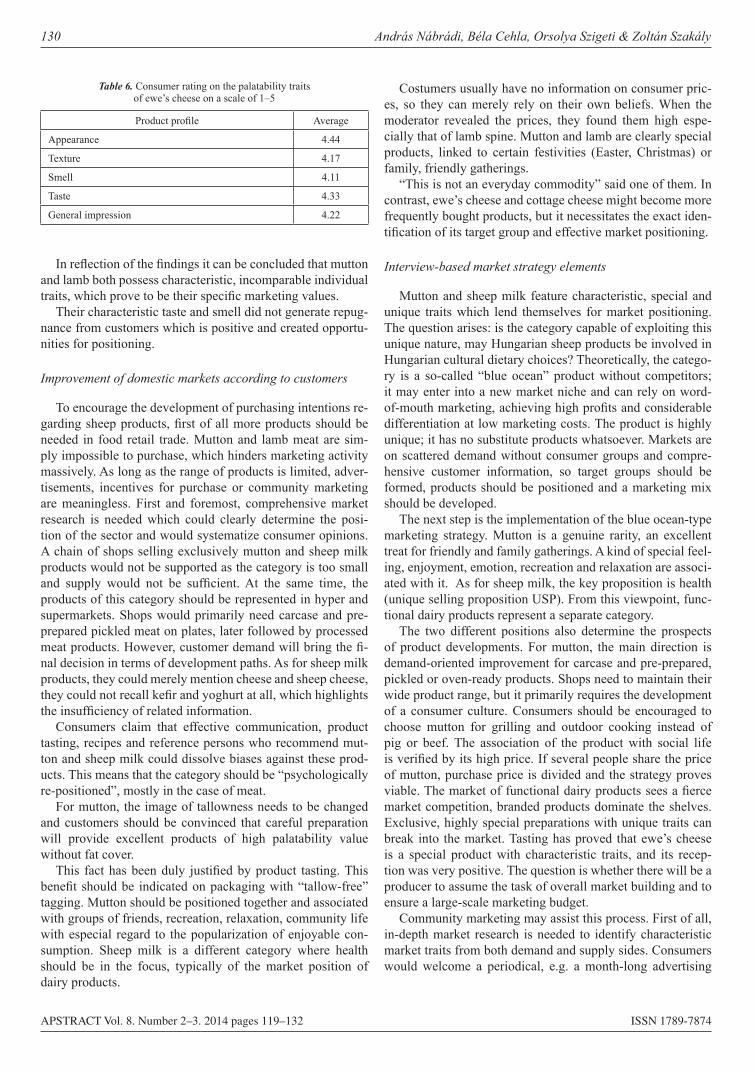
130 András Nábrádi, Béla Cehla, Orsolya Szigeti & Zoltán Szakály
APSTRACT Vol. 8. Number 2–3. 2014 pages 119–132 ISSN 1789-7874
In reflection of the findings it can be concluded that mutton and lamb both possess characteristic, incomparable individual traits, which prove to be their specific marketing values.
Their characteristic taste and smell did not generate repug-nance from customers which is positive and created opportu-nities for positioning.
Improvement of domestic markets according to customers
To encourage the development of purchasing intentions re-garding sheep products, first of all more products should be needed in food retail trade. Mutton and lamb meat are sim-ply impossible to purchase, which hinders marketing activity massively. As long as the range of products is limited, adver-tisements, incentives for purchase or community marketing are meaningless. First and foremost, comprehensive market research is needed which could clearly determine the posi-tion of the sector and would systematize consumer opinions. A chain of shops selling exclusively mutton and sheep milk products would not be supported as the category is too small and supply would not be sufficient. At the same time, the products of this category should be represented in hyper and supermarkets. Shops would primarily need carcase and pre-prepared pickled meat on plates, later followed by processed meat products. However, customer demand will bring the fi-nal decision in terms of development paths. As for sheep milk products, they could merely mention cheese and sheep cheese, they could not recall kefir and yoghurt at all, which highlights the insufficiency of related information.
Consumers claim that effective communication, product tasting, recipes and reference persons who recommend mut-ton and sheep milk could dissolve biases against these prod-ucts. This means that the category should be “psychologically re-positioned”, mostly in the case of meat.
For mutton, the image of tallowness needs to be changed and customers should be convinced that careful preparation will provide excellent products of high palatability value without fat cover.
This fact has been duly justified by product tasting. This benefit should be indicated on packaging with “tallow-free” tagging. Mutton should be positioned together and associated with groups of friends, recreation, relaxation, community life with especial regard to the popularization of enjoyable con-sumption. Sheep milk is a different category where health should be in the focus, typically of the market position of dairy products.
Costumers usually have no information on consumer pric-es, so they can merely rely on their own beliefs. When the moderator revealed the prices, they found them high espe-cially that of lamb spine. Mutton and lamb are clearly special products, linked to certain festivities (Easter, Christmas) or family, friendly gatherings.
“This is not an everyday commodity” said one of them. In contrast, ewe’s cheese and cottage cheese might become more frequently bought products, but it necessitates the exact iden-tification of its target group and effective market positioning.
Interview-based market strategy elements
Mutton and sheep milk feature characteristic, special and unique traits which lend themselves for market positioning. The question arises: is the category capable of exploiting this unique nature, may Hungarian sheep products be involved in Hungarian cultural dietary choices? Theoretically, the catego-ry is a so-called “blue ocean” product without competitors; it may enter into a new market niche and can rely on word-of-mouth marketing, achieving high profits and considerable differentiation at low marketing costs. The product is highly unique; it has no substitute products whatsoever. Markets are on scattered demand without consumer groups and compre-hensive customer information, so target groups should be formed, products should be positioned and a marketing mix should be developed.
The next step is the implementation of the blue ocean-type marketing strategy. Mutton is a genuine rarity, an excellent treat for friendly and family gatherings. A kind of special feel-ing, enjoyment, emotion, recreation and relaxation are associ-ated with it. As for sheep milk, the key proposition is health (unique selling proposition USP). From this viewpoint, func-tional dairy products represent a separate category.
The two different positions also determine the prospects of product developments. For mutton, the main direction is demand-oriented improvement for carcase and pre-prepared, pickled or oven-ready products. Shops need to maintain their wide product range, but it primarily requires the development of a consumer culture. Consumers should be encouraged to choose mutton for grilling and outdoor cooking instead of pig or beef. The association of the product with social life is verified by its high price. If several people share the price of mutton, purchase price is divided and the strategy proves viable. The market of functional dairy products sees a fierce market competition, branded products dominate the shelves. Exclusive, highly special preparations with unique traits can break into the market. Tasting has proved that ewe’s cheese is a special product with characteristic traits, and its recep-tion was very positive. The question is whether there will be a producer to assume the task of overall market building and to ensure a large-scale marketing budget.
Community marketing may assist this process. First of all, in-depth market research is needed to identify characteristic market traits from both demand and supply sides. Consumers would welcome a periodical, e.g. a month-long advertising
Table 6. Consumer rating on the palatability traits of ewe’s cheese on a scale of 1–5
Product profile Average
Appearance 4.44
Texture 4.17
Smell 4.11
Taste 4.33
General impression 4.22
Defining the Strategic Objectives of Hungarian Mutton Product Chain and Elements of Marketing Strategy … 131
APSTRACT Vol. 8. Number 2–3. 2014 pages 119–132 ISSN 1789-7874
campaign with a wide product range to encourage the con-sumption of the products of this category.
Educational articles would also be needed, primarily in women’s newspapers, cookery books, sweepstakes; sales, tasting events and cookery shows should be organized. Judit Stahl, Lázár Kovács and perhaps László Benke are acceptable reference persons for customers together with leading sports-men and sportswomen who appear as trustworthy and recog-nized people for customers. Based on the above mentioned, the following steps are to be taken in favour of successful market participation: • Comprehensive market research • Production of culture through tasting, knowledge transfer
and recipes • Supply development in line with demand • Identification of target markets, positioning of products • Diversification of the product range • Community trademark to guarantee excellent quality and
Hungarian origin • Selection of authentic poster people, advertisement cam-
paigns to popularize productsIf this process is implemented far-reachingly, sheep prod-
ucts may appear on domestic markets under realistic demand conditions.
Conclusions
It is clear so far that genetic basis should primarily be evolved in the industry, as it is the factor that mainly contributes to profitability and price-type factors come only following it.As mentioned earlier, genetic modification can be achieved by changing breeds or cross-breeding. The findings of product cycle level sensitivity analysis suggest that value added in the sector is determined during slaughter sheep production. The critical point for productional stocks is feed conversion and the price of closely-related lamb feed, influencing value added by 2.7–2.9%. The remaining factors affect added value through ewes’ feed costs, but not considerably.
The findings of sensitivity analysis have confirmed that on-farm fodder production can cut costs massively, which is observed in the effects of fodders on value added.
Qualitative market research has unveiled that consumers have a large number of false beliefs and prejudices against mutton, but these were not verified by product tasting. Lamb has is a real rarity, an excellent gourmet product with a unique nature, without any substitute products. Ewe’s cheese and cot-tage cheese are welcomed significantly more positively, even if the characteristic, slightly pungent taste and smell of sheep milk is not accepted by everyone. The image of the product includes its positive health effects and the fact that it is very difficult to purchase. Encouraging customers to buy mutton products more frequently requires more available products in retail-trade.
Markets of sheep products are on scattered lacking consum-er groups and comprehensive customer information, so target groups should be formed, products should be positioned and
a marketing mix should be developed. Mutton is a real rarity, an excellent treat for friendly and family gatherings. A kind of special feeling, enjoyment, emotion, recreation and relaxation are associated with it. As for sheep milk, the key proposition is health (unique selling proposition, USP). The two different positions define the directions of product development. For market building, community marketing tools should be used. It should be pointed out that mutton and lamb are not to be converted into commodity products and their exclusive nature is to be maintained.
As for sheep products, the following activities can foster their marketability
• Comprehensive market research • Production of culture through tasting, knowledge transfer
and recipes • Supply development in line with demand • Identification of target markets, positioning of products • Diversification of product range • Community trademark to guarantee excellent quality and
Hungarian origin • Selection of authentic poster people, advertisement cam-
paigns to popularize productsIf this process is implemented far-reachingly, sheep prod-
ucts may appear in domestic markets under realistic demand conditions.
References
Nábrádi A (2009): Some Economic Issues of Sustainable Animal Husbandry in Eastern-Central Europe. DELHI BUSINESS RE-VIEW 10:(1) pp. 55–77. ISSN: 0972-222XNábrádi A, Madai H & Nagy A (2011): Animal Husbandry in Fo-cus of Sustainability In: Mohamed Behnassi, Shabbir A Shaid, Joyce D’Silva (ed.) Sustainable Agricultural Development: Recent Ap-proaches in Resources Management and Environmentally-Balanced Production Enhancement Berlin: Springer-Science, 2011. pp. 225–233. (ISBN:978-94-007-0518-0)Cehla B, Kovács S & Nábrádi A (2011): Exploitation of relations among the players of the mutton product cycle. APSTRACT – AP-PLIED STUDIES IN AGRIBUSINESS AND COMMERCE vol 5.: (1–2) pp. 129–134. (ISSN:1789-221X, electronic ISSN: 1789-7874)Cehla B, Kovács S & Nábrádi A (2012): Analysis of the Influential Factors on Gross Value Added in the Hungarian Sheep Sector AP-STRACT, APPLIED STUDIES IN AGRIBUSINESS AND COM-MERCE 6:(1,2) pp. 107–112. (ISSN:1789-221X, electronic ISSN: 1789-7874)Cehla B (2011): A hazai juhágazat hústermelési tartalékainak fel-tárása. Doktori Ph.D. értekezés. Ihrig Károly Gazdálkodás- és Szervezéstudományok Doktori Iskola, Debrecen. Nyilvános URL cím: http://ganymedes.lib.unideb.hu:8080/dea/bitstream /2437/117886/10/DOKTORINyi lv%C3%A1nos_vi t%C3 %A1ra-t.pdfhttp://portal.ksh.hu/pls/ksh/docs/hun/xstadat/xstadat_eves/i_oma003.html
132 András Nábrádi, Béla Cehla, Orsolya Szigeti & Zoltán Szakály
APSTRACT Vol. 8. Number 2–3. 2014 pages 119–132 ISSN 1789-7874
Juhász P (2009): Kelj fel juhász, ne aludjál! Magyar Ál lat te nyész tők Lapja 37 (2): 17. p. ISSN: 1417-7811KSH, 2011a. 4.1.19. Állatállomány, december (1995–)Kukovics S, Jávor B & Jávor A (2010): A magyarországi juhtartó gazdaságok főbb jellemzői. In: Kukovics S, Jávor A. (szerk.) A fe-jlesztés lehetőségei a juhágazatban. JUHINNOV Platform. K-OVI-CAP Bt és DE-AGTC, Érd–Debrecen, 2010. pp. 213–265. ISBN: 978-963-08-0624-4Kukovics S & Jávor A (2008): A juhtenyésztés jelen és jövője az EU-ban. Magyar Juhtejgazdasági Egyesület, Debreceni Egyetem Agrár- és Műszaki Tudományok Centruma, Her ceg ha lom–Debre-cen. 2008. 464.p. ISBN: 978-963-8030-58-0Madai H, Nábrádi A & Lapis M (2009): Sheep Production in Hun-gary – is it a Sustainable sector? APSTRACT – APPLIED STUD-IES IN AGRIBUSINESS AND COMMERCE 3:(5–6) pp. 95–100. (ISSN:1789-221X, electronic ISSN: 1789-7874)Malhorta NK (2001): Marketingkutatás. Műszaki Könyv ki adó, Bu-dapest. pp. 1–904. ISBN 9789630586481MJKSZ (2010): 14. Időszaki Tájékoztató. Kiadó: Magyar Juh- és Kecsketenyésztő SzövetségMorris ST (2009): Economics of sheep production. Small ruminant research 86, pp. 59–62. ISSN: 0921-4488
Nábrádi A, Cechla B, Szigeti O & Szakály Z (2012): A magyar juhtenyésztés gazdasági és piaci helyzete Ál lat te nyész tés és takar-mányozás (ISSN: 0230-1814), 61: (3) pp. 294–312Nábrádi A (2009): Az átfogó stratégia kialakításának elemei, elmé-leti és gyakorlati megvalósíthatóság, In: A juhágazat stratégiai kuta-tási terve, Kukovis S.–Jávor A. (szerk), Kiadó: K-OVI-CAP Bt, Érd, 2009 ISBN 978-963-8030-65-8
Scipione PA (1994): A piackutatás gyakorlata. Springer Hungarica Kiadó Kft., Budapest. pp. 1–371.
Szőllősi L (2009): „A vágócsirke termékpálya input-output mod-ellje” In.: ANIM WELFARE ETOLOGIA TARTÁSTECH 5 (4) Gödöllő, 2009. 569–575. pp. HU ISSN 1786-8440
Fenyves V, Orbán I, Dajnoki K & Nábrádi A (2010): Evaluation of Different Predicting Methods in Forecasting Hungarian, Italian, and Greek Lamb Prices. ACTA AGRICULTURAE SCANDINAVICA SECTION C FOOD ECONOMICS 7:(2–4) pp. 192–196.
Fenyves V, Orbán I, Dajnoki K & Nábrádi A (2012): Evaluation of Different Predicting Methods in Forecasting Hungarian, Italian, and Greek Lamb Prices. In: George Baourakis; Prodromos Kalaitzis; Konstadinos (ed.): ood Chains: Quality, Safety and Efficiency in a Challenging World. New York: Routledge of Taylor and Francis Group, 2012. pp. 108–113.
APSTRACT Vol. 8. Number 2–3. 2014 pages 133–141 ISSN 1789-7874
Introduction
What is pálinka?
The production of Hungarian pálinka is regulated by Hungar-ian local law LXXIII of 2008, often referred to as “pálinka law”, which is based on the regulation of generic fruit spirits of the European Union. An alcoholic beverage may be called pálinka if:1. it is fermented exclusively from fruit (excluding concen-
trates and dried fruits) grown in Hungary, and free of ad-ditional ingredients
2. is grown, distilled and bottled in Hungary,3. is not rectified higher than 86% and is bottled with at least 37.5% ABV.
While pálinka is traditionally made from a mash of ripe fruit, the law does not control the addition of non-concentrat-ed fruit juice, and explicitly allows the use of fruit pulp. Dried fruits are excluded from the mash only, and may be used in the aging process. In 2004 the European Union accepted pálinka as a Hungarian speciality, and hence its production is limited to Hungary (and four provinces of Austria for pálinka made from apricots).
What is “Hungaricum”?
Hungaricum: a blanket term indicating a value worthy of dis-tinction and highlighting within a unified system of qualifica-tion, classification, and registry and which represents the high performance of the Hungarian people thanks to its typically Hungarian attribute, uniqueness, specialty and quality,
Hungarian spirits pálinka as a “Hungaricum” i.
literature review and practical approachesImre Milán Harcsa, András Nábrádi & Ildikó Tar
University of Debrecen
Abstract: The history of alcoholic distillation dates back over thousands of years. Spirits arrived in Hungary by the mediation of foreign countries, and were used as medicine in the royal court already in the XIV. Century. The first written presence of the pálinka as a word originated in Debrecen (1572). The quality and alcohol degree of these drinks were increased continuously, and rose to ’Hungaricum’ rank due to several factors such as the quality of the fruit stock grown in our country, the technical development of distillers and several century-old professional experience. Mitterpacher, who distinguished the main parts of the equipment, reviewed the determination methods of alcohol content, and made a proposal for coating the inner surface of the cauldron with tin in favour of the preparation of the high-quality product, played an important role in the establishment of the literature of pálinka distillation.Subcontract distillation, considered as an individual peculiarity in the European Union, developed during a long time in Hungary. It was facilitated by the regulation of distillery plants allowing the operation also for private persons from 1983. The fame of Hungarian national drink increased greatly when the meaning of pálinka was defined punctually: those drinks could be called ’pálinka’, which had 100% fruit content containing no additives, prepared in Hungary and their alcohol content was at least 37.5%. According to conservative evaluation, more than 50% of the Hungarian adult population consumes pálinka occasionally. The majority of the adult population believes that a small amount of pálinka is good for health; many people use it for the alleviation of toothache, sore throat and stomachache. Pálinka has a mood-enhancing impact at social parties and pleasant family events, if consumed in moderation. This paper is an overview of the history of Hungarian pálinka. This is the first part of the article. In the second part we analyze cost-benefit circumstances, and we also deal with the main problematic issue, namely the effect of tax-free production in Hungary and in the European Union.
Keywords: pálinka, hungaricum, historical overview, pálinka production regulations, spirits, technological change, consumption patterns of pálinka
Applied Studies in Agribusiness and Commerce – APSTRACTAgroinform Publishing House, Budapest scientific papers
134 Imre Milán Harcsa, András Nábrádi & Ildikó Tar
APSTRACT Vol. 8. Number 2–3. 2014 pages 133–141 ISSN 1789-7874
– which are considered the work and outstanding value of the Hungarian people both within Hungary and abroad, or
– which are natural values under protection, or– which are national products of a superior standard, or– which are classified as hungaricums by the Committee for
Hungaricums as a result of the individual assessment con-ducted in accordance with the provisions set forth in the leg-islation issued for the enforcement of this law, or which are considered as hungaricums by virtue of this law. (I4)
Literature review, beginning of distillation
The production of spirits and spirit drinks accompanies the history of mankind. In the beginning, experiments and tech-nological limitations resulted in the production of low-alcohol content beverages, such as beer and wine prepared by simple fermentation. “Those high alcohol content drinks of which alcoholic strength can be increased up to 95.57 owe their ori-gin not only to the biological process of fermentation, but to a physical process as well. This physical process is known as distillation by natural sciences and we, Hungarians call it “lepárlás” (rectification) (Osztróvszky 1943). Some say that distillation was already used back in ancient times. Kai–Szetei (2011), who regard the tradition of distillation about 3 thou-sand years old, also share this opinion; however, they mention that at that time technology did not make the distillation of alcohol possible, but it was suitable for the separation of sub-stances of higher boiling points.
In the light of Kautilja’s work, Marton (2002) claims dis-tillation was discovered in India before Christ. He traces the appearance of distillation in China to the 3. Century B.C., when the drink was cooked from rice after fermentation. He considers the existence of distillation in ancient Europe im-possible, whereas others share the rather accepted view that the science of distillation emerged at about the 8. Century. At that time the Arabs distilled wine for scientific purposes rather than enjoyment, as they originally attempted to pro-duce gold. As they were migrating and travelling in foreign countries, they passed on their knowledge and this is how it arrived in Europe. In his book written in the early 1800s Mitterpacher mentioned that the science of distillation, i.e. “destillatio” had been known for “several centuries”. (Mit-terpacher, 1815)
Quoting contemporary research, Osztróvszky (1943) de-nies the ancient origin of aqua vitae; furthermore, he rejects that the extraction of spirits is the merit of Arabs. He claims that present day Italy was the location where the first activi-ties of distillation took place; however, he is uncertain about the identity of the first distillers: they could be alchemists or monks.
Similarly, he could not find attested proofs for the period, thus he can merely allege that people experimented with dis-tillation already in the XI. Century.
Torbágyi-Novák (1948) states that Hungarians learned the preparation of grain spirit from German and Polish settlers in
the XIV. Century. He and Osztróvszky (1943) claim that the distillation apparatus used by Taddeus Florientinus was the first to comply with the basic conditions of pálinka prepara-tion. The pot was made of copper and equipped with a cooling coil, where water was continuously renewed and re-distilla-tion was used in its modern meaning.
Békési–Csarnai (2010) co-authors say that distillation was discovered in the XI. Century, so conditions for wholesale pálinka preparation were given in the XIV. Century.
Range of the pálinka in Hungary
The first pálinka-related memory that lends itself to verifica-tion originated in 1332, in the court of King Charles Robert. Queen Elizabeth suffered from arthritis, which was treated with aqua vitae, the water of life, made not out of fruits at that time, but of distilled wine with rosemary in it. Therefore, first distillate was prepared from mostly wine, conserving it in this way.
As time went by, other materials were looked for and found for preparing pálinka: potato, fruits and grains.
In the XIV. Century pálinka was still of low alcohol con-tent and it was used as an antidote to plague. The onset of grain based distilling industry may also be dated to this period since it represented a more economical alternative compared to wine. Copper-pots were already manufactured at that time and as human inventiveness perfected the equipment, the era saw the emergence of refrigerators and dephlegmators. Not much later, due to Paracelsus, liqueurs started to gain more and more popularity.
In Bártfa in 1438 a person called “Miklós” prepared pálin-ka, i.e. he “burnt” wine and distilled beer as well. Distillates appeared soon and their mixtures with herbs were used as medicaments (in modern interpretation, they were liqueurs). “Druggists recommended spirits almost for everything and people were ready to drink them. After a time, there could be no stopping.” Whereas Balázs (1998) dates the terms “co-gnac, hard liquor to”1570, Marton (2002) traces it back to 1524. Data about pálinka export have been available since 1542. Ferdinand I. In Hungary, the first written occurrence of the word “pálinka” can be dated to the 16. Century: as for research by Balázs (1998), it could be found as “balinca” in 1572 in Debrecen town. It also occurred in the forms of aqua vitae, crematum, vinum sublimatum and brannt wein referring to its preparation from wine. Torbágyi-Novák (1948) claim that grain-spirit production was so extensive that it often brought about famine, therefore it had to be regulated by law, already under King Mathias. When one of these prohibitions was imposed, the first census had to be taken of distilleries in 1677. “In Thököly’s estates 4000 “ice” (about 3400l) pálinka was prepared. In 1721 in Transylvania 3.774 distilleries could be found. Long distillation tubes leaning towards the pot and a wide cap were used to reduce the number of re-distillations. In England in the 1750s the word “aqua mortis” i.e. the water of death appeared. This adjective was used to mock gin due to its
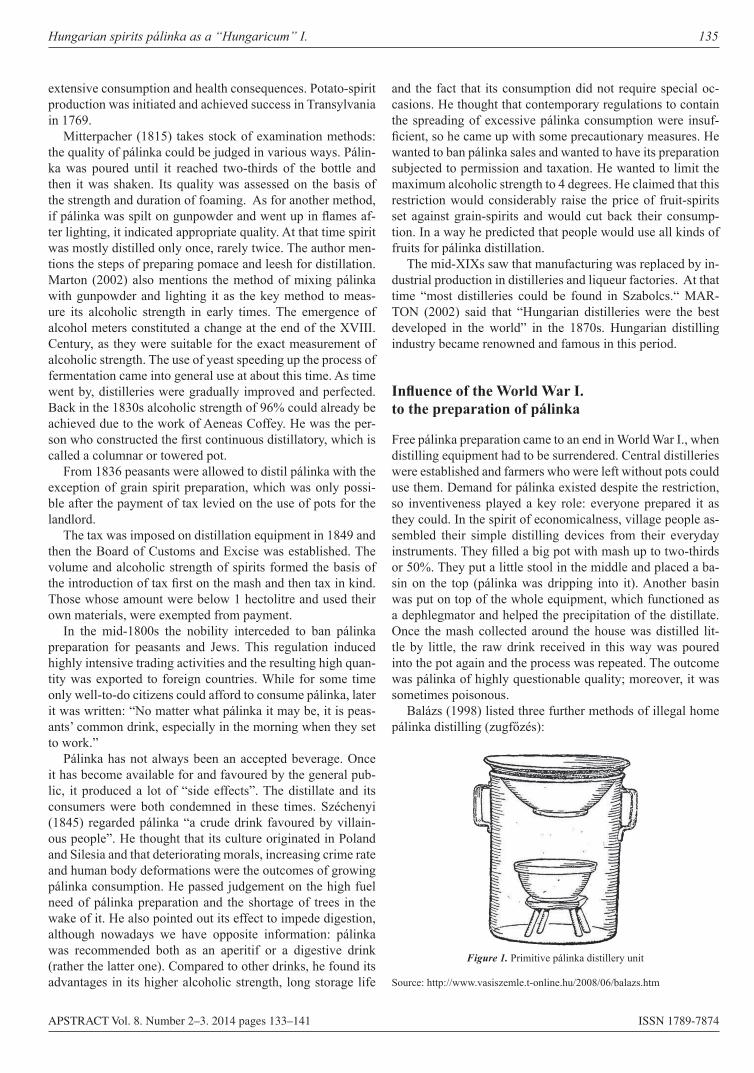
Hungarian spirits pálinka as a “Hungaricum” I. 135
APSTRACT Vol. 8. Number 2–3. 2014 pages 133–141 ISSN 1789-7874
extensive consumption and health consequences. Potato-spirit production was initiated and achieved success in Transylvania in 1769.
Mitterpacher (1815) takes stock of examination methods: the quality of pálinka could be judged in various ways. Pálin-ka was poured until it reached two-thirds of the bottle and then it was shaken. Its quality was assessed on the basis of the strength and duration of foaming. As for another method, if pálinka was spilt on gunpowder and went up in flames af-ter lighting, it indicated appropriate quality. At that time spirit was mostly distilled only once, rarely twice. The author men-tions the steps of preparing pomace and leesh for distillation. Marton (2002) also mentions the method of mixing pálinka with gunpowder and lighting it as the key method to meas-ure its alcoholic strength in early times. The emergence of alcohol meters constituted a change at the end of the XVIII. Century, as they were suitable for the exact measurement of alcoholic strength. The use of yeast speeding up the process of fermentation came into general use at about this time. As time went by, distilleries were gradually improved and perfected. Back in the 1830s alcoholic strength of 96% could already be achieved due to the work of Aeneas Coffey. He was the per-son who constructed the first continuous distillatory, which is called a columnar or towered pot.
From 1836 peasants were allowed to distil pálinka with the exception of grain spirit preparation, which was only possi-ble after the payment of tax levied on the use of pots for the landlord.
The tax was imposed on distillation equipment in 1849 and then the Board of Customs and Excise was established. The volume and alcoholic strength of spirits formed the basis of the introduction of tax first on the mash and then tax in kind. Those whose amount were below 1 hectolitre and used their own materials, were exempted from payment.
In the mid-1800s the nobility interceded to ban pálinka preparation for peasants and Jews. This regulation induced highly intensive trading activities and the resulting high quan-tity was exported to foreign countries. While for some time only well-to-do citizens could afford to consume pálinka, later it was written: “No matter what pálinka it may be, it is peas-ants’ common drink, especially in the morning when they set to work.”
Pálinka has not always been an accepted beverage. Once it has become available for and favoured by the general pub-lic, it produced a lot of “side effects”. The distillate and its consumers were both condemned in these times. Széchenyi (1845) regarded pálinka “a crude drink favoured by villain-ous people”. He thought that its culture originated in Poland and Silesia and that deteriorating morals, increasing crime rate and human body deformations were the outcomes of growing pálinka consumption. He passed judgement on the high fuel need of pálinka preparation and the shortage of trees in the wake of it. He also pointed out its effect to impede digestion, although nowadays we have opposite information: pálinka was recommended both as an aperitif or a digestive drink (rather the latter one). Compared to other drinks, he found its advantages in its higher alcoholic strength, long storage life
and the fact that its consumption did not require special oc-casions. He thought that contemporary regulations to contain the spreading of excessive pálinka consumption were insuf-ficient, so he came up with some precautionary measures. He wanted to ban pálinka sales and wanted to have its preparation subjected to permission and taxation. He wanted to limit the maximum alcoholic strength to 4 degrees. He claimed that this restriction would considerably raise the price of fruit-spirits set against grain-spirits and would cut back their consump-tion. In a way he predicted that people would use all kinds of fruits for pálinka distillation.
The mid-XIXs saw that manufacturing was replaced by in-dustrial production in distilleries and liqueur factories. At that time “most distilleries could be found in Szabolcs.“ MAR-TON (2002) said that “Hungarian distilleries were the best developed in the world” in the 1870s. Hungarian distilling industry became renowned and famous in this period.
Influence of the World War I. to the preparation of pálinka
Free pálinka preparation came to an end in World War I., when distilling equipment had to be surrendered. Central distilleries were established and farmers who were left without pots could use them. Demand for pálinka existed despite the restriction, so inventiveness played a key role: everyone prepared it as they could. In the spirit of economicalness, village people as-sembled their simple distilling devices from their everyday instruments. They filled a big pot with mash up to two-thirds or 50%. They put a little stool in the middle and placed a ba-sin on the top (pálinka was dripping into it). Another basin was put on top of the whole equipment, which functioned as a dephlegmator and helped the precipitation of the distillate. Once the mash collected around the house was distilled lit-tle by little, the raw drink received in this way was poured into the pot again and the process was repeated. The outcome was pálinka of highly questionable quality; moreover, it was sometimes poisonous.
Balázs (1998) listed three further methods of illegal home pálinka distilling (zugfőzés):
Figure 1. Primitive pálinka distillery unit
Source: http://www.vasiszemle.t-online.hu/2008/06/balazs.htm
136 Imre Milán Harcsa, András Nábrádi & Ildikó Tar
APSTRACT Vol. 8. Number 2–3. 2014 pages 133–141 ISSN 1789-7874
pressure-cooker: the distillate was prepared by using tradi-tional household instruments with minimal transformation for individual purposes.– Transdanubian type: it was also assembled from personal
belongings but on a large scale, e.g.people transformed jam pots and fitted them with separate vapour tubes; wooden barrels were used for cooling, so a large amount of mash could be distilled in one go.
– Alföld type: mash was prepared from sugar and yeast; smaller versions of industrial pots were used to generate profit through pálinka sales. The practice of illegal distillation was encouraged by the
traditional rule among peasants that said: windfalls should not go to waste and what you can produce at a lower price, economically, you should not purchase unnecessarily. This economical view was typical of citizens in the country and in towns as well.
The price of pálinka was continuously rising, so people of-tentimes complained about wholesale prices.
In 1916 Popovits Radován published his book “Szerencsés korcsmáros”, which he wrote, by his own admission, to teach people how to prepare drinks more cost-effectively. At that time fruits, grapes and grains were also used for distillation. “Pálinka is distilled in fire, as it evaporates from plants, whereas water remains in the furnace. This process gets repeated twice or three times and the outcome is called burnt spirits.” He also differentiates concentrated drinks as alcoholic drinks, liqueurs and “rozsólis”. He claims: “tasteful pálinka improves natural processes and natural has a favourable impact on tasteful. “
As an example, he prepared calculations how to sell drinks prepared by his method at a guaranteed profit, including the price of materials and the book itself. His examples mention pálinka with 32 degrees of alcoholic strength, indicating that it was generally accepted at that time. (Popovits 1916)
The industry saw an especially fast development between the two world wars. Machines for measuring alcohol strength were used from 1924, first to measure low alcohol (alszesz) and then small–scale factories were subjected to production taxes and large-scale ones to consumption taxes in 1938. The Spirits Monopoly Law of 1938 set up two categories for dis-tilleries. Torbágyi-Novák (1948) found that large “wine and fruit-spirit” distilleries were significant because they pro-vided alcoholic beverages by processing inedible products. He called small distilleries those ones, which offered distill-ing facilities for local inhabitants to prepare pálinka for their own consumption or for sale. In 1936 the number of registered fruit-spirit distilleries was 1500, but only 800 operated. Pots were mostly heated directly, including merely one gas-heated and some steam-heated ones.
Antal Osztróvszky played a considerable role in drafting the assessment of spirits, which was the predecessor of the present day pálinka test. He used the present tulip-shaped glass that he described as pear-shaped for the sensory analysis of pálinka already 70 years ago. He included among the crite-ria of tasks to be performed individually the skills to identify taste, scent, colour and alcoholic strength (22. p.). In those
days alcoholic content was measured at 15 °C, whereas it is at 20 °C today.
Water in which “soap does not lather well and legumes do not get cooked soft” is not suitable to achieve the required alcohol level. He finds mains water suitable and distilled wa-ter the best. He recommends double-walled steam heating to prevent scorching and to produce a distillate of better quality. The head of the distilling plant was obliged to preserve the certificates for three years and he had to report the hectolitre/degree data for the Board of Customs and Excise. Maximum 1 degree was the allowed deviation between the alcoholic strength indicated on the bottle and the actual one. Above a certain price category, a luxury tax was imposed on distil-lates, which had to be indicated on the invoice separately, if the drink was prepared exclusively from the displayed fruits and included no extraneous alcoholic matters whatsoever”. It means that high quality distillates were listed in another category already at that time. He calls attention to continu-ous learning, gaining experience in foreign countries and the significance of individual initiatives and experiments. (Osztróvszky 1943)
Following World War II. renovations were fast, distillation plants and liqueur factories were nationalized until 1951. In the coming decades distilling plants went through organiza-tional changes and large state companies gained dominant roles in the industry. In addition to them, small-scale, local distilleries run by councils or agricultural plants were also in operation.
Share-distillation was introduced in 1952, which meant that distillers received 50% of the pálinka, which was sub-ject to distillation and fuel fees. Subcontract distillation sub-jected to tax on spirits was authorized from 1970 and from 1983 private individuals were also entitled to operate distill-ing plants. (Balázs, 1998) From the turn of the 80s and 90s distilling industrial plants operated under good management conditions. Adaptation to quickly changing market conditions was expedited by transformations and ownership changes in state companies. In the wake of these processes internation-ally renowned companies started their operations in the Hun-garian distilling industry.
For a long time, the name “pálinka” was used for three types of drinks. One of them was a drink produced by the ad-dition of aroma to rectified alcohol, branded as plum-vodka these days; the second was a mixture of rectified alcohol, aro-ma and real fruit-pálinka (so-called “cut” items) and the third included distillates made exclusively of fruits. In that chaotic situation the “pálinka law” and the EU regulation clarified the legal positions. In compliance with category 9. of Appendix II. of 110/2008/EC Decree, pálinka shall be a fruit distillate prepared from fruits grown in Hungary, including fruit pulp, which is mashed, distilled, matured and bottled in Hungary. The spirit made from concentrates and dry fruits cannot bear the name “pálinka”. Therefore pálinka has become a priori-tized spirit category, stated precisely by Act LXXIII of 2008 (Pálinka Law). Under this law pálinka i.e. pálinka made of pomace shall exclusively include:
Hungarian spirits pálinka as a “Hungaricum” I. 137
APSTRACT Vol. 8. Number 2–3. 2014 pages 133–141 ISSN 1789-7874
• pálinka prepared from fruits or recrements of grapes grown in Hungary
• their fruit content is 100%, i.e. they contain no additional alcohols, colouring and flavouring agents or sweeteners.
• their minimum alcoholic strength is 37.5%.Besides Hungary, the name “pálinka” can only be used by
four Austrian provinces (Burgerland, Lower Austria, Styria and Vienna), but exclusively for a special distillate prepared from apricot.
Since 27 September 2010 distillation has become tax-free up to 50 l of fruit spirit (the alcohol strength of fruit spirit is of 86 V/V %). In 2009 the revenue of the state budget was 5.7 and in 2009 “8 billion HUF from home-made pálinka; how-ever, in 2010 the legalization of home distillation lead to a sig-nificant drop in state revenue. As for NAV data, this amount was merely 2.8. billion in this year, and most of this sum was collected in the first part of the year, before the legalization of home distillation.” (I1) Mention must be made that the end product of home distillation is to be called “distillate” as re-quirements stipulated by the pálinka law are impossible to be supervised.
In the past decades alcohol as a raw material and an ingre-dient gained higher significance and now it is used by several industrial sectors (pharmaceutical industry, pesticide produc-tion, domestic-chemical industry etc.); moreover, it is an alter-native motor fuel in several countries.
Modern technology development
Mash prepared from fruits by a special sequence of opera-tions is the raw material for distillation. Balázs (1998) claims that “Fruits are smashed and the resulting mash is usually fer-mented for 5-10 days.” Fermentation is rarely this fast and it is only true of some fruits requiring particular processing. The recommended fermentation period is 2-3 weeks, which is dominantly influenced by outdoor temperature, e.g. for late maturing apples it might extend to 6-8 weeks. Current stand-ards ban the preparation of mash without the careful selection and washing of fruits, although the author does not mention these processes.
For the preparation of pleasurable, excellent quality end-product the following sequence is to be observed. First, only ripe, juicy, healthy and selected fruits should be used. These have to be washed and stoned (it is especially significant for plum and peach). Then fruits are smashed to induce fermenta-tion; furthermore, pure-bred yeast and pectinolytic enzymes are added. Suitable temperature is important, the mash has to be stirred from time to time. Its alcoholic strength is to be measured and once the fermentation has completed, distilla-tion must follow immediately. If it is impossible, the storage tank has to be closed hermetically to prevent alcohol from es-caping.
In the beginning so-called spontaneous fermentation was used where no enzymes or yeasts were added to the mash and alcohol extraction was induced by indigenous yeasts of low colony count on the surface of fruits. As they occurred
in small amounts and their reproductive phase was long, they could not ensure proper alcohol extraction and quantity. Later the process was controlled by yeast available in convenience stores. However, it could be stated in the end product, prompt-ing pálinka lovers to look for new solutions. The current tech-nology is the use of pre-packed dry, pure yeast, available in farmers’ shops. It provides smooth fermentation without side effects. Aroma-rich basic material is produced by providing suitable temperature, adding pure yeast and yeast nutrient salts. Its use has become widespread in large-scale industrial production.
Torbágyi-Novák (1948) claims that the main factors to be considered for the selection of raw materials should not be the available spirit quantity, but the aroma-rich end product that is typical of the given fruit. He points out that fruits are necessarily crushed, as this is the way yeasts can decompose intracellular sugar. Washing is also necessary for raw materi-als to eliminate the effects of harmful soil bacteria. As mash is exposed to various actions and has to be heated for rectifi-cation, “the aroma of the distillate can only be similar to the original fruit aroma, but never the same”. Instead of sponta-neous fermentation, he recommends controlled fermentation by adding nutritional salts providing the generation of high quality alcohols and more pleasurable pálinka.
When Balázs (1998) collected his research data in the 1980s, plastic barrels were not used widely, whereas today they have almost completely replaced wooden ones in house-holds. He adds that in distilling plants waste was used instead of firewood. Distilling plants operated from St Michael’s day to St George’s day, i.e. in the period of 29 September–24 April. It was followed by a stoppage for repair and mainte-nance. Today the plants cannot afford to start their operation this late as for early fruits, e.g. cherry and sour cherry have to be processed already in August to produce high quality pálinka. He rather underestimates the firewood demand of the above, talking about 3-4 sacks i.e. 1 quintals of wood.
Speaking from the ground of personal, practical experience 2-2.5 quintals of wood are needed for the rectification of about 400 l mash. 1.5 countries might be enough if the mash is recti-fied for the umpteenth time on the very day.
He reveals further exciting information regarding the es-tablishment of alcoholic strength. Such is for example the “egg probe” where an egg is submerged into pálinka of 50 degrees to assess the depth it reaches and it serves as a stand-ard to set high or low alcoholic strength. As for another in-teresting practice, as long as the mash foams when dripped on walnut leaves, it has to be cooked. Distilling plants had to switch over from the measurement of low alcohol to that of refined alcohol until 1 December 1991. Covering the field of work with tiles was a requirement even at that time; moreo-ver, Osztróvszky (1943) mentioned proper lighting, spacious areas, easily cleanable surfaces etc. In spite of all these, there are subcontract distilleries with oil-painted walls and concrete floors in our days.
Balázs (1998) identified the reasons of pálinka preparations correctly: “Peasants prepared pálinka for salvage work, val-ue production, value generation and also for its position and
138 Imre Milán Harcsa, András Nábrádi & Ildikó Tar
APSTRACT Vol. 8. Number 2–3. 2014 pages 133–141 ISSN 1789-7874
need in peasants’ working arrangements”. He uses the words value creation and value generation as synonyms. Salvaging includes the use of fallen, damaged fruit, and grapes recre-ment, wine-lees as by-products. This is usually performed for individual purposes, but it still represents a value and makes farmers proud of their work, opening up possibilities to offer the spirit to neighbours and friends. Its real value and pre-ciousness mostly declare themselves when pálinka is given to somebody as a present or return-service. Pálinka is usu-ally given in return to small repair activities or other favours. Pálinka constituted an indispensable element of obligatory present exchanges, relatives living in the country generally took pálinka for their family members in the city. Hence pálin-ka is a value, if we want to buy it, we have to pay its price and if we sell it, we can receive money for it. It means that pálinka is a kind of money replacement. Fieldwork lasts from spring to autumn for rural populations, therefore they have no time or energy for pálinka preparation. Friends, family members can help with collecting and processing fruits in summer and au-tumn, when fruits ripen and it is followed by mashing grapes and grape pomace when summer activities come to an end, i.e. after harvest.
Once the mash has matured, it is to be rectified. For some fruits, e.g. strawberry, this is urgent, while mashes prepared from the majority of fruits can be stored for shorter-longer time without considerable deterioration in quality. The season of pálinka preparation usually comes when busy work is fin-ished or there is a holiday, a period when no work needs to be done or in a gap between other activities. At times when bans on pálinka preparation were in force, or in crises, access to pálinka was impossible or extremely difficult. However, peo-ple needed their favourite drink and they were motivated to produce it. The cost of preparation was also an incentive, as pálinka made from their own fruits was cost effective com-pared to other alcoholic beverages in shops.
Today home-made pálinka is typical and comes to the fore increasingly as distilling plants are not able to meet all de-mands in time and in the required quantity. Home preparation is especially characteristic of small-scale, rare products such as strawberry, cornel and elderberry. Pálinka preparation can be an excellent hobby as a relaxation after work. Abandoned paternal homes in the country and weekend gardens purchased by city dwellers offer good opportunities for distillation. Fresh fruits are sometimes difficult to collect in time, and windfalls can merely be used for pálinka.
In earlier times various “ágyas” (bedded) pálinka types or honey spirits were highly preferred. Under legal restrictions, although these beverages have the required alcoholic strength and comply with pálinka rules, due to the presence of addi-tives the name “pálinka” cannot be used. In the course of time this preference vanished and Péter Apor expressed his sorrow about it in this way: “…in the old times…cinnamon water was boiled in Brasov and the morning drink was called aquavita or pure burnt wine….Or people put some honey into the burnt wine after pouring it into the bowl and added some figs or raisins to it, burnt the liquid and stirred it with a spoon…then the fire was put out, they drank the spirit and consumed the
fruits…”(Balázs, 1998). Today the consumption of pálinka-based liqueurs is increasing again, producers bring back old recipes and introduce new specialities which might attract customers. Such kind of Jonatán apple pálinka-based spirit is for example Zsindelyes keserű (bitter drink, earlier Bazilita bitter) matured in oak barrels, enriched with the extract of 33 herbs.
Home distilling is most typical of the preparation of simple pálinka varieties. However, our experience suggests that wal-nut pálinka traditions have been successfully revived in the Kisvárda area. According to the recipe, green walnuts are to be picked until St Ivan’s day at the latest, as it is important for the shell to remain soft. The fruits are washed, chopped and then placed into the pálinka which is flavoured by various oth-er fruits (e.g. lemon and orange) and the bitterness of walnut is smoothed by the addition of sugar. With subcontract distil-lation pálinka it sometimes occurs that fruits are placed above the steaming liquid which runs through it and gets even more pleasurable. Freshly cut fruits are sometimes put into the sill pot, e.g. Acacia blossom. Some tailor the alcoholic strength of their pálinka to their own taste by the addition of their own water, Tonic, Sprite and Ginger. Some place strawberry or oak tree pieces into the storage tanks.
Hungarian distilleries have two different methods of distil-lation: traditional “kisüsti” (small pot, cauldron) or the modern “column” equipment. Requirements for the “kisüsti” include that the first distillation produces raw alcohol of 16–28% al-coholic strength and the second distillates is fully aromatic. Mitterpacher (1815) lists the following parts of early distilling equipment: pot still, cap, the “nose” of the cap and a long, straight or curved pipe. He points out that the copper elements get gradually worn out and he mentions the harmful effects of dissolved copper. He recommends that each and every part should be tinned to prevent the above health risks. He speaks about a pot, which is not deep but rather wide, its bottom is “a bit convex inside” and he enhances the significance of the ris-ing steam and controlled heating. He claims that pálinka flows very slowly out of the bowl.
The early version of today’s distillery “tower” appeared back in the early 1900s, which could manufacture a distillate of 50–70%. At that time it was generally thought that recti-fication, a more up-to-date method, would never be used in the fruit-spirit industry. It has turned out that this was a mis-conception, as the majority of new distilling plants use this technology.
In modern days subcontract distillation generates the high-est turnover. It means that experts rectify distillates out of mash prepared by individuals in the course of one or two dis-tillations, using copper or acid-resistant distillery equipment. Under this subcontract the volume of authorized pálinka is 43 Hlf (V/V %) per household and the products shall not be marketed and sold.
In the European Union this right is unknown, hence it is uniquely Hungarian. Special manufacturers in various sizes and forms produce pots. Copper pots lend a special, pleasant flavour for pálinka. Original “kisüsti” is a product from two separate distillations in a copper pot through a heat-techno-
Hungarian spirits pálinka as a “Hungaricum” I. 139
APSTRACT Vol. 8. Number 2–3. 2014 pages 133–141 ISSN 1789-7874
logical process in which the pre-distillate is heated to gener-ate steam, which is cooled to gain liquid. The resulting milk-white liquid is the product of the first phase of distillation, and this low alcohol is unsuitable for human consumption. The above mentioned procedure is repeated in a separate pot to refine the alcoholic liquid. The so-called Pistorious plates in the cap sitting on the top of the pot provide excellent quality, fully aromatic distillates.
The second distillation has three phases: the middle-dis-tillate is disjoined from the pre and the post-distillate. All these three phases (besides etylalcohol) leave behind unpleas-ant tastes, odours, and chemical substances in smaller-bigger amounts. Middle-distillates are the most important for us; only this is allowed to run through the alcoholic meter. Pre- and post- distillates are destroyed due to their toxic content. The noble nectar continues its route as experts set the pálinka degree at the required level by adding distilled water to it. Most subcontract distillers prefer pálinka of 50 V/V% .
A modern, single stage or traditional “tower” type distil-lation has come into general use. Instead of using a separate pot for refining, an aroma column is placed on the top of the pot still. It does not only cut back distilling time, but also pro-duces more aroma-rich, fruity spirits. The alcoholic strength is usually lower, it is at about 40–45%.
In large-scale distillation fruit mesh is produced and rec-tified by individuals in their own right, the pálinka gained in this way can be sold (in their own right or in another tax warehouse) with a tax stamp on it, after the full payment of 3333.85 Ft/V/V% excise duty.
The right of free pálinka distillation caused difficulties not for subcontract distillers, but for large-scale ones. High fruit yields in 2013 motivated people to prepare more pálinka, so turnover surged in already busy subcontract distilling plants.
As a consequence, approximately 9-10 million hectolitre pálinka was distilled in plants. In addition to this amount, the volume of homemade distillation can only be assessed, it might be approximately 5 million v/v %. In the meanwhile, tradover dropped harshly in industrial distilling plants. While earlier they produced an annual amount of 1.5–1.2 V/V%, i.e. 50% of subcontract production, it decreased to 660 thousand V/V%. In the background of his recession we can find the black market sale of subcontract distillates and a massive set-back in the trend of pálinka consumption. (I2)
There is much to do for distillers to make pálinka, our unique spirit widely known and consumed by other nations. Stakeholders in the pálinka industry have set this priority for long decades.
“Our fruit spirit industry, just like all sectors of agriculture, is confronted with the shortage of working capital…. The only obstacle to impede our export potentials is our higher price as compared to world market price, due to high raw material related production costs. For export purposes, Hun-garian fruit-spirit production must produce standard excellent quality pálinka….Just like French cognac, Scottish whisky, English gin acquired world fame during history and could create their own markets, Hungarian fruit distillates have to
find their rightful place in world markets”. (Torbágyi-Novák, 1948)
The excellent quality of pálinka is unquestionable, as dis-tillers do their best to achieve the best final product. However, standard quality may become problematic, as different years yield different fruits influencing the quality of distillates. It is impossible for the same distiller to produce two identical distillates even if he uses the same equipment and fruits in two subsequent years.
Summary
The history of spirit distillation is thousand years of the his-tory. Foreign mediation to Hungary reached the spirits, and XIV. Century has been used as a medicine in the royal court. The first written occurrence of the word for pálinka comes from the city of Debrecen (1572). The quality of these bever-ages and spirits degree has steadily increased, the fruit grown in Hungary raw material quality, technical development and the combined effect of several centuries of experience thanks to the distillation apparatus rose to the rank of “Hungari-cum”.
Mitterpacher played important role in performance of the literature of distillation of pálinka who has distinguished the main parts of the plant, described the test methods to deter-mine the alcohol content, and made recommendations as to the quality of the final product to coat the inner surface of the pan with phenylglycine.
Hungary emerged in the “subcontract distillation” during the long time, which is considered on an individual peculi-arity in the European Union. Played a major role in the fact that from 1983 authorized the operation of distillery plants also for individuals. Rise of the national drink it got a boost when precisely defined meaning of the term pálinka that this designation only in Hungary, with at least 37.5% of the non-alcoholic beverages, 100% fruit content, additives may be given the name brandy.
The pálinka can made in three ways; in commercial dis-tillery, in subcontract distillation unit and from September 2010 may also be made at home without paying excise tax amounts up to 50 litters of fruit spirits. Traditional pot still is in production technology or modern-column distillation ap-paratus. However, the products made at home wearing only the name; distillate, pálinka designation may only be the fruit spirits produced in the plants, and approved by the Commis-sion Hungaricum.
According to conservative valuation more than 50% of the Hungarian adult population consumed pálinka occasion-ally. The majority of the adult population believes that small amount of pálinka is good for the health; many people use it for alleviation of toothache, sore throat and stomachache. The pálinka has mood-enhancing impact in social parties and pleasant family events, if we do not forget about the modera-tion.
140 Imre Milán Harcsa, András Nábrádi & Ildikó Tar
APSTRACT Vol. 8. Number 2–3. 2014 pages 133–140 ISSN 1789-7874
References
Balázs G (1998): A magyar pálinka (Hungarian pálinka). Aula Kiadó, Budapest, 168 p.
Békési Z & Csarnai E (2010): Házi pálinkafőzés (Home distillery). Mezőgazda Kiadó, Budapest, 157 p.Kai M & Szetei D (2011): A tradicionális lepárlás művészete (The traditional art of distillation). Editorial Unico, 146 p.Marton Sz (2002): Az égetett szeszek és az emberiség (The spirits and humanity). Bába Könyvkiadó, Szeged, 160 p. Mitterpacher L (1815): Rövid oktatás a’ szölö miveléséröl és bor, pálinka, és etzet készittetéséröl (Short education of the viticulture and preparation of wine, pálinka, vinegar). Buda, 1818, 116 p.Osztróvszky A (1943): Ipari likőrgyártás (Industrial liqueur produc-tion). Királyi Magyar Egyetemi Nyomda, Budapest, 207 p.Popovits R (1916): Szerencsés korcsmáros – vendéglősök kézi-könyve (Lucky innkeeper – restaurateurs Handbook). Szövetkezeti Könyv nyomda, Újvidék, 40 p.
Széchenyi I (1845): A’ pálinkáról (The pálinka). Budán, A’ M. Kir. Egye tem’ betűivel, 58.p.Torbágyi-Novák L (1948): Az égetett szeszesitalok gyártása, vizs-gálata és minősítése (The spirits production, testing and certifica-tion). Hernádi Árpád adó-, illetékügyi és közigazgatási szakkönyv-kiadó, Budapest, 573 p.
Internet references:I1: Napi Gazdaság: milliárdokat veszített az állam a „pálinkaforra-dalom” miatthttp://hvg.hu/gazdasag/20110110_palinkafozes_millardok# (2014.03.20)I2: Ilyen nincs! – Elárasztotta az egész országot a fekete pálinkahttp://www.agrarszektor.hu/bor-italok/egyeb/ilyen_nincs_elarasztotta_az_egesz_orszagot_a_fekete_palinka.3590.html (2014.02.28)I3: http://www.vasiszemle.t-online.hu/2008/06/balazs.htmI4: http://www.1moment.hu/hungarikum.pdf
APSTRACT Vol. 8. Number 2–3. 2014 pages 141–146 ISSN 1789-7874
Introduction
Precision agriculture is the key tendency of technological de-velopment in today’s agriculture. It comprises new innovation technologies such as matching farming practices to production areas, integrated plant protection, inter-field variable cultiva-tion technologies, remote sensing, the practical application of GPS technology and geographic information software in agri-culture etc. This is a complex system that allows improved ad-justment to heterogeneous soil conditions, correction of logisti-cal and organizational failures, rational use of available input materials and building up a record of farm activities. Moreover, the large scale benefit of this system is that all the above men-tioned are infinitely reproducible in spatial and temporal terms. Precision farming is a tool and an opportunity for agricultural producers to optimize their farming practices, to improve or-ganization, to foster traceability, to generate and to store infor-mation which improves their decision-making.
The system allows farmers to use more economic and envi-ronmentally sound farming practices. It is noteworthy and can be significantly detected in itself that through site-specific fer-tilizer application, regarding soil heterogeneity, the quantity of applied plant protection products and fertilizers can be re-duced, resulting in lower environmental load (Takács-György 2012).
Moore et al. (1993) claim that precision technology is a system relying on an information and technological basis, which seeks to respect soil properties and to achieve agricul-tural sustainability and environmental protection.
Precision farming is a modern tool in agricultural produc-tion; in fact, this is the key to boost efficiency and to cut envi-ronmental load (Wolf and Buttel 1996). Moreover, precision farming in itself can imply the mitigation of environmental damage and farmers’ risks. This means that yield insecurity can be diminished and revenue safety for farmers can be en-hanced provided that these technological elements are used
Economic, Practical imPacts of PrEcision farming – With EsPEcial
rEgard to harvEstingÁgnes Szolnoki & András Nábrádi
University of Debrecen
Summary: Today agricultural practice is faced with a paradigm shift. In terms of natural resources, the World’s growing population calls for rational management and environment-conscious behaviour. Precision farming may provide a solution for the above mentioned criteria and problems. It has an array of technological equipment, elements and complete systems which are in themselves suitable to create conditions for efficient farming, to reduce environmental load and to provide farmers with optimal return on their investment.Agricultural production has started to focus mainly on efficient crop production and machine operation. Due to this trend, machinery exploitation emerges as a secondary priority for agricultural enterprises. The underlying reason behind this shift is primarily the rise of machinery operation costs. Efficient machinery operation can provide farmers with a solution to reduce their expenditure and through better logistical organization they can obtain extra returns. On the leading edge of my research is to introduce, quantitatively underpin and to justify the application of precision technologies. Our fundamental research methods rely on scenarios and economic calculations.
Keywords: precision farming, logistical optimization, sustainable agriculture, efficiency, effectiveness
Applied Studies in Agribusiness and Commerce – APSTRACTAgroinform Publishing House, Budapest sciEntific PaPErs
142 Ágnes Szolnoki & András Nábrádi
APSTRACT Vol. 8. Number 2–3. 2014 pages 141–146 ISSN 1789-7874
and applied appropriately; however, all this in itself cannot guarantee revenue growth without exception (Takács-György 2012).
Referring to Mondal-Basu (2009) the precision agriculture is a tool in farmer’s hand to optimize yield with minimum input use and reduced environmental pollution. Countries have to face with the challenge of economic and social growth which causes more increasing consumption. (energy con-sumption, food consumption, etc.)
The technological starting point of the system is precision soil sampling, which provides real-time information of each plot through the evaluation of the related results. These data show the condition, the nutrient and the microelement con-tent of the soil. Based on these data, various maps can be drawn up by computer software. Application maps, indicat-ing e.g. the application of fertilizers, plant protection prod-ucts or sowing maps, are developed in consideration of soil sample data.
Their most pivotal element is that the program relies on soil sampling data, taking account of soil heterogeneity and gener-ates maps, i.e. generates optimal input use to minimize envi-ronmental load and to allow farmers to obtain optimal revenue (Bongiovanni, Lowenberg-Deboer 2004). In addition to all these, it keeps records of each plot and provides farmers with precise data on production costs regarding crops and sites. If farmers have access to information on plot-level expenditure and through technologies they can improve yield safety, pro-spective revenues may be calculated which is a cornerstone of present day farming. It is a matter of common knowledge that due to the seasonal nature of agricultural production, farm-ers’ revenues and expenses are temporally very different. The other essential element of the system is GPS communication. Navigation techniques can be successfully used in the period of soil cultivation and sowing, fertilization and plant protec-tion (Swinton 1997).
This cordless technology integrates farming methods among machines, machine owners and machine operators. Its use lends itself to blending machine optimization, logistical optimization and fostering decision-making in agriculture. Farmers can achieve various levels of navigational accuracy; however, the so-called RTK real-time kinematic systems op-erating with the accuracy of 2 cm and can provide the users of precision technologies with highest accuracy.
The control system of precision crop production is divided into four main sub-categories:
DATA COLLECTION→ →DATA-PROCESSING→DECISION-
MAKING→INTERVENTION
Importantly, documentation should be developed during the whole process to ensure that system data can be retrieved and measured. Besides documentation, the background sup-port of information technology and communication among machines allows potentials for intervention.
According to Weiss (1996) “precision farming is the sam-pling, mapping analysis and management of production areas in recognition of this spatial variety.”
The John Deere Company, which introduced satellite-based guidance systems approximately 15 years ago, played a key role in the development and dissemination of precision technologies. With a keynote on innovation, it offers farmers inventions such as the application of cordless technologies.
(JD Link-Logistical and remote administration optimiza-tion) Our modern world requires farmers to keep up with the latest technologies to be able to optimize their revenue. It is expedient to use high-priced input materials more rationally, as a single bad decision may lay heavy burdens on farmers, let alone the unnecessary loading of the environment.
When considering the benefits of precision systems, farm-ers primarily focus on cost efficiency. Typically, they are not yet aware of their responsibility to protect our natural resourc-es. This might be due to inadequate communication and to the fact that farmers do not have access to new information. Unfortunately based on practical experience, this is highly characteristic of Hungary.
Spreading of precision crop production is firstly an eco-nomic decision from farmer’s view because they have to invest their capital. Because of it is not enough to examine the changes of the crop yield we have to examine the product price too so that the farmers can make a responsible and sus-tainable decision (Swinton, Lowenberg-DeBoer 1998).
The application of precision technologies in Hungary shows a very slow progress. The reason for this lies in the fact that the application of the system requires farmers to pos-sess some kind of calling, managerial skills, system-based approach, background knowledge of information science and last but not least, a considerable amount of capital to invest.
Studies also shown that the application of precision crop production is hardly to implement. One reason is that the pro-duction is limited by the need for additional investment and the other is the availability of labour. We can establish that the adoption of precision farming technology is in early stage in Hungary (Takácsné, Lencsés, Takács 2013.).
Further obstacles to hinder the widespread use of this sys-tem are the lack of farmers’ necessary knowledge, practice and experience to use these technologies (Nábrádi 2010).
Our research attempts to investigate a farm that switches from traditional farming practice to precision technology gradually.
This present study is based on an innovative technology exhibition in Hungary, focus on the significance of logistic optimalization in agriculture. The exhibition was held on 5 july 2012 in Zichyújfalu by KITE Zrt.
Our hypotheses are the fallowing:H1. are farmers tend to concentrate mostly on efficient ma-
chine operation? H2. the cost-efficiency achievable by the application of preci-
sion technologies?
Material and methods
The underlying condition in our research was identified as fol-lows: the application of precision technologies is traceable and
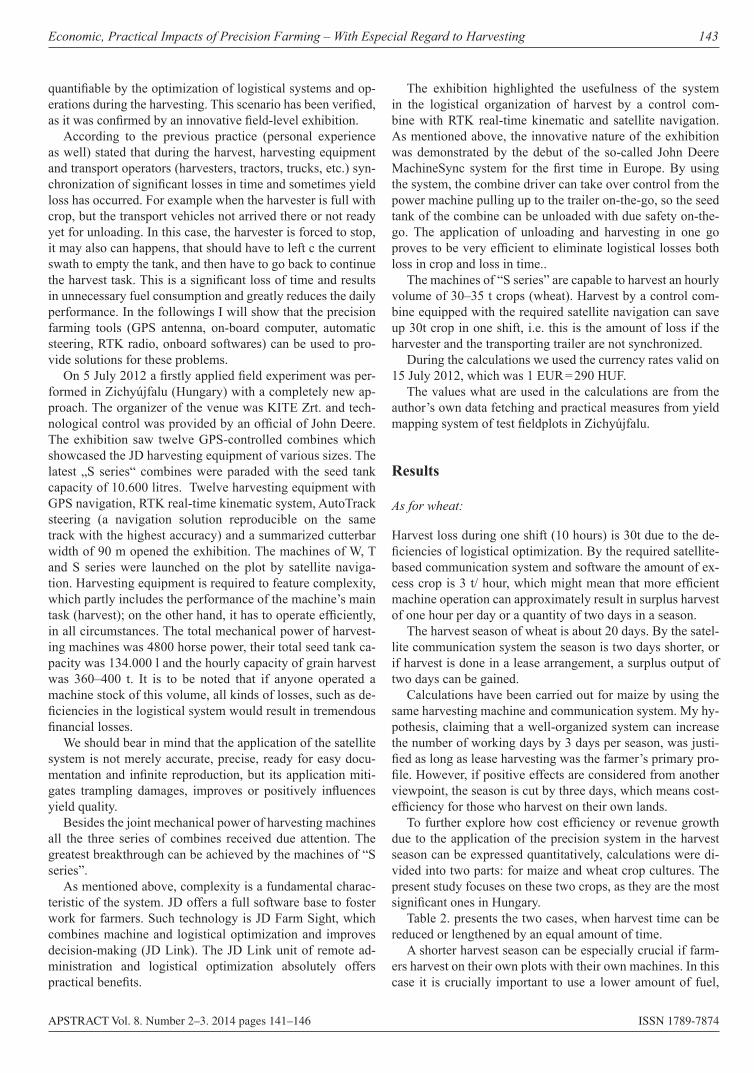
Economic, Practical Impacts of Precision Farming – With Especial Regard to Harvesting 143
APSTRACT Vol. 8. Number 2–3. 2014 pages 141–146 ISSN 1789-7874
quantifiable by the optimization of logistical systems and op-erations during the harvesting. This scenario has been verified, as it was confirmed by an innovative field-level exhibition.
According to the previous practice (personal experience as well) stated that during the harvest, harvesting equipment and transport operators (harvesters, tractors, trucks, etc.) syn-chronization of significant losses in time and sometimes yield loss has occurred. For example when the harvester is full with crop, but the transport vehicles not arrived there or not ready yet for unloading. In this case, the harvester is forced to stop, it may also can happens, that should have to left c the current swath to empty the tank, and then have to go back to continue the harvest task. This is a significant loss of time and results in unnecessary fuel consumption and greatly reduces the daily performance. In the followings I will show that the precision farming tools (GPS antenna, on-board computer, automatic steering, RTK radio, onboard softwares) can be used to pro-vide solutions for these problems.
On 5 July 2012 a firstly applied field experiment was per-formed in Zichyújfalu (Hungary) with a completely new ap-proach. The organizer of the venue was KITE Zrt. and tech-nological control was provided by an official of John Deere. The exhibition saw twelve GPS-controlled combines which showcased the JD harvesting equipment of various sizes. The latest „S series“ combines were paraded with the seed tank capacity of 10.600 litres. Twelve harvesting equipment with GPS navigation, RTK real-time kinematic system, AutoTrack steering (a navigation solution reproducible on the same track with the highest accuracy) and a summarized cutterbar width of 90 m opened the exhibition. The machines of W, T and S series were launched on the plot by satellite naviga-tion. Harvesting equipment is required to feature complexity, which partly includes the performance of the machine’s main task (harvest); on the other hand, it has to operate efficiently, in all circumstances. The total mechanical power of harvest-ing machines was 4800 horse power, their total seed tank ca-pacity was 134.000 l and the hourly capacity of grain harvest was 360–400 t. It is to be noted that if anyone operated a machine stock of this volume, all kinds of losses, such as de-ficiencies in the logistical system would result in tremendous financial losses.
We should bear in mind that the application of the satellite system is not merely accurate, precise, ready for easy docu-mentation and infinite reproduction, but its application miti-gates trampling damages, improves or positively influences yield quality.
Besides the joint mechanical power of harvesting machines all the three series of combines received due attention. The greatest breakthrough can be achieved by the machines of “S series”.
As mentioned above, complexity is a fundamental charac-teristic of the system. JD offers a full software base to foster work for farmers. Such technology is JD Farm Sight, which combines machine and logistical optimization and improves decision-making (JD Link). The JD Link unit of remote ad-ministration and logistical optimization absolutely offers practical benefits.
The exhibition highlighted the usefulness of the system in the logistical organization of harvest by a control com-bine with RTK real-time kinematic and satellite navigation. As mentioned above, the innovative nature of the exhibition was demonstrated by the debut of the so-called John Deere MachineSync system for the first time in Europe. By using the system, the combine driver can take over control from the power machine pulling up to the trailer on-the-go, so the seed tank of the combine can be unloaded with due safety on-the-go. The application of unloading and harvesting in one go proves to be very efficient to eliminate logistical losses both loss in crop and loss in time..
The machines of “S series” are capable to harvest an hourly volume of 30–35 t crops (wheat). Harvest by a control com-bine equipped with the required satellite navigation can save up 30t crop in one shift, i.e. this is the amount of loss if the harvester and the transporting trailer are not synchronized.
During the calculations we used the currency rates valid on 15 July 2012, which was 1 EUR = 290 HUF.
The values what are used in the calculations are from the author’s own data fetching and practical measures from yield mapping system of test fieldplots in Zichyújfalu.
Results
As for wheat:
Harvest loss during one shift (10 hours) is 30t due to the de-ficiencies of logistical optimization. By the required satellite-based communication system and software the amount of ex-cess crop is 3 t/ hour, which might mean that more efficient machine operation can approximately result in surplus harvest of one hour per day or a quantity of two days in a season.
The harvest season of wheat is about 20 days. By the satel-lite communication system the season is two days shorter, or if harvest is done in a lease arrangement, a surplus output of two days can be gained.
Calculations have been carried out for maize by using the same harvesting machine and communication system. My hy-pothesis, claiming that a well-organized system can increase the number of working days by 3 days per season, was justi-fied as long as lease harvesting was the farmer’s primary pro-file. However, if positive effects are considered from another viewpoint, the season is cut by three days, which means cost-efficiency for those who harvest on their own lands.
To further explore how cost efficiency or revenue growth due to the application of the precision system in the harvest season can be expressed quantitatively, calculations were di-vided into two parts: for maize and wheat crop cultures. The present study focuses on these two crops, as they are the most significant ones in Hungary.
Table 2. presents the two cases, when harvest time can be reduced or lengthened by an equal amount of time.
A shorter harvest season can be especially crucial if farm-ers harvest on their own plots with their own machines. In this case it is crucially important to use a lower amount of fuel,
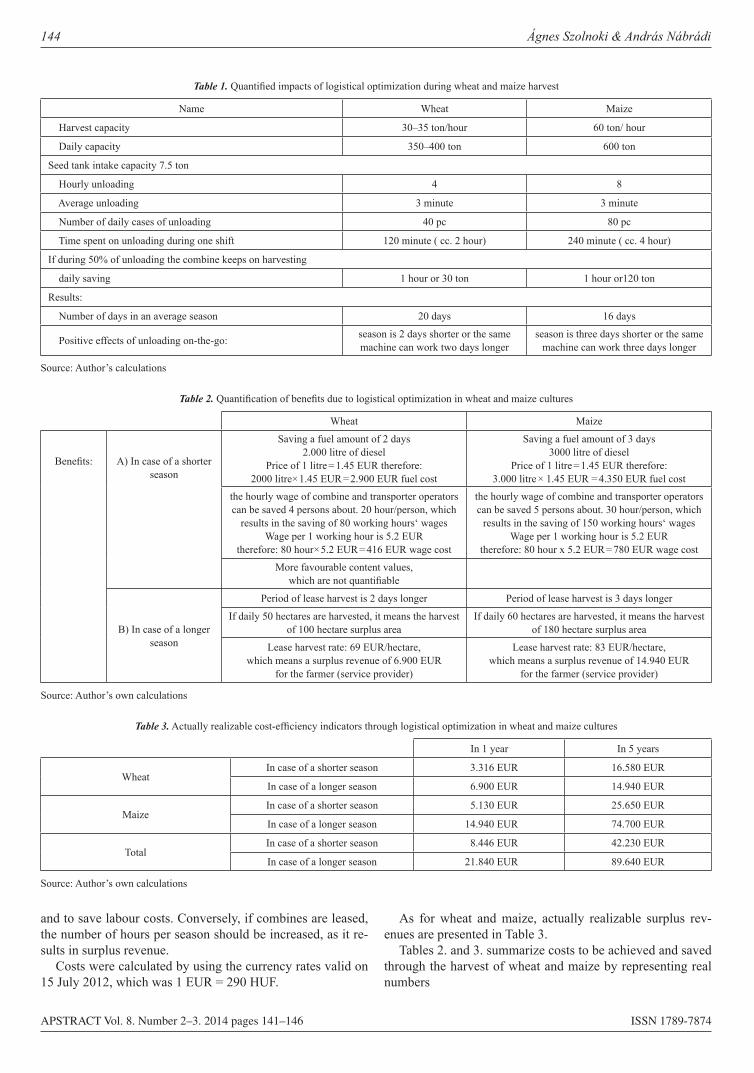
144 Ágnes Szolnoki & András Nábrádi
APSTRACT Vol. 8. Number 2–3. 2014 pages 141–146 ISSN 1789-7874
and to save labour costs. Conversely, if combines are leased, the number of hours per season should be increased, as it re-sults in surplus revenue.
Costs were calculated by using the currency rates valid on 15 July 2012, which was 1 EUR = 290 HUF.
As for wheat and maize, actually realizable surplus rev-enues are presented in Table 3.
Tables 2. and 3. summarize costs to be achieved and saved through the harvest of wheat and maize by representing real numbers
Table 1. Quantified impacts of logistical optimization during wheat and maize harvest
Name Wheat Maize
Harvest capacity 30–35 ton/hour 60 ton/ hour
Daily capacity 350–400 ton 600 ton
Seed tank intake capacity 7.5 ton
Hourly unloading 4 8
Average unloading 3 minute 3 minute
Number of daily cases of unloading 40 pc 80 pc
Time spent on unloading during one shift 120 minute ( cc. 2 hour) 240 minute ( cc. 4 hour)
If during 50% of unloading the combine keeps on harvesting
daily saving 1 hour or 30 ton 1 hour or120 ton
Results:
Number of days in an average season 20 days 16 days
Positive effects of unloading on-the-go: season is 2 days shorter or the same machine can work two days longer
season is three days shorter or the same machine can work three days longer
Source: Author’s calculations
Table 2. Quantification of benefits due to logistical optimization in wheat and maize cultures
Wheat Maize
Benefits:
A) In case of a shorter season
Saving a fuel amount of 2 days2.000 litre of diesel
Price of 1 litre = 1.45 EUR therefore:2000 litre×1.45 EUR = 2.900 EUR fuel cost
Saving a fuel amount of 3 days3000 litre of diesel
Price of 1 litre = 1.45 EUR therefore: 3.000 litre × 1.45 EUR = 4.350 EUR fuel cost
the hourly wage of combine and transporter operators can be saved 4 persons about. 20 hour/person, which
results in the saving of 80 working hours‘ wagesWage per 1 working hour is 5.2 EUR
therefore: 80 hour×5.2 EUR = 416 EUR wage cost
the hourly wage of combine and transporter operators can be saved 5 persons about. 30 hour/person, which
results in the saving of 150 working hours‘ wagesWage per 1 working hour is 5.2 EUR
therefore: 80 hour x 5.2 EUR = 780 EUR wage cost
More favourable content values, which are not quantifiable
B) In case of a longer season
Period of lease harvest is 2 days longer Period of lease harvest is 3 days longer
If daily 50 hectares are harvested, it means the harvest of 100 hectare surplus area
If daily 60 hectares are harvested, it means the harvest of 180 hectare surplus area
Lease harvest rate: 69 EUR/hectare, which means a surplus revenue of 6.900 EUR
for the farmer (service provider)
Lease harvest rate: 83 EUR/hectare, which means a surplus revenue of 14.940 EUR
for the farmer (service provider)
Source: Author’s own calculations
Table 3. Actually realizable cost-efficiency indicators through logistical optimization in wheat and maize cultures
In 1 year In 5 years
WheatIn case of a shorter season 3.316 EUR 16.580 EUR
In case of a longer season 6.900 EUR 14.940 EUR
MaizeIn case of a shorter season 5.130 EUR 25.650 EUR
In case of a longer season 14.940 EUR 74.700 EUR
TotalIn case of a shorter season 8.446 EUR 42.230 EUR
In case of a longer season 21.840 EUR 89.640 EUR
Source: Author’s own calculations
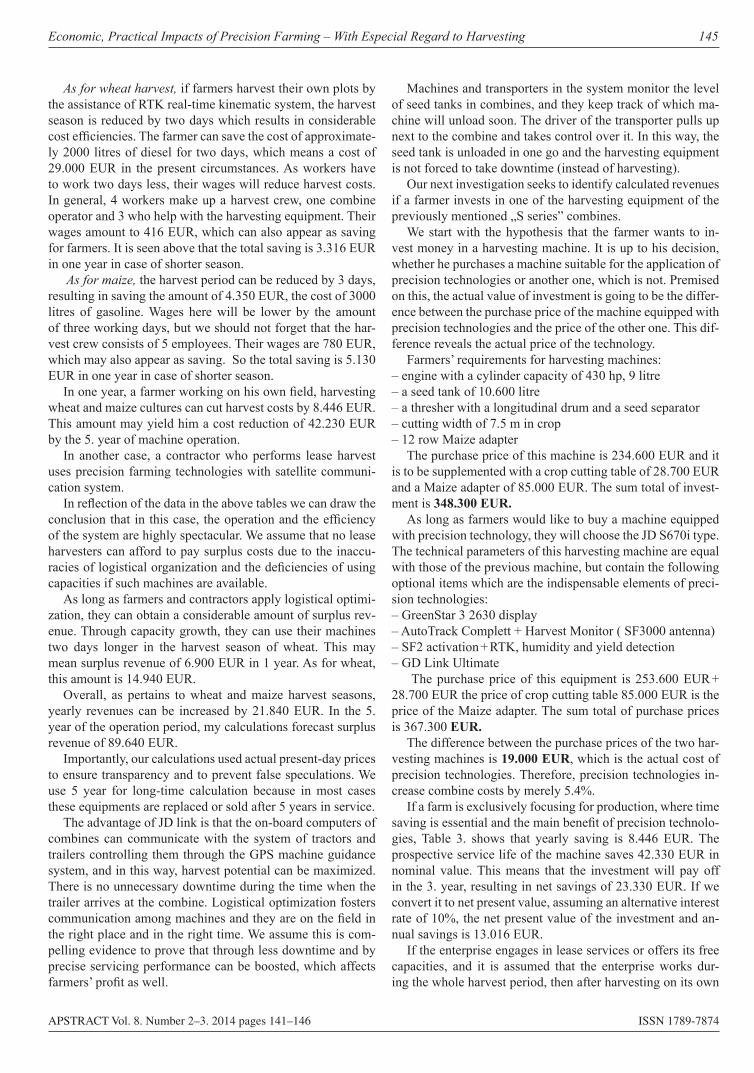
Economic, Practical Impacts of Precision Farming – With Especial Regard to Harvesting 145
APSTRACT Vol. 8. Number 2–3. 2014 pages 141–146 ISSN 1789-7874
As for wheat harvest, if farmers harvest their own plots by the assistance of RTK real-time kinematic system, the harvest season is reduced by two days which results in considerable cost efficiencies. The farmer can save the cost of approximate-ly 2000 litres of diesel for two days, which means a cost of 29.000 EUR in the present circumstances. As workers have to work two days less, their wages will reduce harvest costs. In general, 4 workers make up a harvest crew, one combine operator and 3 who help with the harvesting equipment. Their wages amount to 416 EUR, which can also appear as saving for farmers. It is seen above that the total saving is 3.316 EUR in one year in case of shorter season.
As for maize, the harvest period can be reduced by 3 days, resulting in saving the amount of 4.350 EUR, the cost of 3000 litres of gasoline. Wages here will be lower by the amount of three working days, but we should not forget that the har-vest crew consists of 5 employees. Their wages are 780 EUR, which may also appear as saving. So the total saving is 5.130 EUR in one year in case of shorter season.
In one year, a farmer working on his own field, harvesting wheat and maize cultures can cut harvest costs by 8.446 EUR. This amount may yield him a cost reduction of 42.230 EUR by the 5. year of machine operation.
In another case, a contractor who performs lease harvest uses precision farming technologies with satellite communi-cation system.
In reflection of the data in the above tables we can draw the conclusion that in this case, the operation and the efficiency of the system are highly spectacular. We assume that no lease harvesters can afford to pay surplus costs due to the inaccu-racies of logistical organization and the deficiencies of using capacities if such machines are available.
As long as farmers and contractors apply logistical optimi-zation, they can obtain a considerable amount of surplus rev-enue. Through capacity growth, they can use their machines two days longer in the harvest season of wheat. This may mean surplus revenue of 6.900 EUR in 1 year. As for wheat, this amount is 14.940 EUR.
Overall, as pertains to wheat and maize harvest seasons, yearly revenues can be increased by 21.840 EUR. In the 5. year of the operation period, my calculations forecast surplus revenue of 89.640 EUR.
Importantly, our calculations used actual present-day prices to ensure transparency and to prevent false speculations. We use 5 year for long-time calculation because in most cases these equipments are replaced or sold after 5 years in service.
The advantage of JD link is that the on-board computers of combines can communicate with the system of tractors and trailers controlling them through the GPS machine guidance system, and in this way, harvest potential can be maximized. There is no unnecessary downtime during the time when the trailer arrives at the combine. Logistical optimization fosters communication among machines and they are on the field in the right place and in the right time. We assume this is com-pelling evidence to prove that through less downtime and by precise servicing performance can be boosted, which affects farmers’ profit as well.
Machines and transporters in the system monitor the level of seed tanks in combines, and they keep track of which ma-chine will unload soon. The driver of the transporter pulls up next to the combine and takes control over it. In this way, the seed tank is unloaded in one go and the harvesting equipment is not forced to take downtime (instead of harvesting).
Our next investigation seeks to identify calculated revenues if a farmer invests in one of the harvesting equipment of the previously mentioned „S series” combines.
We start with the hypothesis that the farmer wants to in-vest money in a harvesting machine. It is up to his decision, whether he purchases a machine suitable for the application of precision technologies or another one, which is not. Premised on this, the actual value of investment is going to be the differ-ence between the purchase price of the machine equipped with precision technologies and the price of the other one. This dif-ference reveals the actual price of the technology.
Farmers’ requirements for harvesting machines:– engine with a cylinder capacity of 430 hp, 9 litre – a seed tank of 10.600 litre – a thresher with a longitudinal drum and a seed separator – cutting width of 7.5 m in crop – 12 row Maize adapter
The purchase price of this machine is 234.600 EUR and it is to be supplemented with a crop cutting table of 28.700 EUR and a Maize adapter of 85.000 EUR. The sum total of invest-ment is 348.300 EUR.
As long as farmers would like to buy a machine equipped with precision technology, they will choose the JD S670i type. The technical parameters of this harvesting machine are equal with those of the previous machine, but contain the following optional items which are the indispensable elements of preci-sion technologies: – GreenStar 3 2630 display– AutoTrack Complett + Harvest Monitor ( SF3000 antenna)– SF2 activation + RTK, humidity and yield detection– GD Link Ultimate
The purchase price of this equipment is 253.600 EUR + 28.700 EUR the price of crop cutting table 85.000 EUR is the price of the Maize adapter. The sum total of purchase prices is 367.300 EUR.
The difference between the purchase prices of the two har-vesting machines is 19.000 EUR, which is the actual cost of precision technologies. Therefore, precision technologies in-crease combine costs by merely 5.4%.
If a farm is exclusively focusing for production, where time saving is essential and the main benefit of precision technolo-gies, Table 3. shows that yearly saving is 8.446 EUR. The prospective service life of the machine saves 42.330 EUR in nominal value. This means that the investment will pay off in the 3. year, resulting in net savings of 23.330 EUR. If we convert it to net present value, assuming an alternative interest rate of 10%, the net present value of the investment and an-nual savings is 13.016 EUR.
If the enterprise engages in lease services or offers its free capacities, and it is assumed that the enterprise works dur-ing the whole harvest period, then after harvesting on its own
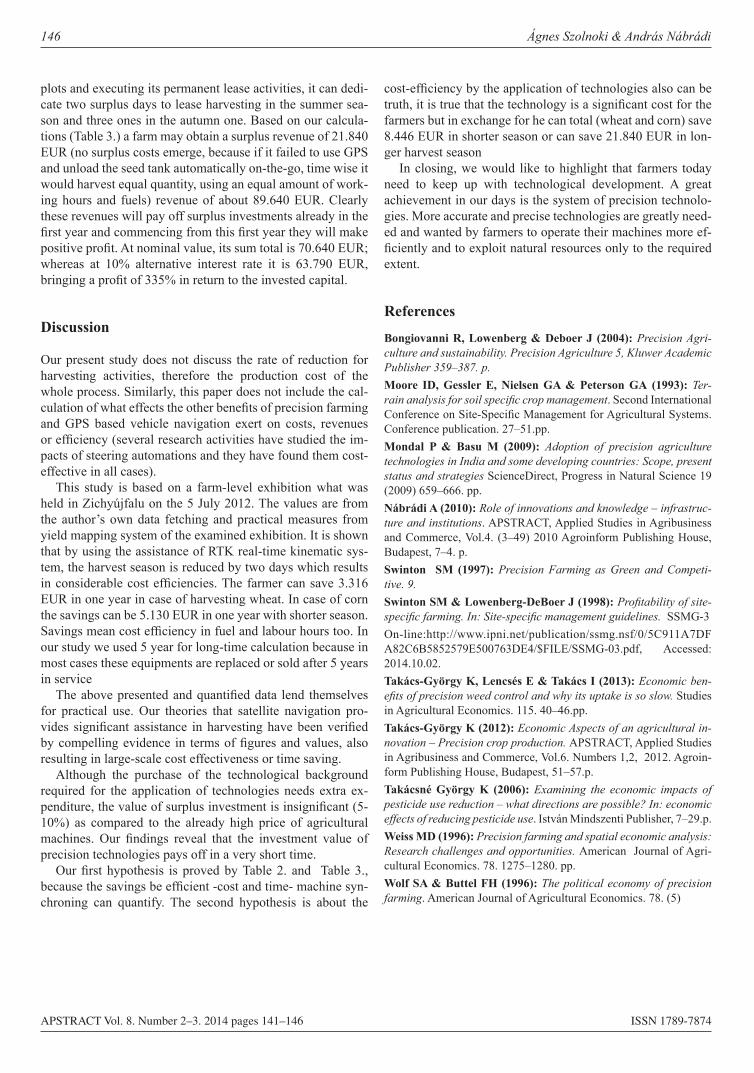
146 Ágnes Szolnoki & András Nábrádi
APSTRACT Vol. 8. Number 2–3. 2014 pages 141–146 ISSN 1789-7874
plots and executing its permanent lease activities, it can dedi-cate two surplus days to lease harvesting in the summer sea-son and three ones in the autumn one. Based on our calcula-tions (Table 3.) a farm may obtain a surplus revenue of 21.840 EUR (no surplus costs emerge, because if it failed to use GPS and unload the seed tank automatically on-the-go, time wise it would harvest equal quantity, using an equal amount of work-ing hours and fuels) revenue of about 89.640 EUR. Clearly these revenues will pay off surplus investments already in the first year and commencing from this first year they will make positive profit. At nominal value, its sum total is 70.640 EUR; whereas at 10% alternative interest rate it is 63.790 EUR, bringing a profit of 335% in return to the invested capital.
Discussion
Our present study does not discuss the rate of reduction for harvesting activities, therefore the production cost of the whole process. Similarly, this paper does not include the cal-culation of what effects the other benefits of precision farming and GPS based vehicle navigation exert on costs, revenues or efficiency (several research activities have studied the im-pacts of steering automations and they have found them cost-effective in all cases).
This study is based on a farm-level exhibition what was held in Zichyújfalu on the 5 July 2012. The values are from the author’s own data fetching and practical measures from yield mapping system of the examined exhibition. It is shown that by using the assistance of RTK real-time kinematic sys-tem, the harvest season is reduced by two days which results in considerable cost efficiencies. The farmer can save 3.316 EUR in one year in case of harvesting wheat. In case of corn the savings can be 5.130 EUR in one year with shorter season. Savings mean cost efficiency in fuel and labour hours too. In our study we used 5 year for long-time calculation because in most cases these equipments are replaced or sold after 5 years in service
The above presented and quantified data lend themselves for practical use. Our theories that satellite navigation pro-vides significant assistance in harvesting have been verified by compelling evidence in terms of figures and values, also resulting in large-scale cost effectiveness or time saving.
Although the purchase of the technological background required for the application of technologies needs extra ex-penditure, the value of surplus investment is insignificant (5-10%) as compared to the already high price of agricultural machines. Our findings reveal that the investment value of precision technologies pays off in a very short time.
Our first hypothesis is proved by Table 2. and Table 3., because the savings be efficient -cost and time- machine syn-chroning can quantify. The second hypothesis is about the
cost-efficiency by the application of technologies also can be truth, it is true that the technology is a significant cost for the farmers but in exchange for he can total (wheat and corn) save 8.446 EUR in shorter season or can save 21.840 EUR in lon-ger harvest season
In closing, we would like to highlight that farmers today need to keep up with technological development. A great achievement in our days is the system of precision technolo-gies. More accurate and precise technologies are greatly need-ed and wanted by farmers to operate their machines more ef-ficiently and to exploit natural resources only to the required extent.
References
Bongiovanni R, Lowenberg & Deboer J (2004): Precision Agri-culture and sustainability. Precision Agriculture 5, Kluwer Academic Publisher 359–387. p.Moore ID, Gessler E, Nielsen GA & Peterson GA (1993): Ter-rain analysis for soil specific crop management. Second International Conference on Site-Specific Management for Agricultural Systems. Conference publication. 27–51.pp.Mondal P & Basu M (2009): Adoption of precision agriculture technologies in India and some developing countries: Scope, present status and strategies ScienceDirect, Progress in Natural Science 19 (2009) 659–666. pp.Nábrádi A (2010): Role of innovations and knowledge – infrastruc-ture and institutions. APSTRACT, Applied Studies in Agribusiness and Commerce, Vol.4. (3–49) 2010 Agroinform Publishing House, Budapest, 7–4. p.Swinton SM (1997): Precision Farming as Green and Competi-tive. 9.Swinton SM & Lowenberg-DeBoer J (1998): Profitability of site-specific farming. In: Site-specific management guidelines. SSMG-3 On-line:http://www.ipni.net/publication/ssmg.nsf/0/5C911A7DFA82C6B5852579E500763DE4/$FILE/SSMG-03.pdf, Accessed: 2014.10.02.Takács-György K, Lencsés E & Takács I (2013): Economic ben-efits of precision weed control and why its uptake is so slow. Studies in Agricultural Economics. 115. 40–46.pp.Takács-György K (2012): Economic Aspects of an agricultural in-novation – Precision crop production. APSTRACT, Applied Studies in Agribusiness and Commerce, Vol.6. Numbers 1,2, 2012. Agroin-form Publishing House, Budapest, 51–57.p.Takácsné György K (2006): Examining the economic impacts of pesticide use reduction – what directions are possible? In: economic effects of reducing pesticide use. István Mindszenti Publisher, 7–29.p.Weiss MD (1996): Precision farming and spatial economic analysis: Research challenges and opportunities. American Journal of Agri-cultural Economics. 78. 1275–1280. pp.Wolf SA & Buttel FH (1996): The political economy of precision farming. American Journal of Agricultural Economics. 78. (5)
APSTRACT Vol. 8. Number 2–3. 2014 pages 147–157 ISSN 1789-7874
Background and research problem
The world milk production shows a continuous rising trend since 1961. In 2005 the world total fresh milk production was 541 million tonnes (FAOSTAT 2010). Since the introduction of milk quotas in 1984 the European Union (EU) production has stagnated around 149 million tonnes (EUROSTAT 2010). The milk quota system was introduced to stop over-produc-tion in Europe.
The biggest milk producer in the world is Europe (37.08%) including the European Union (26.22%). The second largest milk producer is the American continent (North-, Central-, South America and the Caribbean) which represents 28.65% of the total milk production in the world (FAOSTAT 2010). The biggest milk producer in the EU is Germany (18.98%), the second is France (16.13%), and the third is the United Kingdom (9.83%). The Netherlands and Hungary account for 7.31% and 1.22% of total EU production, respectively (FAO-STAT 2010). Currently, dairy farms in a given EU country are expected to be more or less competitive when compared to dairy farms in other countries. A reason for that is the quota system, which does not allow trading between countries, may protect farmers from international competition. Given that the quota system will be abolished in 2015, this will put pressure on less competitive farms in different countries. The issue of optimal use of resources becomes important.
As noted by Bauer et al. (1998), policy makers are par-ticularly interested in the potential impact of their decisions on performance of firms. A firm that is inefficient is wasting inputs because it does not produce the maximum attainable output, given the quantity of inputs used, and hence the possi-bility of reducing average costs. Irrespective of whether a de-veloped or developing economy is under consideration, find-ings from the study of technical efficiency have far-reaching policy implications.
Studying farm efficiency and the potential sources of inef-ficiency are therefore important from a practical and a policy point of view. On the one hand, farmers could use this in-formation to improve their performance. On the other hand, policymakers could use this knowledge to identify and target public interventions to improve farm productivity and farm income (Solís et al. 2009).
This research focuses on estimating and comparing the lev-els of technical efficiency (TE) among Dutch, German and Hungarian dairy farms. The estimation of technical efficiency is carried using Stochastic Frontier Analysis (SFA).
The first objective of the research is to measure dairy farms efficiency in Hungary, Germany and The Netherlands. Based on the results, we can assess the potential of dairy farms in the three countries to survive of the abolishment of the dairy quota system. The research questions of this paper are: What are the differences and the similarities in the Dutch, German and Hungarian dairy sectors? The dairy farms in which coun-
Dairy farms efficiency analysis before the quota system abolishment
Krisztián Kovács
University of Debrecen
Abstract: The abolishment of the dairy quota system in the EU is expected to increase competition across dairy farms in Europe. Assuming a common price for milk in the EU, only the most efficient farms will survive in the new environment. The main objective of the research is to compare dairy farms in Germany, The Netherlands and Hungary about their technical efficiency. In the first part of the research, the efficiency is measured by partial efficiency indexes using one dimensional efficiency measuring. In the second part, the Stochastic Frontier Analysis (SFA) have to be used to measure efficiency in a multidimensional space, using six inputs and two outputs. It appears from the results that the highest efficiency farms are in the Netherlands, and then Germany and Hungary follow thus, we get that the most efficient farms are in the Netherlands with 84% efficient. The German farms are 76% efficient. The Hungarian farms are 68% efficient.With respect the abolishment of the dairy quota system, our results suggest that the Dutch farms are the most efficient, thus probably they will increase their production after the quota system. But because the size of the country we cannot expect dramatic changes in the European Dairy market. The Germans farms efficiency is lower, but their efficiency is also lower, so we won’t expect high increase about the dairy supply. The Hungarian dairy sector is not so efficient like the Dutch, and the size of the sector has also small among the European countries, thus if they want to survive the quota system demolishing, they have to increase their technical efficiency.
Keywords: efficiency, dairy sector, data envelopment analysis (DEA), stochastic frontier analysis (SFA)
Applied Studies in Agribusiness and Commerce – APSTRACTAgroinform Publishing House, Budapest scientific papers
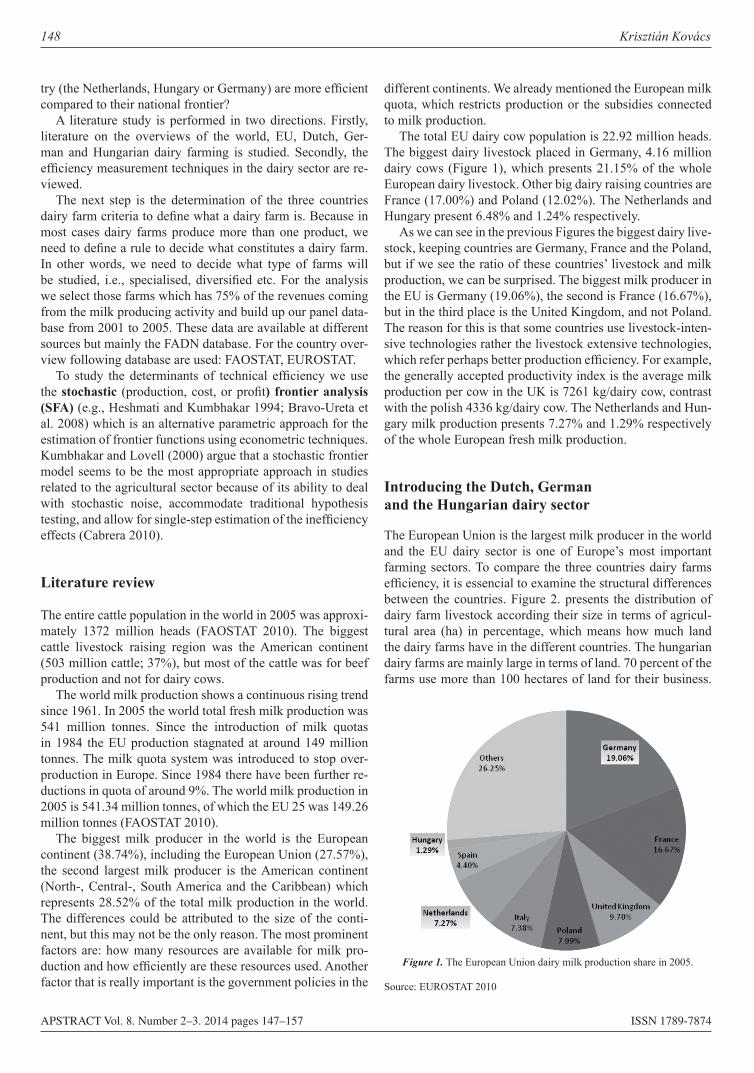
148 Krisztián Kovács
APSTRACT Vol. 8. Number 2–3. 2014 pages 147–157 ISSN 1789-7874
try (the Netherlands, Hungary or Germany) are more efficient compared to their national frontier?
A literature study is performed in two directions. Firstly, literature on the overviews of the world, EU, Dutch, Ger-man and Hungarian dairy farming is studied. Secondly, the efficiency measurement techniques in the dairy sector are re-viewed.
The next step is the determination of the three countries dairy farm criteria to define what a dairy farm is. Because in most cases dairy farms produce more than one product, we need to define a rule to decide what constitutes a dairy farm. In other words, we need to decide what type of farms will be studied, i.e., specialised, diversified etc. For the analysis we select those farms which has 75% of the revenues coming from the milk producing activity and build up our panel data-base from 2001 to 2005. These data are available at different sources but mainly the FADN database. For the country over-view following database are used: FAOSTAT, EUROSTAT.
To study the determinants of technical efficiency we use the stochastic (production, cost, or profit) frontier analysis (SFA) (e.g., Heshmati and Kumbhakar 1994; Bravo-Ureta et al. 2008) which is an alternative parametric approach for the estimation of frontier functions using econometric techniques. Kumbhakar and Lovell (2000) argue that a stochastic frontier model seems to be the most appropriate approach in studies related to the agricultural sector because of its ability to deal with stochastic noise, accommodate traditional hypothesis testing, and allow for single-step estimation of the inefficiency effects (Cabrera 2010).
Literature review
The entire cattle population in the world in 2005 was approxi-mately 1372 million heads (FAOSTAT 2010). The biggest cattle livestock raising region was the American continent (503 million cattle; 37%), but most of the cattle was for beef production and not for dairy cows.
The world milk production shows a continuous rising trend since 1961. In 2005 the world total fresh milk production was 541 million tonnes. Since the introduction of milk quotas in 1984 the EU production stagnated at around 149 million tonnes. The milk quota system was introduced to stop over-production in Europe. Since 1984 there have been further re-ductions in quota of around 9%. The world milk production in 2005 is 541.34 million tonnes, of which the EU 25 was 149.26 million tonnes (FAOSTAT 2010).
The biggest milk producer in the world is the European continent (38.74%), including the European Union (27.57%), the second largest milk producer is the American continent (North-, Central-, South America and the Caribbean) which represents 28.52% of the total milk production in the world. The differences could be attributed to the size of the conti-nent, but this may not be the only reason. The most prominent factors are: how many resources are available for milk pro-duction and how efficiently are these resources used. Another factor that is really important is the government policies in the
different continents. We already mentioned the European milk quota, which restricts production or the subsidies connected to milk production.
The total EU dairy cow population is 22.92 million heads. The biggest dairy livestock placed in Germany, 4.16 million dairy cows (Figure 1), which presents 21.15% of the whole European dairy livestock. Other big dairy raising countries are France (17.00%) and Poland (12.02%). The Netherlands and Hungary present 6.48% and 1.24% respectively.
As we can see in the previous Figures the biggest dairy live-stock, keeping countries are Germany, France and the Poland, but if we see the ratio of these countries’ livestock and milk production, we can be surprised. The biggest milk producer in the EU is Germany (19.06%), the second is France (16.67%), but in the third place is the United Kingdom, and not Poland. The reason for this is that some countries use livestock-inten-sive technologies rather the livestock extensive technologies, which refer perhaps better production efficiency. For example, the generally accepted productivity index is the average milk production per cow in the UK is 7261 kg/dairy cow, contrast with the polish 4336 kg/dairy cow. The Netherlands and Hun-gary milk production presents 7.27% and 1.29% respectively of the whole European fresh milk production.
Introducing the Dutch, German and the Hungarian dairy sector
The European Union is the largest milk producer in the world and the EU dairy sector is one of Europe’s most important farming sectors. To compare the three countries dairy farms efficiency, it is essencial to examine the structural differences between the countries. Figure 2. presents the distribution of dairy farm livestock according their size in terms of agricul-tural area (ha) in percentage, which means how much land the dairy farms have in the different countries. The hungarian dairy farms are mainly large in terms of land. 70 percent of the farms use more than 100 hectares of land for their business.
Figure 1. The European Union dairy milk production share in 2005.
Source: EUROSTAT 2010
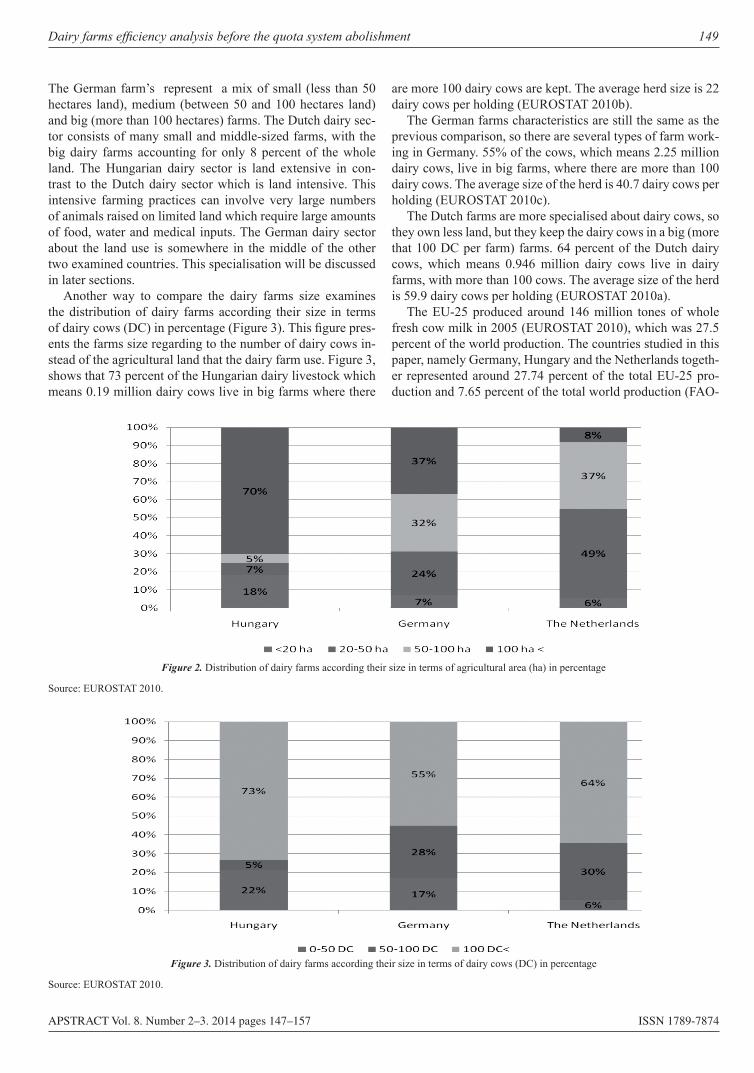
Dairy farms efficiency analysis before the quota system abolishment 149
APSTRACT Vol. 8. Number 2–3. 2014 pages 147–157 ISSN 1789-7874
The German farm’s represent a mix of small (less than 50 hectares land), medium (between 50 and 100 hectares land) and big (more than 100 hectares) farms. The Dutch dairy sec-tor consists of many small and middle-sized farms, with the big dairy farms accounting for only 8 percent of the whole land. The Hungarian dairy sector is land extensive in con-trast to the Dutch dairy sector which is land intensive. This intensive farming practices can involve very large numbers of animals raised on limited land which require large amounts of food, water and medical inputs. The German dairy sector about the land use is somewhere in the middle of the other two examined countries. This specialisation will be discussed in later sections.
Another way to compare the dairy farms size examines the distribution of dairy farms according their size in terms of dairy cows (DC) in percentage (Figure 3). This figure pres-ents the farms size regarding to the number of dairy cows in-stead of the agricultural land that the dairy farm use. Figure 3, shows that 73 percent of the Hungarian dairy livestock which means 0.19 million dairy cows live in big farms where there
are more 100 dairy cows are kept. The average herd size is 22 dairy cows per holding (EUROSTAT 2010b).
The German farms characteristics are still the same as the previous comparison, so there are several types of farm work-ing in Germany. 55% of the cows, which means 2.25 million dairy cows, live in big farms, where there are more than 100 dairy cows. The average size of the herd is 40.7 dairy cows per holding (EUROSTAT 2010c).
The Dutch farms are more specialised about dairy cows, so they own less land, but they keep the dairy cows in a big (more that 100 DC per farm) farms. 64 percent of the Dutch dairy cows, which means 0.946 million dairy cows live in dairy farms, with more than 100 cows. The average size of the herd is 59.9 dairy cows per holding (EUROSTAT 2010a).
The EU-25 produced around 146 million tones of whole fresh cow milk in 2005 (EUROSTAT 2010), which was 27.5 percent of the world production. The countries studied in this paper, namely Germany, Hungary and the Netherlands togeth-er represented around 27.74 percent of the total EU-25 pro-duction and 7.65 percent of the total world production (FAO-
Figure 3. Distribution of dairy farms according their size in terms of dairy cows (DC) in percentage
Source: EUROSTAT 2010.
Figure 2. Distribution of dairy farms according their size in terms of agricultural area (ha) in percentage
Source: EUROSTAT 2010.

150 Krisztián Kovács
APSTRACT Vol. 8. Number 2–3. 2014 pages 147–157 ISSN 1789-7874
STAT 2010). According to Figure 4, which represents the milk production in the examined countries over the period of 2001 to 2005, the three countries milk production was relatively stable, as was the EU-25 production in this period. Among the three countries Germany is the largest milk-producing coun-try with 28.49 million tonnes. The Netherlands and Hungary produced 10.98 million and 1.94 million tonnes respectively.
The milk production was stable, but a small reduction was observed on the number of dairy cows (Figure 5) during the examined period. The country with the biggest cow popula-tion was Germany (4164 million heads in 2005) and the re-duction was approximately 7 percent from 2001 to 2005. The Dutch dairy cows’ number was 1486 million heads in 2005, which was quiet stable during the examined period. However a 4.2 percentage decrease occurred from 2001 to 2005. The Hungarian dairy cows’ number was 285 thousand heads in 2005, which decreased 17.4 percent from 2001. Hence this was the highest decrease among the three countries.
An interesting observation is that during the examined pe-riod the number of cows decreased in all chosen countries, but the milk production was quite stable. This was caused by the increasing performance of the cows. The average milk production per year per cow (Table 1) is the highest in The Netherlands (7615 kg); and lower in Germany (6984 kg) and Hungary (6850 kg).
The milk production per operating cost indicator calcu-lated by the average milk production per farm divided by the livestock-specific operating cost (feeding cost, herd renewal purchases, milk levy and other specific costs) and the non-specific cost (machinery and building upkeep, energy cost, contract work, taxes and other dues, other direct inputs cost). This indicator represents the partial operating technical pro-ductivity, which is the highest in the Netherlands and lowest in Germany.
The next indicator is the milk production per total labour index, which shows the labour productivity among the three countries. This indicator is also the highest in the Netherlands, but the lowest in Hungary. About the labour use Hungary is use their labour extensively; on the other hand the Netherlands and Germany use intensively (Table 1).
The milk production per forage area index presents the land intensity of the dairy farms, which is the highest in the Netherlands and lower in Germany and Hungary. The Hun-garian result is really low, 46% of the Dutch index, which shows that the Netherlands use extremely high land intensive technology.
The milk production per total input index shows the milk production related with the input costs (operating cost and fixed cost), where the highest result came from Hungary and the lowest from Germany. That index presents the ratio of the
Figure 4. Milk production in the examined countries from 2001 to 2005
Source: EUROSTAT 2010.
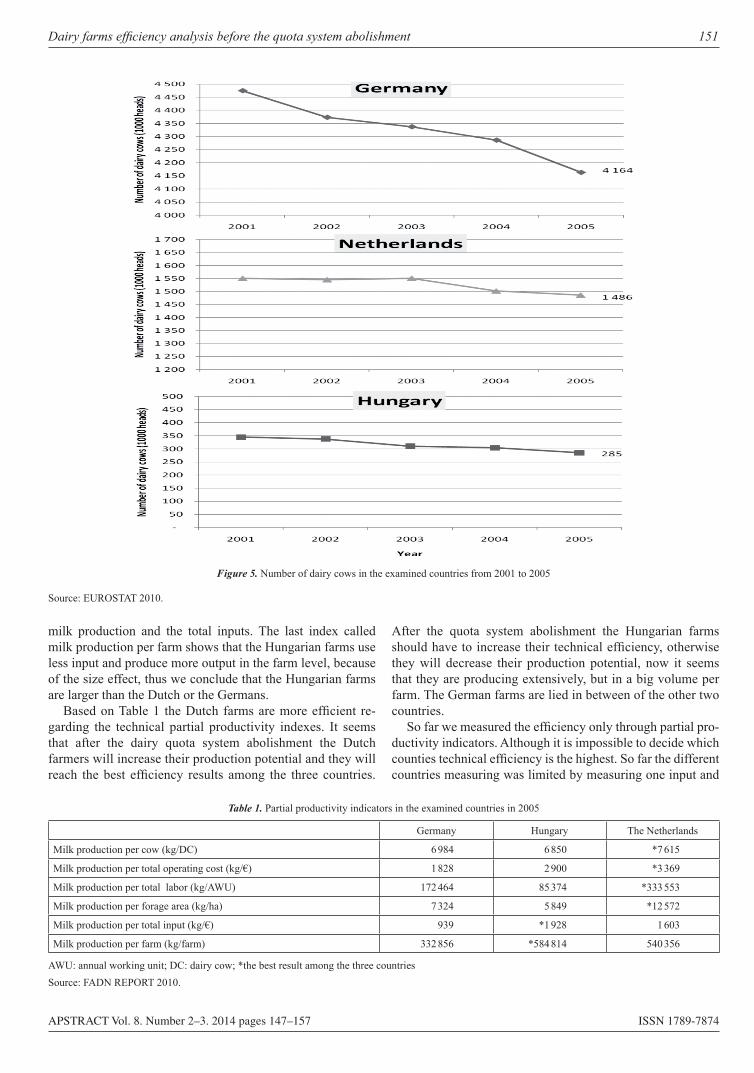
Dairy farms efficiency analysis before the quota system abolishment 151
APSTRACT Vol. 8. Number 2–3. 2014 pages 147–157 ISSN 1789-7874
milk production and the total inputs. The last index called milk production per farm shows that the Hungarian farms use less input and produce more output in the farm level, because of the size effect, thus we conclude that the Hungarian farms are larger than the Dutch or the Germans.
Based on Table 1 the Dutch farms are more efficient re-garding the technical partial productivity indexes. It seems that after the dairy quota system abolishment the Dutch farmers will increase their production potential and they will reach the best efficiency results among the three countries.
After the quota system abolishment the Hungarian farms should have to increase their technical efficiency, otherwise they will decrease their production potential, now it seems that they are producing extensively, but in a big volume per farm. The German farms are lied in between of the other two countries.
So far we measured the efficiency only through partial pro-ductivity indicators. Although it is impossible to decide which counties technical efficiency is the highest. So far the different countries measuring was limited by measuring one input and
Figure 5. Number of dairy cows in the examined countries from 2001 to 2005
Source: EUROSTAT 2010.
Table 1. Partial productivity indicators in the examined countries in 2005
Germany Hungary The Netherlands
Milk production per cow (kg/DC) 6 984 6 850 *7 615
Milk production per total operating cost (kg/€) 1 828 2 900 *3 369
Milk production per total labor (kg/AWU) 172 464 85 374 *333 553
Milk production per forage area (kg/ha) 7 324 5 849 *12 572
Milk production per total input (kg/€) 939 *1 928 1 603
Milk production per farm (kg/farm) 332 856 *584 814 540 356
AWU: annual working unit; DC: dairy cow; *the best result among the three countriesSource: FADN REPORT 2010.
152 Krisztián Kovács
APSTRACT Vol. 8. Number 2–3. 2014 pages 147–157 ISSN 1789-7874
one output performance of the farms. Thus the measuring of the inputs and the outputs was separately, during the following chapters the efficiency performance measuring regard with re-spect to all inputs and all output as many authors called (Farrel 1957; Begum el. al. 2009; Coelli et. all 2005.; Tauer 1998; Jaforullah and Whiteman 1999; Stokes et al. 2007; Kumbha-kar and Lovell 2000; Emvalomatis, 2010) in the literature the “multiple input and output measurement”.
1. Measuring efficiency
Measuring the productive efficiency of the dairy sector is im-portant to both the practical experts and the economic policy makers. “If economic planning is to concern itself with practi-cal industries, it is important to know how far a given industry can be expected to increase its output by simply increasing its efficiency, without absorbing further resources.” (Farrel 1957)
Measuring efficiency is a widely used concept in econom-ics. Economic (or overall) efficiency expressed as a combina-tion of technical and allocative (or price) efficiencies. Techni-cal efficiency is the ability of the farmer to obtain maximal output from a given set of inputs while allocative efficiency measures the ability of the farmer to use inputs in optimal pro-portions, given their input prices and technology (Begum el. al. 2009; Coelli et. all 2005). There have been several methods to measuring efficiency; the generally used methods are data envelopment analysis (DEA) and stochastic frontier analysis (SFA), which involve mathematical programming and econo-metric methods, respectively.
Farell (1957) distinguishes input and output orientated measures depending on which factor we assume altering. So in the input orientated measure the input quantities changing without changing the output quantities. The assumed objec-tive is to reduce the input quantities as much as possible, with-out changing the output quantities.
2. Materials and methods
This chapter firstly introduces the FADN database which has been used for this article. It includes yearly data from 2001 to 2005 for different dairy farms in Germany, the Netherlands and from 2001 to 2008 for Hungary.
In this research we use a database from the European Farm Accountancy Data Network (FADN). The concept of the FADN was launched in 1965, when Council Regulation 79/65 established the legal basis for the organisation of the network. It consists of an annual survey carried out by the Member States of the European Union (EU). The agencies responsible in the Union for the operation of the FADN col-lect every year accountancy data from a sample of the agricul-tural holdings in the European Union. Derived from national surveys, the FADN is the only source of micro-economic data that is harmonised; because the bookkeeping principles are the same in all countries. Holdings are selected to take part
in the survey on the basis of sampling plans established at the level of each region in the EU. The survey does not cover all the agricultural holdings in the EU, but only those which due to their size could be considered commercial. The meth-odology applied aims to provide representative data along three dimensions: region, economic size and type of farming (FADN 2010a).
Currently, the annual sample covers approximately 80.000 holdings. They represent a population of about 5.000.000 farms in the 25 Member States, which cover approximately 90% of the total utilized agricultural area (UAA) and account for about 90% of the total agricultural production of the EU. It is expected that for the EU-27, that is including Bulgaria and Romania, the FADN would represent about 6.400.000 farms. The information collected, for each sample farm, concerns ap-proximately 1000 variables (FADN 2010b).
To ensure that this sample reflects the heterogeneity of farming before the sample of farms, Liaison Agencies stratify the field of observation is defined according to 3 criteria: re-gion, economic size and type of farming. Farms are selected in the sample according to a selection plan that guarantees its representativity. An individual weight is applied to each farm in the sample, this corresponding to the number of farms in the 3-way stratification cell of the field of observations divided by the number of farms in the corresponding cell in the sample. This weighting system is used in the calculation of standard results. The database contains farm level data, where the input and output data express with monetary units (€). The dataset organised by yearly for every farm, so this makes the panel dataset (FADN 2010c).
In this research we selected the dairy farms from Germany, Hungary and the Netherlands from 2001 to 2005. We focussed mainly on those dairy farms, whose revenues from cow’s milk production are at least 75% of their total revenues for every year.
We use two outputs in our model, the revenues from cow’s milk production and the revenues from other outputs. This other output revenues includes revenues from beef and veal and other output production that a dairy farm can produce. For the better estimation to account for the dependence of rev-enues on inflation, the output revenues and the input costs are deflated with country-wide price indices for each category of products, with prices obtained from EUROSTAT.
The analysis uses six deflated (base year is 2000) inputs categories, which cover the whole input side of the dairy busi-ness. These categories are the following:1. Capital (K) consists of the buildings and fixed equipment
like: tractors, lorries, milking machines, cleaning machines, feeding automats.
2. Labour (L) is measured in working hours and includes both family and hired labours.
3. Land (A) is measured in hectares, and includes the total utilized agricultural area (UAA) of the holding. Does not include areas used for woodland, roads, non-farmed areas.
4. Total material inputs (M) includes all deflated farm specific costs, that arise in the dairy business like: seeds and plants, fertilizers, crop protection, crop and livestock-specific cost
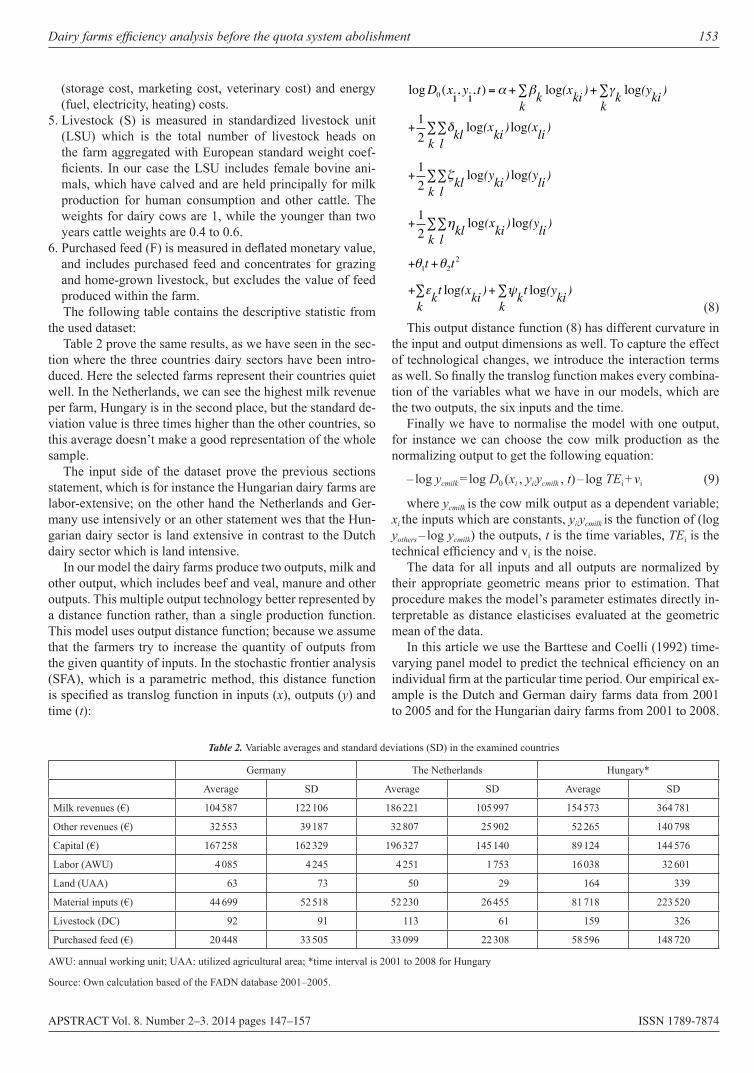
Dairy farms efficiency analysis before the quota system abolishment 153
APSTRACT Vol. 8. Number 2–3. 2014 pages 147–157 ISSN 1789-7874
(storage cost, marketing cost, veterinary cost) and energy (fuel, electricity, heating) costs.
5. Livestock (S) is measured in standardized livestock unit (LSU) which is the total number of livestock heads on the farm aggregated with European standard weight coef-ficients. In our case the LSU includes female bovine ani-mals, which have calved and are held principally for milk production for human consumption and other cattle. The weights for dairy cows are 1, while the younger than two years cattle weights are 0.4 to 0.6.
6. Purchased feed (F) is measured in deflated monetary value, and includes purchased feed and concentrates for grazing and home-grown livestock, but excludes the value of feed produced within the farm.The following table contains the descriptive statistic from
the used dataset:Table 2 prove the same results, as we have seen in the sec-
tion where the three countries dairy sectors have been intro-duced. Here the selected farms represent their countries quiet well. In the Netherlands, we can see the highest milk revenue per farm, Hungary is in the second place, but the standard de-viation value is three times higher than the other countries, so this average doesn’t make a good representation of the whole sample.
The input side of the dataset prove the previous sections statement, which is for instance the Hungarian dairy farms are labor-extensive; on the other hand the Netherlands and Ger-many use intensively or an other statement wes that the Hun-garian dairy sector is land extensive in contrast to the Dutch dairy sector which is land intensive.
In our model the dairy farms produce two outputs, milk and other output, which includes beef and veal, manure and other outputs. This multiple output technology better represented by a distance function rather, than a single production function. This model uses output distance function; because we assume that the farmers try to increase the quantity of outputs from the given quantity of inputs. In the stochastic frontier analysis (SFA), which is a parametric method, this distance function is specified as translog function in inputs (x), outputs (y) and time (t):
�l�o�g�D�0 �(�x�i�, �y�i�, �t�) = + �k�k
�l�o�g�(�x�k�i �)+ �k�k
�l�o�g�(�y�k�i �)
+�1�2 �k�l
�l�k�l�o�g�(�x�k�i �) �l�o�g�(�x�l�i �)
+�1�2 �k�l
�l�k�l�o�g�(�y�k�i �) �l�o�g�(�y�l�i �)
+�1�2 �k�l
�l�k�l�o�g�(�x�k�i �) �l�o�g�(�y�l�i �)
+ �1�t + �2�t�2
+ �k�k
�t �l�o�g�(�x�k�i �)+ �k�k
�t �l�o�g�(�y�k�i �) (8)
This output distance function (8) has different curvature in the input and output dimensions as well. To capture the effect of technological changes, we introduce the interaction terms as well. So finally the translog function makes every combina-tion of the variables what we have in our models, which are the two outputs, the six inputs and the time.
Finally we have to normalise the model with one output, for instance we can choose the cow milk production as the normalizing output to get the following equation:
– log ycmilk = log D0 (xi , yi/ycmilk , t) – log TEi + vi (9)
where ycmilk is the cow milk output as a dependent variable; xi the inputs which are constants, yi/ycmilk is the function of (log yothers – log ycmilk) the outputs, t is the time variables, TEi is the technical efficiency and vi is the noise.
The data for all inputs and all outputs are normalized by their appropriate geometric means prior to estimation. That procedure makes the model’s parameter estimates directly in-terpretable as distance elasticises evaluated at the geometric mean of the data.
In this article we use the Barttese and Coelli (1992) time-varying panel model to predict the technical efficiency on an individual firm at the particular time period. Our empirical ex-ample is the Dutch and German dairy farms data from 2001 to 2005 and for the Hungarian dairy farms from 2001 to 2008.
Table 2. Variable averages and standard deviations (SD) in the examined countries
Germany The Netherlands Hungary*
Average SD Average SD Average SD
Milk revenues (€) 104 587 122 106 186 221 105 997 154 573 364 781
Other revenues (€) 32 553 39 187 32 807 25 902 52 265 140 798
Capital (€) 167 258 162 329 196 327 145 140 89 124 144 576
Labor (AWU) 4 085 4 245 4 251 1 753 16 038 32 601
Land (UAA) 63 73 50 29 164 339
Material inputs (€) 44 699 52 518 52 230 26 455 81 718 223 520
Livestock (DC) 92 91 113 61 159 326
Purchased feed (€) 20 448 33 505 33 099 22 308 58 596 148 720
AWU: annual working unit; UAA: utilized agricultural area; *time interval is 2001 to 2008 for Hungary
Source: Own calculation based of the FADN database 2001–2005.
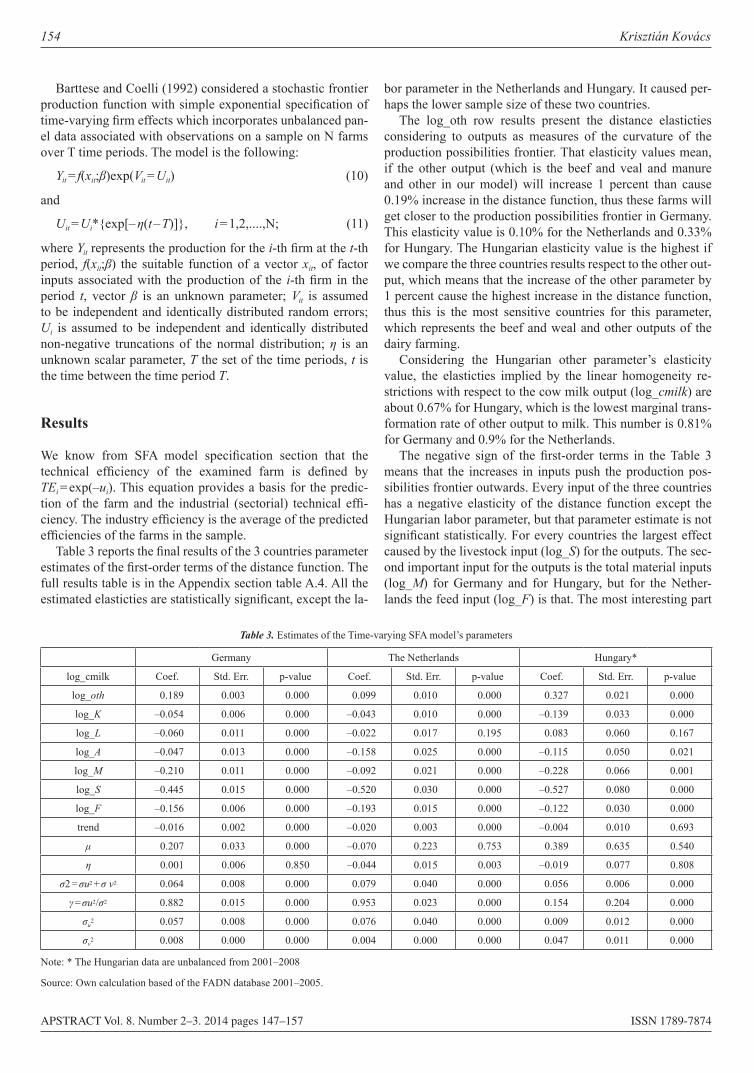
154 Krisztián Kovács
APSTRACT Vol. 8. Number 2–3. 2014 pages 147–157 ISSN 1789-7874
Barttese and Coelli (1992) considered a stochastic frontier production function with simple exponential specification of time-varying firm effects which incorporates unbalanced pan-el data associated with observations on a sample on N farms over T time periods. The model is the following:
Yit = f(xit;β)exp(Vit = Uit) (10)
and
Uit = Ui*{exp[– η(t – T)]}, i = 1,2,....,N; (11)
where Yit represents the production for the i-th firm at the t-th period, f(xit;β) the suitable function of a vector xit, of factor inputs associated with the production of the i-th firm in the period t, vector β is an unknown parameter; Vit is assumed to be independent and identically distributed random errors; Ui is assumed to be independent and identically distributed non-negative truncations of the normal distribution; η is an unknown scalar parameter, T the set of the time periods, t is the time between the time period T.
Results
We know from SFA model specification section that the technical efficiency of the examined farm is defined by TEi = exp(–ui). This equation provides a basis for the predic-tion of the farm and the industrial (sectorial) technical effi-ciency. The industry efficiency is the average of the predicted efficiencies of the farms in the sample.
Table 3 reports the final results of the 3 countries parameter estimates of the first-order terms of the distance function. The full results table is in the Appendix section table A.4. All the estimated elasticties are statistically significant, except the la-
bor parameter in the Netherlands and Hungary. It caused per-haps the lower sample size of these two countries.
The log_oth row results present the distance elasticties considering to outputs as measures of the curvature of the production possibilities frontier. That elasticity values mean, if the other output (which is the beef and veal and manure and other in our model) will increase 1 percent than cause 0.19% increase in the distance function, thus these farms will get closer to the production possibilities frontier in Germany. This elasticity value is 0.10% for the Netherlands and 0.33% for Hungary. The Hungarian elasticity value is the highest if we compare the three countries results respect to the other out-put, which means that the increase of the other parameter by 1 percent cause the highest increase in the distance function, thus this is the most sensitive countries for this parameter, which represents the beef and weal and other outputs of the dairy farming.
Considering the Hungarian other parameter’s elasticity value, the elasticties implied by the linear homogeneity re-strictions with respect to the cow milk output (log_cmilk) are about 0.67% for Hungary, which is the lowest marginal trans-formation rate of other output to milk. This number is 0.81% for Germany and 0.9% for the Netherlands.
The negative sign of the first-order terms in the Table 3 means that the increases in inputs push the production pos-sibilities frontier outwards. Every input of the three countries has a negative elasticity of the distance function except the Hungarian labor parameter, but that parameter estimate is not significant statistically. For every countries the largest effect caused by the livestock input (log_S) for the outputs. The sec-ond important input for the outputs is the total material inputs (log_M) for Germany and for Hungary, but for the Nether-lands the feed input (log_F) is that. The most interesting part
Table 3. Estimates of the Time-varying SFA model’s parameters
Germany The Netherlands Hungary*
log_cmilk Coef. Std. Err. p-value Coef. Std. Err. p-value Coef. Std. Err. p-value
log_oth 0.189 0.003 0.000 0.099 0.010 0.000 0.327 0.021 0.000
log_K –0.054 0.006 0.000 –0.043 0.010 0.000 –0.139 0.033 0.000
log_L –0.060 0.011 0.000 –0.022 0.017 0.195 0.083 0.060 0.167
log_A –0.047 0.013 0.000 –0.158 0.025 0.000 –0.115 0.050 0.021
log_M –0.210 0.011 0.000 –0.092 0.021 0.000 –0.228 0.066 0.001
log_S –0.445 0.015 0.000 –0.520 0.030 0.000 –0.527 0.080 0.000
log_F –0.156 0.006 0.000 –0.193 0.015 0.000 –0.122 0.030 0.000
trend –0.016 0.002 0.000 –0.020 0.003 0.000 –0.004 0.010 0.693
μ 0.207 0.033 0.000 –0.070 0.223 0.753 0.389 0.635 0.540
η 0.001 0.006 0.850 –0.044 0.015 0.003 –0.019 0.077 0.808
σ2 = σu2 + σ v2 0.064 0.008 0.000 0.079 0.040 0.000 0.056 0.006 0.000
γ = σu2/σ2 0.882 0.015 0.000 0.953 0.023 0.000 0.154 0.204 0.000
σu2 0.057 0.008 0.000 0.076 0.040 0.000 0.009 0.012 0.000
σv2 0.008 0.000 0.000 0.004 0.000 0.000 0.047 0.011 0.000
Note: * The Hungarian data are unbalanced from 2001–2008
Source: Own calculation based of the FADN database 2001–2005.
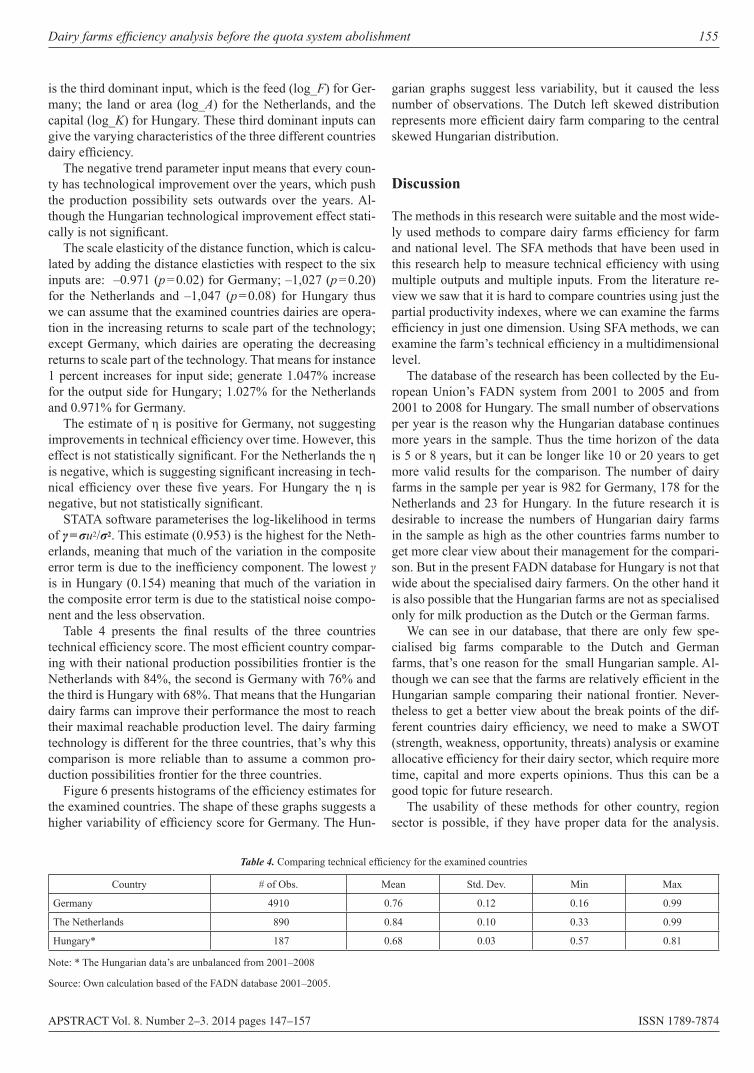
Dairy farms efficiency analysis before the quota system abolishment 155
APSTRACT Vol. 8. Number 2–3. 2014 pages 147–157 ISSN 1789-7874
is the third dominant input, which is the feed (log_F) for Ger-many; the land or area (log_A) for the Netherlands, and the capital (log_K) for Hungary. These third dominant inputs can give the varying characteristics of the three different countries dairy efficiency.
The negative trend parameter input means that every coun-ty has technological improvement over the years, which push the production possibility sets outwards over the years. Al-though the Hungarian technological improvement effect stati-cally is not significant.
The scale elasticity of the distance function, which is calcu-lated by adding the distance elasticties with respect to the six inputs are: –0.971 (p = 0.02) for Germany; –1,027 (p = 0.20) for the Netherlands and –1,047 (p = 0.08) for Hungary thus we can assume that the examined countries dairies are opera-tion in the increasing returns to scale part of the technology; except Germany, which dairies are operating the decreasing returns to scale part of the technology. That means for instance 1 percent increases for input side; generate 1.047% increase for the output side for Hungary; 1.027% for the Netherlands and 0.971% for Germany.
The estimate of η is positive for Germany, not suggesting improvements in technical efficiency over time. However, this effect is not statistically significant. For the Netherlands the η is negative, which is suggesting significant increasing in tech-nical efficiency over these five years. For Hungary the η is negative, but not statistically significant.
STATA software parameterises the log-likelihood in terms of γ = σu2/σ2. This estimate (0.953) is the highest for the Neth-erlands, meaning that much of the variation in the composite error term is due to the inefficiency component. The lowest γ is in Hungary (0.154) meaning that much of the variation in the composite error term is due to the statistical noise compo-nent and the less observation.
Table 4 presents the final results of the three countries technical efficiency score. The most efficient country compar-ing with their national production possibilities frontier is the Netherlands with 84%, the second is Germany with 76% and the third is Hungary with 68%. That means that the Hungarian dairy farms can improve their performance the most to reach their maximal reachable production level. The dairy farming technology is different for the three countries, that’s why this comparison is more reliable than to assume a common pro-duction possibilities frontier for the three countries.
Figure 6 presents histograms of the efficiency estimates for the examined countries. The shape of these graphs suggests a higher variability of efficiency score for Germany. The Hun-
garian graphs suggest less variability, but it caused the less number of observations. The Dutch left skewed distribution represents more efficient dairy farm comparing to the central skewed Hungarian distribution.
Discussion
The methods in this research were suitable and the most wide-ly used methods to compare dairy farms efficiency for farm and national level. The SFA methods that have been used in this research help to measure technical efficiency with using multiple outputs and multiple inputs. From the literature re-view we saw that it is hard to compare countries using just the partial productivity indexes, where we can examine the farms efficiency in just one dimension. Using SFA methods, we can examine the farm’s technical efficiency in a multidimensional level.
The database of the research has been collected by the Eu-ropean Union’s FADN system from 2001 to 2005 and from 2001 to 2008 for Hungary. The small number of observations per year is the reason why the Hungarian database continues more years in the sample. Thus the time horizon of the data is 5 or 8 years, but it can be longer like 10 or 20 years to get more valid results for the comparison. The number of dairy farms in the sample per year is 982 for Germany, 178 for the Netherlands and 23 for Hungary. In the future research it is desirable to increase the numbers of Hungarian dairy farms in the sample as high as the other countries farms number to get more clear view about their management for the compari-son. But in the present FADN database for Hungary is not that wide about the specialised dairy farmers. On the other hand it is also possible that the Hungarian farms are not as specialised only for milk production as the Dutch or the German farms.
We can see in our database, that there are only few spe-cialised big farms comparable to the Dutch and German farms, that’s one reason for the small Hungarian sample. Al-though we can see that the farms are relatively efficient in the Hungarian sample comparing their national frontier. Never-theless to get a better view about the break points of the dif-ferent countries dairy efficiency, we need to make a SWOT (strength, weakness, opportunity, threats) analysis or examine allocative efficiency for their dairy sector, which require more time, capital and more experts opinions. Thus this can be a good topic for future research.
The usability of these methods for other country, region sector is possible, if they have proper data for the analysis.
Table 4. Comparing technical efficiency for the examined countries
Country # of Obs. Mean Std. Dev. Min Max
Germany 4910 0.76 0.12 0.16 0.99
The Netherlands 890 0.84 0.10 0.33 0.99
Hungary* 187 0.68 0.03 0.57 0.81
Note: * The Hungarian data’s are unbalanced from 2001–2008
Source: Own calculation based of the FADN database 2001–2005.
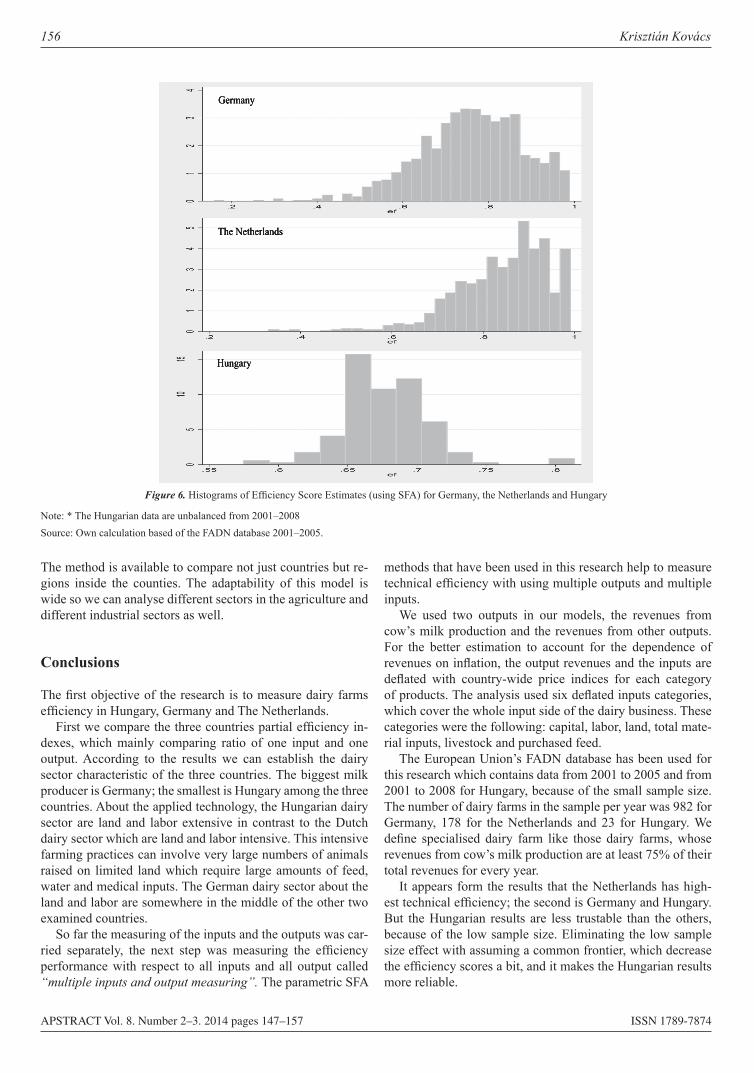
156 Krisztián Kovács
APSTRACT Vol. 8. Number 2–3. 2014 pages 147–157 ISSN 1789-7874
The method is available to compare not just countries but re-gions inside the counties. The adaptability of this model is wide so we can analyse different sectors in the agriculture and different industrial sectors as well.
Conclusions
The first objective of the research is to measure dairy farms efficiency in Hungary, Germany and The Netherlands.
First we compare the three countries partial efficiency in-dexes, which mainly comparing ratio of one input and one output. According to the results we can establish the dairy sector characteristic of the three countries. The biggest milk producer is Germany; the smallest is Hungary among the three countries. About the applied technology, the Hungarian dairy sector are land and labor extensive in contrast to the Dutch dairy sector which are land and labor intensive. This intensive farming practices can involve very large numbers of animals raised on limited land which require large amounts of feed, water and medical inputs. The German dairy sector about the land and labor are somewhere in the middle of the other two examined countries.
So far the measuring of the inputs and the outputs was car-ried separately, the next step was measuring the efficiency performance with respect to all inputs and all output called “multiple inputs and output measuring”. The parametric SFA
methods that have been used in this research help to measure technical efficiency with using multiple outputs and multiple inputs.
We used two outputs in our models, the revenues from cow’s milk production and the revenues from other outputs. For the better estimation to account for the dependence of revenues on inflation, the output revenues and the inputs are deflated with country-wide price indices for each category of products. The analysis used six deflated inputs categories, which cover the whole input side of the dairy business. These categories were the following: capital, labor, land, total mate-rial inputs, livestock and purchased feed.
The European Union’s FADN database has been used for this research which contains data from 2001 to 2005 and from 2001 to 2008 for Hungary, because of the small sample size. The number of dairy farms in the sample per year was 982 for Germany, 178 for the Netherlands and 23 for Hungary. We define specialised dairy farm like those dairy farms, whose revenues from cow’s milk production are at least 75% of their total revenues for every year.
It appears form the results that the Netherlands has high-est technical efficiency; the second is Germany and Hungary. But the Hungarian results are less trustable than the others, because of the low sample size. Eliminating the low sample size effect with assuming a common frontier, which decrease the efficiency scores a bit, and it makes the Hungarian results more reliable.
Figure 6. Histograms of Efficiency Score Estimates (using SFA) for Germany, the Netherlands and Hungary
Note: * The Hungarian data are unbalanced from 2001–2008Source: Own calculation based of the FADN database 2001–2005.
Germany
The Netherlands
Hungary
Dairy farms efficiency analysis before the quota system abolishment 157
APSTRACT Vol. 8. Number 2–3. 2014 pages 147–157 ISSN 1789-7874
We can assume that if the quota system abolished and as-suming a common price for milk in EU, only the efficient farms will survive the higher competition among the coun-tries. In our case the Dutch farms are the most efficient, thus probably they will increase their production after the quota system. But because the size of the country we cannot expect dramatic changes in the European Dairy market. The Germans farms efficiency is lower, although their dairy sector size is bigger than the other two countries, so we won’t expect high increase about the dairy supply. The Hungarian dairy sector is not as efficient as the Dutch, and the size of the sector is also small among the European countries, thus if they want to survive the quota system demolishing, they have to increase their efficiency.
References
Battese GE & Coelli TJ (1992): Frontier production functions, tech-nical efficiency and panel data: With application to paddy farmers in India. Journal of Productivity Analysis, 3(1–2):153–169.Bauer PW, Berger AN, Ferrier, GD & Humphrey DB (1998): Consistency conditions for regulatory analysis of financial institu-tions: a comparison of frontier efficiency models. Journal of Eco-nomics and Business 50: 85–114.Begum IA, Buysse J, Alam MJ & Huylenbroeck GV (2009): An application of Data Envelopment Analysis (DEA) to Evaluate Eco-nomic Efficiency of Poultry Farms in Bangladesh; presentation at the International Association of Agricultural Economists Conference, Beijing, China, August 16–22, 2009Bravo-Ureta BE, Moreira VH, Arzubi AA, Schilder ED, Alva-rez J & Molina C (2008): Technological change and technical ef-ficiency for dairy farms in three countries of South America. Chilean Journal of Agricultural Research 68: 360–367.Cabrera VE, Solís D & J del Corral (2010): “Determinants of tech-nical efficiency among dairy farms in Wisconsin” Journal of Dairy Science 93: 387–393
Coelli T, Rao DSP, O’Donell CJ & Battese GE (2005): An intro-duction to efficiencyEmvalomatis G (2010): Distance Functions, Inside document for the Business Economics Group, Wageningen University, Wagenin-gen, The NetherlandsEUROSTAT 2010. http://epp.eurostat.ec.europa.eu/portal/page/por-tal/agriculture/data/databaseEUROSTAT 2010a. http://epp.eurostat.ec.europa.eu/cache/ITY_OFFPUB/KS-SF-08-115/EN/KS-SF-08-115-EN.PDFEUROSTAT 2010b. http://epp.eurostat.ec.europa.eu/cache/ITY_OFFPUB/KS-SF-09-007/EN/KS-SF-09-007-EN.PDFEUROSTAT 2010c. http://epp.eurostat.ec.europa.eu/cache/ITY_OFFPUB/KS-SF-09-039/EN/KS-SF-09-039-EN.PDFFADN 2010a.: http://ec.europa.eu/agriculture/rica/index.cfmFADN 2010b.: http://ec.europa.eu/agriculture/rica/concept_en.cfmFADN 2010c..:http://ec.europa.eu/agriculture/rica/methodology3_en.cfmFADN REPORT 2010 http://ec.europa.eu/agriculture/analysis/fadn/reports/sa0207_milk.xlsFAOSTAT 2010. http://faostat.fao.org/site/569/DesktopDefault.aspx ?PageID=569#ancorFarrell MJ (1957): The measurement of productive efficiency. Jour-nal of the Royal Statistical Society, Series A 120 (3): 253–281.Heshmati A & S Kumbhakar (1994): Farm heterogeneity and tech-nical efficiency: Some results from Swedish dairy farms. Journal of Productivity Analysis 5: 45–61.Kumbhakar S & K Lovell (2000): Stochastic Frontier Analysis. Cambridge Univ. Press, Cambridge, UK.Solís D, Bravo-Ureta B & Quiroga R (2009): Technical efficiency among peasant farmers participating in natural resource management programs in Central America. Journal of Agricultural Economics 60: 202–219.Tauer LW (1998): Productivity of New York dairy farms measured by nonparametric Malquist indices. Journal of Agricultural Econom-ics 49: 234–249.
Applied Studies in Agribusiness and Commerce – APSTRACTAgroinform Publishing House, Budapest INFORMATION FOR AUTHORS
Applied Studies in Agribusiness and Commerce(APSTRACT) is the official periodical of the InternationalMBA Network in Agribusiness and Commerce for thediscussion and dissemination of applied research inagricultural economics, agribusiness and commerceperformed within the International MBA Network.Submitted manuscripts should be related to ruraldevelopment or the economics of agriculture, naturalresources and environment. Papers should have a practicalorientation and demonstrate innovation in analysis, methodsor application. Topic areas include production economicsand farm management, agricultural policy, agriculturalenvironmental issues, regional planning and ruraldevelopment, methodology, the marketing of agricultural andfood products, international trade and development.APSTRACT publishes practical research and case studies, aswell as papers discussing policy issues. Shorter featuresinclude book reviews and comments on previously publishedarticles. In addition, the journal publishes on its website theAnnual Report of the International MBA Network inAgribusiness and Commerce enabling the members ofInternational MBA Network to have immediate access to thepapers. Reactions to articles previously published inAPSTRACT should be sent to the Editor. Critical commentsand suggestions are always welcome.
General rules of formatting a paper and preparing a list ofreferences are consistent with the recommendations ofAmerican Psychological Association (APA 2001) and theAPA Style Guide to Electronic References (2007).Manuscripts should be headed with the title of the paper, firstand family name(s) of author(s), with corresponding institutename and address where the research was carried out.
TITLE OF THE PAPERFirst name(s) and surname of author1, first name(s)
and surname of author2
1Name and address of institute 12 Name and address of institute 2
Include an abstract immediately after the title. Abstractprovides readers with a quick overview. Abstract shouldcontain the research topic or research questions, participants,methods, results, and conclusions. You may also includepossible implications of your research and future work yousee connected with your findings. Your abstract should be asingle, double-spaced paragraph with no indentation. Yourabstract should be between 200 and 300 words. The abstract
should give a clear idea of the main conclusions of the article,the methods employed, an indication of reasoning and aconcise summary of the key points of your research. Providea maximum of five key words below the abstract. Listingyour keywords will help researchers find your work indatabases.
All articles will be held to the same set of scholarlystandards. Articles should be written in English and shouldnot exceed 20 pages, including abstract, tables, figures, andgraphs. Shorter articles will also be considered. Font size 10,with margins; top 6 cm, bottom 5 cm, left 4.5 cm and right 4cm on A/4 sheets. Manuscripts should be divided intosections, each with numbers and section heading. Do not usemore than two grades of headings. Manuscripts should bedivided into the following sections: Abstracts, Keywords,Introduction, Materials and Methods, Results andDiscussion, Acknowledgements, References. Backgroundinformation to the article, such as sponsoring bodies of theresearch project, should appear in the foot notes, but collectreferences at the end of the manuscripts. Publishers do notrecommend footnotes and endnotes as they are expensive toreproduce, if necessary, footnotes should appear at the end ofthe page on which they are inserted.
Label each table with an Arabic number (Table 1, Table 2,and so on) and provide a clear title. Tables should be quotedin text and placed in their position in the manuscript. Keeptables as simple as possible. Tables spreading across doublepages are difficult to read and typeset. Proposed format fortable headings are: Table (number): Title of table (note ifany). Table heading is located before the table. Row andcolumn headings should only have the initial lettercapitalized. Below the table, give its source as a note. Figuresshould be numbered consecutively, quoted in text and placedin their position of the manuscript. Camera-ready copies ofline drawings and photos should be submitted. Proposedformat for headings of figures including graphs, charts,drawings, and photographs are: Figure (number): Title offigure (note if any). Figure title and tables should appearbelow the figure. Discuss the most significant features ofeach figure. Mathematical formulas should also be placed inthe text. Units should conform to the International System ofUnits (SI). Although the amount of explanation and dataincluded depends upon the study, do not give formulas forcommon statistics (i.e. mean, t test) and do not repeatdescriptive statistics in the text if they are represented in atable or figure. When including statistics in written text, be
Information for authors
24_Information for Authors_Information for Authors 7/17/13 8:48 AM Page 147
160 148
sure to include enough information for the reader tounderstand the study.
A citation of a publication by a single author should be madewith a signal phrase that includes the last name of authorfollowed by the year of publication in parentheses (Nábrádi2009). When citing a publication with two authors, includeboth family names in the signal phrase each time you cite thework (Nábrádi and Heijman 2009). A work with three or moreauthors is identified with the family name of the first authorfollowed by et al. and the year of publication (Nábrádi et al.2009). If the author is a government agency or otherorganization, name the organization the first time you cite withan acronym in parentheses and use the acronym in the signalphrase followed by the year of publication in parentheses(FAO 2009). When your parenthetical citation names two ormore works, put them in the same order that they appear in thereference list, separated by semicolons (Nábrádi 2009;Nábrádi et al. 2008). When possible, cite an electronicdocument the same way as any other document using the nameof author followed by the year of publication.
Alphabetize entries in the list of references by the family nameof the first author; if a work has no author, alphabetize it by theacronym of the organization followed by the year ofpublication. The date of publication appears immediately afterthe name of authors. Observe all details: capitalization,punctuation, use of italics, and so on. Begin the entry with thefamily name of first author, followed by a comma and theinitial(s) of first author. If more than one author, continue witha comma followed by the family name of the second author,followed by a comma and the initial(s) of the second author,etc. until all authors are listed. Then give the year ofpublication in parentheses followed by a period. The followingmodels illustrate the style for entries in the list of references:
Book: Author, A. A., Author, B. B. (Year of publication). Titleof book. Name of publisher, Place of publication. Pages.
Article in an edited book of conference proceedings:Author, A. (Year of publication). Title of paper. In: Author, B.B. (Ed.) Title of edited book or conference proceedings.Name of publisher, Place of publication. Pages.
Articles in journal Author, A. (Year of publication). Title ofpaper. Title of journal, Volume number (issue number ifavailable). Pages.
Articles from electronic sources: Author, A. (Date ofpublication). Title of paper. Name of publisher, Web place ofpublication.
Refereeing process: Submitted papers are sent to twoindependent, anonymous reviewers selected by the EditorialBoard members for judgment on their appropriateness forpublication. Lists of Editorial Board members can be foundon the inside cover of the Applied Studies in Agribusinessand Commerce. The recommendations of the refereeingpanel are made known to the authors by the Editor. Revisedarticles should be sent directly to the Editor in the same wayas first submissions. Proofreading: Proofs are sent to authorsfor reading and correction directly by the publisher and adate for the return of proofs will be given; correctionsarriving after the stated date will only be incorporated if timeis available.
Articles should be submitted to the Editor by e-mail,prepared in a recent version of Word for Windows. Oneprinted copy of the complete article should be sent via post.
Editor: Prof. Dr. Andras Nábrádi
Faculty of Applied Economics and Rural Development
University of Debrecen
4032 Debrecen, Boszormenyi ut 138, Hungary
Tel: 00/36/52/526967
e-mail: [email protected]
Editor: Prof. Dr. András Nábrádi – Editorial office: H–1149 Budapest, Angol u. 34.
Phone/fax: (36-1) 220-8331 • E-mail: [email protected]
Executive publisher: Etelka Bolyki, managing director
Typography: Opal System Graphics • Production: Agroinform Visual Studio
The publication is distributed by AGROINFORM Publishing House • www.agroinform.com
H–1149 Budapest, Angol u. 34. • Phone: (36-1) 220-8331
HU-ISSN 1789-221X�
�
24_Information for Authors_Information for Authors 7/17/13 8:48 AM Page 148
http://www.apstract.net
Typography:
Vol.
8. N
umbe
rs 2
-3. 2
014
App
lied
Stud
ies I
n A
grib
usin
ess A
nd C
omm
erce
20142,3Applied Studies In Agribusiness And Commerce
Vol. 8. Numbers 2-3. 2014Aberdeen, Belgorod, Belgrade, Budapest, Berlin, Cork, Debrecen, Fayetteville, Hohenheim Kazan, Kiev, Nitra, Novi-Sad, Podgorica, Prague, Stavropol, Ulan-Bator, Warsaw, Wageningen, Zagreb
� � � ������ �������
3
ContentsSCIENTIFIC PAPERS
Potential of vertical and horizontal integration in the hungarian fish Product chain györgy iván neszmélyi Ph.d. Szűcs István–Szőllősi László . . . . . . . . . . . . . . . . . . . . . . . . . . . . . . . . . . . . . . . . . . . . . . . . . . . . . . . . . . . . . . . . . . . . . . . . . . . . . . . . 5some thoughts on the rePayment methods of hungarian household forex loans Barbara Sepsi–Veronika Fenyves . . . . . . . . . . . . . . . . . . . . . . . . . . . . . . . . . . . . . . . . . . . . . . . . . . . . . . . . . . . . . . . . . . . . . . . . . . . . 17the Possibilities of energetic aPPlicability and economic evaluation of graPe in the szentantalfa townshiP József Brazsil–Gábor Pintér–Mihály Veszelka . . . . . . . . . . . . . . . . . . . . . . . . . . . . . . . . . . . . . . . . . . . . . . . . . . . . . . . . . . . . . . . . . . 25a comParative analysis of the Profitability of PineaPPle-mango blend and PineaPPle fruit juice Processing in ghana Michael K. Asante and John K. M. Kuwornu . . . . . . . . . . . . . . . . . . . . . . . . . . . . . . . . . . . . . . . . . . . . . . . . . . . . . . . . . . . . . . . . . . . 33the characteristics of consumer attitudes in the food market in hungary Mihály Soós–Sára Szabó–Zoltán Szakály . . . . . . . . . . . . . . . . . . . . . . . . . . . . . . . . . . . . . . . . . . . . . . . . . . . . . . . . . . . . . . . . . . . . . . 43examination of enterPreneurshiP ecosystem in debrecen from the direction of oPen innovation sPaces Adrienn Horváth . . . . . . . . . . . . . . . . . . . . . . . . . . . . . . . . . . . . . . . . . . . . . . . . . . . . . . . . . . . . . . . . . . . . . . . . . . . . . . . . . . . . . . . . . 51concePtions and misconcePtions of hostels worldwide Réka Somlai . . . . . . . . . . . . . . . . . . . . . . . . . . . . . . . . . . . . . . . . . . . . . . . . . . . . . . . . . . . . . . . . . . . . . . . . . . . . . . . . . . . . . . . . . . . . . 61oPtimised dairy cow feeding economy in hungary András Halász . . . . . . . . . . . . . . . . . . . . . . . . . . . . . . . . . . . . . . . . . . . . . . . . . . . . . . . . . . . . . . . . . . . . . . . . . . . . . . . . . . . . . . . . . . . 69technical efficiency analysis of maize Production: evidence from ghana Beatrice Bempomaa. . . . . . . . . . . . . . . . . . . . . . . . . . . . . . . . . . . . . . . . . . . . . . . . . . . . . . . . . . . . . . . . . . . . . . . . . . . . . . . . . . . . . . . 73on the conveyor belt of Public emPloyment Programs between 2009 and 2013 in hajdúböszörmény Judit Oláh–Andrea Szabó . . . . . . . . . . . . . . . . . . . . . . . . . . . . . . . . . . . . . . . . . . . . . . . . . . . . . . . . . . . . . . . . . . . . . . . . . . . . . . . . . . 81the labour market Position of PeoPle with disabilities and with a reduced work caPacity after the change of regime Balázs-Földi Emese . . . . . . . . . . . . . . . . . . . . . . . . . . . . . . . . . . . . . . . . . . . . . . . . . . . . . . . . . . . . . . . . . . . . . . . . . . . . . . . . . . . . . . . 89the economic efficiency of aPPle Production in terms of Post-harvest technologyViktor Szabó . . . . . . . . . . . . . . . . . . . . . . . . . . . . . . . . . . . . . . . . . . . . . . . . . . . . . . . . . . . . . . . . . . . . . . . . . . . . . . . . . . . . . . . . . . . . . 99the effect of logistic controlling on business Processes Szilvia Berek Méhesné . . . . . . . . . . . . . . . . . . . . . . . . . . . . . . . . . . . . . . . . . . . . . . . . . . . . . . . . . . . . . . . . . . . . . . . . . . . . . . . . . . . . . 107consumer aPProach of health and ayurveda Sára Szabó, Viktória Szente, Zoltán Szakály, András Nábrádi . . . . . . . . . . . . . . . . . . . . . . . . . . . . . . . . . . . . . . . . . . . . . . . . . . . . . . 113defining the strategic objectives of hungarian mutton Product chain and elements of marketing strategy in the beginning of the second decade of the century Anrás Nábrádi–Béla Cehla, Orsolya Szigeti, Zoltán Szakály . . . . . . . . . . . . . . . . . . . . . . . . . . . . . . . . . . . . . . . . . . . . . . . . . . . . . . . 119hungarian sPirits Pálinka as a “hungaricum” i. literature review and Practical approaches Imre Milán Harcsa–András Nábrádi–Ildiko Tar . . . . . . . . . . . . . . . . . . . . . . . . . . . . . . . . . . . . . . . . . . . . . . . . . . . . . . . . . . . . . . . . . 133economic, Practical imPacts of Precision farming – with esPecial regard to harvesting Ágnes Szolnoki–András Nábrádi . . . . . . . . . . . . . . . . . . . . . . . . . . . . . . . . . . . . . . . . . . . . . . . . . . . . . . . . . . . . . . . . . . . . . . . . . . . . . 141dairy farms efficiency analysis before the quota system abolishmentKrisztián Kovács . . . . . . . . . . . . . . . . . . . . . . . . . . . . . . . . . . . . . . . . . . . . . . . . . . . . . . . . . . . . . . . . . . . . . . . . . . . . . . . . . . . . . . . . . 147
INFORMATION FOR AUTHORS . . . . . . . . . . . . . . . . . . . . . . . . . . . . . . . . . . . . . . . . . . . . . . . . . . . . . . . . . . . . . . . . . . . . . . . . . . . . 159
conc
eption
s
dairy
cow
feed
ing
mis
conc
eptio
ns
com
mun
ity m
arke
ting
optim
isat
ion
cont
rolli
ng
busin
ess
proc
esse
s
fore
x
Related Documents