Available online at www.CivileJournal.org Civil Engineering Journal (E-ISSN: 2476-3055; ISSN: 2676-6957) Vol. 7, No. 12, December, 2021 2011 Evaluating the Friction Characteristics of Pavement Surface for Major Arterial Road Diana Jumah Mohammad 1* , Mohammed Qadir Ismael 2 1 M.Sc. Student, Civil Engineering Department, University of Baghdad, Baghdad, 10071, Iraq. 2 Assistant Professor, Civil Engineering Department, University of Baghdad, Baghdad, 10071, Iraq. Received 12 August 2021; Revised 15 October 2021; Accepted 08 November 2021; Published 01 December 2021 Abstract The performance of the pavement in terms of vehicle safety and tire wear is affected by the friction behavior of the pavement. To highlight the main characteristics that affect the production of better friction resistance of the pavement surface in this work. The micro-texture and macro-texture of the asphalt surface of Baghdad Airport highway were studied using two methods: (sand patch method and the British pendulum test). The sand patch was examined by drawing sand grains of a specific volume, while the micro-texture was analyzed using a BPT under dry and wet surface conditions. All data obtained from the two examinations were analyzed and modelled statistically using SPSS 25 software. Results show that skid resistance of pavement surface increase with the increase of MTD, this increase may be due to the increase of coarse aggregate which lead to increase the roughness of the pavement surface, this increase ranged between (96 - 91%). MTD decreases with the increase of traffic flow due to the friction between the road surface and the vehicle tires leading to increase of smoothness of the road surface. This is mean that MTD is highly affected by the traffic flow and this effectiveness ranged between (84-97%). Skid resistance also is highly affected by the traffic flow with an effectiveness ranged between (81-94%) for both pavement conditions. According to the regression analysis for friction and other parameters, it can be concluded that surface friction values are highly affected by cumulative traffic (asphalt mix deterioration) over time. Keywords: Pavement Surface Texture; Macrotexture; Microtexture; Skid Resistance; BPN; Sand Patch; MTD; SPSS. 1. Introduction For safe road travel, tires must have adequate friction with the road. Also known as skid resistance, the road surface texture (or roughness) is a source of friction between the tire and the ground. Without friction, there would be no acceleration, deceleration, or adjusting the vehicle's path safely. People are more likely to be in an accident if the car has low skid resistance, especially on wet roads [1]. One of the key factors in driving safety is the surface friction of the pavement, which plays a vital role in reducing accidents on wet pavements [2]. Pavement surface texture, also known as surface asperity, is a surface feature that measures the divergence between the natural plane and the actual surface. [3]. In terms of wavelength and amplitude, the pavement surface has been classified into three layers; based on the measurements of the surface asperities, these layers are mega-texture, macro-texture, and micro-texture [4]. Generally, there are three different texture types: macro and microtextures, which affect skid resistance, and textures of all three types have macro and micro textures as their primary features [5]. Of particular importance, the micro-texture takes * Corresponding author: [email protected] http://dx.doi.org/10.28991/cej-2021-03091775 © 2021 by the authors. Licensee C.E.J, Tehran, Iran. This article is an open access article distributed under the terms and conditions of the Creative Commons Attribution (CC-BY) license (http://creativecommons.org/licenses/by/4.0/).

Welcome message from author
This document is posted to help you gain knowledge. Please leave a comment to let me know what you think about it! Share it to your friends and learn new things together.
Transcript
Available online at www.CivileJournal.org
Civil Engineering Journal (E-ISSN: 2476-3055; ISSN: 2676-6957)
Vol. 7, No. 12, December, 2021
2011
Evaluating the Friction Characteristics of Pavement Surface for
Major Arterial Road
Diana Jumah Mohammad 1*, Mohammed Qadir Ismael 2
1 M.Sc. Student, Civil Engineering Department, University of Baghdad, Baghdad, 10071, Iraq.
2 Assistant Professor, Civil Engineering Department, University of Baghdad, Baghdad, 10071, Iraq.
Received 12 August 2021; Revised 15 October 2021; Accepted 08 November 2021; Published 01 December 2021
Abstract
The performance of the pavement in terms of vehicle safety and tire wear is affected by the friction behavior of the
pavement. To highlight the main characteristics that affect the production of better friction resistance of the pavement
surface in this work. The micro-texture and macro-texture of the asphalt surface of Baghdad Airport highway were studied
using two methods: (sand patch method and the British pendulum test). The sand patch was examined by drawing sand
grains of a specific volume, while the micro-texture was analyzed using a BPT under dry and wet surface conditions. All
data obtained from the two examinations were analyzed and modelled statistically using SPSS 25 software. Results show
that skid resistance of pavement surface increase with the increase of MTD, this increase may be due to the increase of
coarse aggregate which lead to increase the roughness of the pavement surface, this increase ranged between (96 - 91%).
MTD decreases with the increase of traffic flow due to the friction between the road surface and the vehicle tires leading
to increase of smoothness of the road surface. This is mean that MTD is highly affected by the traffic flow and this
effectiveness ranged between (84-97%). Skid resistance also is highly affected by the traffic flow with an effectiveness
ranged between (81-94%) for both pavement conditions. According to the regression analysis for friction and other
parameters, it can be concluded that surface friction values are highly affected by cumulative traffic (asphalt mix
deterioration) over time.
Keywords: Pavement Surface Texture; Macrotexture; Microtexture; Skid Resistance; BPN; Sand Patch; MTD; SPSS.
1. Introduction
For safe road travel, tires must have adequate friction with the road. Also known as skid resistance, the road surface
texture (or roughness) is a source of friction between the tire and the ground. Without friction, there would be no
acceleration, deceleration, or adjusting the vehicle's path safely. People are more likely to be in an accident if the car
has low skid resistance, especially on wet roads [1]. One of the key factors in driving safety is the surface friction of the
pavement, which plays a vital role in reducing accidents on wet pavements [2]. Pavement surface texture, also known
as surface asperity, is a surface feature that measures the divergence between the natural plane and the actual surface.
[3]. In terms of wavelength and amplitude, the pavement surface has been classified into three layers; based on the
measurements of the surface asperities, these layers are mega-texture, macro-texture, and micro-texture [4]. Generally,
there are three different texture types: macro and microtextures, which affect skid resistance, and textures of all three
types have macro and micro textures as their primary features [5]. Of particular importance, the micro-texture takes
* Corresponding author: [email protected]
http://dx.doi.org/10.28991/cej-2021-03091775
© 2021 by the authors. Licensee C.E.J, Tehran, Iran. This article is an open access article distributed under the terms and conditions of the Creative Commons Attribution (CC-BY) license (http://creativecommons.org/licenses/by/4.0/).

Civil Engineering Journal Vol. 7, No. 12, December, 2021
2012
effect at lower vehicle speeds when they help induce tire adhesion to the road surface; at higher vehicle speeds. However,
the macro-texture is mainly responsible for promoting slip resistance through increasing the friction gradient and
channeling drainage of water [6-8]. The pavement friction is described as "a force that resists relative motion between
the tire of vehicle and surface of pavement" [9]. A non-dimension coefficient, defined as friction coefficient, is typically
used to describe the friction of the tires. The Coefficient of friction between the surface of pavement and tire can be
defined as the quotient of the tangential force at the tire's contact surface and the longitudinal force at the wheel. A
variety of causes Tire-pavement friction. That include:
1) The characteristics of the surface of the ground;
2) The properties of the tire;
3) The working conditions of the vehicle;
4) Environmental conditions.
Skid resistance must maintain on pavements for safe vehicle manoeuvring [10]. Several studies have proven that a
focused approach to improving skid resistance in high-risk areas with frequent braking provides significant safety
advantages compared to increasing skid resistance in all areas. Road engineers must consider skid resistance when
designing the pavement [11]. Moreover, skid resistance is now a component of the common control of pavement
conditions that allows road authorities to be vigilant in the safe and successful maintenance of the road network.
2. Research Methodology
The tire's slipping resistance on the pavement is referred to as skid resistance [6]. Skid Resistance (SR) is a critical
parameter for the assessment of the pavement. That is a crucial element in road safety, and it is the force that maintains
the traction that the tire requires to hold the car under control and stop in emergencies [12]. Also referred to as resistance
to skidding, skid resistance has been used interchangeably to describe the force resisting relative motion between the
pavement surface and the vehicle's tire. It is opposite to the movement between the rubber and the surface that the
friction force acts [6]. Skid resistance is essential to road safety because it prevents a vehicle from sliding and falling
across the surface of the roadway, even when the driver makes different types of driving movements (increases speed,
shifts directions, or both) [13]. The skid resistance of the standard pavement lane might deteriorate over time due to
repetitive traffic movements in a set direction [6, 14]. Improper skid resistance may lead to more injuries caused by
skidding [12]. Skid resistance can affect other important aspects of pavement durability when it comes to vehicle safety,
including vehicle stability [13]. In the skid resistance of the pavement, there are four significant influences: the
characteristics of the road surface (texture, temperature, and materials), the properties of the tires (pad shape, rubber
structure, sliding velocity, and temperature), and climatic and environmental factors [15, 16].
2.1. Pavement Tire – Interaction
One of the most fundamental aspects in infrastructure and transportation safety design is tire–pavement friction.
Friction is a major factor in many of the equations used in road design. The friction rate, for example, is essential in
airport design for horizontal curves, Stopping Sight Distance, and emergency lines. Furthermore, the amount of friction
between the tire and the pavement influences the quantity and severity of car accidents. Driving accidents have been a
major cause of death in recent years, although developing countries account for only 54 per cent of vehicle traffic.
However, developing countries account for more than 90% of the death toll from traffic accidents that have occurred in
these countries [17]. In developed countries, road crashes are also one of the leading causes of death. The negative
consequences of vehicle crashes are certainly not confined to human mortality, and the economic and social expenses
of a car accident have always been and will continue to be an enormous burden for human society [18]. Human mistakes,
ambient conditions, car or tunnel faults, or combinations of these elements can cause a traffic accident [19]. Friction
between the tire and the pavement is one of the essential pavement features, and it directly impacts traffic safety [20].
Tire – Pavement friction influenced (on) tire wear, the quantity of internal and external noise created by the vehicle's
movement on the pavement [21], driving comfort, and a few more criteria in addition to traffic safety [22]. The presence
of pavement friction is express by a friction coefficient (µ). This ratio is known as the Coefficient of friction, and it can
be calculated as the inverse of the force of friction (opposite direction of motion) multiplied by the normal force (the
force that applied normal to the surface) (from the axle of the wheel)), as shown in Equation 1;
µ =𝐹𝑅
𝐹𝑁 (1)
where: µ=Coefficient of friction; 𝐹𝑅 = Friction force; 𝐹𝑁 = Normal force.
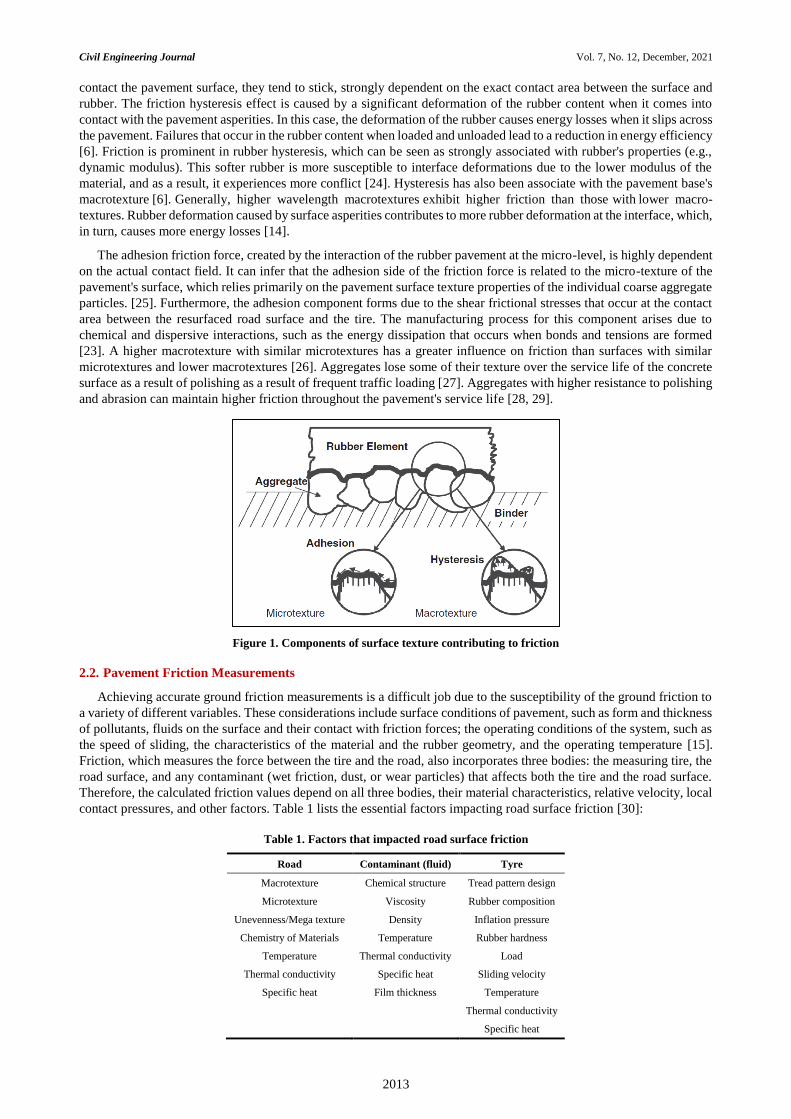
Two commonly accepted components contribute to the friction of the pavement; these processes know as hysteresis
and adhesion. Both of them are closely associated with the thickness of the pavement at various wavelengths [14].
Hysteresis occurs because the rubber tire deforms and the internal friction of the rubber creates friction with the surface
of the road, which results in a loss of energy [23]. The other factor to consider is adhesion forces. When rubber molecules
Civil Engineering Journal Vol. 7, No. 12, December, 2021
2013
contact the pavement surface, they tend to stick, strongly dependent on the exact contact area between the surface and
rubber. The friction hysteresis effect is caused by a significant deformation of the rubber content when it comes into
contact with the pavement asperities. In this case, the deformation of the rubber causes energy losses when it slips across
the pavement. Failures that occur in the rubber content when loaded and unloaded lead to a reduction in energy efficiency
[6]. Friction is prominent in rubber hysteresis, which can be seen as strongly associated with rubber's properties (e.g.,
dynamic modulus). This softer rubber is more susceptible to interface deformations due to the lower modulus of the
material, and as a result, it experiences more conflict [24]. Hysteresis has also been associate with the pavement base's
macrotexture [6]. Generally, higher wavelength macrotextures exhibit higher friction than those with lower macro-
textures. Rubber deformation caused by surface asperities contributes to more rubber deformation at the interface, which,
in turn, causes more energy losses [14].
The adhesion friction force, created by the interaction of the rubber pavement at the micro-level, is highly dependent
on the actual contact field. It can infer that the adhesion side of the friction force is related to the micro-texture of the
pavement's surface, which relies primarily on the pavement surface texture properties of the individual coarse aggregate
particles. [25]. Furthermore, the adhesion component forms due to the shear frictional stresses that occur at the contact
area between the resurfaced road surface and the tire. The manufacturing process for this component arises due to
chemical and dispersive interactions, such as the energy dissipation that occurs when bonds and tensions are formed
[23]. A higher macrotexture with similar microtextures has a greater influence on friction than surfaces with similar
microtextures and lower macrotextures [26]. Aggregates lose some of their texture over the service life of the concrete
surface as a result of polishing as a result of frequent traffic loading [27]. Aggregates with higher resistance to polishing
and abrasion can maintain higher friction throughout the pavement's service life [28, 29].
Figure 1. Components of surface texture contributing to friction
2.2. Pavement Friction Measurements
Achieving accurate ground friction measurements is a difficult job due to the susceptibility of the ground friction to
a variety of different variables. These considerations include surface conditions of pavement, such as form and thickness
of pollutants, fluids on the surface and their contact with friction forces; the operating conditions of the system, such as
the speed of sliding, the characteristics of the material and the rubber geometry, and the operating temperature [15].
Friction, which measures the force between the tire and the road, also incorporates three bodies: the measuring tire, the
road surface, and any contaminant (wet friction, dust, or wear particles) that affects both the tire and the road surface.
Therefore, the calculated friction values depend on all three bodies, their material characteristics, relative velocity, local
contact pressures, and other factors. Table 1 lists the essential factors impacting road surface friction [30]:
Table 1. Factors that impacted road surface friction
Road Contaminant (fluid) Tyre
Macrotexture Chemical structure Tread pattern design
Microtexture Viscosity Rubber composition
Unevenness/Mega texture Density Inflation pressure
Chemistry of Materials Temperature Rubber hardness
Temperature Thermal conductivity Load
Thermal conductivity Specific heat Sliding velocity
Specific heat Film thickness Temperature
Thermal conductivity
Specific heat
Civil Engineering Journal Vol. 7, No. 12, December, 2021
2014
2.3. Skid Resistance
Secure road travel requires adequate friction between the paved road surface and the tires of the car. One of the key
reasons causing the friction between the tire and the ground surface is the roughness of the road surface texture called
skid resistance. Friction forces are required to accelerate, decelerate or adjust the driving path of the vehicle safely. Low
skid resistance directly links to the increased risk of accidents, especially on wet roads [1]. Road friction can be
calculated using one out of five principles: locked wheel, constant slip, variable slip, constant slip angle, and retardation
measurement of a standard ABS braked car [31]. The slip resistance of the pavement is influencing by characteristics of
the paved road surface (texture, temperature, and materials), the properties of the tires (pad shape, rubber structure,
sliding velocity, temperature), and the climatic and environmental factors [15, 16].
Sarsam (2009) studied the macrotexture and micro-texture of the asphalt concrete pavement surface in the field using
four different methods (the sand patch process, the Outflow Time (OFT) method, the sand cone method, and the British
Pendulum Test (BPT). Two different grain sizes of sand were used for both sand patch and sand cone techniques, while
the micro-texture was investigates using the micro-texture method. The test outcomes of the four strategies were
modelled and compared. Also, the skid number was calculated. He argued that the contribution of sand size to the
determination of micro-texture is almost insignificant enough to disregard. For the two sand sizes measured, the outflow
time method is more beneficial for rough texture estimation, and the 1000 cc water volume is very appropriate for this
technique. Testing techniques applied for both micro and macro textures are more accurate models after added skid
number phenomena. The mathematical models producing from this field investigation should be successfully
implementing [32].
Ahmed et al. (2019), has investigated the evaluation of pavement friction values for major types of Egyptian roads;
desert, agriculture, and urban roads. According to the American Society for Testing and Materials, the tested roads have
been evaluated by a portable skid resistance mechanism using a British Pendulum (BP) tester. The field tests were
performed within the same region during an equivalent summer temperature. The surface skid resistance is anticipated
at its low value because of high asphalt viscosity according to a high temperature to control test conditions that led to
minimizing variability in test results. Relations between friction values and Cumulative Traffic (CT), surface layer ages
and accident rates have been developed for evaluating roads. From regression analysis for friction and other parameters,
they concluded that surface friction value is highly affected by road ages and CT, leading to (asphalt mix deterioration)
over time [33, 34].
2.4. Pavement Surface Texture
The main function of highway pavement is to standard traffic and allow mobility in a safe, comfortable, and
economical way by distributing the surface loads to the existing natural subgrade [35]. As pavement is the main structural
element of the road infrastructure, it must provide a durable, solid structure capable of withstanding the traffic loads
carried during its service life without suffering damages that can eventually reduce its safety. Along with the structure,
the pavement's surface functional performance is a key factor due to its direct relation to safety, riding quality, noise,
and appropriate visibility at night and in adverse weather conditions [36]. The texture of the pavement's surface is
described as a deviation of the pavement's surface from the actual plane of the pavement's surface [6]. Pavement
roughness can be divided into four textures according to the wavelengths of the deviations [37, 38]. Therefore, the
texture of the pavement is categorizing into:
2.4.1. Macrotexture
Macrotexture of wavelengths of 0.5 mm and 50 mm. The style and scale of aggregate particles on the pavement's
surface and the presence of grooves on any surface are commonly used to create the macrotexture. Also, it is influencing
by the area spacing and placement of large aggregate particles. It regulates slip-resistance on wet pavement surfaces,
with slip resistance decreasing as the speed of the vehicle increases. Pavement Surfaces with a higher degree of
macrotexture tend to have greater friction at high rates than at low rates, but this is not always the case [39, 40]. When
driving at speeds greater than 90 km/h on wet pavements, macro-texture is responsible for a significant section of surface
friction, regardless of slippage speed [6]. It influences water runoff from the tire surface area and is considered
responsible for friction because of high-speed hysteresis [25]. The macro-texture is controlling by the greatest aggregate
size, the fine and coarse aggregate forms, the mixing of binder material and viscosity, the mixing of gradation, and the
mixing of air content [6].
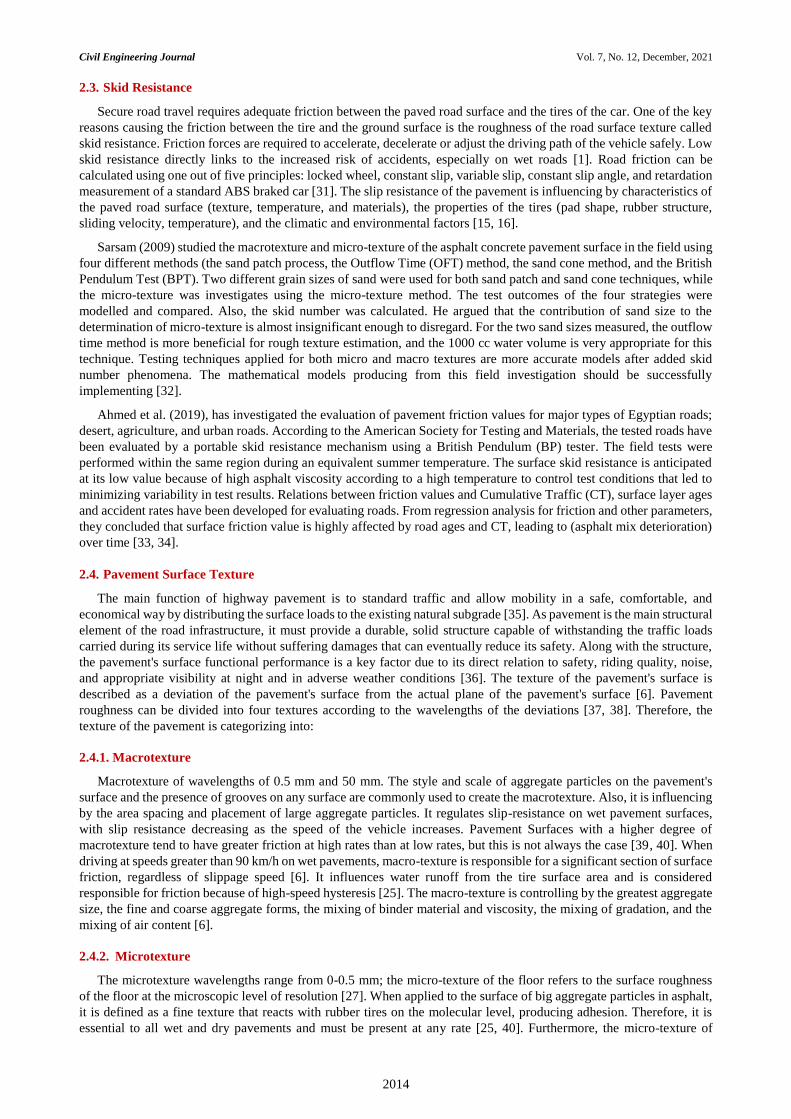
2.4.2. Microtexture
The microtexture wavelengths range from 0-0.5 mm; the micro-texture of the floor refers to the surface roughness
of the floor at the microscopic level of resolution [27]. When applied to the surface of big aggregate particles in asphalt,
it is defined as a fine texture that reacts with rubber tires on the molecular level, producing adhesion. Therefore, it is
essential to all wet and dry pavements and must be present at any rate [25, 40]. Furthermore, the micro-texture of
Civil Engineering Journal Vol. 7, No. 12, December, 2021
2015
aggregates helps break through the water layer between the aggregate particle and tire rubber, thereby playing an
essential role in the wet slip resistance [41, 42]. The micro-texture is primarily influencing by the coarse aggregate type
[6].
Figure 2. Micro and Macro textures
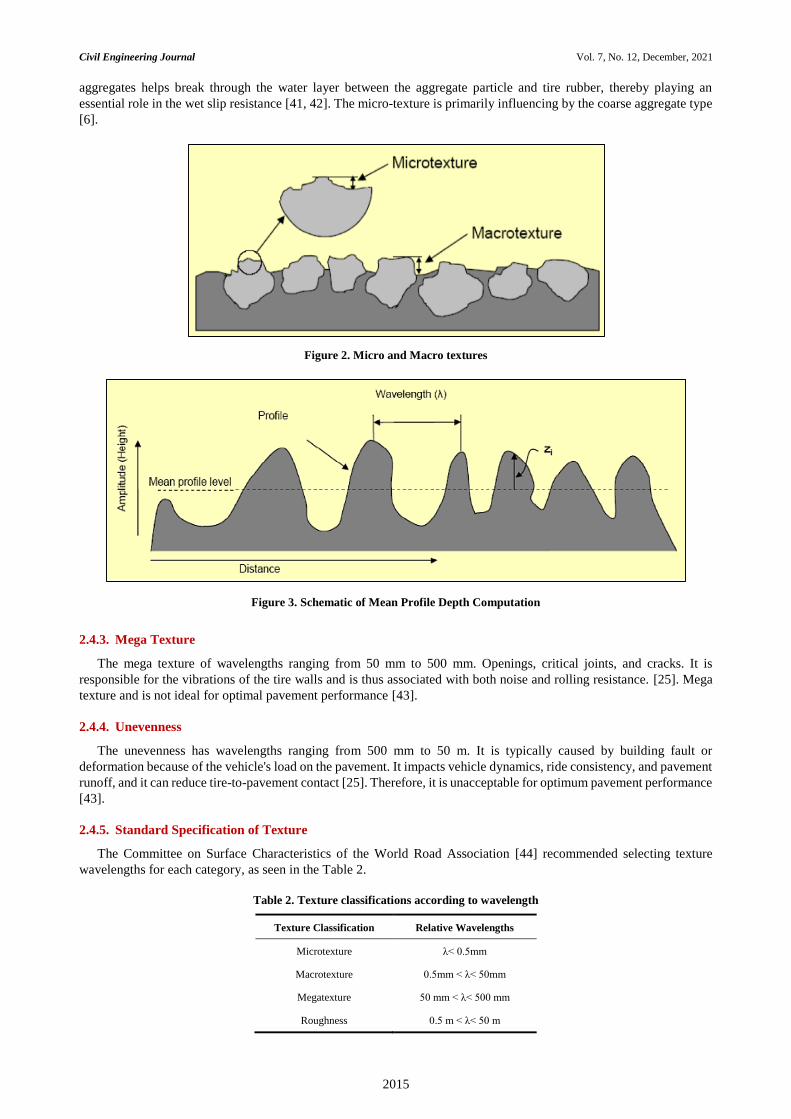
Figure 3. Schematic of Mean Profile Depth Computation
2.4.3. Mega Texture
The mega texture of wavelengths ranging from 50 mm to 500 mm. Openings, critical joints, and cracks. It is
responsible for the vibrations of the tire walls and is thus associated with both noise and rolling resistance. [25]. Mega
texture and is not ideal for optimal pavement performance [43].
2.4.4. Unevenness
The unevenness has wavelengths ranging from 500 mm to 50 m. It is typically caused by building fault or
deformation because of the vehicle's load on the pavement. It impacts vehicle dynamics, ride consistency, and pavement
runoff, and it can reduce tire-to-pavement contact [25]. Therefore, it is unacceptable for optimum pavement performance
[43].
2.4.5. Standard Specification of Texture
The Committee on Surface Characteristics of the World Road Association [44] recommended selecting texture
wavelengths for each category, as seen in the Table 2.
Table 2. Texture classifications according to wavelength
Texture Classification Relative Wavelengths
Microtexture λ< 0.5mm
Macrotexture 0.5mm < λ< 50mm
Megatexture 50 mm < λ< 500 mm
Roughness 0.5 m < λ< 50 m

Civil Engineering Journal Vol. 7, No. 12, December, 2021
2016
2.5. Factors Contributing to Skidding in Accidents
2.5.1. The Characteristics of Vehicles
Goods truck traffic and passenger car traffic have various criteria for road surface skidding resistance. Both types of
vehicles vary in terms of tire properties and weights and terms of acceleration and spatial parameters. The division of
goods vehicles covers all kinds of trucks with or without a trailer, including coaches, mini-busses, combination cars,
and small cars, all with or without a trailer in passenger cars. Certain vehicles (e.g., motorcycles) have a limited share
of traffic volume [45]. The motorcycle's small size makes it possible for the rider to navigate and pass the other car
while driving. Speeding is vulnerable to motorcycling and pillaging when faster speed causes a high degree of damage
or impact on a traffic crash. The motorcyclist will have little power over their motorcycle at a specific speed rate due to
the human capability factor, raising the likelihood of a road crash [46]. Speeding is an insufficient activity that increases
the risk of getting involved in a traffic crash rather than frustration leading to aggressive driving. More than 50 per cent
of motorcyclists travel over the speed limit set by all road types, and at some stage, the speed is greater than the other
car [47].
2.5.2. Condition of the Road Surface
Properties like skid resistance and roughness can help determine how safe a pavement surface is. All pavement
surfaces should be built and maintained to meet the roadway's friction requirements. According to decades of research,
skid resistance is particularly important on wet pavements; as a result, most highway safety management decisions are
made solely based on wet pavement crashes. Recent research has discovered. However, that skid resistance may have
an impact on crash risk on dry surfaces. Because dry pavements are more common than wet pavements, management
choices based only on wet collisions are made using smaller data sets. If skid resistance affects crash risk on dry
pavements, including dry crashes in highway safety management can enhance the number of crash observations,
improve safety analysis, and result in better maintenance decisions [48]. McCarthy et al. (2021), investigated the
association between skid resistance and crash occurrence in dry and wet situations using visual and regression analyses.
Figures were created to depict the crash–friction link visually, and crash models were generated using statistical
regression. The estimated regression coefficients were used to determine whether there was a statistical relationship.
They discovered that skid resistance affects collisions in dry and wet situations, with wet weather having a bigger impact
[48].
3. Materials and Methods
This fieldwork was done on Baghdad International Airport Highway. Baghdad Airport Expressway is a 12-kilometre-
long (7.5-mile-long) stretch of highway in Baghdad that connects different parts of the city to the airport and
neighbouring areas. It was taken to analyze a flexible pavement section on the freeway leading to Baghdad international
airport with a width of 3.5 meters. The pavement of the highway layers consists of a natural subgrade with deep of 40
cm, a subbase layer with deep of 30-40 cm, a stabilizer layer (base) with deep of 10 cm and a binder and surface layer
with deep of 5 cm for each. One hundred twenty locations have been selected; the distance between each location and
another was 5 meters; Figure 4 shows the location map for each section. Figure 5, shows the steps of work developed in
this research.
Figure 4. Location map of the freeway sections

Civil Engineering Journal Vol. 7, No. 12, December, 2021
2017
Figure 5. Location map for each section
Figure 6. Flow chart of the experimental work
Experimental Work
Sand Patch Technique
Using 100 gr of silica sand to
determine the total area
covered, and calculate the average pavement macrotexture
depth.
British Pendulum Tester
To determine the micro-
texture depth of pavement by
taking an average of four
swings of pendulum in dry
and wet pavement condition.
Manual Counting for
Traffic Flow
Calculation of vehicle for
two weeks (Jan. 31/2021 –
Feb. 13/2021).
For two hours per day
(10:00 A.M. – 12:00 P.M.)
Conclusions
Analysis and obtaining Results Using SPSS 25 Software
Using Single Linear Regression and Stepwise Regression
Civil Engineering Journal Vol. 7, No. 12, December, 2021
2018
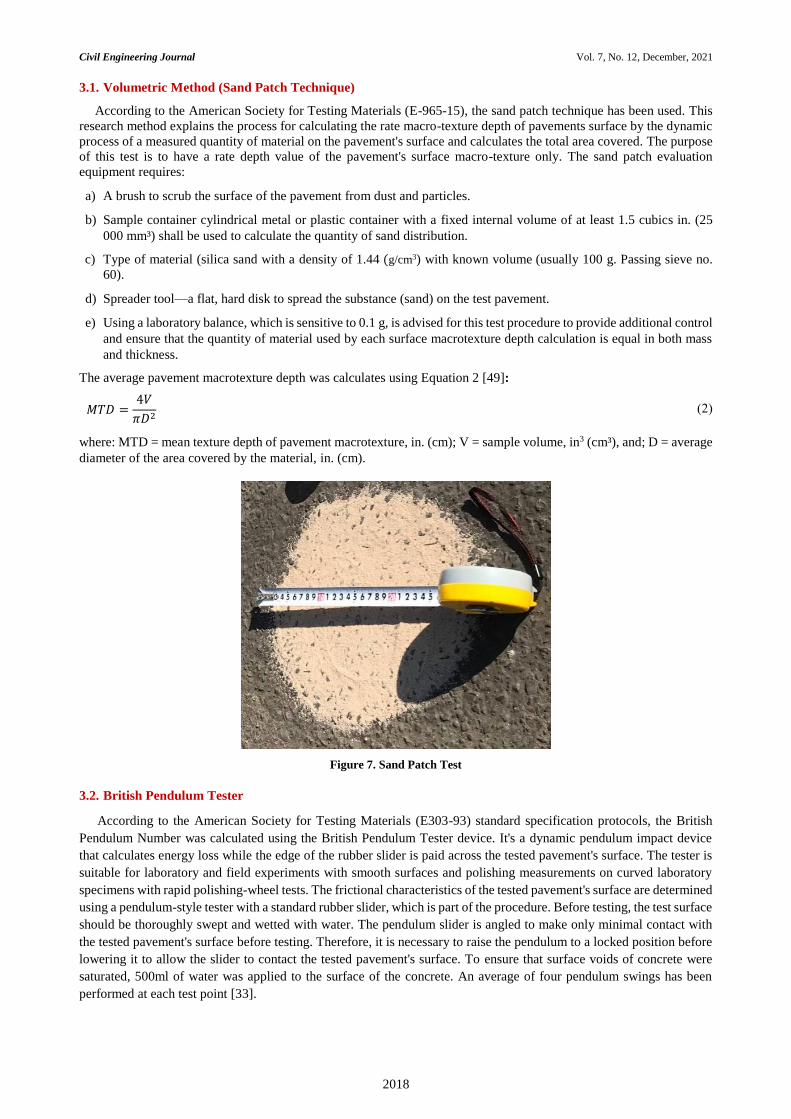
3.1. Volumetric Method (Sand Patch Technique)
According to the American Society for Testing Materials (E-965-15), the sand patch technique has been used. This
research method explains the process for calculating the rate macro-texture depth of pavements surface by the dynamic
process of a measured quantity of material on the pavement's surface and calculates the total area covered. The purpose
of this test is to have a rate depth value of the pavement's surface macro-texture only. The sand patch evaluation
equipment requires:
a) A brush to scrub the surface of the pavement from dust and particles.
b) Sample container cylindrical metal or plastic container with a fixed internal volume of at least 1.5 cubics in. (25
000 mm³) shall be used to calculate the quantity of sand distribution.
c) Type of material (silica sand with a density of 1.44 (g/cm3) with known volume (usually 100 g. Passing sieve no.
60).
d) Spreader tool—a flat, hard disk to spread the substance (sand) on the test pavement.
e) Using a laboratory balance, which is sensitive to 0.1 g, is advised for this test procedure to provide additional control
and ensure that the quantity of material used by each surface macrotexture depth calculation is equal in both mass
and thickness.
The average pavement macrotexture depth was calculates using Equation 2 [49]:
𝑀𝑇𝐷 =4𝑉
𝜋𝐷2 (2)
where: MTD = mean texture depth of pavement macrotexture, in. (cm); V = sample volume, in3 (cm³), and; D = average
diameter of the area covered by the material, in. (cm).
Figure 7. Sand Patch Test
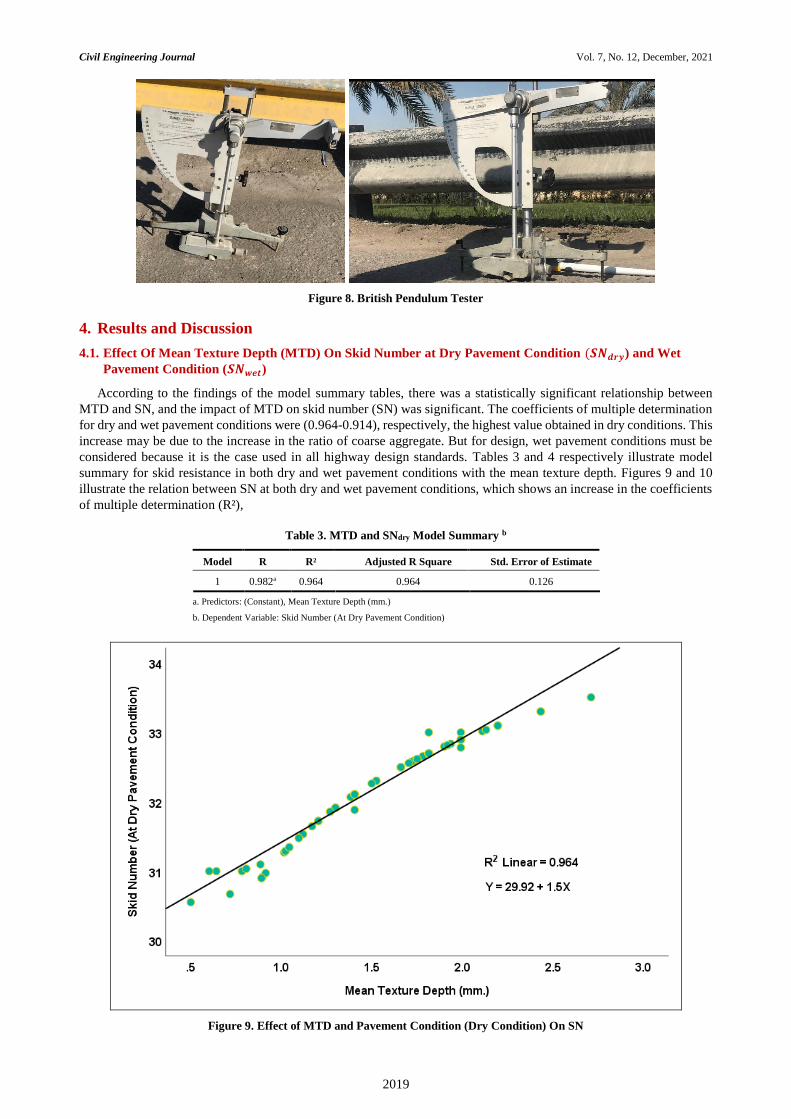
3.2. British Pendulum Tester
According to the American Society for Testing Materials (E303-93) standard specification protocols, the British
Pendulum Number was calculated using the British Pendulum Tester device. It's a dynamic pendulum impact device
that calculates energy loss while the edge of the rubber slider is paid across the tested pavement's surface. The tester is
suitable for laboratory and field experiments with smooth surfaces and polishing measurements on curved laboratory
specimens with rapid polishing-wheel tests. The frictional characteristics of the tested pavement's surface are determined
using a pendulum-style tester with a standard rubber slider, which is part of the procedure. Before testing, the test surface
should be thoroughly swept and wetted with water. The pendulum slider is angled to make only minimal contact with
the tested pavement's surface before testing. Therefore, it is necessary to raise the pendulum to a locked position before
lowering it to allow the slider to contact the tested pavement's surface. To ensure that surface voids of concrete were
saturated, 500ml of water was applied to the surface of the concrete. An average of four pendulum swings has been
performed at each test point [33].
Civil Engineering Journal Vol. 7, No. 12, December, 2021
2019
Figure 8. British Pendulum Tester
4. Results and Discussion
4.1. Effect Of Mean Texture Depth (MTD) On Skid Number at Dry Pavement Condition (𝑺𝑵𝒅𝒓𝒚) and Wet
Pavement Condition (𝑺𝑵𝒘𝒆𝒕)
According to the findings of the model summary tables, there was a statistically significant relationship between
MTD and SN, and the impact of MTD on skid number (SN) was significant. The coefficients of multiple determination
for dry and wet pavement conditions were (0.964-0.914), respectively, the highest value obtained in dry conditions. This
increase may be due to the increase in the ratio of coarse aggregate. But for design, wet pavement conditions must be
considered because it is the case used in all highway design standards. Tables 3 and 4 respectively illustrate model
summary for skid resistance in both dry and wet pavement conditions with the mean texture depth. Figures 9 and 10
illustrate the relation between SN at both dry and wet pavement conditions, which shows an increase in the coefficients
of multiple determination (R²),
Table 3. MTD and SNdry Model Summary b
Model R R² Adjusted R Square Std. Error of Estimate
1 0.982a 0.964 0.964 0.126
a. Predictors: (Constant), Mean Texture Depth (mm.)
b. Dependent Variable: Skid Number (At Dry Pavement Condition)
Figure 9. Effect of MTD and Pavement Condition (Dry Condition) On SN
Civil Engineering Journal Vol. 7, No. 12, December, 2021
2020
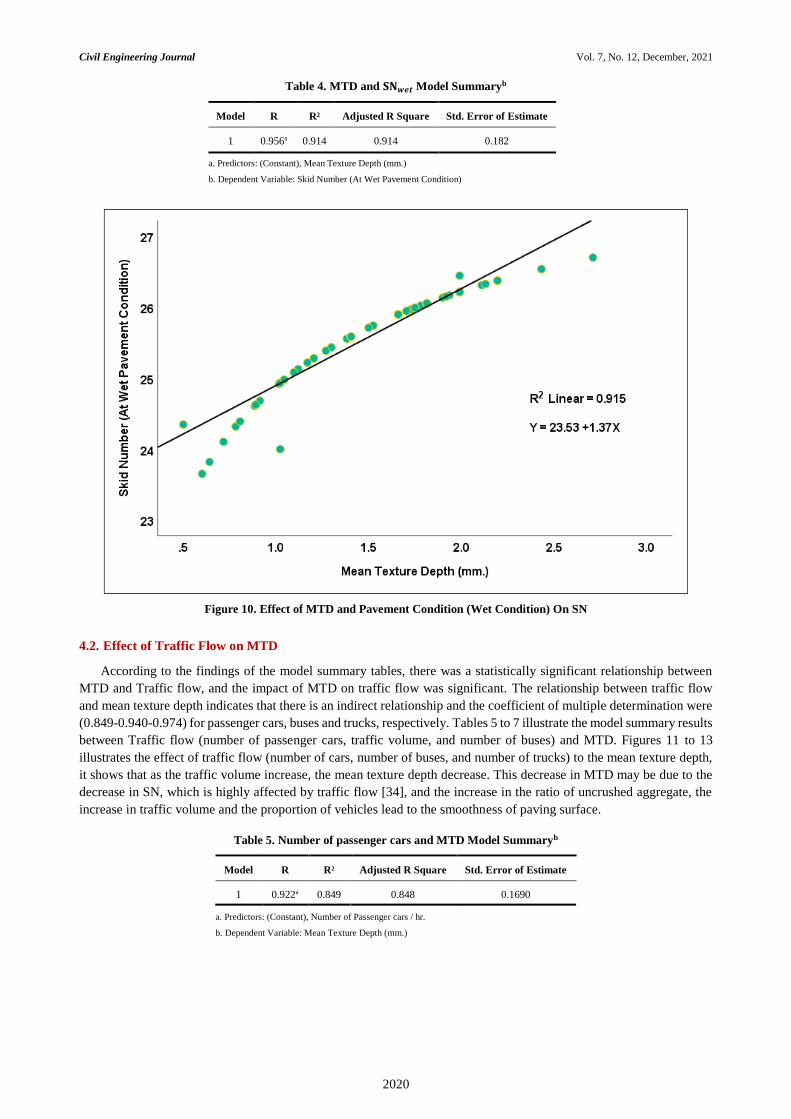
Table 4. MTD and 𝐒𝐍𝒘𝒆𝒕 Model Summaryb
Model R R² Adjusted R Square Std. Error of Estimate
1 0.956a 0.914 0.914 0.182
a. Predictors: (Constant), Mean Texture Depth (mm.)
b. Dependent Variable: Skid Number (At Wet Pavement Condition)
Figure 10. Effect of MTD and Pavement Condition (Wet Condition) On SN
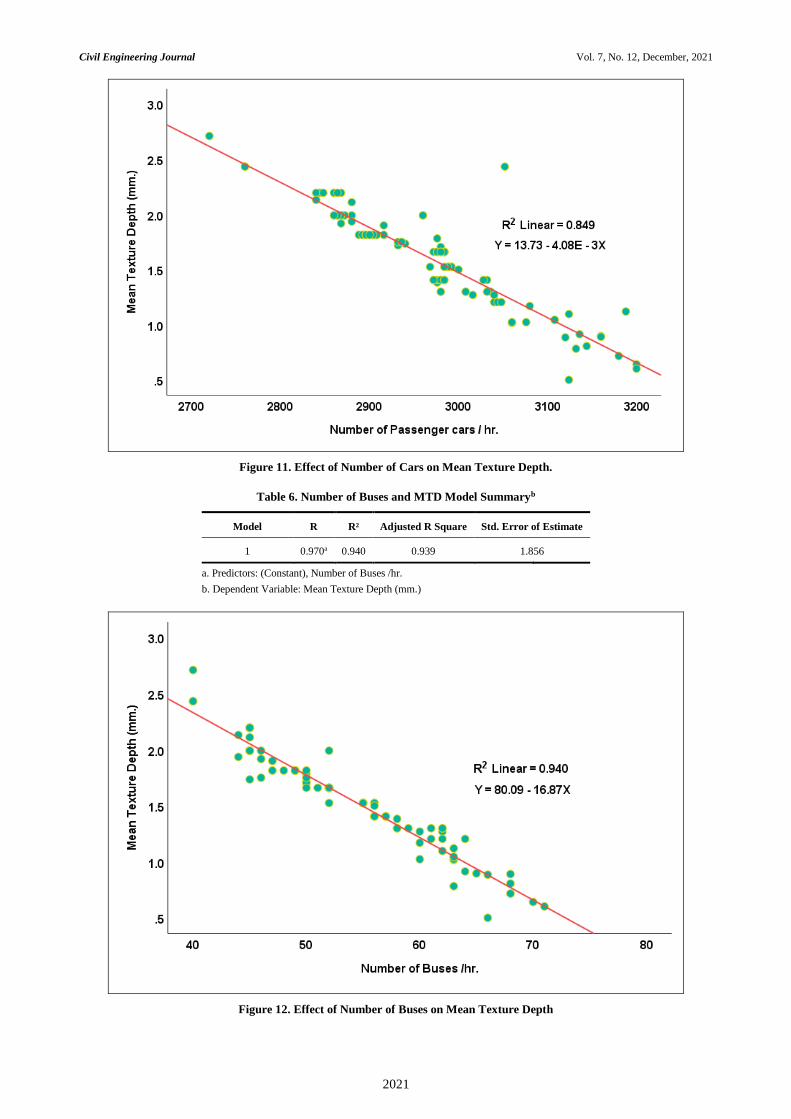
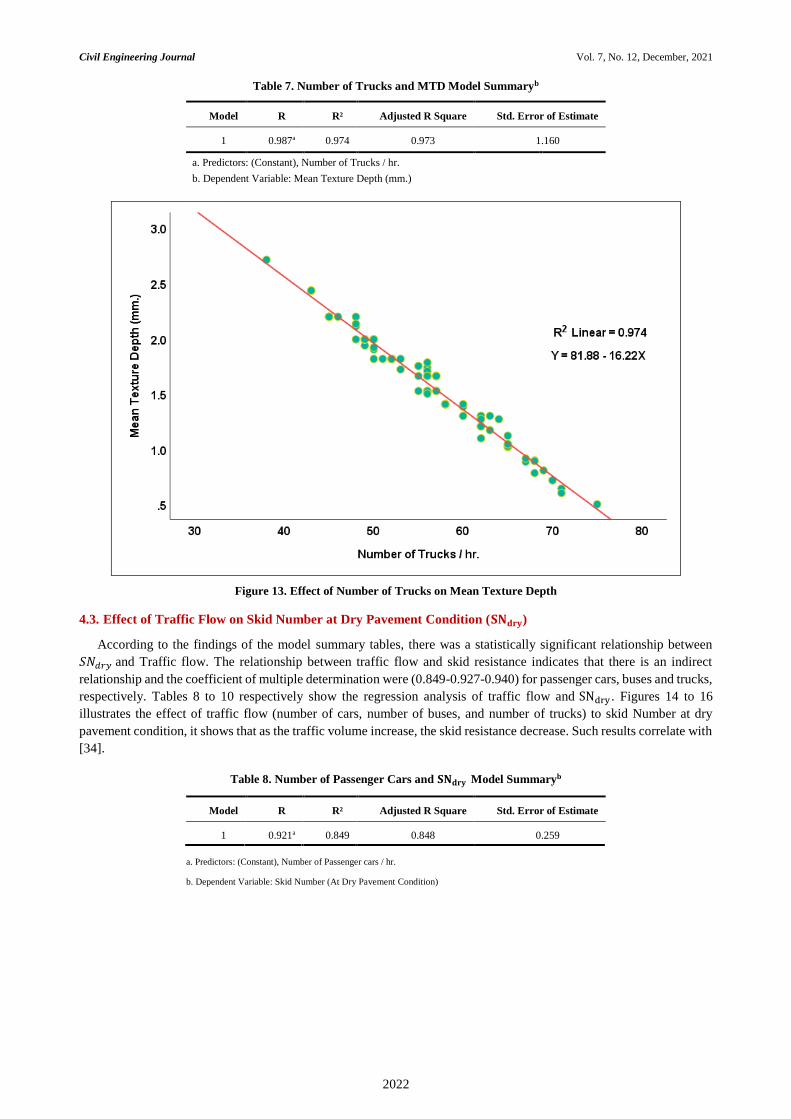
4.2. Effect of Traffic Flow on MTD
According to the findings of the model summary tables, there was a statistically significant relationship between
MTD and Traffic flow, and the impact of MTD on traffic flow was significant. The relationship between traffic flow
and mean texture depth indicates that there is an indirect relationship and the coefficient of multiple determination were
(0.849-0.940-0.974) for passenger cars, buses and trucks, respectively. Tables 5 to 7 illustrate the model summary results
between Traffic flow (number of passenger cars, traffic volume, and number of buses) and MTD. Figures 11 to 13
illustrates the effect of traffic flow (number of cars, number of buses, and number of trucks) to the mean texture depth,
it shows that as the traffic volume increase, the mean texture depth decrease. This decrease in MTD may be due to the
decrease in SN, which is highly affected by traffic flow [34], and the increase in the ratio of uncrushed aggregate, the
increase in traffic volume and the proportion of vehicles lead to the smoothness of paving surface.
Table 5. Number of passenger cars and MTD Model Summaryb
Model R R² Adjusted R Square Std. Error of Estimate
1 0.922a 0.849 0.848 0.1690
a. Predictors: (Constant), Number of Passenger cars / hr.
b. Dependent Variable: Mean Texture Depth (mm.)
Civil Engineering Journal Vol. 7, No. 12, December, 2021
2021
Figure 11. Effect of Number of Cars on Mean Texture Depth.
Table 6. Number of Buses and MTD Model Summaryb
Model R R² Adjusted R Square Std. Error of Estimate
1 0.970a 0.940 0.939 1.856
a. Predictors: (Constant), Number of Buses /hr.
b. Dependent Variable: Mean Texture Depth (mm.)
Figure 12. Effect of Number of Buses on Mean Texture Depth
Civil Engineering Journal Vol. 7, No. 12, December, 2021
2022
Table 7. Number of Trucks and MTD Model Summaryb
Model R R² Adjusted R Square Std. Error of Estimate
1 0.987a 0.974 0.973 1.160
a. Predictors: (Constant), Number of Trucks / hr.
b. Dependent Variable: Mean Texture Depth (mm.)
Figure 13. Effect of Number of Trucks on Mean Texture Depth
4.3. Effect of Traffic Flow on Skid Number at Dry Pavement Condition (𝐒𝐍𝐝𝐫𝐲)
According to the findings of the model summary tables, there was a statistically significant relationship between
𝑆𝑁𝑑𝑟𝑦 and Traffic flow. The relationship between traffic flow and skid resistance indicates that there is an indirect
relationship and the coefficient of multiple determination were (0.849-0.927-0.940) for passenger cars, buses and trucks,
respectively. Tables 8 to 10 respectively show the regression analysis of traffic flow and SNdry . Figures 14 to 16
illustrates the effect of traffic flow (number of cars, number of buses, and number of trucks) to skid Number at dry
pavement condition, it shows that as the traffic volume increase, the skid resistance decrease. Such results correlate with
[34].
Table 8. Number of Passenger Cars and 𝐒𝐍𝐝𝐫𝐲 Model Summaryb
Model R R² Adjusted R Square Std. Error of Estimate
1 0.921a 0.849 0.848 0.259
a. Predictors: (Constant), Number of Passenger cars / hr.
b. Dependent Variable: Skid Number (At Dry Pavement Condition)

Civil Engineering Journal Vol. 7, No. 12, December, 2021
2023
Figure 14. Effect of Number of Passenger Cars on 𝐒𝐍𝐝𝐫𝐲
Table 9. Number of Buses and 𝐒𝐍𝐝𝐫𝐲 Model Summaryb
Model R R² Adjusted R Square Std. Error of Estimate
1 0.963a 0.927 0.926 2.051
a. Predictors: (Constant), Number of Buses /hr.
b. Dependent Variable: Skid Number (At Dry Pavement Condition)
Figure 15. Effect of Number of Buses on 𝐒𝐍𝐝𝐫𝐲
Civil Engineering Journal Vol. 7, No. 12, December, 2021
2024
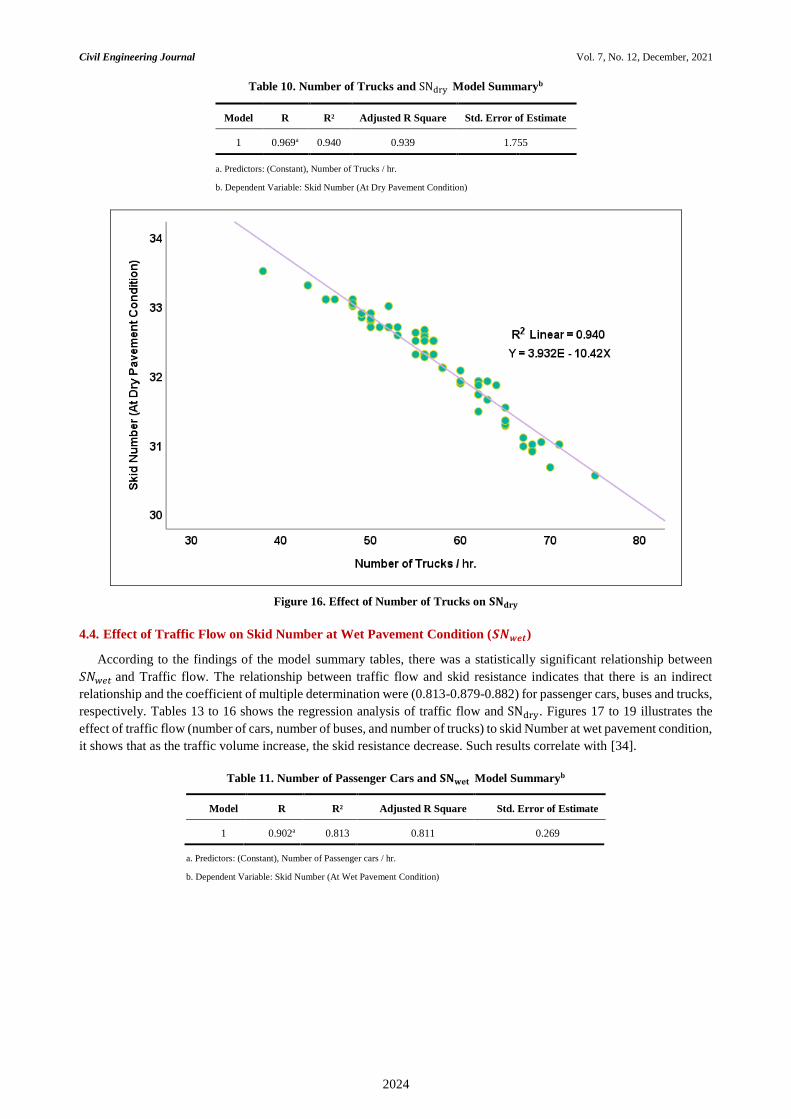
Table 10. Number of Trucks and SNdry Model Summaryb
Model R R² Adjusted R Square Std. Error of Estimate
1 0.969a 0.940 0.939 1.755
a. Predictors: (Constant), Number of Trucks / hr.
b. Dependent Variable: Skid Number (At Dry Pavement Condition)
Figure 16. Effect of Number of Trucks on 𝐒𝐍𝐝𝐫𝐲
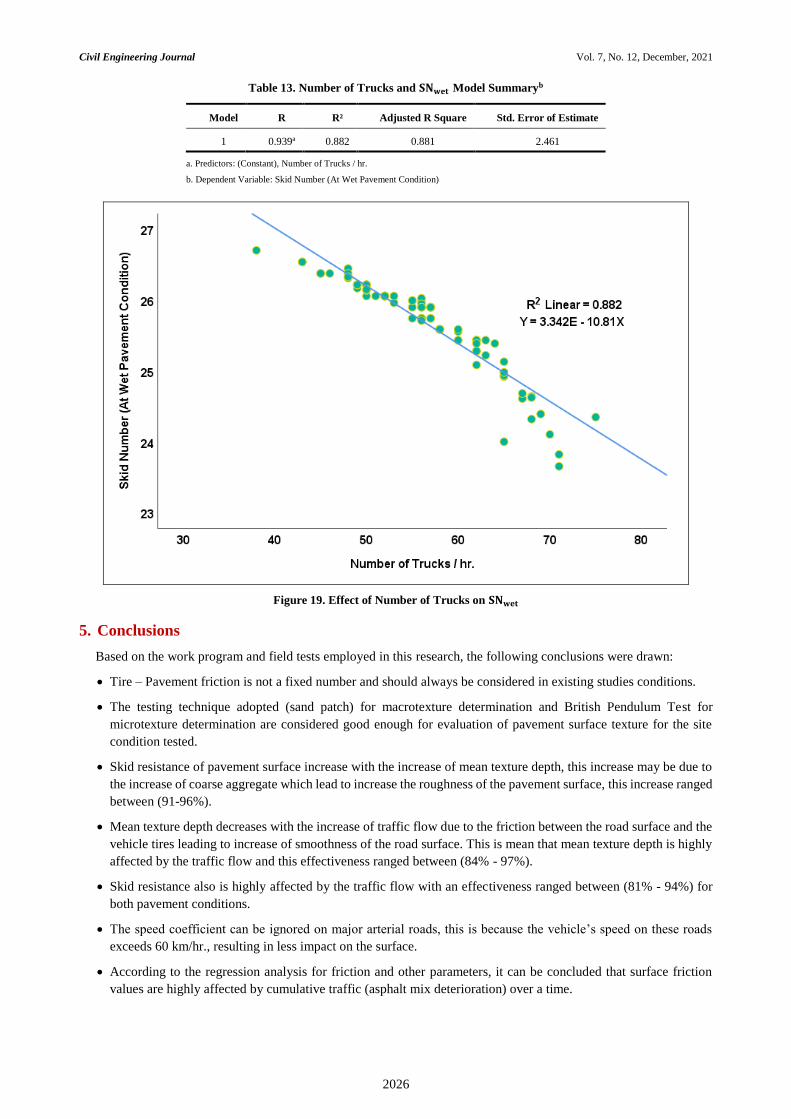
4.4. Effect of Traffic Flow on Skid Number at Wet Pavement Condition (𝑺𝑵𝒘𝒆𝒕)
According to the findings of the model summary tables, there was a statistically significant relationship between
𝑆𝑁𝑤𝑒𝑡 and Traffic flow. The relationship between traffic flow and skid resistance indicates that there is an indirect
relationship and the coefficient of multiple determination were (0.813-0.879-0.882) for passenger cars, buses and trucks,
respectively. Tables 13 to 16 shows the regression analysis of traffic flow and SNdry. Figures 17 to 19 illustrates the
effect of traffic flow (number of cars, number of buses, and number of trucks) to skid Number at wet pavement condition,
it shows that as the traffic volume increase, the skid resistance decrease. Such results correlate with [34].
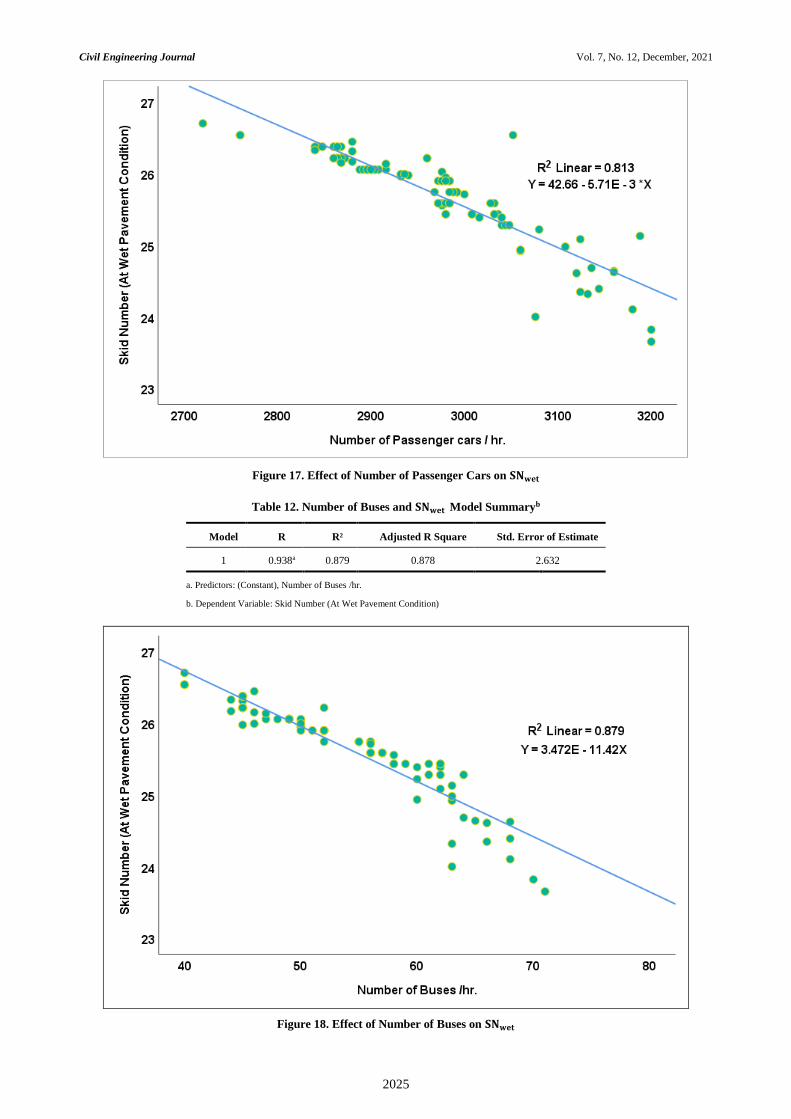
Table 11. Number of Passenger Cars and 𝐒𝐍𝐰𝐞𝐭 Model Summaryb
Model R R² Adjusted R Square Std. Error of Estimate
1 0.902a 0.813 0.811 0.269
a. Predictors: (Constant), Number of Passenger cars / hr.
b. Dependent Variable: Skid Number (At Wet Pavement Condition)
Civil Engineering Journal Vol. 7, No. 12, December, 2021
2025
Figure 17. Effect of Number of Passenger Cars on 𝐒𝐍𝐰𝐞𝐭
Table 12. Number of Buses and 𝐒𝐍𝐰𝐞𝐭 Model Summaryb
Model R R² Adjusted R Square Std. Error of Estimate
1 0.938a 0.879 0.878 2.632
a. Predictors: (Constant), Number of Buses /hr.
b. Dependent Variable: Skid Number (At Wet Pavement Condition)
Figure 18. Effect of Number of Buses on 𝐒𝐍𝐰𝐞𝐭
Civil Engineering Journal Vol. 7, No. 12, December, 2021
2026
Table 13. Number of Trucks and 𝐒𝐍𝐰𝐞𝐭 Model Summaryb
Model R R² Adjusted R Square Std. Error of Estimate
1 0.939ª 0.882 0.881 2.461
a. Predictors: (Constant), Number of Trucks / hr.
b. Dependent Variable: Skid Number (At Wet Pavement Condition)
Figure 19. Effect of Number of Trucks on 𝐒𝐍𝐰𝐞𝐭
5. Conclusions
Based on the work program and field tests employed in this research, the following conclusions were drawn:
Tire – Pavement friction is not a fixed number and should always be considered in existing studies conditions.
The testing technique adopted (sand patch) for macrotexture determination and British Pendulum Test for
microtexture determination are considered good enough for evaluation of pavement surface texture for the site
condition tested.
Skid resistance of pavement surface increase with the increase of mean texture depth, this increase may be due to
the increase of coarse aggregate which lead to increase the roughness of the pavement surface, this increase ranged
between (91-96%).
Mean texture depth decreases with the increase of traffic flow due to the friction between the road surface and the
vehicle tires leading to increase of smoothness of the road surface. This is mean that mean texture depth is highly
affected by the traffic flow and this effectiveness ranged between (84% - 97%).
Skid resistance also is highly affected by the traffic flow with an effectiveness ranged between (81% - 94%) for
both pavement conditions.
The speed coefficient can be ignored on major arterial roads, this is because the vehicle’s speed on these roads
exceeds 60 km/hr., resulting in less impact on the surface.
According to the regression analysis for friction and other parameters, it can be concluded that surface friction
values are highly affected by cumulative traffic (asphalt mix deterioration) over a time.
Civil Engineering Journal Vol. 7, No. 12, December, 2021
2027
6. Declarations
6.1. Author Contributions
Conceptualization, M.Q.I.; methodology, M.Q.I.; software, D.J.M.; writing—original draft preparation, D.J.M.;
writing—review and editing, M.Q.I.; supervision, M.Q.I.; All authors have read and agreed to the published version of
the manuscript.
6.2. Data Availability Statement
The data presented in this study are available in article.
6.3. Funding
This research was funded by the University of Baghdad, College of Engineering, and Department of Civil
Engineering.
6.4. Conflicts of Interest
The authors declare no conflict of interest.
7. References
[1] Wang, Chao, Mohammed A. Quddus, and Stephen G. Ison. “The Effect of Traffic and Road Characteristics on Road Safety: A
Review and Future Research Direction.” Safety Science 57 (2013): 264–75. doi:10.1016/j.ssci.2013.02.012.
[2] Wu, Zhong, and Chris Abadie. “Laboratory and Field Evaluation of Asphalt Pavement Surface Friction Resistance.” Frontiers of
Structural and Civil Engineering 12, no. 3 (2018): 372–81. doi:10.1007/s11709-017-0463-1.
[3] Dewey, George R, Alan C Robords, Brian T Armour, and R Muethel. “Aggregate Wear and Pavement Friction.” Transportation
Research Board, Annual Meeting CD-ROM, (2001): 17.
[4] Hogervorst, D. “Quelques Propriétés Techniques Des Aggrégats Concassés Utilisables Pour Les Couches de Surface Des
Chaussées.” Bulletin of the International Association of Engineering Geology - Bulletin de l’Association Internationale de
Géologie de l’Ingénieur 10, no. 1 (1974): 59–64. doi:10.1007/BF02634635.
[5] Rose J.G., Gallaway B.M., and Hankins K.D. “Macrotexture Measurements and Related Skid Resistance at Speeds from 20 to 60
Miles per Hour.” Highway Research Record, no. 34 (1970): 33–45.
[6] Hall, J. W., Kelly L. Smith, Leslie Titus-Glover, James C. Wambold, Thomas J. Yager, and Zoltan Rado. "Guide for pavement
friction." Final Report for NCHRP Project 1 (2009): 43. doi:10.17226/23038.
[7] Ashby, J T. “Blended Aggregate Study.” Louisiana. Department of Highways. Research and Development Section, (1980).
Available online: https://rosap.ntl.bts.gov/view/dot/21945. (accessed on May 2021).
[8] Bloem, Delmar L. "Skid-Resistance--The Role of Aggregates and Other Factors." National Sand & Gravel Assoc Circulars (1971).
[9] AASHTO. Mechanistic-Empirical Pavement Design Guide: A Manual of Practice. American Association of State Highway and
Transportation Officials, Washington, DC. AASHTO, (2020).
[10] Harish, H. S., N. P. Avinash, and M K Harikeerthan. “Field Evaluation of Longitudinal Skid Resistance on Pavement Surface
in Bangalore City - A Case Study.” The International Journal of Engineering and Science (IJES) 2, no. 6 (2013): 10–18.
[11] Čygas, Donatas, Alfredas Laurinavičius, Audrius Vaitkus, Zigmantas Perveneckas, and Algirdas Motiejunas. “Research of
Asphalt Pavement Structures on Lithuanian Roads (I).” Baltic Journal of Road and Bridge Engineering 3, no. 2 (2008): 77–83.
doi:10.3846/1822-427X.2008.3.77-83.
[12] Greibe, Poul. “Braking Distance, Friction and Behaviour.” Trafitec 376, no. July (2007): 1–85. Available online:
http://www.trafitec.dk/sites/default/files/publications/braking distance - friction and driver behaviour.pdf. (accessed on May
2021).
[13] Noyce, David A., Hussain U. Bahia, Josué M. Yambó, and Guisk Kim. “Incorporating Road Safety into Pavement Management:
Maximizing Asphalt Pavement Surface Friction for Road Safety Improvements.” Midwest Regional University Transportation
Center, 2005, 110.
[14] Henry, John J. Evaluation of Pavement Friction Characteristics. Vol. 291. Transportation Research Board, (2000).
[15] Kogbara, Reginald B., Eyad A. Masad, Emad Kassem, A. Scarpas, and Kumar Anupam. “A State-of-the-Art Review of
Parameters Influencing Measurement and Modeling of Skid Resistance of Asphalt Pavements.” Construction and Building
Materials 114 (2016): 602–17. doi:10.1016/j.conbuildmat.2016.04.002.

Civil Engineering Journal Vol. 7, No. 12, December, 2021
2028
[16] Do, M. T., Z. Tang, M. Kane, and F. de Larrard. “Evolution of Road-Surface Skid-Resistance and Texture Due to Polishing.”
Wear 266, no. 5–6 (2009): 574–77. doi:10.1016/j.wear.2008.04.060.
[17] Schlottmann, Francisco, Anna F. Tyson, Bruce A. Cairns, Carlos Varela, and Anthony G. Charles. “Road Traffic Collisions in
Malawi: Trends and Patterns of Mortality on Scene.” Malawi Medical Journal 29, no. 4 (2017): 301–5. doi:10.4314/mmj.v29i4.4.
[18] Wijnen, Wim, Arno Schroten, and Maarten‘t Hoen. “The Cost of Road Crashes in the Netherlands the Cost of Road Crashes in
the Netherlands an Assessment of Scenarios for Making,” 2017.
[19] Journal, International, Transport Logistics, and Afolabi Oluwaseyi. “Road Traffic Crashes in Nigeria : Causes.” Transport &
Logistics: The International Journal 17, no. 42 (2017): 40–49.
[20] Huang, Helai, Hoong Chor Chin, and Md Mazharul Haque. “Severity of Driver Injury and Vehicle Damage in Traffic Crashes
at Intersections: A Bayesian Hierarchical Analysis.” Accident Analysis and Prevention 40, no. 1 (2008): 45–54.
doi:10.1016/j.aap.2007.04.002.
[21] Staiano, Michael A. “Tire–Pavement Noise and Pavement Texture.” Journal of Transportation Engineering, Part B: Pavements
144, no. 3 (2018): 04018034. doi:10.1061/jpeodx.0000047.
[22] Liu, Qingfan, and Ahmed Shalaby. “Relating Concrete Pavement Noise and Friction to Three-Dimensional Texture Parameters.”
International Journal of Pavement Engineering 18, no. 5 (2017): 450–58. doi:10.1080/10298436.2015.1095897.
[23] Persson, B. N.J. “Theory of Rubber Friction and Contact Mechanics.” Journal of Chemical Physics 115, no. 8 (2001): 3840–61.
doi:10.1063/1.1388626.
[24] Tomita, H. Tire-Pavement Friction Coefficients. Naval Civil: Engineering Lab Port Hueneme CA, (April 1, 1970).
doi:10.21236/AD0705987.
[25] Dunford, Alan. Road Surfaces. Characterisation of Areal Surface Texture. Vol. 9783642364587. University of Nottingham,
2013. doi:10.1007/978-3-642-36458-7_14.
[26] Puzzo, Lorenzo, Giuseppe Loprencipe, Cristina Tozzo, and Antonio D’Andrea. “Three-Dimensional Survey Method of
Pavement Texture Using Photographic Equipment.” Measurement: Journal of the International Measurement Confederation 111
(2017): 146–57. doi:10.1016/j.measurement.2017.07.040.
[27] Kassem, Emad, Ahmed Awed, Eyad Masad, and Dallas Little. “Development of Predictive Model for Skid Loss of Asphalt
Pavements.” Transportation Research Record 2372, no. 2372 (2013): 83–96. doi:10.3141/2372-10.
[28] Al-Assi, Mohammad, Emad Kassem, and Richard Nielsen. “Using Close-Range Photogrammetry to Measure Pavement Texture
Characteristics and Predict Pavement Friction.” Transportation Research Record 2674, no. 10 (2020): 794–805.
doi:10.1177/0361198120936650.
[29] Khasawneh, Mohammad, and Robert Y Liang. “Correlation Study between Locked Wheel Skid Trailer and Dynamic Friction
Tester,” (2008).
[30] Åström, Henrik, and Carl-Gustaf Wallman. “Friction Measurement Methods and the Correlation between Road Friction and
Traffic Safety. A Literature Review.” Statens väg-och transportforskningsinstitut Vti, (2001).
[31] Gillespie, Thomas D. “Fundamentals of Vehicle Dynamics.” Fundamentals of Vehicle Dynamics, (1992). doi:10.4271/r-114.
[32] Sarsam, S I. “Modelling Asphalt Pavement Surface Texture Using Field Measurements.” In Proceedings, TRB–Conference,
Developing a Research Agenda for Transportation Infrastructure Preservation and Renewal, Washington DC, November, 12–
13. Washington DC, (2009).
[33] Tests, Resistance. Standard Test Method for Measuring Surface Frictional Properties Using the British. Vol. 93. Conshohocken,
PA, USA: ASTM International West, 2014. doi:10.1520/E0303-93R13.2.
[34] Abdallah, Ahmed M, Ahmed E Abu Elmaaty, and Mohamed G Alzoghby. “Assessment of Surface Friction Characteristics for
Egyptian Highways.” Assessment 15, no. 1 (2019): 41–54.
[35] Plati, Christina, Maria Pomoni, and Konstantina Georgouli. “Quantification of Skid Resistance Seasonal Variation in Asphalt
Pavements.” Journal of Traffic and Transportation Engineering (English Edition) 7, no. 2 (2020): 237–48.
doi:10.1016/j.jtte.2018.07.003.
[36] Afonso, Marcia Lopes, Marisa Dinis-Almeida, and Cristina Sena Fael. “Characterization of the Skid Resistance and Mean
Texture Depth in a Permeable Asphalt Pavement.” IOP Conference Series: Materials Science and Engineering 471, no. 2 (2019):
22029. doi:10.1088/1757-899X/471/2/022029.
[37] PIARC World Road Association. "Report of the committee on surface characteristics." In Proceeding of XVIII World Road
Congress, pp. 13-19. (1987): 13-19.
[38] Tsubota, Takahiro, Celso Fernando, Toshio Yoshii, and Hirotoshi Shirayanagi. “Effect of Road Pavement Types and Ages on
Traffic Accident Risks.” Transportation Research Procedia 34 (2018): 211–18. doi:10.1016/j.trpro.2018.11.034.
Civil Engineering Journal Vol. 7, No. 12, December, 2021
2029
[39] Roe, Peter, and S Hartshorme. The Polished Stone Value of Aggregates and In-Service Skidding Resistance. Transport Research
Laboratory, (1998).
[40] Flintsch, Gw, K McGhee, Edgar De León Izeppi, and S Najafi. “The Little Book of Tire Pavement Friction.” Pavement Surface
Properties Consortium 1, no. September (2012): 1–22.
[41] Mcquaid, Grainne, Phillip Millar, David Woodward, Shore Road, Northern Ireland, Shaun Friel, Sutton Coldfield, and West
Midlands B. “Use of Close Range Photogrammetry To Assess the Micro-Texture Of.” International Journal of Pavements
Conference, São Paulo, Brazil, (2013).
[42] Shalaby A., and EL Gendy A. “Three-Dimensional Pavement Surface Macrotexture Measurements Using the Photometric Stereo
Technique and Applications.” 6th International Symposium on Pavement Surface Characteristics SURF 2008, Portorož, (2008).
[43] Descornet, Guy. “Criterion for Optimizing Surface Characteristics.” Transportation Research Record, no. 1215 (1989): 173–77.
[44] Wambold, J, and J Henry. “International Piarc Experiment to Compare and Harmonize Texture and Skid Resistance
Measurement.” Nordic Road and Transport Research, (1994).
[45] Schlosser, Leonard H M. “Traffic Accidents and Road Surface Skidding Resistance.” Transportation Research Record 623
(1977): 11–20.
[46] Sukor, Nur Sabahiah Abdul, Ari K.M. Tarigan, and Satoshi Fujii. “Analysis of Correlations between Psychological Factors and
Self-Reported Behavior of Motorcyclists in Malaysia, Depending on Self-Reported Usage of Different Types of Motorcycle
Facility.” Transportation Research Part F: Traffic Psychology and Behaviour 46 (2017): 509–23. doi:10.1016/j.trf.2016.09.032.
[47] Abdul Manan, Muhammad Marizwan, Jen Sim Ho, Syed Tajul Malik Syed Tajul Arif, Muhammad Ruhaizat Abdul Ghani, and
András Várhelyi. “Factors Associated with Motorcyclists’ Speed Behaviour on Malaysian Roads.” Transportation Research Part
F: Traffic Psychology and Behaviour 50 (2017): 109–27. doi:10.1016/j.trf.2017.08.006.
[48] McCarthy, Ross, Gerardo Flintsch, and Edgar de León Izeppi. “Impact of Skid Resistance on Dry and Wet Weather Crashes.”
Journal of Transportation Engineering, Part B: Pavements 147, no. 3 (2021): 04021029. doi:10.1061/jpeodx.0000286.
[49] E965 − 15. “Standard Test Method for Measuring Pavement Macrotexture Depth Using a Volumetric Technique1,” (2018).
Related Documents