
Welcome message from author
This document is posted to help you gain knowledge. Please leave a comment to let me know what you think about it! Share it to your friends and learn new things together.
Transcript


Sample Chapter
Copyright © 2013 by Alberto Ferrari, Marco RussoAll rights reserved.
ISBN: 978-0-7356-7634-3
To learn more about this book visit:http://www.sqlbi.com/books/excel-2013-building-data-models-with-powerpivot
To view our international courses calendar on PowerPivot visit:http://www.powerpivotworkshop.com

v
Contents
Introduction . . . . . . . . . . . . . . . . . . . . . . . . . . . . . . . . . . . . . . . . . . . . . . . . . . . . xiii
Chapter 1 Introduction to PowerPivot 1Using a PivotTable on an Excel table . . . . . . . . . . . . . . . . . . . . . . . . . . . . . . . . . 2
Using PowerPivot in Microsoft Office 2013 . . . . . . . . . . . . . . . . . . . . . . . . . . . 5
Adding information to the Excel table . . . . . . . . . . . . . . . . . . . . . . . . . . 6
Creating a data model with many tables . . . . . . . . . . . . . . . . . . . . . . . . 8
Understanding relationships . . . . . . . . . . . . . . . . . . . . . . . . . . . . . . . . .11
Understanding the data model . . . . . . . . . . . . . . . . . . . . . . . . . . . . . . . . . . . .13
Querying the data model . . . . . . . . . . . . . . . . . . . . . . . . . . . . . . . . . . . .14
The PowerPivot add-In . . . . . . . . . . . . . . . . . . . . . . . . . . . . . . . . . . . . . . . . . . . .15
Using OLAP tools and converting to formulas . . . . . . . . . . . . . . . . . . . . . . .18
Understanding PowerPivot for Excel 2013 . . . . . . . . . . . . . . . . . . . . . . . . . . .23
Creating a Power View report . . . . . . . . . . . . . . . . . . . . . . . . . . . . . . . . . . . . . .25
Chapter 2 Using the unique features of PowerPivot 31Loading data from external sources . . . . . . . . . . . . . . . . . . . . . . . . . . . . . . . .31
Creating a PowerPivot PivotTable . . . . . . . . . . . . . . . . . . . . . . . . . . . . .35
Using the DAX language . . . . . . . . . . . . . . . . . . . . . . . . . . . . . . . . . . . . . . . . . .37
Creating a calculated column . . . . . . . . . . . . . . . . . . . . . . . . . . . . . . . .37
Creating a calculated field . . . . . . . . . . . . . . . . . . . . . . . . . . . . . . . . . . .41
Computing complex aggregations like Distinct Count . . . . . . . . . . .44
Refreshing the PowerPivot data model . . . . . . . . . . . . . . . . . . . . . . . . . . . . . .48

vi Contents
Chapter 3 Introducing DAX 49Understanding DAX calculations . . . . . . . . . . . . . . . . . . . . . . . . . . . . . . . . . . .49
DAX syntax . . . . . . . . . . . . . . . . . . . . . . . . . . . . . . . . . . . . . . . . . . . . . . . .49
DAX data types . . . . . . . . . . . . . . . . . . . . . . . . . . . . . . . . . . . . . . . . . . . . .50
DAX operators . . . . . . . . . . . . . . . . . . . . . . . . . . . . . . . . . . . . . . . . . . . . .52
DAX values . . . . . . . . . . . . . . . . . . . . . . . . . . . . . . . . . . . . . . . . . . . . . . . .53
Understanding calculated columns and fields . . . . . . . . . . . . . . . . . . . . . . . .54
Calculated columns . . . . . . . . . . . . . . . . . . . . . . . . . . . . . . . . . . . . . . . . .54
Calculated fields . . . . . . . . . . . . . . . . . . . . . . . . . . . . . . . . . . . . . . . . . . . .55
Handling errors in DAX expressions . . . . . . . . . . . . . . . . . . . . . . . . . . . . . . . .60
Conversion errors . . . . . . . . . . . . . . . . . . . . . . . . . . . . . . . . . . . . . . . . . . .60
Arithmetical operations . . . . . . . . . . . . . . . . . . . . . . . . . . . . . . . . . . . . .61
Intercepting errors . . . . . . . . . . . . . . . . . . . . . . . . . . . . . . . . . . . . . . . . . .63
Formatting DAX code . . . . . . . . . . . . . . . . . . . . . . . . . . . . . . . . . . . . . . . . . . . .65
Common DAX functions . . . . . . . . . . . . . . . . . . . . . . . . . . . . . . . . . . . . . . . . . .68
Aggregate functions . . . . . . . . . . . . . . . . . . . . . . . . . . . . . . . . . . . . . . . .68
Logical functions . . . . . . . . . . . . . . . . . . . . . . . . . . . . . . . . . . . . . . . . . . .71
Information functions . . . . . . . . . . . . . . . . . . . . . . . . . . . . . . . . . . . . . . .72
Mathematical functions . . . . . . . . . . . . . . . . . . . . . . . . . . . . . . . . . . . . .74
Text functions . . . . . . . . . . . . . . . . . . . . . . . . . . . . . . . . . . . . . . . . . . . . . .74
Conversion functions . . . . . . . . . . . . . . . . . . . . . . . . . . . . . . . . . . . . . . . .75
Date and time functions . . . . . . . . . . . . . . . . . . . . . . . . . . . . . . . . . . . . .76
Relational functions . . . . . . . . . . . . . . . . . . . . . . . . . . . . . . . . . . . . . . . . .77
Using basic DAX functions . . . . . . . . . . . . . . . . . . . . . . . . . . . . . . . . . . . . . . . .78
Chapter 4 Understanding data models 83Understanding the basics of data modeling . . . . . . . . . . . . . . . . . . . . . . . . .83
Producing a report without a data model . . . . . . . . . . . . . . . . . . . . . .84
Building a data model . . . . . . . . . . . . . . . . . . . . . . . . . . . . . . . . . . . . . . .88
More about relationships . . . . . . . . . . . . . . . . . . . . . . . . . . . . . . . . . . . . . . . . .89
Understanding normalization and denormalization . . . . . . . . . . . . . . . . . .91
Denormalizing within SQL queries . . . . . . . . . . . . . . . . . . . . . . . . . . . . . . . . . .95
The PowerPivot query designer . . . . . . . . . . . . . . . . . . . . . . . . . . . . . . .95
When to denormalize tables . . . . . . . . . . . . . . . . . . . . . . . . . . . . . . . .102

Contents vii
Understanding over-denormalization . . . . . . . . . . . . . . . . . . . . . . . . . . . . . .104
Understanding OLTP and data marts . . . . . . . . . . . . . . . . . . . . . . . . . . . . . .106
Querying the OLTP database . . . . . . . . . . . . . . . . . . . . . . . . . . . . . . . .107
Data marts, facts, and dimensions . . . . . . . . . . . . . . . . . . . . . . . . . . .110
Star schemas . . . . . . . . . . . . . . . . . . . . . . . . . . . . . . . . . . . . . . . . . . . . . .111
Which database is the best to query? . . . . . . . . . . . . . . . . . . . . . . . .112
Using advanced relationships . . . . . . . . . . . . . . . . . . . . . . . . . . . . . . . . . . . . .112
Chapter 5 Publishing to SharePoint 117SharePoint 2013 and PowerPivot integration . . . . . . . . . . . . . . . . . . . . . . .117
Licensing and setup . . . . . . . . . . . . . . . . . . . . . . . . . . . . . . . . . . . . . . . . . . . . .118
Publishing a workbook to SharePoint . . . . . . . . . . . . . . . . . . . . . . . . . . . . . .118
Using the PowerPivot Gallery . . . . . . . . . . . . . . . . . . . . . . . . . . . . . . . . . . . . .123
Connecting Excel to a SharePoint Excel data model . . . . . . . . . . . . . . . . .125
Creating a Power View report . . . . . . . . . . . . . . . . . . . . . . . . . . . . . . . . . . . . .127
Managing the PowerPivot data refresh . . . . . . . . . . . . . . . . . . . . . . . . . . . .129
Chapter 6 Loading data 133Understanding data sources . . . . . . . . . . . . . . . . . . . . . . . . . . . . . . . . . . . . . .133
Loading from a database . . . . . . . . . . . . . . . . . . . . . . . . . . . . . . . . . . . . . . . . .135
Loading from a list of tables . . . . . . . . . . . . . . . . . . . . . . . . . . . . . . . .137
Loading relationships . . . . . . . . . . . . . . . . . . . . . . . . . . . . . . . . . . . . . .139
Selecting related tables . . . . . . . . . . . . . . . . . . . . . . . . . . . . . . . . . . . . .140
Loading from a SQL query . . . . . . . . . . . . . . . . . . . . . . . . . . . . . . . . . .141
Loading from views . . . . . . . . . . . . . . . . . . . . . . . . . . . . . . . . . . . . . . . .142
Opening existing connections . . . . . . . . . . . . . . . . . . . . . . . . . . . . . . . . . . . .143
Loading from Access . . . . . . . . . . . . . . . . . . . . . . . . . . . . . . . . . . . . . . . . . . . .144
Loading from SQL Server Analysis Services . . . . . . . . . . . . . . . . . . . . . . . . .146
Using the MDX editor . . . . . . . . . . . . . . . . . . . . . . . . . . . . . . . . . . . . . .148
Handling of keys in the OLAP cube . . . . . . . . . . . . . . . . . . . . . . . . . .150
Loading from a tabular database . . . . . . . . . . . . . . . . . . . . . . . . . . . .152
Loading from SharePoint . . . . . . . . . . . . . . . . . . . . . . . . . . . . . . . . . . . . . . . . .153

viii Contents
Using linked tables . . . . . . . . . . . . . . . . . . . . . . . . . . . . . . . . . . . . . . . . . . . . . .157
Loading from Excel files . . . . . . . . . . . . . . . . . . . . . . . . . . . . . . . . . . . . . . . . . .160
Loading from text files . . . . . . . . . . . . . . . . . . . . . . . . . . . . . . . . . . . . . . . . . . .163
Loading from the Clipboard . . . . . . . . . . . . . . . . . . . . . . . . . . . . . . . . . . . . . .165
Loading from a report . . . . . . . . . . . . . . . . . . . . . . . . . . . . . . . . . . . . . . . . . . .167
Loading from a data feed . . . . . . . . . . . . . . . . . . . . . . . . . . . . . . . . . . . . . . . .171
Loading from Windows Azure Marketplace . . . . . . . . . . . . . . . . . . . . . . . . .173
Suggest related data . . . . . . . . . . . . . . . . . . . . . . . . . . . . . . . . . . . . . . .176
Refreshing connections . . . . . . . . . . . . . . . . . . . . . . . . . . . . . . . . . . . . . . . . . .176
Chapter 7 Understanding evaluation contexts 179Introduction to evaluation contexts . . . . . . . . . . . . . . . . . . . . . . . . . . . . . . .180
Understanding the row context . . . . . . . . . . . . . . . . . . . . . . . . . . . . .184
Testing your evaluation context understanding . . . . . . . . . . . . . . . . . . . . .185
Using SUM in a calculated column . . . . . . . . . . . . . . . . . . . . . . . . . . .185
Using fields in a calculated field . . . . . . . . . . . . . . . . . . . . . . . . . . . . .186
Creating a row context with iterators . . . . . . . . . . . . . . . . . . . . . . . . . . . . . .189
Understanding FILTER, ALL, and context interactions . . . . . . . . . . . . . . . .192
Working with many tables . . . . . . . . . . . . . . . . . . . . . . . . . . . . . . . . . . . . . . . .195
Row contexts and relationships . . . . . . . . . . . . . . . . . . . . . . . . . . . . . .196
Filter context and relationships . . . . . . . . . . . . . . . . . . . . . . . . . . . . . .198
Introducing VALUES . . . . . . . . . . . . . . . . . . . . . . . . . . . . . . . . . . . . . . . .199
Introducing ISFILTERED and ISCROSSFILTERED . . . . . . . . . . . . . . . . 201
Evaluation contexts recap . . . . . . . . . . . . . . . . . . . . . . . . . . . . . . . . . . . . . . . .205
Creating a parameter table . . . . . . . . . . . . . . . . . . . . . . . . . . . . . . . . . . . . . . .206
Chapter 8 Understanding CALCULATE 209Why is CALCULATE needed? . . . . . . . . . . . . . . . . . . . . . . . . . . . . . . . . . . . . . .209
CALCULATE examples . . . . . . . . . . . . . . . . . . . . . . . . . . . . . . . . . . . . . . . . . . .213
Filtering a single column . . . . . . . . . . . . . . . . . . . . . . . . . . . . . . . . . . . .213
Filtering with complex conditions . . . . . . . . . . . . . . . . . . . . . . . . . . . .218
Using CALCULATE inside a row context . . . . . . . . . . . . . . . . . . . . . . . . . . . .222

Contents ix
Understanding circular dependencies . . . . . . . . . . . . . . . . . . . . . . . . . . . . . .225
CALCULATE rules . . . . . . . . . . . . . . . . . . . . . . . . . . . . . . . . . . . . . . . . . . . . . . . .229
Understanding ALLSELECTED . . . . . . . . . . . . . . . . . . . . . . . . . . . . . . . . . . . . .230
Chapter 9 Using Hierarchies 233Understanding Hierarchies . . . . . . . . . . . . . . . . . . . . . . . . . . . . . . . . . . . . . . .233
When to Build Hierarchies . . . . . . . . . . . . . . . . . . . . . . . . . . . . . . . . . .235
Building Hierarchies . . . . . . . . . . . . . . . . . . . . . . . . . . . . . . . . . . . . . . . .235
Creating Hierarchies on Multiple Tables . . . . . . . . . . . . . . . . . . . . . .236
Performing Calculations Using Hierarchies . . . . . . . . . . . . . . . . . . . .238
Using Parent/Child Hierarchies . . . . . . . . . . . . . . . . . . . . . . . . . . . . . . . . . . . .248
Chapter 10 Using Power View 261What Is Power View? . . . . . . . . . . . . . . . . . . . . . . . . . . . . . . . . . . . . . . . . . . . .261
Power View Basics . . . . . . . . . . . . . . . . . . . . . . . . . . . . . . . . . . . . . . . . . . . . . . .262
Using the Filters Pane . . . . . . . . . . . . . . . . . . . . . . . . . . . . . . . . . . . . . .265
Decorating Your Report . . . . . . . . . . . . . . . . . . . . . . . . . . . . . . . . . . . .267
Understanding Table, Matrix, and Cards . . . . . . . . . . . . . . . . . . . . . . . . . . .268
Using the Matrix Visualization . . . . . . . . . . . . . . . . . . . . . . . . . . . . . . .269
Using the Card Visualization . . . . . . . . . . . . . . . . . . . . . . . . . . . . . . . .270
Using a Table as a Slicer . . . . . . . . . . . . . . . . . . . . . . . . . . . . . . . . . . . .272
Using Charts . . . . . . . . . . . . . . . . . . . . . . . . . . . . . . . . . . . . . . . . . . . . . . . . . . . .272
Using the Line Chart . . . . . . . . . . . . . . . . . . . . . . . . . . . . . . . . . . . . . . .273
Using the Pie Chart . . . . . . . . . . . . . . . . . . . . . . . . . . . . . . . . . . . . . . . .274
Using the Scatter Chart . . . . . . . . . . . . . . . . . . . . . . . . . . . . . . . . . . . . .275
Using Maps . . . . . . . . . . . . . . . . . . . . . . . . . . . . . . . . . . . . . . . . . . . . . . . . . . . . .277
Understanding Drill-Down . . . . . . . . . . . . . . . . . . . . . . . . . . . . . . . . . . . . . . .281
Using Tiles . . . . . . . . . . . . . . . . . . . . . . . . . . . . . . . . . . . . . . . . . . . . . . . . . . . . .283
Understanding Multipliers . . . . . . . . . . . . . . . . . . . . . . . . . . . . . . . . . . . . . . . .286
Using Power View Effectively . . . . . . . . . . . . . . . . . . . . . . . . . . . . . . . . . . . . .287

x Contents
Chapter 11 Shaping the Reports 289Key Performance Indicators (KPIs) . . . . . . . . . . . . . . . . . . . . . . . . . . . . . . . . .289
Creating data models for Power View . . . . . . . . . . . . . . . . . . . . . . . . . . . . . .299
Understanding Power View metadata . . . . . . . . . . . . . . . . . . . . . . . . . . . . .304
Using Summarize By . . . . . . . . . . . . . . . . . . . . . . . . . . . . . . . . . . . . . . .305
Using the default field set . . . . . . . . . . . . . . . . . . . . . . . . . . . . . . . . . . .308
Using the Table Behavior dialog box . . . . . . . . . . . . . . . . . . . . . . . . .309
Defining sets . . . . . . . . . . . . . . . . . . . . . . . . . . . . . . . . . . . . . . . . . . . . . . . . . . .310
Creating dynamic sets with MDX . . . . . . . . . . . . . . . . . . . . . . . . . . . . . . . . . .314
Using perspectives . . . . . . . . . . . . . . . . . . . . . . . . . . . . . . . . . . . . . . . . . . . . . .318
Understanding drill-through . . . . . . . . . . . . . . . . . . . . . . . . . . . . . . . . . . . . . .322
Chapter 12 Performing Date Calculations in DAX 323Building a calendar table . . . . . . . . . . . . . . . . . . . . . . . . . . . . . . . . . . . . . . . . .323
Working with multiple calendar tables . . . . . . . . . . . . . . . . . . . . . . .326
Calculating working days . . . . . . . . . . . . . . . . . . . . . . . . . . . . . . . . . . .329
Computing the difference in working days . . . . . . . . . . . . . . . . . . . .335
Aggregating and comparing over time . . . . . . . . . . . . . . . . . . . . . . . . . . . .339
Year-to-Date (YTD), Quarter-to-Date (QTD), and Month-to-Date (MTD) . . . . . . . . . . . . . . . . . . . . . . . . . . . . . . . . . . . . . .339
Time intelligence with CALCULATE . . . . . . . . . . . . . . . . . . . . . . . . . . .343
Computing periods from the prior year (PY) . . . . . . . . . . . . . . . . . .346
Computing the moving annual total . . . . . . . . . . . . . . . . . . . . . . . . .348
Using other aggregation functions . . . . . . . . . . . . . . . . . . . . . . . . . . .349
Computing difference over a previous year . . . . . . . . . . . . . . . . . . .351
Closing balance over time . . . . . . . . . . . . . . . . . . . . . . . . . . . . . . . . . . . . . . . .353
Semiadditive measures . . . . . . . . . . . . . . . . . . . . . . . . . . . . . . . . . . . . .353
OPENINGBALANCE and CLOSINGBALANCE functions . . . . . . . . . .356
Updating balances by using transactions . . . . . . . . . . . . . . . . . . . . .360
Computing moving averages . . . . . . . . . . . . . . . . . . . . . . . . . . . . . . . . . . . . .363

Contents xi
Chapter 13 Using Advanced DAX 369Banding . . . . . . . . . . . . . . . . . . . . . . . . . . . . . . . . . . . . . . . . . . . . . . . . . . . . . . . .369
Ranking . . . . . . . . . . . . . . . . . . . . . . . . . . . . . . . . . . . . . . . . . . . . . . . . . . . . . . . .374
Using many-to-many relationships . . . . . . . . . . . . . . . . . . . . . . . . . . . . . . . .382
Computing new and returning customers . . . . . . . . . . . . . . . . . . . . . . . . . .386
Understanding KEEPFILTERS . . . . . . . . . . . . . . . . . . . . . . . . . . . . . . . . . . . . . 390
Implementing basket analysis . . . . . . . . . . . . . . . . . . . . . . . . . . . . . . . . . . . . .400
Understanding the power of calculated columns: ABC analysis . . . . . . . .408
Handling currency conversion . . . . . . . . . . . . . . . . . . . . . . . . . . . . . . . . . . . .412
Chapter 14 Using DAX as a Query Language 417Understanding EVALUATE . . . . . . . . . . . . . . . . . . . . . . . . . . . . . . . . . . . . . . . .417
Creating an Excel table with EVALUATE . . . . . . . . . . . . . . . . . . . . . . . . . . . .418
Using common functions in queries . . . . . . . . . . . . . . . . . . . . . . . . . . . . . . .423
Using FILTER . . . . . . . . . . . . . . . . . . . . . . . . . . . . . . . . . . . . . . . . . . . . . .423
Using CALCULATETABLE . . . . . . . . . . . . . . . . . . . . . . . . . . . . . . . . . . . .424
Using ADDCOLUMNS . . . . . . . . . . . . . . . . . . . . . . . . . . . . . . . . . . . . . . . . . . . .425
Using VALUES with ADDCOLUMNS . . . . . . . . . . . . . . . . . . . . . . . . . .426
Using SUMMARIZE . . . . . . . . . . . . . . . . . . . . . . . . . . . . . . . . . . . . . . . . . . . . . .427
Using the ROLLUP option . . . . . . . . . . . . . . . . . . . . . . . . . . . . . . . . . . .430
Linking back a DAX query . . . . . . . . . . . . . . . . . . . . . . . . . . . . . . . . . . . . . . . .431
Computing ABC analysis with a linked-back table . . . . . . . . . . . . . . . . . . .435
Using CROSSJOIN . . . . . . . . . . . . . . . . . . . . . . . . . . . . . . . . . . . . . . . . . . . . . . .439
Using GENERATE . . . . . . . . . . . . . . . . . . . . . . . . . . . . . . . . . . . . . . . . . . . . . . . .440
Querying with DAX Studio . . . . . . . . . . . . . . . . . . . . . . . . . . . . . . . . . . . . . . .443
Chapter 15 Automating Operations Using VBA 445Enabling the DEVELOPER tab of the ribbon . . . . . . . . . . . . . . . . . . . . . . . . .445
Updating a linked-back DAX query through VBA . . . . . . . . . . . . . . . . . . . .451
Using the Model object . . . . . . . . . . . . . . . . . . . . . . . . . . . . . . . . . . . . . . . . . .455

xii Contents
Importing data into the data model using VBA . . . . . . . . . . . . . . . . . . . . .456
Understanding data connections . . . . . . . . . . . . . . . . . . . . . . . . . . . . . . . . . .459
Chapter 16 Comparing Excel and SQL Server Analysis Services 463Understanding the different versions of the engine . . . . . . . . . . . . . . . . .463
Feature matrix . . . . . . . . . . . . . . . . . . . . . . . . . . . . . . . . . . . . . . . . . . . . . . . . . .464
Securing your data . . . . . . . . . . . . . . . . . . . . . . . . . . . . . . . . . . . . . . . . . . . . . .465
Programmability and flexibility . . . . . . . . . . . . . . . . . . . . . . . . . . . . . . . . . . .466
Translations . . . . . . . . . . . . . . . . . . . . . . . . . . . . . . . . . . . . . . . . . . . . . . . . . . . .468
Database size . . . . . . . . . . . . . . . . . . . . . . . . . . . . . . . . . . . . . . . . . . . . . . . . . . .469
Number of databases . . . . . . . . . . . . . . . . . . . . . . . . . . . . . . . . . . . . . . . . . . . .471
PowerPivot as a prototyping system . . . . . . . . . . . . . . . . . . . . . . . . . . . . . . .472
Index 473

xiii
Introduction
Microsoft Excel is the world standard for performing data analysis. Its ease of use and power make the Excel spreadsheet the tool that everybody uses, regardless
of the kind of information being analyzed.
You can use Excel to store your personal expenses, your current account information, your customer information or a complex business plan, or even your weight-loss progressduringahard-to-followdiet.Thepossibilitiesareinfinite—wearenotevengoing to try to start enumerating all the kind of information you can analyze with Excel. The fact is that if you have some data to arrange and analyze, your chances are excellent that Excel will be the perfect tool to use. You can easily arrange data in a tabular format, update it, generate charts, PivotTables, and calculations based on it, and make forecasts with relatively limited knowledge of the software. With the advent of the cloud, now you can use Excel on mobile devices like tablets and smart phones, too, using Internet to have constant access to your information. Also, in earlier versions of Excel, there was a limit of 65,536 rows per single worksheet, and the fact that so many customers asked Microsoft to increase this number (which Microsoft did, raising the limit to 1 million rows in Excel 2007) is a clear indication that users want Excel to store and analyze large amounts of data.
Besides Excel users, there is another category of people dedicating their professional lives to data analysis: business intelligence (BI) professionals. BI is the science of getting insights from large amounts of information, and, in recent years, BI professionals have learned and created many new techniques and tools to manage systems that can handle the range of hundreds of millions or even billions of rows. BI systems require the effort of many professionals and expensive hardware to run. They are powerful, but they are expensive and slow to build, which are serious disadvantages.
Before 2010, there was a clear separation between the analysis of small and large amountsofdata:ExcelononesideandcomplexBIsystemsontheother.Afirststepin the direction of merging the two worlds was already present in Excel because the PivotTable tool had the ability to query BI systems. By doing that, data analysts could query large BI systems and get the best of both worlds because the result of such a query can be put into an Excel PivotTable, and thus they could use it to perform further analysis.
In 2010, Microsoft made a strong move to break down the wall between BI professionals and Excel users by introducing xVelocity, a powerful engine that drives large BI solutions directly inside Excel. That happened when Microsoft SQL Server 2008

xiv Introduction
R2 PowerPivot for Excel was released as a free add-in to Excel 2010. The goal was to make the creation of BI solutions so easy that Excel would start to be not only a BI client, but also a BI server, capable of hosting complex BI solutions on a notebook. They called it self-service BI.
Microsoft PowerPivot has no limits on the number of rows it can store: if you need to handle 100 million rows, you can safely do so, and the speed of analysis is amazing. PowerPivot also introduced the DAX language, a powerful programming language aimed to create BI solutions, not only Excel formulas. Finally, PowerPivot is able to compress data in such a way that large amounts of information can be stored in relativelysmallworkbooks.Butthiswasonlythefirststep.
TheseconddefinitivesteptobringthepowerofBItouserswastheintroductionofExcel 2013. PowerPivot is no longer a separate add-in of Excel; now it is an inherent part of the Excel technology and brings the power of the xVelocity engine to every Excel user. The era of self-service BI started in 2010, and it has advanced in 2013.
Because you are reading this introduction, you are probably interested in joining the self-service BI wave, and you want to learn how to master PowerPivot for Excel. You will needtolearnthebasicsofthetool,butthisisonlythefirststep.Then,youwillneedtolearnhowtoshapeyourdatasothatyoucanexecuteanalysisefficiently:wecallthis data modeling. Finally, you will need to learn the DAX language and master all its concepts so you can get the best out of it. If that is what you want, then this is the book for you.
We are BI professionals, and we know from experience that building a BI solution is not easy. We do not want to mislead you: BI is a fascinating technology, but it is also a hard one. This book is designed to help you take the necessary steps to transform you from an Excel user to a self-service BI modeler. It will be a long road that will require timeanddedicationtotravel,andyouwillfindyourselfmakingtheadaptationsyouneed to learn new techniques. However, the results you will be able to accomplish are invaluable.
The book is not a step-by-step guide to PowerPivot for Excel 2013. If you are looking for a PowerPivot for Dummies book, then this is not the book for you. But if you want abookthatwillgowithyouonthislong,satisfyingjourney,fromthefirstsimple workbooks to the complex simulations you will be creating soon, then this is your ultimate resource.
When writing this book, we decided to focus on concepts and real-world examples, starting at zero and bringing you to mastering the DAX language. We do not cover every single feature, and we do not explain each operation in a “Click this, and then

Introduction xv
do that” fashion. On the other hand, we packed in this single book a huge amount ofinformationsothat,onceyoufinishedstudyingthebook,youwillhaveagreat background in the new modeling options of Excel.
This last sentence highlights the main characteristic of this book: it is a book to study,notjusttoread.Getpreparedforalongtrip—butwepromiseyouthatitwillbewell worth it.
Who this book is for
The book is aimed at Excel users, project managers, and decision makers who wish to learn the basics of PowerPivot for Excel 2013, master the new DAX language that is used by PowerPivot, and learn advanced data modeling and programming techniques with PowerPivot.
Assumptions about you
This book assumes that you have a basic knowledge of Excel 2010 or Excel 2013. You donotneedtobeamasterofExcel;justbeingaregularuserisfine.Wewillcoverwhatis needed to make the transition from Excel to PowerPivot, but we do not cover in any way the fundamentals of Excel, like entering a formula, writing a VLOOKUP function, or other basic functionalities.
No previous knowledge of PowerPivot is needed. If you already tried to build a data modelbyyourself,thatisfine,butwewillassumethatyouneveropenedPowerPivotbefore reading the book.
Organization of this book
The book is designed to be read from cover to cover. Trying to jump directly to the solutionofaspecificproblem,skippingsomecontent,willprobablybethewrongchoice. In each chapter, we introduce concepts and functionalities that you will need to understand the subsequent chapters. Moreover, we wrote some chapters knowing that you will need to read them more than once, because the theoretical background they provideishardtotakeinatafirstread.

xvi Introduction
The book is divided into 16 chapters:
Chapter 1, “Introduction to PowerPivot,” offers a guided tour of the basic features of PowerPivot for Excel 2013. By following a step-by-step guide, we show the main benefitsofusingPowerPivotforyouranalyticalneeds.WeshowhowtocreateasimplePower View report as well.
Chapter 2, “Using the Unique Features of PowerPivot,” shows the features that are available only if you enable the PowerPivot for Excel add-in. This includes calculated columns,calculatedfields,hierarchies,andsomeotherbasicfeatures.Itisthelogicalcontinuation (and conclusion) of Chapter 1.
In Chapter 3, “Introducing DAX,” we start covering the DAX language, including its syntax and the most basic functions. We highlight the difference between a calculated columnandacalculatedfield,andattheend,weshowafirstpracticalexampleofDAXusage.
Chapter 4, “Understanding Data Models,” is a theoretical chapter, covering the basics of data modeling and showing the different modeling options in a Power-Pivot database. We describe several concepts that are not evident for Excel users, like normalization and denormalization, the structure of a SQL query, how relationships work and why they are so important, the structure of data marts, and data warehouses.
In Chapter 5, “Publishing to SharePoint,” we cover the process of publishing workbooks to Microsoft SharePoint to do team BI. Moreover, we introduce the concept of PowerPivot for SharePoint being a server-side application that you can program and extend using Excel and PowerPivot.
Chapter 6, “Loading Data,” is dedicated to the many ways to load data inside PowerPivot. For each data source, we show the way it works and provide many hints andbestpracticesforthatspecificsource.
Chapter 7, “Understanding Evaluation Contexts,” and Chapter 8, “Understanding CALCULATE,” are the theoretical core of the book. There, we introduce the concepts of evaluation contexts, relationships, and the CALCULATE function. These are the pillars of the DAX language, and you will need to master them before writing advanced data models with PowerPivot.
Chapter 9, “Using Hierarchies,” shows how to create and manage hierarchies. Itcoversbasichierarchyhandling,howtocomputevaluesoverhierarchies,andfinally,it shows how to manage parent/child hierarchies by using the concepts learned in Chapters 7 and 8.

Introduction xvii
Chapter 10, “Using Power View,” is dedicated to the new reporting tool in Excel 2013: Power View. There, we show the main feature of this tool, how to create simple Power Viewreports,andhowtofilterdataandbuildreportsthatarepleasanttolookatandprovide useful insights in your data.
Chapter 11, “Shaping the Reports,” covers several advanced topics regarding reporting. It includes Key Performance Indicators (KPIs), how to write them, and how to use them to improve the quality of your reporting system. We also cover the Power View metadata layer in PowerPivot, drill-through, sets in Excel or in MDX, and perspectives.
Chapter 12, “Performing Date Calculations in DAX,” deals with time intelligence. Year to Date (YTD), Quarter to Date (QTD), Month to Date (MTD), working days versus non-working days, semiadditive measures, moving averages, and other complex calculations involving time are all topics covered here.
Chapter 13, “Using Advanced DAX,” is a collection of scenarios and solutions, all of which share the same background: they are hard to solve using Excel or in any other tool, whereas they are somewhat easier to manage in DAX, once you gain the necessary knowledge from the previous chapters in the book. All these examples come from real-world scenarios and are among the top requests we see when we do consultancy or look at forums on the web.
Chapter 14, “Using DAX as a Query Language,” is dedicated to using DAX as a query language (as you might guess). It covers the various functionalities of DAX when used to query a database. It also shows advanced functionalities, like reverse-linked and linked-back tables, which greatly enhance the capabilities of PowerPivot to build complex data models.
Chapter 15, “Automating Operations Using VBA,” discusses using Microsoft Visual Basic for Applications (VBA) to manage PowerPivot workbooks in a programmatic way, automating a few common tasks. We provide some code examples and show how to solve some of the common scenarios where VBA might be useful.
Chapter 16, “Comparing Excel and SQL Server Analysis Services,” compares the functionalitiesofthethreeflavorsofPowerPivottechnology:PowerPivotforExcel, PowerPivot for SharePoint, and SQL Server Analysis Services (SSAS). The goal of this finalchapteristogiveyouaclearpictureofwhatcanbedonewithPowerPivotforExcel, when you need to move a step further and adopt PowerPivot for SharePoint, and what extra features are available only in SSAS.

1
C H A P T E R 1
Introduction to PowerPivot
Microsoft PowerPivot for Microsoft Excel 2013 is a technology aimed at providing self-service business intelligence (BI), which is a real revolution inside the world of data analysis because
it gives the final user all the power needed to perform complex data analysis without requiring the intervention of BI technicians. PowerPivot is an Excel add-in that implements a fast, powerful, in-memory database that can be used to organize data, detect interesting relationships, and provide the fastest way to browse information.
Some of the most interesting features of PowerPivot are the following:
■■ The ability to organize tables for the PivotTable tool in a relational way, freeing the analyst from the need to import data as Excel sheets before analyzing them.
■■ The availability of a fast, space-saving, columnar database that can handle huge amounts of data without the limitations of Excel sheets.
■■ DAX, a powerful programming language that defines complex expressions on top of the relational database. It makes it possible to define surprisingly rich expressions compared to those standards in Excel.
■■ The ability to integrate different sources of data, such as databases, Excel sheets, and data sources available on the Internet, and virtually any kind of data.
■■ Amazingly fast in-memory processing of complex queries over the whole database.
Some people might think of PowerPivot as a simple replacement for the PivotTable, while others might use it as a rapid development tool for complex BI solutions, and still others might believe that it is a real replacement for a complex BI solution. PowerPivot is not a replacement for large and complex BI solutions like the ones built on top of Microsoft Analysis Services, but it is much more than a simple replacement for the Excel PivotTable, and it is a great tool for exploring the BI world and implementing end-to-end BI solutions.
PowerPivot fills the gap between an Excel sheet and a complete BI solution, and it has some unique characteristics that make it appealing for both Excel power users and seasoned BI analysts. This book analyzes all the features of PowerPivot, but, as with any big project, we need to start from the beginning. This chapter starts with a simple introduction to the basic features of PowerPivot. We suggest that you follow the step-by-step instructions so you can see on your own computer the results that we show in the book. Later, in the following chapters, we will not use step-by-step

2 Microsoft Excel 2013: Building data models with PowerPivot
instructions anymore because we think that it is better to focus the book on concepts rather than on “click Next” instructions for more advanced topics.
Even though this book is about PowerPivot for Excel 2013, it is a good idea to start with a short review of how PowerPivot was born and how it worked in Excel 2010, so you can better appreciate the new features and understand some of the peculiarities of this add-in.
Using a PivotTable on an Excel table
Let’s start by going backward, into the past. Since the release of Excel 97, it has been possible to analyze data using PivotTables. Prior to the availability of PowerPivot, using PivotTables was the main way to analyze data. The PivotTable is an easy and convenient way to browse huge amounts of data that you collect into Excel sheets. This book does not explain in detail how the PivotTable tool works; there are a lot of good descriptions available from other sources. However, it’s helpful to recall the main features of the PivotTable to compare them with those of PowerPivot.
Suppose you have a standard Excel table, imported from a query run against a database, that contains all the data that you want to analyze. To get this data, you probably asked IT to provide some means to access the database and a specific query to retrieve the information. Your Excel sheet would look like the one in Figure 1-1. Because the table contains raw data, it is very difficult to analyze. You can look at this worksheet in the companion workbooks under the name “CH01-01-Classical Excel PivotTable.xlsx.”
FIGURE 1-1 Here, you see some sample data we can use to create a new PivotTable.
Now that you have all the data available in a sheet, you can choose to insert a PivotTable using the PivotTable button of the Insert tab of the Excel ribbon. The wizard prompts for the table to use as the source of the Pivot and for where to put the PivotTable, and then it provides the standard Excel PivotTable interface shown in Figure 1-2.

CHAPTER 1 Introduction to PowerPivot 3
FIGURE 1-2 This is the standard PivotTable interface in Excel.
From here, you can choose to take the Year (to cite one example) and put it as a column and the ProductCategory as a row, displaying the SalesAmount at the intersection of rows and columns. After properly formatting your numbers, you get a nice report (as shown in Figure 1-3) showing how each category performed over time.
FIGURE 1-3 Here is an example of a report created with the PivotTable tool.

4 Microsoft Excel 2013: Building data models with PowerPivot
It is clear that by changing the way data is organized into rows and columns, you can easily produce different and interesting reports with an intuitive, fast interface that helps you navigate the information.
Figure 1-3 shows what a standard PivotTable looks like. Users all around the world have been utilizing this tool for many years with great success, analyzing their Excel data in many different ways and producing reports according to their needs.
One of the best characteristics of the PivotTable tool is its ease of use. Excel analyzes the source table, detects numeric values, and provides the ability to display their total slicing data over all other columns. Clearly, totals are aggregated using the SUM function because this is what is normally needed. If you want a different aggregation function, you can choose it using the various PivotTable options.
As easy as it is to use, PivotTables have some limitations:
■■ PivotTables can analyze only information coming from a single table stored in an Excel sheet. If you have different sheets, containing different information, there is not an easy way to correlate information coming from them.
■■ It is not always easy to get the source data into a format that is suitable for analysis. In the previous example, you saw a table that is extracted from a SQL query run against the AdventureWorks database and that you build to analyze data. The skills needed to build such a query are somewhat technical because you need to know the SQL syntax and the underlying database structure, and this often raises the problem of asking your IT department to develop such queries before you even start the analysis process.
■■ Because only one table can be analyzed at a time, you can often end up building the queries needed for a specific analysis and, if for any reason you want to perform a different analysis, then you will need to build different queries. For example, if you have a query that returns sales at the “month” level, you cannot use that same query to perform further analysis at the “day of week” level. To do that, you will need a new query. This, in turn, might involve the need to contact IT again, which can become expensive if IT charges based on the amount of work it performs.
When PivotTables are not enough, as is the case for medium-sized companies, it is very common to start a complete BI project with products like SQL Server Analysis Services, which will provide the same pivoting features on complex data structures known as OLAP cubes. OLAP cubes are difficult to build but provide the best solution to the complexity of free analysis of the company data. OLAP cubes will be discussed briefly later in this book, in Chapter 4, “Understanding Data Models”; at this point, it is enough to point out that they are the definitive solution to BI requirements, but they are expensive and still require great effort from the IT department.

CHAPTER 1 Introduction to PowerPivot 5
Using PowerPivot in Microsoft Office 2013
PivotTables based on standard Excel tables are a pretty handy tool. Nevertheless, to let you analyze more complex data, Microsoft introduced a feature called “self-service BI.” The goal of this technology is to let you build complex data structures and analyze them with PivotTables, removing the current limitations of PivotTables. PowerPivot is the primary tool available from Microsoft to handle self-service BI, along with its companion Power View, which you will learn to use later in this chapter.
PowerPivot enables the user to analyze data without needing to contact IT to produce complex queries. Furthermore, it removes the limitation that a PivotTable can analyze only a single table because you will be able to query more tables at the same time, producing reports that easily integrate information coming from different sources.
Working with the AdventureWorks sample databaseIn order to provide examples, we will use the AdventureWorks database throughout this book. We have chosen AdventureWorks because it is well known, freely available on the web, and contains sample data that you can easily use for complex analysis. The database contains information about Adventure Works Cycles, which is a large multinational, fictitious company that manufactures and sells metal and composite bicycles to North American, European, and Asian commercial markets.
You can download the AdventureWorks database from http://www.codeplex.com/SqlServerSamples, where you will find different versions of the database, depending on the release of Microsoft SQL Server that you have installed. If you don’t have SQL Server on your PC, then you can use the Microsoft Access version of AdventureWorks that is provided in the companion material. Moreover, all the demos in this book are available in the companion material as Excel workbooks. Thus, you will be able to follow most of the examples even if you do not have access to a database.
Moreover, for the interested reader, Microsoft provides sample data in Excel workbooks that can be used to test PowerPivot at http://tinyurl.com/PowerPivotSamples. Even if we do not use these files in this book, you might be interested in loading them to have some data to perform your tests.
In 2010, PowerPivot for Excel 1.0 was released as an add-in for Excel 2010. PowerPivot is a powerful columnar database that does not work with classical Excel tables. Rather, it works with data stored inside its proprietary database, and it can be queried using the DAX language or a PivotTable. Although this information seems to be just a curiosity about the history of PowerPivot, it is in reality very important: for PowerPivot to work, the data should not be stored inside Excel tables, it needs to be stored inside the PowerPivot database. Keep this fact in mind; it will come in handy later.

6 Microsoft Excel 2013: Building data models with PowerPivot
Note The PowerPivot database is also referred to as the “Excel data model.” The two terms relate to the very same technology: the Excel data model is, in reality, a PowerPivot database; and the PowerPivot database is stored inside the Excel workbook. In this book, we will refer to it using both names, depending on the context. If we believe that it is important to separate PowerPivot from Excel, then we will refer to it as the PowerPivot database; otherwise, we adhere to the more standard terminology and call it the Excel data model.
At the beginning, the PowerPivot database was somewhat separated from Microsoft Office, meaning that all its features were available only to users who decided to download and install the add-in. If an Excel workbook containing PowerPivot data was opened on a PC where the add-in was not installed, it simply did not work, even if the data contained in Excel sheets is always visible.
In Office 2013, PowerPivot comes preinstalled and should only need to be activated. Moreover, in Office 2013, the PowerPivot engine is fully integrated into the Excel code and starts to work even before being activated. Some features are immediately available, whereas others have to be manually activated, as you will learn later in this chapter.
In order to start using PowerPivot, we are going to take the easy way: we will create PowerPivot tables (remember—they are different from Excel tables) without even activating the add-in. This happens smoothly as soon as you activate some of the advanced features of Excel for the analysis of data, such as
■■ Power View reports
■■ Relationships between tables
■■ PivotTables over more than one table
Adding information to the Excel tableLet’s start making the analysis slightly more complex. The dataset provided by our Excel table contains information about product categories. Assume that at AdventureWorks, each product category is assigned to a salesperson and this information is not stored in the database, so you don’t have the option to modify the original query to grab this information. Because Excel is available, you can fill another Excel table with this information, as you can see in Figure 1-4.

CHAPTER 1 Introduction to PowerPivot 7
FIGURE 1-4 The SalesManager Excel table will prove useful to show performance of managers instead of categories.
In order to use this new information in the PivotTable, you need to bring the SalesManager column into the original data model and, as you probably already know, VLOOKUP is invaluable here. Add a column to our original table with this formula:
=VLOOKUP([@ProductCategory],SalesManagers,2)
You will end up with a new dataset that now contains the sales manager, as you can see in Figure 1-5.
FIGURE 1-5 Using VLOOKUP, we have been able to bring the sales manager into the original table.
With the new dataset, the PivotTable can be easily re-created, adding the SalesManager to the rows. This results in the desired report, as you can see in Figure 1-6.

8 Microsoft Excel 2013: Building data models with PowerPivot
FIGURE 1-6 The SalesManager column is now visible in the PivotTable.
This technique works fine, but if you now want to slice data using the Office column from the SalesManager table, you need to repeat the operation of using VLOOKUP to put the Office column in the original table. Even if it does not mean a huge amount of work in this specific example, it is better to move to the next level and learn some of the new features of Excel 2013.
Creating a data model with many tablesInstead of using VLOOKUP to populate a single dataset, as in the previous example, you now want to add the SalesManager table to the PivotTable, so that all its columns can be used. You are moving from a classical single-table analysis to a more advanced multi-table one. Doing this is very easy. At the bottom of the PivotTable fields list is the MORE TABLES… option (see Figure 1-7).

CHAPTER 1 Introduction to PowerPivot 9
FIGURE 1-7 The MORE TABLES… option lets you add more tables to a single PivotTable report.
If you click MORE TABLES…, you will see an information message that asks you to confirm whether you want to continue creating a new PivotTable. The dialog box, shown in Figure 1-8, contains some very useful information about what is happening, including a reference to something new: the data model.
FIGURE 1-8 As simple as it is, this confirmation window contains a good deal of useful information.
If you click Yes, Excel creates a new PivotTable, with a structure that is identical to the current one but with more tables. You can see the result in Figure 1-9, where the field list now contains two tables.

10 Microsoft Excel 2013: Building data models with PowerPivot
FIGURE 1-9 The new PivotTable contains two tables in the field list.
Now remove SalesManager and ProductCategory from the rows and, after expanding the Sales-Managers table, add Office to the rows. The result is not what you might expect. In fact, as Figure 1-10 shows, it seems that all the offices (two, in this example) have exactly the same sales, which is clearly false. The PivotTable seems to detect the same wrong situation because a warning appears in the Field List: “Relationships Between Tables May Be Needed.” There is also an inviting CREATE… button.
FIGURE 1-10 Adding the Office column to the PivotTable shows incorrect results and a warning about relationships.
CHAPTER 1 Introduction to PowerPivot 11
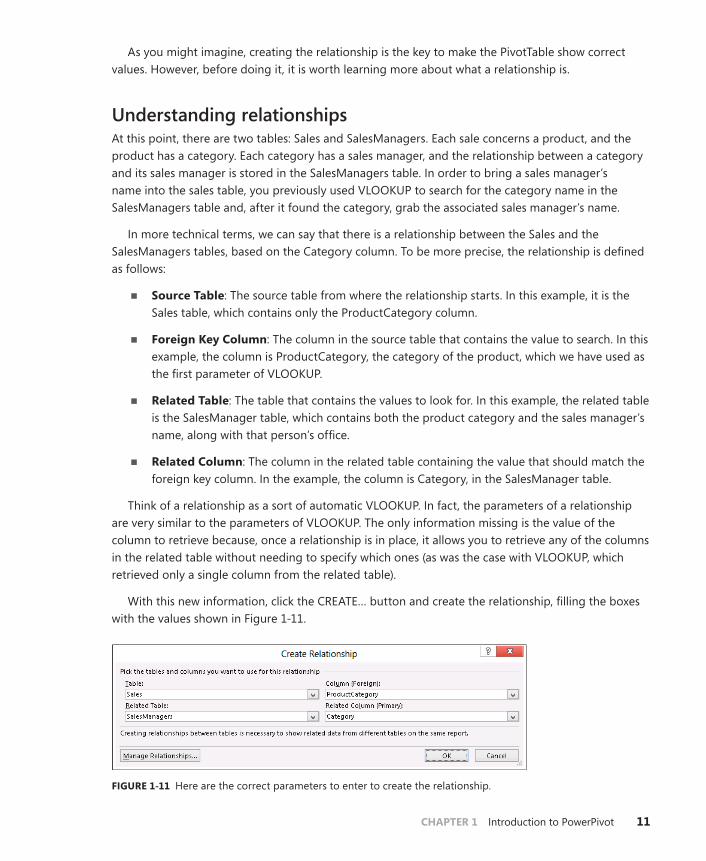
As you might imagine, creating the relationship is the key to make the PivotTable show correct values. However, before doing it, it is worth learning more about what a relationship is.
Understanding relationshipsAt this point, there are two tables: Sales and SalesManagers. Each sale concerns a product, and the product has a category. Each category has a sales manager, and the relationship between a category and its sales manager is stored in the SalesManagers table. In order to bring a sales manager’s name into the sales table, you previously used VLOOKUP to search for the category name in the SalesManagers table and, after it found the category, grab the associated sales manager’s name.
In more technical terms, we can say that there is a relationship between the Sales and the SalesManagers tables, based on the Category column. To be more precise, the relationship is defined as follows:
■■ Source Table: The source table from where the relationship starts. In this example, it is the Sales table, which contains only the ProductCategory column.
■■ Foreign Key Column: The column in the source table that contains the value to search. In this example, the column is ProductCategory, the category of the product, which we have used as the first parameter of VLOOKUP.
■■ Related Table: The table that contains the values to look for. In this example, the related table is the SalesManager table, which contains both the product category and the sales manager’s name, along with that person’s office.
■■ Related Column: The column in the related table containing the value that should match the foreign key column. In the example, the column is Category, in the SalesManager table.
Think of a relationship as a sort of automatic VLOOKUP. In fact, the parameters of a relationship are very similar to the parameters of VLOOKUP. The only information missing is the value of the column to retrieve because, once a relationship is in place, it allows you to retrieve any of the columns in the related table without needing to specify which ones (as was the case with VLOOKUP, which retrieved only a single column from the related table).
With this new information, click the CREATE… button and create the relationship, filling the boxes with the values shown in Figure 1-11.
FIGURE 1-11 Here are the correct parameters to enter to create the relationship.

12 Microsoft Excel 2013: Building data models with PowerPivot
Note PowerPivot for Excel 2010, the previous version of this add-in, had an engine that automatically detected relationships, making life easier in some cases. Unfortunately, the detection algorithm used a heuristic to check for the existence of relationships, and in some rare cases, it could detect the relationship incorrectly. For this reason, no automatic detection happens in Excel 2013; it is up to you to define the relationship. Although this characteristic might seem to be a downgrade, it really is a welcome development: it is always better to be safe when creating a relationship, and in this case, the human brain is much better than a heuristic algorithm.
Clicking OK will make Excel create the relationship and update the content of the PivotTable, which now shows correct values arranged by office. Figure 1-12 shows the result, where the SalesManager column from the SalesManagers table is placed on the rows.
FIGURE 1-12 The PivotTable shows the correct results once the relationship is set.
Relationships play a very important role in PowerPivot, and you will learn a lot more about them from this book. For now, it is enough to think of a relationship as a way to tie together two tables, using a column in both. If two columns share the same value for a specific row, then the relationship has a match, and the two rows are tied together.
But . . . wait! Didn’t we just say that relationships are important in PowerPivot? Up to now, you have not used PowerPivot—you have simply used Excel features to create a PivotTable on more than one table. So why is this book about PowerPivot? The reason is simple: even if you have not explicitly used PowerPivot, Excel has created a PowerPivot data model, and the multiple-table PivotTable is, in reality, browsing that model. So let’s look at the data model.

CHAPTER 1 Introduction to PowerPivot 13
Understanding the data model
As Figure 1-8 previously demonstrated, the confirmation window asked you to create a new PivotTable using the data model. It did not explain what a data model is, nor why it is needed if you want to show more than one table in the PivotTable, but it was clear about the fact that the new PivotTable would use the data model. Thus, it is interesting to understand better what the data model is before diving into more advanced topics.
Excel tables are exactly what their name suggests: they are tables. You can have hundreds of tables in an Excel workbook, but each table is separated from the others. This is why you can create a PivotTable over a single table: adding more than one table to a PivotTable is meaningless because they share nothing. The key to turn a set of tables into a data model is the existence of relationships. If many tables are connected by relationships, then it is useful to show them all together inside a PivotTable because filtering a table, as a side effect, filters other, related tables as well.
In this example, putting a filter on the Office column of the SalesManagers table included a filter on the Sales table. In fact, rows with information about the Seattle office showed only values about categories that are handled by Seattle personnel. The reason why the Sales table is filtered by Office is because each sale is pertinent to a sales manager who works in an office. The relationship between the two tables makes this mechanism work. Thus, the following is true:
■■ A set of tables is nothing but a set of separate tables.
■■ A set of tables with relationships holding among them is a data model.
Excel 2013 introduced the concept of a data model as one of the tools available to users to analyze data. Each Excel table can belong to the data model: it is automatically added to the data model as soon as a relationship is defined on the table, either as the source or as the target of the relationship.
All this seems fine, but what has PowerPivot got in common with this description of a data model? The data model in Excel is, in reality, a PowerPivot data model. Whenever you add a table to the data model, you are really adding the table to the PowerPivot database that lives inside the Excel workbook.
The PowerPivot data model and the Excel table are two distinct entities. If you add an Excel table to the data model, you are not transforming the Excel table into a PowerPivot one. What happens is that the data in the Excel table is copied into a PowerPivot table. The two tables are then linked, so that if you update the original Excel table and refresh the PivotTable, the updates are imported into the PivotTable data model. But, from the point of view of storage, the data is really duplicated in two places: the original table in Excel and a copy in PowerPivot.
Creating a data model is very simple. It happens automatically as soon as Excel detects that it needs to create a data model to solve your specific needs. In this case, Excel turned the tables into a PowerPivot data model as soon as it was necessary to create a PivotTable with more than one table. To accomplish this task, Excel created a PowerPivot data model for use, effectively eliminating the need to completely understand what is happening under the surface.

14 Microsoft Excel 2013: Building data models with PowerPivot
Nevertheless, it is important to understand that by using these automatic features, you are using only a very small portion of the real power of PowerPivot. In order to exploit all PowerPivot features, you will need to learn how to work with the PowerPivot data model by itself, without simply relying on the automatic usage of the PowerPivot engine, as Excel does.
Querying the data modelIn the previous section of this chapter, you learned that, by means of creating relationships among tables, you can create a PowerPivot data model inside your Excel workbook. Once the data model has been created for the first time, it can be queried with many PivotTables, without the need to add more tables to the same model. This section discusses how to perform this operation, which, although not very easy to find, is very convenient.
If you create a new PivotTable, Excel prompts you with the Create PivotTable dialog box, shown in Figure 1-13.
FIGURE 1-13 The Create PivotTable dialog box prompts you for the parameters of a new PivotTable.
From this dialog box, instead of choosing a range, as you are probably used to doing, you should choose Use An External Data Source and then click Choose Connection. Excel shows the external connection that can be used and, on the Tables tab, lists both the Excel tables and the data model, as shown in Figure 1-14.

CHAPTER 1 Introduction to PowerPivot 15
FIGURE 1-14 The list of external tables contains the Workbook data model, which is also the PowerPivot data model.
Selecting the Workbook data model and confirming everything up to the end of the PivotTable creation process leads you to a new PivotTable connected to the same data model that you previously created, based on the original Excel tables.
The PowerPivot add-In
In the previous sections of this chapter, you learned that the new features of Excel 2013 require you to create a PowerPivot data model to work with, and that this data model can be created without enabling the PowerPivot add-in, which comes preinstalled but disabled. Once the data model has been created, you can query it with a PivotTable (or, as you will see later in this chapter, with Power View). If, on the other hand, you want to look at the data model, Excel does not offer a way to analyze it or simply look at its content. In order to see the data model, you need to enable the PowerPivot add-in, as you are going to learn in this section.
To enable the PowerPivot add-in, you need to open the Excel options, select Add-Ins, and choose the COM Add-Ins, as shown in Figure 1-15.

16 Microsoft Excel 2013: Building data models with PowerPivot
FIGURE 1-15 You will need to enable the PowerPivot add-in to use the new PowerPivot features.
Once you have selected COM Add-Ins, click Go to open the list of COM add-ins available, as you can see in Figure 1-16.
FIGURE 1-16 In the list of COM add-ins, you can enable or disable the PowerPivot add-in.
To enable the PowerPivot add-in, you simply have to select the Microsoft Office PowerPivot For Excel 2013 check box and then click OK. While you are here, it is a good idea to enable the Power View add-in (if it’s disabled), which is going to come in handy shortly. To do this, simply select the
CHAPTER 1 Introduction to PowerPivot 17
Power View check box. Power View is another great addition to your Excel analytical experience, and it works with the PowerPivot data model too.
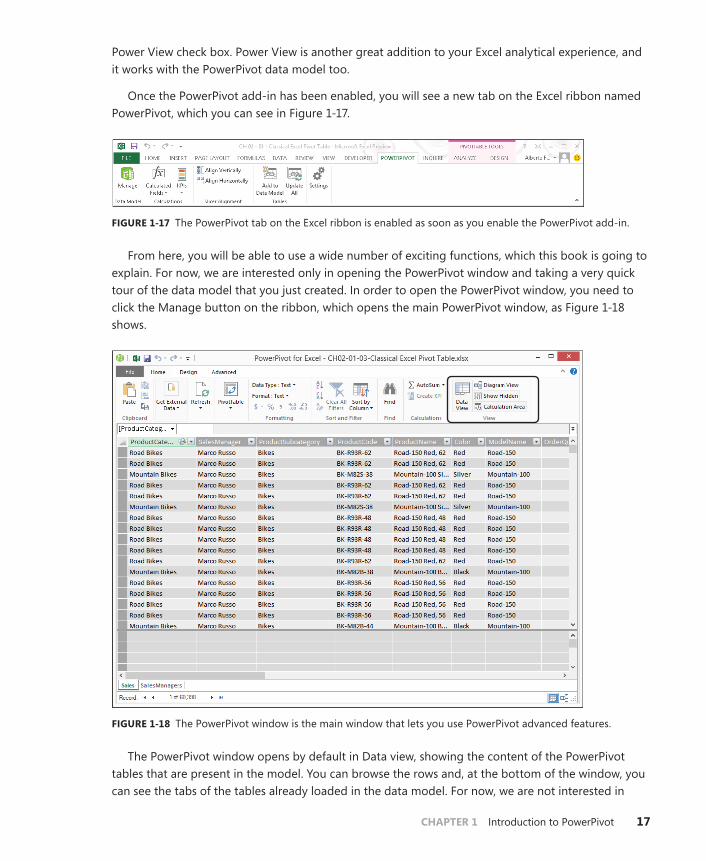
Once the PowerPivot add-in has been enabled, you will see a new tab on the Excel ribbon named PowerPivot, which you can see in Figure 1-17.
FIGURE 1-17 The PowerPivot tab on the Excel ribbon is enabled as soon as you enable the PowerPivot add-in.
From here, you will be able to use a wide number of exciting functions, which this book is going to explain. For now, we are interested only in opening the PowerPivot window and taking a very quick tour of the data model that you just created. In order to open the PowerPivot window, you need to click the Manage button on the ribbon, which opens the main PowerPivot window, as Figure 1-18 shows.
FIGURE 1-18 The PowerPivot window is the main window that lets you use PowerPivot advanced features.
The PowerPivot window opens by default in Data view, showing the content of the PowerPivot tables that are present in the model. You can browse the rows and, at the bottom of the window, you can see the tabs of the tables already loaded in the data model. For now, we are not interested in

18 Microsoft Excel 2013: Building data models with PowerPivot
exploring all the features of this window. We want to use it to take only a brief look at the data model. In order to look at the data model, you need to click the Diagram View button on the ribbon.
As a result, the PowerPivot window switches from Data view to Diagram view is a very convenient way of visualizing the data model because, instead of focusing on the content of the tables, it shows the struc-ture of the relationships, making it easier to represent relationships graphically, as shown in Figure 1-19.
FIGURE 1-19 Diagram view lets you focus on the relationship structure of the data model.
The Diagram view is a canonical “boxes and arrows” representation of the relational model that is stored inside the data model. Each table is represented by a box, and if two tables are linked through a relationship, then there is an arrow running from the source table to the target table. Clicking a relationship highlights the columns that are part of that relationship.
You will learn how to use the many features of this window throughout this book; for now, you can simply close it. Starting from Chapter 3, “Introducing DAX,” you will start using Diagram view to modify the data model. At the moment, we are more interested in taking you on a tour of the main features of Excel 2013 with PowerPivot than in describing them in detail.
Using OLAP tools and converting to formulas
One of the new features of Excel, which is available on the data model but not on the single-table PivotTable, is the OLAP Tools section. This set of features was originally available only on PivotTables built on top of OLAP databases (hence its name), but because of the nature of the data model, which is in reality a PowerPivot database, the feature is now available with the data model too.

CHAPTER 1 Introduction to PowerPivot 19
PivotTables are really powerful tools to explore data. Nevertheless, they very often serve as the first step in the production of complex reports that gather data from PivotTables, perform computations and formatting, and provide the final results in compact reports, sometimes called dashboards. Roughly speaking, a dashboard is nothing but a report containing several pieces of information (each one taken from a query to the database), resulting in a very compact representation of the company status.
Suppose that you want to produce a report containing total sales, the growth in percentage of total sales, and the percentage of Internet and reseller sales of the last three years. The report should contain information divided by region, so that you can use it to find which regions need your attention.
Figure 1-20 shows such a report in its final form, which you can find in the workbook “CH01-02-Dashboard.xlsx.”
FIGURE 1-20 Here, you can see a simple dashboard created from a PivotTable.
We are not interested in these specific results; the focus here is on the technique. So, having a clear idea of the results you want to produce, let’s take a closer look at the problems you will need to solve:
■■ The first issue concerns the geographical slicing. In the final report, you have data at the group, country, and region levels, but countries with only one region have been compacted to remove the region level, which is useless. This is something that the PivotTable will not handle by itself, even though it is a very common request for reports.
■■ The headers contain total sales and growth divided by year (and the selection of years in the two columns is different, since growth is not shown for 2006). Moreover, in the columns header, you want to show years divided by sales type (Internet and reseller). This mixed kind of slicing is not something that can be realized with a PivotTable.
■■ Data inside the cells is a mix of Internet and reseller sales for some cells (the total sales ones); other cells display the ratio of Internet or reseller sales to the total.
■■ Moreover, via the Conditional Formatting option in Excel, the report shows cells of various colors that will direct the reader’s attention to the most interesting data. Clearly, the conditional formatting uses different formulas for different cells.

20 Microsoft Excel 2013: Building data models with PowerPivot
■■ Needless to say, you cannot produce such a report by using any type of PivotTable. Nevertheless, you surely can produce the original values needed to compute each single cell by using one or more PivotTables. All you need to do is to create some PivotTables that perform the computation and then use standard Excel formulas to move the original piece of data inside the dashboard.
You can start building this dashboard by creating the PivotTable shown in Figure 1-21, using a simple PivotTable that shows sales amounts from the FactResellerSales table.
FIGURE 1-21 This PivotTable is the starting point for this dashboard.
This PivotTable, together with a very similar one built on top of Internet sales, contains the basic information needed to build the dashboard. Now, since this is a PowerPivot workbook, you might expect to build a very complex DAX formula that will magically build the dashboard, but this is not the case. PivotTables are useful to explore data in an interactive way, but there is no need to push them too far from their natural inclinations. Once you have data available, Excel moves it inside the dashboard and performs further computations.
You can start building your dashboard based on the PivotTable that you just made, creating formulas that move information from the PivotTable to the dashboard. Nevertheless, PivotTables are dynamic by their very nature. They can change their size if new values appear inside the source tables. Thus, if you reference directly the cells inside a PivotTable, you are at risk of needing to update formulas as the source data is updated. It would be much better if you found a way to fix the PivotTable so that it cannot change its size dynamically.
Luckily, Excel has an option that will help you to convert the dynamic PivotTable in a set of static formulas that show the same data, but without the PivotTable’s dynamic nature. You will lose the ability to navigate through your data, but on the other hand, you will gain the immobility of cells.

CHAPTER 1 Introduction to PowerPivot 21
On the ANALYZE tab of the Excel ribbon, there is a button called OLAP Tools, which contains several features. One of these is Convert To Formulas, as you can see in Figure 1-22.
FIGURE 1-22 The Convert To Formulas option is available for PivotTables based on the data model.
If you choose this option, the PivotTable is deleted and returns as a standard Excel worksheet that contains a formula for each of the original cells (see Figure 1-23).
Sum of SalesAmount Columns Labels
Row Labels 2005 2006 2007 2008
Europe 2,834,512.33 8,036,022.46
France 1,428,020.38 3,179,517.56
Germany 1,983,988.04
France 1,428,020.38 3,179,517.56
Germany 1,406,491.96 1,983,988.04
United Kingdom 1,406,491.96 2,872,516.87
1,406,491.96 2,872,516.87United Kingdom
Canada 3,079,806.81 5,615,169.14 5,682,949.64
United States 13,208,634.95 19,471,989.04 20,927,177.22
Canada 5,682,949.645,615,169.143,079,806.81
Central 3,071,245.712,810,586.672,024,175.80
Northeast 2,397,693.483,352,228.071,182,920.47
Northwast 5,792,864.773,386,959.803,255,251.43
Southeast 2,530,179.762,480,188.692,857,047.77
Pacific 1,594,335.38
Australia 1,594,335.38
Australia 1,594,335.38
Southwest 7,135,193.507,442,025.823,889,239.48
Grand Total 36,240,484.7027,921,670.5216,288,441.77
North America 25,087,158.1816,288,441.77 26,610,126.86
FIGURE 1-23 The worksheet that contained PivotTable looks this way after Convert To Formulas has been applied.

22 Microsoft Excel 2013: Building data models with PowerPivot
Now it is worth taking a look at the formulas inside the cells. They are of two different types:
■■ CUBEMEMBER. This type of formula is used for the headers of both columns and rows. It returns an object, called a member, which is basically the value of a column in a table. For example, the formula inside the “2008” header contains
=CUBEMEMBER("ThisWorkbookDataModel","[DimTime].[FiscalYear].&[2008]")
This can be read as
Return the value of the column FiscalYear in table DimTime where the value is “2008.”
The formula might be confusing because its return value is “2008” and we provide “2008” as the parameter, which doesn’t seem to make sense. This has to do with the internals of PowerPivot, which reasons in terms of members and values of an OLAP cube. Moreover, it might be worth noting at this point that the syntax used for the expressions in CUBEMEMBER and CUBEVALUE is not DAX syntax—it is MDX. Excel still uses MDX to interact with PowerPivot.
■■ CUBEVALUE. This type of formula is used for the cells inside the table. Each cell asks for a value giving the set of members that form the coordinates of the requested value. For example, in the case of sales in North America for 2009, the coordinates are
• [Measures].[Sum of SalesAmount]
• [DimTime].[FiscalYear].&[2009]
• [DimSalesTerritory].[SalesTerritoryGroup].&[North America]
The result is the value of the measure SalesAmount in 2009 for North America.
Readers used to OLAP databases will recognize in these formulas the standard set of coordinates used to navigate over OLAP cubes. In fact, at the very end, PowerPivot stores its data inside cubes that are automatically processed by PowerPivot itself, which is something that we are going to show later in this chapter.
Now, it is not important to take this digression too far. The real interesting aspect of this is that the worksheet is now composed of formulas (the PivotTable disappeared) and the formulas can be moved wherever you want. Moreover, even if the source data changes, Excel will not change the position of any cell.
You can now create a new worksheet and proceed to write your dashboard, referencing the values inside this new set of cells. The only caution is that if a cube does not return any data, it is returned by CUBEMEMBER as an empty string. Thus, whenever you need to reference its value, you need to surround it with an IF, as in the cell Total Sales in Europe for 2006 in Figure 1-20, which contains this formula:

CHAPTER 1 Introduction to PowerPivot 23
= IF( Internet!D5 = "", 0, Internet!D5 ) + IF( Resellers!D5 = "", 0, Resellers!D5 )
The only precaution to take when using values coming from an OLAP cube is to remember that empty values are empty strings, not numbers. The remaining part of the dashboard can be easily created by using standard Excel formulas and some formatting, all of which is already well known and documented.
Note Results from OLAP cubes are always strings, so the ISBLANK function in Excel will not help here.
The really interesting part of this section is not the dashboard itself, but the fact that, by converting a PivotTable into formulas, you can use data from PowerPivot as the first brick of a more complex workbook, which uses the original data to provide values, indicators, and other information that can be processed later with the full power of Excel at hand.
Understanding PowerPivot for Excel 2013
Now that you have used the PowerPivot data model for the first time, it is worthwhile to learn some basics about what the PowerPivot engine is before delving into all its features. This section of the chapter will give you a general understanding of this topic. It is not strictly required to use PowerPivot, at least at a basic level; however, we believe that it is interesting. You can consider it as a small digression, just to give you some general background on the topic of columnar databases.
PowerPivot for Excel 2013 is, in reality, the Tabular engine of SQL Server Analysis Services 2012, running in process inside Excel. The PowerPivot engine is called the xVelocity analytics engine, and it is a space-saving columnar database running completely in memory.
Most databases, including SQL Server, are row-oriented databases, and they are easy to understand because they work in a very natural way: every table of the database stores data row by row, exactly the way you see data on the screen.
For example, consider the following table of data:
ID_Author FirstName LastName Blog Posts
1 Alberto Ferrari http://sqlblog.com/blogs/alberto_ferrari 27
2 Maurizio Macagno http://adventureworks.com/blogs/mmacagno 43
3 Marco Russo http://sqlblog.com/blogs/marco_russo 38

24 Microsoft Excel 2013: Building data models with PowerPivot
A row-oriented database physically stores data row by row. For example, the second item in the list contains all the columns of the row describing Maurizio’s data, in a way that can be expressed in this table:
Row ID Row Data
1 1, Alberto, Ferrari, http://sqlblog.com/blogs/alberto_ferrari, 27
2 2, Maurizio, Macagno, http://adventureworks.com/blogs/mmacagno , 43
3 3, Marco, Russo, http://sqlblog.com/blogs/marco_russo, 38
The physical implementation depends on the database product. For example, SQL Server divides the storage space into pages and every page stores one or more rows. Other databases might use different techniques, but the important point is that data is stored row-wise.
In general, a row-oriented database requires a full scan of all the rows of a table if you want to query all the values of a single column of a table (that is, to compute an aggregation). The cost of a complete table scan is the same regardless of the number of columns requested.
A column-oriented database uses a different approach. Instead of considering the row of a table as the main unit of storage, it considers every column as a separate entity and stores data for every column in a separate way. For example, you might imagine that data of our initial table is logically stored in this way:
Column Name Column Data
ID_Author 1, 2, 3
FirstName Alberto, Maurizio, Marco
LastName Ferrari, Macagno, Russo
Blog http://sqlblog.com/blogs/alberto_ferrari, http://adventureworks.com/blogs/mmacagno, http://sqlblog.com/blogs/marco_russo
Posts 27, 43, 38
This makes it very fast to query data for a single column, but it requires a higher computational effort to retrieve data for several columns of a single row. The worst-case scenario is the request of all the columns from a row, which requires access to the storage of all the rows. For example, to retrieve Maurizio’s data, Maurizio must be identified in the FirstName column. Because it is the second element in the column, getting the second element from every other column will retrieve all of Maurizio’s data. Moreover, to calculate the total number of posts of all the authors, it will be necessary to access only the Posts column data.
From the point of view of data retrieval, a column-oriented database might be faster because data access is optimized for many query scenarios. In fact, the most frequent requests in an analytical system require data from only a few columns, usually to aggregate data from a column by grouping results according to the value of other columns.
CHAPTER 1 Introduction to PowerPivot 25
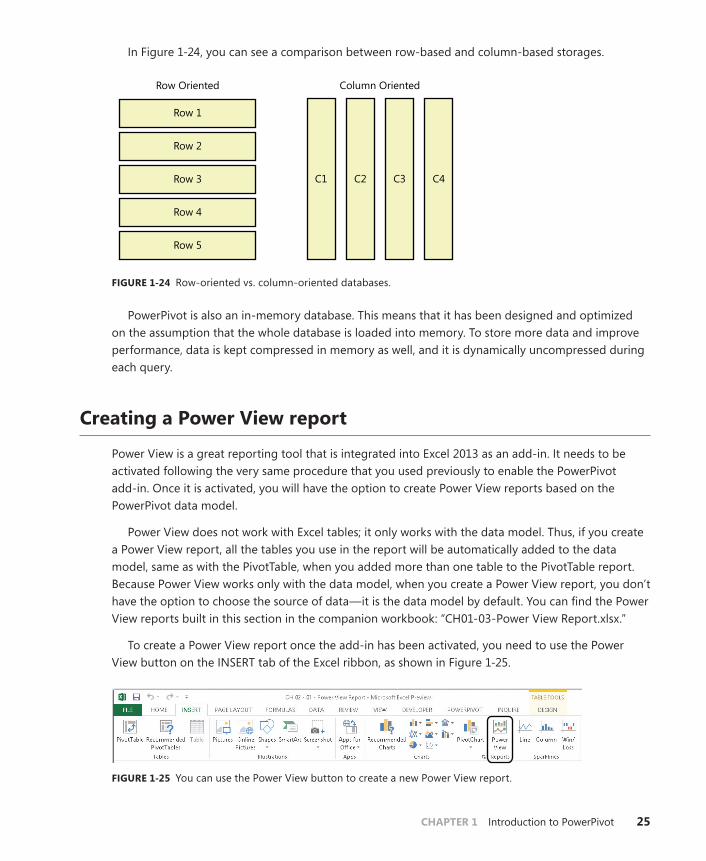
In Figure 1-24, you can see a comparison between row-based and column-based storages.
Row Oriented Column Oriented
C2 C3 C4C1
Row 2
Row 3
Row 4
Row 5
Row 1
FIGURE 1-24 Row-oriented vs. column-oriented databases.
PowerPivot is also an in-memory database. This means that it has been designed and optimized on the assumption that the whole database is loaded into memory. To store more data and improve performance, data is kept compressed in memory as well, and it is dynamically uncompressed during each query.
Creating a Power View report
Power View is a great reporting tool that is integrated into Excel 2013 as an add-in. It needs to be activated following the very same procedure that you used previously to enable the PowerPivot add-in. Once it is activated, you will have the option to create Power View reports based on the PowerPivot data model.
Power View does not work with Excel tables; it only works with the data model. Thus, if you create a Power View report, all the tables you use in the report will be automatically added to the data model, same as with the PivotTable, when you added more than one table to the PivotTable report. Because Power View works only with the data model, when you create a Power View report, you don’t have the option to choose the source of data—it is the data model by default. You can find the Power View reports built in this section in the companion workbook: “CH01-03-Power View Report.xlsx.”
To create a Power View report once the add-in has been activated, you need to use the Power View button on the INSERT tab of the Excel ribbon, as shown in Figure 1-25.
FIGURE 1-25 You can use the Power View button to create a new Power View report.

26 Microsoft Excel 2013: Building data models with PowerPivot
Note Power View requires the Silverlight component to be installed on your system. If you have never installed Silverlight, Power View will prompt you to do so, directing you to the website where you can download it. Once Silverlight is installed, Power View will work fine. You will need to use Microsoft Internet Explorer to download the correct version of Silverlight; downloading it using a different browser might not activate the correct version of Silverlight that Excel needs.
Now you will create a simple report using the same workbook created in this chapter. The Power View environment is designed to be simple: most of its features require a single mouse click to be activated, and you don’t have all the configuration options available in classical Excel charts. The major benefit of Power View is that it can create beautiful reports with a minimum of effort.
Once the Power View report is opened, you will see an empty canvas on the left of the window and the list of tables in the data model in the right panel, which resembles the PivotTable Field list. To start creating your first report, expand the Sales table and select the ProductCategory column. You will see the list of categories in a new table in the canvas. Then, selecting the SalesAmount column, Power View will add the total sales amount to each row of the table, showing the total sales for each category. At this point, the Excel window will look like Figure 1-26.
FIGURE 1-26 The Power View report shows categories and sales.

CHAPTER 1 Introduction to PowerPivot 27
The idea of Power View is to start with data and decide only later what format you want to use for them. For example, suppose that you are interested in creating a report that shows the total sales for each category (which you already did) and, beside them, a report that shows the sales divided by geographical area.
Because you already have completed the first step, you now need to create a new table containing the country of sale, along with the total sales amount. This can be easily done by clicking in the empty area of the Power View canvas and then selecting the TerritoryCountry column first, and then the SalesAmount column. At this point, your report should look like the one in Figure 1-27.
FIGURE 1-27 The Power View report shows tabular data by default.
Although the data is there, it does not look very appealing. The tabular representation of information is less than wonderful—you need a way to show the same information with charts. Let’s start with the geography. It would be much better to show the sales on a map. To perform this operation, simply select the table containing the TerritoryCountry and use the Map button on the DESIGN tab of the Excel ribbon, as shown in Figure 1-28. The table is immediately transformed into a map, where the total sales are shown by the size of the points on the map.
Tip You need an active Internet connection for the map to work because the map itself and the geographical resolution of the countries is created through the Bing web service.

28 Microsoft Excel 2013: Building data models with PowerPivot
FIGURE 1-28 The Map button transforms the tabular representation into a map.
At this point, you can follow the same procedure to transform the Categories table into a Column chart, resize it, and put it below the map. You have seen that the idea of Power View is first the data, then the graphical representation. The chart, at this point, looks like the one in Figure 1-29.
FIGURE 1-29 The Categories table is now a column chart.
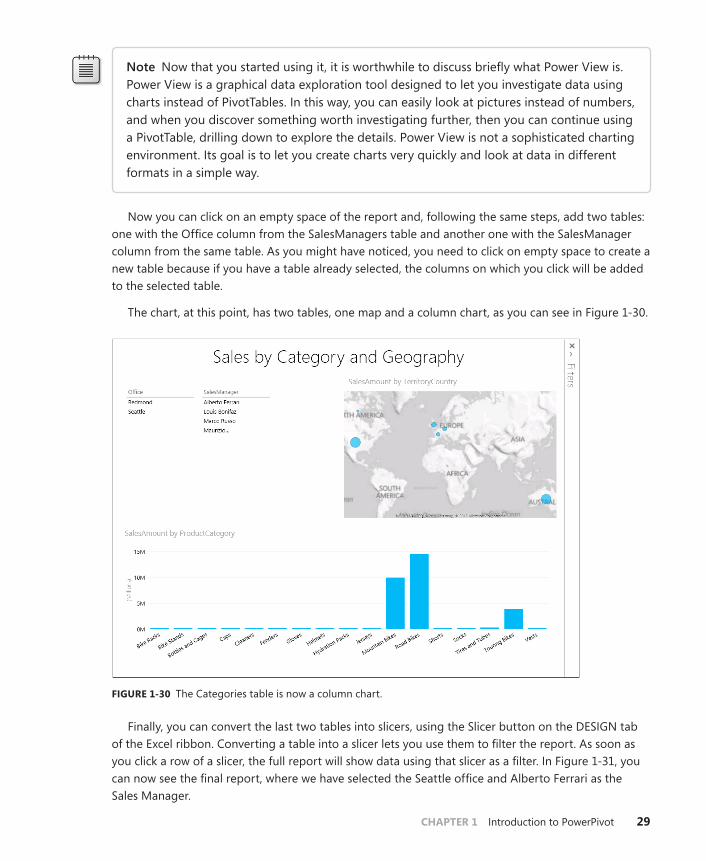
CHAPTER 1 Introduction to PowerPivot 29
Note Now that you started using it, it is worthwhile to discuss briefly what Power View is. Power View is a graphical data exploration tool designed to let you investigate data using charts instead of PivotTables. In this way, you can easily look at pictures instead of numbers, and when you discover something worth investigating further, then you can continue using a PivotTable, drilling down to explore the details. Power View is not a sophisticated charting environment. Its goal is to let you create charts very quickly and look at data in different formats in a simple way.
Now you can click on an empty space of the report and, following the same steps, add two tables: one with the Office column from the SalesManagers table and another one with the SalesManager column from the same table. As you might have noticed, you need to click on empty space to create a new table because if you have a table already selected, the columns on which you click will be added to the selected table.
The chart, at this point, has two tables, one map and a column chart, as you can see in Figure 1-30.
FIGURE 1-30 The Categories table is now a column chart.
Finally, you can convert the last two tables into slicers, using the Slicer button on the DESIGN tab of the Excel ribbon. Converting a table into a slicer lets you use them to filter the report. As soon as you click a row of a slicer, the full report will show data using that slicer as a filter. In Figure 1-31, you can now see the final report, where we have selected the Seattle office and Alberto Ferrari as the Sales Manager.
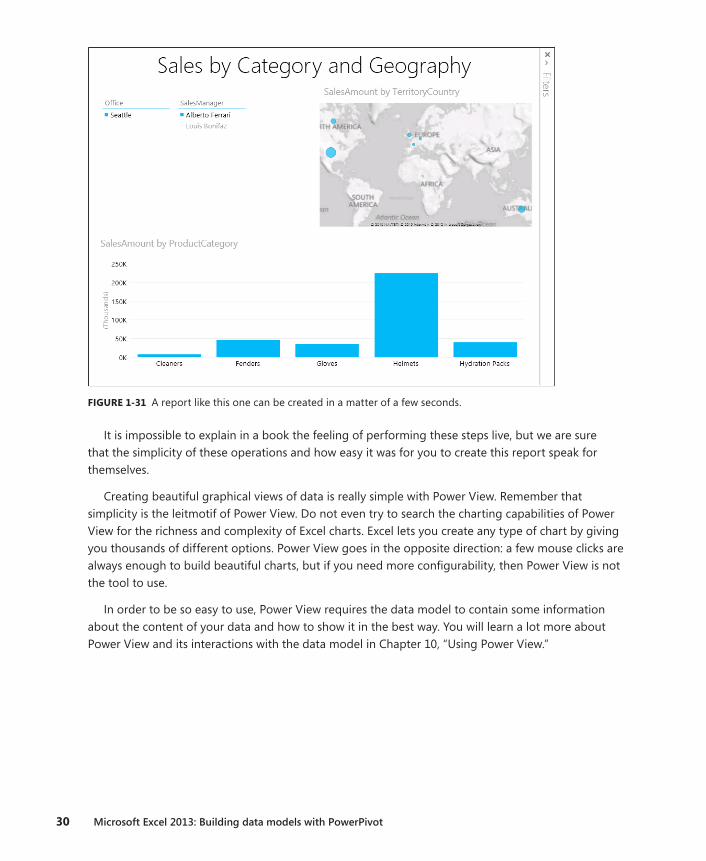
30 Microsoft Excel 2013: Building data models with PowerPivot
FIGURE 1-31 A report like this one can be created in a matter of a few seconds.
It is impossible to explain in a book the feeling of performing these steps live, but we are sure that the simplicity of these operations and how easy it was for you to create this report speak for themselves.
Creating beautiful graphical views of data is really simple with Power View. Remember that simplicity is the leitmotif of Power View. Do not even try to search the charting capabilities of Power View for the richness and complexity of Excel charts. Excel lets you create any type of chart by giving you thousands of different options. Power View goes in the opposite direction: a few mouse clicks are always enough to build beautiful charts, but if you need more configurability, then Power View is not the tool to use.
In order to be so easy to use, Power View requires the data model to contain some information about the content of your data and how to show it in the best way. You will learn a lot more about Power View and its interactions with the data model in Chapter 10, “Using Power View.”
Related Documents


