SOLAR ENERGY

Download presentation source
Jul 13, 2015
Welcome message from author
This document is posted to help you gain knowledge. Please leave a comment to let me know what you think about it! Share it to your friends and learn new things together.
Transcript

SOLAR ENERGY

Solar energy runs the engines of the earth
Generates its windsDrives the water cycle
Warms its oceans
Grows its plants
Feeds its animals
It heats its atmosphere and its lands

This energy can be converted into heat and cold, driving force and electricity

How much solar energy strikes the earth?
•The sun generates an enormous amount of energy - approximately 1.1 x 10 E20 kilowatt-hours every second (a kilowatt-hour is the amount of energy needed to power a 100 watt light bulb for ten hours.)
•The earth’s outer atmosphere intercepts about one two-billionth of the energy generated by the sun, or about 1500 quadrillion (1.5 x 10 E18 ) kilowatt-hours per year.
•Because of reflection, scattering, and absorption by gases and aerosols in the atmosphere, however, only 47% of this, or approximately 7 x 10 E17 kilowatt-hours, reaches the surface of the earth.

THE AMOUNT OF INCIDENT ENERGY PER UNIT AREA AND DAY DEPENDS ON A NUMBER OF FACTORS:
•LATITUDE
•LOCAL CLIMATE
•SEASON OF THE YEAR
•INCLINATION OF THE COLLECTING SURFACE IN THE DIRECTION OF THE SUN
IN THE EARTH’S ATMOSPHERE, SOLAR RADIATION IS RECEIVED DIRECTLY (DIRECT RADIATION) AND BY DIFFUSION IN AIR, DUST, WATER, ETC., CONTAINED IN THE ATMOSPHERE (DIFFUSE RADIATION). THE SUM OF THE TWO IS REFERRED TO AS GLOBAL RADIATION.

Solar radiation can be converted into useful energy through
Passive systems are defined as those where the
heat moves by natural means due to house design
which entails the arrangement of basic building materials to
maximize the sun’s energy
active systems passive solar design
Active systems are generally those that are very visible like solar collectors or photovoltaic cells
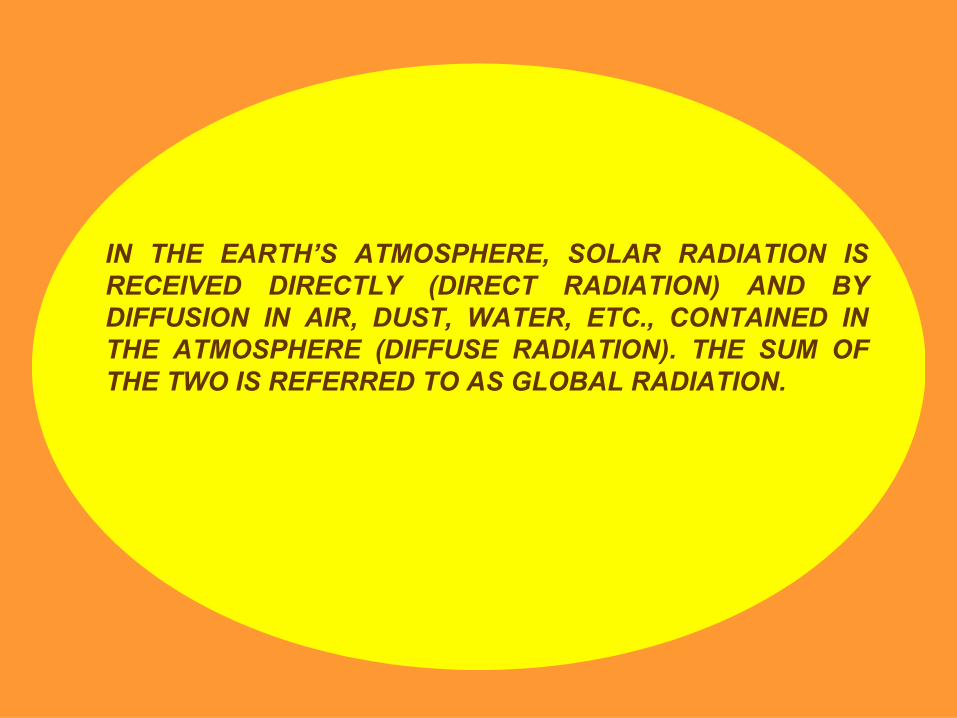
•The term, derived from Greek word for light - photos- and the name for unit of electromotive force - volt - means direct generation of electricity from light.
•The largest photovoltaic power station that has yet been constructed is the 5 MW system at Carrisa Plain, California.
•The efficiency of photovoltaic power stations is presently about 10% but individual solar cells have been fabricated with efficiencies exceeding 20%.
Photovoltaic cells (PV)

Commercial PV cells are sold with rated output power (Pp) that correspond to their maximum output in standard test conditions when the solar irradiation is near to its maximum at 1000 W/m2, and the cell
temperature is 25 0C.
In practice, PV modules seldom work at these conditions………….
The also called “solar cells”, made from semiconductor materials such as silicon, produce electric currents when exposed to sunlight. By manufacturing modules which contain dozens of such solar cells and connecting the modules large power stations can be built.
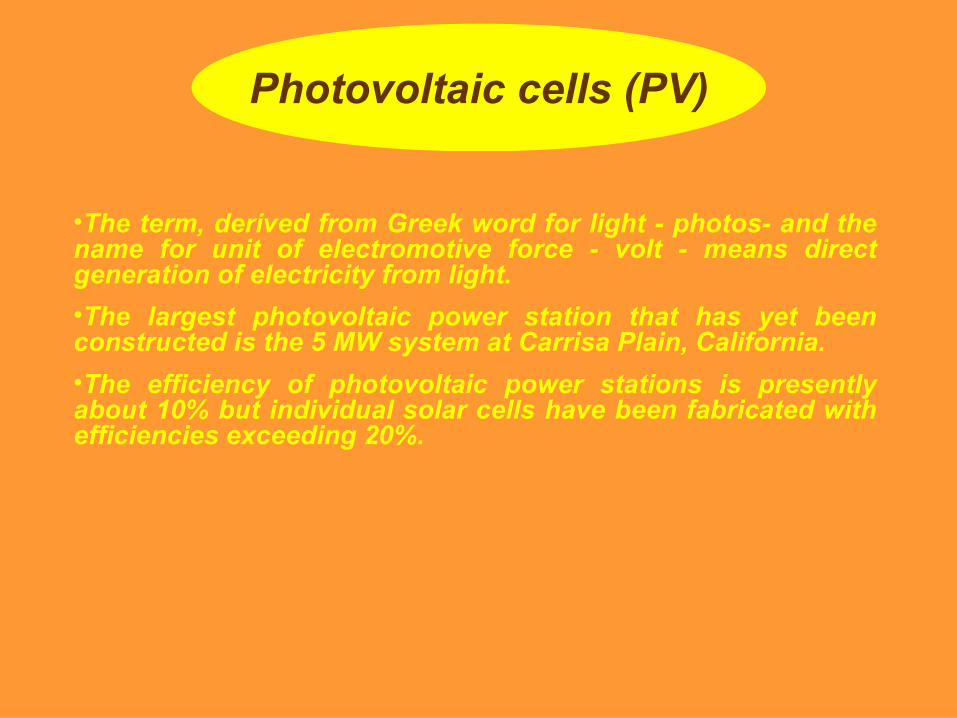
A rough estimate of the output from PV systems can be made according to the equation:
P (kWh/day) = Pp (kW) * I (kWh/m2 per day) * PR
where:
P : Photovoltaic system output
Pp : Rated Output Power.
I : Solar Irradiation on the surface in kWh/m2.
PR : Performance Ratio, determined by the system.

Could you develop mathematical models that allow us to predict the
variations in the power output throughout the year of different PV systems in different geographical
locations?
http://www.seps.sk/zp/fond/dieret/solar.htmlhttp://www.fsec.ucf.edu/PVT/PVFundamentals/index.htp
http://www.fsec.ucf.edu/
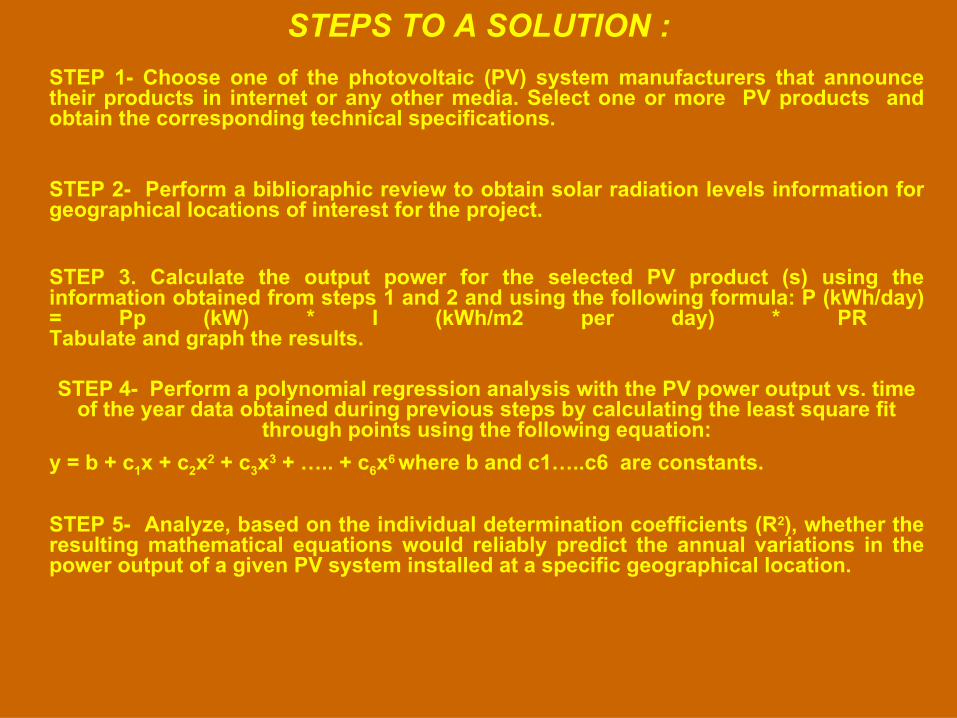
STEPS TO A SOLUTION :
STEP 1- Choose one of the photovoltaic (PV) system manufacturers that announce their products in internet or any other media. Select one or more PV products and obtain the corresponding technical specifications.
STEP 2- Perform a biblioraphic review to obtain solar radiation levels information for geographical locations of interest for the project.
STEP 3. Calculate the output power for the selected PV product (s) using the information obtained from steps 1 and 2 and using the following formula: P (kWh/day) = Pp (kW) * I (kWh/m2 per day) * PR Tabulate and graph the results.
STEP 4- Perform a polynomial regression analysis with the PV power output vs. time of the year data obtained during previous steps by calculating the least square fit
through points using the following equation:
y = b + c1x + c2x2 + c3x3 + ….. + c6x6 where b and c1…..c6 are constants.
STEP 5- Analyze, based on the individual determination coefficients (R2), whether the resulting mathematical equations would reliably predict the annual variations in the power output of a given PV system installed at a specific geographical location.
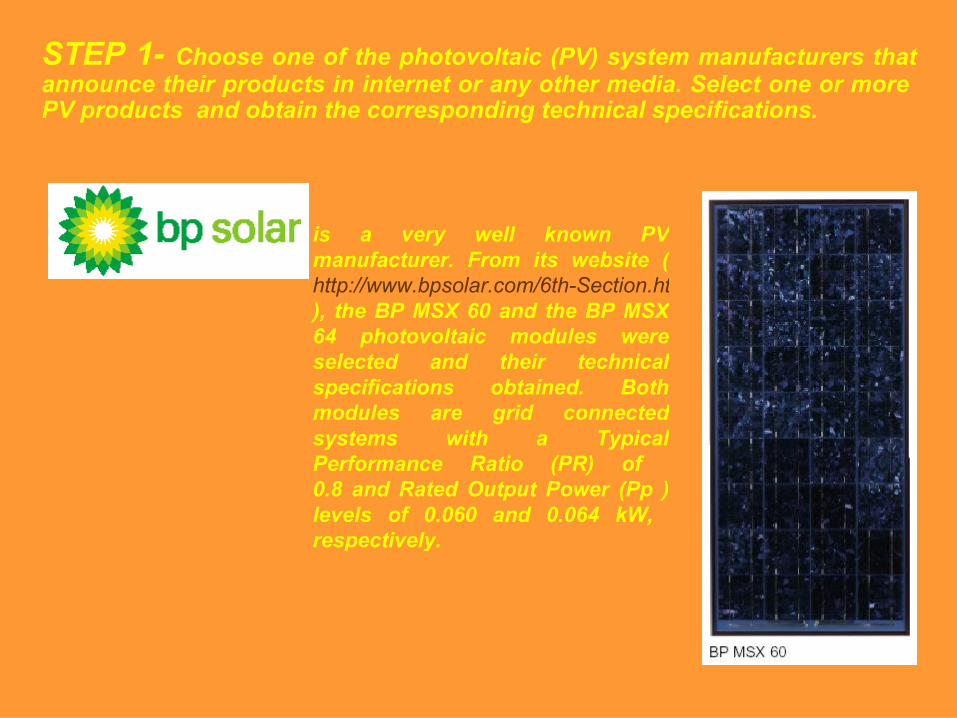
STEP 1- Choose one of the photovoltaic (PV) system manufacturers that announce their products in internet or any other media. Select one or more PV products and obtain the corresponding technical specifications.
is a very well known PV manufacturer. From its website (http://www.bpsolar.com/6th-Section.html), the BP MSX 60 and the BP MSX 64 photovoltaic modules were selected and their technical specifications obtained. Both modules are grid connected systems with a Typical Performance Ratio (PR) of 0.8 and Rated Output Power (Pp ) levels of 0.060 and 0.064 kW, respectively.
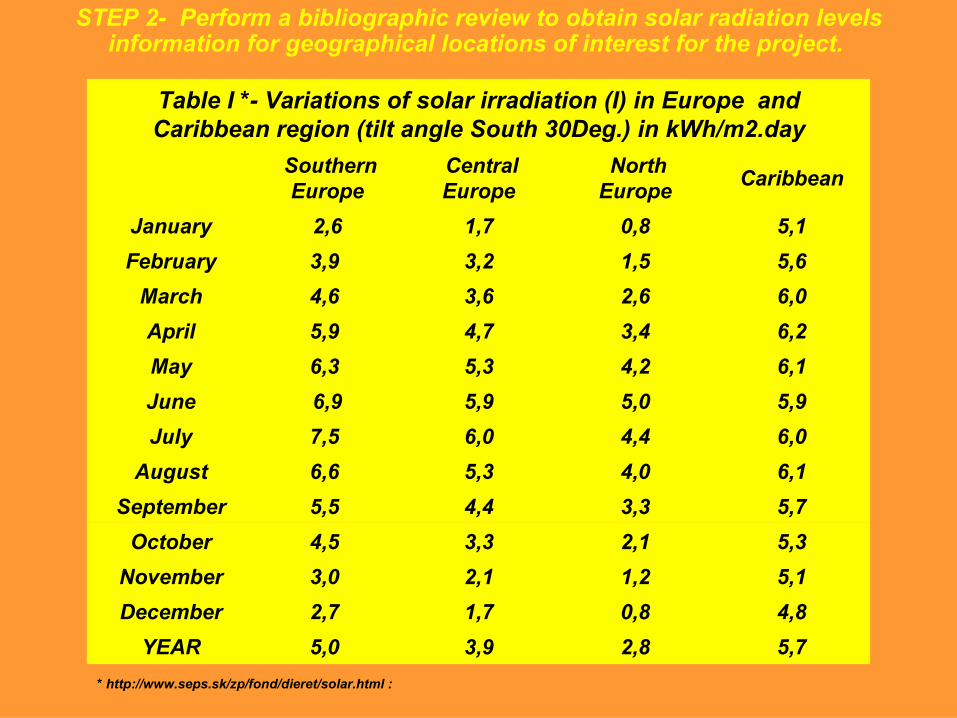
5,72,83,95,0 YEAR
4,80,81,72,7 December
5,11,22,13,0 November
5,32,13,34,5 October
5,73,34,45,5 September
6,14,05,36,6 August
6,04,46,07,5 July
5,95,05,96,9June
6,14,25,36,3 May
6,23,44,75,9 April
6,02,63,64,6 March
5,61,53,23,9 February
5,10,81,72,6January
Caribbean North Europe
Central Europe
Southern Europe
Table I *- Variations of solar irradiation (I) in Europe and Caribbean region (tilt angle South 30Deg.) in kWh/m2.day
STEP 2- Perform a bibliographic review to obtain solar radiation levels information for geographical locations of interest for the project.
* http://www.seps.sk/zp/fond/dieret/solar.html :
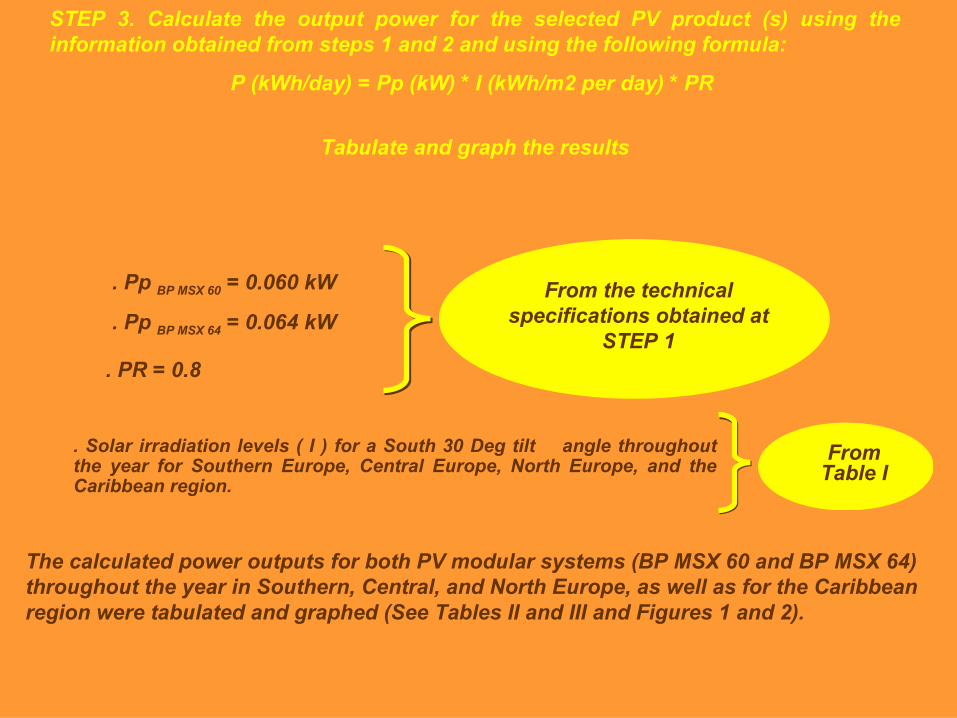
STEP 3. Calculate the output power for the selected PV product (s) using the information obtained from steps 1 and 2 and using the following formula:
P (kWh/day) = Pp (kW) * I (kWh/m2 per day) * PR
Tabulate and graph the results
. Pp BP MSX 60 = 0.060 kW
. Pp BP MSX 64 = 0.064 kW
. PR = 0.8
. Solar irradiation levels ( I ) for a South 30 Deg tilt angle throughout the year for Southern Europe, Central Europe, North Europe, and the Caribbean region.
From the technical specifications obtained at
STEP 1
From Table I
The calculated power outputs for both PV modular systems (BP MSX 60 and BP MSX 64) throughout the year in Southern, Central, and North Europe, as well as for the Caribbean region were tabulated and graphed (See Tables II and III and Figures 1 and 2).
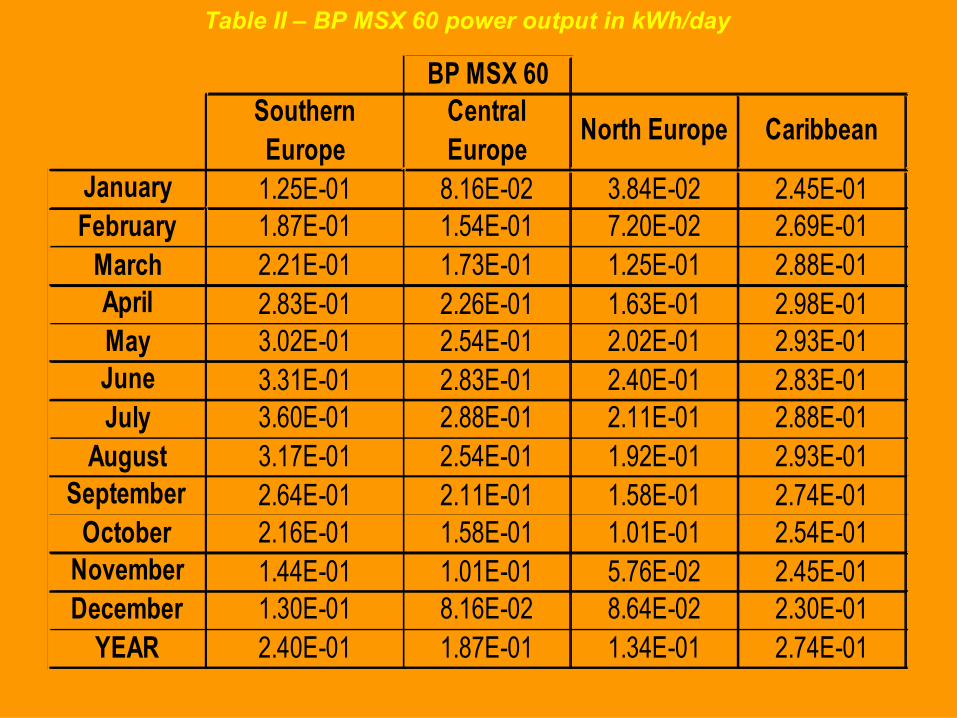
BP MSX 60
January 1.25E-01 8.16E-02 3.84E-02 2.45E-01February 1.87E-01 1.54E-01 7.20E-02 2.69E-01
March 2.21E-01 1.73E-01 1.25E-01 2.88E-01April 2.83E-01 2.26E-01 1.63E-01 2.98E-01May 3.02E-01 2.54E-01 2.02E-01 2.93E-01June 3.31E-01 2.83E-01 2.40E-01 2.83E-01July 3.60E-01 2.88E-01 2.11E-01 2.88E-01
August 3.17E-01 2.54E-01 1.92E-01 2.93E-01September 2.64E-01 2.11E-01 1.58E-01 2.74E-01
October 2.16E-01 1.58E-01 1.01E-01 2.54E-01November 1.44E-01 1.01E-01 5.76E-02 2.45E-01December 1.30E-01 8.16E-02 8.64E-02 2.30E-01
YEAR 2.40E-01 1.87E-01 1.34E-01 2.74E-01
Southern Europe
Central Europe
North Europe Caribbean
Table II – BP MSX 60 power output in kWh/day

BP MSX 64
January 1.33E-01 8.70E-02 4.10E-02 2.61E-01February 2.00E-01 1.64E-01 7.68E-02 2.87E-01
March 2.36E-01 1.84E-01 1.33E-01 3.07E-01April 3.02E-01 2.41E-01 1.74E-01 3.17E-01May 3.23E-01 2.71E-01 2.15E-01 3.12E-01June 3.53E-01 3.02E-01 2.56E-01 3.02E-01July 3.84E-01 3.07E-01 2.25E-01 3.07E-01
August 3.38E-01 2.71E-01 2.05E-01 3.12E-01September 2.82E-01 2.25E-01 1.69E-01 2.92E-01
October 2.30E-01 1.69E-01 1.08E-01 2.71E-01November 1.54E-01 1.08E-01 6.14E-02 2.61E-01December 1.38E-01 8.70E-02 9.22E-02 2.46E-01
YEAR 2.56E-01 2.00E-01 1.43E-01 2.92E-01
Southern Europe
Central Europe
North Europe Caribbean
Table II I– BP MSX 64 power output in kWh/day
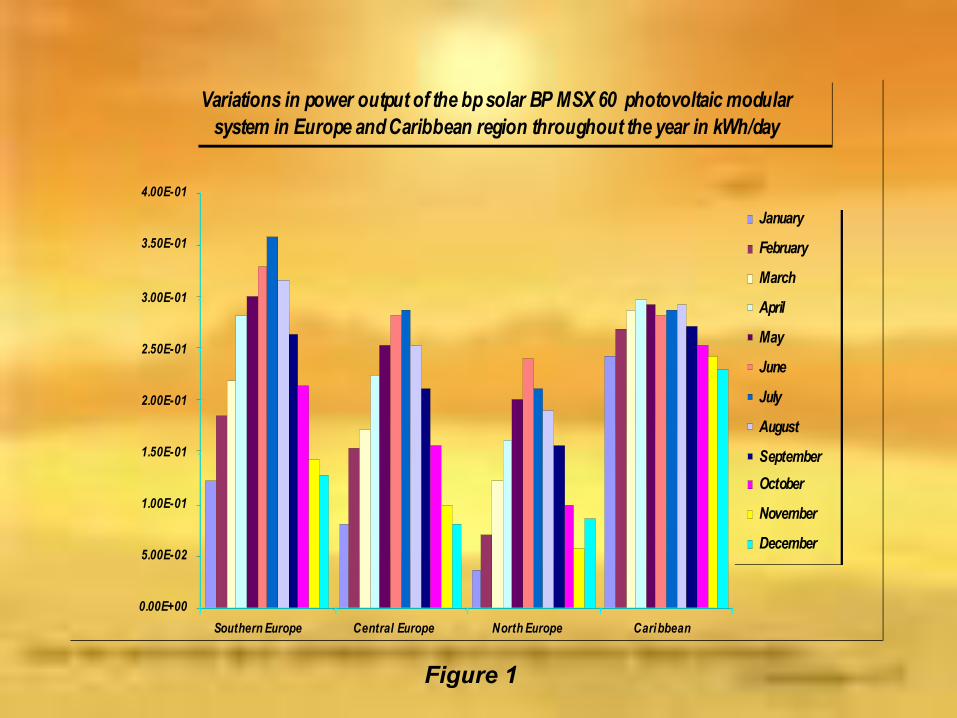
Variations in power output of the bp solar BP MSX 60 photovoltaic modular system in Europe and Caribbean region throughout the year in kWh/day
0.00E+00
5.00E-02
1.00E-01
1.50E-01
2.00E-01
2.50E-01
3.00E-01
3.50E-01
4.00E-01
Southern Europe Central Europe North Europe Caribbean
Power Output (kWh/day
January
February
March
April
May
June
July
August
September
October
November
December
Figure 1

Variations in power output of the bp solar BP MSX 64 photovoltaic modular system in Europe and Caribbean region throughout the year in kWh/day
0.00E+00
5.00E-02
1.00E-01
1.50E-01
2.00E-01
2.50E-01
3.00E-01
3.50E-01
4.00E-01
4.50E-01
Southern Europe Central Europe North Europe Caribbean
Power Output (kWh/day
January
February
March
April
May
June
July
August
September
October
November
December
Figure 2

STEP 4- Perform a polynomial regression analysis with the PV power output vs. time of the year data obtained during previous steps by calculating the least square fit through points using the
following equation:
y = b + c1x + c2x2 + c3x3 + ….. + c6x6
where b and c1…..c6 are constants.
The trendline function associated to graphs in Microsoft Excel workbooks was used to obtain the mathematical equations that best represent the data as well as the corresponding correlation coefficients. The resulting models are shown in Figures 3 through 6………..
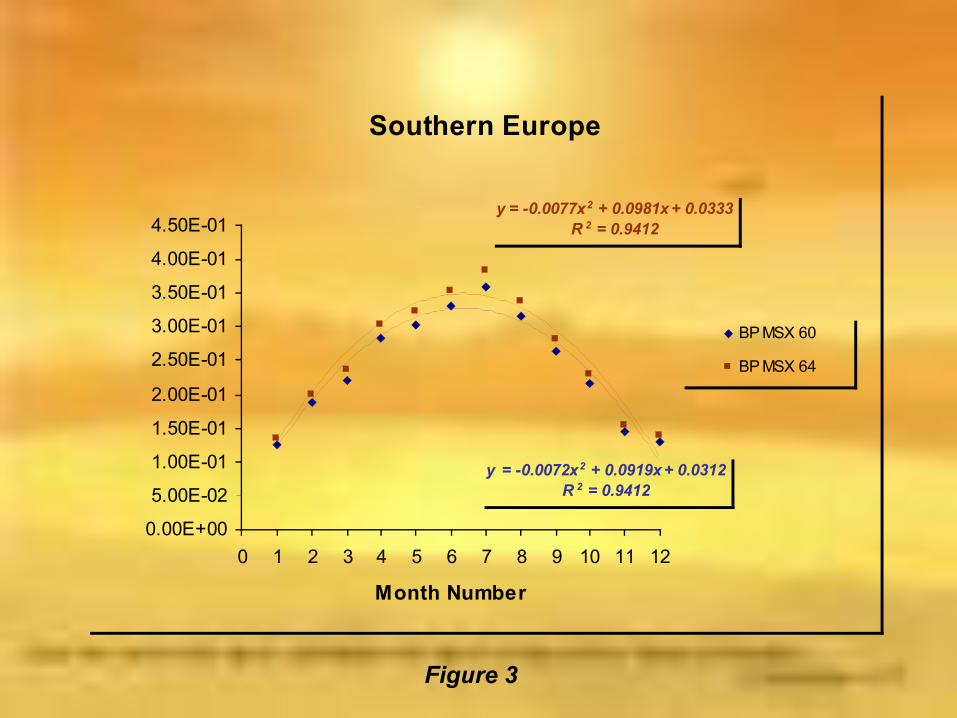
Southern Europe
y = -0.0077x2 + 0.0981x + 0.0333R 2 = 0.9412
y = -0.0072x2 + 0.0919x + 0.0312R 2 = 0.9412
0.00E+00
5.00E-02
1.00E-01
1.50E-01
2.00E-01
2.50E-01
3.00E-01
3.50E-01
4.00E-01
4.50E-01
0 1 2 3 4 5 6 7 8 9 10 11 12
Month Number
PV power output (kWh/day)
BP MSX 60
BP MSX 64
Figure 3

Central Europe
y = -0.0071x2 + 0.0894x + 0.0028R 2 = 0.9495
y = -0.0066x2 + 0.0838x + 0.0026R 2 = 0.9495
0.00E+00
5.00E-02
1.00E-01
1.50E-01
2.00E-01
2.50E-01
3.00E-01
3.50E-01
0 1 2 3 4 5 6 7 8 9 10 11 12
Month Number
PV power output (kWh/day)
BP MSX 60
BP MSX 64
Figure 4
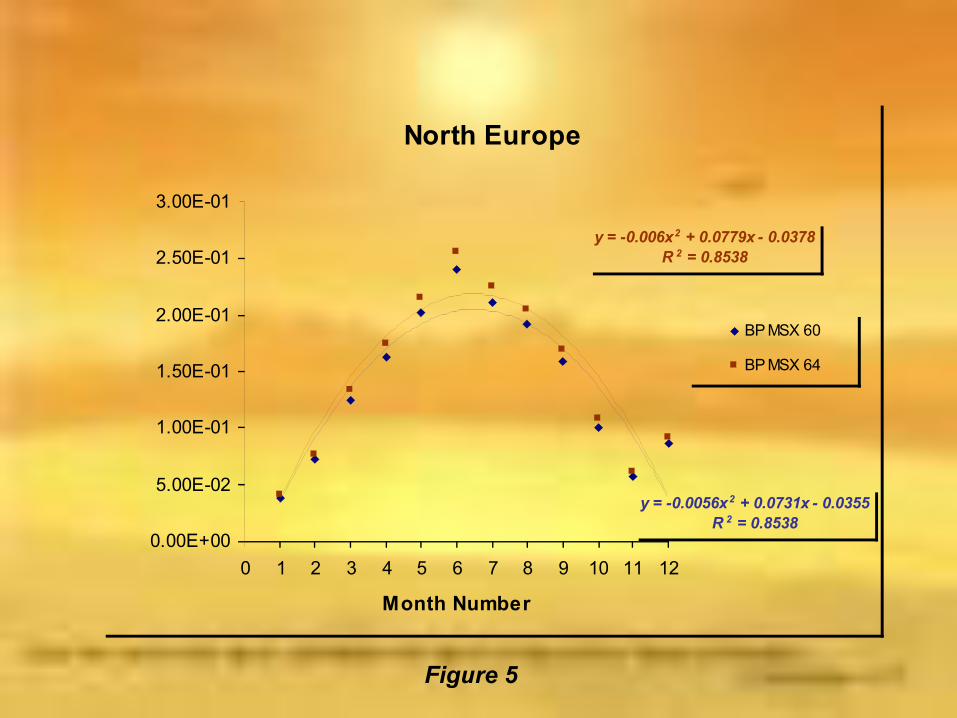
North Europe
y = -0.006x2 + 0.0779x - 0.0378R 2 = 0.8538
y = -0.0056x2 + 0.0731x - 0.0355R 2 = 0.8538
0.00E+00
5.00E-02
1.00E-01
1.50E-01
2.00E-01
2.50E-01
3.00E-01
0 1 2 3 4 5 6 7 8 9 10 11 12
Month Number
PV power output (kWh/day)
BP MSX 60
BP MSX 64
Figure 5

Caribbean
y = -0.0019x2 + 0.0221x + 0.2494R 2 = 0.913
y = -0.0018x2 + 0.0207x + 0.2338R 2 = 0.913
1.00E-01
1.50E-01
2.00E-01
2.50E-01
3.00E-01
3.50E-01
4.00E-01
0 1 2 3 4 5 6 7 8 9 10 11 12
Month Number
PV power output (kWh/day)
BP MSX 60
BP MSX 64
Figure 6

STEP 5- Analyze, based on the individual determination coefficients (R2), whether the resulting mathematical equations would reliably predict the annual variations in the power output of a given PV system installed at a specific geographical location.
R2 values of 0.85 – 0.95 indicate that the polynomial equations shown in Figures 3 through 6 are reliable trendlines in the estimation of power output (kWh/day) variations throughout a typical year for the BP MSX 60 & 64 photovoltaic modules manufactured by bp solar.
Related Documents