DOSE % EFFECT RELATIONSHIP: The dose % response curves The intensity and duration of the effect of drugs are a function of the drug dose and of the drug concentration at the effect site

Welcome message from author
This document is posted to help you gain knowledge. Please leave a comment to let me know what you think about it! Share it to your friends and learn new things together.
Transcript

DOSE%EFFECT)RELATIONSHIP:
The)dose%response)curves
The)intensity)and)duration)of)the)effect)of)drugs)are)a)function)of)the)drug)dose)and)of)the)drug)concentration)at)the)effect)site

•Continuous)scale)(↑dose),)↑effect)•Measured)in)a)single)biologic)unit•Relates)dose)to)intensity)of)effect
•All:or:none)pharmacologic)effect•Population)studies•Relates)dose)to)frequency)of)effect
Graded
Quantal
Dose&Effect+Endpoints
Two)types)of)Dose:response)curves:

%"of"maximal"effect
Graded&Dose*Response&Curves
EC50:"concentration"that"gives"the"half"maximal"effect
Linear"Scale Semilog"Scale
[drug]"("M/L)" Log"[drug]"("M/L)"

Linearity))between)16)and)84%)of)maximal)
effect
Grafico)semi:logaritmico
100
50
84
16
%)of)maximal)effect
Litchfield:Wilcoxon)method)for)determining)))EC50

Weight'/'Dose
Number'of'individuals/
Number'of'responding'individuals
Quantal'Dose9response'models'are'based'on'normal'distribution'of'biological'variables
mean% Average%Response%
Quantal'Dose9Response'Curves

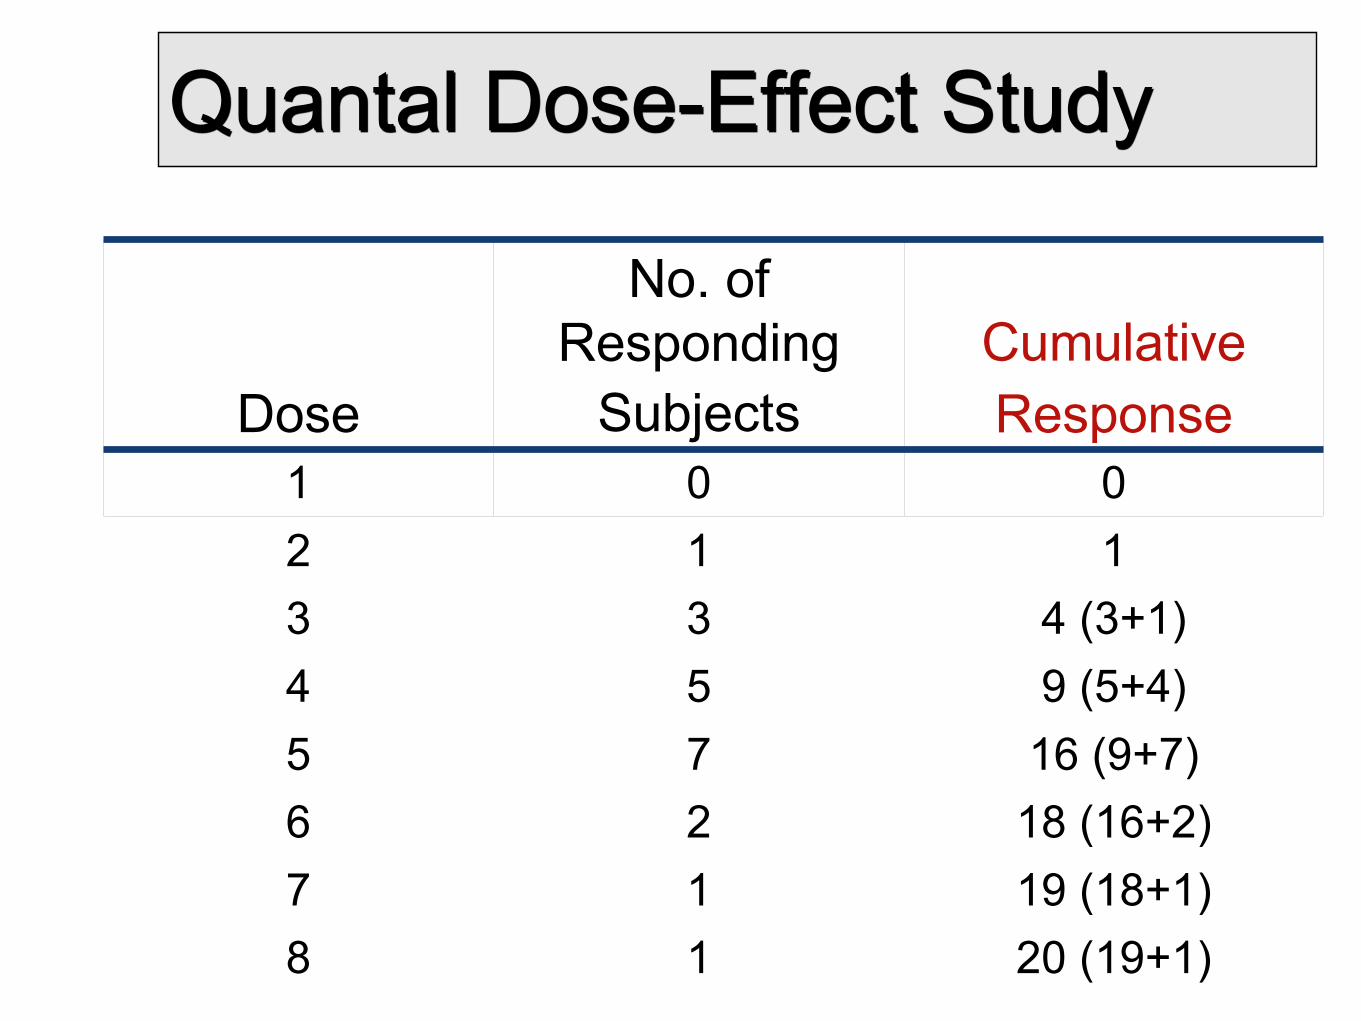
DoseNo.'of'Responding
Subjects1 02 13 34 55 76 27 18 1
Quantal'DoseAEffect'Study

Quantal'Dose,Effect'Curve:Frequency'distribution'
Log'Dose'(mg/kg)
#'of'patients'responding
ED50:'dose'required'to'produce'the'therapeutic'effect'in'50%'of'the'population'
ED50
Dose
No.'of'
Responding
Subjects
Cumulative
Response
1 0 0
2 1 1
3 3 4'(3+1)
4 5 9'(5+4)
5 7 16'(9+7)
6 2 18'(16+2)
7 1 19'(18+1)
8 1 20'(19+1)
Quantal'DoseHEffect'Study

Log$Dose$(mg/kg)
#$of$individuals$$responding
Quantal$Dose:Effect$Curve:Cumulative$Frequency$distribution$

Log$Dose$(mg/kg)
#$of$individuals$$responding ED50:$dose$required$
to$produce$a$therapeutic$effect$in$50%$of$the$population$
LD50:$letal$dose$in$50%$of$the$population$

Log$Dose$(mg/kg)
#$of$individuals$$responding ED50:$dose$required$
to$produce$a$therapeutic$effect$in$50%$of$the$population$
LD50:$letal$dose$in$50%$of$the$population$
Therapeutic0Index:

Log$Dose$(mg/kg)
#$of$individuals$$responding
ED99:$dose$required$to$produce$a$therapeutic$effect$in$99%$of$the$population$
LD1:$letal$dose$in$1%$of$the$population$
Margin,ofSafety:
LD1
ED99$0,70
160
230$==
Therapeutic,Index:

The$Therapeutic$Ratio$does$not$take$into$account$the$slope$of$the$dose4response$curvesDrugs$A$and$B$have$the$same$Therapeutic$Ratio$(same$ED50)$but$A$is$more$safe$than$BThe$Safety$Factor,$ratio$of$ED99$to$TD1,$better$describes$the$safety$degree$of$a$drug
Related Documents