DOOR RECOGNITION IN CLUTTERED BUILDING INTERIORS USING IMAGERY AND LIDAR DATA L. Díaz-Vilariño a, *, J. Martínez-Sánchez a , S. Lagüela a , J. Armesto a , K. Khoshelham b a Applied Geotechnologies Research Group, University of Vigo, ETSE Minas, 36310 Vigo (Spain)- (lucia, joaquin.martinez, susiminas, julia)@uvigo.es b Faculty of Geo-Information Science and Earth Observation, University of Twente, P.O. Box 217, Enschede 7514 AE, The Netherlands (k.khoshelham)@utwente.nl Commission V KEY WORDS: 3D modelling, feature extraction, imagery, terrestrial laser scanning. ABSTRACT: Building indoors reconstruction is an active research topic due to the importance of the wide range of applications to which they can be subjected, from architecture and furniture design, to movies and video games editing, or even crime scene investigation. Among the constructive elements defining the inside of a building, doors are important entities in applications like routing and navigation, and their automated recognition is advantageous e.g. in case of large multi-storey buildings with many office rooms. The inherent complexity of the automation of the recognition process is increased by the presence of clutter and occlusions, difficult to avoid in indoor scenes. In this work, we present a pipeline of techniques used for the reconstruction and interpretation of building interiors using information acquired in the form of point clouds and images. The methodology goes in depth with door detection and labelling as either opened, closed or furniture (false positive). * Corresponding author. 1. INTRODUCTION In the last decade, 3D building reconstruction has been a research of interest due to the increasing demand of realistic and accurate building models, which are requested as an input source for a variety of purposes. The representation of building interiors can support a wide range of applications in many fields, from architectural planning, to lighting analysis, crime scene investigation or indoor navigation. Specifically, openings of the building (windows and door) are of primary interest due to their unchanging nature within the building, especially when compared to furniture, as well as their influence of natural illumination and emergency route planning, among others. The geometric detail and the semantic content of existing indoor models strongly depend on the application area for which models are created. In this way, Building Information Modelling (BIM) provide highly detailed 3D indoor models that support a large amount of semantic data; while the representation of building interiors in GIS is limited in both geometry and semantic contents. This is due to the fact that, 3D GIS models are aimed at urban, global and large-scale purposes. Manual generation of a building model is a time-consuming process that requires expert knowledge (Tang, et al, 2010; Gonzalez-Aguilera et al, 2012). Reconstruction tools based on the interpretation of measured data such as LiDAR Data and Images are frequently used for the automatic interpretation and reconstruction of building geometry. One of the key challenges to the automation of the reconstruction of building interiors is the presence of clutter and occlusions, caused by furniture and other objects. To be useful, modelling algorithms should be functional in unmodified environments since it is not practical to remove the furniture and objects of an indoor scene prior data acquisition. Their specific challenges are, on the one hand, occluding objects that can block the visibility of the structural building surfaces (i.e. walls, ceilings or floors) causing absence of measured data; on the other hand, they can be erroneously interpreted as parts of the model itself. For example, a large bookshelf or cupboard can be confused with a door because their size and shape can be similar; or the frame of a picture can also be not clearly distinguishable from a window. Despite the presence of clutter and occlusions in building interiors, some approaches have dealt successfully with the reconstruction of structural elements of indoor scenes from imagery and/or point cloud data. Some methods based on data- driven approaches are presented by (Valero et al, 2012; Díaz- Vilariño et al 2014) and prior knowledge is used by (Budroni and Boehm, 2010; Becker et al, 2003). Regarding openings, as windows can be modelled also from outside, most literature about windows reconstruction is focused on facades because they present lower occlusion levels and repetitive patterns. Nevertheless, several methods have been developed to extract windows from indoor environments. Adán et al, (2011) and Previtali et al. (2014) detect openings in indoor scenes by analysing data density and classifying low- density areas as openings, thus limiting the scope to low-density windows and doorways. Demisse et al, (2013) use thermally coloured point clouds for detecting windows and labelling them as closed or open according to the temperature difference between walls and windows. The International Archives of the Photogrammetry, Remote Sensing and Spatial Information Sciences, Volume XL-5, 2014 ISPRS Technical Commission V Symposium, 23 – 25 June 2014, Riva del Garda, Italy This contribution has been peer-reviewed. doi:10.5194/isprsarchives-XL-5-203-2014 203

Welcome message from author
This document is posted to help you gain knowledge. Please leave a comment to let me know what you think about it! Share it to your friends and learn new things together.
Transcript
DOOR RECOGNITION IN CLUTTERED BUILDING INTERIORS USING IMAGERY
AND LIDAR DATA
L. Díaz-Vilariño a, *, J. Martínez-Sáncheza, S. Lagüelaa, J. Armestoa, K. Khoshelhamb
a Applied Geotechnologies Research Group, University of Vigo, ETSE Minas, 36310 Vigo (Spain)- (lucia,
joaquin.martinez, susiminas, julia)@uvigo.es b Faculty of Geo-Information Science and Earth Observation, University of Twente, P.O. Box 217, Enschede 7514 AE,
The Netherlands (k.khoshelham)@utwente.nl
Commission V
KEY WORDS: 3D modelling, feature extraction, imagery, terrestrial laser scanning.
ABSTRACT:
Building indoors reconstruction is an active research topic due to the importance of the wide range of applications to which they can
be subjected, from architecture and furniture design, to movies and video games editing, or even crime scene investigation. Among
the constructive elements defining the inside of a building, doors are important entities in applications like routing and navigation,
and their automated recognition is advantageous e.g. in case of large multi-storey buildings with many office rooms. The inherent
complexity of the automation of the recognition process is increased by the presence of clutter and occlusions, difficult to avoid in
indoor scenes. In this work, we present a pipeline of techniques used for the reconstruction and interpretation of building interiors
using information acquired in the form of point clouds and images. The methodology goes in depth with door detection and labelling
as either opened, closed or furniture (false positive).
* Corresponding author.
1. INTRODUCTION
In the last decade, 3D building reconstruction has been a
research of interest due to the increasing demand of realistic and
accurate building models, which are requested as an input
source for a variety of purposes.
The representation of building interiors can support a wide
range of applications in many fields, from architectural
planning, to lighting analysis, crime scene investigation or
indoor navigation. Specifically, openings of the building
(windows and door) are of primary interest due to their
unchanging nature within the building, especially when
compared to furniture, as well as their influence of natural
illumination and emergency route planning, among others. The
geometric detail and the semantic content of existing indoor
models strongly depend on the application area for which
models are created. In this way, Building Information
Modelling (BIM) provide highly detailed 3D indoor models that
support a large amount of semantic data; while the
representation of building interiors in GIS is limited in both
geometry and semantic contents. This is due to the fact that, 3D
GIS models are aimed at urban, global and large-scale purposes.
Manual generation of a building model is a time-consuming
process that requires expert knowledge (Tang, et al, 2010;
Gonzalez-Aguilera et al, 2012). Reconstruction tools based on
the interpretation of measured data such as LiDAR Data and
Images are frequently used for the automatic interpretation and
reconstruction of building geometry.
One of the key challenges to the automation of the
reconstruction of building interiors is the presence of clutter and
occlusions, caused by furniture and other objects. To be useful,
modelling algorithms should be functional in unmodified
environments since it is not practical to remove the furniture
and objects of an indoor scene prior data acquisition. Their
specific challenges are, on the one hand, occluding objects that
can block the visibility of the structural building surfaces (i.e.
walls, ceilings or floors) causing absence of measured data; on
the other hand, they can be erroneously interpreted as parts of
the model itself. For example, a large bookshelf or cupboard
can be confused with a door because their size and shape can be
similar; or the frame of a picture can also be not clearly
distinguishable from a window.
Despite the presence of clutter and occlusions in building
interiors, some approaches have dealt successfully with the
reconstruction of structural elements of indoor scenes from
imagery and/or point cloud data. Some methods based on data-
driven approaches are presented by (Valero et al, 2012; Díaz-
Vilariño et al 2014) and prior knowledge is used by (Budroni
and Boehm, 2010; Becker et al, 2003).
Regarding openings, as windows can be modelled also from
outside, most literature about windows reconstruction is
focused on facades because they present lower occlusion levels
and repetitive patterns. Nevertheless, several methods have been
developed to extract windows from indoor environments. Adán
et al, (2011) and Previtali et al. (2014) detect openings in
indoor scenes by analysing data density and classifying low-
density areas as openings, thus limiting the scope to low-density
windows and doorways. Demisse et al, (2013) use thermally
coloured point clouds for detecting windows and labelling them
as closed or open according to the temperature difference
between walls and windows.
The International Archives of the Photogrammetry, Remote Sensing and Spatial Information Sciences, Volume XL-5, 2014ISPRS Technical Commission V Symposium, 23 – 25 June 2014, Riva del Garda, Italy
This contribution has been peer-reviewed.doi:10.5194/isprsarchives-XL-5-203-2014 203
In contrast to windows, there is not much literature on door
reconstruction. From point clouds, if the doors are open, they
can be easily detected as a hole in the wall. If they are closed,
detection becomes more difficult because their descriptive
features are highly dependent on the quality of input data. From
imagery, similar size and shape objects can be erroneously
understood as doors.
In this work, we propose a simple but effective methodology
based on automatic data-driven approach for the reconstruction
of building indoor scenes using both 3D point clouds and RGB
images, going in depth with door detection and classification.
The methodology is tested through a case study, acquired under
unmodified-furniture conditions.
Specifically, an image-based algorithm using the Generalized
Hough Transform (GHT) is developed for the detection of door
candidates in orthoimages. Then, the point cloud is used as a
ground-truth for the distinction of doors from other objects with
similar size and shape and the classification of all of them into
three categories: open doors, closed doors and furniture.
2. METHODOLOGY
The approach developed for modelling building interiors allows
the automatic reconstruction of envelope and doors, starting
from point clouds and imagery.
The workflow of the proposed methodology is shown in figure
1. The initial step (section 2.2.) involves the segmentation of the
point cloud and the recognition and reconstruction of the
building elements that compose the indoor-scene envelope
(walls, floor and ceiling). The walls obtained are used as the
basis for the generation of orthoimages (section 2.3.) which will
be the input data for the following step, the detection of door
candidates (section 2.4). The final step consists of the
classification and pruning of door candidates (section 2.5.).
Figure 1. Workflow of the proposed methodology.
2.1 Data acquisition
The data set includes point clouds and images obtained from a
single hybrid acquisition system formed by a Terrestrial Laser
Scanner (TLS), model Riegl LMS Z-390i, and a high-resolution
camera firmly mounted on its top (Nikon D200 with a 20 mm
lens).
On the one hand, the Internal Calibration Parameters of the
camera are calculated following the photogrammetric
calibration process of self-calibration bundle adjustment based
on flat check pattern images (Brown, 1971). On the other hand,
the External Orientation Parameters (EOPs) are obtained
through a point matching process using reflective targets.
Therefore, the geometric relation between each laser point and
the camera is known.
The laser scanner presents a field of view of 360º horizontally
and 80º vertically, which implies missing information from the
immediate ceiling and floor on top and under it. The choice of
number of scanner positions and their location is made by the
user depending on the shape complexity of the indoor scene,
trying to maximize the area of interest acquirable from each of
them.
2.2 Envelope segmentation and reconstruction
The acquired point cloud is rotated for its alignment with the
main building axis and submitted to a curvature study based on
the Principal Component Analysis (PCA) by using the
covariance method (Jolliffe, 2002). PCA involves the
computation of the eigenvalues (λi) and eigenvectors (ei) of the
covariance matrix (COV) of a neighbourhood (k) of each point
(i). The points, part of these neighbourhoods, are searched
according to the minimum Euclidean distance by applying a K
Nearest Neighbour (KNN) procedure.
( ) [
] (1)
( ) ( )
∑ ( ̅)
(2)
( ) ( ) ( )
∑ ( ̅)( ̅)
(3)
Where, E(x) is the expected value for an axis ( ( ) ̅ ), and
and denote the variance and covariance values,
respectively.
Eigenvalues are used afterwards to derive a curvature feature,
which can act as an indicator of the planarity of each point
neighbourhood: the eigenvector associated to the smallest
eigenvalue is considered as the normal vector to the surface of
each point, since it is the direction vector of the plane with the
lowest probability of being the fitting plane. Therefore, if the
point was on a planar surface, the variance should be nominally
zero.
Then a normal vector smoothing is performed by averaging
each point normal vector with the normal vectors of the points
in its neighbourhood, k.
∑ (4)
The averaging is carried out with a weighting factor which
depends on the distance between points , where, denotes
the averaged normal of point .
RGB Images
3 D Building Interior
Orthoimages
3D point cloud
3D region-growing
Generalized Hough
Transform
3D building Envelope
Door Candidates
classification
The International Archives of the Photogrammetry, Remote Sensing and Spatial Information Sciences, Volume XL-5, 2014ISPRS Technical Commission V Symposium, 23 – 25 June 2014, Riva del Garda, Italy
This contribution has been peer-reviewed.doi:10.5194/isprsarchives-XL-5-203-2014 204
∑
(5)
Then, a seeded region-growing algorithm (Rabbani et al, 2006)
is developed for the detection of planar surfaces. For each
iteration of the algorithm, the point with lowest curvature value
is chosen as a region seed candidate. Following, a region-
growing step in the algorithm includes in the region all those
points satisfying the following conditions:
1. The difference between the direction of its normal
vector (i.e. the eigenvector associated to the smallest
eigenvalue ) and the region normal vector is below
a certain threshold ( ).
2. The distance between the point and the planar region
is below a certain threshold ( ).
The algorithm is computed until all points are assigned to a
region, even though only regions with the highest number of
points are used in successive steps.
After segmentation, horizontal regions are automatically
classified into “ceiling” and “floor” according to the Z
component of their coordinates, while vertical regions are
submitted to a visual inspection for their identification and
labelling into: “walls” or “furniture”.
Finally, RANSAC (Fischler and Bolles, 1981) is applied for
achieving the best fitting plane to each region and the 3D
building envelope is reconstructed by intersecting these planes
assigned to walls, floor and ceiling in order to obtain the
boundary points that define each element.
2.3 Orthoimages generation
Assuming that building interiors are composed of vertical walls
with rectangular shapes, the 3D boundary points that define
each wall are used to determine the 2D coordinate system of the
orthoimage plane of each wall. The origin of the coordinate
system is established in the lower-left boundary point from an
interior-scene point of view.
According to the theory of optical projection, the rays
corresponding to each object can intersect on the projective
plane by adjusting the External Orientation Parameters of each
image. Therefore, after defining the orthoimage plane and the
resolution of the image to be generated, object 3D points are
transformed from the laser scanner coordinate system to the
camera coordinate system through an exterior rotation (R) and
translation (T).
( ) (
) (6)
Both rotation and translation matrices are obtained from the
geometric relation between the laser scanner and the camera,
given by the acquisition device, and the rotation matrix obtained
from the point cloud alignment with the main building axis.
Then, resulting points are projected to the image plane and RGB
values are obtained through the perspective projection of the 3D
points using a pinhole camera model,
(7)
where (x,y,z) represent a point projected onto the image plane, f
is the focal length of the camera and (x’,y’) refer to the
coordinates of the image pixel.
Lens distortion is calculated and corrected to make possible the
correction of the difference between the actual camera
projection and the camera model, which is introduced by the
lens. The Interior Orientation Parameters consist of three radial
distortion coefficients (K1, K2, K3) and two decentring distortion
coefficients (P1, P2) are respectively applied to the computation
of the radial (drad) and decentring (dxdec, dydec) corrections,
which are undone to obtain the distorted pixel coordinates.
(8)
( ) (9)
( )
Where, √ .
As the image acquisition is carried out for the complete
horizontal angle of view (0º-360º), the azimuth (regarding the
Camera Coordinate System) of the ray formed between each
pixel and the camera projection centre is calculated and
compared with the orientation of each image. If the azimuth of
the ray is within the field of view of the image, the RGB value
is adopted. If this condition is not verified, the point is not in the
image frame.
Finally, as the image acquisition is performed with 10% overlap
between consecutive images, a linear transition (Lui et al, 2009)
is implemented in order to smooth transition areas and eliminate
edge seams caused by a direct average fusing.
2.4 GHT for doors detection
The Generalized Hough Transform (GHT) (Ballard, 1981) is
applied for detecting door candidates in the orthoimages
previously generated.
In the original Hough Transform (Hough, 1962), a straight line
is represented by the Hesse form, where ρ is the distance from
the application point of the normal vector to the origin of XY
image space and θ is its angle with the X-axis.
(10)
The method is based on the transformation of the image space
(XY) into a 2D parameter space (ρ θ). Each pixel in the image
corresponds to a curve representing all the parameters of the
lines of a bundle of straight lines that have this pixel as
intersection point. Therefore, the objective of this line detection
process is to find this intersection point. The parameter space is
discretized through an accumulator array consisting of bins
where votes from edge pixels in the image space are stored. The
bin that receives the maximum number of votes determines the
solution.
While the Hough Transform is used to detect objects defined
with few parameters such as lines or planes, the GHT
transforms the shape detection problem into a maximum
analysis problem, so that arbitrary shapes can be detected, even
The International Archives of the Photogrammetry, Remote Sensing and Spatial Information Sciences, Volume XL-5, 2014ISPRS Technical Commission V Symposium, 23 – 25 June 2014, Riva del Garda, Italy
This contribution has been peer-reviewed.doi:10.5194/isprsarchives-XL-5-203-2014 205
being robust to partial occlusion and clutter (Khoshelham,
2007).
The algorithm uses edge information to define a mapping from
the orientation of an edge point to a reference point of the
shape. Doors can be assumed as rectangles with vertical
orientation. For the performance of edge detection, true colour
orthoimages are converted to grayscale images, where edges are
found by the Canny operator. Then, the resulting edges are
submitted to an orientation filter through which 90° and 180°
oriented edge pixels are selected for computation.
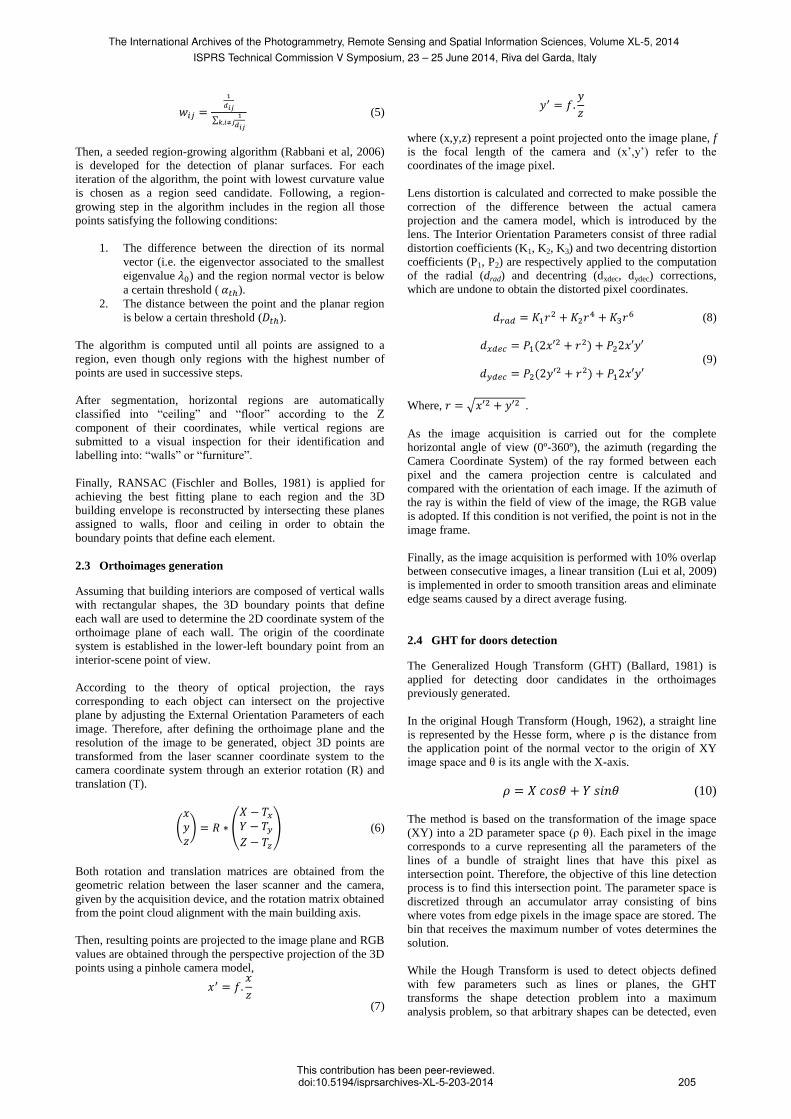
The shape of the door (rectangle), defined by length (r) and
direction (β), is previously stored in a table, called R-Table,
where the gradient direction (φ) serves as an index.
The process starts by selecting an arbitrary reference point for
the door (XC, YC). For every resulting edge pixel on the shape
edge, the gradient direction (φ) as well as the length (r) and the
direction (β) of a vector connecting the boundary pixel to the
reference point are computed. For each couple (r, β) found in
the R-Table, the accumulator array bin is increased in one vote.
At the end of this voting process, the bin with the maximum
number of votes indicates the reference point and the edge
pixels of the most probable candidate. In order to refine the
results, neighbour candidates are supressed.
Figure 2. Parameters involved in the GHT for door-candidate
detection.
As doors are assumed as rectangles with vertical orientation,
four parameters are considered for their definition: two
coordinates of the centre, width and height. They are used as
constraints to enforce the detection of door candidates.
2.5 Candidate classification and pruning
Due to the detection process, objects with size and shape similar
to doors can be detected as false positives. In order to reduce the
false positive rate, a candidate pruning method based on the
analysis of the segmented planar regions and the original 3D
point cloud is implemented.
After segmentation, points on closed doors can be labelled as
wall points depending on the distance thresholds in the region
growing ( ) and the RANSAC ( ) steps. Lowering these
thresholds can be a solution for contiguous planes, but it could
result in over-segmentation of large walls. Therefore, enhancing
the pruning method with classification capabilities results in a
more robust methodology.
In a first step, points that are projected orthogonally onto the
rectangular candidate are taken into account. The points that are
at higher distance than the threshold distance from the wall
plane are discarded. This threshold distance is coincident with
the candidate width, in order to consider enough space to open
and pass through a door opening.
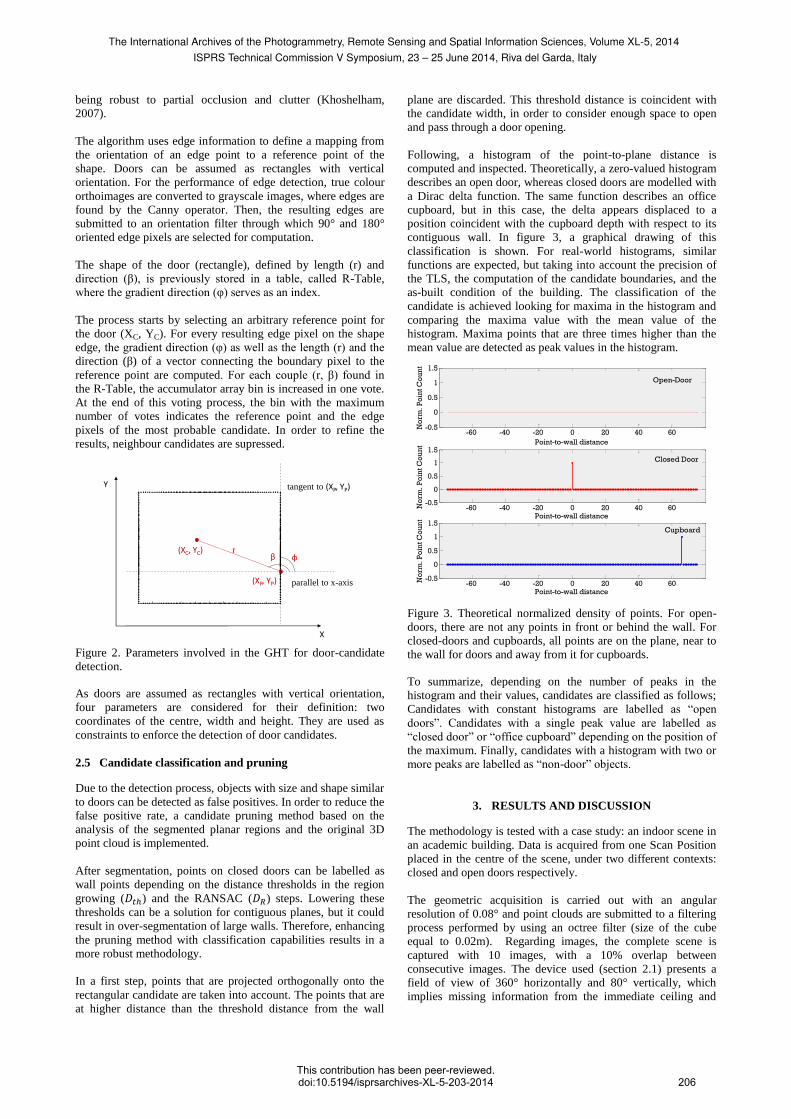
Following, a histogram of the point-to-plane distance is
computed and inspected. Theoretically, a zero-valued histogram
describes an open door, whereas closed doors are modelled with
a Dirac delta function. The same function describes an office
cupboard, but in this case, the delta appears displaced to a
position coincident with the cupboard depth with respect to its
contiguous wall. In figure 3, a graphical drawing of this
classification is shown. For real-world histograms, similar
functions are expected, but taking into account the precision of
the TLS, the computation of the candidate boundaries, and the
as-built condition of the building. The classification of the
candidate is achieved looking for maxima in the histogram and
comparing the maxima value with the mean value of the
histogram. Maxima points that are three times higher than the
mean value are detected as peak values in the histogram.
Figure 3. Theoretical normalized density of points. For open-
doors, there are not any points in front or behind the wall. For
closed-doors and cupboards, all points are on the plane, near to
the wall for doors and away from it for cupboards.
To summarize, depending on the number of peaks in the
histogram and their values, candidates are classified as follows;
Candidates with constant histograms are labelled as “open
doors”. Candidates with a single peak value are labelled as
“closed door” or “office cupboard” depending on the position of
the maximum. Finally, candidates with a histogram with two or
more peaks are labelled as “non-door” objects.
3. RESULTS AND DISCUSSION
The methodology is tested with a case study: an indoor scene in
an academic building. Data is acquired from one Scan Position
placed in the centre of the scene, under two different contexts:
closed and open doors respectively.
The geometric acquisition is carried out with an angular
resolution of 0.08° and point clouds are submitted to a filtering
process performed by using an octree filter (size of the cube
equal to 0.02m). Regarding images, the complete scene is
captured with 10 images, with a 10% overlap between
consecutive images. The device used (section 2.1) presents a
field of view of 360° horizontally and 80° vertically, which
implies missing information from the immediate ceiling and
(XC, YC) rβ φ
(XP, YP)
Y
X
parallel to x-axis
tangent to (XP, YP)
-60 -40 -20 0 20 40 60-0.5
0
0.5
1
1.5
Point-to-wall distance
No
rm.
Po
int
Co
un
t
Open-Door
-60 -40 -20 0 20 40 60-0.5
0
0.5
1
1.5
Closed Door
Point-to-wall distance
No
rm.
Po
int
Co
un
t
-60 -40 -20 0 20 40 60-0.5
0
0.5
1
1.5Cupboard
Point-to-wall distance
No
rm.
Po
int
Co
un
t
The International Archives of the Photogrammetry, Remote Sensing and Spatial Information Sciences, Volume XL-5, 2014ISPRS Technical Commission V Symposium, 23 – 25 June 2014, Riva del Garda, Italy
This contribution has been peer-reviewed.doi:10.5194/isprsarchives-XL-5-203-2014 206
floor on top and under it. However, this lack of data does not
affect the next steps in the proposed workflow.
With regard to segmentation, a curvature analysis is performed
by analysing each point supported by a neighbourhood of its 50
closest points (Díaz-Vilariño et al, 2013). The region-growing
step is carried out taking into account, on one side, a high
angular threshold ( ) of 75° and on the other side, a small
connectivity threshold ( ) of 0,05m. As this step aims to
segment just envelope elements such as walls, ceilings and
floors, these parameters are chosen to avoid over-segmentation.
In this way, breakings of smooth areas are ensured to appear
only on the edges between consecutive elements. Finally, as
building interiors are usually highly cluttered and the point
cloud is processed without cleaning pre-processing, small size
regions (minimum size of 350 points) are rejected for further
processing.
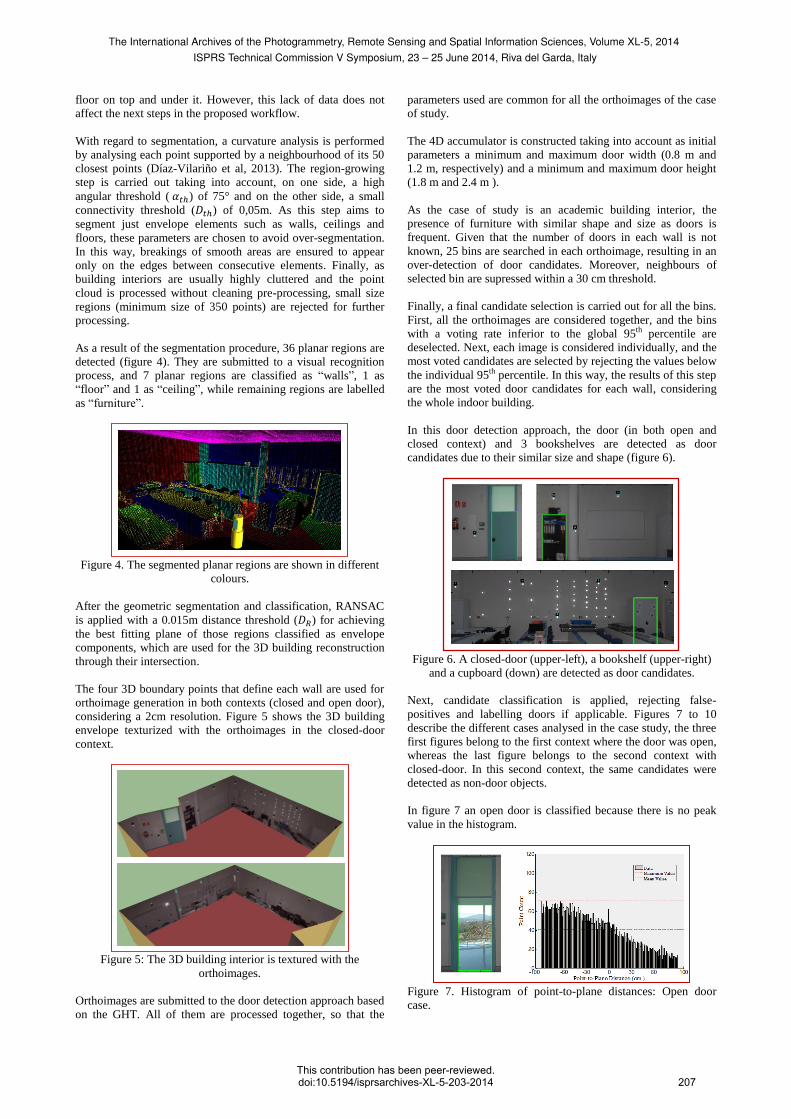
As a result of the segmentation procedure, 36 planar regions are
detected (figure 4). They are submitted to a visual recognition
process, and 7 planar regions are classified as “walls”, 1 as
“floor” and 1 as “ceiling”, while remaining regions are labelled
as “furniture”.
Figure 4. The segmented planar regions are shown in different
colours.
After the geometric segmentation and classification, RANSAC
is applied with a 0.015m distance threshold ( ) for achieving
the best fitting plane of those regions classified as envelope
components, which are used for the 3D building reconstruction
through their intersection.
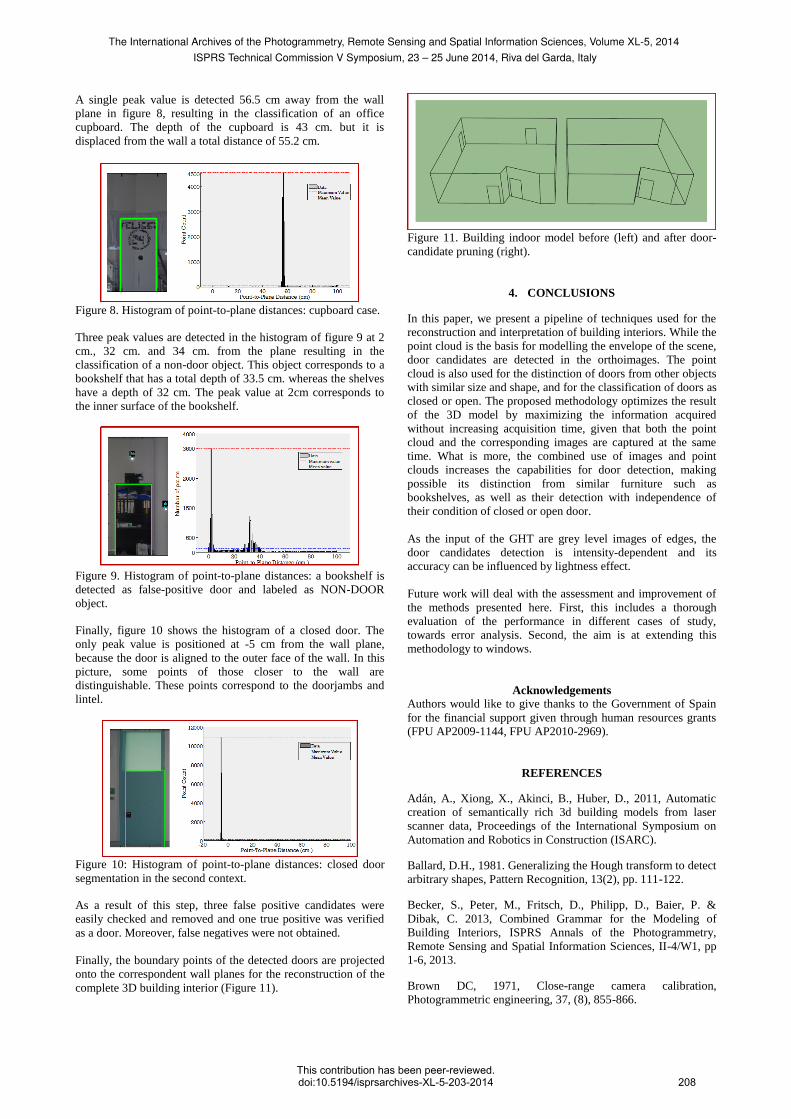
The four 3D boundary points that define each wall are used for
orthoimage generation in both contexts (closed and open door),
considering a 2cm resolution. Figure 5 shows the 3D building
envelope texturized with the orthoimages in the closed-door
context.
Figure 5: The 3D building interior is textured with the
orthoimages.
Orthoimages are submitted to the door detection approach based
on the GHT. All of them are processed together, so that the
parameters used are common for all the orthoimages of the case
of study.
The 4D accumulator is constructed taking into account as initial
parameters a minimum and maximum door width (0.8 m and
1.2 m, respectively) and a minimum and maximum door height
(1.8 m and 2.4 m ).
As the case of study is an academic building interior, the
presence of furniture with similar shape and size as doors is
frequent. Given that the number of doors in each wall is not
known, 25 bins are searched in each orthoimage, resulting in an
over-detection of door candidates. Moreover, neighbours of
selected bin are supressed within a 30 cm threshold.
Finally, a final candidate selection is carried out for all the bins.
First, all the orthoimages are considered together, and the bins
with a voting rate inferior to the global 95th percentile are
deselected. Next, each image is considered individually, and the
most voted candidates are selected by rejecting the values below
the individual 95th percentile. In this way, the results of this step
are the most voted door candidates for each wall, considering
the whole indoor building.
In this door detection approach, the door (in both open and
closed context) and 3 bookshelves are detected as door
candidates due to their similar size and shape (figure 6).
Figure 6. A closed-door (upper-left), a bookshelf (upper-right)
and a cupboard (down) are detected as door candidates.
Next, candidate classification is applied, rejecting false-
positives and labelling doors if applicable. Figures 7 to 10
describe the different cases analysed in the case study, the three
first figures belong to the first context where the door was open,
whereas the last figure belongs to the second context with
closed-door. In this second context, the same candidates were
detected as non-door objects.
In figure 7 an open door is classified because there is no peak
value in the histogram.
Figure 7. Histogram of point-to-plane distances: Open door
case.
The International Archives of the Photogrammetry, Remote Sensing and Spatial Information Sciences, Volume XL-5, 2014ISPRS Technical Commission V Symposium, 23 – 25 June 2014, Riva del Garda, Italy
This contribution has been peer-reviewed.doi:10.5194/isprsarchives-XL-5-203-2014 207
A single peak value is detected 56.5 cm away from the wall
plane in figure 8, resulting in the classification of an office
cupboard. The depth of the cupboard is 43 cm. but it is
displaced from the wall a total distance of 55.2 cm.
Figure 8. Histogram of point-to-plane distances: cupboard case.
Three peak values are detected in the histogram of figure 9 at 2
cm., 32 cm. and 34 cm. from the plane resulting in the
classification of a non-door object. This object corresponds to a
bookshelf that has a total depth of 33.5 cm. whereas the shelves
have a depth of 32 cm. The peak value at 2cm corresponds to
the inner surface of the bookshelf.
Figure 9. Histogram of point-to-plane distances: a bookshelf is
detected as false-positive door and labeled as NON-DOOR
object.
Finally, figure 10 shows the histogram of a closed door. The
only peak value is positioned at -5 cm from the wall plane,
because the door is aligned to the outer face of the wall. In this
picture, some points of those closer to the wall are
distinguishable. These points correspond to the doorjambs and
lintel.
Figure 10: Histogram of point-to-plane distances: closed door
segmentation in the second context.
As a result of this step, three false positive candidates were
easily checked and removed and one true positive was verified
as a door. Moreover, false negatives were not obtained.
Finally, the boundary points of the detected doors are projected
onto the correspondent wall planes for the reconstruction of the
complete 3D building interior (Figure 11).
Figure 11. Building indoor model before (left) and after door-
candidate pruning (right).
4. CONCLUSIONS
In this paper, we present a pipeline of techniques used for the
reconstruction and interpretation of building interiors. While the
point cloud is the basis for modelling the envelope of the scene,
door candidates are detected in the orthoimages. The point
cloud is also used for the distinction of doors from other objects
with similar size and shape, and for the classification of doors as
closed or open. The proposed methodology optimizes the result
of the 3D model by maximizing the information acquired
without increasing acquisition time, given that both the point
cloud and the corresponding images are captured at the same
time. What is more, the combined use of images and point
clouds increases the capabilities for door detection, making
possible its distinction from similar furniture such as
bookshelves, as well as their detection with independence of
their condition of closed or open door.
As the input of the GHT are grey level images of edges, the
door candidates detection is intensity-dependent and its
accuracy can be influenced by lightness effect.
Future work will deal with the assessment and improvement of
the methods presented here. First, this includes a thorough
evaluation of the performance in different cases of study,
towards error analysis. Second, the aim is at extending this
methodology to windows.
Acknowledgements
Authors would like to give thanks to the Government of Spain
for the financial support given through human resources grants
(FPU AP2009-1144, FPU AP2010-2969).
REFERENCES
Adán, A., Xiong, X., Akinci, B., Huber, D., 2011, Automatic
creation of semantically rich 3d building models from laser
scanner data, Proceedings of the International Symposium on
Automation and Robotics in Construction (ISARC).
Ballard, D.H., 1981. Generalizing the Hough transform to detect
arbitrary shapes, Pattern Recognition, 13(2), pp. 111-122.
Becker, S., Peter, M., Fritsch, D., Philipp, D., Baier, P. &
Dibak, C. 2013, Combined Grammar for the Modeling of
Building Interiors, ISPRS Annals of the Photogrammetry,
Remote Sensing and Spatial Information Sciences, II-4/W1, pp
1-6, 2013.
Brown DC, 1971, Close-range camera calibration,
Photogrammetric engineering, 37, (8), 855-866.
The International Archives of the Photogrammetry, Remote Sensing and Spatial Information Sciences, Volume XL-5, 2014ISPRS Technical Commission V Symposium, 23 – 25 June 2014, Riva del Garda, Italy
This contribution has been peer-reviewed.doi:10.5194/isprsarchives-XL-5-203-2014 208
Budroni, A., Boehm, J., 2010. Automated 3D reconstruction of
interiors from point clouds. International Journal of
Architectural Computing 8(1), 55-73
Demisse, G., Borrmann, D., and Nüchter, A., 2013, Interpreting
Thermal 3D Models of Indoor Environments for Energy
Efficiency. Proceedings of the 16th IEEE International
Conference on Advanced Robotics (ICAR '13)
Díaz-Vilariño, L., Lagüela, S., Armesto, J., Arias, P., 2013,
Semantic as-built 3d models including shades for the evaluation
of solar influence on buildings, Solar Energy, 92, 269-279
Díaz-Vilariño, L., Lagüela, S., Armesto, J., Arias, P., 2014,
Indoor daylight simulation performed on automatically
generated as-built 3D models, Energy and Buildings, 68, 54-62
Fischler, M.A., and Bolles, R.C., 1981. Random sample
consensus: a paradigm for model fitting with applications to
image analysis and automated cartography, CACM 24 (6), 381–
395.
Jolliffe, I.T., 2002, Principal Component Analysis, second ed.,
Springer, New York.
Gonzalez-Aguilera, D., Del Pozo, S., Lopez, G., Rodriguez-
Gonzalvez, P., 2012, From point cloud to CAD models: Laser
and optics geotechnology for the design of electrical
substations, Optics & Laser Technology 44 (5), 1384-1392
Khoshelham, K., 2007, Extending generalized Hough transform
to detect 3D objects in laser range data, ISPRS Workshop on
Laser Scanning 2007 and SilviLaser 2007, Espoo, Finland, pp.
206-210.
Liu, J. Shen, W. Chen, 2009, Image mosaic technology based
on overlapped area linear transition method, 2nd Int. Congress
on Image and Signal Processing, Tianjin, pp. 1–3.
Previtali, M., Scaioni, M., Barazzetti, L., and Brumana, R.
2014. Towards automatic indoor reconstruction of cluttered
building rooms from point clouds. Int. ISPRS Annals of
Photogrammetry, Remote Sensing and Spatial Information
Sciences, Vol. II, Riva del Garda, Italy, 8 pages.
Rabbani T, Heuvel FA, Vosselman G. 2006, Segmentation of
point clouds using smoothness constraint. IAPRS 36(5):248–53
Tang, P., Huber, D., Akinci, B., Lipman, R., Lytle, A., 2010,
Automatic reconstruction of as-built building information
models from laser-scanned point clouds: A review of related
techniques, Automation in Construction, 19(7), 829-843
Valero, E., Adán, A., Cerrada, C., 2012. Automatic Method for
Building Indoor Boundary Models from Dense Point Clouds
Collected by Laser Scanners. Sensors 12(12), 16099-16115.
The International Archives of the Photogrammetry, Remote Sensing and Spatial Information Sciences, Volume XL-5, 2014ISPRS Technical Commission V Symposium, 23 – 25 June 2014, Riva del Garda, Italy
This contribution has been peer-reviewed.doi:10.5194/isprsarchives-XL-5-203-2014 209
Related Documents