HAL Id: hal-03515097 https://hal.archives-ouvertes.fr/hal-03515097 Submitted on 6 Jan 2022 HAL is a multi-disciplinary open access archive for the deposit and dissemination of sci- entific research documents, whether they are pub- lished or not. The documents may come from teaching and research institutions in France or abroad, or from public or private research centers. L’archive ouverte pluridisciplinaire HAL, est destinée au dépôt et à la diffusion de documents scientifiques de niveau recherche, publiés ou non, émanant des établissements d’enseignement et de recherche français ou étrangers, des laboratoires publics ou privés. Does sexual selection shape sex differences in longevity and senescence patterns across vertebrates? A review and new insights from captive ruminants Morgane Tidière, Jean-Michel Gaillard, Dennis W H Müller, Laurie Bingaman Lackey, Olivier Gimenez, Marcus Clauss, Jean-François Lemaître Lemaître To cite this version: Morgane Tidière, Jean-Michel Gaillard, Dennis W H Müller, Laurie Bingaman Lackey, Olivier Gimenez, et al.. Does sexual selection shape sex differences in longevity and senescence patterns across vertebrates? A review and new insights from captive ruminants. Evolution, Wiley 2015, 69 (12), pp.3123-3140. 10.1111/evo.12801. hal-03515097

Welcome message from author
This document is posted to help you gain knowledge. Please leave a comment to let me know what you think about it! Share it to your friends and learn new things together.
Transcript
HAL Id: hal-03515097https://hal.archives-ouvertes.fr/hal-03515097
Submitted on 6 Jan 2022
HAL is a multi-disciplinary open accessarchive for the deposit and dissemination of sci-entific research documents, whether they are pub-lished or not. The documents may come fromteaching and research institutions in France orabroad, or from public or private research centers.
L’archive ouverte pluridisciplinaire HAL, estdestinée au dépôt et à la diffusion de documentsscientifiques de niveau recherche, publiés ou non,émanant des établissements d’enseignement et derecherche français ou étrangers, des laboratoirespublics ou privés.
Does sexual selection shape sex differences in longevityand senescence patterns across vertebrates? A review
and new insights from captive ruminantsMorgane Tidière, Jean-Michel Gaillard, Dennis W H Müller, Laurie Bingaman
Lackey, Olivier Gimenez, Marcus Clauss, Jean-François Lemaître Lemaître
To cite this version:Morgane Tidière, Jean-Michel Gaillard, Dennis W H Müller, Laurie Bingaman Lackey, OlivierGimenez, et al.. Does sexual selection shape sex differences in longevity and senescence patternsacross vertebrates? A review and new insights from captive ruminants. Evolution, Wiley 2015, 69(12), pp.3123-3140. �10.1111/evo.12801�. �hal-03515097�
1
Does sexual selection shape sex differences in longevity and 1
senescence patterns across vertebrates? A review and new 2
insights from captive ruminants 3
4
Morgane Tidière1,2
, Jean-Michel Gaillard1,3
, Dennis W. H. Müller4,5
, Laurie 5
Bingaman Lackey6,7
, Olivier Gimenez8,9
, Marcus Clauss10,11
and Jean-François 6
Lemaître1,12
7
8
1Université de Lyon, F-69000, Lyon; Université Lyon 1 ; CNRS, UMR5558, Laboratoire de 9
Biométrie et Biologie Evolutive, F-69622, Villeurbanne, France. 10
2E-mail: [email protected]; telephone number: +33 47244811; corresponding 11
author 12
3E-mail: [email protected]; telephone number: +33 47244811 13
4National Park ‘‘Bavarian Forest’’, Freyunger Str. 2, 94481 Grafenau, Germany. 14
5E-mail: XXX; telephone number: +XX XXX 15
61230 Oakland Street, Hendersonville, North Carolina, USA. 16
7E-mail: XXX; telephone number: +XX XXX 17
8UMR 5175, Centre d’Ecologie Fonctionnelle et Evolutive, campus CNRS, 1919 route de 18
Mende, 34293, Montpellier Cedex 5, France. 19
9E-mail: [email protected]; telephone number: +33 467613211 20
10Clinic for Zoo Animals, Exotic Pets and Wildlife, Vetsuisse Faculty, University of Zurich, 21
Winterthurerstr. 260, 8057 Zurich, Switzerland. 22
2
11E-mail: [email protected]; telephone number: +41 446358376. 23
12E-mail: [email protected]; telephone number: +33 47244811 24
25
KEY WORDS: ageing, ungulates, mating system, reproductive costs. 26
27
RUNNING TITLE: Sexual selection and senescence. 28
NUMBER OF WORDS: 7, 774 (excluding references, tables and figures) 29
NUMBER OF TABLES: 3 30
NUMBER OF FIGURES: 3 31
32
3
ABSTRACT (200 words) 33
In vertebrates, both sexes mostly exhibit a different pattern of senescence and lifespan, often 34
male-biased in mammals and female-biased in birds. Since polygynous males are under 35
intense sexual competition to secure mating opportunities, they allocate into costly 36
conspicuous sexual traits that might explain sex-differences in longevity and senescence 37
patterns. However, comparative studies performed to date have led to conflicting results. We 38
aimed to solve this problem by first reviewing and discussing published case studies of the 39
relationship between the strength of sexual selection and age-specific survival metrics. Then, 40
we performed a comparative analysis to test whether such relationships occur among species 41
of captive large herbivores. We found that the strength of sexual selection negatively 42
influenced the onset of actuarial senescence in males, with males both senescing earlier in 43
polygynous than in monogamous species and showing greater between-sex differences in 44
onset of senescence in favor of females. Moreover, males of territorial species had earlier 45
onset of senescence than males of species displaying harem or tending mating tactics. We did 46
not detect any influence of the strength of sexual selection on the rate of actuarial senescence. 47
Our findings demonstrate that the onset of actuarial senescence, rather than its rate, is the 48
target of sexual selection. 49
50
51
4
During the last two decades, demographic analyzes based on long-term studies have 52
demonstrated that actuarial senescence, a progressive decrease of survival with age 53
(Monaghan et al., 2008), is almost an ubiquitous process in vertebrates (Brunet-Rossini and 54
Austad, 2006; Gaillard and Bonenfant 2008; Nussey et al., 2008, 2013). Nevertheless, 55
actuarial senescence is not expressed with the same intensity across the tree of life (Nussey et 56
al., 2013; Jones et al., 2014). These differences in the intensity of senescence among species 57
are generally driven by the pace of life (Jones et al., 2008) that is strongly associated with 58
body mass (Calder, 1984), phylogeny (Gaillard et al., 1989), and habitat (Wiersma et al., 59
2007). 60
Within species, the intensity of actuarial senescence also varies, especially according 61
to sex (Clutton-Brock and Isvaran, 2007; Maklakov and Lummaa, 2013; Regan and Partridge, 62
2013; Adler and Bonduriansky, 2014). For example, mammalian males generally live shorter 63
and senesce faster than females in a given species or population (Lemaître and Gaillard, 64
2013a; Ramp et al., 2010; but see Gamelon et al., 2014). The magnitude of such between-sex 65
differences in actuarial senescence is generally assumed to be associated with the strength of 66
sexual selection (Clutton-Brock and Isvaran, 2007; Lemaître and Gaillard, 2013a). Sexual 67
selection causes the evolution of traits and/or behaviors that are associated with mating 68
success (Darwin, 1859) and individuals from species subjected to a strong sexual selection 69
will generally suffer from high cost of production and maintenance of these sexually selected 70
traits (e.g. an increased reproductive senescence for males controlling the largest harems in 71
the polygynous red deer, Cervus elaphus, Lemaître et al., 2014a). In most species, the 72
intensity of sexual selection is stronger in males than in females because fathers generally 73
allocate much less than mothers to the production and rearing of offspring (Bateman, 1948; 74
Trivers, 1972 Andersson, 1994). Then, males can allocate much more than females to intra-75
specific sexual competition to obtain additional mating and thereby to increase their 76
5
individual fitness. Males of species subjected to a low intra-sexual competition will both 77
undergo a lower sexual selection pressure and allocate less energy to mate. They can then 78
allocate more to somatic maintenance and thereby enjoy higher survival and weaker 79
senescence than males of species deeply involved in intra-sexual competition (Bonduriansky 80
et al., 2008). Therefore, sexual selection leads to the production and maintenance of costly 81
sexual traits in males and associated risky behaviors, which are likely to cause higher 82
mortality and accelerated senescence, and thus increased between-sex differences in actuarial 83
senescence (Williams, 1957; Owens and Bennett, 1994; Bonduriansky et al., 2008). We thus 84
expect a greater sex-bias in senescence pattern in favor of females to occur in species in 85
which males are subjected to high levels of sexual competition. 86
The influence of the strength of sexual selection on senescence or survival patterns is a 87
key topic of evolutionary biology that is currently highly debated. From a literature survey, 88
we have identified 10 studies of the link between the strength of sexual selection and survival 89
patterns at the inter-specific level (Table 1) and only six of these studies provided support for 90
a cost of sexual selection in terms of survival. However, only three studies involved actuarial 91
senescence sensu stricto. The other studies focused on age-independent metrics such as 92
maximum longevity, lifespan, or average adult mortality, which do not provide any reliable 93
information about actuarial senescence and are highly dependent of sample size (Krementz et 94
al., 1989; Moorad et al., 2012). Moreover, for a given metric, the measure retained strongly 95
differed from one study to another. For example, sexual size dimorphism (SSD), a commonly 96
used proxy of the strength of sexual selection, was measured either as the ratio between male 97
and female body mass (Promislow, 1992; Owens and Bennett, 1994), as the residuals from the 98
linear regression of male body mass against female body mass (Toïgo and Gaillard, 2003), by 99
including both male and female body mass as additive covariates in the model (Lemaître and 100
Gaillard, 2013a), or as the Lovich and Gibbons (1992)’s ratio of the mean size between males 101
6
and females when males are larger (Bro-Jørgensen, 2012). Such a diversity of SSD measures 102
often makes difficult to compare results among studies. 103
Conclusions from studies based on actuarial senescence metrics are also largely 104
inconsistent. So far, only one provided evidence of a stronger male-biased senescence in 105
species with strong inter-male competition for mating (Clutton-Brock and Isvaran, 2007). The 106
other two studies did not report statistically significant relationship between different rates of 107
actuarial senescence and the strength of sexual selection in either males (Lemaître and 108
Gaillard, 2013a) or females (Lemaître and Gaillard, 2013b). Moreover, all these studies were 109
based on the rate of senescence, which only depicts the intensity of actuarial senescence. The 110
onset of senescence provides another potentially powerful metric that is most often 111
overlooked in senescence studies. However, the few studies available for this trait have 112
demonstrated its biological relevance by showing that observed variation in the onset of 113
senescence across species is mostly shaped by variation in the pace of life (e.g. Jones et al., 114
2008; Péron et al., 2010). Moreover, a recent study has shown that the highly fecund wild 115
boar (Sus scrofa) females suffered from earlier, not stronger, actuarial senescence than 116
similar-sized female mammals with much lower fecundity (Gamelon et al., 2014). These 117
recent findings thus emphasize that the onset of senescence could potentially better assess the 118
potential costs of sexual selection in terms of actuarial senescence. 119
In the present study, we strive to make a fairly comprehensive investigation of the 120
relationship between various metrics of actuarial senescence and survival and the strength of 121
sexual selection both across species and between sexes. For this purpose, we analyzed a high 122
quality dataset on age-specific survival of large herbivores living in captivity. In large 123
herbivores, males are often subjected to intensive sexual competition (Clutton-Brock, 1989; 124
Bro-Jørgensen, 2011) and there is a large variation in the intensity of sexual selection among 125
species. To gain mating opportunities males subjected to strong sexual selection often display 126
7
phenotypic responses (Preston et al., 2003), which can be costly and lead to increased 127
mortality. In particular, these males allocate a lot in body mass, which confers advantages in 128
contest with competing males (Jarman, 1983; Andersson, 1994). Thus, a positive correlation 129
between the magnitude of SSD and male-biased mortality is expected because of the high 130
energy requirements associated with large body size (Jarman, 1983; Weckerly, 1998). 131
Moreover, large herbivores exhibit different mating systems (Clutton-Brock, 1989; Bro-132
Jørgensen, 2012) that are likely to mediate the intensity of male-male competition, and thus 133
traits such as SSD (Loison et al., 1999a). In large herbivores, three types of mating systems 134
are predominant: monogamy when males mate with the same female in several reproductive 135
attempts, promiscuity when males and females mate with several partners and there is no 136
continuing bond between individual males and females after mating, and polygyny when 137
males mate with the same group of females in successive mating attempts (Clutton-Brock, 138
1989). Inter-male competition for mating is expected to be higher in polygynous species, a 139
little less in promiscuous species, and much lower in monogamous species. This explains why 140
monogamous species are generally less dimorphic in size than promiscuous and polygynous 141
species (Jarman, 1983). Furthermore, in both promiscuous and polygynous species, the 142
mating tactic can differ markedly (Clutton-Brock, 1989), encompassing territoriality (when 143
female groups are stable and home-range defensible, or when females are constrained to use a 144
given area, males defend part or all the home range of a female group), harem (a male defends 145
access to a group of females rather than to a territory), and tending (when female groups are 146
stable with a home range too large to be defensible or when females are solitary or live in 147
small groups and are unpredictably distributed, males range widely searching for oestrus 148
females, pairing with them and defending them against other males during oestrus). 149
Defending a territory should be more energetically costly than defending a harem, and even 150
more than doing tending because the time and energy devoted to harem or territory defense is 151
8
no longer available to repair injuries, DNA damages or to fight against diseases. In the same 152
way, allocating in sexually selected traits like horns or antlers should increase the intensity of 153
senescence because of inherent trade-offs in energy allocation between reproduction and 154
maintenance (Williams, 1966). In support, the relationship between antler or horn size and 155
strength of sexual selection in large herbivores is now well established (Plard et al., 2011; 156
Bro-Jørgensen, 2007; Lemaître et al., 2014b). 157
We used data from 64 species of large herbivores living in captivity, which were 158
obtained from the International Species Information System (ISIS) database that combines 159
individual data for each animal living in captivity in 850 member institutions from more than 160
80 countries. Such protected conditions allow eliminating mortality due to environmental 161
causes such as predation, climatic harshness or disease transmission, and thereby better 162
identifying the underlying causes of senescence. To assess the relationship between the 163
magnitude of the male-bias of actuarial senescence and the strength of sexual selection, we 164
used different measures of the intensity of sexual competition simultaneously: SSD, mating 165
system, mating tactic (in polygynous and promiscuous species only) and horn size 166
dimorphism (HSD) (in bovids only). We had too few cervids (N = 14) in our dataset to 167
include male antler size in a specific analysis. In addition, we measured the intensity of male 168
survival costs and of sex differences in actuarial senescence and survival using different 169
measures previously selected in other comparative studies: maximum longevity (Bro-170
Jørgensen, 2012), Gompertz rate of senescence (Ricklefs, 2010), age at the onset of 171
senescence (Péron et al., 2010) and a linear rate of senescence between well-defined cut-off 172
ages (Jones et al., 2008; Lemaître and Gaillard, 2013a), for each sex. We investigated whether 173
increasing allocation by males in sexual selection leads to increasing mortality and actuarial 174
senescence in males on both an absolute scale and relative to females. More specifically, we 175
tested the following predictions. First, we expected that (i) males of polygynous species 176

9
and/or with large SSD and HSD should have earlier and stronger actuarial senescence and 177
should live shorter than males of monogamous species and/or with a weak SSD and HSD. 178
Within polygynous and promiscuous species, we expected males of territorial species to have 179
earlier and stronger actuarial senescence than males of non-territorial species. (ii) between-sex 180
differences in actuarial senescence and longevity should be greater in species in which males 181
face strong sexual selection. 182
183
Materials and methods 184
METRICS OF SURVIVAL AND ACTUARIAL SENESCENCE 185
We first estimated survival at each age for each sex of each species of large herbivores 186
present in the International Species Information System (ISIS) (Müller et al., 2011; Lemaître 187
et al., 2013), which combines individual data for a given species since 1973, from 850 188
member institutions (Zoos, national parks) in over 80 countries. Thus, for each individual, 189
information such as sex and dates of birth and death are available. Considering each species 190
of captive population of each zoo as a "meta-population", it is possible to compute the 191
parameters that characterize the average population living in captivity. In sum, this “meta-192
population” describes the average performance for each species in captivity and not a specific 193
population. We only used cohorts of animals for which both dates of birth and death were 194
known, which implies that animals were born in captivity. The complete dataset included data 195
for 95 species of large herbivores. However, we kept only species for which 25 individuals at 196
least were alive at 1 year-old (N = 64 species) to get accurate estimates of age-specific 197
survival. 198
To measure species- and sex-specific pattern of survival and senescence, we used four 199
different and complementary metrics: the maximum longevity, the Gompertz rate of 200
senescence, the onset of senescence, and the linear rate of senescence between two well-201

10
defined cut-off ages (between 6 and 12 years of age) (See Table S1). Such a diversity of 202
metrics is important for two reasons. First it allows comparing our finding with previous 203
results published in the literature and second it helps to disentangle possible confounding 204
effects between the rate (i.e. intensity) and the onset (i.e. timing) of senescence. 205
We extracted the maximum longevity recorded for each sex from species-specific life 206
tables. This trait (called ‘longevity’ hereafter) is not a direct measure of senescence because it 207
does not include any information about age-dependent survival. However, longevity allows 208
measuring the overall difference in survival between the sexes and can therefore be linked 209
with the energy allocation in maintenance during the lifespan. 210
The second metric we used was the Gompertz rate of senescence (after called 211
‘Gompertz rate’) that measures the sex- and species-specific average exponential rate of 212
mortality with age. To measure actuarial senescence, many mathematical functions have been 213
proposed (Ricklefs and Scheuerlein, 2002). The Gompertz function is the most commonly 214
used to study human survival, survival in laboratory or in captivity (Ricklefs and Scheuerlein, 215
2002) and has been shown to provide a reliable description of age-specific survival in large 216
herbivores (Gaillard et al., 2004). We first built the capture history of each individual of each 217
sex and each of the 64 species of large herbivores included in our dataset (coded as "1" when 218
the individual was observed alive and as "0" when it was dead at a given age from birth). 219
These capture histories were then loaded into a CMR (capture-mark-recapture) software (E-220
SURGE, Choquet et al., 2009) to get reliable age-specific estimates (Lebreton et al., 1992), 221
knowing that detection probabilities were equal to 1 in captivity. We then fitted different age-222
dependent models including a model with a constant survival (i.e. no age-dependence), a 223
model with two age-classes (first year of life vs. older ages) to account for the lower survival 224
in juveniles than in older individuals that characterizes large herbivores (Gaillard et al., 2000), 225
a model with full age-dependence (i.e. one survival rate per age), and a series of Gompertz 226
11
models with onsets of senescence varying between 1 year of age and the age corresponding to 227
the first two thirds of lifespan for each sex in each species. In Gompertz models, age variation 228
in survival was constrained from the age at the onset of senescence to be linear on a log(-log) 229
scale (Gaillard et al., 2004). We selected a final model using AIC (Akaïke’s Information 230
Criterion, Burnham and Anderson, 2002). Then, we retained the estimate of the Gompertz rate 231
in species for which a Gompertz model provided a better fit than either the constant or the 232
two-age class model (N = 54 species, see Table S2). 233
The Gompertz rates we estimated were thus dependent on the onset of senescence. An 234
early onset of senescence is indeed associated with a low actuarial senescence rate (0.27 ± 235
0.13; t = 2.07; P = 0.04; λ < 0.001). In other words, delaying the onset of senescence should 236
lead to increase the rate of senescence. To correct for that constraint, we estimated the onset 237
of senescence and the rate of senescence independently from the Gompertz models. The age 238
at the onset of senescence was then estimated as the age at which the mortality rate was the 239
lowest (Jones et al., 2008). However, to avoid extreme mortality values caused by a small 240
number of old individuals, we restricted the range of ages to the first two thirds of the 241
maximum lifespan recorded for a given sex in a given species (See Figure S1 for an example). 242
We also measured the rate of senescence as the proportional decrease of survival 243
between 6 and 12 years of age. We fixed these age thresholds because most of large 244
herbivores species initiated their senescence between these age threshold as demonstrated on 245
detailed analyzes of age-specific variation in intensively monitored populations of large 246
herbivores (e.g. Loison et al., 1999b; Festa-Bianchet et al., 2003; Gaillard et al., 2004; Toïgo 247
et al., 2007), which allowed us to make estimates directly comparable among species. Saïga 248
(Saiga tartarica), Speke’s gazelle (Gazella spekii), Goitered gazelle (Gazella subgutturosa) 249
and Greater kudu (Tragelaphus strepsiceros) were excluded for this analysis because all 250
males died before 12 years of age in these species. Therefore, the rate of senescence of males 251
12
between 6 and 12 years of age was analyzed using data from 60 species. In addition, the 252
longest-lived female of Water deer (Hydropotes inermis) died before reaching 12 years of 253
age. We therefore restricted the analysis of between-sex differences in senescence rate of 254
females between 6 and 12 years of age to 59 species. 255
Dependent variables (longevity, Gompertz rate, onset of senescence and rate of 256
senescence between 6 and 12 years of age) were all log-transformed to account for the 257
allometric nature of the relationships (see Houle et al., 2011). For longevity and onset of 258
senescence, the between-sex difference was calculated as the female value minus the male 259
value. For both rates of senescence, the between-sex difference was calculated as the male 260
rate minus the female rate. All data are provided in Table S1. 261
262
METRICS OF SEXUAL SELECTION 263
To assess thoroughly the strength of sexual selection in a given species, we used 4 264
metrics: sexual size dimorphism (SSD), mating system, mating tactic (only for polygynous 265
and promiscuous species) and horn size dimorphism (HSD) for bovids only (See Table S2). 266
The first and most commonly used metric in such analyzes is the SSD (Toïgo and Gaillard, 267
2003; Table 1), which allows taking into account the difference in mass between sexes, 268
assuming that males will invest more strongly than females to increase their probability of 269
success in male-male competition (Bateman, 1948; Bonduriansky et al., 2008). Sex-specific 270
body masses (in kg) were collected for both sexes in the same free-ranging populations as 271
used by Bro-Jørgensen (2012) for bovids and Plard et al. (2011) for cervids, and completed 272
using more specific sources when required. As several measures of SSD have been previously 273
used (see Table 1), we replicated the analyzes using other SSD measures but results remained 274
qualitatively unchanged. We thus report results from analyzes including both male and female 275
body masses as covariates in the model (both log-transformed) as advocated by Freckleton 276
13
(2009) to avoid potentially biased estimates in phylogenetically controlled analyzes. 277
Moreover, doing that allows to correct analyzes for among-species variation in the pace of 278
life, because of the strong allometric relationship linking body mass and generation time, a 279
reliable metric for assessing the pace of life (Gaillard et al., 2005). 280
We assessed the mating system (monogamous, promiscuous or polygynous) of 281
each species according to Zerbe et al. (2012)’s classification. This metric was entered as a 282
discrete factor in models, using monogamous species as a reference. In the same way, we 283
identified the mating tactic (territoriality, harem or tending) of each species thanks to further 284
studies (listed in Table S3) using the tending tactic as a reference. 285
Finally, we used the horn size dimorphism (HSD) of bovids as a last metric of the 286
strength of sexual selection. Female bovids bear horns like males, but generally of smaller 287
size (Bro-Jørgensen, 2007). We thus assumed that increasing sexual selection leads to 288
increase horn size in males relatively to females. For this study, we included only 37 species 289
because we were not able to find horn size data for at least one sex in 11 species (American 290
bison Bison bison, European bison Bison bonasus, Gaur Bos gaurus, Wild goat Capra 291
aegargus, Blesbok Damaliscus pygargus, Mountain gazelle Gazella gazella, Dama gazelle 292
Nanger dama, Scimitar oryx Oryx dammah, Bighorn sheep Ovis Canadensis, Mouflon Ovis 293
orientalis and Common eland Tragelaphus oryx). Data of horn size were also obtained from 294
free-ranging populations. 295
296
ACCOUNTING FOR POSSIBLE CONFOUNDING VARIABLES 297
We controlled for possible confounding factors previously reported to influence 298
survival and actuarial senescence in captive large herbivores. First, body mass was included to 299
control for the strong allometric relationship linking body mass and adult survival or actuarial 300
senescence rates in large herbivores (Sacher, 1959; Gaillard et al., 2003; Lemaître and 301
14
Gaillard, 2013b). Moreover, accounting for body mass allows taking into account most 302
variation generated by the pace of life because of the strong allometric component of the pace 303
of life in large herbivores (Gaillard et al., 2008). The average species-specific body mass for 304
each sex was recovered from the literature (see above and Table S3). 305
Additionally, in captivity, food supplied to large herbivores is sometimes not optimal 306
(Müller et al., 2011) and grazers (whose diet consists mainly of grass) generally meet their 307
food needs in captivity better than browsers (whose diet consists mainly of leaves or twigs). 308
This leads grazers to have a longer longevity and a reduced actuarial senescence in captivity 309
compared to their wild counterparts while the opposite is observed for browsers (Müller et al., 310
2011; Lemaître et al., 2013). Therefore, diet is a structuring factor for survival and senescence 311
in large herbivores and in the present study, the effect of diet on different metrics for males 312
has been included to avoid confounding effects of a poorly adapted diet for browsers in 313
captivity. To do that, the percentage of grass in a species’ natural diet has been obtained from 314
Zerbe et al. (2012)’s supplement data (see Table S3) and included as a covariate in our 315
models. 316
317
STATISTICAL ANALYZES 318
To avoid biased assessment of the relationships between sexual selection and survival 319
patterns due to phylogenetic inertia, we controlled all the analyzes for the non-independence 320
between species due to sharing ancestry using "Phylogenetic Generalized Least-Squares" 321
(PGLS) models (Freckleton et al., 2002). The PGLS method provides an estimate of the 322
phylogenetic signal λ, which allows controlling for the phylogenetic dependence (between 0 323
and 1). If λ is not statistically different from 0, phylogeny does not have a detectable effect 324
and a linear regression without correcting for phylogeny can be safely used. A phylogeny of 325
the 64 species of large herbivores used in this study (see Figure 1) was built using the 326
15
phylogenetic super-tree of mammals published by Bininda-Emonds et al. (2007, 2008). This 327
near completed, at the species-level, super-tree is building using a 66-gene alignment in 328
conjunction with 30 cladistically robust fossil calibration points. Branch lengths are 329
proportional to time. To confirm our results, analyzes were repeated with Agnarsson and 330
May-Collado (2008)’s near species-completed phylogeny of 266 species of Cetartiodactyla 331
based on cytochrome b sequence data and using recent Figuet et al. (2014)’s phylogenetic tree 332
reconstructed from complete mitochondrial genome of 201 species of Cetartiodactyla. In all 333
cases, results were qualitatively similar and we only present in this paper those obtained with 334
the phylogenetic super-tree of mammalian species (Bininda-Emonds et al., 2007, 2008). 335
Phylogenetically controlled analyzes were performed using the package caper (Orme, 2012). 336
In our analyzes dependent variables included longevity, Gompertz rate, onset of 337
senescence and rate of senescence between 6 and 12 years of age. For each dependent 338
variable entered in the full model we included the percentage of grass in a species’ natural 339
diet (only when studying male traits but not between-sex differences because diet is the same 340
for both sexes, which leads their survival patterns to be biased in the same way), the SSD (by 341
entering both male and female body mass, as repeatedly advocated, Freckleton, 2002, 2009), 342
mating system, and the two-way interaction between mating system and male body mass. We 343
added this interaction because the largest herbivores tend to be polygynous and the lightest 344
ones tend to be monogamous, leading a cost of SSD to be possibly detected only in 345
polygynous species. Moreover, as the estimate of the Gompertz rate depends on the age at the 346
onset of senescence used to model senescence, the onset of senescence included in the 347
selected model was entered as a covariate in the analysis of Gompertz rates. 348
To analyze the effects of mating tactics on survival patterns, the full model included 349
diet, SSD, mating tactic and the two-way interaction between mating tactic and male body 350
mass (because males of harem and territorial species tend to be larger than males of tending 351
16
species and senescence could potentially be only detected in harem and territorial species) 352
(See Table S3). 353
When we analyzed bovids separately, the full model included diet, SSD, HSD (with 354
male and female horn size added as covariate) and the two-way interaction between body 355
mass and horn size (See Table S3). Dependent variables were the same as for the analysis of 356
the entire dataset. 357
Finally, to select the best model of variation in longevity or senescence metrics, we 358
used a model selection procedure based on the Akaïke Information Criterion (AIC, Burnham 359
and Anderson, 2002). For each senescence or survival metric, we retained the model with the 360
lowest AIC. When the difference of AIC between competing models was less than 2, we 361
retained the simplest model to satisfy parsimony rules (Burnham and Anderson, 2002). In 362
addition, the AIC weight (wi) was calculated to measure the relative likelihood of each model 363
to be the best among the set of fitted models. When lambda was not statistically different from 364
0 we performed linear models without correcting for phylogeny to avoid any possible bias 365
induced by the inclusion of a non-required phylogenetic index and provided estimates from 366
linear models without correcting for phylogeny (Revell, 2010). However, results were 367
qualitatively the same with and without this correction. When lambda was statistically 368
different from 0, parameter estimates were obtained using the PGLS method (Tables 2 and 3). 369
Analyzes were performed with R version 2.14.0 (R Development Core Team, 2011) 370
and parameter estimates are given ± SE. 371
372
Results 373
INFLUENCE OF SEXUAL SELECTION ON MALE LONGEVITY AND 374
SENESCENCE PATTERNS 375
376
17
Following parsimony rules, the model selected for male longevity included diet and 377
male body mass (wi = 0.22; λ < 0.001; Table S4). Longevity of males increased with the 378
percentage of grass in the species natural diet (Table 2, Figure S2A) and longevity increased 379
with body mass in males (Table 2, Figure S3A). Although the model with the lowest AIC 380
included an additional effect of mating system (wi = 0.30; λ < 0.001; Table S4), the effect size 381
was very small, with males tending to live slightly longer in monogamous and in promiscuous 382
than in polygynous species (difference of longevity compared to monogamous species: -1.02 383
year for promiscuous species, 95%CI [-1.27 – 1.22]; -1.15 year for polygynous species, 384
95%CI [-1.43 – 1.09]). 385
The selected model for Gompertz rates included the onset of senescence (wi = 0.27; λ 386
< 0.001; Table S4). As expected, males with earlier onset of senescence had lower Gompertz 387
rates (Table 2). The models including additive effects of diet (ΔAIC = 0.56; wi = 0.21; λ < 388
0.001; Table S4), or of body mass (ΔAIC = 1.00; wi = 0.16; λ < 0.001; Table S4) also 389
provided good fits, although the effect sizes were very small in both cases. As expected, male 390
senescence rate tended to decrease with both the proportion of grass in species natural diet (β 391
= -0.0030 ± 0.0026; Figure S2B) and with males body mass (β = -0.057 ± 0.058; Figure S3B). 392
The selected model of onset of senescence in males (wi = 0.51; λ < 0.001; Table S4) 393
included diet, body mass and mating system. Males of grazer species senesced later than 394
males of browser species (Table 2, Figure S2C), males of large species senesced later than 395
males of small species (Table 2, Figure S3C), and compared to males of monogamous 396
species, males of promiscuous and polygynous species tended to senesce 1.3 (95%CI [-1.8 – 397
1.1]) and 1.6 (95%CI [-2.3 – -1.1]) years earlier (Table 2, Figure 2). 398
Lastly, the model selected for the rate of senescence between 6 and 12 years of age 399
only included body mass (wi = 0.28; λ < 0.001; Table S4). Males of small species senesced 400
faster than males of large species (Table 2, Figure S2D). Just as for male longevity, the model 401
18
with the lowest AIC included additional effects of diet (wi = 0.30; λ < 0.001; Table S4), and 402
as predicted males of grazers senesced at a slower rate than males of browsers (β = -0.002 ± 403
0.001; Figure S3D). 404
Analyzes restricted to polygynous and promiscuous species failed to detect any effect 405
of mating tactic on either longevity or Gompertz rate (Table S5). However, the onset of 406
senescence was influenced by the mating tactic with males of territorial species doing harem 407
or tending senescing 1.4 (95%CI [-1.9 – -1.1]) years earlier than males of species doing harem 408
or tending (Tables S5 and S6, Figure 3). In addition, the model selected for the senescence 409
rate between 6 and 12 years of age included diet, body mass, mating tactic and the two-way 410
interaction between mating tactic and male body mass (wi = 0.88; λ = 0.984; Table S5). 411
Territorial males senesced slower between 6 and 12 years of age than males of species with 412
harem or tending mating tactics (difference of rate compared to males of tending species: -413
0.49 ± 1.20 for species with harem; -2.61 ± 0.84 for territorial species; Table S6). 414
Complementary analyzes performed in bovids have revealed no effect of horn size 415
dimorphism on longevity, onset of senescence, Gompertz rate and senescence rate between 6 416
and 12 years of age (Appendix S1, Tables S7 and S8). 417
418
INFLUENCE OF SEXUAL SELECTION ON THE SEX-DIFFERENCES IN 419
LONGEVITY AND SENESCENCE PATTERNS 420
421 Males had, on average, a shorter longevity than females (male: 16.3 years, 95%CI 422
[15.5 – 17.2]; female: 19.1 years, 95% CI [18.3 – 20.0]), with a difference of 2.81 years (95% 423
CI [2.1 – 3.5]). Male senesced earlier than females (male: 8.7 years, 95% CI [78.0 – 9.5]; 424
female: 10.3 years, 95%CI [9.6 – 11.0]), with a difference of 1.6 years (95%CI [0.9 – 2.3]), 425
and their rate of senescence between 6 and 12 years of age was stronger than that of females 426
(male: 0.69, 95%CI [0.65 – 0.74]; female: 0.56, 95%CI [0.09 – 0.17]) with a difference of 427
0.13 (95%CI [2.1 – 3.5]). However, both sexes had similar Gompertz rates (male: 0.17, 428
19
95%CI [0.14 – 0.19]; female: 0.16, 95%CI [0.14 – 0.18]) with a non-significant difference of 429
0.008 (95%CI [-0.013 – 0.028]). 430
When testing the effect of sexual selection on the sex-differences in longevity and 431
senescence patterns, the model selected for longevity (wi = 0.24; λ < 0.001; Table S9), 432
Gompertz rate (wi = 0.53; λ < 0.001; Table S9) and senescence rate between 6 and 12 years of 433
age (wi = 0.45; λ < 0.001; Table S9) was the constant model. 434
The model selected for the onset of senescence only included the mating system (wi = 435
0.45; λ < 0.001; Table S9) and the between-sex difference in the onset of senescence was 436
greater in polygynous than in monogamous species (monogamy: -1.0 year, 95%CI [-1.4 – 437
1.3]; promiscuity: 1.1 years, 95%CI [-1.2 – 1.6]; polygyny: 1.4 years, 95%CI [1.0 – 2.0]; 438
Table 3). 439
When focusing on the effects of mating tactic, in polygynous and promiscuous species 440
only the selected model was the constant model, for longevity (wi = 0.47; λ < 0.001; Table 441
S10), Gompertz rate of senescence (wi = 0.44; λ < 0.001; Table S10) and onset of senescence 442
(wi = 0.28; λ < 0.001; Table S10). However, the model with the lowest AIC for between-sex 443
difference in the onset of senescence included mating tactic (wi = 0.37; λ < 0.001; Table S10) 444
with territorial species that tended to display a larger between-sex difference in the onset of 445
senescence than harem-holding species and tending species (tending: 1.0 year, 95%CI [-1.3 – 446
1.3]; harem: 1.3 years, 95%CI [-1.2 – 1.9]; territorial: 1.4 years, 95%CI [1.0 – 1.9]; Table 447
S11). The model selected for between-sex differences in senescence rate between 6 and 12 448
years of age included mating tactic, body mass and the two-way interaction between male 449
body mass and mating tactic (wi = 1.00; λ < 0.001; Table S10). The sex-bias in rate of 450
senescence between 6 and 12 years of age increased with male body mass in territorial 451
species, whereas it decreased with body mass in harem species and even more in tending 452
species (Table S11). 453
20
In bovids, the sex-bias in longevity and senescence patterns was not affected by the 454
HSD because no selected model included both male and female horn size (Tables S12 and 455
S13). 456
457
Discussion 458
Our results suggest that in large herbivores the intensity of sexual competition affects 459
male senescence patterns and consequently the sex-differences in senescence patterns. This 460
finding principally relies on an effect of mating on the age of onset of senescence with males 461
from polygynous species starting to senesce earlier (but not faster) than males from 462
promiscuous and monogamous species, both on an absolute scale and relative to females. 463
464
Findings presented here, thus support the hypothesis that, at least in the range of 465
species considered in our study, high level of sexual competition leads to severe survival 466
costs. However, the impact was limited to the age at the onset of senescence (i.e. the timing of 467
senescence) and did not affect the rate of senescence (i.e. the intensity of senescence). The 468
absence of any relationship between our proxies of sexual competition level and actuarial 469
senescence rates is in line with a previous report from Lemaître and Gaillard (2013a) based on 470
a much smaller dataset of wild herbivores. In fact, the only reported effect of sexual selection 471
on senescence rates comes from the finding that in birds and mammals, the sex-differences in 472
senescence rates is bigger in polygynous than in monogamous species (Clutton-Brock and 473
Isvaran, 2007, Table 1). Therefore, until now no inter-specific study have clearly 474
demonstrated that high level of sexual competition fasten actuarial senescence rates in males. 475
476
Males of polygynous herbivores start to senesce earlier than males of promiscuous 477
and monogamous species. For instance, if we compare two similar size ungulate species, we 478
21
observe than monogamous Bay duiker males (Cephalophus dorsalis) begin to senesce at 7 479
years of age whereas polygynous Speke’s gazelle males (Gazella spekei) start at 3 year-olds, 480
which shows that costs associated with polygynous mating system lead to an earlier onset of 481
senescence. Survival costs linked to species-specific mating systems have already been 482
reported in a few studies (Table 1). For example, Promislow (1992) found that the mean adult 483
mortality rate is female-biased in monogamous mammals and Müller et al., (2011) found a 484
longer relative life expectancy in males of monogamous species compared to males of 485
polygynous species. However, to our knowledge, we provide a first evidence of a cost in 486
terms of earlier senescence. This notably comes from the fact that comparative studies 487
interested in such questions have focused mostly on longevity and in a few instances on 488
actuarial senescence rates, without considering a possible impact in terms of timing of 489
senescence (Table 1). Recently, a wide diversity of senescence patterns have been described 490
in the living world (Nussey et al., 2013; Jones et al., 2014) and the age at the onset of 491
senescence is now increasingly recognized as a key factor characterizing senescence patterns 492
(Jones et al., 2008; Péron et al., 2010; Jones et al., 2014; Gamelon et al., 2014). While it has 493
already been shown that the onset of senescence co-varies with other time variable to shape 494
the pace of life in mammals and birds (Jones et al., 2008), our study demonstrates that other 495
factors such as the intensity of sexual selection contributes to the diversity of age at the onset 496
of senescence observed in the wild. 497
498
In addition, we found that among polygynous and promiscuous species, males from 499
territorial species also senesce earlier than males from species with harem-holding or tending 500
mating tactic. Again, if we look at two similar size species, we can see that males Bighorn 501
sheep males (Ovis canadensis) which display a tending mating tactic, start to senesce at 9 502
years of age, whereas territorial Lechwe males (Kobus leche) senesce from 3 years of age. 503
22
Inter-specific differences in senescence patterns between territorial and non-territorial males 504
are likely to arise from the important energetically and physical demands to maintain 505
territories. For instance, in impala (Aepyceros melampus), Van Rooyen (1993) found that 506
territorial males lose more body condition during the rut than males not involved in the 507
defense of a territory, a decline that seems to result from a decrease in food intake in parallel 508
to an increased activity both linked to territorial tenure (Murray, 1982). Moreover, such costs 509
might be associated with an increased probability to face aggressive contests and injuries, as 510
observed in males of territorial pudu (Pudu puda),where fights between males during rutting 511
season includes cause injuries (MacNamara and Elridge, 1987) but also in other vertebrates 512
such as lizards species, where male-male interactions in territorial species are more likely to 513
lead to fighting than in non-territorial species (Vanhooydonck et al., 2005; Lailvaux and 514
Irschick, 2007). 515
516
Although we provided clear evidence that both mating systems and tactics influence 517
the age at the onset of senescence, we did not find any relationship between sexual size 518
dimorphism and any of our metrics of survival and senescence. This is surprising because the 519
large amount of energy required for male growth compared to female growth in highly 520
sexually dimorphic species is expected to cause survival or ageing costs (e.g. Toïgo and 521
Gaillard, 2003; Bro-Jørgensen, 2012). Interestingly, our review of the literature reveals that 522
the relationship between sexual size dimorphism and senescence per se has almost never been 523
investigated (but see Lemaître and Gaillard 2013a). Most studies so far have documented 524
survival costs of sexual size dimorphism through a negative relationship between SSD and 525
adult mortality (Promislow, 1992; Promislow et al., 1992; but see Owens and Bennett, 1994 526
and Toïgo and Gaillard, 2003) or longevity (Bro-Jørgensen 2012). However, these studies 527
have used different metrics to assess the level of sexual size dimorphism. For instance, 528
23
Promislow (1992) measured SSD as the ratio of male body mass on female body mass while 529
Bro-Jørgensen (2012) used the Lovich and Gibbons (1992)’s ratio. In the present study, we 530
measured SSD by adding both male and female body mass as covariates in our analyzes, a 531
method that has been repeatedly advocated in comparative studies to avoid bias resulting 532
when predictors are collinear in multi-factorial analyzes (Freckleton et al., 2002; Freckleton 533
2009). However, when we replicated our analyzes using other metrics previously used of 534
sexual size dimorphism, all results remained qualitatively unchanged (Tables S14 and S15). 535
Therefore, the observed discrepancy between the results we report here and previously 536
published studies are likely to involve either the absence of corrections for confounding 537
factors (e.g. pace of life, see below) or the type and quality of data analyzed. For instance, for 538
a trait like longevity the use of different sources can rapidly lead to divergent outcomes (see 539
Lemaître et al., 2014c for an example). In the present study, we have used data from the ISIS 540
database rather than published records of longevity. ISIS data allows working on long-term 541
population with the huge advantage of not having to consider capture probabilities as 542
individuals living in captivity are known without doubt to be alive or dead in a given year. 543
This allows getting highly reliable estimates of survival and senescence. Furthermore, life in 544
captivity eliminates environmentally-driven sources of mortality (e.g. predation or climate 545
harshness) and allows to better assessing how costs associated with sexual selection and thus 546
intrinsic changes in animals conditions influence survival. 547
548
Since sexual selection acts primarily on males, female longevity and senescence 549
patterns are not expected to be directly influenced by the intensity of sexual competition. 550
Therefore, if sexual selection generates sex-differences in survival and senescence patterns, 551
the effect should be mainly driven by changes in males. Our results are in full agreement with 552
this assumption. Indeed, similarly to our analyzes strictly focused in males, we found an effect 553
24
of mating system on the sex-differences in the age at the onset of senescence, with larger 554
differences in onset of senescence in polygynous species than in promiscuous and 555
monogamous species. Although not focused on the onset of senescence, results from 556
comparative analyzes that have investigated this topic have revealed a link between the 557
mating system and the sex-differences in longevity or senescence patterns. These studies 558
looked at the between-sex differences of longevity in mammals (Clutton-Brock and Isvaran, 559
2007; Müller et al., 2011) and birds (Clutton-Brock and Isvaran, 2007), or the between-sex 560
differences in adult mortality in birds (Liker and Székely, 2005), have systematically been 561
found to be higher in polygynous than in monogamous species. In the present study, we 562
reported strong between-sex differences as strong as 1.5 years in the onset of senescence in 563
polygynous species, whereas this difference was less than 1 year in monogamous species. 564
These results show that the sex-bias in senescence patterns is driven by costs linked to mating. 565
566
In addition, our study documents a strong allometric relationship between body mass 567
and senescence metrics. In large herbivores, body mass is tightly linked to the pace of life 568
(Gaillard et al., 2003), with small species having a relatively fast pace of life, characterized by 569
an early and fast senescence compared to larger species. In addition, and in accordance with 570
previous reports (Müller et al., 2011; Lemaître et al., 2013), we found that diet is associated 571
with senescence in captive ungulates. Typically, grazer species (e.g. African buffalo, Syncerus 572
caffer) have a delayed onset of senescence, a slower rate of senescence, and live longer 573
compared to browser species such as roe deer (Capreolus capreolus). Overall, these analyzes 574
emphasize the importance of correcting for the pace of life and for diet when working on 575
captive populations to avoid biased results. However, most studies listed in Table 1 failed to 576
control for such confounding variables, which might explain part of the discrepancy observed 577
between these studies. Using the three different methods employed to assess SSD in the 578

25
context of sexual selection (see Table 1), we thus tested in complementary analyses how an 579
absence of correction for body mass, diet or both variables influences our results. 580
Interestingly, when body mass or both body mass and diet are removed from the models, 581
mating system was found in best models for longevity, onset of senescence and rate of 582
senescence between two ages, and SSD was associated with onset of senescence in large 583
herbivore in the expected direction (i.e. a positive association between the intensity of sexual 584
selection and the intensity of senescence, see Tables S16 and S17). This demonstrates the 585
importance to control analyzes for confounding effects of diet and pace of life to assess 586
reliably the relationship between sexual selection and senescence pattern at inter-specific level 587
and stress the importance to consider sparingly results from analyzes non-corrected for these 588
factors. 589
590
Finally, our analyzes and review of the literature show that the relationship between 591
the intensity of sexual selection and the strength of male senescence is complex. Then, the 592
lack of SSD effect along with the clear evidence of an effect of the mating system on the 593
onset of senescence in males indicate that the costs associated with sexual selection via intra-594
sexual competition are generated by risky and energy-demanding behaviours rather than by 595
large size in itself. These results demonstrate that only some traits like the timing of actuarial 596
senescence and/or behaviors like territoriality involved in sexual selection are costly in terms 597
of survival. 598
599
ACKNOWLEDGMENTS 600
M. Tidière is funded by the French Ministry of Education and Research. We are grateful to I. 601
Agnarsson from providing us access to an unpublished phylogenetic tree of ruminants. 602
603
26
LITERATURE CITED 604
Adler, M.I., and Bonduriansky, R. (2014). Sexual conflict, life span, and aging. Cold Spring 605
Harb. Perspect. Biol. 6, a017566–a017566. 606
Agnarsson, I., and May-Collado, L.J. (2008). The phylogeny of Cetartiodactyla: The 607
importance of dense taxon sampling, missing data, and the remarkable promise of cytochrome 608
b to provide reliable species-level phylogenies. Mol. Phylogenet. Evol. 48, 964–985. 609
Andersson, M.B. (1994). Sexual Selection (Princeton University Press). 610
Bateman, A. (1948). Intra-sexual selection in drosophila. Heredity 2, 349–368. 611
Bininda-Emonds, O.R.P., Cardillo, M., Jones, K.E., MacPhee, R.D.E., Beck, R.M.D., 612
Grenyer, R., Price, S.A., Vos, R.A., Gittleman, J.L., and Purvis, A. (2007). The delayed rise 613
of present-day mammals. Nature 446, 507–512. 614
Bininda-Emonds, O.R.P., Cardillo, M., Jones, K.E., MacPhee, R.D.E., Beck, R.M.D., 615
Grenyer, R., Price, S.A., Vos, R.A., Gittleman, J.L., and Purvis, A. (2008). The delayed rise 616
of present-day mammals. Nature 456, 274. 617
Bonduriansky, R., Maklakov, A., Zajitschek, F., and Brooks, R. (2008). Sexual selection, 618
sexual conflict and the evolution of ageing and life span. Funct. Ecol. 22, 443–453. 619
Brunet-Rossini, A.K., and Austad, S.N. (2006). Senescence in wild populations of mammals 620
and birds. In Handbook of the Biology of Aging, (Academic Press), pp. 243–266. 621
Burnham, K.P., and Anderson, D.R. (2002). Model selection and multimodel inference: a 622
practical information-theoretic approach (Springer). 623
Calder, W.A. (1984). Size, function, and life history (Cambridge, MA). 624
Choquet, R., Rouan, L., and Pradel, R. (2009). Program E-SURGE: a software application for 625
fitting multievent models. Environ. Ecol. Stat. 3, 8–39. 626
Clutton-Brock, T.H. (1989). Review lecture: mammalian mating systems. Proc. R. Soc. B 627
Biol. Sci. 236, 339–372. 628
Clutton-Brock, T.H., and Isvaran, K. (2007). Sex differences in ageing in natural populations 629
of vertebrates. Proc. R. Soc. B Biol. Sci. 274, 3097–3104. 630
Darwin, C. (1859). On the origin of species. 631
Festa-Bianchet, M., Gaillard, J.-M., and Côté, S.D. (2003). Variable age structure and 632
apparent density dependence in survival of adult ungulates. J. Anim. Ecol. 72, 640–649. 633
Figuet, E., Romiguier, J., Dutheil, J.Y., and Galtier, N. (2014). Mitochondrial DNA as a tool 634
for reconstructing past life-history traits in mammals. J. Evol. Biol. 27, 899–910. 635
Freckleton, R.P. (2002). On the misuse of residuals in ecology: regression of residuals vs. 636
multiple regression. J. Anim. Ecol. 71, 542–545. 637
27
Freckleton, R.P. (2009). The seven deadly sins of comparative analysis. J. Evol. Biol. 22, 638
1367–1375. 639
Freckleton, R.P., Harvey, P.H., and Pagel, M. (2002). Phylogenetic Analysis and Comparative 640
Data: A Test and Review of Evidence. Am. Nat. 160, 712–726. 641
Gaillard, J., Pontier, D., Allaine, D., Lebreton, J., Trouvilliez, J., and Clobert, J. (1989). An 642
analysis of demographic tactics in birds and mammals. Oikos 56, 59–76. 643
Gaillard, J., Allaine, D., Pontier, D., Yoccoz, N., and Promislow, D. (1994). Senescence in 644
natural-populations of mammals - a reanalysis. Evolution 48, 509–516. 645
Gaillard, J.M., Festa-Bianchet, M., Yoccoz, N.G., Loison, A., and Toigo, C. (2000). Temporal 646
variation in fitness components and population dynamics of large herbivores. Annu. Rev. 647
Ecol. Syst. 31, 367–393. 648
Gaillard, J.-M., Loison, A., Festa-Bianchet, M., Yoccoz, N.G., and Solberg, E. (2003). 649
Ecological correlates of life span in populations of large herbivorous mammals. Popul. Dev. 650
Rev. 29, 39–56. 651
Gaillard, J.-M., Viallefont, A., Loison, A., and Festa-Bianchet, M. (2004). Assessing 652
senescence patterns in populations of large mammals. Anim. Biodivers. Conserv. 27, 47–58. 653
Gaillard, J. ‐M., Yoccoz, N.G., Lebreton, J. ‐D., Bonenfant, C., Devillard, S., Loison, A., 654
Pontier, D., and Allaine, D. (2005). Generation Time: A Reliable Metric to Measure 655
Life‐History Variation among Mammalian Populations. Am. Nat. 166, 119–123. 656
Gamelon, M., Focardi, S., Gaillard, J.-M., Gimenez, O., Bonenfant, C., Franzetti, B., 657
Choquet, R., Ronchi, F., Baubet, E., and Lemaître, J.-F. (2014). Do age-specific survival 658
patterns of wild boar fit current evolutionary theories of senescence? Evolution n/a – n/a. 659
Houle, D., Pelabon, C., Wagner, G.P., and Hansen, T.F. (2011). Measurement and meaning in 660
biology. Q. Rev. Biol. 86, 3–34. 661
Jarman, P. (1983). Mating system and sexual dimorphism in large, terrestrial, mammalian 662
herbivores. Biol. Rev. Camb. Philos. Soc. 58, 485–520. 663
Jones, O.R., Gaillard, J.-M., Tuljapurkar, S., Alho, J.S., Armitage, K.B., Becker, P.H., Bize, 664
P., Brommer, J., Charmantier, A., Charpentier, M., et al. (2008). Senescence rates are 665
determined by ranking on the fast-slow life-history continuum. Ecol. Lett. 11, 664–673. 666
Jones, O.R., Scheuerlein, A., Salguero-Gómez, R., Camarda, C.G., Schaible, R., Casper, B.B., 667
Dahlgren, J.P., Ehrlén, J., García, M.B., Menges, E.S., et al. (2014). Diversity of ageing 668
across the tree of life. Nature 505, 169–173. 669
Bro-Jørgensen, J. (2007). The intensity of sexual selection predicts weapon size in male 670
bovids. Evolution 61, 1316–1326. 671
Bro-Jørgensen, J. (2011). Intra- and intersexual conflicts and cooperation in the evolution of 672
mating strategies: lessons from ungulates. Evol. Biol. 38, 28–41. 673
28
Bro-Jørgensen, J. (2012). Longevity in bovids is promoted by sociality, but reduced by sexual 674
selection. PLOS ONE 7, e45769. 675
Krementz, D.G., Sauer, J.R., and Nichols, J.D. (1989). Model-based estimates of annual 676
survival rate are preferable to observed maximum lifespan statistics for use in comparative 677
life-history studies. Oikos 56, 203–208. 678
Lailvaux, S.P., and Irschick, D.J. (2007). The Evolution of Performance‐Based Male Fighting 679
Ability in Caribbean Anolis Lizards. Am. Nat. 170, 573–586. 680
Lebreton, J., Burnham, K., Clobert, J., and Anderson, D. (1992). Modeling Survival and 681
Testing Biological Hypotheses Using Marked Animals - a Unified Approach with Case-682
Studies. Ecol. Monogr. 62, 67–118. 683
Lemaître, J.-F., and Gaillard, J.-M. (2013a). Male survival patterns do not depend on male 684
allocation to sexual competition in large herbivores. Behav. Ecol. 24, 421–428. 685
Lemaître, J.-F., and Gaillard, J.-M. (2013b). Polyandry has no detectable mortality cost in 686
female mammals. PLOS ONE 8, e66670. 687
Lemaître, J.-F., Gaillard, J.-M., Bingaman Lackey, L., Clauss, M., and Müller, D.W.H. 688
(2013). Comparing free-ranging and captive populations reveals intra-specific variation in 689
aging rates in large herbivores. Exp. Gerontol. 48, 162–167. 690
Lemaître, J.-F., Gaillard, J.-M., Pemberton, J.M., Clutton-Brock, T.H., and Nussey, D.H. 691
(2014a). Early life expenditure in sexual competition is associated with increased 692
reproductive senescence in male red deer. Proc. R. Soc. B Biol. Sci. 281, 20140792. 693
Lemaître, J.-F., Vanpe, C., Plard, F., and Gaillard, J.-M. (2014b). The allometry between 694
secondary sexual traits and body size is nonlinear among cervids. Biol. Lett. 10, 20130869–695
20130869. 696
Lemaître, J.-F., Müller, D.W.H., and Clauss, M. (2014c). A test of the metabolic theory of 697
ecology with two longevity data sets reveals no common cause of scaling in biological times: 698
Longevity scaling in mammals. Mammal Rev. n/a – n/a. 699
Liker, A., and Székely, T. (2005). Mortality costs of sexual selection and parental care in 700
natural populations of birds. Evolution 59, 890–897. 701
Loison, A., Gaillard, J.-M., Pélabon, C., and Yoccoz, N.G. (1999a). What factors shape sexual 702
size dimorphism in ungulates? Evol. Ecol. Res. 1, 611–633. 703
Loison, A., Festa-Bianchet, M., Gaillard, J.-M., Jorgenson, J.T., and Jullien, J.-M. (1999b). 704
Age-specific survival in five populations of ungulates: evidence of senescence. Ecology 80, 705
2539–2554. 706
Lovich, J.E., and Gibbons, J.W. (1992). A review of techniques for quantifying sexual size 707
dimorphism. Growth. Dev. Aging 56, 269–281. 708
MacNamara, M., and Elridge, W. (1987). Behavior and reproduction in captive pudu (Pudu 709
puda) and red brocket (Mazama americana), a descriptive and comparative analysis. In 710
Biology and Management of the Cervidae, (Washington: Smithsonian Institute), pp. 371–386. 711
29
Maklakov, A.A., and Lummaa, V. (2013). Evolution of sex differences in lifespan and aging: 712
Causes and constraints. BioEssays 35, 717–724. 713
Monaghan, P., Charmantier, A., Nussey, D.H., and Ricklefs, R.E. (2008). The evolutionary 714
ecology of senescence. Funct. Ecol. 22, 371–378. 715
Moorad, J.A., Promislow, D.E.L., Flesness, N., and Miller, R.A. (2012). A comparative 716
assessment of univariate longevity measures using zoological animal records. Aging Cell 11, 717
940–948. 718
Müller, D.W.H., Lackey, L.B., Streich, W.J., Fickel, J., Hatt, J.-M., and Clauss, M. (2011). 719
Mating system, feeding type and ex situ conservation effort determine life expectancy in 720
captive ruminants. Proc. R. Soc. B Biol. Sci. 278, 2076–2080. 721
Murray, M.G. (1982). The rut of impala - Aspects of seasonal mating under tropical 722
conditions. Z. Tierpsychol.-J. Comp. Ethol. 59, 319–337. 723
Nussey, D.H., Coulson, T., Festa-Bianchet, M., and Gaillard, J.-M. (2008). Measuring 724
senescence in wild animal populations: towards a longitudinal approach. Funct. Ecol. 22, 725
393–406. 726
Nussey, D.H., Froy, H., Lemaître, J.-F., Gaillard, J.-M., and Austad, S.N. (2013). Senescence 727
in natural populations of animals: widespread evidence and its implications for bio-728
gerontology. Ageing Res. Rev. 12, 214–225. 729
Orme, D. (2012). The caper package: comparative analysis of phylogenetics and evolution in 730
R. 731
Owens, I.P.F., and Bennett, P.M. (1994). Mortality costs of parental care and sexual 732
dimorphism in birds. Proc. R. Soc. B Biol. Sci. 257, 1–8. 733
Péron, G., Gimenez, O., Charmantier, A., Gaillard, J.-M., and Crochet, P.-A. (2010). Age at 734
the onset of senescence in birds and mammals is predicted by early-life performance. Proc. R. 735
Soc. B Biol. Sci. 277, 2849–2856. 736
Plard, F., Bonenfant, C., and Gaillard, J.-M. (2011). Revisiting the allometry of antlers among 737
deer species: male-male sexual competition as a driver. Oikos 120, 601–606. 738
Preston, B.T., Stevenson, I.R., Pemberton, J.M., Coltman, D.W., and Wilson, K. (2003). 739
Overt and covert competition in a promiscuous mammal: the importance of weaponry and 740
testes size to male reproductive success. Proc. R. Soc. B Biol. Sci. 270, 633–640. 741
Promislow, D.E.L. (1992). Costs of Sexual Selection in Natural Populations of Mammals. 742
Proc. R. Soc. B Biol. Sci. 247, 203–210. 743
Promislow, D.E.L., Montgomerie, R., and Martin, T.E. (1992). Mortality costs of sexual 744
dimorphism in birds. Proc. R. Soc. B Biol. Sci. 250, 143–150. 745
Ramp, C., Bérubé, M., Palsbøll, P., Hagen, W., and Sears, R. (2010). Sex-specific survival in 746
the humpback whale Megaptera novaeangliae in the Gulf of St. Lawrence, Canada. Mar. Ecol. 747
Prog. Ser. 400, 267–276. 748
30
R Development Core Team (2011). R : A language and environment for statistical computing. 749
Regan, J.C., and Partridge, L. (2013). Gender and longevity: Why do men die earlier than 750
women? Comparative and experimental evidence. Best Pract. Res. Clin. Endocrinol. Metab. 751
27, 467–479. 752
Revell, L.J. (2010). Phylogenetic signal and linear regression on species data. Methods Ecol. 753
Evol. 1, 319–329. 754
Ricklefs, R.E. (2010). Life-history connections to rates of aging in terrestrial vertebrates. 755
Proc. Natl. Acad. Sci. 107, 10314–10319. 756
Ricklefs, R.E., and Scheuerlein, A. (2002). Biological implications of the Weibull and 757
Gompertz models of aging. J. Gerontol. A. Biol. Sci. Med. Sci. 57, B69–B76. 758
Van Rooyen, A.F. (1993). Variation in body condition of impala and nyala in relation to 759
social status and reproduction. South Afr. J. Wildl. Res. 23, 36–38. 760
Sacher, G.A. (1959). Relation of lifespan to brain weight and body weight in mammals. In 761
The Lifespan on Animals, (London: G.E.W. Wolstenholme and M. O’Connor, eds.),. 762
Toïgo, C., and Gaillard, J.-M. (2003). Causes of sex-biased adult survival in ungulates: sexual 763
size dimorphism, mating tactic or environment harshness? Oikos 101, 376–384. 764
Toïgo, C., Gaillard, J.-M., Festa-Bianchet, M., Largo, E., Michallet, J., and Maillard, D. 765
(2007). Sex- and age-specific survival of the highly dimorphic Alpine ibex: evidence for a 766
conservative life-history tactic. J. Anim. Ecol. 76, 679–686. 767
Trivers, R. (1972). Mother-offspring conflict. Am. Zool. 12, 648–648. 768
Vanhooydonck, B., Herrel, A.Y., Van Damme, R., and Irschick, D.J. (2005). Does dewlap 769
size predict male bite performance in Jamaican Anolis lizards? Funct. Ecol. 19, 38–42. 770
Weckerly, F.W. (1998). Sexual-size dimorphism: influence of mass and mating systems in the 771
most dimorphic mammals. J. Mammal. 79, 33–52. 772
Wiersma, P., Muñoz-Garcia, A., Walker, A., and Williams, J.B. (2007). Tropical birds have a 773
slow pace of life. Proc. Natl. Acad. Sci. 104, 9340–9345. 774
Williams, G.C. (1966). Adaptation and natural selection: a critique of some current 775
evolutionary thought (Princeton University Press). 776
Zerbe, P., Clauss, M., Codron, D., Bingaman Lackey, L., Rensch, E., Streich, J.W., Hatt, J.-777
M., and Müller, D.W.H. (2012). Reproductive seasonality in captive wild ruminants: 778
implications for biogeographical adaptation, photoperiodic control, and life history. Biol. Rev. 779
87, 965–990. 780
781
31
Table 1: Survey of comparative analyzes investigating the relationship between the strength of sexual selection and mortality or actuarial senescence metrics 782
across species. Gray-shaded results correspond to studies reporting support for a statistically significant association between the strength of sexual selection and 783
the level of mortality or actuarial senescence. Results in bold correspond to studies based on metrics of actuarial senescence per se. To identify these 784
comparatives studies, we entered the keywords ‘senescence’, ‘ag(e)ing’, and ‘sexual selection’ into the search engine database of Web of Science (SCI-785
Expanded). 786
Study Taxa Population N Statistical
analysis Sex
Sexual selection
intensity (measure)
Survival or
senescence
variables
(measure) Conclusion
Promislow, 1992
Mammals wild 35 PICs Sex-difference SSD Mating system
Ratio of male to female length Monogamy / Polygyny
Adult mortality rate
Ratio of female to male life expectancy from the average
age at maturity
Positive correlation between SSD and male bias adult mortality.
Female-bias in adult mortality in monogamous taxa.
Promislow et al., 1992
Birds (North American
Passerine only)
wild 28 PICs Male Female
Sex-difference
SSD Brightness
Plumage
Difference
Male minus female values Scale from 1 (dull) to 5
(bright)
male - females score
Adult mortality rate
Sex-specific mortality rate extracted from literature
Sex-bias :
male – female values
Positive correlation between male adult mortality and SSD.
Positive correlation between sex-biased mortality and both SSD and male brightness.
Owens and Bennett, 1994
Birds (western Palearctic
species only)
wild 37 PICs Males Females
SSD
Sexual Plumage
Dimorphism (SPD)
Ratio of male to female body mass
Difference expressed on a
scale from 0 (monomorphic) to 10 (maximum dimorphism)
for five body regions
Adult mortality rate
Sex-specific annual mortality rate
Sex-bias: male/female
No mortality cost associate to SSD neither
SPD.
Toïgo and Gaillard, 2003
Mammals (Large herbivores
only)
wild 18 PICs Male Sex-difference
SSD
Male mating
tactic
Residuals male to female body mass
territoriality / tending / harem-
holding
Adult survival rate
Prime-age survival between 2 and 7 years of age
Sex-bias:
male - survival
Male survival is lower than female survival.
SSD has no effect on male-biased mortality.
No relationship between mating tactic and male-biased mortality.
Liker and Székely, 2005
Birds wild 194 PICs Male Female
Mating system Relative testes
size
Monogamy / Polygyny Testes size and male body
mass in covariate
Adult mortality rate
Sex-specific mortality rate Sex-bias :
male – female values
Male-male competition and relative testis size are positively associated to male biased
mortality.
Females have higher adult mortality than males.
Clutton-Brock
and Isvaran,
2007
Mammals and birds wild 30 PGLS Sex-difference Mating system Monogamy/polygyny:
average number of adult
females in breeding group
Lifespan Ratio of male lifespan to
female lifespan Bigger sex difference of lifespan in
polygynous species than monogamous species.
Rate of
actuarial
senescence
Difference in slope
obtained from linear
regression fitted on age-
specific data
Bigger sex differences in senescence rates
for polygynous species than for
monogamous species
32
Müller et al.,
2011
Mammals
(Large herbivores only)
captive 78 PGLS Male
Female
Mating system Monogamous / Tending /
Polygynous
Relative life
expectancy (rLE)
Life expectancy as
proportion of longevity Higher rLE in males of monogamous than
polygynous species.
Higher rLE in females than males.
Bro-Jørgensen,
2012
Mammals
(Bovids only)
captive 100 PICs
(and PGLS)
Male
Female
SSD Lovich & Gibbons ratio* Longevity Maximum longevity Longevity decrease with SSD in male only.
Lemaître and
Gaillard, 2013a
Mammals
(Large herbivores
only)
wild 24 PGLS Male
Sex-difference
SSD
Weapon size
dimorphism
(WSD)
Relative testes
mass (RTM)
Male mating
tactic
Male and female body mass
in covariate
Male and female body mass
in covariate
Testes mass and male body
mass in covariate
Territoriality / tending,
/harem following
Median lifespan
Age at which 50% of an initial cohort are still alive
Sex-bias :
female – male
Lower adult survival in males than in females.
No relationship between male allocation to SSD, WSD and/or RTM and inter-species
difference of both absolute and relative adult lifespan.
Rate of
actuarial
senescence
Slope obtained from linear
regression fitted on age-
specific data, from median
lifespan to age where 10%
of an initial cohort is still
alive
Sex-bias :
female - male
Stronger rate of senescence in males than
in females.
No relationship between male allocation to
SSD, WSD and/or RTM and between-
species difference of both absolute and
relative actuarial intensity of senescence.
Lemaître and
Gaillard,
2013b
Mammals wild 24 PGLS Female Level of female
polyandry
Relative testes mass or
percentage of multiple
paternity
Median lifespan
Age at which 50% of an initial cohort are still alive
Polyandry level does not affect female lifespan.
Rate of
actuarial
senescence
Slope obtained from linear
regression fitted on age-
specific data, from the age
at the onset of senescence
to death
Polyandry level does not affect female rate
of senescence.
N, number of species; PICs, Phylogenetically Independent contrasts; PGLS, PhyloGenetically Least Square models; SSD, Sexual Size Dimorphism; rLE, relative Life Expectancy. * ratio calculated as M/F if M>F and 2-F/M if F>M, M and F denote male and female body mass respectively.
787
33
Table 2: Parameter estimates from the models selected to account for among-species 788
variation observed in longevity and metrics of actuarial senescence in males of large 789
herbivore species living in captivity. In all analyzes performed, phylogeny had no statistically 790
significant effects (λ < 0.001) and parameters were thus estimated from linear models (LM) 791
without any phylogenetic correction. Effect size statistically different from 0 occur in bold. 792
Method Variables β 95%CI Adjusted-R2 λ
Longevity LM Diet 0.002 0.000 ; 0.004 0.18 < 0.001
(N=64) Male body mass 0.054 0.011 ; 0.097
Gompertz rate of LM Gompertz onset 0.273 0.015 ; 0.530 0.06 < 0.001
senescence (N=54)
Onset of senescence LM Promiscuity -0.244 -0.599 ; 0.112 0.23 < 0.001
(N=64)
Polygyny -0.456 -0.817 ; -0.096
Diet 0.004 0.001 ; 0.008
Male body mass 0.099 0.025 ; 0.172
Rate of senescence LM Male body mass -0.137 -0.198 ; -0.076 0.24 < 0.001
between 6 and 12
years-old (N=60)
793
794
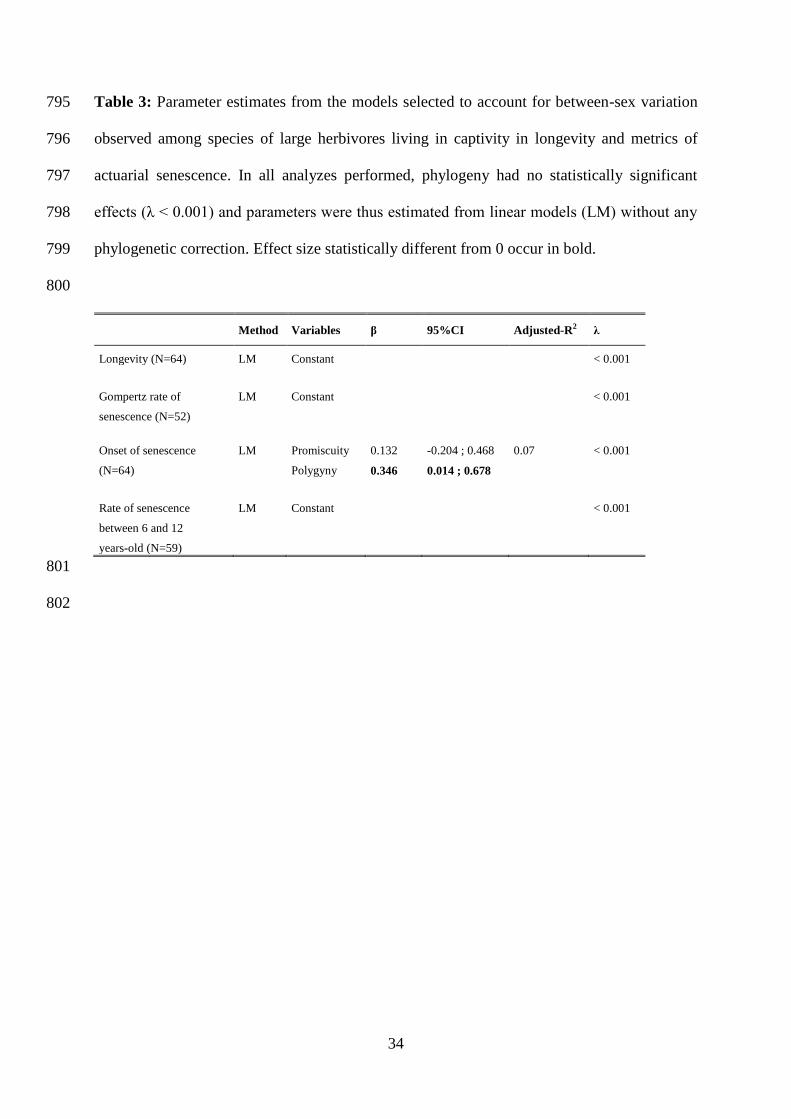
34
Table 3: Parameter estimates from the models selected to account for between-sex variation 795
observed among species of large herbivores living in captivity in longevity and metrics of 796
actuarial senescence. In all analyzes performed, phylogeny had no statistically significant 797
effects (λ < 0.001) and parameters were thus estimated from linear models (LM) without any 798
phylogenetic correction. Effect size statistically different from 0 occur in bold. 799
800
Method Variables β 95%CI Adjusted-R2 λ
Longevity (N=64) LM Constant
< 0.001
Gompertz rate of LM Constant
< 0.001
senescence (N=52)
Onset of senescence LM Promiscuity 0.132 -0.204 ; 0.468 0.07 < 0.001
(N=64)
Polygyny 0.346 0.014 ; 0.678
Rate of senescence LM Constant
< 0.001
between 6 and 12
years-old (N=59)
801
802
35
FIGURE LEGENDS: 803
804
Figure 1: Phylogenetic tree built on 64 species of large herbivores used in our analysis (based 805
on Bininda-Edmonds (2007, 2008)’s phylogenetic tree. Cervid species are specified in bold, 806
Tragulus javanicus (Tragulidae), Giraffa camelopardalis (Giraffidae) and Antilocapra 807
americana (Antilocapridae) are in grey, and other are bovid species. For graphical 808
representation, the SSD was calculated as the ratio of male body mass on female body mass. 809
810
Figure 2: Relationships between the age at the onset of actuarial senescence in males 811
(corrected for both diet and body mass), and the mating system (N = 64 species). 812
813
Figure 3: Relationships between the age at the onset of actuarial senescence in males 814
(corrected for diet), and the mating tactic (N = 37 species). 815
816
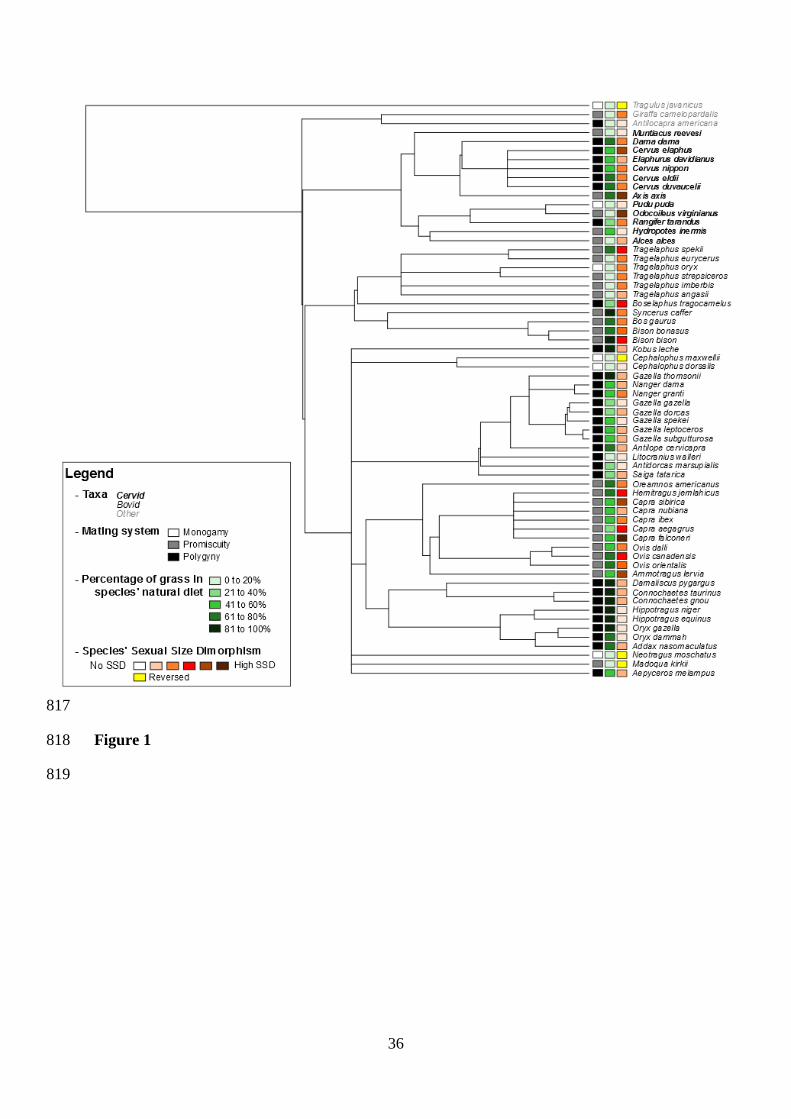
36
817
Figure 1 818
819
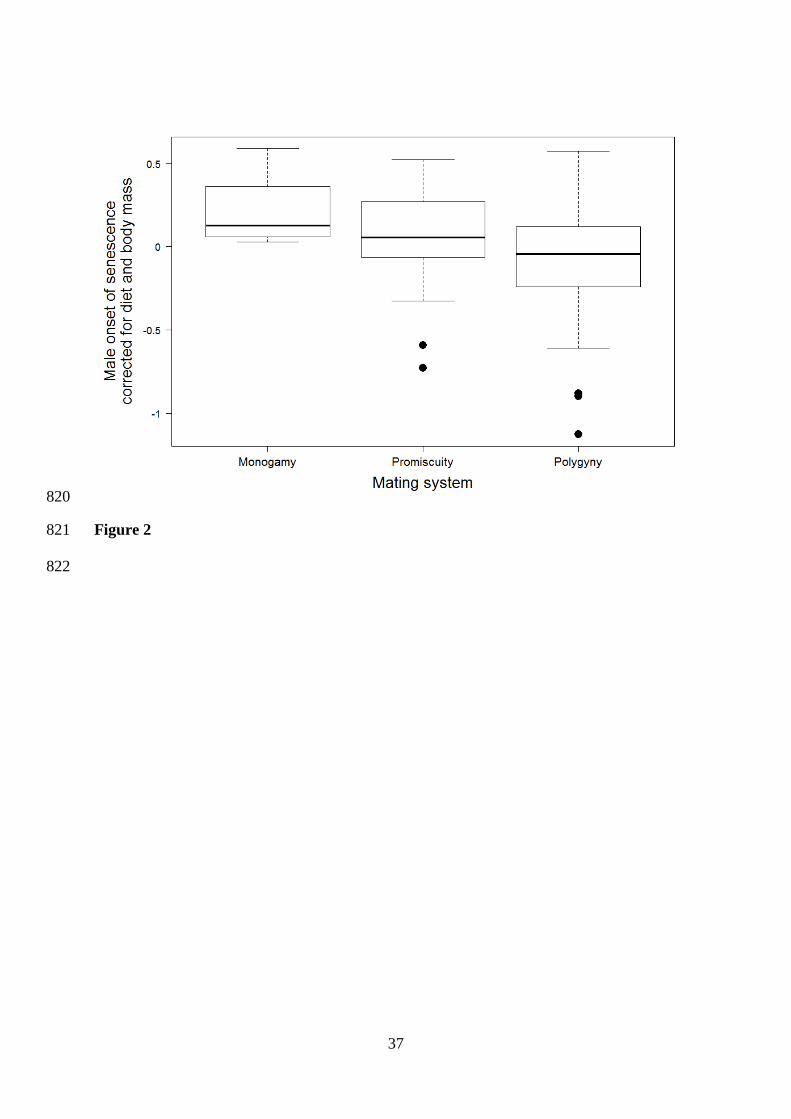
37
820
Figure 2 821
822
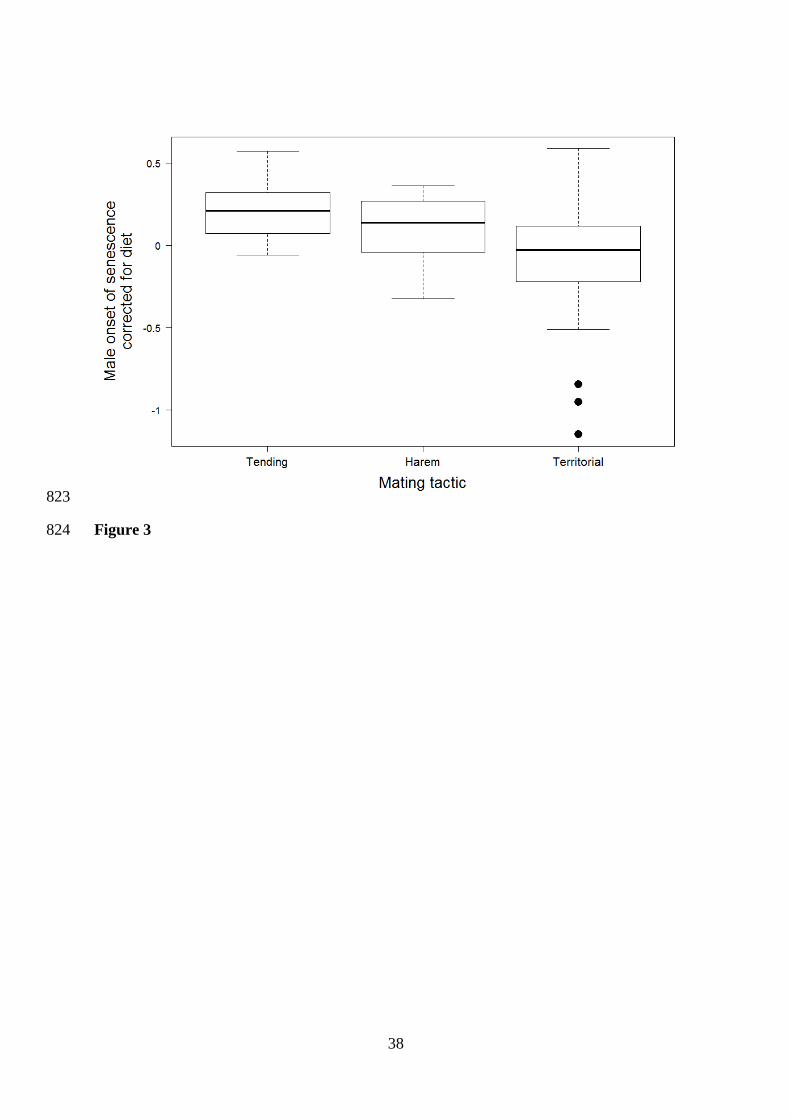
38
823
Figure 3 824
Related Documents