Does Presence of a Mid-Ocean Ridge Enhance Biomass and Biodiversity? Imants G. Priede 1 *, Odd Aksel Bergstad 2 , Peter I. Miller 3 , Michael Vecchione 4 , Andrey Gebruk 5 , Tone Falkenhaug 2 , David S. M. Billett 6 , Jessica Craig 1 , Andrew C. Dale 7 , Mark A. Shields 1 , Gavin H. Tilstone 3 , Tracey T. Sutton 8 , Andrew J. Gooday 6 , Mark E. Inall 7 , Daniel O. B. Jones 6 , Victor Martinez-Vicente 3 , Gui M. Menezes 9 , Tomasz Niedzielski 10 , þorsteinn Sigurðsson 11 , Nina Rothe 6 , Antonina Rogacheva 5 , Claudia H. S. Alt 6 , Timothy Brand 7 , Richard Abell 7 , Andrew S. Brierley 12 , Nicola J. Cousins 1 , Deborah Crockard 1 , A. Rus Hoelzel 13 ,A ˚ ge Høines 14 , Tom B. Letessier 15 , Jane F. Read 6 , Tracy Shimmield 7 , Martin J. Cox 16 , John K. Galbraith 17 , John D. M. Gordon 7 , Tammy Horton 6 , Francis Neat 18 , Pascal Lorance 19 1 Oceanlab, Institute of Biological and Environmental Sciences, University of Aberdeen, Aberdeen, United Kingdom, 2 Institute of Marine Research, Flødevigen, His, Norway, 3 Remote Sensing Group, Plymouth Marine Laboratory, Plymouth, United Kingdom, 4 National Oceanic and Atmospheric Administration/National Marine Fisheries Service, National Systematics Laboratory, National Museum of Natural History, Smithsonian Institution, Washington, District of Columbia, United States of America, 5 P.P. Shirshov Institute of Oceanology, Russian Academy of Sciences, Moscow, Russia, 6 National Oceanography Centre, Southampton, United Kingdom, 7 Scottish Association for Marine Science, Scottish Marine Institute, Oban, United Kingdom, 8 Virginia Institute of Marine Science, College of William & Mary, Gloucester Point, Virginia, United States of America, 9 Department of Oceanography and Fisheries, University of the Azores, Horta, Faial, Portugal, 10 Department of Geoinformatics and Cartography, Institute of Geography and Regional Development, University of Wroclaw, Wroclaw, Poland, 11 Marine Research Institute, Reykjavik, Iceland, 12 Scottish Oceans Institute, University of St. Andrews, United Kingdom, 13 School of Biological and Biomedical Sciences, Durham University, Durham, United Kingdom, 14 Institute of Marine Research, Bergen, Norway, 15 Centre for Marine Futures, Oceans Institute, University of Western Australia, Perth, Western Australia, Australia, 16 Southern Ocean Ecosystem Change Department, Australian Antarctic Division, Kingston, Tasmania, Australia, 17 Northeast Fisheries Science Center, National Oceanic and Atmospheric Administration, Woods Hole, Massachusetts, United States of America, 18 Marine Laboratory, Marine Scotland Science, Aberdeen, United Kingdom, 19 Institut Franc ¸ais de Recherche Pour L’exploitation De La Mer, Nantes, France Abstract In contrast to generally sparse biological communities in open-ocean settings, seamounts and ridges are perceived as areas of elevated productivity and biodiversity capable of supporting commercial fisheries. We investigated the origin of this apparent biological enhancement over a segment of the North Mid-Atlantic Ridge (MAR) using sonar, corers, trawls, traps, and a remotely operated vehicle to survey habitat, biomass, and biodiversity. Satellite remote sensing provided information on flow patterns, thermal fronts, and primary production, while sediment traps measured export flux during 2007–2010. The MAR, 3,704,404 km 2 in area, accounts for 44.7% lower bathyal habitat (800–3500 m depth) in the North Atlantic and is dominated by fine soft sediment substrate (95% of area) on a series of flat terraces with intervening slopes either side of the ridge axis contributing to habitat heterogeneity. The MAR fauna comprises mainly species known from continental margins with no evidence of greater biodiversity. Primary production and export flux over the MAR were not enhanced compared with a nearby reference station over the Porcupine Abyssal Plain. Biomasses of benthic macrofauna and megafauna were similar to global averages at the same depths totalling an estimated 258.9 kt C over the entire lower bathyal north MAR. A hypothetical flat plain at 3500 m depth in place of the MAR would contain 85.6 kt C, implying an increase of 173.3 kt C attributable to the presence of the Ridge. This is approximately equal to 167 kt C of estimated pelagic biomass displaced by the volume of the MAR. There is no enhancement of biological productivity over the MAR; oceanic bathypelagic species are replaced by benthic fauna otherwise unable to survive in the mid ocean. We propose that globally sea floor elevation has no effect on deep sea biomass; pelagic plus benthic biomass is constant within a given surface productivity regime. Citation: Priede IG, Bergstad OA, Miller PI, Vecchione M, Gebruk A, et al. (2013) Does Presence of a Mid-Ocean Ridge Enhance Biomass and Biodiversity? PLoS ONE 8(5): e61550. doi:10.1371/journal.pone.0061550 Editor: John Murray Roberts, Heriot-Watt University, United Kingdom Received December 3, 2012; Accepted March 11, 2013; Published May 2, 2013 Copyright: ß 2013 Priede et al. This is an open-access article distributed under the terms of the Creative Commons Attribution License, which permits unrestricted use, distribution, and reproduction in any medium, provided the original author and source are credited. Funding: The research was funded by the UK Natural Environment Research Council (http://www.nerc.ac.uk/) consortium grant number NE/C512961/1 for a project entitled: ECOMAR; Ecosystem of the Mid Atlantic Ridge at the Sub-Polar Front and Charlie Gibbs Fracture Zone. Funding was also provided by the Census of Marine Life (http://www.coml.org/). Other than selecting the project for funding and approving the resources required, the funders had no role in study design, data collection and analysis, decision to publish, or preparation of the manuscript. Competing Interests: The authors have declared that no competing interests exist. * E-mail: [email protected] PLOS ONE | www.plosone.org 1 May 2013 | Volume 8 | Issue 5 | e61550 PDF compression, OCR, web optimization using a watermarked evaluation copy of CVISION PDFCompressor

Welcome message from author
This document is posted to help you gain knowledge. Please leave a comment to let me know what you think about it! Share it to your friends and learn new things together.
Transcript
Does Presence of a Mid-Ocean Ridge Enhance Biomassand Biodiversity?Imants G. Priede1*, Odd Aksel Bergstad2, Peter I. Miller3, Michael Vecchione4, Andrey Gebruk5,
Tone Falkenhaug2, David S. M. Billett6, Jessica Craig1, Andrew C. Dale7, Mark A. Shields1,
Gavin H. Tilstone3, Tracey T. Sutton8, Andrew J. Gooday6, Mark E. Inall7, Daniel O. B. Jones6,
Victor Martinez-Vicente3, Gui M. Menezes9, Tomasz Niedzielski10, þorsteinn Sigurðsson11, Nina Rothe6,
Antonina Rogacheva5, Claudia H. S. Alt6, Timothy Brand7, Richard Abell7, Andrew S. Brierley12,
Nicola J. Cousins1, Deborah Crockard1, A. Rus Hoelzel13, Age Høines14, Tom B. Letessier15, Jane F. Read6,
Tracy Shimmield7, Martin J. Cox16, John K. Galbraith17, John D. M. Gordon7, Tammy Horton6,
Francis Neat18, Pascal Lorance19
1 Oceanlab, Institute of Biological and Environmental Sciences, University of Aberdeen, Aberdeen, United Kingdom, 2 Institute of Marine Research, Flødevigen, His,
Norway, 3 Remote Sensing Group, Plymouth Marine Laboratory, Plymouth, United Kingdom, 4 National Oceanic and Atmospheric Administration/National Marine
Fisheries Service, National Systematics Laboratory, National Museum of Natural History, Smithsonian Institution, Washington, District of Columbia, United States of
America, 5 P.P. Shirshov Institute of Oceanology, Russian Academy of Sciences, Moscow, Russia, 6 National Oceanography Centre, Southampton, United Kingdom,
7 Scottish Association for Marine Science, Scottish Marine Institute, Oban, United Kingdom, 8 Virginia Institute of Marine Science, College of William & Mary, Gloucester
Point, Virginia, United States of America, 9 Department of Oceanography and Fisheries, University of the Azores, Horta, Faial, Portugal, 10 Department of Geoinformatics
and Cartography, Institute of Geography and Regional Development, University of Wrocław, Wrocław, Poland, 11 Marine Research Institute, Reykjavik, Iceland, 12 Scottish
Oceans Institute, University of St. Andrews, United Kingdom, 13 School of Biological and Biomedical Sciences, Durham University, Durham, United Kingdom, 14 Institute
of Marine Research, Bergen, Norway, 15 Centre for Marine Futures, Oceans Institute, University of Western Australia, Perth, Western Australia, Australia, 16 Southern Ocean
Ecosystem Change Department, Australian Antarctic Division, Kingston, Tasmania, Australia, 17 Northeast Fisheries Science Center, National Oceanic and Atmospheric
Administration, Woods Hole, Massachusetts, United States of America, 18 Marine Laboratory, Marine Scotland Science, Aberdeen, United Kingdom, 19 Institut Francais de
Recherche Pour L’exploitation De La Mer, Nantes, France
Abstract
In contrast to generally sparse biological communities in open-ocean settings, seamounts and ridges are perceived as areasof elevated productivity and biodiversity capable of supporting commercial fisheries. We investigated the origin of thisapparent biological enhancement over a segment of the North Mid-Atlantic Ridge (MAR) using sonar, corers, trawls, traps,and a remotely operated vehicle to survey habitat, biomass, and biodiversity. Satellite remote sensing provided informationon flow patterns, thermal fronts, and primary production, while sediment traps measured export flux during 2007–2010. TheMAR, 3,704,404 km2 in area, accounts for 44.7% lower bathyal habitat (800–3500 m depth) in the North Atlantic and isdominated by fine soft sediment substrate (95% of area) on a series of flat terraces with intervening slopes either side of theridge axis contributing to habitat heterogeneity. The MAR fauna comprises mainly species known from continental marginswith no evidence of greater biodiversity. Primary production and export flux over the MAR were not enhanced comparedwith a nearby reference station over the Porcupine Abyssal Plain. Biomasses of benthic macrofauna and megafauna weresimilar to global averages at the same depths totalling an estimated 258.9 kt C over the entire lower bathyal north MAR. Ahypothetical flat plain at 3500 m depth in place of the MAR would contain 85.6 kt C, implying an increase of 173.3 kt Cattributable to the presence of the Ridge. This is approximately equal to 167 kt C of estimated pelagic biomass displaced bythe volume of the MAR. There is no enhancement of biological productivity over the MAR; oceanic bathypelagic species arereplaced by benthic fauna otherwise unable to survive in the mid ocean. We propose that globally sea floor elevation has noeffect on deep sea biomass; pelagic plus benthic biomass is constant within a given surface productivity regime.
Citation: Priede IG, Bergstad OA, Miller PI, Vecchione M, Gebruk A, et al. (2013) Does Presence of a Mid-Ocean Ridge Enhance Biomass and Biodiversity? PLoSONE 8(5): e61550. doi:10.1371/journal.pone.0061550
Editor: John Murray Roberts, Heriot-Watt University, United Kingdom
Received December 3, 2012; Accepted March 11, 2013; Published May 2, 2013
Copyright: � 2013 Priede et al. This is an open-access article distributed under the terms of the Creative Commons Attribution License, which permitsunrestricted use, distribution, and reproduction in any medium, provided the original author and source are credited.
Funding: The research was funded by the UK Natural Environment Research Council (http://www.nerc.ac.uk/) consortium grant number NE/C512961/1 for aproject entitled: ECOMAR; Ecosystem of the Mid Atlantic Ridge at the Sub-Polar Front and Charlie Gibbs Fracture Zone. Funding was also provided by the Censusof Marine Life (http://www.coml.org/). Other than selecting the project for funding and approving the resources required, the funders had no role in study design,data collection and analysis, decision to publish, or preparation of the manuscript.
Competing Interests: The authors have declared that no competing interests exist.
* E-mail: [email protected]
PLOS ONE | www.plosone.org 1 May 2013 | Volume 8 | Issue 5 | e61550
PDF compression, OCR, web optimization using a watermarked evaluation copy of CVISION PDFCompressor
Introduction
The Mid-Atlantic Ridge (MAR) was described a century ago as
the most striking feature of the Atlantic Ocean dividing the ocean
into eastern and western deep basins [1]. By the 1950s sonar
surveys [2] had revealed the structure of the MAR with a
tectonically active central rift valley bounded by elevated flanks on
either side, sloping down to the abyssal plains [3]. This forms part
of the global mid-ocean ridge system occupying 33% of the total
ocean floor that plays a major role in plate tectonics as the site of
formation of new earth’s crust [4]. Whilst the geological function
of the mid-ocean ridge system is well known, its biological
significance remains uncertain. Abundant chemosynthetically-
supported life is found around hydrothermal vents that occur
along ridge axes [5]. However despite their ubiquity, locally high
biomass [6] and productivity [7], vent fields are small and sparsely
distributed [8] so can only make a minor contribution to mid-
ocean biological productivity. Downward export of organic carbon
from photosynthesis in surface layers of the ocean is the dominant
source of secondary biological productivity over mid-ocean ridge
systems.
Mid-ocean shallows such as ridges and seamounts have
attracted attention as areas of high fisheries productivity
[9,10,11] and biodiversity [12,13]. Generally, the most biologically
productive regions of the oceans are coastal shallow seas with high
incident solar radiation and rapid recycling of nutrients from the
sea floor augmented by terrestrial inputs. In the open ocean,
nutrient concentrations in surface layers are restricted and a
significant fraction of surface primary production is exported
downward into the ocean interior, gradually attenuated with
depth, supporting deep-sea life throughout the water column and
on the abyssal sea floor [14]. Export production can vary with time
and is reported to be 50–80% of the primary production during
episodic blooms or in high productivity areas, but much lower (5–
10%) outside of these periods due to recycling and re-mineralisa-
tion of organic matter in the photic zone [15]. Benthic biomass
decreases with increasing depth and distance from the continents
so that at abyssal depths it is,1% of the values in coastal waters
[16]. Thus in mid ocean in the absence of a ridge - relatively low
surface productivity would support a sparse abyssal fauna at
.4 km depth. The presence of a mid-ocean ridge with a truncated
water columns disrupts this general pattern potentially creating
regions of high biomass that may arise from topographic
influences on water circulation [17] upwelling nutrient-rich deep
water as well as concentrating biomass over summits creating mid
ocean regions of high productivity. Sea surface temperature fronts
that are typically areas of elevated primary production [18], may
account for enhanced production if associated with ridge
topography. Elevation of the sea floor is likely to provide
additional habitat for slope-dwelling bathyal fauna. Such species
cannot otherwise survive in mid ocean owing to their adaptation to
restricted species-specific depth ranges. Biodiversity maxima tend
to occur at mid-slope depths around the ocean margins [16], if this
trend were reflected at similar depths in mid ocean this would
greatly enhance biodiversity there. Mid-ocean shallows may thus
provide stepping stones for trans-oceanic dispersal of bathyal
species. Conversely the ridge may act as a barrier to movement of
abyssal species between the two halves of the ocean. Finally, there
may be sufficient isolation of bathyal fauna on the ridge to allow
development of endemic species confined to the ridge system,
further enhancing oceanic biodiversity.
There is concern that deep water biogenic habitats such as
corals and sponge fields on mid-ocean ridges are vulnerable to
damage from fishing and other anthropogenic activity. Despite
great scientific uncertainty, high seas Marine Protected Areas
(MPAs) have been established over large areas of the MAR [19] to
conserve these habitats. Globally the mid-ocean ridge system is
recognised as a large scale ecosystem with extensive areas of lower
bathyal habitat defined as depths of 800–3500 m [20]. Although
seamounts of similar depths have been proposed to be hotspots of
biodiversity and biological productivity these paradigms have been
questioned [21]. The present study is concerned with elucidating
the potential multiple effects of the presence of a mid-ocean ridge
system on oceanic biology.
The present study has been conducted over an extensive
segment of northern Mid-Atlantic Ridge (MAR), focussing on a
region between the Azores and Iceland (Figure 1A) around the
Charlie-Gibbs Fracture Zone (CGFZ). The CGFZ is a major
discontinuity in the MAR at 53uN (Figure 1B) coinciding with the
location of the sub-polar front (SPF) which delineates the
boundary between Subarctic Intermediate Water (9–10uC) at the
surface to the north and North Atlantic Central water (15–16uC,
summer temperatures) to the south [22].
Materials and Methods
For the purposes of large-scale analysis we have considered the
entire North Atlantic basin deeper than 800 m (Figure 1A) north
of a line between Natal, Brazil and Bolama, Guinea-Bissau using
30-second gridded global bathymetry data [23](corresponding to
926 m resolution in latitude). For detailed studies we sampled an
area between the Azores and Iceland centred on the Charlie-
Gibbs Fracture Zone (Figure 1A,B). In order to characterise the
sea floor habitat, sonar swath bathymetry data were collected
during voyages of the FRV GO Sars in 2004 (Kongsberg Simrad
EM 300) [24], and RRS James Cook in 2007 (Kongsberg Simrad
EM120). Data were viewed in real time on board the vessels using
OLEX software but were post processed on shore with MB system
V5 (www.mbari.org/data/mbsystem) or equivalent software for
seven segments traversing the ridge (Figure 1B). Maps with
resolution,100 m were generated and areas occupied by 3 slope
categories calculated on an equal area projection: Flat plains (slope
,5u), gentle slopes (5–30u) and steep slopes (.30u). Based on these
data, four stations were established; NE (54u00.059N 34u10.619W),
NW (53u59.339N 36u07.399W), SE (49u01.929N 27u40.829W) and
SW (48u46.809N 28u38.439) spaced either side of the MAR axis
(Figure 1B). The moorings were placed at 2500 m depth and
sampling was conducted at depths from 2056 to 2762 m around
the stations. In 2010, video line transects were done using the
Remotely Operated Vehicle (ROV) Isis. As a laser pointer passed
in a straight line over the sea floor the benthic habitat type, soft
sediment or hard rock, was scored at 1 cm resolution using HD
video camera at 2 m altitude above the sea floor. A total of 24 km
were sampled in this way with 500 m long transects placed at
random within the three slope categories. A mooring was placed at
each station, with sediment traps 100 m and 1000 m above
bottom, plus other instrumentation measured downward flux of
organic matter and water flow over the ridge from July 2007 to
June 2010. Voyages of the RRS James Cook serviced the moorings,
surveyed and sampled in 2007, 2009 and 2010. RRS Discovery
serviced the moorings in 2008 (see File S1). Cruise reports can be
downloaded at http://www.oceanlab.abdn.ac.uk/ecomar/cruises.
php. All data from these cruises and cruise reports are also
archived and can be accessed from the British Oceanographic
Data Centre: http://www.bodc.ac.uk.
Since all the sampling locations were in high seas areas beyond
any national jurisdiction no specific permits were required for the
described field studies.
Mid-Ocean Ridge Biology
PLOS ONE | www.plosone.org 2 May 2013 | Volume 8 | Issue 5 | e61550
PDF compression, OCR, web optimization using a watermarked evaluation copy of CVISION PDFCompressor
However the work followed the ‘‘Code of conduct for
responsible marine research in the deep seas and high seas of
the OSPAR maritime area’’ [25].
Satellite remote sensing data were used to evaluate frequency of
fronts and primary production over the MAR and adjacent
regions. Thermal fronts were investigated using 8-day composite
front maps [26] derived from daily merged microwave and
infrared sea surface temperature data from 2006 to 2011, and then
aggregated to indicate regions where strong fronts are most
frequently observed. Primary production was estimated using a
wavelength resolving model [27,28] using mean monthly 9 km
NASA SeaWiFS OC4v4 Chla and Pathfinder v2009 AVHRR
SST data to generate mean monthly satellite maps of PP from
1997 to 2010. The satellite estimates of primary production are
accurate to 20% in the Atlantic Ocean [29] and were verified by in
situ incubation of samples on board ship. Advection of surface
particles to the sediment traps was calculated based on altimeter-
estimated surface currents and settlement velocities covering
phytoplankton size range of 0.2–20 mm. Particles were found to
advect from a 70 km radius over the NW and NE moorings and a
7006400 km ellipse over the SW and SE moorings. Primary and
new production values were calculated from cloud free pixels over
these areas. Missing data (28%) were estimated from interpolation
using a Gaussian fit on the production climatology (r2 = 0.99) and
annual production was calculated from the March-September
mean for 2007–2010. Mass and organic carbon fluxes from the
time-series sediment traps (McLane research Laboratories, Inc.
MA, USA) at the 4 MAR stations were estimated using JGOFS
(Joint Global Ocean Flux Study) protocols. http://usjgofs.whoi.
edu/protocols_rpt_19.html
Two proxies were used to investigate patterns of pelagic biomass
distribution above the MAR, acoustic surveys and biolumines-
cence. The Reykjanes Ridge section of the MAR and the adjacent
Irminger Sea have been surveyed in June and July of each year
(1996–2009) down to a depth of 850 m by an international
fisheries acoustic survey for the pelagic redfish (Sebastes mentella). All
non-redfish features on the echograms were designated as deep-
scattering layer. Composition was verified by pelagic net tows. For
depths from 500 m to the sea floor, data from vertical profiles of
counts of bioluminescent organisms impacting on a fast-descend-
ing mesh screen were abstracted from surveys over the MAR [30],
Porcupine Abyssal Plain (PAP) and Porcupine Seabight (PSB)
(Figure 1B) [31].
Quantitative sampling of benthic fauna was done using a
multiple corer (10 cm diameter core tubes) for macrofauna (see
File S1[S2]) and an otter trawl (see File S1 [S4]) for megafauna
and fishes. In addition, samples were collected by baited traps and
in 2010 by ROV Isis equipped with manipulators, cores, grabs,
suction samplers and a suite of cameras. Sampling was focussed on
areas around the four instrumented stations (Fig 1B). Sampling
over wider latitudinal (41u229N to 60u189N) and depth (607 to
3465 m) ranges during the voyage of the RV GO Sars in 2004
provided further data for assessment of species occurrences on the
MAR [24].
Results
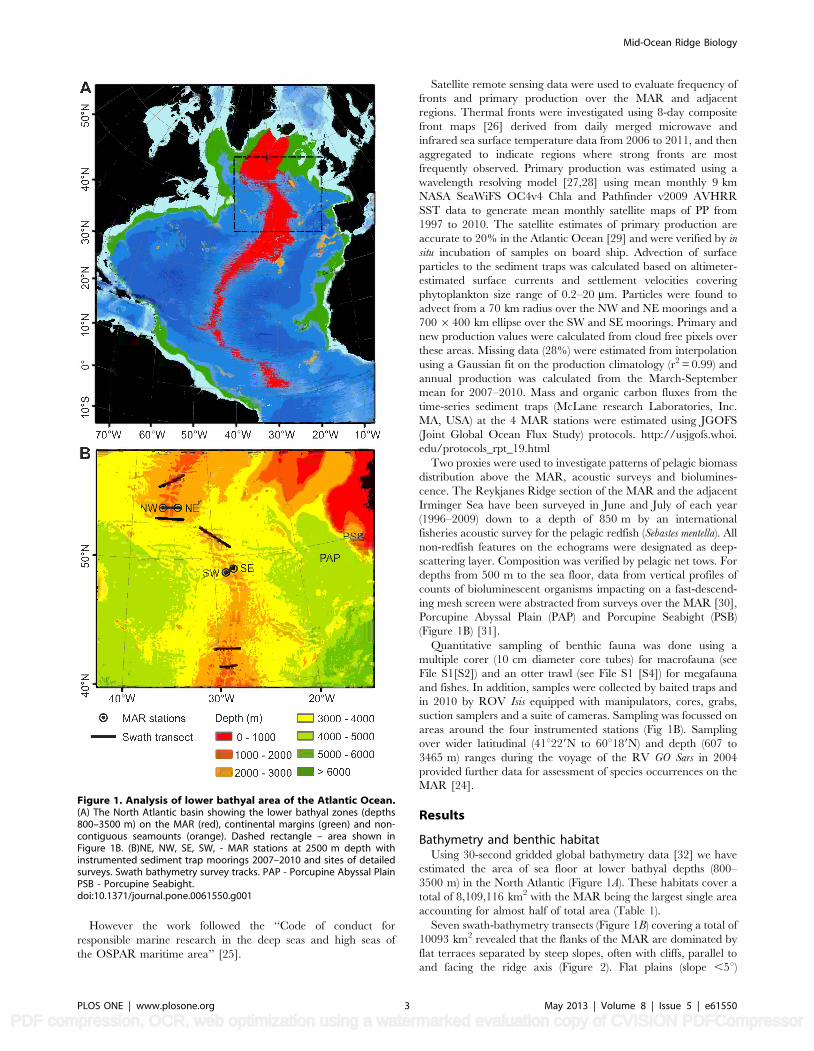
Bathymetry and benthic habitatUsing 30-second gridded global bathymetry data [32] we have
estimated the area of sea floor at lower bathyal depths (800–
3500 m) in the North Atlantic (Figure 1A). These habitats cover a
total of 8,109,116 km2 with the MAR being the largest single area
accounting for almost half of total area (Table 1).
Seven swath-bathymetry transects (Figure 1B) covering a total of
10093 km2 revealed that the flanks of the MAR are dominated by
flat terraces separated by steep slopes, often with cliffs, parallel to
and facing the ridge axis (Figure 2). Flat plains (slope ,5u)
Figure 1. Analysis of lower bathyal area of the Atlantic Ocean.(A) The North Atlantic basin showing the lower bathyal zones (depths800–3500 m) on the MAR (red), continental margins (green) and non-contiguous seamounts (orange). Dashed rectangle – area shown inFigure 1B. (B)NE, NW, SE, SW, - MAR stations at 2500 m depth withinstrumented sediment trap moorings 2007–2010 and sites of detailedsurveys. Swath bathymetry survey tracks. PAP - Porcupine Abyssal PlainPSB - Porcupine Seabight.doi:10.1371/journal.pone.0061550.g001
Mid-Ocean Ridge Biology
PLOS ONE | www.plosone.org 3 May 2013 | Volume 8 | Issue 5 | e61550
PDF compression, OCR, web optimization using a watermarked evaluation copy of CVISION PDFCompressor
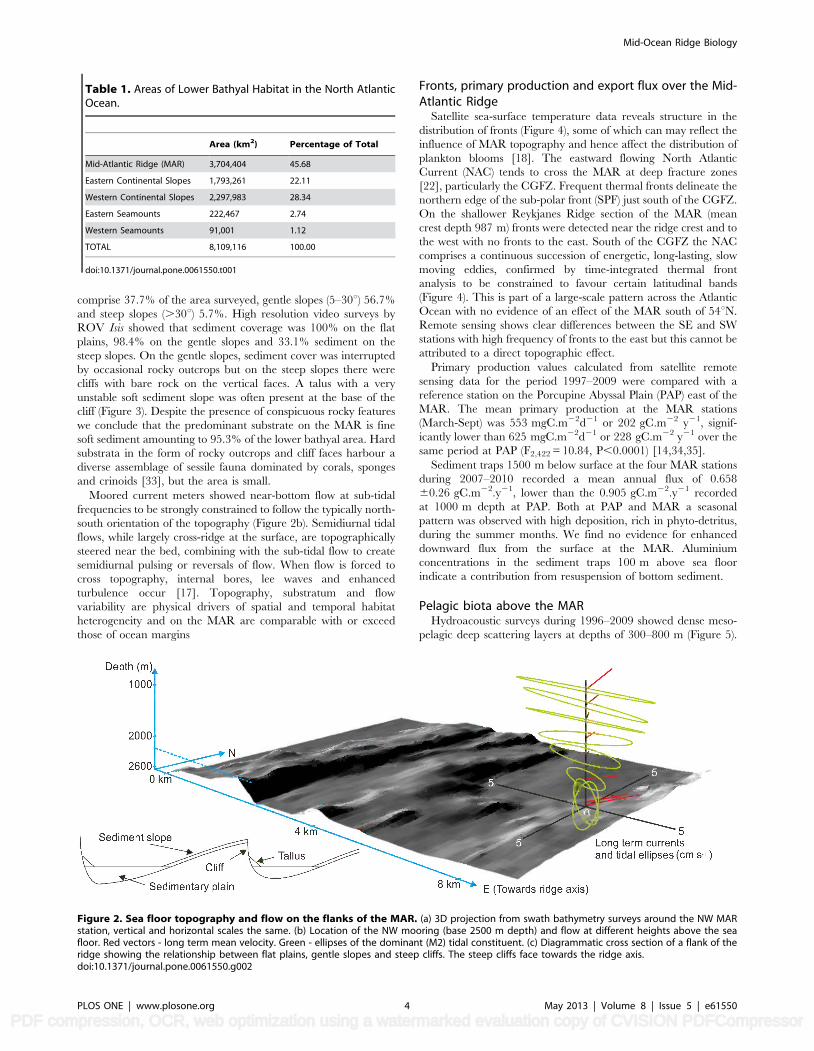
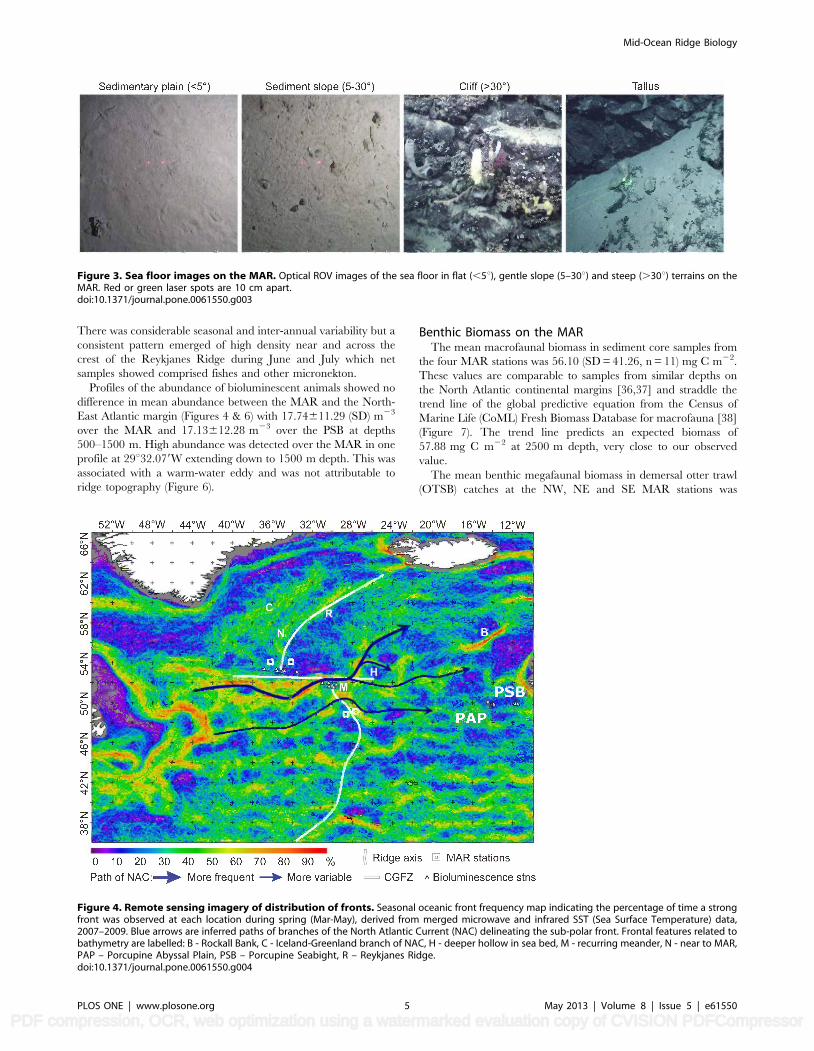
comprise 37.7% of the area surveyed, gentle slopes (5–30u) 56.7%
and steep slopes (.30u) 5.7%. High resolution video surveys by
ROV Isis showed that sediment coverage was 100% on the flat
plains, 98.4% on the gentle slopes and 33.1% sediment on the
steep slopes. On the gentle slopes, sediment cover was interrupted
by occasional rocky outcrops but on the steep slopes there were
cliffs with bare rock on the vertical faces. A talus with a very
unstable soft sediment slope was often present at the base of the
cliff (Figure 3). Despite the presence of conspicuous rocky features
we conclude that the predominant substrate on the MAR is fine
soft sediment amounting to 95.3% of the lower bathyal area. Hard
substrata in the form of rocky outcrops and cliff faces harbour a
diverse assemblage of sessile fauna dominated by corals, sponges
and crinoids [33], but the area is small.
Moored current meters showed near-bottom flow at sub-tidal
frequencies to be strongly constrained to follow the typically north-
south orientation of the topography (Figure 2b). Semidiurnal tidal
flows, while largely cross-ridge at the surface, are topographically
steered near the bed, combining with the sub-tidal flow to create
semidiurnal pulsing or reversals of flow. When flow is forced to
cross topography, internal bores, lee waves and enhanced
turbulence occur [17]. Topography, substratum and flow
variability are physical drivers of spatial and temporal habitat
heterogeneity and on the MAR are comparable with or exceed
those of ocean margins
Fronts, primary production and export flux over the Mid-Atlantic Ridge
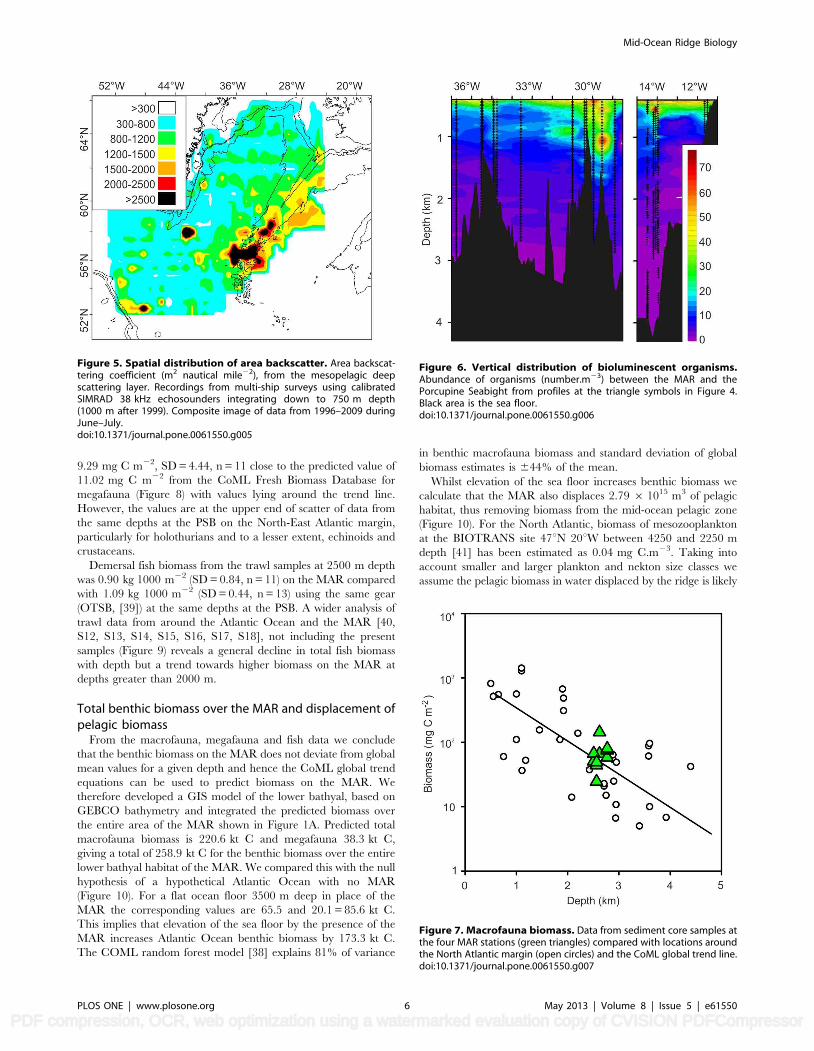
Satellite sea-surface temperature data reveals structure in the
distribution of fronts (Figure 4), some of which can may reflect the
influence of MAR topography and hence affect the distribution of
plankton blooms [18]. The eastward flowing North Atlantic
Current (NAC) tends to cross the MAR at deep fracture zones
[22], particularly the CGFZ. Frequent thermal fronts delineate the
northern edge of the sub-polar front (SPF) just south of the CGFZ.
On the shallower Reykjanes Ridge section of the MAR (mean
crest depth 987 m) fronts were detected near the ridge crest and to
the west with no fronts to the east. South of the CGFZ the NAC
comprises a continuous succession of energetic, long-lasting, slow
moving eddies, confirmed by time-integrated thermal front
analysis to be constrained to favour certain latitudinal bands
(Figure 4). This is part of a large-scale pattern across the Atlantic
Ocean with no evidence of an effect of the MAR south of 54uN.
Remote sensing shows clear differences between the SE and SW
stations with high frequency of fronts to the east but this cannot be
attributed to a direct topographic effect.
Primary production values calculated from satellite remote
sensing data for the period 1997–2009 were compared with a
reference station on the Porcupine Abyssal Plain (PAP) east of the
MAR. The mean primary production at the MAR stations
(March-Sept) was 553 mgC.m22d21 or 202 gC.m22 y21, signif-
icantly lower than 625 mgC.m22d21 or 228 gC.m22 y21 over the
same period at PAP (F2,422 = 10.84, P,0.0001) [14,34,35].
Sediment traps 1500 m below surface at the four MAR stations
during 2007–2010 recorded a mean annual flux of 0.658
60.26 gC.m22.y21, lower than the 0.905 gC.m22.y21 recorded
at 1000 m depth at PAP. Both at PAP and MAR a seasonal
pattern was observed with high deposition, rich in phyto-detritus,
during the summer months. We find no evidence for enhanced
downward flux from the surface at the MAR. Aluminium
concentrations in the sediment traps 100 m above sea floor
indicate a contribution from resuspension of bottom sediment.
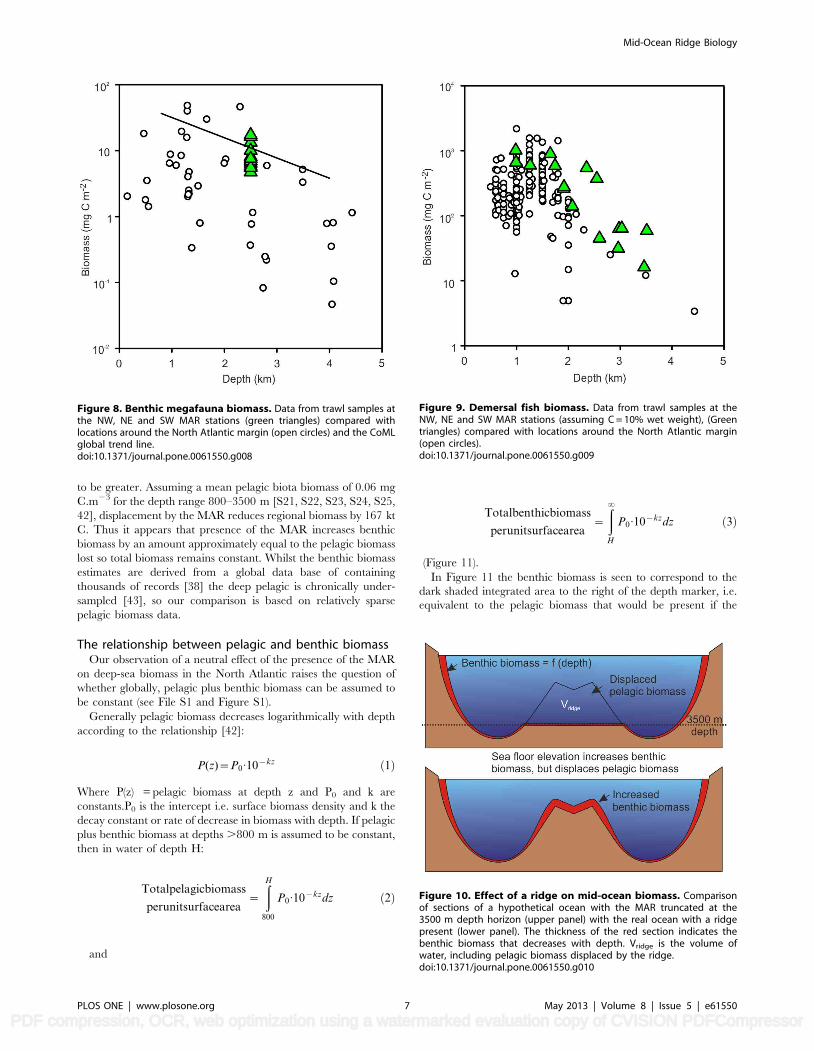
Pelagic biota above the MARHydroacoustic surveys during 1996–2009 showed dense meso-
pelagic deep scattering layers at depths of 300–800 m (Figure 5).
Table 1. Areas of Lower Bathyal Habitat in the North AtlanticOcean.
Area (km2) Percentage of Total
Mid-Atlantic Ridge (MAR) 3,704,404 45.68
Eastern Continental Slopes 1,793,261 22.11
Western Continental Slopes 2,297,983 28.34
Eastern Seamounts 222,467 2.74
Western Seamounts 91,001 1.12
TOTAL 8,109,116 100.00
doi:10.1371/journal.pone.0061550.t001
Figure 2. Sea floor topography and flow on the flanks of the MAR. (a) 3D projection from swath bathymetry surveys around the NW MARstation, vertical and horizontal scales the same. (b) Location of the NW mooring (base 2500 m depth) and flow at different heights above the seafloor. Red vectors - long term mean velocity. Green - ellipses of the dominant (M2) tidal constituent. (c) Diagrammatic cross section of a flank of theridge showing the relationship between flat plains, gentle slopes and steep cliffs. The steep cliffs face towards the ridge axis.doi:10.1371/journal.pone.0061550.g002
Mid-Ocean Ridge Biology
PLOS ONE | www.plosone.org 4 May 2013 | Volume 8 | Issue 5 | e61550
PDF compression, OCR, web optimization using a watermarked evaluation copy of CVISION PDFCompressor
There was considerable seasonal and inter-annual variability but a
consistent pattern emerged of high density near and across the
crest of the Reykjanes Ridge during June and July which net
samples showed comprised fishes and other micronekton.
Profiles of the abundance of bioluminescent animals showed no
difference in mean abundance between the MAR and the North-
East Atlantic margin (Figures 4 & 6) with 17.74611.29 (SD) m23
over the MAR and 17.13612.28 m23 over the PSB at depths
500–1500 m. High abundance was detected over the MAR in one
profile at 29u32.079W extending down to 1500 m depth. This was
associated with a warm-water eddy and was not attributable to
ridge topography (Figure 6).
Benthic Biomass on the MARThe mean macrofaunal biomass in sediment core samples from
the four MAR stations was 56.10 (SD = 41.26, n = 11) mg C m22.
These values are comparable to samples from similar depths on
the North Atlantic continental margins [36,37] and straddle the
trend line of the global predictive equation from the Census of
Marine Life (CoML) Fresh Biomass Database for macrofauna [38]
(Figure 7). The trend line predicts an expected biomass of
57.88 mg C m22 at 2500 m depth, very close to our observed
value.
The mean benthic megafaunal biomass in demersal otter trawl
(OTSB) catches at the NW, NE and SE MAR stations was
Figure 3. Sea floor images on the MAR. Optical ROV images of the sea floor in flat (,5u), gentle slope (5–30u) and steep (.30u) terrains on theMAR. Red or green laser spots are 10 cm apart.doi:10.1371/journal.pone.0061550.g003
Figure 4. Remote sensing imagery of distribution of fronts. Seasonal oceanic front frequency map indicating the percentage of time a strongfront was observed at each location during spring (Mar-May), derived from merged microwave and infrared SST (Sea Surface Temperature) data,2007–2009. Blue arrows are inferred paths of branches of the North Atlantic Current (NAC) delineating the sub-polar front. Frontal features related tobathymetry are labelled: B - Rockall Bank, C - Iceland-Greenland branch of NAC, H - deeper hollow in sea bed, M - recurring meander, N - near to MAR,PAP – Porcupine Abyssal Plain, PSB – Porcupine Seabight, R – Reykjanes Ridge.doi:10.1371/journal.pone.0061550.g004
Mid-Ocean Ridge Biology
PLOS ONE | www.plosone.org 5 May 2013 | Volume 8 | Issue 5 | e61550
PDF compression, OCR, web optimization using a watermarked evaluation copy of CVISION PDFCompressor
9.29 mg C m22, SD = 4.44, n = 11 close to the predicted value of
11.02 mg C m22 from the CoML Fresh Biomass Database for
megafauna (Figure 8) with values lying around the trend line.
However, the values are at the upper end of scatter of data from
the same depths at the PSB on the North-East Atlantic margin,
particularly for holothurians and to a lesser extent, echinoids and
crustaceans.
Demersal fish biomass from the trawl samples at 2500 m depth
was 0.90 kg 1000 m22 (SD = 0.84, n = 11) on the MAR compared
with 1.09 kg 1000 m22 (SD = 0.44, n = 13) using the same gear
(OTSB, [39]) at the same depths at the PSB. A wider analysis of
trawl data from around the Atlantic Ocean and the MAR [40,
S12, S13, S14, S15, S16, S17, S18], not including the present
samples (Figure 9) reveals a general decline in total fish biomass
with depth but a trend towards higher biomass on the MAR at
depths greater than 2000 m.
Total benthic biomass over the MAR and displacement ofpelagic biomass
From the macrofauna, megafauna and fish data we conclude
that the benthic biomass on the MAR does not deviate from global
mean values for a given depth and hence the CoML global trend
equations can be used to predict biomass on the MAR. We
therefore developed a GIS model of the lower bathyal, based on
GEBCO bathymetry and integrated the predicted biomass over
the entire area of the MAR shown in Figure 1A. Predicted total
macrofauna biomass is 220.6 kt C and megafauna 38.3 kt C,
giving a total of 258.9 kt C for the benthic biomass over the entire
lower bathyal habitat of the MAR. We compared this with the null
hypothesis of a hypothetical Atlantic Ocean with no MAR
(Figure 10). For a flat ocean floor 3500 m deep in place of the
MAR the corresponding values are 65.5 and 20.1 = 85.6 kt C.
This implies that elevation of the sea floor by the presence of the
MAR increases Atlantic Ocean benthic biomass by 173.3 kt C.
The COML random forest model [38] explains 81% of variance
in benthic macrofauna biomass and standard deviation of global
biomass estimates is 644% of the mean.
Whilst elevation of the sea floor increases benthic biomass we
calculate that the MAR also displaces 2.79 6 1015 m3 of pelagic
habitat, thus removing biomass from the mid-ocean pelagic zone
(Figure 10). For the North Atlantic, biomass of mesozooplankton
at the BIOTRANS site 47uN 20uW between 4250 and 2250 m
depth [41] has been estimated as 0.04 mg C.m23. Taking into
account smaller and larger plankton and nekton size classes we
assume the pelagic biomass in water displaced by the ridge is likely
Figure 5. Spatial distribution of area backscatter. Area backscat-tering coefficient (m2 nautical mile22), from the mesopelagic deepscattering layer. Recordings from multi-ship surveys using calibratedSIMRAD 38 kHz echosounders integrating down to 750 m depth(1000 m after 1999). Composite image of data from 1996–2009 duringJune–July.doi:10.1371/journal.pone.0061550.g005
Figure 6. Vertical distribution of bioluminescent organisms.Abundance of organisms (number.m23) between the MAR and thePorcupine Seabight from profiles at the triangle symbols in Figure 4.Black area is the sea floor.doi:10.1371/journal.pone.0061550.g006
Figure 7. Macrofauna biomass. Data from sediment core samples atthe four MAR stations (green triangles) compared with locations aroundthe North Atlantic margin (open circles) and the CoML global trend line.doi:10.1371/journal.pone.0061550.g007
Mid-Ocean Ridge Biology
PLOS ONE | www.plosone.org 6 May 2013 | Volume 8 | Issue 5 | e61550
PDF compression, OCR, web optimization using a watermarked evaluation copy of CVISION PDFCompressor
to be greater. Assuming a mean pelagic biota biomass of 0.06 mg
C.m23 for the depth range 800–3500 m [S21, S22, S23, S24, S25,
42], displacement by the MAR reduces regional biomass by 167 kt
C. Thus it appears that presence of the MAR increases benthic
biomass by an amount approximately equal to the pelagic biomass
lost so total biomass remains constant. Whilst the benthic biomass
estimates are derived from a global data base of containing
thousands of records [38] the deep pelagic is chronically under-
sampled [43], so our comparison is based on relatively sparse
pelagic biomass data.
The relationship between pelagic and benthic biomassOur observation of a neutral effect of the presence of the MAR
on deep-sea biomass in the North Atlantic raises the question of
whether globally, pelagic plus benthic biomass can be assumed to
be constant (see File S1 and Figure S1).
Generally pelagic biomass decreases logarithmically with depth
according to the relationship [42]:
P(z)~P0:10{kz ð1Þ
Where P(z) = pelagic biomass at depth z and P0 and k are
constants.P0 is the intercept i.e. surface biomass density and k the
decay constant or rate of decrease in biomass with depth. If pelagic
plus benthic biomass at depths .800 m is assumed to be constant,
then in water of depth H:
Totalpelagicbiomass
perunitsurfacearea~
ðH
800
P0:10{kzdz ð2Þ
and
Totalbenthicbiomass
perunitsurfacearea~
ð?
H
P0:10{kzdz ð3Þ
(Figure 11).
In Figure 11 the benthic biomass is seen to correspond to the
dark shaded integrated area to the right of the depth marker, i.e.
equivalent to the pelagic biomass that would be present if the
Figure 8. Benthic megafauna biomass. Data from trawl samples atthe NW, NE and SW MAR stations (green triangles) compared withlocations around the North Atlantic margin (open circles) and the CoMLglobal trend line.doi:10.1371/journal.pone.0061550.g008
Figure 9. Demersal fish biomass. Data from trawl samples at theNW, NE and SW MAR stations (assuming C = 10% wet weight), (Greentriangles) compared with locations around the North Atlantic margin(open circles).doi:10.1371/journal.pone.0061550.g009
Figure 10. Effect of a ridge on mid-ocean biomass. Comparisonof sections of a hypothetical ocean with the MAR truncated at the3500 m depth horizon (upper panel) with the real ocean with a ridgepresent (lower panel). The thickness of the red section indicates thebenthic biomass that decreases with depth. Vridge is the volume ofwater, including pelagic biomass displaced by the ridge.doi:10.1371/journal.pone.0061550.g010
Mid-Ocean Ridge Biology
PLOS ONE | www.plosone.org 7 May 2013 | Volume 8 | Issue 5 | e61550
PDF compression, OCR, web optimization using a watermarked evaluation copy of CVISION PDFCompressor
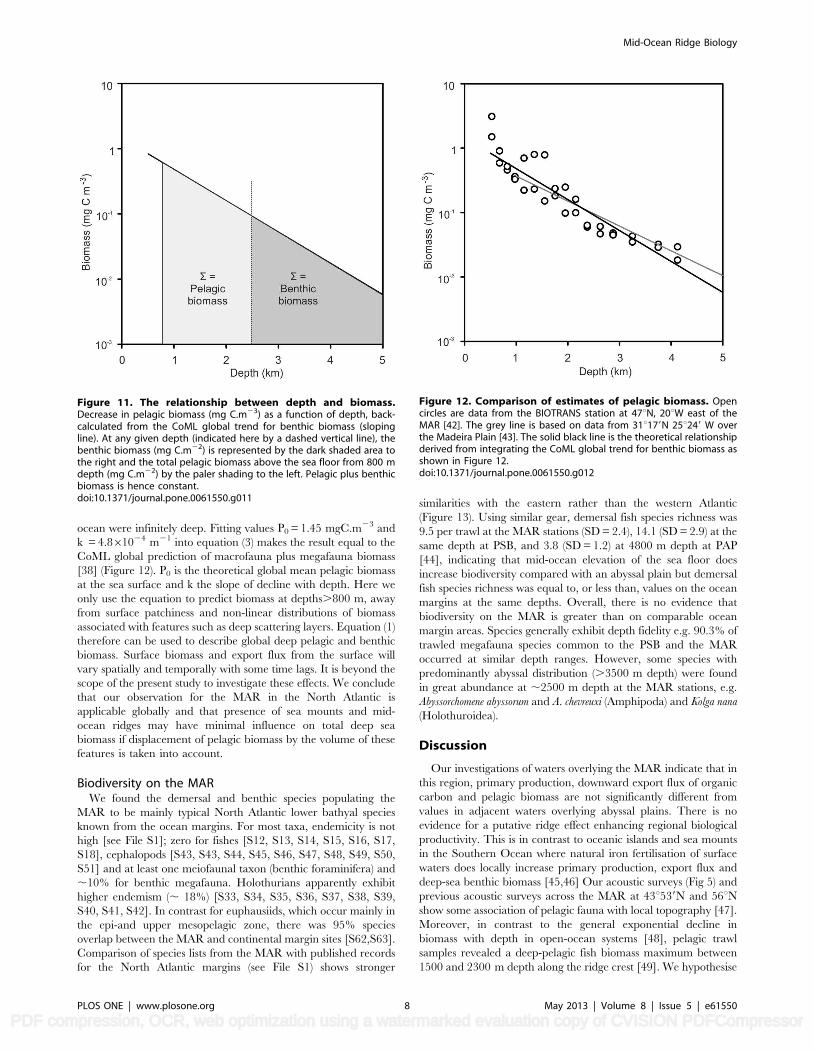
ocean were infinitely deep. Fitting values P0 = 1.45 mgC.m23 and
k = 4.861024 m21 into equation (3) makes the result equal to the
CoML global prediction of macrofauna plus megafauna biomass
[38] (Figure 12). P0 is the theoretical global mean pelagic biomass
at the sea surface and k the slope of decline with depth. Here we
only use the equation to predict biomass at depths.800 m, away
from surface patchiness and non-linear distributions of biomass
associated with features such as deep scattering layers. Equation (1)
therefore can be used to describe global deep pelagic and benthic
biomass. Surface biomass and export flux from the surface will
vary spatially and temporally with some time lags. It is beyond the
scope of the present study to investigate these effects. We conclude
that our observation for the MAR in the North Atlantic is
applicable globally and that presence of sea mounts and mid-
ocean ridges may have minimal influence on total deep sea
biomass if displacement of pelagic biomass by the volume of these
features is taken into account.
Biodiversity on the MARWe found the demersal and benthic species populating the
MAR to be mainly typical North Atlantic lower bathyal species
known from the ocean margins. For most taxa, endemicity is not
high [see File S1]; zero for fishes [S12, S13, S14, S15, S16, S17,
S18], cephalopods [S43, S43, S44, S45, S46, S47, S48, S49, S50,
S51] and at least one meiofaunal taxon (benthic foraminifera) and
,10% for benthic megafauna. Holothurians apparently exhibit
higher endemism (, 18%) [S33, S34, S35, S36, S37, S38, S39,
S40, S41, S42]. In contrast for euphausiids, which occur mainly in
the epi-and upper mesopelagic zone, there was 95% species
overlap between the MAR and continental margin sites [S62,S63].
Comparison of species lists from the MAR with published records
for the North Atlantic margins (see File S1) shows stronger
similarities with the eastern rather than the western Atlantic
(Figure 13). Using similar gear, demersal fish species richness was
9.5 per trawl at the MAR stations (SD = 2.4), 14.1 (SD = 2.9) at the
same depth at PSB, and 3.8 (SD = 1.2) at 4800 m depth at PAP
[44], indicating that mid-ocean elevation of the sea floor does
increase biodiversity compared with an abyssal plain but demersal
fish species richness was equal to, or less than, values on the ocean
margins at the same depths. Overall, there is no evidence that
biodiversity on the MAR is greater than on comparable ocean
margin areas. Species generally exhibit depth fidelity e.g. 90.3% of
trawled megafauna species common to the PSB and the MAR
occurred at similar depth ranges. However, some species with
predominantly abyssal distribution (.3500 m depth) were found
in great abundance at ,2500 m depth at the MAR stations, e.g.
Abyssorchomene abyssorum and A. chevreuxi (Amphipoda) and Kolga nana
(Holothuroidea).
Discussion
Our investigations of waters overlying the MAR indicate that in
this region, primary production, downward export flux of organic
carbon and pelagic biomass are not significantly different from
values in adjacent waters overlying abyssal plains. There is no
evidence for a putative ridge effect enhancing regional biological
productivity. This is in contrast to oceanic islands and sea mounts
in the Southern Ocean where natural iron fertilisation of surface
waters does locally increase primary production, export flux and
deep-sea benthic biomass [45,46] Our acoustic surveys (Fig 5) and
previous acoustic surveys across the MAR at 43u539N and 56uNshow some association of pelagic fauna with local topography [47].
Moreover, in contrast to the general exponential decline in
biomass with depth in open-ocean systems [48], pelagic trawl
samples revealed a deep-pelagic fish biomass maximum between
1500 and 2300 m depth along the ridge crest [49]. We hypothesise
Figure 11. The relationship between depth and biomass.Decrease in pelagic biomass (mg C.m23) as a function of depth, back-calculated from the CoML global trend for benthic biomass (slopingline). At any given depth (indicated here by a dashed vertical line), thebenthic biomass (mg C.m22) is represented by the dark shaded area tothe right and the total pelagic biomass above the sea floor from 800 mdepth (mg C.m22) by the paler shading to the left. Pelagic plus benthicbiomass is hence constant.doi:10.1371/journal.pone.0061550.g011
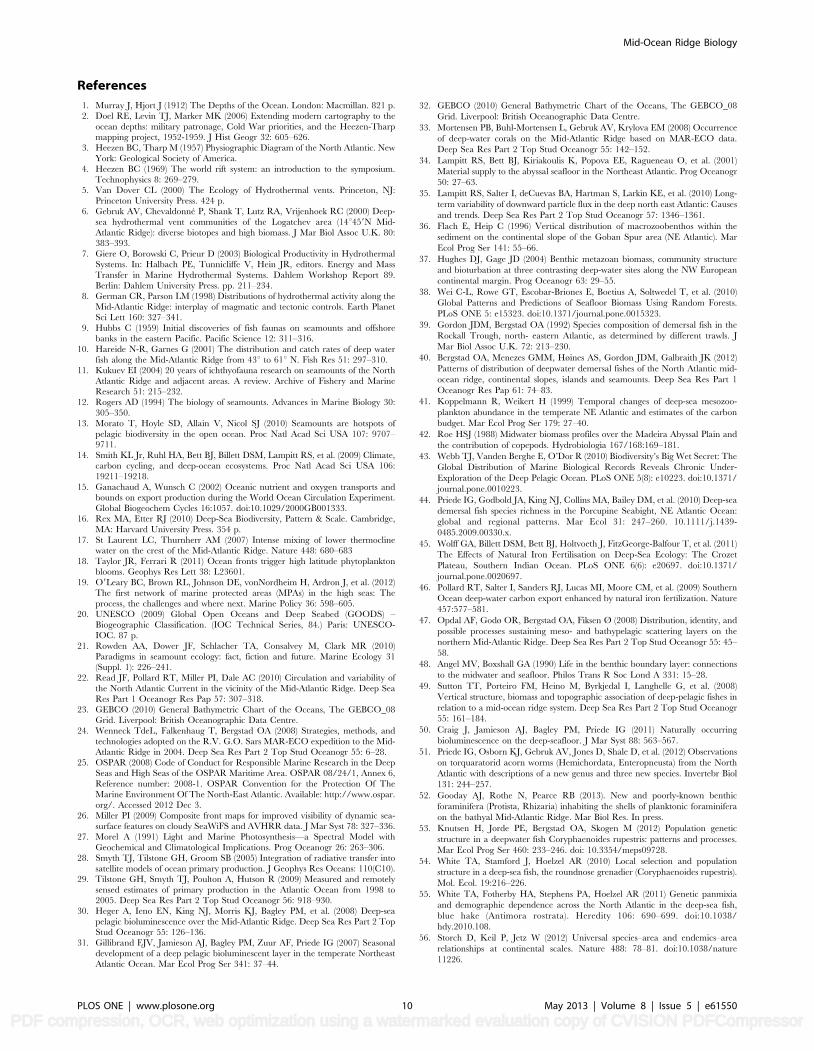
Figure 12. Comparison of estimates of pelagic biomass. Opencircles are data from the BIOTRANS station at 47uN, 20uW east of theMAR [42]. The grey line is based on data from 31u179N 25u249 W overthe Madeira Plain [43]. The solid black line is the theoretical relationshipderived from integrating the CoML global trend for benthic biomass asshown in Figure 12.doi:10.1371/journal.pone.0061550.g012
Mid-Ocean Ridge Biology
PLOS ONE | www.plosone.org 8 May 2013 | Volume 8 | Issue 5 | e61550
PDF compression, OCR, web optimization using a watermarked evaluation copy of CVISION PDFCompressor

that these concentrations of biomass and biodiversity do not reflect
localized increased biological productivity but is the result
aggregation behavior by active nektonic species effectively
importing biomass from the surrounding seas.
Benthic biomass on the MAR is enhanced compared with a
hypothetical mid ocean with a continuous abyssal plain and no
ridge. This is not the result of an increase in total biological
productivity; displaced pelagic biomass is simply replaced by
benthic biomass. We propose that generally for deep ocean areas,
for depths greater than 800 m, pelagic plus benthic biomass is
constant, the value of the total being determined by the mean
primary production in the photic zone of the area under
consideration. Our analysis did not include the smaller mieofauna
fraction which also follow depth trends similar to the macrofauna
and megafauna [38]. Benthic meiofauna together with smaller size
fractions of plankton would contribute to the total biomass present.
We did not measure biomass on hard substrata, rocky outcrops
and cliffs that harbour a diverse assemblage of sessile fauna
dominated by corals, sponges and crinoids [33]. However such
habitat represents,5% of the lower bathyal area of the MAR.
Although patches of attached fauna may be very conspicuous,
indeed made more so by bioluminescence [50], a large proportion
of the lower bathyal rock faces is bare (Figure 3). Our calculations
imply that biomasses on hard and soft substrate are equal; any
error arising from this is likely to be small.
Comparisons of biodiversity and evidence for endemism are
hampered by our imperfect knowledge of deep-sea fauna. New
species discovered [51,52] on the MAR are likely to be found
living elsewhere. Although ca. 18% endemism amongst holothu-
rians appears to be well founded, the fact that the best known
taxon, the fishes, shows zero endemism may be more informative.
Indeed population genetic studies on some deep demersal fish
species suggest that the MAR is not a barrier to gene flow;
roundnose grenadier (Coryphaenoides rupestris)[53] showed only slight
intra-specific differentiation from the ocean margins [54] and in
blue hake (Antimora rostrata) there was no differentiation [55].
Analysis of species occurrences shows a clear bias towards closer
similarity to the eastern Atlantic margin (Figure 13).
There is no doubt that presence of the MAR greatly alters the
water circulation and biology of the Atlantic Ocean providing
habitat for bathyal organisms that would not otherwise survive in
mid ocean. However the overall effect on oceanic productivity
appears to be neutral which cautions against excessive ambitions
for exploitation of biological resources. From the point of view of
biodiversity, the MAR roughly doubles the available area of lower
bathyal habitat in the ocean basin. Applying species-area theory
[56] this suggests that the MAR is more important for sustaining
bathyal benthic diversity in the Atlantic basin as a whole rather
than supporting a rich endemic fauna of its own.
Supporting Information
Figure S1 The relationship between pelagic and benthicbiomass. The curve indicates a trend of pelagic biomass density
as a function of depth. For any given bottom depth (H) the
integrated area under curve to the right is equal to the benthic
biomass per unit surface area. The integrated area to the left gives
the pelagic biomass per unit surface area. (tiff)
(TIF)
File S1 Comprising information on Cruises, Materials& Methods, The relationship between pelagic andbenthic faunal biomass, Biodiversity Data Sources usedin Figure 13, and Supporting Information References tosources of data.
(DOCX)
Acknowledgments
We thank, the ships’ companies of FRV GO Sars, RRS Discovery, RRS James
Cook, NOAA Ship Henry B. Bigelow and other research vessels. Also thanks
to PINRO, Russia and Federal Research Centre for Fisheries, Hamburg,
Germany for access to DSL data from redfish surveys (1996–2009).
Satellite data were provided to cruises by NERC Earth Observation Data
Acquisition and Analysis Service (www.neodaas.ac.uk).
Author Contributions
Conceived and designed the experiments: IGP OAB PIM MV AG TF
DSMB GHT TS MEI ASB ARH TS. Performed the experiments: IGP
OAB PIM MV AG TF JC ACD MAS GHT TTS AJG DOBJ VM-V
GMM AzS AR CHSA TB RA NJC AH TBL JFR MJC. Analyzed the
data: IGP OAB PIM MV AG TF JC ACD MAS GHT TTS AJG MEI
DOBJ VM-V GMM TN AzS NR AR CHSA TB RA NJC DC AH TBL
JFR MJC TH. Wrote the paper: IGP OAB PIM MV AG TF DSMB JC
ACD MAS GHT TTS AJG MEI DOBJ CHSA TB RA ASB NJC DC
ARH TBL JFR MJC TH FN PL. Contributed comparative data on species
occurrences around the Atlantic Ocean: OAB MV AG TF DSMB AJG
GMM JKG JDMG TH FN PL.
Figure 13. Faunal overlap between the MAR and continentalslopes. Sørensen indices of species overlap between MAR and theNorthwest (WNA, filled) and Northeast (ENA, open) Atlantic derivedfrom species occurrence data. Numbers in parentheses are the numbersof species of each group found on the MAR.doi:10.1371/journal.pone.0061550.g013
Mid-Ocean Ridge Biology
PLOS ONE | www.plosone.org 9 May 2013 | Volume 8 | Issue 5 | e61550
PDF compression, OCR, web optimization using a watermarked evaluation copy of CVISION PDFCompressor
References
1. Murray J, Hjort J (1912) The Depths of the Ocean. London: Macmillan. 821 p.2. Doel RE, Levin TJ, Marker MK (2006) Extending modern cartography to the
ocean depths: military patronage, Cold War priorities, and the Heezen-Tharpmapping project, 1952-1959. J Hist Geogr 32: 605–626.
3. Heezen BC, Tharp M (1957) Physiographic Diagram of the North Atlantic. NewYork: Geological Society of America.
4. Heezen BC (1969) The world rift system: an introduction to the symposium.
Technophysics 8: 269–279.5. Van Dover CL (2000) The Ecology of Hydrothermal vents. Princeton, NJ:
Princeton University Press. 424 p.6. Gebruk AV, Chevaldonne P, Shank T, Lutz RA, Vrijenhoek RC (2000) Deep-
sea hydrothermal vent communities of the Logatchev area (14u459N Mid-
Atlantic Ridge): diverse biotopes and high biomass. J Mar Biol Assoc U.K. 80:383–393.
7. Giere O, Borowski C, Prieur D (2003) Biological Productivity in HydrothermalSystems. In: Halbach PE, Tunnicliffe V, Hein JR, editors. Energy and Mass
Transfer in Marine Hydrothermal Systems. Dahlem Workshop Report 89.
Berlin: Dahlem University Press. pp. 211–234.8. German CR, Parson LM (1998) Distributions of hydrothermal activity along the
Mid-Atlantic Ridge: interplay of magmatic and tectonic controls. Earth PlanetSci Lett 160: 327–341.
9. Hubbs C (1959) Initial discoveries of fish faunas on seamounts and offshorebanks in the eastern Pacific. Pacific Science 12: 311–316.
10. Hareide N-R, Garnes G (2001) The distribution and catch rates of deep water
fish along the Mid-Atlantic Ridge from 43u to 61u N. Fish Res 51: 297–310.11. Kukuev EI (2004) 20 years of ichthyofauna research on seamounts of the North
Atlantic Ridge and adjacent areas. A review. Archive of Fishery and MarineResearch 51: 215–232.
12. Rogers AD (1994) The biology of seamounts. Advances in Marine Biology 30:
305–350.13. Morato T, Hoyle SD, Allain V, Nicol SJ (2010) Seamounts are hotspots of
pelagic biodiversity in the open ocean. Proc Natl Acad Sci USA 107: 9707–9711.
14. Smith KL Jr, Ruhl HA, Bett BJ, Billett DSM, Lampitt RS, et al. (2009) Climate,carbon cycling, and deep-ocean ecosystems. Proc Natl Acad Sci USA 106:
19211–19218.
15. Ganachaud A, Wunsch C (2002) Oceanic nutrient and oxygen transports andbounds on export production during the World Ocean Circulation Experiment.
Global Biogeochem Cycles 16:1057. doi:10.1029/2000GB001333.16. Rex MA, Etter RJ (2010) Deep-Sea Biodiversity, Pattern & Scale. Cambridge,
MA: Harvard University Press. 354 p.
17. St Laurent LC, Thurnherr AM (2007) Intense mixing of lower thermoclinewater on the crest of the Mid-Atlantic Ridge. Nature 448: 680–683
18. Taylor JR, Ferrari R (2011) Ocean fronts trigger high latitude phytoplanktonblooms. Geophys Res Lett 38: L23601.
19. O9Leary BC, Brown RL, Johnson DE, vonNordheim H, Ardron J, et al. (2012)The first network of marine protected areas (MPAs) in the high seas: The
process, the challenges and where next. Marine Policy 36: 598–605.
20. UNESCO (2009) Global Open Oceans and Deep Seabed (GOODS) –Biogeographic Classification. (IOC Technical Series, 84.) Paris: UNESCO-
IOC. 87 p.21. Rowden AA, Dower JF, Schlacher TA, Consalvey M, Clark MR (2010)
Paradigms in seamount ecology: fact, fiction and future. Marine Ecology 31
(Suppl. 1): 226–241.22. Read JF, Pollard RT, Miller PI, Dale AC (2010) Circulation and variability of
the North Atlantic Current in the vicinity of the Mid-Atlantic Ridge. Deep SeaRes Part 1 Oceanogr Res Pap 57: 307–318.
23. GEBCO (2010) General Bathymetric Chart of the Oceans, The GEBCO_08Grid. Liverpool: British Oceanographic Data Centre.
24. Wenneck TdeL, Falkenhaug T, Bergstad OA (2008) Strategies, methods, and
technologies adopted on the R.V. G.O. Sars MAR-ECO expedition to the Mid-Atlantic Ridge in 2004. Deep Sea Res Part 2 Top Stud Oceanogr 55: 6–28.
25. OSPAR (2008) Code of Conduct for Responsible Marine Research in the DeepSeas and High Seas of the OSPAR Maritime Area. OSPAR 08/24/1, Annex 6,
Reference number: 2008-1. OSPAR Convention for the Protection Of The
Marine Environment Of The North-East Atlantic. Available: http://www.ospar.org/. Accessed 2012 Dec 3.
26. Miller PI (2009) Composite front maps for improved visibility of dynamic sea-surface features on cloudy SeaWiFS and AVHRR data. J Mar Syst 78: 327–336.
27. Morel A (1991) Light and Marine Photosynthesis—a Spectral Model with
Geochemical and Climatological Implications. Prog Oceanogr 26: 263–306.28. Smyth TJ, Tilstone GH, Groom SB (2005) Integration of radiative transfer into
satellite models of ocean primary production. J Geophys Res Oceans: 110(C10).29. Tilstone GH, Smyth TJ, Poulton A, Hutson R (2009) Measured and remotely
sensed estimates of primary production in the Atlantic Ocean from 1998 to2005. Deep Sea Res Part 2 Top Stud Oceanogr 56: 918–930.
30. Heger A, Ieno EN, King NJ, Morris KJ, Bagley PM, et al. (2008) Deep-sea
pelagic bioluminescence over the Mid-Atlantic Ridge. Deep Sea Res Part 2 TopStud Oceanogr 55: 126–136.
31. Gillibrand EJV, Jamieson AJ, Bagley PM, Zuur AF, Priede IG (2007) Seasonaldevelopment of a deep pelagic bioluminescent layer in the temperate Northeast
Atlantic Ocean. Mar Ecol Prog Ser 341: 37–44.
32. GEBCO (2010) General Bathymetric Chart of the Oceans, The GEBCO_08
Grid. Liverpool: British Oceanographic Data Centre.
33. Mortensen PB, Buhl-Mortensen L, Gebruk AV, Krylova EM (2008) Occurrence
of deep-water corals on the Mid-Atlantic Ridge based on MAR-ECO data.
Deep Sea Res Part 2 Top Stud Oceanogr 55: 142–152.
34. Lampitt RS, Bett BJ, Kiriakoulis K, Popova EE, Ragueneau O, et al. (2001)
Material supply to the abyssal seafloor in the Northeast Atlantic. Prog Oceanogr
50: 27–63.
35. Lampitt RS, Salter I, deCuevas BA, Hartman S, Larkin KE, et al. (2010) Long-
term variability of downward particle flux in the deep north east Atlantic: Causes
and trends. Deep Sea Res Part 2 Top Stud Oceanogr 57: 1346–1361.
36. Flach E, Heip C (1996) Vertical distribution of macrozoobenthos within the
sediment on the continental slope of the Goban Spur area (NE Atlantic). Mar
Ecol Prog Ser 141: 55–66.
37. Hughes DJ, Gage JD (2004) Benthic metazoan biomass, community structure
and bioturbation at three contrasting deep-water sites along the NW European
continental margin. Prog Oceanogr 63: 29–55.
38. Wei C-L, Rowe GT, Escobar-Briones E, Boetius A, Soltwedel T, et al. (2010)
Global Patterns and Predictions of Seafloor Biomass Using Random Forests.
PLoS ONE 5: e15323. doi:10.1371/journal.pone.0015323.
39. Gordon JDM, Bergstad OA (1992) Species composition of demersal fish in the
Rockall Trough, north- eastern Atlantic, as determined by different trawls. J
Mar Biol Assoc U.K. 72: 213–230.
40. Bergstad OA, Menezes GMM, Høines AS, Gordon JDM, Galbraith JK (2012)
Patterns of distribution of deepwater demersal fishes of the North Atlantic mid-
ocean ridge, continental slopes, islands and seamounts. Deep Sea Res Part 1
Oceanogr Res Pap 61: 74–83.
41. Koppelmann R, Weikert H (1999) Temporal changes of deep-sea mesozoo-
plankton abundance in the temperate NE Atlantic and estimates of the carbon
budget. Mar Ecol Prog Ser 179: 27–40.
42. Roe HSJ (1988) Midwater biomass profiles over the Madeira Abyssal Plain and
the contribution of copepods. Hydrobiologia 167/168:169–181.
43. Webb TJ, Vanden Berghe E, O’Dor R (2010) Biodiversity’s Big Wet Secret: The
Global Distribution of Marine Biological Records Reveals Chronic Under-
Exploration of the Deep Pelagic Ocean. PLoS ONE 5(8): e10223. doi:10.1371/
journal.pone.0010223.
44. Priede IG, Godbold JA, King NJ, Collins MA, Bailey DM, et al. (2010) Deep-sea
demersal fish species richness in the Porcupine Seabight, NE Atlantic Ocean:
global and regional patterns. Mar Ecol 31: 247–260. 10.1111/j.1439-
0485.2009.00330.x.
45. Wolff GA, Billett DSM, Bett BJ, Holtvoeth J, FitzGeorge-Balfour T, et al. (2011)
The Effects of Natural Iron Fertilisation on Deep-Sea Ecology: The Crozet
Plateau, Southern Indian Ocean. PLoS ONE 6(6): e20697. doi:10.1371/
journal.pone.0020697.
46. Pollard RT, Salter I, Sanders RJ, Lucas MI, Moore CM, et al. (2009) Southern
Ocean deep-water carbon export enhanced by natural iron fertilization. Nature
457:577–581.
47. Opdal AF, Godø OR, Bergstad OA, Fiksen Ø (2008) Distribution, identity, and
possible processes sustaining meso- and bathypelagic scattering layers on the
northern Mid-Atlantic Ridge. Deep Sea Res Part 2 Top Stud Oceanogr 55: 45–
58.
48. Angel MV, Boxshall GA (1990) Life in the benthic boundary layer: connections
to the midwater and seafloor. Philos Trans R Soc Lond A 331: 15–28.
49. Sutton TT, Porteiro FM, Heino M, Byrkjedal I, Langhelle G, et al. (2008)
Vertical structure, biomass and topographic association of deep-pelagic fishes in
relation to a mid-ocean ridge system. Deep Sea Res Part 2 Top Stud Oceanogr
55: 161–184.
50. Craig J, Jamieson AJ, Bagley PM, Priede IG (2011) Naturally occurring
bioluminescence on the deep-seafloor. J Mar Syst 88: 563–567.
51. Priede IG, Osborn KJ, Gebruk AV, Jones D, Shale D, et al. (2012) Observations
on torquaratorid acorn worms (Hemichordata, Enteropneusta) from the North
Atlantic with descriptions of a new genus and three new species. Invertebr Biol
131: 244–257.
52. Gooday AJ, Rothe N, Pearce RB (2013). New and poorly-known benthic
foraminifera (Protista, Rhizaria) inhabiting the shells of planktonic foraminifera
on the bathyal Mid-Atlantic Ridge. Mar Biol Res. In press.
53. Knutsen H, Jorde PE, Bergstad OA, Skogen M (2012) Population genetic
structure in a deepwater fish Coryphaenoides rupestris: patterns and processes.
Mar Ecol Prog Ser 460: 233–246. doi: 10.3354/meps09728.
54. White TA, Stamford J, Hoelzel AR (2010) Local selection and population
structure in a deep-sea fish, the roundnose grenadier (Coryphaenoides rupestris).
Mol. Ecol. 19:216–226.
55. White TA, Fotherby HA, Stephens PA, Hoelzel AR (2011) Genetic panmixia
and demographic dependence across the North Atlantic in the deep-sea fish,
blue hake (Antimora rostrata). Heredity 106: 690–699. doi:10.1038/
hdy.2010.108.
56. Storch D, Keil P, Jetz W (2012) Universal species–area and endemics–area
relationships at continental scales. Nature 488: 78–81. doi:10.1038/nature
11226.
Mid-Ocean Ridge Biology
PLOS ONE | www.plosone.org 10 May 2013 | Volume 8 | Issue 5 | e61550
PDF compression, OCR, web optimization using a watermarked evaluation copy of CVISION PDFCompressor
Related Documents