DOCUMENT RESUME ED 469 504 JC 020 684 AUTHOR Luan, Jing; Borden, Richard C.; Cassada, Judy TITLE Cabrillo College Fact Book, 2001. INSTITUTION Cabrillo Coll., Aptos, CA. Office of Institutional Research. PUB DATE 2001-00-00 NOTE 98p.; "Cabrillo's Prospectus & Portfolio." Cover title varies. For the 1999-2000 Fact Book, see ED 451 829. PUB TYPE Numerical/Quantitative Data (110) Reports Research (143) EDRS PRICE EDRS Price MF01/PC04 Plus Postage. DESCRIPTORS College Outcomes Assessment; *College Planning; Community Colleges; Educational Assessment; *Educational Finance; *Institutional Characteristics; Self Evaluation (Groups); *Student Characteristics; Two Year College Students; Two Year Colleges IDENTIFIERS *Cabrillo College CA ABSTRACT This document presents resource and reference information on key aspects of Cabrillo College (California) operations. Topics addressed include governance, instruction, students, faculty, fiscal/budget issues, and facilities/services. Report highlights include: (1) unduplicated fall semester enrollment for 2001 was 13,672; (2) African-American students made up 1.4.% of enrollment, Asians 4.9%, Hispanic 22%, Native-American 1%, and White 66%; (3) in the spring of 2001, females made up 55% of enrolled students; (4) the median age of students in spring 2001 was 27; (5) 75% of students attended part-time; (6) total revenue in fiscal year 1999-2000 was $44,218,839; (7) total A.A. degrees awarded in 2000 -2001 were 429; and (8) total A.S. degrees awarded in 2000-2001 were 219. This report includes an organizational chart, a glossary, and numerous charts and graphs that detail student and faculty characteristics as well as college finances. (RC) Reproductions supplied by EDRS are the best that can be made from the original document.

Welcome message from author
This document is posted to help you gain knowledge. Please leave a comment to let me know what you think about it! Share it to your friends and learn new things together.
Transcript

DOCUMENT RESUME
ED 469 504 JC 020 684
AUTHOR Luan, Jing; Borden, Richard C.; Cassada, Judy
TITLE Cabrillo College Fact Book, 2001.
INSTITUTION Cabrillo Coll., Aptos, CA. Office of Institutional Research.PUB DATE 2001-00-00NOTE 98p.; "Cabrillo's Prospectus & Portfolio." Cover title
varies. For the 1999-2000 Fact Book, see ED 451 829.PUB TYPE Numerical/Quantitative Data (110) Reports Research (143)EDRS PRICE EDRS Price MF01/PC04 Plus Postage.DESCRIPTORS College Outcomes Assessment; *College Planning; Community
Colleges; Educational Assessment; *Educational Finance;*Institutional Characteristics; Self Evaluation (Groups);*Student Characteristics; Two Year College Students; Two YearColleges
IDENTIFIERS *Cabrillo College CA
ABSTRACT
This document presents resource and reference information onkey aspects of Cabrillo College (California) operations. Topics addressedinclude governance, instruction, students, faculty, fiscal/budget issues, andfacilities/services. Report highlights include: (1) unduplicated fallsemester enrollment for 2001 was 13,672; (2) African-American students madeup 1.4.% of enrollment, Asians 4.9%, Hispanic 22%, Native-American 1%, andWhite 66%; (3) in the spring of 2001, females made up 55% of enrolledstudents; (4) the median age of students in spring 2001 was 27; (5) 75% ofstudents attended part-time; (6) total revenue in fiscal year 1999-2000 was$44,218,839; (7) total A.A. degrees awarded in 2000 -2001 were 429; and (8)total A.S. degrees awarded in 2000-2001 were 219. This report includes anorganizational chart, a glossary, and numerous charts and graphs that detailstudent and faculty characteristics as well as college finances. (RC)
Reproductions supplied by EDRS are the best that can be madefrom the original document.

0
0
John I rd Jing LuanSuperintendent/President Director, Planning and Research
Jing Luan, Ph.D., [email protected] C. Borden, Ph.D., Research [email protected] Cassada, M.P.A., Institutional Research [email protected] Trimble, Graphic Designer
2001FACT BOOK(Cabrillo's prospectus & portfolio)
PERMISSION TO REPRODUCE ANDDISSEMINATE THIS MATERIAL HAS
BEEN GRANTED BY
TO THE EDUCATIONAL RESOURCESINFORMATION CENTER (ERIC)
1
U.S. DEPARTMENT OF EDUCATIONOffice of Educational Research and Improvement
EDUCATIONAL RESOURCES INFORMATIONCENTER (ERIC)
15.Jhis document has been reproduced asreceived from the person or organizationoriginating it.
Minor changes have been made toimprove reproduction quality.
Points of view or opinions stated in thisdocument do not necessarily representofficial OERI position or policy.
Planning and Research Office (PRO)6500 Soquel DriveAptos, CA 95003
831.479.5720 (voice)831.477.5250 (fax)
http://www.cabrillo.cc.ca.us/oir
BEST COPY AVAILABLE
2CABRILLO COLLEGE FACTBOOK 2001

©2001 Cabrillo College Planning and Research Office
Typeset with Page Maker 6.5.
Tables and charts made with Excel 2000 except for enrollment model fit, which was
made with SPSS 10.0.5.
Data extracted with Brio 6.0, Fox Pro 6.0, or Data Tel.
Data analyzed with SPSS 10.0.5 or Excel 2000.
Maps composed in Arc View 3.2.
Web version made with Dreamweaver 3.
11 CABRILLO COLLEGE FACTBOOK 2001 3

Welcome to the 2001 Cabrillo College Fact BookFor the most up-to-date Fact Book data, please visit:http://www.cabrillo.cc.ca.us/oir/factbook/fact.html
The Fact Book contains resource and reference information useful for the following:PlanningEnrollment managementGrant developmentMarketingProgram planningOutreachLearning outcome assessment, andPartnership for Excellence
The Fact Book helps faculty, staff, students and members of the college community better understandthe operations of the college in the following areas: 1) Governance, 2) Instruction, 3) Students, 4)Faculty, 5) Fiscal/Budget, and 6) Facilities/Services.
The contents and layout of this edition of the Fact Book are different from previous editions. We havedesigned the book based on the natural sequence of steps taken by the reader and his/her level ofinterest in the details. The last section of the book contains Learning Outcome and Program Planningdata, which used to be at the beginning of the book.
It is a very time consuming task to compile the Fact Book. Each chart or table is a study in itself. Wehave made every attempt to present the data as accurately as possible. If a reader spots an error orwould like to provide suggestions, please do not hesitate to contact the Planning and Research Office(PRO).
We would like to thank the following individuals for their support and dedication to publishing the FactBook. We would like to thank John Hurd, Claire Biancalana, Pegi Ard, Manuel Osorio, Bette Hirsch,Rock Pfotenhauer, and Loreen Easterly for their firm commitment to and support of planning andresearch at the college. Thanks also go to Kay Cardwell, Johanna Bowen, Gloria Garing, Al Holbert,Salvatoria Larter, Rachel Mayo, Donna Melds, Marylee Morrison, Richard Ross, Dana Eno-Price, DenaTaylor, and the entire Research Advisory Committee. The Director of the Planning and Research Officewould like to thank Richard Borden, Judy Cassada and Shirley Trimble for working beyond the call ofduty and excelling in everything they do. Special thanks go to Sue Haas, Marcy Weiland, and J. C. Firthfor providing the data, and Ray Rider and his crew for the wonderful service at a moment's notice. And,again, Shirley Trimble, we are proud of your accomplishments and your skills in digital media.
Jing Luan, Ph.D.Chief Planning and Research Officer
4 CABRILLO COLLEGE FACTBOOK 2001

SENIOR COLLEGE MANAGEMENT
John HurdClaire BiancalanaPegi ArdManuel OsorioBette HirschRock PfotenhauerLoreen EasterlySesario Escoto
Superintendent/President
Assistant Superintendent, Vice President, Instruction
Assistant Superintendent, Vice President, Business Services
Vice President, Student Services
Dean, Instruction, Transfer and Distance Education
Dean, Instruction, Career Education and Economic Development
Dean, Instruction, Student Development
Dean, Student Services
FACULTY, STAFF, AND STUDENT LEADERSHIP
David BaloghDebora BoneStephanie StainbackLiz Curtis
President, Faculty Senate
President, CCFT
President, SEIU
President, Student Senate
RESEARCH ADVISORY COMMITTEE
Jing Luan, ChairPegi ArdDavid BaloghClaire BiancalanaLoreen EasterlyGloria GaringBette HirschAl HolbertSue HoltJohn HurdBrad KreinManuel OsorioLiz CurtisRock Pfotenhauer
iv CABRILLO COLLEGE FACTBOOK 2001

Cabrillo Community College DistrictGoverning Board
Rebecca GarciaChair (Area V)
John Laird(Area IV)
John Leopold(Area III)
Gary Reece(Area II)
Alan Smith(Area VI)
Katy Stonebloom(Area VII)
Claudine Wildman(Area I)
Goran Klepic(Student Trustee)
John HurdSuperintendent/PresidentSeceretary To The Board
CABRILLO COLLEGE FACTBOOK 2001 V
CABRILLO COLLEGE ORGANIZATION CHART-2002Governing Board
PresidentJohn Hurd
x6306
Foundation
Equity andDiversity
x6491
Planning andResearch Office
x5720
Marketing andCommunications
x5744
V ice PresidentBusinessPegi Ard
x6406
Bookstorex6209
Business Servicesx5736
Duplicationsx6488
Purchasingx5270
Food Servicesx5270
Warehousex5046
Computing R srcx5046
Personnel/ HumanResources
x62I7
Facilities Dev.x5641
Safety & ProtectiveServicesx6468
Risk Managementx6406
Labor RelationsX6406
M aint & Opersx6465
VII CABRILLO COLLEGE FACTBOOK 2001
Vice PresidentStudent Services
M anuel Osoriox6527
TransportationM gmt Program
CounselingDivision
x6274
Dean of StudentServices
Sesario Escotox6525
Admissions &Recordsx62I3
Veteransx6208
Counselingx6274
Student Rights &Responsibilities
x6525
Financial Aidx5007
Puentex6541
E.0 .P.S.x6530
InternationalStudentsx6200
Scholarshipsx5007
Job PlacementCenterx6540
Healthx6435
Re-Entryx5629 Student Activities
x3508
Transfer Centerx6210 Student Senate
X3508
CAP
Custodialx5761
Groundsx6I43
Maintenancex5078
x5637
BEST COPY AVAIRAINA
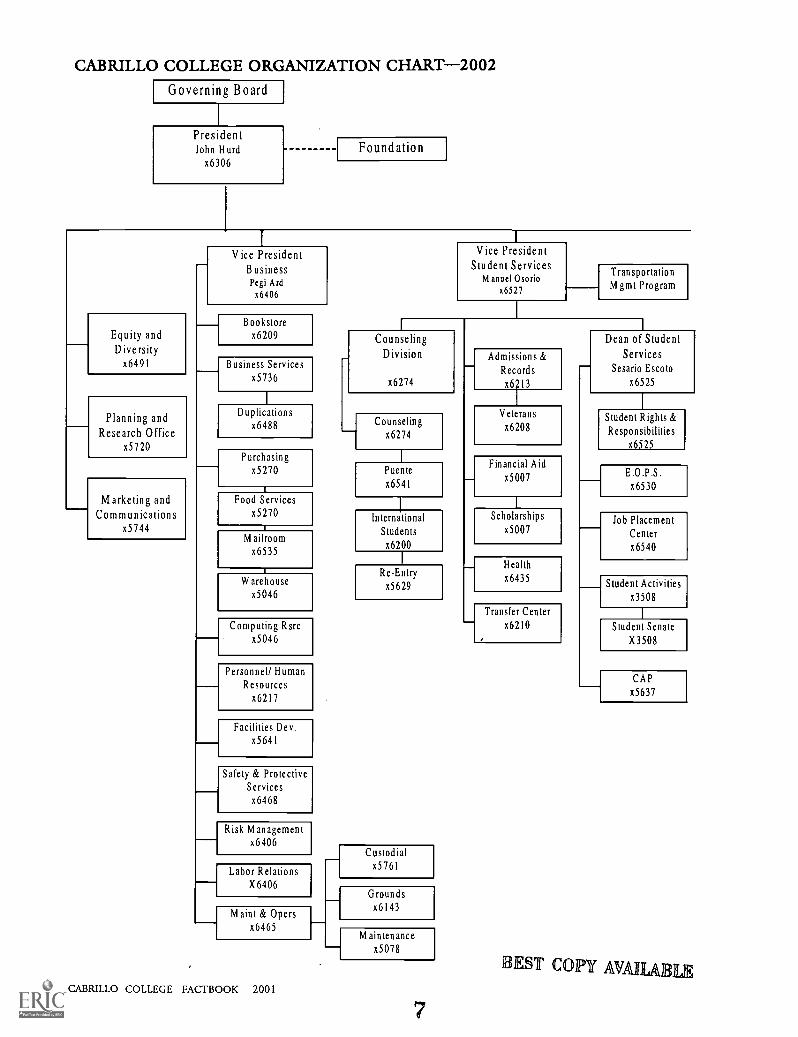
Vice PresidentInstruction
Claire Biancalanax645I
BCS
x6400
BEC HO
x6256
Englishx6424
FLA C
x6478
HASSx6348
1
Children's Centerx6352
Stroke Center425-0622
HPERDx6266
Athleticsx6149
Library & LearningResources
x6473
M SE
x6328
VAPAx6464
Galleryx6308
Theatrex6288
Watsonville Centerx5110
& LearningCenterx5031
Dean of InstrStudent DevLoreen Easterly
x6164
M atriculationx5768
Assessment
x6515
Disabled StudentServices
x6379
Fast Track to Workx6147
MESA
x6503
Tutorialsx6470
8
Dean of InstrTrans & Dist Ed
Bette Hirschx5075
Articulationx6272
Distance Educationx5030
Study Travelx6477
Schools Outreachx5760
Dean of InstrCareer Ed & Ec Dev
Rock Pfotenhauerx6482
CommunityEducation
x5701
Contract Educationx6481
EconomicDevelopment
x6481
VTEAx6481
Career Educationx6481
SB DC
x6136
Tech Prep/
School-to-Careerx5070
W ork Based Learninx5650
g
BEST COPY AVAHAIREE
CABRILLO COLLEGE FACTBOOK 2001 VII

GlossaryDIVISION CROSS-WALK
BCS HASSBusiness Computer Science Division Human Arts and Social Sciences
Accounting and Finance AnthropologyBusiness Applied Living ArtsBusiness Office Skills & Technology ArchaeologyComputer Information Systems Culinary ArtsDigital Media Early Childhood EducationReal Estate EconomicsSmall business Training Program Geography
GerontologyBECHO HistoryBiology, Environment, Chemistry, Meteorology
Health Occupations Philosophy
Allied Health Political Science
Biology Psychology
Chemistry Sociology
Construction & Energy Management Speech Communication
Dental Hygiene Stroke Center
Horticulture Women's Studies
Medical AssistantNursing HPERDRadio logic Technology Health, Physical Education, Recreation,
DanceCOUNSELING Adaptive Physical Education
Counseling AthleticsD
Counseling and GuidanceHealth Science
ENGLISH Physical EducationRecreation
EnglishEnglish LIBRARYEnglish as a Second LanguageJournalism Library
Libraryibrary
FLACForeign Language and Communication
Bilingual/Bicultural StudiesCriminal JusticeFire TechnologyLearning SkillsChineseFrenchGermanItalianJapaneseSpanishSign Language
Viii CABRILLO COLLEGE FACTBOOK 2001
MSEMath, Science & Engineering
AeronauticsAstronomyEngineeringEngineering TechnologyEnvironmental ScienceGeologyMathematicsOceanographyPhysicsWelding
VAPAVisual & Performing Arts
Art HistoryArt PhotographyArt StudioMusicTheater Arts
BEST COPY AVAELABILE

Programs and Cou ses Course Code Programs and Courses Course CodeAccounting (BCS) ACCT Geography (HASS) GEOGAdaptive Physical Education (HPERD) ADAPT Geology (MSE) GEOLAeronautics (MSE) AERO German (FLAC) GRMNAllied Health (BECHO) ALH Gerontology (HASS) GERONAnthropology (HASS) ANTHR Hazardous Materials Technology (FLAC) HMTApplied Living Arts (HASS) ALA Health Science (HPERD) HSArchaeological Technology (HASS) ARCHE History (HASS) HISTArt History (VAPA) AH Horticulture (BECHO) HORTArt Photography (VAPA) AP Humanities (ENGLISH) HUMANArt Studio (VAPA) ART Italian (FLAC) ITALAstronomy (MSE) ASTRO Japanese (FLAC) JAPANAthletics (HPERD) ATH Journalism (ENGLISH) JOURNBilingual/Bicultural Studies (FLAC) BBS Learning Skills (FLAC) LSBiology (BECHO) B I 0 Library (LIBRARY) LIBBusiness Office Skills and Technology (BCS) BOST Mathematics (MSE) MATHBusiness (BCS) BUS Medical Assistant (BCS) MAChemistry (BECHO) CHEM Meteorology (HASS) METEOChinese (FLAC) CHIN Music (VAPA) MUSComputer Information Systems (BCS) CIS Nursing (BECHO) NConstruction & Energy Management (BECHO) CEM Oceanography (MSE) OCEANCounseling and Guidance (CG) CG Philosophy (HASS) PHILOCriminal Justice (FLAC) CJ Physical Education (HPERD) PECulinary Arts & Hospitality Management (HASS) CAHM Physics (MSE) PHYSDance (HPERD) DANCE Political Science (HASS) PSDental Hygiene (BECHO) DH Psychology (HASS) PSYCHDevelopmental Studies (FLAC) DS Radiologic Technology (BECHO) RTDigital Media (BCS) DM Reading (ENGLISH) READEarly Childhood Education (HASS) ECE Real Estate (BCS) REEconomics (}{ASS) ECON Recreation (HPERD) RECEngineering (MSE) ENGR Sign Language (FLAC) SLSEngineering Technology (MSE) ETECH Small Business Training Program (BCS) SBUSEnglish (ENGLISH) ENGL Sociology (HASS) SOCEnglish as a Second Language (ENGLISH) ESL Spanish (FLAC) SPANEnvironmental Science (MSE) ES Speech Communications (HASS) SPCOMFinance (BCS) FIN Stroke Center (HASS) SCFire Technology (FLAC) FT Theatre Arts (VAPA) TAFoster Parent (HASS) FP Welding (MSE) WFrench (FLAC) FR Women's Studies (HASS) WS
DW Data Warehouse. Essential to research, planning, marketing, and executive decision making, a data warehouse providesthe critical data source, outside surveyed or aggregate data. It typically consists of a collection of data files with unitary dataelements either linked with a key or key variables or ready to be linked ad hoc with a relational database software program.
PEE Partnership for Excellence. It is a mutual commitment by the State of California and the California CommunityColleges system to significantly expand the contribution of the community colleges to the social and economic success ofCalifornia. It is structured in phases, with substantial financial investment by the State in exchange for a credible commitmentfrom the System to specific student and performance outcomes. Initiated in 1998 by the Chancellor's Office, it is a legislationdriven program aimed to improve both system goals and district specific goals in Transfer, Degree/Certificate, SuccessfulCourse Completion, Basic Skills, and Workforce Development.
AA African American
AI American Indian
WSCH Weekly Student Contact Hours. Referring to the Learning Outcome and Program Planning Data by Departmentby Academic Year (pages 60-87), it is a way of examining productivity via a cost per resource by unit. It is the count of the
number of hours per week that students are in attendance in a course.
FTES - Full Time Equivalent Student. Referring to the Learning Outcome and Program Planning Data by Department byAcademic Year (pages 60-87), WSCH divided by 525 and multiplied by 17.5, whichis the Term Length Multiplier defined as the number of weeks per semester.
FTEF Full Time Equivalent Faculty. Referring to the Learning Outcome and Program Planning Data by Department byAcademic Year (pages 60-87), it is the percentage of full-time equivalent faculty for a specific discipline.
EST COPY AVAIIIIABILE
10 CABRILLO COLLEGE FACTBOOK 2001 1.1X

In order to facilitate the search for data for various accountability and planninginitiatives, this Fact Book has built the following cross-walk references The pagenumbers on which the data is presented are in parentheses Not all areas arecovered by the Fact Book and each area may not be covered thoroughly Pleasecontact PRO or other affiliated offices for detailed information
A ID b ' I
-. . II" O. -
' . . 'ID ' IP' . '11 .
I: .1 :41 . 4 .1 :
. . . 4 . .
. op ID- es
Ii 11;'", A\ Ai! AIN r
t 11
Table of ContentsStudent Enrollment Counts and LoadEnrollment by Department by Division *Major by Department by Division *FTES by Department by Division *WSCH by Department by Division *Load Information by Department by Division *Wait list by Department by Division *
Unduplicated Fall Semester Enrollment 2
Actual and Projected Santa Cruz Public HighSchool Graduates Enrolling at Cabrillo 3
Ten-Year Enrollment Projection 4
Enrollment Projection by Ethnicity 5
Watsonville Enrollment Projection by Ethnicity 6
Enrollment History at Watsonville Center/Area 7
Student DemographicsSanta Cruz Public High School Graduates
Enrollment Rates at Cabrillo 8
Enrollment by Gender 9
Enrollment by Ethnicity 10
Demographics of First-Time Students 11
Enrollment by Age by Semester 12
Mean and Median Age of Students 13
Enrollment by Semester of Full & Part-TimeStudents 14
Santa Cruz Population Participation Rate 15
Enrollment by Semester 16
Educational Background 17
Enrollment by Student Status 18
Units Attempted 19
International Students 20
Enrollment by Zip Code 21
Students With Disability 22
Proportion of Students with a Bus Pass 23
Watsonville Center/Area Enrollment by Ethnicity 24Watsonville Center/Area Enrollment by Gender 25
Board of Governors Grant (BOGW) 26
Number of Financial Aid Recipients andApplicants 27
Student Expense Budget Worksheet 28
Comparison Between Full-Time Students' Initialand Informed Educational Goals 29
* Learning outcome and/or ProgramPlanning information can be found in thetables on pages 60-87
Student PerformanceSuccess & Retention by Department by Division *Degree & Certificate Awarded by Department by Division *Licensure Exam passing rates by Department by Division *Cabrillo Assessment of High School Students 30
Cabrillo Assessment Course Placements 31
Transfer and Basic Skills Course Enrollment 32
Vocational Courses 33
Degrees &CertificatesAwarded by Demography... ...... 34-35
Degrees &Certificates Awarded inOccupational Programs 36-37
Success and Retentionfor Pre-Collegiate Basic-Skills 38
Cabrillo Transfer Informationby Academic Years 39
Top-Ten Community Colleges for Transfer to UC 40Community Colleges that Sent the Largest Number
of Transfer Students to CSU 41
Faculty and StaffDistibution of Job Categories of Full-Time Staff Members . 42
Distribution of Ethnicity of All Full-TimeStaff Members 43-44
Classified Employee Ethnicity Informationby Calendar Year 45
Classified Employee Gender Informationby Calendar Year 46
Years of Service for Classified Employees 47Tenured or Tenure TrackFaculty by Ethnicity 48
Tenured Faculty Range by Academic Year 49Years of Employment of Tenured Faculty 50
Educational Background of Full-time Faculty 51
Facilities and BudgetApportionment FTES Counts 52
Budget Income Categories for 1998-1999 53
District Income 54
Robert Swenson Library Resources 55
Robert Swenson Library Circulation 56
Central Coast Small Business DevelopmentCenter Data 57
Cabrillo College Crime Statistics 58
Learning Outcome and Program PlanningData by Department by Academic Year(Input/Output Tables)How to Use Input/Output Tables 59
Cabrillo College Learning Outcomeand Program Planning Data by Departmentby Academic Year (Input/Output Tables) 60-87
12CABRILLO COLLEGE FACTBOOK 2001 1

Undu licated Fall Semester Enrollment at Cabrillok r
2001
200019991998
1997
136721
1.'596
;60437073767
1996 12761995 121291994 12751993 12581992 36961991 1 5001990 130 71989 130 31988 20871987 118621986 10801985 100551984 99531983 10671982 1 4581981 11 231980 109191979 7121978 8871977 92 61976 8981975 9001974 78911973 71 21912 68251971 61181970 58861969 48191968 39631967 3 451966 3061965 28431964 27161963 24311962 19441961 12 1
1960 1041959 789
0 2000 4000 6000 8000 10000 12000 14000 16000
Source: Data Warehouse (Enroll) and Fall 2001 Census
2 CABRILLO COLLEGE FACTBOOK 2001 13
EST COPY AVAILABLIR,

Actual and Pro'ected Santa Cruz Public HS Graduates Enrolling11111112011aboatniammemoil
3000
2500
2000
1500
1000
500
- - - - - * - * - - - .
0.-0-0- -0- -0- -0- -0- -0
0
rb <0 C3\c§b Ncp Ncp Nc3c3 cp0\ (b <0(159 opt
High School Graduates
Act grad 1% Chng
190
Graduates Enrolling at Cab
CC end 1% Chng
1736 673
1679 -3.3% 751 11.6%
1770 5.4% 782 4.1%
1899 7.3% 753 -3.7%
1909 0.5% 812 7.8%
2044 7.1% 901 11.0%
2191 7.2% 893 -0.9%
2276 3.9% 837 -6.3%
2305 1.3% 901 7.6%
2413 4.7% 930 3.3%
2429 0.7% 934 0.5%
2421 -0.3% 932 -0.2%
2396 -1.0% 925 -0.7%
2432 1.5% 935 1.1%
2536 4.3% 964 3.0%
2572 1.4% 973 1.0%
2595 0.9% 980 0.6%
2569 -1.0% 973 -0.7%
2502 -2.6% 954 -1.9%
112th grade Enrollment
N 1% Chng
1992-3 1796
1993-4 1766 -1.7%
1994-5 2047 15.9%
1995-6 2039 -0.4%
1996-7 2236 9.7%
1997-8 2278 1.9%
1998-9 2541 11.5%
1999-0 2668 5.0%
2000-1 2672 0.1%
2001-2 2782 4.1%
2002-3 2786 0.1%
2003-4 2763 -0.8%
2004-5 2720 -1.6%
2005-6 2741 1.0%
2006-7 2850 3.7%
2007-8 2816 0.9%
2008-9 2887 0.4%
2009-10 2844 -1.5%
2010-11 2756 -3.1%
Sources and Projection Assumptions:
Actual HSgrads
-o-- ActuallCabrilloenrollment
- Projected HSgrads
-o- - ProjectedCabrilloenrollment
Enrollment and Graduation Data are from California Department of Education(CDE) and California Department of Finance (DOF). High School GraduateProjections are from DOF. 12th grade Enrollment projections were based on the
significant correlation (R2 = 0.77) observed between H.S. graduates and H.S.graduate enrollment at Cabrillo observed from 92-93 to 99-00 by using theformula:
H.S. Grads Enrolling at Cabrillo = 0.273 x (DOF H.S. graduates) + 271.
1 4CABRILLO COLLEGE FAL I BOOK 3

20,000
18,000
16,000
14,000
12,000
10,000
8,000
6,000
4,000
2,000
Cabrillo Enrollment 10 Year Pro'ectionkvisfirim ,
xx xxx-
...o ...o ...ox
_o...0
Actualx Base Estimate
Current Trend0 Low Estimate
0
(4'` 4') d§3 (;\ q`b cf) o' og, Q?' dp do o' o °'.°qq000000 00000(le q. <7. (1, (1, rt, 61, (1 (I, (1,
Current =ase owYear Actual Trend Estimate Estimate
1993 12,5871994 12,7591995 12,1291996 12,7671997 13,5961998 13,7671999 13,7072000 13,6042001 14,296 *2002200320042005200620072008200920102011
14,504 14,621 14,52714,715 14,955 14,76314,930 15,297 15,00315,149 15,648 15,24715,371 16,008 15,49615,597 16,377 15,75015,826 16,756 16,00916,060 17,146 16,27216,298 17,545 16,54116,539 17,955 16,815
Source: Data Warehouse (1993-2000), Fall 2001 Census
Projection assumptions:(1) The Watsonville Center/Area will resume its 1993-2000 compound annual growth rate of 2.9% for 2002-2011.(2) The balance of the College (less Watsonville) will continue its 1993-2000 compound annual growth rate of 1.25%.
* Note: The Fall 1999 Census count came in at 95.6% of the end-of-term Data Warehouse actual count.Accordingly, the Fall 2001 Census count (N=13,672) was divided by 0.956 to approximate the Fall 2001 "actual".
** Note: The "Base" and "Low" estimates are derived from population growth and demand increases as projected bythe California Postsecondary Education Commission, which were partly based upon California Department ofFinance and U.S. Census Bureau data.
4 CABRILLO COLLEGE FACTBOOK 2001
15
12000
10000
8000
6000
4000
2000
0
Enrollment Projections 12y- EthnicityIIMEINIANZItte111111IMZIN
-r- TT TTT -n
(IP oir) ci (5 <0 (13\() \C<<V e e (ft 0 0 0 tz
African-American
-0-- Asian/Pacific Islander
Hispanic
Native American
-X- OtherWhite
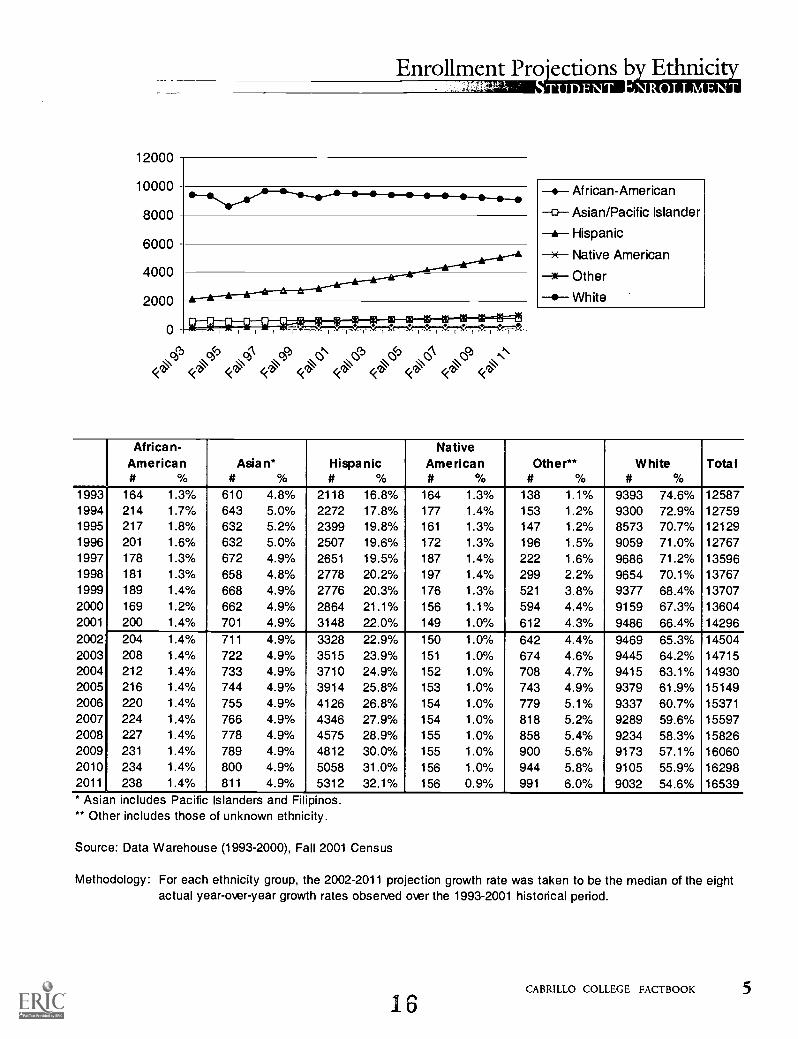
African-American# %
Asian*# %
Hispanic# %
NativeAmerican# %
Other**# %
White# %
Total
1993 164 1.3% 610 4.8% 2118 16.8% 164 1.3% 138 1.1% 9393 74.6% 125871994 214 1.7% 643 5.0% 2272 17.8% 177 1.4% 153 1.2% 9300 72.9% 127591995 217 1.8% 632 5.2% 2399 19.8% 161 1.3% 147 1.2% 8573 70.7% 121291996 201 1.6% 632 5.0% 2507 19.6% 172 1.3% 196 1.5% 9059 71.0% 127671997 178 1.3% 672 4.9% 2651 19.5% 187 1.4% 222 1.6% 9686 71.2% 135961998 181 1.3% 658 4.8% 2778 20.2% 197 1.4% 299 2.2% 9654 70.1% 137671999 189 1.4% 668 4.9% 2776 20.3% 176 1.3% 521 3.8% 9377 68.4% 137072000 169 1.2% 662 4.9% 2864 21.1% 156 1.1% 594 4.4% 9159 67.3% 136042001 200 1.4% 701 4.9% 3148 22.0% 149 1.0% 612 4.3% 9486 66.4% 142962002 204 1.4% 711 4.9% 3328 22.9% 150 1.0% 642 4.4% 9469 65.3% 145042003 208 1.4% 722 4.9% 3515 23.9% 151 1.0% 674 4.6% 9445 64.2% 147152004 212 1.4% 733 4.9% 3710 24.9% 152 1.0% 708 4.7% 9415 63.1% 149302005 216 1.4% 744 4.9% 3914 25.8% 153 1.0% 743 4.9% 9379 61.9% 151492006 220 1.4% 755 4.9% 4126 26.8% 154 1.0% 779 5.1% 9337 60.7% 153712007 224 1.4% 766 4.9% 4346 27.9% 154 1.0% 818 5.2% 9289 59.6% 155972008 227 1.4% 778 4.9% 4575 28.9% 155 1.0% 858 5.4% 9234 58.3% 158262009 231 1.4% 789 4.9% 4812 30.0% 155 1.0% 900 5.6% 9173 57.1% 160602010 234 1.4% 800 4.9% 5058 31.0% 156 1.0% 944 5.8% 9105 55.9% 162982011 238 1.4% 811 4.9% 5312 32.1% 156 0.9% 991 6.0% 9032 54.6% 16539* Asian includes Pacific Islanders and Filipinos.** Other includes those of unknown ethnicity.
Source: Data Warehouse (1993-2000), Fall 2001 Census
Methodology: For each ethnicity group, the 2002-2011 projection growth rate was taken to be the median of the eightactual year-over-year growth rates observed over the 1993-2001 historical period.
CABRILLO COLLEGE FAL IBOOK
165

Watsonville Enrollment Pro ections b Ethnici (Fall 2002-Fall 2011)WillITZTEI ttomenner
200018001600140012001000800600400200
0
---17
cb 6(6)Q<b <b, e <a<v <v- <, (C?P'
--s- African-American
-0- Asian/Pacific Islander
-36- Hispanic
x Native American
Other
-.- White
African-American# ok
Asian*# ok
Hispanic# %
NativeAmerican# %
Other**# ok
White# c/0
Total
1993 8 0.9% 35 3.8% 621 67.1% 3 0.3% 4 0.4% 255 27.5% 9261994 13 1.2% 48 4.4% 740 68.3% 6 0.6% 8 0.7% 268 24.7% 10831995 7 0.7% 34 3.2% 787 73.6% 12 1.1% 6 0.6% 223 20.9% 10691996 8 0.7% 44 3.9% 773 67.7% 14 1.2% 7 0.6% 295 25.9% 11411997 6 0.5% 45 3.6% 899 71.2% 11 0.9% 8 0.6% 294 23.3% 12631998 7 0.6% 35 2.9% 901 75.5% 10 0.8% 10 0.8% 230 19.3% 11931999 5 0.4% 50 4.1% 897 73.9% 9 0.7% 27 2.2% 225 18.5% 12132000 10 0.8% 35 2.7% 982 75.9% 6 0.5% 25 1.9% 235 18.2% 12932001 14 0.8% 49 2.7% 1283 69.8% 16 0.9% 37 2.0% 439 23.9% 18382002 16 0.8% 56 3.0% 1335 70.6% 16 0.8% 38 2.0% 432 22.8% 18922003 17 0.9% 64 3.3% 1387 71.2% 16 0.8% 39 2.0% 424 21.8% 19472004 19 1.0% 72 3.6% 1440 71.9% 16 0.8% 40 2.0% 417 20.8% 20042005 21 1.0% 82 4.0% 1493 72.4% 16 0.8% 41 2.0% 409 19.8% 20622006 24 1.1% 93 4.4% 1547 72.9% 16 0.7% 42 2.0% 400 18.9% 21222007 26 1.2% 106 4.8% 1602 73.3% 16 0.7% 43 2.0% 392 17.9% 21842008 29 1.3% 120 5.3% 1656 73.7% 16 0.7% 44 2.0% 383 17.1% 22482009 32 1.4% 135 5.8% 1710 73.9% 16 0.7% 46 2.0% 374 16.2% 23142010 35 1.5% 153 6.4% 1765 74.1% 15 0.7% 47 2.0% 365 15.3% 23812011 39 1.6% 173 7.0% 1818 74.2% 15 0.6% 49 2.0% 356 14.5% 2450* Asian includes Pacific Islanders and Fil pinos** Other includes those of unknown ethnicity
Source: Data Warehouse (1993-2000), Fall 2001 Census
Methodology: For each ethnicity group, the 2002-2011 projection growth rate was taken to be the median of the eightactual year-over-year growth rates observed over the 1993-2001 historical period.
6 CABRILLO COLLEGE FACTBOOK 200117

Enrollment History at Watsonville Center /Area (Fall 1987-Spring 20011asmazraMmtunommem
3
1400
1200
1000
800
600
400
200
0
S88 S89 S90 S91 S92 S93 S94
Students
S95 S96 S97 S98 S99 S00 SO1
ChangeF87 569
S88 559 -1.8%F88 703 25.8%S89 784 11.5%
F89 754 -3.8%
S90 797 5.7%F90 788 -1.1%
S91 851 8.0%F91 782 -8.1%
S92 855 9.3%
F92 837 -2.1%
S93 824 -1.6%F93 926 12.4%
S94 1035 11.8%F94 1083 4.6%
S95 1117 3.1%F95 1069 -4.3%S96 1200 12.3%
F96 1141 -4.9%S97 1274 11.7%F97 1263 -0.9%S98 1109 -12.2%F98 1193 7.6%S99 1241 4.0%F99 1213 -2.3%
S00 1240 2.2%FOO 1293 4.3%SO1 1272 -1.6%
Source: F87F92 Watsonville Center; S93-S01 Data Warehouse
18CABRILLO COLLEGE FACTBOOK 7

Santa Cruz Public Hi h School Graduates Enrollment RatesLITMTIMII 14 es
60.0%
50.0%
40.0%
30.0%
20.0%
10.0%
0.0%
44\ ,Z4 sZ`.4c\
PQ oc
\e,,1/49
*k.- Ar c .A c,fir o
1/41 C e
Zg&
oegob iN Soo
4.A
..,
Districts Schools
HS
Grads
95-96End'd
Cab Rate
96-97HS End'd
Grads Cab Rate
97-98HS EnrI'd
Grads Cab Rate
98-99HS EnrI'd
Grads Cab Rate
99-00HS End'd
Grads Cab Rate
Avg.
Rate
Pajaro Aptos HS 274 127 46.4% 287 163 56.8% 428 187 43.7% 427 184 43.1% 396 163 41.2% 46.2%Renaissance HS 43 11 25.6% 60 11 18.3% 69 21 30.4% 42 21 50.0% 62 8 12.9% 27.5%Watsonville HS 381 155 40.7% 358 160 44.7% 367 159 43.3% 382 150 39.3% 464 183 39.4% 41.5%total: 698 293 42.0% 705 334 47.4% 864 367 42.5% 851 355 41.7% 922 354 38.4% 42.4%
SLV S L V High 229 85 37.1% 212 90 42.5% 233 99 42.5% 240 95 39.6% 264 78 29.5% 38.2%Charter 12 0 0.0% 11 0 0.0% 11 0 0.0% 15 na na 24 0.0% natotal: 241 85 35.3% 223 90 40.4% 244 99 40.6% 255 95 37.3% 288 78 27.1% 36.1%
S. Cruz The Ark 59 26 44.1% 54 15 27.8% 76 24 31.6% 76 27 35.5% 41 12 29.3% 33.6%Harbor HS 254 103 40.6% 263 116 44.1% 279 149 53.4% 266 153 57.5% 260 122 46.9% 48.5%Loma Prieta HS 86 22 25.6% 86 19 22.1% 52 15 28.8% 71 16 22.5% 72 18 25.0% 24.8%Santa Cruz HS 242 112 46.3% 228 110 48.2% 217 110 50.7% 272 109 40.1% 259 92 35.5% 44.2%Soquel HS 254 112 44.1% 276 128 46.4% 241 137 56.8% 320 138 43.1% 331 161 48.6% 47.8%Delta Charter 4 0 0.0% 2 0 0.0% 9 na na 6 0.0% naAlt. Family 11 0 0.0% 8 0 0.0% 8 na na 8 0.0% natotal: 895 375 41.9% 922 388 42.1% 875 435 49.7% 1022 443 43.3% 977 405 41.5% 43.7%
Supt.OffJuvenile Hall 50 0 0.0% 60 0 0.0% 55 0 0.0% 54 0 0.0% 70 0.0% 0.0%total: 50 0 0.0% 60 0 0.0% 55 0 0.0% 54 0 0.0% 70 0.0% 0.0%
Grand Total 1884 753 40.0% 1910 812 42.5% 2038 901 44.2% 2182 893 40.9%f 2257 837 37.1%
Source: Data Warehouse, California Office of Education and California Department of Finance (till 1998)
notes:crosswalk - COE 96-97 = DW 975,977,983 = DW (SB11) 397.
na= not available
8 CABRILLO COLLEGE FACTBOOK 2001
1.9
Enrollment by Gender_MLA mu 03 Main am rote' tA :1 rem
60.0%
50.0%
40.0%
30.0%
20.0%
10.0%
0.0%
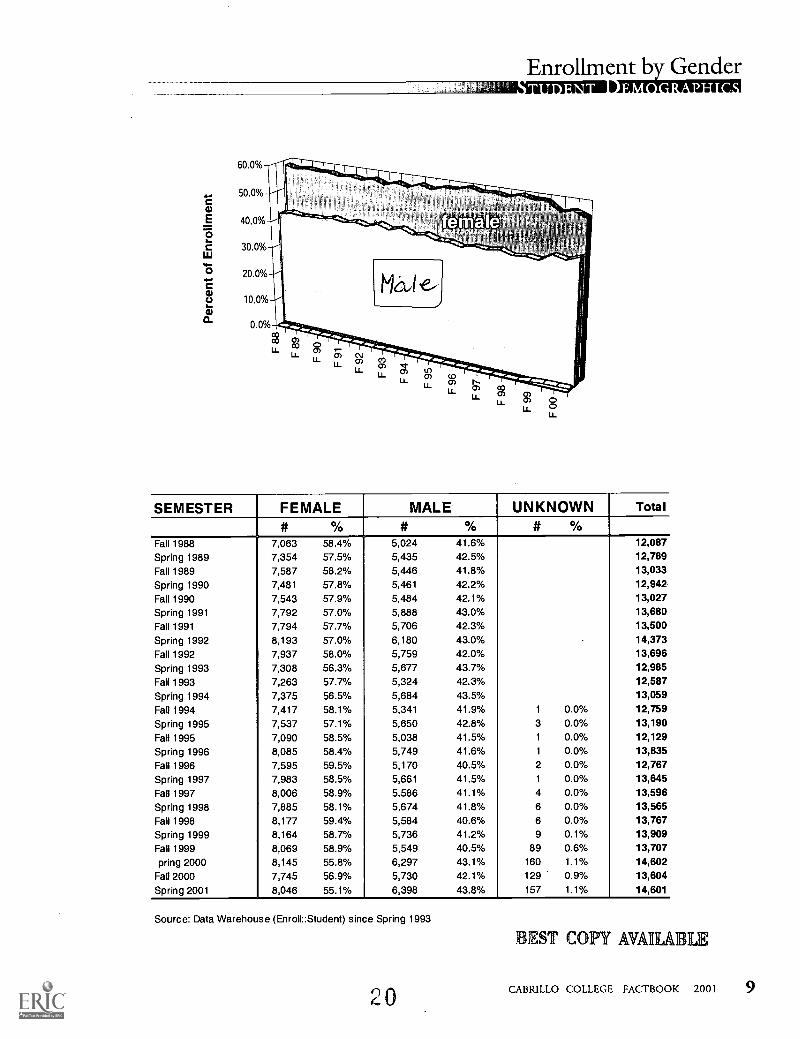
SEMESTER FEMALE MALE UNKNOWN Total
# % # % # %Fall 1988 7,063 58.4% 5,024 41.6% 12,087
Spring 1989 7,354 57.5% 5,435 42.5% 12,789
Fall 1989 7,587 58.2% 5,446 41.8% 13,033
Spring 1990 7,481 57.8% 5,461 42.2% 12,942.
Fall 1990 7,543 57.9% 5,484 42.1% 13,027
Spring 1991 7,792 57.0% 5,888 43.0% 13,680
Fall 1991 7,794 57.7% 5,706 42.3% 13,500
Spring 1992 8,193 57.0% 6,180 43.0% 14,373
Fall 1992 7,937 58.0% 5,759 42.0% 13,696
Spring 1993 7,308 56.3% 5,677 43.7% 12,985
Fall 1993 7,263 57.7% 5,324 42.3% 12,587
Spring 1994 7,375 56.5% 5,684 43.5% 13,059
Fall 1994 7,417 58.1% 5,341 41.9% 1 0.0% 12,759
Spring 1995 7,537 57.1% 5,650 42.8% 3 0.0% 13,190
Fall 1995 7,090 58.5% 5,038 41.5% 1 0.0% 12,129
Spring 1996 8,085 58.4% 5,749 41.6% 1 0.0% 13,835
Fall 1996 7,595 59.5% 5,170 40.5% 2 0.0% 12,767
Spring 1997 7,983 58.5% 5,661 41.5% 1 0.0% 13,645
Fall 1997 8,006 58.9% 5,586 41.1% 4 0.0% 13,596
Spring 1998 7,885 58.1% 5,674 41.8% 6 0.0% 13,565
Fall 1998 8,177 59.4% 5,584 40.6% 6 0.0% 13,767
Spring 1999 8,164 58.7% 5,736 41.2% 9 0.1% 13,909
Fall 1999 8,069 58.9% 5,549 40.5% 89 0.6% 13,707
pring 2000 8,145 55.8% 6,297 43.1% 160 1.1% 14,602
Fall 2000 7,745 56.9% 5,730 42.1% 129 0.9% 13,604
Spring 2001 8,046 55.1% 6,398 43.8% 157 1.1% 14,601
Source: Data Warehouse (Enroll::Student) since Spring 1993
IBIEST AVAHAIBLIE
CABRILLO COLLEGE FACTBOOK 2001 9

Enrollment by EthnicityLITIETZMITOiTaTIMTNIER..,
-0-- Other Minorities -0-- Hispanic White
15000
10000
5000ci)
0
* - r
B=8=e=s=e=9=8=8=9=8=8=9=E3=8=B
ce) C 5°je'413
,5 <fr k\Qj <fr\ <fr%
-0- African-American - - - 0- - - Native American-6-- Asian/Pacific Islander ---X- Filipino-0- Other
600
500
400
300
200
100
.
0 11111111111114) Afb4 4t S())4.3 4) .1,())6 CO SC)? \ \ '/411 C) SP4°) 4) .QQ'r 63 SP6\
<Z % i % i''' % % 'Z' % <Z* % <'Z' %'' Z' %
African-American
# %
Asian# %
Filipino# %
Hispanic# %
NativeAmerican
# %
Other# %
Unknown# %
White# %
Total#
Fall 1993 164 1.3 460 3.7 150 1.2 2118 16.8 164 1.3 135 1.1 3 0.0 9393 74.6 12,587Spring 1994 204 1.6 478 3.7 146 1.1 2247 17.2 155 1.2 129 1.0 4 0.0 9696 74.3 13,059Fall 1994 214 1.7 509 4.0 134 1.0 2272 17.8 177 1.4 150 1.2 3 0.0 9300 72.9 12,759Spring 1995 229 1.7 511 3.9 159 1.2 2439 18.5 180 1.4 145 1.1 4 0.0 9523 72.2 13,190Fall 1995 217 1.8 462 3.8 170 1.4 2399 19.8 161 1.3 134 1.1 13 0.1 8573 70.7 12,129Spring 1996 233 1.7 509 3.7 189 1.4 2551 18.5 184 1.3 161 1.2 27 0.2 9981 72.1 13,835Fall 1996 201 1.6 470 3.7 162 1.3 2507 19.6 172 1.3 172 1.3 24 0.2 9059 71.0 12,767Spring 1997 193 1.4 509 3.7 186 1.4 2623 19.2 184 1.3 200 1.5 18 0.1 9732 71.3 13,645Fall 1997 178 1.3 498 3.7 174 1.3 2651 19.5 187 1.4 181 1.3 41 0.3 9686 71.2 13,596Spring 1998 172 1.3 516 3.8 166 1.2 2614 19.3 180 1.3 198 1.5 62 0.4 9657 71.2 13,565Fall 1998 181 1.3 491 3.6 167 1.2 2778 20.2 197 1.4 196 1.4 103 0.7 9654 70.1 13,767Spring 1999 162 1.2 538 3.9 157 1.1 2705 19.5 196 1.4 193 1.4 130 0.9 9828 70.6 13,909Fall 1999 189 1.4 507 3.7 161 1.2 2776 20.3 176 1.3 200 1.5 321 2.3 9377 68.4 13,707Spring 2000 201 1.4 534 3.7 168 1.2 2959 20.3 187 1.3 226 1.5 328 2.2 9999 68.5 14,602Fall 2000 169 1.3 486 3.6 176 1.3 2864 21.6 156 1.1 216 1.6 378 2.8 9159 66.7 13,604Spring 2001 185 1.3 539 3.7 172 1.2 3047 20.9 177 1.2 236 1.6 452 3.1 9793 67.1 14,601Source: Data Warehouse (Enroll::Student)
10 CABRILLO COLLEGE FACTBOOK 2001
21

Age<21
21-25
26-30
31-40
41-50
51-60
61+
Enrollment of First Time StudentsA 1) NYA EMI ta
Age of First Time Students
First-time at a CollegeFA97 FA98 FA99 FA00'SP97 SP98 SP99 SPOO
First-time Transfer to CollegeSP97 SP98 SP99 SPOO FA97 FA98 FA99 FA00
304 273 303 319
496 548 506 412
275 274 244 233
346 310 300 305
250 251 236 227
107 100 116 134
59 57 53 31
Total
448 360 339 572 1301 1419 1509
235 206 198 213 230 221 198
140 114 97 119 151 137 95
186 140 150 193 207 153 135
127 109 94 123 128 112 95
49 26 26 31 32 45 41
32 21 21 27 21 32 21
1217 976 925 1278 2070 2119 2094
1416
236
126
176
107
32
11
142
443
305
316
257
137
71
119 138
389 412
278 262
284 274
222 242
122 127
70 67
180
385
234
269
209
132
51
2104 1671 1484 1522 1460 1837 1813 1758 1661
Ethnicity of First Time Students
EthnicityFirst-time at a College First-time Transfer to Cabrillo
SP97 SP98 SP99 SPOO FA97 FA98 FA99 FA00 SP97 SP98 SP99 SPOO FA97 FA98 FA99 FA00
AA 18 10 15 18 28 34 34 29 12 22 20 14 25 30 29 24
ASIAN 39 43 32 29 65 55 69 52 63 51 74 65 76 77 72 52
FILIPINO 13 11 7 13 27 25 23 27 31 17 20 21 28 20 30 25
HISPANIC 365 305 303 388 616 643 583 621 187 162 179 162 227 220 214 195
NAT AM 15 16 16 15 32 33 23 28 21 15 17 19 24 20 16 15
OTHER 22 12 13 27 20 29 30 40 35 15 21 32 26 28 31 39
PAC ISLE 3 8 4 9 14 9 13 12 6 6 5 5 6 7 4 8
UNKNOWN 1 7 21 737 11 30 32 1211 2 22 51 1075 15 39 58 1221
WHITE 741 564 514 48 1257 1261 1287 86 1314 1174 1135 70 1410 1372 1304 84
Total 1217 976 925 1284 2070 2119 2094 2106 1671 1484 1522 1463 1837 1813 1758 1663
Gender of First-Time Students
First-time at a College First-time Transfer to CabrilloGender SP97 SP98 SP99 SPOO FA97 FA98 FA99 FA00 SP97 SP98 SP99 SPOO FA97 FA98 FA99 FA00FEMALE 685 538 475 623 1130 1174 1124 1072 925 830 812 725 1033 1050 994 921
MALE 531 438 449 620 937 943 965 995 746 651 706 683 803 760 760 720
UNKNOWN 1 1 41 3 2 5 39 3 4 55 1 3 4 22
Total 1217 976 925 1284 2070 2119 2094 2106 1671 1484 1522 1463 1837 1813 1758 1663
Source: Data Warehouse (Students)
22CABRILLO COLLEGE FACTBOOK 2001 11
Enrollment by A e b SemesterLISMUM11
16000
14000
12000
10000
8000
6000
4000
2000
0S95 F95 S96 F96 S97 F97 S98 F98 S99 F99 SOO FOO SO1
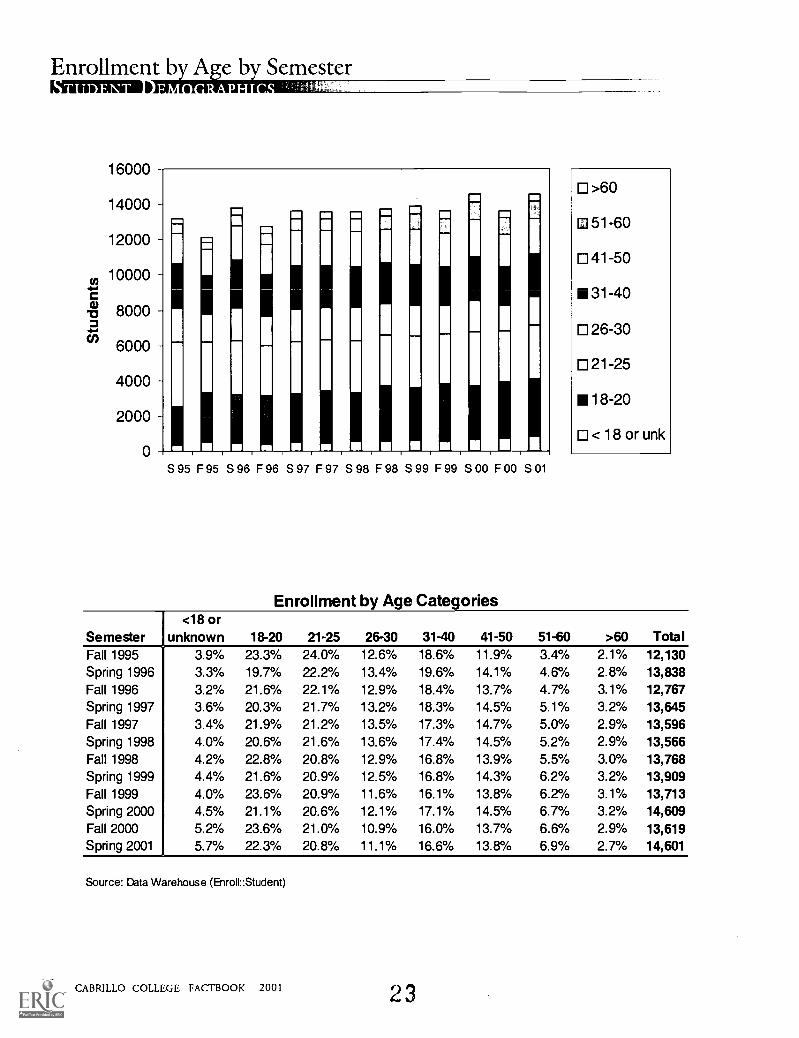
Enrollment by Age Categories
>60
51-60
41-50
131 -40
26-30
21-25
18-20
< 18 or unk
<18 orSemester unknown 18-20 21-25 26-30 31-40 41-50 51-60 >60 TotalFall 1995 3.9% 23.3% 24.0% 12.6% 18.6% 11.9% 3.4% 2.1% 12,130Spring 1996 3.3% 19.7% 22.2% 13.4% 19.6% 14.1% 4.6% 2.8% 13,838Fall 1996 3.2% 21.6% 22.1% 12.9% 18.4% 13.7% 4.7% 3. 1% 12,767Spring 1997 3.6% 20.3% 21.7% 13.2% 18.3% 14.5% 5.1% 3.2% 13,645Fall 1997 3.4% 21.9% 21.2% 13.5% 17.3% 14.7% 5.0% 2.9% 13,596Spring 1998 4.0% 20.6% 21.6% 13.6% 17.4% 14.5% 5.2% 2.9% 13,566Fall 1998 4.2% 22.8% 20.8% 12.9% 16.8% 13.9% 5.5% 3.0% 13,768Spring 1999 4.4% 21.6% 20.9% 12.5% 16.8% 14.3% 6.2% 3.2% 13,909Fall 1999 4.0% 23.6% 20.9% 11.6% 16.1% 13.8% 6.2% 3. 1% 13,713Spring 2000 4.5% 21.1% 20.6% 12.1% 17.1% 14.5% 6.7% 3.2% 14,609Fall 2000 5.2% 23.6% 21.0% 10.9% 16.0% 13.7% 6.6% 2.9% 13,619Spring 2001 5.7% 22.3% 20.8% 11.1% 16.6% 13.8% 6.9% 2.7% 14,601
Source: Data Warehouse (Enroll::Student)
12 CABRILLO COLLEGE FACTBOOK 2001 23

Mean and Median Age of Studentsmil WO A 6) MEM! MI I NM
mean 0 median
35
30
25
a) 20
`I 15
10
5
0S 96 F 96 S 97 F 97 S 98 F 98 S 99 F 99 S 00 F00 S 01
A g e
Semester mean medianSpring 1996 31.6 27.9Fall 1996 30.9 27.0Spring 1997 31.9 27.9Fall 1997 31.1 27.0Spring 1998 31.7 27.9Fall 1998 30.9 26.1Spring 1999 31.9 27.9Fall 1999 32.0 27.0Spring 2000 32.2 28.0Fall 2000 30.3 26.0Spring 2001 30.3 27.0Source: Data Warehouse (Enroll::Student)
24 CABRILLO COLLEGE FACTBOOK 2001 13

1
Enrollment b Semester of Full and Part-Time Students31 Ili= il I I I I I 14
100.0
90.0
80.0 I/ Part-time70.0 Full-time60.0
50.0
1!!!111!1 11-111 11
0. 40.0
30.0
20.0
10.0
0.0 I I 1 I I I 1 I
S94 F94 S95 F95 S96 F96 S97 F97 S98 F98 S99 F99 S00 F00 SO1
SEMESTER
FULL-TIME0/0
PART-TIME
Spring 1994 4,026 30.8 9,051 69.2
Fall 1994 4,144 8,640 67.6
Spring 1995 4,219 32.0 8,982 68.0
Fall 1995 3,995 32.9 8,161 67.1
Spring 1996 3,848 27.8 10,004 72.2
Fall 1996 3,891 30.4 8,903 69.6
Spring 1997 3,940 28.9 9,716 71.1
Fall 1997 3,959 29.1 9,651 70.9Spring 1998 3,827 28.2 9,749 71.8Fall 1998 4,124 29.9 9,659 70.1
Spring 1999 3,827 27.5 10,095 72.5Fall 1999 3,830 27.9 9,875 72.1
Spring 2000 3,666 25.1 10,960 74.9Fall 2000 3,884 28.5 9,747 71.5Spring 2001 3,678 25.2 10,929 74.8
Source: Cata Warehouse since Spring 1994
Full time >= 12 units
14 CABRILLO COLLEGE FACTBOOK 2001 25

Po ulation Participation RateLW/RV .111110120N dl 11):474 Wei MI 01 OM
120
100
80
60
40
20
0
93-94 94-95 95-96 96-97 97-98 98-99 99-00 00-01
Annual PPR:
0 Fall Term PPR:
93-94 94-95 95-96 96-97 97-98 98-99 99-00 00-0118+ County Residents 173875 176866 179856 182847 185838 188828 191819 194861Cabrillo Yearly E nrollm en 18546 18646 18299 19225 19819 19937 20540 21133Annual PPR: 107 105 102 105 107 106 107 108Cabrillo Fall Enrollment 12617 12785 12156 12794 13613 13791 13727 13635Fall Term PPR: 73 72 68 70 73 73 72 70
PPR: Population Participation Rate. It is usually expressed as the number of students enrolled at the college per 1,000
adults living in the service area, which is currently defined as the entire county. The current rate has been affected bythe population projections made from the 1990 census that resulted in a total county adult population of 183,236 w hen
in fact the census 2000 data reported a total of 194,861 adults in the county by 2000. Adjustments have been made tolinearly increase the lagging projections for the years leading up to 2000.
Data sources: Census Data from Geolytics Census 2000 CD and Enrollment data from Data Warehouse (ppr.bqy).
io,
26
EST COPY AVMLA LIE
CABRILLO COLLEGE FACTBOOK 2001 15

Enrollment by SemesterMITAMTMI 11)UM NMI ti 11 111F.
16,000
14,000
12,000
10,000
8,000
6,000
4,000
2,000
AcademicYear
Fall
EnrollmentSpring
Enrollment1983-84 10,673 10,484
1984-85 9,953 9,9451985-86 10,055 10,822
1986-87 10,804 11,527
1987-88 11,862 12,215
1988-89 12,087 12,789
1989-90 13,033 12,942
1990-91 13,027 13,680
1991-92 13,500 14,373
1992-93 13,696 12,988
1993-94 12,592 13,064
1994-95 12,762 13,192
1995-96 12,132 13,837
1996-97 12,768 13,6471997-98 13,598 13,569
1998-99 13,767 13,918
1999-00 13,718 14,616
2000-01 13,619 14,601
Sources:
Fall 1984 to Spring 1992 - R3cords/nsus Eta
Fall 1992 to Spring 2001 - Cate Warehouse (Enroll::Student)
16 CABRILLO COLLEGE FACTBOOK 2001 27

Educational Background,A1=111191 IA tor a I) tem wet :Moore:1
70.0%
60.0%
50.0%
40.0%
30.0%
20.0%
10.0%
0.0%
coc)
No HSconcur-rently
enrolledS94 5.9% 3.5%F94 6.3% 2.1%S95 6.2% 3.8%F95 6.0% 2.1%S96 5.7% 2.6%F96 5.8% 1.6%S97 5.6% 2.5%F97 5.3% 1.7%S98 5.3% 3.1%F98 5.2% 2.5%S99 5.1% 3.4%F99 4.7% 2.5%SOO 5.0% 4.2%F00 4.7% 4.7%SO1 4.5% 5.7%
;7.4 gam+V-1 1-r r--,
0) A 0 c5 0 'cb c5 0 0
-o- No HS
- ID- concurrentlyenrolled
-a- Adult School
- 0- HS diploma
o- GED
- ID- HS certificate
+- Foreign HS
-o- AA/AS
-36- BA+
Adult HS ForeignSchool diploma HS
GED HS cert. AA/AS BA+ Unknown Total
0.9% 63.0% 7.3% 2.3% 2.8% 4.4% 10.0% 13,0640.8% 63.9% 7.4% 2.5% 2.9% 4.6% 9.5% 12,7620.9% 62.2% 7.2% 2.7% 2.9% 4.6% 9.5% 0.01% 13,1921.0% 64.8% 7.4% 2.7% 3.0% 4.5% 8.6% 0.01% 12,1320.9% 57.3% 6.7% 2.3% 2.9% 4.8% 16.8% 13,8371.0% 60.2% 6.9% 2.4% 2.9% 4.6% 14.5% 12,7681.0% 56.9% 6.7% 2.3% 2.9% 5.1% 16.9% 0.01% 13,6471.0% 58.3% 6.9% 2.4% 2.8% 5.4% 16.2% 13,5980.9% 55.6% 6.7% 2.5% 2.8% 5.4% 17.6% 13,5690.8% 57.8% 6.7% 2.3% 2.8% 5.2% 16.6% 0.01% 13,7670.8% 55.6% 6.8% 2.3% 2.6% 5.1% 18.2% 0.00% 13,9180.7% 56.6% 6.6% 2.1% 2.5% 7.5% 16.8% 0.1% 13,7180.8% 53.3% 6.0% 2.1% 2.3% 7.7% 18.0% 0.7% 14,6150.7% 55.6% 5.6% 1.9% 2.2% 7.3% 16.7% 0.6% 13,6210.7% 53.8% 5.3% 1.8% 2.3% 7.6% 17.6% 0.6% 14,601
HS = high schoolSource: Data Warehouse (Enroll::Student)
The proportion of students with high school diplomas has shown a significant linear decline of 0.8% on averageper term since Spring 1994 while the proportion of students with college degrees has shown a significant linearincrease of 0.8% on average per term since Spring 1994.
28 CABRILLO COLLEGE FACTBOOK 2001 17

Enrollment by Student StatusLITMUS-MI) LI.
4C.
C)
a)a.
80
70
60
50
40
30
20
10
0ce341)c)^ 41, tn q),Ncb ,Nc3 NO)C5 b :6 A 4b
e e e .c ,c) i sc 3N e ,
oq oq o< oc, o9 ol ,q oq oc
19
co9
New
-0- ReturningContinuing
Semester New*# %
Returning**# %
Continuing# %
Spring 1989 2,845 22.2 2,838 22.2 7,106 55.6Fall 1989 3,936 30.2 3,015 23.1 6,082 46.7Spring 1990 2,586 20.0 2,582 20.0 7,774 60.1Fall 1990 3,823 29.3 3,037 23.3 6,167 47.3Spring 1991 2,734 20.0 2,764 20.2 8,182 59.8Fall 1991 3,771 27.9 2,729 20.2 7,000 51.9Spring 1992 2,654 18.5 2,811 19.6 8,908 62.0Fall 1992 3,459 25.6 2,659 19.7 7,411 54.8Spring 1993 2,382 18.8 1,859 14.7 8,413 66.5Fall 1993 3,387 28.0 2,087 17.3 6,620 54.7Spring 1994 2,296 18.5 2,024 16.3 8,105 65.2Fall 1994 3,551 29.0 2,054 16.8 6,647 54.3Spring 1995 2,296 18.5 2,024 16.3 8,105 65.2Fall 1995 2,999 26.8 1,826 16.3 6,370 56.9Spring 1996 2,794 20.8 2,554 19.0 8,075 60.2Fall 1996 3,282 26.9 2,375 19.5 6,534 53.6Spring 1997 2,631 20.3 2,388 18.5 7,923 61.2Fall 1997 3,650 27.8 2,662 20.3 6,823 51.9Spring 1998 2,326 17.9 2,358 18.2 8,305 63.9Fall 1998 3,670 28.0 2,664 20.3 6,793 51.7Spring 1999 2,289 16.7 2,440 17.8 8,509 62.1Fall 1999 3,626 26.9 2,393 17.8 7,346 54.5Spring 2000 2,747 18.8 1,218 8.3 10,187 69.7Fall 2000 3,769 27.7 949 7.0 8,440 62.0Spring 2001 3,143 21.5 980 6.7 9,971 68.3
Includes both first time and new transfers
*" Includes returning tranfers
Note: Unknow n/unreported excluded
Source: MIS report
Prior to Spring 2000, data were produced from the former computer system.DataTel/Colleague system is now being used. The two systems use differentdefinitions for this element, however, both comply with State MIS.
18 CABRILLO COLLEGE FACTBOOK 2001 29

Units Attempted732:11 II Mila I)NM NM MIa toR1
120,000
100,000
80,000
60,000
40,000
20,000
0
Positive Attendance -o- Full Term
F89 F90 F91 F92 F93 F94 F95 F96 F97 F98 F99 FOO
o Work Experience Independent Study Distance Education-0-- - - -A- - -
2000
1500
1000
500
0
. 4. 2 # - A, A"a
-. - 'A".. -A-A a a. a
I I I II IIIIIIIF89 F90 F91 F92 F93 F94 F95 F96 F97 F98 F99 F00
UNITS ATTEMPTEDSEMESTER Work Independent Positive Full Distance
Experience Study Attendance Term Education
Fall 1990 142 1,347 12,561 84,965
Spring 1991 120 1,690 13,229 95,567
Fall 1991 126 1,470 14,199 88,797
Spring 1992 88 1,455 14,314 90,748
Fall 1992 123 870 14,259 89,005
Spring 1993 217 775 16,163 80,394
Fall 1993 128 981 17,415 75,938
Spring 1994 158 1,173 19,733 76,537
Fall 1994 322 1,207 19,505 77,160
Spring 1995 361 1,540 20,472 75,513
Fall 1995 247 1,407 16,806 73,240
Spring 1996 256 1,451 19,569 73,032Fall 1996 238 1,450 19,785 70,227
Spring 1997 255 739 22,733 69,628 880Spring 1999 284 521 9,400 84,855 1,184Fall 1999 183 138 7,800 88,526 1,351
Spring 2000 198 375 8,595 85,797 834Fa112000 176 443 9,684 87,036 1,465Spring 2001 204 535 12,474 85,361 1,735
Source: State MIS Summary
CABRILLO COLLEGE FACTBOOK 2001 19v

International Students
COUNTRY Spring 00 Spring 017ntina 1 2
Belgium 2 1
Brazil 10 13Bulgaria 1 2
Canada 3 4
Chile 2
China 5 4
Croatia 0 1
Denmark 0 1
Dominican Republic 1 1
England 7 2France 8 6Gambia 1 1
Germany 9 8Hongkong 0 2India 2 1
Ireland 1 1
Israel 4 3Japan 46 58Kenya 3 2Korea 6 7Lebanon 0 1
Mexico 5 8Micronesi 0 1
Nepal 3 2Netherland 2 2New Zealand 1 1
Norway 2 3Peru 2 2Philippines 0 1
Russia 0 3South Africa 1 1
Spain 3 3Sweden 3 3Switzerland 2 2Taiwan 5 9Thailand 2 3Turkey 1 1
Uganda 2Ukraine 1 1
Unknown 6 12
Total 164 183Source: International Student Office
20 CABRILLO COLLEGE FACTBOOK 2001
International Students (Spring 01)student count
0 20 40 60 80
Argentina
Belo. ]
Brazil
Bulgala 3
ococth DChile 3China M
Coda 3
Denmcrk 3
DorrinlocnReputlic ]
Englund 0
France =Gcrrtia ]
err --1Hongkong
Inc la ]
Ireland ]
Israel D
J won
Kenya 3Kaea =
Letatn ]
Mexico =Maenad ]
Need 3
Netherland 3NewZeciond ]
Norway D
Peru 3
PNlippines ]
Russia D
South Africa)
Span ..n
Sweden _n
SwItzerlond .3
Taw= 1
T hcilcnd D
Turkey 3
Ugtncb 0Ukrcine ]
Unknown
3I
BEST COPY AVAILABLE

Students by Zip Code
Book:ler Creek
ettossloa inco nad a
Ben Lom9nd
San Jose
CampbellSaratoga
Cambrian Park
Monte Se ranoLos Gatos
o Scotts VellayFelton 0 rr,-'
Day Valey
SOT!. CAptos Corralitoso live Oak
Santa CruznL
) tots()
'Twin Aptos Hills-Larkin Valley.
0 InterlakenFreedom
Watsonyill
Student Counts Pajito
1 - 102
O 103 375
o 376 - 1803
O 1804 - 3997
o 3998 8439
Morgan
San Malin
Gltoy
Zip Students I Zip Students Zip Students
95076 8439 95 02 3 264 93905 54
95060 6634 95 07 7 249 95030 51
95062 5927 95 063 236 93933 49
95003 3997 95 00 1 231 95037 48
95073 21 52 95 03 3 182 95045 35
95 010 1803 95 04 1 155 95124 34
95066 14 97 95 01 2 144 93955 33
95065 11 86 95 064 137 94960 32
95018 1046 95 02 0 124 94060 32
95005 957 95 007 123 95476 31
95006 873 93 90 6 115 94 558 29
95 019 845 95 01 7 102 93 901 29
95061 375 95 06 7 74 95032 25
95004 341 95 03 9 62 95959 25
93 907 272 93 94 0 56 95482 23
Source: Data Warehouse
32
Mar'
Castr. Ile
as
ElkhornPrune dale
Salinas
San uanBautista
BEST COPY MAMA to
CABRILLO COLLEGE FACTBOOK 2001 21

Students with DisabilitiesFMTMEMIII13
45.0%
40.0%
35.0%
30.0%
25.0%
20.0%
15.0%
10.0%
5.0%
0.0%6 ,., 6
.4"_42'6 e
e .QQ, ,e e0: 4 (`C) 4
`Z \(1' tib
Principal DisabilityAcq. Brain Inj.Dev. DelayedHearing ImpairedLearning DisabledMobility ImpairedOther DisabilityPsych. DisabilitySpeech/Lang.lm p.Visually ImpairedTotal
Source: Data Warehouse
6:c'\ A 26,, ':: °\\ 2>k\e i ,s,,tb P \(Cs
Q
':'\ sC5N r. ,,,c4 (b.
CV°Ce 'e _.6) -4\
O _NY .)co
ercoq
Fall 1996 Fall 1997Count Col % Count Col %
156 15.0% 192 16.6%98 9.5% 102 8.8%16 1.5% 20 1.7%
378 36.5% 414 35.8%197 19.0% 205 17.7%
55 5.3% 77 6.7%
118 11.4% 129 11.1%
6 0.6% 6 0.5%13 1.3% 12 1.0%
1,037 1,157
22 CABRILLO COLLEGE FACTBOOK 2001
Fall 1998 Fall 1999 Fall 2000 99-00Count Col % Count Col % Count Col % % change
173 14.2% 183 15.4% 174 14.7% -4.9%179 14.7% 189 15.9% 132 11.1% -30.2%
18 1.5% 18 1.5% 17 1.4% -5.6%421 34.5% 410 34.5% 455 38.3% 11.0%213 17.4% 188 15.8% 177 14.9% -5.9%
73 6.0% 81 6.8% 81 6.8% 0.0%
117 9.6% 132 11.1% 132 11.1% 0.0%3 0.2% 5 0.4% 6 0.5% 20.0%
13 1.1% 15 1.3% 13 1.1% -13.3%1,210 1,221 1,187 -2.8%
33

Proportion of Students with a Bus PassEAMINvanomoral MMORItaltnorefzi
12%
10%
8%
6%
4%
2%
0%Fall 1998 Spring 1999 Fall 1999 Spring 2000 Fall 2000 Spring 2001
Semester Bus Passes EnrollmentPercent withBus Passes
Bus Passchange
Enrollmentchange
Fall 1998 1,596 13,783 11.6%Spring 1999 1,650 13,922 11.9% 3.4% 1.0%Fall 1999 1,531 13,719 11.2% -7.2% -1.5%Spring 2000 1,412 14,612 9.7% -7.8% 6.5%Fall 2000 1,495 13,010 11.5% 5.9% -11.0%Spring 2001 1,470 14,601 10.1% -1.7% 12.2%
Source: Student Services and Data Warehouse
34 CABRILLO COLLEGE FACTBOOK 2001 23

Watsonville Center/Area Enrollment by Ethnicity (Fall 1993 Spring 2001)LITMTNEMBITTiralTAMTMONI_
1200
1000
800
v° 600
400
200
4-- LATINO
a WHITEo OTHER
0 I 1 I I 1 1 I 1 I I
F93 S94 F94 S95 F95 S96 F96 S97 F97 S98 F98 S99 F99 S00 F0O SOl
African-
American Asian' Latino
Native
American Olher White Total
F93 8 35 621 3 4 255 926S94 9 46 709 4 3 264 1,035F94 13 48 740 6 8 268 1,083S95 6 43 790 8 3 267 1,117F95 7 34 787 12 6 223 1,069S96 12 34 859 13 6 276 1,200F96 8 44 773 14 7 295 1,141S97 10 27 911 16 9 301 1,274F97 6 45 899 11 8 294 1,263S98 6 42 811 13 7 230 1,109F98 7 35 901 10 10 230 1,193S99 4 37 910 8 12 270 1,241F99 5 50 897 9 27 225 1,213SOO 6 32 955 4 28 215 1,240FOO 10 35 982 6 25 235 1,293SO1 6 24 1,022 4 28 188 1,272* Asian includes Pacific Islanders and Filipinos
Source: Data Warehouse
24 CABRILLO COLLEGE FACTBOOK 2001 35
Watsonville Center/Area Enrollment by Gender Fall 1993 -Spring 2001)inPI MN DJ :118 I MN
1000
900
800
700
22 600C
-10 500
400
300
200
100
WALE FEMALE
111111111141111F93 S94 F94 S95 F95 S96 F96 S97 F97 S98 F98 S99 F99 S00 F00 SO1
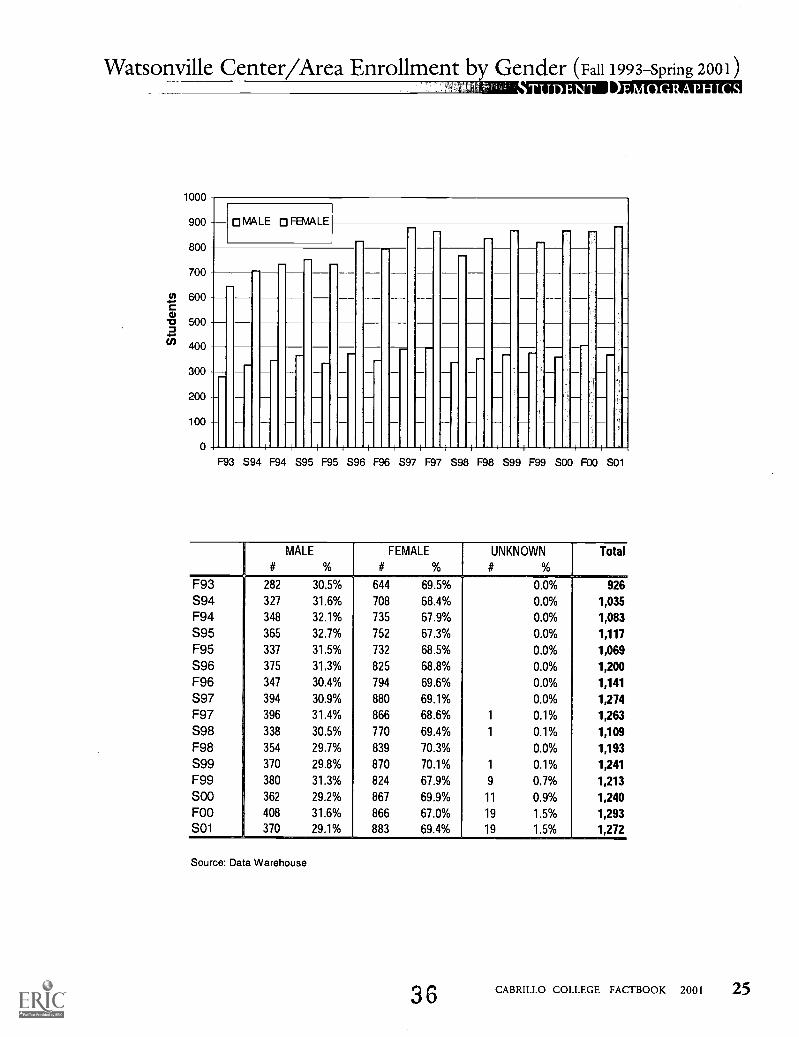
#
MALE
%
FEMALE
# %
UNKNOWN
# %
Total
F93 282 30.5% 644 69.5% 0.0% 926
S94 327 31.6% 708 68.4% 0.0% 1,035
F94 348 32.1% 735 67.9% 0.0% 1,083
S95 365 32.7% 752 67.3% 0.0% 1,117
F95 337 31.5% 732 68.5% 0.0% 1,069
S96 375 31.3% 825 68.8% 0.0% 1,200
F96 347 30.4% 794 69.6% 0.0% 1,141
S97 394 30.9% 880 69.1% 0.0% 1,274
F97 396 31.4% 866 68.6% 1 0.1% 1,263
S98 338 30.5% 770 69.4% 1 0.1% 1,109
F98 354 29.7% 839 70.3% 0.0% 1,193
S99 370 29.8% 870 70.1% 1 0.1% 1,241
F99 380 31.3% 824 67.9% 9 0.7% 1,213
SOO 362 29.2% 867 69.9% 11 0.9% 1,240
FOO 408 31.6% 866 67.0% 19 1.5% 1,293SO1 370 29.1% 883 69.4% 19 1.5% 1,272
Source: Data Warehouse
36 CABRILLO COLLEGE FACTBOOK 2001 25

Board of Governor's Grant BOGW)wimsErmagnman.
1998-1999 1999-2000# of Total $
Recipients Amount# of Total $
Recipients Amount
BOGW-ABOGW-BBOGW-C
585
1,372
2,691
$74,961
$199,985
$562,145
547
1,159
2,626
$67,260
$152,596
$511,381
TOTAL 4,603 $837,091 4,332 $731,237
1999-2000 CAL Grant A Reserve:Number of recipients: 377
1999-2000 CAL Grant B:Number of recipients: 171
Total amount: 184743
1999-2000 CAL Grant C:Number of recipients: 56Total amount: $22,935
1999-2000 Subsidized Loans:Number of recipients: 347Total amount: $943,418
1999-2000 Unsubsidized Loans:Number of recipients: 155Total amount: $25,146
1999-2000 Plus Loans:Number of recipients: 5Total amount: $25,146
1999-2000 Total Loans:Number of recipients: 363Total amount: $1,442,006
PELL Grant Awards: 1998-99 1999-2000Number of recipients: 1,767 1,555Total amount: $3,086,970 $2,807,212
Source: Financial Aid
26 CABRILLO COLLEGE FACTBOOK 2001 37
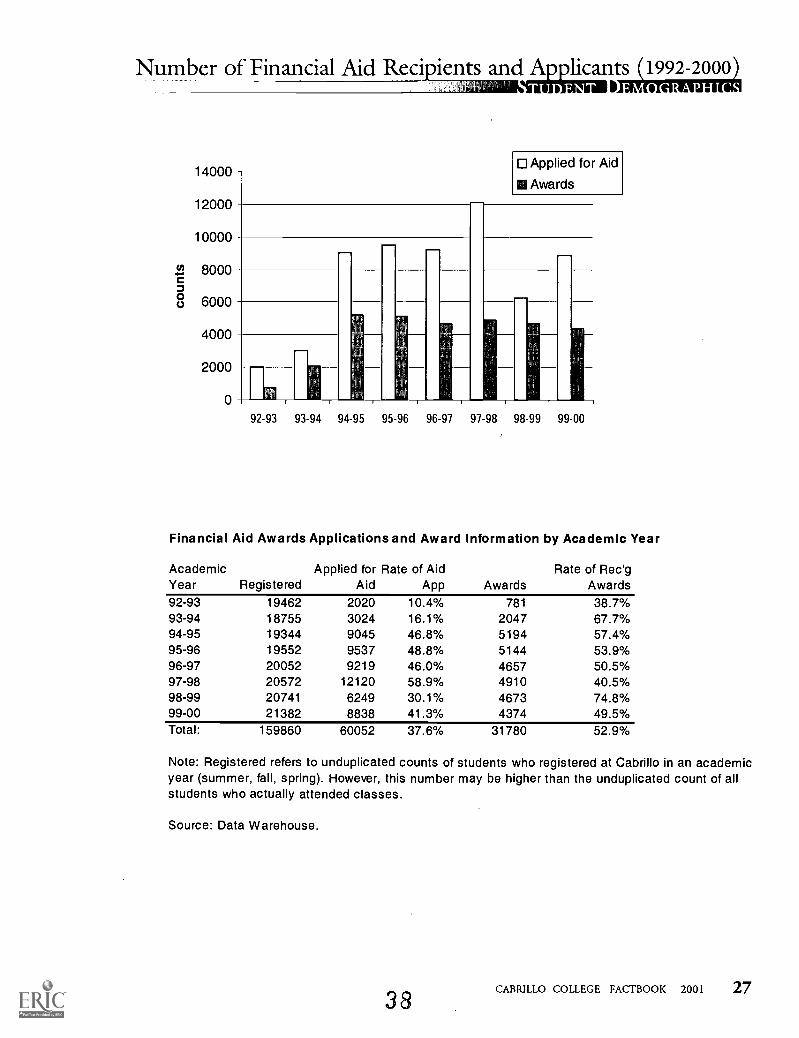
Number of Financial Aid Recipients and Applicants (1992-2000). Nam Ortitaltint 1
14000
12000
10000
800038 6000
4000
2000
0
Applied for Aid
II Awards
r--
92-93 93-94 94-95 95-96 96-97 97-98 98-99 99-00
Financial Aid Awards Applications and Award Information by Academic Year
Academic Applied for Rate of Aid Rate of Rec'gYear Registered Aid App Awards Awards92-93 19462 2020 10.4% 781 38.7%93-94 18755 3024 16.1% 2047 67.7%94-95 19344 9045 46.8% 5194 57.4%95-96 19552 9537 48.8% 5144 53.9%96-97 20052 9219 46.0% 4657 50.5%97-98 20572 12120 58.9% 4910 40.5%98-99 20741 6249 30.1% 4673 74.8%99-00 21382 8838 41.3% 4374 49.5%Total: 159860 60052 37.6% 31780 52.9%
Note: Registered refers to unduplicated counts of students who registered at Cabrillo in an academicyear (summer, fall, spring). However, this number may be higher than the unduplicated count of allstudents who actually attended classes.
Source: Data Warehouse.
38CABRILLO COLLEGE FACTBOOK 2001 27

Student Expense Budget Worksheet (Nine Months)
2001 2002
California ResidentAt Home
AwayFrom Home
Enrollment Fee 308 308Health Fee 24 24Student Center Fee 10 10Books/Supplies 846 846Food/Housing 2,592 8,046Transportation 756 846Personal/Miscellaneous 1,719 1,800Total: $6,257 $11,882
Non California ResidentAdditional $130 per unit 3,752 3,752Total Non-resident Exp: $10,009 $15,634
Enrollment fees are based on 14 units per semester at $11/unit, revised Fall 2001.Food/Housing formula:
33% Food $277/month x 9 = $2,49367% Housing $617/month x 9 = $5,553
REASONABLE DEPENDANT CHILD CARE/DISABILITY EXPENSESmay be included as part of the student expense budget provided that appropri-ate written documentation is submitted. For dependant care, submit documen-tation of expenses, including the number and ages of dependant(s). Disabledstudent: submit proof of expenses not paid by any other agency.
Source: Financial Aid Office
28 CABRILLO COLLEGE FACTBOOK 2001
39

First-Time Students' Initial and Informed Educational GoalsIIIlSIOMNI II) NM NM ti I' I WA
40.0
35.0
30.0
25.0
20.0
15.0
10.0
5.0
0.0 r(es
co \.io
KO'lot't1
Comparison Between First-time Students' Initial EducationalGoal and Their Informed Goal a Semester Later
(Most recent semesters)
FOO INITIAL GOAL
SO1 INFORMED GOAL
r rin 1 1 rin r- fin
,<Z e ,q<<, 4, \., cp ," ,s<<, 0<,e,N- \, 0- 4 p
co gsq \'' \ 0 CO N' (<5> 4° c'C'N' e*0 0 e/ ,s.q''. 46- 'R\'
<zr 4e ,xe d ) \) I-g\...r,,/
C". S 4:0'
C,
Spr98 Fall 98 Fall 98 Spr99 Spr99 Fall 99 Fall 99 Spr 00 Spr 00 Fall 00 Fall 00 Spr 01EDUCATIONAL GOALS INI INF INI INF INI INF INI INF INI INF INI INF
AA/AS w/o TRANS 4.8 6.2 3.8 5.2 4.5 4.8 4.5 4.9 2.8 4.7 2.6 3.3AA/ASN w/o TRANS 1.9 1.4 3.0 1.9 2.9 3.2 2.1 2.0 2.1 1.3 0.4 1.0BA/BS w/ AA/AS 26.5 24.8 41.7 35.0 21.9 23.0 41.9 41.3 18.5 20.2 30.7 30.6BA/BS w/0 AA/AS 9.5 7.4 8.8 8.2 5.3 5.9 8.4 8.4 3.4 7.2 6.4 7.1BASIC SKILLS 2.9 3.3 2.3 3.4 6.1 5.9 3.5 3.2 5.1 4.7 3.0 3.6CAREER PLANS 7.6 11.7 8.6 12.7 8.8 9.1 6.1 6.1 4.9 3.6 4.2 4.2CERT w/o TRANS 3.3 4.3 2.7 2.4 2.4 2.1 1.0 1.0 1.5 1.9 1.1 0.7GED/HSCH 1.7 1.2 0.7 1.1 1.3 1.3 3.8 3.9 10.0 3.2 4.3 2.5LEISURE 9.8 8.4 6.4 5.8 14.2 11.5 7.5 5.4 6.2 4.2 5.3 2.2LICENSE 2.4 1.7 1.2 1.4 0.3 0.3 0.9 0.9 0.8 1.7 1.2 1.1
SKILLS 11.2 10.7 8.5 9.0 14.7 14.2 6.4 6.3 7.4 5.5 3.8 3.9UNDECIDED 13.4 14.3 9.1 11.2 9.4 8.0 11.6 14.4 30.6 36.1 35.2 37.4UNKNOWN 1.2 0.0 1.4 0.8 1.1 0.8 0.8 0.8 1.9 1.9 0.5 0.4UPDATE 3.8 4.5 1.8 1.9 7.0 7.0 1.3 1.3 4.9 3.8 1.3 1:9NOT APPLICABLE 0.0 0.0 0.0 0.1 0.0 2.9 0.0 0.1 0.0 0.0 0.0 0.1
Total % 100 100 100 100 100.0 100.0 100.0 100.0 100.0 100.0 100.0 100.0Total # 419 1396 374 1279 471 1348
INI=Initial goal : the educational goal a first-time student selects when enrolling.
INF=Informed goal : the educational goal a student selects in the second semester (after being a first-time student for one semester).
Source: Data Warehouse
40 CABRILLO COLLEGE FACTBOOK 2001 29

Cabrillo College Assessment of High School StudentsNMSTEMPINIMIONI
Santa Cruz County High Schools in February and March 2001
MATH PLACEMENTS ENGLISH PLACEMENTSMath Basic Elem Int Trans Engl Basic AA/AS UC/CSU
High School Totals Re-test Math Algebra Algebra Math Totals English Level Level
Aptos 96 31 32% 21 22% 9 9% 28 29% 7 7% 95 38 40% 50 52% 7 7%The Ark 7 0 0 4 57% 3 43% 0 0 0 0 6 5 83% 1 17% 0 0Harbor 29 4 14% 5 17% 1 3% 6 21% 13 45% 31 8 26% 21 67% 2 6%Loma Priem 15 1 7% 7 47% 6 40% 1 7% 0 0 15 4 27% 11 74% 0 0Renaissance 12 6 50% 5 42% 0 0 1 8% 0 0 12 10 83% 2 17% 0 0San Lorenzo Vly 38 4 11% 4 11% 8 21% 19 50% 3 8% 43 3 7% 35 81% 5 11%Santa Cruz 47 10 21% 10 21% 2 4% 22 47% 3 6% 47 10 21% 34 72% 3 6%Soquel 66 8 12% 11 17% 9 14% 20 30% 18 27% 66 13 20% 42 63% 11 17%Watsonville 60 25 42% 9 15% 6 10% 19 32% 1 2% 58 18 31% 39 67% 1 2%
Totals 370 89 24% 76 21% 44 12% 116 31% 45 12% 373 109 29% 235 63% 29 8%
In addition to test scores, placement considers multiple measures, students' self reported educational backgrounds and plans.
Santa Cruz County High Schools in February and March 2000
I MATH PLACEMENTS ENGLISH PLACEMENTSMath
TotalsBasic Elem Int Trans Engl Basic AA/AS
Level
UC/CSU
Level
High School Re-test Math Algebra Algebra Math Totals English
Aptos 82 11 13% 26 32% 11 13% 24 29% 10 12% 82 20 24% 47 57% 15 18%The Ark 18 2 11% 10 56% 5 28% 1 6% 0 0 18 4 22% 14 78% 0 0Harbor 77 0 0 13 17% 5 6% 24 31% 35 45% 78 11 14% 58 74% 9 12%Loma Prieta 13 0 0 9 69% 4 31% 0 0 0 0 15 12 81% 3 20% 0 0Renaissance 13 0 0 9 69% 3 23% 1 7% 0 0 12 8 67% 4 33% 0 0San Lorenzo Vly 40 8 20% 4 10% 7 18% 18 45% 3 8% 40 0 0 31 78% 9 23%
Santa Cruz 32 6 18% 3 9% 8 24% 11 36% 4 12% 32 5 16% 22 68% 5 16%Soquel 52 3 6% 4 8% 11 21% 16 31% 18 35% 52 12 23% 32 61% 8 15%Watsonville 121 12 10% 76 63% 15 12% 16 13% 2 2% 107 48 44% 53 50% 6 7%
Totals 448 42 9% 154 34% 69 15% 111 25% 72 161% 436 120 28% 264 61% 52 12%
Math retest (11%) numbers are included in the total numbers but the percentage is not listed.English total number includes eighteen students (3% or zero to five per high school) who were recommendedfor ESL assessment.In addition to test scores, placement considers mulitple measures, the students' self reported educationalbackgrounds and plans.
Source: Assessment Center
30 CABRILLO COLLEGE FACTBOOK 2000-2001 41

Reading
Cabrillo College Assessment Course Placementstiammonia
255 205/206 100 52 ReadingFall 1996 t 242 11% 401 18% 583 27% 969 44% 2,195Spring 1997 108 11% 196 20% 269 27% 428 43% 1,001
Fall 1997 244 12% 400 20% 562 28% 813 40% 2,019Spring 1998 86 10% 181 21% 240 28% 350 41% 857
Fall 1998 227 10% 480 21% 671 29% 907 40% 2,285Spring 1999 83 11% 157 21% 212 29% 287 39% 857Fall 1999 278 13% 400 18% 452 21% 1,049 48% 2,179Spring 2000 130 17% 143 19% 138 18% 361 46% 772
Fall 2000 414 20% 463 22% 514 25% 702 33% 2.093Spring 2001 113 16% 118 16% 146 20% 343 48% 720
ESL200 100 or 111 1 /2 or 10 3 /4 or 20 Adult Ed Engl ESL
Fall 1996 86 45% 67 35% 57 33% 21 11% 66 22% 295Spring 1997 49 26% 36 18% 49 26% 24 13% 34 17% 192
Fall 1997 51 26% 42 22% 47 24% 21 11% 17 9% 15 8% 193
Spring 1998 31 20% 26 17% 31 20% 8 5% 14 9% 42 28% 152Fall 1998 46 25% 49 26% 53 28% 27 15% 5 3% 6 3% 186
Spring 1999 37 26% 27 19% 40 28% 21 15% 8 6% 8 6% 141
Fall 1999 48 25% 44 23% 56 30% 22 12% 14 7% 5 3% 189Spring 2000 63 35% 34 19% 39 22% 14 8% 24 13% 6 3% 180
Fall 2000 52 28% 43 23% 48 26% 34 18% 1 1% 7 4% 185
Spring 2001 32 26% 33 27% 33 27% 19 15% 0 5 4% 122
Math255 or 254 154 152 Transf Math Retest Math
Fall 1996 708 28% 1,081 43% 517 20% 234 9% 2,541
Spring 1997 455 37% 506 42% 174 14% 81 7% 1,216Fall 1997 656 29% 882 38% 451 19% 236 10% 73 3% 2,298Spring 1998 402 39% 392 38% 134 13% 74 7% 37 4% 1,039Fall 1998 803 31% 863 34% 493 19% 286 11% 122 5% 2,567Spring 1999 392 41% 331 34% 127 13% 78 8% 36 4% 964Fall 1999 999 42% 615 26% 379 16% 340 14% 38 2% 2,371Spring 2000 434 48% 238 26% 139 15% 57 6% 46 5% 914
Fa112000 767 33% 624 27% 494 21% 291 13% 127 6% 2,303Spring 2001 352 42% 173 21% 166 20% 77 9% 55 7% 823
English255 or 290 100 1A ESL Referral English
TotalsFall 1996 286 13% 1,289 57% 636 28% 34 2% 2,245Spring 1997 150 15% 577 56% 263 26% 33 3% 1,023Fall 1997 387 19% 1,345 64% 332 15% 49 2% 2,113Spring 1998 197 21% 553 61% 140 15% 20 2% 910Fall 1998 496 21% 1,382 59% 418 18% 35 2% 2,331Spring 1999 155 19% 468 56% 161 19% 39 5% 923Fall 1999 493 23% 1,308 59% 395 18% 32 1% 2,228Spring 2000 218 25% 450 52% 143 16% 53 6% 864Fa112000 482 23% 1,268 60% 311 15% 61 3% 2,122Spring 2001 208 27% 443 59% 112 15% 0 0 763
CABRILLO COLLEGE FACTBOOK 2000-2001 3142

Transfer and Basic Skills Course Enrollment and SuccesskwiTismorimutrraw.:
Transfer Courses by Academic Years (Summer 1997-Spring 2001)
SU97 FA97 SP98 97-98 SU98 FA98 SP99 98-99 SU99 FA99 SPOO 99-00 SUO0 FA00 SPO1 00-01
A 1168 8402 8738 18308 1186 8936 9262 19384 1135 8715 8797 18647 1508 8291 8599 18743B 512 4448 4609 9569 516 4783 4813 10112 586 4719 4686 9991 545 4309 4657 9679C 231 2353 2404 4988 210 2396 2403 5009 268 2412 2256 4936 239 2327 2410 5046CR 298 2244 2414 4956 230 2613 2842 5685 383 2785 3095 6263 468 2614 3118 6304D 44 524 541 1109 43 570 546 1159 45 540 486 1071 56 526 487 1085F 48 671 706 1425 60 719 758 1537 29 719 571 1319 51 692 706 1453NC 99 1994 2176 4269 147 2527 2449 5123 135 2669 2784 5588 276 2757 2771 5836W 269 4633 4241 9143 250 3963 4103 8316 265 4953 4991 10209 370 5386 4746 10606Total 2669 25269 25829 53767 2642 26507 27176 56325 2846 27512 27666 58024 3513 26902 27494 58752
Success I 83% 69% 70% 70% 81% 71% 71% 71% 83% 68% 68% 69% 79% 65% 68% 68%Retentior 90% 82% 84% 83% 91% 85% 85% 85% 91% 82% 82% 82% 89% 80% 83% 82%
Transfer Course definition: Transfer status = A or BIF, XX, UD, UG, RD grades not includedSource: Data Warehouse
Basic Skills Course Success and Retention by Academic Year (Summer 1997 to Spring 2001)
SU97 FA97 SP98 97-98 SU98 FA98 SP99 98-99 SU99 FA99 SPOO 99-00 SUO0 FA00 SPO1 00-01
A 91 86 177 148 150 298 36 141 142 319 49 144 153 351B 39 44 83 114 105 219 15 92 66 173 20 104 112 238C 29 13 42 51 44 95 2 37 38 77 3 54 47 107CR 240 1175 802 2217 172 821 702 1695 134 1254 995 2383 262 1198 1033 2511D 5 4 9 15 10 25 9 7 16 15 10 25F 3 1 4 10 10 20 7 8 15 23 9 32NC 40 307 215 562 12 289 251 552 29 343 335 707 69 346 233 649W 22 462 288 772 23 249 339 611 51 386 448 885 45 515 411 981Count 302 2111 1453 3866 207 1697 1611 3515 267 2269 2039 4575 448 2399 2008 4894
Success 79% 63% 65% 65% 83% 67% 62% 66% 70% 67% 61% 65% 75% 63% 67% 66%Retentio 93% 78% 80% 80% 89% 85% 79% 83% 81% 83% 78% 81% 90% 79% 80% 80%
Basic Skills Course definition: CB08 = P or B and CB09 = D or EFA98 data extracted by course title, due to coding change for that semesterSource: Data Warehouse
32 CABRILLO COLLEGE FACTBOOK 2000-2001 43
Vocational Courses Enrollment and Success
Vocational Education Courses by Academic Year (Summer 1997 to Spring 2001)
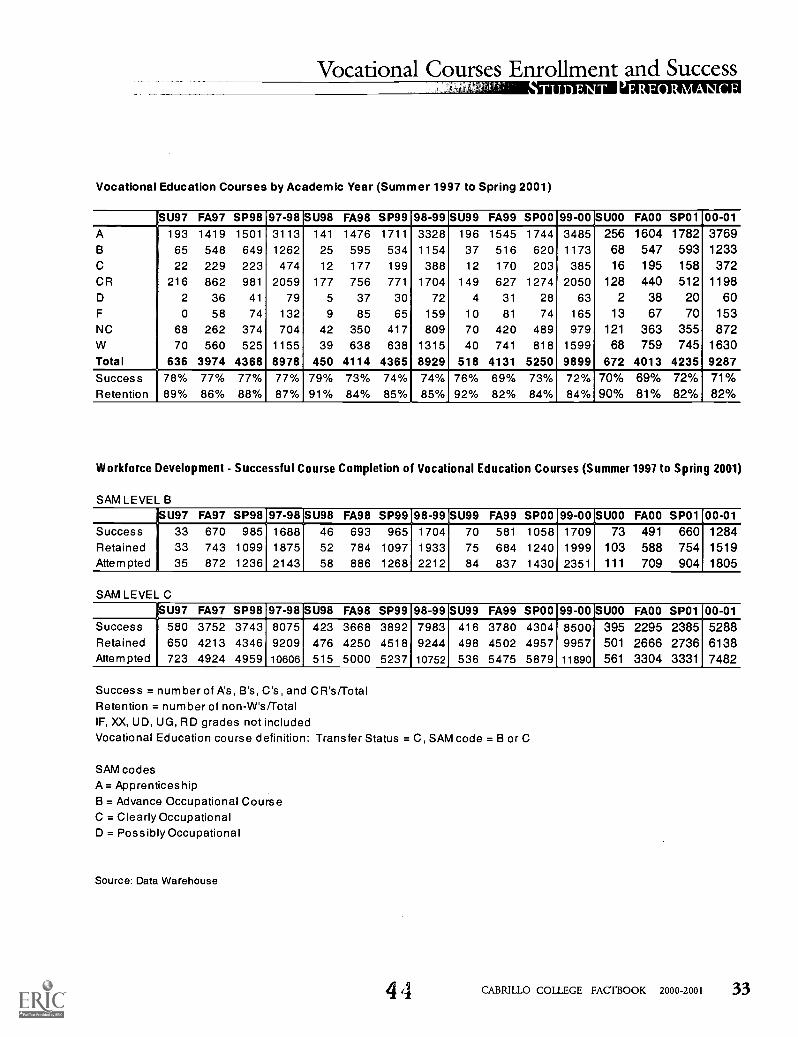
SU97 FA97 SP98 97-98 SU98 FA98 SP99 98-99 SU99 FA99 SPOO 99-00 SUO0 FA00 SPO1 00-01A 193 1419 1501 3113 141 1476 1711 3328 196 1545 1744 3485 256 1604 1782 3769B 65 548 649 1262 25 595 534 1154 37 516 620 1173 68 547 593 1233C 22 229 223 474 12 177 199 388 12 170 203 385 16 195 158 372CR 216 862 981 2059 177 756 771 1704 149 627 1274 2050 128 440 512 1198D 2 36 41 79 5 37 30 72 4 31 28 63 2 38 20 60F 0 58 74 132 9 85 65 159 10 81 74 165 13 67 70 153NC 68 262 374 704 42 350 417 809 70 420 489 979 121 363 355 872W 70 560 525 1155 39 638 638 1315 40 741 818 1599 68 759 745 1630Total 636 3974 4368 8978 450 4114 4365 8929 518 4131 5250 9899 672 4013 4235 9287Success 78% 77% 77% 77% 79% 73% 74% 74% 76% 69% 73% 72% 70% 69% 72% 71%Retention 89% 86% 88% 87% 91% 84% 85% 85% 92% 82% 84% 84% 90% 81% 82% 82%
Workforce Development - Successful Course Completion of Vocational Education Courses (Summer 1997 to Spring 2001)
SAM LEVEL BSU97 FA97 SP98 97 -98 SU98 FA98 SP99 98-99 SU99 FA99 SPOO 99-00 SUO0 FA00 SPO1 00-01
Success 33 670 985 1688 46 693 965 1704 70 581 1058 1709 73 491 660 1284Retained 33 743 1099 1875 52 784 1097 1933 75 684 1240 1999 103 588 754 1519Attempted 35 872 1236 2143 58 886 1268 2212 84 837 1430 2351 111 709 904 1805
SAM LEVEL CSU97 FA97 SP98 97-98 SU98 FA98 SP99 98-99 SU99 FA99 SPOO 99-00 SUO0 FA00 SPO1 00-01
Success 580 3752 3743 8075 423 3668 3892 7983 416 3780 4304 8500 395 2295 2385 5288Retained 650 4213 4346 9209 476 4250 4518 9244 498 4502 4957 9957 501 2666 2736 6138Attempted 723 4924 4959 10606 515 5000 5237 10752 536 5475 5879 11890 561 3304 3331 7482
Success = number of A's, B's, C's, and CR's/TotalRetention = number of non-W'sfrotalIF, XX, UD, UG, RD grades not includedVocational Education course definition: Transfer Status = C, SAM code = B or C
SAM codesA= ApprenticeshipB = Advance Occupational CourseC = Clearly OccupationalD = Possibly Occupational
Source: Data Warehouse
44 CABRILLO COLLEGE FACTBOOK 2000-2001 33

Degrees and Certificates Awarded by Demographyti
DEGREES AND CERTIFICATES AWARDEDchange from
93-94 94-95 95-96 96-97 97-98 98-99 99-00 00-01 99/00 to 00/01*AA 210 274 288 329 361 364 407 429 22ASAS 222 217 255 226 223 228 198 219 21
CERTIFICATE 115 143 102 109 108 100 94 88 -6
TOTAL 547 634 645 664 692 692 699 736 37* NOT IN THE REST OF THE TABLES.
A.A. DEGREES AWARDED BY ETHNICITY BY YEAR1995-96
# %1996-97
# %1997-98
# %1998-99
# %1999-00
# %2000-01
# %Last 2 yr% Chng
AFRICAN AMERICAN t 6 2.1% 4 1.2% 6 1.7% 1 0.3% 5 1.2% 6 1.4% 20.0%ASIAN 17 5.9% 24 7.3% 21 5.8% 19 5.3% 18 4.5% 17 4.0% -5.6%FILIPINO 5 1.2% 6 1.4% 20.0%HISPANIC 47 16.3% 75 22.9% 63 17.5% 67 18.6% 67 16.6% 79 18.4% 17.9%NATIVE AMERICAN 6 2.1% 5 1.5% 6 1.7% 3 0.8% 4 1.0% 6 1.4% 50.0%OTHER 3 1.0% 3 0.9% 5 1.4% 9 2.5% 11 2.7% 7 1.6% -36.4%UNKNOWN 1 0.3% 0 0.0% 1 0.3% 4 1.1% 11 2.7% 6 1.4% -45.5%WHITE 208 72.2% 217 66.2% 258 71.7% 258 71.5% 283 70.0% 302 70.4% 6.7%Total: 288 100.0% 328 100.0% 360 100.0% 361 100.0% 404 100.0% 429 100.0% 6.2%
A.S. DEGREES AWARDED BY ETHNICITY BY YEAR1995-96
# %1996-97
# %1997-98
# %1998-99
# %1999-00
# %2000-01
# %Last 2 yr% Ch ng
AFRICAN AMERICAN 3 1.2% 2 0.9% 1 0.5% 2 0.9% 1 0.5% -100%ASIAN 14 5.5% 18 8.0% 13 5.9% 21 9.3% 17 8.5% 11 5.0% -35.3%FILIPINO 4 2.0% 5 2.3% 25.0%HISPANIC 41 16.1% 28 12.4% 39 17.6% 35 15.4% 35 17.5% 55 25.1% 57.1%NATIVE AMERICAN 4 1.6% 2 0.9% 1 0.5% 4 1.8% 5 2.5% 3 1.4% -40.0%OTHER 2 0.8% 1 0.4% 2 0.9% 3 1.3% 2 1.0% 4 1.8% 100.0%UNKNOWN 0 0.0% 0 0 0.0% 2 0.9% 4 2.0% 3 1.4% infiniteWHITE 191 74.9% 175 77.4% 165 74.7% 160 70.5% 132 66.0% 138 63.0% 4.5%Total: 255 100.0% 226 100.0% 221 100% 227 100.0% 200 100.0% 219 100.0% 9.5%
CERTIFICATE OF PROFICIENCY AWARDED BY ETHNICITY BY YEAR1995-96 1996-97 1997-98 1998-99 1999-00 2000-01 Last 2 yr
# `1/0 # % # % # % # % # % % ChngAFRICAN AMERICAN 3 2.9% 1 0.9% 2 1.9% 1 1.0% 3 3.4%ASIAN 8 7.8% 11 10.3% 7 6.5% 5 5.2% 3 3.4% 4 4.5% 33.3%FILIPINO 1 1.1% 2 2.3% 100.0%HISPANIC 10 9.8% 21 19.6% 22 20.4% 23 23.7% 16 18.4% 18 20.5% 12.5%NATIVE AMERICAN 1 1.0% 1 0.9% 3 2.8% 0 0.0% 2 2.3%OTHER 1 1.0% 1 0.9% 2 1.9% 2 2.1% 1 1.1% -100%UNKNOWN 1 1.0% 0 0 0.0% 3 3.1% 1 1.1% infiniteWHITE 78 76.5% 72 67.3% 72 66.7% 63 64.9% 66 75.9% 58 65.9% -12.1%Total: 102 100.0% 107 100.0% 108 100.0% 97 100.0% 87 100.0% 88 100.0 %I 1.1%
Source: Data Warehouse
34 CABRILLO COLLEGE FACTBOOK 2000-2001
45

Degrees and Certificates Awarded by Demo ra h14
A.A. DEGREES AWARDED BY GENDER BY YEAR1995-96
# 0/01996-97
# 0/0
1997-98# %
1998-99# 0/0
1999-00# %
2000-01# %
Last 2 yrcY0 Chng
Female 175 60.8% 206 62.8% 257 71.4% 223 61.9% 258 63.9% 252 58.7% -2.3%Male 113 39.2% 122 37.2% 103 28.6% 137 38.1% 141 34.9% 176 41.0% 24.8%Unknown 5 1.2% 1 0.2% -80.0%Total: 288 100.0% 328 100.0% 360 100.0% 360 100.0% 404 100.0% 429 100.0% 6.2%
A.S. DEGREES AWARDED BY GENDER BY YEAR1995-96
# %1996-97
# %1997-98
# 0/0
1998-99# %
1999-00# %
2000-01# %
Last 2 yr% Chng
Female 164 64.3% 155 68.6% 143 64.7% 145 64.2% 134 67.0% 151 68.9% 12.7%Male 91 35.7% 71 31.4% 78 35.3% 81 35.8% 64 32.0% 68 31.1% 6.3%Unknown 2 1.0%Total: 255 100.0% 226 100.0% 221 100.0% 226 100.0% 200 100.0% 219 100.0% 9.5%
CERTIFICATES OF PROFICIENCY AWARDED BY GENDER BY YEAR1995-96
# %1996-97
# %1997-98
# %1998-99
# %1999-00
# %2000-01
# %Last 2 yr'% Chng
Female 68 66.7% 72 67.3% 84 77.8% 66 69.5% 71 81.6% 71 80.7% 0.0%Male 34 33.3% 35 32.7% 24 22.2% 29 30.5% 16 18.4% 17 19.3% 6.3%Unknown 87 100.0% 88 100.0%Total: Y 102 100.0% 107 100.0% 108 100.0% 95 100.0%
Source: Data Warehouse
4 6 CABRILLO COLLEGE FACTBOOK 2000-2001 35

Degrees and Certificates Awarded in Occupational Programs
Biology, Chemistry,Chemist , Environment and Health Occupations DivisionAf. Am. Asian Filipino Hispanic Nat. Am. Other Unknown White Total
CEM Male 2 2
DH Female 1 1 3 1 1 10 17
DH Male 1 1
HORT Female 2 10 12
HORT Male 3 3
N Female 1 12 1 22 36N Male 1 1 2
RT Female 1 7 7
RT Male 3 4
Total 3 1 27 2 1 3 66 103
Business and Computer Science DivisionAf. Am. Asian Filipino Hispanic Nat. Am. Other Unknown White Total
ACCT Female 1 6 1 11 19
ACCT Male 1 1
BOST Female 2 2
BUS Female 1 1 8 14 24BUS Male 1 1 3 2 1 9 17
CIS Female 1 2 11 14
CIS Male 2 2 3 9 16
DM Female 3 1 1 27 32DM Male 6 6RE Male 1 1
Total 4 8 1 23 2 2 1 91 132
English DivisionAl. Am. Asian Filipino Hispanic Nat. Am. Other Unknown J White Total
JOURN Male r 1
Total r 1---
Foreign Language and Communication DivisionAl. Am. Asian Filipino Hispanic Nat. Am. Other I Unknown White I Total
CJ Female_
5_
6 11
CJ Male 1 2 1 5 9FT Female 1 1
FT Male 1 9 10
Total 7 1 7 2 F 21 31
36 CABRILLO COLLEGE FACTBOOK 2000-2001 4dBEST COPY AVAILABLE

Degrees and Certificates Awarded in Occupational Pro ramst t
Human Arts and Services Division
1Af. Am. Asian [ Filipino J Hispanic Nat. Am. j. Other J Unknown j White Total
ARCHE
ARCHE
CAHM
CAHM
ECE
ECE
Female 2 2
Male 1 1
Female 2 3 5
Male 1 2 2 5
Female 1 5 9 1 11 27Male 1 1
Total 2 5 13 1 20 41
Mathematics, Science and Engineering DivisionAl. Am. Asian Filipino Hispanic Nat. Am. Other Unknown White Total
DRAFT Female 1 1
DRAFT Male 1 1 2
ET Female 1 1 2
ET Male 1 2 2 5
Total 3 2 5 10
Source: Data Warehouse
48 CABRILLO COLLEGE FACTBOOK 2000-2001 37

Success and Retention for Pre-Colle iate Basic SkillsF.TRIIISTMI
ENGLISH SU96 FA96 SP97 SU97 FA97 SP98 SU98 FA98 SP99 SU99 FA99 SPOO TotalA 8 8
B 5 5C 5 5CR 50 222 178 79 320 168 69 158 116 33 252 164 1809
D 0
F 2 2
NC 10 52 58 13 45 38 7 31 36 17 69 85 461
W 6 153 130 5 166 79 15 59 61 29 108 117 928
Total 66 447 366 97 531 285 91 248 213 79 429 366 3218
Success 76% 54% 49% 81% 60% 59% 76% 64% 54% 42% 59% 45% 57%Retention 91% 66% 64% 95% 69% 72% 84% 76% 71% 63% 75% 68% 71%
ESL SU96 FA96 SP97 SU97 FA97 SP98 SU98 FA98 SP99 SU99 FA99 SPOO TotalA 30 20 38 25 30 24 10 13 190
B 46 28 29 34 41 24 17 17 236
C 28 15 29 13 10 13 13 9 130
CR 6 56 104 75 50 62 105 99 80 637
D 4 5 5' 4 4 5 1 28
F 1 3 3 1 5 2 15
NC 16 8 21 9 10 10 43 27 144
W 35 73 36 40 43 72 1 51 45 396Total 6 216 256 236 176 200 258 1 234 193 1776
Success 100% 74% 65% 72% 69% 72% 64% 0% 59% 62% 67%Retention 100% 84% 71% 85% 77% 79% 72% 0% 78% 77% 78%
Math SU96 FA96 SP97 SU97 FA97 SP98 SU98 FA98* SP99 SU99 FA99 SPOOL TotalA 80 95 36 96 96 403
B 51 63 15 64 41 234C 33 19 2 21 28 103
CR 56 284 250 47 298 151 68 72 10 134 132 1502D 8 3 5 7 23
F 7 3 7 6 23
NC 9 136 199 13 109 27 70 77 6 103 95 844
W 6 92 94 5 143 68 67 110 4 86 89 764Total 71 512 543 65 550 246 384 442 73 516 494 3896
Success 79% 55% 46% 72% 54% 61% 60% 56% 86% 61% 60% 58%Retention 92% 82% 83% 92% 74% 72% 83% 75% 95% 83% 82% 80%* extracted by course title due to codina chanae
Reading SU96 FA96 SP97 SU97 FA97 SP98 SU98 FA98 SP99 SU99 FA99 SPOO TotalA 9 14 8 31
B 5 5 3 13C 2 4 3 9CR 162 149 12 200 172 238 127 6 205 139 1410D 1 2 3 6F 3 2 5NC 120 112 4 99 102 125 94 4 100 97 857W 32 28 31 29 31 24 1 47 56 279Total 314 289 16 330 303 414 272 11 369 292 2610Success 52% 52% 75% 61% 57% 61% 55% 55% 59% 48% 56%Retention 90% 90% 100% 91% 90% 93% 91% 91% 87% 81% 89%
Source: Data Warehouse
38 CABRILLO COLLEGE PALI BOOK 2000-2001
49

Cabrillo College Transfer Information b Academic YearsI . trawnimmerNA
UC Under-represented
CSU Under-represented
TotalUC/CSU
TotalUnder-rep'd
% ofUnder-rep'd
1981-82 . 3761982-83 . . 382 .
1983-84 . . 384 .
1984-85 . . 342 .
1985-86 . 339 .
1986-87 220 357 . 5771987-88 228 342 . 5701988-89 279 . 402 . 6811989-90 224 384 . 6081990-91 334 409 . 7431991-92 342 25 355 50 697 75 10.8%1992-93 371 43 384 51 755 94 12.5%1993-94 318 36 423 72 741 108 14.6%1994-95 252 34 389 75 641 109 17.0%1995-96 268 37 455 94 723 131 18.1%1996-97 263 35 386 89 649 124 19.1%1997-98 286 43 323 81 609 124 20.4%1998-99 241 24 362 70 603 94 15.6%
1999-00 241 34 353 72 594 106 17.8%2000-01 256 42 350 62 606 104 17.2%
Summary of Cabrillo Transfers to UCSC and SJSU (Fall Terms)
UCSC Under- CSUSJrepresented
Under- CSUMBrepresented
Under-represented
FALL 90 187 18 109 8FALL 91 183 14 129 15FALL 92 224 26 156 16FALL 93 214 26 162 24FALL 94 183 20 179 28FALL 95 162 20 142 28FALL 96 192 24 188FALL 97 190 29 128 47 22 6FALL 98 142 16 100 18 42 11
FALL 99 158 20 96 18 32 7FALL 00 168 22 96 19 47 7
Source: CPEC via Transfer Center
50CABRILLO COLLEGE FACTBOOK 2000-2001 39

To Ten Communi College Transfers to UCRS Emma tdatiaotemor
2000-2001
Ranking1
23456
789
10
College # TransferredSanta Monica 709Diablo Valley 547Santa Barbara 524DeAnza 461
Orange Coast 411Pasadena City 351
San Diego Mesa 300Riverside 269City College of S.F. 264Cabrillo 256TOTAL 4092
1999-2000
Ranking College1 Santa Monica2 Santa Barbara3 Diablo Valley4 De Anza5 Orange Coast6 San Diego Mesa7 Pasadena City8 CC San Francisco9 Cabrillo10 Moorpark
TOTAL
1998-1999
Ranking1
2345678910
CollegeSanta MonicaSanta BarbaraDiablo ValleyDe AnzaOrange CoastSan Diego MesaPasadena CityCC San FranciscoRiversideCabrillo
# Transferred737547489436339320325278241240
3952
# Transferred632542470396351269253246244241
TOTAL: 3644
Source: California Postsecondary Education Commission
40 CABRILLO COLLEGE FACTBOOK 2000-2001 51

Largest Number of Community College Transfer Students to CSUmu Cem m :wawa d
2000-2001
Ranking Colleges # Transf'd Ranking Colleges # Transf'd Ranking Colleges # Transf'd1 Orange Coast 1,187 21 Butte 756 41 Golden West 5062 De Anza 1,142 22 Cuesta 755 42 Sequoias 4943 Mt. San Antonio 1,118 23 Saddleback 735 43 Ohlone 4464 CC San Francisco 1,090 24 L.A. Pierce 729 44 Reedly 4395 Diablo Valley 1,057 25 Sacramento 709 45 Rio Hondo 4366 Fullerton 1,057 26 Santa Ana 687 46 L.A. City 431
7 American River 1,034 27 Cerritos 681 47 Antelope Valley 4308 Fresno City 1,022 28 Long Beach 676 48 Canyons 4239 Pasadena 992 29 Chaffey 674 49 San Mateo 41110 Grossmont 915 30 East L.A. 661 50 San Bernardino 40811 Santa Monica 911 31 Moorpark 657 51 Irvine Valley 40012 El Camino 897 32 Southwestern 653 52 San Diego City 38713 Sierra 883 33 L.A. Valley 633 53 Santa Barbara 38514 San Diego Mesa 866 34 Chabot 628 54 Shasta 37115 Palomar 849 35 Cypress 624 55 Skyline 36816 Santa Rosa 846 36 Ventura 599 56 Merced 36517 San Joaquin Delta 842 37 Glendale 577 57 Foothills 35418 Riverside 787 38 West Valley 540 58 Redwoods 35219 Bakersfield 780 39 Consumnes 528 59 Cabrillo 35020 Modesto 770 40 Citrus 517
1999-2000
Ranking Colleges # Transfd Ranking Colleges # Transfd Ranking Colleges # Transfd1 De Anza 1,173 21 Butte 740 41 Consumens River 4742 Orange Coast 1,142 22 Bakersfield 729 42 Ventura 4743 Fullerton 1,100 23 Santa Ana Co 696 43 Ohlone 4644 San Francisco 1,096 24 Cerritos 688 44 Rio Hondo 4435 Diablo Valley 1,078 25 L.A. Valley 681 45 San Mateo 437
6 Fresno Valley 1,076 26 Long Beach City 678 46 Kings River 4367 Mt. San Antonio 1,076 27 Moorpark 674 47 Valley 395
8 Pasadena 1,019 28 Saddleback 671 48 Irvine Valley 391
9 American River 976 29 L.A. City 664 49 L.A. City 38310 Santa Monica 965 30 Chabot 654 50 Santa Barbara 38211 Santa Rosa 940 31 Cypress 641 51 Skyline 38012 Sierra 932 32 San Diego Mesa 618 52 Antelope Valley 37413 Palomar 900 33 West Valley 600 53 Merced 37314 El Camino 855 34 Chaffey 590 54 Foothill 36615 Grossmont 815 35 East Los Angeles 569 55 Canyons 36316 Cuesta 808 36 Southwestern 556 56 Shasta 36217 San Joaquin Delta 800 37 Citrus 531 57 Solano 360
18 Sacramento City 785 38 Golden West 528 58 Cabrillo 35319 Riverside City 776 39 Sequoias 51920 Modesto 749 40 Glendale 518
Source: California Postsecondary Education Commission
52CABRILLO COLLEGE FACTBOOK 2000-2001 41

Distribution of Job Categories of All Full-Time Staff MembersMT11111 1111WLI I
60%
50%
40%
30%
20%
10%
0%
1997-1998
011998-1999
2000-2001
c \o o\ ,kc cPst.i,c4s c\c"'\ c c cs
c., ,ce, <2 CP rb.e \v.,,e ,,coo '1/4:(-6`..*
v , rb. co ,..,4?'..,e, 1-1 4.0.
ccP,ekc'eb.cr ,s0G .c.i-
Goo
1997-1998 1998-1999 2000-2001# % # % # %
Executive/Admin/Mngr 37 9% 41 9% 38 8.2%Faculty 186 45% 194 44% 237 51.4%Clerical/Secretarial 80 20% 90 20% 93 20.2%Technical/Paraprof. 62 15% 76 17% 54 11.7%Skilled Craft 6 1% 6 1% 7 1.5%Service/Maintenance 39 10% 37 8% 32 6.9%Total 410 444 461
Source: Staff Census
(1999-2000 data not available due to Datatel conversion.)
42 CABRILLO COLLEGE FAC1 BOOK 2000-2001 53

Distribution of Ethnicity of All Full-Time Staff MembersLzimmli Daum IM:11011MTMA
90.0%
80.0%
70.0%
60.0%
50.0%
40.0%
30.0%
20.0%
10.0%
0.0%
1997-1998
Ei 1998-1999
2000-2001
tqr .1e 4%
Cc\ OC\P..,,,,,s, e
N.,
0.( 4`o 4"c%04.
e.)c,Oar
1997-1998 1998-1999 2000-2001# ok # % # 0/0
African American 9 2.0% 7 2.0% 9 0.7%American Indian 7 2.0% 8 2.0% 5 1.1%Asian 24 6.0% 22 5.00% 13 2.8%Filipino 10 2.2%Hispanic 52 13.0% 65 15.00% 70 15.2%Other/Unknown 3 0.7%White 321 77.0% 342 77.00% 351 76.1%Total 410 444 461
Source: Equity and Diversity Office
(1999-2000 data not available due to Datatel conversion.)
54CABRILLO COLLEGE FAL I BOOK 2000-2001 43

Distribution of Gender of All Full-Time Staff MembersII MIMIma'am '''fWrrMllttLgL;11--
70%
60%
50%
40%
30%
20%
10%
0%
1997-1998 1998-1999 2000-2001
Female
Male
1997-1998 1998-1999 2000-2001# % # % # %
Female 251 61% 270 61% 283 61%Male 159 39% 174 39% 178 39%Total 410 444 461
Source: Equity and Diversity Office
(1999-2000 data not available due to Datatel conversion.)
5544 CABRILLO COLLEGE FAC, 1 BOOK 2000-2001

Classified Employee Ethnicity Information by Calendar YearMtnmilreLIZI MMUS
80.0%
70.0%
60.0%
50.0%
40.0%
30.0%
20.0%
10.0%
0.0%
Ea 1997 1998 2000
n IAA Al ASIAN HISPANIC
AA Al ASIAN HISPANIC UNKWN WHITE Group Total1996 2.8% 1.1% 7.7% 12.7% 1.1% 74.6% 1811997 3.7% 1.0% 8.4% 13.6% 0.5% 72.8% 1911998 3% 2% 6.90% 21.60% 0.00% 66.70% 2042000 2.70% 2.20% 5.80% 20% 1.30% 68.30% 224
Source: Staff Census
(1999-2000 data not available due to Datatel conversion.)
56 CABRILLO COLLEGE FACTBOOK 2000-2001 45

Classified Em lo ee Gender Information by Calendar YearInstunawazolk
80%
70%
60%
50%
40%
30%
20%
10%
0%
68% 67.90%5.4%
.60%32.10%
1997 1998
1997 1998 2000
Females 68% 65.4% 67.90%Males 32% 34.60% 32.10%Total 191 208 224
Source: Staff Census
(1999-2000 data not available due to Datatel conversion.)
5746 CABRILLO COLLEGE FAL 1 BOOK 2000-2001
2000
Females
m Males

Years of Service for 2000 Classified Em loyees at CabrilloWitsin I dIFSEN9
80
70
60
50
40
30
20
10
0
cco C% 9, <1. \co (,)
o <;) r, _,j)./
9./ (1Ycr,
n qe <0 c;;%' ,\00\°
# %<2 years 76 33.9%2 to 4 65 29.0%5 to 8 32 14.3%9 to 12 38 17.0%13 to 16 7 3.1%17-20 3 1.3%21-25 1 0.4%26-30 0 0.0%31+ 2 0.9%Total 224
*using employees employed in 2000.Source: census-employee
58
p\x
CABRILLO COLLEGE FAC. BOOK 2000-2001 47
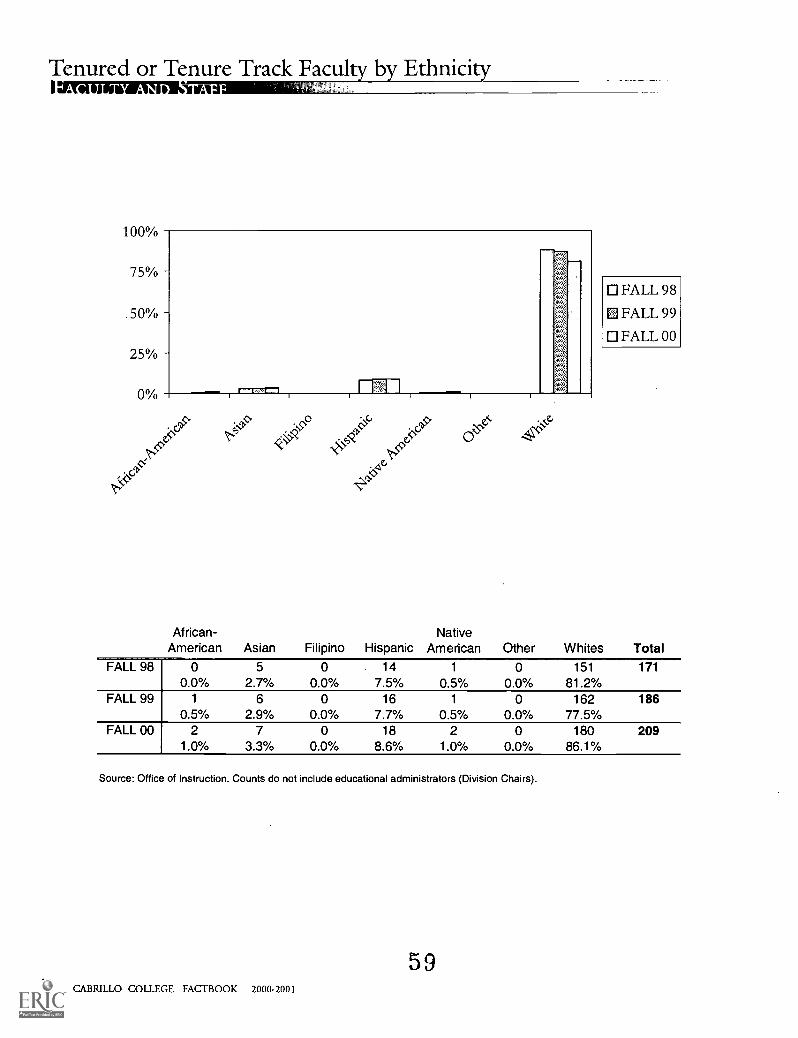
Tenured or Tenure Track Facul b Ethniciivaniu IV &WM i Mil PEI 3 =MIlliggi64---
100%
75%
.50%
25%
0%
ecN.
.
FALL 98
FALL 99
FALL 00
African-American Asian Filipino Hispanic
NativeAmerican Other Whites Total
FALL 98 0 5 0 14 1 0 151 1710.0% 2.7% 0.0% 7.5% 0.5% 0.0% 81.2%
FALL 99 1 6 0 16 1 0 162 1860.5% 2.9% 0.0% 7.7% 0.5% 0.0% 77.5%
FALL 00 2 7 0 18 2 0 180 2091.0% 3.3% 0.0% 8.6% 1.0% 0.0% 86.1%
Source: Office of Instruction. Counts do not include educational administrators (Division Chairs).
5948 CABRILLO COLLEGE FACTBOOK 2000-2001
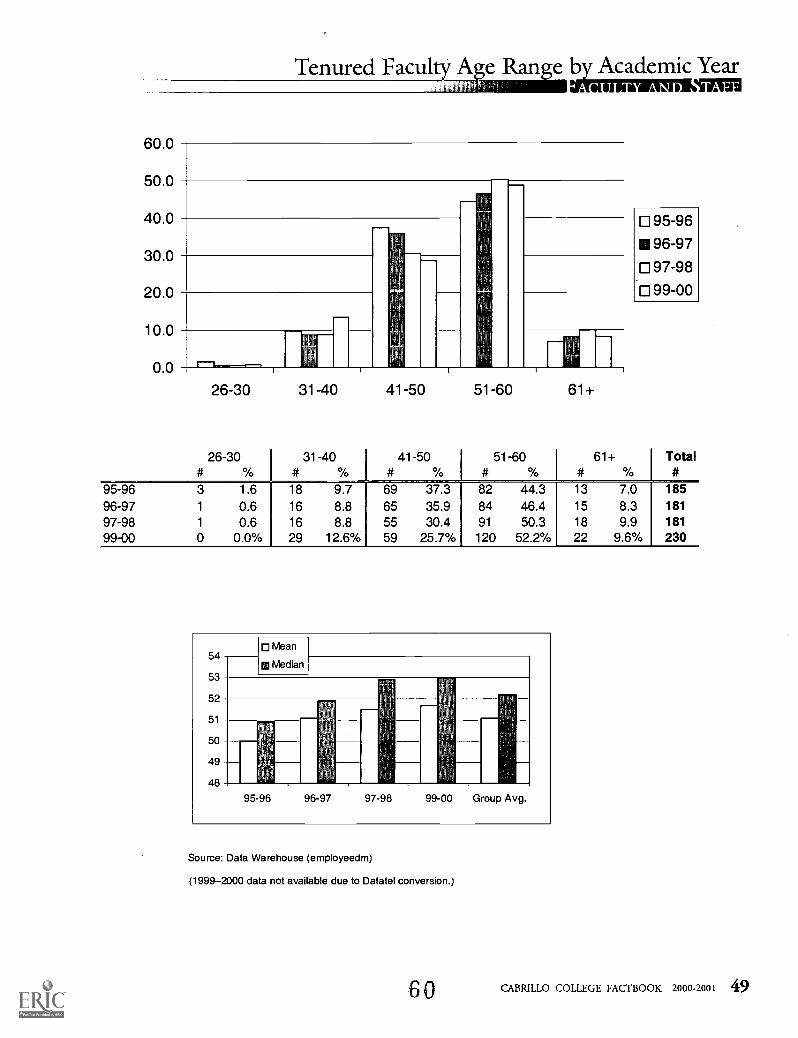
Tenured Faculty Abe Ran e by Academic Yearsun IMIZIIIVragn
60.0
50.0
40.0
30.0
20.0
10.0
0.0
26-30 31-40 41-50 51-60 61+
95-96
III 96-97
97-98
99-00
#26-30
% #31-40
`Yo #41-50
%51-60
# % #61+
%Total#
95-96 3 1.6 18 9.7 69 37.3 82 44.3 13 7.0 185
96-97 1 0.6 16 8.8 65 35.9 84 46.4 15 8.3 181
97-98 1 0.6 16 8.8 55 30.4 91 50.3 18 9.9 181
99-00 0 0.0% 29 12.6% 59 25.7% 120 52.2% 22 9.6% 230
54Mean
m Median53
52
51
50
49
48
95 96 96-97 97-98 99-00 Group Avg.
Source: Data Warehouse (employeedm)
(1999-2000 data not available due to Datatel conversion.)
60 CABRILLO COLLEGE FAC 1100K 2000-2001 49
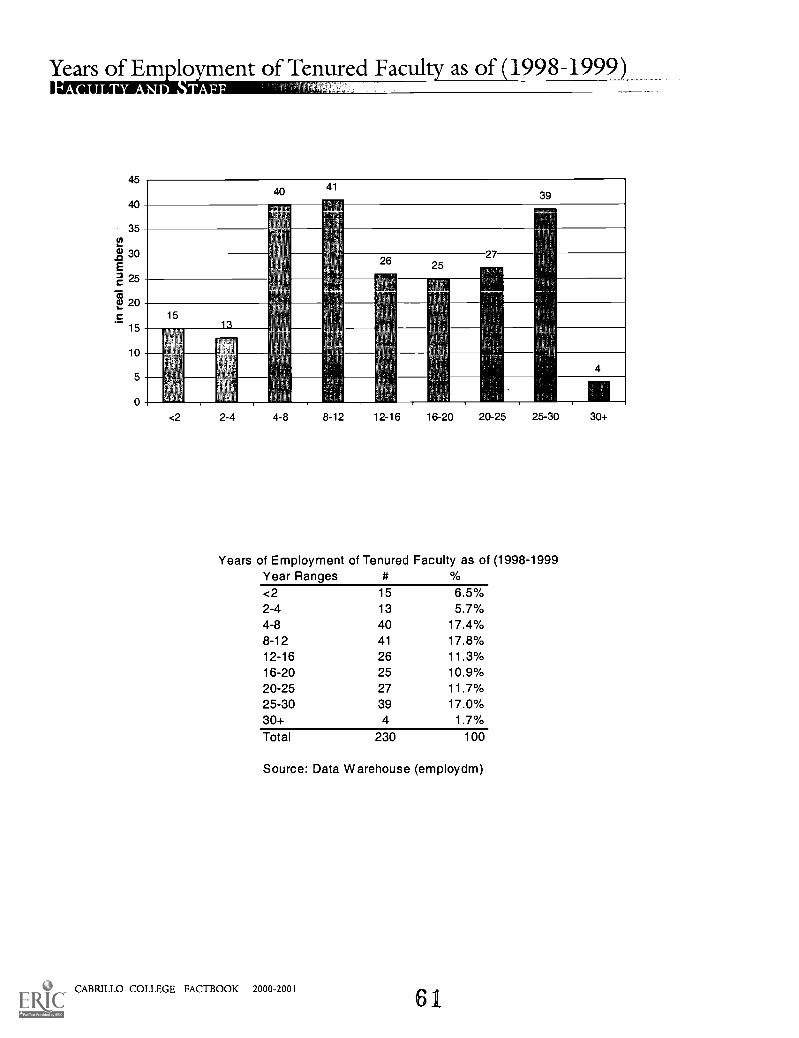
Years of Em to of Tenured Faculty as of 1998-1999)I MUM MI IMAM PM*
<2 2-4 4-8 8-12 12-16 16-20 20-25 25-30
Years of Employment of Tenured Faculty as of (1998-1999Year Ranges<2 15 6.5%2-4 13 5.7%4-8 40 17.4%8-12 41 17.8%12-16 26 11.3%16-20 25 10.9%20-25 27 11.7%25-30 39 17.0%30+ 4 1.7%Total 230 100
Source: Data Warehouse (employdm)
50 CABRILLO COLLEGE FAL.11300K 2000-2001
61
30+

Educational Background of Full-Time Facul 2000-244. A
30
2000-2001
-1111 11 11
25
20 -
15 -
10-
5
0 I(00 -co pco 0 Co
,coke() \> p\>s <P7 .6e <,\-\
GO)
BachelorDivision 96-97 97-98 98-99 99-00 00-01BCS 4 4 4 6 6BECHO 1 2 2 0 1
COUNSELING 0 1 1 0 0ENGLISH 0 0 0 0 0FLAG 0 1 1 0 1
HASS 1 0 0 2 1
HPERD 3 1 1 2 2LIBRARY 0 0 0 0 0MSE 0 2 2 0 0VAPA 1 0 0 2 0TOTAL 10 11 11 12 11
Bachelor
Master
Doctorate
Master Doctorate96-97 97-98 98-99 99-00 00-01
8 10 10 12 1516 15 15 13 1413 13 13 13 1621 18 18 20 1912 7 7 5 723 15 15 22 2610 15 15 12 132 3 3 3 417 16 16 19 21
18 19 19 22 20140 131 131 141 155
96-97 97-98 98-99 99-00 00-010 1 1 0 06 4 4 10 122 2 2 2 24 5 5 5 72 2 2 3 1
4 6 6 4 71 2 2 1 00 0 0 0 04 8 8 4 71 2 2 2 1
24 32 32 31 37
Source: Cabrillo College Catalog, 2001-2002
Note: Social Science & HAS data collapsed for 1996-97 through 1999-00 due to departmental reorganization which began in 2000-01.
62 CABRILLO COLLEGE FAC I BOOK 2000-2001 51

Apportionment FTES Countsi a 1111111INIM I
Annual Apportionment Attendance (FTES)YEAR FTES
1990-91 8,7051991-92 9,2481992-93 8,6851993-94 8,3701994-95 8,4591995-96 8,2281996-97 8,5261997-98 9,2471998-99 9,5491999-00 9,6962000-01 10,157 (estimates)
Note: for resident students only
Source: Admissions and Records CCSF320,
52 CABRILLO COLLEGE FACTBOOK 2000-2001

Budget Income Cate ories 1999-2000)Minim-m:111
Student Fees3%
Contracts/Grants2%
Other Sources13%
Local Taxes33%
Tuition Funds
6%
1999-2000
Lottery Funds3%
Local Taxes $ 14,646,275State Apportionment $ 17,945,796Lottery Funds $ 1,235,951Tuition Funds $ 2,633,899Contracts/Grants $ 923,449Student Fees $ 1,220,643Other Sources $ 5,612,826
Total Revenue $ 44,218,839
State Apportionment40%
ECONOMIC IMPACT OF CABRILLO COLLEGECATEGORIES 1994-95 1995-96 1996-97 1997-98 1998-99 1999-2000Annual Total Ex penditures/Outgo $ 30,095,030 $ 30,608,575 $ 33,693,832 $ 37,212,251 $ 39,720,890 $ 43,214,035Gross Salaries and Benefits Paid $ 25,906,766 $ 25,795,970 $ 27,992,118 $ 29,811,017 $ 31,863,140 $ 34,167,215Other Ex penditures/Outgo $ 4,188,264 $ 4,812,605 $ 5,701,714 $ 7,401,234 $ 7,957,750 $ 9,046,820Number of Full and Part-time Employ 1,234 1,183 1,216 1,282 1,313 1,311
Source: Business Office
EST COPY AVAILABLE
6 4 CABRILLO COLLEGE FAC1 BOOK 2000-2001 53

District Income (1983-2000 )I ate mil :4.444111:
$22,000,000.00
$20,000,000.00
$18,000,000.00
$16,000,000.00
$14,000,000.00
$12,000,000.00
$10,000,000.00
$8,000,000.00
$6,000,000.00
$4,000,000.00
$2,000,000.00
LOCAL INCOME
STATE AND OTHER
83 84 84 85 85-86 86-87 87 88 88 89 89 90 90 91 91 92 92 93 93 94 94 95 95-96 96-97 97 98 98 99 99 00
FISCAL YR LOCAL INCOMESTATE AND
OTHER TOTAL INCOME83-84 $ 5,598,748.00 $ 9,370,643.00 $ 14,969,391.0084-85 $ 6,402,109.00 $ 9,840,560.00 $ 16,242,669.0085-86 $ 7,255,309.00 $ 11,651,763.00 $ 18,907,072.0086-87 $ 7,701,073.00 $ 12,209,841.00 $ 19,910,914.0087-88 $ 8,569,444.00 $ 13,692,958.00 $ 22,262,402.0088-89 $ 8,621,133.00 $ 15,662,586.00 $ 24,283,719.00
89-90 $ 10,152,429.00 $ 18,209,407.00 $ 28,361,836.0090-91 $ 10,231,956.00 $ 18,772,266.00 $ 29,004,222.00
91-92 $ 11,004,820.00 $ 17,916,887.00 $ 28,921,707.00
92-93 $ 12,774,292.00 $ 16,295,100.00 $ 29,069,392.00
93-94 $ 16,490,040.00 $ 13,019,088.00 $ 29,509,128.0094-95 $ 16,006,279.00 $ 14,121,192.00 $ 30,127,471.0095-96 $ 16,059,054.00 $ 15,565,344.00 $ 31,624,398.0096-97 $ 15,924,017.00 $ 17,648,177.00 $ 33,572,194.00
97-98 $ 16,714,945.00 $ 21,214,470.00 $ 37,929,415.00
98-99 $ 18,229,408.00 $ 23,876,310.00 $ 42,105,718.0099-00 $ 20,010,596.00 $ 24,208,243.00 $ 44,218,839.00
Source: Business Office
54 CABRILLO COLLEGE FAC1 BOOK 2000-2001
65

Robert Swenson Library-Resources__-1.1aN11111 WIN I N =rem
60000
50000
40000
30000
20000
10000
q qq 6)A qce
CY
p ps\--i q (1, (19\
C6Nq 0C)
0'(1/
ReferenceCirculating
Collection
VideousCorse
ReserveIteArchives ms
niputerSoftware
1997-98 1998-99 1999-2000 2000-2001 ChanceCirculating Collection 46,739 49,053 56,383 58,848 2,465Course Reserve Items 2,180 2,840 3,565 4,111 546Videos 1,649 2,030 2,621 3,056 435Computer Software 112 180 576 662 86Reference 6,468 6,560 7,012 7,370 358Archives 1,160 1,454 1,577 123Total size of collection(volumes): 57,148 61,823 71,611 75,624 4,013
Source: Library
66 CABRILLO COLLEGE FAC11300K 2000-2001 55

Robert Swenson LibraryCirculationI MTN 1 MI II I NAM :11 ea MII2411111F
60%
50%
40%
30%
20%
10%
0%
4b
q0 VCCb
00000 \\
CqCY
V0,
(9
rt9
books and other check outsreserve material check outs
periodical check outs
1997-98 1998-99 1999-2000 2000-2001 Changeperiodical check outs 7% 3% 3% 4% 0%reserve material check outs 40% 41% 39% 40% -2%books and other check outs 53% 56% 58% 56% 2%Library Circulation (check outs): 39,673 41,372 38,711 35,005 -3,706Library Door Count (visits): 333,761 345,875 382,033 339,281 -42752Library Circulation (in library use): 20,915 19,934 25,043 32,836 7,793
Source: Library
56 CABRILLO COLLEGE FAcfBOOK 2000-2001 67
BEST COPY MAMA Is JUR

Central Coast Small Business Development Center DataWATO1 II neWil trifffagi
60
50
010111111111111111." 11-40
30 111,11142%0011110
"Aa1141/1111.ebe`'
20
10
<zs.
4db <7>C
Actual Achieved
Target Goal
Summary of achievement of goal (reporting period: January '00 - December DO)Target Goal Actual Achieved Percentage Achiel
New Clients/ Counseling 450 487 108.2%Training Attendees 1,375 1,398 101.7%Jobs Created na 46 naJobs Retained na 526 naWorkshop/Seminars 77 81 105.2%
d
Amount of business loans obtained by CCSBDC clients in 2000: $6,053,682.na = not applicable. No target goals were set for job creation and retention in 2000.
Central Coast Small Business Development Center831.479.6136www.businessonline.org
Source: CCSBDC
CABRILLO COLLEGE FAC, I BOOK 2000-2001 57

Cabrillo College Crime Statistics 1998-2000)momilmoinktm:
30
25
20
15
10
5
0
52
-c
O
1998 1999 2000 ChangeAggravated Assault 0 0 0 0Alcohol 1 2 1 -1
Arson 0 0 3 3
Bomb Threats 0 1 0 -1
Burglary 13 17 23 6Drugs 0 1 4 3
Fraud 0 0 0 0Hate Crime 1 0 0 0Motor Vehicle Theft 0 0 0 0Murder 0 0 0 0Rape 0 0 0 0Robbery 0 0 0 0Sexual Battery 0 0 1 1
Sexual Exposure 2 3 0 -3Simple Assault 1 2 1 -1
Theft 27 25 13 -12Vandalism 18 12 15 3Weapons 0 0 0 0
Other 3 6 2 -4
Total Occurence # 63 63 63 0
Source: Sheriffs Office
58 CABRILLO COLLEGE FACTBOOK 2000-2001
69
1998
BEST COPY AVAILABLE

Learning Outcome and Program Planning Data by Department by Academic Year
The following tables have been designed for the purpose of providing one-stop shoppingfor information on most frequently requested program level information.
Input information includes:census enrollment student counts,majors claimed,FTES,WSCH,FTEF,oad (WSCH/FTEF),% of WSCH,% of FTEF andwait list.
Output information includes:success and retention rates,licensure exam passing rates, anddegree/certificate awards.
For further drill-down information and information not included in these tables,please consult the rest of the Fact Book.
70CABRILLO COLLEGE FAC.11300K 2001 59

.--- ,
-%Change
si .
Fall
_
M4= Fall M-4=-....
Fall Ear.- _ _
Fall
. - -Fall
:-- . :.KII:=M' - -
/- --Annual8.76%
Certificates
AwardedAnnual7.45-1.54% -5.76% -9.28% -11.02'k -2.01% -0.50% -1.59% 1.50'/o
2000'01 6 697 6,401 65.17% 67.92'/ 79.41% 81.64% for Details 658 101
1999'00 43,390 45,160 7,382 7,194 67.18% 68.42°/ 81.00% 80.14% 635 94
1998199
1997/96
43,09441,896
43,44641,821
7 161
7,391
7,1697,183
70.16%
69.217/
69.64%69.987
82.26°/81.71%
1E0.06%
83.24%603593
8698
1996197
we I
--
38 491
Fall
40,218
War.
7 130
Fail
7,406
.
ILMVII
68.69%
:....
-
Fall
68.257:.
....
-111E=.
84.62%
- D
Fail
83.77%
.
'NE=.- -
Fall W4=11
558
0 --. . _Annual
106
CertificatesAwardedAnnual
%Change -19.15% -6.63% -15.74% -18.13% 5.97% 6.29% 7.89% -2.30% na 12.50%
2000101 353 352 166 149 61.67°/ 64.20°/ 75.03Y 78.13% 12 91999'00 449 377 197 182 55.70'/ 5.91°/ 67.11% 80.43% 9 81998199 333 497 216 205 62.10% 59.07% 78.43°/ 79.96% 13 71997/96 342 356 210 208 6223V 65.79V 82.97°/ 82.16% 12 51996197
..- --
542
.
Fall
342
_
WI=
204
Fall
223
.
M41=.
67.17%
___
Fall
66.25%
-M=111
86.60°/
- _ _
Fall
76.47%
. .., -
Fail KI=7/
16
- r--. -.
Annual
11
CertificatesAwardedAnnual
%Chage -13.19% 2.73% -12.08% -30.42% aon. 4.31% 3.16% -4.63% - 13.04% -50.00%2000101 520 565 466 414 65.00% 63.547 81.54% 79.47% 40 1
1999'00 599 550 530 595 56.93% 59.23°/ 78.38% 84.10%1998199 608 593 522 546 61.96% 68.34 79.00% 84.26% 46 21997/96 583 621 524 530 56.50% 60.43 75.99% 78.81% 36 21996197
. . -
-- ,,
599
Fall
604
_
WM!.
557
Fall
552
-11M1
59.90°/
- __Fall
62.09%
KM. r.
82.96%
- ... _
Fall
74.96%
KTME._ -
Fall
.- _
47
1. ----. .--.Annual
0
Certifi atesAwardedAnnual
%Qum, 40.48% -31.03% na na -23.93% 20.95% -13.48% 1.29% 0.00% 0.00% na na2000101 59 40 1 1 35.59°/ 67.50% 62.717 87.50%199990 42 58 0 0 59.52% 46.55 76.19"/ 86.21% 0 0 0 01998199 62 60 16 4 56.677 0.00% 91.67% 0.007 0 0 0 01997/98 48 37 15 21 37.78% 39.4 91.11% 89.47/ 0 0 0 01996197 0 51 18 15
. =.-39.64%
0.07/
.....
Fall
46.94%
-111=.na
0.00V
Failna
87.76%
.
W.=na
0
_. -
Fall
0
V .j 0
/- -.--.-.
Annual-50.00%
0
CertificatesAwardedAnnual-66.67%
-
.-- D.-
-%change
..- -.I
.
Fallna
. :._
W=1/na
.. :IN.
Fall-22.27% na
2000101 1,421 1614 199 166 41.177 50.43 64.81% 70.26% 1 1
199900 256 275 2 31998991997/981996'97- :. - . . Ise . - 1 :.
...
.-
Fall
. . ... I
- Is,
KWE
. - - ...
Fall
.
MI=
. 1 - . -
'.- -
Fall
. - .....;,
ME=
.
... -
Fall
. -, ..
MWE
.0 - - -
-*
Annual
1 5,,, .
Cerenelte3AwardedAnnual
:.
..----
%Change
L -: ... .
Fall MWEna na na na na na na na na re
2000911999'00 3,512 3,677 286 295 60.17% 60.21% 78.20/ 76.303/1998199 3,291 3,702 240 267 60.25°/ 62.86% 85.31 84.57°/ 2 1
1997/96 3 431 3,446 232 215 66.71*/ 64.56°/ 83.48% 83.86 1 91996197 2,405 2,800 204 221 66.00P/ 64.41*/ 86.393/ 80.97/ 3 4
Ale rro . : -
11
. I : II :..
I ' I \ i 3 I I"

VVSCH/FTEF= Load Percent.- . PIES - 0 . FIEF of WSCH Percent of FIEF
c.- -
Watt List
Fall W'1:1 Fall WIMM Fall Wi' MI Fall KIM, Fall K.".' rnil Fall W1 Fall WM:1%Charge 2.78% 0.93% 2.74% 0.79% 124% -1.52% 1.48% 2.35% 0.00% 0.00% 0.00% 0.00% na2000/01 4,700 4,718. 146 C27. 146,691.21 285. I 290.15 511.66 505. 103.0/ 100.0% 103.06/ 1()3.0'/1999'001998199
4,57325 4,675.394 635.31 4,555.55
142,133. 145,536.52 281. 294.62 604.20 493.93 100.0/ 103.0°/ 1(X).0°/ 100.CP/ na4 939144,081. 141,391.83 274. 278. 524.64 508.48 100.0/ 100.0P/ 100.0°/ 103.07 4
1997i'98 4,119.,' 4,560.13 13,070. 137,539.71 270.50 267.86 46237 513.48 100.0°/ 100.09/ 100.0°/ 1C0.0°/ 4,866 4,1861996197
4,--
3,915.31 4,104.32
PIES
118 98629
.......
124,807.10 263. 277.81
:. . :_....... _L.,
FIEF
451.51 449.25.. B -
VISCHFIEF = Load
103.0°/ 10100°/
I
Percent of WSCH
1()0.0°/ 100.0*/
Percent of FIEF
4 185 4 510
1 I .
Walt List
Year Fall K:=11 Fall -M=B Fall EIMI Fall Elrffl Fall KfMni Fall 1=1 Fall EM.1%Change -1.11% -5.37% -2.42% -5.31% -13.03% -6.67% 1220% 1.46% -0.06% -o.07% -0.15% 431E% na2000Y01 56.1 48.-4 1,7333) 1,536.401MM 3.08 649.18 489.09 1.187/ 1.027/ 0.936°/ 1.0827EIM 01999100
1998199
56.7 ,62.7 ea
1,776211,936...
1,591802140.03
3.0MM 3.333.03
578.57709.40
432.06694.81
1.250°/ 1.093'/ 1.069°/0.994%
1.12)6/1.10037
na1.344% 1.514/ 23
1997/98 47. 61. 1 466 1,85730 MEM 2.94 498.72 631.73 1.1726/ 1.350% 1.087/ 1.098% 21 61996197 42 1 5703) 1,296.3 MilE 3.00
FIEF
509.84 432.07
V1SCl/FIEF= Load
1.320% 1.039°/
Percent of NISCH
1.169°/ 1.0803/
Patent of FIEF
18 23
: ...-- .:.....-._
Waft List- - FIES 4.-...
Year Fall CM Fall -M7=. Fall ir.. inli Fan Ms1=1 Fall WMTI Fall E=I Fall -UM71%change -1a35% 8.26% -13.39% 831% -a61% 3.12% -10.14% 5.03% -025% 0.11% -0.06% 0.3%2006101 64.71 1,998.90 2,245.00 IIIIM 3.30 576.05 680.30 1.369% 1.5307 1.216% 1.137/ 81996100 74.- 67.11 2,307. 2,07280 =i1E 32) 641.06 647.75 1.624% 1.424°/ 1.277/ 1.086°/ 16 na1998199 74. 2,346. P. 2,26420 MEE 4.03 651.92 566.05 1.620 1.601/ 1.311°/ 1.438/ 151997/913 59.11 78. 1784.01 2,375.61 =iE 350 48216 678.75 1.4263/ 1.7277 1.339°/ 1.307/ 13 61996/97 61. 63.1 1,823.7 1,89921 4. 4.30
FIEF
404.61 441.68
VISCHFrEF= Load
1.530% 1.522°/
Percent of WSCH
1.708'Y 1.548°/
Percent of FIEF
5 13
-.: :...
Vtidt List.- - PIES 4-.-- Fall VIZI Fall W' ffll Fall EMI Fall WM11 Fall EMI Fall EMI Fall WMPI
%Chrnge 36.16% 0.00% 40.48% 0.03% 0.(0% 0.(0% 40.48% 0.01% 0.03% -0.04% 0.00% 0.03% na -100.00%2000/01 6.01 ENI3E 188.80 128.00 0.40 0.40 472.00 320m 0.129V 0.087/ 0.140°/ 0.138/ . 01996100 ME 6.01 134.40 185.63 0.40 0.40 33600 464.00 0.1397% 0.128% 0.142°/ 0.136/ m1938199 6.53 0.00 2)1.50 0.00 0.40 0.00 503.75 0.00 0.140P/ 0.000*/ 0.146 0.0X:P/ 01937/98 4.80 4.44 144.00 133.25 02) 02) 723.130 666.25 0.1167 0.09 0.074°/ 0.075/ 9 1
1936197
. r.
0.00 4.90
FTES
0.00
-::.
147.00
I..
0.00 0.20
FIEF
0.130 735.0)
WSCHTIEF= Load
0.000°/ 0.118%
. ,.....-...
Percent of WSCH
0.00t 0.072°/
. 1 .
Percent of FIEF
0 22
_ ...) : la ...
Waft List
-- Fall Eit I Fall Fall W=1 Fall EMI Fall IMM Fall 11=1 Fall WM"%Chrnge 0.004/. 0.00% 0.00% 0% 0.03% 0.(1)% 0.00% 0.00% 1.47% 1.88% 206% 2.21% na2000'011999'001996199
68 - ea rO. r. 0.
0. 0. r.
2,148.0. r I
0. 1
2,754.920.0)0.00
=M:O. r 1
0. r r
6.
0.000.00
364.840.130
OA)
43.10.000.00
1.472°/0.030°/0.000
1.878°/0.000T0.000Y
2064°/ 2210.000%0.030°/
200 .0.01P/
0.000)/1%17/98
1996197
- _ FEES -0 FIEF WSCI-VFTEF = Load
. .J. ....
Percent of WSCH
..-., . .
Percent of FIEF
-t: , , e...
VIM List
., Fall E=1 Fall MOMIE Fall KM, Fall 1=1 Fall 'W=1 Fall K=1 Fall K".-11%Ching! -99.96% -10300% -100.00% -100.00% -103.00% -103.00% -103.00% -100.00% -7.61% -9.10% -520% -6.02% na2000101 0.1 0 o. r 0.00 o. 0.00 coo ace o.ary/ cow,/ ciao,/ okary .- 01999'001998(99
348.-370.
427. 10,818.373 11 502.51
13,238.08 14...11,7133.92 MIIIM
17.75 736.4713.26 785.15
745.81 7.612%883.' 7.567
9.1X6°/ 5.197°/8.231°/ 5.334°/
6.025°/ 6794.769% 310 540
1997/961936197
192.197.
364. 6 054.234. 6,208 r
10,959.35 MEM7,373.771MM
13.29 455.9213.55 504.73
624. 4.841/544.19 5.218°/
7.968°/ 4.905.9Q3°/ 4.6677
4.96 4864.877/ 550
485592
11; 1' \ A\ Ail Ati ir

Computer Information Systems (CIS)
AcademicYear
Enrollment Majors Success Retention Ucensure ExamsDegreesAwarded
Certificates
AwardedFall Spring Fail Spring Fall Spring Fall Spring Fall Spring Annual Annual
%Change na na 26.09% 8.16% na na na na 29.41% -18.18%2000/01 2,406 2,333 638 636 59.15% 63.16% 81.24% 83.09% 22 91999/00 506 588 17 11
1998/991997/981996197
Note: CIS is new as of Fall 2000. It was formed by collapsing the Computer Science and the Microcomputer Management programs togetherwith a portion of the CADS program
Computer Science
AcademicYear
Enrollment Majors Success Retention Ucensure ExamsDegreesAwarded
Certificates
AwardedFall Spring Fall Spring Fall Spring Fall Spring Fall Spring Annual Annual
%Change na na na na na na na na na na2000/01
1999/00 1,052 1,015 596 422 56.83% 56.57% 80.96% 76.49%1998/99 1,073 1,166 547 593 66.63% 62.86% 85.46% 83.84% 27 161997/98 805 1,191 542 576 64.76% 65.85% 74.97% 81.18% 19 171996/97 704 787 420 495 59.11% 65.78% 73.16% 72.51% 11 11
Note: Beginning Fall 2000, Computer Science was grouped with Mcrccompute Management and part of CADS into Computer Information Systems (CIS).
Digital Media (DM)
AcademicYear
Enrollment Majors Success Retention Ucensure Exams DegreesAAnwardn:
CertificatesAwarded
Fall Spring Fall Spring Fall Spring Fall Spring Fall Spring Annual%Otange na na na na na na na na -26.67% 103.00P/02000/01 896 980 175 164 71.76% 68.78% 83.80% 79.98% 11 341999/00 185 181 15 171999,991997/981996/97
Note: DM is new as of Fall 2000. It is one of three programs created by splitting up the former Computer Applications and Office Systems(CADS) program.
Microcomputer Management
AcademicYear
Enrollment Majors Success Retention Ucensure ExamsDivreesAwarded
CertificatesAwarded
Fail Spring Fall Spring Fall Spring Fall Spring Fall Spring Annual Annual%Change na na na na na na na na na na2000/01
1999/00 63 67 126 0 61.90% 53.73% 88.89% 88.06%1998/99 51 74 116 109 60.42% 6e.69% 91.67% 92.54% 20 91997/98 41 63 136 120 90.00% 79.37% 92.50% 87.30% 23 181996/97 107 88 114 133 62.20% 76.54% 78.05% 95.06% 11 15
Note: Beginning Fall 2000, Mcr000rnputer Management was grouped with Computer Science and part of CAOS into Computer Information Systems (as).
Real Estate
AcademicYear
Enrollment Majors Success Retention Ucensure ExamsDegreesAwarded
CertificatesAwarded
Fall Spring Fall Spring Fall Spring Fall Spring Fall Spring Annual Annual%Change -12.82% -21.74% - 36.36% -20.51% -2.14% -2.65% -1.32% 7.99% -100.03% 100.00%2000/01 102 90 28 31 59.60% 50.56% 71.72% 68.54% 0 1
1999/00 117 115 44 39 61.74% 53.21% 73.04% 60.55% 1 01998/99 85 74 23 26 50.00% 60.29% 73.08% 83.82% 1 01997/98 71 77 42 27 67.16% 61.11% 80.60P/o 75.00% 0 01996/97 62 64 31 36 75.00% 47.37% 90.00% 64.91% 3 0
Small Business
AcademicYear
Enrollment Majors Success Retention Ucensure Exams DecjreesAwarded
CertificatesAwarded
Fall Spring Fall Spring Fall Spring Fall Spring Fall Spring Annual Annual%Change 5.75% 4.72% -34.15% -57.95% -3.31% 17.61% -13.38% 9.38% na na2000/01 92 111 54 37 57.61% 66.67% 72.83% 81.08%1999/00 87 106 82 88 60.92% 49.06% 86.21% 71.70% 21998/99 129 173 81 85 68.00% 64.88% 74.40P/o 83.33% 1 1
1997/98 131 148 86 81 68.00% 70.14% 92.00% 84.72% 0 21996/97 126 49 66 76 63.41% 77.27% 74.80% 95.45% 4 0
62 CABRILLO COLLEGE FACTBO 0 K 2001 73 fi EST COPY AVAILABLE

WSCHIFTEF = LoadFTES. - FTEF Percent of WSCH
. ....".:_ . :. I
Percent of FTEF
. ,:. _
wait Ust
Fall El=1 Fall 111EIMM Fall E=1 Fall E=11 Fall -LMil Fall EI=1 Fall EIM1%Change 0.00% 0.00 °/o 0.00% 0.00% 0.00% 0.00/. 0.00P/o 0.00% 8.24% 8.33°./. 4.13% 3.96% o.co%2000/01 388.91 396.00 1 038.-4 1 338.06 11.78 11.49 1 (21 96 1 071.20 8.244 8.3E05' 4.127/ 3.960V MIM 1831999'00 0.00 0.00 0. 0.00 0.00 0.00 0.00 0.00 0.000'/ 0.0007 0.0007 0.000'/ 0 -
1991809 0. r 0.00 0. 0.00 0.00 0.00 0.00 0.00 0.030V 0.000./ 0.0:07 0.000'/1997/98
199607
VVSC1-VFTEF = Load Percent of WSCH Percent of FTEF
. . .. . :.. -
Waft UstFTES-Fall W=1 Fall
.-M7=M
FTEF
Fall IMI Fall KM, Fall W=1 Fall KM, Fall W=1%Change -103.00% -100.00% -100.00% -100.00% -100.00% -100.00% -100.00% -103.00% -3.72% -3.67% -1.83% -1.66% m230001 0. r 0.00 0. 0.00 0.00 0.00 0.00 0.00 0.010 0.00/ 0.0307 0.000 0199000 173.06 5285.29 5,344.81 5.16 4.88 1,024.28 1095.25 3.717/ 3.6725'. 1.830/ 1.656V 123 m1998199 165. 4,734.66 5,089.75 6.33 835.04 804.0 3.286* 3.6007 2.0665' 2.276/ 146 1721997/98 79 179. r 506.56 5 348.97 4.76 5.28 526.59 1013.06 2.004% 3887/ 1.750°/ 1.971/ 106 1471996'97 70. ea
FIES
235. 2,680.83 4.8 4.93
FTEF
459.01 543.78
VVSCIVREF = Load
1.879°/ 2148*/
Percent of VvSCH
1.848% 1.775V
Percent of FIEF
72 126
I P-:
Weft Ust
Fall Fall MMTE Fall KIIMI Fall EMI Fall E:=11 Fall WM, Fall E=1%Change 0.00% 0.00% 0.00% 0.007° 0.00% 0.0:1% 0.00% 0.00% 4.91% 5.35% 1.E2% 1.99% (la2)0(Y01 232 254.20 7169.
0. r.7 854. :
0.00MriElMffi 1565. 13611 4.910°/ 5.3546/
0.000P/ 0.007/1.6050 1 987/ M.: 365
1999TO 0. r. 0.0) 0.00 0.13) 0.00 0.00 0.037 0.000V i -199809 0. 0.00 0. 0.00 0.00 0.00 0.00 0.00 0.000°/ 0.0007 0.017/ 0.0005'1997/98
1996197
REF WSO-VREF = Load Percent of WSCH Percent of FTEF
,L,:. -; -;:.... :. ,
Walt ListFTES
Fall Fall W74ME Fall WM" Fall 'IU I Fall KM, Fall W=11 Fall 11%Change -100.00% -100.00% - 100.00% -1C0.00% 0.0% 0.00% 0.007. 0.00P/0 -0.09% -0.02% 0.01% 0.00% na200001 0. r r 0.00 0. 0.00 aco 0.00 0.00 0.00 0.0007 0.003°/ 0.0000 0.0007 0199000 MEM 0. 129.60 28.25 0.00 0.00 0.00 0.00
0.00
0.091°/ 0.017/0.108°/ 0.027/
0.00O3/ 0.00 16 na1998199 4 MEE 156. r 39.86 0.23 0.00 781.50 0.077/ 0.007/ 3 81997/98 IIMEMWM 85. 214.36 0.28 02) 306.93 1,071.80 0.069 0.15 0.104 0.0755' 0 91996'97 4. 4.81 129.41 101.08 0. 0.58
FTEF
369.74 174.28
WSCI-VREF = Load
0.107/ 0.081
Percent of VVSCH
0.1335' 0.207/
Percent of FTEF
13 0
r.. -7. ,r, iWait ListFTES- --
Fall Enirl Fall Fall 7 =1 Fall 11=1 Fall WM, Fall K=11 Fall EMTI%change -14.44% -21.23% -14.41% -21.22% 0.00% 0.00% -14.41% -21.22% -0.04% -ao6% 0.00% 0.00%mown 10.31 9. 318. 288. 0.' 0. 707. 641. 0.218°/ 0.197% 0.1587 0.155V MMIE 01999'00 . 11.8
1998'99 8. 270.
366.60
221.00
0.' 0.45 826. 814.. 0.237/ 0.257/ 0.160°/ 0.153°/ . -
0 00 0.25 1060.00 884.00 0.187°/ 0.156°/ 0.091V 0.090'/1997198 6. 8.28 198.00 237.25 0. 0.25 792.00 949.00 0.158% 0.172% 0.092V 0.0937 0 01996'97 6.1 6.41
FTES'
180. r. 177.00
S.
0.40 0.25
FIEF
450.0) 708.00
VVSCI-VFTEF = Load
0.151/ 0.142%
Percent of WSCH
0.157/ 0.0907
Percent of REF
0 0
Wait List
Fall EMTII Fall WME Fall 1=1 Fall 1=1 Fall I -1=1 Fall -L=1 Fall WMTI%Chew 12.57/. 16.38% 13.44% 16.44% 18.57% 54.0070 433% -24.39% 0.01% 0.027. 0.04% 0.10% na=cm MIFE19900 4.
6.11MIMI/KMMN= 130. r
163.60
334.22
o. 0. 211.51 0.127/ 0.130./ 0.2917 0.265V IMO 2)na
25 33
0.70 0.50 221.07978.88
227.20 0.107/ 0.11200.115'! 0.236°/
0.248 0.170V199IY99 EWE 10.7' 166.41 0.1 0.33 1,012.79 0.062°/ 0.119°/1997/98 IMIM 250 91.r. 79.31 0.20 0. 455.30 293.7' 0.0737 0.067/ 0.074 0.101 18 451936w IlmE 0.91
111 '''' i Is';ii
67.'
\,kil
28.86
413
0. 0.10
r
2322 288.60 0.057°/ 0.023'
: . III
0.1105' o.ozisv
I/ ;SS
0 36
II

Biology, Environment, Chemistry & Health Occupations DivisionAllied Health
AcademicYear
Enrollment Ma ors Success Retention Ucensure ExamsDegreesAwarded
CertificatesAwarded
Fall Spring Fall Spring Fall Spring Fall Spring Fall Spring Annual Annual% Change -11.71% -13.64% 0.00% 0.00% -7.73% -1.94% -7.79% -9.18% na na2000/01 181 171 60.56% 58.48% 76.11% 68.42%1999100 205 198 0 0 68.29% 60.42% 83.90% 77.60%1998199 159 210 0 0 63.45% 67.17% 85.52% 77.27% 0 01997/98 54 104 0 0 86.27% 76.47% 92.16% 85.29% 01996197 0 0 0 0 0.00% 0.00% 0.00% 0.00% 0
Biology
AcademicYear
Enrollment Majors Success Retention Ucensure ExamsDegreesAwarded
Cert
Awaifirded
cates
Fall Spring Fall Spring Fall Spring Fall Spring Fall Spring Annual Annual%Change -4.19°/0 -11.62% 1.67% 0.42% -0.03% -1.17% -1.94% 0.90% 0.00% na2000101 983 1,004 243 239 76.23% 75.05% 81.05% 8253% 4 01999100 1,026 1,136 239 238 76.26% 76.22% 82.99% 81.63% 4 01998/99 1,003 1,029 268 260 78.95% 81.85% 82.77% 86.44% 1 01997/98 979 779 286 284 77.99% 78.83% 84.44% 88.05% 4 01996/97 1,056 1,020 295 300 73. 49% 74.95% 81.48% 79.49% 0 0
Chemistry
AcademicYear
Enrollment Ma ors Success Retention Ucensure ExamsAwarded Awarded
Fail Spring Fall Spring Fall Spring Fall Spring Fall Spring Annual Annual%Change -17.98% -15.48% -21.88% -22.58% 4.16% -0.14% 1.65% -2.90% na na2000101 374 404 25 24 m 39% 72.70% 80.11% 80.89% 6 01999100 456 478 32 31 69.23% 72.84% 78.46% 83.79%1998/99 432 434 35 34 68.30% 70.29% 83.29% 83.57% 0 01997/98 458 334 40 36 68.98% 72.49% 80.32% 85.76% 0 01998197 451 428 43 44 69.75% 74.00% 79.45% 83.45% 0 0
Construction & Energy Management
AcademicYear
Enrollment Majors Success Retention Ucensure ExamsDegreesAwarded
Certificates
AwardedFall Spring Fall Spring Fall Spring Fall Spring Fall Spring Annual Annual
% Change 16.67% -16.90P/0 9.68% -22.78% -100.00% -100.00% -100.00% -100.00% -75.00% 100.00%2000101 161 177 68 61 1 1
1999100 138 213 62 79 58.70% 58.69% 72.46% 66.67% 4 01998/99 176 150 71 71 69.19% 69.17% 84.88% 83.46% 41997/98 183 156 68 73 66.48% 64.19% 80.11% 79.05% 2 1
1996197 153 168 61 69 67.33% 60.61% 84.67% 75.76% 3
Dental Hygiene (* Enrollment counts for Dental Hygiene represent "program.' enrollment rather than "course" enrollment.)
AcademicYear
Enrol ment* Majors Success Retention Ucensure ExamsDegreesAwarded
Certificates
AwardedFall Spring Fall Spring Fall Spring Fall Spring Fall Spring Annual Annual
% Change -7.14% -9.52% -4.52% -14.04% 6.49% 2.13% -1.21% 1.77% 0.00% na 0.00% na2000/01 39 38 169 147 93.75% 100.00% 96.43% 100.00% na 19
1999100 42 42 177 171 87.26% 97.87% 97.64% 98.23% 100% 191998/99 40 42 159 149 94.68% 99.60% 97.34% 99.60% 95% 20 01997/98 40 38 164 151 97.65% 99.61% 97.65% 99.61% 100% 21 01996/97 40 40 143 149 97.41% 99.59% 100.00% 100.00% 100% 19 0
Horticulture
AcademicYear
Enrollment Majors Success Retention Ucensure ExamsDegreesAwarded
CertificatesAwarded
Fall Spring Fall Spring Fall Spring Fall Spring Fall Spring Annual Annual%Charge -3.55% 16.27% -15.45% -4.24% 5.18% -7.01% 4.25% -2.52% -23.08% 66.67%2000/01 299 343 104 113 78.21% 74.46% 87.14% 87.69% 10 51999/00 310 295 123 118 73.03% 81.47% 82.89% 90.21% 13 31998199 310 322 140 124 8227% 74.01% 92.91% 87.50% 9 41997/98 303 261 160 140 75.96% 85.77% 83.28% 94.31% 11 31996/97 334 328 146 154 84.05% 81.90% 91.03% 89.21% 10 6
64 CABRILLO COLLEGE FACTBO OK 2001
75BEST COPY AVAILABLY,
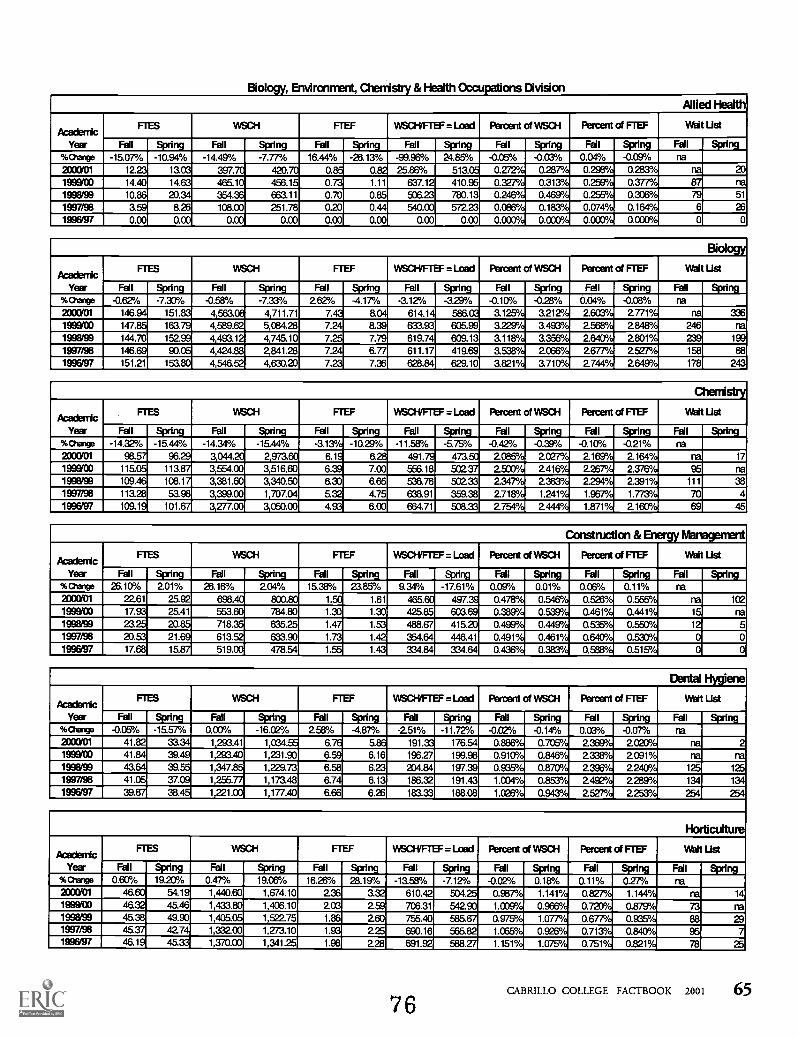
:a ,:.-
1110
:.-.1
.:..:
..W
SC
I-VF
TE
F =
Load
-: .....
e- .,1
FT
ES
.. _
-t.R
EF
Percent of V
VS
CH
Percent of F
IEF
Wait List
-F
allE
l=1
Fall
-M1M
/MF
allM
MT
EF
ailW
M111
Fall W
W1
Fall
WM
T1
Fall E
=1
%C
hange-15.07%
-10.94%-14.47Y
.-7.77%
16.44%-26.13%
-99.96%24.85%
-0.05%-0.03%
0.04%-0.07/0
na
200001 IMM
4 ME
E397.
420.I
0.0.
25.86% W
SW
:0.272°/
0.287/0.2937
0.23/20
1999W14.40 M
irjEc
199819910.:.
20.
465.1 a456.15
354.6E
2.11
0.1.11
0.700.85
627.12410.95
606.23780.13
0.327°/0.313%
0.246%0.469%
0.257/0.3777
0.255%0.307/
:na
7951
1997/98c
8.26108.00
251.780.20
0.44540.00
572.230.086°/
0.183%0.074%
0.164/0.000°/
0.000°/
Percent of F
IEF
6X
I0
0
:. ..)A
Wait List
19961970.00
0.00
FT
ES
0.0)0.00
-
0.000.0)
FIE
F
0.000.00
WS
CI-V
FT
EF
= Load
0.1000'/0.000/
Percent of W
SC
H
-F
all 1=1
Fall
MI=
EF
all EM
Fall
WM
:IF
all KM
,F
allK
Mni
Fall
-ET
M,
%C
hime
-0.62%-7.30%
-0.58%-7.33%
2.62%4.17Y
,-3.12%
-3.29%-0.10%
-0.23%0.04%
-0.03°/.nE
t
2000Y01
146. WR
IT4 563.
4 711.71MalE
8.614.1-
586. ec3.125%
3.21272.6337
27717IMO
336
1999W =
LW,
163.4,589.
5,334.28ME
E8.39
633.93605.99
3.227/3.497/
2568/2848
246na
1998/99 IIME
M M
4 .4 493.1
4 745.10ME
.7.79
619.74609.13
3.118°/3.3567
2640"2.80
239199
1997/98146.
90. r.1996/97
151.21193.80
FTFS
4 424.88841.28
4,546.524,1330.20
-A.
ME
E6.77
11.1M4
7.36
FT
EF
611.17419.69
a9380/2.06
2677°/2527%
2744%26497
Percent of F
IEF
15868
178243
S.:.
-'I4
Wait List
628.84629.10
WS
CI-V
FT
EF
= Laid
3.821°/3.7106/
Ftercent of W
SC
H
Fall
Fall
Fall
Fall
Fall
Fall
Fall
%C
harge- 14.32%
-15.44%-14.34%
-15.44%-3.17/
-10.29%-11.58%
-5.75%-040/o
-0.39%-0.10%
-021%na
2000/0198.
96.3 044.
2 973.6.1
6. is491.
473.I
2087/2027°/
2169'/2164°/M
:17
19E6100
I.113.8
1996199109.
108.1
1997/98-4
53.98
3 554.003 516.60
3,381.603,340.50
6.7.006.654.75
556.1890e.
2.5003/2.416%
2267°/237
95na
6.33
MgE
53E.76
502.33
638.91359.38
2347°/236
2718%1.241/
2294/23917
1.967°/1.773%
11136
704
3,399.001,707.04
1996197109.1
101..3 277.00
3 050.00Mr,E
6.00664.71
508.33
VV
S(X
FIE
F =
Load
2754%2444°/
Percent of W
SC
H
1.871%2.1607
......-
..
Ascent of F
IEF
6945
:..1,
:..-;
. :_:.
Wilt List
FT
ES
-F
TE
F
Fall
11=1
Fall
Fall
EM
PIII
Fall
MIM
EF
all WM
,F
all WM
,F
allK
-7'...1%
Charge
26.10%201%
26.16%2.04%
15.38'/o23.85%
9.34%-17.61%
0.07/.0.01%
0.06%0.11%
na200001
22.6125.92
698.800.M
E1.61
465.497. a
0.478°/0.546°/
0.520.556IN
IM102
1999100M
c,25.41
553.784.80
1.331.30
425.85603.69
0..%).9°/
0.537/0.461/
0.441°/15
na1998/99
23.20.:
718.635.25
1.41.53
488.67415.20
0.497/0.449°/
0.535%0.553Y
125
1997/9820. O
WE
:613.
633.901.42
354.64446.41
0.490.461°/
0.643/0.530°/
00
1996197V
L15.8
519. e I478.
l1.43
334.84334..'
0.436%0.38
0.588%0.517/
00
FT
ES
- «.F
TE
FW
SC
WF
TE
F =
LoadP
ercent of VI/5C
HP
ercent of RE
F
II:- i.gl:-
-
Wait List
Fall
E:=
1F
allF
all E=
1F
all WM
,F
all KM
"F
allW
7=1
Fall
KM
%%
Charge
-005%-15.57%
0.30° /.-16.02%
2.58%-4.87%
-2.51%-11.72%
-0.02%4114%
0.03%-0.07%
na2000/01
41.33.
1 293411 034.
6. M2E
-191. c
176.540.636°
0.702367/
2020!!'-1
21999/00
41.:39.
199819943.
39.
1293.401,231.90
1 347.1,229.73
6.6.16
6.586.23
196.27199.98
204.84197.39
0.910/0.846°/
0.935°/0.870'/
2336%20916/
239772247/
m125
125
1997/98 MilE
. ME
RE
1 255.1,173.48
6.76.13
186.32191.43
1.004°/0.857/
2.492%2287/
.134
199619739.:
38.
FT
ES
1221.001177.40
-
6.666.26
RE
F
183.33188.08
VV
SC
H/F
rEF
= Load
1.027/0.943°/
Percent of W
SC
H
25276/2253°/
Ftrcent of F
IEF
254254
.,
.-II
-
Wait List
Fall E
=I
Fall
NO
ME
Fail
Fall
E:=
1F
ailF
all WM
,F
all-E
-Mni
%chim
e0.67/0
19.20%0.47%
19.07/.16.26%
28.19%-13.98%
-7.12%-0.02%
0.18%0.11%
0.27%na
20011/0146. -I =
MIE
1440.601,674.10
2363.32
610.42504.25
0.987°/1.14W
0.827/1.1447
111111014
19991(046.
45.46
1998199 IMM
49.9)1997/98
427
1 433.801 406.10
1 4C6.
1 522.75 ME
M1.86
MB
E259
7136.31
260755.40
225690.16
54290585.
565.82
1.337/0.966%
0.975%1.077°/
1.0670.926°/
0.723/0.8797
738895
.:
2970.677/
0.935'/0.713
0.843/133200
1,273.101996197
46.1 M3E
c1370.00
1,341.25 MB
E2.28
691.92588.
1.151%1.07
0.751%0.8217
7825
::
II

Medical Assistant
AcademicYear
Enrollment Majors Success Retention Licensun) ExamsDegreesAwarded
CertificatesAwarded
Fall Spring Fall Spring Fall Spring Fall Spring Fall Spring Annual Annual% Change -17.20% -25.75% -19.76% -26.32% 2.31% -0.49% 3.16% -3.55% 20.00% -43.48%2000/01 385 320 134 112 70.37% 70.25% 82.01% 80.38% 6 131999/00 465 431 167 152 68.06% 70.74% 78.85% 83.93% 5 231998/99 533 437 188 182 66.74% 66.58% 79.75% 75.19% 13 171997/98 473 442 179 169 73.94% 72.36% 83.10% 87.50% 11 171996/97 438 482 152 186 77.46% 74.17% 84.17% 85.21% 9 24
Nursing (* Enrollment counts for Nursing represent "program" enrollment rather than ' course" enrollment.)
AcademicYear
Enrollment* Majors Success Retention Ucensure Exams DegreesAwarded
CertificatesAwarded
Fall Spring Fall Spring Fall Spring Fall Spring Fall Spring Annual Annual5.00% 5.00% -8.43% -14.02% -0.39% -2.33% -1.23% 0.29% 0.00% na 14.71% na
2000/01 42 42 304 282 94.15% 93.82% 94.40% 96.76% na 391999/00 40 40 332 328 94.54% 96.15% 95.63% 96.47% 93% 341998/99 38 38 359 359 84.42% 94.99% 86.93% 96.57/e 88% 44 01997/98 40 40 322 325 88.83% 95.63% 89.35% 98.54% 97% 42 01996197 40 40 361 335 93.47% 96.16% 96.23% 96.68% 100% 36 0
Radiologic Technology (* Enrollment counts for Radiologic Technology represent "program" enrollment rather than "course" enrollment.)
AcademicYear
Enrollment' Majors Success Retention Ucensure ExamsDegreesAwarded
Ce
AwartificatesrdedFall Spring Fall Spring Fall Spring Fall Spring Fall Spring Annual Annual
% Change 11.11% -41.67% -22.47% -7.50% -5.12% 2.60% -9.18% 1.86% 0.00% 0.00% 0.00% na2000/01 20 7 69 74 89.44% 96.67% 90.14% 96.67% 100% 11
1999/00 18 12 89 80 94.56% 94.07% 99.32% 94.81% 100% 11
1998199 20 15 84 84 89.94% 95.16% 91.62% 99.46% 100% 161997/98 19 13 81 86 95.48% 100.00% 97.18% 100.00% 100% 13 01996/97 18 23 100 99 97.14% 99.18% 100.00% 99.18% 100% 26 0
Counseling & Guidance Division
Counseling & Guidance
AcademicYear
Enrollment Ma ors Success Retention Ucensure ExamsDegreesAwarded
CertificatesAwarded
Fall Spring Fall Spring Fall Spring Fall Spring Fall Spring Annual Annual%Change -11.19% 14.07% 0.00% 0.00% -10.12% -7.67% -1.60% -0.63% na na2000/01 619 665 59.71% 61.70% 78.14% 77.36%1999/00 697 583 0 0 69.87/o 69.37% 79.74% 77.99%1998/99 1,634 643 0 0 72.99% 67.67% 86.01% 81.85% 0 01997/98 1,505 1,529 0 0 68.53% 63.17% 76.97% 77.14% 0 0
1996/97 780 738 0 0 73.52% 63.57% 81.54% 72.86% 0 0
English Division
English
AcademicYear
Enrollment Majors Success Retention Ucensure ExamsDegrees
AwardedCertificatesAwarded
Fall Spring Fall Spring Fall Spring Fall Spring Fall Spring Annual Annual%Change 1.64% -4.30% -23.29% -26.92% -3.26% 2.04% -1.11% 3.42% -33.33% na2000/01 4,521 3,942 191 171 64.61% 64.82% 75.88% 74.78% 21999/00 4,448 4,119 249 234 67.87% 62.78% 76.99% 71.36% 31998199 4,284 4,359 262 263 71.51% 63.26% 80.48% 72.70% 0 01997/98 4,337 4,203 253 244 66.36% 66.33% 73.63% 74.72% 0 01996/97 4,450 4,121 270 265 66.58% 62.27% 74.59% 69.34% 3 0
English as a Second Language
AcademicYear
Enrollment Majors Success Retention Ucensure Exams DegreesAwarded
CertificatesAwarded
Fall Spring Fall Spring Fall Spring Fall Spring Fall Spring Annual Annual% Change -9.96% 9.23% 0.00% 0.00% -0.31% 3.01% -3.74% -0.14% na na2000/01 479 509 66.67% 74.75% 78.13% 82.25%1999/00 532 466 0 1 66.98% 71.74% 81.87% 82.39%1998199 518 546 0 0 72.95% 69.59% 82.17% 79.66% 0 01997/98 522 499 0 0 75.35% 75.52% 85.66% 84.44% 0 01996/97 499 514 0 0 75.31% 70.28% 85.98% 78.11% 0 0
66 CABRILLO COLLEGE FAL 'BOOK 2001 77

Medcal Assistant
AcademicYear
FTES WSCH FTEF WSCH/FTEF = Load Percent of WSCH Percent of FTEF Wait List
Fall Spring Fall Spring Fall Spring Fall Spring Fall Spring Fall Spring Fall Spring%Change -1.52% -2218% -1.35% -22.01% 9.62% -2.30% -10.01% -20.18% -0.04% -0.22% 0.08% -0.01% na2000/01 41.55 35.89 1,290.79 1,115.27 2.85 2.55 45291 437.36 0.884% 0.760% 0.999% 0.879% na 01999'00 42. 19 46.12 1,308.49 1,430.10 2.60 2.61. 503.27 547.93 0.921% 0.983% 0.922% 0.886% 18 na1998199 57.63 45.20 1,785.94 1,366.12 2.70 2.35 661.46 581.33 1.240% 0.966% 0.983% 0.845% 28 171997/98 44.09 47.94 1,299.59 1,406.11 2.65 2.50 490.41 56244 1.039% 1.022% 0.980% 0.933% 12 21996/97 39.63 45.49 1,174.05 1,359.14 2.67 2.38 439.72 571.07 0.987% 1.089% 1.013% 0.857% 12 5
Nursing
AcademicYear
FTES WSCH FTEF WSCH/FTEF = Load Percent of WSCH Percent of FTEF Wait List
Fail Spring Fall Spring Fall Spring Fall Spring Fall Spring Fall Spring Fall Spring%Change 5.98% 9.33% 5.44% 9.45% -9.15% -387% 16.06% 13.86% 0.03% 0.11% -0.31% -0.07% na2000101 63.49 6201 1,960.70 1,973.40 7.84 8.44 250.09 233.82 1.343% 1.345% 2747% 2.909% na 61
1999/00 59.91 56.72 1,859.55 1,803.02 8.63 8.78 215.48 205.36 1.308% 1.239% 3.061% 2.980% 12 na1998/99 64.27 63.17 1,993.47 2,013.66 9.41 10.39 211.85 193.81 1.384% 1.424% 3.426% 3.736% 17 171997/98 68.94 57.49 2,084.10 1,776.54 9.78 9.29 213.10 191.23 1.666% 1.292% 3.616% 3.468% 381996'97 65.33 63.49 1,973.13 1,972.03 9.61 10.03 205.32 196.61 1.658% 1.580% 3.647% 3.610% 63 63
Radlologic Technology
AcademicYear
WSCH FTEF WSCH/FTEF = Load Percent of WSCH Percent of FTEF Wait List
Fall Spring Fall Spring Fall Spring Fall Spring Fall Spring Fall Spring Fall Spring%Change 27.21% -19.11% 28.96% 40.08% 0.00% 10.67% 28.96% 26.58% 0.11% 0.22% -0.01% 0.06% na na2000'01 25.43 20.99 805.24 1,132.88 1.35 1.66, 596.47 682.46 0.551% 0.772% 0.473% 0.572% na 01999'03 19.99 25.95 624.40 808.73 1.35 1.50 462.52 539.15 0.439'k 0.556% 0.479% 0.509% na na1998/99 25.84 36.64 805.24 1,132.88 1.35 1.66 596.47 682.46 0.559% 0.801% 0.492% 0.597% 7 71997/98 31.16 3240 957.70 989.87 1.34 1.64 714.70 603.58 0.766% 0.7200/ 0.495% 0.612% 15 151996(97 17.31 31.45 533.20 983.63 1.26 1.23 423.17 799.70 0.448% 0.788% 0.478% 0.443% 11 11
Counseling & Guidance Division
Counseling & Guidance
AcademicYear
FTES WSCH FTEF WSCH/FTEF = Load Percent of WSCH Percent of FTEF Walt List
Fall Spring Fall Spring Fall Spring Fall Spring Fall Spring Fall Spring Fall Spring%Change -16.80% 9.89% -9.83% -5.67% -5.78% -64.33% -4.30% 164.46% -0.13% -0.05% -0.06% -1.08% na na2000/01 38.79 41.32 1,357.76 1,141.29 2.12 1.78 640.45 641.17 0.930% 0.778% 0.743% 0.613% na 71999/00 46.62 37.60 1,505.81 1,209.83 2.25 4.99 669.25 242.45 1.059% 0.831% 0.798% 1.694% na na1998199 42.31 35.45 1,357.76 1,141.29 2.12 1.78 640.45 641.17 0.942% 0.807k 0.772% 0.640% 38 171997/98 42.00 40.39 1,295.80 1,243.74 2.36 219 549.07 567.92 1.036% 0.904% 0.872% 0.818% 14 7
1996/97 41.06 41.38 1,285.00 1,292.20 1.94 208 66237 621.25 1.080% 1.035% 0.736% 0.749% 17 6
English Division
English
AcademicYear
FTES WSCH FTEF WSCH/FTEF = Load Percent of WSCH Percent of FTEF Walt List
Fall Spring Fall Spring Fall Spring Fall Spring Fall Spring Fall Spring Fall Spring%Change 1.04% -4.68% 1.08% -4.85% 1.91% a 18% -0.81% -7.78% -0.14% -0.43% 0.07% 0.47% na na2000/01 394.32 344.56 12,234.50 10,688.33 29.42 30.21 415.86 353.80 8.378% 7.286% 10.308% 10.412% na 8681999/00 390.26 361.48 12,103.38 11,232.97 28.87 29.28 419.24 383.64 8.515% 7.718% 10.241% 9.908% 845 na1998199 374.63 346.70 11,667.80 10,783.90 27.47 28.77 424.75 374.83 8.098% 7.627% 10.003'k 10.346% 789 5341997/98 361.66 373.03 10,909.27 11,246.55 28.28 29.49 385.76 381.37 8.722% 8.177% 10.455% 11.009% 828 4601996/97 353.69 341.10 10,690.54 10,281.74 29.14 31.32 366.87 328.28 8.985% 8.2380/ 11.058% 11.274% 529 407
English as a Second Language
AcademicYear
FTES WSCH FTEF WSCH/FTEF = Load Percent of WSCH Percent of FTEF Wait List
Fall Spring Fall Spring Fall Spring Fall Spring Fall Spring Fall Spring Fall Spring%Change -6.81% 11.22% -6.73% 11.05% -2.62% 7.47% -4.21% 3.33% -0.15% 0.15% -0.09% 0.19% na na2000/01 68.80 75.91 2,132.34 2,351.16 6.68 6.62 319.21 355.16 1.460% 1.603% 2.341% 2282°k na 371999'00 73.83 68.25 2,286.12 2,117.20 6.86 6.16 333.25 343.70 1.608% 1.455% 2433% 2091% 2 na1998/99 75.78 75.79 2,350.43 2,347.01 7.15 6.78 328.73 346.17 1.631% 1.660% 2.604% 2.438% 16 1
1997/98 81.46 77.54 2,449.68 2,337.44 7.51 6.81 326.19 343.24 1.959% 1.699% 2776% 2.542% 0 51996197 81.56 84.68 2,455.24 2,546.67 6.48 7.29 378.90 349.34 2063% 2040% 2459% 2.624% 14 17
EST COPY AVAILAMA 7 CABRILLO COLLEGE FACTBOOK 2001 67

Humanities
AcademicYear
Enrollment Majors Success Retention Ucensure ExamsDegreesAwarded
CertificatesAwarded
Fall Spring Fall Spring Fall Spring Fall Spring Fall Spring Annual Annual%Change 0.00% 0.00% 0.00% 0.00% na na2000/011999/00 0 0 0 0
1998/99 0 0 0 0 0 01997/98 30 0 0 0 69.23% 69.23% 0 01996197 0 0 0 0 0 0
Journalism
AcademicYear
Enrollment Ma ors Success Retention Ucensure ExamsDegreesAwarded
Certificatp-s
AwardedFall Spring Fall Spring Fall Spring Fall Spring Fall Spring Annual Annual
%Change -23.64% 40.98% -10.34% -8.33% -4.84% 3.05% -9.91% -0.53% 0.00% na2000101 84 86 52 44 58.02% 78.05% 69.14% 87.80% 1
1999100 110 61 58 48 62.86% 75.00% 79.05% 88.33% 1
1998199 114 103 67 60 84.55% 74.00% 87.27% 80.00% 5 21997/98 111 120 70 70 70.19% 76.32% 76.92% 84.21% 1 01996/97 102 122 61 78 74.75% 74.78% 80.81% 76.52% 1 1
Reading
AcademicYear
Enrollment Majors Success Retention Ucensure Exams DegreesAwarded
CertifiwacatesArdedFall Spring Fall Spring Fall Spring Fall Spring Fall Spring Annual Annual
%Change 0.00% -6.81% 0.00% 0.00% 0.13% 12.69% -9.59% 1.94% na na2000101 599 424 57.10% 57.78% 76.46% 77.83%1999100 599 455 0 0 56.97% 45.09% 86.05% 75.89%1998199 699 441 0 0 60.92% 55.08% 90.34% 90.31% 0 01997/98 652 533 0 0 56.37% 52.96% 85.83% 88.93% 0 01996197 582 515 0 0 49.91% 50.20% 85.74% 86.40% 0 0
Foreign Language and Communications Division
Bilingual/BicUltural Studies
AcademicYear
Enrollment Majors Success Retention Ucensure ExamsDegreesAwarded
CertificatesAwarded
Fall Spring Fall Spring Fall Spring Fall Spring Fall Spring Annual Annual
%Change 0.00% 0.00% -6.25% -7.14% na na2000101 15 131999(00 0 13 16 14 100.00% 100.00% 1
1998/99 0 0 21 24 1 01997/98 0 0 23 21 0 01996/97 0 16 22 19 78.57% 78.57% 1 0
Criminal Justice
AcademicYear
Enrollment Majors Success Retention Ucensure ExamsDegrees
AwardedCertificatesAwarded
Fail Spring Fall Spring Fall Spring Fall Spring Fall Spring Annual Annual%Change -49.03% -74.13% -21.45% 34.41% -4.52% -7.31% -3.34% -4.05% 31.25% na2000101 472 785 216 250 84.19% 88.71% 90.36% 93.70% 21
1999100 926 3,034 275 186 88.71% 96.02% 93.70% 97.75% 161998/99 1,092 876 278 249 90.21% 87.24% 94.87% 92.69% 1 01997/98 1,167 1,213 258 273 92.13% 89.81% 96.11% 94.32% 5 01996/97 467 1,025 244 268 77.24% 70.78% 92.12% 75.32% 2 0
Developmental Studies
AcademicYear
Enrollment Majors Success Retention Ucensure Exams DegreesAwarded
CertificatesAwarded
Fall Spring Fall Spring Fall Spring Fall Spring Fall Spring Annual Annual%change -100.00% -100.00% 0.00% 0.00% -100.00% -100.00% -100.00% -100.00% na na2000101
1999100 55 2 0 0 59.26% 100.00% 88.89% 100.00%1998199 50 75 0 0 78.72% 56.06% 87.23% 72.73% 0 01997/98 114 110 0 0 62.50% 69.16% 79.46°/0 75.70% 0 01996,97 109 129 0 0 77.14% 78.23% 79.05% 82.26% 0 0
68 CABRILLO COLLEGE FACTBOOK 2001
79

.-.... FTES el. FIEF WSCH/FIEF = Load Percent of WSCH Percent of FIEF
- -Wait Ust
-- Fall 10=1 Fall -MMTE Fall 1E= Fall 10=1 Fall K4=1 Fall -KM.-1 Fall -K7MMv. champ 0.00% 0.00% 0.00% 0.30% 0.00% 0.00% 0.00% 0.00% 0.00% 0.30% 0.00% 0.00% na na200001 0.00 0.00 0.00 0.00 0.00 0.00 0.00 0.00 0.000% 0.000 0.000/ 0.30V 0 01991300 0.00 0.00 0.00 0.00 0.00 0.00 0.00 0.00 0.000% 0.000V 0.030 0.000% 0 01996199 0.00 0.00 0.00 aoo 0.00 aim 0.00 0.00 0.000% 0.000% 0.3007 0.000% 0 01997/96 - 0.00 74.98 0.00 0.20 0.00 374.90 0.00 0.060% 0.000% 0.074/ 0.000% 0 01996197
..-- ..
0.00 0.00
FTES
0.00 0.00
o.
0.00 0.00
FTEF
0.00 0.00
WSCH/FIEF= Load
0.000°/.
Percent
0.000% 0.000% 0.000% 0 0
of WSCH Percent of FTEF
. .
Wait List
--* Fall IUMI Fall I KMIR Fall 1=1 Fall K4MTI Fall L4=1 Fa0 -10=1 Fall -&M1:1%Change - 14.88% 36.11% -14.61% 36.29% 0.00% 1.48% -14.61% 34.30% -0.05% 0.06% -0.01% 0.01% na na200001 10.8 10.93 337.10 338.00 1.62 1.37 208.09 246.72 0231% 0.230% 0.568 0.472% na 919991001996199 14.6
8.031266
394.80454.10
248.00386.05
1.62 1.351.42 1.38
243.70319.79
183.70279.75
0.278%0.315%
0.170h0.273%
0.5°/0.517/
0.458h0.496%
11 na11 12
1997/96 12.90 15.38 383.1 452.50 1.15 1.42 333.17 318.66 0.306% 0.329% 0.425% 0.530% 15 221996197 12.76 1363
FTES
379.: 40335 1.53 1.66
FTEF
248.26 242.98
WSCWFTEF = Load
0.319% 0.3237
Percent of WSCH
0.581
Percent
0.598%
of FIEF
6 1
Wait Ust
--- Fall E7M71 Fall WrMil Fall K4=I Fall WM01 Fall K4M71 Fall 110=1 Fall -L=%mange
1.09% -0.90% 1.10% -0.88% -11.78% -8.21% 14.60% 7.99% -0.02% -0.01% -0.14% -aos% na na200001 43.40 33.0 1,363.62 1,044.85 MEffi 257 492.28 406.56 0.934% 0.712% 0.9716/ 0.886% 43 81999/00 42. 33.37 1,348.79 1,054.10 3.14 283 429.55 376.46 0.949% 0.724% 1.114 0.950% na1996199 52.78 32.68 1,666.13 1,032.04 2.79 274 597.18 376.66 1.156% 0.730 1.016°/ 0.985% 43 21997/96 44.8 37.99 1375.95 1,163.83 2.73 273 504.01 426.31 1.100% 0.846% 1.0097 1.019% 33 91996197 37.01 34.10 1135.61 1,051.00
:._
2.73
. : .
253-; ,- .
415.97 415.42
. -:
VVSCHIFTEF = Load
0.954% 0.842%
1 .
Percent of WSCH
1.036°/ 0.911%
Percent of FTEF
20 1
F ; ' Or .,-
Wait UstFTES FTEF
_-. Fall 1=1 Fall =. Fall -E":=1 Fall 11E=1 Fall 1E4=71 Fall Kr=11 Fall KM71%annoy 0.00% -100.00% 0.00% -100.00% 0.00% -100.00% 0.00% - 100.00% 0.00% -0.03% 0.00% -0.07% 0.00% na200001 0.00 0.00 0.00 0.00 0.00 0.00 0.00 0.00 0.000% 0.0007 0.0007 0.0007. 0 01999(00 0.00 1.35 0.00 41.60 0.00 0.20 0.00 208.00 0.030% 0.0297 0.0007 0.068% 0 01996199 0.00 0.00 0.00 0.00 0.00 0.00 0.00 0.00 0.000% 0.000% 0.000% 0.300% 0 01997/96 0.00 0.00 0.00 0.00 0.00 0.00 0.00 0.00 0.000% 0.000% 0.000`/ 0.030% 0 01 97 0.00 0.00 48.00 0.00 0.20
FTEF
0.00 240.00
VVSCH1FTEF = Load
0.000% 0.038
Percent of WSCH
0.0007 E1 1 r&211:1:1
Percent of FTEF Wait ListFTES
- Fall 10=11 Fall M-41=. Fall KM7I Fall L4Mil Fall K.4=1 Fall El=11 Fall =I%ming. -12.46% -21.13% -12.93% -21.79% -15.68% -16.27% 325% -6.60% -0.18% -0.45% -0.22% -0.17% na na200001 46. 71.59 1,445.48 2,265.83 312 278 463.29 815.05 0.993% 1.545% 1.093/ 0.958% 12 491999(001996/99
,
58.90.7750.08
1,660.201,843.91
2897.171,544.87
3.70 3323.96 3.51
448.70465.63
872.64440.13
1.168%1.280%.
1.9911.093
1.127%1.442 1.2627.
na 1=00 6
1997/96 55.30 60.06 1683.97 1,815.73 4.16 373 404.80 486.79 1.346% 1.320%. 1.5337 1.393%. 0 81996197 51.0 52.26 1,539.56 1,579.70 aso 4.16
FTEF
394.76 379.74
VVSCHFTEF = Load
1.294% 1.266%
Ftrcent of WSCH
1.483 1.497%
D
Percent of FTEF
3 2
AvAL: . --...
Walt List...-
FTES lit
-- Fall K47=1 Fall -IIEMI Fall K41=1 Fall IL=1 Fall K4=71 Fall -W=1 Fall -E=111%Chow -100.00% -100.00% -100.00% -100.00% -100.00% na -100.30% na -0.08% 0.00% -0.14% 0.00% na na200001 0.00 0.00 0.00 0.00 0.00 0.00 0.00 0.00 0.000% 0.000% 0.003 0.000% 019991001996/99
MEM350
0.12 115.804.65 108.00
4.00144.66
0.390.43
0.00 296.920.62 251.16
0.00 0.081%233.32 0.075
0.00 0.1330.102 0.157/
0.000% 0 na0.223% 0 3
1997/96 7.52 8.23 226.00 247.00 0.92 0.79 245.65 31266 0.181% 0.180 0.3407 0.295% 28 251996/97 n0-=FM 218.00 254.00=17E;17A ..-fTV9-,.. WILVI: MO< 1 702 MR172 =MO iEl
'
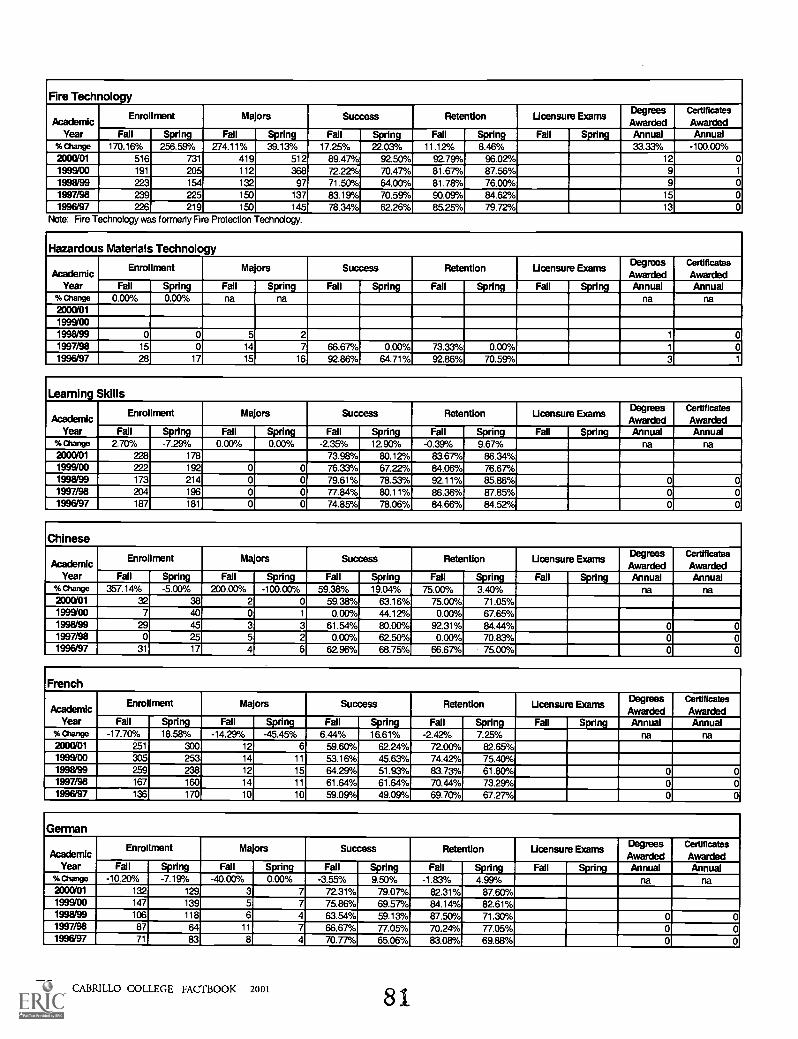
Fire Technology
AcademicYear
Enrollment Ma ors Success Retention Ucensure ExamsDegreesAwarded
Ce rtcatAwaifirded
es
Fall Spring Fall Spring Fall Spring Fall Spring Fall Spring Annual Annual%Change 170.16% 256.59% 274.11% 39.13% 17.25% 22.03% 11.12% 8.46% 33.33% - 100.00%2000101 516 731 419 512 89.47% 92.50% 92.79% 96.02% 12 01999/00 191 205 112 368 72.22% 70.47% 81.67% 87.56% 91998/99 223 154 132 97 71.50% 64.00% 81.78% 76.00% 9 01997/98 239 225 150 137 83.19% 70.59% 90.09% 84.62% 15 01996/97 226 219 150 145 78.34% 62.26% 85.25% 79.72% 13 0
Note: Fire Technology was formerly Fire Protection Technology.
Hazardous Materials Technology
AcademicYear
Enrollment Majors Success Retention Ucensure ExamsDegreesAwarded
CertificatesAwarded
Fall Spring Fall Spring Fall Spring Fall Spring Fall Spring Annual Annual%theme 0.00% 0.00% na na na na2000/011999/001998199 0 0 5 2 1 01997/98 15 0 14 7 66.67% 0.00% 73.33% 0.00% 1 01996197 28 17 15 16 92.86% 64.71% 92.86% 70.59% 3 1
Learning Skills
AcademicYear
Enrollment Majors Success Retention Ucensure ExamsDegreesAwarded
CertificatesAwarded
Fall Spring Fall Spring Fall Spring Fall Spring Fall Spring Annual Annual% Change 2.70% -7.29% 0.00% 0.00% -2.35% 12.90% -0.39% 9.67% na na20011/01 228 178 73.98% 80.12% 83.67% 86.34%1999/00 222 192 0 0 76.33% 67.22% 84.06°/0 76.67%1998199 173 214 0 0 79.61% 78.53% 92.11% 85.86% 0 01997/98 204 196 0 0 77.84% 80.11% 86.36% 87.85% 0 01996197 187 181 0 0 74.85% 78.06% 84.66% 84.52% 0 0
Chinese
AcademicYear
Enrollment Majors Success Retention Ucensure ExamsDegreesAwarded
CertificatesAwarded
Fall Spring Fall Spring Fall Spring Fall Spring Fall Spring Annual Annual%Change 357.14% -5.00% 200.00% -100.00% 59.38% 19.04% 75.00% 3.40% na na2000/01 32 38 2 0 59.38% 63.16% 75.00% 71.05%1999/00 7 40 0 1 0.00% 44.12% 0.00% 67.65%1998199 29 45 3 3 61.54% 80.00% 92.31% 84.44% 0 01997/98 0 25 5 2 0.00% 62.50% 0.00% 70.83% 0 01996/97 31 17 4 6 62.96% 68.75% 66.67% 75.00% 0 0
French
AcademicYear
Enrollment Ma ors Success Retention Ucensure ExamsDegreesAwarded
Certificates
AwardedFall Spring Fall Spring Fall Spring Fall Spring Fail Spring Annual Annual
% Change -17.70% 18.58% -14.29% -45.45% 6.44% 16.61% -2.42% 7.25% na na2000101 251 300 12 6 59.60% 62.24% 72.00% 82.65%1999100 305 253 14 11 53.1 6% 45.63% 74.42% 75.40%1998/99 259 238 12 15 64.29% 51.93% 83.73% 61.80% 0 01997/98 167 160 14 11 61.64% 61.64% 70.44% 73.29% 0 01996/97. 136 170 10 10 59.09% 49.09% 69.70% 67.27% 0 0
German
AcademicYear
Enrollment Majors Success Retention Ucensure Exams DegreesAwarded
CertificatesAwarded
Fall Spring Fall Spring Fall Spring Fall Spring Fall Spring Annual Annual%Change -10.20% -7.19% -40.00% 0.00% -3.55% 9.50% -1.83% 4.99% na na2000/01 132 129 3 7 72.31% 79.07% 82.31% 87.60%1999/00 147 139 5 7 75.86% 69.57% 84.14% 82.61%1998/99 106 118 6 4 63.54% 59.13% 87.50% 71.30% 0 01997/98 87 64 11 7 66.674 77.05% 70.24% 77.05% 0 01996/97 71 83 8 4 70.77% 65.06% 83.08% 69.88% 0 0
70 CABRILLO COLLEGE FACTBOOK 2001 81

Fire Technology
AcademicYear
FTES WSCH FTEF WSCH/FTEF = Load Percent of WSCH Percent of FTEF Wait Ust
Fall Spring Fall Spring Fall Spring Fall Spring Fall Spring Fall Spring Fall Spring%Change 143.01% 276.84% 151.14% 288.43% 4.79% -19.08% 139.65% 380.01% 0.57% 1.10% 0.02% -0.09% na na2000(01 43.79 67.19 1,406.64 2,174.44 1.53 1.23 919.37 1,767.84 0.963% 1.482% 0.536% 0.424% na 15
1999/00 18.02 17.83 560.10 559.80 1.46 1.52 383.63 368.29 0.394% 0.385% 0.518% 0.516% 0 na1998/99 20.69 15.21 646.42 468.03 1.59 1.33 406.55 351.90 0.449% 0.331% 0.579% 0.478% 0 1
1997/98 21.48 2251 655.00 672.23 2.12 1.60 308.96 420.14 0.524% 0.489% 0.784% 0.597% 9 0
1996197 20.56 20.64 608.09 619.33 1.56 1.59 389.80 389.52 0.511% 0.496% 0.592% 0.572% 2 0
Hazardous Materials Technology
Acade micYear
FTESES WSCH FTEF WSCH/FTEF = Load Percent of WSCH Percent of FTEF Wait Ust
Fall Spring Fall Spring Fall Spring Fall Spring Fall Spring Fall Spring Fall Spring%Change na na2000011999(W)
1998/99 0 01997/98 1.50 0.00 45.00 0.00 0.20 0.00 225.00 0.00 0.038'/. 0.000% 0.074% 0.000% 0 01996/97 1.67 1.63 52.92 48.00 0.28 0.20 189.00 240.00 0.044% 0.038% 0.106% 0.072% 0 0
Learning Skills
AcademicYear
FTES WSCH FTEF WSCH/FTEF = Load Percent of WSCH Percent of FTEF Wait List
Fall Spring Fall Spring Fall Spring Fall Spring Fall Spring Fall Spring Fall Spring%Change 12.61% -23.85% 11.60% 5.19% -25.58% 3.17% 0.50 1.95% 0.02% 0.01% -0.08% 0.01% na na2000101 8.75 5.14 280.45 230.30 0.64 0.65 438.20 354.31 0.192% 0.157% 0.224% 0.224% na 1
1999/00 7.77 6.75 251.30 218.94 0.86 0.63 29221 347.52 0.177% 0.150% 0.305% 0.214% 45 na1998/99 6.66 7.94 214.03 255.57 0.47 0.60 455.38 425.95 0.149% 0.181% 0.171% 0.216% 8 461997/98 7.86 8.03 242.35 247.12 0.47 0.54 515.64 457.63 0.194% 0.180% 0.174% 0.202% 17 41996/97 6.00 7.06 186.64 218.06 0.40 0.40 466.60 545.15 0.157% 0.175% 0.152% 0.144% 13 25
Chinese
AcademicYear
FTES WSCH FTEF WSCH/FTEF = Load Percent of WSCH Percent of FIEF Watt List
Fall Spring Fall Spring Fall Spring Fall Spring Fall Spring Fall Spring Fall Spring%Change 145.36% -am% 146.05% -372% 0.00% 0.00% 146.05% -372% 0.03% 0.00% 0.00% 0.00P/0 na na2000101 2.38 3.00 74.06 93.39 0.27 027 274.30 345.89 0.051% 0.064% 0.095% 0.093% na 01999/00 0.97 3.12 30.10 97.00 0.27 0.27 111.48 359.26 0.021% 0.067% 0.096% 0.092% 0 na1998199 2.28 3.72 71.13 118.31 0.27 0.27 263.44 438.19 0.049% 0.084% 0.098% 0.097% 0 01997/98 0.00 353 0.00 106.20 0.00 0.27 0.00 393.33 0.000°/. 0.077% 0.000% 0.101% 0 01996197 4.13 2.22 124.00 67.00 0.27 0.27 459.26 248.15 0.104% 0.054% 0.102% 0.097% 0 0
French
AcademicYear
FTES WSCH FTEF WSCH/FTEF = Load Percent of WSCH Percent of FTEF Wait List
Fall Spring Fall Spring Fall Spring Fall Spring Fall Spring Fall Spring Fall Spring%Change -25.05% 19.39% -24.89% 19.79% 0.63% -28.33% -25.36% 67.15% -0.16% 0.08% 0.00% -0.17% na na203001 19.99 24.07 621.66 749.40 1.61 1.29 386.12 580.93 0.426% 0.511% 0.564% 0.445% na 31999100 26.67 20.16 827.68 625.60 1.60 1.80 517.30 347.56 0.582% 0.430% 0.568% 0.611% 0 na1998/99 20.51 20.71 641.89 645.33 1.34 1.53 479.02 421.78 0.446% 0.456% 0.488% 0.550% 0 01997/98 2227 22.18 668.00 665.70 1.07 1.80 624.30 369.83 0.534% 0.484% 0.396% 0.672% 0 01996/97 18.13 21.88 544.00 657.00 1.33 1.53 409.02 429.41 0.457% 0.526% 0.505% 0.551% 6 1
German
AcademicYear
FTES WSCH FTEF WSCH/FTEF = Load Percent of WSCH Percent of FTEF Wait List
Fall Spring Fall Spring Fall Spring Fall Spring Fall Spring Fall Spring Fall Spring%change -17.66% -2.27% -17.75% -2.31% 0.00% 0.00% -17.75% -2.31% -0.06% -0.01% 0.00% 0.01% na na2000/01 11.28 11.20 351.05 348.18 1.06 1.00 331.18 348.18 0.240% 0.237% 0.371% 0.345% na 01999100 13.70 11.46 426.81 356.40 1.06 1.00 40265 356.40 0.300% 0.245% 0.376% 0.339% 0 na1998/99 9.70 10.27 301.04 318.77 0.80 1.00 376.30 318.77 0.209% 0.225% 0.291% 0.360% 0 01997/98 11.60 8.69 348.00 262.20 1.06 0.80 328.30 327.75 0.278% 0.191% 0.392% 0.299% 0 01996(97 9.33 10.33 280.00 310.00 0.80 1.00 350.00 310.00 0.235% 0.248% 0.304% 0.363% 0 0
BEST COPY AVAILABIA 82CABRILLO COLLEGE FALL BOOK 2001 71
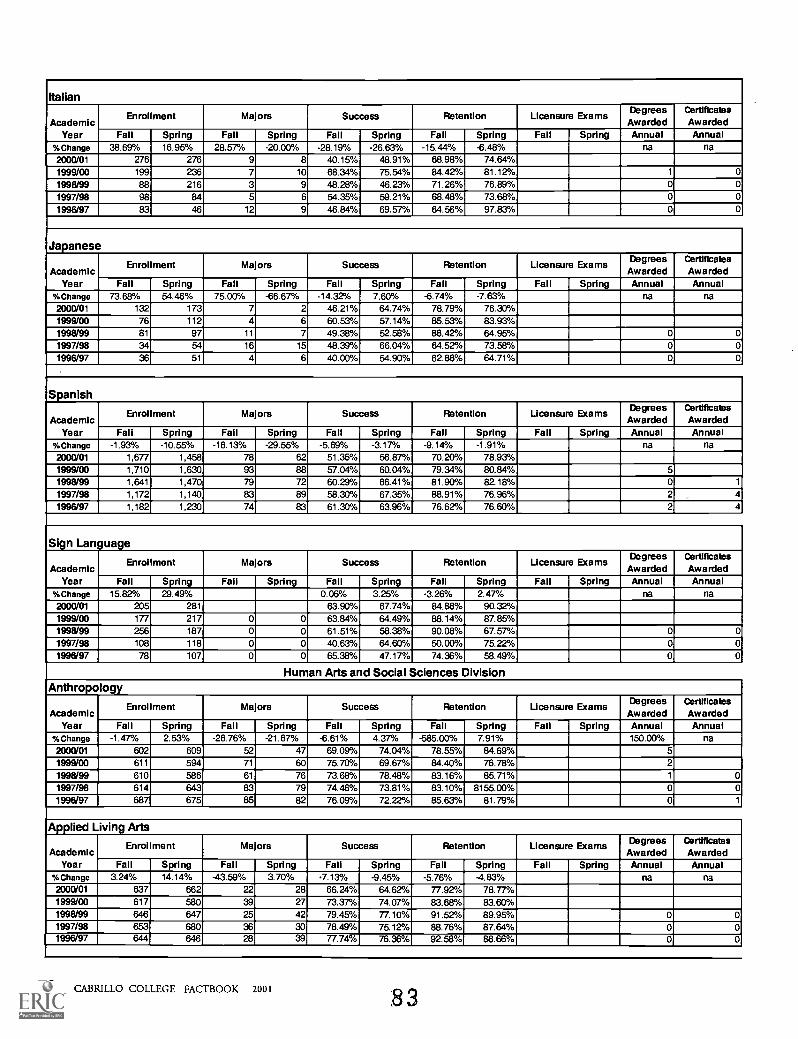
Italian
AcademicYear
Enrollment Ma ors Success Retention Licensure ExamsDegreesAwarded
CertificatesAwarded
Fall Spring Fall Spring Fall Spring Fall Spring Fall Spring Annual Annual%Change 38.69% 16.95% 28.57% -20.00% -28.19% -26.63% -15.44% -6.48% na na
2000/01 276 276 9 8 40.15% 48.91% 68.98% 74.64%1999/00 199 236 7 10 68.34% 75.54% 84.42% 81.12% 1 0
1998/99 88 216 3 9 48.28% 46.23% 71.26% 76.89% 0 0
1997/98 98 84 5 6 54.35% 59.21% 68.48% 73.68% 0 0
1996/97 83 46 12 9 46.84% 69.57% 64.56% 97.83% 0 0
Japanese
AcademicYear
Enrollment Majors Success Retention Licensure Exams DegreesAwarded
CertificatesAwarded
Fall Spring Fall Spring Fall Spring Fall Spring Fall Spring Annual Annual%Change 73.68% 54.46% 75.00% -66.67% -14.32% 7.60% -6.74% -7.63% na na
2000/01 132 173 7 2 46.21% 64.74% 78.79% 76.30%1999/00 76 112 4 6 60.53% 57.14% 85.53% 83.93%1998/99 81 97 11 7 49.38% 52.58% 86,42% 64.95% 0 0
1997/98 34 54 16 15 48.39% 66.04% 64.52% 73.58%1996/97 36 51 4 6 40.00% 54.90% 62.86% 64.71% 0 0
Spanish
AcademicYear
Enrollment Majors Success Retention Licensure Exams DegreesAwarded
CertificatesAwarded
Fall Spring Fall Spring Fall Spring Fall Spring Fall Spring Annual Annual%Change -1.93% -10.55% -16.13% -29.55% -5.69% -3.17% -9.14% -1.91% na na
2000/01 1,677 1,458 78 62 51.35% 56.87% 70.20% 78.93%199900 1,710 1,630 93 88 57.04% 60.04% 79.34% 80.84% 51998/99 1,641 1,470 79 72 60.29% 66.41% 81.90% 82.18% 0 1
1997/98 1,172 1,140 83 89 58.30% 67.35% 66.91% 76.96% 2 41996/97 1,182 1,230 74 83 61.30% 63.96% 76.62% 76.60% 2 4
Sign Language
AcademicYear
Enrollment Ma ors Success Retention Licensure ExamsDegreesAwarded
CertificatesAwarded
Fall Spring Fall Spring Fall Spring Fall Spring Fall Spring Annual Annual%Change 15.82% 29.49% 0.06% 3.25% -3.26% 2.47% na na
2000/01 205 281 63.90% 67.74% 84.88% 90.32%1999/00 177 217 0 0 63.84% 64.49% 88.14% 87.85%1998/99 256 187 0 0 61.51% 58.38% 90.08% 67.57% 0 01997/98 108 118 0 0 40.63% 64.60% 50.00% 75.22% 0 0
1996/97 78 107 0 0 65.38% 47.17% 74.36% 58.49% 0 0
Human Arts and Social Sciences DivisionAnthropology
AcademicYear
Enrollment Ma ors Success Retention LIcensure Exams DegreesAwarded
CertificatesAwarded
Fall Spring Fall Spring Fall Spring Fall Spring Fall Spring Annual Annual%Change -1.47% 2.53% -26.76% -21.67% -6.61% 4.37% -585.00% 7.91% 150.00% na
2000/01 602 609 52 47 69.09% 74.04% 78.55% 84.69% 51999/00 611 594 71 60 75.70% 69.67% 84.40% 76.78% 2
1998/99 610 586 61 76 73.68% 78.48% 83.16% 85.71% 1 0
1997/98 614 643 83 79 74.46% 73.81% 83.10% 8155.00%1996/97 687 675 85 82 76.09% 72.22% 85.63% 81.79% 0 1
Applied Living Arts
AcademicYear
Enrollment Majors Success Retention Licensure Exams DegreesAwarded
CertificatesAwarded
Fall Spring Fall Spring Fall Spring Fall Spring Fall Spring Annual Annual%Change 3.24% 14.14% -43.59% 3.70% -7.13% -9.45% -5.76% -4.83% na na2000/01 637 662 22 28 66.24% 64.62% 77.92% 78.77%1999/00 617 580 39 27 73.37% 74.07% 83.68% 83.60%1998/99 646 647 25 42 79.45% 77.10% 91.52% 89.95% 0 01997/98 653 680 36 30 78.49% 75.12% 88.76% 87.64% 0 01996/97 644 646 28 39 77.74% 76.36% 92.58% 88.66% 0 0
72 CABRILLO COLLEGE FACTBOOK 2001 83

1,478.22
FTES.... _
-10. FIEF WS01/FTEF = Load Percent of FTEF
.--
Waft ListPercent of WSCH
Fall E4=1 Fall -=. Fall WM1 Fall 'EMI Fall 1001 Fall 1=1 Fall WM,% charge 15.17% 7.42% 14.66% 6.95% 25.47% 25.47% -8.82% -14.77% 0.04% 0.03% 0.09% 0.10% na na2000101 19.1 21.28 594.81 661.35 MK< 1.33 44723 497.26 0.407°/ 0.451% 0.4667 0.45 na 71
1999(00 16.61 19.81
1996199 17.03
518. 618.40 1E.224. N 527.96 0.53
1.06 489.42 583.40
396.96
0.365V 0.42570.156 0.3737
0.3767 0.36070.193 0.47
7 na0 31133 423.83
1997/96 11.75 389. c e 353.30 0.80 0.80 486.25 441.63 0.311V 0.257% 0.296 0.2977 6 51996197 10. 2.91
FTES
328.00 92.00 0.78 0.130
-0. FTEF
420.51 0.00
WSCH/FTEF = Load
0.276/ 0.074
Percent of WSCH
0.296% 0.000
Percent of FTEF
4 17
Wait List
Fall 1E= Fall EM'. Fall WMII Fall WW1 Fall E Fall K71 Fall KM,%change 57.91% 60.28% 57.33% 60.85% 96.30% 50.94% -19.85% 6.56% 0.07% 0.11% 0.09% 0.10%2000(01 9. 13. 96 291. 435.58 0.53 0.80 549.13 544.48 0.19 0.297 0.186 0.27/ 6 71996100 8.71 184. 270.80 0. 0.53 685.14 510.94 0.130Y 0.18 0.09 0.1807 na1996193 6.41 8.00 199. 248.79 0. 0.53 739.04 469.42 0.138 0.17/ 0.0987 0.19 0 01997/96 4. 7.69 136. 230.90 0. 0.53 503.70 435.66 0.1077 0.16/ 0.1007 0.1917/. 8 01996197 4.80 6.80
...._ FTES
144. 234.00 0. 0.53
-. FTEF
533.33 384.91
VVSCHFTEF = Load
0.121°/ 0.16/
Percent of WW1
0.102V 0.191%
Percent of FTEF
9 1
Wait List
Fall K=11 Fall WME Fall KM, Fall C:7101 Fall C=11 Fall KI=1 Fall WM71%aunge -10 15% -9.84% -10.33% -9.89% -10.65% -5 74% 0.37% - 4.40% -0.41% -asaw. -0.45% -0.15% na20011101 120.97 4,092.53 3,760.16 9.55 9.68 428.54 388.45 280 2563 33467 3.336% na 81999100 146. 134.181996199 144.39 133.
4564.04 4,17290 10.69 10.274,509.49 4,184.81 10.' 10.60
426.94 406.32 3211/ 2867" 3792/ 3.486 84 na432.77 394.79 a 137/ 2957/ a 794/ 3.812°/ 81 37
1997/96 141.. 145.701996197 143. 145.68
. .. - FTES
4261.06 4,383.25 9.60 10.374,325.00 4,411.35 10.1 11.03
-. FTEF
443.86 422.69
425.27 398.14
WSCH1FIEF= Load
a 407V 3.18/36357 3.535%
Percent of VVSCH
a 549/ 3871*/a 859Y 3.988%
Percent of FTEF
57 4539 37
Wait List
Fall KIMil Fall II -E=. Fall E=I Fall 'W,M1 Fall ni Fall WM, Fall WMTI%puma 9.78% 26.40% 9.79% 26.47/. 33.75% 0.37/. -17.91% 26.48% a 02% 0.09% 0.09% 0.01%200001 21.74 478.:. 677.20 1.0 1.07 447.53 632.90 0.327/ 0.467/ 0.375°/ 0.369% na 11
1996100 14.01 172)1991199 19. 1561
436.1 535.40 0.80 1.07622. 486.71 1.07
545.19 500.37581.92 454.87
0.3077. 0.368/0.437/ 0.344/
0.284 0.360.390/ 0.385°/
na4 0
1997/96 14. i. 16.90 427.1 e 507.40 1.07 399.07 474.21 0.34 0.3677 0.39 0.399°/ 11 31996197 10... 14.18 309. 426.00 0. 1.06
.
572.22 401.89
. .. ._ :...... 1
WSCH(FTEF = Load
0.2607 0.341°/
GA
Percent of WSCH
0.237/ 0.3827
Percent at FTEF
6 1
, 1 )iWait List
I : -
FTEF... _FTES
Fall 11-=1 Fall IIUME Fall W=1 Fall Fall Fall W=11 Fall L=1%Change -523% 248% -5.57/. 227% 0.90% -0.89% -6.37% 3.18% -0.13% 0.02% -am% 0.01% na na200301 67.
1999'00 MIEEM1991199 MgEc
68.91
67.246551
2,094.1 139.' 4.46 4.472,216.64 091.95 4. 4.51
2,214.31 2040.94 4. 4.64469.53 478.62501.50 463.85476.20 439.86
1.4341.56071.5377
1.451.43771.44
1.563/ 1.541%1.5687 1.531"/1.693/ 1.667/
na 138
39 na29 9
1997/91 70.1 =OE 2,126.03 2,287.63 389 4.40 546.54 519.92 1.7007 1.663/ 1.437/ 1.64 48 61
1996197 76.81 77.41
- . FTES
330.52 2,340.10 4.15 4.38
' FTEF
561.57 534.27
ifilSCIVFTEF= Load
1.957/ 1.875/
Percent of VVSCH
1.577/ 1.577/
Percent of FTEF
I.,
44 55
,. . .
Wait List
Fall WMTE Fall WIMTE Fall KI=1 Fall L=1 Fall =11 Fall W=1 Fall K=1%Change 7.24% 27.44% 6.76% 19.81% -a ark 16.96% 10.84% 244% 0.04% 0.19% -UV/. 0.22% na21300101 WM=12E 1647.78 1,733.92 340 4.00 484.64 433.48 1.12 1.137/ 1.191°/ 1.377/ na 137199300 48.
1996199 53.681997/96 50.
43.19 1 543.49 1,447.21 3.5349.8 1,684.48 1,570.26 3.4653. 00 1,534.86 1,6oa 12 3.46
3.42 437.25
331 486.84
3.33 443.60
423.16 1.066V474.40 1.169°/
481.42 1.711/
0.994/ 1.25.77
1.111 ° / 1.20071.16 1.2797
1.161.19071.24
92141
106
na13)106
1996/97 50.60 1,54242 333 3.66 4.43.91 421.43 150 101
A
:

Archaeolc9y Technology
AcademicYear
Enrollment Ma ors Success Retention Ucensure ExamsD egrees
AwardedCertificatesAwarded
Fall Spring Fall Spring Fall Spring Fall Spring Fall Spring Annual Annual%Change -5.75% 16.07% -32.26% -15.38% -9.47% -0.34% -7.03% -2.38% -75.00% -75.00%2000/01 82 65 21 22 64.56% 79.25% 70.89% 79.25% 1 2199900 87 56 31 26 74.03% 79.59% 77.92% 81.63% 4 81998/99 94 86 38 35 75.32% 84.21% 76.62% 84.21% 0 51997/98 67 69 28 24 77.42% 91.38% 80.65% 94.83% 2 51996/97 94 34 34 32 67.03% 86.67% 74.73% 86.67% 2 8
Culinary Arts & Hospitality Management
AcademicYear
Enrollment Majors Success Retention Ucensure ExamsDegreesAwarded
Certificates
AwardedFall Spring Fall Spring Fall Spring Fall Spring Fall Spring Annual Annual
%Change 14.46% -26.40% -8.18% -21.24% 7.82% 2.39% 3.93% 5.06% -33.33% 0.00%2000'01 475 368 101 89 73.76% 71.23% 87.53% 90.60% 4 6199900 415 500 110 113 65.94% 68.84% 83.70% 85.54% 6 61998/99 399 373 114 103 74.16% 66.39% 91.21% 89.81% 10 121997/98 393 297 115 87 63.56% 70.82% 83.62% 85.41% 4 41996197 336 300 95 101 79.63% 70.55% 90.12% 8288% 7
Early Childnood Education
AcademicYear
Enrollment Majors Success Retention Ucensure Exams DegreesAwarded
es
AwardedFall Spring Fall Spring Fall Spring Fall Spring Fall Spring Annual Annual
%Change -14.15% 0.74% -11.41% -12.13% 1.84% 4.19% 3.56% 4.10% 6.25% 75.00%2000'01 892 1,082 435 449 79.70% 84.48% 86.81% 89.93% 17 14199900 1,039 1,074 491 511 77.86% 80.29% 83.25% 85.83% 16 81998/99 1,147 1,126 504 469 83.52% 85.81% 89.39% 91.37% 10 101997/98 1,067 1,083 457 459 84.91% 85.12% 89.55% 90.25% 19 11
1996197 1,198 1,161 497 484 8219% 85.02% 86.49% 88.45% 13 10
Foster Parent
AcademicYear
Enrollment Majors Success Retention Licensure ExamsDegreesAwarded
CertMcates
AwardedFall Spring Fall Spring Fall Spring Fall Spring Fall Spring Annual Annual
%Change 0.00% 0.00% -100.00% -100.00% na na2000/011999'00 0 0 1 31998/99 0 0 3 2 0 01997/98 0 0 0 1 0 01996/97 0 0 1 1 0 0
Economics
AcademicYear
Enrollment Majors Success Retention Ucensure ExamsDegreesAwarded
Certificates
AwardedFall Spring Fall Spring Fall Spring Fall Spring Fall Spring Annual Annual
%Change 15.17% 10.67% -36.36% -53.13% -5.88% -5.62% -2.39% -0.74% 100.00% na2000'01 243 249 21 15 59.67% 58.06% 82.30% 78.63% 21999'00 211 225 33 32 65.55% 63.68% 84.69% 79.37% 1
1998/99 223 218 28 25 63.13% 71.43% 85.25% 79.52% 1 01997/98 221 218 31 34 57.87% 65.70% 80.56% 80.68% 01996/97 197 221 33 27 66.84% 72.56% 81.82% 83.26% 0 0
Geography
AcademicYear
Enrollment Majors Success Retention Ucensure Exams DegreesAwarded
CertificatesAwarded
Fall Spring Fall Spring Fall Spring Fall Spring Fall Spring Annual Annual%Change -8.11% -17.44% -14.29% -37.50% 314% -6.76% 1.47% 1.97% 0.00% na2000/01 374 322 6 5 67.41% 61.39% 79.39% 8291% 1
1999/00 407 390 7 8 64.27% 68.15% 77.92% 80.94% 1
1998/99 470 419 8 8 67.12% 72.77'/o 86.53% 87.13% 0 01997/98 376 420 14 11 73.33% 61.90% 85.22% 8221% 0 01996/97 367 479 11 10 6279% 68.78% 81.98% 83.26% 0 0
74 CABRILLO COLLEGE FACTBOOK 2001
85

..FTES O. FTEF VS:II/REF = Load Percent of VVSCH
.. -:
Percent of FTEF
. .) :...- . ..)A
Wait List
Fail .., Fall M. Fall EMI Fall KMM1 Fall 10=1 Fall KM, Fall KM 1%Clunge 10.19% -7.46% 9.77% -9.18% -1.14% -58.54% 11.04% 119.04% 0.01% -0.01% -0.01% -0.16% na na200001 5.58 240.81 175.18 0.87 0.34 276.79 515.24 0.165°/ 0.1197 0.3 0.1177 na 31999'00
1996/99
6.8 6.03 219. 19288 0.88 0.82 249.28 235.22 0.154°/ 0.13 0.317/ 0.278rY na
a 9.47 285.7 30252 0.88 0.82 324.73 368.93 0.19/ 0.214°/ 0.320°/ 0.295% 0 1
1997/90 6.90 8.56 265.28 0.88 0.62 241.14 427.87 0.1779' 0.193°/ 0.325% 0231/ 0 01996/97
...
3.51
FTES
242.
-
108.31 0.93 0.62
FTEF
261.26 174.69
VVSCHIFIEF = Load
0234*/ 0.087/
1
Percent of WSCH
0.35 0.2237.
-..: - . .... .
Percent of FIEF
1 0
K 1 -..
Wait List
Fall -ILMni Fall MM?. Fall I r=1 Fall ILIMMII Fall &Mr' Fall 1=11 Fall%Change 0.48% -421% 0.31% -4.25% 8.79% 7.87% -7.80% -11.24% -0.02% -0.05% 0.12% 0.15% na200001 41. 40.74 1307.13 1 278.64 4.95 5.07 264.07 25220 0.89/ 0.872% 1.734°/ 1.7477 na 1141999'00 41. 4253 1,303.10 1,335.39 4.55 4.70 286.40 284.13 0.917 0.91 1.614/ 1.595/ 144 na1991199 36.49 aa 44 1,200.94 1,178.60 4.1 4.09 290.08 288.17 0.834% 0.834°/ 1.507% 1.471% 110 1631997/96 36.00 26.45 1,129.17 775.19 4.51 3.44 250.37 225.35 0. Mr/ 0.564'/ 1.66 1.284% 122 110
1996197 34. 28.84 1,005.34 862.35 3.06 2.86 328.54 301.52
WSCI-1/FIEF = Loud
0.845 0.691*/
Percent of VVSCH
1.161/ 1.029%
--:
Percent of FTEF
114 116
.1 .. -.1.--.11.
Wait ListFTEF- - FTES .Fall WIMI Fall MEMTE Fall KM 1 Fall lEarli Fall E:=1 Fall 'MTM11 Fall 1=1
%Change -5.66% -5.22% -5.36% -5.05% -15.77% -0.57% 12.35% - 4.50% -0.14% -0.11% -0.42% 0.02°/.2000(01 A 8299 2,406.93 2,634.31 5.93 6.93 405.89 380.13 1.6487 1.796/ 207 2.36 na 1321999'001996/99
80. 87.56
93 90.46
2,543.31
2,979.022,774.35
2,846.33
7.04 6.97
7.09 6.17
361.27 398.04 1.789'/2068/
1.9062013
2497 2366V2513 2219V
265 na146 206420.17 461.32
1997/96 88.8 84.84 2,710.10 2,587.45 6.11 5.89 443.55 439.30 2167/ 1.881/ 225 2197/ 188 1621996/97 56. 92.43 2,645.53 2,814.96
.
6.22 6.99
FTEF
425.33 40271
INSCI-VFTEF = Load
2223°/ 2255 ° /
Percent of WSCH
236 2517/
Percent of FTEF
254 802
...:,1,.. .. I
Wait List.. - FTES
Fall ILM71 Fall WM.-11 Fall WWI Fall -E7=1 Fall Iran Fall KM, Fall -E7=1%Chaige 0.00% 0.00°/0 0.00 0.00% 0.07/. 0.00/. 0.00% 0.00% 0.00% 0.00% 0.00% 0.00%2000/01 0.00 0.00 0. 0.00 0.00 0.00 0.00 0.00 0.000°/ 0.000V 0.000/ 0.000°/199900 0.00 0.00 0. r r 0.00 0.00 acx) 0.00 0.00 0.000°/ 0.007/ 0.007/ 0.000*/1996(99 0.00 0.00 0. I 0.00 0.00 0.00 0.00 0.00 0.0007 0.C(X)"/ 0.000V 0.000'/ 0 01997/96 0. r r 0.00 0. 0.00 0.00 0.0) 0.00 0.00 0.000 0.0007 0.0007 0.000% 0 01996(97 0. r 0.00
FTES
0. r 0.00 0.00 0.00
FTEF
aa) aoo
VVSCHIFTEF = Load
o.axr/ 0.000/
Pastern of VVSCH
0.0007 0.000%
Percent of FIEF
0 0
... .-
Wait List
Fall 1=1 Fall -MMTIII Fall KM" Fall -K7=1 Fall E-471r1 Fall EM, Fall EMni%Change 15.72% 10.68% 15.71% 10.67% 0.00% 20.00% 15.71% -7.78% 0.06% 0.05% 0.00% 0.07% na na2000'01 =OE 25.80MME 796.80 IMME MOM=OE 664. 0.533 0.543 0.350 0.414/=M 401999'001996/99
23.31
23. 2295672 r r718.
720.00
708.50
1.00 1.00
0. 1.00
672(X) 720.00740.46 708.50
0.473Y0.4997
0.495*/0.501/
0.355% 0.327/0.353'/ 0.360V
2 na
7 171997/90 2293 23.16 688. 694.79 0.98 1.02 702.04 681.17 0.550°/ 0.505/ 0.362Y 0.381*/ 13 191996/97 19. 21.93 591. r 661.76 1.00 0.97 591.00 68223
= Load
0.49 0.530V
Percent of WSCH
0.379% 0.349*/
Percent of FIEF
1 13
:....x.uw
Wait List. FTES FTEF VISCI-VREF
Fall El=1 Fall IILMIM Fall I -10=1 Fall rUaril Fall E"." '1?1 Fall EM7i Fall W=71%Change -9.16% -26A4% -9.55% -26.17% -15.94% -24.40% 7.61% -234% -a11% -025% -0.12% -0.16°/. na na2000'01 39. 31.89 MEM 991. MNME 697. r 627.56 0.831/ 0.676V 0.617/ 0.54/ nd 01999'00 43.35 1,340.91 1,34298 2.0 209 647.78 64257 0.9437. 0.923 0.734% 0.7097 1 na1996/99 49.. 44.79 1,548.7 1,393.71 MB 1.72 828.20 810.30 1.075*/ 0.936 0.681°/ 0.619*/ 7 471997/96 39.1 45. 1,189.68 1,3E3272 1.70 1.67 699.81 827.98 0.951/ 1.005°/ 0.62137 0123*/ 0 61996/97 48.24 1,121.92 1,460.97 207 671.81 705.78 0.9437 1.171°/ 0.634°/ 0.745/ 1
1;', 1 I I \ r I1 1

Gerontology
AcademicYear
Enrollment Majors Success Retention Ucensure ExamsDegreesAwarded
CertificatesAwarded
Fall Spring Fall Spring Fall Spring Fall Spring Fall Spring Annual Annual%Chang) 0.00% 11.76% 0.00% 0.00% -13.93% -9.29% na na2000/01 19 1 68.42% 78.95%1999/00 0 17 0 1 82.35% 88.24%1998/99 0 17 0 0 82.35% 82.35% 0 01997/98 0 15 0 0 86.67% 86.67% 0 01996197 0 25 0 0 84.00% 84.00% 0 0
History
AcademicYear
Enrollment Majors Success Retention Unsure Exams DegreesAwarded
CertificatesAwarded
Fall Spring Fall Spring Fall Spring Fall Spring Fall Spring Annual Annual% Change -7.80% -24.28% -11.67% -32.91% 0.50% -1.13% 1.45% -2.74% na na2000/01 745 845 53 53 66.67% 70.04% 79.39% 77.86%1999'00 808 1,116 60 79 66.17% 71.17% 77.94% 80.60% 1
1998/99 832 945 73 52 69.46% 73.82% 82.23% 87.02% 0 01997/98 895 878 68 67 71.79% 68.82% 83.80% 81.96% 0 01996/97 865 858 58 68 63.85% 69.95% 78.23% 84.43% 1 0
Meteorology
AcademicYear
Enrollment Majors Success Retention Ucensure Exams DegreesAwarded
CertificatesAwarded
Fall Spring Fall Spring Fall Spring Fall Spring Fall Spring Annual Annual% Change 2.83% 64.29% 0.00% 0.00% -4.30% -10.64% 3.96% -a27% na na2000/01 109 207 85.32% 83.01% 93.58% 94.17%1999/00 106 126 0 0 89.62% 93.65% 89.62% 94.44%1998/99 84 104 0 0 92.68% 90.20% 92.68% 90.20% 0 01997/98 86 145 0 0 80.25% 72.41% 83.95% 83.45% 0 01996/97 88 77 0 0 76.14% 71.05% 84.09% 78.95% 0 0
Philosophy
AcademicYear
Enrollment Majors Success Retention Ucensure Exams DegreesAwarded
CertificatesAwarded
Fall Spring Fall Spring Fall Spring Fall Spring Fall Spring Annual Annual% Chaige -4.27% 18.83% 23.53% -33.33% 1.58% 0.86% 3.70% 2.03% na na2000/01 673 688 42 26 63.77% 64.04% 78.59% 82.31%1999/00 703 579 34 39 62.19% 63.18% 74.89% 80.28% 41998/99 700 647 28 34 64.95% 62.28% 84.39% 87.01% 0 01997/98 657 654 30 28 63.33% 63.69% 81.74% 82.32% 2 01996/97 600 704 38 38 68.48% 64.40% 86.69% 87.00% 0 0
Political Science
AcademicYear
Enrollment Majors Success Retention Ucensure ExamsDegreesAwarded
CertificatesAwarded
Fall Spring Fall Spring Fall Spring Fall Spring Fall Spring Annual Annual%Change 6.94% 22.49% 11.43% 56.67% -0.13% -2.88% 1.39% -2.69% na na200401 539 610 39 47 67.48% 68.66% 81.87% 78.61%1999/00 504 498 35 30 67.61% 71.54% 80.48% 81.30% 21998/99 601 594 24 40 70.68% 74.70% 86.21% 86.92% 0 01997/98 593 573 31 26 76.79% 80.76% 80.80% 90.74% 1 01996/97 526 551 39 39 76.29% 77.01% 85.46% 80.75% 1 0
Psychology
AcademicYear
Enrollment Majors Success Retention Ucensure Exams DegreesAwarded
CertificatesAwarded
Fall Spring Fall Spring Fall Spring Fall Spring Fall Spring Annual Annual% Change -17.83% -11.07% -4.45% -14.12% 1.38% -3.12% -3.70% -8.89% -25.00% na2000/01 613 643 236 219 52.13% 51.87% 79.02% 70.72% 31999/00 746 723 247 255 50.75% 54.99°/0 82.72% 79.61% 41996/99 700 694 241 238 58.40% 60.99% 81.28% 83.86% 8 01997/98 694 658 263 248 54.50% 56.94% 81.52% 82.81% 5 01996197 748 698 265 256 57.10% 55.19% 79.94% 80.45% 4 0
76 CABRILLO COLLEGE FACTBO 0 K 2001 87

FT
ES
«F
IEF
VIS
CH
FrE
F =
LoadP
ercent of WS
CH
Percent of F
IEF
..A..)i
Wait list
-F
ail =1
Fall
M-71=
.F
all-K
1=11
Fall
-&-M
11F
all E=
1F
all-1=
11F
allK
.=1
%thieve
0.00%11.93%
0.03%11.76%
0.00%11.76%
0.00%0.00%
0.00%0.00%
200091aoo
1.970.(X
)60.80
0.(00.2)
0.00334.00
0.000P/
0.041%0.000%
0.067/na
0
19991000.00
1.760.00
54.400.00
a 2oam
272.000.000P
/clove/
0.000P/
0.06.:
1996990.00
1.790.00
55.250.00
0.200.00
276.250.0:03/
0.0393/0.(00°/
0.077/0
0
1997/960.00
1.13aco
35.600.00
0.200.00
178.000.0003/
0.027/0.000°/
0.077/0
0
199697
..-
aw2.10
FT
ES
am63.00
- ei
0.000.20
FIE
F
0.(I)315.00
WS
CH
'FT
EF
= Load
0.000if0.C
606/
Percent of W
SC
H
0.007/0.077/
Percent of F
IEF
00
-A
Wait List
--F
all K=
1F
allW
MT
.F
all W=
1F
all MO
MF
all =1
Fall =
11F
allW
MT
I%
change-1.%
-23.69%-1.25%
-24.80%9.52%
-3.99%-9.84%
-21.68%-0.07%
-0.61%0.15%
-0.06%net
na200091
823685.04IIIIM
E2,637.':
6. r.442.
438.1.747/
1.797/2.0153'.
207/na
129
199910083.41
111.442,576.00
3,506.655.25
6.27490.67
559.1.8123/
2407/1.862°/
21266
19969986.78
97.612,681.62
3,036.345.25
5.86510.78
518.151.861°/
2147/2187/
2051/1.9123/
2.107°/
2.218°/2.2740/
8386
6045
1709890.55
94.00733.86
2,820.306.00
6.09455.14
463.10
1996f978525
86.64
FT
ES
2,561.722,612.35
-40
5.755.75
FIE
F
445.52454.
VV
SC
H,F
rEF
= Load
2153°/2097/
Percent of W
SC
H
2.1823/20703/
Parent of F
IEF
WI
53
:_,.....)1
Wait U
st
-F
all W=
1F
allM
I=.
Fall
WM
11F
allF
all E=
IF
all*I=
1F
all K=
I%
change6.81%
62.40%6.86%
62.55%0.00%
62.50%6.85%
0.03%0.01%
0.17%0.(0%
0.09%na
m2000'01
11292121
348. s655.
0.0.
872.1,008.31
0.2393/0.44/
0.1403/0.224
na108
1999x0010.57
13.06326.40
403.200.40
0.40816.00
1,038.000230°/
0.277/0.1423/
0.1311
1996998.85
10.73273.00
331.250.35
0.40780.00
828.130.1893/
0.234 ° /0.127°/
0.144°/1
10
1997/988.60
15.73251390
471.250.35
0.55737.14
856.0.207/
0.347/0.1293/
0.20577
0
1996197
.- ...
8.807.70
FT
ES
264.00231.00
- «
0.350.35
FIE
F
754.29660.00
WS
CH
CrE
F =
Load
0.222370.1857
0.133°/0.126V
5 MIM
Percent of W
SC
HP
ercent of FIE
F
.,:- :ED
A
Wait List
--F
allK
:=111
Fall
11=1.
Fall
EM
TI
Fall
II=11
Fall
II=1
Fall K
M,
Fall
K."-":1
%chim
e-ass%
18.95%-3.67%
19.11%-7.85%
5.(X)%
4.54%13.44%
-0.10%027/.
-0.09%0.06%
nana
1999'0069.93
71.19MU
M201.:1
2702.94
799.19748.84
1.478%1.501*/
0.9466/1.017/
ne
1999T0
72.5359.85
2,240.001,848.40
293280
764.51660.14
1.571.2703/
1.037/0.957/
1
1996997326
68.112,261.50
2,10275298
283758.89
743.1.570P
/1.487
1.085%1.0187
81
1997/9869.39
70.832,079.75
2,124.252.75
275756.27
772451.6637.
1.5446/1.017%
1.027/4 M
=E
1996/97
- -
59.8672.30
FIE
S
tcoa co2,169.00
-01.
2662.80
FIE
F
676.69774.
WS
CH
FrE
F =
Load
1.511.7377
Percent of W
SC
H
1.00771.037/
Percent of F
IEF
04
I....
.,_-
Wait U
st
--F
all E=
IF
Ml
'ME
MO
Fall
VE
MI
Fall 'M
IF
allF
all EM
1F
all =1
%C
hange7.52%
22.91%7.53%
22.14%20.37%
-10.13%-10.67%
35.90%0.05%
amok
0.18%-0.11%
nana
2000'0155.51
62.561 714.
1 932.M
M.: M
ilE.
527.51558.
1.174 ° /1.317/
1.137/1.1923/
re114
199913051.63
50.901,594.40
1,582(X)
2.703.85
590.52410.91
1.1223/1.087/
0.95871.307/
23MM
199819952.18
61.951,93250
1,919.50290
286666.38
671.151.341°/
1.351.05
1.027/35
36
1997/986250
61.161,881.25
1,844.753.05
2.71616.80
680.1.504°/
1.341/1.128°/
1.017758
109
1996197
..- -
52.6055.50
FIE
S
1,5/8510-e
1,677.003.10
290
FIE
F
50903578.
WS
CF
VF
TE
F =
Load
1.327/1.344/
Percent of W
SC
H
1.177/1.044%
Percent of F
IEF
3969
.11)4
Wait List
Fall
Fall
Fall
KM
,F
all =II
Fall
WM
TE
Fall
-K7=
1F
all K=
1%
chave-17.19%
-9.11%-17.18%
-9.23%-923%
-6.69%-8.77/.
-277%-0.33%
-0.16%-0.12%
-0.06%na
na200091199900
64.71
78.1469.05
75.97
1 998. r2,413.00
1322,350.40 =
FM325 M
M329677.'
694.742.46
714.41
1.339°/1.454*/
1.691.615%
1.034%1.C
683/
1.1571.117/
na56
451998199
74.174.71
2,298.0132)
3.15718.13
734.1.59
1.637/1.16
1.137/at
1997/9671.91
2,220.752165.
3.503.55
634.50610.
1.7763/1.57
1294*/1.327/
513
19961977527
74.402,274.00
2,246.50a40
3.3
I
668.82691.
1.911/1.807/
l.
1.2903/1.177/
:10
3
IIIt [
-I
'II r \,
i \:
II
It I

Sociology
AcademicYear
Enrollment Ma ors Success Retention Ucensure ExamsDegreesAwarded
CertificatesAwarded
Fall Spring Fail Spring Fall Spring Fall Spring Fall Spring Annual Annual%Change -6.02% -15.88% -20.48% -33.33% 1.78% -8.64% -1.39% -8.81% -25.00% na
2000/01 453 392 66 54 65.78% 65.98% 81.56% 78.61% 31999/00 482 466 83 81 64.00% 74.62% 82.95% 87.42% 4
1998/99 483 466 87 81 74.58% 76.37% 92.44% 86.43% 1 0
1997/98 489 456 105 87 58.52% 64.95% 74.89% 82.01% 0 0
199697 457 442 85 105 67.35% 64.78% 81.74% 81.32% 1 0
Speech Communication
Academic
Year
Enrollment Majors Success Retention Ucensure ExamsDegreesAwarded
CertificatesAwarded
Fall Spring Fall Spring Fall Spring Fall Spring Fall Spring Annual Annual% Change 5.51% 2.15% -41.94% -47.22% -5.62% -4.29% -4.20% -4.15% 0.00% na
2000/01 1,054 1,095 18 19 77.33% 77.60% 86.17% 85.53% 1
1999/00 999 1,072 31 36 82.95% 81.89% 90.37% 89.68% 1
1998/99 1,010 1,062 34 33 83.54% 82.92% 92.68% 92.61% 0 0
1997/98 968 1,005 29 29 80.13% 86.85% 90.98% 92.96% 1 0
1996197 875 966 18 25 77.62% 84.40% 88.23% 93.05% 0 0
Stroke Center
Academic
Year
Enrollment Majors Success Retention Ucensure ExamsDegreesAwarded
CertificatesAwarded
Fall Spring Fall Spring Fall Spring Fall Spring Fall Spring Annual Annual% change -0.78% -66.12% na na 0.00% 1.46% 0.00% 0.73% na na2000/01 381 144 100.00% 100.00% 100.00% 100.00P/o
199600 384 425 100.00% 98.54% 100.00% 99.27%1998/99 350 407 100.00% 100.00% 100.00% 100.00%1997/98 371 357 100.00% 100.00% 100.00% 100.00%199697 304 399 100.00% 100.00% 100.00% 100.00%
Women's Studies
AcademicYear
Enrollment Majors Success Retention Ucensure ExamsDegreesAwarded
CertificatesAwarded
Fall Spring Fall Spring Fall Spring Fall Spring Fall Spring Annual Annual% Change -11.08% -13.67% -7.69% 13.64% -2.38% -0.29% -3.16% 4.44% na na2000/01 281 259 24 25 76.34% 73.36% 80.53% 81.47%1999/00 316 300 26 22 78.72% 73.65% 83.69% 77.03% 2 0199699 261 272 13 23 81.51% 74.60% 85.71% 76.98% 0 01997/98 336 341 27 15 77.23% 75.08% 81.85% 84.00% 2
199697 269 311 54 47 81.74% 85.86% 86.72% 93.45% 1 0
Health/Physical Education/Recreation/Dance Division
Adaptive Physical Education
AcademicYear
Enrollment Ma ors Success Retention Ucensure ExamsDegreesAwarded
CertificatesAwarded
Fall Spring Fall Spring Fall Spring Fall Spring Fall Spring Annual Annual%Change 24.07% -14.23% 0.00% 0.00% -2.81% 5.84% -6.35% -0.57% na na2000/01 299 241 0 0 78.40% 87.50% 85.60% 93.75%1999/00 241 281 0 0 81.21% 81.66% 91.95% 94.32% 0 01998/99 326 333 0 0 86.54% 86.69% 94.23% 89.52% 0 01997/98 280 271 0 0 95.00% 97.06% 96.82% 98.53% 0 0199697 353 290 0 0 86.16% 94.87% 91.52% 96.41% 0 0
Athletics
AcademicYear
Enrollment Majors Success Retention Ucensure Exams DegreesAwarded
CertificatesAwarded
Fall Spring Fall Spring Fall Spring Fall Spring Fall Spring Annual Annual%Change 27.82% -36.36% 0.00% 0.00% -2.90% 4.58% -1.60% 2.80% na na2000/01 340 105 90.56% 90.36% 92.63'/o 92.31%1999/00 266 165 0 0 93.46% 85.80% 94.23% 89.51%1998/99 250 138 0 0 85.89% 92.31% 87.97% 94.87% 0 01997/98 279 123 0 0 89.47% 96.75% 90.60% 96.75% 0 0199697 281 147 0 0 88.81% 90.97% 90.67k 93.06% 0 0
78 CABRILLO COLLEGE FACTBOOK 2001 89

Sociology
AcadenicYear
FTES WSCH FIEF WSCWFTEF = Load Percent of WSCH Percent of FTEF Wait List
Fall Spring Fall Spring Fall Spring Fail Spring Fall Spring Fall Spring Fall Spring
%Change -5.81% -15.45% -5.81% -15.45% 0.00% 0.00% -5.81% -15.45% -0.09% -0.17% -0.01% 0.01% na rta
2000/01 47.04 40.83 1,452.80 1,260.80 2.20 2.40 660.36 525.33 0.995% 0.859% 0.771% 0.827% na 71999/00 49.94 48.29 1,542.40 1,491.20 2.20 240 701.09 621.33 1.085% 1.025% 0.780% 0.815% 15 na
1998/99 50.71 49.04 1,565.25 1,514.26 2.20 220 711.48 688.30 1.086% 1.071% 0.801% 0.791% 20 8
1997/98 51.76 49.43 1,552.25 1,482.00 2.25 225 689.89 658.67 1.241% 1.078% 0.832% 0.840% 25 12
1996/97 45.63 45.59 1,369.00 1,367.50 2.20 220 622.27 621.59 1.151% 1.096% 0.835% 0.792% 21 9
Speech Communication
Academic
Year
FTES WSCH FTEF WSC1-VFTEF = Load Percent of WSCH Percent of FTEF Walt List
Fall Spring Fall Spring Fall Spring Fall Spring Fall Spring Fall Spring Fall Spring%Change 0.37% -0.84% 0.49% -0.61% 0.00% 5.45% 0.49% -5.74% -0.04% -0.02% -0.02% 0.12% na na2000/01 75.02 76.63 2,325.76 2,381.49 5.14 5.42 452.48 439.39 1.593% 1.623% 1.801% 1.868% na 2071999100 74.74 77.28 2,314.40 2,396.11 5.14 5.14 450.27 466.17 1.628% 1.646% 1.823% 1.745% 92 na1998/99 76.03 76.37 2,352.11 2,458.18 4.75 4.78 495.18 514.26 1.632% 1.739% 1.730% 1.719% 68 1131997/98 73.12 78.36 2,193.75 2,350.38 4.94 4.94 444.08 475.79 1.754% 1.709% 1.826% 1.844% 37 531996/97 61.59 70.31 1,848.00 2,109.25 4.74 4.74 389.87 444.99 1.553% 1.690% 1.799% 1.706% 23 67
Stroke Center
Academic
Year
WSCH FTEF WSCWFTEF = Load Percent of WSCH Percent of FTEF Wait List
Fall Spring Fall Spring Fall Spring Fall Spring Fall Spring Fall Spring Fall Spring%Change 0.95% -17.79% 7.00 -166.61 0.49 -0.29 -14.12 -23.16 -0.009% -0.119% 0.151% -0.072% na na20011/01 23.41 23.47 768.00 770.06 5.16 4.96 148.84 155.25 0.526% 0.525% 1.808% 1.709%1999/00 23.19 28.55 761.00 936.67 4.67 5.25 162.96 178.41 0.535% 0.644% 1.657% 1.782%1998/99 21.39 23.46 697.10 764.20 5.19 5.27 134.32 145.01 0.484% 0.540% 1.890% 1.895%1997/98 23. 13 22.17 731.30 700.43 4.59 4.67. 159.32 149.99 0.585% 0.509% 1.697% 1.743%1996/97 20.26 25.99 639.56 822.42 5.27 5.27 121.36 156.06 0.538% 0.659% 2.000% 1.897%
Women's Studies
AcademicYear
FTES WSCH FTEF WSCIi/FTEF = Load Percent of WSCH Percent of FTEF Wait List
Fall Spring Fall Spring Fall Spring Fall Spring Fall Spring Fall Spring Fall Spring-50.13% -9.40% -50.53% -10.22% -13.77% -14.44% -42.62% 4.93% -0.40% -0.05% -0.09% -0.08% na
2000/01 17.02 17.64 536.88 550.92 1.44 1.60 372.83 344.33 0.368% 0.376% 0.506% 0.551% na 451999100 34.13 19.47 1,085.19 61365 1.67 1.87 649.81 328.16 0.763% 0.422% 0.592% 0.635% 22 na1998/99 17.61 17.65 551.62 555.54 1.47 1.48 375.25 375.36 0.383% 0.393% 0.535% 0.532% 36 791997/98 23.28 23.07 708.87 702.75 1.94 1.69 365.40 415.83 0.567% 0.511% 0.717% 0.631% 46 691996/97 21.45 21.22 651.34 646.94 1.60 211 407.09 306.61 0.547% 0.518% 0.607% 0.760% 34 109
Health/Phvsical Education/Recreation/Dance Division
Adaptive Physical
Percent of FTEF
Education
Wait ListAcadernic
Year
FTES WSCH FTEF WSCI1/FTEF = Load Percent of WSCH
Fall Spring Fall Spring Fall Spring Fall Spring Fall Spring Fall Spring Fall Spring%change 57.61% -0.14% 57.62% -0.66% 90.00% -26.35% -17.04% 34.88% 0.17% -0.01% 0.19% -0.13% na2000101 2339 21.95 72220 677.80 1.14 1.09 633.51 621.83 0.495% 0.462% 0.399% 0.376% na 141999/00 14.84 21.98 458.20 682.30 0.60 1.48 76367 461.01 0.322% 0.469% 0.213% 0.502% 37 na1998/99 21.96 20.55 678.35 644.02 0.87 0.91 779.71 707.71 0.471% 0.455% 0.317% 0.327% 21 71997/98 19.17 18.75 575.00 562.00 0.66 0.60 871.21 936.67 0.460% 0.409% 0.244% 0.224% 51 421996/97 19.40 17.50 582.00 525.00 0.66 0.66 881.82 795.45 0.489% 0.421% 0.250% 0.238% 53 62
Athletics
AcademicYear
FTES WSCH FTEF WSCH/FTEF = Load Percent of WSCH Percent of FTEF Walt List
Fall Spring Fall Spring Fall Spring Fall Spring Fall Spring Fall Spring Fall Spring%Change 7.50% -1345% 9.50% -13.44% 5.19% -1244% 4.10% -1.14% 0.08% -0.10% 0.08% -o. 1 5% na na2000/01 53.77 25.94 1,797.20 851.27 6.08 3.38 295.59 251.86 1.231% 0.580% 2.130% 1.165% na 01999/00 50.02 29.97 1,641.31 983.39 5.78 3.86 283.96 254.76 1.155% 0.676% 2.050% 1.310% na1998/99 46.99 31.22 1,531.64 1,018.05 5.02 a85 305.11 264.43 1.063% 0.720% 1.823% 1.385% 0 1
1997/98 30.60 31.54 1,601.34 997.97 5.03 395 31 a 36 252.65 1.280% 0.726% 1.860% 1.475% 0 1
1996/97 50.27 32 20 1,591.54 1,019.54 4.96 3.76 320.88 271.15 1.338% 0.817% 1.882% 1.353% 0 0
BEST COPY AVAII AA BA.1 J 0 CABRILLO COLLEGE FACTIBOOK 2001 79

Dance
AcademicYear
Enrollment Majors Success Retention Licensure ExamsDegreesAwarded
CertificatesAwarded
Fall Spring Fall Spring Fall Spring Fall Spring Fall Spring Annual Annual
% Change 14.90% 14.34% -100.00% -100.00% -2.47% 5.28% -0.39% -1.06% 200.00% na
2000(01 509 590 47.64% 60.51% 64.17% 72.20% 3
1998100 443 516 59 57 50.11% 55.23% 64.56% 73.26% 1
1998/99 403 457 44 55 62.56% 57.73% 82.56% 70.91% 0 0
1997/98 400 504 46 49 59.68% 56.84% 73.74% 70.95% 0 0
1996/97 362 491 61 58 59.55% 65.60% 72.47% 75.21% 0 0
Note: As of Fall 1998, data on Yoga (PE-55) has been included in Physical Education. Prior to Fall 1998, it was included in Dance.
Health Science
AcademicYear
Enrollment Ma ors Success Retention Ucensure ExamsDegreesAwarded
CertificatesAwarded
Fall Spring Fall Spring Fall Spring Fall Spring Fall Spring Annual Annual% Change -9.11% -3.78% -24.00% -31.94% -9.99% -4.37% 1.21% 3.47% 0.00% na
2000/01 419 407 57 49 72.66% 72.70% 89.93% 93.78% 1
1999/00 461 423 75 72 82.65% 77.07% 88.72% 90.31% 1
1998/99 474 388 71 56 82.54% 79.11% 92.89% 94.52% 2 0
1997/98 515 479 90 81 78.26% 75.00% 90.51% 90.17% 0 0
1996/97 417 400 67 74 78.45% 76.77% 91.04% 87.12% 0 0
Physical Education
AcademicYear
Enrollment Majors Success Retention Ucensure ExamsDegreesAwarded
CertificatesAwarded
Fall Spring Fall Spring Fall Spring Fall Spring Fall Spring Annual Annual% Change -7.56% -4.81% -25.00% -23.19% -1.79% 4.51% -2.76% 4.16% na na
2000/01 1,981 2,256 57 53 68.54% 74.96% 79.97% 85.92%1999}00 2,143 2,370 76 69 70.33% 70.45% 82.73% 81.76% 2
1998/99 2,382 2,250 68 72 73.40% 78.38% 84.18% 89.62% 0 0
1997/98 2,225 2,257 77 59 71.86% 73.65% 80.50% 83.14% 0 0
1996/97 2,063 2,429 69 71 71.46% 71.88% 82.52% 79.22% 1
Note: As of Fall 1998, data on Yoga (PE-55) has been included in Physical Education. Prior to Fall 1998, it was included in Dance.
Recreation
AcademicYear
Enrollment Ma ors Success Retention Ucensure ExamsDegreesAwarded
CertificatesAwarded
Fall Spring Fall Spring Fall Spring Fall Spring Fall Spring Annual Annual% Change na 7.41% -33.33% -33.33% 73.68% 1.53% 89.47% -2.93% na na
2000}01 19 29 4 4 73.68% 79.31% 89.47/o 89.66%1999}00 0 27 6 6 77.78% 92.59%1998/99 15 20 4 4 73.33% 92.86% 86.67% 92.86% 0 01997/98 17 24 12 10 70.59% 75.00% 82.35% 91.67% 0 01996/97 17 35 12 10 64.71% 68.57% 82.35% 80.00% 0
Libra
Library
AcademicYear
Enrollment Majors Success Retention Ucensure ExamsDegreesAwarded
CertificatesAwarded
Fall Spring Fall Spring Fall Spring Fall Spring Fall Spring Annual Annual% Change -5.70% -2.84% -14.29% -23.08% -4.85% 8.54% -1.76% 14.24% na na
2000/01 1,241 1,298 12 10 59.76% 66.55% 75.73% 84.69%1999}00 1,316 1,336 14 13 64.61% 58.01% 77.49% 70.45%1998199 893 1,494 11 15 66.79% 67.10% 76.69% 80.76% 0 01997/98 877 1,025 15 14 61.06% 59.74% 72.61% 70.83% 0 01996/97 936 1,056 12 9 67.29% 65.18% 76.32% 72.58% 0 0
Math Science & Engineerinq Division
Aeronautics
AcademicYear
Enrollment Majors Success Retention Ucensure ExamsDegreesAwarded
CertificatesAwarded
Fall Spring Fall Spring Fall Spring Fall Spring Fall Spring Annual Annual% Change -11.76% 5.26% 0.00% na -2.22% 7.43% 1.23% 1.82% 0.00% 0.00%2000/01 30 40 1 65.52% 75.00% 68.97k 77.50% 0 01999/00 34 38 0 0 67.74% 67.57% 67.74% 75.68% 0 0
1998/99 53 34 0 1 73.91% 81.25% 73.91% 90.63% 0 01997/98 41 41 3 3 70.73% 75.61% 73.17% 82.93% 0 01996/97 27 30 2 1 69.57% 78.57% 78.26% 82.14% 0 0
80 CABRILLO COLLEGE FAL 11300K 2001 91

Dance
AcademicYear
FTES WSCH FTEF WSCH/FTEF = Load Percent of WSCH Percent of FTEF Wait Ust
Fall Spring Fall Spring Fall Spring Fall Spring Fall Spring Fall Spring Fall Spring%Change 9.26% 22.19% 9.25% 22.92% 4.70% 15.96% 4.34% 6.01% 0.06% 0.22% 0.04% 0.18% na na
2000/01 49.22 58.75 1,520.40 1,821.74 3.12 3.56 487.31 511.72 1.041% 1.242% 1.093% 1.227% na 252
1999100 45.05 48.08 1,391.73 1,482.00 2.98 3.07 467.02 482.74 0.979% 1.018% 1.057% 1.042% 168 re1998/99 43.91 48.80 1,358.50 1,507.05 2.79 2.93 486.92 514.35 0.943% 1.066% 1.016% 1.054% 20 42
1997/98 68.75 81.05 2,063.00 2,435.61 3.89 3.47 530.33 701.90 1.649% 1.771% 1.438% 1.295% 89 162
1996/97 67.45 79.81 2,024.00 2,400.22 3.84 4.36 527.08 550.51 1.701% 1.923% 1.457% 1.569% 75 172
Health Science
AcademicYear
FTES WSCH FTEF WSCH/FTEF = Load Percent of WSCH Percent at FTEF Wait Ust
Fall Spring Fall Spring Fall Spring Fall Spring Fall Spring Fall Spring Fall Spring%Change -8A3% -8.96% -8.65% -8.67% 0.00% -7.69% -8.65% -1.06% -0.11% -0.09% -0.01% -0.06% na na2000/01 43.33 39.65 1,334.80 1,228.55 2.40 2.40 556.17 511.90 0.914% 0.838% 0.841% 0.827% na1999/00 47.32 43.55 1,461.20 1,345.20 2.40 2.60 608.83 517.38 1.028% 0.924% 0.851% 0.882% 17 na1998199 49.93 40.85 1,540.50 1,261.00 2.40 a 40 641.88 525.42 1.069% 0.892% 0.874% 0.863% 32 221997/98 55.09 51.92 1,651.75 1,556.75 2.60 2.60 635.29 598.75 1.321% 1.132% 0.961% 0.971% 14 31996/97 41.70 41.60 1,251.00 1,248.25 2.40 2.60 521.25 480.10 1.051% 1.000% 0.911% 0.936% 8 12
Physical Education
AcademicYear
WSCH FTEF WSCH/FTEF = Load Percent of WSCH Percent of FTEF Walt Ust
Fall Spring Fall Spring Fall Spring Fall Spring Fall Spring Fall Spring Fall Spring%Change -6.27% -3.33% -6.43% -3.52% -8.20% -0.41% 1.92% -3.12% -0.41% -0.21% -0.36% 0.04% na na2000101 196.82 220.30 6,089.14 6,818.30 9.97 9.70 610.75 702.92 4.170% 4.648% 3.493% 3.343% na 4981999/00 209.98 227.89 6,507.57 7,067.15 10.86 9.74 599.22 725.58 4.578% 4.856% aasrk 3.306% 245 rta1998/99 226.46 210.90 7,022.37 6,558.94 10.65 9.06 659.38 723.94 4.874% 4.639% 3.878% 3.258% 1851997/98 189.12 198.19 5,688.09 5,954.25 8.89 8.19 639.83 727.01 4.548% 4.329% 3.297% 3.058% 215 183
1996/97 158.92 203.90 4,780.72 6,148.51 8.20 8.76 583.01 701.88 4.018% 4.926% 3.112% a 153% 60 198
Recreation
AcademicYear
FTES WSCH FTEF WSCH/FTEF = Load Percent of WSCH Percent of FTEF Wait Ust
Fall Spring Fall Spring Fall Spring Fall Spring Fall Spring Fall Spring Fall Spring%Change na -26.27% na - 24.28% na 0.00% na -24.28% 0.04% -0.02% 0.07% 0.00% na na2000101 1.97 948 60.80 110.40 0.20 0.29 304.00 380.69 0.042% 0.075% 0.070% 0.100% na 01999100 0.00 4.72 0.00 145.80 0.00 0.29 0.00 502.76 0.000% 0.100% 0.000/o 0.098% na1998199 1.58 3.35 48.75 103.60 0.21 0.29 232.14 357.24 0.034% 0.073% 0.076% 0.104% 0 01997/98 1.84 4.32 55.25 129.60 0.21 0.29 263.10 446.90 0.044% 0.094% 0.078% 0.108% 0 01996197 1.60 4.86 48.00 153.73 0.20 0.29 240.00 530.10 0.040% 0.123% 0.076% 0.104% 0 0
Libra
library
AcademicYear
FTES WSCH FTEF WSCH FIEF = Load Percent of WSCH Percent of FTEF Wait Ust
Fall Spring Fall Spring Fall Spring Fall Spring Fall Spring Fall Spring Fall Springna%Change -16.68% -0.20% -16.83% -0.53% -17.73% -5.66% 1.09% 5.44% -0.11% -0.01% -0.15% -0.03% na
2000/01 21.03 25.34 688.71 828.63 1.81 2.00 380.50 414.32 0.472% 0.565% 0.634% 0.689% na 591999100 25.24 25.39 828.04 833.04 2.20 2.12 376.38 392.94 0.583% 0.572% 0.780°A, 0.720% 14 na1998/99 26.89 31.00 879.02 1,010.22 1.65 1.81 532.74 558.13 0.610% 0.714% 0.601% 0.651% 7 14
1997/98 26.63 28.47 838.19 894.22 1.59 2.19 527.16 408.32 0.670% 0.650% 0.588% 0.818% 4 191996197 33.34 31.14 1,054.87 984.04 1.52 1.84 693.99 534.80 0.897% 0.788% 0.577% 0.662% 19 19
Math, Science & Engineering Division
Aeronautics
AcademicYear
FTES WSCH FTEF WSCH/FTEF = Load Percent of WSCH Percent of FTEF Wait Ust
Fall Spring Fall Spring Fall Spring Fall Spring Fall Spring Fall Spring Fall Spring%Change -11.65% 5.08% -11.76% 5.26% 0.00% 0.00% -11.76% 5.26% -0.01% 0.00% 0.00% 0.00% na na2000101 3.11 4.14 96.00, 128.001 0.20 0.20 480.00 640.00 0.066% 0.087% 0.070% 0.069% na 01999100 3.52 3.94 108.80 121.60 0.20 0.20 544.00 608.00 0.077% 0.084% 0.071% 0.068% re1998/99 5.37 ass 165.75 110.50 0.20 0.20 828.75 552.50 0.115% 0.078% 0.073% 0.072% 0 01997/98 4.00 4.44 120.00 133.25 0.20 0.20 600.00 666.25 0.096% 0.097% 0.074% 0.075% 0 01996/97 2.70 3.00 81.00 90.00 0.20 aao 405.00 450.00 0.068% 0.072% 0.076% 0.072% 0 0
BEST COPY AVAIIILA 11
LIE 92 CABRILLO COLLEGE FAC 1 BOOK 2001 81
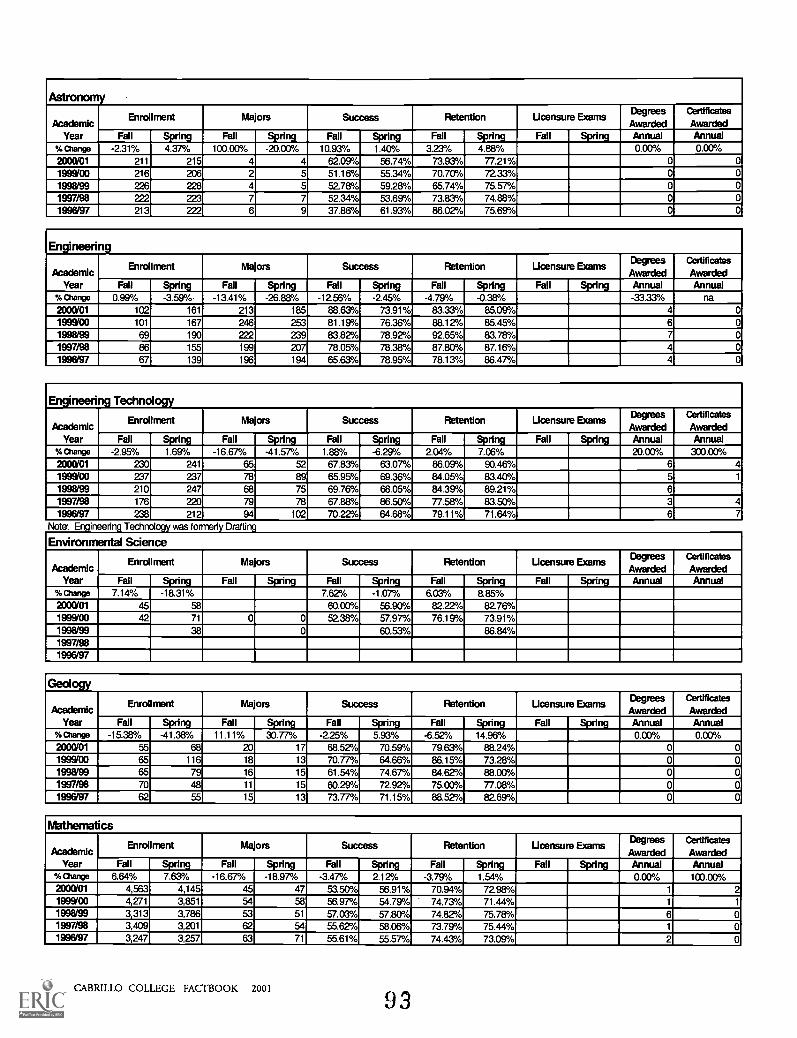
Astronomy
AcademicYear
Enrollment Majors Success Retention Ucensure ExamsDegreesAwarded
CertificatesAwarded
Fall Spring Fall Spring Fall Spring Fall Spring Fall Spring Annual Annual%change -2.31% 4.37% 100.00% -20.00% 10.93% 1.40% 3.23% 4.88% 0.00% 0.00%2000/01 211 215 4 4 6209% 56.74% 73.93% 77.21% 0 01999/00 216 206 2 5 51.16% 55.34% 70.70% 7233% 0 01998/99 226 228 4 5 5278% 59.28% 65.74% 75.57% 0 01997/98 222 223 7 7 52.34% 53.69% 73.83% 74.88% 0 01996/97 213 222 6 9 37.86% 61.93% 66.02% 75.69% 0 0
Engineering
AcademicYear
Enrollment Majors Success Retention Ucensure Examsees
AwardedCertificab3s
AwardedFall Spring Fall Spring Fall Spring Fall Spring Fall Spring Annual Annual
%mange 0.99% -a59%. -13.41% -26.88% -1256% -2.45% -4.79% -0.36% -33.33% na2000101 102 161 213 185 68.63% 73.91% 83.33% 85.09% 4 0199900 101 167 246 253 81.19% 76.36% 88.12% 85.45% 6 01998/99 69 190 222 239 83.82% 78.92% 92.65% 83.78% 7 01997/98 86 155 199 207 78.05% 78.38% 87.80% 87.16% 4 01996197 67 139 196 194 65.63% 78.95% 78.13% 86.47% 4 0
Engineering Technology
AcademicYear
Enrollment Ma ors Success Retention Ucensure ExamsDegreesAwarded
Certificates
AwardedFall Spring Fall Spring Fall Spring Fall Spring Fall Spring Annual Annual
%alanfle -2.95% 1.69% -16.67% -41.57% 1.88% -6.29% 2.04% 7.06% 20.00% 300.00%2000/01 230 241 65 52 67.83% 63.07% 86.09% 90.46% 61999100 237 237 78 89 65.95% 69.36% 84.05% 83.40% 5 1
1998199 210 247 68 75 69.76% 68.05% 84.39% 89.21% 61997/98 176 220 79 78. 67.88% 66.50% 77.58% 83.50%1996197 238 212 94 102 70.22% 64.68% 79.11% 71.64% 6 7
Note: Ergineerino Technoloav was fonnerly Drafti
Environmental Science
AcademicYear
Enrollment Majors Success Retention Ucensure ExamsDegreesAwarded
CertificatesAwarded
Fall Spring Fall Spring Fall Spring Fall Spring Fall Spring Annual Annual%change 7.14% -18.31% 7.62% -1.07% 6.03% 8.85%2000/01 45 58 60.00% 56.90% 82.22% 82.76%1999100 42 71 0 0 5238% 57.97% 76.19% 73.91%1998199 38 0 60.57/o 86.84%1997/981996/97
Geology
AcademicYear
Enrollment Majors Success Retention Licensure ExamsDegreesAwarded
CertificatesAwarded
Fall Spring Fall Spring Fall Spring Fall Spring Fall Spring Annual Annual% Change -15.38% -41.38% 11.11% aa 77% -225% 5.93% -6.52% 14.96% 0.00% 0.00%2000101 55 68 20 17 68.52% 70.59% 79.63% 88.24% 01999'00 65 116 18 13 70.77% 64.66% 86.15% 73.28% 0 01998/99 65 79 16 15 61.54% 74.67% 84.62% 88.00% 0 01997/98 70 48 11 15 60.29% 72.92% 75.00% 77.08% 0 01996'97 62 55 15 13 73. 77°A, 71.15% 88.52% 8269% 0 0
Mathematics
AcademicYear
Enrollment Majors Success Retention Ucensure ExamsDegrees
AwardedCettificabas
AwardedFall Spring Fall Spring Fall Spring Fall Spring Fall Spring Annual Annual
%Change 6.84% 7.63% -16.67% -18.97% -3.47% 2.12% -3.79% 1.54% 0.00% 103.00%2000/01 4,563 4,145 45 47 53.50% 56.91% 70.94% 7298% 1 21999'00 4,271 3,851 54 58 56.97% 54.79% 74.73% 71.44% 1 1
1998/99 3,313 3,786 53 51 57.03% 57.80% 74.82% 75.78% 6 01997/98 3,409 3,201 62 54 55.62% 58.06% 73.79% 75.44% 1 01996/97 3,247 3,257 63 71 55.61% 55.57% 74.43% 73.09% 2 0
82 CABRILLO COLLEGE FACTBOOK 2001
93

- -F
rES
I.F
IEF
WS
CW
FT
EF
= Load
Percent of W
SC
HP
ercent of FIE
F
'1A
Wait List
-F
all E=
IF
allII -U
MW
Fall
ET
MI
Fall
EIT
M1
Fall
VE
MII
Fall
II=1
Fall IM
1%
Change
-7.30/.3 06%
-6.65%3.35%
0.90%0.00%
-6.65%3.35%
-0.04%0.01%
0.007.0.01%
nana
2000'0119.1-
20.11593.91
623.1 (X
)1.0)
593.91623.93
0.407)/0.425/
0.353*/0.345%
na26
1999001998/99
20.19.51
221636.
683.
603.70661.97
1.(X)
1.9063623
603.700.448/
0.415!/.0.3557
0.3390.360/
17na
714
1.9)1.90
683.90661.97
0.474%0.468%
0.364*/1997/96
21.63653.:
651.041X
01.(0
653.85651.04
0.523)/0.473%
0.3717/0.37
2110
19999719..
19.23592
579.58too
1.03592.25
536.65
WS
CI-V
FT
EF
= Load
0.496°/0.464%
Percent of W
SC
H
0.379'Y0.339
Percent of F
IEF
2025
-:..,
Wait List
- -F
TE
S-
FIE
F
-F
all-E
=I
Fall
W-M
MFall
KM
%Fall E
41F
allK
7=11
Fall
-KM
,F
all KM
,%
Change
6.59°/.242/.
302.197.251.01%
616.67%179.17%
-4388%25.74%
0.28%0.39%
0.39%0.45%
nana
2003'0117.4
25.81540.
797.s
1.29201
418.99396.77
0.370%0.544/
0.462b/0.693°/
01999'00
1998/9916.39
25.20
16.27.68
134.
508.50227.20
854.900.18
0.721.21
1.74
746.67315.56
0.095%0.156%
0.084V0.244
3na
1012
420.25491.32
0.353)/0.605/
0.44/0.626
1997/9614.7
466.755.30
1.261.46
370.26517.33
0.373*/0.549
0.466/0.54.5/
102
1996/9712.11
16.08383.
506.52127
1.41
FrE
F
301.80360.65
VV
SC
HIF
IEF
= Load
0.3227-0.407*/
Percent of W
SC
H
0.40270.5067
1r...,
Percent of F
IEF
00
.:....
1)4
VIM
List- . _
FrE
S-
-F
all EM
IF
allM
MT
EFall
E=
11Fall E
=I
Fall EM
iFall
En=
71Fall
EM
71%
Change
35.76%-257%
35.76%-258%
11.93%-4.53%
21.28%2.04%
am%
-0.04%0.09%
-am%
nana
2003/01
1999'001998/99
44.9148.48
33.49.7.
43.47.39
1,386.1 021.60
1 340.33
1 497.
1,537.90
1,463.90 Mgffl
243241
2.74509.89
546.46420.41
535.54556.14
569.61
0.950)/1.021V
0.719%1.056
0.9303/1.035/
0.9530.944'YM
O:
292.87
2.570.862,
0.974%0.878/
0.924/12
na0
171997/98
46.25971.--
1,331.33209
2.46464.80
561.500.777°/
1.004%0.773°/
a 918%0
01996197
42131.45
1,318.31978.75
1.99540.29
491.831.106°/
0.784/
Percent of W
SC
H
0.926°/0.716/
Percent of F
rEF
314
,,
-
Walt List
-^
FrE
Se.
FT
EF
VV
SC
H/F
rEF
= Load
Fall
MM
TI
Fall
M=
.F
all 1=1
Fall
WM
T1
Fall
11=1
Fall
1=1
Fall
-K7=
15fe M
M.
9.66%-18.34%
9.52%-1631%
111.11%58.33%
-4a 12%-48.41%
0.01%-0.03%
0.07%0.15%
2000'014.
6.01147. s
185..'0.38
1.14387.37
162.810.101°/
0.127%0.133°/
0.393/.na
541999'00
1998'997.36
0. r cam
134.a s r227.20
120.250.18
0.720.00
0.25746.67
315.560.00
481.900.095°/
0.1560.0007
0.085*/0.C
646/0.2440.090/
27na
0.900Y1997/90
1996/97
.... --
FT
ES
FrE
FV
VS
CH
/FT
EF
= Load
Percent of W
SC
HP
ercentof FrE
F
,...
)4W
ait List
Fall
KIM
TE
Fall
WM
.F
all LMT
FallM
MT
EFall
M47=
1Fall
"K=
IFall
KM
71%
thaw-18.57%
-20.44%-18.60%
-23.39%-1.72%
-1268%-17.17%
-12277°-0.04%
-0.05%-0.01%
-am%
nana
2009017.19
223.2227
0.0.62
392.77359.29
0.153)/0.152*/
0.230*/0.214/
21999'001998/99
8.:"9.00
9.9.
4 INW
4.1re:307.
290.76
298.360.58
0.71
0.0.62
474.17409.52
530.96481.23
0.193Y0.200'/
0.214%0.211/
0.206,0.241/
0.211*/0.222
1910
na91997/96
9.6.9
291.1,-210.60
0.580.43
501.76489.77
0.233%0.153*/
0.214°/0.161%
1919
1996197
.--
8561
FT
ES
263.177.63
0.0.43
FT
EF
4623241309
WS
CI-V
FT
EF
= Load
0.221*/0.142%
Percent of W
SC
H
0.216/0.155
Percent of F
rEF
19
--1
Wait
25
r..-
i -.
List
Fall
KM
,F
allW
IME
Fall
K:=
11F
allM
OM
Fall
Fall
W.=
IF
ill1=
1%
Change
4.16%-3.13%
4.25%-3.27%
3.20%-3.21%
1.01%-am
%0.18%
-0.45%0.20%
-0.17%na
na2030/01
1999'001998199
1997/96
1996197
574.
551.
548.'.461.1
446.
504.9617 769.
521.2817 046.15
506.1.16,94227
524.3013,980.04
46239
15 594. c16 120.85
15,650.75
15,741.17
14,010.09
29.6328.71
26.2-
24.6023.61
28.68599.73
29.63593.74
26.84645.67
25.01568.29
26.25575.07
543.7412169
10.631*/10.382*/
544.0711.9937
11.077*/10.184°/
583.1111.759/
11.069*/9.555°/
629.4011.1786/
11.445*/9.094
533.7211.411/
11.225%8.959°/
9.885/na
10.057°/91
9.652879
9.3377797
9.4491! IN.=
n74 580na586655
'
3, I1
\ I1,
:I I

Oceanography
AcademicYear
Enrollment Majors Success Retention Ucensure ExamsDegreesAwarded
Certificates
AwardedFall Spring Fall Spring Fall Spring Fall Spring Fall Spring Annual Annual
%Change 5.37% -14.17% 0.00% 0.00% 13.23% -7.08% 0.52% -a47% 0.00% 0.00%2000101 157 109 0 0 71.34% 65.14% 80.25% 74.31% 0 01999100 149 127 0 0 58.11% 72.22% 79.73% 77.78% 0 01998/99 157 102 0 0 74.50% 74.75% 87.25% 80.81% 0 01997/98 128 118 0 0 63.20% 70.80% 75.20% 82.30% 0 01996/97 122 113 0 0 66.39% 72.73% 77.31% 81.82% 0 0
Physics
AcademicYear
Enrollment Majors Success Retention Ucensure ExamsDegreesAwarded
Certificates
AwardedFall Spring Fall Spring Fall Spring Fail Spring Fall Spring Annual Annual
%Change -8.04% 1.05% -25.00% -18.18% -4.63% -1.56% -5.91% -5.07% na na2000/01 263 290 21 18 77.48% 81.31% 83.21% 83.74% 0 1
1999100 286 287 28 22 82.11% 82.87% 89.12% 88.81%1998199 295 270 28 34 80.858/o 81.30% 85.46% 85.88% 2 01997/98 242 301 33 27 80.34% 85.22% 85.90% 87.97% 21996197 288 262 28 26 80.50P/o 77.82% 85.46% 83.27% 2 0
Welding
Academic
Year
Enrollment Majors Retention Ucensure Examsuegrees laNtaleateS
Fall Spring Fall Spring Fall Spring Fall Spring Fall Spring Annual Annual
%Change -10.85% -a 10% -100.00% -100.00% -7.54% 10.04% -6.90% 13.50% na na200001 115 125 59.13% 61.60% 72.17% 76.00%1999/00 129 129 4 4 66.67% 51.56% 79.07% 62.50%1998/99 119 121 7 6 71.19% 53.72% 83.05% 82.64% 1 01997/98 114 117 28 9 69.44% 61.54% 87.04% 80.34% 0 01996197 118 129 27 31 70.34% 76.00% 77.97% 83.20% 0 1
Note: Welding was formerly known as Industrial Technology.
Visual and Perfornlina Arts DivisionArt History
AcademicYear
Enrollment Majors Success Retention Ucensure ExamsDegreesAwarded
CertificatesAwarded
Fall Spring Fall Spring Fall Spring Fall Spring Fall Spring Annual Annual%Change -7.19% 7.83% -29.03% -10.71% 6.27% 11.16% 5.88% 9.30% 0.00% 0.00%2000101 400 358 22 25 78.20% 82.07% 82.21% 86.27% 1
1999100 431 332 31 28 71.93% 70.91% 76.33% 76.97%1998/99 402 386 32 40 75.45% 70.49% 82.10% 76.23% 0 01997/98 450 390 47 34 72.85% 77.66% 77.96% 81.65% 2 01996197 392 355 36 41 80.16% 69.32% 85.52% 79.35% 1 0
Art Photography
AcademicYear
Enrollment Majors Success Retention Ucensure ExamsDegreesAwarded
CertificatesAwarded
Fall Spring Fall Spring Fall Spring Fall Spring Fall Spring Annual Annual%Change 0.00% 0.00% 0.00% 0.00% -4.18% -8.61% -1.54% -a 86% 11.1194 0.00%2000/01 244 290 0 0 69.04% 64.82% 82.56% 81.11% 10 01999/00 244 290 0 0 73. 22% 73.438/o 84.10% 84.97% 9 01998199 252 279 0 0 75.56% 79.70% 88.00P/o 90.41% 0 01997/98 290 247 0 0 74.55% 83.12% 82.55% 89.87% 0 01996197 131 274 0 0 77.17% 76.78% 91.34% 82.77% 0 0
Art Studio
AcademicYear
Enrollment Majors Success Retention Ucensure ExamsDegreesAwarded
CertificatesAwarded
Fall Spring Fall Spring Fall Spring Fall Spring Fall Spring Annual Annual%Change -4.34% -a 31% -29.57% -31.84% -5.55% a 56% -4.76% 1.44% na na2000101 1,762 1,751 281 274 52.97% 56.71% 83.61% 88.37%1999/00 1,842 1,811 399 402 58.52% 53.15% 88.37% 86.93%1998199 1,895 1,992 357 401 59.81% 56.70% 89.25% 87.21% 12 01997/98 1,919 1,968 422 395 56.25% 59.23% 89.39% 90.46% 10 01996/97 1,798 1,867 369 412 54.38% 53.48% 86.88% 84.94% 7 0
84 CABRILLO COLLEGE FACTBOOK 2001
95

. - FTES . FTEF VVSCH1FTEF = Load Percent of VVSCH Percent of FTEF Wait List
- Fall 1=11 Fall ILTIME Fall En=11 Fall KM, Fall ETMII Fall WMTI Fall KT=1
%Owings 7.03% -15.39% 7.03% -15.34% 0.76% 0.00% 6.22% -15.34% 0.02% -0.08% 0.0 CPA 0.01% na re 2000'01 29. 19. 908. 613 1.32 1.11 688.30 552.74 0.5223/ 0.418/ 0.467/ 0.383 /11-.1 7
1999'00 1998199
23 29. 18.
848. 724.7 - 1.31 1.11
880. 58525 1.31 1.12
647.98 652.92 0.597 0.498 0.4657' 0.377V 8 na 10 5 671.76 522. 0.611 0.414 0.4777' 0.403
1997/98 25. 768. 755.20 1.10 1.10 698.18 686.55 0.614°/ 0.54 0.407° 0.411/ 19 7 1996197
. ..
24. r 23
FTES
726.03 700.00 1.10 1.05
FTEF
660.00 666.
WSCHFrEF = Load
0.610% 0.5616/ 0.4177'. 0.37 13 5
Percent of WSCH Percent of FIEF
- .- Wait List
Fall 1=1 Fall MT II Fall EMI Fall WM, Fall -L=1 Fall EM, Fall E1 %Change 7.53% -724% 7.53% -7.23% 17.33% -2.03% -8.35°4 -5.714 0.05% -0.10% 0.17% -0.01% na na 2000'01 53.01 =EM 1 637.1 r 1653. r 3.52 3.37 465.09 490.71 1.121°/ 1.127°/ 1.233Y 1.161/ nst 25
1999'00 1991199
49.
48. 44.
152240 1,782.60 3.00 3.44
1491.30 1,386.65 EWE 349 507.47 518.20
498.76 397.32
1.071°/ 1.22/ 1.0357' 0.981
1.064% 1.168 1.089% 1.255
26 na 50 17
1997/98 41. . 50.41 1,248.00 1,512.00 3.26 333 712.82 454.05 0.996Y 1.099 1.237/ 1.247/ 27 1996197
%Change
46. 43.1,397X0
FTES
. .
-9.94% - 4.33%
1,317.75 MDE 336
FTEF
- ' -. .
-9.94% -4.33% -7.00% -6.93%
407.29 389.87
WSCHCIEF = Load
-. . -3.16% 279%
1.174°/ 1.056/
Percent of WSCH
" -0.05% -0.02%
1.307/ 1.2177'
Percent of FTEF
-. .
.0.03% -0.02%
22 24
:.. . .
Wait List
-. .
na m 2000'01 17.01 486. . 0. 0. 52344 558. 0.333'/ 0.358/ 0.32/ 0.324/ 49
1999100
1998199 M 17.78
16 16.
540. r 549.20 1.00 1.01 540.50 543.76 0.730Y 0.3776/ 0.357/ 0.343 31 na 25 8 502. 502.25 0. 0.94 528.68 534.31 0.34 0.355% 0.346/ 0.338
1997/98 14.2 16.31 427. r 488.85 0.93 0.84 474.44 581.96 0.341% 0.355% 0.333 0.314 6 22 1996197 14.. 16. 438. r 483.00 1.10 1.10
... :_
398.64 439.09
4 li
VISCHFIEF = Load
0.369% 0.38
.r
Percent of WSCH
0.417/ 0.396/
Percent of FIEF
4 19
I -. . i Wait List FTES
- .1.
FTEF
Fall ETrffl Fall -IKTME Fall En =1 Fall K=1 Fall K=1 Fan ETMTI Fall C=1 %Carge -7.52% 8.77/o -7.35% 8.73% lace% 9.39% -17.29% -0.5)/. -0.10% 0.06/. 0.71% 0.08% na na 200001 42. 37.98 1 338. r IMPIEEMM 2.33 561.59 503.39 0.897/ 0.8C 0.81 0.807/ -., 27 199900 45. 34.91 1,41230 1,078.70 2.08 2.13 678.99 506.43 0.994°/ 0.741/ 0.73/ 0.723Y 60 na 1998199 42. 41.08 1,323.10 1,268.05 MM 1.83 72.101 692.92 0.918/ 0.897'/ 0.666 0.658/ 56 0 1997/98 47 42 1415. 1 287.45 2.08 1.83 680.40 703.52 1.1327 0.936/ 0.7697' 0.65/ 32 8 1996197 39. 1 181.0) 1,065.65 Min 1.83 645.36 582.32
VVSC1-VFTEF = Load
0.993% 0.854%
Percent of WSCH
0.694°/ 0.65
Percent of FIEF
35 15
. .x.LIDA
Walt List ..
FTES - FIEF
- Fall ErMI Fall W.MII Fall K7=1 Fail KIM Fall KTMII Fall KM11 Fall 1
%Clow 8.99% 1.43% 9.0)% 1.43% 11.83% -10.71% -2.53% 1360/. 0.07% 0.01% 0.14% -0.157. na na 200001 55. 61. 1706. r 1 885.1 r 4.16 4.25 410.22 443 55 1.169Y 1.28. 1.45 1.4657 296 1999100
1991'99
1997/98
50. r 60.18 INIM=M2
=MU MEM 1565.60 1,858.501=M 4.76
3.65 3.31
420.86 310.
407.23 488.82 434.59 476.
1.101°/ 1.2776/ 1.320P/ 1.617/ : 139 259 I 162
1616.70 1,784.20 1,734XX0 1,56.80MgE
1.1221/ 1.262 1.3287' 1.14
1.446 1.313 1.475Y 1.216°/
1996197 26. r 54.80 786.rr 1,644.00 2.6 3.65 294.38 450.41
VVSCHF1EF = Load
0.661/ 1.317'/
Percent of WS(01-1
1.017/ 1.314
Percent of FIEF
106 161
- . .
Wait List .. . :.
FTES - REF
- Fall EnIMI Fall 10=1I Fall EMI Fall En =1 Fall KM" Fall WM" Fall MTI %manse -1.°Y., -2.62% -1.60% -2.77/. 4.23% 0.43% -5.59% -320% -0.19% -0.16% 0.14% 0.09.A. na na
2000'01 199. 199. 6 198. s 6,175.91 13.81 14.05 448.85 439. 4.2457' 4.210/ 4.837/ 4.647/ 227 1999100
1991'99 232 207
204. 6 299.1 6,353.13 K. 221. 6,442.01 6,874.37 13.0
1399 475.41 454.12 4.432 4.365%
492.89 494.92 4.471/ 4.862%
4.7110 4.748 320 - 4.759Y 4.99 an 283 13.89
1997/98 196. 229. 5,937. 6,917.70 13.63 447.11 507.53 4.7476/ 5.030 4.907/ 5.087/ 257 1996/97 193 70.46 5,839 6,045.27 12901M 452.66 435.85 4.9077' 4.844 4.89 4.997/ 210 264
.

rtrilSIC
t mimicYeer
Ent-011m 3nt rajas Snows R3tenticn Limns= Bars LI3ge3s
Anercled
Certificates
PmerckdFell zing Fall 4rring FEE zing Fell 4:rirg Fall Spring Areal Mild
%Crrge -4,03% 0.46% -15.09% -1861% -3.06% -1.84% -2.92°/0 -4.12% -2E67% na
2000131 1,848 1,959 287 258 70.58% 73.19% 8366% 84.00% 519991)0 1,926 1,950 328 317 73.64% 75.03% 86580% 8812% 7
1938/93 1,917 1,958 305 306 7649% 73.97% 88E2% 8899% 8 01997198 1,940 2,089 331 325 75.41% 72.22% 8873% 87.14% 9 01936097 1,E61 2,163 277 328 75.CEP/c 71.40% 86.40"/c 81.53% 7 0
Theatre Ms
ft211311iC
Year
Erroll rnsrit M3j0S Success Median U0311Slie BursD3greshatted
CatifiatesMended
Fall Sprim Fall zing Fell Spring Fall Wing Fall Spring Annual%amp -11.83% -15.40'/0 -28.74% -617/0 -1.60% 6E2% 0.58'/o -1.50% re re230041 410 412 62 76 67.73°/c 7379% 84.63% 6223%1993130 466 487 87 81 E9.33% sa17% 84.02% 13078%
199899 456 462 83 81 75.63% 76.29% 87.93% 8277% 01997198 473 457 74 70 71.03% 67.95% 8611% 80.45% 2 01936197 463 463 82 66 7287°/0 72.29% 84.14% 93763/c 0
Notes:
1. Non- credit courses (5xx) are excluded from this data.2. Spring 1998 and prior semesters excluded data on Special Studies (80S, 180S,22) Work Experience, and Labs fromEnrollment and Wait List data. As of Fall 1998, they are included in Enrollment and Wait List Statistics.3. Wait List data not available for every semester due to Datatel conversion.
86 CABRILLO COLLEGE FACTBOOK 2001 90

E/Lsic
itaiBIliCYear
RES WWI WiEWFTEF= Load Rstat d WKH Rived d REF Writ ListF19
Fell Spring Fell 43ing Fell Si7ing Fall Spring Fell Sling Fell 41ing Fell Siiirg%crew -4.18% -233% -4.16% -241% 1.93% 284% -6.(2% -510% -Q% -Q17% Q03% QaP/c. re na
2C00131 231.91 233.59 7,1769E 7,42Q1C 1340 1375 5E74 533.64 49160% 5.058% 4836% 4.739% ra 293
199900 242C2 21533 7,490.56 7,60303 1314 1337 570.06 53867 5270'/c 5224% 4661% 4.538% 157 ra1933193 22a C6 234.37 7, C.83 C2 7,24871 1 321 1322 53619 54831 4916% a 1 ZP/c 4 81 0% 4.754% 171 253
1937198 16997 22. 11 5=03 7,874.84 1260 12E6 42564 61236 4298% 5726% 4659% 4.831% 145 223
1993'97 16853 13345 530328 595/50 1233 132) 433.11 451.33 4457% 4773% 4679% 4.751% 107 240
ThEtte Arts
cYew
F1ES WECH FIEF IftEDIFIEF =Load Ricert d IlleCH Rstait d FIEF Wit List
Fall 4rirg Fall Spring Rill SI3irg Fedi qxing MI Spring Fall Spring Fall Spring
%chrry3 1.71% -2807% 1.36% -23.52% -569% -4.55% 7.47% -2&16°/0 -Q02% -0.M% -0.C9% -Q04% ra ra21001 6) 81 57.16 1,86572 1,7673=A 332 357 571.00 4E6.06 1.238% 1205% 1.1 53% 1220% fa 40
199900 59.79 7947 1,87021 2,537.51 aT 374 53131 670.46 1.316°A 1.722Ph 1.249% 1233% 23 M
199em 64e3 67.16 2,01207 2101.63 333 327 60423 64270 1.393% 1.493:x 1.213% 1 . 1 76% 3 39
1997/93 8396 7364 1,93116 2,22671 328 323 579132 681.92 1.519% 1.623% 1.213% 1225°/c 16 29
192M7 6210 5381 1,92639 1,33370 328 325 52106 557.53 1.67% 1.4E6% 1.245% 1.181% 13 13
BEST COPY AVAILABLE
CABRILLO COLLEGE FAC.1 BOOK 2001 87

U.S. Department of EducationOffice of Educational Research and Improvement (OERI)
National Library of Education (NLE)Educational Resources Information Center (ERIC)
NOTICE
Reproduction Basis
Huta llosal Resources Inform tan Centel
This document is covered by a signed "Reproduction Release (Blanket)"form (on file within the ERIC system), encompassing all or classes ofdocuments from its source organization and, therefore, does not require a
"Specific Document" Release form.
This document is Federally-funded, or carries its own permission toreproduce, or is otherwise in the public domain and, therefore, may bereproduced by ERIC without a signed Reproduction Release form (either
"Specific Document" or "Blanket").
EFF-089 (1/2003)
Related Documents