Effect of compositional variation in the milling streams on rheological behavior of soft wheat dough and its impact on the end quality of the biscuits. RAHIL AHMED Thesis is submitted to fulfill requirement for the degree of Doctor of Philosophy In Food Science and Technology Department of Food Science and Technology University of Karachi 2018

Welcome message from author
This document is posted to help you gain knowledge. Please leave a comment to let me know what you think about it! Share it to your friends and learn new things together.
Transcript

Effect of compositional variation in the milling streams
on rheological behavior of soft wheat dough and its
impact on the end quality of the biscuits.
RAHIL AHMED
Thesis is submitted to fulfill
requirement for the degree of
Doctor of Philosophy
In
Food Science and Technology
Department of Food Science and Technology
University of Karachi
2018

II

III
DEDICATION
THESIS IS DEDICATED
TO MY BELOVED
SUPERVISOR
PROF. DR. RASHIDA ALI
&
MY FAMILY

IV
ACKNOWLEDGMENT
First of all, I am very thankful to Almighty Allah who guided me towards the right path of
learning at every stage of my life that helped in performing my duties in the beneficial
way. I take this opportunity to thank the management of English Biscuit Manufacturers
Pvt. Ltd. (EBM) for all the financial support and laboratory facilities to complete the
present work and to apply my knowledge to achieve the targets that is to serve the
company in most beneficial way. My special thanks are due to Dr. Zeelaf Munir and Ms.
Saadia Naveed for their constant encouragement support. I am indebted to my
supervisor Dr. Rashida Ali for her continuous help and motivation. I am also thankful to
my co supervisor Dr. Asad Saeed for his time to time guidance and support. I would also
like to thank the staff at Centre of Excellence, EBM for their technical assistance.
Last but not the least, I wish to deeply express my gratitude to my parents, wife and
other family members for ignoring my duties and negligence towards my commitments
related to home assignments. I am sure that without their constant moral support this
work wouldn’t has been possible.

V
TABLE OF CONTENT
CERTIFICATE …………………………………….…………………………………………………………..………….…..II
DEDICATION …………………………………….………………………………………………………………….………III
ACKNOWLEDGMENT …….…………………………………………………………………………………………… IV
LIST OF TABLES ………………………………………………………………………………….……………….……… XI
LIST OF FIGURE ……….………………………………………………………………………………………………… XIII
SUMMARY ……………………..……………………………………………………….…………………………….. XVIII
SUMMARY (URDU VERSION) ……………………………………………………………….………………….…XX
LIST OF ABBREVIATIONS …………….………………………………………………………………………….…XXII
LIST OF PUBLISHED RESEARCH PAPERS …………………………………………………………………… XXIV
1. Chapter: Introduction
1.1. Wheat (1-5)
1.1.1. Global wheat production
1.1.2. Wheat production in Pakistan
1.1.3. End use of wheat
1.1.4. Supply chain of wheat
1.1.5. Structure of wheat
1.1.6. Classifications of wheat
1.2. Milling (5-13)
1.2.1. Milling process in brief and its impact on quality of flour
1.2.2. Effect of extraction rate on flour quality
1.2.3. Role of tempering, conditioning or pearling in modification of flour for
biscuit
1.2.4. Pearling
1.2.5. Characteristics of flour suitable for biscuit making
1.2.6. Variation in physicochemical characteristic of flour streams
1.2.7. Parameters to identify quality of flour streams
1.2.8. Relationship of milling with end quality of biscuits
1.3. Wheat flour (13-15)

VI
1.3.1. Composition of flour
1.4. Ingredients other than flour and their functions (15-17)
1.4.1. Sugar and syrup
1.4.2. Milk and role of milk proteins in baking
1.4.3. Egg and role of egg proteins
1.4.4. Fat or Shortening
1.5. Role of additives in biscuit processing (17-19)
1.5.1. Specific enzymes used in modification of biscuit dough
1.5.2. Emulsifiers in biscuit processing
1.5.3. Oxidizing and reducing agents
1.5.4. Hydrocolloids:
1.6. Mixing (19-24)
1.6.1. A process of dough development
1.6.2. Reactions in mixing
1.6.3. Identification of optimal dough
1.6.4. Dough as a predictor of end quality
1.7. Baking (24-27)
1.7.1. Reactions in baking
1.7.2. Role of Ovens in Baking
1.7.3. Baking Zones
2. Chapter: Material & Methods (28-36)
2.1. Materials
2.2. Methods
2.2.1. Physicochemical Analysis
2.2.1.1. Moisture Content
2.2.1.2. Analysis on Kernelyzer
2.2.1.3. Determination of particle size
2.2.2. Farinograph Analysis
2.2.3. Micro Visco-Amylo-Graph Analysis

VII
2.2.4. Glutomatic Analysis
2.2.5. Determination of Damaged Starch Content by SDmatic
2.2.6. Scanning Electron Microscopy (SEM)
2.2.7. Solvent retention capacity
2.2.8. AWRC profiles of flours
2.2.9. Statistical Analysis
2.2.10. Evaluation of biscuit quality
3. Chapter: Wheat Milling and its Industrial Application
3.1. Study of milling streams used in production of commercial flours to be utilized in
biscuit making industry (37-91)
3.1.1. Foreword of the study
3.1.2. Material & Method
3.1.3. Result and discussion
3.1.3.1. Physicochemical Analysis of Milling Streams
3.1.3.2. Study of the Dough Rheology– Farinograph Analysis
3.1.3.3. Pasting Behavior of Dough – MVAG
3.1.3.4. Solvent Retention Capacity of Flour Streams – SRC
3.1.4. Conclusion
3.2. Comparative analysis of physiochemical and dough rheological properties of
break and reduction streams and its impact on the quality of cookie. (92-99)
3.2.1. Foreword of the study
3.2.2. Material and Method
3.2.3. Result and Discussion
3.2.3.1. Comparative analysis of physicochemical parameters in break and
reduction streams
3.2.3.2. SRC analysis
3.2.3.3. Farinograph parameters:
3.2.3.4. Micro Visco-Amylo-Graph
3.2.3.5. Glutomatic Parameters

VIII
3.2.3.6. End quality evaluation
3.2.4. Conclusion
4. Chapter: Solution of Industrial Problem
4.1. To study wheat available in Pakistan suitable for soft product. Identification of
optimum level of damaged starch along with other physicochemical properties
for the soft dough. (100-114)
4.1.1. Foreword of the study
4.1.2. Material and Method
4.1.3. Result and Discussion
4.1.3.1. Physical Analysis of wheat
4.1.3.2. Instrumental Analysis of wheat
4.1.3.3. Physicochemical analysis of flour
4.1.3.4. Farinograph
4.1.3.5. Observation of line behavior of flour on production lines
4.1.4. Conclusion
4.2. Dough stickiness & mitigation in product (115-121)
4.2.1. Foreword of the study
4.2.2. Problems Due to Stickiness
4.2.3. Possible factor affecting stickiness of the dough
4.2.4. Approach and mechanism to minimize stickiness from sheeted product.
4.2.5. Flour analysis parameters for sheeted products
4.2.6. Conclusion
5. Chapter: Flour, quality assessment and its treatment
5.1. Wheat flour characteristics of different countries (122-128)
5.1.1. Foreword of the study
5.1.2. Material and Method
5.1.3. Result and Discussion
5.1.3.1. Physicochemical Characteristics
5.1.3.2. Farinograph parameters
IX
5.1.3.3. Damaged Starch and Particle size distribution
5.1.3.4. Glutomatic Proteins of flour from different wheat sources
5.1.3.5. Damaged Starch affecting Water absorption of Flour
5.1.3.6. Particle size affecting Damaged Starch Content
5.1.4. Conclusion
5.2. Prediction of damaged starch by assessing some physicochemical quality of
wheat flour (129-144)
5.2.1. Foreword of the Study
5.2.2. Material and Method
5.2.3. Result and Discussion
5.2.3.1. Damaged starch versus physicochemical properties of flour
5.2.3.2. Relationship of DS with SRC and AWRC values
5.2.3.3. Farinographic parameters versus damaged starch
5.2.3.4. Damaged starch versus pasting curve of micro Visco-Amylo-Graph
5.2.3.5. Relationship of Proteins from Glutomatic and DS
5.2.4. Conclusions
5.3. Effect of commercial enzymes (proteases & carbohydrases) on dough rheology
and end quality of Cookie (145-152)
5.3.1. Foreword of the study
5.3.2. Material and Method
5.3.3. Result and Discussion
5.3.3.1. Physicochemical Characteristics
5.3.3.2. Enzyme affecting Farinograph Properties of flour
5.3.3.3. Enzymes affecting Micro Visco-Amylo-Graph Properties
5.3.3.4. Enzymes affecting Glutomatic Properties
5.3.3.5. Dimensional Properties of the end product
5.3.4. Conclusion

X
6. Chapter: Nutraceutical product
6.1. Legume protein enrich biscuits and its impact on rheological properties of
dough/the end quality (153-159)
6.1.1. Foreword of the Study
6.1.2. Material and Method
6.1.3. Result and Discussion
6.1.3.1. Physicochemical properties and SRC analysis
6.1.3.2. Rheological properties
6.1.3.3. Farinograph analysis
6.1.3.4. Micro Visco-Amylo-graph
6.1.3.5. Glutomatic protein profile
6.1.3.6. Dimensional and sensory analysis of biscuits
6.1.4. Conclusion
6.2. Black gram flour in cookie dough as a substitute of egg (160-167)
6.2.1. Foreword of the study
6.2.2. Material and Method
6.2.3. Result and Discussion
6.2.3.1. Physico-chemical quality
6.2.3.2. Farinograph Attributes
6.2.3.3. MVAG Analysis
6.2.3.4. Microstructure of Biscuit Dough
6.2.3.5. Dimensional/textural quality
6.2.3.6. Sensory Analysis
6.2.4. Conclusion
7. Reference (168-176)

XI
List of Tables
Table 1: Area, production and yield of wheat
Table 2: Combination of zone used for commercially baked biscuits in Hybrid ovens
Table 3: Streams names, types and description
Table 4: Milling streams type and details
Table 5: Recipe of cookie to evaluate the effect of different milling streams
Table 6: End Quality Analysis
Table 7: Month wise wheat source utilized by flour suppliers.
Table 8: Instrumental analysis of wheat (Source wise).
Table 9: Physical analysis of wheat (Source wise).
Table 10: Moisture, ash and gluten analysis
Table 11: Particle size and damaged starch analysis
Table 12: Farinographic analysis of flour samples
Table 13: Line observation of flour. (Numbers mentioned in bracket after source name
indicating rating of line behavior for the month)
Table 14: Flour parameters suitable for sheeted product
Table 15: Temperature ranges suitable for sheeted product
Table 16: Farinograph parameter suitable for sheeted product
Table 17. Physiochemical properties of different wheat sources
Table 18: Farinograph parameters of flour from different wheat sources
Table 19: Glutomatic properties of flour from different wheat sources
Table 20. Damaged starch and particle Size analysis of flour
Table 21: Physicochemical analysis of different flour samples
Table 22: SRC and AWRC of wheat flour samples
Table 23: Farinograph parameters in various flour
Table 24. Micro Visco-Amylo-Graph parameters of various flour
Table 25: Glutomatic proteins and DS of various flour
Table 26: DS vs NG-WA

XII
Table 27: Recipe of biscuit for enzyme study
Table 28: Physicochemical parameters
Table 29: Enzyme affecting farinograph Properties
Table 30: Enzyme affecting Micro Visco-Amylo-Graph properties
Table 31: enzyme affecting glutomatic properties
Table 32: Recipe of biscuits with legume
Table 33: Physicochemical and SRC analysis of substituted flour
Table 34: Farinograph and Micro Visco-Amylo-Graph, glutomatic profile of substituted
flour
Table 35: Dimensional properties of biscuits
Table 36: Correlation of different parameters with % substitution of MBF
Table 37: Recipe of BGF biscuit
Table 38. Physico-chemical analysis of BGF
Table 39. Farinograph properties of BGF added dough
Table 40. BG flour affecting Micro Visco-Amylo-Graph properties
Table 41. End product quality
Table 42. Eating quality of BGF added biscuit.

XIII
List of Figures
Figure 1: Composition of wheat
Figure 2: A brief diagram of milling
Figure 3: Flow chart of milling streams for flour collection
Figure 4: Variation in moisture (%) in flour from break rolls streams.
Figure 5: Variation in moisture (%) in flour from semolina streams.
Figure 6: Variation in moisture (%) in flour from semolina overtail streams
Figure 7: Variation in moisture (%) in flour from middling streams
Figure 8: Variation in protein (%) in flour from break rolls streams
Figure 9: Variation in protein (%) in flour from semolina streams
Figure 10: Variation in Protein (%) in flour from semolina overtail streams
Figure 11: Distribution of protein (%) in flour from middling streams.
Figure 12: Variation in ash (%) in flour from break rolls streams
Figure 13: Variation in Ash (%) in flour from semolina streams
Figure 14: Ash (%) in Flour Streams from semolina overtail streams
Figure 15: Variation in ash (%) in flour from middling streams
Figure 16: Variation in gluten Index (%) in flour from break rolls streams
Figure 17: Variation in Gluten Index (%) in flour from semolina streams
Figure 18: Variation in Gluten Index (%) in flour from semolina overtail streams.
Figure 19: Variation in Gluten Index (%) in flour from middling streams
Figure 20: Variation in Dry Gluten (%) in flour from break rolls streams
Figure 21: Variation in Dry Gluten (%) in flour from semolina streams
Figure 22: Variation in dry Gluten (%) in flour from semolina overtail streams.
Figure 23: Variation in dry Gluten (%) in flour from middling streams.
Figure 24: Variation Wet Gluten (%) in flour streams from 18.8 to 28.78%.
Figure 25: Showing minor variation in wet gluten (%) in flour streams from 20.70 to 26.1
Figure 26: Variation in Wet Gluten (%) in flour streams from 25.75 to 29.23

XIV
Figure 27: Wet Gluten (%) in flour streams from middling
Figure 28: Showing increase in % retention at 160 µm sieve of flour streams from break
rolls
Figure 29: % Retention at 125 µm sieve of flour streams from break rolls
Figure 30: % through from 125 µm sieve of flour streams from break rolls
Figure 31: % Retention at 160 µm sieve of flour Streams from semolina showing retention
0.1 to 9.1%
Figure 32: % of flour streams retained at 125 µm sieve from 5.0 to 72.8% in semolina
passages
Figure 33: % of flour streams from semolina from 125 µm sieve.
Figure 34: % of Flour Streams from 0.1 to 4 retained at 160 µm sieve in semolina overtail
passages
Figure 35: % Retention at 125 µm sieve of flour streams from semolina overtail
Figure 36 : % through from 125 µm sieve of flour streams from semolina overtail
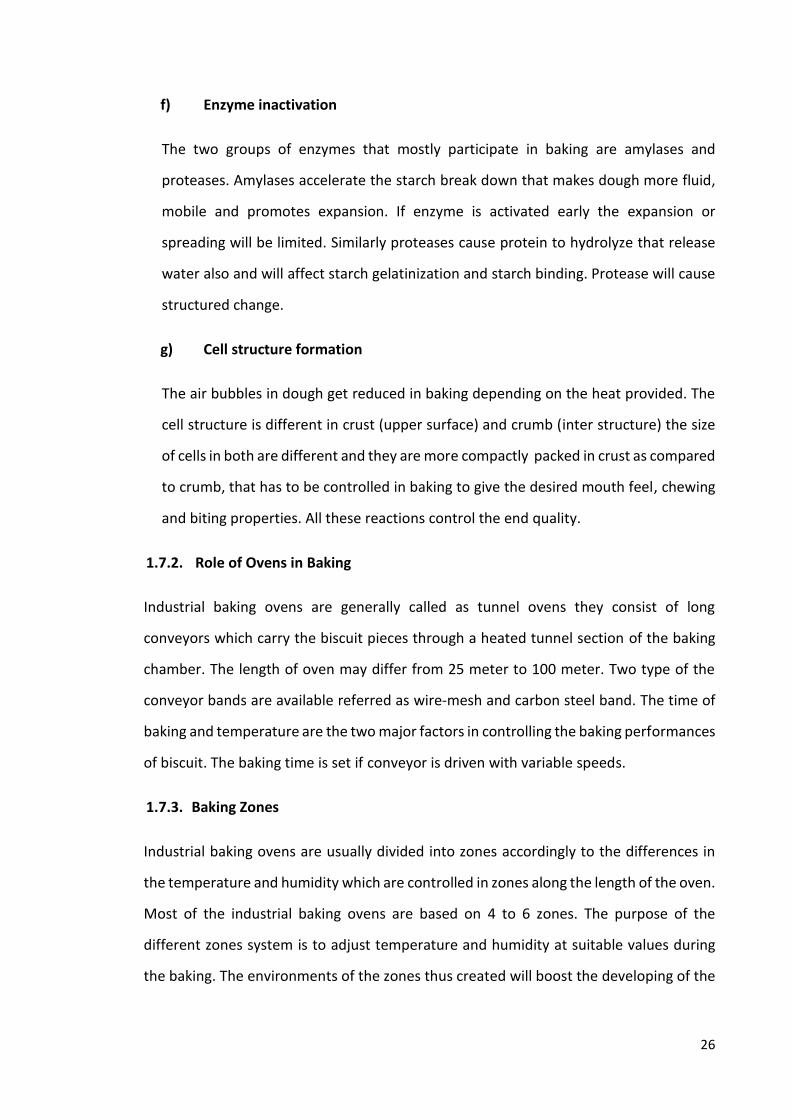
Figure 37: % Retention at 160 µm sieve of flour streams from middling
Figure 38: % Retention at 125 µm sieve of flour streams from middling
Figure 39: % through from 125 µm sieve of flour streams from middling
Figure 40: FQN in flour from break rolls streams
Figure 41: FQN in flour from semolina streams
Figure 42: FQN in flour rom semolina overtail streams
Figure 43: FQN in flour from middling streams
Figure 44: Water absorption % in flour from break rolls streams
Figure 45: Water absorption % in flour from semolina streams
Figure 46: Water absorption % in flour from semolina overtail streams
Figure 47: Water absorption % in flour from middling streams
Figure 48: DDT (min) in flour from break rolls streams
Figure 49: DDT (min) in flour from semolina streams
Figure 50: DDT (min) in flour from semolina overtail streams
Figure 51: DDT (min) in flour from middling streams

XV
Figure 52: DST (min) in flour from break streams
Figure 53: DST (min) in flour from semolina streams
Figure 54: DST (min) in flour from semolina overtail streams
Figure 55: DST (min) in flour from middling streams
Figure 56: DoS (FU) in flour from break streams
Figure 57: DoS (FU) in flour from semolina streams
Figure 58: DoS (FU) in Flour from semolina overtail streams
Figure 59: DoS (FU) in flour from middling streams
Figure 60: Max. Viscosity (BU) in flour from break streams
Figure 61: Max. Viscosity (BU) in flour from semolina streams
Figure 62: Max. Viscosity (BU) in flour from semolina overtail streams
Figure 63: Max. Viscosity (BU) in flour from middling streams
Figure 64: BD Viscosity (BU) in flour from break streams
Figure 65: BD Viscosity (BU) in flour from semolina streams
Figure 66: BD Viscosity (BU) in flour from semolina overtail streams
Figure 67: BD Viscosity (BU) in flour from middling streams
Figure 68: SB Viscosity (BU) in flour from break streams
Figure 69: SB Viscosity (BU) in flour from semolina streams
Figure 70: SB Viscosity (BU) in flour from semolina overtail streams
Figure 71: SB Viscosity (BU) in flour from middling streams
Figure 72: SC-SRC flour from break streams
Figure 73: SC-SRC in flour from semolina streams
Figure 74: SC-SRC in flour from semolina overtail streams
Figure 75: SC-SRC in flour from middling streams
Figure 76: W-SRC flour from break streams
Figure 77: W-SRC in flour from semolina streams
Figure 78: W-SRC in flour from semolina overtail streams
Figure 79: W-SRC in 6 flour from middling streams

XVI
Figure 80: Su-SRC flour from break streams
Figure 81: Su-SRC in flour from semolina streams
Figure 82: Su-SRC in flour from semolina overtail streams
Figure 83: Su-SRC in flour from middling streams
Figure 84: LA-SRC (%) in flour from break streams
Figure 85: LA-SRC in flour from semolina streams
Figure 86: LA-SRC in flour from semolina overtail streams
Figure 87: LA-SRC in flour from middling streams
Figure 88: Moisture, protein, particle size, bottom and damaged starch content of break
and reduction passages.
Figure 89: Variation in SRCs in two types of milling streams
Figure 90: Farinograph analysis of milling streams
Figure 91: Milling streams on Visco-amylo-graph parameters
Figure 92: Milling streams on glutomatic parameters
Figure 93: Instrumental and physical analysis of wheat (Source wise)
Figure 94: Moisture, ash and gluten analysis
Figure 95: Particle size analysis
Figure 96: Farinographic analysis of flour samples
Figure 97: Damaged starch
Figure 98: Trend of damaged Starch supplier wise (Numeric values on X axis shows the
month i.e. 1 Jul)
Figure 99: Flow chart of work plan to rectify the issue
Figure 100 . Root cause Analysis/4M’s techniques to identify the root cause
Figure 101: Crumb generation
Figure 102: Effect of particle size on damaged starch content
Figure 103: Effect of particle size on damaged starch content of flour
Figure 104: Damaged starch vs total protein contents
Figure 105: DS vs AWRC
Figure 106: DS vs SC-SRC

XVII
Figure 107: DS vs W-SRC
Fig. 108: DS vs LA-SRC
Figure 109: DS vs Su-SRC
Figure 110: DS vs WA.
Figure 111: DS Vs dough quality parameters DDT.
Figure 112: DS Vs Beginning of Gelatinization temperature
Figure 113: DS Vs Trough Viscosity
Figure 114: DS Vs Final Viscosity
Figure 115: DS Vs Peak Viscosity
Figure 116: Damaged vs passed gluten
Figure 117: Damaged starch vs retained gluten
Figure 118: Damaged starch vs gluten index
Figure 119: DS vs NG-WA
Figure 120: Proteases and amylases on cookies factor
Figure 121: Sensory score of biscuit made with control and substituted flour
Figure 122: (a) control (b) 2 gm BGF added dough (c) 4 gm BGF added dough and (d) 6 gm
BGF added dough respectively.

XVIII
Summary (English)
The present study was taken up with certain defined aims and objectives to promote
research that is directly applicable to the industry and involves deep learning at higher
education level. The objectives included as study of milling streams for selection of
desired flour for biscuit making, solution of problems related to dough rheology, role of
damaged starch in assessment of flour quality, use of commercial enzymes in dough
modification and improvements in the end quality of biscuits, nutraceutical biscuits
(including egg and fat replacements). The research applied at various stages of processing
is briefly described here,
Milling for selection of desired flour: Optimal or desired composite flour was obtained
after a close coordination between the miller and baking industry (EBM). Certain
physicochemical tests were identified to blend the streams for getting the desired
composite flour.
Solution of problems: Number of problems faced in processing were solved through
research such as conversion of hard flour to soft by using enzymes (proteases and
carbohydrases) as a dough modifier. The research revealed that enzymes may be
inhibited by certain recipe ingredients and selection of enzymes is a highly technical.
Dough Stickiness: The problem of stickiness of dough was solved by using previously
prepared dough, chilled water to adjust solid fat index (SFI) and addition of little fat at
the later stage of mixing.
Role of damaged starch (DS): The studies related to the effect of DS in biscuit processing
are missing. We studied the estimation of DS in flour through physicochemical tests (SRC,
AWRC) and related it to Farinograph and Micro Visco-Amylo-Graph parameters.
Nutraceutical biscuits: Biscuits with enhanced nutritional status were prepared, as
legumes are enriched in protein. Problems in dough rheology due to addition of legume
proteins were adjusted by considering physicochemical changes as observed by
Farinograph, Micro Visco-Amylo-Graph and Glutomatic.

XIX
Egg replacement: Black gram flour was also successfully used to replace egg in biscuit.
Egg enrichment often is not desired by customers because of the presence of saturated
fat and cholesterol in eggs.
Fat replacement: Black gram was found as a good substitute for fat in biscuit recipe.
End quality improvement: The study also involved improvement in end quality of biscuit,
for example it was observed that DS in low percentage is desired in most of the recipe.
High DS increases water absorption in dough that causes size reduction and heavy weigh.
Cost reduction: The industries usually do not support the use of the highly sophisticated
costly instruments such as Farinograph, Micro Visco-Amylo-Graph etc. the present study
suggested the use of simple tests i.e. SRC, AWRC as the alternatives.
Application of finding of milling study enabled industry to save the losses because of
wastages, low productivity due to heavy weight problem in cookies.

XX
Summary (Urdu)

XXI

XXII
List of Abbreviation
PSQCA Pakistan Standard Quality Control Authority
EBM English Biscuit Manufacturers Pvt. Ltd.
COE Centre of Excellence
SEM Scanning Electron Microscopy
MVAG Micro Visco-Amylo-Graph
Gm Gram
Kg Kilogram
Hr Hour
Min Minute
DS Damaged Starch
DDT Dough Development Time
DST Dough Stability Time
WA Water Absorption
DoS Degree of Softening
HMW High Molecular Weigh
LMW Low Molecular Weight
GI Gluten Index
PG Passed Gluten
RG Retained Gluten
DG Dry Gluten
PV Peak Viscosity
MV Maximum Viscosity
BD Breakdown
SB Setback
TV Trough Viscosity
FU Farinograph Unit
BU Brabender Unit
UCD Unite Chopin Dubois
SRC Solvent Retention Capacity

XXIII
AWRC Alkaline Water Retention Capacity
SC-SRC Sodium Carbonate Solvent Retention Capacity
Su-SRC Sucrose Solvent Retention Capacity
W-SRC Water Solvent Retention Capacity
LA-SRC Lactic Acid Solvent Retention Capacity
MBF Mash Bean Flour
BGF Black Gram Flour
PPO Polyphenol Oxidase
ER Extraction Rate
FN Falling Number

XXIV
List of Published Research Paper
Rahil Ahmed, Rashida Ali, Syed Asad Saeed, Syed Muhammed Ghufran Saeed and Lubna
Mobin. (2017). Impact of distinct compositional variations in flours of various milled
streams on dough behavior and end quality of baked products. Pak. J. Bot., 49(SI): 383-
387.
Rahil Ahmed, Rashida Ali, Muhammad Shakeel Khan, Madiha Moin, Saira Imtiaz Kazmi
and Syed Asad Saeed. (2015). Comparative Study on the Physicochemical and
Rheological Parameters of Soft Wheat Flour Obtained from Three Countries. American
Journal of Food Science and Nutrition Research. 2(3): 89-93.
Rahil Ahmed, Rashida Ali, Muhammad Shakeel Khan, Syed Asad Sayeed, Jahangir Saeed
and Fariha Yousufi. (2015). Effect of Proteases & Carbohydrases on dough Rheology and
End Quality of Cookie. American Journal of Food Science and Nutrition Research, 2(2):
62-66.
Muhammad Shakeel Khan, Rahil Ahmed, Rashida Ali and Syed Asad Sayeed. (2015).
Relationship of Sodium Carbonate SRC with Some Physicochemical, Rheological and
Gelatinization Properties of Flour and its Impact on End Quality of Biscuit, International
Journal of Scientific and Research Publications, 5(8), 1-8.
Rashida Ali, Muhammad Shakeel Khan, Syed Asad Saeed, Rahil Ahmed, Syed Muhammed
Ghufran Saeed and Lubna Mobin. (2014). Relationship of damaged starch with some
physicochemical parameters in assessment of wheat flour quality. Pak. J. Bot., 46(6):
2217-2225.
Rashida Ali, Syed Muhammad Ghufran Saeed, Syed Arsalan Ali, Syed Asad Sayed, Rahil
Ahmed and Lubna Mobin. (2018). Effect of black gram flour as egg replacer on
microstructure of biscuit dough and its impact on edible qualities. Journal of Food
Measurement and Characterization. https://doi.org/10.1007/s11694-018-9779-3.

XXV
Lubna Mobin, Syed Asad Saeed, Rashida Ali, Syed Muhammed Ghufran Saeed and Rahil
Ahmed. (2017). Antibacterial, antioxidant and phenolics compound analysis of Abrus
Precatorius seed coat extract and its different reactions. Pak. J. Bot., 49(6): 2499-2506.
Lubna Mobin, Syed Asad Saeed, Rashida Ali, Syed Muhammed Ghufran Saeed and Rahil
Ahmed (2017). Antibacterial and antifungal activities of the polyphenolic fractions
isolated from the seed coat of Abrus precatorius and Caesalpinia crista. Natural Product
Research. DOI:10.1080/14786419.2017.1378217.

1
1. CHAPTER: INTRODUCTION
1.1. Wheat
Wheat (Triticum aestivum L.) is a staple food in Pakistan like in most part of the world
and it is a widely grown crop in most of the countries. Wheat produced in Pakistan is
consumed mostly in making chapattis, rotis and naan (Anjum and walker, 1991). Wheat
is primary diet and is the cheapest source of proteins. Pakistan has been producing wheat
enough to fulfill the local demand. Recently Pakistan is also exporting surplus produced
wheat from last two to three years.
1.1.1. Global wheat production
Global wheat production has decreased by 15 million tons this year (2016-17) from last
year production which is still second highest world production (738 million tons). A
decrease of 29 million tons is expected in major exporting countries. Argentina and EU
will achieve higher production whereas Australia, Canada, Kazakhstan, Russia, Ukraine
and United State will produce less wheat. In EU, production is expected to increase by
4% from the last year whereas Argentina will produce more wheat due to expansion in
the growing area.
Forecast production of wheat in Russia shows decline from last year however, it is the
second highest yield. About 7% decline is expected in Ukraine. US will produce wheat in
less quantity than the last year. China and India will produce high quantity of wheat.
Consumption of wheat as animal feed is expected to reduce worldwide whereas wheat
as human food will be on rise in the many parts of the word. High consumption of wheat
in south and South East Asia is expected due to population growth, urbanization and
because of rising income through agriculture.
(Source: Foreign Agricultural Service / USDA)

2
1.1.2. Wheat production in Pakistan
Wheat being main the agricultural crop in Pakistan, is grown around 9 million hectares
area which is nearly country’s 40% of the total land (cultivated) during the Rabi season.
Wheat contributes for 9.9% in the value added in agricultural products that represented
2.0% of GDP of Pakistan during 2015-16. (USDA Agricultural service)
Ministry of Finance, Pakistan has shown an increase of 0.6%, 9260 thousand hectares
(2015-16) from last year’s area of production 9204 (2014-15). Above 25482 million tons
wheat was produced, with 1.6% increase in comparison to the production last year
(25086 million tons). The increase in production per unit area as shown in table 1 was
due to enough time and moisture available specifically in Barany track which maintained
the germinated progress.
Table 1: Area, Production and Yield of Wheat
Year
Area Production Yield
(000
Hectares)
%
Change (000 Ton)
%
Change
(Kg/
Hec.)
%
Change
2011-12 8650 - 23473 - 2714 -
2012-13 8660 0.1 24211 3.1 2796 3
2013-14 9199 6.2 25979 7.3 2824 1
2014-15 9204 0.1 25086 -3.4 2726 -3.5
2015-16P 9260 0.6 25482 1.6 2752 0.9
P: Provisional (July-March)
Source: Pakistan Bureau of Statistics
1.1.3. End use of wheat.
Wheat is milled to produce flour. Flour is used for making chapatti (flat bread), naan,
bread, biscuit, cake, pasta, pizza etc. for commercial purpose. In Pakistan two methods
of milling are mostly practiced (1) Roller milling (Large scale) (2) Stone grinding (Chaki) at

3
small scale. Chakki milling is very popular at domestic level in which wheat is completely
ground into flour by using stone grinding technique.
Roller milling is used to make flour by separating bran from endosperm and germ.
Different quality of flours are achieved during milling. Pure white portion of endosperm
is separated as Maida and is sold for commercial purpose (Bakery industries). Bran is used
for animal feed whereas mixture (Aatta) of endosperm with high amount of bran is used
at domestic level for making Chapati.
1.1.4. Supply chain of wheat
Wheat in Pakistan is a Government controlled commodity. Availability of specific quality
of wheat for consistency is always challenging for baking /milling industries in Pakistan.
There is no system available at government level to guide farmers at growing stage.
Wheat is ground at the milling unit in extremely uncontrolled manner, despite of the fact
that actual requirements for the end use quality are already reviewed.
Grading of wheat at the purchasing stage is also unavailable, Govt. decides prices of
wheat without considering quality / grades. Millers always face difficulties in producing
good quality flour as the sub-standards wheat quality is also grown without control.
1.1.5. Structure of wheat
Although wheat is a grain but is included in the grass family in botanical way of
classification. It belongs to the class of caryopsis where fruit wall (pericarp) and seed coat
are enacted, resulting in the separation of fruit from seed.
Wheat differs in shapes, may be oval or spherical, long or of flattened shape. The length
of wheat kernel varies from 5-9 mm and a single grain weighs 35 to 50 mg. The grain
contains 2-3% germ, 13-17% bran and 80-85% endosperm (on dry basis). (Belderoket et
al, 2000; Posner, 2000).
Several layers together compose the bran, the outer most layer that protects the main
part of the grain and is rich in B vitamins, minerals, phytochemicals and fibers.

4
Source: http://www.nabim.org.uk/nabim
Figure 1: Composition of wheat
1.1.6. Classifications of wheat:
In United States wheat is classified as described below,
Durum Wheat
The light-colored kernel which is hard and translucent, is recommended to be used to
make semolina flour for variety of bakery products i.e. pasta, spaghetti etc. Kernels are
rich in gluten proteins.
Red Spring wheat (hard)
The variety (kernel) is hard, slightly brownish, and rich in protein content. Specific wheat
is recommended for bread and other products with strong gluten network (Pasta).
Red Winter Wheat (hard)
It is also hard in structure and contains dark yellow protein. It is recommend to be used
in bread and pasta. It is also used in combination with other low gluten wheat to increase
the gluten level in composite flour.
5
Soft Red (winter)
It is soft and low in gluten content. Recommend to be used in Cake, cookies and biscuits
etc.
Hard White Wheat
Its crop is planted in very dried and high temperature field. It is hard in nature and light
in colored.
Soft White Wheat
It is soft in nature and also light in colored. It is low in protein and grown in temperate
moist areas.
The classification of wheat in Pakistan is not well defined, only hard, soft or seasonal
varieties of wheat are mentioned in the standards/specifications/literature.
1.2. Milling
1.2.1. Milling process in brief and its impact on quality of flour
Milling is a process of gradual grinding and fractionation to convert grain into flour. The
prime objective of the milling is to separate endosperm from bran and germ first,
followed by further grinding the endosperm into a large number of fractions called
streams (Campbell, 2007). Each stream differs in its composition, particle size and
distribution of flour particle according to its size. The performance of milling is greatly
influenced by the grain hardness or the grain class. The streams are combined to produce
the composite flour indicating that various category of flours may be obtained with
specific characteristics by combining or blending the different streams. This shows that
quality of the resulting flour depends on selection of the specific streams which differs
widely in their composition and thus in their functionality to produce a particular bakery
product (Souza et al, 2011). The streams selected for bread flour will be different than
the streams blended for biscuit. Milling is therefore a highly technical process to provide

6
the options to bakers for getting desired flour to process their target product (Ahmed et
al, 2017). Major steps in milling are given in fig. 2.
Figure 2: A brief diagram of milling
1.2.2. Effect of extraction rate on flour quality
The quality of flour depends on the extraction rate (ER) defined as ratio of flour with rest
part of the wheat (Aprodu et al, 2010). The pure white flour is obtained with lower
extraction rate i.e. ER less than 75% as the endosperm extraction rates increases to reach
the theoretically maximum ER of 81-84%, the flour gets contaminated with bran and the
color is changed to yellowish brown. The flour consisting all the bran is called whole meal
flour with 100% nutritive value and high amount of fibers (Sudha et al, 2007). The
nutritional quality of wheat flour decreaseS with decrease in ER because of inclusion of
bran which is rich in dietary fibers and many bioactive components such as vitamin B
group, minerals, tryptophan, carotenoids and lignin etc. (Symons et al, 1996). Milling
process is thus a determining factor in providing a healthy flour to the consumers.
CLEANING
WASHING
BREAK
FLOUR
REDUCTION
SOAKING
WATER
EXTRINIOUS MATTERS COME OUT
DUST IS WASHED WITH WATER
WHEAT KERNAL ABSORB WATER,
CUASING KERNAL TO SOFTEN AND
OPEN THE WHEAT KERNAL AND
SEPARATE BRAN WITH ENDOSPERM
ENDOSPERM IS PASSED THROUG
MULTIPLE SET OF ROLLS, PURIFIERS
AND SIFTERS

7
The compositional changes in flour take place as the extraction rate increases and tail
streams are obtained. Ash, protein, damaged starch increase with flour towards high ER
(Ahmed et al, 2017). It is also reported that fiber, protein, wet gluten increase however
falling number, sedimentation values and moisture decrease in soft wheat (Moiraghi et
al, 2011). The water absorption as determined by Farinograph also increases with the
increase of damaged starch content. High protein also leads to increase in water
absorption of flour. Milling process demands skilled and qualified manpower to achieve
the quality of flour and to supply the desired flour to bakers according to the product
they are handling.
1.2.3. Role of tempering, conditioning or pearling in modification of flour for biscuit
Conditioning is the process of spraying water on kernels (moistening) before milling and
if the temperature and additives are also taken into consideration, the process may be
referred as tempering. The objective of tempering/conditioning is to toughen the
pericarp (bran) and to mellow (soften) endosperm in order to separate the two easily
during milling. There are at least four different parameters which affect the milling
process and the end quality of flour. The initial moisture or intrinsic moisture of the
kernel, tempering moisture, time for moisturizing and temperature of tempering.
(Rehman et al, 2006)
The rate of water penetration into the kernel or the diffusion rate is directly related to a
number of factors particularity compositions of endosperm, the amount of hydrophilic
polymers such as protein, starch, damage starch, non-starch polysaccharides etc. The
protein content and its quality, temperature, and nature of additives used also influence
water absorption. Usually around 16.0% moisture in wheat kernel provides better result
during milling. The quality of flour during milling is most commonly evaluated by ash
content which is an indicator of bran inclusion gradually in flour. However during recent
decades polyphenol oxidase (PPO) is taken as a reliable measure of bran contamination.
PPO is solely present in bran and therefore extent of PPO activity measures bran quality.

8
The quality of flour is greatly affected by using additives in the process of conditioning
such as the oxidizing/reducing agents, enzymes and salts. The use of some enzymes as
xylanase, and amylases during tempering has improved the functional rheological
properties of biscuit dough because enzymes hydrolyzed the major biopolymers
(Pentosans) of bran i.e. arabinoxylans that increases water absorption in mixing and
reduces the dimensional properties of biscuit.
Tempering/conditioning improves and alters the quality of wheat grain milling process
that is the process of scissoring precisions to get desired ratio of bran-germ-endosperm
at the end (Glenn and Johnstan, 1992). The research has shown that
tempering/conditioning is an ideal tool in the hands of miller to modify the quality of
flour accordingly.
1.2.4. Pearling
Tempering/conditioning process as mentioned earlier change the quality of flour,
enzyme treatment are specifically active in controlling the dough behavior or as well as
the yield of flour. The cocktail of the cell wall degrading enzymes consisting cellulase,
xylanase and peclinase are added in tempering water to increase the flour recovery in
break streams as compared to reduction streams in a roller mill (Yoo et al, 2009).
Regarding the end quality of biscuits, the diameter is strongly negatively related to biscuit
thickness (r2= -0.986, p<0.001), particle size, damage starch protein and SRC-parameters.
All the above characteristics are highly dependent on the milling process.
1.2.5. Characteristics of flour suitable for biscuit making
The flour ideal for biscuit production has been identified by variety of indicative tests, the
following properties may be considered in evaluation of optimal flour.
- Soft flour is the most suitable, soft wheat kernel should be selected for getting best
performance of the flour. Soft flour is actually low in protein, ash, damaged starch
etc.
- Low protein content (7-10%) provides better rheological behavior of the biscuit
dough. Bradford dye binding method for quantification of protein is still used being

9
simple (Iqbal et al, 2015). However sedimentation value is a good indicator to
evaluate protein quality and specially glutenin content. Low sedimentation value are
more suitable to select flour quality (Ramrez-Suarez, 2005).
- Low ash content provide better result in dough development during mixing. Although
ash indicates the mineral contents of the flour, however minerals are mostly located
in bran so ash indirectly is related to bran quantity or the ER.
- Damaged starch. Flour low in damaged starch is selected by the bakers in biscuit
factory. Damaged starch is high in hard flour because hard wheat kernel need more
pressure to break the grain that damages starch granules. Damage starch in the range
of below 26 UCD is suitable for biscuit making, however the values changes from
recipe to recipe.
- Moisture content plays an important role in determining the quality of flour. Low
intrinsic moisture and low tempering moisture is suitable for biscuit making because
excess water is able to hydrate sugar particles easily giving sticky dough, and reduced
size of biscuits.
- Pentosans are biopolymers with monomers of 5 carbon atoms which vary largely in
nature. In wheat flour arbinoxylan is located in bran largely. Pentosans are generally
located in the cell wall and indicate bran percentage in flour. Less quality of pentosan
is needed for biscuit processing.
- Water absorption plays key role in the hydration process of all the ingredients in
biscuit recipe. Low water absorption is needed for biscuit rheology because it restricts
protein network formation that is pre-requisite in biscuit dough formation.
It is well illustrated that significant close relationship exists between flour quality and
many biochemical factors and numerous biochemical components contributes to quality
variance in flour and one should not rely on a single test for flour quality selection.
1.2.6. Variation in physicochemical characteristic of flour streams
Soft wheat kernels with low protein and high intrinsic moisture harvested in winter are
preferred for biscuit manufacturing because of their suitability for easy milling and
producing less damaged starch. The distinct compositional variation in flour has been

10
noticed both at the break and reduction stages. The lower value of hardness, stickiness
and cohesiveness of the dough reduce cutting strength. Sprouted kernels decrease the
hardness of the dough but increase end quality or acceptability of biscuits (Agrah-ar-
Murekgkar, 2015; Moreira, 2015). The pilot milling analysis of soft winter wheat shows
that ash, protein and water extractable solids including water extractable arabinoxylans
increase exponentially in the reduction streams. (Souza et al, 2011). Flour milling also
alters microstructure of the intact endosperm tissues which are densely packed and give
the compact structure that gets disintegrated during milling forming aggregates of starch
granules taking their position in protein matrix. Deformation of starch granule (type S)
increases with harshness in reduction milling (distance between roller is reduced) and
damage starch (DS) increases (Gangadarappa et al, 2008). DS usually present in the range
from 5.14% to 14.79% in different streams, is strongly negatively correlated with biscuit
spread ratio (Bareera et al, 2007). In the straight grade flour with 72% flour recovery (ER),
the tail end streams have high percentage of damage starch and pentosans forming
weaker dough.
Recently Liu and coworker (2015) have shown that milling governs the sensory qualities
of bakery products. Moreover the characteristics of the viscoelastic dough from only flour
and water may complement the physicochemical parameters in predicting the
consistency of the dough for the laminated biscuit recipe (Fustier et al, 2009). The
Rheological properties of flour change in both types of flour i.e. the break flour streams
and the reduction flour streams, however changes are more pronounced in the break
streams. The total protein contents, falling number, sedimentation value and oil content
of the flour increase with an increase of break streams, while the color intensity of the
flour decreases. Interestingly these changes were not so visible in the reduction flour
streams (Prabhasankera et al, 2000). The fatty acid composition of oil changes
accordingly to streams, palmatic acid and linoleic acid contents were major in saturated
and unsaturated acids respectively. Protein content used as the predicator of baking
performance and end quality is related to variety of rheological properties of dough, and
changes significantly in various streams (Koppel and Ingver, 2010). The milling and baking
performances of the flour are very closely correlated to each other and milling process

11
including pre-milling (as conditioning or tempering) may be modified to produce the flour
of desired baking performance. Predominant correlation was observed between water
absorption and yield of semolina as bran gets easily removed on wetting (Huskova et al,
2006). Mill streams produce flour of high diversity and complexity. The components as
ash, wet gluten, phytic acid, damaged starch and amylograph peak viscosity change
affecting the fermentative activity of baker’s yeast (saccharomyces cerevisiae),
consequently every mill streams will behave differently during baking (Katarina eta al,
2008). The resting and proofing times will be dependent on the type of streams blended
with variable fermentative ability. The values of damage starch, falling number of flour
and amylose content will also influence the fermentative process
1.2.7. Parameters to identify quality of flour streams
There are variety of parameters which indicate the functional properties of streams,
some of these are discussed below. All these values are closely related to mixing, dough
rheology and the baking performance.
a) Ash Contents
Ash content increases with the ER and end streams are usually rich in ash which
are not suitable for biscuit.
b) Polyphenoloxidase PPO
Arabinoxylans present in bran is the major functional component of bran and is
related to the enzyme (PPP) that hydrolyses it, therefore determination of PPO
activity is another valid indicator to evaluate bran contamination in white flour or
for increasing ER (Furest et al, 2006).
c) Protein content
Protein quantity and quality is indirectly a measure of quality of flour. It is
determined by variety of tests such as sedimentation value, LA-SRC, AWRC and
electrophoresis.
d) Particle size
It is the basic requirement in flour mill to evaluate flour quality. Fine particles lead
to produce high damaged starch content with high water absorption.

12
e) Falling number (FN)
It measures indirectly α-amylase activity which is related to get strength of starch
gel in dough. High FN means less α-amylase activity and starch molecule will unite
strongly.
f) Moisture content
Normally high moisture in flour supports softness on dough. Excess must be
avoided to present infestation and microbiological attack.
g) Damaged Starch
Low level of damaged starch is required for biscuit manufacturing. Streams which
have damaged starch lower than 25 UCD or less than 6% must be used for biscuit
production, higher value will support bread and pasta making.
1.2.8. Relationship of milling with end quality of biscuits
The end quality of biscuits largely depends on the process of milling and blending. The
choice for selecting break roll streams for further grinding also change the quality of flour.
Approaching towards the tail streams, the composition is fairly stabilized and drastically
changed. The following end quality properties are closely related to the composite flour
that is obtained after blending all the streams.
a. Diameter of the biscuit
The biscuits get reduced in size if major portion of tail streams rich in ash, protein,
damaged starch and bran is included in blending.
b. Height
Height will be decreased if streams of high damaged starch will be used.
c. Weight
Weight will be increased in specific volume i.e. density will be higher if tail streams
are included.
d. Color
The biscuit is related to most of the above values, the higher ash and protein
content will provide biscuit darker in color.

13
e. Surface crack/top grain
Tail streams will provide less cracking on the surface due to compact nature of
flour.
f. Mouth feel
Excess PPO activity, ash, protein and damaged starch contents provide hard
texture to biscuit and are responsible for adverse mouth feel.
1.3. Wheat flour
The fine powder after grinding of wheat is called wheat flour.
1.3.1. Composition of flour
1.3.1.1. Proteins
There are four types of protein found in wheat kernel,
a) Albumins (soluble in water)
b) Globulins (soluble in salt solution)
c) Prolamins (soluble in 70 to 85% ethanol)
d) Glutelins (soluble in dilute acid)
On hydration, flour form a viscoelastic mass that is called gluten with activated
network. Gluten is actually composed of two protein, gliadin (Prolamins) and glutenin
(Glutelins).
Glutenins are large polymeric proteins held together by many disulfide bonds. These
proteins give strength and elasticity to dough. Gliadins are smaller monomeric
proteins that are responsible for dough extensibility.
1.3.1.2. Starch
Wheat flour contains generally over 70% starch that is composed of
a) Amylose (25%)
b) Amylopectin (75%)

14
Amylose is a primarily straight-chain polymer of α-1,4-linked D-glucopyranose
molecules. Amylopectin is a branched polymer of α-1,4-linked glucose connected by
α-1,6- linked branch points. Starch has the property of absorbing water and cause
swelling when it is heated in excess water.
These properties of starch are important in many aspects relating to flour quality
because they influence the interactions of starch and water in a food system. Starch
granules can be physically damaged during flour milling, increasing their water-
holding ability and susceptibility to be attacked from the enzyme α-amylase.
1.3.1.3. Damaged Starch
The level of damaged starch depends on wheat hardness and milling technique. The
wheat which is harder, needs more force to break out, causing starch granules to be
damaged. Damaged starch increases water absorption of water, make flour
susceptible to α-amylase attack. α-amylase reduces starch into small fragments of
dextrin. Dextrin influences water holding ability and porosity of the dough.
High dextrin quantity softens the dough and make dough sticky, which is unwanted
impact on cookie quality.
1.3.1.4. Pentosans
Pentosans are the constituents of cell walls of wheat endosperm and bran. They are
composed of arabinoxylan which is a polymer with a β-(1-4)-linked D xylopyranose
backbone and branches of L-arabinofuranose.
It absorbs water ten times of its own weight. Pentosans are of both types i.e. water-
insoluble and water-soluble forms, depending on the degree of branching of the
arabinose side chains. A higher degree of arabinose substitution is associated with
higher water solubility.

15
1.3.1.5. Lipids
Whole grain wheat contains approximately 2 to 4% and the endosperm about 1 to
2% crude fats.
1.3.1.6. Ash Contents:
The inorganic residue in flour is called ash. It varies in flour and depends on how
milling is efficiently performed. 0.4% to 0.55% ash is usually considered as good
quality flour.
1.3.1.7. Moisture content:
Moisture is already present in wheat and also added during soaking of wheat. Usually
12-14% moisture is found in flour.
1.4. Ingredients other than flour and their functions
1.4.1. Sugar and syrup
Sugar and syrup being part of the recipe influence the various rheological characteristics
of the biscuit dough and the end quality. Excess of sugar reduce extrusion time, density,
consistency, viscosity and development of gluten network (as elastic recovery is
reduced). Spreading and thickness of the biscuit get increased. Reducing sugars like
dextrose, invert syrup, liquid glucose, fructose, high fructose corn syrup (HFCS) are used
as color improvers, HFCS shows better impact. Substitution of small level of glucose,
fructose, maltose, HFCS for sucrose, change the surface cracking pattern of the biscuit.
This shows that reducing sugars are more effective in determining the top grain (surface
cracking) than non-reducing (sucrose). However only glucose or fructose used as sugar
do not affect surface pattern. Sucrose either dissolved or in granular form exhibit surface
cracking because it crystalizes during baking. The appearance and physical properties of
biscuit such as dimensional properties, shape and surface cracking depend on the type
of sugar used because all the sugars vary in their melting point, solubility and
crystallization pattern.

16
1.4.2. Milk and role of milk proteins in baking
Whole milk liquid/powder and whey powder/whey protein concentrates (WPC) are
frequently used in biscuit production. Although addition of milk or milk products serves
the basic purpose of flavor and nutritional improvement, however milk components
including proteins play role in altering rheological and textural properties of biscuit.
Caseins show more elasticity and many make the texture harder, WPC has been used in
making gluten-free biscuits (Gaines et al, 2006) and shows its functional property to
participate in making gluten network, whey proteins are very strong non gluten proteins
candidate to replace gluten in gluten free biscuits. Milk ingredients leaving caseins make
dough less elastic and improve biscuit end quality as the softness increases while in
mouth feel it shows better mobility in mouth.
1.4.3. Egg and role of egg proteins
The components of egg are regarded as multifunctional additives in variety of food
system including biscuits, egg is sued to improve texture, volume, color, and flavor apart
from enhancing its nutritional value. Egg proteins play distinct role, like egg white
proteins form stronger, tougher and more elastic gel network than the yolk proteins
which provides color and softness to the biscuit. The protein network gets modified also
during mixing, sheeting and baking
1.4.4. Fat or Shortening
Fat plays many roles in baking, but few critical functions of fat are mentioned
underneath.
Slip melting point which shows the start temperature where fat begins to melt, is one of
the critical and major factor of functions of fat in dough.
a) Dough weakening.
Fat when mixed with flour, surrounds the particle resulting in weakening the gluten
network, resulting in baked products to become softer in texture, easily breakable,
chewable and melt in the mouth.

17
b) Creaming
Fat has the tendency to trap air bubbles during beating and mixing of dough which
produces porosity in dough containing many tiny air bubbles that are well trapped in
fat. This is very vital process in baking, the soft and airy texture of the product is
formed due to these air bubbles that expand during baking.
c) Layering
The bakery products other than the biscuit i.e. puff pastry, high melting points fats
are used to produce layers. Fat with high melting points tend to spread inside the
layers of pastry and it will be separated during baking to produce layers or puffs in
products.
d) Flavoring
Commonly all fats that are used in baking must have a plain taste and flavor. This is
required to keep finished product away from changing its own flavor. In rare products
fats are used to impart specific flavor to the baked products for example, using butter
for particular baked goods and lard for meat pie pastry.
e) Emulsion formation
Fat are also used to form emulsion with other ingredients in first stage of mixing
in dough or batter to form dough structure, later flour is added in second stage
of mixing.
1.5. Role of additives in biscuit processing
The additives in baking products have become essential part of the recipe. Additives in
biscuits although were used as flour improvers to ease the processing and to produce the
desired end quality. However, now they serve multiple purposes such as to enhance
nutritive value, to replace the ingredients for cost reduction etc. Variety of substances
are added in bakery products such as oxidizing and reducing agents, enzymes, emulsifies,
hydrocolloids, salts, nutrients etc. The objective of adding each additive is different and
it differ in their chemical nature widely.

18
1.5.1. Specific enzymes used in modification of biscuit dough
Enzymes are widely used in improving the functionality of dough. Different proteases
have been added to hydrolyze the gluten proteins (gliadins or glutenins) to make hard
flour soft by reducing the gluten strength of the dough. Amylases are used to adjust
viscosity and flow of the dough while lipases have served the purpose of altering dough
rheology in variety of ways.
Lipases modify the dough by acting as built in emulsifiers because they hydrolyze the fat
present in the dough partially or fully, if fat is partially hydrolyzed then either mono or
diglycerides are produced which are now used as established emulsifiers. Lipases in the
recipe may reduce the quantity of lecithin or may eliminate it completely. Every lipase,
will produce a different emulsifier and so its functions in dough may be desirable or
undesirable.
1.5.2. Emulsifiers in biscuit processing:
Emulsifiers are commonly added as ingredients to improve dough handling and baking
performance. Emulsifiers are responsible for promoting gluten and fat interactions that
makes the end product soft and provide better mouth feel. Lecithin, diacetyl tartaric acid
ester of monoglycerides (DATEM), mono and diglycerides (MGD) are commonly used
individually and in combinations. Biscuit recipe consists fat as a major component next
to flour and role of emulsifiers may hardly be ignored to make a desired product.
Emulsifiers play their role as anti-staling agent in bread. Emulsifiers are responsible for
changing the secondary structure of gluten proteins affecting the texture of end
products.
1.5.3. Oxidizing and reducing agents
Oxidizing and reducing agents are commonly used in flour treatment for variety of
purposes, such as for breaking dough strength/baking performance. Chlorine is used to
bleach the various pigments present in bran. Some oxidizing chemicals act as maturing
agents as chlorine dioxide, acetone peroxide, azodicarobonamide, potassium borate,
potassium iodate (a rapid dough breakdown agent). Potassium iodate and

19
azocarbonamide are fast acting oxidant and give similar effect as given by activated
dough bond compound. The reducing agents break the disulfide bridge of the large
glutenin molecules and make protein molecule size smaller than get hydrated easily and
dough mixes well reducing the mixing time. The reducing agents such as cysteine, sodium
bi-sulphite and sodium meta bisulfite are often used as flour improvers.
1.5.4. Hydrocolloids
The significance of functional importance of hydrocolloid in modifying dough rheology
and baking performance is being gradually understood in baking industry. Hydrocolloids
are hydrophilic biopolymers widely distributed in food systems, they affect water take up
by different molecules in the recipe by interacting with water ions and thus alter the
swelling, gelatinization, viscosity and gelling properties of the mix (dough). Hydrocolloids
are used as improver in bread, cake, biscuit and other bakery products. Some of the
hydrocolloids have been used as gluten replacers in the gluten free products as they are
capable of inducing viscoelastic, hydration and gas binding (gas retaining) properties.
Common hydrocolloids include gums (xanthan, guar, arabic), carbomethoxy cellulose
(CMC), non-starch polysaccharides (NSP) such as celluloses and hemicelluloses, beta
glucan, arabinoxylans, dietary fibers etc. Some of the emulsifiers also act as hydrocolloids
because they promote lipid gluten and lipid starch interactions in dough making process.
The gel rheology of the dough gets improved in presence of hydrocolloids which seems
to be a requisite for establishment of continuous network structure of the dough.
1.6. Mixing
1.6.1. A process of dough development
Mixing is an integral and the most critical part of any baking industry because the
mistakes you make here will appear in baking i.e. in end quality and there will be no
possibility for correction. Mixing is the process where all the ingredients in appropriate
amounts are blended and they interact to achieve the uniform distribution of each to
produce a mass of desired consistency, the mass is named as “dough”. So mixing is a
process of dough development that is highly important, complex, focal and need skilled

20
handling. Mixing time of the dough depends on the recipe of biscuit and may take 5-25
minutes.
1.6.2. Reactions in mixing
Variety of reactions take place during mixing to properly develop the dough. These
reactions may be inter ingredients or intra ingredients for example a component of flour
say protein may interact within itself or may react with another component (starch). It is
also possible that protein/starch in flour may react with sugar, fat or other ingredients.
The dough development is therefore a process of multiple visible and invisible stages,
where variety of reactions are taking place to develop gluten network, gluten-starch
matrix formation etc. The other molecules (ingredients) are embedded in the network
uniformly to produce desired viscoelastic mass or the dough. Some of the visible stages
of dough development are briefly discussed here, which are actually the outcome of
chemical reactions (invisible)
a. Formation of many electrostatic bonds between water molecule and
protein/starch.
b. Formation of new di-sulphide bridges that generate gluten network.
c. Protein starch linkages that develops protein matrix
d. Starch- starch interactions that shape a starch granule embedded in
protein network.
e. Non peptide linkages formation as a result of reactions of protein with
oxidizing and reducing agents
f. Enzymatic hydrolysis of peptide ester linkage of fats, acyle bond of
starches and their interactions in between themselves.
g. Formation of starch – fatty acids enclosures.
In fact many more such reactions are simultaneously occurring that finally give the shape
to dough. Some stages in mixing which are very visible, are being briefly discussed here.

21
I. Pick up
It is the process of hydration of each ingredient but the water taken up is not
absorbed or interacted. The mix is sticky with lumps and is cold. It shows ratio of
the hydrophilic and hydrophobic ingredients in a recipe.
II. Initial development
Water is penetrating and acting as a bridge between molecules, dough is smooth,
dried and hold temperature gets warmer.
III. Clean up
Dough is getting as one mass and scattered ingredients interact firmly to make it
stiff and together. Changes in color are obvious because of molecular interaction.
The dough now is lumpy, irregular and hard. It is the “under developed dough”.
IV. Final development
During the process of further mixing the dough has gained elasticity, desired
gluten network is at final stage i.e. s-s-bridges with in the glutenin and in gliaden
– glutenin have been sufficiently formed, arabinoxylan and starch interlinkages
have been developed to hold other molecules to provide the appropriate
viscosity. The temperature of the dough is suitable for handling, the dough which
at this stage may be called as the “optimal dough”, the dough ready to be baked.
V. Let down
The dough is very warm and viscous with more flow and less elasticity. The
molecular interactions if exceed than desired, the dough becomes very soft and
mobile.
VI. Breakdown
The inter molecular bridges i.e. s-s-and ferulic acid, protein-protein cross linking,
starch-protein, starch – starch (amylose-amylopecin with fat linkages) are
breaking and dough is getting weak, beginning to liquefy. The dough at this stage
may be called as “over developed”.
VII. Ideal dough
The ideal desired dough / optimal dough for each product (for each recipe) is
different and is obtained by controlling of the temperature at each stage, mixing

22
time and speed of mixer etc. Its temperature, density, weight, viscosity etc.
should be recorded as a check parameters to control quality of the dough that
determines quality.
1.6.3. Identification of optimal dough:
Optimal dough is the dough which produce the desired product on baking. It must be
thoroughly examined before baking because once the end product is obtained, the
process is irreversible. The parameters (tests) to assess the quality of optimal dough must
be highly reliable and dependable. Some of the tests to identify optimal dough are
discussed below.
a. Baking performance
The most reliable is the baking test, however it takes time. Some rheological tests using
Mixolab, texture analyzers and alveograph etc. provide information about pre baking
quality of dough. However quick tests are needed to decide whether the dough should
be baked or recycled such tests are discussed here.
b. Dough density
It predicts dough baking performance and end quality. The shape, weight and
dimensional characteristics are evaluated by studying the density of dough which may
easily be determined by dipping (immersing) a known weight of dough into an immiscible
liquid (water), the formula weight/volume will give the density.
c. Temperature of dough
The temperature of the dough before entering the oven is very important and should
coordinate with the temperature of 1st oven zone. Dough temperature at the beginning,
middle stage and end stage is also important. The dough temperature rises because of
inclusion of heat of hydration, heat of friction and environmental temperature that affect
the intermolecular reactions and the end properties. The rise in temperature during
mixing may be approximately calculated by friction factor which is defined as the value

23
used to compensate for the increased length of time. The friction factor is calculated by
the following formula,
3 x t 0C (dough) - t0C(room)+t0C (flour) + t0C(water) = Friction factor
d. Water absorption
Known amount of dough placed on a paper and pressed with a known weight will
produce wetted area on paper that is inversely proportional to water withheld and is
related to texture, surface crack etc.
e. Fat absorption
It is determined in the same way as the water absorption and is related to color and the
softness of the biscuit.
f. Hexane stability test
It gives amount of unabsorbed fat in the dough which is related to color, spread ability
etc. Expert bakers use their own way of thumb pressing, area of fat on filter paper, stretch
ability etc. Such tests at the end of mixing and before baking are important to reduce the
unwanted wastage.
g. Thumb Impression
Smooth dough when pressed with thumb makes depression, how quickly the dough
detains its original appearance predicts the dough baking performance.
Expert bakers may feel the dough behavior well in baking and such simple tests may
further help to predict the end quality and in identifying the desired dough.
1.6.4. Dough as a predictor of end quality
Bakers have to realize that dough before baking is the true predictor of end quality and
during dough development, variety of changes in process may change the dough
rheology and baking performance. As multiple reactions are going on during dough
development, it is necessary to promote certain reactions and to restrict also

24
considerable reaction to achieve the best performance of the dough. “Resting of the
dough” for a short period of time may be a good option that may reduce mixing time and
to save energy. Many of the reactions presently going on may get time to be completed.
Resting of dough is often desirable if enzyme are used.
1.7. Baking
1.7.1. Reactions in baking
It is interesting to see that how a flattened piece of dough get the attractive shape
appealing and a yummy taste just after spending few minutes in various sections of oven.
It is because the complex molecules as protein, fat, starch interact in multiple ways in
presence of water and heat. We have already hydrated these molecules during mixing
and provided the facility to them to swell that initiate inter molecular associations that
promote reactions in baking. Baking is actually a process of series of chemical reactions
responsible for visible physical changes i.e. formation of biscuit shape, appearance and
flavor. Some of these reactions are briefly discussed here.
a) Vaporization and mobility of water
The water present in dough vaporizes slowly as the dough enters in the oven. The
vapors moves horizontally (from center to sides) and vertically (from bottom to top)
that causes dough to expand and it dries gradually forming the structure. The
hardness, color, height and diameter of the biscuit may be controlled by varying the
speed of oven band, temperature and humidity in each zone of oven that determines
the texture of the biscuits percentage of moisture loss in each zone is a control of
quality of biscuit.
b) Caramelization
The process of caramelization brings three distinct changes in biscuit, firstly color,
secondly flavor and thirdly texture (crispiness). Caramelization in brief is a process of
burning of sugar in absence of moisture that causes color change from yellow to
brown, flavor development as burnt, bitter, acrid texture and formation. The above

25
observation are a result of multiple, chemical reactions between unsaturated
compounds forming complex polymers that are mostly saturated.
c) Maillard reaction
Maillard reaction is a group of reactions that includes condensation, addition and
polymerization reaction in series. It begins when water evaporates from dough and
condenses in dough an group of a protein to react with aldehdic group of starch to
form an amide. Many such reaction products go through polymerization to produce
compounds of brown color, burnt flavor and hard texture. Millard reaction also plays
key role in giving appearance, color and taste to biscuits.
d) Protein modification
Variety of proteins are present in dough which change or modify their structures when
heat is provided and water evaporates. Firstly coiled structure of protein is decoiled
and it aggregates that change in protein is known as denaturation or coagulation of
protein. This thermal denaturation at a temperature of 60-70 °C causes protein to
release water during uncoiling the released water (Proteins absorbs 31% water) is
taken up by starch which at further higher temperature > 74 °C gets gelatinized around
air bubbles, forming rigid structure due to protein and starch binding. All these
reactions help in texture formation of biscuit. Texture development is a complex
process of multiple reaction where ingredients added water and thermal environment
play their roles.
e) Starch gelatinization
Starch gelatinization is at least a three step process, firstly the starch granules hydrate
themselves, secondly the starch starts swelling at 40 °C, thirdly they start losing water
at higher temperature (simultaneously they bind protein) to from gel and finally to
become rigid in structure by losing water from gel. Starch is the most abundant
molecule in dough as flour consists nearly 68-82% of starch. Texture formation is
therefore mostly controlled by starch gelatinization.
26
f) Enzyme inactivation
The two groups of enzymes that mostly participate in baking are amylases and
proteases. Amylases accelerate the starch break down that makes dough more fluid,
mobile and promotes expansion. If enzyme is activated early the expansion or
spreading will be limited. Similarly proteases cause protein to hydrolyze that release
water also and will affect starch gelatinization and starch binding. Protease will cause
structured change.
g) Cell structure formation
The air bubbles in dough get reduced in baking depending on the heat provided. The
cell structure is different in crust (upper surface) and crumb (inter structure) the size
of cells in both are different and they are more compactly packed in crust as compared
to crumb, that has to be controlled in baking to give the desired mouth feel, chewing
and biting properties. All these reactions control the end quality.
1.7.2. Role of Ovens in Baking
Industrial baking ovens are generally called as tunnel ovens they consist of long
conveyors which carry the biscuit pieces through a heated tunnel section of the baking
chamber. The length of oven may differ from 25 meter to 100 meter. Two type of the
conveyor bands are available referred as wire-mesh and carbon steel band. The time of
baking and temperature are the two major factors in controlling the baking performances
of biscuit. The baking time is set if conveyor is driven with variable speeds.
1.7.3. Baking Zones
Industrial baking ovens are usually divided into zones accordingly to the differences in
the temperature and humidity which are controlled in zones along the length of the oven.
Most of the industrial baking ovens are based on 4 to 6 zones. The purpose of the
different zones system is to adjust temperature and humidity at suitable values during
the baking. The environments of the zones thus created will boost the developing of the

27
biscuit structure at suitable parameters such as moisture, top grain and color to get the
desired end quality.
The moisture removed from the biscuit dough depends on the extraction unit in every
zone which is linked to the speed of the conveyors. A fan is used to draw moist air from
baking tunnel for the exit of the moist air to chimneys and finally to atmosphere that
determines the extraction units.
There are three types of oven used in professional baking oven,
I. Radiant - Direct gas fired ovens and indirect radiant that is called cyclotherm
ovens
II. Conduction– The mesh bands or steel bands that are used pre-heated
III. Convection – They may be direct and indirect.
1.7.4. Hybrid ovens
Commercially a combination of different oven types are used in the form of zones that is
called “hybrid” or “combination” oven. The advantage of hybrid ovens is that different
heat transfer modes may be used at different stages of the baking process.
Table 2: Combination of zone used for commercially baked biscuits in Hybrid ovens
Zones
For semi hard/Sheeted product
i.e. biscuit and cracker
(wire mesh band)
For soft product i.e. cookie
(steel band)
01 Direct fire Cyclotherm
02 Direct Fire Cyclotherm
03 Cyclotherm Cyclotherm
04 Convection Convection
05 Convection Convection

28
2. CHAPTER: MATERIAL AND METHOD
2.1. Materials
Materials are separately discussed in each study or investigation. Please refer sections
“3.1.2.”, “3.2.2.”, “4.1.2.”, “5.1.2.”, “5.2.2.”, “5.3.2.”, “6.1.2.” and “6.2.2.” for the
description of materials.
2.2. Methods
2.2.1. Physicochemical Analysis
Instrumental Analysis
2.2.1.1. Moisture Content
Brabender Moisture Tester (Germany) was used to determine moisture contents of flour.
9 - 11 gm flour was dried at 155 °C as per AACC approved method no. 44-19.
Note: Results of moisture analysis have been discussed in the sections i.e. “3.1.3.1.”,
“3.2.3.1.”, “4.1.3.3.”, “5.1.3.1.”, “5.3.3.1.”, “6.1.3.1.” and “6.2.3.1.”
2.2.1.2. Analysis using Kernelyzer
Total protein, zeleny value and ash contents were analyzed by using Brabender
Kernalyzer. Ash is a critical parameter which identifies the flour quality with respect to
milling efficiency. Amount of ash in flour is also a legal requirement of PSQCA (Pakistan
Standard Quality Control Authority) which need to be fulfilled according to a baking
industry.
Normally ash is determined through muffle furnace method which takes at least 6 hours
to produce the result, it also involves manual handing which produce results where
accuracy may be challenged. Kernelyzer is a nondestructive testing machine which gives
results in seconds. Keeping time limitation and accuracy in result, Kernelyzer is used in
most of the commercial industries.
Note: Results Kernelyzer have been discussed in the sections i.e. “3.1.3.1.”, “3.2.3.1.”,
“4.1.3.2.”, “4.1.3.3.”, “5.1.3.3.”, “5.2.3.1.”, “5.3.3.1.”, “6.1.3.1.” and “6.2.3.1.”

29
2.2.1.3. Vibratory Sieve shaker to determination the particle size
The distribution of particle size in flour was measured by a vibratory sieve shaker
(Oberstein, Germany). Two sieves of 160 to 125 micron was used with vibration of 2 mm
amplitude for the time period of 10 min.
Note: Results of particle size analysis have been discussed in the sections i.e. “3.1.3.1.”,
“3.2.3.1.”, “4.1.3.3.”, “5.1.3.3.”, “5.2.3.1.”, “5.3.3.1.”, “6.1.3.1.” and “6.2.3.1.”
2.2.2. Farinograph Analysis
The flour behavior during dough making (rheological properties) were analyzed on
Brabender Farinograph (Duisburg, Germany) as per approved method of AACC (method
54-21). Farinograph Quality Number (FQN), Water Absorption (WA), Dough Stability Time
(DST), Dough Development Time (DDT) and two type of Degree of Softening (DoS) (ICC -
12 min after peak time and 10 min after beginning of curve) were determined.
The flour samples (300 gm) consisting 14 % moisture content were placed separately in
the mixing bowl of Farinograph. The line of 500 Farinograph Unit (FU) was reached, water
was poured by using already installed burette.
a) Dough development time (DDT)
DDT that is also called “peak” or “peak time” is the time when water is first added till it
reaches to maximum consistency of dough and dough moves slowly. It also indicate the
mixing time of dough.
b) Dough stability (DST)
Dough stability time is the time of difference in arrival and departure time. Arrival time
shows the time when peak first touches 500 FU line while departure is the time when
peak departs from 500 FU. DST is a measure of dough strength that how long the dough
may remain unchanged and is not deformed.

30
c) Degree of Softening (DoS)
DoS of the dough is measured in two ways. It is the difference in torque (FU) from peak
at the top of the curve measured either 12 min after peak time or 10 min after the
beginning.
d) Water Absorption (WA)
It is the amount of water required to be absorbed by the flour to form a consistent dough
at 500 FU. The water absorption value changes according to the quality of flour and the
ingredients in recipe. Hard flour need more water to reach required consistency of the
dough.
e) Farinograph Quality Number (FQN)
Farinograph quality number suggests the overall nature of the dough. High FQN reflects
strong dough network, while low FQN indicates weak dough.
Note: Results of farinograph have been discussed in the sections i.e. “3.1.3.2.”,
“3.2.3.3.”, “4.1.3.4.”, “5.1.3.2.”, “5.2.3.3.”, “5.3.3.2.”, “6.1.3.3.” and “6.2.3.2.”
2.2.3. Micro Visco-Amylo-Graph (MVAG) Analysis
MVAG (Brabender, Duisburg, Germany) was used to determine pasting properties of
starch present in wheat flour. Approved method of AACC (AACC Method 22-12) was used
to analyze wheat flour. A 15 gm flour sample was weighed and transferred into the bowl
provided with MVAG and then distilled water around 100 ml was added. The quantity of
water was adjusted as per the moisture content present in flour. Slurry was initially
formed by shaking with hands, then the bowl was fixed in MVAG. Slurry was stirred at
160 rpm and heated to 35°C for 10 sec and then heated to 95 °C for 7.3 min. During the
holding period, slurry was held heated at 95 °C for 15.7 min. Finally it was cooled to 50
°C for a period of 7.7 min. Beginning of Gelatinization, Max Viscosity/Peak Viscosity (PV),
Break-Down (BD) and Setback (SB) were estimated.

31
a) Pasting Temperature
The capacity of starch to swell depends on ratio of amylose and amylopectin, their chain
length, total concentration and chemical structure of the two component of starch
granule. The swelling shows the ability of starch molecules to inbide water and depends
on the pasting temperature which is defined as the temperature at which the fluid gets
viscous. It also determines beginning of gelatinization. The MVAG measures the pasting
temperature that helps to regulate the temperature of zone of baking oven. The excess
of starch granules lowers the pasting temperature while small molecules as
glucose/maltose lead to high pasting temperature.
b) Peak Viscosity/Maximum Viscosity
Peak viscosity of the starch molecule is related to its ability to swell and form paste on
heating in water, if the paste is concentrated viscosity will be higher because the pins of
the mixer will resist during stirring and will show higher viscosity. The ability of the paste
to resist movement during stirring is called the peak viscosity. It is related to overall end
quality of biscuit.
c) Hot Paste Viscosity
It is the viscosity measured at the end of heating process and determines the mobility of
swollen starch granules after cooking for 20 minutes. Viscosity at this stage is decreased
and is known as the breakdown viscosity. Which is calculated by subtracting the hot paste
viscosity from peak viscosity. The hot paste viscosity is related to hardness of the end
product.
d) Cold Paste Viscosity
It is the viscosity measured at the 300C or the 500C and is higher than the hot paste
viscosity or breakdown viscosity because the amylose molecules now reunite making
the paste thicker. This phase is refereed as retrogradation of starch when more H-
bonds are formed between adjacent hydroxyl groups of amylose units. The cold paste
viscosity is related to mouth feel property of biscuits.

32
e) Setback Viscosity
The SB viscosity involves recrystallization of starch which shows the closing of double
helices and viscosity increases. It is calculated by subtracting peak viscosity from cold
paste viscosity which is also named as final viscosity. All the viscosities at cold
temperature are related to chewing, biting or mouthfeel properties and elaborate the
eating quality of the biscuit or the biscuit texture.
Note: Results of MVAG have been discussed in the sections i.e. “3.1.3.3.”, “3.2.3.4.”,
“5.2.3.4.”, “5.3.3.3.”, “6.2.3.3.” and “6.1.3.4.”
2.2.4. Glutomatic Analysis
Different analysis on gluten proteins were conducted on Glutomatic System - 2000
(Perten, Sweden) as per approved method 38 - 12 (AACC, 2000). The dry gluten (DG), wet
gluten (WG), passed gluten (PG), retained gluten (RG), gluten index (GI) and water
binding capacity (WBC) were the parameters analyzed using Glutomatic System. 10 gm
flour sample was placed on cups with polyester sieve and fixed in the washing chamber
of Glutomatic. 2% saline water was used to wash the flour for 5 min. The residue i.e. wet
gluten was collected on cups and then placed in centrifuge machine to get passed and
retained gluten separated through a perforated mesh already installed inside the holder
cup.
a) Gluten Index:
The Gluten Index is a measure of gluten strength or the gluten network of the dough
and is calculated by the formula GI = (Retained gluten)/100.
b) Wet Gluten:
Wet Gluten is a predictor of few qualities of the flour. It measures water binding
capacity of the gluten proteins, thereby indicating the behavior of gluten proteins
during mixing and baking. The amount of wet gluten shows hardness of the flour and is
measured by Glutomatic 2200 using method 38-12 (AACC-2000) proteins.

33
Note: Results of glutomatic proteins have been discussed in the sections i.e. “3.1.3.1.”,
“3.2.3.5.”, “4.1.3.3.”, “5.1.3.4.”, “5.2.3.5.”, “5.3.3.4.”, “6.1.3.5.” and “6.2.3.1.”
2.2.5. Determination of Damaged Starch Content by SDmatic
Damaged Starch content was analyzed by using Chopin Sdmatic. The Sdmatic from
Chopin is designed to measure starch damage rate of the flour in Ai %( iodine absorption)
and in UCD (Chopin Dubois Unit). The Sdmatic works on the Medcalf and Giles Principle
(1965) to measure the starch damage rate of flour.
Briefly describing, 120 ml of distilled water in plastic bottle is taken, 1.5 grams of citric
acid, 3 gm of potassium iodide with 1-2 drop of sodium thiosulphate at 0.1 mol/l were
added. Bottle was shaken for seconds and then poured into a reaction solution in reaction
bowl of Sdmatic system. Reaction bowled was placed in the Sdmatic and folded down the
arm. 1 gm of flour was weighed in the spoon and placed in the Sdmatic. Flour weight,
moisture and protein level were fed in the software and the test was started. Results
were shown in UCD, % according to AACC 76-31and also in Farrand.
Note: Results of DS have been discussed in the sections i.e. “4.1.3.3.”, “3.2.3.1.”, “5.1.3.3.”
and “5.2.3.1.”
2.2.6. Scanning Electron Microscopy (SEM)
SEM (Analysis system, Model JEOL-2300) was used to evaluate dough microstructure
according to Prabhashankar and coworker (2004). Samples of dough were kept in hexane
for 16 hr to defat it. After fat removal, dough was dried by freezing for 5-6 hr. For sample
preparation to analyze in SEM, dried dough was cut (transversally) into fine slices by using
blade considering no damage of the dough structure. After mounting on the holder
further studies were taken place to produce picture.
Note: Results have been discussed in the section of “6.2.3.4”.

34
Chemical Analysis
2.2.7. Solvent retention capacity
Different type of Solvent retention capacity (SRC) analysis were conducted as per the
approved method of AACC 56 - 11 (AACC 2000). All SRC are discussed below,
a) Water SRC
1 gm of flour sample (each) was added in tube with 5 ml of water. The suspended flour
samples were held hydrated for the period of 20 min (shake for 5 second after 5, 10, 15,
and 20 min). After 20 min tube were placed in centrifuge tube with 1,000 rpm for the
period of 15 min. The supernatant in the tube was decanted and then tube was placed
on a paper towel at 90° angle to drain it for 10 min. The remaining centrifuged part of
flour was weighed. The SRC value was calculated as per the method derived by Haynes
and coworkers (2009). The analysis for each sample was conducted in duplicate.
b) Sucrose SRC
1 gm of flour sample (each) was added in tube with 5 ml of 50% sucrose. The suspended
flour samples were held hydrated for the period of 20 min (shake for 5 second after 5,
10, 15, and 20 min). After 20 min tube were placed in centrifuge tube with 1,000 rpm for
the period of 15 min. The supernatant in the tube was decanted and then tube was
placed on a paper towel at 90° angle to drain it for 10 min. The remaining centrifuged
part of flour was weighed. The SRC value was calculated as per the method derived by
Haynes and coworkers (2009). The analysis for each sample was conducted in duplicate.
c) Lactic Acid SRC
1 gm of flour sample (each) was added in tube with 5 ml of 5% lactic acid. The suspended
flour samples were held hydrated for the period of 20 min (shake for 5 second after 5,
10, 15, and 20 min). After 20 min tube were placed in centrifuge tube with 1,000 rpm for
the period of 15 min. The supernatant in the tube was decanted and then tube was
placed on a paper towel at 90° angle to drain it for 10 min. The remaining centrifuged

35
part of flour was weighed. The SRC value was calculated as per the method derived by
Haynes and coworkers (2009). The analysis for each sample was conducted in duplicate.
d) Sodium carbonate SRC
1 gm of flour sample (each) was added in tube with 5 ml of 5% sodium carbonate solution.
The suspended flour samples were held hydrated for the period of 20 min (shake for 5
second after 5, 10, 15, and 20 min). After 20 min tube were placed in centrifuge tube with
1,000 rpm for the period of 15 min. The supernatant in the tube was decanted and then
tube was placed on a paper towel at 90° angle to drain it for 10 min. The remaining
centrifuged part of flour was weighed. The SRC value was calculated as per the method
derived by Haynes and coworkers (2009). The analysis for each sample was conducted in
duplicate.
Note: Results have been discussed in the sections i.e. “3.1.3.4.”, “3.2.3.2.” and with other
physicochemical analysis.
2.2.8. AWRC profiles of flours:
The AWRC was conducted as per approved method of AACC 56-10, 1 gm of flour sample
(each) was added in tube with 5 ml of NaHCO3 solution (8.4g in 1 liter). The suspended
flour samples were held hydrated for the period of 20 min (shake for 5 second after 5,
10, 15, and 20 min). After resting for 20 min, the tubes were centrifuged at 1,000 rpm for
the period of 15 min. The supernatant in the tube was decanted and then each tube was
placed on a paper towel at 90° angle to drain the fluid for 10 min. The remaining
centrifuged part of flour was weighed. The AWRC value was calculated as per the method
derived by Haynes and coworkers (2009). The analysis for each sample was conducted in
duplicate.
Note: Results have been discussed in the section of “5.2.3.2.”
2.2.9. Statistical Analysis
The simple statistical techniques using Microsoft Excel (2010) were mostly used to
analyze the data. Tools including linear correlation coefficients between different

36
parameters, scattered chart and line/bar chart were utilized. The SPSS statistical software
(version 20) was used for SEM study.
The values shown in each investigation are a mean of at least three readings.
The reason of including very simple statistical analysis in the study is to focus the milling
industries in Pakistan who are not well developed, they can easily interpret and apply
results in their industries to get the benefit from these studies.
2.2.10. Evaluation of biscuit end quality
The end quality of biscuits was evaluated under the following heading
a) Dimensional analysis
The biscuit dimensions i.e. size, thickness including weight were measured and recorded
as per AACC method (10-31B). Sample for measurement was randomly selected. The
diameter of the biscuit was measured in mm by turning at different angles three times
and the mean value is reported. The thickness of biscuits were measure by placing eight
biscuits in a column and taking average of one biscuit in mm.
The cookie factor/spread ratio was calculated by dividing width (W) by height (H)
according to Colombo et al (2008).
b) Textural analysis
The hardness of biscuit was measured by UTM (Zwick/Roel). Force was calculated on N.
c) Sensory analysis
The 10 trained panelists from English Biscuit Manufacturers Pvt. Ltd. Conducted the
sensory evaluation by using a nine point Hedonic scale. One (1) represented “extremely
dislike” and nine (9) represented “extremely like”. Texture, color, flavor, taste and overall
acceptability level were the attributes for sensory evaluation.
Note: Results have been discussed in the sections i.e. “3.2.3.6.”, “5.3.3.5.”, “6.1.3.6.”,
“6.2.3.5.” and “6.2.3.6.”

37
3. CHAPTER: WHEAT MILLING AND ITS INDUSTRIAL APPLICATION
3.1. Study of milling streams used in the production of commercial flours
to be utilized in biscuit making industry.
3.1.1. Foreword of the study
Miller, usually face difficulties to produce flour as per customer requirement due to the
uncontrolled supply chain of wheat in Pakistan especially if they have to supply same
quality of flour for longer period of time or permanently. Milling industries are also in
transition period to be modernized by installing state of the art plants and inducting
excellent human resource to face the challenge of supplying flour as per customer need
inspite of the issue of unavailability of required type of wheat kernels.
The study was conducted to evaluate the physiochemical and rheological properties of
milling streams produced in a mill to identify required quality of flour and match with the
different specifications for the customers by mixing selected streams to get composite
flour.

38
Figure 3: Flow chart of milling streams for flour collection
PN: Numeric values are representing the sieve size in micron, alpha numeric values are
representing the streams name. Purifier is actually called Suji machine in Pakistan.

39
3.1.2. Material and Method:
Please refer to chapter 2 for detail description of the methods, however only specific
material and method related to the topic are discussed here.
3.1.2.1. Material
Soft wheat from Punjab origin was milled commercially in Garibsons Pvt. Ltd. Port Qasim,
Karachi, Pakistan. Total 35 flour streams (all type) were studied and samples were
collected accordingly.
3.1.2.2. Information on milling streams used in the study
The final product or the composite flour as commercially practiced in Pakistan is
produced by mixing of the various milling streams/passages as mentioned below
(definition and description were discussed in table 3).
a) Break Streams
b) Middling Streams
c) Fine and Coarse Semolina Streams
d) Semolina Overtail Streams
The final product actually represents the composite flour or a mixture of all the above
mentioned streams. The 132 micron sieve size of sifter was fixed at the mill for getting
flour to be mixed in last stage for adjusting the quality and quantity of the final product.
Some flour streams after sieving from 150 or 180 micron sieves were also used to
increase the extraction rate of flour and to meet the customer order (required quantity).
However, all other quality parameters were achieved within the range of customer’s
specification even after mixing the larger particles size flour.
Table 3: Streams names, types and description
S. No Strea
ms Name
Name of Streams after combining similar streams
Type of Streams
Description of streams
1 B1A
1st Break Break Streams
Wheat is broken by the set of grooved rollers and converted into the many fractions varying in particle size. All fractions are passed through
2 B1B
3 B1C
4 B2A 2nd Break

40
5 B2B the different sieves in huge sifters. The particles which are collected after the end of sieve of 132 or 180 micron are diverted to be mixed into the end product. Whereas the rest of the fractions are further processed by smooth rollers (reduction rollers) to extract remaining flour of different particle size.
6 B2C
7 B3A
3rd Break 8 B3B
9 B3C
10 B4A
4th Break 11 B4B
12 B4C
13 B4D
14 B5A 5th Break
15 C1A Coarse - C1A
Fine and Coarse
Semolina Streams
Portion of ground wheat from break rolls, which has particle size in between 1020-820 micron to 720-530 micron goes to purifiers for the separation of bran, then these fractions are processed by set of rolls and streams are produced called coarse semolina streams, whereas particle between 720-530 to 280-270 micron goes to other purifiers, including the other set of RR and these passages called fine semolina streams. The flour of particle size that is collected after the end of sieve of 132 or 180 micron are diverted to be mixed into the end product flour. Rejection of both the purifiers are diverted to C1B whereas end residue is diverted to bran rich products.
16 C2C Fine - C2C
17 C2A Fine - C2A/B
18 C2B
19 C3A Fine - C3A
20 C1B C1B Semolina Overtail
Streams/ Rejection
from Semolina Streams
Rejection/retained of purifier (Suji machine), goes to other roll sets for further grinding. Flour received after sieving from 132 micron sieves are diverted to be mixed in the final product.
21 C4A C4
22 C4B
23 C5A C5
24 C5B
25 C6A C6
26 C6B
27 D1A D1
Middling Streams
Retained wheat part on 132 or 180 micron sieves from the break roller, goes to other set of smooth rollers for further grinding. In each roller set, flour is achieved after passing it through 132 micron sieve.
28 D1B
29 DD1A DD1
30 DD1B
31 R1A R1A
32 C7A C7A
33 C7B C7B
34 C8A C8
35 C8B

41
The large scale size flour mills usually use more than one set of two rolls for same streams
to get the high grinding rate (extraction rate).
The flours from roller sets consisting similar values were mixed and the number of milling
streams were reduced to 19. Underneath discussion is based on the 19 milling streams.
Table 4: Milling streams type and details
S. NO Streams/Passages # of
streams Name of streams
1 Break Rolls 5 1st, 2nd , 3rd, 4th and 5th Break
2 Fine and coarse
semolina
4 Coarse C1A, Fine C2C, Fine C2A/C2B
and Fine C3A
3 Semolina Overtail 4 C1B, C4, C5 AND C6
4 Middling 6 D1, DD1, R1A, C7A, C7B AND C8
The numbers of streams mentioned above were assigned by the Mill as themselves that
differ from mill to mill.
3.1.3. Result and Discussion
3.1.3.1. Physicochemical Analysis of Milling Streams
3.1.3.1.1. Moisture
The moisture is a critical parameter for optimizing flour quality for the manufacturing of
biscuits and cookies. It plays vital role in indicating the flour behavior in dough
development and water may need adjustment in the recipe. The moisture is also
responsible for control of dimensional properties of biscuit.
a. Moisture in flour from break passages
Moisture contents in the flour streams decreased gradually from the initial moisture 16%
(wheat) to 12.29% in flour. The moisture amount recorded in break rolls decreased from
15% to 12.29% that clearly indicated that the wheat flour fractions were losing moisture
during milling because of the heat generated by friction energy. The overall moisture loss
in break roll was 2.72% during milling from 1st to 5th break.

42
Figure 4: Variation in moisture (%) in flour from break streams.
b. Moisture in flour from semolina passages
The moisture was recorded as 13.14% in flour taken from coarse semolina whereas
12.26% to 12.94% moisture was observed in flour produced from three streams of fine
semolina. Total 0.68% decrease in moisture was observed in three streams of fine
semolina that was a negligible loss in moisture.
Figure 5: Variation in moisture (%) in flour from semolina streams.
c. Moisture in flour from semolina overtail passages
The moisture loss as 12.88% to 11.72% was recorded in these four streams. Lower
moisture content was evident in semolina overtail passages.
15.0114.47
13.7313.22
12.29
1st Break 2nd Break 3rd Break 4th Break 5th Break
13.14
12.9412.83
12.26
Coarse - C1A Fine - C2C Fine - C2A/B Fine - C3A

43
Figure 6: Variation in moisture (%) in flour from semolina overtail streams
d. Moisture in flour from middling passages
The decrease in moisture content was also observed in the flour streams of middling. C7A
and C7B were the streams found with very low moisture content even up to 11.7%. The
first three flour middling stream had higher moisture level (13.21%-13.87%) with a
difference of 0.66% while the last three streams had shown very low moisture level
(12.3% - 11.7%) with a difference of 2.17% from the highest moisture of middling stream
(13.87%).
Figure 7: Variation in moisture (%) in flour from middling streams
e. Conclusion
The percent moisture was decreasing as milling further proceeded i.e. the particle size
was reduced constantly (as mentioned in 3.1.3.1.7). Higher moisture contents were
observed in break streams whereas the flour from middling, overtail and semolina
12.88
11.72
12.02
12.39
C1B C4 C5 C6
13.47
13.87
13.21
11.84 11.70
12.30
D1 DD1 R1A C7A C7B C8
Moisture (%) in Flour Streams from Middling

44
streams showed similar values of moisture. Along with the recipe water, the moisture
already present in flour is very important in producing required dough (Wade et al, 2012).
3.1.3.1.2. Protein
The total proteins content include all types of proteins present in the flour (including the
gluten proteins). Since gluten plays the determining role in the evaluation of flour quality,
dough making and texture formation of biscuit, it is separately analyzed in the laboratory.
Total protein analysis is therefore not an only significant parameter to predict flour
behavior on production lines (Gaines et al, 2006; Fustier et al, 2009).
a. Protein content in flour from Break passages
Protein content was found to be increasing as the wheat kernel was getting milled,
10.23% protein was reported in the flour from 1st break whereas highest amount of
protein as 13.97% was observed in flour from 3rd break. Increase in protein was due to
the inclusion of bran that is a rich source of bran proteins.
Figure 8: Variation in protein (%) in flour from break rolls streams
b. Protein content in flour from Semolina passages
Quite consistent amount of protein was found to be present in 4 streams from semolina
(10% to 10.4%). Similar like gluten, the low protein content in flour is perfect for cookie
making in baking industry.
10.23
12.40
13.9713.33
12.60
1st Break 2nd Break 3rd Break 4th Break 5th Break

45
Figure 9: Variation in protein (%) in flour from semolina streams
c. Protein content in flour from Semolina overtail passages
Increase in protein content as 10.15% to 11.3% was recorded in overtail streams of
semolina due to the inclusion of bran. Bran proteins are widely distributed in pericarp.
Enough information is not yet available that whether bran protein behave as gluten
protein or they disturb the gluten network.
Figure 10: Variation in Protein (%) in flour from semolina overtail streams
d. Protein content in flour from Middling passages
The protein amount in middling streams varied widely. The minimum quantity of protein
as 9.6% was recorded in R1A stage/streams while maximum was found as 11.4% in C7B.
10.40
10.30
10.20
10.00
Coarse - C1A Fine - C2C Fine - C2A/B Fine - C3A
10.40
10.15
11.05
11.30
C1B C4 C5 C6

46
Figure 11: Distribution of protein (%) in flour from middling streams.
e. Conclusion
Consistency in protein distribution was recorded in semolina streams. Our results
confirmed the earlier findings that streams rich in ash contents were found also to have
high amount of protein. Protein and ash showed close association in compositional
distribution of protein in the wheat kernel.
3.1.3.1.3. Ash
Both the components of flour i.e. ash and proteins act as a deciding factors of flour quality
for biscuit, cake, crackers etc. The lower ash and protein content are the indicators for
soft quality of flour; hard and durum flours consist more protein. The increased amount
of protein and ash in the flour produces cookies of hard texture, reduced diameter and
darker in color.
a. Ash content in flour from Break passages
Constant increase in ash content was observed in streams obtained from break rolls
however the rate of increase was maximum in streams from 4th to 5th rolls. Minimum ash
content 0.63% recorded in 1st break whereas maximum ash % i.e. 1.38% was recorded in
5th break with a difference of 0.75%. The results showed that ash was found to be
increasing with further grinding of wheat, suggesting wheat bran was gradually being
finely ground and mixed in flour. Geng et al (2012) have also reported the ash enrichment
of flour in break streams in later phases of milling.
10.65
11.15
9.60
11.30 11.40
10.75
D1 DD1 R1A C7A C7B C8
Protein (%) in Flour Streams from Middling

47
Figure 12: Variation in ash (%) in flour from break rolls streams
b. Ash content in flour from Semolina passages
The amount of ash produced in semolina streams was found to be reduced. As the flour
passed through the purifiers, the bran was completely eliminated which was a rich source
of ash. The importance of measuring ash diversity is essential to assess the changes of
flour in quality during disintegration or the streams collected and its impact on spread
ratio of the cookies (Gaines et al, 1988).
Figure 13: Variation in Ash (%) in flour from semolina streams
c. Ash content in flour from Semolina Overtail passages
The ash obtained in the streams C1B, C4, C5 and C6, ranged from 0.35% to 0.7% which
were collected immediately after purifier stage and named as overtail (as they retained
on the sieves of purifier). The lower ash quantity in C1B and C4 was due to the removal
of bran flakes from sieves and less opportunity of bran to be finely ground by the set of
0.63 0.65
0.94
1.08
1.38
1st Break 2nd Break 3rd Break 4th Break 5th Break
0.41
0.35
0.39
0.42
Coarse - C1A Fine - C2C Fine - C2A/B Fine - C3A

48
rollers in initial stage. In later phases finely ground bran was mixed with flour thus
increased the ash value.
Figure 14: Ash (%) in flour Streams from semolina overtail streams
d. Ash content in flour from Middling passages
The ash contents present in streams in middling varied from 0.37% to 0.87% with a
difference of 0.50%. The flour consisting high ash content is usually directed towards Atta
(a low refined type of flour used for Chapatti making in Pakistan), whereas low ash flour
is mixed with flour used for biscuit production. The flour from middling streams showed
very varied ash distribution as also shown in the case of moisture distribution.
Figure 15: Variation in ash (%) in flour from middling streams
0.35
0.44
0.660.70
C1B C4 C5 C6
0.49
0.62
0.37
0.78
0.87
0.65
D1 DD1 R1A C7A C7B C8

49
e. Conclusion
The flour consisting low ash were produced from all the streams in middling and
semolina. Wide variation was noticed in all type of streams. The lower ash content in
flour streams from middling and semolina showed that they should be included more in
blending for biscuit making and ratio should be adjusted accordingly.
3.1.3.1.4. Gluten index
GI is a parameter in flour that predicts the dough strength based on network making
ability during dough formation. High GI reflects strong network of gluten proteins present
in the flour. The flour suitable for biscuit production should make weak gluten network
i.e. low GI. (Madugiri et al 2008) as dough required to be soft in nature.
a. Gluten Index in flour from Break passages
High value of GI was observed that varied from 88 to 96, strong gluten network is
expected from all the break roller streams. However a constant increase or decrease in
GI was not observed.
Figure 16: Variation in gluten Index (%) in flour from break streams
b. Gluten Index in flour from Semolina passages
The semolina flour showed slightly less GI values from 83 to 95. It was an indication that
purified flour was producing slightly less glutenins as compared to gliadins.
93
88
93
96 96
1st Break 2nd Break 3rd Break 4th Break 5th Break

50
Figure 17: Variation in gluten index (%) in flour from semolina streams.
c. Gluten Index in flour from Semolina overtail passages
Minimum GI achieved in C4 passages, the reason is unknown but it may be attributed to
low ash content.
Figure 18: Variation in gluten index (%) in flour from semolina overtail streams.
d. Gluten Index in flour from Middling passages
Variation showed decrease in gluten index in flour streams from 93 to 84, almost a
constant decline.
87
95
83
94
Coarse - C1A Fine - C2C Fine - C2A/B Fine - C3A
94
70
9288
C1B C4 C5 C6

51
Figure 19: Variation in gluten index (%) in flour from middling streams.
e. Conclusion.
Slight higher GI was observed in all the streams however, the streams also had low ash
content, it was looked that the medium GI and low ash complement each other and the
flour was suitable for biscuit making.
3.1.3.1.5. Dry Gluten
Generally flour is categorized on the basis of dry gluten content. Higher dry gluten values
referring to hard flour are required for pasta, pizza and bread making whereas low dry
gluten values is desired for biscuit, wafers and cakes.
a. Dry gluten in flour from Break passages
The dry gluten varying from 6.9% to 10.03% was obtained in 5 break rolls. However the
quantity of dry gluten rose till the streams obtained from 3rd break then it dropped in the
4th and 5th break. The rise and fall in the quantity of dry gluten probably was related to
the design and number of the grooves present in each roller.
93
92
9091
88
84
D1 DD1 R1A C7A C7B C8

52
Figure 20: Variation in dry gluten (%) in flour from break rolls streams
b. Dry gluten in flour from Semolina passages
The dry gluten recorded in semolina varied from 7.3% to 8.8% with a difference of 1.5%.
No significant difference or relation was observed. The difference in gluten content in
different streams might be linked with the gap between the two rollers and its differential
speed.
Figure 21: Variation in dry gluten (%) in flour from semolina streams
c. Dry gluten in flour from Semolina overtail passages
The dry gluten in flour was recorded the higher values varied from 8.7% to 9.4% with a
maximum difference of 0.7%. There are many number of factors that may influence the
inclusion of gluten in flour (endosperm) such as the distance between the roller, design
etc.
7.43
9.6010.03
7.20 6.90
1st Break 2nd Break 3rd Break 4th Break 5th Break
7.90
8.80 8.60
7.30
Coarse - C1A Fine - C2C Fine - C2A/B Fine - C3A

53
Figure 22: Variation in dry gluten (%) in flour from semolina overtail streams.
d. Dry gluten in flour from Middling passages
All variety of flours consisting variable quantity of DG obtained from 6 middling streams
showed different percentage of dry gluten in initial, middle and the last streams. The
quantity of DG varied from 7.00% to 9.8% with a difference of 1.8%.
Figure 23: Variation in dry gluten (%) in flour from middling streams.
e. Conclusion
The quantity of dry glutens obtained from various streams varied widely as recorded in
flour collection. A strong relation of ash with dry gluten was observed in break roll
streams as the values of ash as well as dry gluten were found to be the highest. It may be
attributed to the fact that minerals generally are bound to the proteins. It may be pointed
out here that how higher values of dry gluten are helpful to categories flour as weak,
strong or durum.
8.70
9.25
9.40
9.20
C1B C4 C5 C6
8.35 8.40
7.00
9.60 9.80
8.50
D1 DD1 R1A C7A C7B C8

54
3.1.3.1.6. Wet Gluten
The wet gluten is similar in parameter to DG that is used to identify the flour type,
strength based on the gluten proteins network. Most of the flour standards are based on
gluten contents where gluten is referred as wet gluten. It also predicts the water
absorption capabilities of gluten which is linked to end quality of most of the baked
products. The water absorption value obtained from Farinograph represents the water
retained by all the hydrophilic components present in flour including the water held by
the gluten proteins.
There was no significant variations in values as observed in analyzing various streams.
Figure 24: Variation wet gluten (%) in flour streams from 18.8 to 28.78%.
Figure 25: Showing minor variation in wet gluten (%) in flour streams from 20.70 to
26.1
22.02
28.27 28.78
20.4618.80
1st Break 2nd Break 3rd Break 4th Break 5th Break
Wet Gluten (%) in Flour Streams from Break Rolls
23.7526.10 25.95
20.70
Coarse - C1A Fine - C2C Fine - C2A/B Fine - C3A
Wet Gluten (%) in Flour Streams from Semolina

55
Figure 26: Variation in wet gluten (%) in flour streams from 25.75 to 29.23
Figure 27: Wet gluten (%) in Flour streams from middling
3.1.3.1.7. Particle size distribution
Particle size of flour plays vital role in determining the water absorption, damaged starch
production, and evaluation of the texture of the biscuit.
a. Particle size in flour from Break passages
The present milling design produced flour of particle size 132 micron from 1st and 2nd
break, whereas the flour from 3rd, 4th and 5th break maintained as 180 micron. The
retention of flour particles at 160 micron sieve including the sieve 1st and 2nd was almost
nil, whereas the particle size of the flour from 3rd, 4th, and 5th break rolls was increasing.
At 125 micron, highest retention was observed in 4th break. Whereas lowest retention
was observed in 1st break. Overall, very fine particle of flour was produced by 1st and 2nd
break, whereas 4th break produced flour of coarse particle.
25.75
28.9529.23
27.33
C1B C4 C5 C6
Wet Gluten (%) in Flour Streams from Semolina overtail
25.58 25.53
21.50
28.5030.05
26.08
D1 DD1 R1A C7A C7B C8

56
Figure 28: Showing increase in % retention at 160 µm sieve of flour streams from
break rolls
Figure 29: % Retention at 125 µm sieve of Flour streams from break rolls
Figure 30: % through from 125 µm sieve of Flour streams from break rolls
0.1 0.7
33.0
38.8
46.8
1st Break 2nd Break 3rd Break 4th Break 5th Break
6.7
13.3
37.7
43.6
30.1
1st Break 2nd Break 3rd Break 4th Break 5th Break
93.286.0
29.3
17.623.1
1st Break 2nd Break 3rd Break 4th Break 5th Break

57
b. Particle size in flour from Semolina passages,
A fine semolina passage C2C, 180 micron sieve was placed due to which high relation at
160 micron observed. C2C produced coarse particle flour whereas C3A, C2A/B produced
very fine flour.
Figure 31: % Retention at 160 µm sieve of flour streams from semolina showing
retention 0.1 to 9.1%
Figure 32: % of flour streams retained at 125 µm sieve from 5.0 to 72.8% in semolina
passages
2.6
9.1
0.2 0.1
Coarse - C1A Fine - C2C Fine - C2A/B Fine - C3A
6.9
72.8
25.1
5.0
Coarse - C1A Fine - C2C Fine - C2A/B Fine - C3A

58
Figure 33: % of flour streams from semolina from 125 µm sieve.
c. Particle size in flour from Semolina overtail passages
Fine flour retained at 125 micron in C5 and C6 is to be higher than the flour that passed
through the sieve. Whereas a small amount of coarser flour was retained in C1b and C4.
Figure 34: % of Flour Streams from 0.1 to 4 retained at 160 µm sieve in semolina
overtail passages
90.5
18.1
74.8
94.9
Coarse - C1A Fine - C2C Fine - C2A/B Fine - C3A
4.0
0.1 0.2 0.1
C1B C4 C5 C6

59
Figure 35: % Retention at 125 µm sieve of flour streams from semolina overtail
Figure 36: % through from 125 µm sieve of flour streams from semolina overtail
d. Particle size in flour from Middling passages
The streams R1A, C7A, C7B and C8 produced fine particle size flour whereas DD1
produced coarse flour.
54.7
43.1
7.9
20.9
C1B C4 C5 C6
41.3
56.9
92.0
79.0
C1B C4 C5 C6
0.6
12.8
0.80.1 0.1 0.3
D1 DD1 R1A C7A C7B C8
60
Figure 37: % Retention at 160 µm sieve of flour streams from middling
Figure 38: % Retention at 125 µm sieve of flour streams from middling
Figure 39: % through from 125 µm sieve of flour streams from middling
e. Conclusion
Different fractions of flour consisting different particle size are received during milling by
setting the distance between the rollers and using sieves of different sizes
As per customer requirement the flour of a particular particle size may be obtained by
applying modification in milling techniques and using specified blending techniques to
produce the composite flour.
18.5
29.4
20.8
10.9
19.0
12.8
D1 DD1 R1A C7A C7B C8
81.0
57.8
78.4
89.0
80.986.9
D1 DD1 R1A C7A C7B C8

61
3.1.3.2. Study of the Dough Rheology of Flour – Farinograph Analysis
Dough behavior during mixing is determined by using variety of chemical and
instrumental methods, Farinograph is one of them. Following parameters from
Farinograph were helpful in understanding the dough development process.
3.1.3.2.1. FQN
Farinograph quality number is known to predict overall behavior of flour, higher values
represents the hard flour. The Farinograph quality number is directly linked to the
dimensional properties of biscuit such as the high FQN will give low spread ratio of the
biscuit.
a. FQN in flour from Break rolls milling passages
Very high FQN was reported in streams from break roll except on 1st break where only 23
FQN was received. The streams from other break passages showed and confirmed the
production of hard flour and provided strong dough making ability of flour.
Figure 40: FQN in flour from break streams
b. FQN in flour from Semolina passages
Almost every stream showed softness in dough except the fine semolina C2C. FQN values
i.e. 25, 26 and 27 were reported in C1A, C2A/B and C3A respectively. It stated that
semolina streams produced flour of low FQN in comparison with flour from break rolls.
Low FQN in semolina streams suggesting that softest flour was achieved in pure
23
155 154
122110
1st Break 2nd Break 3rd Break 4th Break 5th Break

62
endosperm part of the wheat grain or might be low ash content contributed to the
softness with respect to the FQN value.
Figure 41: FQN in Flour from semolina streams
c. FQN in flour from Semolina overtail passages
Very low FQN in C1B was reported. It is a first stream of semolina overtail of purifier. Rest
of the streams were produced middle range of FQN around 67 to 74.
Figure 42: FQN in Flour rom semolina overtail streams
d. FQN in flour from Middling passages
Low (22) to high (100) FQN were observed in middling passages. Half of streams
contained FQN in lower side whereas FQN was increased as grinding proceeded.
25
98
27 26
Coarse - C1A Fine - C2C Fine - C2A/B Fine - C3A
9
67
74 74
C1B C4 C5 C6

63
Figure 43: FQN in flour from middling streams
e. Conclusion:
High FQN flour was produced in break stages whereas low FQN was produced by
semolina streams.
3.1.3.2.2. Water absorption
It is an important parameter in dough making process suggesting changes in flour
behavior. High WA% is required in pasta and bread making process whereas low WA% is
the required for biscuit and cake. The WA is closely associated to ash and damaged starch
present in the flour.
a. Water absorption in flour from Break rolls passages
Water absorption was increasing as wheat was further ground. Very low water
absorption was the result of having low content of damaged starch, protein and ash
content in the flour streams. The WA was gradually increased in 5th break from 53.2% to
66.6%. However a constant increase in water absorption was observed.
27 2922
88
100
47
D1 DD1 R1A C7A C7B C8

64
Figure 44: Water absorption % in Flour from break streams
b. Water absorption in flour from Semolina passages
The percent of water absorption was ranged from 58.6% to 69%, while the lowest value
in stream of break roll which was 53.2% while in semolina streams it was recorded as
62.2% for the first stage passage (coarse semolina). In fine semolina passages, WA was
reported as 58.6% which then increased up to 67% in further streams. It had clearly
shown that in further processing, flour was getting damaged and would take extra water
in recipe.
Figure 45: Water absorption % in Flour from semolina streams
c. Water absorption in flour from Semolina overtail passages
The stream C1B had low WA as 57% whereas all the overtail streams of semolina had
high WA ranged from 64.8% to 68.3%. The water absorption increased slightly from the
53.256.0
60.162.6
66.6
1st Break 2nd Break 3rd Break 4th Break 5th Break
62.2
58.6
62.4
67.0
Coarse - C1A Fine - C2C Fine - C2A/B Fine - C3A

65
water absorption in break roll and semolina streams, which showed highest values as
66.6% and 67% respectively.
Figure 46: Water absorption % in flour from semolina overtail streams
d. Water absorption in flour from Middling passages
The amount of WA fluctuated within the range of 59.2% to 67.9%. The streams in the
initial stage had low water absorption, however WA raised in the central streams and last
i.e. C8, it again dropped to 59.2%.
Figure 47: Water Absorption % in flour from middling streams
e. Conclusion
The highest and lowest value of WA in streams from break roll, semolina, semolina
overtail and middling recorded as 53.2-66.6%, 58.6-67%, 57-68.3% and 59.2-67.9 %
57.0
68.3
66.064.8
C1B C4 C5 C6
Water Absorption % in Flour Streams from Semolina overtail
60.4
59.2
67.066.1
67.9
63.2
D1 DD1 R1A C7A C7B C8

66
respectively showed an overall increase of 6% from lowest value while an increase of 1-
2% in highest absorption value.
3.1.3.2.3. Dough development time
The dough development time depends on the nature of hardness of the flour, especially
the amount of hydrophilic components of flour. The hydrophilic biopolymers present in
flour include starch bran, proteins and pentosan. The hydration capacity and hydration
rate of the flour are associated with these components. DDT is an indicator that how
much time is required for a flour to form a desired dough. Higher DDT represents the
hard flours and need more water to be absorbed.
a. Dough Development time in flour from Break Rolls passages
Initial two break rolls streams produced low DDT whereas following three streams
required longer time for dough to develop DDT. It might be attributed due to the
inclusion of bran that showed high water absorption.
Figure 48: DDT (min) in flour from break rolls streams
b. Dough Development time in flour from Semolina
The low DDT of 1.5 to 1.9 min was reported in semolina streams. Dough would be
developed early if flour from these streams are to be utilized in biscuit making and saving
of energy required in mixing i.e. cost involved will be reduced.
1.3
2.5
7.1
5.5 5.7
1st Break 2nd Break 3rd Break 4th Break 5th Break

67
Figure 49: DDT (min) in flour from semolina streams
c. Dough Development time in flour from Semolina overtail passages
The C5 passage produced high DDT i.e. 12.9 minutes where as others produced lower
DDT values. Reason for C5 to take longer dough mixing time might be attributed to
distance of rollers in this portion, change in sifter or other reasons for variation in particle
size. However it showed that the flour from C5 should either be recycled or mixed with
semolina or middling streams in the appropriate proportion to suit end quality and to
reduce DDT.
Figure 50: DDT (min) in flour from semolina overtail streams
d. Dough Development time in flour from Middling passages
The dough development time remained almost constant and streams were consistent in
terms of DDT recorded in middling streams. The time for development of dough was the
least i.e. only 1.5 to 1.7 minutes in middling streams.
1.5
1.7 1.7
1.9
Coarse - C1A Fine - C2C Fine - C2A/B Fine - C3A
1.7 2.0
12.9
1.9
C1B C4 C5 C6

68
Figure 51: DDT (min) in flour from middling streams
e. Conclusion
Although not very strong relationship of DDT was found with any other parameter, but
as some association has been found with ash, water absorption and particle size of the
flour, the collective values of the above parameters will reduce the mixing time.
3.1.3.2.4. Dough Stability (DST)
The strength of dough to remain stable is expressed as dough stability, it indicates that
how much a flour after conversion to dough during continuous mixing may hold its
network in native form and prevent the dough from turning to be more fluid. The high
DST represent strong dough made from hard flour. The network holding property against
mechanical shearing if gets prolonged dough will produce an optimal dough.
a. Dough Stability in flour from Break passages
Flour streams in first break produced less stable flour whereas second and third break
produced flour that made highly stable dough. Flour of medium stability was also
achieved. The dough stability was highest as 14.7 min in the 3rd break streams and lowest
1.9 min in the 1st break with a difference of 12.8 min while the average time for the dough
to remain stable was noted as approx. 9.4 min.
1.6 1.6
1.5
1.7 1.7 1.7
D1 DD1 R1A C7A C7B C8

69
Figure 52: DST (min) in flour from break streams
b. Dough Stability in flour from Semolina passages
Very low to medium DST was achieved at this stage ranging from 0.9min to 8.6 min with
and average of 3.8 min. showing that flour needs to be mixed with flour of high DST if
long duration of mixing is required before baking.
Figure 53: DS (min) in flour from semolina streams
c. Dough Stability in flour from Semolina overtail passages
Medium DST was achieved in these streams, values varies from 5.3 min to 8.4 min. The
difference in dough stability among the four stream was less (3 min) as compared to the
stability of other streams 8.3 min.
1.9
13.614.7
9.5
7.5
1st Break 2nd Break 3rd Break 4th Break 5th Break
1.3
8.6
4.5
0.9
Coarse - C1A Fine - C2C Fine - C2A/B Fine - C3A

70
Figure 54: DST (min) in flour from semolina overtail streams
d. Dough Stability in flour from Middling passages
The dough was found to be stable for only a short period of time i.e. for two minutes or
even less in first three streams of middling, later on it remained stable up to 7.7 minutes.
The stability time of dough varies from 1 min to approximately 8 min in various streams
of middling.
Figure 55: DST (min) in flour from middling streams
e. Conclusion
DST was decreasing as ash, particle size, protein and damaged starch were increasing in
the flour. The dough stability time is highly important in control of the process, because
of DST is more than the time required for sheeting, cutting and time taken just before
entering in the oven, than end quality of biscuits will not change throughout baking,
otherwise the last batch of biscuits will be of poor quality.
8.3
7.5
8.4
5.3
C1B C4 C5 C6
1.9 2.1
0.6
6.9
7.7
3.9
D1 DD1 R1A C7A C7B C8

71
3.1.3.2.5. Degree of softening DoS (ICC)
Dough rheology change rapidly during mixing. The DoS after 10 minutes of mixing time
or 12 minutes give certain characteristics of dough related to end quality. It determines
the softness in dough structure that is also visible in SEM microstructure. The value of
higher DoS reflects soft dough, suitable for production of biscuit, cake etc.
a. Degree of softening in flour from Break passages
The DoS in break streams fluctuated widely and did not show any distinct relationship
and as the value range from 23.3 to 71 FU (Farinograph Unit).
Figure 56: DoS (FU) in flour from break streams
b. Degree of softening in flour from Semolina passages
The flour streams from semolina showed that dough prepared from Semolina flours
would have a softer structure than dough processed from flour stream from break roll.
The range (48 FU to 96 FU) as found in the Semolina flour. The DoS between 48 to 96 FU
is suitable for biscuit and cookie.
71.3
27.0
45.0
23.3
60.0
1st Break 2nd Break 3rd Break 4th Break 5th Break

72
Figure 57: DoS (FU) in flour from semolina streams
c. Degree of softening in flour from Semolina overtail passages
Mid-range of DoS (47 to 69 FU) was reported in these streams. The difference of 22 FU
was quite distinct and wide, however it was less than the same difference in FU was
observed in streams from break and semolina.
Figure 58: DoS (FU) in Flour from semolina overtail streams
d. Degree of softening in flour from Middling passages
R1A was found softest among all the streams which produced DoS value as 137,
otherwise mid-range of DoS was reported in the remaining streams.
74.0
48.0
62.5
96.0
Coarse - C1A Fine - C2C Fine - C2A/B Fine - C3A
54.0
69.0
47.049.5
C1B C4 C5 C6

73
Figure 59: DoS (FU) in flour from middling streams
e. Conclusion
Summary of the Farinograph parameters, In general, flour from break rolls were found
to produce soft nature dough. The Farinograph parameters are very helpful in evaluating
the precautions to be taken during mixing to get optimal dough which behaves without
problem in processing.
3.1.3.3. Pasting Behavior of Dough – MVAG
3.1.3.3.1. Maximum hot paste viscosity/Peak viscosity (MV/PV)
Both the MV and PV values are referred in the literature for describing the maximum hot
paste viscosity, however in the present description only MV is used to avoid any
confusion. The flour having high maximum/peak viscosity tends to have high swelling
ability. They can hold high moisture under critical temperature and mechanical strength.
In general soft wheat flours show highest MV as compared to hard flours or durum. The
highest pasting viscosity indicated the high content of starch in wheat flour.
a. Peak/Max. viscosity in flour from Break passages
The MV/PV was found to be decreasing constantly as grinding further proceeded. The
MV as 996 BU was recorded as the highest value of maximum viscosity observed in the
1st break. The slight decrease in max viscosity in later stages may be due to a constant
increase in damaged starch content. The lowest MV as 814 BU was observed in the 5th
break with a difference of 182 BU.
76.0
53.0
137.0
53.0 49.0
72.5
D1 DD1 R1A C7A C7B C8

74
Figure 60: Max. Viscosity (BU) in flour from break streams
b. Peak/Max. viscosity in flour from Semolina passages
It was observed that among the semolina streams maximum viscosities increased from
860 to 1047 BU with a difference of 187 BU although the increase was not constant and
both the fine and coarse streams showed varied value of MV.
Figure 61: Max. Viscosity (BU) in flour from semolina streams
c. Peak viscosity/Max. in flour from Semolina overtail passages
The C4 passage produced the least maximum viscosity of 875 BU, whereas high viscosities
were recorded in rest of the passages. The highest value recorded as 1047 BU was
observed in only either the streams Semolina or Semolina overtail.
996.0947.0 918.0
867.3814.0
1st Break 2nd Break 3rd Break 4th Break 5th Break
958.01047.0 1031.0
860.0
Coarse - C1A Fine - C2C Fine - C2A/B Fine - C3A

75
Figure 62: Max. Viscosity (BU) in flour from semolina overtail streams
d. Peak/Max. viscosity in flour from Middling passages
R1A had the low maximum/peak viscosity, whereas high viscosities were achieved by rest
of the streams. The lower value of MV was recorded in 5th break as 814 BU, in semolina
as 860 BU, in semolina overtail as 875 BU and in middling streams as 848 BU.
Figure 63: Max. Viscosity (BU) in flour from middling streams
3.1.3.3.2. Break Down viscosity (BDV)
The BDV is correlated to the trough viscosity which is also referred as the minimum hot
paste viscosity. The difference between the maximum hot paste viscosity (MV or PV) and
the minimum hot paste viscosity (trough viscosity) is referred as BDV and is calculated
from a pasting curve. The starch granule in the grains get disrupt during holding period
of the viscosity test because the starch is subjected to mechanical shear stress , amylose
to leach out and re arrange itself. This period is closely associated to BDV. Various
1047.0
875.0
1011.5993.5
C1B C4 C5 C6
989.51032.5
848.0
966.0 969.0 959.5
D1 DD1 R1A C7A C7B C8

76
starches behave differently to be stable at this high temperature and shear and are
related to dough spreading during baking. The swelling of starch granules during baking
or heating is related to high value of BDV and MV. Both MV and BDV are associated with
the end quality i.e. puffing and spreading.
a. Break Down viscosity in flour from Break passages
Similarly like MV, BV was also found to be decreasing in break roll streams from 1st break
to the 5th break roll stream. The highest BV was recorded in 1st break as 355.7 BU whereas
lowest recorded in the 5th break as 295 BU, with a difference of 60 BU.
Figure 64: BD Viscosity (BU) in flour from break streams
b. Break Down viscosity in flour from Semolina passages
The breakdown or the BDV values reported in semolina stage varied from 326 BU to
383.5BU with a difference of 59 BU. So maximum value of 355BU from the first break roll
streams was almost maintained in the flour stream from Semolina. The highest value of
385.5 BU in Fine C2A/B was recorded against the lowest value of 326 BU.
355.7335.7
353.3324.5
295.0
1st Break 2nd Break 3rd Break 4th Break 5th Break

77
Figure 65: BD Viscosity (BU) in flour from semolina streams
c. Break Down viscosity in flour from Overtail passages
The breakdown viscosity record showed a difference of 57.5BU. Lowest BD was reported
in C4 i.e. 186BU. Highest reported in C5. The difference in BDV in the semolina overtail
stream was recorded as the highest 204.5BU. This property may be attributed to highest
particle size of the flour.
Figure 66: BD Viscosity (BU) in flour from semolina overtail streams
d. Break Down viscosity in flour from Middling passages
High BDV was reported in all the middling stage streams with minor difference in values.
The highest BDV of 386.0 BU is obtained from Stream DD1 while the stream R1A gave the
lowest value as 308 BU, the difference of only 78 BU.
358.0
370.0
383.5
326.0
Coarse - C1A Fine - C2C Fine - C2A/B Fine - C3A
385.0
186.0
390.5 377.5
C1B C4 C5 C6
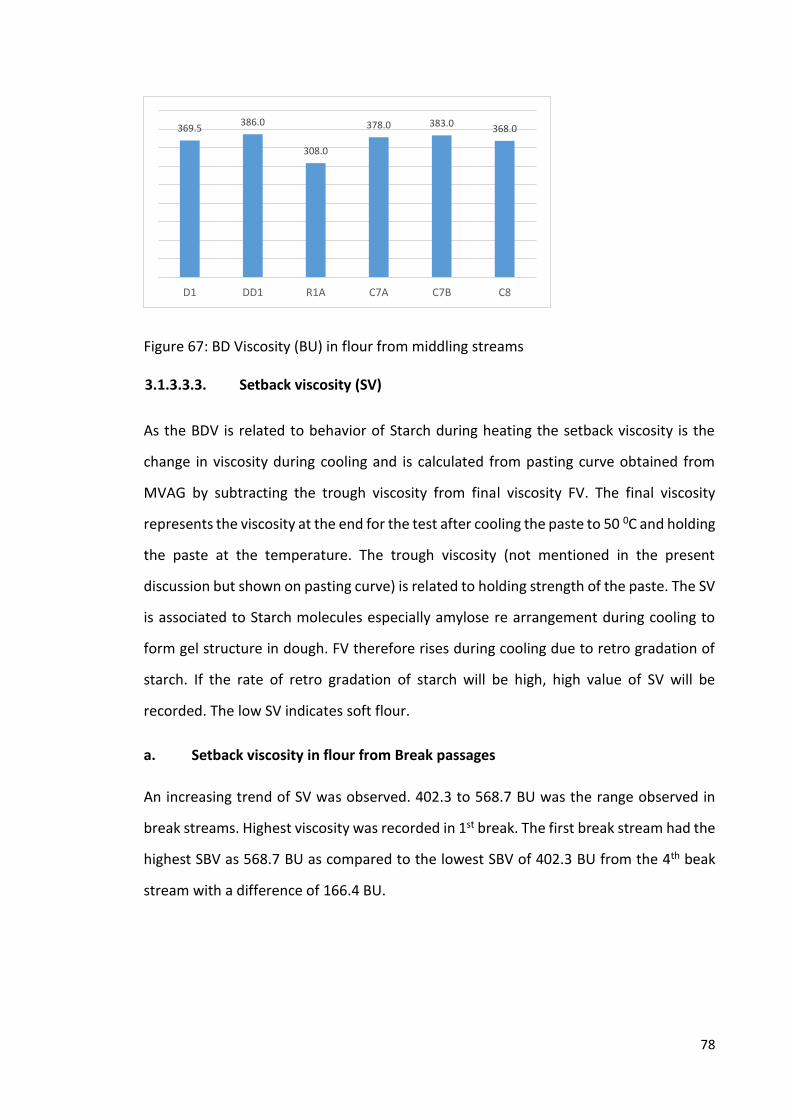
78
Figure 67: BD Viscosity (BU) in flour from middling streams
3.1.3.3.3. Setback viscosity (SV)
As the BDV is related to behavior of Starch during heating the setback viscosity is the
change in viscosity during cooling and is calculated from pasting curve obtained from
MVAG by subtracting the trough viscosity from final viscosity FV. The final viscosity
represents the viscosity at the end for the test after cooling the paste to 50 0C and holding
the paste at the temperature. The trough viscosity (not mentioned in the present
discussion but shown on pasting curve) is related to holding strength of the paste. The SV
is associated to Starch molecules especially amylose re arrangement during cooling to
form gel structure in dough. FV therefore rises during cooling due to retro gradation of
starch. If the rate of retro gradation of starch will be high, high value of SV will be
recorded. The low SV indicates soft flour.
a. Setback viscosity in flour from Break passages
An increasing trend of SV was observed. 402.3 to 568.7 BU was the range observed in
break streams. Highest viscosity was recorded in 1st break. The first break stream had the
highest SBV as 568.7 BU as compared to the lowest SBV of 402.3 BU from the 4th beak
stream with a difference of 166.4 BU.
369.5386.0
308.0
378.0 383.0368.0
D1 DD1 R1A C7A C7B C8

79
Figure 68: SB Viscosity (BU) in flour from break streams
b. Setback viscosity in flour from Semolina passages
The streams from Semolina did not show significant difference in SB values as compared
to the values form Break rolls. The mid-range of SB was observed in the semolina stage.
Figure 69: SB Viscosity (BU) in flour from semolina streams
c. Setback viscosity in flour from Overtail passages
A great variation in SBV was observed in the streams from Semolina overtail as 298.5 BU
as the minimum setback viscosity recorded in semolina overtail of C4. While the highest
SB viscosity 578 BU was observed in Fine C2C with a difference of 268.5 BU.
568.7531.7
508.0
402.3
452.0
1st Break 2nd Break 3rd Break 4th Break 5th Break
496.0
578.0537.0
467.0
Coarse - C1A Fine - C2C Fine - C2A/B Fine - C3A

80
Figure 70: SB Viscosity (BU) in flour from semolina overtail streams
d. Setback viscosity in flour from Middling passages
The minimum SB viscosity as 465 BU whereas high SB viscosity as 547.5 BU were recorded
in middling stage and a difference of only 82.5 BU.
Figure 71: SB Viscosity (BU) in flour from middling streams
e. Conclusion:
The various viscosities i.e. MV, BDV and SBV indicated pasting properties (from the
pasting curve) clearly of the behavior of flour during heating and cooling process. The
study of the pasting curve or more elaborating the viscosities value (MV, BDV, and SBV)
would be very helpful in selection of streams and their inclusion for a particular bakery
product.
567.0
298.5
530.0 512.5
C1B C4 C5 C6
531.5
547.5
465.0
478.0
506.0
521.0
D1 DD1 R1A C7A C7B C8

81
3.1.3.4. Solvent Retention Capacity of Flour Streams
The SRC test is a sum of flour test i.e. SC-SRC, Water SRC, Su-SRC and LA-SRC, indicating
the presence of different components of wheat flour.
3.1.3.4.1. Sodium Carbonate Solvent Retention Capacity - SC-SRC
The SC-SRC predicts the damaged starch level in flour. The higher SC-SRC value indicates
the higher damaged starch contents in flour.
a. SC-SRC in flour from Break passages
It was noted that sodium Carbonate SRC was increasing with the grinding proceeded.
High SC-SRC in the 5th break represented the milling pressure on the grain to produce
flour. Very low i.e. 70% SC-SRC provided by 1st break. It was clearly shown that milling
rollers were constantly grinding the grains to produce more of the damaging starch. The
5th break roll stream produced the highest amount of damaged starch as 97% while the
first break had the lowest value of 70.47% with a difference of 16.6%
Figure 72: SC-SRC flour from break streams
b. SC-SRC in flour from Semolina passages
The high amount of damaged starch (106.93% and 130.37%) was reported in coarse C1A
and fine C3A, respectively whereas fine C2C and fine C2A/B produced mid-range of
damaged starch. Due to coarse particle size distribution in flour as seen in C2C, less
70.47 72.7279.08
83.24
97.07
1st Break 2nd Break 3rd Break 4th Break 5th Break

82
damaged starch was produced in the stream C2C. A different of 43.5% in the percent of
damaged starch was recorded in Semolina streams.
Figure 73: SC-SRC in flour from semolina streams
c. SC-SRC in flour from Semolina Overtail passages
A significant difference in the amount of damaged starch among the four break roll
streams was observed and mid rang of SC-SRC was reported (84.88% to 113.53%). Since
these streams were the overtail of Semolina, thus to have high milling exposure which
ultimately produced high damaged starch.
Figure 74: SC-SRC in flour from semolina overtail streams
106.93
86.92
99.61
130.37
Coarse - C1A Fine - C2C Fine - C2A/B Fine - C3A
84.88
113.53
98.7693.72
C1B C4 C5 C6

83
d. SC-SRC in flour from Middling passages
Similarly line Semolina overtail the streams from middling produced mid to high SC-SRC
Values i.e. 84.84 to 138.7% and a difference in the percentage of damaged starch
recorded was found to be 53.83%.
Figure 75: SC-SRC in flour from middling streams
e. Conclusion
Those streams which were gone through many grinding rolls, producing damaged starch.
In break stages, flour were having less damaged starch as compare to middling and
semolina overtail. Secondly the qualitative difference in the percentage of damaged
among the four categories i.e. break, semolina, semolina overtail and middling that
indicated collectively the increase in damaged starch in the streams
3.1.3.4.2. Water SRC
Gluten, damaged starch, pentosans etc. contributes to the water absorption individually
in flour while W-SRC is a measurement collective capacity of water absorption of the flour
and shows how much these molecules can uphold moisture during mixing. W-SRC value
i.e. the swelling power of flour is directly linked to dimensional and textural properties of
the biscuit.
88.92 84.87
138.70
100.47 101.20 99.98
D1 DD1 R1A C7A C7B C8

84
a. Water SRC in flour form Break passages
Minimum value of W-SRC was found in 1st Break i.e. 61.7% whereas highest value was
reported in 3rd break i.e. 93.77%, a difference of 32.07% was observed. No clear relation
of W-SRC was found with milling mechanics or any other parameters of flour analysis.
Figure 76: W-SRC flour from break streams
b. Water SRC in flour form Semolina passages
Similarly like break streams, in semolina streams no clear relation of W-SRC was
determined with milling parameters. However 71.12% to 154.87% is the range among
the W-SRC values achieved in these passages and a difference of 83.75% was recorded in
the water absorption capacity of the streams in Semolina.
Figure 77: W-SRC in flour from semolina streams
61.70 63.00
93.77
75.06
83.34
1st Break 2nd Break 3rd Break 4th Break 5th Break
128.71
71.12 73.98
154.87
Coarse - C1A Fine - C2C Fine - C2A/B Fine - C3A

85
c. Water SRC in flour form Semolina Overtail passages
Higher to lower W-SRC was reported in these streams. C4 produced the highest water
holding capacity while C6 absorbed only 77.03% water with a difference of 48% W-SRC.
Figure 78: W-SRC in flour from semolina overtail streams
d. Water SRC in flour form Middling passages
Overall lower value of W-SRC was produced in the middling stage. However, minimum
difference of 26.7% was recorded among the flour stream DD1 having the lowest value
of W-SRC (69.89%) and the last stream C8 (96.6%). The water absorption capacity of the
6 streams of middling remained similar to each other and any stream may be selected for
blending if W-SRC is taken as a parameter for the quality evaluation.
Figure 79: W-SRC in 6 flour from middling streams
109.56
126.20
94.70
77.03
C1B C4 C5 C6
75.0269.89
91.1081.93 82.79
96.60
D1 DD1 R1A C7A C7B C8

86
e. Conclusion
Although no significant relation of W-SRC was reported with milling streams. However, it
may be considered that difference in variation of W-SRC values is highest in the flour
streams from Semolina and least among the streams for middling. Great skill will be
required in selection of streams for blending to get the desired optimal composite flour
for biscuit making.
3.1.3.4.3. Sucrose SRC (Su-SRC)
The pentosans and gliadin contents of flour are extracted in sucrose solution. Gliadin
proteins are single chain, low molecular weight proteins which either has single or no
intra disulphide bridges as compared to glutenins having multiple disulphide bridges
making them polymeric proteins of higher molecular weight. Gliadin control viscosity of
the dough and viscoelastic properties are due to both types of the gluten proteins i.e.
gliading and glutamine.
a. Sucrose SRC in flour from Break passages
Mixed trend was observed in Su-SRC values among the flour streams form the break rolls.
On third break stream minimum value of 82.67% was found that suggested that at third
break low amount of pentosanes and gliadin transferred into flour. Whereas 5th break
produced flour of highest S-SRC i.e. 119.62%. The difference of 26.95% was noted.
Figure 80: Su-SRC flour from break streams
91.7197.85
82.67
109.01119.62
1st Break 2nd Break 3rd Break 4th Break 5th Break

87
b. Sucrose SRC in flour from Semolina passages
In Coarse C1A and Fine C3A, S-SRC was found to be the lowest i.e. 78.88%, 88.20% and
highest and 108.65%, 110.48% respectively. The middle passages of Semolina streams
were carrying flour of high S-SRC. Results reflecting that coarse and last passage of fine
semolina has less pentosans and gliadin content.
Figure 81: Su-SRC in flour from semolina streams
c. Sucrose SRC in flour from Semolina Overtail Passages
Flour streams received from C1B passage, had very low Su-SRC and as grinding proceeded
the value increased constantly. 67.12% to 109.9% S-SRC reported in overtail semolina
passages. A difference of 42.78% was observed. The S-SRC values were found to be
increasing constantly and steadily.
Figure 82: Su-SRC in flour from semolina overtail streams
78.22
108.65 110.48
88.20
Coarse - C1A Fine - C2C Fine - C2A/B Fine - C3A
67.12
83.32
97.90
109.91
C1B C4 C5 C6

88
d. Sucrose SRC in flour from Middling passages
Mid to high level of Su-SRC reported in these streams, R1A and C7B are having very high
Su-SRC values 154.5% to 171.42 %. A zig zag shaped variation was observed among the
flour from six streams from middling, 97.97% as the lowest while 171.42% as the highest
value. A vast difference of 73.45% was recorded.
Figure 83: Su-SRC in flour from middling streams
e. Conclusion:
In general it is observed that the passages which are obtained after going through many
rollers, usually produced flour of high Su-SRC. Dough prepared from such flours will show
high viscosity.
3.1.3.4.4. Lactic Acid Solvent Retention Capacity - LA SRC
LASRC is more closely related to the concentration of high molecular weight glutenins
that are positively related to bread loaf volume (LV). However, they are inversely related
to biscuit dimensional properties. It has been observed earlier that higher values of
glutinins produce biscuit of reduced diameter in view of the high elasticity of dough
(Wieser and Kieffer, 2001, Wieser et al, 2003).
a. LA-SRC in flour form Break Passages
A range of 72% to 94% was attained during break stage. On 1st break minimum value of
72.15% achieved whereas higher value of 94.13% was achieved in 5th break. A difference
111.31101.81
154.50
112.46
171.42
97.97
D1 DD1 R1A C7A C7B C8

89
in first LA-SRC value i.e. first and 5th streams was recorded as 21.98%. LA-SRC was
increased with grinding proceeded further.
Figure 84: LA-SRC (%) in flour from break streams
b. LA-SRC in flour form Semolina passages
In coarse semolina flour stream C1A, LA-SRC was found on higher side. Whereas in fine
semolina flour streams LA – SRC was increased with further grinding. Highest LA-SRC as
101.94% and 97.03% was reported in from last semolina streams. Coarse – C1A and Fine
– C3A were the streams which produced flour of higher LA-SRC value that would produce
biscuits of increased diameter. The lowest LA-SRC value was recorded in fine C2C stream.
Figure 85: LA-SRC in flour from semolina streams
72.15 74.39
85.7289.68
94.13
1st Break 2nd Break 3rd Break 4th Break 5th Break
97.03
78.04
90.25101.94
Coarse - C1A Fine - C2C Fine - C2A/B Fine - C3A
LA-SRC in Flour Streams from Semolina

90
c. LA-SRC in flour form Semolina Overtail passages
C1B was found to have low LA-SRC i.e. 78.96%, whereas the other streams form semolina
overtail produced similar values as 93.34%, 93.72% to 97% LA-SRC. The reason of C1B
was due to the less grinding exposure of stream as compared to rest streams. A
difference of 18.48% was recorded in these passages.
Figure 86: LA-SRC in flour from semolina overtail streams
d. LA-SRC in flour form Middling passages
LA-SRC varied differently in all the 6 flour streams. DD1 to have lowest LA-SRC that was
78.39%. In middling streams and highest value as 107% recorded with a difference of
28.6%.
Figure 87: LA-SRC in flour from middling streams
78.96
97.4493.34 93.72
C1B C4 C5 C6
85.9578.39
107.00
95.59 99.3493.14
D1 DD1 R1A C7A C7B C8

91
e. Conclusion
In general, LA-SRC was found to have good relationship with different streams during
milling. In start of milling, LA-SRC was found in lower side. As milling proceeds further, it
increased and came to almost constant value.
The overall lactic acid SRC values in all the four streams i.e. break roll, semolina, semolina
over tail and middling were quite less as 21.98%, 23.9%, 18.46% and 28.61% respectively
indicated that the quantity of higher molecular weight proteins i.e. glutenins becomes
similar in each streams and any of the stream may be selected for blending purposes of
glutenins is taken as a parameter for evaluating flour quality.
3.1.4. Conclusion (Overall)
It was observed that each test was quite significant in evaluating the quality of flours from
different streams. The overall results showed fluctuation in values of various streams.
Such variations are significant for millers in choice of selection of stream for blending to
produce composite flour. The SRC values for composite flour for biscuit, bread, pasta etc.
have wide difference and must be considered at both the ends i.e. miller and bakers
before dispatching the flour for specified purpose.
Study has revealed that the milling is not so simple, it produce different quality of flour
from same mill type. Extensive working is required to fulfil the customer’s requirement
(quality and quantity of flour) and also a close working relationship is essential between
millers and bakers to produce the desired end quality of the product.

92
3.2. Comparative analysis of physiochemical and dough rheological
properties of break and reduction streams and its impact on the quality
of cookie.
3.2.1. Foreword of the study
Presently the discussion is focused to explore the impact of chemical and physical
parameters to evaluate the characteristics of 20 streams (break 6, reduction 14) related
to the behavior of viscous mass (dough) and end quality of biscuit.
3.2.2. Material and Method
Please refer to chapter 2 for detail description of the methods, however only specific
material and method related to the topic are discussed here.
3.2.2.1. Material
Soft wheat was commercially milled to flour at Garibsons Private Ltd. Port Qasim
Industrial Area, Karachi. Total 20 flour streams were collected i.e. 6 samples of break
streams and 14 samples of reduction streams for the study.
Analytical grades reagents/chemicals were used procured from the distributor of Sigma
Aldrich (Germany) in Pakistan, Labline Pvt. Ltd.
3.2.2.2. Biscuit Preparation
The dough was prepared by mixing all ingredients as per recipe mentioned in table 5. First
emulsion was prepared by mixing all the ingredients except flour in Kenwood Mixer, UK
at a speed of 40 rpm for 1 min, and then flour was added and mixed at 25 rpm for 1:30
minutes to develop the dough. The dough was sheeted and cut using circular mold of 50
mm diameter. Biscuits were baked in oven (Nardi, Italy) at 205°C for 8 minutes with
heating coils fixed both at the top and the bottom ends.

93
Table 5: Recipe of cookie to evaluate the effect of different milling streams
Ingredients Quantity
(gm)
Flour 500
Sugar 150
Invert Syrup 8
Vegetable Fat 120
Skimmed Milk Powder 8
Ammonium bi Carbonate 5
Baking Powder 1
Salt 3
Lecithin 0.5
Water 62
3.2.3. Result and discussion
3.2.3.1. Comparative analysis of physicochemical parameters in break and
reduction streams
The parameters of physicochemical analysis changed as the milling process proceeded.
The water in flour, quality of particles and total proteins changed, and moisture was
reduced from 14.62% (B streams) to 12.43% (R streams). The decrease in moisture is due
to two reasons (1) the surface area of flour particle was increased thus evaporation was
more. (2) Secondly mechanical heat was generated as milling continued. The particles
were getting finer and finer a the milling process proceeded, larger particles of 125
micron or above contributed to 42.25% of the total break streams, however only 13.22%
of the particles of this size were produced in break streams resulting in production of
more refined flour in reduction stream than the break stream.

94
Figure 88: Moisture, protein, particle size, bottom and damaged starch content of Break
and Reduction passages.
It was demonstrated that damaged starch will increase with reduction in particle, size
and decrease in moisture level that is why wheat tempering is necessary if fine particle
size of flour is desired.
3.2.3.2. SRC analysis
The Na2CO3 absorption is less in B streams (86.23%) than in R-Streams as 103.86%, this
indicated indirectly the volume during swelling and is a partial measure of DS. Various
streams produced different amount of DS (Damaged Starch) that clearly shows the need
of great skill required in blending the streams to produce the optimal flour (Ali et al,
2014).
Sucrose SRC which represents the presence of pentosans and gliadins and was not very
significantly correlated in the passages. The pentosans content of flour may vary in milling
streams. Pentosans mainly the arabinoxylans (AX) are the integral part of bran are found
in larger amount in starch tailing because of inclusion of bran that causes an increase in
dough density and viscosity affecting the end quality of biscuits. The dough absorbs more
water and biscuits become heavier, reduced in size and of tough texture.
14.6210.65
42.25
57.23
17.8812.43 10.72
13.22
86.52
23.36
Moisture (%) Protein % 125 µm Bottom Damaged Starch(UCD)
Break Streams Reduction Streams

95
Lactic acid absorption was found low in B streams versus R streams which is associated
to the polymeric part of gluten i.e. glutenin. As already discussed (Liu et al, 2015) it
represents the linkages between gliandins and glutenins i.e. HMW proteins are increased
during milling process represented by the Lactic acid solvent retention capacity test and
WA (water absorption) test by Farinograph. All the flour streams values of SRC test
increased during size reduction i.e. in reduction streams.
Figure 89: Variation in SRCs in two types of milling streams
3.2.3.3. Farinograph parameters
The results of comparative analysis results from Farinograph for B and R streams were
reported in fig. 90. Farinograph Quality Number (FQN) is a parameter associated with
overall dough strength that remained almost constant. Water absorption capacity of
reduction stream was higher being 64.86% as compared to the WA capacity of break
passages (56.25%). Flour functionality in product making is not depended only on the
presence of water loving pioplymers but at the same time it also counts that how much
water is added and also the amount of other ingredients including sugar, sugar syrup in
pre salt dough and many other additives. The issues faced by the baking industries such
as the heavy weight, size, density, appearance (shape, color, surface hair lines) may be
solved by introducing appropriate milling and blending (Rogers et al, 1993).
86.23
74.95
104.32
80.00
103.86
92.73
111.29
94.68
Sodium Carbonate Water Sucrose Lactic acid
Break Streams Reduction Streams

96
Dough development time was increased in reduction stage that was because of the
increase in Lactic acid SRC (more HMW gluteneins). Large quantity of HMW-gltuenins
are responsible for increased values of water absorption, dough development time and
L-SRC making dough hard and resistant as shown by the stable dough. Dough Stability
in R-streams (4.5min) represented increased values than in B streams (4.25 min). The
flour streams obtained from B-Streams have more DoS as 89.00FU against the DoS values
from R streams (68.93 BU). Flour from break streams is preferred for biscuit making.
The flour components determine the behavior of dough in processing which change
according to seasonal changes. Water stress during dry weather (drought) affect the
weight of grain, crude protein and its nutritional quality (Noorka et al, 2009 and Ahmad
et al, 1999).
Figure 90: Farinograph Analysis of milling streams
3.2.3.4. Micro Visco-Amylo-Graph
Higher Gelatinization temperature was found in break streams 59.97 0C as compared to
reduction streams (89.32 0C). Due to high damaged starch contents in the reduction
streams because gelatinization took place at high temperature. Similarly like
gelatinization temperature, max viscosity was higher in reduction streams 965.5 BU as
compared to break streams 733.33 BU. High damaged starch production and inclusion of
48.83
504.83
56.25
3.15 4.23
89.00
52.86
496.14
64.86
3.31 4.50
68.93
FQN Consistency WA(%) DDT (min) DS (min) DoS (ICC)
Break Streams Reduction Streams

97
pentosans in break streams were responsible for increase in peak viscosity. No significant
impact was evident in breakdown viscosity between these two types of streams. Higher
setback viscosity 510.86BU than the break streams were observed in reduction streams
because the amylose and amylopectin molecules are separated and other flour
molecules are reduced so they rejoin each other easily to raise the viscosity. Amylose
amylose reunion i.e. retrogradation of starch takes place to make the dough more
viscous. Flour from these streams will produce tough textured biscuit.
Figure 91: Milling streams on Visco-amylo-graph Parameters
3.2.3.5. Glutomatic Parameters
Gluten index was found higher in break streams as 95.67% as compared to reduction
streams i.e. 87.36%. In reduction streams most purified flour was extracted for final
product thus showed higher gluten value 8.71%. In break stage, low gluten content was
achieved as 6.87%. Due to inclusion of bran in later stages of break streams, overall gluten
content in flour were changed. Dry gluten and wet gluten showed similar values because
only water was evaporated during drying otherwise the protein content of flour and the
dough were same.
59.97
733.33
351.83380.17
89.32
965.50
367.43
510.86
Gelatinization Temp.°C Max Viscosity (BU) Breakdown (BU) Setback (BU)
Break Streams Reduction Streams

98
Figure 92: Milling streams on Glutomatic Parameters
3.2.3.6. End quality evaluation
Previously investigated (Charun et al, 2000) that showed the correlation of
physical/chemical parameters of the flour from two different set of streams to dough
rheology and the end quality of biscuits. Some correlation between the cookies factors
(diameter/thickness) and water absorption capacities of the flours from different type of
streams (break and reduction) was observed and reported in table 6.
The 1st break was found to consist less WA than in two reduction roll i.e. 7 and 11, which
produced cookies of reduced diameter and high in thickness
The study is confirming that blending of streams must be conducted after going through
carefully the physicochemical characteristics of flour from various streams to get the
desired product.
95.67
6.87
20.08
87.36
8.71
26.46
Gluten Index Dry Gluten Wet Gluten
Break Streams Reduction Streams

99
Table 6: End Quality Analysis
Sample
Name
Water
Absorption Diameter Thickness
Cookie
Factor
BR – 1 50 49.5 6.1 8.11
RR – 7 67.9 47.1 6.3 7.48
RR – 11 59.5 48.3 6.2 7.79
3.2.4. Conclusion
The milling procedure involves in the development of various flour types like BR and RR
differing in their chemical composition which predicts the dimensional qualities of biscuit
as described in this study. Further, another important technical procedure of blending
the streams which needs qualified personals who can understand and assess constant
changes occurring in the composition of streams as the milling proceeds. The
characteristics related to biscuit depend on the presence of certain components, i.e. their
quality generated by including some particular type of flour due to blending that modified
the chemical properties of streams taken in suitable proportion.
The studies have emphasized the need of strong and solid coordination, relationship and
collaboration among farmers, flour producers (millers) and manufacturers (bakers) to
produce the optimal wheat to get the required quality of flour streams. Actually the
baked product manufacturer is to convey the message to millers about the characteristic
of flour they need for processing their products.

100
4. CAHPTER: SOLUTION OF INDUSTRIAL PROBLEM
4.1. To study wheat available in Pakistan suitable for soft product.
Identification of optimum level of damaged starch along with other
physicochemical properties for the soft dough.
4.1.1. Foreword of the study
Wheat is not well categorized in Pakistan with respect to its end use i.e. for biscuits,
cookies, cakes, breads and pasta etc. Usually, the end users of flour like baking industries
face many difficulties in getting suitable quality of the flour for production of their
products. Soft dough products are very critical in handling, numerous problem trouble
shooting are experienced if flour quality is not up to the mark with results that industries
have no options but to reject the flour supply.
The present study is based on to identify best wheat variety for production of cookies
and to further evaluate flour quality to pick the critical parameter which is actually being
neglected in cookies production.
4.1.2. Material and Method
Please refer to chapter 2 for detail description of the methods, however only specific
material and method related to the topic are discussed here.
4.1.2.1. Material used in the study of wheat variety
All local and imported flour suppliers of EBM were included in this study. Study was
carried out for the period from October 14 to June 15.
1. Garibsons Pvt Ltd, Karachi, Sindh, 2. Masoom Flour Mill, Karachi, Sindh, 3. Qandhari
flour mill, Karachi Sind, 4 Matiari Roller flour mill, Matiari, Sindh and imported source
Nowrangroy, India were selected for flour analysis and its impact on processing i.e. line
behavior, whereas only the wheat samples provided from our local suppliers i.e.
Garibsons, Masoom and Qandhari were also analyzed.

101
The entire study was conducted at the Centre of Excellence (COE) laboratory at English
Biscuit Manufacturers Pvt. Ltd. Karachi, Pakistan.
4.1.2.2. Identification of Wheat Source
Wheat flour suppliers (millers) provided all the basic information about wheat source and
flour on a sheet at paper that is called certificate of analysis (COA). Table 7 showed the
collective information of wheat sources for the fiscal year (Jul 2014 to Jun 2015).
- Garibsons maintained their supplies from only one source that is Mirpurkhas.
- In November 2014, Garibsons utilized partially Ukraine wheat which later on was
replaced with local source as per our instruction.
- Nawabshah was the local source for Masoom.
- Matiari flour was utilized in April and May 2015; they used wheat from variety of
source located in Sind.
- Nowrangroy an Indian source, they used their own wheat and didn’t share the
exact location.

102
Table 7: Month wise wheat source utilized by flour suppliers.
Month Masoom Garibsons Qandhari Nowrangroy Matiari
July Nawabshah Mirpurkhas Dadu and Its surrounding - -
August Nawabshah Mirpurkhas Dadu and Its surrounding - -
Sep Nawabshah Mirpurkhas Dadu and Its surrounding - -
Oct Nawabshah Mirpurkhas 50% U, 50% (Dadu,
Larkana and Nawabshah) Indian
-
Nov
80 NS , 20
Ukraine, later
on 100 NS
Mirpurkhas 50% U, 50% (Dadu,
Larkana and Nawabshah) Indian
-
Dec Nawabshah Mirpurkhas 50% U, 50% (Dadu,
Larkana and Nawabshah) Indian
-
Jan Nawabshah Mirpurkhas 50% U, 50% (Dadu,
Larkana and Nawabshah) Indian
-
Feb Nawabshah Mirpurkhas Sanghar Indian -
March Nawabshah Mirpurkhas Sanghar - -
April Nawabshah Mirpurkhas Sanghar
-
Sindh
(Mixed
Location)
May Nawabshah Mirpurkhas Sanghar
-
Sindh
(Mixed
Location)
Jun Nawabshah Mirpurkhas Sanghar - -
4.1.2.3. Testing of Wheat Samples in Centre of Excellence (COE- A lab used for
research in EBM).
Wheat samples provided by suppliers were analyzed on monthly basis through
KERNELYZER as this was one of the facilities for wheat testing at COE. The wheat was
analyzed for determining the following factors,
i. Protein
ii. Moisture
iii. Gluten
iv. Zeleny

103
Furthermore, few physical tests on wheat were also conducted as listed below,
i. Avg. weight of wheat kernel
ii. Avg. diameter of wheat Kernel
iii. Avg. length of wheat kernel
4.1.2.4. Physicochemical analysis of Flour
Sample from each flour supplies received from all sources were drawn and analyzed for
the following parameters,
i. Moisture Content %
ii. Gluten Content %
iii. Gluten Index
iv. Ash %
v. Particle size analysis (on 160µm, 125 µm and Bottom)
vi. Damaged Starch Content
vii. Farinograph analysis
4.1.3. Result and Discussion
4.1.3.1. Physical Analysis of wheat
- Wheat from Mirpurkhas had the largest length and smallest diameter of the
kernel.
- Nawabshah wheat was second in the smallest diameter after Mirpurkhas.
- Imported wheat from Ukraine had smallest length, and lowest weight.
4.1.3.2. Instrumental Analysis of wheat
- Highest protein content (13.53%) was reported in mixed wheat (Dadu, Larkana
and Nawabshah) provided by Qandhari whereas lowest (11.93%) was reported in
Sanghar wheat.
- Highest moisture content (10.88%) was reported in Nawabshah wheat whereas
lowest (9.81%) reported in Mirpurkhas wheat.

104
- Highest gluten content (22.33%) was reported in mixed wheat (Dadu, Larkana and
Nawabshah) whereas lowest (20.42%) reported in Sanghar wheat.
Table 8: Instrumental analysis of wheat (Source wise).
Supplier Source Protein% Moisture (%)
Gluten Zeleny
Masoom Nawabshah 12.78 10.88 21.67 35.22
Garibsons Mirpurkhas 12.23 9.81 22.07 34.07
Qandhari Sanghar 11.93 10.78 20.42 41.33
Qandhari Dadu, Larkana and Nawabshah
13.53 10.19 22.33 28.42
Imported Ukraine 12.31 10.8 21 37.75
Table 9: Physical analysis of wheat (Source wise).
Supplier Source Weight (gm)
Diameter (mm)
Length (mm)
Masoom Nawabshah 2.88 2.83 5.9
Garibsons Mirpurkhas 2.42 2.68 6.13
Qandhari Sanghar 2.87 3.02 6.08
Qandhari Dadu, Larkana and Nawabshah
2.18 3.12 5.99
Imported Ukraine 2.08 2.88 5.56

105
Figure 93: Instrumental and physical analysis of wheat (Source wise)
4.1.3.3. Physicochemical analysis of flour
a) Moisture Content
Trend of high moisture content was observed in Nawabshah (Masoom), Dadu and its
surroundings (Qandhari) and Indian source. Whereas lowest moisture content was
observed in Matiari flour. Rest of the samples maintained the moisture level from
13.5 to 14%.
b) Ash Content
Ash content was found below specification max. limit (0.5%).
c) Gluten Index
Lowest GI was observed in Matiari which has lowest ash as well, however it had high
DG. Please note that Matiari provided their supplies on April and May, in these
months low GI trend was observed in all supplies.
0.00
5.00
10.00
15.00
20.00
25.00
30.00
35.00
40.00
45.00
Nawab Shah
Mirpurkhas
Sanghar
Dadu, Larkana andNawabshah
Ukraine

106
d) Gluten Content
Mirpurkhas wheat provided low gluten content flour whereas Matiari was highest
among all. All suppliers except Matiari followed specification defined for soft range
of flour. (7-8.5%).
e) Particle Size
Before mid of November 14, larger particle size flour (3%) were allowed in our specs,
then gradually we shifted towards finest particle size. Indian flour and Matiari flour
provided their flour on finest side.
f) Damaged Starch
Trend of low damaged starch content in observed in Matiari flour, Mirpurkhas,
Nawabshah, whereas all sources provided from Qandhari were reported on higher
side. Whereas Indian source had high level of damaged starch.
4.1.3.4. Farinograph
There is no such clear trend observed in any flour sources from different Farinographic
parameters, remained constant during testing.
Table 10: Moisture, Ash and Gluten analysis
Supplier Source Moisture Ash (%) GI DG
(%)
Garibsons Mirpurkhas 13.78 0.43 83.14 8.03
Masoom 80 NS , 20 Ukraine, later on 100 NS 14.24 0.42 89.94 8.26
Masoom Nawabshah 13.93 0.42 79.24 8.31
Qandhari Dadu and Its surrounding 14.08 0.32 73.86 8.22
Qandhari
50% U, 50% (Dadu, Larkana and
Nawabshah) 13.64 0.41 92.17 8.23
Qandhari Sanghar 13.78 0.34 74.24 8.23
Matiari Interior Sindh 13.31 0.30 62.27 9.08
Nowrangroy Indian 14.16 0.40 85.23 8.37

107
Table 11: Particle size and damaged starch analysis
Supplier Source 160 µm 125 µm Bottom Damaged
starch (UCD)
Garibsons Mirpurkhas 1.91 20.30 78.28 21.49
Masoom 80 NS , 20 Ukraine, later on 100 NS 2.97 26.66 81.23 21.33
Masoom Nawabshah 1.14 26.67 72.19 22.07
Qandhari Dadu and Its surrounding 0.67 20.66 78.66 NA
Qandhari
50% U, 50% (Dadu, Larkana and
Nawabshah) 0.83 20.31 81.16 23.34
Qandhari Sanghar 0.63 15.92 83.46 25.99
Matiari Interior Sindh 0.18 24.43 75.39 19.90
Nowrangroy Indian 0.29 16.48 84.03 24.73
Table 12: Farinographic analysis of flour samples
Supplier Source DDT
(min) DS (min) WA (%) FQN
DoS
(ICC)
Garibsons Mirpurkhas 2.17 5.51 59.01 57.09 85.98
Masoom
80 NS , 20 Ukraine, later on
100 NS 2.19 5.61 58.11 49.57 82.72
Masoom Nawabshah 2.86 5.12 59.24 55.64 88.81
Qandhari Dadu and Its surrounding 3.40 6.36 59.71 76.04 86.23
Qandhari
50% U, 50% (Dadu, Larkana
and Nawabshah) 2.19 6.34 59.14 64.00 75.63
Qandhari Sanghar 2.90 5.27 61.61 59.88 91.94
Matiari Interior Sindh 3.65 4.85 64.22 59.93 90.36
Nowrangroy Indian 2.21 7.70 61.59 69.79 56.03

108
Figure 94: Moisture, Ash and Gluten analysis
Uk/U Ukraine, NS Nawabshah
Figure 95: Particle size analysis (%)
Uk/U Ukraine, NS Nawabshah
0.00
10.00
20.00
30.00
40.00
50.00
60.00
70.00
80.00
90.00
100.00
Moisture Ash (%) GI DG (%)
Mirpurkhas
80 NS , 20 Uk
Nawabshah
Dadu and Itssorrounding
50% U, 50% (Dadu,Larkana andNawabshah)Sanghar
Interior Sindh
Indian
0.00
10.00
20.00
30.00
40.00
50.00
60.00
70.00
80.00
90.00
160 µm 125 µm Bottom
Mirpurkhas
80 NS , 20 Uk
Nawabshah
Dadu and Its sorrounding
50% U, 50% (Dadu, Larkanaand Nawabshah)
Sanghar
Interior Sindh
Indian

109
Figure 96: Farinographic analysis of flour samples
Uk/U Ukraine, NS Nawabshah
Figure 97: Damaged Starch in various flour samples
Uk/U Ukraine, NS Nawabshah
0.00
10.00
20.00
30.00
40.00
50.00
60.00
70.00
80.00
90.00
100.00
DDT(min) DS(min) WA(%) FQN DoS (ICC)
Mirpurkhas
80 NS , 20 Uk
Nawabshah
Dadu and Its sorrounding
50% U, 50% (Dadu, Larkanaand Nawabshah)
Sanghar
Interior Sindh
Indian
21.49 21.33 22.0723.34
25.99
19.90
24.73
0.00
5.00
10.00
15.00
20.00
25.00
30.00
Mirpurkhas 80 NS , 20 Uk Nawabshah Dadu and Itssorrounding
50% U, 50%(Dadu, Larkana
andNawabshah)
Sanghar Interior Sindh Indian
Damaged Starch (UCD)
UCD

110
Figure 98: Trend of damaged Starch supplier wise (Numeric values on X axis shows the
month i.e. 1 Jul)
4.1.3.5. Observation of line behavior of flour on production lines
Following production lines were processing soft product,
i. Line 3
ii. Line 4
iii. Line 5
Table 13: Line observation of flour. (Numbers mentioned in bracket after source name
indicating rating of line behavior for the month)
18
19
20
21
22
23
24
25
26
27
28
4 5 6 7 8 9 10 11 12
Damaged Starch
Garibsons
Masoom
Qandhari
Matiari
Nowrangroy
Month Masoom Garibsons Qandhari Nowrangroy Matiari
July Nawabshah Mirpurkhas Dadu and Its surrounding - -
August Nawabshah Mirpurkhas Dadu and Its surrounding - -
Sep Nawabshah Mirpurkhas Dadu and Its surrounding - -
Oct Nawabshah (3) Mirpurkhas (2)
50% U, 50% (Dadu, Larkana
and Nawabshah) Indian Source (1) Sindh
Line
# 3
Very less utilization Fat => Less fat up to 4
kg, Ammonia => Nil
Not Utilized in Soft dough
product
Fat => Less fat up to 4
kg, Ammonia => Nil,
Utilized with Garibsons
-

111
4
Fat => Standard,
Ammonia => Nil,
Utilized with
Garibsons
Fat => Less fat up to 2
kg, Ammonia => Nil
Not Utilized in Soft dough
product
Fat => Standard or Less
fat , Ammonia => Nil to
0.1 kg, Utilized with
Garibsons
-
7
Fat => Less fat,
Ammonia => Nil
Fat => Less fat up to 8
kg, Ammonia => Nil,
Utilized with
Nowrangroy
Not Utilized in Soft dough
product
Fat => Less fat up to 8
kg, Ammonia => Nil,
Utilized with Garibsons
-
Nov
80% Nawabshah ,
20% Ukraine, later
100% Nawabshah (2)
Mirpurkhas
(performed better in
later phase) (3)
50% U, 50% (Dadu, Larkana
and Nawabshah) Indian Source (1) Sindh
Line
#
3
Very less utilization
Fat => Standard to
extra, Ammonia => 0.2-
0.3 kg
Not Utilized in Soft dough
product Not utilized
-
4
Fat => Standard or
less fat, Ammonia =>
nil to 0.3 kg
Fat => Standard to
extra, Ammonia => 0.3
kg
Not Utilized in Soft dough
product
Fat => Standard or less
fat, Ammonia => nil to
0.1 kg, utilized with
Masoom
-
7
Fat => Standard,
Ammonia => 0.2 kg Fat => Standard to 2kg
extra, Ammonia => 0.2
to 0.3 kg
Not Utilized in Soft dough
product
Fat => Standard or less
fat, Ammonia => nil,
0.1 and 0.3 kg, utilized
with Masoom and
Garibsons
-
Dec Nawabshah (2) Mirpurkhas (2)
50% U, 50% (Dadu, Larkana
and Nawabshah) Indian Source (1) Sindh
Line
#
3
Fat => less fat,
Ammonia => nil to 0.1
kg
Fat => Standard,
Ammonia => nil to 0.1
kg
Not Utilized in Soft dough
product
Fat => Less fat,
Ammonia => Nil,
Utilized with Garibsons
and Masoom
-
4
Fat => Standard or
less fat, Ammonia =>
nil
Fat => Standard or less
fat, Ammonia => nil
Not Utilized in Soft dough
product
Fat => Standard or less
fat, Ammonia => nil,
Utilized with Garibsons
-
7
Fat => less fat,
Ammonia => 0.4 kg
Fat => less fat,
Ammonia => 0.4 kg
Not Utilized in Soft dough
product
Fat => less fat,
Ammonia => 0.4 kg,
utilized with Masoom
and Garibsons
-
Jan Nawabshah (3) Mirpurkhas (2)
50% U, 50% (Dadu, Larkana
and Nawabshah) Indian Source (1) Sindh
Line
#
3
Fat => Standard fat,
Ammonia => 0.1 kg,
utilized with
Garibsons and
Nowrangroy
Fat => Standard fat,
Ammonia => 0.1 kg,
utilized with Masoom
and Nowrangroy
Not Utilized in Soft dough
product
Fat => Standard fat,
Ammonia => 0.1 kg,
utilized with Masoom
and Garibsons
-
4
Fat => Standard fat,
Ammonia => 0.2 kg Fat => Standard or less
fat, Ammonia => nil
Not Utilized in Soft dough
product
Fat => Standard or less
fat, Ammonia => nil,
Utilized with Garibsons
-
7
Fat => Standard fat,
Ammonia => 0.1 to
0.3 kg, Utilized with
Nowrangroy
Fat => Standard fat,
Ammonia => 0.1 to 0.3
kg, Utilized with
Nowrangroy
Not Utilized in Soft dough
product
Fat => Standard fat,
Ammonia => Nil to 0.3
kg, Utilized with
Masoom and
Garibsons
-
Feb Nawabshah (2) Mirpurkhas (2) Sanghar Indian Source (1) Sindh
Line
# 3
Fat => less fat,
Ammonia => nil to 0.2
Fat => less fat,
Ammonia => nil to 0.2
Not Utilized in Soft dough
product Fat => less fat,
Ammonia => nil to 0.2
-

112
kg, utilized with
Nowrangroy
kg, utilized with
Nowrangroy
kg, utilized with
Masoom and
Garibsons
4
Fat => Standard fat,
Ammonia => 0.3-0.4
Kg
Fat => Standard or less
fat, Ammonia => nil to
0.2 kg, Utilized with
Nowrangroy
Not Utilized in Soft dough
product
Fat => Standard or less
fat, Ammonia => nil to
0.2 kg, Utilized with
Masoom
-
7
Fat => Standard fat,
Ammonia => 0.4 Kg,
utilized with
Garibsons
Fat => Standard fat,
Ammonia => 0.4 Kg,
utilized with Masoom
Not Utilized in Soft dough
product - -
March Nawabshah (1) Mirpurkhas (2) Sanghar (3) Indian Source Sindh
Line
#
3
Fat => Standard fat,
Ammonia => 0.1-0.2
Kg, utilized with
Garibsons
Fat => Standard fat,
Ammonia => 0.1-0.2
Kg, utilized with
Masoom
Fat => Standard fat, Ammonia
=> 0.2 Kg, utilized with
Garibsons
- -
4
Fat => Standard fat,
Ammonia => 0.1 Kg,
In combination with
Garibsons, Fat =>
Standard fat,
Ammonia => 0.2 Kg,
In combination with
Qandhari
Fat => Standard,
Ammonia => 0.3kg
Fat => Standard fat, Ammonia
=> 0.3 Kg, In combination
with Garibsons
- -
7
Fat => Standard fat,
Ammonia => 0.2-0.4
Kg, utilized with
Garibsons
Fat => Standard fat,
Ammonia => 0.2-0.3
Kg, utilized with
Masoom
- -
April Nawabshah (2) Mirpurkhas (2) Sanghar Indian Source Sindh (1)
Line
#
3
Fat => Standard fat,
Ammonia => nil to 0.2
Kg, In combination
with Garibsons
Fat => Standard fat,
Ammonia => nil to
0.2kg
Not Utilized in Soft dough
product -
Fat => Standard fat,
Ammonia => nil to 0.2
Kg, In combination with
Garibsons
4
Fat => Standard fat,
Ammonia => 0.2 Kg,
In combination with
Garibsons
Fat => Standard fat,
Ammonia => nil-0.2 Kg
Not Utilized in Soft dough
product -
Fat => Standard fat,
Ammonia => nil
7
Fat => Standard fat,
Ammonia => 0.5 Kg
Not Utilized in Soft dough
product -
In combination with
Garibsons
May Nawabshah (3)
Mirpurkhas (It
improved in later
phase) (2)
Sanghar (4) Indian Source Sindh (1)
Line
#
3
Fat => Standard fat,
Ammonia => 0.35 Kg
Fat => Standard fat,
Ammonia => nil to 0.2
Kg
Fat => Standard fat, Ammonia
=> nil to 0.2 Kg, utilized with
Masoom
- -
4
Fat => Standard fat,
Ammonia => 0.2-0.25
Kg utilized with
Matiari, Fat =>
Standard fat,
Ammonia => 0.35,
utilized with
Garibsons
Fat => Standard fat,
Ammonia => 0.1 Kg
Fat => Standard fat, Ammonia
=> 0.25 Kg, utilized with
Matiari
-
Fat => Standard fat,
Ammonia => 0.2-0.25 Kg
utilized with Masoom,
Fat => Standard fat,
Ammonia => 0.25 Kg,
utilized with Qandhari
7 In combination with all, 0.5 kg ammonia - -

113
From October onward we started collecting observation of line behavior of flour derived
from wheat source. Fat and leavening agent quantity determine the impact of flour
quality (level of softness) on production lines. Less fat (than standard) and ammonium bi
carbonate (shortly ammonia) quantity less than 0.4 kg represents softness of the flour.
On standard recipe, soft flour will produce low dense dough and ultimately cookies of
reduced weight (than the standard), for hard flour situation becomes opposite. In both
cases wastages are carried out on production lines. Considering the condition, fat or
ammonia is decreased or increased.
Following observations were recorded,
- Most of the time imported source (Ukraine) Maida was used in production of soft
dough product but didn’t perform as desired because of the composition
variations.
- Imported source wheat flour (Nowrangroy flour) behaved extra ordinary soft
whenever it was utilized in Soft dough product
- Matiari flour also behaved soft.
- Garibsons was very consistent providing flour which behaved soft.
- Masoom was little bit inconsistent providing flour especially In May and Jun 15.
4.1.4. Conclusion
Nowrangroy proved to be providing flour from best quality of wheat source, whereas
Mirpurkhas variety provided by Garibsons behaved consistently as soft, Nawabshah
wheat was inferior as compared to the Mirpurkhas wheat variety. Mixed wheat utilized
by Qandhari (Dadu, Larkana, Nawabshah and Sanghar) didn’t behave up to the mark at
Jun Nawabshah (2) Mirpurkhas (1) Sanghar Indian Source Sindh
Line
#
3 Not Utilized in Line 3
Fat => Standard fat,
Ammonia => 0.1 Kg
Not Utilized in Soft dough
product - -
4
Fat => Standard fat,
Ammonia => 0.4 Kg
Fat => Standard fat,
Ammonia => 0.1 Kg
Not Utilized in Soft dough
product - -
7
Fat => Standard fat,
Ammonia => 0.5 Kg,
utilized with
Garibsons
Fat => Standard fat,
Ammonia => 0.5 Kg,
utilized with Masoom
utilized few quantity in Soft
dough product - -

114
the processing line. Ukraine wheat whenever used in combination with our local supplies
was responsible for the hardness in the flour.
If correlating parameters of wheat samples with line behavior, Garibsons (Mirpurkhas)
behaved as softest among Qandhari and Masoom, utilized wheat with large kernel length
(6.13 mm) and smallest diameter (2.68 mm). No other clear correlation found as per
instrumental and physical analysis of wheat.
Finest particle size also proved to be soft, however low damaged starch content were
preferred. On review of data of the whole year, it was found that the flour which had
damaged starch value below 22 UCD, behaved as soft at production lines, as in the case
of Matiari, Garibsons and Masoom. The flour supplies when exceeded the mentioned
limit of DS, it behaved hard in production lines. The Nowrangroy variety performed
differently (having high damaged starch content with fine particle size behaved soft) as
it might be due to wheat source, it was produced in India where processes and wheat
source/nature was different and unknown to us.
Theoretically, low moisture content and high gluten content lead to hard nature of flour,
but it was not true in the case of Matiari, only difference in damaged starch was
significant among all. Matiari recently installed a milling unit that produced finest particle
flour with low damaged starch content.
On the whole it may be concluded that if wheat taken from different location used as in
the case of Matiari flour and the wheat from Mirpurkhas proved as soft wheat following
Nawabshah wheat. However it was not only wheat variety which affected the quality of
flour, it also the amount of damaged starch, particle size and ash etc. that determined
the quality of flour. The milling process if controlled also contributes to the soft or hard
nature of flour.

115
4.2. Dough stickiness and mitigation in product.
4.2.1. Foreword of the study
Dough stickiness is a routine problem faced during production of biscuits, specially
observed in sheeted products. If dough stickiness is resolved immediately or before it
goes to baking unit, wastages may be controlled and company can be benefitted,
4.2.2. Problems Due to Stickiness
Following are the problems due to stickiness,
Scratch bottom
Inappropriate Sheet formation of biscuit
Dimensional variation
4.2.3. Possible factor affecting stickiness of the dough
Dough stickiness is a common problem which may be due to either quality of raw material
or processing methods and parameters. Possible root causes and their mechanisms are
discussed below,
a) Flour Moisture Content
Moisture Content in Flour is directly related to water absorption capacity of flour. Flour
having high moisture content has tendency to have low moisture absorption, if recipe
water is not adjusted according to moisture of flour, extra water will cause stickiness on
dough.
b) Damaged starch and α-amylase activity
Damaged starch is one of the prominent factor for causing stickiness in dough. During
harsh milling of wheat, damaged starch is produced, which increases the availability of
substrate for α-amylase to hydrolyze starch into dextrins and many other degraded
products. Dextrins and sugars have tendency to absorb more water and to cause
stickiness. The high amylase activity will also increase the problem because small

116
molecules will increase in number and therefore will increase the interaction of water
with degraded molecules.
c) Inappropriate Recipe Water/Human Error
It is a normal practice to follow the same mixing parameters and recipe settings for next
flour supplies and not significant variation is performed. If added water in recipe is not
adjusted according to flour analysis report it can cause stickiness or many other
problems.
d) Unbalanced Recipe Design
Performance of any product on Production line is totally dependent on Recipe design and
it needs to be well adjusted. If it is unbalanced i.e. unbalanced fat and water ratio can
produce stickiness on dough.
e) Particle Size of Flour
Flour having small particle size has high surface area, means water has many sites to be
absorbed. Large particle of flour hydrates less. If water is not adjusted keeping particle
size in view, for example large particle absorbs less water than small particle; extra water
in recipe can cause stickiness on dough.
f) Mixing Parameters (Time, RPM etc.)
Mixing time should be adjusted according to flour properties (DDT, DST). Less mixing time
will reduce water absorption and high mixing time can lead to breaking of protein
network. In both cases stickiness can arise on dough.
g) Environmental Factors/Raw material Temperature and physical condition
Temperature of Raw material and environment affect dough rheology and shape
formation in Cutting unit. Very low raw material temperature like Fat, can have some
adverse effect on rheology of dough, as it sticks on feeding roll of Cutting Unit, pushing
strength of rollers reaches on its highest point, so wet weight can’t be increased more.

117
Very low temperatures of environment and ingredients cause improper mixing.
Absorption, solubility of any material is directly related to temperature. Unbounded and
unabsorbed water produces stickiness on dough.
Figure 99: Flow Chart of work plan to rectify the issue
Monitor Temperature Profile (ingredients
and Environment)
Draw Flour Samples and do complete
Testing
After Gathering Significant Data, Make
relation
Conclude Result
Observe Line Performance of Problematic
and non-problematic Products and collect all
possible data

118
Figure 100. Root Cause Analysis/4M’s techniques to identify the root cause
4.2.4. Approach and mechanism to minimize stickiness from sheeted product
After the complete analysis of root causes three main steps were applied in order to
minimize stickiness as follows,
a) Inclusion of left over dough
Left over dough (10%) was added in fresh dough as it was chemically changed dough; all
reaction had already been taken place. It was the enzymatically inactivated dough, no
conversion of starch into dextrin and water was occurred. Less chances of production of
free water was possible in dough. Left over dough was dry on the surface, it absorbed
free water from the recipe and made fresh dough non sticky.
MATERIAL
STICKINESS
METHOD
Ingredients Sequencing
Chilled Water
Mixing Time
MACHINE
Work Force Allocation
MAN
Mixer over heating
Weighing balance
calibration
Oven Profile
(Zones)
Flour
Left over Dough
Temp.
Monitoring
Wate
r
Machine
Room Dough
Water quantity
Cutting Profile
(Sheet rollers)
Additives
Improper ingredients
weighing

119
b) Chilled Water
Chilled water was added to make dough temperature as per required 36 0C. Enzymes
(proteases and amylases) were activated over certain range which was responsible for
production of free water, liquefaction of starch and protein which made dough sticky.
Mixer gets hot with the passage of time, as mixing proceeds temperature increases,
chilled water prevented mixer to produce heat.
c) Some quantity of Fat added in later Phase
Some fat added (15%) in later phases of mixing to grease the dough and improve machine
ability. It decreased dryness of the dough.
4.2.5. Flour analysis parameters for sheeted products
Table 14 shows that Moisture from 14.1 to 14.5 was found to be suitable for sheeted
product whereas slightly higher gluten content was appropriate to control stickiness
problem (9.34 to 9.59%) as compared to other product i.e. cookies (7-8.5%). As per table
2, low moisture absorption flour was suitable for sheeted product.
Table 14: Flour parameters suitable for sheeted product
Moisture and Glutomatic
System
Parameters Min Max
Moisture 14.1 14.5
DG 9.34 9.59
GI 68.84 74.7
WG 28.56 28.61
PG 19.7 21.3

120
Table 15: Temperature ranges suitable for sheeted product
Temperature Range
Temperature Min Max
Dough 35.5 36.5
Chilled Water 18.5 20.5
Tap Water 27 28.5
Table 16: Farinograph parameter suitable for sheeted product
Farinograph
Parameters Min Max
WA 58.2 59.4
DDT 4.2 5.3
ST 6.5 8.1
DoS (10 min) 39 43
DoS (12 min) 43 64
FQN 85 86

121
Figure 101: Crumb generation
4.2.6. Conclusion:
Before project started, crumb generation was higher than 5.1 %, after applying remedies,
crumb generation has gradually decreased up to 3.49%.
4.97%
7.11%
2.98%
3.98%
6.50%
2.68%
5.07%
3.41%3.74%
4.46%
2.52%2.17%
3.93%
0.00%
1.00%
2.00%
3.00%
4.00%
5.00%
6.00%
7.00%
8.00%
Crumb Generation in Whole Wheat Slices
Standard % Actual %

122
5. CHAPTER: FLOUR, QUALITY ASSESSMENT AND ITS TREATMENT
5.1. Wheat flour characteristics of different countries
5.1.1. Foreword of the study
An extensive study on comparative basis was carried out using flour extracted from wheat
of four different locations of three countries (Pakistan, Ukraine and India) with different
ratios.
These wheat were being used in the mills located at Karachi for the production of wheat
flour to be used commercially in baking industry. The baking performance of different
flours differs according to the physicochemical characteristics which consequently govern
the dough rheology and edible properties of the products. It is therefore important that
the physicochemical properties of the flour must be appropriately selected for studies to
govern the entire processing. Varieties of physicochemical parameters were studied that
indicated distinct relationship with dough rheological properties.
5.1.2. Material and Method
Please refer to chapter 2 for detail description of the methods, however only specific
material and method related to the topic are discussed here.
5.1.2.1. Material
Commercially available soft wheat flour was received from Masoom Flour Mills Private
Ltd. Karachi, Garibsons Flour Mills Private Ltd. Karachi, Qandhari Roller Flour Mills Private
Ltd. Karachi and Nowrangroy, Agro Pvt. Ltd. India. Masoom utilized local source of wheat
which was obtained from the Sind i.e. Nawabshah. Garibsons utilized Mirpurkhas wheat,
whereas Qandhari provided flour with mixed wheat i.e. 50% Ukraine and 50%
Mirpurkhas. Total 165 samples of flour were evaluated in the study in which 44 samples
from Nawabshah, 49 samples from Mirpurkhas, 58 obtained by mixing 50% Mirpurkhas-
50% Ukraine and 14 samples from India were included.
5.1.3. Result and discussion
5.1.3.1. Physicochemical Characteristics
The moisture content in flour from all sources varied from 13.9 to 14.4%. The flour

123
produced from Nawabshah wheat had highest moisture content whereas flour blended
from wheat of Nawabshah and Ukraine at the ratio of 50%:50% showed the minimum
moisture level (13.92%). Ash level in all flour samples were found in the range of 0.42 to
0.445% which complied the Pakistan standard for wheat flour to be used in biscuit
manufacturing. Protein content varied between 10.21-10.78% which may be categorized
as soft.
5.1.3.2. Farinograph parameters
The dough development time of flour samples did not show the significant difference.
The higher value of DST was reported in Indian flour as 7.26 min which confirmed the
strong networking of gluten and also held maximum WA. Lowest WA was reported in
Nawabshah wheat flour which also showed reduced DST. It was indicated that DST was
positively correlated to WA, i.e. the high WA will have the high dough stability. The direct
relationship between WA and DST has been reported recently by Diosi and coworkers
(2015).
5.1.3.3. Damaged Starch and Particle size distribution
The Indian wheat flour showed the highest level of damaged starch (25 UCD) whereas
low damaged starch was reported in Nawabshah supplies. The 100% Indian wheat flour
contained more of fine particles whereas Nawabshah wheat had the least amount of
small particle of flour (table 20). The relationship between damaged starch and particle
size is a well-established factor and is confirmed by various other workers (Barak et al,
2014; Kang et al; 2014 and Ali et al, 2014)

Table 17. Physiochemical Properties of different wheat sources
Source and Ratio of Wheat Moisture (%) Ash (%) Protein (%)
100% Local- Nawabshah 14.40 ± 0.31 0.44 ± 0.03 10.61 ± 2.30
100% Local- Mirpurkhas 14.27 ± 0.36 0.44 ± 0.06 10.21 ± 0.17
50% Mirpurkhas- 50% Ukraine 13.92 ± 0.61 0.42 ± 0.07 10.31 ± 0.23
100% Indian 14.04 ± 0.49 0.43 ± 0.03 10.78 ± 0.34
Standard deviation is indicated as ± after the mean value
Table 18: Farinograph Parameters of flour from different wheat sources
Source and
Ratio of Wheat DDT(min) DST(min) WA (%) FQN DoS (ICC)
100% Local-
Nawabshah 2.07 ± 0.89
4.93 ±
2.16
56.48 ±
1.54
44.6 ±
17.78
83.77 ±
14.34
100% Local-
Mirpurkhas 1.83 ± 0.32
5.06 ±
2.50
57.99 ±
1.68
51.38 ±
22.90
84.92 ±
13.10
50%
Mirpurkhas-
50% Ukraine
2.19 ± 1.00 5.79 ±
2.31
58.97 ±
1.23
60.40 ±
25.32
79.40 ±
16.86
100% Indian 1.96 ± 0.33 7.26 ±
2.63
62.04 ±
1.03
60.43 ±
39.20
56.21 ±
15.46
Standard deviation is indicated as ± after the mean value

125
Table 19: Glutomatic properties of flour from different wheat sources
Source and Ratio of
Wheat
Wet
Gluten
(%)
Passed
Gluten
(%)
Retained
Gluten
(%)
Gluten
Index
Dry Gluten
(%)
Water
Retained
(%)
100% Local-
Nawabshah
23.48 ±
1.73
1.89 ±
0.70
21.59 ±
1.62
92.02 ±
2.91 8.13 ± 0.32
15.35 ±
1.60
100% Local-
Mirpurkhas
23.39 ±
0.81
1.97 ±
0.80
21.42 ±
0.61
91.41 ±
3.41 8.03 ± 0.28
15.37 ±
0.65
50% Mirpurkhas-
50% Ukraine
23.77 ±
1.61
1.70 ±
0.72
22.07 ±
1.54
92.79 ±
2.80 8.27 ± 0.27
15.49 ±
1.56
100% Indian 24.38 ±
1.04
2.71 ±
1.13
21.67 ±
0.89
88.86 ±
4.05 8.37 ± 0.18
16.00 ±
0.91
Standard deviation is indicated as ± after the mean value

126
Table 20. Damaged Starch and Particle Size analysis of flour
Source and
Ratio of
Wheat
Damaged Starch Content Particle Size(% Retention)
UCD AACC % Farrand 160 µm 125 µm Bottom
100% Local-
Nawabshah
20.39
± 1.47
5.81 ±
0.39
23.01 ±
2.92
1.50 ±
0.71
23.61 ±
2.54 74.89 ± 2.64
100% Local-
Mirpurkhas
22.5 ±
1.07
6.51 ±
0.49
28.78 ±
3.53
1.00 ±
0.54
19.08 ±
2.53 79.92 ± 2.58
50%
Mirpurkhas-
50%
Ukraine
23.96
± 1.23
7.00 ±
0.48
33.62 ±
3.68
0.89 ±
0.56
17.58 ±
3.96 81.52 ± 4.26
100% Indian 25.0 ±
1.25
7.38 ±
0.49
36.76 ±
4.38
0.38 ±
0.24
16.07 ±
2.09 83.55 ± 2.05
Standard deviation is indicated as ± after the mean value
Figure 102: Effect of Particle size on Damaged Starch content
100% Local-Nawabshah
100% Local-Mirpurkhas
50% Mirpurkhas -50% Ukraine
100% Indian
R² = 0.8678
55
56
57
58
59
60
61
62
63
15 20 25 30
Wat
er
Ab
sorp
tio
n (
%)
Damaged Starch (UCD)

127
Figure 103: Effect of Particle size on Damaged Starch content of Flour
5.1.3.4. Glutomatic proteins of flour from different wheat sources
The Indian wheat flour produced high WG, PG and DG, lowest GI and high water
absorption by proteins in comparison to others, it also showed highest WA from
Farinograph, highest protein contents (table 19) and highest UCD (table 20). It showed
that water held in dough was due to damage starch and gluten as the percentage was
higher. Secondly the results indicated that GI and water had good coordination as both
decreased inspite of the fact that all the Glutomatic proteins increased while dry
Gluten for all flour samples were same.
5.1.3.5. Damaged Starch affecting Water absorption of Flour
It is now a well-established fact that damaged starch is significantly correlated with
water absorption as also confirmed from our result (R2=0.868). High contents of
damaged starch lead to more water absorption as shown in fig. 102. The direct
relationship of damage starch and water absorption has been reported by various
authors from time to time.
5.1.3.6. Particle size affecting Damaged Starch Content
The quantity of damaged starch was highly correlated with the distribution of the
particle size of flour (R2=0.98) as shown in fig. 103 that confirmed the increase in
damaged starch level on fine grinding with same protein level.
100% Local-Nawabshah
100% Local-Mirpurkhas
50% Mirpurkhas -50% Ukraine
100% Indian
R² = 0.9788
74
75
76
77
78
79
80
81
82
83
84
85
15 20 25 30
Par
ticl
e b
elo
w 1
25
mic
ron
(%
)
Damaged Starch (UCD)
128
5.1.4. Conclusion
The quality of flour depends on variety of factors such as it is related to the wheat
sources that governs flour’s composition and also depends on the type of milling and
blending the streams. DS level, wet gluten and particle size were contributed on the
flour water absorption capacity. Indian wheat flour composed of high protein and
lowest ash content and also produced high dough stability, high water absorption and
less degree of softening.
The decreased of damaged starch level was found in the flour obtained from
Nawabshah wheat, whereas Indian wheat produced high level of damaged starch. Wet
and dry gluten were highest in Indian wheat flour whereas Pakistani flours had less
wet and dry glutens. Particle size distribution (0 to 125 micron) was found to be
significantly correlated with damaged starch (R2= 0.98) which consequently was
strongly predictive of high water absorption as indicated from Farinograph (R2=0.87).
Rheological behavior showed high water absorption also would have high dough
stability and less degree of softening as found in Indian wheat flour. Pakistani wheat
(Nawabshah and Mirpurkhas) produced dough of biscuit quality (soft) as degree of
softening was higher as compared to others.
The variety of wheat analyzed in different countries as in Hungary (Diosi et al, 2015),
Korea (Kang et al, 2014), China (Zhang et al, 2007), India (Ram et al, 2004), Egypt (El-
Porai et al, 2013) etc. have all shown relationship of a certain parameter to the baking
performance of flour. Further research is required to establish a useful strategy based
on simple physicochemical analysis of flour for exchange of wheat/flour
internationally.

129
5.2. Prediction of damaged starch by assessing some physicochemical
quality of wheat flour.
5.2.1. Foreword of the Study
The baking ability of flour depends on the amount of damaged starch present in flour.
DS may not necessarily be directly determined as DS but it might be determined
indirectly. DS is also much related to other parameters of four determined by other
techniques. For example AWRC values resenting the amount of protein, insoluble
pentosan and minerals are directly linked to DS, if AWRC values increases the DS will
automatically increase and will result in reduced diameter of the biscuits.
In flour mill of Sindh, analysis lab are not well established to perform damaged starch
test. SDmatic system is used worldwide to analyze the damaged starch and is a very
expensive instrument. The objective of the study is to find out other simple methods
which can predict the level of damaged starch and those simple methods may be
established in all type of labs (advance or basic facility of testing). Some correlation of
DS was also tried to find out with sophisticated equipment, i.e. Farinograph and
MVAG.
5.2.2. Material and Method
Please refer to chapter 2 for detail description of the methods, however only specific
material and method related to the topic are discussed here.
5.2.2.1. Material
Eighteen flour samples of soft wheat (produced for commercial use in biscuit industry)
from four different mills i.e. Masoom Flour Mills Private Ltd., Ghouri Roller Flour Mills
Private Ltd, Qandhari Roller Flour Mills Private Ltd. and Madina Flour Mills Private Ltd.
were included in the study. Numbers after the mill name (first name) represented the
sample number for specific mill.
Analytical grades reagents/chemicals were used procured from the distributor of
MERCK (Darmstadt, Germany) in Pakistan, Labline Pvt. Ltd.

130
5.2.3. Result and discussion
5.2.3.1. Damaged starch versus physicochemical properties of flour
It is well acknowledged among the researchers that damaged starch enhance
absorption of water to the extreme as compared to native starch. The
physicochemical factors of wheat flour is also stated to be affected by water added
during conditioning of wheat which ultimately converts into moisture in flour
(Nooroka et al 2009) but currently it showed the in significant relation between water
and damaged starch (Table 21). It is possible that flour samples included in the study
were milled freshly. Furthermore, the starch granule damaged during the milling of
wheat did not have good opportunity to absorb moisture from environment or low
humid weather condition in Sindh which might cause the in appropriate water
retention in all flour samples. Difference in level of moisture already present in the
wheat kernels might affected damaged starch as it majorly depends on the condition
of milling and other factors of wheat i.e. mineral and gluten proteins. The direct linear
relationship was observed in ash and protein with the damaged starch content of flour
as indicated earlier (Barrera et al, 2007; Keskin et al, 2012 and Colombo et al, 2008).
The firmness and rigidity of wheat grain closely related with ash and protein contents.
Hard kernel produces more damaged starch in comparison with the soft varieties.
Zeleny values found lowered than such values mentioned before (Fargested et al,
1999) which varied between 30-36. Zeleny values represents the sedimentation
capacity of LMW weight proteins and same value is also indicated by LA-SRC. The
hardness of wheat kernel and its size reduction extent are resemble closely to
damaged starch present in flour. Finer flour requires heavy pressure from rollers and
also need prolong milling time producing more damaged starch. The table 21 showed
that the flour samples Madina-1 and Madina-2 comprising 5.1%, 6.8% of its particles
above 160 µm generated less of damaged starch (5.27%, 5.86%) than the other flour
samples from Masoom flour mill and Ghouri flour mill which had 0.5% and 1.5%
particle size distribution above >160 µm resulting 8.12%, 8.58% damaged starch
respectively. It was shown that the particle size of flour was correlated with other
physicochemical characteristics, for example SRC, AWRC, FN (falling number), gluten
proteins and damaged starch (Barak et al, 2012). Fig. 104 showed R2 value of protein
and damaged starch that was 0.451 in flour confirming mild correlation between

131
these parameters. It may be assumed that approximate values of damaged starch are
usually calculated considering other values and routine analysis of damaged starch is
omitted.
Figure 104: Damaged starch vs total protein contents
Table 21: Physicochemical analysis of different flour samples.
Flour Damaged starch,
%
Moisture, %
Ash, %
Protein, %
Zeleny
Particle size
Above 160
µm, %
160-125
µm, %
Below 125
µm, %
Madina 1
5.27 14.9 0.527 10.4 32 5.1 16.6 78.3
Madina 2
5.86 15 0.462 9.7 30 6.8 18.2 75
Qandhari 2
6.11 13.1 0.526 10.8 31 0.7 10.3 89.2
Qandhari 5
6.18 12.8 0.433 10.5 36 1.1 9.2 89.7
Ghouri 2 6.31 13.7 0.466 10.8 35 2.3 18.7 78
Qandhari 1
6.35 13.1 0.508 11.3 33 1.3 10.2 88.5
Ghouri 1 6.41 13.3 0.526 10.6 35 2.8 19.1 78.1
Masoom 2
6.5 14.1 0.568 11.8 34 0.5 11 88.5
Qandhari 4
6.64 13.1 0.527 11.1 33 1.8 12 86.2
Masoom 4
6.76 13.8 0.539 11.8 35 0.7 12.7 86.6
Ghouri 4 6.86 13.3 0.472 10.4 32 4.5 20.5 75
Ghouri 3 6.9 13.6 0.45 11.1 34 5.1 20.4 74.5
Masoom 3
6.96 14.2 0.526 11.5 36 0.9 13.2 85.9
R² = 0.451
9
9.5
10
10.5
11
11.5
12
12.5
0 2 4 6 8 10 12
Pro
tein
(%
)
Damaged Starch (%)
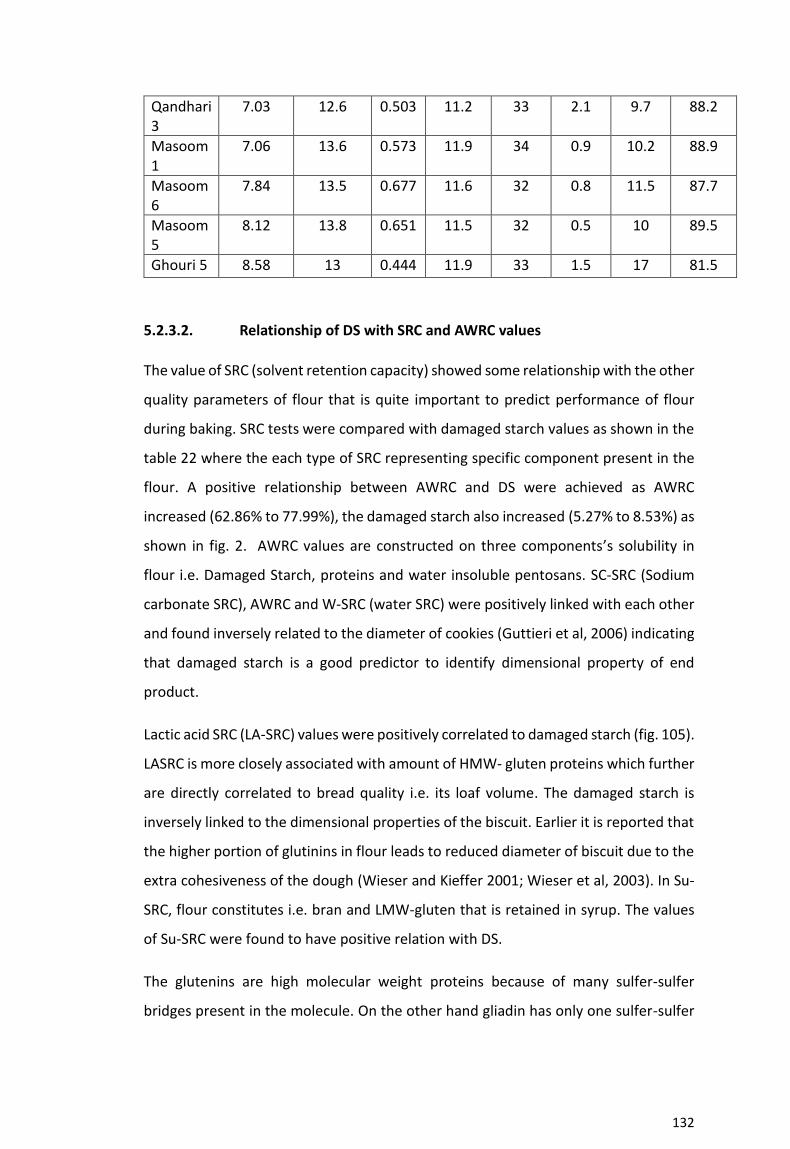
132
Qandhari 3
7.03 12.6 0.503 11.2 33 2.1 9.7 88.2
Masoom 1
7.06 13.6 0.573 11.9 34 0.9 10.2 88.9
Masoom 6
7.84 13.5 0.677 11.6 32 0.8 11.5 87.7
Masoom 5
8.12 13.8 0.651 11.5 32 0.5 10 89.5
Ghouri 5 8.58 13 0.444 11.9 33 1.5 17 81.5
5.2.3.2. Relationship of DS with SRC and AWRC values
The value of SRC (solvent retention capacity) showed some relationship with the other
quality parameters of flour that is quite important to predict performance of flour
during baking. SRC tests were compared with damaged starch values as shown in the
table 22 where the each type of SRC representing specific component present in the
flour. A positive relationship between AWRC and DS were achieved as AWRC
increased (62.86% to 77.99%), the damaged starch also increased (5.27% to 8.53%) as
shown in fig. 2. AWRC values are constructed on three components’s solubility in
flour i.e. Damaged Starch, proteins and water insoluble pentosans. SC-SRC (Sodium
carbonate SRC), AWRC and W-SRC (water SRC) were positively linked with each other
and found inversely related to the diameter of cookies (Guttieri et al, 2006) indicating
that damaged starch is a good predictor to identify dimensional property of end
product.
Lactic acid SRC (LA-SRC) values were positively correlated to damaged starch (fig. 105).
LASRC is more closely associated with amount of HMW- gluten proteins which further
are directly correlated to bread quality i.e. its loaf volume. The damaged starch is
inversely linked to the dimensional properties of the biscuit. Earlier it is reported that
the higher portion of glutinins in flour leads to reduced diameter of biscuit due to the
extra cohesiveness of the dough (Wieser and Kieffer 2001; Wieser et al, 2003). In Su-
SRC, flour constitutes i.e. bran and LMW-gluten that is retained in syrup. The values
of Su-SRC were found to have positive relation with DS.
The glutenins are high molecular weight proteins because of many sulfer-sulfer
bridges present in the molecule. On the other hand gliadin has only one sulfer-sulfer

133
bridge. The property was correlated to DS (fig. 102-105). The amount of gliadin and
glutenin proteins as measured by chemical tests as SC-SRC, AWRC, LA-SRC, W-SRC and
Su-SRC and represents the viscoelasticity of dough which was also related to DS and
to the end quality.
Figure 105: DS vs AWRC
Figure 106: DS vs SC-SRC
Figure 107: DS vs W-SRC
R² = 0.697
55%
60%
65%
70%
75%
80%
0 2 4 6 8 10 12
AW
RC
(%
)
Damaged Starch (%)
R² = 0.690
65%
75%
85%
95%
105%
115%
0 2 4 6 8 10 12
SC-S
RC
(%
)
Damaged Starch (%)
R² = 0.359
55%
60%
65%
70%
75%
80%
85%
0 2 4 6 8 10 12
WSR
C (
%)
Damaged Starch (%)

134
Fig. 108: DS vs LA-SRC
Figure 109: DS vs Su-SRC
Table 22: SRC and AWRC of wheat flour samples.
Flour DS, % AWRC,
% WSRC,
% SCSRC,
% SuSRC,
% LASRC,
%
Madina 1 5.27 62.86 61.24 77.51 86.81 74.98
Madina 2 5.86 65.56 63.44 75.98 85.29 74.87
Qandhari 2 6.11 64.72 67.89 74.82 92.63 73.83
Qandhari 5 6.18 69.92 68.35 84.03 98.13 78.31
Ghouri 2 6.31 71.75 71.25 88.49 99.85 81.52
Qandhari 1 6.35 70.66 71.85 89.07 105 80.16
Ghouri 1 6.41 70.13 69.83 85.31 101.08 81.83
Masoom 2 6.5 72.48 70.78 89.8 101.22 81.29
Qandhari 4 6.64 71.55 67 90.95 96.19 76.7
Masoom 4 6.76 72.23 72.13 89.89 102.36 82.91
Ghouri 4 6.86 74.99 65.67 87.29 100.18 78.16
Ghouri 3 6.9 72.56 80.03 89.09 93.66 77.04
Masoom 3 6.96 72.37 74.97 93.32 100.33 80.39
Qandhari 3 7.03 71.73 74.39 90.43 104.89 79.31
Masoom 1 7.06 70.97 70.87 90.98 101.83 82.12
Masoom 6 7.84 74.47 73.17 91.27 98.13 91.17
R² = 0.486
65%
70%
75%
80%
85%
90%
95%
0 2 4 6 8 10 12
LASR
C (
%)
Damaged Starch (%)
R² = 0.101
75%
80%
85%
90%
95%
100%
105%
110%
0 2 4 6 8 10 12
Su-S
RC
(%
)
Damaged Starch (%)

135
Masoom 5 8.12 72.97 73.33 91.49 93.98 80.81
Ghouri 5 8.58 77.99 72.56 106.07 97.96 86
5.2.3.3. Farinographic parameters versus damaged starch
The table 23 represented Farinograph parameters such as time for dough formation
(DDT), water absorption (WA), two type of degree of softening (DoS), dough stability
time (DST) and Farinograph quality number (FQN). The compositional values of the
flour were found to be highly predictive for dough behavior during processing. The
parameters associated with dough firmness and rheology were true indicators of the
final texture of biscuits. The damaged starch granules can absorb large amount of
moisture as compared to native molecules. The fig. 111 showed that damaged starch
responsible for more water absorption increased the mixing time or the dough
development time (DDT). Actually, some chemical changes such as molecular
degradation from starch to dextrins, then to maltose and finally to glucose (through
amylases) cause for dough rigidity. The overall impact may be observed on biscuit that
becomes small in size (diameter reduced) (Barak et al, 2012). Another visible change
due to large amount of water absorption may be seen on the surface of the biscuit or
the top grain. Extra water takes more time to be evaporated during baking, because
water is taken up by sugar in the recipe to form syrup that changes dough viscosity
and delay in water evaporation effects pattern of surface crack on the surface of the
biscuit (Barrera et al 2007). Excess of water taken up by DS in dough disturbs the
gluten network of dough i.e. the dough rheology is adversely affected (Haynes et al,
2009; Singh and Khatkar, 2005)
Figure 110: DS vs WA.
R² = 0.810
54
56
58
60
62
64
66
0 2 4 6 8 10 12
Wat
er
Ab
sorp
tio
n (
%)
Damaged Starch (%)

136
Figure 111: DS Vs dough quality parameters DDT.
Table 23: Farinograph parameters in various flour
Flour DS, % DST, min
WA, % FQN DDT, min
DoS ICC, FU
DoS, FU
Madina 1 5.27 3.6 55.7 33 1.9 83 57
Madina 2 5.86 7.1 55.9 81 2.4 88 50
Qandhari 2 6.11 6.5 60 79 1.9 65 43
Qandhari 5 6.18 7.9 59.2 66 2.9 60 37
Ghouri 2 6.31 7.7 58.6 91 2 52 36
Qandhari 1 6.35 10.3 60.6 120 2.9 49 18
Ghouri 1 6.41 5.9 58.7 78 2.2 53 38
Masoom 2 6.5 5.7 61.1 75 4.7 86 51
Qandhari 4 6.64 9.9 59.1 42 2.3 51 32
Masoom 4 6.76 6.1 60.9 88 4.2 60 34
Ghouri 4 6.86 6.8 59.7 88 5.7 78 40
Ghouri 3 6.9 4.5 62.3 59 3.8 108 78
Masoom 3 6.96 4.5 61 75 3.3 61 48
Qandhari 3 7.03 9.1 61.4 106 2 55 26
Masoom 1 7.06 5.3 62.7 65 2.4 99 68
Masoom 6 7.84 7.3 62.5 87 5.2 78 41
Masoom 5 8.12 7.8 64.4 92 6 86 40
Ghouri 5 8.58 4.5 64.6 65 3.5 114 71
R² = 0.337
0
1
2
3
4
5
6
7
0 2 4 6 8 10 12
DD
T (m
in)
Damaged Starch (%)

137
Figure 112: DS Vs Beginning of Gelatinization temperature
Figure 113: DS Vs Trough Viscosity
R² = 0.449
59.5
60
60.5
61
61.5
62
0 2 4 6 8 10 12
Be
gin
nin
g o
f ge
lati
niz
atio
n (°C
)
Damaged Starch (%)
R² = 0.456
300
400
500
600
700
800
0 2 4 6 8 10 12
Tro
ugh
Vis
cosi
ty (
BU
)
Damaged Starch (%)

138
Figure 114: DS Vs Final Viscosity
Figure 115: DS Vs Peak Viscosity
R² = 0.420
600
800
1000
1200
1400
0 2 4 6 8 10 12
Fin
al V
isco
sity
(B
U)
Damaged Starch (%)
R² = 0.435
400
600
800
1000
1200
0 2 4 6 8 10 12
Pe
ak V
isco
sity
(B
U)
Damaged Starch (%)

Table 24. Micro Visco-Amylo-Graph parameters of various flour
Flour Damaged starch, %
Beginning of gelatinization PV, BU BV, BU
TV, BU
SV, BU
FV, BU
Torque, BU
Temp. ,°C
Madina 1 5.27 20 61.7 952 360 592 608 1200
Madina 2 5.86 21 61.3 1004 379 625 594 1219
Qandhari 2
6.11 15 61.6 993 297 696 430 1126
Qandhari 5
6.18 19 61.4 1017 348 669 606 1275
Ghouri 2 6.31 11 60.3 1019 358 661 454 1115
Qandhari 1
6.35 20 61.8 946 309 637 331 968
Ghouri 1 6.41 22 61.1 999 363 636 534 1170
Masoom 2
6.5 20 60.1 1041 372 669 461 1130
Qandhari 4
6.64 16 60.6 985 350 635 605 1240
Masoom 4
6.76 17 60.4 957 339 618 500 1118
Ghouri 4 6.86 20 61.1 993 360 633 581 1214
Ghouri 3 6.9 18 60.8 975 384 591 554 1145
Masoom 3
6.96 16 59.9 988 332 656 354 1010
Qandhari 3
7.03 16 60.9 1006 338 668 369 1037
Masoom 1
7.06 17 60.3 984 323 661 301 962
Masoom 6
7.84 18 60.3 938 394 544 528 1072
Masoom 5
8.12 18 60.5 907 350 557 539 1096
Ghouri 5 8.58 15 59.9 603 264 339 408 747

140
5.2.3.4. Damaged starch versus pasting curve of MVAG
The pasting behavior of the dough significantly changed due to the presence of DS in flour
as shown by various viscosities which was caused by the rising heat at different stages
i.e. heating, holding & cooling as mentioned in table 24. As damaged starch increases,
the pasting temperature (PT) was slightly decreased that relates to increase in viscosity
for the first time. The pasting curve shows the close relationship of DS with the
gelatinization of starch, that determines the texture of baking products (Ragaee et al,
2001). The trough viscosity TV is low in presence of damaged starch that will affect the
end quality (Ragaee and Abdel-Aal, 2006). The breakdown (BV) viscosities and setback
(SV) viscosities got decreased in presence of DS because of excess water absorption. The
SV, FV were higher than BV. However, with the increase of damaged starch both of them
decreased. Further, starch retrogradation that showed rearrangement of starch
molecules decreased when DS increased, which also slowed down the process of
syneresis. The pasting curve as obtained from MVAG is a useful indicator of behavior of
DS in dough during baking because its shows how DS affects the dough viscosities at high
and low temperature. The pasting curve will be predictive of final texture of the biscuit.
5.2.3.5. Relationship of Proteins from Glutomatic -2000 and DS
The gluten proteins in industrial process and research are closely related for assessing
flour quality. Glutomatic machine is used to measure parameters i.e. dry gluten (DG),
wet/hydrated gluten (WG), passed gluten (PG), retained gluten (RG), gluten index (GI)
that gives the strength of gluten network and water binding capacity (WBC). The present
studies showed the impact of DS on the Glutomatic proteins (table 25). Positive
association between DS and PG was shown in fig. 116 while inverse relationship with RG
and GI were shown in fig. 117 and 118.
The textural and dimensional characteristics of biscuits is associated with the
composition of flour that determines the WA by the flour. The water of all the hydrophilic
polymers present in flour was high as shown by Farinograph than the WA form
Glutomatic 2000 (WA only by gluten). Actually WA also depends on molecular
Figure 2A:

141
structure/particle size (Stasio et al, 2007) that was also illustrated by the present study
(table 25).
Figure 116: Damaged vs passed gluten
Figure 117: Damaged starch vs retained gluten
Figure 118: Damaged starch vs gluten index
R² = 0.358
0
5
10
15
20
0 2 4 6 8 10 12
Pas
sed
Glu
ten
(%
)
Damaged Starch (%)
R² = 0.383
5
10
15
20
25
30
0 2 4 6 8 10 12
Re
tain
ed
Glu
ten
(%
)
Damaged Starch (%)
R² = 0.403
20
40
60
80
100
0 2 4 6 8 10 12
Glu
ten
Ind
ex
Damaged Starch (%)
A

142
Table 25: Glutomatic Proteins and DS of various flour
Flour Damaged
starch (DS)
Retained gluten (RG)
Passed gluten (PG)
Dry gluten (DG)
Wet gluten (WG)
Water binding capacity (WBC)
Gluten index (GI)
Madina 1 5.27 22.1 2.8 8.2 24.9 16.7 89
Madina 2 5.86 19.8 2.3 7 22.1 15.1 90
Qandhari 2 6.11 19.3 11 9.2 30.3 21.1 64
Qandhari 5 6.18 26.8 2.3 9.6 29.1 19.5 92
Ghouri 2 6.31 16.2 12 9.9 28.2 18.3 57
Qandhari 1 6.35 23.2 3.3 8.8 26.5 17.7 88
Ghouri 1 6.41 20.6 6.8 8.7 27.4 18.7 75
Masoom 2 6.5 16.2 14.8 9.3 31 21.7 52
Qandhari 4 6.64 23.8 2 8.4 25.8 17.4 92
Masoom 4 6.76 17.1 11.9 9.3 29 19.7 59
Ghouri 4 6.86 19.9 8.1 8.9 28 19.1 71
Ghouri 3 6.9 19 10.9 9.5 29.9 20.4 64
Masoom 3 6.96 14.3 16.4 10 30.7 20.7 47
Qandhari 3 7.03 20.2 6.8 8.7 27 18.3 75
Masoom 1 7.06 15.7 15.5 9.9 31.2 21.3 50
Masoom 6 7.84 17 11.5 10 28.5 18.5 60
Masoom 5 8.12 15 13.7 9.4 28.7 19.3 52
Ghouri 5 8.58 13.3 14.6 8.8 27.9 19.1 48
Figure 119: DS vs NG-WA
R² = 0.729
36
38
40
42
44
46
0 2 4 6 8 10 12
NG
-WA
(%
)
Damaged Starch (%)

143
Table 26: DS vs NG-WA
Flour DS, (%) G-WA, (%) F-WA, (%) NG-WA, (%)
Madina 1 5.27 16.7 55.7 39
Madina 2 5.86 15.1 55.9 40.8
Qandhari 2 6.11 21.1 60 38.9
Qandhari 5 6.18 19.5 59.2 39.7
Ghouri 2 6.31 18.3 58.6 40.3
Qandhari 1 6.35 17.7 60.6 42.9
Ghouri 1 6.41 18.7 58.7 40
Masoom 2 6.5 21.7 61.1 39.4
Qandhari 4 6.64 17.4 59.1 41.7
Masoom 4 6.76 19.7 60.9 41.2
Ghouri 4 6.86 19.1 59.7 40.6
Ghouri 3 6.9 20.4 62.3 41.9
Masoom 3 6.96 20.7 61 40.3
Qandhari 3 7.03 18.3 61.4 43.1
Masoom 1 7.06 21.3 62.7 41.4
Masoom 6 7.84 18.5 62.5 44
Masoom 5 8.12 19.3 64.4 45.1
Ghouri 5 8.58 19.1 64.6 45.5

144
5.2.4. Conclusions
Our lab results explained the relation between the intrinsic parameters of local flour
samples and the added ingredients. The results from sophisticated lab equipments
revealed that some of the parameters showed very close relationship that how flour
would form the type of specific dough which will determine the biscuit quality. DS was
especially related to variety of flour characteristics. DDT from Farinograph, beginning of
Gelatinization from MVAG and RG/PG from Glutomatic were found to predict DS. The
absorbed water by DS was strongly related to values of WA obtained from Farinograph
and Glutomatic, because Glutomatic gives the amount of water absorbed only by the
gluten proteins while water absorption value from Farinograph includes the total amount
of water taken up by all the hydrophilic components of flour (Protein, Starch, DS, and
Pentosan etc.) plus some of the ingredients in the recipe that absorbs water such as the
sugar etc.
The results elaborated for the first time that the two values of WA from Farinograph and
Glutomatic were predictive for end quality of baked products.

145
5.3. Effect of commercial enzymes (proteases & carbohydrases) on dough rheology and
end quality of Cookie
5.3.1. Foreword of the study
Additives in bakery industry are vital ingredients to ease processing and to improve
quality of the products in relation to their structural diversity and its influence on dough
development. Enzymes are now a very important inclusion in the list of additives. It show
dominance because they can make specific structural changes in the dough without
disturbing other molecules that improves functional properties of the dough and the end
quality of the baked goods (Colombo et al, 2008; Hassan et al, 2013). Enzymes are
recognized as safe (GRAS) whereas many other additives are declared unsafe for human
consumption i.e. sulfites.
With variety of enzymatice and chemical treatments, flour other than the soft nature i.e.
Hard and semi hard have been used after making it soft since long time (Patel et al, 2012).
Many additives are used to convert the strong gluten network to weak network which
may include emulsifiers, iodates, sodium metabisulphite, proteolytic enzymes and that
cleave the peptide chains, disulphide bridges, tyrosine-tyrosine and glutamyl-lysine cross
linkages (Ramrez- Suarez et al, 2005).
Four commercial enzymes were used in the present study. Two proteases i.e. Biobake and
Nutrase and two carbohydrases i.e. Pentopan and Fungal Amylase were mixed in the
wheat flour sample with different concentration (30 ppm, 60 ppm and 90 ppm) in order
to get partially hydrolyzed dough polymers. The enzyme were capable to improve dough
rheology and dimensional characteristic of cookies by initiating molecular
rearrangements. The rheological behavior of dough and gluten characteristics were
evaluated by Perten Glutomatic System.
5.3.2. Material and Method:
Please refer to chapter 2 for detail description of the methods, however only specific
material and method related to the topic are discussed here.

146
5.3.2.1. Material:
Semi hard wheat flour sample was received from Johar Flour Mills Private Ltd. Karachi.
The enzymes as Nutrase (protease), Fungal Amylase (carbohydrase), and Pentopan
(xylanse) were obtained from Novozymes, Switzerland and Biobake (protease) was
purchased from Kerry ingredients & Flavors Carigaline, Ireland
5.3.2.2. Biscuit Preparation
The dough was prepared by mixing all ingredients as per recipe mentioned in table 27.
First emulsion was prepared by mixing all the ingredients except flour in Kenwood Mixer,
UK at a speed of 40 rpm for 1 min, and then flour was added and mixed at 25 rpm for
1:30 min to develop the dough. The dough was sheeted and cut using circular mold of 50
mm diameter. Biscuits were baked in oven (Nardi, Italy) at 205°C for 8 minutes with
heating coils fixed both at the top and the bottom ends.
The dough batches (13) were produced, control without any enzyme, Biobake, Neutrase,
Fungal Amylase and Pentopan 3 batches each consisting of 30, 60 & 90 ppm.
Table 27: Recipe of biscuit for enzyme study
Ingredients Quantity
(gm)
Flour 500
Sugar 150
Invert Syrup 8
Vegetable Fat 120
Skimmed Milk Powder 8
Ammonium bi Carbonate 5
Baking Powder 1
Salt 3
Lecithin 0.5
Water 62
Egg 37.5
Enzyme as per study

147
5.3.3. Result and Discussion:
5.3.3.1. Physicochemical Characteristics
The flour sample used in the study was the same with the following composition.
Table 28: Physicochemical Parameters
Physicochemical Parameters of
flour Amount in %
Moisture 14.5
Protein 11.2
Ash 0.468
5.3.3.2. Enzyme affecting Farinograph Properties of flour
Proteases and fungal amylases showed no effect on DDT whereas DDT increased by 47%
when Pentopan was used at 60 ppm. Dough stability was also increased by Pentopan at
all the concentration (30 ppm, 60 ppm and 90 ppm) from 8.6 min to 9.8 min, 9.4 min and
9.2 min respectively. At very low concentration of 30 ppm, Fungal Amylase decreased DST
from 8.6 min to 1.5 min. Proteases showed less DST as compare to the control flour. DoS
was increased when proteases was incorporated (at all concentrations). At the
concentration of 90 ppm, Biobake showed highest DoS as 255 FU as compare to 67 FU for
control. Pentopan showed opposite character from others (Biobake, Nutrase, and Fungal
Amylase) in controlling the stability of dough.
High FQN value was achieved by Pentopan at the concentration of 60 and 90 ppm that
may be due to the hardening effect on flour.
Overall, analysis of Farinograph revealed that all the enzymes (proteases and fungal
amylase) produced soft dough whereas pentopan showed some strengthing effect on the
dough.
5.3.3.3. Enzymes affecting Micro Visco-Amylo-Graph Properties
Table 30 represented the maximum viscosity that is a significant parameter to identify the

148
behavior of starch in dough development that can be controlled by enzymes as also
revealed earlier (Debroh et al 2011). PV was decreased from 1042 BU to 855 BU, 691 BU
and 545 BU and BD viscosity was decreased from 379 to 347, 267 and 235 BU by Pentopan
at the concentration of 30, 60 and 90 ppm respectively. Rest of the enzymes didn’t
showed any significant reaction on pasting properties as mentioned in table 30. We may
conclude that higher temperature affected enzymes activity and inactivated them by
gradually denatured the structure.
5.3.3.4. Enzymes affecting Glutomatic Properties
As expected, enzymes showed variable impact on wet gluten and dry gluten content of
flour. Proteases showed significant impact as Biobake had shown the most significant
change on Gl followed by Nutrase. Biobake reacted on gluten network and decreased GI
from 91 to 57, 34 and 13 (at the concentration of 30 ppm, 60 ppm and 90 ppm
respectively). Nutrase at 90 ppm showed largest drop (from 91 to 53) in gluten index.
Biobake acted much faster than Nutrase with less quantity of the enzyme to hydrolyze
the peptide bonds as indicated in table 31. Fungal Amylase & Pentopan (carbohydrates
degrading enzymes) didn’t show any substantial impact on softening of dough, because
their substrates (starch and arabinoxylan) were not involved in forming gluten network
complex.
5.3.3.5. Dimensional Properties of the end product
Correlation of cookie factor with Proteases and Carbohydrases were significant as R2 for
Biobake, Nutrase, Pentopan and Fungal Amylase were found to be 0.886, 0.97, 0.987 and
0.83 respectively.
Proteases increased the cookie factor of biscuit as dough is softened by the degradation
of the gluten network and produce biscuit with more spread (Kara et al, 2005).
Carbohydrateses (Fungal Amylase & Pentopan) showed an increase in the cookie factor.
It may be attributed that low concentrations of enzymes reduced the starch molecular
size to a certain extent to produce spreadness in the biscuit. Biobake performed well in
producing high cookie factor at the concentration of 60 and 90 ppm than the other
enzymes. Recently similar study was conducted by Amal A. Hassan (2013) using only

149
protease at concentration max. 25 ppm.
Table 29: Enzyme affecting Farinograph Properties
Enzyme Qty
Water
Absorption
(%)
Development
Time (min)
Stability
(min)
Degree of
Softening,
ICC (FU)
Degree of
Softening
(FU)
FQN
Control 59.6±0.1 1.7±0.1 8.6±0.2 67±3.0 39±1.5 89±1.2
Bio
bak
e 3
0
pp
m 59.6±0.2 1.7±0.1 4.6±0.3 148±5.4 102±2.4 27±1.0
60
pp
m 59.6±0.3 2.0±0.1 3.6±0.2 231±3.0 164±1.6 49±2.3
90
pp
m 59.6±0.1 2.0±0.05 3.3±0.5 255±2.0 197±1.2 48±3.0
Ne
utr
ase
30
pp
m 59.6±0.2 1.9±0.1 7.7±0.2 88±2.1 48±1.1 35±2.5
60
pp
m 59.6±0.2 2.0±0.1 5.1±0.2 134±5.0 88±5.2 38±5.6
90
pp
m 59.6±0.3 1.9±0.1 4.2±0.2 191±5.5 115±2.3 38±2.1
Pe
nto
pan
30
pp
m 59.6±0.1 2.3±0.05 9.8±0.4 66±1.3 27±4.6 44±2.3
60
pp
m 59.6±0.3 2.5±0.05 9.4±0.6 73±3.0 27±2.1 103±2.4
90
pp
m 59.6±0.2 2.2±0.5 9.2±0.8 74±1.1 29±2.2 101±4.5
Fun
gal A
myl
ase
30
pp
m 59.6±0.3 1.8±0.1 1.5±0.2 139±3.2 104±5.1 24±1.2
60
pp
m 59.6±0.1 1.7±0.1 1.2±0.7 136±4.0 110±4.5 21±1.5
90
pp
m 59.6±0.1 2.0±0.1 1.4±0.4 116±5.2 91±4.8 26±2.8
Standard Deviation is indicated as ± after the mean value

150
Table 30: Enzyme affecting Micro Visco-Amylo-Graph Properties
Enzyme Qty
Beginning of
Gelatinization
(BU)
Max viscosity
(BU)
Break- down
(BU) Setback (BU)
Control 23±0.3 1042±15 379±5.1 481±8.1
Bio
bak
e
30
pp
m 24±0.5 1018±12 375±4.6 453±6.5
60
pp
m 11±0.4 1012±8 377±3.4 403±9.5
90
pp
m 21±0.5 952±20 326±2.4 400±5.7
Ne
utr
ase
30
pp
m 21±1.2 979±15 350±2.6 252±6.1
60
pp
m 18±2.1 1005±13 399±4.5 531±5.4
90
pp
m 17±1.4 973±16 355±4.1 547±2.3
Pe
nto
pan
30
pp
m 18±2.2 858±8 347±4.7 514±8.5
60
pp
m 18±1.5 691±11 267±5.2 261±5.5
90
pp
m 17±1.3 548±14 235±4.3 357±5.7
Fun
gal A
myl
ase
30
pp
m 15±1.5 987±7 317±3.1 236±6.1
60
pp
m 18±1.3 971±11 323±2.3 244±8.4
90
pp
m 17±1.8 936±8 320±4.6 389±9.7
Standard Deviation is indicated as ± after the mean value

151
Table 31: enzyme affecting Glutomatic Properties
Enzyme Qty Wet Gluten
(%)
Retained
Gluten (%)
Passed
Gluten (%)
Gluten
Index
Dry Gluten
(%)
Control 25.67±0.5 23.59±0.5 2.09±0.5 91±3 8.91±0.5
Bio
bak
e
30
pp
m
26.70±0.5 15.30±1.2 11.41±1.4 57±2 8.50±0.2
60
pp
m
27.41±1.2 9.41±2.2 18.00±1.5 34±1 8.66±0.1
90
pp
m
27.40±0.7 3.66±1.2 23.74±2.1 13±4 8.70±0.4
Nu
tras
e
30
pp
m
23.60±0.4 21.88±0.8 1.72±1.3 92±2 8.52±0.1
60
pp
m
25.55±0.5 18.86±1.4 6.69±1.0 73±3 8.66±0.1
90
pp
m
24.40±0.5 13.12±1.2 11.29±1.1 53±2 8.70±0.4
Pe
nto
pan
30
pp
m
25.91±1.2 22.67±0.7 3.24±0.1 87±2 8.53±0.1
60
pp
m
26.37±0.2 22.62±1.1 3.75±0.4 85±4 8.67±0.2
90
pp
m
25.73±0.7 21.40±1.1 4.33±0.1 83±3 8.37±0.1
Fun
gal A
myl
ase 30
pp
m
25.76±0.6 21.78±0.6 3.98±0.5 84±3 8.46±0.4
60
pp
m
26.23±1.2 21.75±2.1 4.49±0.3 82±1 8.59±0.4
90
pp
m
26.07±0.9 21.10±1.5 4.97±0.4 81±2 8.40±0.3
Standard Deviation is indicated as ± after the mean value

152
Figure 120: Proteases and Amylases on Cookies factor
5.3.4. Conclusion
Enzymes like additive played vital role as dough improver and it also had shown impact on
the end quality of the product. Enzymes showed different action on dough parameters as
higher GI value was obtained by Biobake as compared to Nutrase with little less impact on
end quality. Proteases were successful in breaking the gluten network, whereas degree of
softening was affected by both proteases and Fungal Amylase. No noticeable effect was
indicated by Pentopan. 90 ppm was found to be best concentration for altering flour
property and dough rheology.
It may be summarized that the commercial enzymes i.e. Biobake, Fungal Amylase and
Pentopan worked successfully to control the dimensional properties of biscuits. The
dough may be tailored made according to the desired end product by the use of selected
proteases and carbohydrases, their ratio and concentration.
R² = 0.886
R² = 0.9728
R² = 0.9874
R² = 0.8335
6.00
6.20
6.40
6.60
6.80
7.00
7.20
7.40
20 40 60 80 100
Co
oki
e F
acto
r
Enzyme Qty (ppm)
Biobake
Neutrase
Control
Pentopan
FungalAmylase

153
6. CHAPTER: NUTRACEUTICAL PRODUCT
6.1. Legume protein enriched biscuits and its impact on rheological
properties of dough/the end quality.
6.1.1. Foreword of the Study
Bakery products with high nutritional profile, significant textural improvement and
excellent consumer’s acceptability have been produced in the past by partially replacing
wheat flour with various other flours from pulses. Pulses generally are the rich source of
protein (18-30%), dietary fibers (14-26%), starch (32-52%) and minerals (1- 3.5%).
Variety of bakery products have been developed by incorporating lentil flour in wheat
flour including the layer and sponge cake (Hera et al, 2012). Biscuits with pigeon pea
substitution (15%) have been produced successfully in wire cut products (Tiwari et al,
2011).The sheeted and wire cut biscuits were also prepared by substituting only 5% pea
flour (Kamaljit et al, 2010). The kidney bean flour was mixed with wheat flour even up to
15% in presence of fresh orange juice and the dough behavior was observed during mixing
(Eissa et al, 2007) which was found to be normal with slightly reduced elasticity. The
biscuits from green lentil, navy and pinto beans with acceptable end qualities were
produced with high nutritional status because of potent antioxidant activity (Zucco et al,
2011).
In view of the fact that Mash bean also known as black gram (Vigna mungo) has rarely
been substituted in bakery products. The study was undertaken to investigate the effect
of wheat flour enrichment with Mash bean flour (MBF) in order to improve the nutritional
quality of biscuits and also to see its impact on physicochemical characteristics of flour,
dough rheology, dimensional, textural and organoleptic properties of biscuits.
6.1.2. Material and Method
Please refer to chapter 2 for detail description of the methods, however only specific
material and method related to the topic are discussed here.

154
6.1.2.1. Material
The wheat flour was obtained from Masoom Flour Mill, Karachi. The Mash bean flour
(MBF) was purchased from Imtiaz Super Market, Karachi. Analytical grades
reagents/chemicals were used which were procured from the distributor of MERCK
(Darmstadt, Germany) in Pakistan, Labline Pvt. Ltd.
All samples were prepared by adding (MBF) at 0, 10, 20, 30 and 40% levels in wheat flour.
6.1.2.2. Biscuit Preparation
The dough was prepared by mixing all ingredients as per recipe mentioned in table 32.
First emulsion was prepared by mixing all the ingredients except flour in Kenwood Mixer,
UK at a speed of 40 rpm for 1 min, and then flour was added and mixed at 25 rpm for 1:30
minutes to develop the dough. The dough was sheeted and cut using circular mold of 50
mm diameter. Biscuits were baked in oven (Nardi, Italy) at 205°C for 8 minutes with
heating coils fixed both at the top and the bottom ends.
Table 32: Recipe of biscuits with legume
Ingredients Quantity
(gm)
Flour 400
Sugar 150
Sodium bi carbonate 0.5
Vegetable Fat 150
Skimmed Milk Powder 4
Ammonium bi Carbonate 3.5
Vanillin powder 0.5
Salt 3
Lecithin 1
Water 26
6.1.3. Result and discussion:
6.1.3.1. Physicochemical properties and SRC analysis
The various physicochemical parameters of the samples analyzed were given in table 33.
Moisture content of different substituted flour was affected negatively (R2= 0.98),
whereas substitution of MBF increased the protein content constantly (R2= 0.99) as
pulses are rich in proteins (Du et al, 2013). Recently, lentil flour was supplemented in

155
producing protein enriched wheat based biscuits for babies, children and also the bread
in developing countries (Grah et al, 2014). Lentil flour, as well as pinto -bean and navy
bean flours have successfully been incorporated in pita bread (Borsuk et al, 2012)
Ash was also increased from 0.432% to 0.813% and was almost double at 40 %
substitution showing the significant increase in mineral contents. Incorporation of flour
from pulses is related to increase the resistant starch apart from increasing the other
nutrients present in legumes (Noor et al, 2012; Shah et al, 2011).
LA-SRC was less affected (R2= 0.69) with substitution of MBF although protein content
were increased from 11% to 12.65%. This may be attributed to the quality of legume
proteins, which consisting excess of low molecular weight proteins did not absorb lactic
acid. Su-SRC, SC-SRC and W-SRC profile (table 33) were increased that was due to increase
in the swelling power of the respective hydrophilic polymers by the addition of MBF. This
may be attributed to the presence of dietary fibers in pulses and also because of the
influence of damage starch produced during milling of Mash beans (Ahmed et al, 2015;
Khan et al 2015).
Table 33: Physicochemical and SRC Analysis of substituted flour
Substitution
%
Moisture
% Ash %
Protein
%
% Retention at sieve Solvent Retention Capacity
200μm 160μm
120μm bottom
LA-
SRC
SC-
SRC S-SRC
W-
SRC
0 14 0.432 11 1.6 2.3 16.6 79.5 78.8 83.5 100.9 66.4
10 13.6 0.61 11.5 5.8 1.3 14.7 78.2 89.55 91.54 105.4 81.59
20 12.98 0.664 11.9 12.2 1.5 16.9 69.4 88.92 96.82 108.68 84.96
30 12.91 0.752 12.35 18.7 2.2 17.3 61.8 88.83 100.6 109.5 84.88
40 12.44 0.813 12.85 23.3 1.8 20.6 54.3 89.3 105 111.95 93.7
6.1.3.2. Rheological properties - Farinograph
Water absorption is the amount of water required by the flour to produce optimum
dough and is represented by the amount of water required to touch the peak at 500 BU
for the first time as indicated by Farinogram (Ram et al, 2005). The water absorption
ranged from 58.5% to 62.1% and increased with increase in substitution of MBF. It may
be due to the affinity of hydrophilic polymers present in Maash flour such as proteins,

156
dietary fiber and damage starch etc. The addition of flour from pulses consisting large
amount of protein increased the water absorption in dough (Perez et al, 2013) and in
consequences modifying the dough behavior. The substitution of lentil and small white
bean flour in production of rolls has shown the substantial changes in dough rheology, for
example Farinograph water absorption capacity and dough development time increased
while the dough stability was reduced (Kohajdova et al, 2013). Dough stability is the time
between the arrival time and departure time of the peak while touching the 500 FU line.
It was first increased more on adding 10% MBF from 7.2 to 17.0 minutes. However it
dropped gradually on further substitution of MBF (i.e. 13-8 →7.7→5.7min) and even it
was lower than wheat flour itself (7.2min).The drop in stability may be attributed to the
fact that when MBF was added first time, although the total protein increased, however
it was not enough to interfere the gluten network i.e. to penetrate between the gluten
proteins, with increase in MBF proteins, the gluten network was consequently weakened
and that decreased the stability as also reported by Kohajdova et al. (2013). FQN number
was increased from 78 to 200 due to increase in hardness induced by the components of
MBF.
Table 34: Farinograph and MVAG and Glutomatic profile of substituted flour
Substitution
% WA %
DDT
(min)
DS
(min) FQN
PV
(BU)
BV
(BU)
SV
(BU) GI WG % DG %
0 58.5 1.9 7.2 78 1305 494 569 81.75 29.6 8.85
10 61 9.7 17 166 963 366 475 94.1 19.1 6.21
20 61.5 11.9 13.8 168 931 359 416 96.95 12.2 4.25
30 61.8 13.8 7.7 194 855 338 374 99.79 9.75 3.5
40 62.1 17.2 5.7 200 725 245 332 99.96 1.83 0.68
6.1.3.3. Micro Visco-Amylo-Graph
PV, BV and SV were negatively affected (R2 = 0.929, 0.934, 0.982) by MBF substitutions.
The decrease in all the viscosities was due to the reduced amount of wheat starch which
was responsible for making paste. The MBF consists of less starch as compared to wheat
flour and also the ratio of amylose to amylopectin is different that plays the key role in
regulating the properties related to pasting.

157
6.1.3.4. Glutomatic protein profile
Gluten index, wet and dry gluten contents were reported in table 34. Both the wet and
dry gluten contents were decreased due to the substitution of MBF. The sharp decrease
in WG from the control to the sample after addition of 10% MBF then the gradual drop
showed that wheat proteins had better ability of holding the water in their gluten network
6.1.3.5. Dimensional and sensory analysis of biscuits
The significant correlation between the dimensional properties of the biscuits made from
MBF substituted flour and that of the control was not observed. It seems that components
of wheat flour and that of MBF complement each other in functional properties required
to produce dough.
Biscuits at 20% substitution were best in texture, taste, color and overall acceptability
whereas biscuits produced with above 20 % substitution of MBF were poor in sensory
analysis.
Table 35: Dimensional Properties of Biscuits
Substitution
%
Moisture
of
Biscuit
(%)
Weight
(gm)
Diameter
(mm)
Thickness
(mm)
0 0.37 8 54.9 7.8
10 0.59 8.43 54.13 7.23
20 0.8 8.1 53.9 7
30 1 8.23 54.6 7.89
40 1.21 8.23 54.64 7.4

158
Table 36: Correlation of different parameters with % substitution of MBF
Parameter R2 Parameter R2
Moisture of flour
(with and without
MBF) sample %
-0.98076
DDT (min) 0.956755
DS (min) -0.39976
% Retention at
200μm 0.997268 FQN 0.879123
% Retention at
160μm -0.03656 PV (bu) -0.92965
% Retention at
120μm 0.784261 BV (bu) -0.93422
% Retention at
bottom -0.98243 SV (bu) -0.98279
Ash % 0.97365 GI 0.884773
Protein % 0.999336 WG % -0.98099
LA-SRC 0.691398 DG % -0.9863
SC-SRC 0.987936 Moisture of Biscuit
(%) 0.999874
S-SRC 0.970131 Weight (gm) 0.254122
W-SRC 0.918766 Diameter (mm) -0.01939
WA % 0.875586 Thickness (mm) -0.05872

159
Figure 121: Sensory score of biscuit made with control and substituted flour
6.1.4. Conclusion
The incorporation of Mash bean flour in wheat flour enhanced the nutritive value of
biscuits by increasing the proteins dietary fibers and mineral contents; it also modified
the dough behavior and pasting properties of starch positively. Moreover addition of
MBF improved the texture and acceptability of the end products. The softness of the
biscuit increased due to the incorporation of MBF because the moisture contents in the
finished products increased significantly. The biscuits made from control had moisture
as 0.37% while the biscuits from 20% MBF substitution carry 1% moisture that increased
more than double as observed. The 20% substitution of MBF was found to be the optimal
addition for considering the consumer’s acceptance, texture and the bite. The MBF
substitution in biscuits will overcome the nutritional deficiencies in the diet of the
consumers in Asian countries where consumption of biscuit is higher.
0
2
4
6
8
10Color
Flavor
TasteTexture
OverallAcceptability
0%
10%
20%
30%
40%
160
6.2. Black gram flour (BGF) in cookie dough as a substitute of egg.
6.2.1. Foreword of the study
Egg has been included as the raw material in many food products traditionally because of
its multiple functional properties including foaming, coagulation, emulsification, water
and fat absorption etc. Egg plays role as a binding and thickening agent due to its
composition. In recent times, legumes, sharing few of above mentioned properties have
proved their place as egg replacer in baking industries for many other beneficial
properties (Des-Marchais et al, 2011; Tiwari et al, 2011; Angioloni et al, 2012). The
composite flour of legumes and wheat flour therefore produce better microstructure of
the biscuit, making it best suitable alternative for eggs during baking process (Ma et al,
2011; Kadam et al, 2012; Uhlman et al, 2014). The transformations of microstructure of
dough after egg replacement by black gram (powder) were investigated with the help of
a technique Scanning electron microscopy (SEM). The study also included the evaluation
of physical and chemical attributes of flour, rheology of the dough and the quality of the
end product (cookies) after the addition of BGF. The study was also conducted to explore
a nutritive and applied solution of egg replacement in the composition of cookies to
reduce health concerns associated with eggs and to introduce bakery products without
egg or only a small amount of egg as an ingredient.
6.2.2. Material and method
Please refer to chapter 2 for detail description of the methods, however only specific
material and method related to the topic are discussed here.
6.2.2.1. Material
Flour sample of commercial soft wheat acquired from Garibsons Pvt. Ltd, Port Qasim, and
Karachi. Black gram was purchased from Imtiaz Super Market, Karachi. Whereas rest of
the raw materials were taken from the store of English Biscuit Manufacturers Pvt. Ltd.
Karachi (they procured from different sources).
6.2.2.2. Biscuit preparation
The dough was prepared by mixing all ingredients as per recipe mentioned in table 37.

161
First emulsion was prepared by mixing all the ingredients except flour in Kenwood Mixer,
UK at a speed of 40 rpm for 1 min, and then flour was added and mixed at 25 rpm for 1:30
minutes to develop the dough. The dough was sheeted and cut using circular mold of 50
mm diameter. Biscuits were baked in oven (Nardi, Italy) at 205°C for 8 minutes with
heating coils fixed both at the top and the bottom ends.
Table 37: Recipe of BGF biscuit
Ingredients Quantity (gm)
Flour 125
Sugar 44
Sodium bi carbonate 0.5
Vegetable Fat 40
Skimmed Milk Powder 2
Salt 1
Water 10
Egg 5
DATUM 1
6.2.3. Result and discussion
6.2.3.1. Physico-chemical quality:
Same type and quality of flour sample was utilized in the study to evaluate the impact of
other ingredients on dough formation and cookie quality. Black gram flour increased the
overall moisture content of the mixture. Whereas no significant change in protein was
reported as mentioned in table 38. Ash content was slightly increased with the addition
of increased amount of BGF. The protein content was also slightly increased when BGF
was added. As expected the Glutomatic proteins i.e. gluten index, dry gluten and wet
gluten were gradually decreased due to absence of gluten in BGF as the proteins already
present in legumes do not assemble and associate closely to produce the viscous mass.
The increase in moisture as shown in table 38 indicated better water holding capacity of
legume protein as also measured by Farinograph (table 39). BGF was found to be good
substitute of wheat flour as substitution didn’t affect significantly overall chemical
attributes of wheat flour.
The microstructure of dough (as referred by SEM) showed interactions of proteins (from
gluten and legume) with starch granules present in wheat. These interactions were

162
revealing the difference in dough structures and its formation. A continuous starch-
protein matrix in control (wheat flour without BGF) was observed which was represented
by a white line in microgram fig. 122 (a), however the structure became towards rough as
illustrated in fig. 122 (d) that was representing the incapability of proteins of BGF to link
with the wheat starch granule. It may be concluded that Protein for BGF and granules of
wheat starch form matrix which may dissociate at certain level and lead to further
increase with the further addition of proteins (BGF).
Table 38. Physico-chemical analysis of BGF
Black gm/125gm
flour)
Moisture, %
Protein, % Ash, % DG, % WG, % GI
0 14.6±0.05 10.1±0.12 0.461±0.005 7.9±0.02 25.2±0.12 93±1.0
2 14.8±0.06 10.3±0.08 0.467±0.008 7.8±0.04 24.9±0.06 92±2.1
4 14.8±0.10 10.5±0.11 0.475±0.005 7.7±0.03 24.8±0.07 91±0.6
6 15.0±0.05 10.5±0.07 0.477±0.009 7.6±0.07 24.6±0.14 87±1.2
Standard Deviation is indicated as ± after the mean value (n=3)
6.2.3.2. Farinograph Parameters
Farinograph profile i.e. WA, DST, DDT, FQN and DoS (12 min after maximum value - Dos)
was increased with the addition of black gram flour. DoS after 10 min decreased with the
increased concentration of BGF (table 39). High WA with BGF might be predicting the
possibility of intermingling of more hydrophilic biopolymers of BGF with –OH gourps of
added water. Flour strength i.e. the DDT and DST was increased by adding low amount of
the BGF (2-4 g/125 g) whereas concentration of 6 g of BGF decreased the strength of these
parameters. FQN was increased with the addition of BGF that indicated the hardening
effect of the dough. The strength in dough resulted prolonged DS, DoS and DDT. The
strength of the dough confirmed that network of protein was able to hold tiny air bubbles
firmly. Usually the albumin protein of egg plays the same role but BGF in current recipe
had successfully taken over the role of egg proteins.

163
Table 39. Farinograph Properties of BGF added dough
Black gm/125gm flour)
DDT, min WA, % DST, min DoS
ICC, FU FQN
0 1.7±0.1 59.6±0.1 08.6±0.20 67±3.0 89.0±1.20
2 2±0.8 58.5±0.4 10.5±0.22 23±0.7 112±0.77
4 6.8±0.2 59.8±0.1 11.0±0.34 16±1.0 123±0.89
6 5.5±0.3 68.5±0.2 09.0±0.70 22±0.9 126±0.50
Standard Deviation is indicated as ± after the mean value (n=3)
6.2.3.3. MVAG Analysis
The all types of viscosities started increasing with the addition of BGF. The viscosities are
further increased (addition of 4 gm BGF) except few i.e. BD and PV viscosities. Whereas
each and every viscosity was decreased on 6 gm addition of BGF.
The values of breakdown and set back are true representatives of many interactions like
starch-starch, protein-protein or starch protein cross-linking. Results showed that the
dough would become more thick and viscous at the concentration of 2 gm/125 gm BGF
during heating while the mass would be less viscous at the concentration of 4 gm/125 gm
or 6 gm/125 gm. However, high viscosity at the concentration of 4 gm/125gm of BGF was
achieved on the period of cooling due to re-association of starch molecules i.e.
retrogradation (table 40).
Table 40. BG flour affecting Micro Visco-Amylo-Graph Properties.
Black gm/125gm flour)
PV, BU BD, BU SB, BU
0 1042±15 379±5.1 481±8.1
2 1220±11 436±8.1 719±4.9 4 1205±18 426±4.7 740±4.7
6 1164±10 412±3.2 646±6.0
Standard Deviation is indicated as ± after the mean value (n=3)

164
6.2.3.4. Microstructure of Biscuit Dough
The roughness on surface was observed on the addition of BGF as indicated by the
encircled area. Whereas the structure of control sample (only simple wheat flour without
addition of BGF) had showed very smooth surface confirming formation of gluten matrix
and starch association only. The other images reflected the major changes on the
characteristics of surface. A complex picture was produced by the collaboration of
different starches (wheat and BGF) and their interactions with different gluten proteins.
Long white lines represented the interactions between the egg proteins, wheat starch and
gluten. The white line developed itself frequently very sharp but decreased in length
because of mixing. The smaller granules were replacing the large pieces of starch as
mentioned in fig. 122 (d), it may be due to the reason that proteins present in BGF made
matrix with shorter starch granule. The starch granules are usually intermingled in the
matrix with gluten. Bounding of starch and protein line was even shorter but was more
frequent when the concentration of BGF was increased from (b) to (d).
Figure 122: (a) control (b) 2 gm BGF added dough (c) 4 gm BGF added dough and (d)
6 gm BGF added dough respectively.
a b
d c

165
6.2.3.5. Dimensional/textural quality
The recipe of control cookie was comprised of 5 g liquid egg (whole) whereas egg was
replaced by BGF at the concentration of 2gm, 4gm and 6gm in wheat flour. 2 gm BGF
substituted flour provided best dimensional properties in comparison with controls and
other concentration too. The texture of cookies was also found to be excellent as
highlighted in table 41.
Table 41. End product quality
Black gm/125gm flour)
Diameter, mm
Weight, gm
Height, mm
Force Break, N
0 48.10±0.3 8.33±0.1 8.39±0.2 23.14±1.3
2 48.80±0.1 8.00±0.3 8.51±0.3 07.37±0.6
4 48.31±0.4 8.35±0.3 8.71±0.1 11.44±1.2
6 47.80±0.3 8.49±0.3 8.93±0.4 15.52±1.1

166
6.2.3.6. Sensory Analysis:
The factor of consumer acceptance decreased overall as BGF was increased (table 42).
The taste attribute that is the highly important and critical factor in sensory was observed
improved at the concentration of 2 gm of BGF. Bitter taste was sensed on increased
concentration of BGF. The texture of the cookie was as good as the control recipe and in
certain parameters produced better texture. Color of crumb and overall appearance of
the cookie improved in case of 2 g BGF added cookie.
Table 42. Eating quality of BGF added biscuit.
Black gm/125gm flour)
Appearance (10)
Color (10)
Crumb (10)
Taste (20)
Texture (20)
Mouthfeel (10)
Total Score (80)
0 8.5±1.5a 9.2±1.0a 8.2±0.99a 18.7±1.17a 17.8±2.01a 9.3±0.73ab 71.8
2 8.1±1.06ab 8.6±1.15a 8.9±0.97a 18.5±0.88a 18.2±1.15a 9.5±0.60a 71.9
4 7.5±1.47bc 7.8±1.2b 7.5±1.23
b 15.3±1.22
b 16.8±1.54b 8.8±0.83bc 63.8
6 7.1±1.33c 7.2±1.21b 6.9±1.39
b 14.4±0.88c 15.2±1.32c 8.6±1.09c 59.4
Mean value ± S.D with the different alphabets (superscript) within a column are
significantly different from each other. Values are calculated with Duncan method
(P<0.05). (no. of panelist = 15)
6.2.4. Conclusion
It may be concluded that BGF is one of the suitable replacement of egg in cookies. It for
sure increases the nutritional status of cookie. Concentration of 2 gm/125 gm of wheat
flour was found to be the most appropriate limit for the replacement which produced
cookies with good eating quality. Industries must look for the adoption of replacement
of egg with Mash bean flour or black gram flour to get full benefit associated with these
lentils/beans.
The nutrition and diet experts are advising strongly the consumption of legumes (daal) in
daily diet for variety of reasons. Firstly the legumes are recognized as cholesterol
lowering components while egg being rich in cholesterol has limitation in diet. The
legume starch consist resistant starch which is a beneficial dietary fiber. The dietary fibers

167
are not present in eggs. The BGF enriched biscuit after replacing egg will be economical
as eggs are the expensive ingredients of the recipe. It should also be considered that only
2 gm of BGF may replace 5 gm of egg liquid, it is an important alternative for cost
reduction. Secondly, some especial categories of consumers do not consume egg because
of religious restrictions and allergy.
The research opens the door for further research and their role in new product
development for food industries. The legume proteins hydrolysate, modified legume and
wheat starches are unique as ingredients because of their multiple functionalities, they
are the promise for high future in food products.

168
REFERENCES:
AACC, (2000). Approved Methods of American Association of Cereal Chemists, 10th
ed. The Association, St. Paul, MN, USA.
Ahmad, M. and M.A. Arain. (1999). Effect of dough simulation on grain weight,
protein and lysine content of bread wheat. Pak. J. Bot., 31, 109-114.
Ahmed, R., Ali, R., Khan, M.S., Sayeed, S.A., Saeed, J. and Yousufi, F. (2015). Effect of
proteases and carbohydarse on dough Rheology and End quality of cookie. American
Journal of Food Sceince and Nutrition Research. 2(2), 62-66
Ali, R., M.S. Khan, S.A. Sayeed, R. Ahmed, S.M.G. Saeed and L. Mobin. (2014).
Relationship of damaged starch with some physicochemical parameters in
assessment of wheat flour quality. Pak. J. Bot., 46 (6), 2217-2225.
Amal A. Hassan. (2013). Improving dough rheology and cookie quality by protease
enzyme. American Journal of Food Science and Nutrition Research, 1(1), 1-7
Angioloni, A., Collar, C., 2012. High legume-wheat matrices: an alternative to
promote bread nutritional value meeting dough viscoelastic restrictions. European
Food Research and Technology 234, 273-284.
Anjum, F.M. and Walker, C.E. (1999). Grain, flour and bread-making
properties of eight Pakistani hard white spring wheat cultivars grown at three
different locations for 2 years. International Jouranl of Food science and Tech.,
35(4), 407-416
Aprodu, L., Banu, L., Stoenescu,G. and Ionescu, V. (2010). Effect of the industrial
milling process on the rheological behavior of different types of wheat flour. St. Cerc.
St. 11(4), 429-437

169
Barak, S., Mudgil, D. and Khatkar, B. S. (2014). Effect of flour particle size and
damaged starch on the quality of cookies. Journal of Food Science and Technology.
51(7), 1342-1348
Barrera, G. N., Perez, G. T., Ribotta, P. D. and Leon, A. E., (2007). Influence of damaged
starch on cookie and bread making quality. Eur Food Res Technol, 22(5), 1-7.
Belderok B, Mesdag H, Donner DA (2000) Bread-Making Quality of Wheat.
Springer, New York
Borsuk, Y., Arntfield, S. Lukow, O. M., Swallow, K. Malcolmson, L. (2012).
Incorporation of pulse flours of different particle size in relation to pita bread quality.
Journal of Food and Agriculture, 92(10), 2055-2061
Charun, E., Abecassis, J., Contamine, A.S., Roulland, T.M., Vergnes, B., and Morel,
M.H. (2000). Effect of temperature and mechanical input on semisweet biscuit
(cookie) quality and dough characteristics. Cereal Chem., 77(3), 265-271
Colombo, A., G.T. Perez, P.D. Ribotta and A.E. Leon. (2008). A comparative study of
physicochemical tests for quality prediction of Argentine wheat flours used as
corrector flours and for cookie production. Journal of Cereal Science, 48(3), 775-780.
Des-Marchais, L. P., Foisy, M., Mercier, S., Villeneuve, S., Mondor, M., 2011. Bread-
making potential of pea protein isolate produced by a novel ultra
filtration/diafiltration process. Procedia Food Science, 1, 1425–1430.
Diosi, G., More, M. and Sipos, P. (2015). Role of Farinograph test in the wheat flour
quality determination. Acta Univ. Sapientiae, Alimentaria, 8, 104-110
Du, S.K., Jiang,H., Yu, X. and Jane, J.L. (2013). Physicochemical and functional
properties of whole legume flour. Food Science and Technology, 55(1), 308-313.
Duyvejonck, E. A., Lagrain, B., Pareyt, B., Courtin, C. M., and Delcour, J. A. (2011).
Relative contribution of wheat flour constituents to solvent retention capacity
profiles of European wheat. Journal of Cereal Science, 53, 312-318.

170
Eissa, A., Hussein, A. S., & Mostafa, B. E. (2007). Rheological properties and quality
evaluation of Egyptian balady bread and biscuits supplemented with flours of
unterminated and germinated legume seeds or mushroom. Polish Journal of Food
and Nutrition Sciences, 57, 487–496.
El-Porai, E.S., Salama, A.E., Sharaf, A.M., Hegazy, A.I. and Gadallah, M.G.E. (2013).
Effect of different milling processess on Egyptian wheat flour properties and pan
bread quality. Annals of Agricultural science. 58(1), 51-59
Færgestad, E.M., E.M. Magnus, S. Sahlström and T. Næs. 1999. Influence of flour
quality and baking process on hearth bread characteristics made using gentle mixing.
Journal of Cereal Science, 30(1), 61-70.
Furest, E. P., Anderson, J.V., and Morris, C.F. (2006). Polyphenol oxidase in wheat
grain: whole kernel and bran assays for total and soluble activity. Cereal Chem. 83,
10-16.
Gangadharappa, G. H., Ramakrishna, R., and Prabhasankar, P. 2008. Chemical and
scanning electron microscopic studies of wheat whole-meal and its streams from
roller mill flour. J. Food Eng. 85, 366-371
Glenn, G.M and Johnston, R.K. (1992). Mehcanical-properties of starch, protein and
endosperm and their relationship to hardness in wheat. Food Struct. 11,187-199
Grah, A. M. B., Beda, M. Y., Aubin, P Dakia, Niaba, K. P.V. and Gnakri, D. (2014).
Manufacture of Biscuit from the flour of wheat and lentil seeds as a food supplement.
European Journal of Food Science and Technology, 2(2), 23-32.
Guttieri, M.J., C. Becker and E. Souza. (2006). Application of wheat meal solvent
retention capacity tests within soft wheat breeding populations. Cereal Chemistry,
81(2), 261-266.
Haynes, L.C., A.D. Bettge and L. Slade. (2009). Soft wheat and flour products methods
review: solvent retention capacity equation correction. Cereal Foods World, 54(4),
174-175.

171
Hera, Esther de la, Ruiz-Paris, E. Oliete, B. Gomez, M. (2012). Studies of the quality
of cakes made with wheat-lentil composite flours. Food Science & Technology, 49(1),
48-54
Iqbal, Z., I. Pasha, M. Abrar, M.S. Hanif and S.M. Arif. (2015). Protein concentrate,
composition and distribution in wheat flour mill streams. Annals. Food Sci and Tech.,
16 (1), 220-231
Kadam, M. L., Salve, R. V., Mehrajfatema, Z. M., More, S. G., 2012. Development and
evaluation of composite flour for Missi roti/chapatti. Food Process & Technology. 3,
100-134.
Kamaljit, K., Baljeet, S., & Amarjeet, K. (2010). Preparation of bakery products by
incorporating pea flour as a functional ingredient. American Journal of Food
Technology, 5, 130–135.
Kara, M., Sivri, D. and Koksel. H. 2005. Effects of high protease-activity flours
and commercial proteases on cookie quality. Food Research International 38,
479-486.
Kaur, A., Singh, N., Kaur and K. Seeratpeet. (2014). Relationship of flour solvent
retention capacity, secondary structure and rheological properties with the cookie
making characteristics of wheat cultivars. Food Chem., 158: 48-55.
Keskin, S., H. Ozkaya and S. Turksoy. (2012). Effects of damaged starch on
physiochemical properties of wheat flour and its bread making potential. Akademik
Gida., 10(2), 14-18.
Kohajdová, Z., Karovičová, J. and Magala.M. (2013) Rheological and qualitative
characteristics of pea flour incorporated cracker biscuits. Croat. J. Food Sci. Technol.
5, 11-17.
Kohajdova.Z. Karovičová.J. and Magala.M.(2013).Effect of lentil and bean flours on
rheological and baking properties of wheat dough. Versita, Chemical Papers 67(4),
398-407.

172
Koppel, R. and Ingver, A. (2010). Stability and predictability of baking quality of winter
wheat. Agronomy Research 8(III), 637-644
Liu, C., L. Liu, L. Li and X. Wang. 2015. Effects of different milling process on whole
wheat flour quality and performance in steamed bread making. Lebensmittel-
wissenchaf und-technologie, 62(1), 310-318.
Ma, Z., Boye, J. I., Simpson, B. K., Prasher, S. O., Monpetit, D., Malcolmson, L., 2011.
Thermal processing effects on the functional properties and microstructure of lentil,
chickpea, and pea flours. Food Research International, 44, 2534–2544.
Moiraghi, M., Vanzetti, L., Bainotti, C., Helguera, M., Leon, A.E. and Perez, G. (2011).
Relationship between soft wheat flour physicochemical composition and cookie-
making performance. Cereal Chemistry, 88, 130-136.
Murugkar, D. A., Kotwaliwale, N., Gupta, C., Gulati, P. and Kumar, M. (2015).
Optimization of Soy-Butter from Sprouted Soybean and its Quality
Parameters. Journal of Food Quality banner. 37(1), 63-72
Noor, A .A., Noor, M., A.Y. and Ho, L.H. (2012). Physicochemical and organoleptic
properties of cookies incorporated with legume flour. International Food Research
Journal, 19(4), 1539-1543.
Noorka, I. R., S.U. Rehman, J.R. Haidry, I. Khaliq, S. Tabassum and G.M.U. Din. (2009).
Effect of water stress on physico-chmeical properties of wheat (Triticum Aestivum
L.). Pak. J. Bot., 41(6), 2917-2924.
Patel, M.J., Ng, J.H.Y., Hawkins, W.E., Pitts, K.F. and Chakrabarti-Bell S. 2012.
Effect of Fungal alpha amylase on chemically leavened wheat flour doughs.
Journal of Cereal Science, 56, 644-651.
Patel, M.J., Ng, J.H.Y., Hawkins, W.E., Pitts, K.F. and Chakrabarti-Bell, S. (2012). Effect
of Fungal alpha amylase on chemically leavened wheat flour doughs. Journal of
Cereal Science 56, 644-651.

173
Pérez.S. Matta.E., Osella.C., TorreM.D.L. and Sánchez.H.D. (2013). Effect of soy flour
and whey protein concentrate on cookie color. Food Science and Technology. 50(1),
120-125
Posner, Richard A., Antitrust in the New Economy (November 2000). U
Chicago Law & Economics, Olin Working Paper No. 106. Available at SSRN:
https://ssrn.com/abstract=249316 or http://dx.doi.org/10.2139/ssrn.249316
Prbhasanker, P., Sudha, M.L. and Rao, P. H. (2000). Quality characteristics of wheat
flour milled streams. Food research international, 33, 381-386
Ragaee, S and E.-S.M. Abdel-Aal. (2006). Pasting properties of starch and protein in
selected cereals and quality of their food products. Food Chemistry, 95(1): 9-18.
Ragaee, S., G.L. Campbell, G.J. Scoles, J.G. McLeod and R.T. Tyler. (2001). Studies on
rye (Secale cereala L.) lines exhibiting a range of extract viscosities. Journal of
Agriculture and Food Chemistry, 49(5), 2446-2453.
Ram, S. and Singh, R.P. (2004). Solvent retention capacity of Indian wheats and their
relationshipt with cookie making quality. Cereal chemistry 81, 128-133.
Ram, S., Dawar, V., Singh, R. P., and Shoran, J. (2005). Application of solvent retention
capacity tests for the prediction of mixing properties of wheat flour. Journal of Cereal
Science, 42, 261–266.
Ramrez- Suarez, J.C., Addo,. K. and Xiong, Y.L. (2005). Gelation of mixed
myofibrillar/wheat gluten proteins treated with microbial transglutaminase. Food
Research International, 38, 1143-1149.
Rehman, S., M.M. Ahmad, I.A. Bhatti, R. Shafique, G.U. Mueen and A.M. Murtaza.
(2006). Effect of pearling on physic-chemical reheological characteristics and phytate
content of wheat-sorghum flour. Pak. J. Bot., 38(3), 711-719.

174
Rogers. D.E., R.C. Hoseney, G.L. Lookhart, S.P. Curran, W.D.A. Lin and R.G. Sears.
(1993). Milling and cookie baking quality of near isogenic lines of wheat differing in
kernel hardness. Cereal Chem., 70, 183-187.
Shah.H.U.Khan.U.L., Alam S., Shad. A.A., Iqbal.Z., and Parveen.s., (2011). Effect of
home cooking on the retention of various nutrients in commonly consumed pulses
in Pakistan. Sarhad J. Agric. 27(2), 279-284
Singh, M and B.S. Khatkar. (2005). Structural and functional properties of wheat
storage proteins: a review. J. Food Sci. Technol., 42(6), 455-471.
Souza, E. J., Guttieri, M. J. and Sneller, C. (2011) Water-Extractable Nonstarch
Polysaccharide Distribution in Pilot Milling Analysis of Soft Winter wheat.
Cereal Chem. 88(5), 525–532
Stasio, M.D., Vacca, P., Piciocchi,N., Meccariello, C,. Volpe, M., Stasio, M.D., Vacca,
P., Piciocchi, N., Meccariello, C. and Volpe, M.G. (2007). Particle size distribution and
starch damage in some soft wheat cultivars. International Journal of Food Science
and Technology, 42(2), 246-250.
Sudha, M., Vetrimani, R., and Leelavathi, K. (2007). Influence of fiber from different
cereals on the rheological characteristics of wheat flour dough and on biscuit quality.
Food Chemistry, 100, 1365-1370.
Symons, S.j., and Dexter, J. E. (1996). Aleurone and pericarp flourenscence as
estimators of mill streams refinement for various Canadian wheat classes. J. Cereal
Sci. 23:73-83
Tiwari, B. K., Brennan, C. S., Jaganmohan, R., Surabi, A., Alagusundaram, K., 2011.
Utilisation of pigeon pea (Cajanus cajan L) byproducts in biscuit manufacture. Food
Science and Technology, 44, 1533–1537.
Uhlman, J., Schumacher, J., 2014. Sensory and Objective Evaluation of Pumpkin Bars
using 12 Ground Flaxseed or Sweet Potato Baby Food as Egg Replacers. International
Journal of Advanced Nutritional and Health Science 2(1), 89-97.

175
Waters, D.M., Ryan, L.A.M., Patrick, G., Arendit, M.E.K. and Tuohy, M.G. (2011).
Characterisation of a Talaraomyces emersonii thermostable enzyme cocktail with
application in wheat dough rheology. Enzyme and microbial Technology. 49, 229-236.
Wieser, H. and R. Kieffer. 2001. Correlations of the amount of gluten protein types
to the technological properties of wheat flours determined on a micro-scale. Journal
of Cereal Science, 34(1), 19-27.
Wieser, H., S.L.K. Hsam and F.J. Zeller. (2003). Relationship between the qualitative
and quantitative compositions of gluten protein types and technological properties
of synthetic hexaploid wheat derived from Triticum durum and Aegilops tauschii.
Cereal Chemistry, 80(3), 247-251.
Yoo. C. Y, Pence, H. E, Hasegawa P. M and Mickelbart M.V. (2009) Regulation
of Transpiration to Improve Crop Water Use, Critical Reviews in Plant Sciences,
28(6), 410-431, DOI: 10.1080/07352680903173175
Zhang, Q., Zhang, Y., Zhang, Y., He, Z. and Pena, R.J. (2007). Effects of solvent
retention capacities, pentosan content, and dough rheological properties on sugar
snap cookie quality in Chinese soft wheat genotypes. Crop Scienec 47, 656-664
Zucco, F., Borsuk, Y., Arntfield, S.D. (2011). Physical and nutritional evaluation of
wheat cookies supplemented with pulse flours of different particle sizes. Food
Science and Technology, 44, 2070-2076.
Colombo, A., Perez, G.T., Ribotta, P.D. and Leon, A.E. (2008). A comparative study of
Physicochemical tests for quality prediction of Argentine wheat flours used as
corrector flours and for cookie production. Journal of Cereal Science, 48, 775-780.
Wade, B. B, Rayas-Duarte, P. and Dasheng Ji, D. (2012). Predicting rheological
properties of wheat dough based on wheat characteristics. Journal of Agricultural
Sceince. 4(3), 79 – 84.
Campbell, G. (2007). Roller milling of wheat, Handbook of powder technology, 383-
419

176
Fustier, P., F. Castaigne. S.L. Turgeon and C.G. Biliaderis. (2009). Impact of
commercial soft wheat flour streams on dough rheology and quality attributes of
cookies. J. Food Eng., 90, 228-237.
Gaines, C.S., Reid,F. J., Kant, C. V. and Morris, C.F. (2006). Comparison of methods for
gluten strength assessment. Cereal Chemistry, 83(3), 284-286.
Gaines, C.S., Donelson, J.R. and Finney, P.L. (1988). Effects of damaged starch,
chlorine gas, flour particle size, and dough holding time and temperature on cookie
dough handling properties and cookie size. Cereal Chem., 65(5), 384-389.
Geng, Z., Zhang, P., Yao, J., Yang, D., Ma, H., and Rayas-Duarte, P. (2012).
Physicochemical and Rheological Properties of Chinese Soft Wheat Flours and Their
Relationships with Cookie-Making Quality. Cereal Chemistry, 89 (5), 237-241
Madhugiri, L., Sudha, R., Krishan and Leeavathi. (2008). Relationship between the
protein content and cookie making quality of different mill streams. Adv. Food Sci.
30(2), 70-77.
Related Documents