Do grammar schools increase or reduce inequality? 1 Simon Burgess*, Matt Dickson** and Lindsey Macmillan*** February 2014 *Department of Economics and Centre for Market and Public Organisation, University of Bristol, UK. ** Department of Social and Policy Sciences, University of Bath, UK. ***Department of Quantitative Social Science, Institute of Education, UK. Abstract There is much debate on both sides of the Atlantic concerning the merits of schooling systems that select students on the basis of academic ability. In the UK the debate concerns the existing inequality in access to high quality schools and whether a selective (grammar school) system is better at reducing inequality and promoting social mobility than a system where proximity determines access to schools. In the latter case (the comprehensive system), variation in school quality induces variation in local house-prices and this can act as a bar, preventing poorer students from accessing the higher quality schools. Proponents of the selective system – which sees the highest ability students attending the elite “grammar schools” – suggest that it is a pro-social mobility policy option, allowing bright students from poorer backgrounds to access the best schools. Unlike the existing literature, rather than focusing on the impact of grammar attendance (or not) on the marginal student who just passes (fails) the selection exam, this paper considers the impact of the grammar school system on the level of inequality in the whole of the earnings distribution later in life. We find that the wage distribution of individuals who grew up in areas operating a selective schooling system is significantly more unequal than that of individuals who grew up in areas with the comprehensive system. JEL Classifications: I24, J31 Key words: selective schooling, inequality, wages 1 Many thanks to Damon Clark for compiling the data on selectivity of local education authorities and to Stephen Jenkins, John Hills and John Micklewright for their comments. Thanks also to seminar participants at the Bristol-Bath applied micro-workshop and participants at the CASE Research Workshop and the Department of Quantitative Social Science seminar series.

Welcome message from author
This document is posted to help you gain knowledge. Please leave a comment to let me know what you think about it! Share it to your friends and learn new things together.
Transcript
Do grammar schools increase or reduce inequality?1
Simon Burgess*, Matt Dickson** and Lindsey Macmillan***
February 2014
*Department of Economics and Centre for Market and Public Organisation,
University of Bristol, UK.
** Department of Social and Policy Sciences, University of Bath, UK.
***Department of Quantitative Social Science, Institute of Education, UK.
Abstract
There is much debate on both sides of the Atlantic concerning the merits of schooling
systems that select students on the basis of academic ability. In the UK the debate concerns
the existing inequality in access to high quality schools and whether a selective (grammar
school) system is better at reducing inequality and promoting social mobility than a system
where proximity determines access to schools. In the latter case (the comprehensive system),
variation in school quality induces variation in local house-prices and this can act as a bar,
preventing poorer students from accessing the higher quality schools. Proponents of the
selective system – which sees the highest ability students attending the elite “grammar
schools” – suggest that it is a pro-social mobility policy option, allowing bright students from
poorer backgrounds to access the best schools. Unlike the existing literature, rather than
focusing on the impact of grammar attendance (or not) on the marginal student who just
passes (fails) the selection exam, this paper considers the impact of the grammar school
system on the level of inequality in the whole of the earnings distribution later in life. We
find that the wage distribution of individuals who grew up in areas operating a selective
schooling system is significantly more unequal than that of individuals who grew up in areas
with the comprehensive system.
JEL Classifications: I24, J31
Key words: selective schooling, inequality, wages
1 Many thanks to Damon Clark for compiling the data on selectivity of local education authorities and to
Stephen Jenkins, John Hills and John Micklewright for their comments. Thanks also to seminar participants at
the Bristol-Bath applied micro-workshop and participants at the CASE Research Workshop and the Department
of Quantitative Social Science seminar series.

1
1. Introduction
Grammar schools continue to be a prominent issue in policy proposals in England. More
generally, the debate continues about inequality in access to high quality schools, and the best
system for the assignment of students to schools to reduce the inequality. A grammar school
system assigns students on the basis of a test score (in England this is taken at age 11) with
passing students typically attending grammar schools while failing students typically attend
secondary moderns. In non-grammar schools systems, there is no selection on test scores,
with all students theoretically having the same choice set of schools.
The proponents of grammar schools argue that they enhance social mobility by offering poor,
bright students a route to attend the best schools, although evidence on access to grammar
schools suggests that children from deprived families are less likely to attend a grammar
school, even conditional on attainment at age 11 (Cribbs et. al., 2013). Indeed, a quick look at
the league tables of attainment gaps between Free School Meals (FSM)2 and non-FSM
children at age 16 (Key Stage 4 in the English schooling system) by Local Education
Authority (LEA) confirms that those LEAs that are still selective today are commonly found
to be poor performers in terms of educational inequality3.
Alongside this debate on access to grammar schools, much of the previous research on this
topic has considered the impact of attending a grammar school on the marginal student’s
attainment4, focusing on the shorter and longer term benefits to those students who ‘make it’
to a grammar school. These types of analysis commonly use regression discontinuity designs
to compare the outcomes of students just above and just below the entrance test threshold to
access selective schools. However these studies say little about differences across selective
and non-selective systems. Here we move away from the debate on fair access to grammar
schools and considering the benefits to the marginal student to focus on a more systemic
question: does a grammar school system increase or reduce inequality?
We use data from a large-scale household panel dataset to study students growing up in
England, some in grammar schools areas, others not. This allows us to examine the effect of
growing up in a selective schooling area on their earnings observed later in life. The richness
2 Free school meal eligibility is based on parental resources and is a standard marker of disadvantage in the UK.
3
https://docs.google.com/spreadsheet/ccc?key=0At6CC4x_yBnMdDRBUEM1UEFZOVptOHI0amRDaG1SQXc
&usp=sharing#gid=3 (accessed 28th
January, 12.08pm). 4 Clarke (2010), Abdulkadiroglu, Angrist and Pathak (2011), Dobbie and Fryer (2011)
2
of the data means that we can control for the parental background of the individual. We
compare the spread of the earnings distribution in middle age of those growing up in selective
schooling areas and those growing up in very similar non-selective areas, controlling for
parental background and the labour market characteristics of the local area where the
individual now lives.
We find evidence that individuals who grew up in an area operating a selective schooling
system have a more unequal wage distribution in later life, compared with individuals who
grew up in areas without selection. Those growing up in selective systems who make it to the
top of the earnings distribution are significantly better off compared to their non-selective
counterparts. For those at the bottom of the earnings distribution, those growing up in a
selective system earn significantly less than their non-selective counterparts. These
differences remain after controlling for a range of background characteristics and current
local area. There are both winners and losers from the grammar system: the additional
earnings differential between the 90th
and 10th
percentile in selective systems accounts for 12-
15% of the total 90-10 earnings gap. This is in line with evidence from Atkinson, Gregg and
McConnell (2006) who find that in selective LEAs grammar-educated pupils perform
considerably better at age 16 than their non-selective LEA counterparts while non-grammar
educated pupils do worse.
In the next section we review the related literature on the impact of selective systems on later
outcomes before describing the framework for our analysis in section three. Our empirical
approach and the data used are outlined in section four and our results are presented in
section five. We end with some brief conclusions.
2. Related literature
As noted, much of the previous literature on selective schools tends to focus on the benefit to
the marginal student of attending a grammar school compared to not attending. In the UK,
Clark (2010) uses access data from East Ridings (a local government district in the north of
England) to estimate the causal impact of attending a grammar school on attainment at 16, the
types of course taken and university enrolment. He finds small effects of grammar schools on
test scores at 16 but larger effects on longer-run outcomes such as taking more advanced
courses and more academic courses – which allow access to A-levels and university
enrolment. Similarly, Clark and Del-Bono (2014) implement a regression discontinuity
3
design to assess the impact of attending a grammar school for a cohort of young people born
in Aberdeen in the 1950s. They find large effects on educational attainment, and for women
there are long-run impacts labour market outcomes and reduced fertility. For men there were
no long-term impacts identified. Abdulkadiroglu, Angrist and Pathak (2011) and Dobbie and
Fryer (2011) assessed the impact of attending exam schools in Boston and New York on
attainment and test scores. Both studies found limited impacts on student achievements from
attending these selective schools, though Dobbie and Fryer (2011) found positive effects on
the rigour of the types of courses taken.
Sullivan and Heath (2002) and Galindo-Rueda and Vignoles (2005) used the NCDS data
from the UK to compare the outcomes of those attending grammar schools to comprehensive
schools and secondary moderns. Both use a value-added approach alongside school-level
controls to assess the impact of the different schools on educational attainment. In addition,
Galindo-Rueda and Vignoles (2005) also instrument school type with the political power of
the LEA at the time, arguing that the political power of the constituency at the time of reform
affected the speed at which the systems were switched from selective to mixed schooling.
Both studies find significant positive effects on attainment of grammar education compared
to comprehensives although Manning and Pischke (2006) use a falsification test of value-
added from age 7 to 11 to show that these studies are still affected by selection bias.
These studies say little about differences across selective and non-selective systems.
Atkinson, Gregg and McConnell (2006) and Jesson (2000) use more recent NPD/PLASC
data to compare LEAs that are still selective now to non-selective LEAs. These studies are
therefore more in line with our research, comparing the outcomes of pupils in systems as a
whole rather than the outcomes of the marginal pupil who makes it into a grammar school.
Both Jesson (2000) and Atkinson et. al. (2006) use NPD data to compare value added
attainment across selective and non-selective LEAs. While Jesson (2000) is open to the
critique of Manning and Pischke (2006) that value-added alone does not remove selection
bias, Atkinson, Gregg and McConnell (2006) match LEAs to attempt to control for this. They
show that prior attainment when comparing selective LEAs to the comprehensive population
as a whole is much higher in the selective LEAs but when comparing prior attainment in the
matched LEAs, this is very similar. While neither study finds evidence of higher attainment
across selective and non-selective systems as a whole, Atkinson, Gregg and McConnell
(2006) find that grammar-educated children in selective LEAs outperform similar children in
non-selective LEAs on average while non-grammar-educated children in selective LEAs
4
underperform compared to similar children in non-selective LEAs. This is in line with our
findings of greater inequality in earnings later in life for those from selective LEAs.
3. Framework
A grammar school system, assigning individuals to schools based on their performance on a
test, is one way of assigning students to schools. In order to compare outcomes from this
system to others we consider the main alternatives, namely neighbourhood schooling (each
student goes to her local school) and school choice. In England, the latter involves students
nominating a number of school preferences. However, given that the better schools quickly
become over-subscribed and the criterion for assigning students in this case becomes
proximity of the student’s home to the school, school choice quickly reduces down to
neighbourhood schooling. We therefore consider the differences in outcomes between two
systems where, in their simplest form, one allocates pupils to schools based on ability5 and
one allocates pupils to schools based on proximity.
Why should one system imply greater inequality? Here is a very simple ideal-type framework
for thinking about this:
Think of a population, where students have ability, a, and parental resources, r. These have
distributions with variances σ2
a and σ2
r; they are positively correlated with covariance σar.
The schooling outcome, s, for student i depends on ability, school quality, q, and peer group
quality, ̅:
si=s(ai, ̅i,qi).
Later adult earnings depend on both the ability of the student and their schooling outcome:
where γ is the relative weight on schooling.
To determine the relative impacts of the alternative schooling systems on earnings inequality,
we must evaluate how each system translates ability into outcomes and therefore what each
5 Of course there are issues concerning whether the tests used actually measure ability. Given the role of
‘tutoring to the test’, they are more likely to be measuring some mix of ability and attainment although this is
not central to our analysis here.
5
system implies for ̅(a) and q(a) – that is, how each system relates student ability to peer
group ability and student ability to teacher quality.
Grammar system – assignment through selection on ability
By definition, grammar school systems sort pupils based on their ability: so ̅(a) will be
positive and very strong. Schools with high ability pupils are attractive to high ability
teachers, hence we assume grammar schools attract and retain high quality teaching staff,
hence q(a) will be positive and strong.
si=s(ai, ̅i(ai), qi(ai)) =sg(ai) and earnings will be: ( )
Comprehensive system – assignment through residential proximity to school
Here we assume that the high quality schools are randomly distributed around an area.
However, because of the proximity rule, families with high level of resources (high r) cluster
around the good schools, so the quality of the school is related to parental resources: q(r). As
a covariance exists between r and a, we can write this as q(r(a)). This also induces variation
in peer groups, so ̅(a) again, but only through r. Therefore there is also a positive association
between peer groups and ability and teaching quality and ability in this system, although
these work through the correlation between r and a rather than directly as in the grammar
system.
si=s(ai, ̅i(r(ai)), qi(r(ai))) =sc(ai) and earnings will be: ( ).
Returning to how these systems impact on earnings, they are determined by:
( ) where k = g (grammar) or c (comprehensive).
What is ( ( ))and ( ( ))? The variance of a function of a, can be approximated
by ( ( )) { ( ( ))}
, hence the variances can be characterised as:
( ( )) {( ( ))}
, where k = g (grammar) or c (comprehensive).
Consequently, varg(y) < or > varc(y) depending on whether ( )
< or >
( )
.
Therefore how the schooling system creates more equal or unequal wage distributions
depends, among other things, on how the two systems translate individual ability into
schooling outcomes. As we have seen, this will depend on how individual ability is related to
6
peer group ability and how individual ability is related to school (teacher) quality in each
system, both directly and indirectly via parental resources. These are empirical questions that
we bring to the data.
4. Empirical analysis
To estimate the impact of selective systems compared to non-selective systems we would
need to be living in an ideal world. Imagine two communities of identical families, growing
up separately. One community has a grammar school system; the other has a comprehensive
system (allocation by proximity). Following their education, both sets of individuals go on to
work in the same labour market. A comparison of the distribution of wages amongst those
who grew up in the selective system with the distribution for those who grew up in the non-
selective system, would tell us something about the impact of selective schooling on the
whole distribution of wages.
Unfortunately such a thought experiment cannot be run in practice and we therefore have to
use empirical methods to get as close to this ideal world as possible. In order to empirically
test our model, we need to be able to compare the distribution of wages for individuals who
grew up in LEAs operating a selective mechanism for allocating students to schools, with the
distribution amongst individuals who grew up in areas that were very similar along a number
of relevant dimensions but that were operating the comprehensive system. This should ensure
that we are not incorrectly attributing the effects of other area characteristics on later wages
to the effect of growing up in a selective school area.
We use Understanding Society for our empirical analysis. This is a large longitudinal panel
study following approximately 40,000 households in the UK, beginning in 2009. Information
is collected from all individuals in the household aged 16 and over, on a wide range of topics,
including parental background, labour market status and earnings. We make use of the
special license release of the data, which includes the individual’s age, current local authority
of residence and crucially for our purposes, the local authority district where the individual
was born. Each wave is collected over 24 months: the first was collected between January
2009 and January 2011, the second between January 2010 and January 2012 – we make use
of both waves in our analysis.
7
Defining selectivity
We begin by defining LEAs at birth as selective or non-selective. Selectivity of an area is
calculated using school level data from the Annual Schools Census: schools are allocated to
their Local Education Authority then the aggregated LEA data is used to calculate the
percentage of children aged 136 in the LEA who had a place allocated by the selective system
(grammar or secondary modern places)7. The time-series of data runs from 1967 to 1983,
however post-1983 there has been very little further comprehensivisation (see Crook, 2013)
and so we make the assumption that the proportion of selective school places within an LEA
has remained at the 1983 level henceforth.
We define an LEA as selective if more than 20% of children in the LEA were assigned their
school place by selection. We define non-selective LEAs as those where less than 5% of 13-
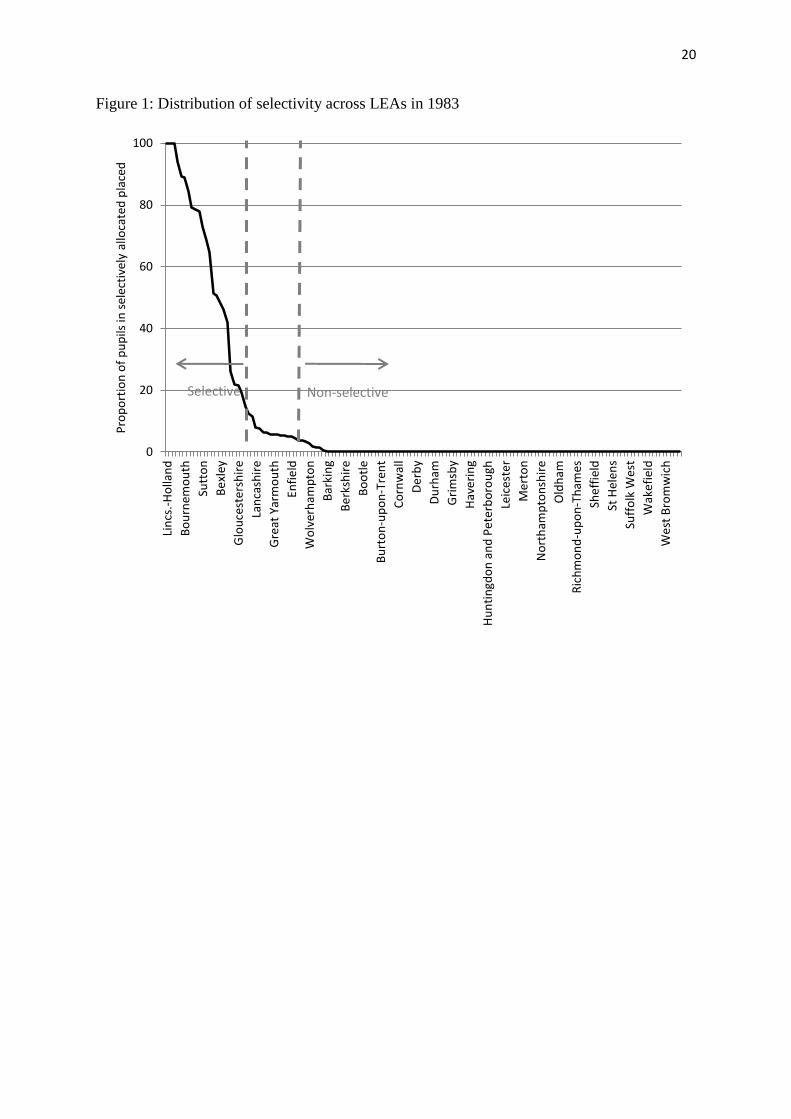
year old children were assigned by selection. As illustrated in Figure 1, given the distribution
of levels of selectivity, these thresholds mark a clear delineation between what were selective
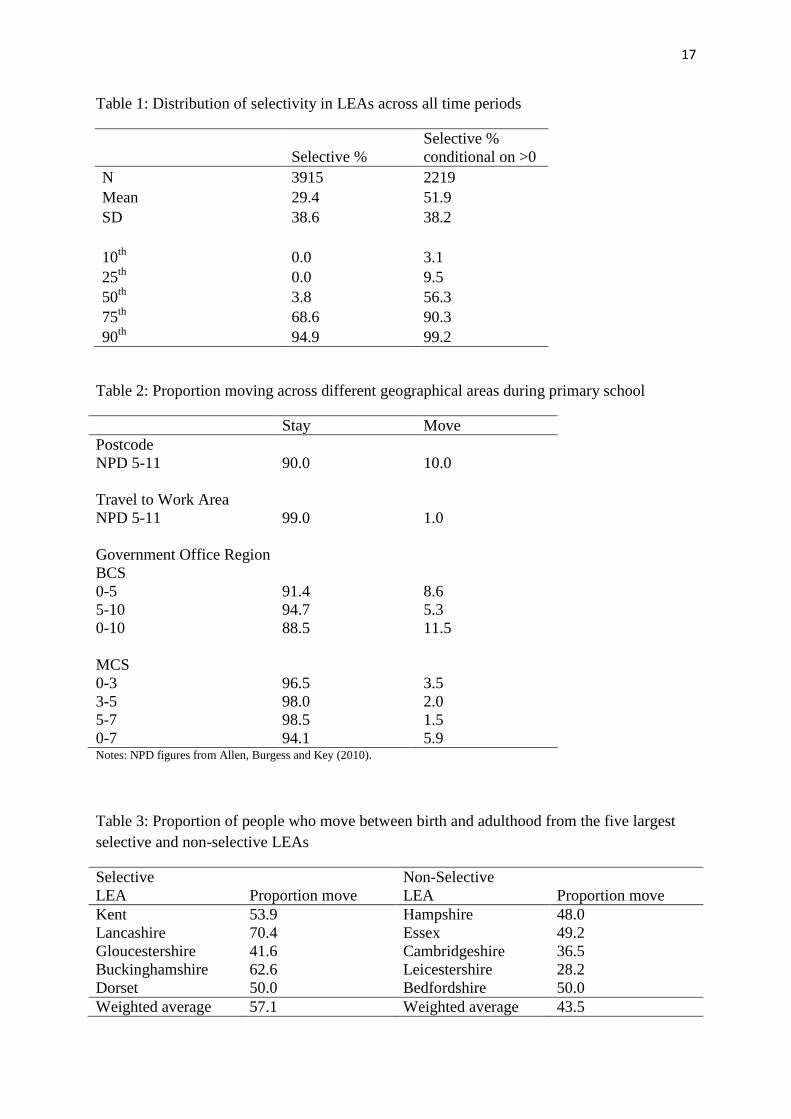
and non-selective areas. Table 1 illustrates the distribution of selectivity in LEAs across the
time period considered. 43% of LEA*time observations were 100% non-selective. Of those
with any selectivity, 65% had greater than 20% selective schools within the LEA and 60%
had greater than 30% selective schools. We consider whether our results are sensitive to these
cut-offs at the end of the results section.
Matching
Having defined selectivity, we proceed by matching selective and non-selective LEAs on the
basis of labour market and school market characteristics: the local unemployment rate8, the
local male hourly wage rate9 and the proportion of children who attend private schools in the
area10
. We select the three nearest neighbour non-selective LEAs for each selective LEA and
6 The proportions were measured at age 13 rather than 11 or 12 because in some secondary schools (upper
secondaries) children didn't start in the school until they were 13. 7 We are extremely grateful to Damon Clark for providing this data. The figures for each LEA in each year are
gender specific as there were/are a non-trivial proportion of single-sex schools in selective areas. For our
purposes, we average the male and female figures to give us an average measure of selectivity for an LEA in a
year. For the LEAs in our sample, the difference between the male and female figures is very small or zero (for
example in Understanding Society: mean of 0.66 percentage points and a median of 0.22 percentage points). 8 Taken from the Employment Gazette, 1979 to 1998, county-level tables. Unemployment rates are matched to
LEAs within counties with two LEAs in the same county taking the same unemployment rate. 9 Taken from the New Earnings Survey, 1974 to 1996, region and sub-region tables. The specific earnings
variable used to match is the average hourly earnings excluding the effect of overtime for full-time male
workers over the age of 21 whose pay for the survey pay-period was not affected by absence. 10
Compiled using the National Pupil Database 2002. Results are robust to the exclusion of private schools from
the matching process.
8
retain only matches that share common support. Individuals turned 13 in a number of
different years in our data and hence the matching of LEAs is done separately for each year
1974 to 1996. Following the matching, we retain individuals who grew up in one of the
selective or matched non-selective LEAs.
Data and methodological issues
Ideally the characteristics that we match on would all be measured at exactly the time that the
individuals attended secondary school and for the majority of our data this is the case.
However, due to the non-availability of some of this information – in part due to the
restructuring of local authority organisation during the 1970s – there is some limit to the
time-variation in the local unemployment data. In our data, only eight of the 23 years that we
include in our analysis are affected. In these cases, we have to assign the value for the nearest
available year (which is a maximum of five years distance and in the majority of cases three
or fewer)11
.
Information on the proportion of children attending private/independent schools is only
available at the local authority level from 2002 and so there is no time-variation in this
variable. However, given that the proportion of full-time pupils in private/independent
schools in England and the proportion of English schools that are private/independent has
changed very little between the time we have our measure of private school density (2002)
and the relevant period for our data (1974 to 1996)12
, it is reasonable to assume that the local
private school density has not changed too dramatically and thus our measure is relevant for
matching.
An obvious concern with our data is that we observe the LEA at birth rather than the LEA
that the individual is enrolled into in secondary school. This raises two issues: families may
cross-borders and therefore individuals may be educated in an alternative system and families
may move areas between birth and the start of secondary school. With regards to the first
issue, that some children cross LEA borders to attend schools in an alternative system to that
in which they live, we investigate the extent to which pupils cross borders in the NPD. On
average around 11% of pupils attend a school in a different LEA from their LEA of
residence. This is most likely to occur in London (over 20% cross-borders on average) where
11
In practice this means that for the years 1974 to 1978 each LEA has their 1979 level of unemployment and for
the years 1994 to 1996 each LEA has their 1993 level of unemployment. 12
See Ryan, C. and Sibieta, L. (2010) “Private schooling in the UK and Australia”, IFS Briefing Note, no. 106.

9
boroughs are close together and there is therefore less distinction between boroughs. We test
our results to see whether they are robust to the exclusion of London for this reason. We
argue that if our results are robust to this exclusion, where border crossing is most relevant,
then our results are not likely to be driven by border crossing elsewhere which will be less
prevalent.
We also argue that border crossing is likely to understate our findings to the extent to which
border crossing across systems is made by 1) those that are the most able in non-selective
systems crossing borders to attend grammar schools and 2) those who do not make it into
grammars in the selective systems crossing borders to attend comprehensives rather than
secondary moderns. In the first case, these individuals will push up the top end of the non-
selective earnings distribution if grammars increase earnings relative to comprehensives and
in the second case, these individuals will push up the bottom end of the selective earnings
distribution if comprehensives increase earnings relative to secondary moderns.
To consider the second issue, that families may move areas, we use data from two birth
cohort studies, born in 1970 and 2000, and the National Pupil Database to investigate the
extent to which we can observe families moving from birth to starting secondary school. The
birth cohort studies provide information from birth to age 10 in the British Cohort Study
(BCS) and from birth to age 7 in the Millennium Cohort Study (MCS), both at Government
Office Region (GOR) level. The National Pupil Database provides information on moves
from age 5-11 at the postcode level and Travel to Work Area (TTWA) level. As can be seen
from Table 2, the vast majority of families do not move during childhood with 10 per cent
moving to a different postcode in the NPD data and 1 per cent moving to a different travel to
work area. The data from the cohort studies suggests that while more families move before
children start school, the numbers moving are still small with 8.6 per cent in the BCS and 5.5
per cent in the MCS moving before the cohort member is 5.
A final concern with our data is that we need individuals to move between school and when
they are observed in the labour market as an adult in order to be able to separate out the effect
of the schooling system from that of the local labour market. If everyone stayed where they
went to school, our findings could be driven by the characteristics of the LEA that are related
to labour market earnings and selection of the schooling system. For example, if selective
LEAs were typically more unequal and individuals from selective LEAs stayed where they
were from as adults, we would attribute the spurious association, or indeed reverse causation
10
of inequality in selective areas, to selective areas causing inequality. Fortunately in our data,
over 50% of the sample move LEAs between birth and adulthood. As illustrated in Table 3,
this varies slightly by the type of system enrolled in with 57.1% of those growing up in
selective LEAs moving while 43.5% of those growing up in non-selective LEAs move. We
therefore argue that we have enough variation in our data to be able to separate the effect of
the school system from the effect of the LEAs labour market characteristics.
Measuring earnings inequality
We use our individuals from selective and non-selective LEAs to compare their earnings
distributions in adulthood. Hourly wages are calculated from the recorded usual gross
monthly pay including overtime, usual weekly hours and overtime hours, deflated to year
2000 £s. Zero earnings are included for individuals who are unemployed or long-term sick or
disabled at the time of the survey13
as these are viewed as valid labour market outcomes.
Given two waves of data, each individual has either one or two observations. Rather than
discarding information, where we have two wage observations for an individual we average
them and include that individual as a single observation. This averaging moves us towards a
more permanent rather than transitory measure of individuals earnings. Sixty percent of the
main estimation sample (1,469 of 2,455 individuals) have two wage observations. Prior to the
averaging, an initial regression is run to remove any year of survey effects from wages.
We begin by estimating an OLS wage regression (1) where is the average hourly wage of
individual i in LEA r, , is a dichotomous variable equal to 1 if the individual was
born in a selective LEA and 0 if they were born in a matched non-selective LEA and
is a gender specific quadratic in age. This ensures that in our baseline specification we are
comparing the earnings of similarly aged males and similarly aged females.
(1)
In addition to the effects of age and gender, there are other factors – unrelated to schooling –
that may affect current wages. In our second specification (2), our conditional model, we run
an OLS regression controlling for a vector of family background characteristics, ,
including gender, ethnicity, parental occupational class, parental education, year of the
survey (2009-2012) and also include fixed effects for the current local area, as well as the
quadratic age*gender controls. Our aim by conditioning on these additional characteristics is
13
Results are robust to the exclusion of the long-term sick and disabled.
11
to minimise the impact of any other factors that could account for differences in the variation
of earnings by the selectivity of the school system in the area the individual was born.
(2)
In both specifications, we recover the residuals from our wage regressions and compare the
distribution of earnings for those growing up in selective and non-selective systems, adjusted
for age and then additional factors. As we are interested in the relative distributions rather
than the effects on the average, we remove the global mean from the residual before
calculating the deciles of the distribution14
. We use unconditional simultaneous quantile
regressions (3), regressing adjusted earnings on the dichotomous selection variable to
estimate whether growing up in a selective system has a significant effect on earnings at each
decile (d) of the distribution of earnings.
( ̂ ) where (3)
Finally, we perform tests on linear combinations at the 90th
and 10th
percentiles and 75th
and
25th
percentiles to test whether there are significant differences in the effect of selective
systems on earnings inequality.
5. Results
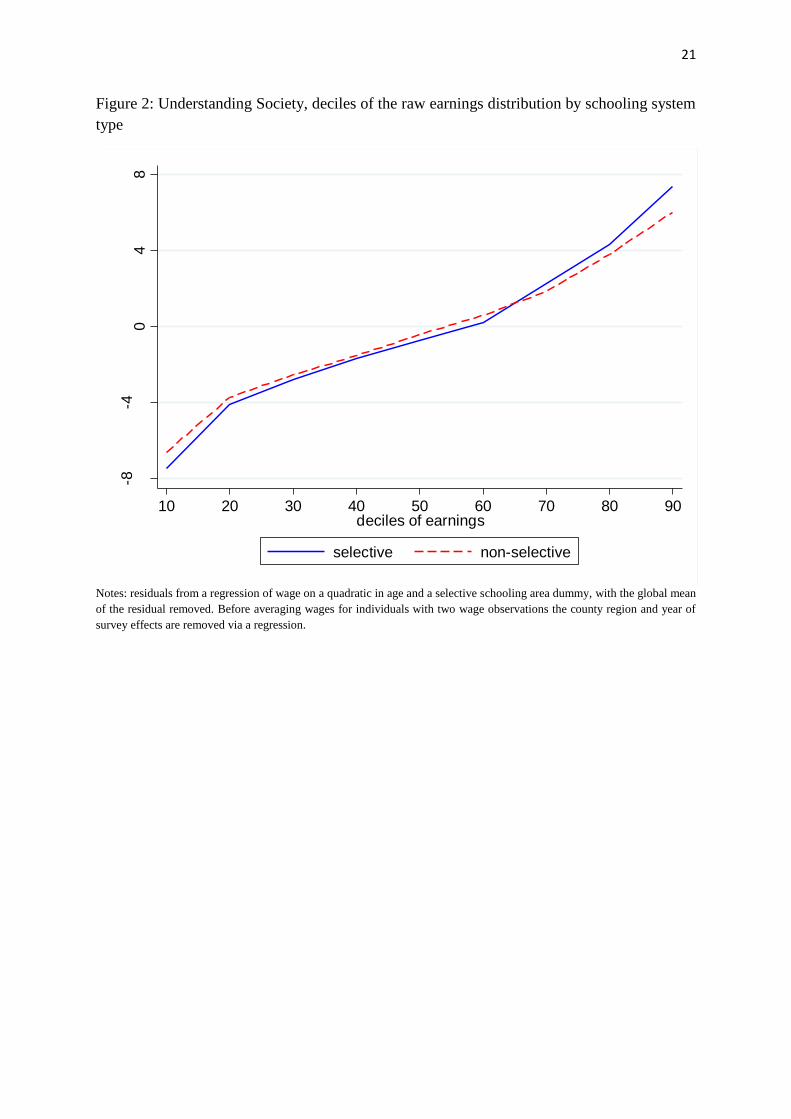
Table 4 shows the raw mean and variance statistics for the selective versus non-selective
areas: overall, average hourly earnings are very similar across the two groups although
slightly (insignificantly) higher amongst those from the selective areas (£8.50 versus £8.47).
The variance of earnings is considerably higher for those growing up in selective areas
(£36.21 versus £26.34). Figure 2 illustrates the impact of selective schooling across the
entirety of the distribution, plotting the deciles of age*gender adjusted hourly earnings for
each system. As can be seen in this figure, the impact of the selective system has a positive
effect on earnings at the top of the distribution and a negative effect on earnings at the lower
end of the distribution. Out of those who do make it to the top of the earnings distribution,
individuals who grew up in areas operating a selective schooling system appear to do better
than their non-selective counterparts. For those who find themselves at the bottom of the
14
As we are removing a constant the results hold for non-mean-adjusted earnings. Note the average earnings are
not significantly different across groups indicating a good match
12
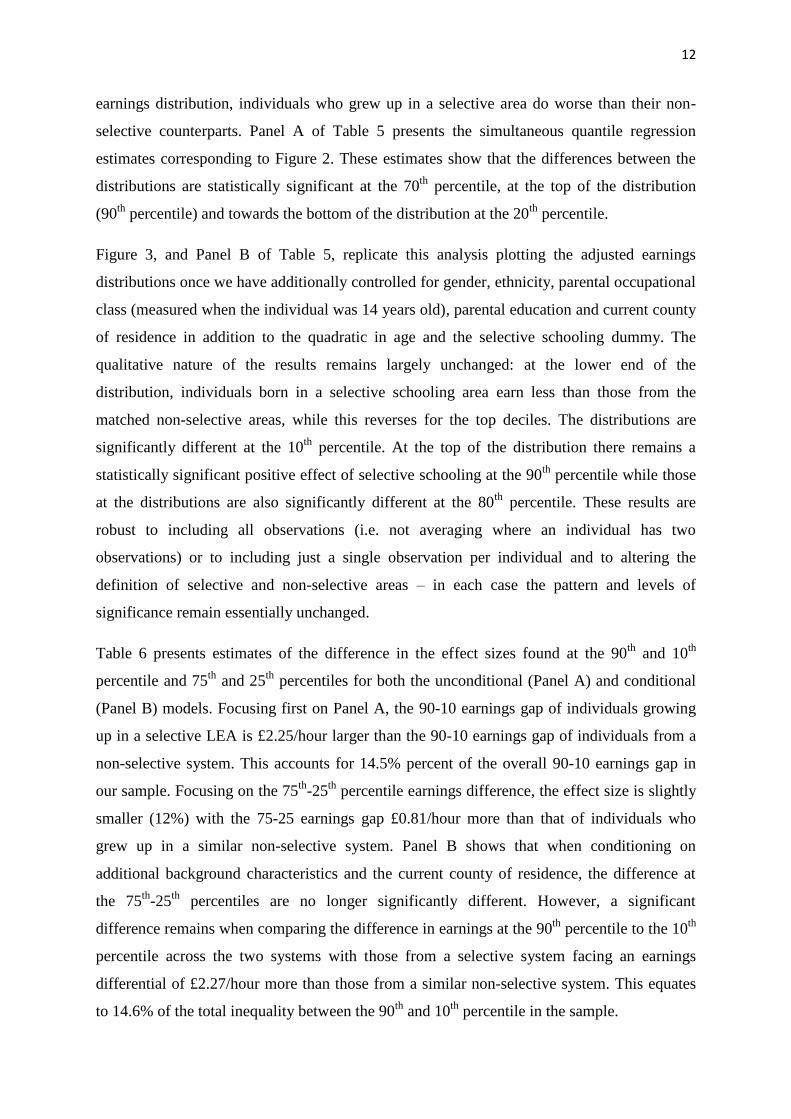
earnings distribution, individuals who grew up in a selective area do worse than their non-
selective counterparts. Panel A of Table 5 presents the simultaneous quantile regression
estimates corresponding to Figure 2. These estimates show that the differences between the
distributions are statistically significant at the 70th
percentile, at the top of the distribution
(90th
percentile) and towards the bottom of the distribution at the 20th
percentile.
Figure 3, and Panel B of Table 5, replicate this analysis plotting the adjusted earnings
distributions once we have additionally controlled for gender, ethnicity, parental occupational
class (measured when the individual was 14 years old), parental education and current county
of residence in addition to the quadratic in age and the selective schooling dummy. The
qualitative nature of the results remains largely unchanged: at the lower end of the
distribution, individuals born in a selective schooling area earn less than those from the
matched non-selective areas, while this reverses for the top deciles. The distributions are
significantly different at the 10th
percentile. At the top of the distribution there remains a
statistically significant positive effect of selective schooling at the 90th
percentile while those
at the distributions are also significantly different at the 80th
percentile. These results are
robust to including all observations (i.e. not averaging where an individual has two
observations) or to including just a single observation per individual and to altering the
definition of selective and non-selective areas – in each case the pattern and levels of
significance remain essentially unchanged.
Table 6 presents estimates of the difference in the effect sizes found at the 90th
and 10th
percentile and 75th
and 25th
percentiles for both the unconditional (Panel A) and conditional
(Panel B) models. Focusing first on Panel A, the 90-10 earnings gap of individuals growing
up in a selective LEA is £2.25/hour larger than the 90-10 earnings gap of individuals from a
non-selective system. This accounts for 14.5% percent of the overall 90-10 earnings gap in
our sample. Focusing on the 75th
-25th
percentile earnings difference, the effect size is slightly
smaller (12%) with the 75-25 earnings gap £0.81/hour more than that of individuals who
grew up in a similar non-selective system. Panel B shows that when conditioning on
additional background characteristics and the current county of residence, the difference at
the 75th
-25th
percentiles are no longer significantly different. However, a significant
difference remains when comparing the difference in earnings at the 90th
percentile to the 10th
percentile across the two systems with those from a selective system facing an earnings
differential of £2.27/hour more than those from a similar non-selective system. This equates
to 14.6% of the total inequality between the 90th
and 10th
percentile in the sample.
13
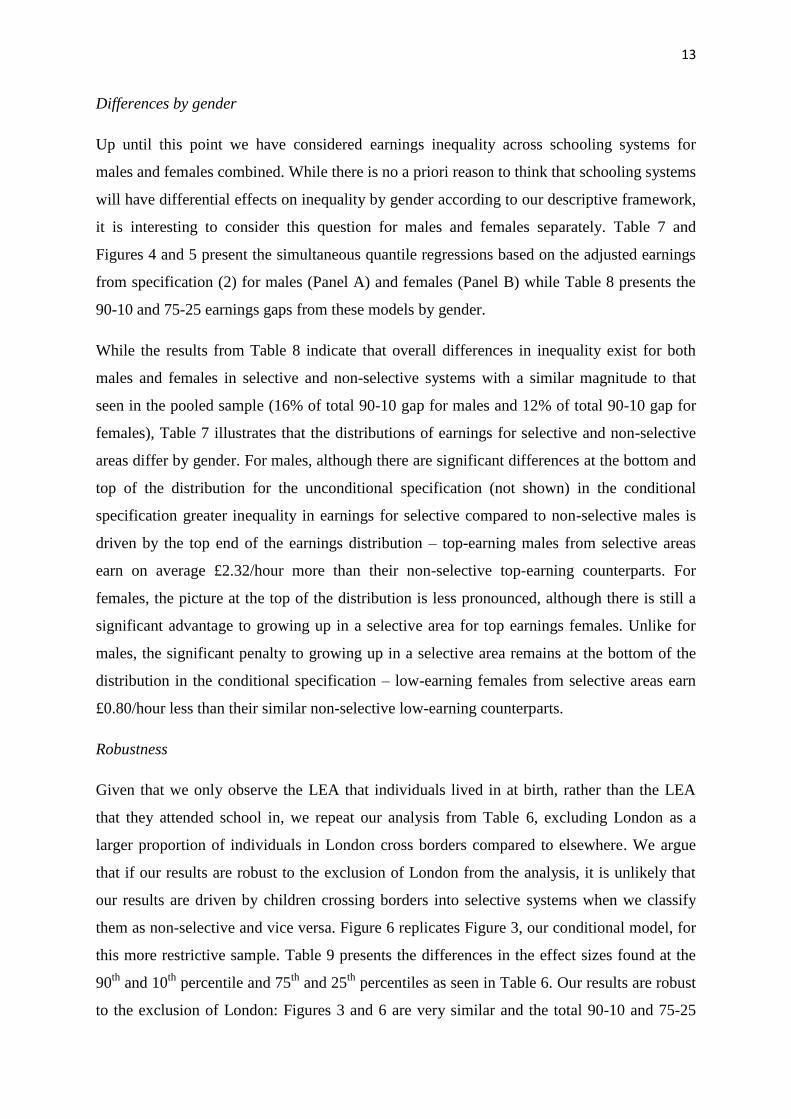
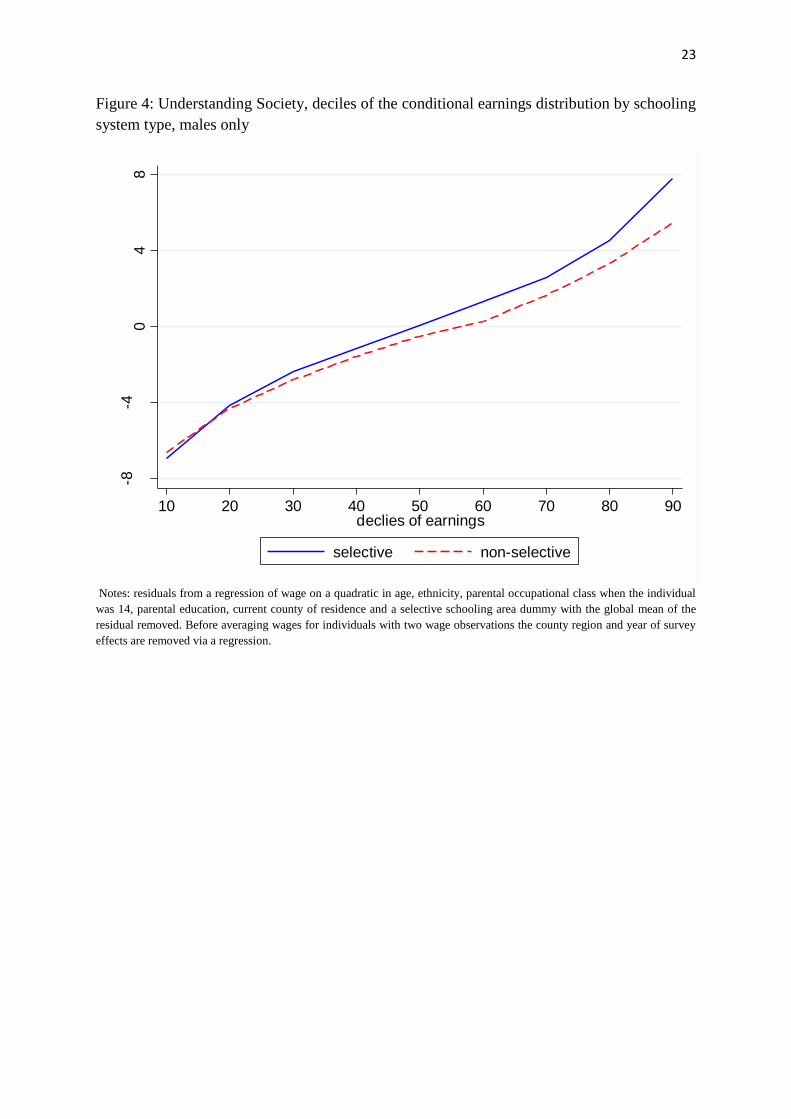
Differences by gender
Up until this point we have considered earnings inequality across schooling systems for
males and females combined. While there is no a priori reason to think that schooling systems
will have differential effects on inequality by gender according to our descriptive framework,
it is interesting to consider this question for males and females separately. Table 7 and
Figures 4 and 5 present the simultaneous quantile regressions based on the adjusted earnings
from specification (2) for males (Panel A) and females (Panel B) while Table 8 presents the
90-10 and 75-25 earnings gaps from these models by gender.
While the results from Table 8 indicate that overall differences in inequality exist for both
males and females in selective and non-selective systems with a similar magnitude to that
seen in the pooled sample (16% of total 90-10 gap for males and 12% of total 90-10 gap for
females), Table 7 illustrates that the distributions of earnings for selective and non-selective
areas differ by gender. For males, although there are significant differences at the bottom and
top of the distribution for the unconditional specification (not shown) in the conditional
specification greater inequality in earnings for selective compared to non-selective males is
driven by the top end of the earnings distribution – top-earning males from selective areas
earn on average £2.32/hour more than their non-selective top-earning counterparts. For
females, the picture at the top of the distribution is less pronounced, although there is still a
significant advantage to growing up in a selective area for top earnings females. Unlike for
males, the significant penalty to growing up in a selective area remains at the bottom of the
distribution in the conditional specification – low-earning females from selective areas earn
£0.80/hour less than their similar non-selective low-earning counterparts.
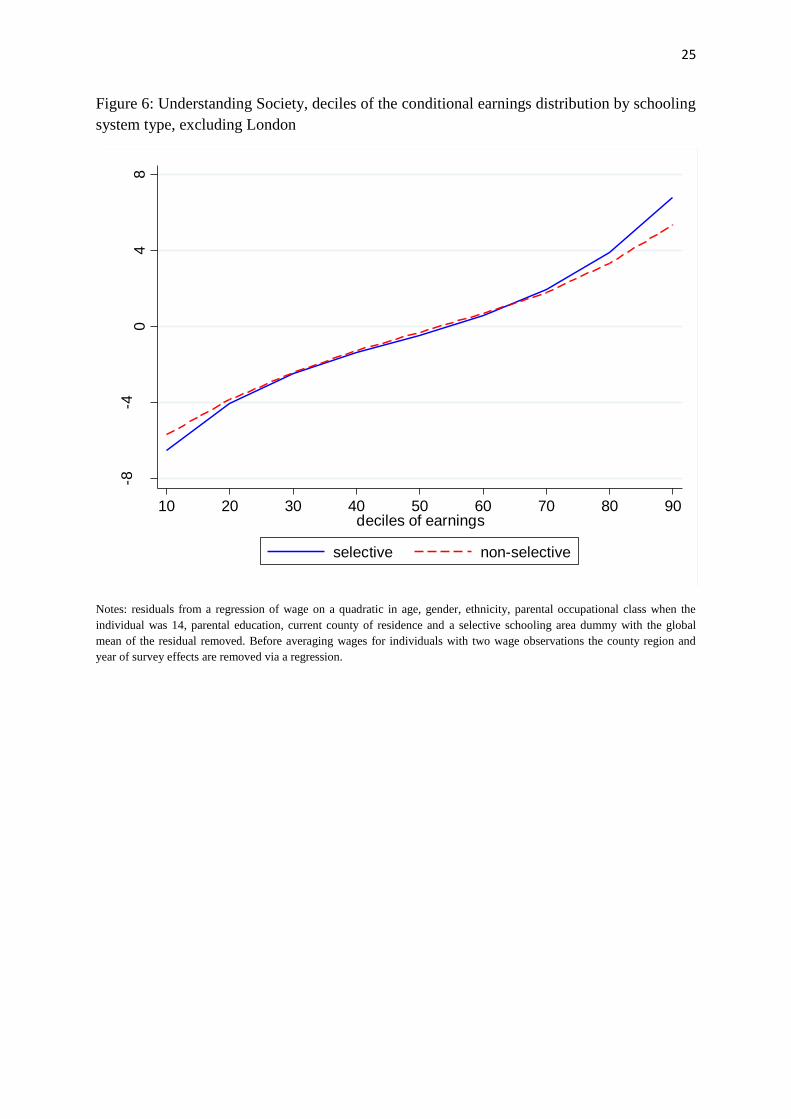
Robustness
Given that we only observe the LEA that individuals lived in at birth, rather than the LEA
that they attended school in, we repeat our analysis from Table 6, excluding London as a
larger proportion of individuals in London cross borders compared to elsewhere. We argue
that if our results are robust to the exclusion of London from the analysis, it is unlikely that
our results are driven by children crossing borders into selective systems when we classify
them as non-selective and vice versa. Figure 6 replicates Figure 3, our conditional model, for
this more restrictive sample. Table 9 presents the differences in the effect sizes found at the
90th
and 10th
percentile and 75th
and 25th
percentiles as seen in Table 6. Our results are robust
to the exclusion of London: Figures 3 and 6 are very similar and the total 90-10 and 75-25
14
earnings gaps found in Tables 6 and 9 are almost identical, suggesting that London is not
driving the significant difference in inequality of earnings between selective and non-
selective educated individuals.
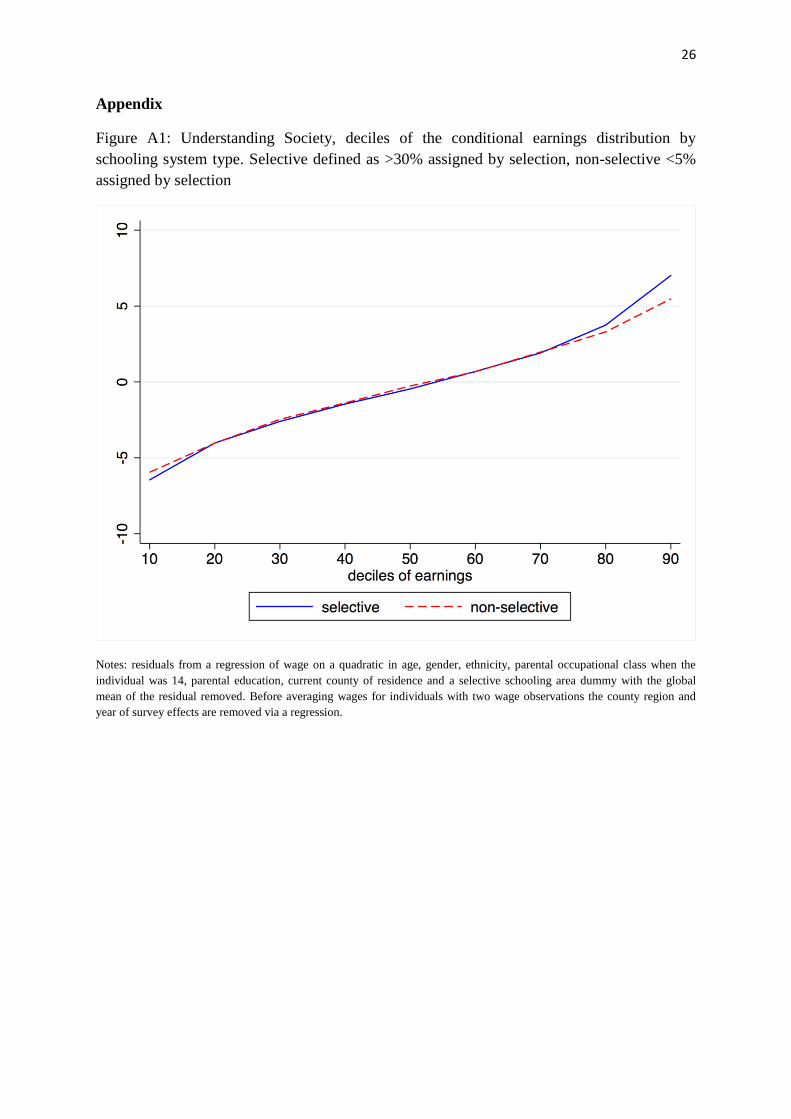
To test whether our results are robust to changes in the definition of selective and non-
selective areas we redefine selective LEAs as those assigning more than 30% of places by
selection whilst retaining the definition of non-selective as those that assign less than 5% by
this method. Appendix Table A1 shows the quantile regressions for the models with and
without controls. The results are qualitatively and quantitatively similar to the corresponding
figures in Table 5 (the 90-10 gap in the conditional results is £2.15) although the effects are
slightly smaller at the bottom of the distribution and slightly larger at the top of the
distribution. Figure A1 illustrates the results of the model with controls and comparison with
Figure 3 provides visual confirmation of the robustness of the results.
6. Conclusions
Inequality in access to high quality schools raises concerns from both an equity and
efficiency point of view. Understanding the best system for the assignment of students to
schools to reduce inequality therefore remains a priority for policy. As such, in both the UK
economics literature and policy debate, the issue of selective schooling continues to divide.
This finds a parallel in the US where a similar literature concerns the merits of exam schools.
In each case, the literature tends to focus on the impact of attending the elite (non-elite)
school for the marginal students who just pass (fail) the exam or on whether there is fair
access to elite schools. In general, the UK literature finds that access to grammar schools is
socially graded, even when conditioning on prior attainment and there is little evidence to
support a causal impact of grammar education on scholastic outcomes. However, to date this
literature has not addressed the issue of the impact of selective school systems on the whole
distribution of wages, rather than for the marginal student.
In this paper, we use data from a large household panel study to illustrate the extent to which
selective schooling systems actually increase later wage inequality. Controlling for a range of
background characteristics and the current labour market, the wage distribution for
individuals who grew up in areas operating a selective schooling system shows significant
differences to that for comparable areas that operated a comprehensive system. As one might
expect, those making top earnings from the selective areas are earning significantly more than

15
those making top earnings from comparable non-selective areas. For those at the bottom of
the distribution of earnings, growing up in a selective system leads to significant penalties in
terms of earnings compared to those growing up in non-selective systems. These results are
robust to a number of specification checks and suggest that selective schooling systems have
significant impacts across the whole distribution of earnings. The total effect sizes here are
large: 16% of the total gap in earnings between the 90th
and 10th
percentile can be explained
by the difference in the 90-10 gap between those growing up in selective compared to non-
selective areas.
The descriptive framework suggests that the inequality in each system is driven by the
mapping of ability into schooling outcomes, via the channels of peer groups and school
(teacher) quality. While selective systems directly relate ability to peer groups and (arguably)
teaching quality, in comprehensive systems this works through the mechanism of parental
resources and the positive association between resources and ability. We might expect
therefore that inequality is exacerbated by selective systems given these stronger peer group
and teaching quality effects. The evidence in the UK literature on peer effects is mixed,
which suggests that perhaps it is the teacher quality mechanism that leads to greater
inequality in selective systems. The sorting of (possibly) the highest quality teachers to teach
the highest ability students – and the implications for the quality match further down – may
explain the differences seen at the top and bottom of the earnings distribution, though we
leave this question for future research.
It remains a matter of opinion as to whether this evidential inequality from selective systems
is a good or a bad thing: some would argue that if wages represent productivity and this is
increasing at the top of the distribution then this will have positive effects on economic
growth. On the other hand, the negative effects of inequality are well documented. If this
inequality is coupled with unequal access to grammar schools then it seems likely that
selective systems are likely to reinforce inequalities across generations rather than drive
social mobility. While such questions remain for policy debate and future research, it is clear
from this study that the idea that selective systems create no losers does not hold true.

16
References
Abdulkadiroglu, A., Angrist, J. and Pathak, P. (2012). ‘The Elite Illusion: Achievement
Effects at Boston and New York Exam Schools’, IZA DP no. 6790.
Allen, R., Burgess, S. and Key, T. (2010) ‘Choosing secondary schools by moving
house: school quality and the formation of neighbourhoods ’, CMPO
working paper No. 10/238.
Atkinson, A., Gregg, P. and McConnell, B. (2006). ‘The Result of 11Plus Selection: An
Investigation into Equity and Efficiency of Outcomes for Pupils in Selective
LEAs’, CMPO DP no. 06/150.
Clark, D. and Del Bono, E. (2014). ‘The Long-Run Effects of Attending and Elite School:
Evidence from the UK’, ISER Working Paper No. 2014-05.
Clark, D. (2010). ‘Selective Schools and Academic Achievement’, B.E. Journal of Economic
Analysis and Policy, 10(1): 1935-1682.
Cribb, J., Sibieta, L., and Vignoles, A. (2013) ‘Entry into Grammar Schools in England’, IFS
book chapter in Poor Grammar: Entry into Grammar Schools for disadvantage
pupils in England Sutton Trust Report.
Crook, D. (2013) “Politics, politicians and English comprehensive schools,” History of
Education: Journal of the History of Education Society, Vol. 42, no. 3: 365-380.
Dobbie, W. and Fryer, R. 2011. ‘Exam High Schools and Academic Achievement: Evidence
from New York City’, NBER WP no. 17286.
Galindo-Rueda, F., and Vignoles, A. (2005) ‘The Heterogeneous Effect of Selection in
Secondary Schools: Understanding the Changing Role of Ability’ CEE Working
Paper, LSE
Hart, R., Moro, M. and Roberts, J. 2012. ‘Date of birth, family background, and the 11 plus
exam: short– and long–term consequences of the 1944 secondary education
reforms in England and Wales’, Stirling Economics DP no. 2012-10.
Jesson, D. (2000) ‘The Comparative Evaluation of GCSE Value-Added Performance by Type
of School and LEA’ University of York DP in Economics, No. 2000/52
Manning, A and Pischke, J.S. (2006) ‘Comprehensive versus Selective Schooling in England
and Wales: What do We Know? CEP DP, LSE
Pop-Eleches, C. and Urquiola, M. 2013. ‘Going to a Better Schools: Effects and Behavioral
Responses’, American Economic Review, 103(4): 1289-1324.
Ryan, C., and Sibieta, L. (2010) ‘Private Schooling in the UK and Australia’ IFS Briefing
Notes. BN106
Sullivan, A. and Heath, A. (2002) ‘State and Private Schools in England and Wales’
Sociology Working Paper, University of Oxford, No. 2002-02.
17
Table 1: Distribution of selectivity in LEAs across all time periods
Selective %
Selective %
conditional on >0
N 3915 2219
Mean 29.4 51.9
SD 38.6 38.2
10th
0.0 3.1
25th
0.0 9.5
50th
3.8 56.3
75th
68.6 90.3
90th
94.9 99.2
Table 2: Proportion moving across different geographical areas during primary school
Stay Move
Postcode
NPD 5-11 90.0 10.0
Travel to Work Area
NPD 5-11 99.0 1.0
Government Office Region
BCS
0-5 91.4 8.6
5-10 94.7 5.3
0-10 88.5 11.5
MCS
0-3 96.5 3.5
3-5 98.0 2.0
5-7 98.5 1.5
0-7 94.1 5.9 Notes: NPD figures from Allen, Burgess and Key (2010).
Table 3: Proportion of people who move between birth and adulthood from the five largest
selective and non-selective LEAs
Selective Non-Selective
LEA Proportion move LEA Proportion move
Kent 53.9 Hampshire 48.0
Lancashire 70.4 Essex 49.2
Gloucestershire 41.6 Cambridgeshire 36.5
Buckinghamshire 62.6 Leicestershire 28.2
Dorset 50.0 Bedfordshire 50.0
Weighted average 57.1 Weighted average 43.5

18
Table 4: Raw earnings distribution by schooling system type
Selective Non-Selective
Hourly wage: mean 8.50 8.47
variance 36.21 26.34
N 1289 1166 Notes: hourly earnings in year 2000 £s
Table 5: Quantile Regression estimates of selective schooling effect on wages
A: Without controls B: With controls
coeff. std. error t
coeff. std. error t
10 -0.917 0.668 -1.37
10 -0.862 0.323*** -2.67
20 -0.399 0.221 -1.81*
20 -0.250 0.262 -0.95
30 -0.235 0.177 -1.32
30 -0.141 0.217 -0.65
40 -0.163 0.196 -0.83
40 -0.227 0.229 -0.99
50 -0.327 0.214 -1.53
50 -0.180 0.195 -0.92
60 -0.350 0.240 -1.46
60 -0.142 0.225 -0.63
70 0.433 0.267 1.62*
70 0.122 0.270 0.45
80 0.548 0.390 1.41
80 0.715 0.345** 2.07
90 1.335 0.574 2.33**
90 1.412 0.515*** 2.74
N=2455
N=2455
Notes: residuals from a regression of wage on a quadratic in age and a selective schooling area dummy (Panel A); and
residuals from a regression of wage on a quadratic in age, a selective schooling area dummy, gender, ethnicity, parental
occupational class when the individual was 14, parental education and current county of residence (Panel B). Global means
of the residual removed. Before averaging wages for individuals with two wage observations the county region and year of
survey effects are removed via a regression.
Table 6: Estimated effects sizes
Sample
wage gap A: Without controls B: With controls
coeff. std. error Effect size
coeff. std. error Effect size
90-10 15.58 2.252 0.743*** 14.5
2.274 0.594*** 14.6
75-25 6.55 0.813 0.346** 12.4
0.320 0.330 4.9
Notes: earnings differentials estimated by testing the linear combination from the simultaneous quantile regressions. The
effect size is calculated as the estimated difference divided by the total earnings differential in the sample.

19
Table 7: Quantile Regression estimates of selective schooling effect on wages, by gender
A: Males B: Females
coeff. std. error t
coeff. std. error t
10 -0.424 0.566 -0.75
10 -0.804 0.300*** -2.68
20 0.152 0.477 0.32
20 -0.668 0.395* -1.69
30 0.470 0.331 1.42
30 -0.571 0.279* -2.04
40 0.415 0.303 1.37
40 -0.409 0.281 -1.46
50 0.547 0.286* 1.92
50 -0.551 0.281** -1.96
60 1.070 0.264*** 4.04
60 -0.430 0.274 -1.57
70 0.916 0.427** 2.15
70 -0.458 0.323 -1.42
80 1.205 0.447*** 2.69
80 -0.218 0.461 -0.47
90 2.324 0.589*** 3.95
90 0.869 0.477* 1.82
1068
1387
Notes: residuals from a regression of wage on a quadratic in age and a selective schooling area dummy (Panel A); and
residuals from a regression of wage on a quadratic in age, a selective schooling area dummy, ethnicity, parental occupational
class when the individual was 14, parental education and current county of residence (Panel B). Global means of the residual
removed. Before averaging wages for individuals with two wage observations the county region and year of survey effects
are removed via a regression.
Table 8: Estimated effects sizes for conditional specification by gender
Sample
wage gap A: Males Sample
wage gap B: Females
coeff. std. error Effect size
coeff. std. error Effect size
90-10 16.93 2.749 0.757*** 16.2
14.19 1.673 0.495*** 11.8
75-25 6.96 0.592 0.628 8.5
5.66 -0.079 0.380 -3.7
Notes: earnings differentials estimated by testing the linear combination from the simultaneous quantile regressions. The
effect size is calculated as the estimated difference divided by the total earnings differential in the sample.
Table 9: Estimated effects sizes excluding London
Sample
wage gap A: Without controls B: With controls
coeff. std. error Effect size
coeff. std. error Effect size
90-10 15.53 2.346 0.797*** 15.1
2.136 0.560*** 13.8
75-25 6.48 0.774 0.357** 11.9
0.386 0.355 6.0
Notes: earnings differentials estimated by testing the linear combination from the simultaneous quantile regressions. The
effect size is calculated as the estimated difference divided by the total earnings differential in the sample.
20
Figure 1: Distribution of selectivity across LEAs in 1983
0
20
40
60
80
100
Lin
cs.-
Ho
llan
d
Bo
urn
emo
uth
Sutt
on
Be
xley
Glo
uce
ster
shir
e
Lan
cash
ire
Gre
at Y
arm
ou
th
Enfi
eld
Wo
lver
ham
pto
n
Bar
kin
g
Be
rksh
ire
Bo
otl
e
Bu
rto
n-u
po
n-T
ren
t
Co
rnw
all
De
rby
Du
rham
Gri
msb
y
Hav
eri
ng
Hu
nti
ngd
on
an
d P
ete
rbo
rou
gh
Leic
este
r
Me
rto
n
No
rth
amp
ton
shir
e
Old
ham
Ric
hm
on
d-u
po
n-T
ham
es
She
ffie
ld
St H
elen
s
Suff
olk
Wes
t
Wak
efie
ld
We
st B
rom
wic
h
Pro
po
rtio
n o
f p
up
ils in
sel
ecti
vely
allo
cate
d p
lace
d
Non-selective Selective
21
Figure 2: Understanding Society, deciles of the raw earnings distribution by schooling system
type
Notes: residuals from a regression of wage on a quadratic in age and a selective schooling area dummy, with the global mean
of the residual removed. Before averaging wages for individuals with two wage observations the county region and year of
survey effects are removed via a regression.
-8-4
04
8
glo
bal m
ean c
entr
ed h
ourl
y e
arn
ings
10 20 30 40 50 60 70 80 90deciles of earnings
selective non-selective

22
Figure 3: Understanding Society, deciles of the conditional earnings distribution by schooling
system type
Notes: residuals from a regression of wage on a quadratic in age, gender, ethnicity, parental occupational class when the
individual was 14, parental education, current county of residence and a selective schooling area dummy with the global
mean of the residual removed. Before averaging wages for individuals with two wage observations the county region and
year of survey effects are removed via a regression.
-8-4
04
8
glo
bal m
ean c
entr
ed c
onditio
nal hourl
y e
arn
ings
10 20 30 40 50 60 70 80 90deciles of earnings
selective non-selective
23
Figure 4: Understanding Society, deciles of the conditional earnings distribution by schooling
system type, males only
Notes: residuals from a regression of wage on a quadratic in age, ethnicity, parental occupational class when the individual
was 14, parental education, current county of residence and a selective schooling area dummy with the global mean of the
residual removed. Before averaging wages for individuals with two wage observations the county region and year of survey
effects are removed via a regression.
-8-4
04
8
glo
bal m
ean c
entr
ed c
onditio
nal hourl
y e
arn
ings
10 20 30 40 50 60 70 80 90declies of earnings
selective non-selective

24
Figure 4: Understanding Society, deciles of the conditional earnings distribution by schooling
system type, females only
Notes: residuals from a regression of wage on a quadratic in age, ethnicity, parental occupational class when the individual
was 14, parental education, current county of residence and a selective schooling area dummy with the global mean of the
residual removed. Before averaging wages for individuals with two wage observations the county region and year of survey
effects are removed via a regression.
-8-4
04
8
glo
bal m
ean c
entr
ed c
onditio
nal hourl
y e
arn
ings
10 20 30 40 50 60 70 80 90deciles of earnings
selective non-selective
25
Figure 6: Understanding Society, deciles of the conditional earnings distribution by schooling
system type, excluding London
Notes: residuals from a regression of wage on a quadratic in age, gender, ethnicity, parental occupational class when the
individual was 14, parental education, current county of residence and a selective schooling area dummy with the global
mean of the residual removed. Before averaging wages for individuals with two wage observations the county region and
year of survey effects are removed via a regression.
-8-4
04
8
glo
bal m
ean c
entr
ed c
onditio
nal hourl
y e
arn
ings
10 20 30 40 50 60 70 80 90deciles of earnings
selective non-selective
26
Appendix
Figure A1: Understanding Society, deciles of the conditional earnings distribution by
schooling system type. Selective defined as >30% assigned by selection, non-selective <5%
assigned by selection
Notes: residuals from a regression of wage on a quadratic in age, gender, ethnicity, parental occupational class when the
individual was 14, parental education, current county of residence and a selective schooling area dummy with the global
mean of the residual removed. Before averaging wages for individuals with two wage observations the county region and
year of survey effects are removed via a regression.

27
Table A1: Quantile Regression estimates of selective schooling effect on wages, Selective
defined as >30% assigned by selection, non-selective <5% assigned by selection
A: Without controls B: With controls
coeff. std. error t
coeff. std. error t
10 -0.443 0.891 -0.50
-0.551 0.458 -1.20
20 -0.363 0.305 -1.19
0.002 0.344 0.01
30 -0.443* 0.239 -1.86
-0.174 0.266 -0.66
40 -0.273 0.212 -1.28
-0.108 0.240 -0.45
50 -0.458* 0.242 -1.89
-0.202 0.198 -1.02
60 -0.794** 0.358 -2.22
0.001 0.219 0.01
70 -0.019 0.421 -0.04
-0.042 0.234 -0.18
80 0.320 0.465 0.69
0.479 0.377 1.27
90 1.475** 0.648 2.28
1.602*** 0.532 3.01
1689
1689
Notes: residuals from a regression of wage on a quadratic in age and a selective schooling area dummy (Panel A); and
residuals from a regression of wage on a quadratic in age, a selective schooling area dummy, gender, ethnicity, parental
occupational class when the individual was 14, parental education and current county of residence (Panel B). Global means
of the residual removed. Before averaging wages for individuals with two wage observations the county region and year of
survey effects are removed via a regression.
Related Documents