No. 174 June 2018 Kazushi Takahashi, Yukichi Mano, and Keijiro Otsuka Spillovers as a Driver to Reduce Ex-post Inequality Generated by Randomized Experiments: Evidence from an Agricultural Training Intervention An Empirical Analysis of Expanding Rice Production in Sub-Sahara Africa

Welcome message from author
This document is posted to help you gain knowledge. Please leave a comment to let me know what you think about it! Share it to your friends and learn new things together.
Transcript

No. 174
June 2018
Kazushi Takahashi, Yukichi Mano, and Keijiro Otsuka
Spillovers as a Driver to Reduce Ex-post Inequality Generated by Randomized Experiments: Evidence from an Agricultural Training Intervention
An Empirical Analysis of Expanding Rice Production in Sub-Sahara Africa

Use and dissemination of this working paper is encouraged; however, the JICA Research Institute requests due acknowledgement and a copy of any publication for which this working paper has provided input. The views expressed in this paper are those of the author(s) and do not necessarily represent the official positions of either the JICA Research Institute or JICA. JICA Research Institute 10-5 Ichigaya Honmura-cho Shinjuku-ku Tokyo 162-8433 JAPAN TEL: +81-3-3269-3374 FAX: +81-3-3269-2054
1
Spillovers as a Driver to Reduce Ex-post Inequality Generated by Randomized Experiments: Evidence from an Agricultural Training Intervention*
Kazushi Takahashi*, Yukichi Mano†, and Keijiro Otsuka‡
Abstract
Randomized experiments ensure equal opportunities but could generate unequal outcomes by treatment status, which can be socially costly. This study demonstrates a sequential intervention to conduct rigorous impact evaluation and subsequently to mitigate ‘“experiment-driven’ driven” inequality, using Cote d’Ivoire as a case. Specifically, control farmers were initially restricted from exchanging information with treated farmers, who received rice management training, to satisfy the stable unit treatment value assumption. We then encouraged information exchange between the two groups of farmers one year after the training. We found positive training effects, but initial performance gaps created by our randomized assignment disappeared over time because of information spillovers and, hence, eventually control farmers also benefitted from our experiment. JEL Code: O12, O13, O31, Q12
Keywords: Inequality, Program evaluation, Randomised experiment, Spillover
* We thank Takeshi Aida, Yutaka Arimoto, Jun Goto, Yoko Kijima, Hisaki Kono, Takashi Kurosaki, Yuya Kudo, Tomohiro Machikita, Yuko Nakano, Yasuyuki Sawada, Motonori Tomitaka, Takashi Yamano, Junichi Yamasaki, and seminar participants at the Asian Development Bank, Hitotsubashi University, JICA Research Institute, Institute of Developing Economies, Kobe University, Kyoto University, and Sophia University for their valuable comments on earlier versions of this manuscript. We are also grateful for the financial support by the JICA Research Institute and Ministry of Education, Culture, Sports, Science and Technology (MEXT), Japan. All views and interpretations expressed in this manuscript are those of the authors and not necessarily those of the supporting or cooperating institutions. * Sophia University, Faculty of Economics, Tokyo, 102-8554, Japan, Corresponding author +81-3- (3238)-3224 ; [email protected] † Hitotsubashi University, Graduate School of Economics, Tokyo, 186-8601, Japan ‡ Kobe University, Graduate School of Economics, Hyogo, 657-8501, Japan This paper has been prepared as part of a JICA Research Institute project entitled “An Empirical Analysis of Expanding Rice Production in Sub-Sahara Africa.”

2
1. Introduction
Development, educational, and other social programs have long been chosen and implemented
based on folk wisdom without sufficient scientific evidence. A recent surge in the use of
randomized controlled trials (RCTs) in empirical studies of economics, particularly of
development economics, has substantially contributed to a better understanding of what works
and what does not to improve the welfare of the poor. Examples include conditional and
unconditional cash and asset transfer (Schultz 2004; Banerjee et al. 2015b; Bastagli et al. 2016;
Kabeer and Waddington 2015), microfinance (Karlan et al. 2014; Banerjee et al. 2015a),
preventive health measures (Dupas 2011; Kremer and Glennerster 2011), educational inputs
(Kremer and Holla 2009; Evans and Popova 2016), and agriculture (de Janvry et al. 2017).
RCTs intentionally, though randomly, create a group of people who receive a treatment
and another group who do not. Such an approach has been justified because it provides a more
credible estimate of the impact of the intervention than other available, sophisticated
econometric methods. Since our preconceptions about the effectiveness of development
practices are often biased, rigorous evidence generated by RCTs helps select which practice
should be scaled-up to a wider range of the population. This holds true especially when external
validity is carefully evaluated from multiple RCTs. Furthermore, RCTs are justified because
everyone in a society cannot receive the treatment simultaneously, given limited resources, but
RCTs, if properly executed, could provide equal opportunities to all subjects in the targeted
population. This ex-ante equality of opportunities seems to match the sense of fairness of many
researchers and plays an important role in avoiding their ethical dilemmas.
However, RCTs might generate ex-post inequality in outcomes to the extent that the
implemented program has positive and significant impacts. Moreover, such inequality could
persist for a long period of time. For example, recent studies on a pioneering conditional cash
transfer (CCT) program in Mexico, Progresa, show that those with more time exposed to CCTs

3
are significantly better off even more than 10 years after the program (Kugler and Rojas 2018;
Parker and Vogl 2018). Inequality triggered by RCTs could be eliminated relatively quickly if
RCTs are designed to roll out so that everyone can eventually receive the same treatment. Yet, as
is demonstrated by Progresa, which was precisely designed to do so, this is sometimes imperfect.
Alternatively, RCT-triggered inequality may be mitigated if benefits are allowed to spread from
treated to control groups by such means as social learning or positive spillovers (Miguel and
Kremer 2004; Kremer and Miguel 2007; Oster and Thronton 2012). Although the existence of
positive interpersonal spillover effects is desirable in the real world, it is generally recused in the
RCT setting because it violates the stable unit treatment value assumption (SUTVA), without
which the unbiased impact of implemented programs cannot be estimated. Thus, spillovers tend
to be considered a threat to identification rather than a driver to reduce otherwise persistent
inequality in experimental settings. As a result, researchers who initiate RCTs often prefer the
absence of spillovers and tend to overlook inequality generated by “researcher-tailored” RCTs or
intentionally leave such inequality unattended to observe longer-term impacts.
In this study, we implement a unique field experiment in collaboration with 295
rice-growing farmers in Cote d’Ivoire to explore (1) whether management training for rice
cultivation provides the intended positive impacts, such as the adoption of recommended
agronomic practices as well as improved rice yield and profits, and (2) whether any generated
inequality from our intervention could be eliminated later by encouraging treated farmers to
disclose new knowledge acquired during the training to control farmers. The first objective
echoes other RCTs designed not to cause spillover effects, and the second objective deviates
from their common practices.
We take up a case study of rice farming in Cote d’Ivoire because, like other West African
countries, rice is one of the major staple foods in this country and its consumption has increased
rapidly in recent years, exceeding the domestic production. The government has tried to increase
rice yield to sustain food security and save foreign exchange reserves. The adoption rate of
4
modern inputs, such as improved seeds and chemical fertilizer, is higher in Cote d’Ivoire than in
other rice-growing countries in Sub-Saharan Africa (SSA), owing to past training provided by
local governmental and international organizations such as AfricaRice (formerly known as
WARDA [West Africa Rice Development Association]), whose headquarters was originally
located within the country and is now there again.1 However, several recommended agronomic
practices, including straight-row transplanting, that have proven to boost rice yield in tropical
Asia as well as other SSA countries have not been adopted widely (David and Otsuka 1994;
Otsuka and Larson 2013, 2016). There is thus room for management training to improve the
performance of rice production.
Japanese experts offered a short technical training course in 2015 in collaboration with
local extension agencies to a sub-sample of farmers randomly selected from eight production
sites located in two major rice-growing regions, Bellier and Gbeke. To mitigate noncompliance,
such as the participation of ineligible farmers, local counterparts checked the attendance of
participation in field training every time it was implemented.
We conducted household surveys three times at the baseline before the training (January
2015 to May 2015), the mid-line one year after the training (March 2016 to May 2016), and the
end-line two years after the training (March 2017 to May 2017). During the initial experimental
phase between the baseline and mid-line survey, treated farmers were asked not to transmit
information taught in the training and control farmers were requested to refrain from asking
treated farmers for agricultural advice. Both treated and control farmers were convinced that if
they met these requirements they could obtain precise and valuable knowledge about the
effectiveness in their settings of the technological package taught in the training. After the one
year of observation, we relaxed the restriction and turned to promoting spillovers. Using these
three-year panel data, we examine the evolution of both intention-to-treat (ITT) and
1 Because of political instability in Cote d’Ivoire, the headquarters of AfricaRice was temporarily moved to Cotonou, Benin from 2005 to 2015.
5
treatment-on-the-treated (TOT) effects of the training, with the attendance rate instrumented by
the random assignment of treatment status for the latter.
A focus on agricultural training and technology is suited to our research purpose because
it has been an area where spillovers likely occur through social learning (Foster and Rosenzweig
1995; Munshi 2004; Bandiera and Rasul 2006; Conley and Udry 2010). Most previous studies
share the view that training millions of small farmers is a significant challenge in practice and
farmer-to-famer training or social learning, e.g., farmer field schools (FFS), is potentially more
cost effective in the diffusion of agricultural technologies (Guo et al. 2015; Emerick et al. 2016;
Mekonnen et al. 2018; Ben Yishay and Mobarak 2018; Nakano et al. 2018).
Nevertheless, there is little consensus as to the relative effectiveness of direct training by
extension workers and learning from peer farmers. To the extent that social learning is less
effective than direct training to counter information failures, inequality generated by an
experiment on agricultural training may not easily cease even after information dissemination
from treated to control farmers is encouraged. Feder et al. (2004), Tripp et al. (2005), and
Kondylis et al. (2017) find that directly trained farmers significantly increase the adoption of the
new technology, but their behavior has limited impacts on other farmers. On the other hand,
Krishnan and Patnam (2014) demonstrate that while the initial impact of extension agents is high,
learning from neighbors plays a more important role than direct training by extension agents in
the adoption of the new technology over time. Similarly, Nakano et al. (2018) show that directly
trained farmers perform better initially, but other farmers can catch up with them later through
farmer-to-farmer training. Finally, Genuis et al. (2014) suggest that both extension services and
social learning are strong determinants of technology adoption, and the effectiveness of each of
the two informational channels is enhanced by the presence of the other. These contradicting
findings suggest that the nature and strength of peer effects is not readily generalizable and
should be evaluated in each specific context (Sacerdote 2014).

6
Our main findings are summarized as follows. We find that while the adoption rates of
improved rice management practices are generally high even at the baseline, the treated farmers
are more likely to adopt improved practices, such as seed selection, transplanting in rows, and
field leveling, which is required for uniform crop maturity, within a year after the training. The
higher adoption rates of those recommended agronomic practices lead to improved rice yield
and quality as well as increased income per hectare among treated farmers. Once all farmers are
encouraged to exchange information later, productivity gaps between treated and control farmers
narrow sharply. It may seem possible to interpret this convergence as a sign of short-lived
impacts of training where trained farmers drop new practices and return to the traditional ones.
However, we observe that trained farmers continue to adopt the improved agronomic practices
two years after the training, and control farmers follow them. Our detailed network analysis
based on a dyadic regression further reveals that information flow from treated to control
farmers is less active than between control farmers (a reference group) a year after the training
but becomes more active two years after the training. Meanwhile, information exchange is more
active in the first place between treated farmers than between control counterparts. These results
together suggest that farmers followed our guidance not to exchange agricultural information
within the initial experimental phase, which enables us to rigorously evaluate the short-term
impact of training. Yet, once such a restriction is abolished and information exchange is
encouraged, control farmers could successfully catch up with treated farmers through social
learning. These results imply the importance of social learning not only for the wider diffusion of
agricultural technologies but also for reducing otherwise persistent inequality in experimental
settings.
To the best of our knowledge, this is the first study that attempts to impose SUTVA in the
initial experimental phase but intentionally relaxes it later. Although the existing RCTs pay due
attention to ethical concerns, to date, most studies seem to put too much emphasis on identifying
the efficacy and effectiveness of implemented projects as well as mechanisms underlying the

7
positive, negative, or negligible impacts. We do not deny the importance of those studies to fill
the significant knowledge gaps. However, it might also be valuable to build in a mechanism to
allow control groups to catch up with treated ones and rectify inequality generated by an
experiment. By reducing the RCTs’ potential social cost and improving the welfare of the entire
sample, the RCT is likely to be more widely accepted. This study demonstrates that such design
is possible by encouraging social interaction among subjects once the intended intervention
proves to provide positive impacts.
The rest of the paper is organized as follows. Section 2 explains the study setting,
sampling framework, and experiment design, and examines the summary statistics of our sample.
Section 3 explains our estimation strategy on the dynamic impact of training and discusses
estimation results. Section 4 conducts a detailed analysis of the information network and
explains the estimation results. Section 5 concludes the study.
2. Survey and Experimental Design
2.1 The Study Area
The study took place in the Bellier and Gbeke regions, near the capital city of Yamoussoukro, in
Cote d’Ivoire. The two regions were selected under a bilateral official development assistance
(ODA) program between the Ivoirian and Japanese governments. Japanese technical experts
were dispatched from 2014 to 2018 to improve domestic rice production and increase the
quantity of marketed rice through the ODA scheme organized by Japan International
Cooperation Agency (JICA). There are a total of 107 production sites suitable for rice
production within those two regions, which are all located in the lowlands. Some production
sites have sufficient access to irrigation water and are able to cultivate rice twice in a good year.
Others are in low-humidity zones (called bas-fonds), dependent on rainfall. The main rice
8
cultivation season is roughly from July to December. If irrigated, a second cycle starts around
January/February. When water is insufficient, farmers produce other crops, such as yams and
peanuts, or leave the paddy field to fallow. Since these two regions are agro-climatically more
favorable for rice production than other areas in the country, farmers have received various rice
cultivation trainings provided by international donors, including JICA, World Bank, and
AfricaRice, as well as local extension agencies, including Agence Nationale d'Appui au
Développement Rural (ANADER).
Out of 107 sites, two production sites were initially selected for the JICA project in 2014.
Thereafter, the target area was expanded every year to cover a total of 26 sites until 2018. This
study relies on the data from eight production sites selected in 2015. To choose our study sites,
we closely collaborated with technical experts. Admittedly, selection was not completely
random because technical experts have a target to cover 1,500 hectares of land within the
five-year project period. Thus, the study sites are relatively larger in operational size than the
other remaining sites in the Bellier and Gbeke regions. Since the impacts of training may
potentially vary by agro-ecological and institutional conditions, we classify all potential
production sites into four types depending on the accessibility to irrigation and the existence of
prior rice training: (Type 1) with at least a partial irrigation facility and experience in training;
(Type 2) without irrigation facilities but with experience in training; (Type 3) with at least a
partial irrigation facility but no (or inadequate) experience in training; and (Type 4) with neither
an irrigation facility nor experience in training. We then selected two of each type of site,
generating a sample of eight production sites in total.
2.2 Sampling Structure and Experimental Design
Prior to the experiment, we had meetings with farmers belonging to agricultural cooperatives in
each selected site. The objective of the meeting was to explain our implementation plan and

9
obtain consent from farmers. Although technical experts had experience in rice production
training in Cote d’Ivoire and recommended management practices for lowland rice cultivation
were fairly well established in experimental fields, we felt it was important to evaluate the
training impact on rice production performance through an RCT because it is common to
observe differences between on-farm and on-station results. We also wondered whether
management practices taught in this most recent training were ineffective for those who had
already received similar training in the past or those whose productivity was already close to the
production possibility frontier.
Based on an agreement with technical experts, we explained our plan to farmers as
follows: (1) We would like to conduct a social experiment to assess the impact of training and
ask farmers to cooperate with us; (2) farmers are randomly grouped into two groups, with one
eligible to receiving the training offered by the JICA experts while the other is expected to apply
the best management practice they had access to; (3) all farmers including control farmers are
provided with necessary inputs, such as improved seeds and chemical fertilizer, on credit; (4) the
experimental phase lasts one year during which farmers belonging to different groups are
expected not to exchange information about techniques and management practices taught in
training. Specifically, we request treated farmers not to transmit information taught in the
training and controlled farmers to refrain from asking treated farmers for agricultural advice; (5)
before and after the experiment, we will conduct household surveys for impact evaluation; (6) if
farmers follow our guidance and treated farmers do not transmit information on rice production
management, we can obtain reliable estimates of the impact of training; (7) after the impact
assessment, we will share which technology (i.e. conventional practice vs. one taught in
training) is found to be superior; and (8) after the experimental phase, farmers are encouraged to
share information to provide farmer-to-farmer training.
While unequal treatment during the experimental phase could be a source of tension
between treated and control farmers, we attempted to make them feel neither lucky nor unlucky

10
in their treatment status. Rather, we emphasized that once we know which technology is better,
everyone can benefit from such knowledge and that the success of this social experiment
depends crucially on whether farmers exchange information or not within one year after the
training. This sort of explanation seems to ease tensions, and most farmers understood the
purpose of this experiment and showed strong willingness to cooperate with us.2
After obtaining consent, we collected individual member lists from each agricultural
cooperative. We attempted to randomly select about 100 farmers from each type specified above.
However, since the total number of farmers in Type 3 was only around 50, we overweighed Type
4 so that the number of farmers with and without past training experience totalled roughly 200.
Out of 414 farmers on the shortlist, 295 households were found to be active rice producers who
cultivated rice at least once in the preceding year, resulting in 83 farmers in Type 1, 73 farmers in
Type 2, 39 farmers in Type 3, and 100 farmers in Type 4. These 295 households constitute the
primary sample in this study. We conducted the baseline survey with those households from
January 2015 to April 2015. The data pertain to household demographic characteristics,
accessibility to land and its tenure status, details of rice production and other income-generating
activities, and household asset holdings.
We then assigned eligibility to participate in the training. One half of sample households
were randomly selected as a treatment group and the other half as a control group in each site.
Randomization was implemented at the farmer level within each site. Technical experts provided
a short classroom training to extension agents of ANADER and three key farmers who were
selected from each site. Those extension agents and key farmers in turn offered on-site training
to eligible farmers under the supervision of technical experts. This training consisted of (a) land
preparation, including land levelling, (b) water control, including canal construction and
maintenance, (c) seed selection and incubation, (d) fertilizer and herbicide application, and (e)
2 Some cooperatives voluntarily created rules to prevent control farmers from learning or adopting the agricultural techniques taught in the training.

11
harvest and post-harvest management. To mitigate noncompliance, particularly the participation
of the control farmers, local counterparts visited every session of the training and recorded who
participated in it. The on-site training proceeded gradually to meet the actual rice cultivation
cycle and, in total, it was held at least six times from June to November 2015 to cover the key
practices. We then conducted the follow-up surveys twice, the first soon after the training
(March 2016 to May 2016) and, the second two years after the training (March 2017 to May
2017). During the 2015–2016 seasons, however, there was a severe lack of rainfall. Thus, sample
attrition is serious as will be discussed below.
2.3 Descriptive Statistics and Balancing Test
Table 1 presents the composition of our sample plots. We have a total of 424 plots from 295
households in the baseline survey. Of those, 333 plots were rice planted in the main season. The
number of sample plots in the main season dropped sharply to 193 in the mid-line and further to
168 in the end-line survey because of the lack of rainfall. Rice cultivation was difficult in these
years even for those with access to irrigation because of insufficient water. Therefore, second
cropping was almost impossible for most farmers. As a result, the number of plots cultivating
rice in the sub-season declined substantially from the baseline survey. Production sites without
irrigation, that is, Types 2 and 4, were more severely affected by rainfall shortages, and the
number of attrited sample farmers from these groups is larger than from the others.
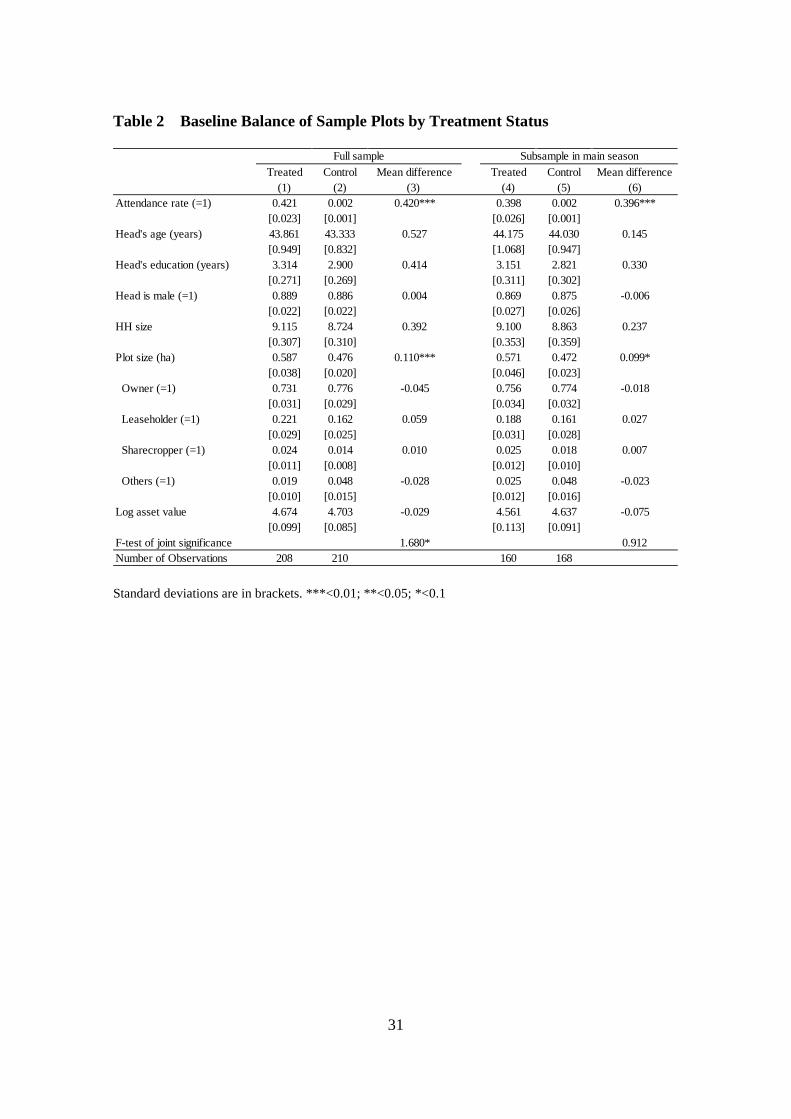
Table 2 shows the balance test on baseline characteristics for the full sample and
sub-sample in the main season. Households with missing values are dropped. We conducted a
t-test of the equality of means between the treated and control farmers and joint significance
F-tests in columns (3) and (6).
On average, households are large (about nine persons), headed by a male in the mid-40s
with minimal or no formal education. The average plot size is relatively small—approximately

12
0.5 hectare. Although the treatment status was randomized, the difference in the plot size
between treatment and control farmers is statistically significant for both full and sub samples.
Most land was operated under owner cultivation. If rented, it was generally under a fixed-rent
contract. Attendance rates at the training was about 42% among treated farmers, while it was
almost null (only two cases) among control farmers, indicating that almost all control farmers
adhered to our request and did not participate in the training. We conducted the joint significant
test except for the attendance rate, demonstrating that we reject the zero-null hypothesis for the
full sample, while we fail to reject it for the sub-sample in the main season. Given that baseline
covariates are balanced only in the main season and that the second crop likely involves
self-selection, we focus on the main season crop in the subsequent analysis.
Table 3 compares the baseline characteristics of attrited and non-attrited samples with a
t-test of the equality of the mean between the two and the associated joint significance F-test.
The attrition rate differs notably by the accessibility of irrigation, and the share of the sample
from irrigation sites (i.e., Types 1 and 3) is significantly larger among non-attrited samples.
Furthermore, most key observable characteristics are statistically significantly different between
attrited and non-attrited samples: on average, attrited samples are more likely to be
female-headed with less education, larger in household size but smaller in plot size, and more
likely to own rice plots. The joint significance test shows that the zero-null hypothesis is strictly
rejected, implying that attrition is non-random. This non-random sample attrition is a potential
threat to our statistical inference, which should be addressed in the econometric analysis.
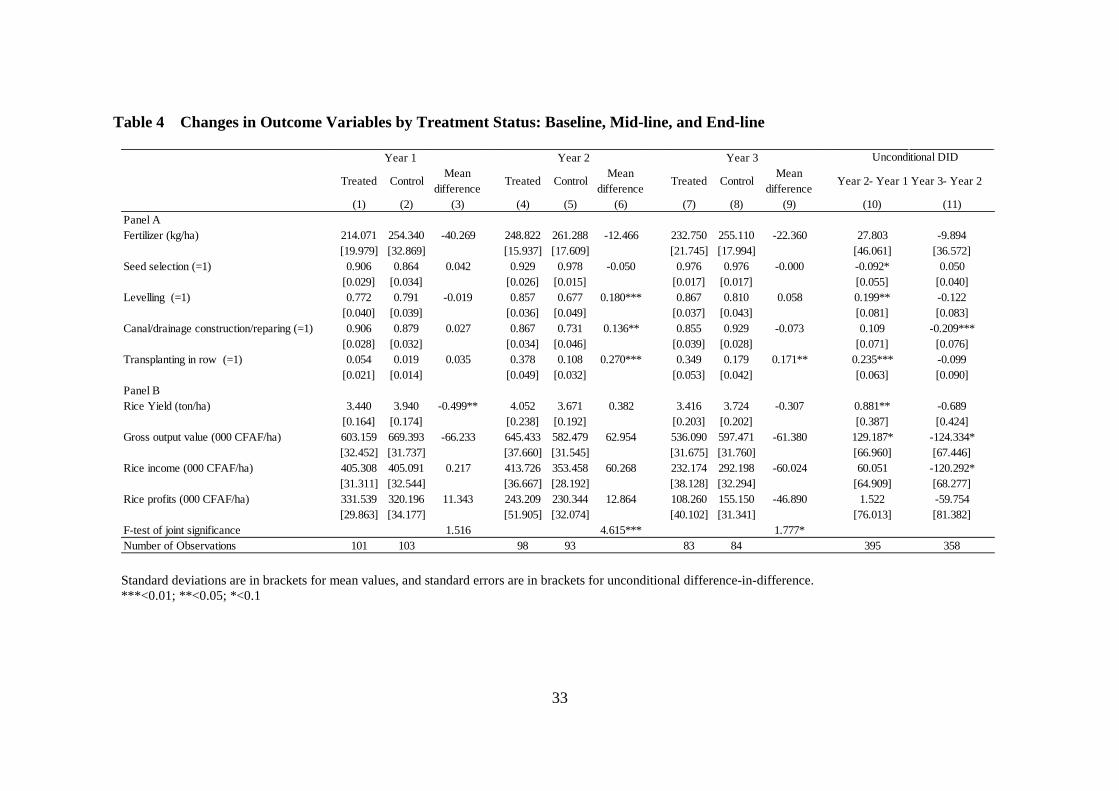
Before discussing our empirical strategy in detail, Table 4 presents the changes in
outcome variables of interest regarding rice management practices and productivity of
non-attrited samples over time. We again show the results of t- and F-tests for treated and control
plots. In addition, columns (10) and (11) present an unconditional difference-in-differences
(DID) regression estimate of the treatment effect (i.e. the difference in the time trend between
treated and control plots).

13
The adoption of recommended management practices was generally high even in the
baseline (Panel A). Because of its proximity to AfricaRice, the adoption of the modern variety of
rice was complete and uptake rates reached 100%.3 The use of chemical fertilizers was also
remarkably high by SSA standards: on average, more than 200 kg/ha of fertilizer, such as NPK
and UREA, were applied. In addition to these external inputs, the adoption of improved
agronomic practices helps boost rice yield in SSA (Otsuka and Larson 2013, 2016). Water
canal/drainage construction and maintenance are important to manage water levels in rice fields
during the growth period, while levelling is crucial to reduce the amount of water wasted by
uneven pockets and to promote even growth of rice plants. Straight-row planting can be adopted
to facilitate other complementary management practices such as hand or rotary weeding and
even the application of fertilizers, herbicides, or insecticides. In our sample, 75–90% of plots had
levelled fields and constructed/repaired water canal/drainages in the baseline. Most sample
farmers selected better seeds by water or winnowing, whereas transplanting in row was less
common.
Panel B shows the rice productivity and profitability of sample plots. Gross production
value per hectare is computed by multiplying the rice yield (1000 kg/ha) with the price received
(kg/CFAF).4 Rice income per hectare is equal to the gross production value minus paid-out costs,
including land rent, irrigation fees, costs of purchased chemicals, and machinery rental, divided
by the plot size. Profits per hectare are equal to rice income minus imputed family labor costs,
divided by the plot size. To impute family labor costs, we used the typical prevailing hired wage
rate for transplanting in each village. The average yield exceeds 3.4 tons/ha which is
significantly higher than the average of other countries in SSA of just above 2 tons/ha (Otsuka
and Larson 2016). The average gross output value, rice income, and profits per hectare were
3 The vast majority of farmers used WITA-9, a high-yielding variety that is tolerant to rice yellow mottle virus and iron toxicity with a maturity period of about 110 days. 4 1 USD is equivalent to 563 CFAF as of January 2015.
14
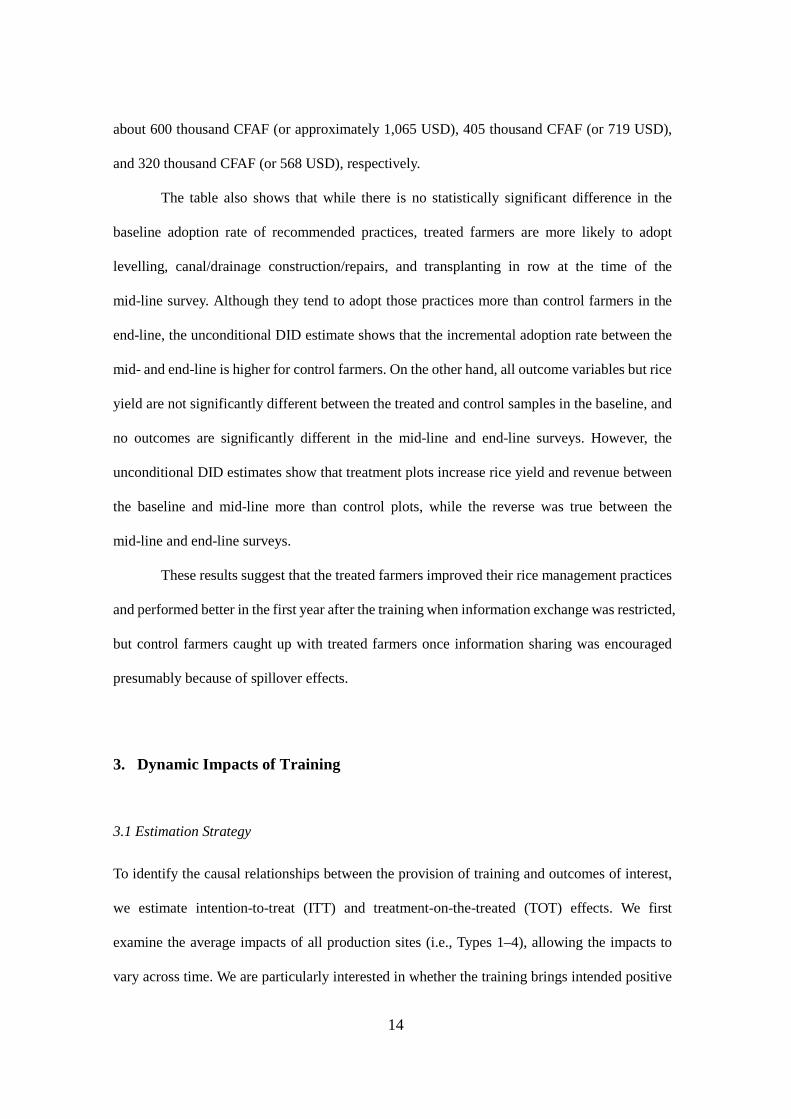
about 600 thousand CFAF (or approximately 1,065 USD), 405 thousand CFAF (or 719 USD),
and 320 thousand CFAF (or 568 USD), respectively.
The table also shows that while there is no statistically significant difference in the
baseline adoption rate of recommended practices, treated farmers are more likely to adopt
levelling, canal/drainage construction/repairs, and transplanting in row at the time of the
mid-line survey. Although they tend to adopt those practices more than control farmers in the
end-line, the unconditional DID estimate shows that the incremental adoption rate between the
mid- and end-line is higher for control farmers. On the other hand, all outcome variables but rice
yield are not significantly different between the treated and control samples in the baseline, and
no outcomes are significantly different in the mid-line and end-line surveys. However, the
unconditional DID estimates show that treatment plots increase rice yield and revenue between
the baseline and mid-line more than control plots, while the reverse was true between the
mid-line and end-line surveys.
These results suggest that the treated farmers improved their rice management practices
and performed better in the first year after the training when information exchange was restricted,
but control farmers caught up with treated farmers once information sharing was encouraged
presumably because of spillover effects.
3. Dynamic Impacts of Training
3.1 Estimation Strategy
To identify the causal relationships between the provision of training and outcomes of interest,
we estimate intention-to-treat (ITT) and treatment-on-the-treated (TOT) effects. We first
examine the average impacts of all production sites (i.e., Types 1–4), allowing the impacts to
vary across time. We are particularly interested in whether the training brings intended positive

15
impacts in the first year after the training with the gap generated by the experiment decreases
over time through spillovers in the next year. Following McKenzie (2012), we employ an
analysis of covariance (ANCOVA) model in the form of:
𝑌𝑌𝑖𝑖𝑖𝑖𝑖𝑖 = 𝛽𝛽0 + 𝛾𝛾𝑌𝑌𝑖𝑖𝑖𝑖0 + 𝛽𝛽1𝑇𝑇𝑖𝑖 + 𝛽𝛽2𝐷𝐷𝑖𝑖𝑖𝑖 + 𝛽𝛽3(𝑇𝑇𝑖𝑖 × 𝐷𝐷𝑖𝑖𝑖𝑖) + 𝑋𝑋𝑖𝑖𝑖𝑖0𝛿𝛿 + 𝜇𝜇𝑖𝑖 + 𝜀𝜀𝑖𝑖𝑖𝑖𝑖𝑖 (1),
where 𝑌𝑌𝑖𝑖𝑖𝑖𝑖𝑖 and 𝑌𝑌𝑖𝑖𝑖𝑖0 are the post- and pre-treatment outcome variables of plot i in production
site j at time t (i.e., either mid-line or end-line) and time 0 (i.e., baseline); 𝑇𝑇𝑖𝑖 is a dummy
variable for the end-line data; 𝐷𝐷𝑖𝑖𝑖𝑖 is a dummy variable equal to one if a household is eligible to
participate in the training (ITT estimate) or a continuous variable for the attendance rate of
training, instrumented by the treatment status (TOT estimate)5; 𝑋𝑋𝑖𝑖𝑖𝑖0 is a set of baseline control
variables; 𝜇𝜇𝑖𝑖 is the time-invariant fixed effect at the production site; and 𝜀𝜀𝑖𝑖𝑖𝑖𝑖𝑖 is the unobserved
error term. The parameters of interest are 𝛽𝛽2 and 𝛽𝛽3 . The former captures the short-term
impacts of training under the imposition of the SUTVA, while the latter represents the mixture of
the longer-term training impacts and spillover effects when the SUTVA is relaxed. We note that
the pure training impact is estimable only in the short-term.
As outcome variables, we focus on the use of chemical fertiliser (kg/ha), the adoption of
seed selection by water or winnowing (=1), levelling (=1), canal/drainage construction/repairing
(=1), and transplanting in row (=1) as well as rice yield (ton/ha), gross output value (‘000CFAF),
rice income (‘000CFAF), and rice profit (‘000CFAF) per hectare. When the outcome is binary,
we apply a liner probability model. As baseline control variables, we include household size,
household head’s characteristics (including age, gender, and years of education), plot
characteristics (including parcel size and tenure status dummies), and the logged value of
household assets at the baseline survey. We cluster all standard errors within production sites.
5 Strictly speaking, this is the local average treatment effect (LATE). However, because almost no control farmers attended the on-site training, our estimate can be virtually considered TOT (Angrist and Pische 2008).

16
The random assignment of treatment status should make the treatment and control
groups similar in expectation. Therefore, including controls in regressors and/or applying the
ANCOVA model would not affect the consistency of the estimated treatment effects. However,
the inclusion of additional controls is expected to lend greater credibility to internal validity of
the estimates when some baseline imbalance exists. Thus, we prefer and present the results with
baseline controls. Still, the estimated parameters may be biased due to non-random sample
attrition. To adjust for that, we use the inverse-probability weighting method, suggested by
Wooldridge (2010). Specifically, we run the probit regression to compute the predicted
probability of non-attrition and use the inverse of it as weights in the main equation. This
first-stage probit regression result is presented in Appendix 1.
3.2 Estimation Results
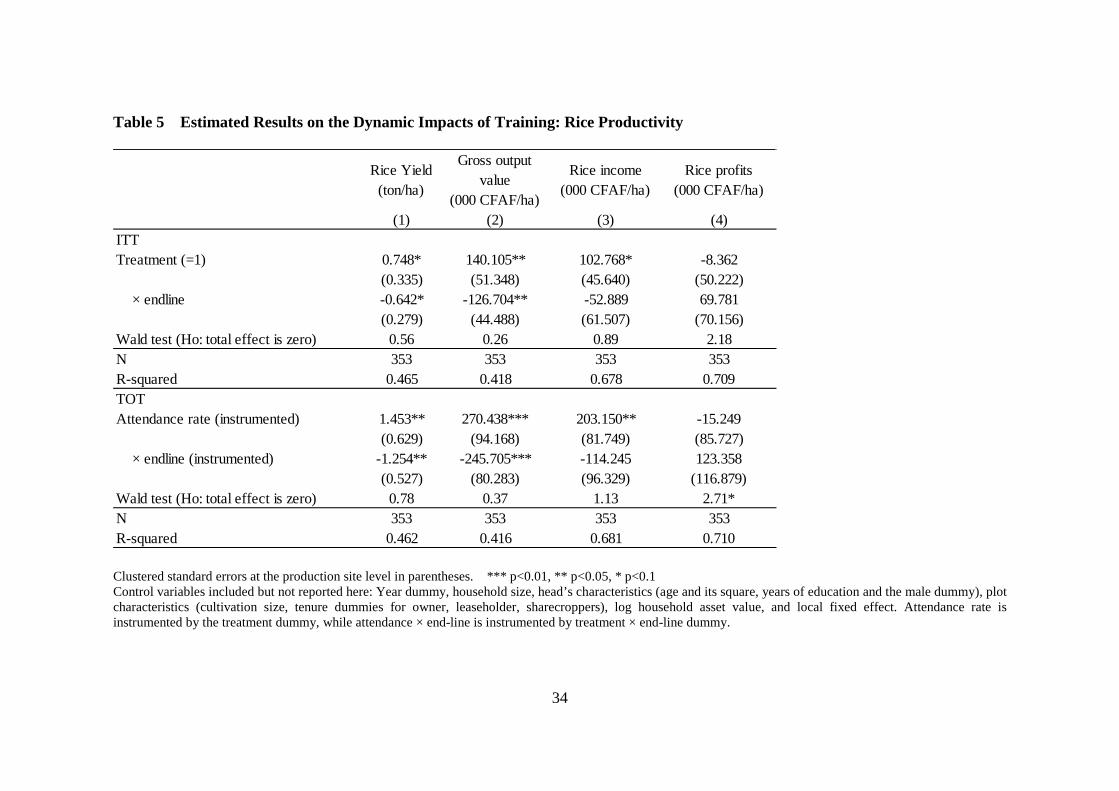
Table 5 shows the estimation results for the dynamic impacts of management training on rice
productivity and profitability. For the sake of brevity, coefficients on control variables are
suppressed.
It is clear that training has positive and significant impacts on rice productivity by the
mid-line, with the rice yield increasing by 0.75 ton/ha, gross output value per hectare by 140
thousand CFAF, and rice income per hectare by 103 thousand CFAF. These improvements
correspond to 20%, 24%, and 29% of control means, respectively, suggesting that management
training was effective in our context.6 This improvement in productivity, however, does not lead
to an increase in profits. As we will see, this is presumably because trained farmers test a larger
number of improved management practices than control farmers, who require more family labor
inputs. Qualitatively similar results are observed for TOT estimates. The fact that we see 6 According to experienced agricultural experts, impacts of recommended management practices on rice productivity are generally larger when there is sufficient water. Thus, our estimates could be considered the lower bound of the impacts that would be realized in a year with normal rainfall.
17
quantitatively larger magnitudes of impacts in TOT than ITT estimates suggests that actual
training participation rather than its simple eligibility is important to improve production
performance.
Notably, the coefficient estimates on the interaction term are negative and significant for
rice yield and gross output value per hectare. This indicates that the improvement of
performance among treatment groups from the mid- to end-line is lower than control groups.
The Wald test shows that we cannot reject the null hypothesis that the total training effect is zero
in most specifications, implying that treated farmers are no better than control farmers by the
end-line. We can interpret this negative interaction term, 𝛽𝛽3, as reflecting either the short-lived
training effects or the existence of spillover effects. If training impacts do not last long, however,
we would observe some signals, such as the declining adoption rate of improved management
practices among treated farmers. We did not observe clear disadoption patterns in Table 4. Thus,
this finding seems consistent with the operation of a mechanism wherein control farmers
improve their performance by learning from treated farmers after the SUTVA is relaxed.
Table 6, which shows estimated impacts of training on the adoption of improved
agronomic practices, also provides supportive evidence of spillovers. When information
exchange between treated and control farmers was restricted during the year after the training,
the positive training impact on the adoption of improved management practices, such as
levelling, canal/drainage construction/repairing, and straight-row transplanting is observed
among treated farmers (ITT estimate) and training participants (TOT estimate). However, once
the restriction was lifted two years after the training, control farmers successfully caught up with
treated farmers in the adoption of recommended practices, as reflected in the negative and
significant coefficients on the interaction term, 𝛽𝛽3.7 The Wald tests also confirm that in most
outcomes we fail to reject the hypothesis of zero training impact in the longer term.
7 Since the same amount of fertilizer is provided to both treatment and control groups in the experimental phase, it seems plausible to observe insignificant effects of training on this outcome.
18
Taken together, we confirm that training has positive impacts in the short-term not only
on the adoption of improved rice management practices but also on rice productivity. Our further
intervention encouraging farmers to spread information contributes to reducing the generated
gap.8 In order to ascertain whether this result reflects spillovers, we will examine in more detail
whether social networks actually mediate the information spillover in Section 4.9
3.3 Heterogeneous Treatment Effects
Before moving on to the detailed network analysis, we investigate the heterogeneous treatment
effects by the type of production site. The purpose of this analysis is to determine whether this
training had negligible impacts on those who had already received similar training in the past or
those whose production was already close to the production possibility frontier. Since the
introduction of multiple interaction terms and multiple endogenous variables makes
interpretation complex, we estimate time-invariant ITT effects by incorporating the interaction
term only between the treatment and type dummies. We thus ignore the differentiated dynamic
impact of the training across production sites over time and their corresponding TOT estimates.
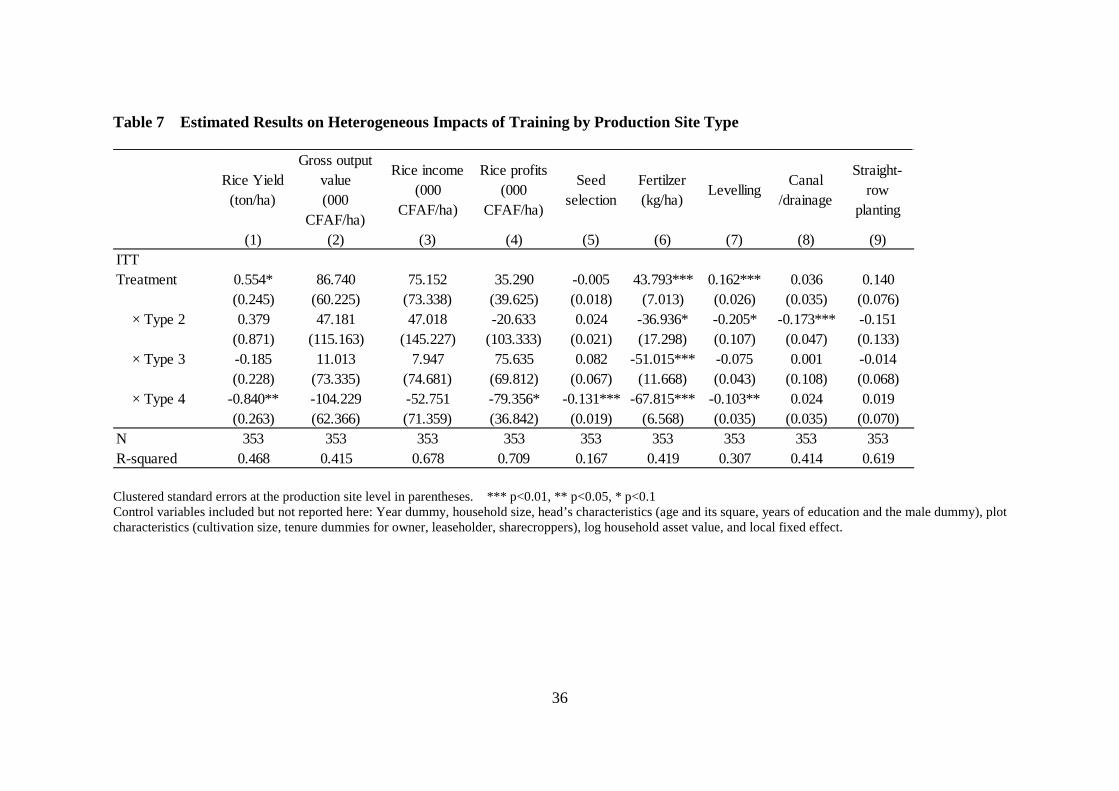
The estimated results in Table 7 show that the training had positive impacts on the
adoption of recommended rice management practices and rice productivity, including rice yield,
the use of chemical fertilizer per hectare, and the application of levelling. Contrary to our
expectation, statistically significant impacts prevail, especially for Type 1, where rice cultivation
environments are most favorable, and farmers have sufficient experience with training in the
8 Although the number of our outcome variables is not so large, one may wonder if we find false positives because of testing multiple hypotheses. To address this concern, we compute false discovery rate sharpened q-values corrected multiple testing, following the Benjamini-Kreieger-Yekutieli method (Bendamini et al. 2006). All outcome variables that show statistically significant effects in Tables 6 and 7 remain significant at 10% or lower. 9 If spillovers exist, the average performance of control groups would improve over time, which could be reflected in 𝛽𝛽1 (the end-line dummy)>0. 𝛽𝛽1 is positive for most outcome variables, and statistically significant for the adoption of canal/drainage construction/repairing and straight-row planting for TOT estimation, further supporting our interpretation in favor of the existence of spillovers.

19
past. Those who belong to Type 4, for which production environments are least favorable and
training experience is scant, do not learn much from training, as indicated by the negative and
significant coefficient estimates on the treatment dummy interacting with the type dummy for
most specifications. This might show the low expected returns of improved rice production
methods in rain-fed areas where water control is difficult, which was also the case in Asia (David
and Otsuka 1994).
4. Spillover Effects
4.1 Information Network Analysis
Having shown the treatment effects across time and production sites, we now examine whether
social networks actually mediate information spillover from treated to control farmers, using the
detailed learning link data.
A fundamental empirical challenge on this topic is how to correctly specify one’s social
network. Asking respondents about their social network by arbitrarily setting a cap on the
number of links may result in truncation bias, while asking an open-ended question tends to
capture only the strong links, ignoring the weaker ones (see, for example, Maertens and Barrett
[2013] for a thorough discussion of potential bias in empirically eliciting the true social network
structure). To address this concern, we exploit a “random matching within sample” technique to
elicit social networks, following, among others, Conley and Udry (2010), Maertens and Barrett
(2013), and Mekonnen et al. (2018). More specifically, we match each sample respondent with
six other survey respondents randomly drawn from the sample in the same production sites and
ask details of the (non)existence of information exchange about agronomic practices between
sample farmers. To examine the differential roles played by treatment and control peers, we
select three matches from treated farmers and the other three from control farmers. To capture

20
changes in the network of interactions over time, we collected the learning link data in both the
mid- and end-line surveys. As Santos and Barrett (2008) demonstrate, the
random-matching-within-sample method recovers the underlying social network structure more
reliably than other available methods, such as a network-within-sample method in which each
respondent is asked about his/her link to every other household in the sample.
We then run a dyadic regression for those who know their matches to characterize the
flow of information about management practices across farmers over time.10 Formally, let 𝐿𝐿𝑖𝑖𝑖𝑖𝑖𝑖
be equal to one if a respondent farmer i asks farmer j (conditional on i knows j) for advice on
agronomic practice, such as land preparation, transplanting, and fertilizer application, at time t.11
We explore the correlates of learning links by including attributes of a household i and j as:
𝐿𝐿𝑖𝑖𝑖𝑖𝑖𝑖 =δ + γTt + α1𝐷𝐷𝑖𝑖𝑖𝑖1+α2𝐷𝐷𝑖𝑖𝑖𝑖2 + α3𝐷𝐷𝑖𝑖𝑖𝑖3+β1(𝐷𝐷𝑖𝑖𝑖𝑖1 × Tt) + β2(𝐷𝐷𝑖𝑖𝑖𝑖2 × Tt) + β3(𝐷𝐷𝑖𝑖𝑖𝑖3 × Tt)
+�𝑋𝑋𝑖𝑖 + 𝑋𝑋𝑖𝑖�𝜌𝜌 + �𝑋𝑋𝑖𝑖 − 𝑋𝑋𝑖𝑖�𝜏𝜏 + 𝑊𝑊𝑖𝑖𝑖𝑖𝜋𝜋 + 𝜑𝜑 + 𝑢𝑢𝑖𝑖𝑖𝑖𝑖𝑖 (2),
where 𝐷𝐷𝑖𝑖𝑖𝑖1 , 𝐷𝐷𝑖𝑖𝑖𝑖2 , and 𝐷𝐷𝑖𝑖𝑖𝑖3 are a combination of the treatment status of households i and j with
[treated, treated], [treated, control], and [control, treated]. The remaining combination [control,
control] is a reference group; T is a binary indicator for the end-line survey; 𝑋𝑋𝑖𝑖 and 𝑋𝑋𝑖𝑖 denote a
vector of baseline controls for farmers i and j characteristics, respectively12; 𝑊𝑊𝑖𝑖𝑖𝑖 describes a
dummy equal to one if the gender of both farmers is the same; 𝜑𝜑 is the production site fixed
effect; and 𝑢𝑢𝑖𝑖𝑖𝑖 is a random disturbance. Following Attanasio et al. (2012), standard errors are
clustered at the production site level to allow for possible correlations not only within dyadic
pairs but also across all dyads in the same location.
10 Using the full sample, including nonacquaintance pairs, does not alter our main findings. 11 In the questionnaire, we asked respondents whether he/she asked advice on rice management practice from a specified person by the time of the survey. 𝐿𝐿𝑖𝑖𝑖𝑖𝑖𝑖 is one if the answer to this question is yes. 12 If 𝐿𝐿𝑖𝑖𝑖𝑖 is bidirectional (i.e., 𝐿𝐿𝑖𝑖𝑖𝑖 = 𝐿𝐿𝑖𝑖𝑖𝑖), 𝛽𝛽𝑋𝑋𝑖𝑖𝑖𝑖 = 𝛽𝛽𝑋𝑋𝑖𝑖𝑖𝑖 should be imposed: In such a case,|𝑋𝑋𝑖𝑖 − 𝑋𝑋𝑖𝑖| instead of �𝑋𝑋𝑖𝑖 − 𝑋𝑋𝑖𝑖� is more relevant as regressors (Fafchamps and Gubert 2007).

21
Table 8 presents estimated results by a linear probability model. The coefficient estimate
on the [treated, treated] dummy, α1, is positive and statistically significant, but its interaction
term with the end-line data dummy, β1 , is statistically insignificant. This indicates that
information exchange amongst treated farmers is more active than control counterparts at the
same production site, and its tendency does not systematically change over time. On the other
hand, consistent with our expectation, we observe a negative and significant coefficient on the
[control, treated] dummy, α3, and a positive and significant coefficient on the interaction term
with the end-line data dummy, β3 . These results illustrate that either controlled farmers
refrained from asking agricultural advice from treated farmers or the latter refrained from
disclosing the management information to the former in the first year after the training,13 but
they are eager and active in doing so in the second year after the training. This strongly indicates
that impact evaluation in the initial phase was less likely to be undermined by spillovers,
supporting our claim that the recommended practices were more productive. It also supports our
main finding that there were information spillovers after the relaxation of the SUTVA in the two
years after the training, which would facilitate control farmers to improve their rice management
practices and performance through social learning.
4.2 Extension to the Linear-in-mean Model
While our analysis so far supports the existence of social learning, one may wonder whether
respondents’ self-report about information exchange patterns is biased and simply reflects their
willingness to satisfy researches’ expectation. Although we cannot directly address such
concerns, if social learning actually plays a role, we might observe the influences of peer
behavior and performance on one’s own. As a robustness check to verify this possibility, we
13 This is also consistent with the fact that some cooperatives created their own rules to keep control farmers from learning the management practices taught in the training during the first year.

22
employ the linear-in-mean model. Exactly identifying peer effects is, however, complicated
because of reflection problems. As discussed by Manski (1993), individuals would behave
similarly not only through social learning (called the “endogenous effect”), but also because they
have similar characteristics (called the “exogenous effect”) or they face similar institutional
environments (called the “correlated effect”). To disentangle endogenous social effects from
other confounders, we add several variables to Equation (1).
First, based on the network data elicited in the random-matching-within-sample method,
we take the average values of baseline observable characteristics in i’s information network,
regardless of whether network peers are treated or control farmers, and include them into
regressors. This serves to control for exogenous effects along with the location fixed effects that
control for unobservable correlated effects. Second, to explore whether the peers’ average
behavior and performance directly affect farmer i’s performance, we also include the average
productivity or technology adoption in i’s network, regardless of their treatment status. Since the
number of peer adopters in i’s information network is used for the numerator of technology
adoption variables, this mimics an identification strategy undertaken by Bandiera and Rasul
(2006).14,15 Following Mekonnen et al. (2018), we use lagged rather than contemporaneous
values of mean group performance or behavior in recognition that information on agricultural
technology cannot be diffused quickly. Third, as another variable to capture endogenous peer
effects especially mediated by treated farmers, we add the share of treated farmers in i’s
information network along with the network size (i.e., max six). This is akin to the methodology
used by Kremer and Miguel (2007) and Oster and Thronton (2012). The original intuition behind
this method is that once we control for the network size (which could be potentially
14 Unlike Bandiera and Rasul (2006), however, we created the variable of peer adopters based not on respondent’s perception (i.e., proxy-report), but on peer’s own self-reports in the interview. See Hogset and Barrett (2010) for a discussion on how proxy-report tends to contain a measurement error and possibly biases estimation results. 15 Following Bandiera and Rasul (2006), we have included the quadratic term of the average outcome in i’s network as well, but we did not find significant non-linear relationships.

23
endogenous),16 the share of network peers in the treatment group is random because of the
randomized experiment. This exogenous variation can be then used to identify peer effects.
Note that the average peer performance and the share of treated farmers in i’s network
above are expected to reflect different channels of peer effects: the former may partly capture
learning by direct observation even without mouth-to-mouth communication, while the latter
may partly capture knowledge transmission from treated farmers even when treated farmers do
not actually adopt some technologies due to certain constraints.
We restrict the observation of this analysis to the end-line year as it reflects a normal
condition without the prohibition of information exchange, in which spillovers are more likely to
take place. We also restrict the outcome variables to rice yield, gross output value per hectare,
the adoption of field levelling, canal/drainage construction/reparing, and straight-row planting
for which strong information spillovers from treated to control farmers seem to exist as observed
in Table 6.
Although we attempt to minimize concerns about spurious correlation by controlling
exogenous and correlated effects, we are aware of a potential endogeneity issue in this exercise.
For example, control farmers who are more motivated, if all else held constant, may be more
willing to establish information links with treated farmers who know the new technique or with
peers who actually adopt it. Given the possibility that interventions can alter the underlying
network structure (Comola and Prina 2017; Advani and Malde 2018), we admit that our
constructed variables to capture social learning/endogenous peer effects are not free from
endogeneity concerns.17
16 In the random matching within sample method, the network size should not be interpreted literally, but rather as a proxy for one’s social connectedness where the more random matches a household knows, the larger will be their true social network (Murendo et al. 2018). 17 Without a sufficient number of instruments, it seems technically infeasible to overcome this potential endogeneity issue.

24
With this caveat in mind, the estimated results in Table 9 show that the share of treated
farmers significantly positively affect one’s own behavior and performance for gross output
value per hectare, levelling, and straight-row planting. We also observe a positive effect of the
average performance of network members in most specifications, although they are statistically
insignificant except for levelling, perhaps due partly to the low statistical power and partly to
difficulties in mimicking new technologies without learning through deep communication.
While these results should be interpreted with caution to avoid strong causal inference, it seems
to be no exaggeration to argue that the results provide further suggestive evidence on the
existence of spillovers, especially mediated through treated farmers.
5. Conclusions
The use of RCTs in empirical studies particularly in development economics has been growing
rapidly and providing a substantial amount of new knowledge on real-world practices. RCTs,
however, could be a potential source of inequality in outcomes to the extent that they offer
positive benefits to the treated individuals, giving rise to ethical concerns. By facilitating
spillovers from treated to control individuals, we could mitigate such inequality and improve
social welfare; however, it comes at a cost in that spillover could be a threat to accurate impact
assessment because it violates the SUTVA.
This study executes a novel RCT to examine whether rice management training has the
intended positive impacts on the adoption of recommended practices and productivity in the
short term as well as whether any performance gap between treated and control farmers
diminishes over time by facilitating information spillovers from the former to the latter in the
subsequent period. We found the positive and significant short-term effects of the training,
which widen the gap in yield by 20%, gross output value per hectare by 24%, and the adoption
rates of selected rice management practices between treated and control farmers. However,

25
during the technology dissemination process, control farmers improved their performance, and,
as a result, the gap between treated and control farmers becomes virtually zero in the longer term.
Our detailed analysis of learning link data shows supportive evidence of the existence of
information spillovers. Indeed, control farmers are less likely to ask treated farmers for advice on
rice management practices when we asked them not to do so and the two groups of farmers are
more likely to exchange new knowledge after the restriction is lifted. Thus, the benefit of the
direct training by extension agencies has been effectively spread from trained to non-trained
farmers through indirect farmer-to-farmer information transmission over time.
More often than not, experimental studies create inequality in the community that is
never addressed. This inequality may be socially costly and sometimes unacceptable to potential
beneficiaries and practitioners. In those cases, researchers would lose opportunities to deeply
understand the causes and resolutions of social problems, while communities and practitioners
might also miss opportunities to adopt effective programs. By contrast, the present study has
demonstrated a unique research design, in which we initially run the RCT to establish the impact
of an intervention, and we next facilitate the dissemination of the useful information to the rest of
the community by providing subjects with opportunities for social learning.
We expect that the benefit of this new research design is particularly pronounced in
development programs whose benefits can be shared by local community members. Examples
include training in the use of agricultural technology, entrepreneurial management, and health
care, wherein local community members can simultaneously benefit from new knowledge
without jeopardizing others’ use and without incurring substantial training cost.
One specific policy implication drawn from our study is that since knowledge of
agronomic management practices is likely to be a local public good, it should be disseminated at
least initially by the public sector through such means as agricultural training. Otherwise, efforts
to improve technology would be suboptimum because of non-excludability of agricultural
technology. In all likelihood, it is a mistake to assume that profit-oriented private enterprises

26
provide technology information, e.g. through contract farming, unless information
dissemination through social networks is not feasible. Public extension agents can save
resources by offering the extension services only to selected farmers in the community who
would then offer a technical training to neighboring farmers. Although our experiment relies on
random assignments without any incentive scheme, how to best select treated nodes and whether
incentives should be given to them in order to maximize diffusion and efficiency may be
important questions for future research (Beaman et al. 2015; Emerick et al. 2016; Kondylis et al.
2017: Barrett et al. 2018; BenYishay and Mobarak 2018).
Another more general policy implication to be stressed is the importance of rigorous
impact evaluation using RCTs combined with other methodologies to identify useful knowledge
for local people. This is crucial to avoid the persistence of traditional inferior practices or the
introduction of inappropriate knowledge, which can take place if a social experiment is
dispensed with. Herein lies a new important opportunity for economists and experts in
agricultural, management, and health sciences to collaborate on for the sake of improving the
well-being of a group of people.

27
References
Advani, Arun, and Bansi Malde. 2017. “Credibly Identifying Social Effects: Accounting for Network Formation and Measurement Error.” Journal of Economic Survey (forthcoming).
Angrist, Joshua D, and Jorn-Steffen Pischke. 2008. Mostly Harmless Econometrics: An Empiricist’s Companion. Princeton University Press: Princeton.
Attanasio, Orazio, Abigail Barr, Juan C Cardenas, Garance Genicot, and Costas Meghir. 2012. “Risk Pooling, Risk Preferences, and Social Networks.” American Economic Journal: Applied Economics 4 (2): 134-67.
Bandiera, Oriana, and Imran Rasul. 2006. “Social Networks and Technology Adoption in Northern Mozambique.” Economic Journal 116 (514): 869-902.
Banerjee, Abhijit, Esther Duflo, Rachel Glennerster, and Cynthia Kinnan. 2015a. “The Miracle of Microfinance? Evidence from a Randomized Evaluation.” American Economic Journal: Applied Economics 7 (1): 22-53.
Banerjee, Abhijit, Esther Duflo, Nathanael Goldberg, Dean Karlan, Robert Osei, William Parienté, Jeremy Shapiro, Bram Thuysbaert, and Christopher Udry. 2015b. “A Multifaceted Program Causes Lasting Progress for the Very Poor: Evidence from Six Countries.” Science 348 (6236): 1260799.
Barrett, Christopher, Paul Christian, and Abebe Shimeles. 2018. “The Processes of Structural Transformation of African Agriculture and Rural Spaces.” World Development 105: 283-85.
Bastagli, Francesca, Jessica Hagen-Zanker, Luke Harman, Valentina Barca, Georgina Sturge, and Tanja Schmidt. 2016. Cash Transfers: What Does The Evidence Say? A Rigorous Review of Programme Impact and of the Role of Design and Implementation Features. ODI: London.
Beaman, Lori, Ariel Benyishay, Jeremy Magruder, and Ahmed M. Mobarak. 2015. “Can Network Theory-Based Targeting Increase Technology Adoption ?” Working Paper.
Benjamini, Yoav, Abba M. Krieger, and Daniel Yekutieli. 2006. “Adaptive Linear Step-up Procedures that Control the False Discovery Rate.” Biometrika 93 (3): 491-507.
BenYishay, Ariel, and Ahmed M. Mobarak. 2018. “Social Learning and Incentive for Experimentation and Communication.” Review of Economic Studies (conditionally accepted).
Comola, Margherita, and Silvia Prima. 2017. “Treatment Effect Accounting for Network Changes: Evidence from a Randomized Intervention.” Mimeo.
Conley, Timothy G, and Christopher R. Udry. 2010. “Learning about a New Technology: Pineapple in Ghana.” American Economic Review 100 (1):35-69.
David, Christina C, and Keijiro Otsuka. 1994. Modern Rice Technology and Income Distribution in Asia. Boulder, USA: Lynne Rienner Publishers.
de Janvry, Alain, Elisabeth Sadoulet, and Tavneet Suri. 2017. “Field Experiments in Developing Country Agriculture.” In Handbook of Economic Field Experiments, Vol. 2, edited by A. Banerjee, and E. Duflo, 427-66. Amsterdam: Elsevier.
Dupas, Pascalin. 2011. “Health Behavior in Developing Countries.” Annual Review of Economics 3: 425-49.
Emerick, Kyle, and Manzoor H. Dar. 2017. “Enhancing the Diffusion of Information about Agricultural Technology.” Unpublished manuscript.
Evans, David, and Anna Popova. 2016. “Cost-Effectiveness Analysis in Development: Accounting for Local Costs and Noisy Impacts.” World Development 77: 262-76.
Fafchamps, Marcel, and Flore Gubert. 2007. “The Formation of Risk Sharing Networks.” Journal of Development Economics 83 (2): 326-50.

28
Feder, Gershon, Rinku Murgai, and Jaime B. Quizon. 2004. “The Acquisition and Diffusion of Knowledge: The Case of Pest Management Training in Farmer Field Schools, Indonesia.” Journal of Agricultural Economics 55 (2): 221-43.
Foster, Andrew. D, and Mark R. Rosenzweig. 1995. “Learning by Doing and Learning from Others: Human Capital and Technical Change in Agriculture.” Journal of Political Economy 103 (6): 1176-1209.
Hogset, Heidi, and Christopher. B. Barrett. 2010. “Social Learning, Social Influence, and Projection Bias: A Caution on Inferences Based on Proxy Reporting of Peer Behavior.” Economic Development and Cultural Change 58 (3): 563-89.
Genius, Margarita, Phoebe Koundouri, Céline Nauges, and Vangelis Tzouvelekas. 2014. “Information Transmission in Irrigation Technology Adoption and Diffusion: Social Learning, Extension Services, and Spatial Effects.” American Journal of Agricultural Economics 96 (1): 328-44.
Guo, Mingliang, Xiangping Jia, Jikun Huang, Krishna B. Kumar, and Nicholas E. Burger. 2015. “Farmer Field School and Farmer Knowledge Acquisition in Rice Production: Experimental Evaluation in China.” Agriculture, Ecosystems and Environment 209: 100-07.
Kabeer, Nalia, and Hugh Waddington. 2015. “Economic Impacts of Conditional Cash Transfer Programmes: A Systematic Review and Meta-analysis.” Journal of Development Effectiveness 7 (3): 290-303.
Karlan, Dean, Aishwarya L. Ratan, and Jonathan Zinman. 2014. “Savings by and for the Poor: A Research Review and Agenda.” Review of Income and Wealth 60 (1): 36-78.
Kondylis, Florence, Valerie Mueller, and Jessica Zhu. 2017. “Seeing Is Believing? Evidence from an Extension Network Experiment.” Journal of Development Economics 125: 1-20.
Kremer, Michael, and Rachel Glennerster. 2011. “Improving Health in Developing Countries: Evidence from Randomized Evaluations.” In Handbook of Health Economics Vol. 2, edited by Mark V. Pauly, Thomas G. Mcguire and Pedro P. Barros, 201-315. Amsterdam: Elsevier.
Kremer, Michael, and Alaka Holla. 2009. “Improving Education in the Developing World: What Have We Learned from Randomized Evaluations?” Annual Review of Economics 1: 513-42.
Kremer, Michael, and Edward Miguel. 2007. “The Illusion of Sustainability.” Quarterly Journal of Economics 132 (4): 1007-65.
Krishnan, Pramila, and Manasa Patnam. 2014. “Neighbors and Extension Agents in Ethiopia: Who Matters More for Technology Adoption?” American Journal of Agricultural Economics 96 (1): 308-27.
Kugler, Adriana D, and Ingrid Rojas. 2018. “Do CCTs Improve Employment and Earnings in the Very Long-Term? Evidence from Mexic).” NBER Working Paper No. w24248. Available at SSRN: https://ssrn.com/abstract=3112035
Maertens, Annemie, and Christopher B. Barrett. 2013. “Measuring Social Networks’ Effects on Agricultural Technology Adoption.” American Journal of Agricultural Economics 95 (2): 353-59.
Manski, Charles F. 1993. “Identification of Endogenous Social Effects: The Reflection Problem.” Review of Economics Studies 60 (3): 531-42.
McKenzie, D. (2012). “Beyond Baseline and Follow-up: The Case for More T in Experiments.” Journal of Development Economics 99: 210-21.
Mekonnen, Daniel Ayalew, Nicolas Gerber, and Julia Anna Matz. 2018. “Gendered Social Networks, Agricultural Innovations, and Farm Productivity in Ethiopia.” World Development 105: 321-35.

29
Miguel, Edward, and Michael Kremer. 2004. “Worms: Identifying Impacts on Education and Health in the Presence of Treatment Externalities.” Econometrica 72 (1): 159-217.
Murendo, Conrad, Meike Wollni, Alan De Brauw, and Nicholas Mugabi. 2018. “Social Network Effects on Mobile Money Adoption in Uganda.” Journal of Development Studies 54 (2): 327-42.
Munshi, Kaivan. 2004. “Social Learning in a Heterogeneous Population: Technology Diffusion in the Indian Green Revolution.” Journal of Development Economics 73 (1): 185-213.
Nakano, Yuko, Takuji W. Tsusaka, Takeshi Aida, and Valerien O. Pede. 2018. “Is Farmer-to-Farmer Extension Effective? The Impact of Training on Technology Adoption and Rice Farming Productivity in Tanzania.” World Development 105: 336-51.
Otsuka, Keijiro, and Donald F. Larson, eds. 2013. An African Green Revolution: Finding Ways to Boost Productivity on Small Farms. Dordrecht, Netherlands: Springer.
———. 2016. In Pursuit of an African Green Revolution: Views from Rice and Maize Farmers’ Fields. Dordrecht, Netherlands: Springer.
Oster, Emily, and Rebecca Thronton. 2012. “Determinants of Technology Adoption: Private Value and Peer Effects in Menstrual Cup Take-Up.” Journal of the European Economic Association 10 (6): 1263-93.
Parker, Susan W, and Tom Vogl. 2018. “Do Conditional Cash Transfers Improve Economic Outcomes in the Next Generation? Evidence from Mexico.” NBER Working Paper No. w24303. Available at SSRN: http://www.nber.org/papers/w24303.pdf
Sacerdote, Bruce. 2014. “Experimental and Quasi-Experimental Analysis of Peer Effects: Two Steps Forward?” Annual Review of Economics 6: 253-72.
Santos, Paul, and Christopher B. Barrett. 2008. “What Do We Learn about Social Networks When We Only Sample Individuals? Not Much.” Unpublished manuscript.
Schultz, T. Paul. 2004. “School subsidies for the poor: evaluating the Mexican Progresa poverty program.” Journal of Development Economics 74 (1): 199-250.
Tripp, Robert, Mahinda Wijeratne, and V.Hiroshini Piyadasa. 2005. “What Should We Expect from Farmer Field Schools? A Sri Lanka Case Study.” World Development 33 (10): 1705-20.
Wooldridge, Jeffery M. 2010. Econometric Analysis of Cross Section and Panel Data. 2nd ed. Cambridge: MIT Press.

30
Table 1 Sample Structure by Season, Year, and Type of Production Sites
YearMain
seasonSub
seasonType 1 Type 2 Type 3 Type 4 Total
2015 (baseline) 333 91 170 76 53 125 424
2016 (midline) 193 7 87 23 41 49 200
2017 (endline) 168 46 83 31 54 46 214
Total 694 144 340 130 148 220 838
31
Table 2 Baseline Balance of Sample Plots by Treatment Status
Standard deviations are in brackets. ***<0.01; **<0.05; *<0.1
Treated Control Mean difference Treated Control Mean difference(1) (2) (3) (4) (5) (6)
Attendance rate (=1) 0.421 0.002 0.420*** 0.398 0.002 0.396***[0.023] [0.001] [0.026] [0.001]
Head's age (years) 43.861 43.333 0.527 44.175 44.030 0.145[0.949] [0.832] [1.068] [0.947]
Head's education (years) 3.314 2.900 0.414 3.151 2.821 0.330[0.271] [0.269] [0.311] [0.302]
Head is male (=1) 0.889 0.886 0.004 0.869 0.875 -0.006[0.022] [0.022] [0.027] [0.026]
HH size 9.115 8.724 0.392 9.100 8.863 0.237[0.307] [0.310] [0.353] [0.359]
Plot size (ha) 0.587 0.476 0.110*** 0.571 0.472 0.099*[0.038] [0.020] [0.046] [0.023]
Owner (=1) 0.731 0.776 -0.045 0.756 0.774 -0.018[0.031] [0.029] [0.034] [0.032]
Leaseholder (=1) 0.221 0.162 0.059 0.188 0.161 0.027[0.029] [0.025] [0.031] [0.028]
Sharecropper (=1) 0.024 0.014 0.010 0.025 0.018 0.007[0.011] [0.008] [0.012] [0.010]
Others (=1) 0.019 0.048 -0.028 0.025 0.048 -0.023[0.010] [0.015] [0.012] [0.016]
Log asset value 4.674 4.703 -0.029 4.561 4.637 -0.075[0.099] [0.085] [0.113] [0.091]
F-test of joint significance 1.680* 0.912Number of Observations 208 210 160 168
Full sample Subsample in main season

32
Table 3 Baseline Balance of Sample Plots by Attrition Status
Standard deviations are in brackets. ***<0.01; **<0.05; *<0.1
AttritedNon-
attritedMean
difference(1) (2) (3)
Treatment (=1) 0.476 0.495 -0.019[0.045] [0.035]
Type =1 (=1) 0.111 0.415 -0.304***[0.028] [0.034]
Type =2 (=1) 0.341 0.159 0.182***[0.042] [0.026]
Type =3 (=1) 0.040 0.179 -0.139***[0.017] [0.027]
Type =4 (=1) 0.508 0.246 0.262***[0.045] [0.030]
Head's age (years) 43.250 44.595 -1.345[1.034] [0.950]
Head's education (years) 2.468 3.304 -0.836*[0.325] [0.284]
Head is male (=1) 0.806 0.912 -0.106***[0.036] [0.020]
HH size 9.524 8.654 0.871*[0.430] [0.306]
Plot size (ha) 0.360 0.618 -0.258***[0.026] [0.036]
Owner (=1) 0.847 0.712 0.135***[0.032] [0.032]
Leaseholder (=1) 0.089 0.229 -0.141***[0.026] [0.029]
Sharecropper (=1) 0.016 0.024 -0.008[0.011] [0.011]
Others (=1) 0.040 0.034 0.006[0.018] [0.013]
Log asset value 4.213 4.835 -0.622***[0.099] [0.095]
F-test of joint significance 9.566***Number of Observations 124 204
33
Table 4 Changes in Outcome Variables by Treatment Status: Baseline, Mid-line, and End-line
Standard deviations are in brackets for mean values, and standard errors are in brackets for unconditional difference-in-difference. ***<0.01; **<0.05; *<0.1
Year 1
Treated ControlMean
differenceTreated Control
Meandifference
Treated ControlMean
differenceYear 2- Year 1 Year 3- Year 2
(1) (2) (3) (4) (5) (6) (7) (8) (9) (10) (11)Panel AFertilizer (kg/ha) 214.071 254.340 -40.269 248.822 261.288 -12.466 232.750 255.110 -22.360 27.803 -9.894
[19.979] [32.869] [15.937] [17.609] [21.745] [17.994] [46.061] [36.572]Seed selection (=1) 0.906 0.864 0.042 0.929 0.978 -0.050 0.976 0.976 -0.000 -0.092* 0.050
[0.029] [0.034] [0.026] [0.015] [0.017] [0.017] [0.055] [0.040]Levelling (=1) 0.772 0.791 -0.019 0.857 0.677 0.180*** 0.867 0.810 0.058 0.199** -0.122
[0.040] [0.039] [0.036] [0.049] [0.037] [0.043] [0.081] [0.083]Canal/drainage construction/reparing (=1) 0.906 0.879 0.027 0.867 0.731 0.136** 0.855 0.929 -0.073 0.109 -0.209***
[0.028] [0.032] [0.034] [0.046] [0.039] [0.028] [0.071] [0.076]Transplanting in row (=1) 0.054 0.019 0.035 0.378 0.108 0.270*** 0.349 0.179 0.171** 0.235*** -0.099
[0.021] [0.014] [0.049] [0.032] [0.053] [0.042] [0.063] [0.090]Panel BRice Yield (ton/ha) 3.440 3.940 -0.499** 4.052 3.671 0.382 3.416 3.724 -0.307 0.881** -0.689
[0.164] [0.174] [0.238] [0.192] [0.203] [0.202] [0.387] [0.424]Gross output value (000 CFAF/ha) 603.159 669.393 -66.233 645.433 582.479 62.954 536.090 597.471 -61.380 129.187* -124.334*
[32.452] [31.737] [37.660] [31.545] [31.675] [31.760] [66.960] [67.446]Rice income (000 CFAF/ha) 405.308 405.091 0.217 413.726 353.458 60.268 232.174 292.198 -60.024 60.051 -120.292*
[31.311] [32.544] [36.667] [28.192] [38.128] [32.294] [64.909] [68.277]Rice profits (000 CFAF/ha) 331.539 320.196 11.343 243.209 230.344 12.864 108.260 155.150 -46.890 1.522 -59.754
[29.863] [34.177] [51.905] [32.074] [40.102] [31.341] [76.013] [81.382]F-test of joint significance 1.516 4.615*** 1.777*Number of Observations 101 103 98 93 83 84 395 358
Unconditional DIDYear 2 Year 3
34
Table 5 Estimated Results on the Dynamic Impacts of Training: Rice Productivity
Clustered standard errors at the production site level in parentheses. *** p<0.01, ** p<0.05, * p<0.1 Control variables included but not reported here: Year dummy, household size, head’s characteristics (age and its square, years of education and the male dummy), plot characteristics (cultivation size, tenure dummies for owner, leaseholder, sharecroppers), log household asset value, and local fixed effect. Attendance rate is instrumented by the treatment dummy, while attendance × end-line is instrumented by treatment × end-line dummy.
Rice Yield(ton/ha)
Gross outputvalue
(000 CFAF/ha)
Rice income(000 CFAF/ha)
Rice profits(000 CFAF/ha)
(1) (2) (3) (4)ITTTreatment (=1) 0.748* 140.105** 102.768* -8.362
(0.335) (51.348) (45.640) (50.222) × endline -0.642* -126.704** -52.889 69.781
(0.279) (44.488) (61.507) (70.156)Wald test (Ho: total effect is zero) 0.56 0.26 0.89 2.18N 353 353 353 353R-squared 0.465 0.418 0.678 0.709TOTAttendance rate (instrumented) 1.453** 270.438*** 203.150** -15.249
(0.629) (94.168) (81.749) (85.727) × endline (instrumented) -1.254** -245.705*** -114.245 123.358
(0.527) (80.283) (96.329) (116.879)Wald test (Ho: total effect is zero) 0.78 0.37 1.13 2.71*N 353 353 353 353R-squared 0.462 0.416 0.681 0.710

35
Table 6 Estimated Results on the Dynamic Impacts of Training: Agronomic Practice
Clustered standard errors at the production site level in parentheses. *** p<0.01, ** p<0.05, * p<0.1 Control variables included but not reported here: Year dummy, household size, head’s characteristics (age and its square, years of education and the male dummy), plot characteristics (cultivation size, tenure dummies for owner, leaseholder, sharecroppers), log household asset value, and local fixed effect. Attendance rate is instrumented by the treatment dummy, while attendance end-line is instrumented by treatment × end-line dummy.
Fertilzer(kg/ha)
SeedSelection
LevellingCanal
/drainageStraight-row
planting(1) (2) (3) (4) (5)
ITTTreatment (=1) 24.736 -0.033 0.178*** 0.119* 0.218**
(17.358) (0.031) (0.050) (0.062) (0.067) × endline -27.566 0.041** -0.202 -0.236** -0.227*
(24.593) (0.017) (0.134) (0.089) (0.099)Wald test (Ho: total effect is zero) 0.03 0.07 0.06 2.28 0.02N 353 353 353 353 353R-squared 0.416 0.133 0.313 0.427 0.627TOTAttendance rate (instrumented) 47.437 -0.063 0.340*** 0.227* 0.417***
(30.788) (0.056) (0.084) (0.118) (0.095) × endline (instrumented) -52.111 0.076*** -0.380* -0.432*** -0.430***
(41.586) (0.030) (0.215) (0.154) (0.155)Wald test (Ho: total effect is zero) 0.04 0.08 0.06 2.81* 0.02N 353 353 353 353 353R-squared 0.415 0.129 0.295 0.418 0.628
36
Table 7 Estimated Results on Heterogeneous Impacts of Training by Production Site Type
Clustered standard errors at the production site level in parentheses. *** p<0.01, ** p<0.05, * p<0.1 Control variables included but not reported here: Year dummy, household size, head’s characteristics (age and its square, years of education and the male dummy), plot characteristics (cultivation size, tenure dummies for owner, leaseholder, sharecroppers), log household asset value, and local fixed effect.
Rice Yield(ton/ha)
Gross outputvalue(000
CFAF/ha)
Rice income(000
CFAF/ha)
Rice profits(000
CFAF/ha)
Seedselection
Fertilzer(kg/ha)
LevellingCanal
/drainage
Straight-row
planting
(1) (2) (3) (4) (5) (6) (7) (8) (9)ITTTreatment 0.554* 86.740 75.152 35.290 -0.005 43.793*** 0.162*** 0.036 0.140
(0.245) (60.225) (73.338) (39.625) (0.018) (7.013) (0.026) (0.035) (0.076) × Type 2 0.379 47.181 47.018 -20.633 0.024 -36.936* -0.205* -0.173*** -0.151
(0.871) (115.163) (145.227) (103.333) (0.021) (17.298) (0.107) (0.047) (0.133) × Type 3 -0.185 11.013 7.947 75.635 0.082 -51.015*** -0.075 0.001 -0.014
(0.228) (73.335) (74.681) (69.812) (0.067) (11.668) (0.043) (0.108) (0.068) × Type 4 -0.840** -104.229 -52.751 -79.356* -0.131*** -67.815*** -0.103** 0.024 0.019
(0.263) (62.366) (71.359) (36.842) (0.019) (6.568) (0.035) (0.035) (0.070)N 353 353 353 353 353 353 353 353 353R-squared 0.468 0.415 0.678 0.709 0.167 0.419 0.307 0.414 0.619
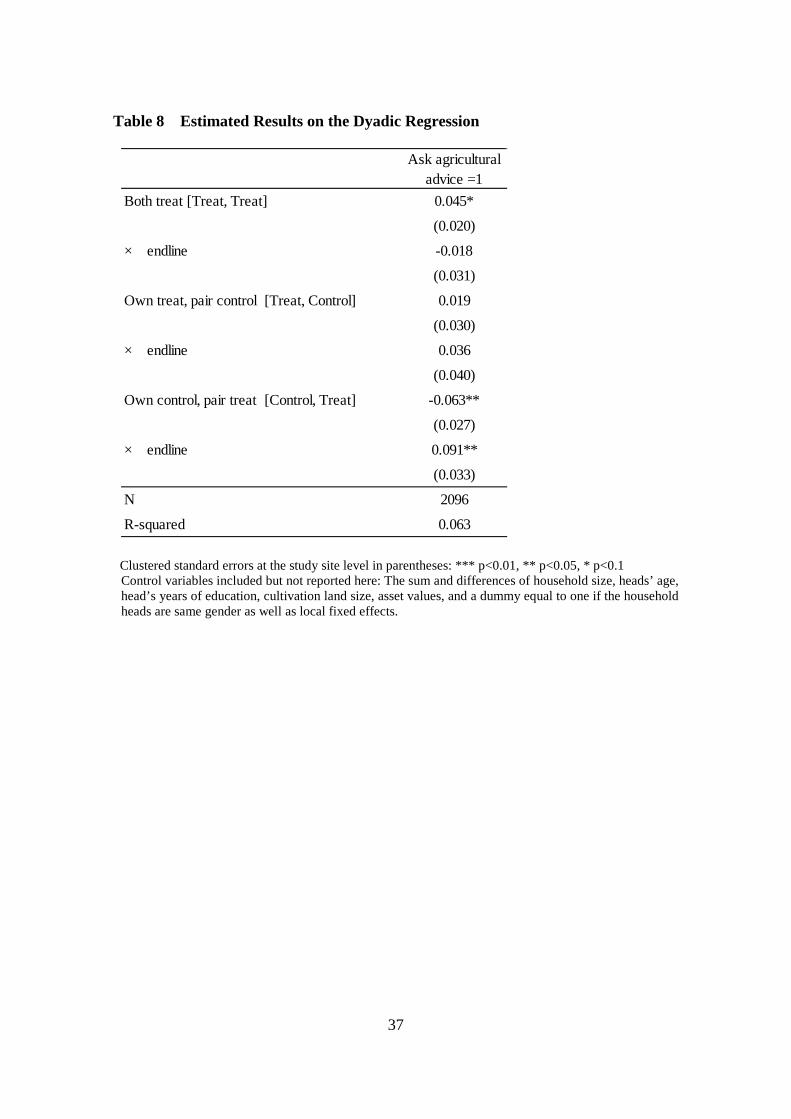
37
Table 8 Estimated Results on the Dyadic Regression
Clustered standard errors at the study site level in parentheses: *** p<0.01, ** p<0.05, * p<0.1 Control variables included but not reported here: The sum and differences of household size, heads’ age, head’s years of education, cultivation land size, asset values, and a dummy equal to one if the household heads are same gender as well as local fixed effects.
Ask agriculturaladvice =1
Both treat [Treat, Treat] 0.045*
(0.020)
× endline -0.018
(0.031)
Own treat, pair control [Treat, Control] 0.019
(0.030)
× endline 0.036
(0.040)
Own control, pair treat [Control, Treat] -0.063**
(0.027)
× endline 0.091**
(0.033)
N 2096
R-squared 0.063
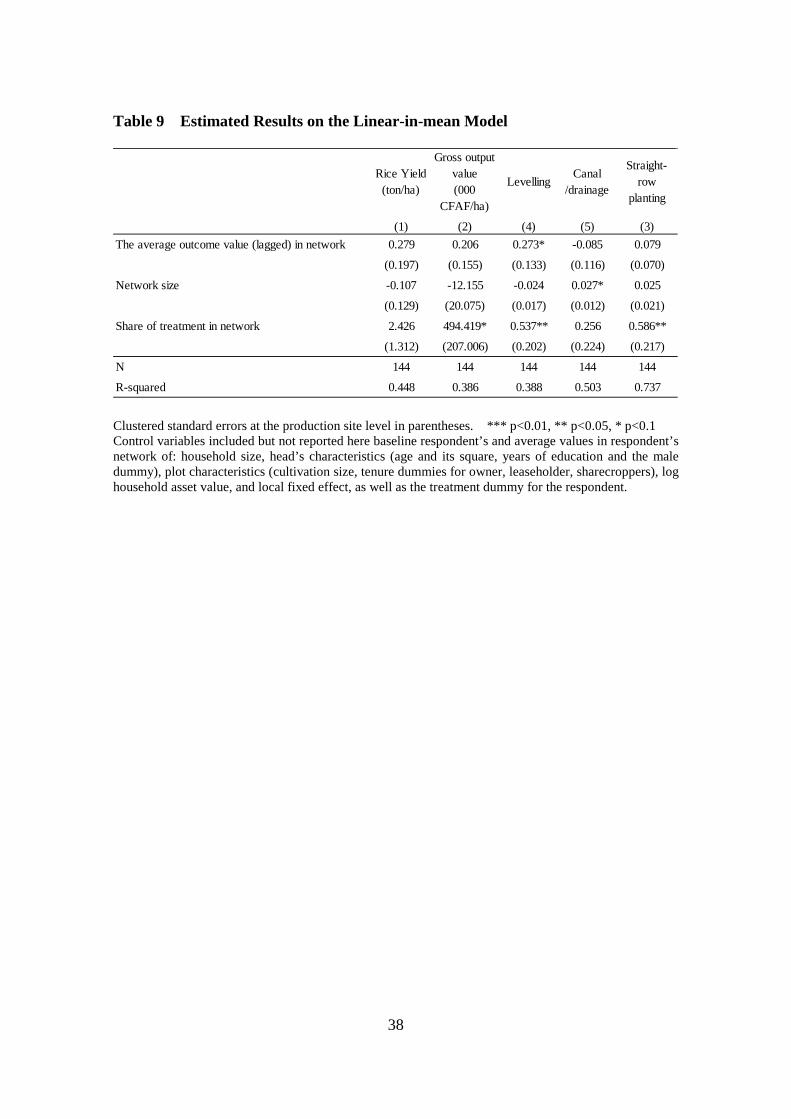
38
Table 9 Estimated Results on the Linear-in-mean Model
Clustered standard errors at the production site level in parentheses. *** p<0.01, ** p<0.05, * p<0.1 Control variables included but not reported here baseline respondent’s and average values in respondent’s network of: household size, head’s characteristics (age and its square, years of education and the male dummy), plot characteristics (cultivation size, tenure dummies for owner, leaseholder, sharecroppers), log household asset value, and local fixed effect, as well as the treatment dummy for the respondent.
Rice Yield(ton/ha)
Gross outputvalue(000
CFAF/ha)
LevellingCanal
/drainage
Straight-row
planting
(1) (2) (4) (5) (3)The average outcome value (lagged) in network 0.279 0.206 0.273* -0.085 0.079
(0.197) (0.155) (0.133) (0.116) (0.070)
Network size -0.107 -12.155 -0.024 0.027* 0.025
(0.129) (20.075) (0.017) (0.012) (0.021)
Share of treatment in network 2.426 494.419* 0.537** 0.256 0.586**
(1.312) (207.006) (0.202) (0.224) (0.217)
N 144 144 144 144 144
R-squared 0.448 0.386 0.388 0.503 0.737

39
Appendix 1 Estimation Results for Non-attrition Probit Model
Standard errors in parentheses. *** p<0.01, ** p<0.05, * p<0.1
Year 2 Year 3
(1) (2)
Head's age (years) -0.015 0.024
(0.043) (0.035)
Head's age squared (years) 0.000 -0.000
(0.000) (0.000)
Head's education (years) 0.037 0.021
(0.023) (0.022)
Head is male (=1) 0.570** -0.177
(0.283) (0.271)
HH size -0.011 -0.011
(0.021) (0.021)
Plot size (ha) 0.116 0.641**
(0.217) (0.270)
Owner (=1) -0.078 0.191
(0.376) (0.381)
Leaseholder (=1) -0.283 0.314
(0.412) (0.410)
Log asset value 0.194*** 0.081
(0.068) (0.067)
Constant -0.633 -2.175**
(1.142) (1.042)
Production site fixed effects Yes Yes
N 328 328

40
Abstract(in Japanese)
要約
ランダム化比較試験を通じた開発プロジェクトのインパクト評価は、他の複雑な計量
経済学的方法よりも少ない仮定で、より信頼性の高い結果をもたらすものとして注目
されている。ランダム化実験では、介入を受ける実験群とそれを受けない統制群の二
つをランダムに振り分ける。割り付けがランダムゆえ、介入を受ける確率は全ての人
に平等に与えられており、その意味では機会の平等は保障されている。しかし、介入
が効果的なものであればあるほど、事後的に実験群・統制群の間に不平等が生まれ、
そうした不平等の存在は社会的なコストとなりうる。
本研究は、コートジボワールで行った稲作技術研修を例として、プロジェクトの厳密
な因果評価とその後「実験によってもたらされた」不平等を緩和させる工夫を施した、
新たな実験デザインを提示する。まず、プロジェクトの厳密な評価を行うために、ト
レーニング直後の段階では、研修を受けなかった農家に、研修を受けた農家と研修内
容についての情報交換をしないよう要請した。これは実験群から統制群に情報やその
効果が漏出(スピルオーバー)してしまうとバイアスのないインパクト評価ができな
くなるからである。トレーニングから一年後、今度は、実験群と統制群の農家の間で
積極的に情報交換を行うことを奨励し、スピルオーバーが生まれやすくなるようにし
た。その結果、研修直後には稲作技術の普及率や収量は研修組の方が高かったが、情
報のスピルオーバーの結果、研修を受けなかった農家もやがて研修の効果を享受し、
研修から 2 年後までには両者の間に稲作のパフォーマンスの差がなくなったことが判
明した。
キーワード:不平等、プログラム評価、ランダム化実験、スピルオーバー

Working Papers from the same research project
“An Empirical Analysis of Expanding Rice Production in Sub-Sahara Africa”
JICA-RI Working Paper No. 25 On the Possibility of a Lowland Rice Green Revolution in Sub-Saharan Africa:
Evidence from the Sustainable Irrigated Agricultural Development (SIAD) Project in
Eastern Uganda
Yoko Kijima, Yukinori Ito and Keijiro Otsuka JICA-RI Working Paper No. 49 Expansion of Lowland Rice Production and Constraints on a Rice Green Revolution:
Evidence from Uganda
Yoko Kijima JICA-RI Working Paper No. 58 The Determinants of Technology Adoption: The Case of the Rice Sector in Tanzania
Yuko Nakano and Kei Kajisa JICA-RI Working Paper No. 61 Extensification and Intensification Process of Rainfed Lowland Rice Farming in
Mozambique
Kei Kajisa and Ellen Payongayong
JICA-RI Working Paper No. 71 To What Extent Does the Adoption of Modern Variety Increase Productivity and Income?
A Case Study of the Rice Sector in Tanzania
Yuko Nakano and Kei Kajisa
JICA-RI Working Paper No. 80 Enhancing Rice Production in Uganda: Impact Evaluation of a Training Program and
Guidebook Distribution in Uganda
Yoko Kijima

JICA-RI Working Paper No. 86 Constraints on Rice Sector Development in Mozambique
Kei Kajisa
JICA-RI Working Paper No. 90 The Impact of Training on Technology Adoption and Productivity of Rice Farming in
Tanzania: Is Farmer-to-Farmer Extension Effective?
Yuko Nakano, Takuji W. Tsusaka, Takeshi Aida and Valerien O. Pede JICA-RI Working Paper No. 105 On the Determinants of High Productivity Rice Farming in Irrigated Areas in Senegal:
The Efficiency of Large Compared with Small-Scale Irrigation Schemes
Takeshi Sakurai JICA-RI Working Paper No. 157 Contract Farming, Farm Mechanization, and Agricultural Intensification: The Case of
Rice Farming in Cote d’Ivoire
Yukichi Y. Mano, Kazushi Takahashi, and Keijiro Otsuka JICA-RI Working Paper No. 161 Long-term and Spillover Effects of Rice Production Training in Uganda
Yoko Kijima
Related Documents