DISCUSSION PAPER SERIES Forschungsinstitut zur Zukunft der Arbeit Institute for the Study of Labor Do Bans on Affirmative Action Hurt Minority Students? Evidence from the Texas Top 10% Plan IZA DP No. 5021 June 2010 Kalena E. Cortes

Welcome message from author
This document is posted to help you gain knowledge. Please leave a comment to let me know what you think about it! Share it to your friends and learn new things together.
Transcript

DI
SC
US
SI
ON
P
AP
ER
S
ER
IE
S
Forschungsinstitut zur Zukunft der ArbeitInstitute for the Study of Labor
Do Bans on Affi rmative Action Hurt Minority Students? Evidence from the Texas Top 10% Plan
IZA DP No. 5021
June 2010
Kalena E. Cortes

Do Bans on Affirmative Action
Hurt Minority Students? Evidence from the Texas Top 10% Plan
Kalena E. Cortes Syracuse University
and IZA
Discussion Paper No. 5021 June 2010
IZA
P.O. Box 7240 53072 Bonn
Germany
Phone: +49-228-3894-0 Fax: +49-228-3894-180
E-mail: [email protected]
Any opinions expressed here are those of the author(s) and not those of IZA. Research published in this series may include views on policy, but the institute itself takes no institutional policy positions. The Institute for the Study of Labor (IZA) in Bonn is a local and virtual international research center and a place of communication between science, politics and business. IZA is an independent nonprofit organization supported by Deutsche Post Foundation. The center is associated with the University of Bonn and offers a stimulating research environment through its international network, workshops and conferences, data service, project support, research visits and doctoral program. IZA engages in (i) original and internationally competitive research in all fields of labor economics, (ii) development of policy concepts, and (iii) dissemination of research results and concepts to the interested public. IZA Discussion Papers often represent preliminary work and are circulated to encourage discussion. Citation of such a paper should account for its provisional character. A revised version may be available directly from the author.

IZA Discussion Paper No. 5021 June 2010
ABSTRACT
Do Bans on Affirmative Action Hurt Minority Students? Evidence from the Texas Top 10% Plan*
In light of the recent bans on affirmative action in higher education, this paper provides new evidence on the effects of alternative admissions policies on the persistence and college completion of minority students. I find that the change from affirmative action to the Top 10% Plan in Texas decreased both retention and graduation rates of lower-ranked minority students. Results show that both fall-to-fall freshmen retention and six-year college graduation of second-decile minority students decreased, respectively, by 2.4 and 3.3 percentage points. The effect of the change in admissions policy was slightly larger for minority students in the third and lower deciles: fall-to-fall freshmen retention and six-year college graduation decreased, respectively, by 4.9 and 4.2 percentage points. Moreover, I find no evidence in support of the minority “mismatch” hypothesis. These results suggest that most of the increase in the graduation gap between minorities and non-minorities in Texas, a staggering 90 percent, was driven by the elimination of affirmative action in the 1990s. JEL Classification: I21, I23, J15, J24 Keywords: affirmative action, Top 10% Plan, college quality, freshmen retention,
college graduation Corresponding author: Kalena E. Cortes Syracuse University 350 Huntington Hall Syracuse, NY 13244-2340 USA E-mail: [email protected]
* This paper was previously circulated under the title “College Quality and the Texas Top 10% Plan: Implications for Minority Students.” I would like to thank David E. Card, Charles Clotfelter, Alan B. Krueger, Caroline M. Hoxby, Cecilia E. Rouse, and Marta Tienda for all of their encouragement and most valued advice throughout this research. Also, I would like to thank Charles Udomsaph, Benjamin A. Campbell, Angela Fertig, Erica M. Field, Daniel Kian Mc Kiernan, Jesse Rothstein, Audrey B. Welber, seminar participants at U.C. Berkeley, Princeton University, Swarthmore College, Harvard Graduate School of Education, Columbia University Teachers College, and The Ohio State University for their comments, Texas Higher Education Opportunity Projects (THEOP) members, and the NBER Higher Education Working Group participants. Grants from the National Institute of Child Health and Human Development (NICHD); Ruth L. Kirschstein National Service Award Individual Fellowship (PHS Grant No. 1-F32-HD043588-01A1); Ford, Mellon, Hewlett, and Spencer Foundations; NSF (Grant No. SES-0350990); and W.E. Upjohn Institute for Employment Research (Grant No. 07-106-07) are gratefully acknowledged. Institutional support from the Office of Population Research, Princeton University (NICHD Grant No. R24-H0047879), Syracuse University, Harvard University, and the National Bureau of Economic Research are also gratefully acknowledged. Research results, conclusions, and all errors are naturally my own.

2
1. Introduction
Few things are as persistent as the educational gap between minorities and their non-
minority counterparts in the United States; this gap has only slightly narrowed over time
(U.S. Department of Education 2005). Because of the significant market premiums attached
to the possession of a college degree, minimizing the gap in educational attainment is of
great concern to policymakers. Previous studies have found that the real market premium
stems from attending a more selective college (Black and Smith 2004; Brewer, Eide, and
Ehrenberg 1999; Brewer and Ehrenberg 1996; Bowen and Bok 1998).1 If college quality
does indeed matter, then social policies such as affirmative action in college admissions can
potentially help close this pervasive educational gap.
In recent years, however, the effectiveness of affirmative action policies in higher
education has been widely debated. Critics of race-sensitive admissions policies maintain
that such policies only hinder the intended beneficiaries (Thernstrom and Thernstrom 1997,
1999; Graglia 1993), and cite the lower postsecondary graduation rates of minority students
at selective colleges as evidence of a “mismatch.” The logic behind this argument is that the
graduation rates for minority students would be higher if they enrolled in institutions whose
academic prerequisites were a better “match” to their academic credentials, rather than
overreaching and enrolling at institutions where they are overshadowed academically by their
classmates.2 On the other hand, proponents of affirmative action argue that minority
students, despite their lower level of preparedness, nevertheless perform well and benefit
1 For a detailed review of the earlier literature on the effects of college quality, see Brewer and Ehrenberg (1996).
2 While the main outcomes of mismatch considered in this paper are lower retention and graduation rates, the term can also refer to lower grade point averages or easier academic majors.

3
from attending selective institutions (Alon and Tienda 2005; Bowen and Bok 1998; Kane
1998a, 1998b; Dee 2004).3
As concern mounts over the changing legal status of affirmative action policies in
college admissions, it is important to analyze the impact of alternative admissions policies on
the postsecondary educational outcomes of minority students. In fact, certain states that
banned the use of racial preferences in college admissions have now implemented high
school rank-based policies—dubbed “top x-percent” plans—in their place. Texas was
among the first states to legislate such a policy, and passed its Top 10% Plan following the
landmark Hopwood v. University of Texas Law School ruling in 1996, which judicially banned the
use of race in admissions decisions at all public postsecondary institutions. Under this
ranked-based admissions policy, Texas high school students in the top 10 percent of their
graduating senior class are automatically guaranteed admission to any four-year public
university of their choice, including the selective University of Texas at Austin and Texas
A&M University at College Station. Students most affected by this change in admissions
policy were minority students ranked in the second and lower deciles, whereas first decile
students were sufficiently qualified to be admitted under both admissions regimes.4
Texas provides a setting in which we can evaluate an alternative admissions policy in
higher education. Based on institutional administrative data obtained from several public
universities in Texas, this paper contributes to the existing research on the use of alternative
admissions policies in higher education and also the minority “mismatch” hypothesis. As
the institutional data span both the affirmative action admissions and Top 10% Plan
3 Conversely, Sander (2004) calls into question the benefits for minority students from attending selective colleges and finds that race-sensitive admissions in law schools reduced the number of black law students who pass the bar exam and eventually become lawyers. However, Sanders (2004) has now been debunked (Ho 2005; Ayres and Brooks 2005; Rothstein and Yoon 2006). 4 Prior to the Top 10% Plan, students who were ranked in the first decile, although not guaranteed, were nevertheless virtually assured of admission to UT-Austin (Tienda et al. 2003; Walker and Lavergne 2001).

4
regimes, I am able to analyze the impact of the change from race-sensitive to ranked-based
admissions policies on college persistence and completion rates of lower-decile minority
students. More specifically, in assessing the impact of the Texas Top 10% Plan, I use a
difference-in-differences procedure to analyze the effect of the change in admissions policies
on fall-to-fall freshmen retention and six-year college graduation for this group.
The results show that both freshmen retention and college graduation rates of lower-
decile minority students declined after the change in admissions policies from affirmative
action admissions to the Top 10% Plan. The proposed mechanism by which lower-ranked
minority students are being impacted is through their lower admission rates to (and
ultimately lower attendance at) selective public colleges during the Top 10% Plan. Thus,
these students cascaded down and ended up attending less selective institutions under the Top
10% Plan. I find that the change in admissions policies lowered the freshmen retention rates
of second-decile minority students by 2.4 percentage points and third- (and below) decile
minority students by 4.9 percentage points. I also find that under the Top 10% Plan the
graduation rate of second-decile minority students declined by 3.3 percentage points, and
similarly, the graduation rate of third- (and below) decile minority students declined by 4.2
percentage points. Moreover, I find no evidence to support the minority “mismatch”
hypothesis, which would have predicted retention and graduation rates of lower-ranked
minority students to have improved under the Top 10% Plan admissions policy.
The change in admissions policies from affirmative action to the Top 10% Plan
negatively impacted lower decile minority students. The analysis suggests that the
elimination of affirmative action in the 1990s only served to increase the pervasive racial gap
in postsecondary educational attainment in Texas. My results suggest that most of this
increase in the graduation gap between minorities and non-minorities in Texas, a staggering

5
90 percent, was driven by the change in admissions policy from affirmative action to the Top
10% Plan.
The paper is organized as follows: Section 2 provides some background on the Texas
Top 10% Plan and presents a literature review; Section 3 discusses the empirical strategy
used in the paper; Section 4 describes the data used in the analysis and sample characteristics;
Section 5 reports and discusses the main results; Section 6 presents a robustness analysis; and
Section 7 concludes.
2. Top 10% Plan and Relevant Literature
Passed on May 20th, 1997 during the governorship of George W. Bush, the H.B.588
Law—more commonly known as the Top 10% Plan—was implemented in response to the
landmark ruling of the 5th Circuit Court’s decision in Hopwood v. University of Texas Law School,
which judicially banned the use of race in admissions decisions in all public postsecondary
institutions in Texas.5 This statewide change in college admissions policies was felt
immediately, especially at the two most selective public institutions, the University of Texas
at Austin and Texas A&M University at College Station, where the number of minority
enrollees plummeted (Tienda et al. 2003; Bucks 2004; Lavergne and Faulkner 2001). Unlike
the top x-percent plans implemented by other states (e.g., California, Washington, and
Florida), the Top 10% Plan guaranteed automatic admission to any public university of
choice to all seniors who graduate in the first decile of their graduating high school class.6,7
Proponents of the plan believed the new admissions policy would restore campus diversity
5 See Hopwood v. University of Texas Law School 78 F.3d 932, 944 (5th Cir. 1996). 6 The University of California system guarantees a slot at a UC campus for the top 4 percent of students from each high school in the state, and the allocation of students to specific campuses is a system-wide decision. Similarly, the Talented 20 Plan in Florida guarantees the top 20 percent of public high school graduates admission to a college, but students are assigned to an institution.

6
because of the high degree of segregation among high schools in Texas; the intent was that
the number of minority students rank-eligible under the Top 10% Plan would be sufficient
to restore campus diversity throughout the state (Yardley 2002; Hockstader 2002).
To date, most of the research conducted on the ban of affirmative action admissions
in favor of the Top 10% Plan in Texas has thoroughly analyzed its effect on application,
admission, and enrollment probabilities of minority and non-minority students to colleges
(Dickson 2006; Card and Krueger 2005; Tienda et al. 2003; Bucks 2004; Lavergne and
Faulkner 2001; Niu, Tienda, and Cortes 2006); have looked at the potential strategic
behavior of high school switchers induced by the Top 10% Plan (Cullen, Reback, and Long
2009); or have measured the externalities generated by households moving to areas with low-
performing high schools (Cortes and Friedson 2010). However, none have analyzed the
effect of this policy ban on the college outcomes of lower-ranked minority students—the
group of students most affected by the change from race-based to rank-based admissions.
Tienda et al. (2003) was among the first studies to document the decline in black and
Hispanic students at the two most selective public institutions in Texas, UT-Austin and
Texas A&M, where undergraduate black and Hispanic enrollments dropped by roughly one
and over two percentage points, respectively. The paper also finds that implementation of
the Top 10% Plan alone after the Hopwood ruling was unable to restore campus diversity at
these Texas flagship institutions to pre-Hopwood levels of black and Hispanic student
enrollment (see also Horn and Flores 2003). Moreover, the study by Dickson (2006) uses a
panel of Texas high schools and finds that the percentage of black and Hispanic students
who took college entrance exams fell when affirmative action admissions was banned in the
state, while the percentage of white students who took college entrance exams did not
7 Although private universities are duty-bound by the Hopwood ruling, they are not subject to the automatic

7
change. Lastly, Bucks (2004) analyzes college choice among Texas high school students and
finds a lower probability among minority students and a higher probability among non-
minority students of enrolling in selective in-state public institutions after the
implementation of the Top 10% Plan.
Despite the growing number of states that have now implemented a top x-percent
admissions policy, there is scant evidence on the effects of this policy on college outcomes
of non-top x-percent students. Arguably, lower-ranked minorities were the group of students
most affected by the elimination of affirmative action policies in college admissions. The
few studies that do examine these top x-percent policies analyze institutional responses to
these percent policies (Faulkner 2000) or focus on the top x-percent students at those
institutions (Leicht and Sullivan 2000). For instance, UT-Austin in 2000 had to increase the
size of the entering freshman cohort in order to facilitate the rise in applicants who
graduated in the first decile of their class (Faulkner 2000). A study by Leicht and Sullivan
(2000), using administrative data from UT-Austin, finds that overall freshmen attrition
declined from 12.9 percent in 1995 to 10.7 percent in 1998, and of the 1998 entering
freshmen cohort, 88 percent of the top 10% students had returned for the 2000 spring
semester. Most recently, in 2009, Texas placed some limits on student institutional choice,
and UT-Austin is now allowed to restrict the number of top 10% students to 75 percent of
the entering freshman class. Moreover, the void in analysis of non-top x-percent students
partly reflects data availability constraints, as most national postsecondary educational
databases have limited information on student high school transcripts and do not contain
information on the exact high school class rank of each student. The institutional data used
admissions guarantee (Tienda et al. 2003).

8
in this study were collected specifically to address these questions that existing educational
databases are unable to address.
Most importantly, the analysis of lower-ranked minority students under this
alternative admissions policy speaks directly to the claims of the “mismatch” hypothesis, that
is, the argument that minority students would have had better college outcomes had they
attended an institution that better matched their academic preparedness. Studies examining
academic performance among minority students attending selective colleges have found a
positive association between overall academic performance and college selectivity (Alon and
Tienda 2005; Bowen and Bok 1998; Kane 1998a, 1998b; Kane and Dickens 1996, Fisher and
Massey 2007; an exception is Loury and Garman 1993, 1995).8 Bowen and Bok (1998),
using data from College and Beyond, was among the first studies to tackle the mismatch
hypothesis, showing that graduation rates increased for both black and white students at all
SAT levels as the quality of the institution they attended increased.9 Interestingly, Fischer
and Massey (2007) finds that for black and Hispanic students attending elite private
institutions, having an SAT score below the institutional average was associated with a slight
increase in freshmen grades for these minority groups. All of these studies find that minority
students at selective colleges have higher grades and graduation rates, a result that clearly
runs counter to the mismatch hypothesis.
It is also worth pointing out that most of the research conducted on affirmative
action policies in higher education has been limited to the analysis of private elite colleges
8 Studies by Loury and Garman (1993, 1995) report an exception to this general pattern of findings. The authors use data from the National Longitudinal Study of the High School Class of 1972 (NLSY-72) and find that black students obtained lower grades and earned lower future earnings if they are “mismatched” with their institution. 9 However, Bowen and Bok (1998) coined it the “fit” hypothesis.

9
with very little coverage of public institutions. This paper examines these understudied
public institutions.
3. Empirical Strategy
A difference-in-differences approach is used to analyze the effect of the change in
admissions policies on fall-to-fall freshmen retention and six-year college graduation for
minority students ranked in the second and lower deciles. The assumption behind this
empirical strategy is that the Top 10% Plan did not affect students ranked in the first decile
since these students were qualified under both admissions policies, but did affect students
ranked in the second and lower deciles. These students were largely left to enroll in less
selective colleges under this alternative admissions policy. In the difference-in-differences
framework, minority students ranked in top 10 percent serve as the control group, and the
two treatment groups are minority students ranked in the second and lower deciles.
The following model specification is estimated by ordinary least squares (OLS) to
analyze the effect of the Top 10% Plan on retention and graduation rates of lower-ranked
minority students,
1999
2 3 _1 2
1990, 1997
2 3 _1 2
nd rd plusit k t it it
k k
nd rd plusi it i it it it it
Y I Cohort k Decile Decile
Post Decile Post Decile S HS
(1)
where Yit is a binary variable that indicates fall-to-fall freshmen retention or college
graduation within six years for student i in cohort (college entry) t. I is an indicator
function associated with cohort t. Posti is a binary variable that indicates if student i is
observed under the Top 10% Plan (i.e., equal to 0 if student i is observed in cohorts 1990

10
through 1996 or equal to 1 if student i is observed in cohorts 1998 through 1999). nditDecile 2
and plusrditDecile _3 are indicator variables for students ranked in the second decile (i.e., 11-20
percentile class rank) and in the third and below deciles (i.e., 21-100 percentile class rank),
respectively. Posti multiplied by nditDecile 2 and plusrd
itDecile _3 , respectively, are interactions of
these variables. Sit and HSit are vectors of student-level and high school-level characteristics,
respectively. More specifically, Sit includes Scholastic Aptitude Test (SAT) scores and
indicator variables for gender and race or ethnicity.10 HSit includes mean high school SAT
score, feeder high school status, school location indicators (i.e., suburban, town, rural, and
urban, which is the omitted category), percentage of free lunch eligible students, and
percentage of minority students.11,12 is a vector of high school fixed effects. Lastly, it is
a normally distributed random error term.
The coefficients of the above difference-in-differences framework have the
following interpretation: k ’s capture the yearly cohort differences in the average outcomes
over time that are common to both the treatment groups (i.e., students ranked in the second
and lower deciles) and the control group (i.e., top 10% students); 1 and 2 capture the
10 The race or ethnicity omitted category will depend on the specific subsample being analyzed. When the minority subsample is being analyzed, the three indicator variables are Hispanic (omitted), black, and Native American students. When the non-minority subsample is being analyzed, the two indicator variables are non-Hispanic white (omitted) and Asian students. 11 The feeder high school indicator variable identifies schools that have extremely strong college-going traditions. Because these feeder high schools supply a large proportion of their high school graduates to the selective colleges, I include a control for this type of high school in the analysis. For instance, the top 20 feeder high schools accounted for 12 percent of students that were admitted to Texas A&M in 2000, and a little over 22 percent of these students contributed to the entering freshmen class. The corresponding figures for UT-Austin are even higher—23 and 35 percent, respectively (Tienda et al. 2003). 12 The analysis controls for time variant high school characteristics to account for possible changes in the high school type of students after the adoption of the Top 10% Plan. Moreover, the admission years under the Top 10% Plan analyzed in this paper are 1998 and 1999; these early years do not capture other effects induced by this new admissions policy, such as students who intentionally switched high schools in order to be ranked in the first decile, as shown by Cullen, Reback, and Long (2009).

11
average permanent differences between the two treatment groups and the control group; and
lastly, of particular interest are the coefficients 1 and 2 , which are the difference-in-
differences estimators that capture the effect of the Top 10% Plan. More specifically, these
parameters measure the differences in outcomes (i.e., retention or graduation) before and
after the Top 10% Plan for the two treatment groups, compared to the corresponding
difference for the control group.
Equation (1) is estimated separately for both minority and non-minority samples.
Although the focus of this paper is to analyze the effect of the change in admissions policies
from affirmative action to the Top 10% Plan on minorities, a parallel analysis on the non-
minority student sample is interesting in its own right since elimination of racial preferences
and implementation of the Top 10% Plan is expected to have also affected non-minority
students. Affirmative action presumably “crowded-out” some non-minorities from
attending selective institutions in Texas—that is, non-minorities who would have gained
access to selective institutions on the basis of merit in the Top 10% new admissions era.
4. Data and Sample Characteristics 4.1 Data Sources
Data for the analysis come from the administrative data component of the Texas
Higher Education Opportunity Project (THEOP), comprising nine institutions in Texas
(two private and seven public) that differ in admissions selectivity and overall institutional
ranking. The present study is based on data from six of the nine institutions; data coverage
for some universities do not span both admissions policies.

12
Figure 1 presents maps that identify the location of the nine THEOP universities
and displays the percentage of minorities (total, blacks, and Hispanics) in the population by
county in 2000.13 The six universities used in the analysis (whose locations are marked by
stars on the maps) are the University of Texas at Austin (UT-Austin), Texas A&M University
at College Station (Texas A&M), Texas Tech University (Texas Tech), Texas A&M
University at Kingsville (TAMU-Kingsville), the University of Texas at San Antonio (UT-
San Antonio), and the University of Texas at Pan American (UT-Pan American). Of these
six institutions, UT-Austin and Texas A&M are considered to be the most selective public
state colleges in Texas (Barron’s College Division 2002), and they have been the target of
most of the debate on affirmative action admissions policies in Texas. As shown in Figure 1,
Hispanics reside predominately in South Texas, whereas blacks reside predominantly in the
Eastern part of the state. Figure 1 also illustrates the high degree of segregation that still
exists in Texas and supports the rationale of Top 10% Plan proponents who argue that it
would restore campus diversity.
The THEOP institutional data provide the total number of applicants, admittances,
and of those, enrollments for all universities across various admission years. For students
who matriculated, full academic records are available for each semester of enrollment until
graduation. These data contain the most important set of student characteristics used in the
admissions process: SAT and ACT scores, exact high school class rank, gender, race and
ethnicity, and other high school information. Since high school information of applicants is
available in the data for all universities, I also use data from the National Center for Education
13 All maps in this paper are generated using the program ArcView. The default classification method in ArcView called natural breaks is used to display the data. The natural breaks method identifies breakpoints between classes using a statistical formula (Jenk’s optimization). Jenk’s method (1967) minimizes the sum of the variance within each of the classes. Natural breaks finds groupings and patterns inherent in the data. Data used in these maps are from the 2000 U.S. Census.

13
Statistics (NCES) and merge in high school characteristics by high school identification
number and year of application; all high school variables used in the analysis are time
variant.14
4.2 Descriptive Statistics and Sample Characteristics
Before turning to the descriptive statistics of the main analytic sample used in the
paper, it is instructive to look at the admission rates of UT-Austin and Texas A&M. If the
proposed mechanism by which lower-ranked minority students are being impacted by the
change in admissions policies is through their lower admission rates to (and ultimately lower
attendance at) selective public colleges during the Top 10% Plan, we should clearly be able
to observe a sharp decline in the admission rates for lower-ranked minority students at these
two most selective public institutions.
Hence, Table 1 reports the overall admission rates at UT-Austin and Texas A&M by
the two admissions policies: affirmative action (years 1990 through 1996) and the Top 10%
Plan (years 1998 and 1999). As seen in Table 1, the admission rates at these two colleges
vary by admissions policies and minority group status. Throughout this paper, “minority”
refers to black, Hispanic, and Native American students, whereas “non-minority” refers to
Asian and non-Hispanic white students. Minority students experienced their highest
admission rates during the affirmative action period (79 percent versus 71 percent). Non-
minority students, on the other hand, experienced their highest admission rates during the
Top 10% Plan (80 percent versus 75 percent).
Most importantly, the change in admissions policies also affected the admission rates
of students ranked in the lower deciles differently across minority group status. As shown in
14 The mean high school SAT variable, however, is obtained from the College Board and is based on all Texas

14
the bottom two panels of Table 1, both minority and non-minority first decile students
experienced close to a 100 percent admissions rate to these selective public colleges under
both admissions regimes.15 For minority students ranked in the second and third (and
below) deciles, admission rates at these selective colleges declined sharply when the
admissions policy changed to the Top 10% Plan. Specifically, the admission rates of
minority students ranked in the second and third (and below) deciles at these selective
colleges declined, respectively, by 10 and 14 percentage points (column (3) of panel B).
Conversely, the admission rates of their non-minority counterparts at these selective colleges
increased by 8 and 10 percentage points (column (3) of panel C).
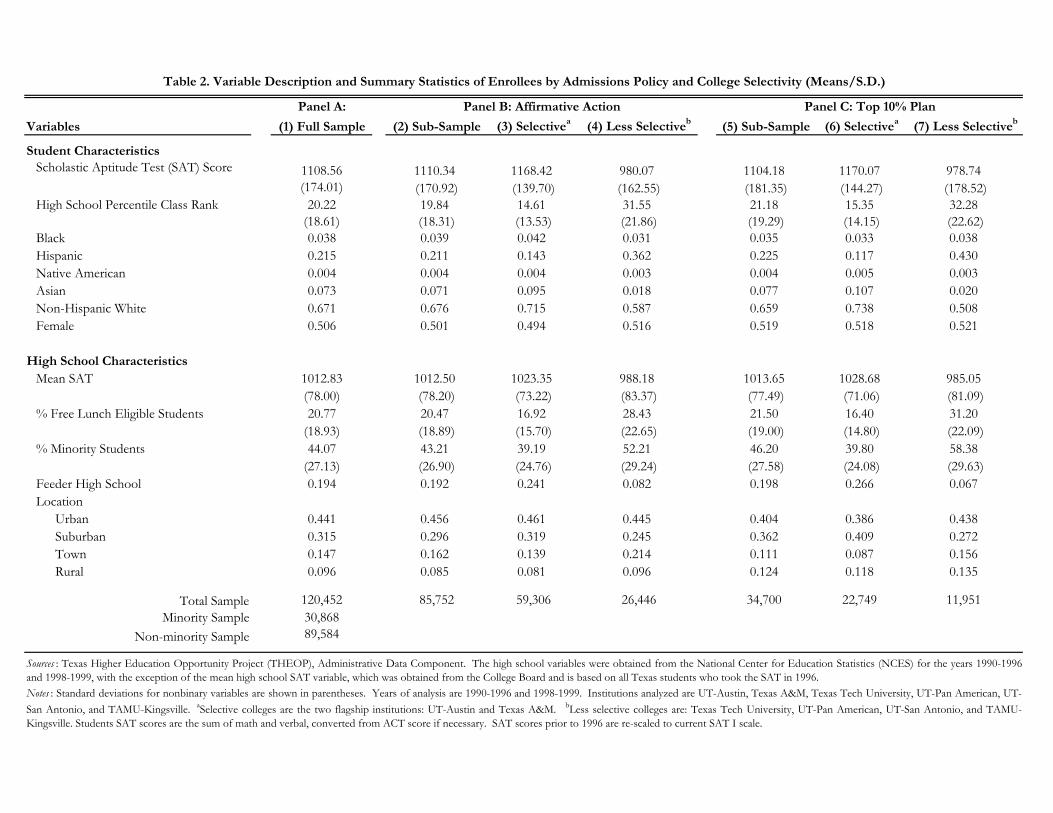
I now turn to the descriptive statistics of the main analytic sample. Table 2 presents
descriptive statistics of the control variables used in the analysis displayed in several
dimensions. Panel A reports the summary statistics for the full sample of enrollees (column
(1)); panel B reports the summary statistics for enrollees during the affirmative action years
(column (2)) and enrollees by college selectivity (columns (3) and (4)); and lastly, panel C
reports the summary statistics for enrollees during the Top 10% Plan (column (5)) and
enrollees by college selectivity (columns (6) and (7)).
The analytic sample consists of 120,452 students (85,752 students in the affirmative
action period and 34,700 students in the Top 10% Plan period) for the cohorts entering in
1990 through 1996 and cohorts entering in 1998 through 1999.16 In the sample, there are
30,868 minority and 89,584 non-minority students. As seen in panel A of Table 2, the
average SAT score for the full analytic sample is 1,108 points and average class rank is 20
students who took the SAT in 1996. I thank Jesse Rothstein for making the data available for this paper. 15 Although the admission rate for first decile students is expected to be exactly at 100 percent during the Top 10% Plan regime, university officials attribute rejections to errors in student applications. 16 The 1997 student cohort is not included in the analysis since this cohort of students was admitted under an admissions policy in which neither affirmative action nor the Top 10% Plan were in place.

15
percentile points. The sample consist of 3.8 percent black, 21.5 percent Hispanic, 0.4
percent Native American, 7.3 percent Asian, and 67.1 percent non-Hispanic white students,
and roughly half the sample is female.
Although the subsample characteristics of enrollees during the affirmative action
years compared to those during the Top 10% Plan years (column (2) versus column (5))
seem to have remained basically unchanged across these two distinct admissions policies,
this is not the case if we further divide these two admission subsamples by students who
enrolled at selective versus those who enrolled at less selective colleges (columns (3) and (4)
of panel B versus columns (6) and (7) of panel C).17 Overall, there are observable
differences in both student attributes and high school level characteristics for students who
attended selective colleges compared to those who attended less selective colleges across
both admissions policies. For instance, under both policies, students who enrolled in
selective colleges have higher SAT scores and class rank. Also, students who enrolled in less
selective colleges were more likely to have graduated from high schools whose students were
eligible for the federally subsidized lunch program, a standard indicator of the average socio-
economic status of a high school. Lastly, students who enrolled in less selective colleges
were more likely to have graduated from high schools that have a larger percentage of
minority students.
However, the most important point illuminated by the division of affirmative action
and the Top 10% Plan samples by college selectivity is the difference in racial composition
of enrollees at selective versus less selective colleges: there are far fewer minority students
17 The classification of the six universities into selective and less selective groups is based on an independent postsecondary school ranking widely referenced in the college quality literature, Barron’s Profiles of American Colleges 25th Edition (2002). The selective colleges consist of the two flagship institutions, UT-Austin and Texas A&M, and the less selective colleges consist of the remaining four institutions: Texas Tech, TAMU-Kingsville, UT-San Antonio, and UT-Pan American.

16
and many more non-minority students attending selective colleges under the Top 10% Plan
compared to the period when affirmative action admissions was in place (column (3) versus
column (6)). Conversely, there are far more minority students and fewer non-minority
students attending less selective colleges under the Top 10% Plan compared to the
affirmative action admission years (column (4) versus column (7)). These simple descriptive
statistics indicate that minority students cascaded downward to less selective public
institutions under the Top 10% Plan. Moreover, this enrollment pattern falls in line with the
observed declined in acceptance rates of lower decile minority students at selective colleges
(shown in Table 1).
Lastly, Tables 3A and 3B present the unadjusted difference-in-differences estimates
of the main outcome variables of interest: fall-to-fall freshmen retention and college
completion within six years of enrollment. These unadjusted differences are shown
separately by minority group status in Tables 3A and 3B, respectively. There was a decline in
both the retention and college graduation rates of minority students ranked in the second
and third (and below) deciles under the Top 10% Plan. As shown in panel A of Table 3A,
freshmen retention rate of minority students ranked in the second and third (and below)
deciles declined by 2.6 and 6.7 percentage points, respectively, under this alternative college
admissions policy. Also, college completion within six years of enrollment of lower ranked
minority students declined: the graduation rates of second- and third- (and below) decile
minority students declined by 3.4 and 6.9 percentage points, respectively. In contrast, with
the exception of the retention rate of students ranked in the third and below deciles, the
difference-in-differences estimates (shown in Table 3B) for non-minority students show no
effect of the Top 10% Policy on the same deciles.

17
5. Results and Discussion
The results from the difference-in-differences analysis are summarized in Table 4A
for the minority sample. This table only reports the estimated coefficients on the post
indicator variable interacted with the two treatment indicator variables (i.e., second and lower
deciles), the two treatment indicator variables, and the constant. All regressions include
cohort dummies (coefficients not reported). In Table 4A, model 1 presents the unadjusted
baseline effects, model 2 controls for student characteristics, model 3 further controls for
high school demographics, and model 4 adds in high school fixed effects. This table is
further divided into two panels: panel A reports the regression results for the fall-to-fall
freshmen retention outcome and panel B reports the regression results for the college
completion outcome.
As panel A shows, there is a negative and statistically significant difference-in-
differences estimates for all model specifications. Although the magnitude of these point
estimates do vary slightly, the direction of these estimates are not sensitive to the addition of
student and high school controls or to the addition of high school fixed effects.18 The
results shown mirror the unadjusted difference-in-differences estimates previously reported
in Table 3A. The preferred model specification for both outcomes of interest is model 3 as
this specification includes the full set of covariates, which improves the efficiency of the
difference-in-differences estimator. Controlling for student attributes and high school
characteristics, I find that the change in admissions policies lowered the freshmen retention
rates of second- and third- (and below) decile minority students, respectively, by 2.4 and 4.9
percentage points. Likewise, as shown in model 3 of panel B, I find that the change in
admissions policies lowered the graduation rates of second- and third- (and below) decile
18 Results are robust when the analytic sample is restricted to minority students in the top four to six deciles.

18
minority students, respectively, by 3.3 and 4.2 percentage points. These results are also
robust to the inclusion of high school fixed effects.
Since the minority mismatch hypothesis would have predicted an improvement in
the retention and graduation rates of these lower-ranked minority students under the Top
10% Plan, the results of my analysis clearly run counter to this prediction. As shown in
Table 1, there was a sizable decline in the admission rates of lower-decile minority students
at selective colleges after the change in admissions policies. Moreover, these lower
admission rates at selective colleges translate to a reduction in the number of minority
students attending selective colleges and an increase in minority attendance at less selective
colleges under the Top 10% Plan compared to the affirmative action admissions years
(shown in Table 2). According to the minority mismatch hypothesis, these students are now
being better “matched” to an institution under this alternative admissions policy, whereas
during the period of affirmative action admissions these students were “under-matched”
academically to selective public institutions. If the mismatch hypothesis was valid, we should
observe both an increase in retention and graduation rather than a decrease in both. The
results from the analysis support previous studies that have used other methodological
approaches to study the mismatch claim (Bowen and Bok 1998; Alon and Tienda 2005;
Kane 1998a, 1998b; Fisher and Massey 2007).
I also conduct the same analysis on the non-minority student sample. Non-minority
students were also impacted by the elimination of affirmative action policies (or the adoption
of the Top 10% Plan) in Texas. For the non-minority sample we should observe a positive
effect of the Top 10% Plan on freshmen retention and college completion of lower-ranked
non-minority students. Recall from Table 1 that the admission rates of lower-ranked non-

19
minority students at selective colleges increased by 8 and 10 percentage points, respectively,
for students ranked in the second and third (and below) deciles.
The results of this analysis are reported in Table 4B, which has the exact layout as
Table 4A. These results once again highlight the fact that the difference-in-differences point
estimates are statistically insignificant for the college completion outcome (shown in panel
B). Likewise, the difference-in-differences point estimates are statistically insignificant for
the freshmen retention outcome for the second-decile non-minority students. However,
there is a positive and statistically significant effect of the Top 10% Plan on retention of
third (and below) decile non-minority students: fall-to-fall freshmen retention increased by
2.4 percentage points.
Interestingly, these results seem to indicate that the elimination of affirmative action
practices did not help non-minorities as much as it harmed the retention and graduation of
minority students. While the admission rates of minority students in the second and lower
deciles to UT-Austin and Texas A&M declined substantially under the Top 10% Plan, those
of non-minorities in the second and lower deciles rose significantly (shown in Table 1).
Moreover, the racial composition of enrollment at selective institutions also shifted toward
non-minorities in the post-affirmative action period (shown in Table 2). However, these
gains did not translate into higher college retention or graduation for non-minority students
under the post-affirmative action era.
The change in admissions policies from affirmative action to the Top 10% Plan
negatively impacted lower decile minority students. The analysis suggests that the
elimination of affirmative action in the 1990s actually increased the pervasive racial gap in
postsecondary educational attainment in Texas. Under affirmative action over the period
1990 to 1996, 42 percent of minorities and 67 percent of non-minorities enrolled in public

20
universities in Texas graduated within 6 years; under the Top 10% Plan over the period 1998
to 1999, the graduation rates were 39 and 69 percent for minorities and non-minorities,
respectively. My results suggest that most of this increase in the graduation gap between
minorities and non-minorities in Texas, a staggering 90 percent, was driven by the change in
admissions policy from affirmative action to the Top 10% Plan.19
6. Robustness Analysis
In order for the difference-in-differences analysis to identify the causal effect of the
impact of the Top 10% Plan, the difference-in-differences framework relies on the critical
assumption that, in the absence of policy change, the average change in retention or
graduation outcomes would have been the same for the two treatment groups and the
control group. This critical assumption is formally called the parallel trends (or “common
trends”) assumption. It must be the case that the two treatment groups and the control
group exhibit common trends. In other words, there should not exist time trends that are
specific to the control group and are different from that of the treatment group. This
19 Based on a difference-in-differences point estimate obtained from an analysis that pools all lower-deciles into one treatment variable, I calculated how much of the rise in the graduation gap between minorities and non-minorities can be explained by the change in admissions policies from affirmative action to the Top 10% Plan. This calculation was performed as follows:
AAnm
Top10nm
AAm
Top10m
gradm
GGGG
β̂
0.670.690.420.39
0.045
0.900.020.03
0.045
where gradmβ̂ is an estimated coefficient obtained from regressing minority graduation within six-years on a
constant, Post x Non-Top10% Decile dummy, Non-Top10% Decile (11-100% percentile class rank) dummy, cohort dummies, student and high school controls (regression standard errors were clustered by students high
school). AAmG and Top10
mG indicate the mean six-year graduation rate of admitted minority students under
affirmative action and the Top 10% Plan, respectively. Lastly, AAnmG and Top10
nmG indicate the mean six-year graduation rate of admitted non-minority students under affirmative action and the Top 10% Plan, respectively.

21
assumption implies that the k ’s in equation (1) are capturing the secular trends that are
common to both the treatment groups and the control group.
In this section I conduct a robustness check to establish the case for the parallel
trends assumption in the analytic sample. The following model specification allows the
differences in the treatment groups with respect to the control group to vary during the
period prior to the implementation of the Top 10% Plan. Hence, this robustness test drops
all post-policy observations from the analysis and the two treatment variables are interacted
with all pre-policy cohort indicators except for 1993, which serves as the base cohort.20 The
following model specification is estimated by OLS,
19962 3 _
1 21990
1996 19962 3 _
1, 2, 1990 1990
nd rd plusit k t it it
k
nd rd plusk t it k t it
k k
it it it
Y I Cohort k Decile Decile
I Cohort k Decile I Cohort k Decile
S HS
(2)
All of the variables in equation (2) have the same meaning as previously defined; however,
the coefficients of interest are now 1, 2, and =1990, , 1996k k k , which indicate any
differences in the yearly cohort effect of the treatment groups (i.e., second and lower deciles)
with respect to the comparison year (i.e., 1993).
If the earlier difference-in-differences point estimates are estimating the causal effect
of the Top 10% Plan, then we should expect there to be no statistically significant
differences between the treatment groups and the control group in the pre-policy years.
20 An alternative test for the parallel trends assumption was also conducted. Specifically, I dropped all post-policy cohorts (i.e., 1998 and 1999 cohorts) and redefined the “post” variable as a “fake cohort” (i.e., 1993

22
Table 5 presents the results of this analysis for the minority sample, and only the coefficients
of interest are reported. The coefficients of the interaction terms in these models are
subsequently tested in two ways: if the coefficients are jointly significant and if they are equal
to each other. At the bottom of Table 5, the F-statistics indicate that these coefficients are
jointly statistically insignificant and that the coefficients are equal to each other.21 Thus,
these tests establish the case that the parallel trends assumption holds for the analytic sample
and reinforces the identification strategy implemented in this paper.
7. Conclusion
This paper informs the ongoing national debate on affirmative action policies in
higher education and provides new evidence on the effects of alternative admissions policies,
specifically the top x-percent plans, on college persistence and completion of minority
students. In light of the changing legal status of race-sensitive admissions policies in higher
education, it is important to understand the merits of alternative admissions policies,
especially since states like Texas, California, and Florida that banned the use of race-based
preferences in postsecondary admissions have implemented some form of rank-based
admissions. The Texas Top 10% Plan provides an important experimental setting in which
the effects of this policy change on the college outcomes of non-top x-percent students at
public institutions can be examined.
I find that the change from affirmative action admissions policies to the Top 10%
Plan in Texas decreased both college persistence and completion rates of lower-ranked
cohort), choosing a cohort that was admitted when the Top 10% Plan was not in effect. All of the difference-in-differences point estimates from this alternative estimation were statistically insignificant for both outcomes. 21 The same analysis and F-tests were conducted for the non-minority sample. In all model specifications, the F-statistics indicated that the coefficients of the interaction terms are jointly statistically insignificant and the

23
minority students. Freshmen retention and six-year college graduation rates of second-decile
minority students decreased, respectively, by 2.4 and 3.3 percentage points. The effect of
this policy change was slightly larger for minority students in the third and below deciles:
freshmen retention and six-year college graduation rates decreased, respectively, by 4.9 and
4.2 percentage points.
Contrary to critics of race-sensitive admissions, results from the analysis run counter
to the “mismatch” hypothesis, which would have predicted both higher retention and college
graduation rates for these lower-ranked minority students because they are now supposedly
being better “matched” to an institution under the Top 10% Plan. Moreover, while I find
that the postsecondary educational attainment of minority students declined under the Top
10% Plan admissions policy, interestingly, the elimination of affirmative action policies did
not increase college retention or graduation for non-minority students under the post-
affirmative action era. The analysis suggests that elimination of racial preference in college
admissions in Texas did not help non-minorities as much as it harmed the retention and
graduation of minority students.
coefficients are equal to each other, indicating that the parallel trends assumption also holds for the non-minority analytic sample.

24
References
Alon, Sigal and Marta Tienda (2005). “Assessing the ‘Mismatch’ Hypothesis: Differences in College Graduation Rates by Institutional Selectivity.” Sociology of Education 78, 294-315.
Ayres, Ian and Richard Brooks (2005). “Does Affirmative Action Reduce the Number of Black Lawyers?” Stanford Law Review 57, 1807-1854.
Barron’s College Division (2002), Barron’s Profiles of American Colleges: 25th Edition 2003 (Hauppauge, NY: Barron’s Educational Series, Inc.).
Black, Daniel A. and Jeffrey A. Smith (2004). “How Robust is the Evidence on the Effects of College Quality? Evidence from Matching.” Journal of Econometrics 121, 99-124.
Bowen, William G. and Derek Bok (1998). The Shape of the River: Long-term Consequences of Considering Race in College and University Admissions (Princeton, N.J.: Princeton University Press).
Brewer, Dominic J. and Ronald G. Ehrenberg (1996). “Does It Pay to Attend an Elite Private College? Evidence from the Senior High School Class of 1980” (pp. 239-271), in Solomon Polacheck (Ed.), Research in Labor Economics, Volume 15 (JAI Press, Greenwich, CT).
Brewer, Dominic. J., Eric R. Eide, and Ronald G. Ehrenberg (1999). “Does It Pay to Attend an Elite Private College? Cross-Cohort Evidence on the Effects of College Type on Earnings.” Journal of Human Resources 34, 104-23.
Bucks, Brian (2004). “Affirmative Access versus Affirmative Action: How Have Texas’ Race-Blind Policies Affected College Outcomes?” Unpublished manuscript, University of Texas at Dallas.
Card, David and Alan B. Krueger (2005). “Would the Elimination of Affirmative Action Affect Highly Qualified Minority Applicants? Evidence from California and Texas.” Industrial & Labor Relations Review 58(3), 416-34.
Cortes, Kalena E. and Andrew I. Friedson (2010). “Ranking Up by Moving Out: The Effect of the Texas Top 10% Plan on Property Values.” Unpublished manuscript, Syracuse University.
Cullen, Julie, Randall Reback, and Mark Long (2009). “Jockeying for a Position: High School Student Mobility and the Texas Top-Ten Percent Rule,” Unpublished manuscript, University of California, San Diego.
Dee, Thomas S. (2004). “Are There Civic Returns to Education?” Journal of Public Economics 88(9), 697-1720.
Dickson, Lisa M. (2006). “Does Ending Affirmative Action in College Admissions Lower the Percent of Minority Students Applying to College?” Economics of Education Review 25(1), 109-19.
Faulkner, L. R. (2000). “‘Top 10 Percent’ Helps Students.” San Antonio Express-News, pg. 5B, October 25.
Fischer, Mary J. and Douglas S. Massey (2007). “The Effects of Affirmative Action in Higher Education.” Social Science Research 36, 531-549.
Graglia, Lino A. (1993). “Racial Preferences in Admission to Institutions of Higher Education” (pp. 127-51), in Howard Dickman (Ed.), The Imperiled Academy (New Brunswick, NJ: Transaction Publishers).

25
Ho, Daniel E. (2005). “Why Affirmative Action Does Not Cause Black Students to Fail the Bar,” Yale Law Journal 114, 1997-2004.
Hockstader, L. (2002). “Texas Colleges’ Diversity Plan May Be New Model.” The Washington Post, pg. A01, November 4.
Hopwood v. University of Texas 78 F.3d 932, 944 (5th Cir. 1996), cert. denied, 116 S.Ct. 2582, 1996.
Horn, Catherine L. and Stella M. Flores (2003). “Percent Plans in College Admissions: A Comparative Analysis of Three States’ Experiences.” Cambridge, MA: Civil Rights Project at Harvard University.
Jenks, George F. (1967). “The Data Model Concept in Statistical Mapping,” International Yearbook of Cartography 7, 86-190.
Kane, Thomas J. (1998a). “Misconceptions in the Debate over Affirmative Action in College Admissions” (pp. 17-32), in Gary Orfield and Edward Miller (Eds.), Chilling Admissions: The Affirmative Crisis and the Search for Alternatives (Cambridge: Harvard Education Publishing Group).
Kane, Thomas J. (1998b). “Racial and Ethnic Preferences in College Admission” (pp. 431-56), in C. Jencks and M. Phillips (Eds.), The Black-White Test Score Gap (Washington, D.C.: Brookings Institution Press).
Kane, Thomas J., and William T. Dickens (1996). “Racial and Ethnic Preference.” Policy Brief No. 9, Brookings Institution.
Leicht, K. T. and Teresa A. Sullivan (2000). “Minority Student Pipelines Before and After the Challenges to Affirmative Action.” Unpublished manuscript, University of Iowa.
Loury, Linda D. and David Garman (1993). “Affirmative Action in Higher Education.” American Economic Review 83(2), 99-103. Loury, Linda D. and David Garman (1995). “College Selectivity and Earnings.” Journal of Labor Economics 13(2), 289-308. Niu, Sunny, Marta Tienda, and Kalena E. Cortes (2006). “College Selectivity and the Texas Top 10% Law: How Constrained are the Options?” Economics of Education Review 25(3), 259-27.
Rothstein, Jesse and Albert Yoon (2006). “Mismatch in Law School.” Education Research Section Working Paper No. 16, Princeton University, Department of Economics, February.
Sander, Richard (2004). “A Systematic Analysis of Affirmative Action in American Law Schools,” Stanford Law Review 57, 367-483. Thernstrom, Stephan and Abigail Thernstrom (1997). America in Black and White: One Nation Indivisible (New York: Simon & Schuster).
Thernstrom, Stephan and Abigail Thernstrom (1999). “Reflections on The Shape of the River Book Review.” UCLA Law Review 46, 1583-1631.
Tienda, Marta, Kevin T. Leicht, Teresa A. Sullivan, Michael Maltese, and Kim Lloyd (2003). “Closing the Gap?: Admissions and Enrollments at the Texas Public Flagships Before and After Affirmative Action.” Working Paper 2003-1, Princeton University Office of Population Research.
U.S. Department of Education, National Center for Education Statistics, Higher Education General Information Survey (2005). “Degrees and Other Formal Awards Conferred” surveys, 1976-77 through 1984-85; and 1988-89 through 2003-04 Integrated

26
Postsecondary Education Data System, “Completions Survey” (IPEDS-C:89-99), and Fall 2000 through Fall 2004.
Walker, B. and Lavergne, G. (2001). “Affirmative Action and Percent Plans: What We Learned from Texas.” The College Board Review, 193, 18-23.
Yardley, J. (2002). “Desperately Seeking Diversity: The 10 Percent Solution.” The New York Times, Education Life Supplement, Section 4A, pg. 28, April 14.

Figure 1. Location of THEOP Universities and Minority Populations
% Minority (2000)
Source: 2000 U.S. Census.Notes: Maps generated using ArcView.
% Hispanic (2000) % Black (2000)

Panel A: All Students
Top 10% Decile *** 0.005 ***
(0.001)
Second Decile (11-20%ile class rank ) *** 0.023 ***
(0.004)
Third and Below Deciles (21-100%ile class rank ) *** 0.036 ***
(0.005)
Overall 0.028 *** 0.016 ***
(0.002) (0.002)
Panel B: Minority Students
Top 10% Decile *** -0.007(0.004)
Second Decile (11-20%ile class rank ) *** -0.117 ***
(0.011)
Third and Below Deciles (21-100%ile class rank ) *** -0.168 ***
(0.010)
Overall -0.082 *** -0.078 ***
(0.005) (0.005)
Panel C: Non-minority Students
Top 10% Decile *** 0.008 ***
(0.001)
Second Decile (11-20%ile class rank) *** 0.053 ***
(0.004)
Third and Below Deciles (21-100%ile class rank ) *** 0.081 ***
(0.005) (0.005)
Overall 0.054 *** 0.037 ***
(0.002)
Controlsa
Admission Rates
(0.002)0.0140.961 0.974
Table 1. Admission Rates at UT-Austin or Texas A&M by Admissions Policy and High School Class Rank (Applicant Sample)
Column Difference (2)-(1):
1990 to 1996 1998 to 1999 Controls
(4) With (1) Affirmative Action: (2) Top 10% Plan: (3) No
0.807 0.857 0.050(0.004)
0.465 0.519 0.054(0.005)
0.755 0.783
(0.004)0.961 0.946 -0.015
0.843 0.741 -0.102(0.010)
0.541 0.397 -0.144(0.010)
0.787 0.705
(0.005)
0.961 0.982 0.021(0.002)
0.798 0.882 0.084
0.445 0.547 0.102
Source : Texas Higher Education Opportunity Project (THEOP), Administrative Data Component.
0.747 0.801
Notes : Robust standard errors are shown in parentheses. aControls included are students and high characteristics reported from Table 2. Minority students include blacks,Hispanics, and Native Americans. Non-minority students include non-Hispanic whites and Asians.
[N=127,559] [N=45,783]
[N=25,823] [N=8,800]
(0.003)[N=101,736] [N=36,983]
Panel A:
Variables (1) Full Sample (2) Sub-Sample (3) Selectivea (4) Less Selectiveb (5) Sub-Sample (6) Selectivea (7) Less Selectiveb
Student CharacteristicsScholastic Aptitude Test (SAT) Score 1108.56 1110.34 1168.42 980.07 1104.18 1170.07 978.74
(174.01) (170.92) (139.70) (162.55) (181.35) (144.27) (178.52)High School Percentile Class Rank 20.22 19.84 14.61 31.55 21.18 15.35 32.28
(18.61) (18.31) (13.53) (21.86) (19.29) (14.15) (22.62)Black 0.038 0.039 0.042 0.031 0.035 0.033 0.038Hispanic 0.215 0.211 0.143 0.362 0.225 0.117 0.430Native American 0.004 0.004 0.004 0.003 0.004 0.005 0.003Asian 0.073 0.071 0.095 0.018 0.077 0.107 0.020Non-Hispanic White 0.671 0.676 0.715 0.587 0.659 0.738 0.508Female 0.506 0.501 0.494 0.516 0.519 0.518 0.521
High School CharacteristicsMean SAT 1012.83 1012.50 1023.35 988.18 1013.65 1028.68 985.05
(78.00) (78.20) (73.22) (83.37) (77.49) (71.06) (81.09)% Free Lunch Eligible Students 20.77 20.47 16.92 28.43 21.50 16.40 31.20
(18.93) (18.89) (15.70) (22.65) (19.00) (14.80) (22.09)% Minority Students 44.07 43.21 39.19 52.21 46.20 39.80 58.38
(27.13) (26.90) (24.76) (29.24) (27.58) (24.08) (29.63)Feeder High School 0.194 0.192 0.241 0.082 0.198 0.266 0.067Location
Urban 0.441 0.456 0.461 0.445 0.404 0.386 0.438Suburban 0.315 0.296 0.319 0.245 0.362 0.409 0.272Town 0.147 0.162 0.139 0.214 0.111 0.087 0.156Rural 0.096 0.085 0.081 0.096 0.124 0.118 0.135
Total Sample 120,452 85,752 59,306 26,446 34,700 22,749 11,951Minority Sample 30,868
Non-minority Sample 89,584
Table 2. Variable Description and Summary Statistics of Enrollees by Admissions Policy and College Selectivity (Means/S.D.)
Sources : Texas Higher Education Opportunity Project (THEOP), Administrative Data Component. The high school variables were obtained from the National Center for Education Statistics (NCES) for the years 1990-1996and 1998-1999, with the exception of the mean high school SAT variable, which was obtained from the College Board and is based on all Texas students who took the SAT in 1996.Notes : Standard deviations for nonbinary variables are shown in parentheses. Years of analysis are 1990-1996 and 1998-1999. Institutions analyzed are UT-Austin, Texas A&M, Texas Tech University, UT-Pan American, UT-
San Antonio, and TAMU-Kingsville. aSelective colleges are the two flagship institutions: UT-Austin and Texas A&M. bLess selective colleges are: Texas Tech University, UT-Pan American, UT-San Antonio, and TAMU-Kingsville. Students SAT scores are the sum of math and verbal, converted from ACT score if necessary. SAT scores prior to 1996 are re-scaled to current SAT I scale.
Panel B: Affirmative Action Panel C: Top 10% Plan

Affirmative Action: Top 10% Plan: Column1990 to 1996 1998 to 1999 Difference
Top 10% Decile 0.844 0.872 0.028***(0.009)
Second Decile (11-20%ile class rank ) 0.780 0.782 0.002(0.012)
Third and Below Deciles (21-100%ile class rank ) 0.633 0.593 -0.040***(0.013)
Difference: Top 10% and Second decile -0.064*** -0.090*** -0.026*(0.008) (0.013) (0.016)
Difference: Top 10% and Third plus deciles -0.212*** -0.279*** -0.067***(0.007) (0.010) (0.012)
Affirmative Action: Top 10% Plan: Column
1990 to 1996 1998 to 1999 DifferenceTop 10% Decile 0.609 0.635 0.026**
(0.012)
Second Decile (11-20%ile class rank ) 0.478 0.471 -0.007(0.014)
Third and Below Deciles (21-100%ile class rank ) 0.266 0.223 -0.043***(0.010)
Difference: Top 10% and Second decile -0.131*** -0.164*** -0.034**(0.009) (0.014) (0.017)
Difference: Top 10% and Third plus deciles -0.343*** -0.412*** -0.069***(0.007) (0.011) (0.013)
Source : Texas Higher Education Opportunity Project (THEOP), Administrative Data Component.Notes : All standard errors (shown in parentheses) are clustered at the high school level. Number of observations are 30,868. Minoritystudents include blacks, Hispanics, and Native Americans. ***, ** , * indicates statistical significance at the 1%, 5%, and 10% level,respectively.
Table 3A. Unadjusted Difference-in-Differences Estimates: Minority Students
Panel A: Freshmen Retention
Panel B: Graduate within 6 years

Affirmative Action: Top 10% Plan: Column1990 to 1996 1998 to 1999 Difference
Top 10% Decile 0.925 0.936 0.011***(0.003)
Second Decile (11-20%ile class rank ) 0.870 0.885 0.015**(0.006)
Third and Below Deciles (21-100%ile class rank ) 0.754 0.791 0.036***(0.007)
Difference: Top 10% and Second decile -0.055*** -0.051*** 0.004(0.003) (0.005) (0.006)
Difference: Top 10% and Third plus deciles -0.171*** -0.145*** 0.025***(0.003) (0.005) (0.006)
Affirmative Action: Top 10% Plan: Column
1990 to 1996 1998 to 1999 DifferenceTop 10% Decile 0.789 0.817 0.028***
(0.005)
Second Decile (11-20%ile class rank ) 0.681 0.698 0.017**(0.007)
Third and Below Deciles (21-100%ile class rank ) 0.508 0.543 0.035***(0.009)
Difference: Top 10% and Second decile -0.108*** -0.118*** -0.011(0.005) (0.007) (0.009)
Difference: Top 10% and Third plus deciles -0.281*** -0.274*** 0.007(0.004) (0.007) (0.008)
Notes : All standard errors (shown in parentheses) are clustered at the high school level. Number of observations are 89,584. Non-minority students include non-Hispanic whites and Asians. ***, ** indicates statistical significance at the 1% and 5% level, respectively.
Table 3B. Unadjusted Difference-in-Differences Estimates: Non-minority Students
Panel A: Freshmen Retention
Panel B: Graduate within 6 years
Source : Texas Higher Education Opportunity Project (THEOP), Administrative Data Component.

Post x Second Decile -0.0228 * -0.0228 * -0.0238 * -0.0276 ** -0.0322 ** -0.0333 ** -0.0332 ** -0.0265 *
(0.0130) (0.0130) (0.0128) (0.0135) (0.0159) (0.0156) (0.0154) (0.0156)
Post x Third and Below Deciles -0.0646 *** -0.0518 *** -0.0491 *** -0.0557 *** -0.0691 *** -0.0499 *** -0.0418 *** -0.0400 ***
(0.0139) (0.0133) (0.0130) (0.0132) (0.0153) (0.0140) (0.0138) (0.0138)
Second Decile (11-20%ile class rank ) -0.0635 *** -0.0357 *** -0.0589 *** -0.0646 *** -0.1299 *** -0.0841 *** -0.1242 *** -0.1347 ***
(0.0083) (0.0080) (0.0081) (0.0081) (0.0113) (0.0107) (0.0096) (0.0095)
Third and Below Deciles (21-100%ile class rank ) -0.2106 *** -0.1267 *** -0.1717 *** -0.1854 *** -0.3408 *** -0.2084 *** -0.2849 *** -0.2980 ***
(0.0106) (0.0105) (0.0100) (0.0091) (0.0129) (0.0127) (0.0106) (0.0100)
Constant 0.8166 *** 0.0943 -1.2125 * -0.0124 0.577 *** -0.1672 * -0.3324 0.7016 ***
(0.0109) (0.0914) (0.6178) (0.1174) (0.0134) (0.0786) (0.6057) (0.1197)
Cohort Dummies Yes Yes Yes Yes Yes Yes Yes Yes
Student Characteristics No Yes Yes Yes No Yes Yes Yes
High School Demographics (time-varying) No No Yes Yes No No Yes Yes
High School Fixed Effects No No No Yes No No No Yes
Observations (student-by-year) 30,868 30,868 30,868 30,868 30,868 30,868 30,868 30,868
R2 0.06 0.09 0.11 0.15 0.11 0.18 0.20 0.24
Table 4A. The Effect of the Top 10% Plan on College Persistence and Completion: Difference-in-Differences Regressions for Minority Students
Panel B: Graduate within 6 yearsPanel A: Freshmen Retention
Source : Texas Higher Education Opportunity Project (THEOP), Administrative Data Component.
Notes : All standard errors (shown in parentheses) are clustered at the high school level. Minority students include blacks, Hispanics, and Native Americans. Years of analysis are 1990-1996 and 1998-1999. Top10% Decile andPostxTop10% Decile are the omitted categories. Model 4 includes 853 high school dummies. ***, ** , * indicates statistical significance at the 1%, 5%, and 10% level, respectively. Mean retention rate and mean 6-year graduationrate for minority students are 0.73 and 0.41; respectively.
Model 1 Model 2 Model 3 Model 1 Model 2Model 4 Model 3 Model 4

Post x Second Decile 0.0043 0.0065 0.0061 0.0069 -0.0104 -0.0072 -0.0080 -0.0048(0.0064) (0.0063) (0.0062) (0.0062) (0.0086) (0.0086) (0.0087) (0.0088)
Post x Third and Below Deciles 0.0253 *** 0.0240 *** 0.0236 *** 0.0239 *** 0.0062 0.0049 0.0041 0.0054(0.0068) (0.0064) (0.0062) (0.0062) (0.0093) (0.0087) (0.0083) (0.0082)
Second Decile (11-20%ile class rank ) -0.0550 *** -0.0369 *** -0.0555 *** -0.0582 *** -0.1075 *** -0.0811 *** -0.1154 *** -0.1204 ***
(0.0046) (0.0044) (0.0042) (0.0043) (0.0067) (0.0066) (0.0057) (0.0058)
Third and Below Deciles (21-100%ile class rank ) -0.1700 *** -0.1186 *** -0.1543 *** -0.1580 *** -0.2795 *** -0.2058 *** -0.2724 *** -0.2781 ***
(0.0094) (0.0081) (0.0063) (0.0061) (0.0130) (0.0118) (0.0075) (0.0066)
Constant 0.9364 *** -0.4446 *** -1.2867 *** -0.1874 ** 0.8129 *** -0.9021 *** -1.5455 *** -0.2736 ***
(0.0037) (0.0969) (0.2887) (0.0903) (0.0060) (0.0892) (0.4905) (0.0932)
Cohort Dummies Yes Yes Yes Yes Yes Yes Yes Yes
Student Characteristics No Yes Yes Yes No Yes Yes Yes
High School Demographics (time-varying) No No Yes Yes No No Yes Yes
High School Fixed Effects No No No Yes No No No Yes
Observations (student-by-year) 89,584 89,584 89,584 89,584 89,584 89,584 89,584 89,584
R2 0.04 0.07 0.08 0.11 0.07 0.10 0.12 0.15
Table 4B. The Effect of the Top 10% Plan on College Persistence and Completion: Difference-in-Differences Regressions for Non-minority Students
Panel A: Freshmen Retention Panel B: Graduate within 6 years
Source : Texas Higher Education Opportunity Project (THEOP), Administrative Data Component.
Notes : All standard errors (shown in parentheses) are clustered at the high school level. Non-minority students include non-Hispanic whites and Asians. Years of analysis are 1990-1996 and 1998-1999. Top10% Decile andPostxTop10% Decile are the omitted categories. Model 4 includes 1043 high school dummies. ***, ** , * indicates statistical significance at the 1%, 5%, and 10% level, respectively. Mean retention rate and mean 6-year graduationrate for non-minority students are 0.86 and 0.68; respectively.
Model 1 Model 2 Model 3 Model 4Model 1 Model 2 Model 3 Model 4

Cohort 1990 x Second Decile -0.017 -0.020 -0.021 -0.017 0.007 0.005 0.003 0.003(0.036) (0.035) (0.036) (0.037) (0.047) (0.045) (0.044) (0.045)
Cohort 1991 x Second Decile 0.026 0.020 0.021 0.022 0.034 0.035 0.037 0.030(0.034) (0.033) (0.033) (0.034) (0.044) (0.044) (0.044) (0.045)
Cohort 1992 x Second Decile 0.014 0.007 0.005 0.001 0.036 0.030 0.025 0.018(0.026) (0.026) (0.025) (0.026) (0.038) (0.036) (0.036) (0.036)
Cohort 1994 x Second Decile 0.015 0.019 0.019 0.018 0.006 0.016 0.015 0.019(0.028) (0.027) (0.026) (0.027) (0.034) (0.033) (0.033) (0.033)
Cohort 1995 x Second Decile 0.029 0.034 0.035 0.033 0.036 0.054 * 0.054 * 0.065 **
(0.026) (0.025) (0.025) (0.025) (0.032) (0.031) (0.030) (0.031)
Cohort 1996 x Second Decile 0.011 0.020 0.019 0.019 -0.013 0.012 0.008 0.019(0.028) (0.027) (0.026) (0.026) (0.034) (0.033) (0.032) (0.033)
Cohort 1990 x Third and Below Deciles -0.001 -0.045 -0.047 -0.040 0.107 *** 0.021 0.014 0.017(0.033) (0.032) (0.032) (0.032) (0.037) (0.035) (0.034) (0.034)
Cohort 1991 x Third and Below Deciles -0.002 -0.036 -0.044 -0.037 0.061 * 0.008 -0.005 -0.005(0.030) (0.030) (0.030) (0.030) (0.036) (0.034) (0.034) (0.035)
Cohort 1992 x Third and Below Deciles -0.008 -0.011 -0.012 -0.014 0.019 0.022 0.023 0.020(0.024) (0.024) (0.023) (0.024) (0.026) (0.024) (0.024) (0.024)
Cohort 1994 x Third and Below Deciles -0.029 -0.030 -0.031 -0.029 -0.001 -0.003 -0.002 -0.002(0.024) (0.024) (0.023) (0.024) (0.025) (0.024) (0.023) (0.024)
Cohort 1995 x Third and Below Deciles 0.016 0.020 0.028 0.021 0.003 0.015 0.027 0.024(0.021) (0.021) (0.021) (0.021) (0.025) (0.026) (0.025) (0.026)
Cohort 1996 x Third and Below Deciles -0.039 * -0.022 -0.019 -0.028 -0.035 -0.001 0.005 0.000(0.023) (0.023) (0.023) (0.022) (0.023) (0.022) (0.022) (0.023)
Second Decile (11-20%ile class rank ) -0.065 *** -0.048 ** -0.069 *** -0.074 *** -0.145 *** -0.106 *** -0.143 *** -0.158 ***
(0.021) (0.021) (0.020) (0.021) (0.027) (0.026) (0.025) (0.025)
Third and Below Deciles (21-100%ile class rank ) -0.166 *** -0.110 *** -0.154 *** -0.168 *** -0.348 *** -0.211 *** -0.289 *** -0.301 ***
(0.017) (0.017) (0.016) (0.016) (0.020) (0.020) (0.018) (0.019)Constant 0.784 *** 0.090 -1.594 ** 0.193 0.633 *** -0.218 ** -0.676 0.712 ***
(0.014) (0.110) (0.721) (0.175) (0.018) (0.090) (0.658) (0.189)
F-statistica 0.91 1.12 1.46 1.18 1.93 0.46 0.52 0.74F-statisticb 0.98 1.21 1.55 1.28 2.11 0.47 0.51 0.74
Observations (student-by-year) 21,693 21,693 21,693 21,693 21,693 21,693 21,693 21,693
R2 0.05 0.08 0.10 0.17 0.10 0.17 0.19 0.24
Cohort Dummies Yes Yes Yes Yes Yes Yes Yes YesStudent Characteristics No Yes Yes Yes No Yes Yes Yes
High School Demographics (time-varying) No No Yes Yes No No Yes Yes
High School Fixed Effects No No No Yes No No No Yes
Table 5. Pre-policy Difference-in-Differences Regressions: Testing the Parallel Trends Assumption (Minority Students)
Panel B: Graduate within 6 years
Model 2
Panel A: Freshmen Retention
Notes : All standard errors (shown in parentheses) are clustered at the high school level. aF-statistic that tests if the coefficients are jointly significant. bF-statistic that tests whether the coefficients are equal to each other. Minority studentsinclude blacks, Hispanics, and Native Americans. Year of analysis are 1990-1996 (pre-policy data). Top10% Decile, Cohort 1993, Cohort 1990-1996 dummies interacted with Top10% Decile, Cohort 1993xSecond Decile, and Cohort1993xThird and Below Deciles are the omitted categories in all regression specifications. Model 4 includes 796 high school dummies. ***, ** , * indicates statistical significance at the 1%, 5%, and 10% level, respectively.
Model 1 Model 2 Model 3 Model 1 Model 3 Model 4Model 4

Post x Second Decile -0.0228 * -0.0228 * -0.0238 * -0.0276 ** -0.0322 ** -0.0333 ** -0.0332 ** -0.0265 *
(0.0130) (0.0130) (0.0128) (0.0135) (0.0159) (0.0156) (0.0154) (0.0156)Post x Third and Below Deciles -0.0646 *** -0.0518 *** -0.0491 *** -0.0557 *** -0.0691 *** -0.0499 *** -0.0418 *** -0.0400 ***
(0.0139) (0.0133) (0.0130) (0.0132) (0.0153) (0.0140) (0.0138) (0.0138)
Second Decile -0.0635 *** -0.0357 *** -0.0589 *** -0.0646 *** -0.1299 *** -0.0841 *** -0.1242 *** -0.1347 ***
(0.0083) (0.0080) (0.0081) (0.0081) (0.0113) (0.0107) (0.0096) (0.0095)
Third and Below Deciles -0.2106 *** -0.1267 *** -0.1717 *** -0.1854 *** -0.3408 *** -0.2084 *** -0.2849 *** -0.2980 ***
(0.0106) (0.0105) (0.0100) (0.0091) (0.0129) (0.0127) (0.0106) (0.0100)Black 0.0628 *** 0.0567 *** 0.0450 *** 0.0670 *** 0.0454 *** 0.0148
(0.0094) (0.0088) (0.0082) (0.0108) (0.0102) (0.0106)Native American -0.0166 -0.0422 ** -0.0580 *** 0.0299 -0.0244 -0.0397 *
(0.0193) (0.0188) (0.0193) (0.0217) (0.0215) (0.0224)Female 0.0296 *** 0.0212 *** 0.0178 *** 0.0779 *** 0.0644 *** 0.0602 ***
(0.0051) (0.0053) (0.0053) (0.0058) (0.0056) (0.0055)SAT (x100) 0.0913 *** 0.0949 *** 0.1159 *** 0.0715 *** 0.0759 *** 0.0850 ***
(0.0171) (0.0167) (0.0139) (0.0152) (0.0132) (0.0132)SAT Squared (x1000) -0.0002 *** -0.0003 *** -0.0004 *** -3.5E-05 -0.0002 *** -0.0003 ***
(0.0001) (0.0001) (0.0001) (0.0001) (0.0001) (0.0001)Mean High School SAT (x100) 0.2529 ** 0.0000 0.0421 0.0000
(0.1268) (0.0000) (0.1219) (0.0000)Mean High School SAT Sq. (x1000) -0.0011 * 0.0001 *** 1.77E-05 -0.0007 ***
(0.0006) (0.0000) (0.0006) (0.0000)Feeder High School 0.0552 *** 0.0000 0.0811 *** 0.0000
(0.0145) (0.0000) (0.0212) (0.0000)Suburban 0.0041 0.0075 -0.0087 0.0065
(0.0115) (0.0179) (0.0102) (0.0175)Town 0.0576 *** -0.0361 0.0165 -0.0154
(0.0158) (0.0221) (0.0161) (0.0267)Rural 0.0271 * -0.0102 -0.0084 0.0046
(0.0153) (0.0290) (0.0143) (0.0248)% Free Lunch -0.0030 *** -0.0030 ** -0.0044 *** 0.0013
(0.0010) (0.0012) (0.0010) (0.0010)% Free Lunch Squared 0.0224 * 0.0337 ** 0.0388 *** -0.0104
(0.0124) (0.0136) (0.0103) (0.0107)% Minority 0.0003 0.0023 -0.0004 -0.0030
(0.0010) (0.0029) (0.0009) (0.0034)% Minority Squared 0.0032 -0.0151 -1.12E-05 0.0270
(0.0089) (0.0240) (0.0079) (0.0269)Constant 0.8166 *** 0.0943 -1.2125 * -0.0124 0.577 *** -0.1672 * -0.3324 0.7016 ***
(0.0109) (0.0914) (0.6178) (0.1174) (0.0134) (0.0786) (0.6057) (0.1197)Other Controls:Year Dummies (not shown) Yes Yes Yes Yes Yes Yes Yes YesHigh School Fixed Effects No No No Yes No No No Yes
Observations 30,868 30,868 30,868 30,868 30,868 30,868 30,868 30,868
R2 0.06 0.09 0.11 0.15 0.11 0.18 0.20 0.24
Notes See notes from Table 4A.
Model 1 Model 2 Model 3 Model 1Model 4 Model 3 Model 4
Appendix Table A1. Difference-in-Differences Regressions: Minority Students (Controls Shown)
Panel B: Graduate within 6 yearsModel 2
Panel A: Freshmen Retention

Post x Second Decile 0.0043 0.0065 0.0061 0.0069 -0.0104 -0.0072 -0.0080 -0.0048(0.0064) (0.0063) (0.0062) (0.0062) (0.0086) (0.0086) (0.0087) (0.0088)
Post x Third and Below Deciles 0.0253 *** 0.0240 *** 0.0236 *** 0.0239 *** 0.0062 0.0049 0.0041 0.0054(0.0068) (0.0064) (0.0062) (0.0062) (0.0093) (0.0087) (0.0083) (0.0082)
Second Decile -0.0550 *** -0.0369 *** -0.0555 *** -0.0582 *** -0.1075 *** -0.0811 *** -0.1154 *** -0.1204 ***
(0.0046) (0.0044) (0.0042) (0.0043) (0.0067) (0.0066) (0.0057) (0.0058)
Third and Below Deciles -0.1700 *** -0.1186 *** -0.1543 *** -0.1580 *** -0.2795 *** -0.2058 *** -0.2724 *** -0.2781 ***
(0.0094) (0.0081) (0.0063) (0.0061) (0.0130) (0.0118) (0.0075) (0.0066)Asian 0.0215 *** 0.0142 *** 0.0082 * -0.0121 * -0.0271 *** -0.0373 ***
(0.0037) (0.0043) (0.0042) (0.0065) (0.0066) (0.0054)Female 0.0213 *** 0.0135 *** 0.0114 *** 0.0592 *** 0.0447 *** 0.0410 ***
(0.0025) (0.0025) (0.0025) (0.0036) (0.0033) (0.0033)SAT (x100) 0.2057 *** 0.1816 *** 0.1654 *** 0.2487 *** 0.2059 *** 0.1638 ***
(0.0158) (0.0160) (0.0143) (0.0143) (0.0136) (0.0141)SAT Squared (x1000) -0.0008 *** -0.0007 *** -0.0006 *** -0.0009 *** -0.0008 *** -0.0006 ***
(0.0001) (0.0001) (0.0001) (0.0001) (0.0001) (0.0001)Mean High School SAT (x100) 0.1681 *** 0.0000 0.1424 0.0000
(0.0525) (0.0000) (0.0944) (0.0000)Mean High School SAT Sq. (x1000) -0.0006 ** 0.0000 *** -0.0004 0.0001 ***
(0.0003) (0.0000) (0.0005) (0.0000)Feeder High School 0.0311 *** 0.0000 0.0612 *** 0.0000
(0.0078) (0.0000) (0.0130) (0.0000)Suburban 0.0004 0.0010 0.0010 -0.0038
(0.0063) (0.0055) (0.0101) (0.0103)Town -0.0002 -0.0096 -0.0051 -0.0109
(0.0066) (0.0106) (0.0092) (0.0123)Rural -0.0008 0.0159 * -0.0028 0.0098
(0.0079) (0.0091) (0.0112) (0.0125)% Free Lunch -0.0005 0.0001 -0.0021 ** -0.0005
(0.0006) (0.0007) (0.0009) (0.0010)% Free Lunch Squared -0.0027 0.0093 0.0092 0.0146
(0.0094) (0.0119) (0.0150) (0.0165)% Minority 9.2E-06 0.0012 0.0004 -0.0001
(0.0005) (0.0010) (0.0008) (0.0015)% Minority Squared -0.0001 -0.0145 -0.0033 -0.0134
(0.0052) (0.0096) (0.0087) (0.0137)Constant 0.9364 *** -0.4446 *** -1.2867 *** -0.1874 ** 0.8129 *** -0.9021 *** -1.5455 *** -0.2736 ***
(0.0037) (0.0969) (0.2887) (0.0903) (0.0060) (0.0892) (0.4905) (0.0932)Other Controls:Year Dummies (not shown) Yes Yes Yes Yes Yes Yes Yes YesHigh School Fixed Effects No No No Yes No No No Yes
Observations 89,584 89,584 89,584 89,584 89,584 89,584 89,584 89,584
R2 0.04 0.07 0.08 0.11 0.07 0.10 0.12 0.15
Model 2 Model 3 Model 4
Notes See notes from Table 4B.
Appendix Table A2. Difference-in-Differences Regressions: Non-minority Students (Controls Shown)
Panel A: Freshmen Retention Panel B: Graduate within 6 yearsModel 1 Model 2 Model 3 Model 4 Model 1
Related Documents


![Untitled-2 [panoramacambalkon.com] · ANOR Bans Tente . ANOR Bans Tente . ANOR Bans Tente](https://static.cupdf.com/doc/110x72/5aece14e7f8b9ae5318f7946/untitled-2-bans-tente-anor-bans-tente-anor-bans-tente.jpg)

