Welcome message from author
This document is posted to help you gain knowledge. Please leave a comment to let me know what you think about it! Share it to your friends and learn new things together.
Transcript

42935.ai 1 3/25/13 11:56 AM42935.ai 1 3/25/13 11:56 AM

Dear Shareholders,
I am immensely proud of our performance in 2012. For the full year –our first full year as a public company – we delivered nearly 40 percent adjusted operating income growth and nearly 40 percent adjusted earnings per share growth year-over-year. And since our IPO in July 2011, our stock has outperformed both the general market and our industry group.
These results are a testimony to Dunkin’ Brands’ unique combination of assets. We have a nearly 100 percent franchised, asset-light business model, with high margins, low capital expenditure requirements and strong cash flow generation. We have an intense focus on driving franchisee profitability, which drives strong returns for both franchisees and shareholders. We have two widely recognized global brands, Dunkin’ Donuts and Baskin-Robbins, and, unlike most of our peers, we have significant restaurant expansion opportunities, both in the U.S. and internationally.
We're pleased that at the beginning of 2013 our Board announced a 27 percent increase in our dividend, further underscoring our commitment to delivering shareholder value.
All of which gives us great confidence about the short- and long-term future of our business.
42935.ai 2 3/25/13 11:56 AM42935.ai 2 3/25/13 11:56 AM

Dunkin’ Donuts: One of the fastest growing QSR concepts
Our highly compelling unit economics, coupled with our contiguous, strategic development approach, helped drive another very strong year for Dunkin’ Donuts U.S. restaurant expansion. Our franchisees added 291 net new Dunkin’ Donuts restaurants in 2012, making us one of the fastest growing QSR concepts by unit count.
Similar to previous years, more than 90 percent of our development was with existing franchisees. Franchisees also continued to invest in the Dunkin’ Donuts brand by completing 618 remodels. Over the past three years our franchisees have remodeled more than 1,700 Dunkin’ Donuts’ locations, bringing the average image age of the restaurant base to less than 5 years. We’ve had steady growth acceleration since 2010 and continue to implement our contiguous, strategic development approach. We’ve set the right development pace, one that capitalizes on our significant opportunity and strong franchisee demand, while ensuring that we’re choosing the right sites in the right markets at the right time, and maintaining the high financial return targets that we’ve set for new store economics.
It’s our confidence in this strategy that enabled us to begin selling franchises in Southern California in January of this year. It’s an exciting milestone, one that has been widely anticipated, and we look forward to the first Dunkin’ Donuts restaurant opening there in 2015.
Our focus on franchisee profitability isn’t limited to Dunkin’ Donuts U.S. We’re using what we’ve learned from Dunkin’ Donuts U.S. and applying it to our International business and Baskin-Robbins U.S.
And, we are beginning to see results from this focus.
42935.ai 3 3/25/13 11:56 AM42935.ai 3 3/25/13 11:56 AM
Innovation: The Heart of the Brand
Product Innovation is a huge contributor to our success – it’s deeply embedded in our heritage and continues to drive our growth today.
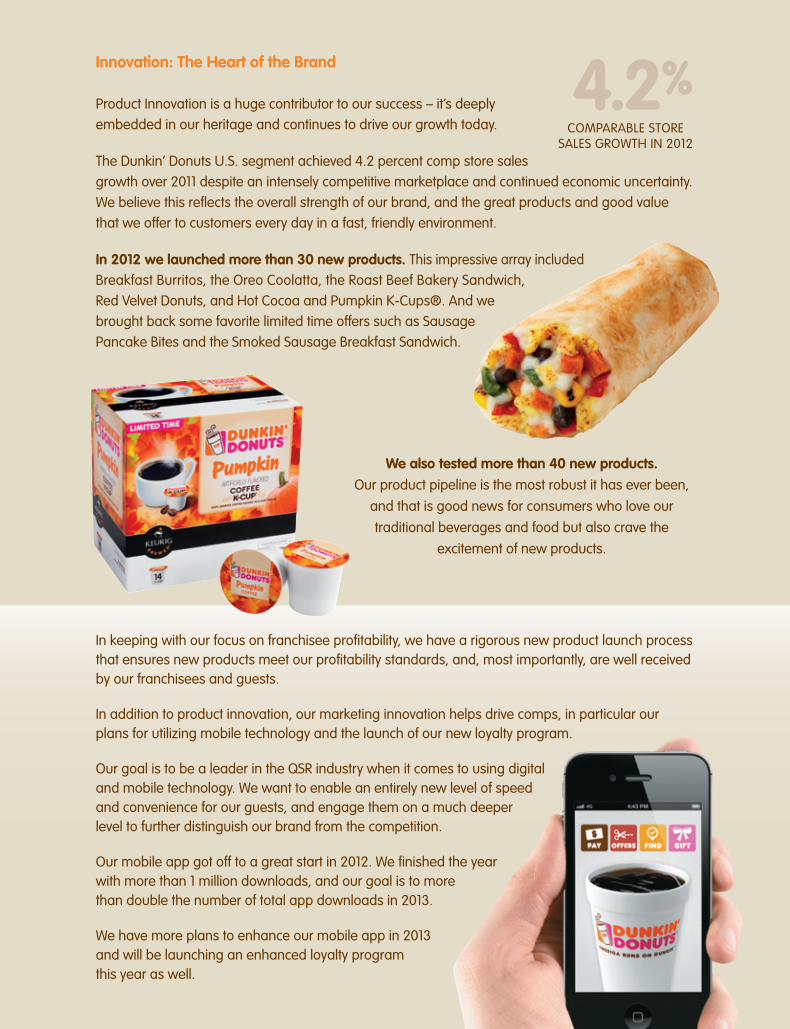
The Dunkin’ Donuts U.S. segment achieved 4.2 percent comp store sales growth over 2011 despite an intensely competitive marketplace and continued economic uncertainty. We believe this reflects the overall strength of our brand, and the great products and good value that we offer to customers every day in a fast, friendly environment.
In 2012 we launched more than 30 new products. This impressive array included Breakfast Burritos, the Oreo Coolatta, the Roast Beef Bakery Sandwich, Red Velvet Donuts, and Hot Cocoa and Pumpkin K-Cups®. And we brought back some favorite limited time offers such as Sausage Pancake Bites and the Smoked Sausage Breakfast Sandwich.
We also tested more than 40 new products. Our product pipeline is the most robust it has ever been,
and that is good news for consumers who love our traditional beverages and food but also crave the
excitement of new products.
In keeping with our focus on franchisee profitability, we have a rigorous new product launch process that ensures new products meet our profitability standards, and, most importantly, are well received by our franchisees and guests.
In addition to product innovation, our marketing innovation helps drive comps, in particular our plans for utilizing mobile technology and the launch of our new loyalty program.
Our goal is to be a leader in the QSR industry when it comes to using digital and mobile technology. We want to enable an entirely new level of speed and convenience for our guests, and engage them on a much deeper level to further distinguish our brand from the competition.
Our mobile app got off to a great start in 2012. We finished the year with more than 1 million downloads, and our goal is to more than double the number of total app downloads in 2013.
We have more plans to enhance our mobile app in 2013 and will be launching an enhanced loyalty program this year as well.
42935.ai 4 3/25/13 11:56 AM42935.ai 4 3/25/13 11:56 AM
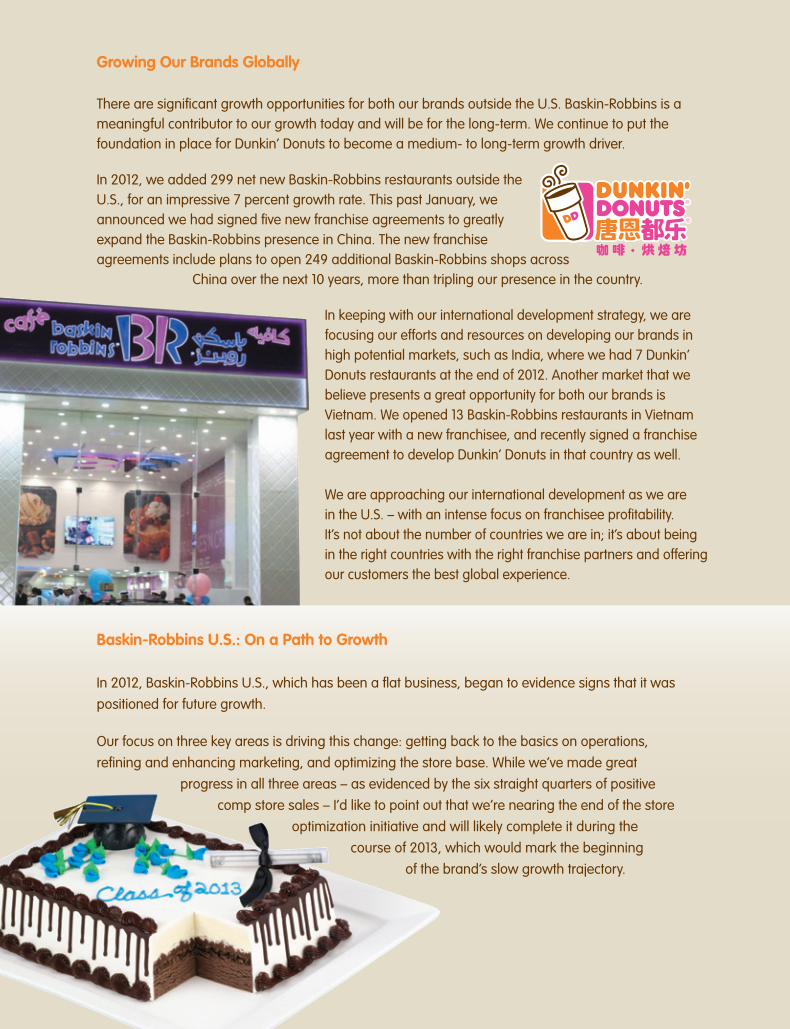
Growing Our Brands Globally
There are significant growth opportunities for both our brands outside the U.S. Baskin-Robbins is a meaningful contributor to our growth today and will be for the long-term. We continue to put the foundation in place for Dunkin’ Donuts to become a medium- to long-term growth driver. In 2012, we added 299 net new Baskin-Robbins restaurants outside the U.S., for an impressive 7 percent growth rate. This past January, we announced we had signed five new franchise agreements to greatly expand the Baskin-Robbins presence in China. The new franchise agreements include plans to open 249 additional Baskin-Robbins shops across China over the next 10 years, more than tripling our presence in the country.
Baskin-Robbins U.S.: On a Path to Growth In 2012, Baskin-Robbins U.S., which has been a flat business, began to evidence signs that it was positioned for future growth. Our focus on three key areas is driving this change: getting back to the basics on operations, refining and enhancing marketing, and optimizing the store base. While we’ve made great progress in all three areas – as evidenced by the six straight quarters of positive comp store sales – I’d like to point out that we’re nearing the end of the store optimization initiative and will likely complete it during the course of 2013, which would mark the beginning of the brand’s slow growth trajectory.
In keeping with our international development strategy, we are focusing our efforts and resources on developing our brands in high potential markets, such as India, where we had 7 Dunkin‘ Donuts restaurants at the end of 2012. Another market that we believe presents a great opportunity for both our brands is Vietnam. We opened 13 Baskin-Robbins restaurants in Vietnam last year with a new franchisee, and recently signed a franchise agreement to develop Dunkin’ Donuts in that country as well. We are approaching our international development as we are in the U.S. – with an intense focus on franchisee profitability. It’s not about the number of countries we are in; it’s about being in the right countries with the right franchise partners and offering our customers the best global experience.
42935.ai 5 3/25/13 11:56 AM42935.ai 5 3/25/13 11:56 AM

A Strong Platform for Continued Growth In 2012 we had an impressive 46 percent adjusted operating income margin, marking an approximately 300 basis point expansion over our already impressive 43 percent adjusted operating income margin in 2011. These results underscore the power of our franchised, asset-light business model. We’re committed to delivering 150 to 200 basis points of continued margin expansion annually over the next 3 to 5 years. Despite macro-economic instability and a tough competitive environment, consumer demand for our products remains high. Our franchisee relationships are strong. We have highly differentiated marketing, innovative products, a focus on operational excellence and a strong restaurant pipeline for future growth.
Combine all of this with our ability to leverage our asset-light business model, and we expect another year of 15 percent plus earnings per share growth. Thank you for your investment in Dunkin’ Brands. We look forward to continuing to deliver on our long-term targets and driving value for you, our shareholders.
Regards,
Nigel TravisChief Executive Officer, Dunkin’ Brands
42935.ai 6 3/25/13 11:56 AM42935.ai 6 3/25/13 11:56 AM
U.S. SECURITIES AND EXCHANGE COMMISSIONWashington, D.C. 20549
____________________________
FORM 10-KANNUAL REPORT PURSUANT TO SECTION 13 OR 15(d) OF THE SECURITIESEXCHANGE ACT OF 1934.
For the year ended December 29, 2012 OR
TRANSITION REPORT PURSUANT TO SECTION 13 OR 15(d) OF THE SECURITIESEXCHANGE ACT OF 1934.
For the transition period from to Commission file number 001-35258
____________________________
DUNKIN’ BRANDS GROUP, INC.(Exact name of registrant as specified in its charter)
Delaware 20-4145825(State or other jurisdiction of
incorporation or organization) (I.R.S. Employer
Identification No.)
130 Royall StreetCanton, Massachusetts 02021
(Address of principal executive offices) (zip code)
(781) 737-3000(Registrants’ telephone number, including area code)
____________________________ Securities registered pursuant to Section 12(b) of the Act:
Title of each class Name of each exchange on which registeredCommon Stock, $0.001 par value per share The NASDAQ Global Select Market
Securities registered pursuant to Section 12(g) of the Act: NONE____________________________
Indicate by check mark if the registrant is a well-known seasoned issuer, as defined in Rule 405 of the Securities Act. Yes No Indicate by check mark if the registrant is not required to file reports pursuant to Section 13 or Section 15(d) of the Act. Yes No Indicate by check mark whether the registrant (1) has filed all reports required to be filed by Section 13 or 15(d) of the Securities Exchange Act of 1934 during the preceding 12 months (or for such shorter period that the registrant was required to file such reports), and (2) has been subject to such filing requirements for the past 90 days. Yes No Indicate by check mark whether the registrant has submitted electronically and posted on its corporate Web site, if any, every Interactive Data File required to be submitted and posted pursuant to Rule 405 of Regulation S-T (§232.405 of this chapter) during the preceding 12 months (or for such shorter period that the registrant was required to submit and post such files). Yes No Indicate by check mark if disclosure of delinquent filers pursuant to Item 405 of Regulation S-K is not contained herein, and will not be contained, to the best of registrant’s knowledge, in definitive proxy or information statements incorporated by reference in Part III of this Form 10-K or any amendment to this Form 10-K. Indicate by check mark whether the registrant is a large accelerated filer, an accelerated filer, a non-accelerated filer, or a smaller reporting company. See the definitions of “large accelerated filer,” “accelerated filer” and “smaller reporting company” in Rule 12b-2 of the Exchange Act.
Large accelerated filer Accelerated filer
Non-accelerated filer Smaller Reporting Company
Indicate by check mark whether the registrant is a shell company (as defined in Rule 12b-2 of the Exchange Act). Yes No The aggregate market value of the voting and non-voting stock of the registrant held by non-affiliates of Dunkin’ Brands Group, Inc. computed by reference to the closing price of the registrant’s common stock on the NASDAQ Global Select Market as of June 30, 2012, was approximately $2.88 billion.
As of February 15, 2013, 106,273,454 shares of common stock of the registrant were outstanding.__________________________
DOCUMENTS INCORPORATED BY REFERENCEPortions of the registrant’s definitive Proxy Statement for the 2013 Annual Meeting of Stockholders to be filed with the Securities and Exchange
Commission pursuant to Regulation 14A not later than 120 days after the end of the fiscal year covered by this Form 10-K, are incorporated by reference in Part III, Items 10-14 of this Form 10-K.


DUNKIN’ BRANDS GROUP, INC. AND SUBSIDIARIES
TABLE OF CONTENTS
Page
Part I.Item 1.Item 1A.Item 1B.Item 2.Item 3.Item 4.
Part II.Item 5.
Item 6.Item 7.Item 7A.Item 8.Item 9.Item 9A.Item 9B.
Part III.Item 10.Item 11.Item 12.Item 13.Item 14.
Part IV.Item 15.
Business 1Risk Factors 9Unresolved Staff Comments 21Properties 21Legal Proceedings 22Mine Safety Disclosures 23
Market for Registrant’s Common Equity, Related Stockholder Matters and Issuer Purchases of Equity Securities
23
Selected Financial Data 25Management’s Discussion and Analysis of Financial Condition and Results of Operations 29Quantitative and Qualitative Disclosures about Market Risk 48Financial Statements and Supplementary Data 50Changes in and Disagreements with Accountants on Accounting and Financial Disclosure 93Controls and Procedures 93Other Information 94
Directors, Executive Officers and Corporate Governance 95Executive Compensation 96Security Ownership of Certain Beneficial Owners and Management and Related Stockholder Matters 96Certain Relationships and Related Transactions, and Director Independence 96Principal Accounting Fees and Services 96
Exhibits, Financial Statement Schedules 96
Forward-Looking Statements
This report on Form 10-K, as well as other written reports and oral statements that we make from time to time, includes statements that express our opinions, expectations, beliefs, plans, objectives, assumptions or projections regarding future events or future results and therefore are, or may be deemed to be, “forward-looking statements” within the meaning of Section 27A of the Securities Act of 1933, as amended, and Section 21E of the Securities Exchange Act of 1934, as amended. These forward-looking statements can generally be identified by the use of forward-looking terminology, including the terms “believes,” “estimates,” “anticipates,” “expects,” “seeks,” “projects,” “intends,” “plans,” “may,” “will” or “should” or, in each case, their negative or other variations or comparable terminology. These forward-looking statements include all matters that are not historical facts.
By their nature, forward-looking statements involve risks and uncertainties because they relate to events and depend on circumstances that may or may not occur in the future. Our actual results and the timing of certain events could differ materially from those anticipated in these forward-looking statements as a result of certain factors, including, but not limited to, those set forth under “Risk Factors” and elsewhere in this report and in our other public filings with the Securities and Exchange Commission, or SEC.
Although we base these forward-looking statements on assumptions that we believe are reasonable when made, we caution you that forward-looking statements are not guarantees of future performance and that our actual results of operations, financial condition and liquidity, and the development of the industry in which we operate may differ materially from those made in or suggested by the forward-looking statements contained in this report. In addition, even if our results of operations, financial condition and liquidity, and the development of the industry in which we operate, are consistent with the forward-looking statements contained in this report, those results or developments may not be indicative of results or developments in subsequent periods.
Given these risks and uncertainties, you are cautioned not to place undue reliance on these forward-looking statements, which speak only as of the date hereof. We undertake no obligation to update any forward-looking statements or to publicly announce the results of any revisions to any of those statements to reflect future events or developments.

-1-
PART I
Item 1. Business. Our Company We are one of the world's leading franchisors of quick service restaurants (“QSRs”) serving hot and cold coffee and baked goods, as well as hard serve ice cream. We franchise restaurants under our Dunkin' Donuts and Baskin-Robbins brands. With over 17,400 points of distribution in 55 countries, we believe that our portfolio has strong brand awareness in our key markets.
We believe that our nearly 100% franchised business model offers strategic and financial benefits. For example, because we do not own or operate a significant number of stores, our Company is able to focus on menu innovation, marketing, franchisee coaching and support, and other initiatives to drive the overall success of our brand. Financially, our franchised model allows us to grow our points of distribution and brand recognition with limited capital investment by us.
We operate our business in four segments: Dunkin' Donuts U.S., Dunkin' Donuts International, Baskin-Robbins International and Baskin-Robbins U.S. In 2012, our Dunkin' Donuts segments generated revenues of $500.9 million, or 78% of our total segment revenues, of which $485.4 million was in the U.S. segment and $15.5 million was in the international segment. In 2012, our Baskin-Robbins segments generated revenues of $144.1 million, of which $102.0 million was in the international segment and $42.1 million was in the U.S. segment. As of December 29, 2012, there were 10,479 Dunkin' Donuts points of distribution, of which 7,306 were in the U.S. and 3,173 were international, and 6,980 Baskin-Robbins points of distribution, of which 4,517 were international and 2,463 were in the U.S.
We generate revenue from five primary sources: (i) royalties and fees associated with franchised restaurants; (ii) rental income from restaurant properties that we lease or sublease to franchisees; (iii) sales of ice cream products to franchisees in certain international markets; (iv) sales at our company-owned restaurants, and (v) other income including fees for the licensing of the Dunkin' Donuts brand for products sold in non-franchised outlets (such as retail packaged coffee) and the licensing of the rights to manufacture Baskin-Robbins ice cream to a third party for ice cream and related products sold to U.S. franchisees; as well as refranchising gains, transfer fees from franchisees, and online training fees.
Our history Both of our brands have a rich heritage dating back to the 1940s, when Bill Rosenberg founded his first restaurant, subsequently renamed Dunkin' Donuts, and Burt Baskin and Irv Robbins each founded a chain of ice cream shops that eventually combined to form Baskin-Robbins. Baskin-Robbins and Dunkin' Donuts were individually acquired by Allied Domecq PLC in 1973 and 1989, respectively. The brands were organized under the Allied Domecq Quick Service Restaurants subsidiary, which was renamed Dunkin' Brands, Inc. in 2004. Allied Domecq was acquired in July 2005 by Pernod Ricard S.A. In March of 2006, we were acquired by investment funds affiliated with Bain Capital Partners, LLC, The Carlyle Group and Thomas H. Lee Partners, L.P. (collectively, the “Sponsors”) through a holding company that was incorporated in Delaware on November 22, 2005, and was later renamed Dunkin' Brands Group, Inc. In July 2011, we completed our initial public offering (the “IPO”). Upon the completion of the IPO, our common stock became listed on the NASDAQ Global Select Market under the symbol “DNKN.” As of December 29, 2012, the Sponsors had sold of all of their existing shares in the Company via secondary stock offerings during 2011 and 2012 and a share repurchase by the Company during 2012.
Our brandsDunkin' Donuts-U.S. Dunkin' Donuts is a leading U.S. QSR concept, and is among the QSR market leaders in coffee, donut, bagel, muffin and breakfast sandwich categories. Since the late 1980s, Dunkin' Donuts has transformed itself into a coffee and beverage-based concept, and is the national QSR leader in servings in the hot regular/decaf/flavored coffee category, with sales of over 1 billion servings of coffee annually. From the fiscal year ended August 31, 2002 to the fiscal year ended December 29, 2012, Dunkin' Donuts U.S. systemwide sales have grown at an 8.2% compound annual growth rate. Total U.S. Dunkin' Donuts points of distribution grew from 3,776 at August 31, 2002 to 7,306 as of December 29, 2012. Approximately 84% of these points of distribution are traditional restaurants consisting of end-cap, in-line and stand-alone restaurants, many with drive-thrus, and gas and convenience locations. In addition, we have alternative points of distribution ("APODs"), such as full- or self-service kiosks in grocery stores, hospitals, airports, offices and other smaller-footprint properties. We believe that Dunkin' Donuts continues to have significant growth potential in the U.S. given its strong brand awareness and variety of restaurant formats. For fiscal year 2012, the Dunkin' Donuts franchise system generated U.S. franchisee-reported sales of $6.2 billion, which accounted for approximately 71.2% of our global franchisee-reported sales, and had 7,306 U.S. points of distribution (including more than 3,300 restaurants with drive-thrus) at period end.

-2-
Baskin-Robbins-U.S. Baskin-Robbins is one of the leading QSR chains in the U.S. for servings of hard-serve ice cream and develops and sells a full range of frozen ice cream treats such as cones, cakes, sundaes and frozen beverages. Although the number of Baskin-Robbins stores in the U.S. has decreased in each year since 2008, Baskin-Robbins enjoys 91% aided brand awareness in the U.S., and we believe the brand is known for its innovative flavors, popular “Birthday Club” program and ice cream flavor library of over 1,000 different offerings. Additionally, our Baskin-Robbins U.S. segment has experienced comparable store sales growth in seven of the last eight quarters. We believe we can capitalize on the brand's strengths and generate renewed excitement for the brand. Baskin-Robbins' “31 flavors”, offering consumers a different flavor for each day of the month, is recognized by ice cream consumers nationwide. For fiscal year 2012, the Baskin-Robbins franchise system generated U.S. franchisee-reported sales of $509 million, which accounted for approximately 5.8% of our global franchisee-reported sales, and had 2,463 U.S. points of distribution at period end.
International operations Our international business is primarily conducted via joint ventures and country or territorial license arrangements with “master franchisees”, who both operate and sub-franchise the brand within their licensed areas. Our international franchise system, predominantly located across Asia and the Middle East, generated franchisee-reported sales of $2.0 billion for fiscal year 2012, which represented 23.0% of Dunkin' Brands' global franchisee-reported sales. Dunkin' Donuts had 3,173 restaurants in 31 countries (excluding the U.S.), representing $663 million of international franchisee-reported sales for fiscal year 2012, and Baskin-Robbins had 4,517 restaurants in 45 countries (excluding the U.S.), representing approximately $1.4 billion of international franchisee-reported sales for the same period. From August 31, 2002 to December 29, 2012, total international Dunkin' Donuts points of distribution grew from 1,605 to 3,173, and total international Baskin-Robbins points of distribution grew from 2,292 to 4,517. We believe that we have opportunities to continue to grow our Dunkin' Donuts and Baskin-Robbins concepts internationally in new and existing markets through brand and menu differentiation.
Overview of franchising Franchising is a business arrangement whereby a service organization, the franchisor, grants an operator, the franchisee, a license to sell the franchisor's products and services and use its system and trademarks in a given area, with or without exclusivity. In the context of the restaurant industry, a franchisee pays the franchisor for its concept, strategy, marketing, operating system, training, purchasing power and brand recognition.
Franchisee relationships We seek to maximize the alignment of our interests with those of our franchisees. For instance, we do not derive additional income through serving as the supplier to our domestic franchisees. In addition, because the ability to execute our strategy is dependent upon the strength of our relationships with our franchisees, we maintain a multi-tiered advisory council system to foster an active dialogue with franchisees. The advisory council system provides feedback and input on all major brand initiatives and is a source of timely information on evolving consumer preferences, which assists new product introductions and advertising campaigns.
Unlike certain other QSR franchise systems, we generally do not guarantee our franchisees' financing obligations. As of December 29, 2012, if all of our outstanding guarantees of franchisee financing obligations came due, we would be liable for $4.7 million. We intend to continue our past practice of limiting our guarantee of financing for franchisees.
Franchise agreement terms For each franchised restaurant, we enter into a franchise agreement covering a standard set of terms and conditions. A prospective franchisee may elect to open either a single-branded distribution point or a multi-branded distribution point. In addition, and depending upon the market, a franchisee may purchase the right to open a franchised restaurant at one or multiple locations (via a store development agreement, or “SDA”). When granting the right to operate a restaurant to a potential franchisee, we will generally evaluate the potential franchisee's prior food-service experience, history in managing profit and loss operations, financial history, and available capital and financing. We also evaluate potential new franchisees based on financial measures, including liquid asset and net worth minimums for each brand.
The typical franchise agreement in the U.S. has a 20-year term. The majority of our franchisees have entered into prime leases with a third-party landlord. The Company is the lessee on certain land leases (the Company leases the land and erects a building) or improved leases (lessor owns the land and building) covering restaurants and other properties. In addition, the Company has leased and subleased land and buildings to other franchisees. When we sublease properties to franchisees, the sublease generally follows the prime lease term structure. Our leases to franchisees are typically structured to provide a ten-year term and two five-year options to renew.

-3-
We help domestic franchisees select sites and develop restaurants that conform to the physical specifications of our typical restaurant. Each domestic franchisee is responsible for selecting a site, but must obtain site approval from us based on accessibility, visibility, proximity to other restaurants, and targeted demographic factors including population density and traffic patterns. Additionally, the franchisee must also refurbish and remodel each restaurant periodically (typically every five and ten years, respectively).
We currently require each domestic franchisee's managing owner and designated manager to complete initial and ongoing training programs provided by us, including minimum periods of classroom and on-the-job training. We monitor quality and endeavor to ensure compliance with our standards for restaurant operations through restaurant visits in the U.S. In addition, a formal restaurant review is conducted throughout our domestic operations at least once per year and comprises two separate restaurant visits. To complement these procedures, we use “Guest Satisfaction Surveys” in the U.S. to assess customer satisfaction with restaurant operations, such as product quality, restaurant cleanliness and customer service. Within each of our master franchisee and joint venture organizations, training facilities have been established by the master franchisee or joint venture based on our specifications. From those training facilities, the master franchisee or joint venture trains future staff members of the international restaurants. Our master franchisees and joint venture entities also periodically send their primary training managers to the U.S. for re-certification.
Store development agreements We grant domestic franchisees the right to open one or more restaurants within a specified geographic area pursuant to the terms of store development agreements ("SDAs"). An SDA specifies the number of restaurants and the mix of the brands represented by such restaurants that a franchisee is obligated to open. Each SDA also requires the franchisee to meet certain milestones in the development and opening of the restaurant and, if the franchisee meets those obligations, we agree, during the term of such SDA, not to operate or franchise new restaurants in the designated geographic area covered by such SDA. In addition to an SDA, a franchisee signs a separate franchise agreement for each restaurant developed under such SDA.
Master franchise model and international arrangements Master franchise arrangements are used on a limited basis domestically (the Baskin-Robbins brand has two “territory” franchise agreements for certain Midwestern and Northwestern markets) but more widely internationally for both the Baskin-Robbins brand and the Dunkin' Donuts brand. In addition, international arrangements include single unit franchises in Canada (both brands), the United Kingdom and Australia (Baskin-Robbins brand) as well as joint venture agreements in Korea (both brands) and Japan (Baskin-Robbins brand).
Master franchise agreements are the most prevalent international relationships for both brands. Under these agreements, the applicable brand grants the master franchisee the exclusive right to develop and operate a certain number of restaurants within a particular geographic area, such as selected cities, one or more provinces or an entire country, pursuant to a development schedule that defines the number of restaurants that the master franchisee must open annually. Those development schedules customarily extend for five to ten years. If the master franchisee fails to perform its obligations, the exclusivity provision of the agreement terminates and additional franchise agreements may be put in place to develop restaurants.
The master franchisee is required to pay an upfront initial franchise fee for each developed restaurant and, for the Dunkin' Donuts brand, royalties. For the Baskin-Robbins brand, the master franchisee is typically required to purchase ice cream from Baskin-Robbins or an approved supplier. In most countries, the master franchisee is also required to spend a certain percentage of gross sales on advertising in such foreign country in order to promote the brand. Generally, the master franchise agreement serves as the franchise agreement for the underlying restaurants operating pursuant to such model. Depending on the individual agreement, we may permit the master franchisee to subfranchise with its territory.
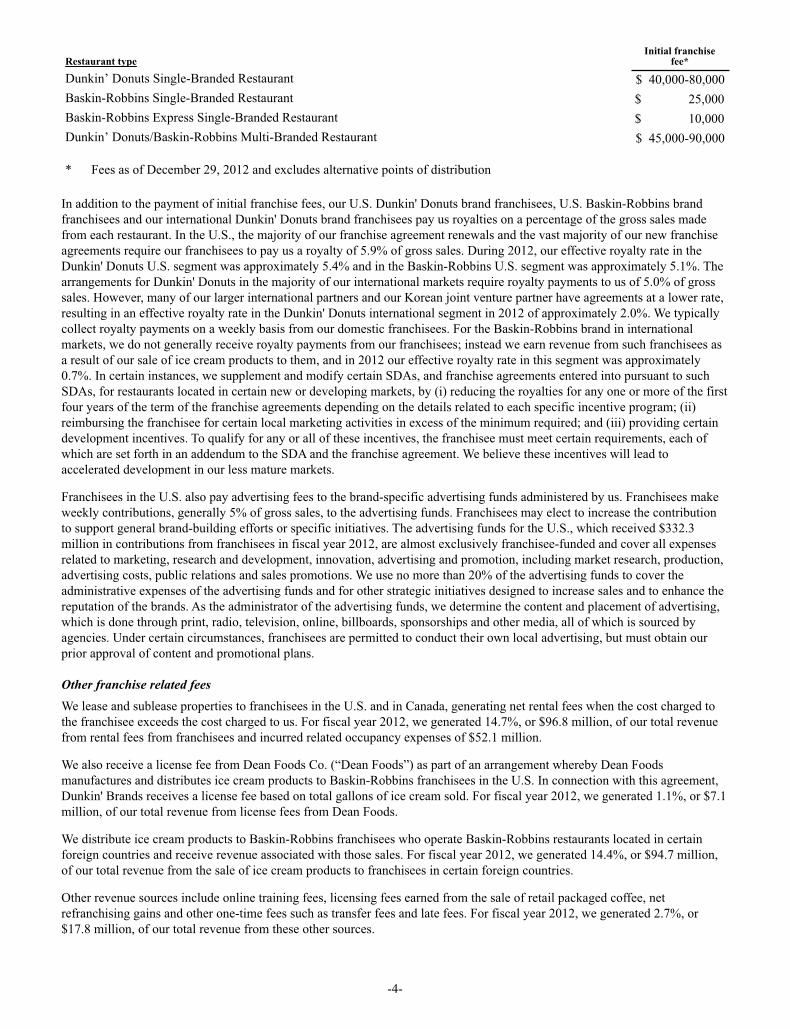
Franchise fees In the U.S., once a franchisee is approved, a restaurant site is approved and a franchise agreement is signed, the franchisee will begin to develop the restaurant. Franchisees pay us an initial franchise fee for the right to operate a restaurant for one or more franchised brands. The franchisee is required to pay all or part of the initial franchise fee upfront upon execution of the franchise agreement, regardless of when the restaurant is actually opened. Initial franchise fees vary by brand, type of development agreement and geographic area of development, but generally range from $10,000 to $90,000, as shown in the table below.
-4-
Restaurant typeInitial franchise
fee*
Dunkin’ Donuts Single-Branded Restaurant $ 40,000-80,000Baskin-Robbins Single-Branded Restaurant $ 25,000Baskin-Robbins Express Single-Branded Restaurant $ 10,000Dunkin’ Donuts/Baskin-Robbins Multi-Branded Restaurant $ 45,000-90,000
* Fees as of December 29, 2012 and excludes alternative points of distribution
In addition to the payment of initial franchise fees, our U.S. Dunkin' Donuts brand franchisees, U.S. Baskin-Robbins brand franchisees and our international Dunkin' Donuts brand franchisees pay us royalties on a percentage of the gross sales made from each restaurant. In the U.S., the majority of our franchise agreement renewals and the vast majority of our new franchise agreements require our franchisees to pay us a royalty of 5.9% of gross sales. During 2012, our effective royalty rate in the Dunkin' Donuts U.S. segment was approximately 5.4% and in the Baskin-Robbins U.S. segment was approximately 5.1%. The arrangements for Dunkin' Donuts in the majority of our international markets require royalty payments to us of 5.0% of gross sales. However, many of our larger international partners and our Korean joint venture partner have agreements at a lower rate, resulting in an effective royalty rate in the Dunkin' Donuts international segment in 2012 of approximately 2.0%. We typically collect royalty payments on a weekly basis from our domestic franchisees. For the Baskin-Robbins brand in international markets, we do not generally receive royalty payments from our franchisees; instead we earn revenue from such franchisees as a result of our sale of ice cream products to them, and in 2012 our effective royalty rate in this segment was approximately 0.7%. In certain instances, we supplement and modify certain SDAs, and franchise agreements entered into pursuant to such SDAs, for restaurants located in certain new or developing markets, by (i) reducing the royalties for any one or more of the first four years of the term of the franchise agreements depending on the details related to each specific incentive program; (ii) reimbursing the franchisee for certain local marketing activities in excess of the minimum required; and (iii) providing certain development incentives. To qualify for any or all of these incentives, the franchisee must meet certain requirements, each of which are set forth in an addendum to the SDA and the franchise agreement. We believe these incentives will lead to accelerated development in our less mature markets.
Franchisees in the U.S. also pay advertising fees to the brand-specific advertising funds administered by us. Franchisees make weekly contributions, generally 5% of gross sales, to the advertising funds. Franchisees may elect to increase the contribution to support general brand-building efforts or specific initiatives. The advertising funds for the U.S., which received $332.3 million in contributions from franchisees in fiscal year 2012, are almost exclusively franchisee-funded and cover all expenses related to marketing, research and development, innovation, advertising and promotion, including market research, production, advertising costs, public relations and sales promotions. We use no more than 20% of the advertising funds to cover the administrative expenses of the advertising funds and for other strategic initiatives designed to increase sales and to enhance the reputation of the brands. As the administrator of the advertising funds, we determine the content and placement of advertising, which is done through print, radio, television, online, billboards, sponsorships and other media, all of which is sourced by agencies. Under certain circumstances, franchisees are permitted to conduct their own local advertising, but must obtain our prior approval of content and promotional plans.
Other franchise related fees We lease and sublease properties to franchisees in the U.S. and in Canada, generating net rental fees when the cost charged to the franchisee exceeds the cost charged to us. For fiscal year 2012, we generated 14.7%, or $96.8 million, of our total revenue from rental fees from franchisees and incurred related occupancy expenses of $52.1 million.
We also receive a license fee from Dean Foods Co. (“Dean Foods”) as part of an arrangement whereby Dean Foods manufactures and distributes ice cream products to Baskin-Robbins franchisees in the U.S. In connection with this agreement, Dunkin' Brands receives a license fee based on total gallons of ice cream sold. For fiscal year 2012, we generated 1.1%, or $7.1 million, of our total revenue from license fees from Dean Foods.
We distribute ice cream products to Baskin-Robbins franchisees who operate Baskin-Robbins restaurants located in certain foreign countries and receive revenue associated with those sales. For fiscal year 2012, we generated 14.4%, or $94.7 million, of our total revenue from the sale of ice cream products to franchisees in certain foreign countries.
Other revenue sources include online training fees, licensing fees earned from the sale of retail packaged coffee, net refranchising gains and other one-time fees such as transfer fees and late fees. For fiscal year 2012, we generated 2.7%, or $17.8 million, of our total revenue from these other sources.

-5-
International operations Our international business is organized by brand and by country and/or region. Operations are primarily conducted through master franchise agreements with local operators. In certain instances, the master franchisee may have the right to sub-franchise. In addition, in Japan and South Korea we have joint ventures with local companies for the Baskin-Robbins brand, and in the case of South Korea, for the Dunkin' Donuts brand as well. By teaming with local operators, we believe we are better able to adapt our concepts to local business practices and consumer preferences. We have had an international presence since 1961 when the first Dunkin' Donuts restaurant opened in Canada. As of December 29, 2012, there were 4,517 Baskin-Robbins restaurants in 45 countries outside the U.S. and 3,173 Dunkin' Donuts restaurants in 31 countries outside the U.S. Baskin-Robbins points of distribution represent the majority of our international presence and accounted for 67% of international franchisee-reported sales and 87% of our international revenues for fiscal year 2012.
Our key markets for both brands are predominantly based in Asia and the Middle East, which accounted for approximately 73.8% and 13.6%, respectively, of international franchisee-reported sales for fiscal year 2012. For fiscal year 2012, $2.0 billion of total franchisee-reported sales were generated by restaurants located in international markets, which represented 23.0% of total franchisee-reported sales, with the Dunkin' Donuts brand accounting for $663 million and the Baskin-Robbins brand accounting for $1.4 billion of our international franchisee-reported sales. For the same period, our revenues from international operations totaled $117.5 million, with the Baskin-Robbins brand generating approximately 87% of such revenues.
Overview of key markets As of December 29, 2012, the top foreign countries and regions in which the Dunkin' Donuts brand and/or the Baskin-Robbins brand operated were:
Country Type Franchised brand(s) Number of restaurants
South Korea Joint Venture Dunkin’ Donuts 883Baskin-Robbins 1,020
Japan Joint Venture Baskin-Robbins 1,127Middle East Master Franchise Agreements Dunkin’ Donuts 292
Baskin-Robbins 637
South Korea Restaurants in South Korea accounted for approximately 36% of total franchisee-reported sales from international operations for fiscal year 2012. Baskin-Robbins accounted for 58% of such sales. In South Korea, we conduct business through a 33.3% ownership stake in a combination Dunkin' Donuts brand/Baskin-Robbins brand joint venture, with South Korean shareholders owning the remaining 66.7% of the joint venture. The joint venture acts as the master franchisee for South Korea, sub-franchising the Dunkin' Donuts and Baskin-Robbins brands to franchisees. There are 1,020 Baskin-Robbins restaurants and 883 Dunkin' Donuts restaurants located in South Korea as of December 29, 2012. The joint venture also manufactures and supplies the franchisees operating restaurants located in South Korea with ice cream, donuts and coffee products.
Japan Restaurants in Japan accounted for approximately 27% of total franchisee-reported sales from international operations for fiscal year 2012, 100% of which came from Baskin-Robbins. We conduct business in Japan through a 43.3% ownership stake in a Baskin-Robbins brand joint venture. Our partner also owns a 43.3% interest in the joint venture, with the remaining 13.4% owned by public shareholders. There were 1,127 Baskin-Robbins restaurants located in Japan as of December 29, 2012, with the joint venture manufacturing and selling ice cream to franchisees operating restaurants in Japan and acting as master franchisee for the country.
Middle East The Middle East represents another key region for us. Restaurants in the Middle East accounted for approximately 14% of total franchisee-reported sales from international operations for fiscal year 2012. Baskin-Robbins accounted for approximately 75% of such sales. We conduct operations in the Middle East through master franchise arrangements.
Industry overview According to Technomic Information Services (“Technomic”), the QSR segment of the U.S. restaurant industry accounted for approximately $154 billion of the total $370 billion restaurant industry sales in the U.S. in 2011. The U.S. restaurant industry is generally categorized into segments by price point ranges, the types of food and beverages offered, and service available to
-6-
consumers. QSR is a restaurant format characterized by counter or drive-thru ordering and limited, or no, table service. QSRs generally seek to capitalize on consumer desires for quality and convenient food at economical prices. Technomic reports that, in 2011, QSRs comprised nine of the top ten chain restaurants by U.S. systemwide sales and ten of the top ten chain restaurants by number of units.
Our Dunkin' Donuts brand competes in the QSR segment categories and subcategories that include coffee, donuts, muffins, bagels and breakfast sandwiches. In addition, in the U.S., our Dunkin' Donuts brand has historically focused on the breakfast daypart, which we define to include the portion of each day from 5:00 a.m. until 11:00 a.m. While, according to The NPD Group/CREST® (“CREST®”) data, the compound annual growth rate for total QSR daypart visits in the U.S. has been flat over the five-year period ended December 2012, the compound annual growth rate for QSR visits in the U.S. during the breakfast daypart averaged 1% over the same five-year period. There can be no assurance that such growth rates will be sustained in the future.
For the twelve months ended December 2012, there were sales of nearly 7.5 billion restaurant servings of coffee in the U.S., 81% of which were attributable to the QSR segment, according to CREST® data. Over the years, our Dunkin' Donuts brand has evolved into a predominantly coffee-based concept, with approximately 58% of Dunkin' Donuts' U.S. franchisee-reported sales for fiscal year 2012 generated from coffee and other beverages. We believe QSRs, including Dunkin' Donuts, are positioned to capture additional coffee market share through an increased focus on coffee offerings.
Our Baskin-Robbins brand competes primarily in QSR segment categories and subcategories that include hard-serve ice cream as well as those that include soft serve ice cream, frozen yogurt, shakes, malts and floats. While both of our brands compete internationally, over 64% of Baskin-Robbins restaurants are located outside of the U.S. and represent the majority of our total international sales and points of distribution.
Competition We compete primarily in the QSR segment of the restaurant industry and face significant competition from a wide variety of restaurants, convenience stores and other outlets that provide consumers with coffee, baked goods, sandwiches and ice cream on an international, national, regional and local level. We believe that we compete based on, among other things, product quality, restaurant concept, service, convenience, value perception and price. Our competition continues to intensify as competitors increase the breadth and depth of their product offerings, particularly during the breakfast daypart, and open new units. Although new competitors may emerge at any time due to the low barriers to entry, our competitors include: 7-Eleven, Burger King, Cold Stone Creamery, Dairy Queen, McDonald's, Quick Trip, Starbucks, Subway, Tim Hortons, WaWa and Wendy's, among others. Additionally, we compete with QSRs, specialty restaurants and other retail concepts for prime restaurant locations and qualified franchisees.
Licensing We derive licensing revenue from agreements with Dean Foods for domestic ice cream sales, with The J.M. Smucker Co. (“Smuckers”) for the sale of packaged coffee in non-franchised outlets (primarily grocery retail) as well as from other licensees. Dean Foods manufactures and sells ice cream to U.S. Baskin-Robbins brand franchisees and pays us a royalty on each gallon sold. The Dunkin' Donuts branded 12 oz. original blend coffee, which is distributed by Smuckers, is the #1 stock-keeping unit nationally in the premium coffee category. According to Nielsen, for the 52 weeks ending December 29, 2012, sales of our 12 oz. original blend, as expressed in total equivalent units and dollar sales, were double that of the next closest competitor.
Marketing We coordinate domestic advertising and marketing at the national and local levels. The goals of our marketing strategy include driving comparable store sales and brand differentiation, increasing our total coffee and beverage sales, protecting and growing our morning daypart sales, and growing our afternoon daypart sales. Generally, our domestic franchisees contribute 5% of weekly gross retail sales to fund brand specific advertising funds. The funds are used for various national and local advertising campaigns including print, radio, television, online, mobile, billboards and sponsorships. Over the past ten years, our U.S. franchisees have invested approximately $2.1 billion on advertising to increase brand awareness and restaurant performance across both brands. Additionally, we have various pricing strategies, so that our products appeal to a broad range of customers. In August 2012, we launched the Dunkin' Donuts mobile application for payment and gifting, enabling us to engage in one-to-one marketing with our customers. As of December 29, 2012, our mobile application had over one million downloads.
-7-
The supply chain Domestic We do not typically supply products to our domestic franchisees. With the exception of licensing fees paid by Dean Foods on domestic ice cream sales, we do not typically derive revenues from product distribution. Our franchisees' suppliers include Rich Products Corp., Dean Foods Co., The Coca-Cola Company and Green Mountain Coffee Roasters, Inc. In addition, our franchisees' primary coffee roasters currently are New England Tea & Coffee Co., Inc., Mother Parkers Tea & Coffee Inc., S&D Coffee, Inc. and Massimo Zanetti Beverage USA, Inc., and their primary donut mix suppliers currently are General Mills, Inc., Harlan Foods, and Aryzta. Our franchisees also purchase donut mix from CSM Bakery Products NA, Inc. and EFCO Products, Inc. We periodically review our relationships with licensees and approved suppliers and evaluate whether those relationships continue to be on competitive or advantageous terms for us and our franchisees.
Purchasing Purchasing for the Dunkin' Donuts brand is facilitated by National DCP, LLC (the “NDCP”), which is a Delaware limited liability company operated as a cooperative owned by its franchisee members. The NDCP is managed by a staff of supply chain professionals who report directly to the NDCP's Executive Management Team, members of which in turn report directly to the NDCP's Board of Directors. The NDCP has over 1,100 employees including executive leadership, sourcing professionals, warehouse staff, and drivers. The NDCP Board has eight franchisee members. In addition, the Senior Vice President, Chief Supply Officer from Dunkin' Brands, Inc. is a voting member of the NDCP board. The NDCP engages in purchasing, warehousing and distribution of food and supplies on behalf of participating restaurants and some international markets. The NDCP program provides franchisee members nationwide the benefits of scale while fostering consistent product quality across the Dunkin' Donuts brand. We do not control the NDCP and have only limited contractual rights associated with supplier certification, quality assurance and protection of our intellectual property.
Manufacturing of Dunkin' Donuts bakery goods Centralized production is another element of our supply chain that is designed to support growth for the Dunkin' Donuts brand. Centralized manufacturing locations (CMLs) are franchisee-owned and -operated facilities for the centralized production of donuts and bakery goods. The CMLs deliver freshly baked products to Dunkin' Donuts restaurants on a daily basis and are designed to provide consistent quality products while simplifying restaurant-level operations. As of December 29, 2012, there were 127 CMLs (of varying size and capacity) in the U.S. CMLs are an important part of franchise economics, and we believe the brand is supportive of profit building initiatives as well as protecting brand quality standards and consistency.
Certain of our Dunkin' Donuts brand restaurants produce donuts and bakery goods on-site rather than relying upon CMLs. Many of such restaurants, known as full producers, also supply other local Dunkin' Donuts restaurants that do not have access to CMLs. In addition, in newer markets, Dunkin' Donuts brand restaurants rely on donuts and bakery goods that are finished in restaurants. We believe that this “just baked on demand” donut manufacturing platform enables the Dunkin' Donuts brand to more efficiently expand its restaurant base in newer markets where franchisees may not have access to a CML.
Baskin-Robbins ice cream Prior to 2000, we manufactured and sold ice cream products to substantially all of our Baskin-Robbins brand franchisees. Beginning in 2000, we made the strategic decision to outsource the manufacturing and distribution of ice cream products for the domestic Baskin-Robbins brand franchisees to Dean Foods. The transition to this outsourcing arrangement was completed in 2003. We believe that this outsourcing arrangement was an important strategic shift and served the dual purpose of further strengthening our relationships with franchisees and allowing us to focus on our core franchising operations.
International Dunkin' Donuts International Dunkin' Donuts franchisees are responsible for sourcing their own supplies, subject to compliance with our standards. They also produce their own donuts following the Dunkin' Donuts brand's approved processes. In certain countries, our international franchisees source virtually everything locally within their market while in others our international franchisees may source virtually everything from the NDCP. Where supplies are sourced locally, we help identify and approve those suppliers. Supplies that cannot be sourced locally are sourced through the NDCP. In addition, we assist our international franchisees in identifying regional and global suppliers with the goal of leveraging the purchasing volume for pricing and product continuity advantages.
-8-
Baskin-Robbins The Baskin-Robbins manufacturing network is comprised of 9 facilities, none of which are owned or operated by us, that supply our international markets with ice cream products. We utilize a facility owned by Dean Foods to produce ice cream products which we purchase and distribute to many of our international markets. Certain international franchisees rely on third party-owned facilities to supply ice cream products to them, including facilities in Ireland and Canada. The Baskin-Robbins brand restaurants in India and Russia are supported by master franchisee-owned facilities in those respective countries while the restaurants in Japan and South Korea are supported by the joint venture-owned facilities located within each country.
Research and development New product innovation is a critical component of our success. We believe the development of successful new products for each brand attracts new customers, increases comparable store sales and allows franchisees to expand into other dayparts. New product research and development is located in a state-of-the-art facility at our headquarters in Canton, Massachusetts. The facility includes a sensory lab, a quality assurance lab and a demonstration test kitchen. We rely on our internal culinary team, which uses consumer research, to develop and test new products.
Operational support Substantially all of our executive management, finance, marketing, legal, technology, human resources and operations support functions are conducted from our global headquarters in Canton, Massachusetts. In the U.S. and Canada, our franchise operations for both brands are organized into regions, each of which is headed by a regional vice president and directors of operations supported by field personnel who interact directly with the franchisees. Our international businesses, excluding Canada, are organized by brand, and each brand has dedicated marketing and restaurant operations support teams. These teams, which are organized by geographic regions, work with our master licensees and joint venture partners to improve restaurant operations and restaurant-level economics. Management of a franchise restaurant is the responsibility of the franchisee, who is trained in our techniques and is responsible for ensuring that the day-to-day operations of the restaurant are in compliance with our operating standards. We have implemented a computer-based disaster recovery program to address the possibility that a natural (or other form of) disaster may impact the IT systems located at our Canton, Massachusetts headquarters.
Regulatory matters Domestic We and our franchisees are subject to various federal, state and local laws affecting the operation of our respective businesses, including various health, sanitation, fire and safety standards. In some jurisdictions our restaurants are required by law to display nutritional information about our products. Each restaurant is subject to licensing and regulation by a number of governmental authorities, which include zoning, health, safety, sanitation, building and fire agencies in the jurisdiction in which the restaurant is located. Franchisee-owned NDCP and CMLs are licensed and subject to similar regulations by federal, state and local governments.
We and our franchisees are also subject to the Fair Labor Standards Act and various other laws governing such matters as minimum wage requirements, overtime and other working conditions and citizenship requirements. A significant number of food-service personnel employed by franchisees are paid at rates related to the federal minimum wage.
Our franchising activities are subject to the rules and regulations of the Federal Trade Commission (“FTC”) and various state laws regulating the offer and sale of franchises. The FTC's franchise rule and various state laws require that we furnish a franchise disclosure document (“FDD”) containing certain information to prospective franchisees and a number of states require registration of the FDD with state authorities. We are operating under exemptions from registration in several states based on our experience and aggregate net worth. Substantive state laws that regulate the franchisor-franchisee relationship exist in a substantial number of states, and bills have been introduced in Congress from time to time that would provide for federal regulation of the franchisor-franchisee relationship. The state laws often limit, among other things, the duration and scope of non-competition provisions, the ability of a franchisor to terminate or refuse to renew a franchise and the ability of a franchisor to designate sources of supply. We believe that our FDDs for each of our Dunkin' Donuts brand and our Baskin-Robbins brand, together with any applicable state versions or supplements, and franchising procedures, comply in all material respects with both the FTC franchise rule and all applicable state laws regulating franchising in those states in which we have offered franchises.
International Internationally, we and our franchisees are subject to national and local laws and regulations that often are similar to those affecting us and our franchisees in the U.S., including laws and regulations concerning franchises, labor, health, sanitation and
-9-
safety. International Baskin-Robbins brand and Dunkin' Donuts brand restaurants are also often subject to tariffs and regulations on imported commodities and equipment, and laws regulating foreign investment. We believe that the international disclosure statements, franchise offering documents and franchising procedures for our Baskin-Robbins brand and Dunkin' Donuts brand comply in all material respects with the laws of the applicable countries.
Environmental Our operations, including the selection and development of the properties we lease and sublease to our franchisees and any construction or improvements we make at those locations, are subject to a variety of federal, state and local laws and regulations, including environmental, zoning and land use requirements. Our properties are sometimes located in developed commercial or industrial areas and might previously have been occupied by more environmentally significant operations, such as gasoline stations and dry cleaners. Environmental laws sometimes require owners or operators of contaminated property to remediate that property, regardless of fault. While we have been required to, and are continuing to, clean up contamination at a limited number of our locations, we have no known material environmental liabilities.
Employees As of December 29, 2012, excluding employees at our company-owned restaurants, we employed 1,104 people, 1,060 of whom were based in the U.S. and 44 of whom were based in other countries. Of our domestic employees, 457 worked in the field and 603 worked at our corporate headquarters or our satellite office in California. Of these employees, 167, who are almost exclusively in marketing positions, were paid by certain of our advertising funds. None of our employees are represented by a labor union, and we believe our relationships with our employees are healthy.
Our franchisees are independent business owners, so they and their employees are not included in our employee count.
Additional Information The Company makes available, free of charge, through its internet website www.dunkinbrands.com, its annual report on Form 10-K, quarterly reports on Form 10-Q, current reports on Form 8-K, proxy statements and amendments to those reports filed or furnished pursuant to Section 13(a) or 15(d) of the Securities Exchange Act of 1934, as amended, as soon as reasonably practicable after electronically filing such material with the Securities and Exchange Commission. You may read and copy any materials filed with the Securities and Exchange Commission at the Securities and Exchange Commission's Public Reference Room at 100 F Street, NE, Washington, DC 20549. You may obtain information on the operation of the Public Reference Room by calling the Securities and Exchange Commission at 1-800-SEC-0330. This information is also available at www.sec.gov. The reference to these website addresses does not constitute incorporation by reference of the information contained on the websites and should not be considered part of this document.
Item 1A. Risk Factors.
Risks related to our business and industry
Our financial results are affected by the operating results of our franchisees.
We receive a substantial majority of our revenues in the form of royalties, which are generally based on a percentage of gross sales at franchised restaurants, rent and other fees from franchisees. Accordingly, our financial results are to a large extent dependent upon the operational and financial success of our franchisees. If sales trends or economic conditions worsen for franchisees, their financial results may deteriorate and our royalty, rent and other revenues may decline and our accounts receivable and related allowance for doubtful accounts may increase. In addition, if our franchisees fail to renew their franchise agreements, our royalty revenues may decrease which in turn could materially and adversely affect our business and operating results.
Our franchisees could take actions that could harm our business.
Our franchisees are contractually obligated to operate their restaurants in accordance with the operations, safety and health standards set forth in our agreements with them. However, franchisees are independent third parties whom we do not control. The franchisees own, operate and oversee the daily operations of their restaurants. As a result, the ultimate success and quality of any franchised restaurant rests with the franchisee. If franchisees do not successfully operate restaurants in a manner consistent with required standards, franchise fees paid to us and royalty income will be adversely affected and brand image and reputation could be harmed, which in turn could materially and adversely affect our business and operating results.

-10-
Although we believe we generally enjoy a positive working relationship with the vast majority of our franchisees, active and/or potential disputes with franchisees could damage our brand reputation and/or our relationships with the broader franchisee group.
Sub-franchisees could take actions that could harm our business and that of our master franchisees.
In certain of our international markets, we enter into agreements with master franchisees that permit the master franchisee to develop and operate restaurants in defined geographic areas. As permitted by our master franchisee agreements, certain master franchisees elect to sub-franchise rights to develop and operate restaurants in the geographic area covered by the master franchisee agreement. Our master franchisee agreements contractually obligate our master franchisees to operate their restaurants in accordance with specified operations, safety and health standards and also require that any sub-franchise agreement contain similar requirements. However, we are not party to the agreements with the sub-franchisees and, as a result, are dependent upon our master franchisees to enforce these standards with respect to sub-franchised restaurants. As a result, the ultimate success and quality of any sub-franchised restaurant rests with the master franchisee. If sub-franchisees do not successfully operate their restaurants in a manner consistent with required standards, franchise fees and royalty income paid to the applicable master franchisee and, ultimately, to us could be adversely affected and our brand image and reputation may be harmed, which could materially and adversely affect our business and operating results.
Our success depends substantially on the value of our brands.
Our success is dependent in large part upon our ability to maintain and enhance the value of our brands, our customers' connection to our brands and a positive relationship with our franchisees. Brand value can be severely damaged even by isolated incidents, particularly if the incidents receive considerable negative publicity or result in litigation. Some of these incidents may relate to the way we manage our relationship with our franchisees, our growth strategies, our development efforts in domestic and foreign markets, or the ordinary course of our, or our franchisees', business. Other incidents may arise from events that are or may be beyond our ability to control and may damage our brands, such as actions taken (or not taken) by one or more franchisees or their employees relating to health, safety, welfare or otherwise; litigation and claims; security breaches or other fraudulent activities associated with our electronic payment systems; and illegal activity targeted at us or others. Consumer demand for our products and our brands' value could diminish significantly if any such incidents or other matters erode consumer confidence in us or our products, which would likely result in lower sales and, ultimately, lower royalty income, which in turn could materially and adversely affect our business and operating results.
The quick service restaurant segment is highly competitive, and competition could lower our revenues.
The QSR segment of the restaurant industry is intensely competitive. The beverage and food products sold by our franchisees compete directly against products sold at other QSRs, local and regional beverage and food operations, specialty beverage and food retailers, supermarkets and wholesale suppliers, many bearing recognized brand names and having significant customer loyalty. In addition to the prevailing baseline level of competition, major market players in noncompeting industries may choose to enter the restaurant industry. Key competitive factors include the number and location of restaurants, quality and speed of service, attractiveness of facilities, effectiveness of advertising, marketing and operational programs, price, demographic patterns and trends, consumer preferences and spending patterns, menu diversification, health or dietary preferences and perceptions and new product development. Some of our competitors have substantially greater financial and other resources than us, which may provide them with a competitive advantage. In addition, we compete within the restaurant industry and the QSR segment not only for customers but also for qualified franchisees. We cannot guarantee the retention of any, including the top-performing, franchisees in the future, or that we will maintain the ability to attract, retain, and motivate sufficient numbers of franchisees of the same caliber, which could materially and adversely affect our business and operating results. If we are unable to maintain our competitive position, we could experience lower demand for products, downward pressure on prices, the loss of market share and the inability to attract, or loss of, qualified franchisees, which could result in lower franchise fees and royalty income, and materially and adversely affect our business and operating results.
We cannot predict the impact that the following may have on our business: (i) new or improved technologies, (ii) alternative methods of delivery or (iii) changes in consumer behavior facilitated by these technologies and alternative methods of delivery.
Advances in technologies or alternative methods of delivery, including advances in vending machine technology and home coffee makers, or certain changes in consumer behavior driven by these or other technologies and methods of delivery could have a negative effect on our business. Moreover, technology and consumer offerings continue to develop, and we expect that new or enhanced technologies and consumer offerings will be available in the future. We may pursue certain of those technologies and consumer offerings if we believe they offer a sustainable customer proposition and can be successfully integrated into our business model. However, we cannot predict consumer acceptance of these delivery channels or their impact
-11-
on our business. In addition, our competitors, some of whom have greater resources than us, may be able to benefit from changes in technologies or consumer acceptance of alternative methods of delivery, which could harm our competitive position. There can be no assurance that we will be able to successfully respond to changing consumer preferences, including with respect to new technologies and alternative methods of delivery, or to effectively adjust our product mix, service offerings and marketing and merchandising initiatives for products and services that address, and anticipate advances in, technology and market trends. If we are not able to successfully respond to these challenges, our business, financial condition and operating results could be harmed.
Economic conditions adversely affecting consumer discretionary spending may negatively impact our business and operating results.
We believe that our franchisees' sales, customer traffic and profitability are strongly correlated to consumer discretionary spending, which is influenced by general economic conditions, unemployment levels and the availability of discretionary income. Negative consumer sentiment in the wake of the economic downturn has been widely reported over the past four years and may continue in 2013. Our franchisees' sales are dependent upon discretionary spending by consumers; any reduction in sales at franchised restaurants will result in lower royalty payments from franchisees to us and adversely impact our profitability. If the economic downturn continues for a prolonged period of time or becomes more pervasive, our business and results of operations could be materially and adversely affected. In addition, the pace of new restaurant openings may be slowed and restaurants may be forced to close, reducing the restaurant base from which we derive royalty income. As long as the weak economic environment continues, our franchisees' sales and profitability and our overall business and operating results could be adversely affected.
Our substantial indebtedness could adversely affect our financial condition.
We have a significant amount of indebtedness. As of December 29, 2012, we had total indebtedness of approximately $1.9 billion, excluding $11.5 million of undrawn letters of credit and $88.5 million of unused commitments under our senior credit facility.
Subject to the limits contained in the credit agreement governing our senior credit facility and our other debt instruments, we may be able to incur substantial additional debt from time to time to finance working capital, capital expenditures, investments or acquisitions, or for other purposes. If we do so, the risks related to our high level of debt could intensify. Specifically, our high level of debt could have important consequences, including:
• limiting our ability to obtain additional financing to fund future working capital, capital expenditures, acquisitions or other general corporate requirements;
• requiring a substantial portion of our cash flow to be dedicate to debt service payments instead of other purposes, thereby reducing the amount of cash flow available for working capital, capital expenditures, acquisitions and other general corporate purposes;
• increasing our vulnerability to adverse changes in general economic, industry and competitive conditions;
• exposing us to the risk of increased interest rates as certain of our borrowings, including borrowings under the senior credit facility, are at variable rates of interest;
• limiting our flexibility in planning for and reacting to changes in the industry in which we compete;
• placing us at a disadvantage compared to other, less leveraged competitors or competitors with comparable debt at more favorable interest rates; and
• increasing our costs of borrowing.
Our variable rate debt exposes us to interest rate risk which could adversely affect our cash flow.
The borrowings under our senior credit facility bear interest at variable rates. Other debt we incur also could be variable rate debt. If market interest rates increase, variable rate debt will create higher debt service requirements, which could adversely affect our cash flow. In September 2012, we entered into variable-to-fixed interest rate swap agreements to hedge the floating interest rate on $900.0 million notional amount of our outstanding term loan borrowings. While these agreements limit our exposure to higher interest rates, they do not offer complete protection from this risk given the total amount of our outstanding variable rate indebtedness.

-12-
The terms of our indebtedness restrict our current and future operations, particularly our ability to respond to changes or to take certain actions.
The credit agreement governing our senior credit facility contains a number of restrictive covenants that impose significant operating and financial restrictions on us and may limit our ability to engage in acts that may be in our long-term best interest, including restrictions on our ability to:
• incur certain liens;
• incur additional indebtedness and guarantee indebtedness;
• pay dividends or make other distributions in respect of, or repurchase or redeem, capital stock;
• prepay, redeem or repurchase certain debt;
• make investments, loans, advances and acquisition;
• sell or otherwise dispose of assets, including capital stock of our subsidiaries;
• enter into transactions with affiliates;
• alter the business we conduct;
• enter into agreements restricting our subsidiaries' ability to pay dividends; and
• consolidate, merge or sell all or substantially all of our assets.
In addition, the restrictive covenants in the credit agreement governing our senior credit facility require us to maintain specified financial ratios and satisfy other financial condition tests. Our ability to meet those financial ratios and tests can be affected by events beyond our control.
A breach of the covenants under the credit agreement governing our senior credit facility could result in an event of default under the applicable indebtedness. Such a default may allow the creditors to accelerate the related debt and may result in the acceleration of any other debt to which a cross-acceleration or cross-default provision applies, including our interest rate swap agreements. In addition, an event of default under the credit agreement governing our senior credit facility would permit the lenders under our senior credit facility to terminate all commitments to extend further credit under that facility. Furthermore, if we were unable to repay the amounts due and payable under our senior credit facility, those lenders could proceed against the collateral granted to them to secure that indebtedness, which could force us into bankruptcy or liquidation. In the event our lenders accelerate the repayment of our borrowings, we and our subsidiaries may not have sufficient assets to repay that indebtedness.
If our operating performance declines, we may in the future need to obtain waivers from the required lenders under our senior credit facility to avoid being in default. If we breach our covenants under our senior credit facility and seek a waiver, we may not be able to obtain a waiver from the required lenders. If this occurs we would be in default under our senior credit facility, the lenders could exercise their rights, as described above, and we could be forced into bankruptcy or liquidation. See “Management's discussion and analysis of financial condition and results of operations—Liquidity and capital resources,” and “Description of indebtedness.”
Infringement, misappropriation or dilution of our intellectual property could harm our business.
We regard our Dunkin' Donuts® and Baskin-Robbins® trademarks as having significant value and as being important factors in the marketing of our brands. We have also obtained trademark protection for several of our product offerings and advertising slogans, including “America Runs on Dunkin' ® ” and “What are you Drinkin'? ® ” . We believe that these and other intellectual property are valuable assets that are critical to our success. We rely on a combination of protections provided by contracts, as well as copyright, patent, trademark, and other laws, such as trade secret and unfair competition laws, to protect our intellectual property from infringement, misappropriation or dilution. We have registered certain trademarks and service marks and have other trademark and service mark registration applications pending in the U.S. and foreign jurisdictions. However, not all of the trademarks or service marks that we currently use have been registered in all of the countries in which we do business, and they may never be registered in all of those countries. Although we monitor trademark portfolios both internally and through external search agents and impose an obligation on franchisees to notify us upon learning of potential infringement, there can be no assurance that we will be able to adequately maintain, enforce and protect our trademarks or other intellectual property rights. We are aware of names and marks similar to our service marks being used by other persons in certain geographic areas in which we have restaurants. Although we believe such uses will not adversely affect us, further or currently unknown unauthorized uses or other infringement of our trademarks or service marks could diminish the value of our brands and may adversely affect our business. Effective intellectual property protection may not be available in every country in which we have
-13-
or intend to open or franchise a restaurant. Failure to adequately protect our intellectual property rights could damage our brands and impair our ability to compete effectively. Even where we have effectively secured statutory protection for our trade secrets and other intellectual property, our competitors may misappropriate our intellectual property and our employees, consultants and suppliers may breach their contractual obligations not to reveal our confidential information, including trade secrets. Although we have taken measures to protect our intellectual property, there can be no assurance that these protections will be adequate or that third parties will not independently develop products or concepts that are substantially similar to ours. Despite our efforts, it may be possible for third-parties to reverse-engineer, otherwise obtain, copy, and use information that we regard as proprietary. Furthermore, defending or enforcing our trademark rights, branding practices and other intellectual property, and seeking an injunction and/or compensation for misappropriation of confidential information, could result in the expenditure of significant resources and divert the attention of management, which in turn may materially and adversely affect our business and operating results.
Although we monitor and restrict franchisee activities through our franchise and license agreements, franchisees may refer to our brands improperly in writings or conversation, resulting in the dilution of our intellectual property. Franchisee noncompliance with the terms and conditions of our franchise or license agreements may reduce the overall goodwill of our brands, whether through the failure to meet health and safety standards, engage in quality control or maintain product consistency, or through the participation in improper or objectionable business practices. Moreover, unauthorized third parties may use our intellectual property to trade on the goodwill of our brands, resulting in consumer confusion or dilution. Any reduction of our brands' goodwill, consumer confusion, or dilution is likely to impact sales, and could materially and adversely impact our business and operating results.
Under certain license agreements, our subsidiaries have licensed to Dunkin' Brands the right to use certain trademarks, and in connection with those licenses, Dunkin' Brands monitors the use of trademarks and the quality of the licensed products. While courts have generally approved the delegation of quality-control obligations by a trademark licensor to a licensee under appropriate circumstances, there can be no guarantee that these arrangements will not be deemed invalid on the ground that the trademark owner is not controlling the nature and quality of goods and services sold under the licensed trademarks.
The restaurant industry is affected by consumer preferences and perceptions. Changes in these preferences and perceptions may lessen the demand for our products, which could reduce sales by our franchisees and reduce our royalty revenues.
The restaurant industry is affected by changes in consumer tastes, national, regional and local economic conditions and demographic trends. For instance, if prevailing health or dietary preferences cause consumers to avoid donuts and other products we offer in favor of foods that are perceived as more healthy, our franchisees' sales would suffer, resulting in lower royalty payments to us, and our business and operating results would be harmed.
If we fail to successfully implement our growth strategy, which includes opening new domestic and international restaurants, our ability to increase our revenues and operating profits could be adversely affected.
Our growth strategy relies in part upon new restaurant development by existing and new franchisees. We and our franchisees face many challenges in opening new restaurants, including:
• availability of financing;
• selection and availability of suitable restaurant locations;
• competition for restaurant sites;
• negotiation of acceptable lease and financing terms;
• securing required domestic or foreign governmental permits and approvals;
• consumer tastes in new geographic regions and acceptance of or products
• employment and training of qualified personnel;
• impact of inclement weather, natural disasters and other acts of nature; and
• general economic and business conditions.
In particular, because the majority of our new restaurant development is funded by franchisee investment, our growth strategy is dependent on our franchisees' (or prospective franchisees') ability to access funds to finance such development. We do not provide our franchisees with direct financing and therefore their ability to access borrowed funds generally depends on their independent relationships with various financial institutions. If our franchisees (or prospective franchisees) are not able to obtain financing at commercially reasonable rates, or at all, they may be unwilling or unable to invest in the development of new restaurants, and our future growth could be adversely affected.
-14-
To the extent our franchisees are unable to open new stores as we anticipate, our revenue growth would come primarily from growth in comparable store sales. Our failure to add a significant number of new restaurants or grow comparable store sales would adversely affect our ability to increase our revenues and operating income and could materially and adversely harm our business and operating results.
Increases in commodity prices may negatively affect payments from our franchisees and licensees.
Coffee and other commodity prices are subject to substantial price fluctuations, stemming from variations in weather patterns, shifting political or economic conditions in coffee-producing countries and delays in the supply chain. If commodity prices rise, franchisees may experience reduced sales, due to decreased consumer demand at retail prices that have been raised to offset increased commodity prices, which may reduce franchisee profitability. Any such decline in franchisee sales will reduce our royalty income, which in turn may materially and adversely affect our business and operating results.
Our joint ventures in Japan and South Korea (the “International JVs”), as well as our licensees in Russia and India, manufacture ice cream products independently. Each of the International JVs owns a manufacturing facility in its country of operation. The revenues derived from the International JVs differ fundamentally from those of other types of franchise arrangements in the system because the income that we receive from the International JVs is based in part on the profitability, rather than the gross sales, of the restaurants operated by the International JVs. Accordingly, in the event that the International JVs experience staple ingredient price increases that adversely affect the profitability of the restaurants operated by the International JVs, that decrease in profitability would reduce distributions by the International JVs to us, which in turn could materially and adversely impact our business and operating results.
Shortages of coffee could adversely affect our revenues.
If coffee consumption continues to increase worldwide or there is a disruption in the supply of coffee due to natural disasters, political unrest or other calamities, the global coffee supply may fail to meet demand. If coffee demand is not met, franchisees may experience reduced sales which, in turn, would reduce our royalty income. Such a reduction in our royalty income may materially and adversely affect our business and operating results.
We and our franchisees rely on computer systems to process transactions and manage our business, and a disruption or a failure of such systems or technology could harm our ability to effectively manage our business.
Network and information technology systems are integral to our business. We utilize various computer systems, including our FAST System and our EFTPay System, which are customized, web-based systems. The FAST System is the system by which our U.S. and Canadian franchisees report their weekly sales and pay their corresponding royalty fees and required advertising fund contributions. When sales are reported by a U.S. or Canadian franchisee, a withdrawal for the authorized amount is initiated from the franchisee's bank after 12 days (from the week ending or month ending date). The FAST System is critical to our ability to accurately track sales and compute royalties due from our U.S. and Canadian franchisees. The EFTPay System is used by our U.S. and Canadian franchisees to make payments against open, non-fee invoices (i.e., all invoices except royalty and advertising funds). When a franchisee selects an invoice and submits the payment, on the following day a withdrawal for the selected amount is initiated from the franchisee's bank. Despite the implementation of security measures, our systems, including the FAST System and the EFTPay System, are subject to damage and/or interruption as a result of power outages, computer and network failures, computer viruses and other disruptive software, security breaches, catastrophic events and improper usage by employees. Such events could result in a material disruption in operations, a need for a costly repair, upgrade or replacement of systems, or a decrease in, or in the collection of, royalties paid to us by our franchisees. To the extent that any disruption or security breach were to result in a loss of, or damage to, our data or applications, or inappropriate disclosure of confidential or proprietary information, we could incur liability which could materially affect our results of operations.
Interruptions in the supply of product to franchisees and licensees could adversely affect our revenues.
In order to maintain quality-control standards and consistency among restaurants, we require through our franchise agreements that our franchisees obtain food and other supplies from preferred suppliers approved in advance. In this regard, we and our franchisees depend on a group of suppliers for ingredients, foodstuffs, beverages and disposable serving instruments including, but not limited to, Rich Products Corp., Dean Foods Co., The Coca-Cola Company and Silver Pail Dairy, Ltd. as well as four primary coffee roasters and three primary donut mix suppliers. In 2012, we and our franchisees purchased products from over 450 approved domestic suppliers, with approximately 12 of such suppliers providing half, based on dollar volume, of all products purchased domestically. We look to approve multiple suppliers for most products, and require any single sourced supplier, such as The Coca-Cola Company, to have audited contingency plans in place to ensure continuity of supply. In addition we believe that, if necessary, we could obtain readily available alternative sources of supply for each product that we
-15-
currently source through a single supplier. To facilitate the efficiency of our franchisees' supply chain, we have historically entered into several preferred-supplier arrangements for particular food or beverage items.
The Dunkin' Donuts system is supported domestically by the franchisee-owned purchasing and distribution cooperative known as the National Distributor Commitment Program. We have a long-term agreement with the National DCP, LLC (the “NDCP”) for the NDCP to provide substantially all of the goods needed to operate a Dunkin' Donuts restaurant in the U.S. The NDCP also supplies some international markets. The NDCP aggregates the franchisee demand, sends requests for proposals to approved suppliers and negotiates contracts for approved items. The NDCP also inventories the items in its seven regional distribution centers and ships products to franchisees at least one time per week. We do not control the NDCP and have only limited contractual rights under our agreement with the NDCP associated with supplier certification and quality assurance and protection of our intellectual property. While the NDCP maintains contingency plans with its approved suppliers and has a contingency plan for its own distribution function to restaurants, our franchisees bear risks associated with the timeliness, solvency, reputation, labor relations, freight costs, price of raw materials and compliance with health and safety standards of each supplier (including those of the International JVs) including, but not limited to, risks associated with contamination to food and beverage products. We have little control over such suppliers. Disruptions in these relationships may reduce franchisee sales and, in turn, our royalty income.
Overall difficulty of suppliers (those of the International JVs) meeting franchisee product demand, interruptions in the supply chain, obstacles or delays in the process of renegotiating or renewing agreements with preferred suppliers, financial difficulties experienced by suppliers, or the deficiency, lack, or poor quality of alternative suppliers could adversely impact franchisee sales which, in turn, would reduce our royalty income and could materially and adversely affect our business and operating results.
We may not be able to recoup our expenditures on properties we sublease to franchisees.
Pursuant to the terms of certain prime leases we have entered into with third-party landlords, we may be required to construct or improve a property, pay taxes, maintain insurance and comply with building codes and other applicable laws. The subleases we enter into with franchisees related to such properties typically pass through such obligations, but if a franchisee fails to perform the obligations passed through to them, we will be required to perform those obligations, resulting in an increase in our leasing and operational costs and expenses. Additionally, in some locations, we may pay more rent and other amounts to third-party landlords under a prime lease than we receive from the franchisee who subleases such property. Typically, our franchisees' rent is based in part on a percentage of gross sales at the restaurant, so a downturn in gross sales would negatively affect the level of the payments we receive.
If the international markets in which we compete are affected by changes in political, social, legal, economic or other factors, our business and operating results may be materially and adversely affected.
As of December 29, 2012, we had 7,690 restaurants located in 54 foreign countries. The international operations of our franchisees may subject us to additional risks, which differ in each country in which our franchisees operate, and such risks may negatively affect our result in a delay in or loss of royalty income to us.
The factors impacting the international markets in which restaurants are located may include:
• recessionary or expansive trends in international markets;
• changes in foreign currency exchange rates and hyperinflation or deflation in the foreign countries in which we or the International JVs operate;
• the imposition of restrictions on currency conversion or the transfer of funds;
• availability of credit for our franchisees, licensees and International JVs to finance the development of new restaurants;
• increases in the taxes paid and other changes in applicable tax laws;
• legal and regulatory changes and the burdens and costs of local operators' compliance with a variety of laws, including trade restrictions and tariffs;
• interruption of the supply of product;
• increases in anti-American sentiment and the identification of the Dunkin' Donuts brand and Baskin-Robbins brand as American brands;
• political and economic instability; and
• natural disasters and other calamities.
-16-
Any or all of these factors may reduce distributions from our International JVs or other international partners and/or royalty income, which in turn may materially and adversely impact our business and operating results.
Termination of an arrangement with a master franchisee could adversely impact our revenues.
Internationally, and in limited cases domestically, we enter into relationships with “master franchisees” to develop and operate restaurants in defined geographic areas. Master franchisees are granted exclusivity rights with respect to larger territories than the typical franchisee, and in particular cases, expansion after minimum requirements are met is subject to the discretion of the master franchisee. In fiscal years 2012, 2011, and 2010, we derived approximately 13.7%, 15.1%, and 14.6%, respectively, of our total revenues from master franchisee arrangements. The termination of an arrangement with a master franchisee or a lack of expansion by certain master franchisees could result in the delay of the development of franchised restaurants, or an interruption in the operation of one of our brands in a particular market or markets. Any such delay or interruption would result in a delay in, or loss of, royalty income to us whether by way of delayed royalty income or delayed revenues from the sale of ice cream products by us to franchisees internationally, or reduced sales. Any interruption in operations due to the termination of an arrangement with a master franchisee similarly could result in lower revenues for us, particularly if we were to determine to close restaurants following the termination of an arrangement with a master franchisee.
Our contracts with the U.S. military are non-exclusive and may be terminated with little notice.
We have contracts with the U.S. military, including with the Army & Air Force Exchange Service and the Navy Exchange Service Command. These military contracts are predominantly between the U.S. military and Baskin-Robbins. We derive revenue from the arrangements provided for under these contracts mainly through the sale of ice cream to the U.S. military (rather than through royalties) for resale on base locations and in field operations. While revenues derived from arrangements with the U.S. military represented less than 1% of our total revenues and less than 0.5% of our international revenues for 2012, because these contracts are non-exclusive and cancellable with minimal notice and have no minimum purchase requirements, revenues attributable to these contracts may vary significantly year to year. Any changes in the U.S. military's domestic or international needs, or a decision by the U.S. military to use a different supplier, could result in lower revenues for us.
Fluctuations in exchange rates affect our revenues.
We are subject to inherent risks attributed to operating in a global economy. Most of our revenues, costs and debts are denominated in U.S. dollars. However, sales made by franchisees outside of the U.S. are denominated in the currency of the country in which the point of distribution is located, and this currency could become less valuable prior to calculation of our royalty payments in U.S. dollars as a result of exchange rate fluctuations. As a result, currency fluctuations could reduce our royalty income. Unfavorable currency fluctuations could result in a reduction in our revenues. Income we earn from our joint ventures is also subject to currency fluctuations. These currency fluctuations affecting our revenues and costs could adversely affect our business and operating results.
Adverse public or medical opinions about the health effects of consuming our products, as well as reports of incidents involving food-borne illnesses or food tampering, whether or not accurate, could harm our brands and our business.
Some of our products contain caffeine, dairy products, sugar and other active compounds, the health effects of which are the subject of increasing public scrutiny, including the suggestion that excessive consumption of caffeine, dairy products, sugar and other active compounds can lead to a variety of adverse health effects. There has also been greater public awareness that sedentary lifestyles, combined with excessive consumption of high-calorie foods, have led to a rapidly rising rate of obesity. In the U.S. and certain other countries, there is increasing consumer awareness of health risks, including obesity, as well as increased consumer litigation based on alleged adverse health impacts of consumption of various food products. While we offer some healthier beverage and food items, including reduced fat items, an unfavorable report on the health effects of caffeine or other compounds present in our products, or negative publicity or litigation arising from other health risks such as obesity, could significantly reduce the demand for our beverages and food products. Similarly, instances or reports, whether true or not, of unclean water supply, food-borne illnesses and food tampering have in the past severely injured the reputations of companies in the food processing, grocery and QSR segments and could in the future affect us as well. Any report linking us or our franchisees to the use of unclean water, food-borne illnesses or food tampering could damage our brands' value immediately, severely hurt sales of beverages and food products, and possibly lead to product liability claims. In addition, instances of food-borne illnesses or food tampering, even those occurring solely at the restaurants of competitors, could, by resulting in negative publicity about the foodservice or restaurant industry, adversely affect our sales on a regional or global basis. A decrease in customer traffic as a result of these health concerns or negative publicity could materially and adversely affect our brands and our business.
-17-
We may not be able to enforce payment of fees under certain of our franchise arrangements.
In certain limited instances, a franchisee may be operating a restaurant pursuant to an unwritten franchise arrangement. Such circumstances may arise where a franchisee arrangement has expired and new or renewal agreements have yet to be executed or where the franchisee has developed and opened a restaurant but has failed to memorialize the franchisor-franchisee relationship in an executed agreement as of the opening date of such restaurant. In certain other limited instances, we may allow a franchisee in good standing to operate domestically pursuant to franchise arrangements which have expired in their normal course and have not yet been renewed. As of December 29, 2012, approximately 1% of our stores were operating without a written agreement. There is a risk that either category of these franchise arrangements may not be enforceable under federal, state and local laws and regulations prior to correction or if left uncorrected. In these instances, the franchise arrangements may be enforceable on the basis of custom and assent of performance. If the franchisee, however, were to neglect to remit royalty payments in a timely fashion, we may be unable to enforce the payment of such fees which, in turn, may materially and adversely affect our business and operating results. While we generally require franchise arrangements in foreign jurisdictions to be entered into pursuant to written franchise arrangements, subject to certain exceptions, some expired contracts, letters of intent or oral agreements in existence may not be enforceable under local laws, which could impair our ability to collect royalty income, which in turn may materially and adversely impact our business and operating results.
Our business activities subject us to litigation risk that could affect us adversely by subjecting us to significant money damages and other remedies or by increasing our litigation expense.
In the ordinary course of business, we are the subject of complaints or litigation from franchisees, usually related to alleged breaches of contract or wrongful termination under the franchise arrangements. In addition, we are, from time to time, the subject of complaints or litigation from customers alleging illness, injury or other food-quality, health or operational concerns and from suppliers alleging breach of contract. We may also be subject to employee claims based on, among other things, discrimination, harassment or wrongful termination. Finally, litigation against a franchisee or its affiliates by third parties, whether in the ordinary course of business or otherwise, may include claims against us by virtue of our relationship with the defendant-franchisee. In addition to decreasing the ability of a defendant-franchisee to make royalty payments and diverting our management resources, adverse publicity resulting from such allegations may materially and adversely affect us and our brands, regardless of whether such allegations are valid or whether we are liable. Our international operations may be subject to additional risks related to litigation, including difficulties in enforcement of contractual obligations governed by foreign law due to differing interpretations of rights and obligations, compliance with multiple and potentially conflicting laws, new and potentially untested laws and judicial systems and reduced or diminished protection of intellectual property. A substantial unsatisfied judgment against us or one of our subsidiaries could result in bankruptcy, which would materially and adversely affect our business and operating results.
Our business is subject to various laws and regulations and changes in such laws and regulations, and/or failure to comply with existing or future laws and regulations, could adversely affect us.
We are subject to state franchise registration requirements, the rules and regulations of the Federal Trade Commission (the “FTC”), various state laws regulating the offer and sale of franchises in the U.S. through the provision of franchise disclosure documents containing certain mandatory disclosures and certain rules and requirements regulating franchising arrangements in foreign countries. Although we believe that the Franchisors' Franchise Disclosure Documents, together with any applicable state-specific versions or supplements, and franchising procedures that we use comply in all material respects with both the FTC guidelines and all applicable state laws regulating franchising in those states in which we offer new franchise arrangements, noncompliance could reduce anticipated royalty income, which in turn may materially and adversely affect our business and operating results.
Our franchisees are subject to various existing U.S. federal, state, local and foreign laws affecting the operation of the restaurants including various health, sanitation, fire and safety standards. Franchisees may in the future become subject to regulation (or further regulation) seeking to tax or regulate high-fat foods, to limit the serving size of beverages containing sugar, to ban the use of certain packaging materials (including polystyrene used in the iconic Dunkin' Donuts cup) or requiring the display of detailed nutrition information. Each of these regulations would be costly to comply with and/or could result in reduced demand for our products.
In connection with the continued operation or remodeling of certain restaurants, the franchisees may be required to expend funds to meet U.S. federal, state and local and foreign regulations. Difficulties in obtaining, or the failure to obtain, required licenses or approvals could delay or prevent the opening of a new restaurant in a particular area or cause an existing restaurant to cease operations. All of these situations would decrease sales of an affected restaurant and reduce royalty payments to us with respect to such restaurant.
-18-
The franchisees are also subject to the Fair Labor Standards Act of 1938, as amended, and various other laws in the U.S. and in foreign countries governing such matters as minimum-wage requirements, overtime and other working conditions and citizenship requirements. A significant number of our franchisees' food-service employees are paid at rates related to the U.S. federal minimum wage, and past increases in the U.S. federal minimum wage have increased labor costs, as would future increases. Any increases in labor costs might result in franchisees inadequately staffing restaurants. Understaffed restaurants could reduce sales at such restaurants, decrease royalty payments and adversely affect our brands.
Our and our franchisees' operations and properties are subject to extensive U.S. federal, state and local laws and regulations, including those relating to environmental, building and zoning requirements. Our development of properties for leasing or subleasing to franchisees depends to a significant extent on the selection and acquisition of suitable sites, which are subject to zoning, land use, environmental, traffic and other regulations and requirements. Failure to comply with legal requirements could result in, among other things, revocation of required licenses, administrative enforcement actions, fines and civil and criminal liability. We may incur investigation, remediation or other costs related to releases of hazardous materials or other environmental conditions at our properties, regardless of whether such environmental conditions were created by us or a third party, such as a prior owner or tenant. We have incurred costs to address soil and groundwater contamination at some sites, and continue to incur nominal remediation costs at some of our other locations. If such issues become more expensive to address, or if new issues arise, they could increase our expenses, generate negative publicity, or otherwise adversely affect us. Our tax returns and positions are subject to review and audit by foreign, federal, state and local taxing authorities, and adverse outcomes resulting from examination of our income or other tax returns could adversely affect our operating results and financial condition.
We are subject to income taxes in both the United States and numerous foreign jurisdictions. The Internal Revenue Service (“IRS”) concluded its examination of the federal income tax returns for the fiscal years 2006 through 2009 during fiscal year 2012 and agreed to a settlement regarding the recognition of revenue for gift cards and other matters. The Company made a cash payment for the additional federal tax due and interest thereon totaling $0.9 million for fiscal years 2006 and 2007 and a cash payment of $8.2 million for the additional federal tax due for fiscal years 2008 and 2009. Based on these settlements, additional state taxes and federal and state interest owed, net of federal and state benefits, are approximately $2.0 million, of which approximately $1.0 million was paid during fiscal year 2012. For fiscal year 2010, we will be required to make an additional cash payment of $3.5 million for federal and state taxes and interest owed, net of federal and state benefits. As the additional federal and state taxes owed for all periods represent temporary differences that will be deductible in future years, the potential tax expense is limited to federal and state interest, net of federal and state benefits, which we do not expect to be material. See Note 16 of the notes to our audited consolidated financial statements included herein.
We are subject to a variety of additional risks associated with our franchisees.
Our franchise system subjects us to a number of risks, any one of which may impact our ability to collect royalty payments from our franchisees, may harm the goodwill associated with our brands, and/or may materially and adversely impact our business and results of operations.
Bankruptcy of U.S. Franchisees. A franchisee bankruptcy could have a substantial negative impact on our ability to collect payments due under such franchisee's franchise arrangements and, to the extent such franchisee is a lessee pursuant to a franchisee lease/sublease with us, payments due under such franchisee lease/sublease. In a franchisee bankruptcy, the bankruptcy trustee may reject its franchise arrangements and/or franchisee lease/sublease pursuant to Section 365 under the United States bankruptcy code, in which case there would be no further royalty payments and/or franchisee lease/sublease payments from such franchisee, and there can be no assurance as to the proceeds, if any, that may ultimately be recovered in a bankruptcy proceeding of such franchisee in connection with a damage claim resulting from such rejection.
Franchisee Changes in Control. The franchise arrangements prohibit “changes in control” of a franchisee without our consent as the franchisor, except in the event of the death or disability of a franchisee (if a natural person) or a principal of a franchisee entity. In such event, the executors and representatives of the franchisee are required to transfer the relevant franchise arrangements to a successor franchisee approved by the franchisor. There can be, however, no assurance that any such successor would be found or, if found, would be able to perform the former franchisee's obligations under such franchise arrangements or successfully operate the restaurant. If a successor franchisee is not found, or if the successor franchisee that is found is not as successful in operating the restaurant as the then-deceased or disabled franchisee or franchisee principal, the sales of the restaurant could be adversely affected.
Franchisee Insurance. The franchise arrangements require each franchisee to maintain certain insurance types and levels. Certain extraordinary hazards, however, may not be covered, and insurance may not be available (or may be available only at prohibitively expensive rates) with respect to many other risks. Moreover, any loss incurred could exceed policy limits and policy payments made to franchisees may not be made on a timely basis. Any such loss or delay in payment could have a
-19-
material and adverse effect on a franchisee's ability to satisfy its obligations under its franchise arrangement, including its ability to make royalty payments.
Some of Our Franchisees are Operating Entities. Franchisees may be natural persons or legal entities. Our franchisees that are operating companies (as opposed to limited purpose entities) are subject to business, credit, financial and other risks, which may be unrelated to the operations of the restaurants. These unrelated risks could materially and adversely affect a franchisee that is an operating company and its ability to make its royalty payments in full or on a timely basis, which in turn may materially and adversely affect our business and operating results.
Franchise Arrangement Termination; Nonrenewal. Each franchise arrangement is subject to termination by us as the franchisor in the event of a default, generally after expiration of applicable cure periods, although under certain circumstances a franchise arrangement may be terminated by us upon notice without an opportunity to cure. The default provisions under the franchise arrangements are drafted broadly and include, among other things, any failure to meet operating standards and actions that may threaten our licensed intellectual property.
In addition, each franchise agreement has an expiration date. Upon the expiration of the franchise arrangement, we or the franchisee may, or may not, elect to renew the franchise arrangements. If the franchisee arrangement is renewed, the franchisee will receive a “successor” franchise arrangement for an additional term. Such option, however, is contingent on the franchisee's execution of the then-current form of franchise arrangements (which may include increased royalty payments, advertising fees and other costs), the satisfaction of certain conditions (including modernization of the restaurant and related operations) and the payment of a renewal fee. If a franchisee is unable or unwilling to satisfy any of the foregoing conditions, the expiring franchise arrangements will terminate upon expiration of the term of the franchise arrangements.
Product Liability Exposure. We require franchisees to maintain general liability insurance coverage to protect against the risk of product liability and other risks and demand strict franchisee compliance with health and safety regulations. However, franchisees may receive through the supply chain (from central manufacturing locations (“CMLs”), NDCP or otherwise), or produce defective food or beverage products, which may adversely impact our brands' goodwill.
Americans with Disabilities Act. Restaurants located in the U.S. must comply with Title III of the Americans with Disabilities Act of 1990, as amended (the “ADA”). Although we believe newer restaurants meet the ADA construction standards and, further, that franchisees have historically been diligent in the remodeling of older restaurants, a finding of noncompliance with the ADA could result in the imposition of injunctive relief, fines, an award of damages to private litigants or additional capital expenditures to remedy such noncompliance. Any imposition of injunctive relief, fines, damage awards or capital expenditures could adversely affect the ability of a franchisee to make royalty payments, or could generate negative publicity, or otherwise adversely affect us.
Franchisee Litigation. Franchisees are subject to a variety of litigation risks, including, but not limited to, customer claims, personal-injury claims, environmental claims, employee allegations of improper termination and discrimination, claims related to violations of the ADA, religious freedom, the Fair Labor Standards Act, the Employee Retirement Income Security Act of 1974, as amended (“ERISA”) and intellectual-property claims. Each of these claims may increase costs and limit the funds available to make royalty payments and reduce the execution of new franchise arrangements.
Potential Conflicts with Franchisee Organizations. Although we believe our relationship with our franchisees is open and strong, the nature of the franchisor-franchisee relationship can give rise to conflict. In the U.S., our approach is collaborative in that we have established district advisory councils, regional advisory councils and a national brand advisory council for each of the Dunkin' Donuts brand and the Baskin-Robbins brand. The councils are comprised of franchisees, brand employees and executives, and they meet to discuss the strengths, weaknesses, challenges and opportunities facing the brands as well as the rollout of new products and projects. Internationally, our operations are primarily conducted through joint ventures with local licensees, so our relationships are conducted directly with our licensees rather than separate advisory committees. No material disputes exist in the U.S. or internationally at this time.
Failure to retain our existing senior management team or the inability to attract and retain new qualified personnel could hurt our business and inhibit our ability to operate and grow successfully.
Our success will continue to depend to a significant extent on our executive management team and the ability of other key management personnel to replace executives who retire or resign. We may not be able to retain our executive officers and key personnel or attract additional qualified management personnel to replace executives who retire or resign. Failure to retain our leadership team and attract and retain other important personnel could lead to ineffective management and operations, which could materially and adversely affect our business and operating results.

-20-
If we or our franchisees or licensees are unable to protect our customers' credit card data, we or our franchisees could be exposed to data loss, litigation, and liability, and our reputation could be significantly harmed.
Privacy protection is increasingly demanding and the introduction of electronic payment methods exposes us and our franchisees to increased risk of privacy and/or security breaches as well as other risks. In connection with credit card sales, our franchisees (and we from our company-operated restaurants) transmit confidential credit card information by way of secure private retail networks. Although we use private networks, third parties may have the technology or know-how to breach the security of the customer information transmitted in connection with credit card sales, and our franchisees' and our security measures and those of our technology vendors may not effectively prohibit others from obtaining improper access to this information. If a person is able to circumvent these security measures, he or she could destroy or steal valuable information or disrupt our operations. Any security breach could expose us to risks of data loss, litigation, liability, and could seriously disrupt our operations. Any resulting negative publicity could significantly harm our reputation and could materially and adversely affect our business and operating results.
Unforeseen weather or other events may disrupt our business.
Unforeseen events, including war, terrorism and other international, regional or local instability or conflicts (including labor issues), embargos, public health issues (including tainted food, food-borne illnesses, food tampering, or water supply or widespread/pandemic illness such as the avian or H1N1 flu), and natural disasters such as earthquakes, tsunamis, hurricanes, or other adverse weather and climate conditions, whether occurring in the U.S. or abroad, could disrupt our operations or that of our franchisees, or suppliers; or result in political or economic instability. For example, in 2012, Hurricane Sandy resulted in the temporary closing of a number of Dunkin' Donuts restaurants along the east coast, 15 of which remained closed as of December 29, 2012. These events could reduce traffic in our restaurants and demand for our products; make it difficult or impossible for our franchisees to receive products from their suppliers; disrupt or prevent our ability to perform functions at the corporate level; and/or otherwise impede our or our franchisees' ability to continue business operations in a continuous manner consistent with the level and extent of business activities prior to the occurrence of the unexpected event or events, which in turn may materially and adversely impact our business and operating results.
Risks related to our common stock
Our stock price could be extremely volatile and, as a result, you may not be able to resell your shares at or above the price you paid for them.
Since our initial public offering in July 2011, the price of our common stock, as reported by NASDAQ, has ranged from a low of $23.24 on December 15, 2011 to a high of $40.00 on January 31, 2013. In addition, the stock market in general has been highly volatile. As a result, the market price of our common stock is likely to be similarly volatile, and investors in our common stock may experience a decrease, which could be substantial, in the value of their stock, including decreases unrelated to our operating performance or prospects, and could lose part or all of their investment. The price of our common stock could be subject to wide fluctuations in response to a number of factors, including those described elsewhere in this prospectus and others such as:
• variations in our operating performance and the performance of our competitors;
• actual or anticipated fluctuations in our quarterly or annual operating results;
• publication of research reports by securities analysts about us or our competitors or our industry;
• our failure or the failure of our competitors to meet analysts' projections or guidance that we or our competitors may give to the market;
• additions and departures of key personnel;
• strategic decisions by us or our competitors, such as acquisitions, divestures, spin-offs, joint ventures, strategic investments or changes in business strategy;
• the passage of legislation or other regulatory developments affecting us or our industry;
• speculation in the press or investment community
• changes in accounting principals
• terrorist acts, acts of war or periods of widespread civil unrest;
• natural disasters and other calamities; and
• changes in general market and economic conditions.

-21-
As we operate in a single industry, we are especially vulnerable to these factors to the extent that they affect our industry or our products, or to a lesser extent our markets. In the past, securities class action litigation has often been initiated against companies following periods of volatility in their stock price. This type of litigation could result in substantial costs and divert our management's attention and resources, and could also require us to make substantial payments to satisfy judgments or to settle litigation.
Provisions in our charter documents and Delaware law may deter takeover efforts that you feel would be beneficial to stockholder value.
Our certificate of incorporation and bylaws and Delaware law contain provisions which could make it harder for a third party to acquire us, even if doing so might be beneficial to our stockholders. These provisions include a classified board of directors and limitations on actions by our stockholders. In addition, our board of directors has the right to issue preferred stock without stockholder approval that could be used to dilute a potential hostile acquirer. Our certificate of incorporation also imposes some restrictions on mergers and other business combinations between us and any holder of 15% or more of our outstanding common stock other than the Sponsors. As a result, you may lose your ability to sell your stock for a price in excess of the prevailing market price due to these protective measures and efforts by stockholders to change the direction or management of the company may be unsuccessful.
Item 1B. Unresolved Staff Comments.
None.
Item 2. Properties.
Our corporate headquarters, located in Canton, Massachusetts, houses substantially all of our executive management and employees who provide our primary corporate support functions: legal, marketing, technology, human resources, public relations, financial and research and development.
As of December 29, 2012, we owned 96 properties and leased 941 locations across the U.S. and Canada, a majority of which we leased or subleased to franchisees. For fiscal year 2012, we generated 14.7%, or $96.8 million, of our total revenue from rental fees from franchisees who lease or sublease their properties from us.
The remaining balance of restaurants selling our products are situated on real property owned by franchisees or leased directly by franchisees from third-party landlords. All international restaurants (other than 10 located in Canada) are owned by licensees and their sub-franchisees or leased by licensees and their sub-franchisees directly from a third-party landlord.
Nearly 100% of Dunkin’ Donuts and Baskin-Robbins restaurants are owned and operated by franchisees. We have construction and site management personnel who oversee the construction of restaurants by outside contractors. The restaurants are built to our specifications as to exterior style and interior decor. As of December 29, 2012, there were 10,479 Dunkin' Donuts restaurants, operating in 38 states and the District of Columbia in the U.S. and 31 foreign countries. Baskin-Robbins restaurants totaled 6,980, operating in 44 states and the District of Columbia in the U.S. and 45 foreign countries. All but 35 of the Dunkin’ Donuts and Baskin-Robbins restaurants were franchisee-operated. The following table illustrates restaurant locations by brand and whether they are operated by the Company or our franchisees.
Franchisee-owned restaurants
Company-owned restaurants
Dunkin’ Donuts—US* 7,278 28Dunkin’ Donuts—International 3,173 —
Total Dunkin’ Donuts* 10,451 28Baskin-Robbins—US* 2,456 7Baskin-Robbins—International 4,517 —
Total Baskin-Robbins* 6,973 7Total US 9,734 35Total International 7,690 —
* Combination restaurants, as more fully described below, count as both a Dunkin’ Donuts and a Baskin-Robbinsrestaurant.
-22-
Dunkin’ Donuts and Baskin-Robbins restaurants operate in a variety of formats. Dunkin’ Donuts traditional restaurant formats include free standing restaurants, end-caps (i.e., end location of a larger multi-store building) and gas and convenience locations. A free-standing building typically ranges in size from 1,200 to 2,500 square feet, and may include a drive-thru window. An end-cap typically ranges in size from 1,000 to 2,000 square feet and may include a drive-thru window. Dunkin’ Donuts also has other restaurants designed to fit anywhere, consisting of small full-service restaurants and/or self-serve kiosks in offices, hospitals, colleges, airports, grocery stores and drive-thru-only units on smaller pieces of property (collectively referred to as alternative points of distributions or APODs). APODs typically range in size between 400 to 1,800 square feet. The majority of our Dunkin’ Donuts restaurants have their fresh baked goods delivered to them from franchisee-owned and -operated CMLs.
Baskin-Robbins traditional restaurant formats include free standing restaurants and end-caps. A free-standing building typically ranges in size from 600 to 1,200 square feet, and may include a drive-thru window. An end-cap typically ranges in size from 800 to 1,200 square feet and may include a drive-thru window. We also have other restaurants, consisting of small full-service restaurants and/or self-serve kiosks (collectively referred to as APODs). APODs typically range in size between 400 to 1,000 square feet.
In the U.S., Baskin-Robbins can also be found in 1,163 combination restaurants (combos) that also include a Dunkin’ Donuts restaurant, and are typically either free-standing or an end-cap. These combos, which we count as both a Dunkin’ Donuts and a Baskin-Robbins point of distribution, typically range from 1,400 to 3,500 square feet.
Of the 9,734 U.S. franchised restaurants, 90 were sites owned by the Company and leased to franchisees, 872 were leased by us, and in turn, subleased to franchisees, with the remainder either owned or leased directly by the franchisee. Our land or land and building leases are generally for terms of ten to 20 years, and often have one or more five-year or ten-year renewal options. In certain lease agreements, we have the option to purchase, or the right of first refusal to purchase, the real estate. Certain leases require the payment of additional rent equal to a percentage of annual sales in excess of specified amounts.
Of the sites owned or leased by the Company in the U.S., 24 are locations that no longer have a Dunkin’ Donuts or Baskin-Robbins restaurant (surplus properties). Some of these surplus properties have been sublet to other parties while the remaining are currently vacant.
We have 10 leased franchised restaurant properties and 3 surplus leased properties in Canada. We also have leased office space in Australia, China, Dubai, Spain and the United Kingdom.
The following table sets forth the Company’s owned and leased office, warehouse, manufacturing and distribution facilities, including the approximate square footage of each facility. None of these owned properties, or the Company’s leasehold interest in leased property, is encumbered by a mortgage.
Location Type Owned/Leased Approximate Sq. Ft.
Canton, MA Office Leased 175,000Braintree, MA (training facility) Office Owned 15,000Burbank, CA (training facility) Office Leased 19,000Dubai, United Arab Emirates (regional office space) Office Leased 3,200Shanghai, China (regional office space) Office Leased 1,700Various (regional sales offices) Office Leased Range of 150 to 300
Item 3. Legal Proceedings.
In May 2003, a group of Dunkin’ Donuts franchisees from Quebec, Canada filed a lawsuit against the Company on a variety of claims, based on events which primarily occurred 10 to 15 years ago, including but not limited to, alleging that the Company breached its franchise agreements and provided inadequate management and support to Dunkin’ Donuts franchisees in Quebec (“Bertico litigation”). On June 22, 2012, the Quebec Superior Court found for the plaintiffs and issued a judgment against the Company in the amount of approximately C$16.4 million (approximately $15.9 million), plus costs and interest, representing loss in value of the franchises and lost profits. During the second quarter of 2012, the Company increased its estimated liability related to the Bertico litigation by $20.7 million to reflect the judgment amount and estimated plaintiff legal costs and interest. During the third and fourth quarters of 2012, the Company accrued an additional $493 thousand for interest that continues to accrue on the judgment amount, resulting in an estimated liability of $25.8 million, including the impact of foreign exchange, as of December 29, 2012. The Company had recorded an estimated liability of approximately $3.9 million as of December 31, 2011, representing the Company’s best estimate within the range of losses which could be incurred in connection with this

-23-
matter. The Company strongly disagrees with the decision reached by the Court and believes the damages awarded were unwarranted. As such, the Company is vigorously appealing the decision.
In addition, the Company is engaged in several matters of litigation arising in the ordinary course of its business as a franchisor. Such matters include disputes related to compliance with the terms of franchise and development agreements, including claims or threats of claims of breach of contract, negligence, and other alleged violations by the Company.
Item 4. Mine Safety Disclosures
Not applicable.
PART II
Item 5. Market for Registrant’s Common Equity, Related Stockholder Matters and Issuer Purchases of Equity Securities.
Our common stock has been listed on the NASDAQ Global Select Market under the symbol “DNKN” since July 27, 2011. Prior to that time, there was no public market for our common stock. The following table sets forth for the periods indicated the high and low sale prices of our common stock on the NASDAQ Global Select Market.
Fiscal Quarter High Low
2012First Quarter (13 weeks ended March 31, 2012) $ 32.44 $ 24.35Second Quarter (13 weeks ended June 30, 2012) $ 37.02 $ 29.58Third Quarter (13 weeks ended September 29, 2012) $ 36.11 $ 27.93Fourth Quarter (13 weeks ended December 29, 2012) $ 33.49 $ 28.62
2011Third Quarter (13 weeks ended September 24, 2011)(1) $ 31.94 $ 24.97Fourth Quarter (14 weeks ended December 31, 2011) $ 29.93 $ 23.24
(1) Represents period from July 27, 2011, the date of our initial public offering, through the end of the quarter
On February 15, 2013, we had 248 holders of record of our common stock.
Dividend policy
No dividends were declared or paid during fiscal year 2011.
During fiscal year 2012, the Company paid dividends on common stock as follows:
Dividend per share
Total amount (in millions) Payment date
Fiscal year 2012:First quarter $ 0.15 $ 18.0 March 28, 2012Second quarter $ 0.15 $ 18.1 May 16, 2012Third quarter $ 0.15 $ 18.1 August 24, 2012Fourth quarter $ 0.15 $ 15.9 November 14, 2012
On January 31, 2013, we announced that our board of directors approved the next quarterly dividend of $0.19 per share of common stock payable February 20, 2013.

-24-
Securities authorized for issuance under our equity compensation plans
(a) (b) (c)
Plan Category
Number of securities tobe issued upon exerciseof outstanding options,
warrants, and rights
Weighted-averageexercise price of
outstanding options,warrants and rights
Number of securitiesremaining available forfuture issuance underequity compensation
plans (excludingsecurities reflected in
column (a))
Equity compensation plans approved by security holders 4,649,553 $ 9.54 10,660,674Equity compensation plans not approved by security
holders — — —TOTAL 4,649,553 $ 9.54 10,660,674
Performance Graph
The following graph depicts the total return to shareholders from July 27, 2011, the date our common stock became listed on the NASDAQ Global Select Market, through December 29, 2012, relative to the performance of the Standard & Poor’s 500 Index and the Standard & Poor’s 500 Consumer Discretionary Sector, a peer group. The graph assumes an investment of $100 in our common stock and each index on July 27, 2011 and the reinvestment of dividends paid since that date. The stock price performance shown in the graph is not necessarily indicative of future price performance.
7/27/2011 12/31/2011 12/29/2012
Dunkin’ Brands Group, Inc. (DNKN) $ 100.00 $ 99.92 $ 132.02S&P 500 $ 100.00 $ 94.42 $ 105.29S&P Consumer Discretionary $ 100.00 $ 95.65 $ 114.27
Recent Sales of Unregistered Securities.During the year ended December 31, 2011, prior to the IPO, we issued and sold 589,342.89 shares of Class A Common Stock and 65,482.54 shares of Class L Common Stock in 2011 for aggregate consideration of $3,213,883. These shares were issued without registration in reliance on the exemptions afforded by Section 4(2) of the Securities Act of 1933, as amended, and Rules 506 and 701 promulgated thereunder.

-25-
The foregoing share numbers do not reflect the 1-for-4.568 reverse split and reclassification of our Class A common stock on July 8, 2011, or the conversion of our Class L common stock in connection with our initial public offering.
Item 6. Selected Financial Data.
The following table sets forth our selected historical consolidated financial and other data, and should be read in conjunction with “Management’s discussion and analysis of financial condition and results of operations” and the consolidated financial statements and the related notes thereto appearing elsewhere in this Annual Report on Form 10-K. The selected historical financial data has been derived from our audited consolidated financial statements. Historical results are not necessarily indicative of the results to be expected for future periods. The data in the following table related to adjusted operating income, adjusted net income, points of distribution, comparable store sales growth, franchisee-reported sales, company-owned store sales, and systemwide sales growth are unaudited for all periods presented. The data for fiscal year 2011 reflects the results of operations for a 53-week period. All other periods presented reflect the results of operations for 52-week periods.
Fiscal Year 2012 2011 2010 2009 2008 ($ in thousands, except per share data or as otherwise noted)
Consolidated Statements of Operations Data:
Franchise fees and royalty income $ 418,940 398,474 359,927 344,020 349,047Rental income 96,816 92,145 91,102 93,651 97,886Sales of ice cream products 94,659 100,068 84,989 75,256 71,445Sales at company-owned restaurants 22,922 12,154 17,362 2,170 435Other revenues 24,844 25,357 23,755 22,976 26,116
Total revenues 658,181 628,198 577,135 538,073 544,929Amortization of intangible assets 26,943 28,025 32,467 35,994 37,848Impairment charges(1) 1,278 2,060 7,075 8,517 331,862Other operating costs and expenses(2)(3) 412,882 389,329 361,893 323,318 330,281
Total operating costs and expenses 441,103 419,414 401,435 367,829 699,991Net income (loss) of equity method
investments(4) 22,351 (3,475) 17,825 14,301 14,169Operating income (loss) 239,429 205,309 193,525 184,545 (140,893)
Interest expense, net (73,488) (104,449) (112,532) (115,019) (115,944)Gain (loss) on debt extinguishment and
refinancing transactions (3,963) (34,222) (61,955) 3,684 —Other gains (losses), net 23 175 408 1,066 (3,929)
Income (loss) before income taxes 162,001 66,813 19,446 74,276 (260,766)Net income (loss) attributable to Dunkin'
Brands $ 108,308 34,442 26,861 35,008 (269,898)Earnings (loss) per share:
Class L—basic and diluted n/a $ 6.14 4.87 4.57 4.17Common—basic $ 0.94 (1.41) (2.04) (1.69) (8.95)Common—diluted 0.93 (1.41) (2.04) (1.69) (8.95)
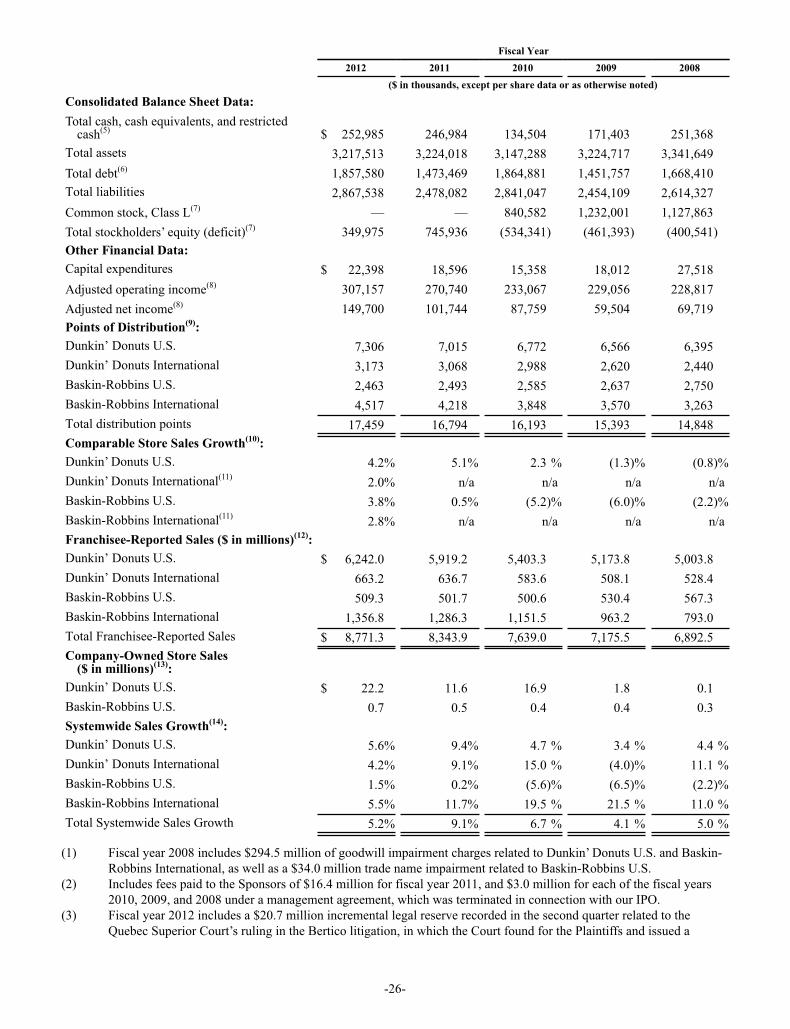
-26-
Fiscal Year 2012 2011 2010 2009 2008 ($ in thousands, except per share data or as otherwise noted)
Consolidated Balance Sheet Data:Total cash, cash equivalents, and restricted
cash(5) $ 252,985 246,984 134,504 171,403 251,368Total assets 3,217,513 3,224,018 3,147,288 3,224,717 3,341,649Total debt(6) 1,857,580 1,473,469 1,864,881 1,451,757 1,668,410Total liabilities 2,867,538 2,478,082 2,841,047 2,454,109 2,614,327Common stock, Class L(7) — — 840,582 1,232,001 1,127,863Total stockholders’ equity (deficit)(7) 349,975 745,936 (534,341) (461,393) (400,541)Other Financial Data:Capital expenditures $ 22,398 18,596 15,358 18,012 27,518Adjusted operating income(8) 307,157 270,740 233,067 229,056 228,817Adjusted net income(8) 149,700 101,744 87,759 59,504 69,719Points of Distribution(9):Dunkin’ Donuts U.S. 7,306 7,015 6,772 6,566 6,395Dunkin’ Donuts International 3,173 3,068 2,988 2,620 2,440Baskin-Robbins U.S. 2,463 2,493 2,585 2,637 2,750Baskin-Robbins International 4,517 4,218 3,848 3,570 3,263Total distribution points 17,459 16,794 16,193 15,393 14,848Comparable Store Sales Growth(10):Dunkin’ Donuts U.S. 4.2% 5.1% 2.3 % (1.3)% (0.8)%Dunkin’ Donuts International(11) 2.0% n/a n/a n/a n/aBaskin-Robbins U.S. 3.8% 0.5% (5.2)% (6.0)% (2.2)%Baskin-Robbins International(11) 2.8% n/a n/a n/a n/aFranchisee-Reported Sales ($ in millions)(12):Dunkin’ Donuts U.S. $ 6,242.0 5,919.2 5,403.3 5,173.8 5,003.8Dunkin’ Donuts International 663.2 636.7 583.6 508.1 528.4Baskin-Robbins U.S. 509.3 501.7 500.6 530.4 567.3Baskin-Robbins International 1,356.8 1,286.3 1,151.5 963.2 793.0Total Franchisee-Reported Sales $ 8,771.3 8,343.9 7,639.0 7,175.5 6,892.5Company-Owned Store Sales
($ in millions)(13):Dunkin’ Donuts U.S. $ 22.2 11.6 16.9 1.8 0.1Baskin-Robbins U.S. 0.7 0.5 0.4 0.4 0.3Systemwide Sales Growth(14):Dunkin’ Donuts U.S. 5.6% 9.4% 4.7 % 3.4 % 4.4 %Dunkin’ Donuts International 4.2% 9.1% 15.0 % (4.0)% 11.1 %Baskin-Robbins U.S. 1.5% 0.2% (5.6)% (6.5)% (2.2)%Baskin-Robbins International 5.5% 11.7% 19.5 % 21.5 % 11.0 %Total Systemwide Sales Growth 5.2% 9.1% 6.7 % 4.1 % 5.0 %
(1) Fiscal year 2008 includes $294.5 million of goodwill impairment charges related to Dunkin’ Donuts U.S. and Baskin-Robbins International, as well as a $34.0 million trade name impairment related to Baskin-Robbins U.S.
(2) Includes fees paid to the Sponsors of $16.4 million for fiscal year 2011, and $3.0 million for each of the fiscal years 2010, 2009, and 2008 under a management agreement, which was terminated in connection with our IPO.
(3) Fiscal year 2012 includes a $20.7 million incremental legal reserve recorded in the second quarter related to the Quebec Superior Court’s ruling in the Bertico litigation, in which the Court found for the Plaintiffs and issued a
-27-
judgment against Dunkin’ Brands in the amount of approximately $C16.4 million (approximately $15.9 million), plus costs and interest.
(4) Fiscal year 2011 includes an impairment of the investment in the Korea joint venture of $19.8 million.(5) Amounts as of December 26, 2009 and December 27, 2008 include cash held in restricted accounts pursuant to the
terms of the securitization indebtedness of $118.2 million and $87.7 million, respectively. Following the redemption and discharge of the securitization indebtedness in fiscal year 2010, such amounts are no longer restricted. The amounts also include cash held as advertising funds or reserved for gift card/certificate programs.
(6) Includes capital lease obligations of $7.6 million, $5.2 million, $5.4 million, $5.4 million, and $4.2 million as of December 29, 2012, December 31, 2011, December 25, 2010, December 26, 2009, and December 27, 2008, respectively.
(7) Prior to our IPO in fiscal year 2011, the Company had two classes of common stock, Class L and common. Class L common stock was classified outside of permanent equity at its preferential distribution amount, as the Class L stockholders controlled the timing and amount of distributions. Immediately prior to our IPO, each share of Class L common stock converted into 2.4338 shares of common stock, and the preferential distribution amount of Class L common stock at the date of conversion was reclassified into additional paid-in capital within permanent equity.
(8) Adjusted operating income and adjusted net income are non-GAAP measures reflecting operating income and net income adjusted for amortization of intangible assets, impairment charges, and other non-recurring, infrequent, or unusual charges, net of the tax impact of such adjustments in the case of adjusted net income. The Company uses adjusted operating income and adjusted net income as key performance measures for the purpose of evaluating performance internally. We also believe adjusted operating income and adjusted net income provide our investors with useful information regarding our historical operating results. These non-GAAP measurements are not intended to replace the presentation of our financial results in accordance with GAAP. Use of the terms adjusted operating income and adjusted net income may differ from similar measures reported by other companies. Adjusted operating income and adjusted net income are reconciled from operating income (loss) and net income (loss), respectively, determined under GAAP as follows:

-28-
Fiscal Year 2012 2011 2010 2009 2008 (Unaudited, $ in thousands)
Operating income (loss) $ 239,429 205,309 193,525 184,545 (140,893)Adjustments:
Amortization of other intangible assets 26,943 28,025 32,467 35,994 37,848Impairment charges 1,278 2,060 7,075 8,517 331,862Sponsor termination fee — 14,671 — — —Secondary offering costs 4,783 1,899 — — —Peterborough plant closure(a) 14,044 — — — —Korea joint venture impairment, net(b) — 18,776 — — —Bertico litigation(c) 20,680 — — — —
Adjusted operating income $ 307,157 270,740 233,067 229,056 228,817Net income (loss) attributable to Dunkin'
Brands $ 108,308 34,442 26,861 35,008 (269,898)Adjustments:
Amortization of other intangible assets 26,943 28,025 32,467 35,994 37,848Impairment charges 1,278 2,060 7,075 8,517 331,862Sponsor termination fee — 14,671 — — —Secondary offering costs 4,783 1,899 — — —Peterborough plant closure(a) 14,044 — — — —Korea joint venture impairment, net(b) — 18,776 — — —Bertico litigation(c) 20,680 — — — —Loss (gain) on debt extinguishment and
refinancing transactions 3,963 34,222 61,955 (3,684) —Tax impact of adjustments, excluding
Bertico litigation(d) (20,404) (32,351) (40,599) (16,331) (30,093)Tax impact of Bertico adjustment(e) (3,980) — — — —Income tax audit settlements(f) (10,514) — — — —State tax apportionment(g) 4,599 — — — —
Adjusted net income $ 149,700 101,744 87,759 59,504 69,719
(a) Represents costs incurred in fiscal year 2012 related to the announced closure of the Baskin-Robbins ice cream manufacturing plant in Peterborough, Canada, including $3.4 million of severance and other payroll-related costs, $4.2 million of accelerated depreciation, $2.7 million of incremental costs of ice cream products, and $1.6 million of other transition-related costs. Amount also reflects the one-time delay in revenue recognition, net of related cost of ice cream products, related to the shift in manufacturing to Dean Foods of $2.1 million.
(b) Amount consists of an impairment of the investment in the Korea joint venture of $19.8 million, less a reduction in depreciation and amortization, net of tax, of $1.0 million resulting from the allocation of the impairment charge to the underlying intangible and long-lived assets of the joint venture.
(c) Represents the incremental legal reserve recorded in the second quarter of 2012 related to the Quebec Superior Court's ruling in the Bertico litigation, in which the Court found for the Plaintiffs and issued a judgment against Dunkin' Brands in the amount of approximately $C16.4 million (approximately $15.9 million), plus costs and interest.
(d) Tax impact of adjustments calculated at a 40% effective tax rate for each period presented, excluding the goodwill impairment charge in fiscal year 2008 as the goodwill is not deductible for tax purposes, the Korea joint venture impairment in fiscal year 2011 as there was no tax impact related to that charge, and the Bertico litigation adjustment for which the tax impact is calculated separately.
(e) Tax impact of Bertico litigation adjustment calculated as if the incremental reserve had not been recorded, considering statutory tax rates and deductibility.

-29-
(f) Represents income tax benefits resulting from the settlement of historical tax positions settled during the period, primarily related to the accounting for the acquisition of the Company by private equity firms in 2006.
(g) Represents deferred tax expense recognized due to an increase in our overall state tax rate for a shift in the apportionment of income to state jurisdictions, as a result of the closure of the Peterborough manufacturing plant and transition to Dean Foods.
(9) Represents period end points of distribution.(10) Represents the growth in average weekly sales for franchisee- and company-owned restaurants that have been open at
least 54 weeks that have reported sales in the current and comparable prior year week.(11) Comparable store sales growth data was not available for our international segments until fiscal year 2012.(12) Franchisee-reported sales include sales at franchisee restaurants, including joint ventures.(13) Company-owned store sales include sales at restaurants majority owned and operated by Dunkin’ Brands.(14) Systemwide sales growth represents the percentage change in sales at both franchisee- and company-owned
restaurants from the comparable period of the prior year. Changes in systemwide sales are driven by changes in average comparable store sales and changes in the number of restaurants.
Item 7. Management’s Discussion and Analysis of Financial Condition and Results of Operations.
The following discussion of our financial condition and results of operations should be read in conjunction with the selected financial data and the audited financial statements and related notes appearing elsewhere in this Annual Report on Form 10-K. This discussion contains forward-looking statements about our markets, the demand for our products and services and our future results and involves numerous risks and uncertainties. Forward-looking statements can be identified by the fact that they do not relate strictly to historical or current facts and generally contain words such as “believes,” “expects,” “may,” “will,” “should,” “seeks,” “approximately,” “intends,” “plans,” “estimates,” or “anticipates” or similar expressions. Our forward-looking statements are subject to risks and uncertainties, which may cause actual results to differ materially from those projected or implied by the forward-looking statement. Forward-looking statements are based on current expectations and assumptions and currently available data and are neither predictions nor guarantees of future events or performance. You should not place undue reliance on forward-looking statements, which speak only as of the date hereof. See “Risk factors” for a discussion of factors that could cause our actual results to differ from those expressed or implied by forward-looking statements.
Introduction and overview
We are one of the world’s leading franchisors of quick service restaurants (“QSRs”) serving hot and cold coffee and baked goods, as well as hard serve ice cream. We franchise restaurants under our Dunkin’ Donuts and Baskin-Robbins brands. With over 17,400 points of distribution in 55 countries, we believe that our portfolio has strong brand awareness in our key markets. QSR is a restaurant format characterized by counter or drive-thru ordering and limited or no table service. As of December 29, 2012, Dunkin’ Donuts had 10,479 global points of distribution with restaurants in 38 U.S. states and the District of Columbia and in 31 foreign countries. Baskin-Robbins had 6,980 global points of distribution as of the same date, with restaurants in 44 U.S. states and the District of Columbia and in 45 foreign countries.
We are organized into four reporting segments: Dunkin’ Donuts U.S., Dunkin’ Donuts International, Baskin-Robbins U.S., and Baskin-Robbins International. We generate revenue from five primary sources: (i) royalty income and franchise fees associated with franchised restaurants, (ii) rental income from restaurant properties that we lease or sublease to franchisees, (iii) sales of ice cream products to franchisees in certain international markets, (iv) retail store revenue at our company-owned restaurants, and (v) other income including fees for the licensing of our brands for products sold in non-franchised outlets, the licensing of the right to manufacture Baskin-Robbins ice cream sold to U.S. franchisees, refranchising gains, transfer fees from franchisees, and online training fees.
Approximately 64% of our revenue for fiscal year 2012 was derived from royalty income and franchise fees. Rental income from franchisees that lease or sublease their properties from us accounted for 15% of our revenue for fiscal year 2012. An additional 14% of our revenue for fiscal year 2012 was generated from sales of ice cream products to Baskin-Robbins franchisees in certain international markets. The balance of our revenue for fiscal year 2012 consisted of revenue from our company-owned restaurants, license fees on products sold in non-franchised outlets, license fees on sales of ice cream products to Baskin-Robbins franchisees in the U.S., refranchising gains, transfer fees from franchisees, and online training fees.
Franchisees fund the vast majority of the cost of new restaurant development. As a result, we are able to grow our system with lower capital requirements than many of our competitors. With only 35 company-owned points of distribution as of December 29, 2012, we are less affected by store-level costs, profitability and fluctuations in commodity costs than other QSR operators.

-30-
Our franchisees fund substantially all of the advertising that supports both brands. Those advertising funds also fund the cost of our marketing, research and development, and innovation personnel. Royalty payments and advertising fund contributions typically are made on a weekly basis for restaurants in the U.S., which limits our working capital needs. For fiscal year 2012, franchisee contributions to the U.S. advertising funds were $332.3 million.
We operate and report financial information on a 52- or 53-week year on a 13-week quarter (or 14-week fourth quarter, when applicable) basis with the fiscal year ending on the last Saturday in December and fiscal quarters ending on the 13th Saturday of each quarter (or 14th Saturday of the fourth quarter, when applicable). The data periods contained within fiscal years 2012, 2011, and 2010 reflect the results of operations for the 52-week, 53-week, and 52-week periods ending on December 29, 2012, December 31, 2011, and December 25, 2010, respectively. Certain financial measures and other metrics have been presented with the impact of the additional week on the results for fiscal year 2011. The impact of the additional week in fiscal year 2011 reflects our estimate of the 53rd week on systemwide sales growth, revenues, and expenses.
Selected operating and financial highlights
Fiscal year 2012 2011 2010
Systemwide sales growth 5.2% 9.1% 6.7 %Comparable store sales growth:
Dunkin’ Donuts U.S. 4.2% 5.1% 2.3 %Dunkin' Donuts International(1) 2.0% n/a n/aBaskin-Robbins U.S. 3.8% 0.5% (5.2)%Baskin-Robbins International(1) 2.8% n/a n/a
Total revenues $ 658,181 628,198 577,135Operating income 239,429 205,309 193,525Adjusted operating income 307,157 270,740 233,067Net income 108,308 34,442 26,861Adjusted net income 149,700 101,744 87,759
(1) Comparable store sales growth data was not available for our international segments until fiscal year 2012.
Adjusted operating income and adjusted net income are non-GAAP measures reflecting operating income and net income adjusted for amortization of intangible assets, impairment charges, and other non-recurring, infrequent, or unusual charges, net of the tax impact of such adjustments in the case of adjusted net income. The Company uses adjusted operating income and adjusted net income as key performance measures for the purpose of evaluating performance internally. We also believe adjusted operating income and adjusted net income provide our investors with useful information regarding our historical operating results. These non-GAAP measurements are not intended to replace the presentation of our financial results in accordance with GAAP. Use of the terms adjusted operating income and adjusted net income may differ from similar measures reported by other companies. See footnote 8 to "Selected Financial Data" for reconciliations of operating income and net income determined under GAAP to adjusted operating income and adjusted net income, respectively.
Fiscal year 2012 compared to fiscal year 2011
Overall growth in systemwide sales of 5.2% for fiscal year 2012, or 7.0% on a 52-week basis, resulted from the following:
• Dunkin’ Donuts U.S. systemwide sales growth of 5.6%, which was the result of comparable store sales growth of 4.2% driven by both increased average ticket and transaction counts, as well as net development of 291 restaurants in 2012, offset by approximately 190 basis points of a decline attributable to the extra week in fiscal year 2011. Increases in average ticket and transactions resulted from our continued focus on product and marketing innovation resulting in strong beverage sales growth, especially in cold beverages, strong breakfast sandwich sales across both core and limited-time offerings, continued growth in bakery sandwiches, and sales of Dunkin' Donuts K-Cup® portion packs including successful limited-time offerings.
• Dunkin’ Donuts International systemwide sales growth of 4.2% as a result of sales increases in the Middle East and Southeast Asia driven by net new restaurant development and comparable store sales growth of 2.0%, offset by an unfavorable foreign currency impact.

-31-
• Baskin-Robbins U.S. systemwide sales growth of 1.5% resulting primarily from comparable store sales growth of 3.8%, offset by approximately 140 basis points of a decline attributable to the extra week in fiscal year 2011, as well as 30 net restaurant closures during 2012. Baskin-Robbins U.S. comparable store sales growth was driven by new product news and signature Flavors of the Month, custom cake sales, and new beverages.
• Baskin-Robbins International systemwide sales growth of 5.5% resulting from increased sales in South Korea and Japan, which resulted from both comparable store sales growth and net development. Offsetting this growth was approximately 170 basis points of a decline attributable to the extra week in fiscal year 2011, as well as an unfavorable foreign currency impact.
The increase in total revenues of $30.0 million, or 4.8%, for fiscal year 2012 primarily resulted from a $20.5 million increase in franchise fees and royalty income driven by the increase in Dunkin’ Donuts U.S. systemwide sales, a $10.8 million increase in sales at company-owned restaurants due to additional locations acquired, and a $4.7 million increase in rental income. The overall $30.0 million growth in revenues reflects the unfavorable impact of the extra week in fiscal year 2011, which contributed approximately $8.0 million of incremental revenue in the prior year consisting primarily of additional royalty income and sales of ice cream products. Sales of ice cream products were also unfavorably impacted by approximately $5.8 million in the fourth quarter of 2012 from a one-time delay in revenue recognition as a result of a change in shipping terms related to the shift in ice cream manufacturing to Dean Foods.
Operating income increased $34.1 million, or 16.6%, for fiscal year 2012 driven by the $20.5 million increase in franchise fees and royalty income, as well as a $25.8 million increase in income from equity method investments driven by an impairment of the investment in the Korea joint venture recorded in fiscal year 2011. The increase in operating income was also attributable to a $14.7 million expense incurred in the prior year related to the termination of the Sponsor management agreement in connection with the Company's initial public offering, as well as a $4.5 million increase in net rental income. Offsetting these increases in operating income was a $20.7 million increase in the Bertico litigation legal reserve recorded in the second quarter of 2012, and an approximately $14.0 million unfavorable impact associated with the closure of our ice cream manufacturing plant in Peterborough, Ontario, Canada.
Adjusted operating income increased $36.4 million, or 13.5%, for fiscal year 2012 driven by the $20.5 million increase in franchise fees and royalty income, a $7.1 million increase in income from equity method investments driven by our Korea joint venture, and a $4.5 million increase in net rental income.
Net income increased $73.9 million, or 214.5%, for fiscal year 2012 as a result of the $34.1 million increase in operating income, a $31.0 million decrease in net interest expense, and a $30.3 million decrease in loss on debt extinguishment and refinancing transactions, offset by a $22.0 million increase in income tax expense driven by increased profit before tax.
Adjusted net income increased $48.0 million, or 47.1%, for fiscal year 2012 resulting primarily from a $36.4 million increase in adjusted operating income and a $31.0 million decrease in net interest expense, offset by a $20.0 million increase in income tax expense.
Fiscal year 2011 compared to fiscal year 2010
Overall growth in systemwide sales of 9.1% for fiscal year 2011, or 7.4% on a 52-week basis, resulted from the following:
• Dunkin’ Donuts U.S. systemwide sales growth of 9.4%, which was the result of comparable store sales growth of 5.1% driven by both increased average ticket and transaction counts, net restaurant development of 243 restaurants in 2011, and approximately 190 basis points of growth attributable to the extra week in fiscal year 2011.
• Dunkin’ Donuts International systemwide sales growth of 9.1% as a result of sales increases in South Korea and Southeast Asia driven by net new restaurant development, comparable store sales growth, and favorable foreign exchange.
• Baskin-Robbins U.S. systemwide sales growth of 0.4% resulting primarily from comparable store sales growth of 0.5% and the extra week in fiscal year 2011, contributing approximately 140 basis points of growth, offset by a slightly reduced restaurant base.
• Baskin-Robbins International systemwide sales growth of 11.6% resulting from increased sales in South Korea and Japan, which resulted from both sales growth and favorable foreign exchange, as well as in the Middle East, and approximately 190 basis points of growth attributable to the extra week in fiscal year 2011.
The increase in total revenues of $51.1 million, or 8.8%, for fiscal year 2011 primarily resulted from increased franchise fees and royalty income of $38.5 million, driven by the increase in Dunkin’ Donuts U.S. systemwide sales, as well as a $15.1
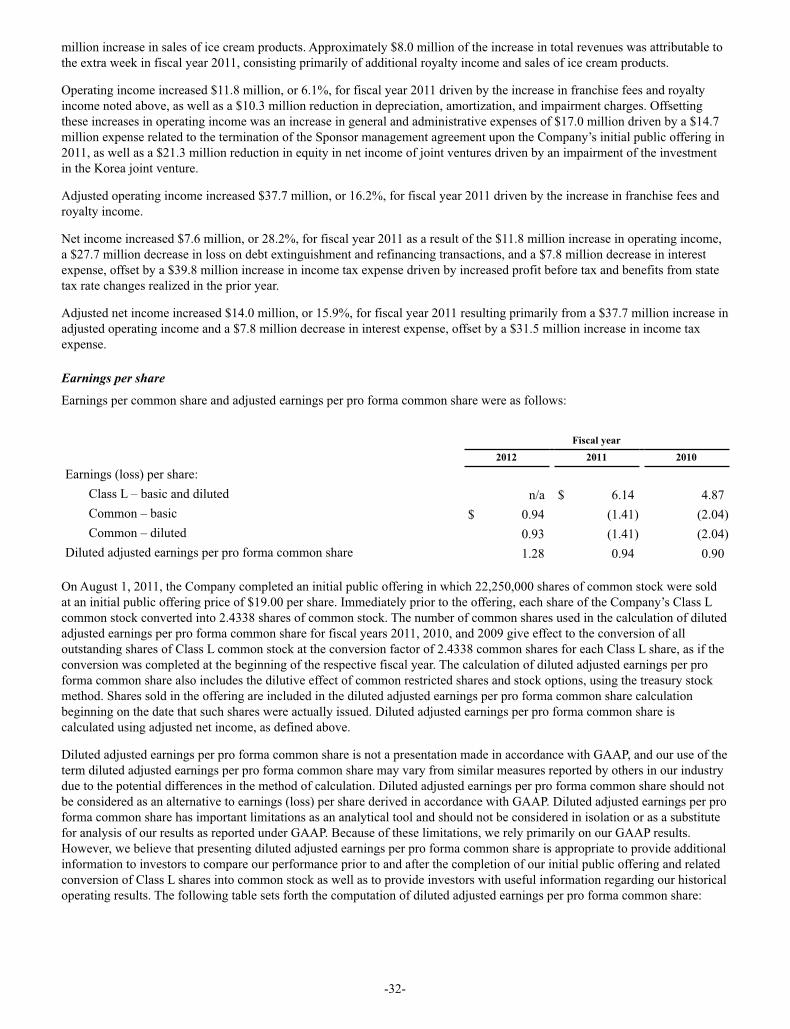
-32-
million increase in sales of ice cream products. Approximately $8.0 million of the increase in total revenues was attributable to the extra week in fiscal year 2011, consisting primarily of additional royalty income and sales of ice cream products.
Operating income increased $11.8 million, or 6.1%, for fiscal year 2011 driven by the increase in franchise fees and royalty income noted above, as well as a $10.3 million reduction in depreciation, amortization, and impairment charges. Offsetting these increases in operating income was an increase in general and administrative expenses of $17.0 million driven by a $14.7 million expense related to the termination of the Sponsor management agreement upon the Company’s initial public offering in 2011, as well as a $21.3 million reduction in equity in net income of joint ventures driven by an impairment of the investment in the Korea joint venture.
Adjusted operating income increased $37.7 million, or 16.2%, for fiscal year 2011 driven by the increase in franchise fees and royalty income.
Net income increased $7.6 million, or 28.2%, for fiscal year 2011 as a result of the $11.8 million increase in operating income, a $27.7 million decrease in loss on debt extinguishment and refinancing transactions, and a $7.8 million decrease in interest expense, offset by a $39.8 million increase in income tax expense driven by increased profit before tax and benefits from state tax rate changes realized in the prior year.
Adjusted net income increased $14.0 million, or 15.9%, for fiscal year 2011 resulting primarily from a $37.7 million increase in adjusted operating income and a $7.8 million decrease in interest expense, offset by a $31.5 million increase in income tax expense.
Earnings per share
Earnings per common share and adjusted earnings per pro forma common share were as follows:
Fiscal year 2012 2011 2010
Earnings (loss) per share:Class L – basic and diluted n/a $ 6.14 4.87Common – basic $ 0.94 (1.41) (2.04)Common – diluted 0.93 (1.41) (2.04)
Diluted adjusted earnings per pro forma common share 1.28 0.94 0.90
On August 1, 2011, the Company completed an initial public offering in which 22,250,000 shares of common stock were sold at an initial public offering price of $19.00 per share. Immediately prior to the offering, each share of the Company’s Class L common stock converted into 2.4338 shares of common stock. The number of common shares used in the calculation of diluted adjusted earnings per pro forma common share for fiscal years 2011, 2010, and 2009 give effect to the conversion of all outstanding shares of Class L common stock at the conversion factor of 2.4338 common shares for each Class L share, as if the conversion was completed at the beginning of the respective fiscal year. The calculation of diluted adjusted earnings per pro forma common share also includes the dilutive effect of common restricted shares and stock options, using the treasury stock method. Shares sold in the offering are included in the diluted adjusted earnings per pro forma common share calculation beginning on the date that such shares were actually issued. Diluted adjusted earnings per pro forma common share is calculated using adjusted net income, as defined above.
Diluted adjusted earnings per pro forma common share is not a presentation made in accordance with GAAP, and our use of the term diluted adjusted earnings per pro forma common share may vary from similar measures reported by others in our industry due to the potential differences in the method of calculation. Diluted adjusted earnings per pro forma common share should not be considered as an alternative to earnings (loss) per share derived in accordance with GAAP. Diluted adjusted earnings per pro forma common share has important limitations as an analytical tool and should not be considered in isolation or as a substitute for analysis of our results as reported under GAAP. Because of these limitations, we rely primarily on our GAAP results. However, we believe that presenting diluted adjusted earnings per pro forma common share is appropriate to provide additional information to investors to compare our performance prior to and after the completion of our initial public offering and related conversion of Class L shares into common stock as well as to provide investors with useful information regarding our historical operating results. The following table sets forth the computation of diluted adjusted earnings per pro forma common share:
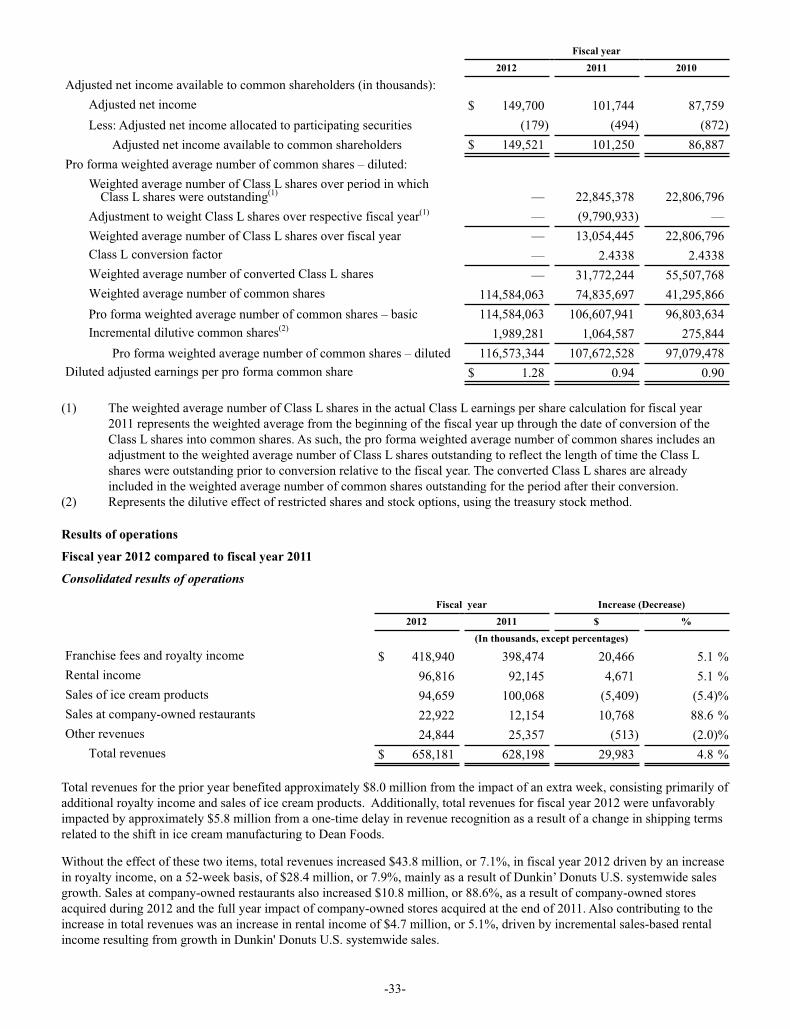
-33-
Fiscal year 2012 2011 2010
Adjusted net income available to common shareholders (in thousands):Adjusted net income $ 149,700 101,744 87,759Less: Adjusted net income allocated to participating securities (179) (494) (872)
Adjusted net income available to common shareholders $ 149,521 101,250 86,887Pro forma weighted average number of common shares – diluted:
Weighted average number of Class L shares over period in which Class L shares were outstanding(1) — 22,845,378 22,806,796
Adjustment to weight Class L shares over respective fiscal year(1) — (9,790,933) —Weighted average number of Class L shares over fiscal year — 13,054,445 22,806,796Class L conversion factor — 2.4338 2.4338Weighted average number of converted Class L shares — 31,772,244 55,507,768Weighted average number of common shares 114,584,063 74,835,697 41,295,866Pro forma weighted average number of common shares – basic 114,584,063 106,607,941 96,803,634Incremental dilutive common shares(2) 1,989,281 1,064,587 275,844
Pro forma weighted average number of common shares – diluted 116,573,344 107,672,528 97,079,478Diluted adjusted earnings per pro forma common share $ 1.28 0.94 0.90
(1) The weighted average number of Class L shares in the actual Class L earnings per share calculation for fiscal year
2011 represents the weighted average from the beginning of the fiscal year up through the date of conversion of the Class L shares into common shares. As such, the pro forma weighted average number of common shares includes an adjustment to the weighted average number of Class L shares outstanding to reflect the length of time the Class L shares were outstanding prior to conversion relative to the fiscal year. The converted Class L shares are already included in the weighted average number of common shares outstanding for the period after their conversion.
(2) Represents the dilutive effect of restricted shares and stock options, using the treasury stock method.
Results of operations
Fiscal year 2012 compared to fiscal year 2011
Consolidated results of operations
Fiscal year Increase (Decrease)
2012 2011 $ % (In thousands, except percentages)
Franchise fees and royalty income $ 418,940 398,474 20,466 5.1 %Rental income 96,816 92,145 4,671 5.1 %Sales of ice cream products 94,659 100,068 (5,409) (5.4)%Sales at company-owned restaurants 22,922 12,154 10,768 88.6 %Other revenues 24,844 25,357 (513) (2.0)%
Total revenues $ 658,181 628,198 29,983 4.8 %
Total revenues for the prior year benefited approximately $8.0 million from the impact of an extra week, consisting primarily of additional royalty income and sales of ice cream products. Additionally, total revenues for fiscal year 2012 were unfavorably impacted by approximately $5.8 million from a one-time delay in revenue recognition as a result of a change in shipping terms related to the shift in ice cream manufacturing to Dean Foods.
Without the effect of these two items, total revenues increased $43.8 million, or 7.1%, in fiscal year 2012 driven by an increase in royalty income, on a 52-week basis, of $28.4 million, or 7.9%, mainly as a result of Dunkin’ Donuts U.S. systemwide sales growth. Sales at company-owned restaurants also increased $10.8 million, or 88.6%, as a result of company-owned stores acquired during 2012 and the full year impact of company-owned stores acquired at the end of 2011. Also contributing to the increase in total revenues was an increase in rental income of $4.7 million, or 5.1%, driven by incremental sales-based rental income resulting from growth in Dunkin' Donuts U.S. systemwide sales.
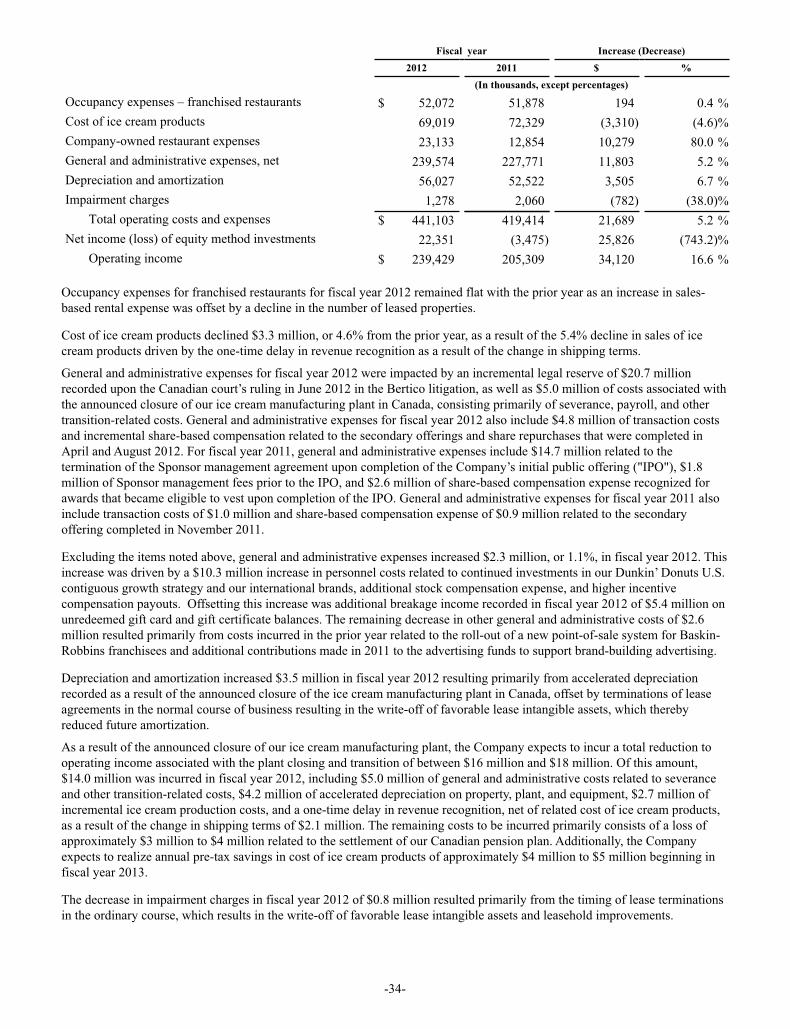
-34-
Fiscal year Increase (Decrease)
2012 2011 $ % (In thousands, except percentages)
Occupancy expenses – franchised restaurants $ 52,072 51,878 194 0.4 %Cost of ice cream products 69,019 72,329 (3,310) (4.6)%Company-owned restaurant expenses 23,133 12,854 10,279 80.0 %General and administrative expenses, net 239,574 227,771 11,803 5.2 %Depreciation and amortization 56,027 52,522 3,505 6.7 %Impairment charges 1,278 2,060 (782) (38.0)%
Total operating costs and expenses $ 441,103 419,414 21,689 5.2 %Net income (loss) of equity method investments 22,351 (3,475) 25,826 (743.2)%
Operating income $ 239,429 205,309 34,120 16.6 %
Occupancy expenses for franchised restaurants for fiscal year 2012 remained flat with the prior year as an increase in sales-based rental expense was offset by a decline in the number of leased properties.
Cost of ice cream products declined $3.3 million, or 4.6% from the prior year, as a result of the 5.4% decline in sales of ice cream products driven by the one-time delay in revenue recognition as a result of the change in shipping terms.
General and administrative expenses for fiscal year 2012 were impacted by an incremental legal reserve of $20.7 million recorded upon the Canadian court’s ruling in June 2012 in the Bertico litigation, as well as $5.0 million of costs associated with the announced closure of our ice cream manufacturing plant in Canada, consisting primarily of severance, payroll, and other transition-related costs. General and administrative expenses for fiscal year 2012 also include $4.8 million of transaction costs and incremental share-based compensation related to the secondary offerings and share repurchases that were completed in April and August 2012. For fiscal year 2011, general and administrative expenses include $14.7 million related to the termination of the Sponsor management agreement upon completion of the Company’s initial public offering ("IPO"), $1.8 million of Sponsor management fees prior to the IPO, and $2.6 million of share-based compensation expense recognized for awards that became eligible to vest upon completion of the IPO. General and administrative expenses for fiscal year 2011 also include transaction costs of $1.0 million and share-based compensation expense of $0.9 million related to the secondary offering completed in November 2011.
Excluding the items noted above, general and administrative expenses increased $2.3 million, or 1.1%, in fiscal year 2012. This increase was driven by a $10.3 million increase in personnel costs related to continued investments in our Dunkin’ Donuts U.S. contiguous growth strategy and our international brands, additional stock compensation expense, and higher incentive compensation payouts. Offsetting this increase was additional breakage income recorded in fiscal year 2012 of $5.4 million on unredeemed gift card and gift certificate balances. The remaining decrease in other general and administrative costs of $2.6 million resulted primarily from costs incurred in the prior year related to the roll-out of a new point-of-sale system for Baskin-Robbins franchisees and additional contributions made in 2011 to the advertising funds to support brand-building advertising.
Depreciation and amortization increased $3.5 million in fiscal year 2012 resulting primarily from accelerated depreciation recorded as a result of the announced closure of the ice cream manufacturing plant in Canada, offset by terminations of lease agreements in the normal course of business resulting in the write-off of favorable lease intangible assets, which thereby reduced future amortization.
As a result of the announced closure of our ice cream manufacturing plant, the Company expects to incur a total reduction to operating income associated with the plant closing and transition of between $16 million and $18 million. Of this amount, $14.0 million was incurred in fiscal year 2012, including $5.0 million of general and administrative costs related to severance and other transition-related costs, $4.2 million of accelerated depreciation on property, plant, and equipment, $2.7 million of incremental ice cream production costs, and a one-time delay in revenue recognition, net of related cost of ice cream products, as a result of the change in shipping terms of $2.1 million. The remaining costs to be incurred primarily consists of a loss of approximately $3 million to $4 million related to the settlement of our Canadian pension plan. Additionally, the Company expects to realize annual pre-tax savings in cost of ice cream products of approximately $4 million to $5 million beginning in fiscal year 2013.
The decrease in impairment charges in fiscal year 2012 of $0.8 million resulted primarily from the timing of lease terminations in the ordinary course, which results in the write-off of favorable lease intangible assets and leasehold improvements.
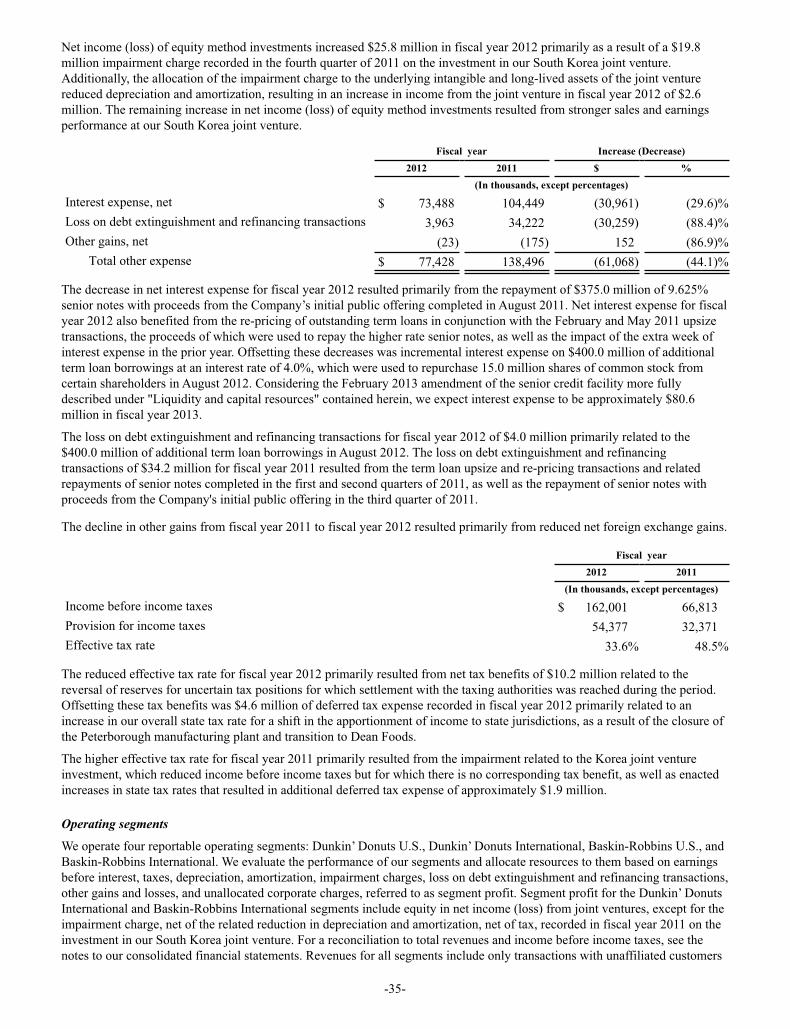
-35-
Net income (loss) of equity method investments increased $25.8 million in fiscal year 2012 primarily as a result of a $19.8 million impairment charge recorded in the fourth quarter of 2011 on the investment in our South Korea joint venture. Additionally, the allocation of the impairment charge to the underlying intangible and long-lived assets of the joint venture reduced depreciation and amortization, resulting in an increase in income from the joint venture in fiscal year 2012 of $2.6 million. The remaining increase in net income (loss) of equity method investments resulted from stronger sales and earnings performance at our South Korea joint venture.
Fiscal year Increase (Decrease)
2012 2011 $ % (In thousands, except percentages)
Interest expense, net $ 73,488 104,449 (30,961) (29.6)%Loss on debt extinguishment and refinancing transactions 3,963 34,222 (30,259) (88.4)%Other gains, net (23) (175) 152 (86.9)%
Total other expense $ 77,428 138,496 (61,068) (44.1)%
The decrease in net interest expense for fiscal year 2012 resulted primarily from the repayment of $375.0 million of 9.625% senior notes with proceeds from the Company’s initial public offering completed in August 2011. Net interest expense for fiscal year 2012 also benefited from the re-pricing of outstanding term loans in conjunction with the February and May 2011 upsize transactions, the proceeds of which were used to repay the higher rate senior notes, as well as the impact of the extra week of interest expense in the prior year. Offsetting these decreases was incremental interest expense on $400.0 million of additional term loan borrowings at an interest rate of 4.0%, which were used to repurchase 15.0 million shares of common stock from certain shareholders in August 2012. Considering the February 2013 amendment of the senior credit facility more fully described under "Liquidity and capital resources" contained herein, we expect interest expense to be approximately $80.6 million in fiscal year 2013.
The loss on debt extinguishment and refinancing transactions for fiscal year 2012 of $4.0 million primarily related to the $400.0 million of additional term loan borrowings in August 2012. The loss on debt extinguishment and refinancing transactions of $34.2 million for fiscal year 2011 resulted from the term loan upsize and re-pricing transactions and related repayments of senior notes completed in the first and second quarters of 2011, as well as the repayment of senior notes with proceeds from the Company's initial public offering in the third quarter of 2011.
The decline in other gains from fiscal year 2011 to fiscal year 2012 resulted primarily from reduced net foreign exchange gains.
Fiscal year2012 2011
(In thousands, except percentages)
Income before income taxes $ 162,001 66,813Provision for income taxes 54,377 32,371Effective tax rate 33.6% 48.5%
The reduced effective tax rate for fiscal year 2012 primarily resulted from net tax benefits of $10.2 million related to the reversal of reserves for uncertain tax positions for which settlement with the taxing authorities was reached during the period. Offsetting these tax benefits was $4.6 million of deferred tax expense recorded in fiscal year 2012 primarily related to an increase in our overall state tax rate for a shift in the apportionment of income to state jurisdictions, as a result of the closure of the Peterborough manufacturing plant and transition to Dean Foods.
The higher effective tax rate for fiscal year 2011 primarily resulted from the impairment related to the Korea joint venture investment, which reduced income before income taxes but for which there is no corresponding tax benefit, as well as enacted increases in state tax rates that resulted in additional deferred tax expense of approximately $1.9 million.
Operating segments
We operate four reportable operating segments: Dunkin’ Donuts U.S., Dunkin’ Donuts International, Baskin-Robbins U.S., and Baskin-Robbins International. We evaluate the performance of our segments and allocate resources to them based on earnings before interest, taxes, depreciation, amortization, impairment charges, loss on debt extinguishment and refinancing transactions, other gains and losses, and unallocated corporate charges, referred to as segment profit. Segment profit for the Dunkin’ Donuts International and Baskin-Robbins International segments include equity in net income (loss) from joint ventures, except for the impairment charge, net of the related reduction in depreciation and amortization, net of tax, recorded in fiscal year 2011 on the investment in our South Korea joint venture. For a reconciliation to total revenues and income before income taxes, see the notes to our consolidated financial statements. Revenues for all segments include only transactions with unaffiliated customers
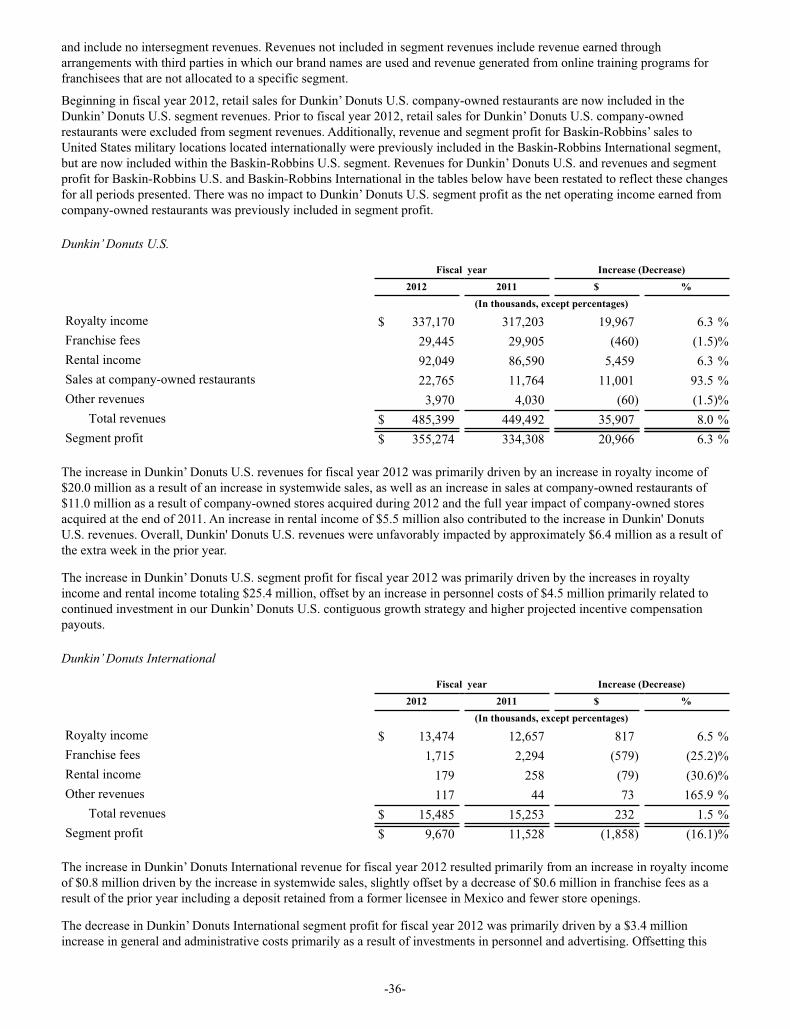
-36-
and include no intersegment revenues. Revenues not included in segment revenues include revenue earned through arrangements with third parties in which our brand names are used and revenue generated from online training programs for franchisees that are not allocated to a specific segment.
Beginning in fiscal year 2012, retail sales for Dunkin’ Donuts U.S. company-owned restaurants are now included in the Dunkin’ Donuts U.S. segment revenues. Prior to fiscal year 2012, retail sales for Dunkin’ Donuts U.S. company-owned restaurants were excluded from segment revenues. Additionally, revenue and segment profit for Baskin-Robbins’ sales to United States military locations located internationally were previously included in the Baskin-Robbins International segment, but are now included within the Baskin-Robbins U.S. segment. Revenues for Dunkin’ Donuts U.S. and revenues and segment profit for Baskin-Robbins U.S. and Baskin-Robbins International in the tables below have been restated to reflect these changes for all periods presented. There was no impact to Dunkin’ Donuts U.S. segment profit as the net operating income earned from company-owned restaurants was previously included in segment profit.
Dunkin’ Donuts U.S.
Fiscal year Increase (Decrease)
2012 2011 $ % (In thousands, except percentages)
Royalty income $ 337,170 317,203 19,967 6.3 %Franchise fees 29,445 29,905 (460) (1.5)%Rental income 92,049 86,590 5,459 6.3 %Sales at company-owned restaurants 22,765 11,764 11,001 93.5 %Other revenues 3,970 4,030 (60) (1.5)%
Total revenues $ 485,399 449,492 35,907 8.0 %Segment profit $ 355,274 334,308 20,966 6.3 %
The increase in Dunkin’ Donuts U.S. revenues for fiscal year 2012 was primarily driven by an increase in royalty income of $20.0 million as a result of an increase in systemwide sales, as well as an increase in sales at company-owned restaurants of $11.0 million as a result of company-owned stores acquired during 2012 and the full year impact of company-owned stores acquired at the end of 2011. An increase in rental income of $5.5 million also contributed to the increase in Dunkin' Donuts U.S. revenues. Overall, Dunkin' Donuts U.S. revenues were unfavorably impacted by approximately $6.4 million as a result of the extra week in the prior year.
The increase in Dunkin’ Donuts U.S. segment profit for fiscal year 2012 was primarily driven by the increases in royalty income and rental income totaling $25.4 million, offset by an increase in personnel costs of $4.5 million primarily related to continued investment in our Dunkin’ Donuts U.S. contiguous growth strategy and higher projected incentive compensation payouts.
Dunkin’ Donuts International
Fiscal year Increase (Decrease)
2012 2011 $ % (In thousands, except percentages)
Royalty income $ 13,474 12,657 817 6.5 %Franchise fees 1,715 2,294 (579) (25.2)%Rental income 179 258 (79) (30.6)%Other revenues 117 44 73 165.9 %
Total revenues $ 15,485 15,253 232 1.5 %Segment profit $ 9,670 11,528 (1,858) (16.1)%
The increase in Dunkin’ Donuts International revenue for fiscal year 2012 resulted primarily from an increase in royalty income of $0.8 million driven by the increase in systemwide sales, slightly offset by a decrease of $0.6 million in franchise fees as a result of the prior year including a deposit retained from a former licensee in Mexico and fewer store openings.
The decrease in Dunkin’ Donuts International segment profit for fiscal year 2012 was primarily driven by a $3.4 million increase in general and administrative costs primarily as a result of investments in personnel and advertising. Offsetting this
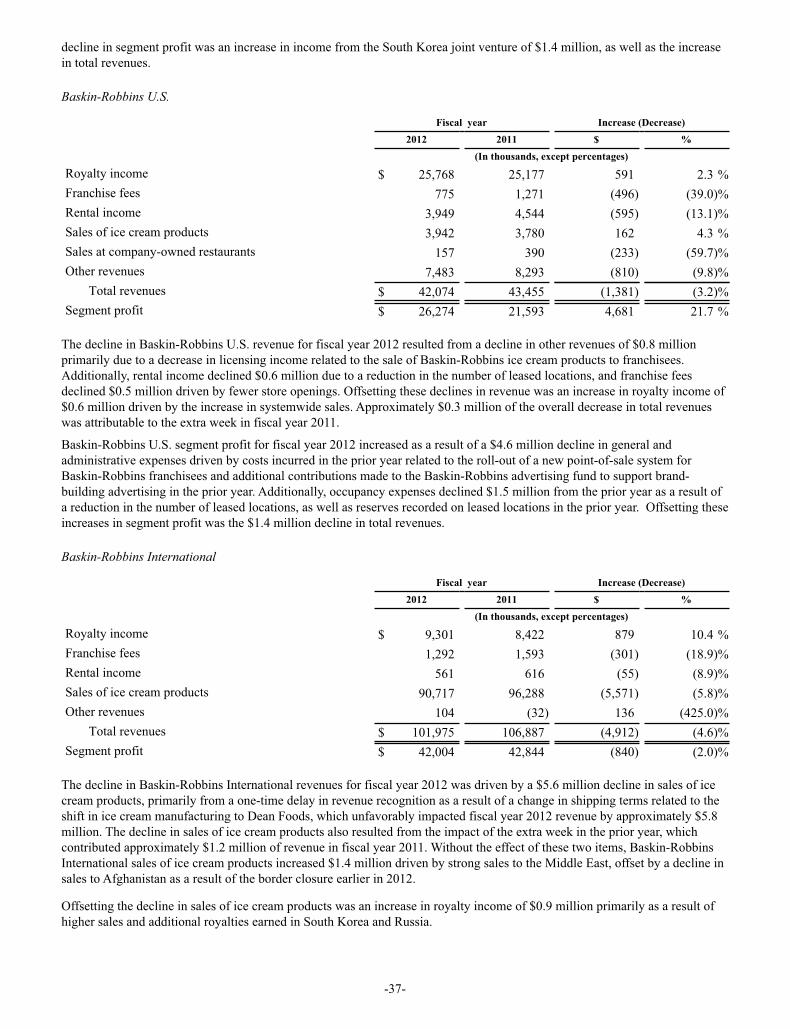
-37-
decline in segment profit was an increase in income from the South Korea joint venture of $1.4 million, as well as the increase in total revenues.
Baskin-Robbins U.S.
Fiscal year Increase (Decrease)
2012 2011 $ % (In thousands, except percentages)
Royalty income $ 25,768 25,177 591 2.3 %Franchise fees 775 1,271 (496) (39.0)%Rental income 3,949 4,544 (595) (13.1)%Sales of ice cream products 3,942 3,780 162 4.3 %Sales at company-owned restaurants 157 390 (233) (59.7)%Other revenues 7,483 8,293 (810) (9.8)%
Total revenues $ 42,074 43,455 (1,381) (3.2)%Segment profit $ 26,274 21,593 4,681 21.7 %
The decline in Baskin-Robbins U.S. revenue for fiscal year 2012 resulted from a decline in other revenues of $0.8 million primarily due to a decrease in licensing income related to the sale of Baskin-Robbins ice cream products to franchisees. Additionally, rental income declined $0.6 million due to a reduction in the number of leased locations, and franchise fees declined $0.5 million driven by fewer store openings. Offsetting these declines in revenue was an increase in royalty income of $0.6 million driven by the increase in systemwide sales. Approximately $0.3 million of the overall decrease in total revenues was attributable to the extra week in fiscal year 2011.
Baskin-Robbins U.S. segment profit for fiscal year 2012 increased as a result of a $4.6 million decline in general and administrative expenses driven by costs incurred in the prior year related to the roll-out of a new point-of-sale system for Baskin-Robbins franchisees and additional contributions made to the Baskin-Robbins advertising fund to support brand-building advertising in the prior year. Additionally, occupancy expenses declined $1.5 million from the prior year as a result of a reduction in the number of leased locations, as well as reserves recorded on leased locations in the prior year. Offsetting these increases in segment profit was the $1.4 million decline in total revenues.
Baskin-Robbins International
Fiscal year Increase (Decrease)
2012 2011 $ % (In thousands, except percentages)
Royalty income $ 9,301 8,422 879 10.4 %Franchise fees 1,292 1,593 (301) (18.9)%Rental income 561 616 (55) (8.9)%Sales of ice cream products 90,717 96,288 (5,571) (5.8)%Other revenues 104 (32) 136 (425.0)%
Total revenues $ 101,975 106,887 (4,912) (4.6)%Segment profit $ 42,004 42,844 (840) (2.0)%
The decline in Baskin-Robbins International revenues for fiscal year 2012 was driven by a $5.6 million decline in sales of ice cream products, primarily from a one-time delay in revenue recognition as a result of a change in shipping terms related to the shift in ice cream manufacturing to Dean Foods, which unfavorably impacted fiscal year 2012 revenue by approximately $5.8 million. The decline in sales of ice cream products also resulted from the impact of the extra week in the prior year, which contributed approximately $1.2 million of revenue in fiscal year 2011. Without the effect of these two items, Baskin-Robbins International sales of ice cream products increased $1.4 million driven by strong sales to the Middle East, offset by a decline in sales to Afghanistan as a result of the border closure earlier in 2012.
Offsetting the decline in sales of ice cream products was an increase in royalty income of $0.9 million primarily as a result of higher sales and additional royalties earned in South Korea and Russia.

-38-
The decrease in Baskin-Robbins International segment profit for fiscal year 2012 resulted primarily from an increase in general and administrative expenses of $2.0 million driven primarily by investments in personnel and advertising, as well as a $1.6 million decline in net margin on sales of ice cream products due primarily to the one-time delay in revenue recognition and the extra week in the prior year. Offsetting these declines in segment profit was an increase in income from the South Korea joint venture of $2.2 million, as well as the increase in royalty income of $0.9 million.
Fiscal year 2011 compared to fiscal year 2010
Consolidated results of operations
Fiscal year Increase (Decrease)
2011 2010 $ % (In thousands, except percentages)
Franchise fees and royalty income $ 398,474 359,927 38,547 10.7 %Rental income 92,145 91,102 1,043 1.1 %Sales of ice cream products 100,068 84,989 15,079 17.7 %Sales at company-owned restaurants 12,154 17,362 (5,208) (30.0)%Other revenues 25,357 23,755 1,602 6.7 %
Total revenues $ 628,198 577,135 51,063 8.8 %
The increase in total revenues for fiscal year 2011 of $51.1 million was driven by an increase in royalty income of $30.7 million, or 9.2%, mainly as a result of Dunkin’ Donuts U.S. systemwide sales growth, and a $6.8 million increase in franchise renewal income. Sales of ice cream products also increased $15.1 million, or 17.7%, driven by strong sales in the Middle East and Australia, a December 2010 price increase that was implemented to offset higher commodity costs, and an additional week of sales in fiscal year 2011. These increases in revenue were offset by a decrease in sales at company-owned restaurants of $5.2 million primarily as a result of a decline in the average number of company-owned stores held during fiscal year 2011. Approximately $8.0 million of the increase in total revenues was attributable to the extra week in fiscal year 2011, consisting primarily of additional royalty income and sales of ice cream products.
Fiscal year Increase (Decrease)
2011 2010 $ % (In thousands, except percentages)
Occupancy expenses – franchised restaurants $ 51,878 53,739 (1,861) (3.5)%Cost of ice cream products 72,329 59,175 13,154 22.2 %Company-owned restaurant expenses 12,854 17,825 (4,971) (27.9)%General and administrative expenses, net 227,771 205,795 21,976 10.7 %Depreciation and amortization 52,522 57,826 (5,304) (9.2)%Impairment charges 2,060 7,075 (5,015) (70.9)%
Total operating costs and expenses $ 419,414 401,435 17,979 4.5 %Net income (loss) of equity method investments (3,475) 17,825 (21,300) (119.5)%
Operating income $ 205,309 193,525 11,784 6.1 %
Occupancy expenses for franchised restaurants for fiscal year 2011 decreased $1.9 million resulting primarily from additional lease reserves recorded in the prior year and a decline in the number of leased properties. Cost of ice cream products increased 22.2% from the prior year, as compared to a 17.7% increase in sales of ice cream products, resulting from unfavorable commodity prices and foreign exchange, slightly offset by increases in selling prices. Company-owned restaurant expenses declined $5.0 million in fiscal year 2011 due to a reduction in the average number of company-owned stores.
General and administrative expenses for fiscal year 2011 includes certain expenses related to our initial public offering completed in August 2011 and a secondary offering completed in December 2011. Upon completion of the initial public offering, the Sponsor management agreement was terminated resulting in a $13.4 million increase in management fees, consisting of a $14.7 million expense incurred upon termination offset by no longer incurring the $3.0 million annual management fee expense post-termination. Additionally, $2.6 million of share-based compensation expense was recorded upon completion of the initial public offering related to approximately 0.8 million restricted shares granted to employees that were not eligible to vest until completion of an initial public offering or change of control (performance condition). No future expense will be recorded related to this tranche of restricted shares. The Company also recorded incremental share-based

-39-
compensation expense of approximately $0.9 million upon completion of the secondary offering in December 2011, related to approximately 0.3 million stock options granted to employees that were not eligible to vest until the sale or disposition of shares held by our Sponsors (performance condition). Finally, the Company incurred approximately $1.0 million of transaction costs related to the secondary offering in fiscal year 2011.
Excluding the offering-related costs above, general and administrative expenses declined $4.0 million, or 2.0%, in fiscal year 2011. This decrease was driven by a decline of $9.1 million in professional fees and legal costs resulting from reduced information technology expenses and legal settlement reserves, as well as a $0.8 million decline in occupancy costs due to lease reserves recorded in the prior year. Offsetting these declines was an increase in personnel costs of $12.9 million, of which approximately $2.4 million was attributable to the extra week in fiscal year 2011, with the remaining increase related to investment in our Dunkin’ Donuts U.S. contiguous growth strategy and higher projected incentive compensation payouts, offset by prior year costs associated with our executive chairman transition. Additionally, other general and administrative expenses increased $1.1 million primarily as a result of expenses incurred related to the roll-out of a new point-of-sale system for Baskin-Robbins franchisees.
Depreciation and amortization declined $5.3 million in fiscal year 2011 resulting primarily from a license right intangible asset becoming fully amortized in July 2010, as well as terminations of lease agreements in the normal course of business resulting in the write-off of favorable lease intangible assets, which thereby reduced future amortization. Additionally, depreciation declined due to assets becoming fully depreciated and the write-off of leasehold improvements upon terminations of lease agreements, slightly offset by depreciation on capital purchases.
The decrease in impairment charges in fiscal year 2011 of $5.0 million resulted primarily from the timing of lease terminations in the ordinary course, which results in the write-off of favorable lease intangible assets and leasehold improvements.
Net income (loss) of equity method investments decreased $21.3 million in fiscal year 2011 primarily as a result of a $19.8 million impairment charge recorded on the investment in our South Korea joint venture, offset by a reduction in depreciation and amortization, net of tax, of $1.0 million resulting from the allocation of the impairment charge to the underlying intangible and long-lived assets of the joint venture. The remaining decline in net income (loss) of equity method investments resulted from higher expenses for our South Korea joint venture, slightly offset by stronger earnings from our Japan joint venture.
Fiscal year Increase (Decrease)
2011 2010 $ % (In thousands, except percentages)
Interest expense, net $ 104,449 112,532 (8,083) (7.2)%Loss on debt extinguishment and refinancing transactions 34,222 61,955 (27,733) (44.8)%Other gains, net (175) (408) 233 (57.1)%
Total other expense $ 138,496 174,079 (35,583) (20.4)%
The decrease in net interest expense for fiscal year 2011 resulted primarily from reductions in the average cost of borrowing due to refinancing and re-pricing transactions, offset by an increase in the weighted average long-term debt outstanding and an extra week of interest expense in fiscal year 2011. As the senior notes were fully repaid upon completion of the initial public offering on August 1, 2011, interest expense is expected to decrease in the future and remain consistent with the net interest expense realized in the fourth quarter of 2011 on a 13-week basis.
The loss on debt extinguishment incurred in fiscal year 2010 resulted from the refinancing of existing long-term debt in the fourth quarter of 2010, which yielded a $58.3 million loss, as well as the voluntary retirement of long-term debt in the second quarter of 2010, which resulted in a $3.7 million loss. The loss on debt extinguishment and refinancing transactions incurred in fiscal year 2011 resulted from the completion of the initial public offering and related repayment of senior notes, as well as term loan re-pricing and upsize transactions completed in the first half of 2011. Loss on debt extinguishment and refinancing transactions in 2011 totaled $25.9 million related to the retirement of senior notes and $8.3 million related to term loans.
The decline in other gains from fiscal 2010 to fiscal 2011 resulted primarily from reduced net foreign exchange gains.
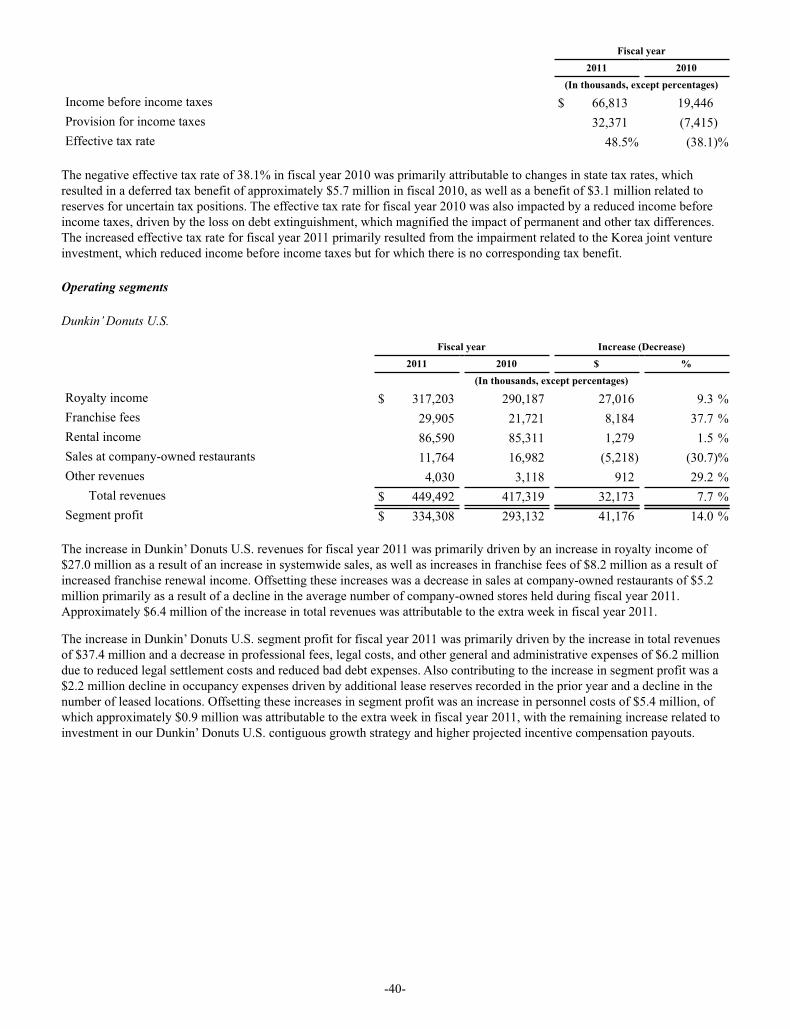
-40-
Fiscal year2011 2010
(In thousands, except percentages)
Income before income taxes $ 66,813 19,446Provision for income taxes 32,371 (7,415)Effective tax rate 48.5% (38.1)%
The negative effective tax rate of 38.1% in fiscal year 2010 was primarily attributable to changes in state tax rates, which resulted in a deferred tax benefit of approximately $5.7 million in fiscal 2010, as well as a benefit of $3.1 million related to reserves for uncertain tax positions. The effective tax rate for fiscal year 2010 was also impacted by a reduced income before income taxes, driven by the loss on debt extinguishment, which magnified the impact of permanent and other tax differences. The increased effective tax rate for fiscal year 2011 primarily resulted from the impairment related to the Korea joint venture investment, which reduced income before income taxes but for which there is no corresponding tax benefit.
Operating segments
Dunkin’ Donuts U.S.
Fiscal year Increase (Decrease)
2011 2010 $ % (In thousands, except percentages)
Royalty income $ 317,203 290,187 27,016 9.3 %Franchise fees 29,905 21,721 8,184 37.7 %Rental income 86,590 85,311 1,279 1.5 %Sales at company-owned restaurants 11,764 16,982 (5,218) (30.7)%Other revenues 4,030 3,118 912 29.2 %
Total revenues $ 449,492 417,319 32,173 7.7 %Segment profit $ 334,308 293,132 41,176 14.0 %
The increase in Dunkin’ Donuts U.S. revenues for fiscal year 2011 was primarily driven by an increase in royalty income of $27.0 million as a result of an increase in systemwide sales, as well as increases in franchise fees of $8.2 million as a result of increased franchise renewal income. Offsetting these increases was a decrease in sales at company-owned restaurants of $5.2 million primarily as a result of a decline in the average number of company-owned stores held during fiscal year 2011. Approximately $6.4 million of the increase in total revenues was attributable to the extra week in fiscal year 2011.
The increase in Dunkin’ Donuts U.S. segment profit for fiscal year 2011 was primarily driven by the increase in total revenues of $37.4 million and a decrease in professional fees, legal costs, and other general and administrative expenses of $6.2 million due to reduced legal settlement costs and reduced bad debt expenses. Also contributing to the increase in segment profit was a $2.2 million decline in occupancy expenses driven by additional lease reserves recorded in the prior year and a decline in the number of leased locations. Offsetting these increases in segment profit was an increase in personnel costs of $5.4 million, of which approximately $0.9 million was attributable to the extra week in fiscal year 2011, with the remaining increase related to investment in our Dunkin’ Donuts U.S. contiguous growth strategy and higher projected incentive compensation payouts.

-41-
Dunkin’ Donuts International
Fiscal year Increase (Decrease)
2011 2010 $ % (In thousands, except percentages)
Royalty income $ 12,657 11,353 1,304 11.5 %Franchise fees 2,294 2,438 (144) (5.9)%Rental income 258 303 (45) (14.9)%Other revenues 44 34 10 29.4 %
Total revenues $ 15,253 14,128 1,125 8.0 %Segment profit $ 11,528 14,573 (3,045) (20.9)%
The increase in Dunkin’ Donuts International revenue for fiscal year 2011 resulted primarily from an increase in royalty income of $1.3 million driven by the increase in systemwide sales, slightly offset by a decrease of $0.1 million in franchise fees driven by fewer store openings.
The decrease in Dunkin’ Donuts International segment profit for fiscal year 2011 was primarily driven by a decline in income from the South Korea joint venture of $3.1 million, as well as increases in personnel costs and travel of $0.9 million. These declines in segment profit were offset by the increase in total revenues.
Baskin-Robbins U.S.
Fiscal year Increase (Decrease)
2011 2010 $ % (In thousands, except percentages)
Royalty income $ 25,177 25,039 138 0.6 %Franchise fees 1,271 1,709 (438) (25.6)%Rental income 4,544 4,842 (298) (6.2)%Sales of ice cream products 3,780 4,027 (247) (6.1)%Sales at company-owned restaurants 390 380 10 2.6 %Other revenues 8,293 8,804 (511) (5.8)%
Total revenues $ 43,455 44,801 (1,346) (3.0)%Segment profit $ 21,593 28,446 (6,853) (24.1)%
The decline in Baskin-Robbins U.S. revenue for fiscal year 2011 primarily resulted from a decline in other revenues of $0.5 million due to a decrease in licensing income related to the sale of Baskin-Robbins ice cream products to franchisees. Additionally, franchise fees declined $0.4 million driven by fewer store openings, and rental income declined $0.3 million due to a reduction in the number of leased locations. Approximately $0.3 million of the increase in total revenues was attributable to the extra week in fiscal year 2011.
Baskin-Robbins U.S. segment profit for fiscal year 2011 declined as a result of increased other general and administrative expenses of $4.5 million primarily related to the roll-out of a new point-of-sale system for Baskin-Robbins franchisees, as well as additional contributions to the Baskin-Robbins advertising fund to support national brand-building advertising. In addition to the declines in revenues, segment profit also declined due to increased personnel costs and travel of $1.2 million.
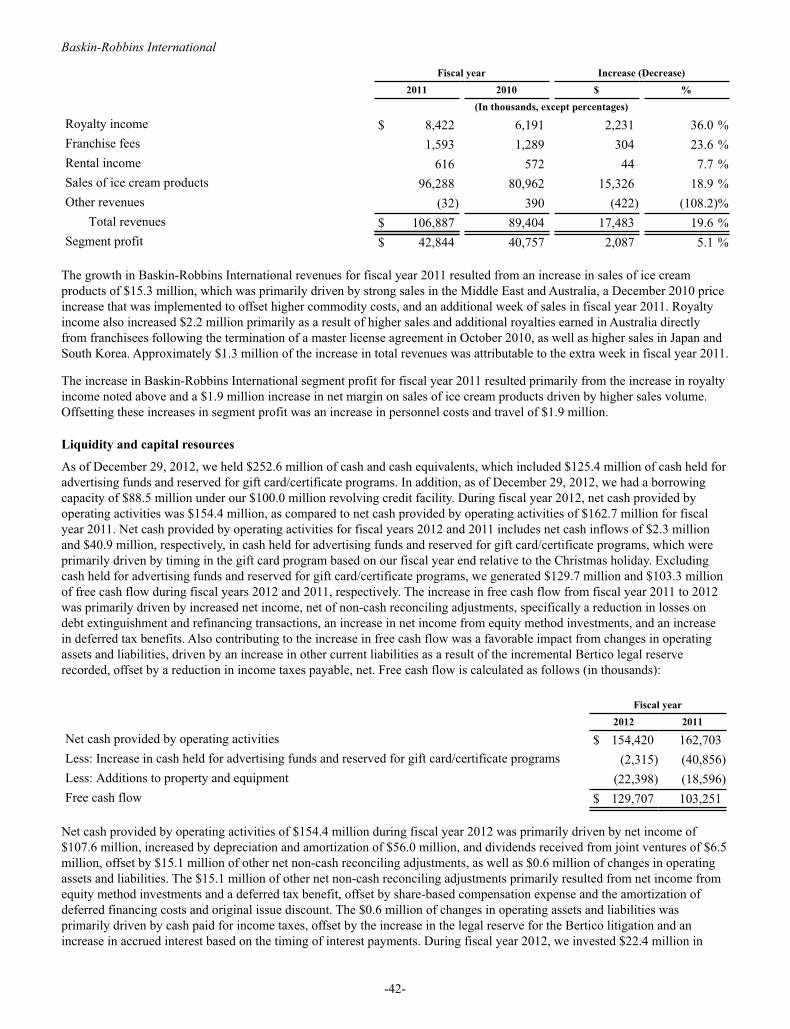
-42-
Baskin-Robbins International
Fiscal year Increase (Decrease)
2011 2010 $ % (In thousands, except percentages)
Royalty income $ 8,422 6,191 2,231 36.0 %Franchise fees 1,593 1,289 304 23.6 %Rental income 616 572 44 7.7 %Sales of ice cream products 96,288 80,962 15,326 18.9 %Other revenues (32) 390 (422) (108.2)%
Total revenues $ 106,887 89,404 17,483 19.6 %Segment profit $ 42,844 40,757 2,087 5.1 %
The growth in Baskin-Robbins International revenues for fiscal year 2011 resulted from an increase in sales of ice cream products of $15.3 million, which was primarily driven by strong sales in the Middle East and Australia, a December 2010 price increase that was implemented to offset higher commodity costs, and an additional week of sales in fiscal year 2011. Royalty income also increased $2.2 million primarily as a result of higher sales and additional royalties earned in Australia directly from franchisees following the termination of a master license agreement in October 2010, as well as higher sales in Japan and South Korea. Approximately $1.3 million of the increase in total revenues was attributable to the extra week in fiscal year 2011.
The increase in Baskin-Robbins International segment profit for fiscal year 2011 resulted primarily from the increase in royalty income noted above and a $1.9 million increase in net margin on sales of ice cream products driven by higher sales volume. Offsetting these increases in segment profit was an increase in personnel costs and travel of $1.9 million.
Liquidity and capital resources
As of December 29, 2012, we held $252.6 million of cash and cash equivalents, which included $125.4 million of cash held for advertising funds and reserved for gift card/certificate programs. In addition, as of December 29, 2012, we had a borrowing capacity of $88.5 million under our $100.0 million revolving credit facility. During fiscal year 2012, net cash provided by operating activities was $154.4 million, as compared to net cash provided by operating activities of $162.7 million for fiscal year 2011. Net cash provided by operating activities for fiscal years 2012 and 2011 includes net cash inflows of $2.3 million and $40.9 million, respectively, in cash held for advertising funds and reserved for gift card/certificate programs, which were primarily driven by timing in the gift card program based on our fiscal year end relative to the Christmas holiday. Excluding cash held for advertising funds and reserved for gift card/certificate programs, we generated $129.7 million and $103.3 million of free cash flow during fiscal years 2012 and 2011, respectively. The increase in free cash flow from fiscal year 2011 to 2012 was primarily driven by increased net income, net of non-cash reconciling adjustments, specifically a reduction in losses on debt extinguishment and refinancing transactions, an increase in net income from equity method investments, and an increase in deferred tax benefits. Also contributing to the increase in free cash flow was a favorable impact from changes in operating assets and liabilities, driven by an increase in other current liabilities as a result of the incremental Bertico legal reserve recorded, offset by a reduction in income taxes payable, net. Free cash flow is calculated as follows (in thousands):
Fiscal year 2012 2011
Net cash provided by operating activities $ 154,420 162,703Less: Increase in cash held for advertising funds and reserved for gift card/certificate programs (2,315) (40,856)Less: Additions to property and equipment (22,398) (18,596)Free cash flow $ 129,707 103,251
Net cash provided by operating activities of $154.4 million during fiscal year 2012 was primarily driven by net income of $107.6 million, increased by depreciation and amortization of $56.0 million, and dividends received from joint ventures of $6.5 million, offset by $15.1 million of other net non-cash reconciling adjustments, as well as $0.6 million of changes in operating assets and liabilities. The $15.1 million of other net non-cash reconciling adjustments primarily resulted from net income from equity method investments and a deferred tax benefit, offset by share-based compensation expense and the amortization of deferred financing costs and original issue discount. The $0.6 million of changes in operating assets and liabilities was primarily driven by cash paid for income taxes, offset by the increase in the legal reserve for the Bertico litigation and an increase in accrued interest based on the timing of interest payments. During fiscal year 2012, we invested $22.4 million in

-43-
capital additions to property and equipment. Net cash used in financing activities was $125.6 million during fiscal year 2012, driven primarily by the repurchase of common stock of $450.4 million and dividend payments of $70.1 million, offset by net proceeds from the issuance of long-term debt of $380.6 million and additional tax benefits of $12.0 million realized from the exercise of stock options. The cash used for the repurchase of common stock was related to 15.0 million shares of common stock repurchased directly from certain shareholders in a private, non-underwritten transaction in August 2012. In connection with that repurchase, we borrowed an additional $400.0 million, less original issue discount of $4.0 million, under our existing term loan facility.
Net cash provided by operating activities of $162.7 million during fiscal year 2011 was primarily driven by net income of $34.4 million, increased by depreciation and amortization of $52.5 million and $35.5 million of other net non-cash reconciling adjustments, $32.9 million of changes in operating assets and liabilities, and dividends received from joint ventures of $7.4 million. During fiscal year 2011, we invested $18.6 million in capital additions to property and equipment. Net cash used in financing activities was $30.1 million during fiscal year 2011, driven primarily by the repayment of long-term debt, net of proceeds from additional borrowings under the term loans, totaling $404.6 million and costs associated with the term loan re-pricing and upsize transactions of $20.1 million, offset by proceeds from our initial public offering, net of offering costs paid, of $390.0 million and proceeds from other issuances of common stock of $3.2 million.
Our senior credit facility is guaranteed by certain of Dunkin’ Brands, Inc.’s wholly-owned domestic subsidiaries and includes a term loan facility and a revolving credit facility. The aggregate borrowings available under the senior secured credit facility are approximately $2.00 billion, consisting of a fully-drawn approximately $1.90 billion term loan facility and an undrawn $100.0 million revolving credit facility under which there was $88.5 million in available borrowings and $11.5 million of letters of credit outstanding as of December 29, 2012.
In February 2013, we amended the senior credit facility to extend the maturity of the term loan facility and revolving credit facility to February 2020 and February 2018, respectively. Considering the February 2013 amendment to the senior credit facility, principal amortization repayments are required to be made on term loan borrowings equal to approximately $19.0 million per calendar year, payable in quarterly installments through December 2019. The final scheduled principal payment on the outstanding borrowings under the term loan, as amended, is due in February 2020. Additionally, following the end of each fiscal year, the Company is required to prepay an amount equal to 25% of excess cash flow (as defined in the senior credit facility) for such fiscal year. If DBI’s leverage ratio, which is a measure of DBI’s outstanding debt to earnings before interest, taxes, depreciation, and amortization, adjusted for certain items (as specified in the senior credit facility), is less than 4.75x, no excess cash flow payments are required. Based on fiscal year 2012 excess cash flow and leverage ratio requirements, considering all payments made, the excess cash flow payment required in the first quarter of 2013 will be $21.7 million, which may be applied to future minimum required principal payments. However, the Company intends on making quarterly payments of $5.0 million.
Borrowings under the term loan bear interest, payable at least quarterly. Borrowings under the revolving credit facility (excluding letters of credit) bear interest, payable at least quarterly. We also pay a 0.5% commitment fee per annum on the unused portion of the revolver. As of December 29, 2012, the fee for letter of credit amounts outstanding was 3.0%. As of December 29, 2012, borrowings under the senior credit facility bear interest at a rate per annum equal to an applicable margin plus, at our option, either (1) a base rate determined by reference to the highest of (a) the Federal Funds rate plus 0.5%, (b) the prime rate, (c) the LIBOR rate plus 1.0%, and (d) 2.0% or (2) a LIBOR rate provided that LIBOR shall not be lower than 1.0%. As of December 29, 2012, the applicable margin under the senior credit facility was 2.0% for loans based upon the base rate and 3.0% for loans based upon the LIBOR rate.
As a result of the February 2013 amendment to the senior credit facility, the applicable margin for the term loan facility was reduced to 1.75% for loans based upon the base rate and 2.75% for loans based upon the LIBOR rate. Subsequent to the amendment to the senior credit facility, borrowings under the revolving credit facility bear interest at a rate per annum equal to an applicable margin plus, at our option, either (1) a base rate determined by reference to the highest of (a) the Federal Funds rate plus 0.5%, (b) the prime rate, and (c) the LIBOR rate plus 1.0%, or (2) a LIBOR rate. The applicable margin under the amended revolving credit facility is 1.5% for loans based upon the base rate and 2.5% for loans based upon the LIBOR rate. In addition, we are required to pay a 0.5% commitment fee per annum on the unused portion of the revolver and a fee for letter of credit amounts outstanding of 2.5%.
In September 2012, we entered into variable-to-fixed interest rate swap agreements to hedge the floating interest rate on $900.0 million notional amount of our outstanding term loan borrowings. We are required to make quarterly payments on the notional amount at a fixed average interest rate of approximately 1.37%. In exchange, we receive interest on the notional amount at a variable rate based on three-month LIBOR spot rate, subject to a 1.0% floor. The February 2013 amendment to the senior credit facility had no impact on our interest rate swap agreements.
The senior credit facility requires us to comply on a quarterly basis with certain financial covenants, including a maximum ratio (the “leverage ratio”) of debt to adjusted earnings before interest, taxes, depreciation, and amortization (“EBITDA”) and a

-44-
minimum ratio (the “interest coverage ratio”) of adjusted EBITDA to interest expense, each of which becomes more restrictive over time. For fiscal year 2012, the terms of the senior credit facility require that we maintain a leverage ratio of no more than 8.25 to 1.00 and a minimum interest coverage ratio of 1.55 to 1.00. The leverage ratio financial covenant will become more restrictive over time and will require us to maintain a leverage ratio of no more than 6.25 to 1.00 by the second quarter of fiscal year 2017. The interest coverage ratio financial covenant will also become more restrictive over time and will require us to maintain an interest coverage ratio of no less than 1.95 to 1.00 by the second quarter of fiscal year 2017. Failure to comply with either of these covenants would result in an event of default under our senior credit facility unless waived by our senior credit facility lenders. An event of default under our senior credit facility can result in the acceleration of our indebtedness under the facility. Adjusted EBITDA is a non-GAAP measure used to determine our compliance with certain covenants contained in our senior credit facility, including our leverage ratio. Adjusted EBITDA is defined in our senior credit facility as net income/(loss) before interest, taxes, depreciation and amortization and impairment of long-lived assets, as adjusted for the items summarized in the table below. Adjusted EBITDA is not a presentation made in accordance with GAAP, and our use of the term adjusted EBITDA varies from others in our industry due to the potential inconsistencies in the method of calculation and differences due to items subject to interpretation. Adjusted EBITDA should not be considered as an alternative to net income, operating income or any other performance measures derived in accordance with GAAP, as a measure of operating performance or as an alternative to cash flows as a measure of liquidity. Adjusted EBITDA has important limitations as an analytical tool and should not be considered in isolation or as a substitute for analysis of our results as reported under GAAP. Because of these limitations we rely primarily on our GAAP results. However, we believe that presenting adjusted EBITDA is appropriate to provide additional information to investors to demonstrate compliance with our financing covenants. As of December 29, 2012, we were in compliance with our senior credit facility financial covenants, including a leverage ratio of 5.15 to 1.00 and an interest coverage ratio of 5.08 to 1.00, which were calculated for fiscal year 2012 based upon the adjustments to EBITDA, as provided for under the terms of our senior credit facility. The following is a reconciliation of our net income to such adjusted EBITDA for fiscal year 2012 (in thousands):
Fiscal year
2012
Net income including noncontrolling interests $ 107,624Interest expense 74,031Income tax expense 54,377Depreciation and amortization 56,027Impairment charges 1,278EBITDA 293,337Adjustments:Non-cash adjustments(a) 29,628Transaction costs(b) 1,682Loss on debt extinguishment and refinancing transactions(c) 3,963Severance charges(d) 4,591Other(e) 7,759Total adjustments 47,623Adjusted EBITDA $ 340,960
(a) Represents non-cash adjustments, including stock compensation expense, legal reserves, and other non-cash gains and losses.
(b) Represents direct and indirect cost and expenses related to the Company’s secondary offering transactions.
(c) Represents transaction costs associated with the refinancing of long-term debt, which consists primarily of fees paid to third parties.
(d) Represents severance and related benefits costs associated with non-recurring reorganizations.
(e) Represents one-time costs and fees associated with entry into new markets, costs associated with various franchisee-related information technology investments and one-time market research programs, and the net impact of other non-recurring and individually insignificant adjustments.
Based upon our current level of operations and anticipated growth, we believe that the cash generated from our operations and amounts available under our revolving credit facility will be adequate to meet our anticipated debt service requirements, capital expenditures and working capital needs for at least the next twelve months. We believe that we will be able to meet these obligations even if we experience no growth in sales or profits. There can be no assurance, however, that our business will generate sufficient cash flows from operations or that future borrowings will be available under our revolving credit facility or

-45-
otherwise to enable us to service our indebtedness, including our senior secured credit facility, or to make anticipated capital expenditures. Our future operating performance and our ability to service, extend or refinance the senior secured credit facility will be subject to future economic conditions and to financial, business and other factors, many of which are beyond our control.
Off balance sheet obligations
In limited instances, we issue guarantees to financial institutions so that our franchisees can obtain financing with terms of approximately three to ten years for various business purposes. We recognize a liability and offsetting asset for the fair value of such guarantees. The fair value of a guarantee is based on historical default rates of our total guaranteed loan pool. We monitor the financial condition of our franchisees and record provisions for estimated losses on guaranteed liabilities of our franchisees if we believe that our franchisees are unable to make their required payments. As of December 29, 2012, if all of our outstanding guarantees of franchisee financing obligations came due simultaneously, we would be liable for approximately $4.7 million. As of December 29, 2012, we had recorded reserves for such guarantees of $389 thousand. We generally have cross-default provisions with these franchisees that would put the franchisee in default of its franchise agreement in the event of non-payment under such loans. We believe these cross-default provisions significantly reduce the risk that we would not be able to recover the amount of required payments under these guarantees and, historically, we have not incurred significant losses under these guarantees due to defaults by our franchisees.
We have entered into a third-party guarantee with a distribution facility of franchisee products that ensures franchisees will purchase a certain volume of product over a 10-year period. As product is purchased by our franchisees over the term of the agreement, the amount of the guarantee is reduced. As of December 29, 2012, we were contingently liable for $6.8 million, under this guarantee. We have also entered into a third-party guarantee with this distribution facility that ensures franchisees will sell a certain volume of product each year over a 5-year period. As of December 29, 2012, we were contingently liable for $7.5 million under this guarantee. Additionally, we have various supply chain contracts that provide for purchase commitments or exclusivity, the majority of which result in the Company being contingently liable upon early termination of the agreement or engaging with another supplier. As of December 29, 2012, we were contingently liable under such supply chain agreements for approximately $57.5 million. We assess the risk of performing under each of these guarantees on a quarterly basis, and, based on various factors including internal forecasts, prior history, and ability to extend contract terms, we have not recorded any liabilities related to these commitments
As a result of assigning our interest in obligations under property leases as a condition of the refranchising of certain restaurants and the guarantee of certain other leases, we are contingently liable on certain lease agreements. These leases have varying terms, the latest of which expires in 2026. As of December 29, 2012, the potential amount of undiscounted payments we could be required to make in the event of nonpayment by the primary lessee was $5.6 million. Our franchisees are the primary lessees under the majority of these leases. We generally have cross-default provisions with these franchisees that would put them in default of their franchise agreement in the event of nonpayment under the lease. We believe these cross-default provisions significantly reduce the risk that we will be required to make payments under these leases, and we have not recorded a liability for such contingent liabilities.
Contractual obligations
The following table sets forth our contractual obligations as of December 29, 2012, and additionally reflects the impact of the February 2013 refinancing transaction:
(In millions) TotalLess than
1 year1-3
years3-5
yearsMore than
5 years
Long-term debt(1) $ 2,420.8 92.4 182.6 188.0 1,957.8Capital lease obligations 12.7 1.0 2.0 2.1 7.6Operating lease obligations 619.1 53.7 100.2 92.9 372.3Purchase obligations and guarantees(2)(3) — — — — —Short and long-term obligations(4) 2.5 2.4 0.1 — —
Total(5) $ 3,055.1 149.5 284.9 283.0 2,337.7
(1) Amounts include mandatory principal payments on long-term debt excluding the impact of any additional principal payments previously made, as well as estimated interest of $73.4 million, $144.7 million, $150.1 million, and $194.5 million for less than 1 year, 1-3 years, 3-5 years, and more than 5 years, respectively. Interest on the $1.9 billion of term loans under our senior credit facility is variable, subject to an interest rate floor, and has been estimated based on a LIBOR yield curve. Additionally, estimated interest also reflects the impact of our variable-to-fixed interest rate

-46-
swap agreements. Our term loans also require us to prepay an amount equal to 25% of excess cash flow (as defined in the senior credit facility) for the preceding fiscal year based on our leverage ratio at the end of the fiscal year. If our leverage ratio is less than 4.75x, then no excess cash flow prepayment is required. An excess cash flow payment of $21.7 million payable in the first quarter of 2013 based on actual excess cash flow for fiscal year 2012 is not reflected above, as such amount may be deducted from future minimum required principal payments. Excess cash flow prepayments have not been reflected for any other future years in the contractual obligation amounts above.
(2) We have entered into two third-party guarantees with a distribution facility of franchisee products that ensures franchisees will purchase or sell a certain volume of product. As of December 29, 2012, we were contingently liable for $6.8 million and $7.5 million under these guarantees. We have various supply chain contracts that provide for purchase commitments or exclusivity, the majority of which result in our being contingently liable upon early termination of the agreement or engaging with another supplier. Based on prior history and our ability to extend contract terms, we have not recorded any liabilities related to these commitments. As of December 29, 2012, we were contingently liable under such supply chain agreements for approximately $57.5 million. Such amounts are not included in the table above as timing of payment, if any, is uncertain.
(3) We are guarantors of and are contingently liable for certain lease arrangements primarily as the result of our assigning our interest. As of December 29, 2012, we were contingently liable for $5.6 million under these guarantees, which are discussed further above in “Off Balance Sheet Obligations.” Additionally, in certain cases, we issue guarantees to financial institutions so that franchisees can obtain financing. If all outstanding guarantees, which are discussed further below in “Critical accounting policies,” came due as of December 29, 2012, we would be liable for approximately $4.7 million. Such amounts are not included in the table above as timing of payment, if any, is uncertain.
(4) Amounts include obligations to former employees under transition and severance agreements. Excluded from these amounts are any payments that may be required related to pending litigation, such as the Bertico matter more fully described in note 17(d) to our consolidated financial statements included herein, as the amount and timing of cash requirements, if any, are uncertain.
(5) Income tax liabilities for uncertain tax positions are excluded from the table above as we are not able to make a reasonably reliable estimate of the amount and period of related future payments. As of December 29, 2012, the Company has a liability for uncertain tax positions, including accrued interest and penalties thereon, of $30.3 million. We estimate that the liability for uncertain tax positions could decrease by up to $4.0 million within the next twelve months due to the settlement of examinations or issues with tax authorities.
Critical accounting policies
Our significant accounting policies are more fully described under the heading “Summary of significant accounting policies” in Note 2 of the notes to the consolidated financial statements. However, we believe the accounting policies described below are particularly important to the portrayal and understanding of our financial position and results of operations and require application of significant judgment by our management. In applying these policies, management uses its judgment in making certain assumptions and estimates.
These judgments involve estimations of the effect of matters that are inherently uncertain and may have a significant impact on our quarterly and annual results of operations or financial condition. Changes in estimates and judgments could significantly affect our result of operations, financial condition, and cash flow in future years. The following is a description of what we consider to be our most significant critical accounting policies.
Revenue recognition
Initial franchise fee revenue is recognized upon substantial completion of the services required of us as stated in the franchise agreement, which is generally upon opening of the respective restaurant. Fees collected in advance are deferred until earned. Royalty income is based on a percentage of franchisee gross sales and is recognized when earned, which occurs at the franchisees’ point of sale. Renewal fees are recognized when a renewal agreement with a franchisee becomes effective. Rental income for base rentals is recorded on a straight-line basis over the lease term. Contingent rent is recognized as earned, and any amounts received from lessees in advance of achieving stipulated thresholds are deferred until such threshold is actually achieved. Revenue from the sale of ice cream is recognized when title and risk of loss transfers to the buyer, which is generally upon shipment. Licensing fees are recognized when earned, which is generally upon sale of the underlying products by the licensees. Retail store revenues at company-owned restaurants are recognized when payment is tendered at the point of sale, net of sales tax and other sales-related taxes. Gains on the refranchise or sale of a restaurant are recognized when the sale transaction closes, the franchisee has a minimum amount of the purchase price in at risk equity, and we are satisfied that the buyer can meet its financial obligations to us.

-47-
Allowances for franchise, license and lease receivables / guaranteed financing
We reserve all or a portion of a franchisee’s receivable balance when deemed necessary based upon detailed review of such balances, and apply a pre-defined reserve percentage based on an aging criteria to other balances. We perform our reserve analysis during each fiscal quarter or when events or circumstances indicate that we may not collect the balance due. While we use the best information available in making our determination, the ultimate recovery of recorded receivables is also dependent upon future economic events and other conditions that may be beyond our control.
In limited instances, we issue guarantees to financial institutions so that our franchisees can obtain financing with terms of approximately three to ten years for various business purposes. We recognize a liability and offsetting asset for the fair value of such guarantees. The fair value of a guarantee is based on historical default rates of our total guaranteed loan pool. We monitor the financial condition of our franchisees and record provisions for estimated losses on guaranteed liabilities of our franchisees if we believe that our franchisees are unable to make their required payments. As of December 29, 2012, if all of our outstanding guarantees of franchisee financing obligations came due simultaneously, we would be liable for approximately $4.7 million. As of December 29, 2012, the Company had recorded reserves for such guarantees of $389 thousand. We generally have cross-default provisions with these franchisees that would put the franchisee in default of its franchise agreement in the event of non-payment under such loans. We believe these cross-default provisions significantly reduce the risk that we would not be able to recover the amount of required payments under these guarantees and, historically, we have not incurred significant losses under these guarantees due to defaults by our franchisees.
Impairment of goodwill and other intangible assets
Goodwill and trade names (“indefinite-lived intangibles”) have been assigned to our reporting units, which are also our operating segments, for purposes of impairment testing. All of our reporting units have indefinite-lived intangibles associated with them.
We evaluate the remaining useful life of our trade names to determine whether current events and circumstances continue to support an indefinite useful life. In addition, all of our indefinite-lived intangible assets are tested for impairment annually. We first assess qualitative factors to determine whether it is more likely than not that a trade name is impaired. In the event we were to determine that the carrying value of a trade name would more likely than not exceed its fair value, quantitative testing would be performed. Quantitative testing consists of a comparison of the fair value of each trade name with its carrying value, with any excess of carrying value over fair value being recognized as an impairment loss. For goodwill, we first perform a qualitative assessment to determine if the fair value of the reporting unit is more likely than not greater than the carrying amount. In the event we were to determine that a reporting unit's carrying value would more likely than not exceed its fair value, quantitative testing would be performed which consists of a comparison of each reporting unit’s fair value to its carrying value. The fair value of a reporting unit is an estimate of the amount for which the unit as a whole could be sold in a current transaction between willing parties. If the carrying value of a reporting unit exceeds its fair value, goodwill is written down to its implied fair value. We have selected the first day of our fiscal third quarter as the date on which to perform our annual impairment test for all indefinite-lived intangible assets. We also test for impairment whenever events or circumstances indicate that the fair value of such indefinite-lived intangibles has been impaired. No impairment of indefinite-lived intangible assets was recorded during fiscal years 2012, 2011, or 2010.
We have intangible assets other than goodwill and trade names that are amortized on a straight-line basis over their estimated useful lives or terms of their related agreements. Other intangible assets consist primarily of franchise and international license rights ("franchise rights"), ice cream manufacturing and territorial franchise agreement license rights ("license rights") and operating lease interests acquired related to our prime leases and subleases ("operating leases acquired"). Franchise rights recorded in the consolidated balance sheets were valued using an excess earnings approach. The valuation of franchise rights was calculated using an estimation of future royalty income and related expenses associated with existing franchise contracts at the acquisition date. Our valuation included assumptions related to the projected attrition and renewal rates on those existing franchise arrangements being valued. License rights recorded in the consolidated balance sheets were valued based on an estimate of future revenues and costs related to the ongoing management of the contracts over the remaining useful lives. Favorable and unfavorable operating leases acquired were recorded on purchased leases based on differences between contractual rents under the respective lease agreements and prevailing market rents at the lease acquisition date. Favorable operating leases acquired are included as a component of other intangible assets in the consolidated balance sheets. Due to the high level of lease renewals made by our Dunkin’ Donuts franchisees, all lease renewal options for the Dunkin’ Donuts leases were included in the valuation of the favorable operating leases acquired. Amortization of franchise rights, license rights, and favorable operating leases acquired is recorded as amortization expense in the consolidated statements of operations and amortized over the respective franchise, license, and lease terms using the straight-line method. Unfavorable operating leases acquired related to our prime leases and subleases are recorded in the liability section of the consolidated balance sheets and are amortized into rental expense and rental income, respectively, over the base lease term of the respective leases using the

-48-
straight-line method. Our amortizable intangible assets are evaluated for impairment whenever events or changes in circumstances indicate that the carrying amount of the intangible asset may not be recoverable. An intangible asset that is deemed impaired is written down to its estimated fair value, which is based on discounted cash flow.
Income taxes
Our major tax jurisdictions are the U.S. and Canada. The majority of our legal entities were converted to limited liability companies (“LLCs”) on March 1, 2006 and a number of new LLCs were created on or about March 15, 2006. All of these LLCs are single member entities which are treated as disregarded entities and included as part of us in the consolidated federal income tax return. Dunkin’ Brands Canada Ltd. (“DBCL”) files separate Canadian and provincial tax returns, and Dunkin Brands (UK) Limited, Dunkin’ Brands Australia Pty. Ltd (“DBA”), and Baskin-Robbins Australia Pty. Ltd (“BRA”) file separate tax returns in the United Kingdom and Australia. The current income tax liabilities for DBCL, Dunkin Brands (UK) Limited, DBA, and BRA are calculated on a stand-alone basis. The current federal tax liability for each entity included in our consolidated federal income tax return is calculated on a stand-alone basis, including foreign taxes, for which a separate company foreign tax credit is calculated in lieu of a deduction for foreign withholding taxes paid. As a matter of course, we are regularly audited by federal, state, and foreign tax authorities.
Deferred tax assets and liabilities are recorded for the expected future tax consequences of items that have been included in our consolidated financial statements or tax returns. Deferred tax assets and liabilities are determined based on the differences between the financial statement carrying amounts of assets and liabilities and the respective tax bases of assets and liabilities using enacted tax rates that are expected to apply in years in which the temporary differences are expected to reverse. The effects of changes in tax rates on deferred tax assets and liabilities are recognized in the consolidated statements of operations in the year in which the law is enacted. Valuation allowances are provided when we do not believe it is more likely than not that we will realize the benefit of identified tax assets.
A tax position taken or expected to be taken in a tax return is recognized in the financial statements when it is more likely than not that the position would be sustained upon examination by tax authorities. A recognized tax position is then measured at the largest amount of benefit that is greater than 50% likely of being realized upon ultimate settlement. Estimates of interest and penalties on unrecognized tax benefits are recorded in the provision for income taxes.
In assessing the realizability of deferred tax assets, management considers whether it is more likely than not that some portion or all of the deferred tax assets will not be realized. The ultimate realization of deferred tax assets is dependent upon the generation of future taxable income during the periods in which those temporary differences become deductible. Management considers the scheduled reversal of deferred tax liabilities, projected future taxable income, and tax planning strategies in making this assessment.
Legal contingencies
We are engaged in litigation that arises in the ordinary course of business as a franchisor. Such matters typically include disputes related to compliance with the terms of franchise and development agreements, including claims or threats of claims of breach of contract, negligence, and other alleged violations by us. We record reserves for legal contingencies when information available to us indicates that it is probable that a liability has been incurred and the amount of the loss can be reasonably estimated. Predicting the outcomes of claims and litigation and estimating the related costs and exposures involve substantial uncertainties that could cause actual costs to vary materially from estimates. Legal costs incurred in connection with legal and other contingencies are expensed as the costs are incurred.
Item 7A. Quantitative and Qualitative Disclosures about Market Risk
Foreign exchange risk
We are subject to inherent risks attributed to operating in a global economy. Most of our revenues, costs and debts are denominated in U.S. dollars. Our investments in, and equity income from, joint ventures are denominated in foreign currencies, and are therefore subject to foreign currency fluctuations. For fiscal year 2012, a 5% change in foreign currencies relative to the U.S. dollar would have had a $1.1 million impact on equity in net income of joint ventures. Additionally, a 5% change in foreign currencies as of December 29, 2012 would have had an $8.7 million impact on the carrying value of our investments in joint ventures. In the future, we may consider the use of derivative financial instruments, such as forward contracts, to manage foreign currency exchange rate risks.
-49-
Interest rate risk
We are subject to interest rate risk in connection with our long-term debt. Our principal interest rate exposure mainly relates to a portion of the term loans outstanding under our senior credit facility. We have a $1.90 billion term loan facility bearing interest at variable rates. In September 2012, we entered into variable-to-fixed interest rate swap agreements to hedge the floating interest rate on $900.0 million notional amount of our outstanding term loan borrowings. These swaps are scheduled to mature in November 2017. We are required to make quarterly payments on the notional amount at a fixed average interest rate of approximately 1.37%. In exchange, we receive interest on the notional amount at a variable rate based on three-month LIBOR spot rate, subject to a 1.0% floor. Based on the principal amount of term loan borrowings outstanding at December 29, 2012 and considering the interest rate swaps, each eighth of a percentage point change in interest rates above the minimum interest rate specified in the senior credit facility would result in a $1.2 million change in annual interest expense on our term loan facility. We also have a revolving credit facility, which provides for borrowings of up to $100.0 million and bears interest at variable rates. Assuming the revolver is fully drawn, each eighth of a percentage point change in interest rates above the minimum interest rate specified in the senior credit facility would result in a $0.1 million change in annual interest expense on our revolving loan facility. There was no material impact to our interest rate risk as a result of the February 2013 amendment to our senior credit facility.
In the future, we may enter into additional hedging instruments, involving the exchange of floating for fixed rate interest payments, to reduce interest rate volatility.

-50-
Item 8. Financial Statements and Supplementary Data
Report of Independent Registered Public Accounting Firm
The Board of Directors and StockholdersDunkin’ Brands Group, Inc.:
We have audited the accompanying consolidated balance sheets of Dunkin' Brands Group, Inc. and subsidiaries as of December 29, 2012 and December 31, 2011, and the related consolidated statements of operations, comprehensive income, stockholders' equity (deficit), and cash flows for each of the fiscal years in the period ended December 29, 2012. These consolidated financial statements are the responsibility of the Company's management. Our responsibility is to express an opinion on these consolidated financial statements based on our audits.
We conducted our audits in accordance with the standards of the Public Company Accounting Oversight Board (United States). Those standards require that we plan and perform the audit to obtain reasonable assurance about whether the financial statements are free of material misstatement. An audit includes examining, on a test basis, evidence supporting the amounts and disclosures in the financial statements. An audit also includes assessing the accounting principles used and significant estimates made by management, as well as evaluating the overall financial statement presentation. We believe that our audits provide a reasonable basis for our opinion.
In our opinion, the consolidated financial statements referred to above present fairly, in all material respects, the financial position of Dunkin' Brands Group, Inc. and subsidiaries as of December 29, 2012 and December 31, 2011, and the results of their operations and their cash flows for each of the fiscal years in the period ended December 29, 2012, in conformity with U.S. generally accepted accounting principles.
We also have audited, in accordance with the standards of the Public Company Accounting Oversight Board (United States), Dunkin' Brands Group, Inc.'s internal control over financial reporting as of December 29, 2012, based on the criteria established in Internal Control - Integrated Framework issued by the Committee of Sponsoring Organizations of the Treadway Commission (COSO), and our report dated February 22, 2013 expressed an unqualified opinion on the effectiveness of the Company's internal control over financial reporting.
/s/ KPMG LLP
Boston, MassachusettsFebruary 22, 2013

See accompanying notes to consolidated financial statements.-51-
DUNKIN’ BRANDS GROUP, INC. AND SUBSIDIARIESConsolidated Balance Sheets
(In thousands, except share data)
December 29,2012
December 31,2011
AssetsCurrent assets:
Cash and cash equivalents $ 252,618 246,715Accounts receivable, net 32,407 37,122Notes and other receivables, net 20,649 21,665Assets held for sale 2,400 1,266Deferred income taxes, net 47,263 48,387Restricted assets of advertising funds 31,849 31,017Prepaid income taxes 10,825 —Prepaid expenses and other current assets 21,769 20,302
Total current assets 419,780 406,474Property and equipment, net 181,172 185,360Equity method investments 174,823 164,636Goodwill 891,900 890,992Other intangible assets, net 1,479,784 1,507,219Restricted cash 367 269Other assets 69,687 69,068
Total assets $ 3,217,513 3,224,018Liabilities and Stockholders’ EquityCurrent liabilities:
Current portion of long-term debt $ 26,680 14,965Capital lease obligations 371 232Accounts payable 16,256 9,651Income taxes payable, net — 15,630Liabilities of advertising funds 45,594 50,547Deferred income 24,683 24,918Other current liabilities 239,931 200,597
Total current liabilities 353,515 316,540Long-term debt, net 1,823,278 1,453,344Capital lease obligations 7,251 4,928Unfavorable operating leases acquired 19,061 21,440Deferred income 15,720 16,966Deferred income taxes, net 569,126 578,660Other long-term liabilities 79,587 86,204
Total long-term liabilities 2,514,023 2,161,542Commitments and contingencies (note 17)Stockholders’ equity:
Preferred stock, $0.001 par value; 25,000,000 shares authorized; no shares issued and outstanding at December 29, 2012 and December 31, 2011, respectively — —
Common stock, $0.001 par value; 475,000,000 shares authorized; 106,146,984 and 120,136,631 shares issued and outstanding at December 29, 2012 and December 31, 2011, respectively 106 119
Additional paid-in capital 1,251,498 1,478,291Accumulated deficit (914,094) (752,075)Accumulated other comprehensive income 9,141 19,601
Total stockholders’ equity of Dunkin' Brands 346,651 745,936Noncontrolling interests 3,324 —Total stockholders' equity 349,975 745,936
Total liabilities and stockholders' equity $ 3,217,513 3,224,018

See accompanying notes to consolidated financial statements.-52-
DUNKIN’ BRANDS GROUP, INC. AND SUBSIDIARIESConsolidated Statements of Operations(In thousands, except per share data)
Fiscal year ended
December 29,
2012December 31,
2011December 25,
2010
Revenues:Franchise fees and royalty income $ 418,940 398,474 359,927Rental income 96,816 92,145 91,102Sales of ice cream products 94,659 100,068 84,989Sales at company-owned restaurants 22,922 12,154 17,362Other revenues 24,844 25,357 23,755
Total revenues 658,181 628,198 577,135Operating costs and expenses:
Occupancy expenses—franchised restaurants 52,072 51,878 53,739Cost of ice cream products 69,019 72,329 59,175Company-owned restaurant expenses 23,133 12,854 17,825General and administrative expenses, net 239,574 227,771 205,795Depreciation 29,084 24,497 25,359Amortization of other intangible assets 26,943 28,025 32,467Impairment charges 1,278 2,060 7,075
Total operating costs and expenses 441,103 419,414 401,435Net income (loss) of equity method investments:
Net income, excluding impairment 22,351 16,277 17,825Impairment charge, net of tax — (19,752) —
Total net income (loss) of equity method investments 22,351 (3,475) 17,825Operating income 239,429 205,309 193,525
Other income (expense):Interest income 543 623 305Interest expense (74,031) (105,072) (112,837)Loss on debt extinguishment and refinancing transactions (3,963) (34,222) (61,955)Other gains, net 23 175 408
Total other expense (77,428) (138,496) (174,079)Income before income taxes 162,001 66,813 19,446
Provision (benefit) for income taxes 54,377 32,371 (7,415)Net income including noncontrolling interests 107,624 34,442 26,861Net loss attributable to noncontrolling interests (684) — —Net income attributable to Dunkin' Brands $ 108,308 34,442 26,861
Earnings (loss) per share:Class L—basic and diluted n/a $ 6.14 4.87Common—basic $ 0.94 (1.41) (2.04)Common—diluted 0.93 (1.41) (2.04)Cash dividends declared per common share 0.60 — —

See accompanying notes to consolidated financial statements.-53-
DUNKIN’ BRANDS GROUP, INC. AND SUBSIDIARIESConsolidated Statements of Comprehensive Income
(In thousands)
Fiscal year ended
December 29,
2012December 31,
2011December 25,
2010
Net income including noncontrolling interests $ 107,624 34,442 26,861Other comprehensive income (loss), net:
Effect of foreign currency translation, net of deferred taxes of $260, $(295), and $(390) for the fiscal years ended December 29, 2012, December 31, 2011, and December 25, 2010, respectively (5,996) 6,560 9,624
Unrealized losses on interest rate swaps, net of deferred taxes of $1,154 for the fiscal year ended December 29, 2012 (1,655) — —
Unrealized loss on pension plan, net of deferred taxes of $415, $85, and $125 for the fiscal years ended December 29, 2012, December 31, 2011, and December 25, 2010, respectively (1,180) (233) (306)
Other (1,629) (353) (120)Total other comprehensive income (loss) (10,460) 5,974 9,198
Comprehensive income including noncontrolling interests 97,164 40,416 36,059Comprehensive loss attributable to noncontrolling interests (684) — —Comprehensive income attributable to Dunkin' Brands $ 97,848 40,416 36,059

See
acco
mpa
nyin
g no
tes t
o co
nsol
idat
ed fi
nanc
ial s
tate
men
ts.
-54-
DU
NK
IN’ B
RA
ND
S G
RO
UP,
INC
. AN
D S
UB
SID
IAR
IES
Con
solid
ated
Sta
tem
ents
of S
tock
hold
ers’
Equ
ity (D
efic
it)(I
n th
ousa
nds)
C
omm
on st
ock
Add
ition
alpa
id-in
capi
tal
Trea
sury
stoc
k, a
t co
stA
ccum
ulat
edde
ficit
Acc
umul
ated
othe
rco
mpr
ehen
sive
inco
me
Non
cont
rolli
ng
inte
rest
sT
otal
Sh
ares
Am
ount
Bal
ance
at D
ecem
ber 2
6, 2
009
41,5
32$
4219
2,50
0(1
,114
)(6
57,2
50)
4,42
9—
(461
,393
)N
et in
com
e—
——
—26
,861
——
26,8
61O
ther
com
preh
ensi
ve in
com
e—
——
——
9,19
8—
9,19
8A
ccre
tion
of C
lass
L p
refe
rred
retu
rn—
——
—(1
11,0
26)
——
(111
,026
)Is
suan
ce o
f com
mon
stoc
k28
—14
1—
——
—14
1Sh
are-
base
d co
mpe
nsat
ion
expe
nse
293
—1,
461
——
——
1,46
1R
epur
chas
es o
f com
mon
stoc
k—
——
(693
)—
——
(693
)Ex
cess
tax
bene
fits f
rom
shar
e-ba
sed
com
pens
atio
n—
—1,
110
——
——
1,11
0B
alan
ce a
t Dec
embe
r 25,
201
041
,853
4219
5,21
2(1
,807
)(7
41,4
15)
13,6
27—
(534
,341
)N
et in
com
e—
——
—34
,442
——
34,4
42O
ther
com
preh
ensi
ve in
com
e—
——
——
5,97
4—
5,97
4A
ccre
tion
of C
lass
L p
refe
rred
retu
rn—
——
—(4
5,10
2)—
—(4
5,10
2)C
onve
rsio
n of
Cla
ss L
shar
es in
to c
omm
on st
ock
55,6
5355
887,
786
——
——
887,
841
Issu
ance
of c
omm
on st
ock
in c
onne
ctio
n w
ith in
itial
pub
lic o
fferin
g22
,250
2238
9,93
9—
——
—38
9,96
1Is
suan
ce o
f com
mon
stoc
k12
9—
942
——
——
942
Exer
cise
of s
tock
opt
ions
62—
266
——
——
266
Shar
e-ba
sed
com
pens
atio
n ex
pens
e10
5—
4,63
2—
——
—4,
632
Rep
urch
ases
of c
omm
on st
ock
——
—(1
73)
——
—(1
73)
Ret
irem
ent o
f tre
asur
y st
ock
(558
)—
(1,9
80)
1,98
0—
——
—Ex
cess
tax
bene
fits f
rom
shar
e-ba
sed
com
pens
atio
n—
—1,
494
——
——
1,49
4B
alan
ce a
t Dec
embe
r 31,
201
111
9,49
411
91,
478,
291
—(7
52,0
75)
19,6
01—
745,
936
Net
inco
me
——
——
108,
308
—(6
84)
107,
624
Oth
er c
ompr
ehen
sive
loss
——
——
—(1
0,46
0)—
(10,
460)
Exer
cise
of s
tock
opt
ions
1,27
72
4,41
6—
——
—4,
418
Con
tribu
tions
from
non
cont
rolli
ng in
tere
sts
——
——
——
4,00
84,
008
Div
iden
ds p
aid
on c
omm
on st
ock
——
(70,
069)
——
——
(70,
069)
Shar
e-ba
sed
com
pens
atio
n ex
pens
e37
2—
6,92
0—
——
—6,
920
Rep
urch
ases
of c
omm
on st
ock
——
—(4
50,3
69)
——
—(4
50,3
69)
Ret
irem
ent o
f tre
asur
y st
ock
(15,
001)
(15)
(180
,027
)45
0,36
9(2
70,3
27)
——
—Ex
cess
tax
bene
fits f
rom
shar
e-ba
sed
com
pens
atio
n—
—11
,978
——
——
11,9
78O
ther
——
(11)
——
——
(11)
Bal
ance
at D
ecem
ber 2
9, 2
012
106,
142
$10
61,
251,
498
—(9
14,0
94)
9,14
13,
324
349,
975

See accompanying notes to consolidated financial statements.-55-
DUNKIN’ BRANDS GROUP, INC. AND SUBSIDIARIESConsolidated Statements of Cash Flows
(In thousands)
Fiscal year ended
December 29,
2012December 31,
2011December 25,
2010Cash flows from operating activities:
Net income including noncontrolling interests $ 107,624 34,442 26,861Adjustments to reconcile net income to net cash provided by operating
activities:Depreciation and amortization 56,027 52,522 57,826Amortization of deferred financing costs and original issue discount 5,727 6,278 6,523Loss on debt extinguishment and refinancing transactions 3,963 34,222 61,955Impact of unfavorable operating leases acquired (2,352) (3,230) (4,320)Deferred income taxes (6,946) (11,363) (28,389)Excess tax benefits from share-based compensation — (1,494) (1,110)Impairment charges 1,278 2,060 7,075Provision for (recovery of) bad debt (542) 2,019 1,505Share-based compensation expense 6,920 4,632 1,461Net loss (income) of equity method investments (22,351) 3,475 (17,825)Dividends received from equity method investments 6,497 7,362 6,603Other, net (845) (1,139) (137)Change in operating assets and liabilities:
Restricted cash — — 101,675Accounts, notes, and other receivables, net 6,321 19,123 (11,815)Other current assets (1,480) 4,406 6,701Accounts payable 2,804 85 (1,115)Other current liabilities 38,767 17,904 29,384Liabilities of advertising funds, net (5,688) (3,572) (346)Income taxes payable, net (38,928) 473 1,341Deferred income (1,491) (5,658) (12,809)Other, net (885) 156 (2,040)
Net cash provided by operating activities 154,420 162,703 229,004Cash flows from investing activities:
Additions to property and equipment (22,398) (18,596) (15,358)Other, net (549) (1,211) (249)
Net cash used in investing activities (22,947) (19,807) (15,607)Cash flows from financing activities:
Proceeds from issuance of long-term debt 396,000 250,000 1,859,375Repayment of long-term debt (15,441) (654,608) (1,470,985)Payment of deferred financing and other debt-related costs (5,978) (20,087) (34,979)Proceeds from initial public offering, net of offering costs — 389,961 —Repurchases of common stock (450,369) (286) (3,890)Dividends paid on Class L common stock — — (500,002)Dividends paid on common stock (70,069) — —Change in restricted cash 218 178 16,144Excess tax benefits from share-based compensation 11,978 1,494 1,110Other, net 8,059 3,274 644
Net cash used in financing activities (125,602) (30,074) (132,583)Effect of exchange rate changes on cash and cash equivalents 32 (207) 76
Increase in cash and cash equivalents 5,903 112,615 80,890Cash and cash equivalents, beginning of year 246,715 134,100 53,210Cash and cash equivalents, end of year $ 252,618 246,715 134,100Supplemental cash flow information:
Cash paid for income taxes $ 90,225 43,143 19,206Cash paid for interest 54,115 103,147 100,629
Noncash investing activities: Property and equipment included in accounts payable and other
current liabilities 5,244 1,641 1,822 Purchase of leaseholds in exchange for capital lease obligation 2,818 — 178

-56-
DUNKIN’ BRANDS GROUP, INC. AND SUBSIDIARIESNotes to Consolidated Financial Statements
(1) Description of business and organization
Dunkin’ Brands Group, Inc. (“DBGI”), together with its consolidated subsidiaries, is one of the world’s largest franchisors of restaurants serving coffee and baked goods as well as ice cream within the quick service restaurant segment of the restaurant industry. We develop, franchise, and license a system of both traditional and nontraditional quick service restaurants and, in limited circumstances, own and operate individual locations. Through our Dunkin’ Donuts brand, we develop and franchise restaurants featuring coffee, donuts, bagels, and related products. Through our Baskin-Robbins brand, we develop and franchise restaurants featuring ice cream, frozen beverages, and related products. Additionally, we distribute Baskin-Robbins ice cream products to Baskin-Robbins franchisees and licensees in certain international markets.
Throughout these financial statements, “Dunkin’ Brands,” “the Company,” “we,” “us,” “our,” and “management” refer to DBGI and its consolidated subsidiaries taken as a whole.
(2) Summary of significant accounting policies
(a) Fiscal year
The Company operates and reports financial information on a 52- or 53-week year on a 13-week quarter basis with the fiscal year ending on the last Saturday in December and fiscal quarters ending on the 13th Saturday of each quarter (or 14th Saturday when applicable with respect to the fourth fiscal quarter). The data periods contained within fiscal years 2012 and 2010 reflect the results of operations for the 52-week periods ended December 29, 2012 and December 25, 2010, respectively, and fiscal year 2011 reflects the results of operations for the 53-week period ended December 31, 2011.
(b) Basis of presentation and consolidation
The accompanying consolidated financial statements include the accounts of DBGI and subsidiaries and have been prepared in accordance with accounting principles generally accepted in the United States of America (“U.S. GAAP”). All significant transactions and balances between subsidiaries have been eliminated in consolidation.
We consolidate entities in which we have a controlling financial interest, the usual condition of which is ownership of a majority voting interest. We also consider for consolidation an entity, in which we have certain interests, where the controlling financial interest may be achieved through arrangements that do not involve voting interests. Such an entity, known as a variable interest entity (“VIE”), is required to be consolidated by its primary beneficiary. The primary beneficiary is the entity that possesses the power to direct the activities of the VIE that most significantly impact its economic performance and has the obligation to absorb losses or the right to receive benefits from the VIE that are significant to it. The principal entities in which we possess a variable interest include franchise entities, the advertising funds (see note 4), and our equity method investees. We do not possess any ownership interests in franchise entities, except for our investments in various entities that are accounted for under the equity method. Additionally, we generally do not provide financial support to franchise entities in a typical franchise relationship. As our franchise and license arrangements provide our franchisee and licensee entities the power to direct the activities that most significantly impact their economic performance, we do not consider ourselves the primary beneficiary of any such entity that might be a VIE. Based on the results of our analysis of potential VIEs, we have not consolidated any franchise or other entities. The Company’s maximum exposure to loss resulting from involvement with potential VIEs is attributable to aged trade and notes receivable balances, outstanding loan guarantees (see note 17(b)), and future lease payments due from franchisees (see note 11).
The Company holds a 51% interest in a limited partnership that owns and operates Dunkin' Donuts restaurants in the Dallas, Texas area. The Company possesses control of this entity and, therefore, consolidates the results of the limited partnership. The noncontrolling interest is presented separately within stockholder's equity in the consolidated balance sheets. The net loss and comprehensive loss attributable to the noncontrolling interest are presented separately in the consolidated statements of operations and comprehensive income, respectively.
(c) Accounting estimates
The preparation of consolidated financial statements in conformity with U.S. GAAP requires the use of estimates, judgments, and assumptions that affect the reported amounts of assets, liabilities, revenues, expenses, and related disclosure of contingent assets and liabilities at the date of the financial statements and for the period then ended. Significant estimates are made in the calculations and assessments of the following: (a) allowance for doubtful accounts and notes receivables, (b) impairment of tangible and intangible assets, (c) income taxes, (d) real estate reserves, (e) lease accounting estimates, (f) gift certificate
-57-
breakage, and (g) contingencies. Estimates are based on historical experience, current conditions, and various other assumptions that are believed to be reasonable under the circumstances. These estimates form the basis for making judgments about the carrying values of assets and liabilities when they are not readily apparent from other sources. We adjust such estimates and assumptions when facts and circumstances dictate. Actual results may differ from these estimates under different assumptions or conditions. Illiquid credit markets and volatile equity and foreign currency markets have combined to increase the uncertainty inherent in such estimates and assumptions.
(d) Cash and cash equivalents and restricted cash
The Company continually monitors its positions with, and the credit quality of, the financial institutions in which it maintains its deposits and investments. As of December 29, 2012 and December 31, 2011, we maintained balances in various cash accounts in excess of federally insured limits. All highly liquid instruments purchased with an original maturity of three months or less are considered cash equivalents.
As part of the securitization transaction (see note 8), certain cash accounts were established in the name of Citibank, N.A. (the “Trustee”) for the benefit of Ambac Assurance Corporation (“Ambac”), the Trustee, and the holders of our ABS Notes (see note 8), and were restricted in their use. Historically, restricted cash primarily represented (i) cash collections held by the Trustee, (ii) interest, insurer premiums, and commitment fee reserves held by the Trustee related to our ABS Notes, (iii) product sourcing and real estate reserves used to pay ice cream product obligations to affiliates and real estate obligations, respectively, (iv) cash collections related to the advertising funds and gift card/certificate programs, and (v) cash collateral requirements associated with our Canadian guaranteed financing arrangements (see note 17(b)). Changes in restricted cash held for interest, insurer premiums, commitment fee reserves, or other financing arrangements are presented as a component of cash flows from financing activities in the accompanying consolidated statements of cash flows. Other changes in restricted cash are presented as a component of operating activities. In connection with the repayment of the ABS Notes in December 2010 (see note 8), the cash restrictions associated with the ABS Notes were released.
Cash held related to the advertising funds and the Company’s gift card/certificate programs are classified as unrestricted cash as there are no legal restrictions on the use of these funds; however, the Company intends to use these funds solely to support the advertising funds and gift card/certificate programs rather than to fund operations. Total cash balances related to the advertising funds and gift card/certificate programs as of December 29, 2012 and December 31, 2011 were $125.4 million and $123.1 million, respectively.
(e) Fair value of financial instruments
The carrying amounts of accounts receivable, notes and other receivables, assets and liabilities related to the advertising funds, accounts payable, and other current liabilities approximate fair value because of their short-term nature. For long-term receivables, we review the creditworthiness of the counterparty on a quarterly basis, and adjust the carrying value as necessary. We believe the carrying value of long-term receivables of $5.8 million and $4.8 million as of December 29, 2012 and December 31, 2011, respectively, approximates fair value.
Financial assets and liabilities are categorized, based on the inputs to the valuation technique, into a three-level fair value hierarchy. The fair value hierarchy gives the highest priority to the quoted prices in active markets for identical assets and liabilities and lowest priority to unobservable inputs. Observable market data, when available, is required to be used in making fair value measurements. When inputs used to measure fair value fall within different levels of the hierarchy, the level within which the fair value measurement is categorized is based on the lowest level input that is significant to the fair value measurement.

-58-
Financial assets and liabilities measured at fair value on a recurring basis as of December 29, 2012 and December 31, 2011 are summarized as follows (in thousands):
December 29, 2012 December 31, 2011Quoted prices
in activemarkets for
identical assets(Level 1)
Significantother
observableinputs
(Level 2) Total
Quoted pricesin active
markets foridentical assets
(Level 1)
Significantother
observableinputs
(Level 2) Total
Assets:Mutual funds $ 2,505 — 2,505 2,777 — 2,777
Total assets $ 2,505 — 2,505 2,777 — 2,777Liabilities:
Deferred compensation liabilities $ — 7,379 7,379 — 6,856 6,856Interest rate swaps — 2,809 2,809 — — —
Total liabilities $ — 10,188 10,188 — 6,856 6,856
The mutual funds and deferred compensation liabilities primarily relate to the Dunkin’ Brands, Inc. Non-Qualified Deferred Compensation Plan (“NQDC Plan”), which allows for pre-tax salary deferrals for certain qualifying employees (see note 18). Changes in the fair value of the deferred compensation liabilities are derived using quoted prices in active markets of the asset selections made by the participants. The deferred compensation liabilities are classified within Level 2, as defined under U.S. GAAP, because their inputs are derived principally from observable market data by correlation to hypothetical investments. The Company holds mutual funds, as well as money market funds, to partially offset the Company’s liabilities under the NQDC Plan as well as other benefit plans. The changes in the fair value of the mutual funds are derived using quoted prices in active markets for the specific funds. As such, the mutual funds are classified within Level 1, as defined under U.S. GAAP.
The Company uses readily available market data to value its interest rate swaps, such as interest rate curves and discount factors. Additionally, the fair value of derivatives includes consideration of credit risk in the valuation. The Company uses a potential future exposure model to estimate this credit valuation adjustment (“CVA”). The inputs to the CVA are largely based on observable market data, with the exception of certain assumptions regarding credit worthiness which make the CVA a Level 3 input, as defined under U.S. GAAP. As the magnitude of the CVA is not a significant component of the fair value of the interest rate swaps as of December 29, 2012, it is not considered a significant input and the derivatives are classified as Level 2.
The carrying value and estimated fair value of long-term debt at December 29, 2012 and December 31, 2011 were as follows (in thousands):
December 29, 2012 December 31, 2011
Financial liabilitiesCarrying
valueEstimatedfair value
Carryingvalue
Estimatedfair value
Term loans $ 1,849,958 1,878,980 1,468,309 1,447,731
The estimated fair value of our term loans is based on current bid prices for our term loans. Judgment is required to develop these estimates. As such, our term loans are classified within Level 2, as defined under U.S. GAAP.
(f) Inventories
Inventories consist of ice cream products, and are valued at the lower of cost or estimated net realizable value. Cost is determined by the first-in, first-out method. Inventories are included within prepaid expenses and other current assets in the accompanying consolidated balance sheets.
(g) Assets held for sale
Assets held for sale primarily represent costs incurred by the Company for store equipment and leasehold improvements constructed for sale to franchisees, as well as restaurants formerly operated by franchisees waiting to be resold. The value of such restaurants and related assets is reduced to reflect net recoverable values, with such reductions recorded to general and administrative expenses, net in the consolidated statements of operations. Generally, internal specialists estimate the amount to be recovered from the sale of such assets based on their knowledge of the (a) market in which the store is located, (b) results of the Company’s previous efforts to dispose of similar assets, and (c) current economic conditions. The actual cost of such assets

-59-
held for sale is affected by specific factors such as the nature, age, location, and condition of the assets, as well as the economic environment and inflation.
We classify restaurants and their related assets as held for sale and suspend depreciation and amortization when (a) we make a decision to refranchise or sell the property, (b) the stores are available for immediate sale, (c) we have begun an active program to locate a buyer, (d) significant changes to the plan of sale are not likely, and (e) the sale is probable within one year.
(h) Property and equipment
Property and equipment are stated at cost less accumulated depreciation and amortization. Depreciation is provided using the straight-line method over the estimated useful lives of the respective assets. Leasehold improvements are depreciated over the shorter of the estimated useful life or the remaining lease term of the related asset. Estimated useful lives are as follows:
Years
Buildings 20 – 35Leasehold improvements 5 – 20Store, production, and other equipment 3 – 10
Routine maintenance and repair costs are charged to expense as incurred. Major improvements, additions, or replacements that extend the life, increase capacity, or improve the safety or the efficiency of property are capitalized at cost and depreciated. Major improvements to leased property are capitalized as leasehold improvements and depreciated. Interest costs incurred during the acquisition period of capital assets are capitalized as part of the cost of the asset and depreciated.
(i) Leases
When determining lease terms, we begin with the point at which the Company obtains control and possession of the leased properties. We include option periods for which failure to renew the lease imposes a penalty on the Company in such an amount that the renewal appears, at the inception of the lease, to be reasonably assured, which generally includes option periods through the end of the related franchise agreement term. We also include any rent holidays in the determination of the lease term.
We record rent expense and rent income for leases and subleases, respectively, that contain scheduled rent increases on a straight-line basis over the lease term as defined above. In certain cases, contingent rentals are based on sales levels of our franchisees, in excess of stipulated amounts. Contingent rentals are included in rent income and rent expense as they are earned or accrued, respectively.
We occasionally provide to our sublessees, or receive from our landlords, tenant improvement dollars. Tenant improvement dollars paid to our sublessees are recorded as a deferred rent asset. For fixed asset and/or leasehold purchases for which we receive tenant improvement dollars from our landlords, we record the property and equipment and/or leasehold improvements gross and establish a deferred rent obligation. The deferred lease assets and obligations are amortized on a straight-line basis over the determined sublease and lease terms, respectively.
Management regularly reviews sublease arrangements, where we are the lessor, for losses on sublease arrangements. We recognize a loss, discounted using credit-adjusted risk-free rates, when costs expected to be incurred under an operating prime lease exceed the anticipated future revenue stream of the operating sublease. Furthermore, for properties where we do not currently have an operational franchise or other third-party sublessee and are under long-term lease agreements, the present value of any remaining liability under the lease, discounted using credit-adjusted risk-free rates and net of estimated sublease recovery, is recognized as a liability and charged to operations at the time we cease use of the property. The value of any equipment and leasehold improvements related to a closed store is assessed for potential impairment (see note 2(j)).
(j) Impairment of long-lived assets
Long-lived assets that are used in operations are tested for recoverability whenever events or changes in circumstances indicate that the carrying amount may not be recoverable through undiscounted future cash flows. Recognition and measurement of a potential impairment is performed on assets grouped with other assets and liabilities at the lowest level where identifiable cash flows are largely independent of the cash flows of other assets and liabilities. An impairment loss is the amount by which the carrying amount of a long-lived asset or asset group exceeds its estimated fair value. Fair value is generally estimated by internal specialists based on the present value of anticipated future cash flows or, if required, by independent third-party valuation specialists, depending on the nature of the assets or asset group.
-60-
(k) Equity method investments
The Company's equity method investments primarily consist of joint venture interests in B-R 31 Ice Cream Co., Ltd. (“BR Japan”) and BR-Korea Co., Ltd. (“BR Korea”), which are accounted for in accordance with the equity method. As a result of the acquisition of the Company by BCT (see note 19(a)) on March 1, 2006 (“BCT Acquisition”), the Company recorded a step-up in the basis of our investments in BR Japan and BR Korea. The basis difference is comprised of amortizable franchise rights and related tax liabilities and nonamortizable goodwill. The franchise rights and related tax liabilities are amortized in a manner that reflects the estimated benefits from the use of the intangible asset over a period of 14 years. The franchise rights were valued based on an estimate of future cash flows to be generated from the ongoing management of the contracts over their remaining useful lives.
(l) Goodwill and other intangible assets
Goodwill and trade names (“indefinite-lived intangibles”) have been assigned to our reporting units, which are also our operating segments, for purposes of impairment testing. All of our reporting units have indefinite-lived intangibles associated with them.
We evaluate the remaining useful life of our trade names to determine whether current events and circumstances continue to support an indefinite useful life. In addition, all of our indefinite-lived intangible assets are tested for impairment annually. We first assess qualitative factors to determine whether it is more likely than not that a trade name is impaired. In the event we were to determine that the carrying value of a trade name would more likely than not exceed its fair value, quantitative testing would be performed. Quantitative testing consists of a comparison of the fair value of each trade name with its carrying value, with any excess of carrying value over fair value being recognized as an impairment loss. For goodwill, we first perform a qualitative assessment to determine if the fair value of the reporting unit is more likely than not greater than the carrying amount. In the event we were to determine that a reporting unit's carrying value would more likely than not exceed its fair value, quantitative testing would be performed which consists of a comparison of each reporting unit’s fair value to its carrying value. The fair value of a reporting unit is an estimate of the amount for which the unit as a whole could be sold in a current transaction between willing parties. If the carrying value of a reporting unit exceeds its fair value, goodwill is written down to its implied fair value. We have selected the first day of our fiscal third quarter as the date on which to perform our annual impairment test for all indefinite-lived intangible assets. We also test for impairment whenever events or circumstances indicate that the fair value of such indefinite-lived intangibles has been impaired.
Other intangible assets consist primarily of franchise and international license rights (“franchise rights”), ice cream distribution and territorial franchise agreement license rights (“license rights”), and operating lease interests acquired related to our prime leases and subleases (“operating leases acquired”). Franchise rights recorded in the consolidated balance sheets were valued using an excess earnings approach. The valuation of franchise rights was calculated using an estimation of future royalty income and related expenses associated with existing franchise contracts at the acquisition date. Our valuation included assumptions related to the projected attrition and renewal rates on those existing franchise arrangements being valued. License rights recorded in the consolidated balance sheets were valued based on an estimate of future revenues and costs related to the ongoing management of the contracts over the remaining useful lives. Favorable and unfavorable operating leases acquired were recorded on purchased leases based on differences between contractual rents under the respective lease agreements and prevailing market rents at the lease acquisition date. Favorable operating leases acquired are included as a component of other intangible assets in the consolidated balance sheets. Due to the high level of lease renewals made by Dunkin’ Donuts’ franchisees, all lease renewal options for the Dunkin’ Donuts leases were included in the valuation of the favorable operating leases acquired. Amortization of franchise rights, license rights, and favorable operating leases acquired is recorded as amortization expense in the consolidated statements of operations and amortized over the respective franchise, license, and lease terms using the straight-line method.
Unfavorable operating leases acquired related to our prime and subleases are recorded in the liability section of the consolidated balance sheets and are amortized into rental expense and rental income, respectively, over the base lease term of the respective leases using the straight-line method. The weighted average amortization period for all unfavorable operating leases acquired is 16 years.
Management makes adjustments to the carrying amount of such intangible assets and unfavorable operating leases acquired if they are deemed to be impaired using the methodology for long-lived assets (see note 2(j)), or when such license or lease agreements are reduced or terminated.
(m) Contingencies
The Company records reserves for legal and other contingencies when information available to the Company indicates that it is probable that a liability has been incurred and the amount of the loss can be reasonably estimated. Predicting the outcomes of

-61-
claims and litigation and estimating the related costs and exposures involve substantial uncertainties that could cause actual costs to vary materially from estimates. Legal costs incurred in connection with legal and other contingencies are expensed as the costs are incurred.
(n) Foreign currency translation
We translate assets and liabilities of non-U.S. operations into U.S. dollars at rates of exchange in effect at the balance sheet date and revenues and expenses at the average exchange rates prevailing during the period. Resulting translation adjustments are recorded as a separate component of comprehensive income and stockholders’ equity, net of deferred taxes. Foreign currency translation adjustments primarily result from our joint ventures, as well as subsidiaries located in Canada, the UK, Australia, and Spain. Business transactions resulting in foreign exchange gains and losses are included in the consolidated statements of operations.
(o) Revenue recognition
Franchise fees and royalty income
Domestically, the Company sells individual franchises as well as territory agreements in the form of store development agreements (“SDA agreements”) that grant the right to develop restaurants in designated areas. Our franchise and SDA agreements typically require the franchisee to pay an initial nonrefundable fee and continuing fees, or royalty income, based upon a percentage of sales. The franchisee will typically pay us a renewal fee if we approve a renewal of the franchise agreement. Such fees are paid by franchisees to obtain the rights associated with these franchise or SDA agreements. Initial franchise fee revenue is recognized upon substantial completion of the services required of the Company as stated in the franchise agreement, which is generally upon opening of the respective restaurant. Fees collected in advance are deferred until earned, with deferred amounts expected to be recognized as revenue within one year classified as current deferred income in the consolidated balance sheets. Royalty income is based on a percentage of franchisee gross sales and is recognized when earned, which occurs at the franchisees’ point of sale. Renewal fees are recognized when a renewal agreement with a franchisee becomes effective. Occasionally, the Company offers incentive programs to franchisees in conjunction with a franchise, SDA, or renewal agreement and, when appropriate, records the costs of such programs as reductions of revenue.
For our international business, we sell master territory and/or license agreements that typically allow the master licensee to either act as the franchisee or to sub-franchise to other operators. Master license and territory fees are generally recognized over the term of the development agreement or as stores are opened, depending on the specific terms of the agreement. Royalty income is based on a percentage of franchisee gross sales and is recognized when earned, which generally occurs at the franchisees’ point of sale. Renewal fees are recognized when a renewal agreement with a franchisee or licensee becomes effective.
Rental income
Rental income for base rentals is recorded on a straight-line basis over the lease term, including the amortization of any tenant improvement dollars paid (see note 2(i)). The difference between the straight-line rent amounts and amounts receivable under the leases is recorded as deferred rent assets in current or long-term assets, as appropriate. Contingent rental income is recognized as earned, and any amounts received from lessees in advance of achieving stipulated thresholds are deferred until such threshold is actually achieved. Deferred contingent rentals are recorded as deferred income in current liabilities in the consolidated balance sheets.
Sales of ice cream products
We distribute Baskin-Robbins ice cream products to Baskin-Robbins franchisees and licensees in certain international locations. Revenue from the sale of ice cream products is recognized when title and risk of loss transfers to the buyer, which was generally upon shipment through November 2012. Beginning in December 2012, title and risk of loss generally transfers to the buyer upon delivery.
Sales at company-owned restaurants
Retail store revenues at company-owned restaurants are recognized when payment is tendered at the point of sale, net of sales tax and other sales-related taxes.
Other revenues
Other revenues include fees generated by licensing our brand names and other intellectual property, as well as gains, net of losses and transactions costs, from the sales of our restaurants to new or existing franchisees. Licensing fees are recognized
-62-
when earned, which is generally upon sale of the underlying products by the licensees. Gains on the refranchise or sale of a restaurant are recognized when the sale transaction closes, the franchisee has a minimum amount of the purchase price in at-risk equity, and we are satisfied that the buyer can meet its financial obligations to us. If the criteria for gain recognition are not met, we defer the gain to the extent we have any remaining financial exposure in connection with the sale transaction. Deferred gains are recognized when the gain recognition criteria are met.
(p) Allowance for doubtful accounts
We monitor the financial condition of our franchisees and licensees and record provisions for estimated losses on receivables when we believe that our franchisees or licensees are unable to make their required payments. While we use the best information available in making our determination, the ultimate recovery of recorded receivables is also dependent upon future economic events and other conditions that may be beyond our control. Included in the allowance for doubtful notes and accounts receivables is a provision for uncollectible royalty, lease, and licensing fee receivables.
(q) Share-based payment
We measure compensation cost at fair value on the date of grant for all stock-based awards and recognize compensation expense over the service period that the awards are expected to vest. The Company has elected to recognize compensation cost for graded-vesting awards subject only to a service condition over the requisite service period of the entire award.
(r) Income taxes
Deferred tax assets and liabilities are recorded for the expected future tax consequences of items that have been included in our consolidated financial statements or tax returns. Deferred tax assets and liabilities are determined based on the differences between the financial statement carrying amounts of assets and liabilities and the respective tax bases of assets and liabilities using enacted tax rates that are expected to apply in years in which the temporary differences are expected to reverse. The effects of changes in tax rates on deferred tax assets and liabilities are recognized in the consolidated statements of operations in the year in which the law is enacted. Valuation allowances are provided when the Company does not believe it is more likely than not that it will realize the benefit of identified tax assets.
A tax position taken or expected to be taken in a tax return is recognized in the financial statements when it is more likely than not that the position would be sustained upon examination by tax authorities. A recognized tax position is then measured at the largest amount of benefit that is greater than fifty percent likely of being realized upon ultimate settlement. Estimates of interest and penalties on unrecognized tax benefits are recorded in the provision (benefit) for income taxes.
(s) Comprehensive income
Comprehensive income is primarily comprised of net income, foreign currency translation adjustments, unrealized gains and losses on interest rate swaps, and unrealized pension gains and losses, and is reported in the consolidated statements of comprehensive income, net of taxes, for all periods presented.
(t) Deferred financing costs
Deferred financing costs primarily represent capitalizable costs incurred related to the issuance and refinancing of the Company’s long-term debt (see note 8). Deferred financing costs are being amortized over a weighted average period of approximately 7 years, based on projected required repayments, using the effective interest rate method.
(u) Derivative instruments and hedging activities
The Company uses derivative instruments to hedge interest rate risks. These derivative contracts are entered into with financial institutions. The Company does not use derivative instruments for trading purposes and we have procedures in place to monitor and control their use.
We record all derivative instruments on our consolidated balance sheets at fair value. For derivative instruments that are designated and qualify as a cash flow hedge, the effective portion of the gain or loss on the derivative instruments is reported as a component of other comprehensive income (loss) and reclassified into earnings in the same period or periods during which the hedged transaction affects earnings. Any ineffective portion of the gain or loss on the derivative instrument for a cash flow hedge is recorded in the consolidated statements of operations immediately. See note 9 for a discussion of our use of derivative instruments, management of credit risk inherent in derivative instruments, and fair value information.
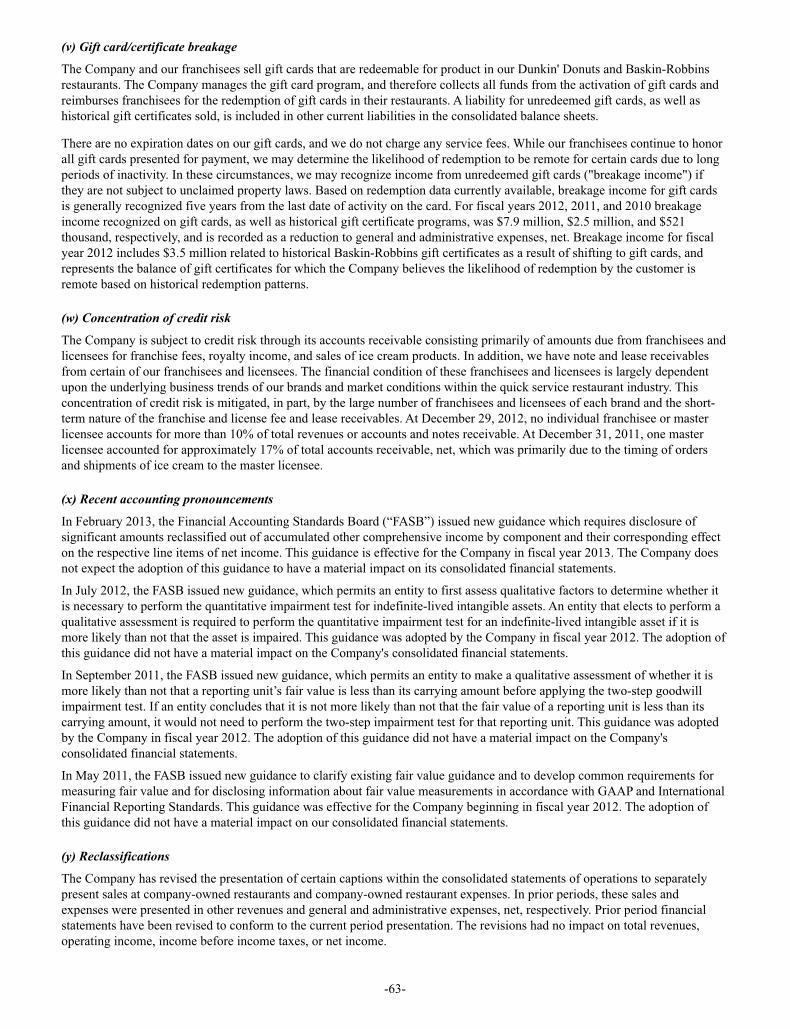
-63-
(v) Gift card/certificate breakage
The Company and our franchisees sell gift cards that are redeemable for product in our Dunkin' Donuts and Baskin-Robbins restaurants. The Company manages the gift card program, and therefore collects all funds from the activation of gift cards and reimburses franchisees for the redemption of gift cards in their restaurants. A liability for unredeemed gift cards, as well as historical gift certificates sold, is included in other current liabilities in the consolidated balance sheets.
There are no expiration dates on our gift cards, and we do not charge any service fees. While our franchisees continue to honor all gift cards presented for payment, we may determine the likelihood of redemption to be remote for certain cards due to long periods of inactivity. In these circumstances, we may recognize income from unredeemed gift cards ("breakage income") if they are not subject to unclaimed property laws. Based on redemption data currently available, breakage income for gift cards is generally recognized five years from the last date of activity on the card. For fiscal years 2012, 2011, and 2010 breakage income recognized on gift cards, as well as historical gift certificate programs, was $7.9 million, $2.5 million, and $521 thousand, respectively, and is recorded as a reduction to general and administrative expenses, net. Breakage income for fiscal year 2012 includes $3.5 million related to historical Baskin-Robbins gift certificates as a result of shifting to gift cards, and represents the balance of gift certificates for which the Company believes the likelihood of redemption by the customer is remote based on historical redemption patterns.
(w) Concentration of credit risk
The Company is subject to credit risk through its accounts receivable consisting primarily of amounts due from franchisees and licensees for franchise fees, royalty income, and sales of ice cream products. In addition, we have note and lease receivables from certain of our franchisees and licensees. The financial condition of these franchisees and licensees is largely dependent upon the underlying business trends of our brands and market conditions within the quick service restaurant industry. This concentration of credit risk is mitigated, in part, by the large number of franchisees and licensees of each brand and the short-term nature of the franchise and license fee and lease receivables. At December 29, 2012, no individual franchisee or master licensee accounts for more than 10% of total revenues or accounts and notes receivable. At December 31, 2011, one master licensee accounted for approximately 17% of total accounts receivable, net, which was primarily due to the timing of orders and shipments of ice cream to the master licensee.
(x) Recent accounting pronouncements
In February 2013, the Financial Accounting Standards Board (“FASB”) issued new guidance which requires disclosure of significant amounts reclassified out of accumulated other comprehensive income by component and their corresponding effect on the respective line items of net income. This guidance is effective for the Company in fiscal year 2013. The Company does not expect the adoption of this guidance to have a material impact on its consolidated financial statements.
In July 2012, the FASB issued new guidance, which permits an entity to first assess qualitative factors to determine whether it is necessary to perform the quantitative impairment test for indefinite-lived intangible assets. An entity that elects to perform a qualitative assessment is required to perform the quantitative impairment test for an indefinite-lived intangible asset if it is more likely than not that the asset is impaired. This guidance was adopted by the Company in fiscal year 2012. The adoption of this guidance did not have a material impact on the Company's consolidated financial statements.
In September 2011, the FASB issued new guidance, which permits an entity to make a qualitative assessment of whether it is more likely than not that a reporting unit’s fair value is less than its carrying amount before applying the two-step goodwill impairment test. If an entity concludes that it is not more likely than not that the fair value of a reporting unit is less than its carrying amount, it would not need to perform the two-step impairment test for that reporting unit. This guidance was adopted by the Company in fiscal year 2012. The adoption of this guidance did not have a material impact on the Company's consolidated financial statements.
In May 2011, the FASB issued new guidance to clarify existing fair value guidance and to develop common requirements for measuring fair value and for disclosing information about fair value measurements in accordance with GAAP and International Financial Reporting Standards. This guidance was effective for the Company beginning in fiscal year 2012. The adoption of this guidance did not have a material impact on our consolidated financial statements.
(y) Reclassifications
The Company has revised the presentation of certain captions within the consolidated statements of operations to separately present sales at company-owned restaurants and company-owned restaurant expenses. In prior periods, these sales and expenses were presented in other revenues and general and administrative expenses, net, respectively. Prior period financial statements have been revised to conform to the current period presentation. The revisions had no impact on total revenues, operating income, income before income taxes, or net income.

-64-
(z) Subsequent events
Subsequent events have been evaluated up through the date that these consolidated financial statements were filed.
(3) Franchise fees and royalty income
Franchise fees and royalty income consisted of the following (in thousands):
Fiscal year ended
December 29,
2012December 31,
2011December 25,
2010
Royalty income $ 385,713 363,458 332,770Initial franchise fees, including renewal income 33,227 35,016 27,157
Total franchise fees and royalty income $ 418,940 398,474 359,927
The changes in franchised and company-owned points of distribution were as follows:
Fiscal year ended
December 29,
2012December 31,
2011December 25,
2010
Systemwide points of distribution:Franchised points of distribution in operation—beginning of year 16,763 16,162 15,375Franchises opened 1,283 1,335 1,618Franchises closed (621) (735) (815)Net transfers from (to) company-owned points of distribution (1) 1 (16)Franchised points of distribution in operation—end of year 17,424 16,763 16,162Company-owned points of distribution—end of year 35 31 31
Total systemwide points of distribution—end of year 17,459 16,794 16,193
(4) Advertising funds
On behalf of certain Dunkin’ Donuts and Baskin-Robbins advertising funds, the Company collects a percentage, which is generally 5%, of gross retail sales from Dunkin’ Donuts and Baskin-Robbins franchisees to be used for various forms of advertising for each brand. In most of our international markets, franchisees manage their own advertising expenditures, which are not included in the advertising fund results.
The Company administers and directs the development of all advertising and promotion programs in the advertising funds for which it collects advertising fees, in accordance with the provisions of our franchise agreements. The Company acts as, in substance, an agent with regard to these advertising contributions. We consolidate and report all assets and liabilities held by these advertising funds as restricted assets of advertising funds and liabilities of advertising funds within current assets and current liabilities, respectively, in the consolidated balance sheets. The assets and liabilities held by these advertising funds consist primarily of receivables, accrued expenses, and other liabilities related specifically to the advertising funds. The revenues, expenses, and cash flows of the advertising funds are not included in the Company’s consolidated statements of operations or consolidated statements of cash flows because the Company does not have complete discretion over the usage of the funds. Contributions to these advertising funds are restricted to advertising, product development, public relations, merchandising, and administrative expenses and programs to increase sales and further enhance the public reputation of each of the brands.
At December 29, 2012 and December 31, 2011, the Company had a net payable of $13.7 million and $19.5 million, respectively, to the various advertising funds.
To cover administrative expenses of the advertising funds, the Company charges each advertising fund a management fee for such items as rent, accounting services, information technology, data processing, product development, legal, administrative support services, and other operating expenses, which amounted to $5.6 million, $5.7 million, and $5.6 million for fiscal years 2012, 2011, and 2010, respectively. Such management fees are included in the consolidated statements of operations as a reduction in general and administrative expenses, net.
The Company made discretionary contributions to certain advertising funds, which amounted to $863 thousand, $2.0 million, and $1.2 million for fiscal years 2012, 2011, and 2010, respectively, for the purpose of supplementing national and regional

-65-
advertising in certain markets. The Company also made net contributions to the advertising funds of $808 thousand, $289 thousand, and $537 thousand for fiscal years 2012, 2011, and 2010, respectively, based on retail sales as owner and operator of company-owned restaurants.
(5) Property and equipment
Property and equipment at December 29, 2012 and December 31, 2011 consisted of the following (in thousands):
December 29,2012
December 31,2011
Land $ 31,080 30,706Buildings 45,447 43,380Leasehold improvements 158,797 161,167Store, production, and other equipment 50,046 50,105Construction in progress 5,549 3,543
Property and equipment, gross 290,919 288,901Accumulated depreciation and amortization (109,747) (103,541)
Property and equipment, net $ 181,172 185,360
The Company recognized impairment charges on leasehold improvements, typically due to termination of the underlying lease agreement, and other corporately-held assets of $319 thousand, $1.4 million, and $4.8 million during fiscal years 2012, 2011, and 2010, respectively, which are included in impairment charges in the consolidated statements of operations.
(6) Investments in joint ventures
The Company’s ownership interests in its joint ventures as of December 29, 2012 and December 31, 2011 were as follows:
Ownership
EntityDecember 29,
2012December 31,
2011
BR Japan 43.3% 43.3%BR Korea 33.3% 33.3%
Summary financial information for the joint venture operations on an aggregated basis was as follows (in thousands):
December 29,2012
December 31,2011
Current assets $ 248,371 195,977Current liabilities 102,787 92,758
Working capital 145,584 103,219Property, plant, and equipment, net 144,570 147,929Other assets 163,511 156,061Long-term liabilities 62,351 55,514
Joint venture equity $ 391,314 351,695
Fiscal year ended
December 29,
2012December 31,
2011December 25,
2010
Revenues $ 687,676 659,319 580,671Net income 51,046 44,156 47,664
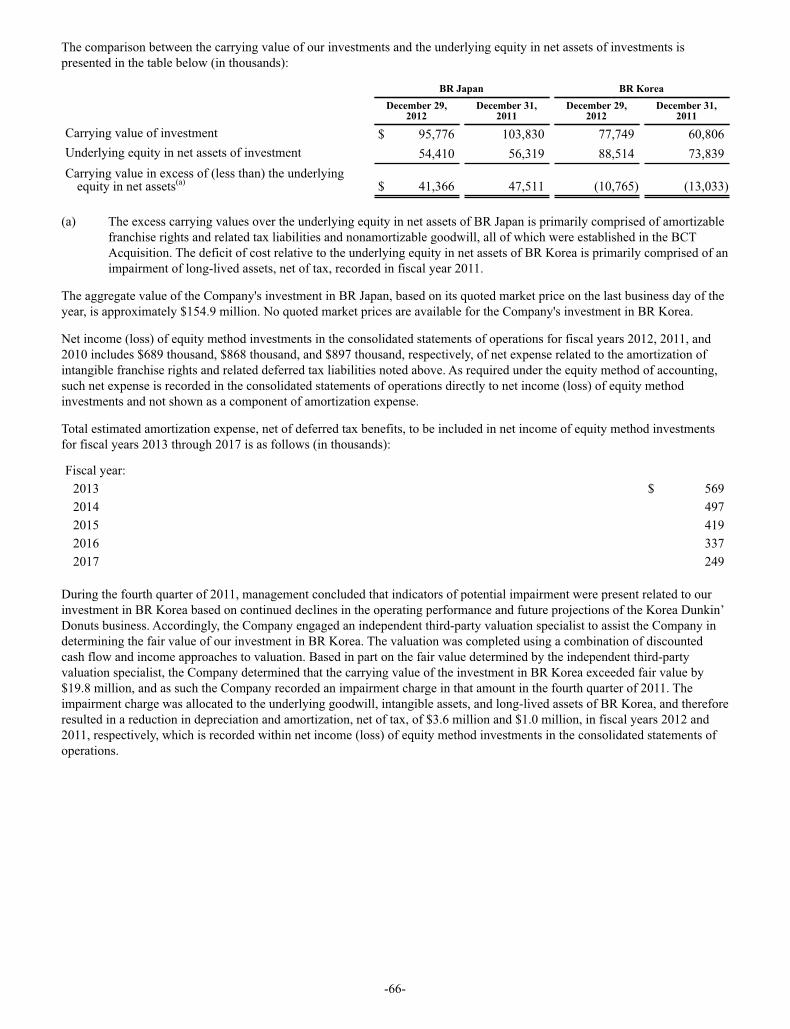
-66-
The comparison between the carrying value of our investments and the underlying equity in net assets of investments is presented in the table below (in thousands):
BR Japan BR Korea
December 29,
2012December 31,
2011December 29,
2012December 31,
2011
Carrying value of investment $ 95,776 103,830 77,749 60,806Underlying equity in net assets of investment 54,410 56,319 88,514 73,839Carrying value in excess of (less than) the underlying
equity in net assets(a) $ 41,366 47,511 (10,765) (13,033) (a) The excess carrying values over the underlying equity in net assets of BR Japan is primarily comprised of amortizable
franchise rights and related tax liabilities and nonamortizable goodwill, all of which were established in the BCT Acquisition. The deficit of cost relative to the underlying equity in net assets of BR Korea is primarily comprised of an impairment of long-lived assets, net of tax, recorded in fiscal year 2011.
The aggregate value of the Company's investment in BR Japan, based on its quoted market price on the last business day of the year, is approximately $154.9 million. No quoted market prices are available for the Company's investment in BR Korea.
Net income (loss) of equity method investments in the consolidated statements of operations for fiscal years 2012, 2011, and 2010 includes $689 thousand, $868 thousand, and $897 thousand, respectively, of net expense related to the amortization of intangible franchise rights and related deferred tax liabilities noted above. As required under the equity method of accounting, such net expense is recorded in the consolidated statements of operations directly to net income (loss) of equity method investments and not shown as a component of amortization expense.
Total estimated amortization expense, net of deferred tax benefits, to be included in net income of equity method investments for fiscal years 2013 through 2017 is as follows (in thousands):
Fiscal year:2013 $ 5692014 4972015 4192016 3372017 249
During the fourth quarter of 2011, management concluded that indicators of potential impairment were present related to our investment in BR Korea based on continued declines in the operating performance and future projections of the Korea Dunkin’ Donuts business. Accordingly, the Company engaged an independent third-party valuation specialist to assist the Company in determining the fair value of our investment in BR Korea. The valuation was completed using a combination of discounted cash flow and income approaches to valuation. Based in part on the fair value determined by the independent third-party valuation specialist, the Company determined that the carrying value of the investment in BR Korea exceeded fair value by $19.8 million, and as such the Company recorded an impairment charge in that amount in the fourth quarter of 2011. The impairment charge was allocated to the underlying goodwill, intangible assets, and long-lived assets of BR Korea, and therefore resulted in a reduction in depreciation and amortization, net of tax, of $3.6 million and $1.0 million, in fiscal years 2012 and 2011, respectively, which is recorded within net income (loss) of equity method investments in the consolidated statements of operations.

-67-
(7) Goodwill and other intangible assets
The changes and carrying amounts of goodwill by reporting unit were as follows (in thousands):
Dunkin’ Donuts U.S. Dunkin’ Donuts International Baskin-Robbins International Total
Goodwill
Accumulatedimpairment
chargesNet
Balance Goodwill
Accumulatedimpairment
chargesNet
Balance Goodwill
Accumulatedimpairment
chargesNet
Balance Goodwill
Accumulatedimpairment
chargesNet
Balance
Balances at December 25, 2010 $1,148,796 (270,441) 878,355 10,300 — 10,300 24,037 (24,037) — 1,183,133 (294,478) 888,655
Goodwillacquired 2,344 — 2,344 — — — — — — 2,344 — 2,344
Effects offoreigncurrencyadjustments — — — (7) — (7) — — — (7) — (7)
Balances at December 31, 2011 1,151,140 (270,441) 880,699 10,293 — 10,293 24,037 (24,037) — 1,185,470 (294,478) 890,992
Goodwillacquired 895 — 895 — — — — — — 895 — 895
Effects offoreigncurrencyadjustments — — — 13 — 13 — — — 13 — 13
Balances at December 29, 2012 $1,152,035 (270,441) 881,594 10,306 — 10,306 24,037 (24,037) — 1,186,378 (294,478) 891,900
The goodwill acquired during fiscal years 2012 and 2011 is related to the acquisition of certain company-owned points of distribution.
Other intangible assets at December 29, 2012 consisted of the following (in thousands):
Weightedaverage
amortizationperiod(years)
Grosscarryingamount
Accumulatedamortization
Netcarryingamount
Definite-lived intangibles:Franchise rights 20 $ 384,065 (139,677) 244,388Favorable operating leases acquired 15 77,653 (35,207) 42,446License rights 10 6,230 (4,250) 1,980
Indefinite-lived intangible:Trade names N/A 1,190,970 — 1,190,970
$ 1,658,918 (179,134) 1,479,784
Other intangible assets at December 31, 2011 consisted of the following (in thousands):
Weightedaverage
amortizationperiod(years)
Grosscarryingamount
Accumulatedamortization
Netcarryingamount
Definite-lived intangibles:Franchise rights 20 $ 383,786 (119,091) 264,695Favorable operating leases acquired 14 83,672 (34,725) 48,947License rights 10 6,230 (3,623) 2,607
Indefinite-lived intangible:Trade names N/A 1,190,970 — 1,190,970
$ 1,664,658 (157,439) 1,507,219
The changes in the gross carrying amount of other intangible assets and weighted average amortization period from December 31, 2011 to December 29, 2012 are primarily due to the impairment of favorable operating leases acquired resulting from lease terminations and intangibles acquired related to the acquisition of company-owned points of distribution. The gross

-68-
carrying amount of other intangible assets is also impacted by foreign currency fluctuations. Impairment of favorable operating leases acquired, net of accumulated amortization, totaled $959 thousand, $624 thousand, and $2.3 million, for fiscal years 2012, 2011, and 2010, respectively, and is included in impairment charges in the consolidated statements of operations.
Total estimated amortization expense for other intangible assets for fiscal years 2013 through 2017 is as follows (in thousands):
Fiscal year:2013 $ 26,1492014 25,5462015 25,2192016 22,2662017 21,480
(8) Debt
Debt at December 29, 2012 and December 31, 2011 consisted of the following (in thousands):
December 29,2012
December 31,2011
Term loans $ 1,849,958 1,468,309Less current portion of long-term debt 26,680 14,965
Total long-term debt $ 1,823,278 1,453,344
Senior credit facility
The Company’s senior credit facility consists of $1.90 billion aggregate principal amount term loans and a $100.0 million revolving credit facility, which were entered into by DBGI’s subsidiary, Dunkin’ Brands, Inc. (“DBI”) in November 2010. The term loans and revolving credit facility mature in November 2017 and November 2015, respectively. As of December 29, 2012 and December 31, 2011, $1.86 billion and $1.47 billion, respectively, of principal was outstanding on the term loans. As of December 29, 2012 and December 31, 2011, $11.5 million and $11.2 million, respectively, of letters of credit were outstanding against the revolving credit facility. There were no amounts drawn down on these letters of credit.
Borrowings under the senior credit facility bear interest at a rate per annum equal to an applicable margin plus, at our option, either (1) a base rate determined by reference to the highest of (a) the Federal Funds rate plus 0.5%, (b) the prime rate, (c) the LIBOR rate plus 1.0%, and (d) 2.0% or (2) a LIBOR rate provided that LIBOR shall not be lower than 1.0%. The applicable margin under the term loan facility is 2.0% for loans based upon the base rate and 3.0% for loans based upon the LIBOR rate. In addition, we are required to pay a 0.5% commitment fee per annum on the unused portion of the revolver and a fee for letter of credit amounts outstanding of 3.0%. The effective interest rate for term loans, including the amortization of original issue discount and deferred financing costs, was 4.4% at December 29, 2012.
Repayments are required to be made under the term loans equal to $19.0 million per calendar year, payable in quarterly installments through September 2017, with the remaining principal balance due in November 2017. Additionally, following the end of each fiscal year, the Company is required to prepay an amount equal to 25% of excess cash flow (as defined in the senior credit facility) for such fiscal year. If DBI’s leverage ratio, which is a measure of DBI’s outstanding debt to earnings before interest, taxes, depreciation, and amortization, adjusted for certain items (as specified in the senior credit facility), is less than 4.75x, no excess cash flow payments are required. The excess cash flow payments may be applied to required principal payments. Under the terms of the senior credit facility, the first excess cash flow payment was due in the first quarter of fiscal year 2012 based on fiscal year 2011 excess cash flow and leverage ratio. In December 2011, the Company made an additional principal payment of $11.8 million that was applied to the 2011 excess cash flow payment due in the first quarter of 2012. Based on fiscal year 2011 excess cash flow and leverage ratio requirements, considering all payments made, the excess cash flow payment required in the first quarter of 2012 was $2.4 million. Based on fiscal year 2012 excess cash flow and leverage ratio requirements, considering all payments made, the excess cash flow payment required in the first quarter of 2013 is $21.7 million. The Company has reflected this excess cash flow payment, along with a $5.0 million voluntary payment made in the first week of fiscal year 2013, within the current portion of long-term debt as of December 29, 2012 in the consolidated balance sheets. Based on all payments made, including the required excess cash flow payment in the first quarter of 2013, no additional principal payments would be required in 2013. Other events and transactions, such as certain asset sales and incurrence of debt, may trigger additional mandatory prepayments.

-69-
The senior credit facility contains certain financial and nonfinancial covenants, which include restrictions on liens, investments, additional indebtedness, asset sales, certain dividend payments, and certain transactions with affiliates. At December 29, 2012 and December 31, 2011, the Company was in compliance with all of its covenants under the senior credit facility.
Certain of the Company’s wholly owned domestic subsidiaries guarantee the senior credit facility. All obligations under the senior credit facility, and the guarantees of those obligations, are secured, subject to certain exceptions, by substantially all assets of DBI and the subsidiary guarantors.
During 2011, the Company increased the size of the term loans from $1.25 billion to $1.50 billion. The incremental proceeds of the term loans were used to repay $250.0 million of the Company’s senior notes. Additionally, the Company completed two separate re-pricing transactions to reduce the stated interest rate on the senior credit facility. As a result of the additional term loan borrowings and the re-pricings of the term loans, the Company recorded a loss on debt extinguishment and refinancing transactions of $8.2 million in fiscal year 2011, which includes debt extinguishment of $477 thousand related to the write-off of original issuance discount and deferred financing costs, and $7.7 million of costs paid to creditors and third parties.
In August 2012, DBI amended its senior credit facility to provide for additional term loan borrowings of $400.0 million. The additional borrowings were issued with an original issue discount of $4.0 million, resulting in net cash proceeds of $396.0 million. The proceeds were used to fund a repurchase of common stock from certain shareholders (see note 13(c)). In addition, the amendment provides certain changes to the negative covenants contained in the senior credit facility and permits increases in future incremental facilities subject to the Company and DBI remaining in compliance with certain specified leverage ratios. In connection with the amendment, the Company recorded costs of $4.0 million, which consisted primarily of fees paid to third parties, within loss on debt extinguishment and refinancing transactions in the consolidated statements of operations.
Total debt issuance costs incurred and capitalized in relation to the senior credit facility were $34.6 million, including costs incurred and capitalized in connection with additional term loan borrowings. The term loans, including additional term loan borrowings, were issued with an original issue discount of $10.3 million. Total amortization of original issue discount and debt issuance costs related to the senior credit facility was $5.7 million, $5.3 million, and $323 thousand for fiscal years 2012, 2011 and 2010, respectively, which is included in interest expense in the consolidated statements of operations.
In February 2013, the Company amended its senior credit facility, resulting in a reduction of the applicable margin for term loans by 0.25% and extending the term loan maturities to February 2020.
Subsequent to the amendment to the senior credit facility, borrowings under the revolving credit facility bear interest at a rate per annum equal to an applicable margin plus, at our option, either (1) a base rate determined by reference to the highest of (a) the Federal Funds rate plus 0.5%, (b) the prime rate, and (c) the LIBOR rate plus 1.0%, or (2) a LIBOR rate. The applicable margin under the revolving credit facility is 1.5% for loans based upon the base rate and 2.5% for loans based upon the LIBOR rate. In addition, we are required to pay a 0.5% commitment fee per annum on the unused portion of the revolver and a fee for letter of credit amounts outstanding of 2.5%. The amendment extends the maturity of the revolving credit facility to February 2018.
In connection with the amendment, the Company expects to incur costs of approximately $6.2 million, primarily consisting of fees paid to existing creditors and third parties.
Senior notes
DBI issued $625.0 million face amount senior notes in November 2010 with a maturity of December 2018 and interest payable semi-annually at a rate of 9.625% per annum.
The senior notes were issued with an original issue discount of $9.4 million. Total debt issuance costs incurred and capitalized in relation to the senior notes were $15.6 million. Total amortization of original issue discount and debt issuance costs related to the senior notes was $1.0 million and $182 thousand for fiscal years 2011 and 2010, respectively, which is included in interest expense in the consolidated statements of operations.
In conjunction with the additional term loan borrowings during 2011, the Company repaid $250.0 million of senior notes. Using funds raised by the Company’s initial public offering (see note 13(a)) in August 2011, the Company repaid the full remaining principal balance on the senior notes. In conjunction with the repayment of senior notes, the Company recorded a loss on debt extinguishment of $26.0 million, which includes the write-off of original issuance discount and deferred financing costs totaling $22.8 million, as well as prepayment premiums and third-party costs of $3.2 million.

-70-
ABS Notes
On May 26, 2006, certain of the Company’s subsidiaries (the “Co-Issuers”) entered into a securitization transaction. In connection with this securitization transaction, the Co-Issuers issued 5.779% Fixed Rate Series 2006-1 Senior Notes, Class A-2 (“Class A-2 Notes”) with an initial principal amount of $1.5 billion and 8.285% Fixed Rate Series 2006-1 Subordinated Notes, Class M-1 (“Class M-1 Notes”) with an initial principal amount of $100.0 million. In addition, the Company also issued Class A-1 Notes (the Class A-1 Notes, together with the Class A-2 Notes and the Class M-1 Notes, the “ABS Notes”), which permitted the Co-Issuers to draw up to a maximum of $100.0 million on a revolving basis.
Total debt issuance costs incurred and capitalized in relation to the ABS Notes were $72.9 million, of which $6.0 million was amortized to interest expense during fiscal year 2010.
A portion of the ABS Notes were repurchased and retired in fiscal year 2009. In 2010, all remaining outstanding ABS Notes in the amount of $1.45 billion were repaid in full with proceeds from the term loans and senior notes, as well as available cash. As a result, a net loss on debt extinguishment of $62.0 million was recorded, which includes the write-off of deferred financing costs of $37.4 million, make whole payments of $23.6 million, and other professional and legal costs.
Maturities of long-term debt
Excluding the impact of any additional principal payments made and excess cash flow payments required by the senior credit facility as discussed above, and considering the extended maturity of the term loans to February 2020, the aggregate maturities of long-term debt for 2013 through 2017 are $19.0 million per year.
(9) Derivative instruments and hedging transactions
The Company is exposed to global market risks, including the effect of changes in interest rates, and may use derivative instruments to mitigate the impact of these changes. The Company does not use derivatives with a level of complexity or with a risk higher than the exposures to be hedged and does not hold or issue derivatives for trading purposes. The Company's hedging instruments consist solely of interest rate swaps at December 29, 2012. The Company's risk management objective and strategy with respect to the interest rate swaps is to limit the Company's exposure to increased interest rates on its variable rate debt by reducing the potential variability in cash flow requirements relating to interest payments on a portion of its outstanding debt. The Company documents its risk management objective and strategy for undertaking hedging transactions, as well as all relationships between hedging instruments and hedged items.
In September 2012, the Company entered into variable-to-fixed interest rate swap agreements with three counterparties to hedge the risk of increases in cash flows (interest payments) attributable to increases in three-month LIBOR above 1.0%, the designated benchmark interest rate being hedged, through November 2017. The notional value of the swaps totals $900.0 million, and the Company is required to make quarterly payments on the notional amount at a fixed average interest rate of approximately 1.37%, resulting in a total interest rate of approximately 4.37% on the hedged amount when considering the applicable margin in effect at December 29, 2012. In exchange, the Company receives interest on the notional amount at a variable rate based on a three-month LIBOR spot rate, subject to a 1.0% floor. The swaps have been designated as hedging instruments and are classified as cash flow hedges. They are recognized on the Company's consolidated balance sheets at fair value and classified based on the instruments' maturity dates. Changes in the fair value measurements of the derivative instruments are reflected as adjustments to other comprehensive income (loss) and/or current earnings.
The fair values of derivatives instruments consisted of the following (in thousands):
December 29,2012
December 31,2011
Consolidated balance sheetclassification
Interest rate swaps - liability $ 2,809 — Other long-term liabilitiesTotal fair values of derivative instruments - liability $ 2,809 —

-71-
The tables below summarizes the effects of derivative instruments on the consolidated statements of operations and comprehensive income for fiscal year 2012:
Derivatives designated as cash flow hedging
instruments
Amount of gain (loss) recognized in
other comprehensive income (loss)
Amount of net gain(loss) reclassified
into earningsConsolidated statement of operations
classification
Total effect on other comprehensive income (loss)
Interest rate swaps (3,673) (864) Interest expense (2,809)Income tax effect 1,509 355 Provision (benefit) for income taxes 1,154Net of income taxes (2,164) (509) (1,655)
There was no ineffectiveness of the interest rate swaps since inception, and therefore, ineffectiveness had no impact on the consolidated statements of operations for fiscal year 2012. The Company reclassified $864 thousand from accumulated other comprehensive income (loss) into the consolidated statements of operations related to the swaps in fiscal year 2012, which is included in interest expense. The interest expense had not been paid in cash as of December 29, 2012 and is accrued in other current liabilities in the consolidated balance sheets. During the next twelve months, the Company estimates that $3.4 million will be reclassified from accumulated other comprehensive income (loss) as an increase to interest expense based on current projections of LIBOR.
The Company is exposed to credit-related losses in the event of non-performance by the counterparties to its hedging instruments. To mitigate counterparty credit risk, the Company only enters into contracts with major financial institutions based upon their credit ratings and other factors, and continually assesses the creditworthiness of its counterparties. At December 29, 2012, all of the counterparties to the interest rate swaps had investment grade ratings. To date, all counterparties have performed in accordance with their contractual obligations.
The Company has agreements with each of its derivative counterparties that contain a provision whereby if the Company defaults on any of its indebtedness, including default where repayment of the indebtedness has not been accelerated by the lender, then the Company could also be declared in default on its derivative obligations. As of December 29, 2012, the Company has not posted any collateral related to these agreements. As of December 29, 2012, the termination value of derivatives is a net liability of $3.7 million, which includes accrued interest but excludes any adjustment for nonperformance risk, related to these agreements.
(10) Other current liabilities
Other current liabilities at December 29, 2012 and December 31, 2011 consisted of the following (in thousands):
December 29,2012
December 31,2011
Gift card/certificate liability $ 145,981 144,965Accrued salary and benefits 31,136 31,001Accrued legal liabilities (see note 17(d)) 27,305 4,658Accrued interest 13,564 659Accrued professional costs 2,996 3,427Other 18,949 15,887
Total other current liabilities $ 239,931 200,597
(11) Leases
The Company is the lessee on certain land leases (the Company leases the land and erects a building) or improved leases (lessor owns the land and building) covering restaurants and other properties. In addition, the Company has leased and subleased land and buildings to others. Many of these leases and subleases provide for future rent escalation and renewal options. In addition, contingent rentals, determined as a percentage of annual sales by our franchisees, are stipulated in certain prime lease and sublease agreements. The Company is generally obligated for the cost of property taxes, insurance, and maintenance relating to these leases. Such costs are typically charged to the sublessee based on the terms of the sublease agreements. The Company also leases certain office equipment and a fleet of automobiles under noncancelable operating leases.

-72-
Included in the Company’s consolidated balance sheets are the following amounts related to capital leases (in thousands):
December 29,2012
December 31,2011
Leased property under capital leases (included in property and equipment) $ 7,902 5,097Less accumulated depreciation (2,003) (1,510)
Net leased property under capital leases $ 5,899 3,587Capital lease obligations:
Current $ 371 232Long-term 7,251 4,928
Total capital lease obligations $ 7,622 5,160
Capital lease obligations exclude that portion of the minimum lease payments attributable to land, which are classified separately as operating leases. Interest expense associated with the capital lease obligations is computed using the incremental borrowing rate at the time the lease is entered into and is based on the amount of the outstanding lease obligation. Depreciation on capital lease assets is included in depreciation expense in the consolidated statements of operations. Interest expense related to capital leases for fiscal years 2012, 2011, and 2010 was $600 thousand, $481 thousand, and $505 thousand, respectively.
Included in the Company’s consolidated balance sheets are the following amounts related to assets leased to others under operating leases, where the Company is the lessor (in thousands):
December 29,2012
December 31,2011
Land $ 27,210 26,624Buildings 39,242 38,472Leasehold improvements 141,264 146,209Store, production, and other equipment 149 62Construction in progress 1,384 823
Assets leased to others, gross 209,249 212,190Accumulated depreciation (71,100) (66,622)
Assets leased to others, net $ 138,149 145,568
Future minimum rental commitments to be paid and received by the Company at December 29, 2012 for all noncancelable leases and subleases are as follows (in thousands):
PaymentsReceipts
SubleasesNet
leases Capitalleases
Operatingleases
Fiscal year:2013 $ 981 53,658 (60,737) (6,098)2014 1,000 52,690 (60,000) (6,310)2015 1,033 47,555 (59,001) (10,413)2016 1,037 46,427 (58,865) (11,401)2017 1,059 46,450 (58,255) (10,746)Thereafter 7,574 372,307 (369,847) 10,034
Total minimum rental commitments 12,684 $ 619,087 (666,705) (34,934)Less amount representing interest 5,062
Present value of minimum capital lease obligations $ 7,622
Rental expense under operating leases associated with franchised locations and company-owned locations is included in occupancy expenses—franchised restaurants and company-owned restaurant expenses, respectively, in the consolidated statements of operations. Rental expense under operating leases for all other locations, including corporate facilities, is included

-73-
in general and administrative expenses, net, in the consolidated statements of operations. Total rental expense for all operating leases consisted of the following (in thousands):
Fiscal year ended
December 29,
2012December 31,
2011December 25,
2010
Base rentals $ 52,821 52,214 53,704Contingent rentals 5,227 4,510 4,093
Total rental expense $ 58,048 56,724 57,797
Total rental income for all leases and subleases consisted of the following (in thousands):
Fiscal year ended
December 29,
2012December 31,
2011December 25,
2010
Base rentals $ 67,988 66,061 66,630Contingent rentals 28,828 26,084 24,472
Total rental income $ 96,816 92,145 91,102
The impact of the amortization of our unfavorable operating leases acquired resulted in an increase in rental income and a decrease in rental expense as follows (in thousands):
Fiscal year ended
December 29,
2012December 31,
2011December 25,
2010
Increase in rental income $ 1,065 1,392 1,806Decrease in rental expense 1,287 1,838 2,514
Total increase in operating income $ 2,352 3,230 4,320
Following is the estimated impact of the amortization of our unfavorable operating leases acquired for each of the next five years (in thousands):
Decrease inrental expense
Increase inrental income
Total increasein operating
income
Fiscal year:2013 $ 1,119 936 2,0552014 1,063 851 1,9142015 958 794 1,7522016 902 723 1,6252017 902 686 1,588
(12) Segment information
The Company is strategically aligned into two global brands, Dunkin’ Donuts and Baskin-Robbins, which are further segregated between U.S. operations and international operations. As such, the Company has determined that it has four operating segments, which are its reportable segments: Dunkin’ Donuts U.S., Dunkin’ Donuts International, Baskin-Robbins U.S., and Baskin-Robbins International. Dunkin’ Donuts U.S., Baskin-Robbins U.S., and Dunkin’ Donuts International primarily derive their revenues through royalty income, franchise fees, and rental income. Baskin-Robbins U.S. also derives revenue through license fees from a third-party license agreement. Baskin-Robbins International primarily derives its revenues from sales of ice cream products, as well as royalty income, franchise fees, and license fees. The operating results of each segment are regularly reviewed and evaluated separately by the Company’s senior management, which includes, but is not limited to, the chief executive officer. Senior management primarily evaluates the performance of its segments and allocates resources to them based on earnings before interest, taxes, depreciation, amortization, impairment charges, loss on debt extinguishment and refinancing transactions, other gains and losses, and unallocated corporate charges, referred to as segment profit. When senior management reviews a balance sheet, it is at a consolidated level. The accounting policies applicable to each segment are consistent with those used in the consolidated financial statements.
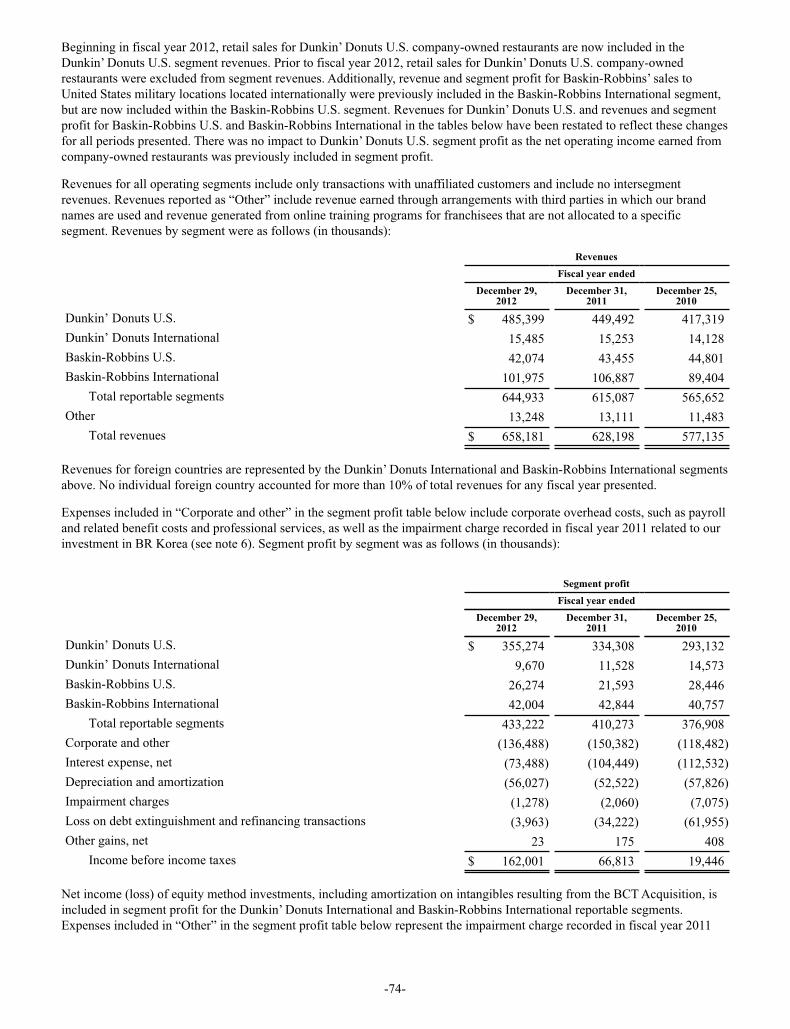
-74-
Beginning in fiscal year 2012, retail sales for Dunkin’ Donuts U.S. company-owned restaurants are now included in the Dunkin’ Donuts U.S. segment revenues. Prior to fiscal year 2012, retail sales for Dunkin’ Donuts U.S. company-owned restaurants were excluded from segment revenues. Additionally, revenue and segment profit for Baskin-Robbins’ sales to United States military locations located internationally were previously included in the Baskin-Robbins International segment, but are now included within the Baskin-Robbins U.S. segment. Revenues for Dunkin’ Donuts U.S. and revenues and segment profit for Baskin-Robbins U.S. and Baskin-Robbins International in the tables below have been restated to reflect these changes for all periods presented. There was no impact to Dunkin’ Donuts U.S. segment profit as the net operating income earned from company-owned restaurants was previously included in segment profit.
Revenues for all operating segments include only transactions with unaffiliated customers and include no intersegment revenues. Revenues reported as “Other” include revenue earned through arrangements with third parties in which our brand names are used and revenue generated from online training programs for franchisees that are not allocated to a specific segment. Revenues by segment were as follows (in thousands):
Revenues Fiscal year ended
December 29,
2012December 31,
2011December 25,
2010
Dunkin’ Donuts U.S. $ 485,399 449,492 417,319Dunkin’ Donuts International 15,485 15,253 14,128Baskin-Robbins U.S. 42,074 43,455 44,801Baskin-Robbins International 101,975 106,887 89,404
Total reportable segments 644,933 615,087 565,652Other 13,248 13,111 11,483
Total revenues $ 658,181 628,198 577,135
Revenues for foreign countries are represented by the Dunkin’ Donuts International and Baskin-Robbins International segments above. No individual foreign country accounted for more than 10% of total revenues for any fiscal year presented.
Expenses included in “Corporate and other” in the segment profit table below include corporate overhead costs, such as payroll and related benefit costs and professional services, as well as the impairment charge recorded in fiscal year 2011 related to our investment in BR Korea (see note 6). Segment profit by segment was as follows (in thousands):
Segment profit Fiscal year ended
December 29,
2012December 31,
2011December 25,
2010
Dunkin’ Donuts U.S. $ 355,274 334,308 293,132Dunkin’ Donuts International 9,670 11,528 14,573Baskin-Robbins U.S. 26,274 21,593 28,446Baskin-Robbins International 42,004 42,844 40,757
Total reportable segments 433,222 410,273 376,908Corporate and other (136,488) (150,382) (118,482)Interest expense, net (73,488) (104,449) (112,532)Depreciation and amortization (56,027) (52,522) (57,826)Impairment charges (1,278) (2,060) (7,075)Loss on debt extinguishment and refinancing transactions (3,963) (34,222) (61,955)Other gains, net 23 175 408
Income before income taxes $ 162,001 66,813 19,446
Net income (loss) of equity method investments, including amortization on intangibles resulting from the BCT Acquisition, is included in segment profit for the Dunkin’ Donuts International and Baskin-Robbins International reportable segments. Expenses included in “Other” in the segment profit table below represent the impairment charge recorded in fiscal year 2011
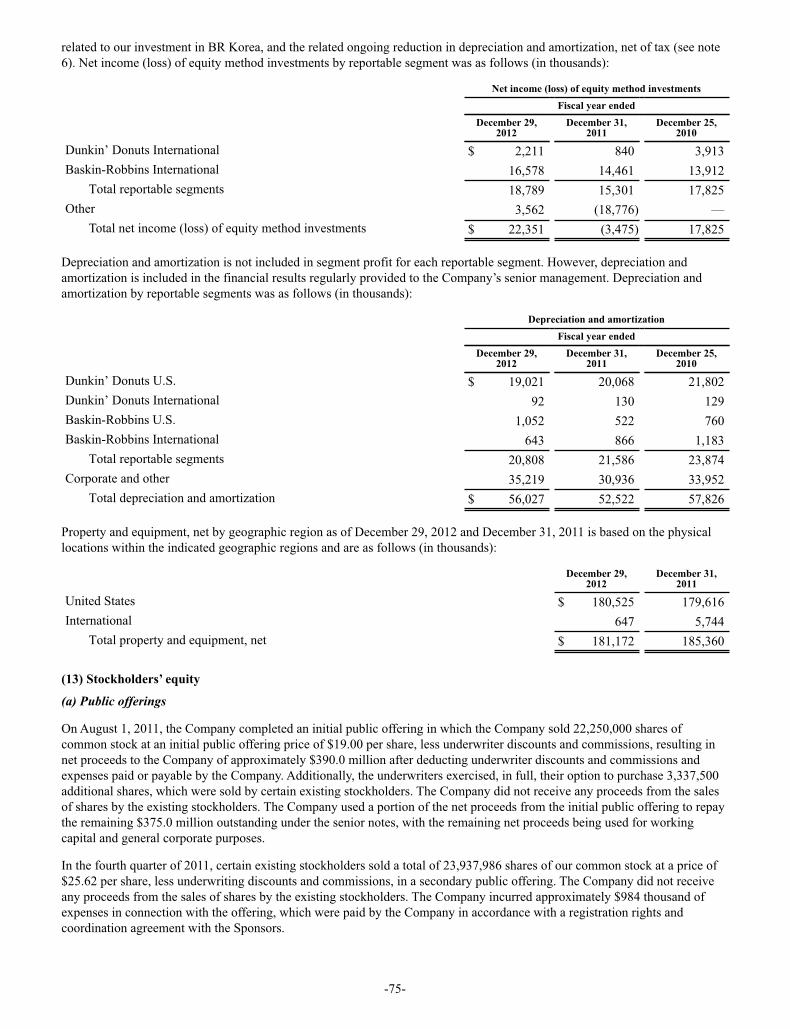
-75-
related to our investment in BR Korea, and the related ongoing reduction in depreciation and amortization, net of tax (see note 6). Net income (loss) of equity method investments by reportable segment was as follows (in thousands):
Net income (loss) of equity method investments Fiscal year ended
December 29,
2012December 31,
2011December 25,
2010
Dunkin’ Donuts International $ 2,211 840 3,913Baskin-Robbins International 16,578 14,461 13,912
Total reportable segments 18,789 15,301 17,825Other 3,562 (18,776) —
Total net income (loss) of equity method investments $ 22,351 (3,475) 17,825
Depreciation and amortization is not included in segment profit for each reportable segment. However, depreciation and amortization is included in the financial results regularly provided to the Company’s senior management. Depreciation and amortization by reportable segments was as follows (in thousands):
Depreciation and amortization Fiscal year ended
December 29,
2012December 31,
2011December 25,
2010
Dunkin’ Donuts U.S. $ 19,021 20,068 21,802Dunkin’ Donuts International 92 130 129Baskin-Robbins U.S. 1,052 522 760Baskin-Robbins International 643 866 1,183
Total reportable segments 20,808 21,586 23,874Corporate and other 35,219 30,936 33,952
Total depreciation and amortization $ 56,027 52,522 57,826
Property and equipment, net by geographic region as of December 29, 2012 and December 31, 2011 is based on the physical locations within the indicated geographic regions and are as follows (in thousands):
December 29,2012
December 31,2011
United States $ 180,525 179,616International 647 5,744
Total property and equipment, net $ 181,172 185,360
(13) Stockholders’ equity
(a) Public offerings
On August 1, 2011, the Company completed an initial public offering in which the Company sold 22,250,000 shares of common stock at an initial public offering price of $19.00 per share, less underwriter discounts and commissions, resulting in net proceeds to the Company of approximately $390.0 million after deducting underwriter discounts and commissions and expenses paid or payable by the Company. Additionally, the underwriters exercised, in full, their option to purchase 3,337,500 additional shares, which were sold by certain existing stockholders. The Company did not receive any proceeds from the sales of shares by the existing stockholders. The Company used a portion of the net proceeds from the initial public offering to repay the remaining $375.0 million outstanding under the senior notes, with the remaining net proceeds being used for working capital and general corporate purposes.
In the fourth quarter of 2011, certain existing stockholders sold a total of 23,937,986 shares of our common stock at a price of $25.62 per share, less underwriting discounts and commissions, in a secondary public offering. The Company did not receive any proceeds from the sales of shares by the existing stockholders. The Company incurred approximately $984 thousand of expenses in connection with the offering, which were paid by the Company in accordance with a registration rights and coordination agreement with the Sponsors.

-76-
In April 2012 and August 2012, certain existing stockholders sold 30,360,000 and 21,754,659 shares, respectively, of our common stock at prices of $29.50 and $30.00 per share, respectively, less underwriting discounts and commissions, in secondary public offerings. The Company did not receive any proceeds from the sales of shares by the existing stockholders. The Company incurred approximately $1.7 million of expenses in connection with the offerings.
(b) Common stock
Prior to the initial public offering, our charter authorized the Company to issue two classes of common stock, Class L and common. The rights of the holders of Class L and common shares were identical, except with respect to priority in the event of a distribution, as defined. The Class L common stock was entitled to a preference with respect to all distributions by the Company until the holders of Class L common stock had received an amount equal to the Class L base amount of approximately $41.75 per share, plus an amount sufficient to generate an internal rate of return of 9% per annum on the Class L base amount, compounded quarterly. Thereafter, the Class L and common stock shared ratably in all distributions by the Company. Class L common stock was classified outside of permanent equity in the consolidated balance sheets at its preferential distribution amount, as the Class L stockholders controlled the timing and amount of distributions. The Class L preferred return of 9% per annum, compounded quarterly, was added to the Class L preferential distribution amount each period and recorded as an increase to accumulated deficit. Dividends paid on the Class L common stock reduced the Class L preferential distribution amount.
Immediately prior to the initial public offering, each outstanding share of Class L common stock converted into approximately 0.2189 of a share of common stock plus 2.2149 shares of common stock, which was determined by dividing the Class L preference amount, $38.8274, by the initial public offering price net of the estimated underwriting discount and a pro rata portion, based upon the number of shares sold in the offering, of the estimated offering-related expenses. As such, the 22,866,379 shares of Class L common stock that were outstanding at the time of the offering converted into 55,652,782 shares of common stock.
The changes in Class L common stock were as follows (in thousands):
Fiscal year ended December 31, 2011 December 25, 2010 Shares Amount Shares Amount
Common stock, Class L, beginning of year 22,995 $ 840,582 22,981 $ 1,232,001Issuance of Class L common stock 65 2,270 14 754Repurchases of Class L common stock — (113) — (3,197)Retirement of treasury stock (194) — — —Cash dividends paid — — — (500,002)Accretion of Class L preferred return — 45,102 — 111,026Conversion of Class L shares to common shares (22,866) (887,841) — —Common stock, Class L, end of year — $ — 22,995 $ 840,582
Common shares issued and outstanding included in the consolidated balance sheets include vested and unvested restricted shares. Common stock in the consolidated statement of stockholders’ equity (deficit) excludes unvested restricted shares.
(c) Treasury stock
During fiscal years 2011 and 2010, the Company repurchased a total of 23,624 shares and 193,800 shares, respectively, of common stock and 3,266 shares and 65,414 shares, respectively, of Class L shares that were originally sold and granted to former employees of the Company. The Company accounts for treasury stock under the cost method, and as such recorded increases in common treasury stock of $173 thousand and $693 thousand during fiscal years 2011 and 2010, respectively, based on the fair market value of the shares on the respective dates of repurchase. On April 26, 2011, the Company retired all of its treasury stock, resulting in a $2.0 million reduction in common treasury stock and additional paid-in-capital.
In August 2012, the Company repurchased a total of 15,000,000 shares of common stock at a price of $30.00 per share from certain existing stockholders, and incurred approximately $341 thousand of third-party costs in connection with the repurchase. The Company accounts for treasury stock under the cost method, and as such recorded an increase in common treasury stock of $450.4 million during fiscal year 2012, based on the fair market value of the shares on the date of repurchase and the direct costs incurred. During fiscal year 2012, the Company retired all outstanding treasury stock, resulting in decreases in common stock and additional paid-in capital of $15 thousand and $180.0 million, respectively, and an increase in accumulated deficit of $270.3 million.

-77-
(d) Accumulated other comprehensive income
The components of accumulated other comprehensive income were as follows (in thousands):
Effect offoreign
currencytranslation
Unrealized losses on
interest rate swaps
Unrealized loss on pension adjustment Other
Accumulatedother
comprehensiveincome
Balances at December 31, 2011 $ 20,910 — (1,306) (3) 19,601Other comprehensive income (5,996) (1,655) (1,180) (1,629) (10,460)
Balances at December 29, 2012 $ 14,914 (1,655) (2,486) (1,632) 9,141
(f) Dividends
On December 3, 2010, the board of directors declared an aggregate dividend in the amount of $500.0 million, or $21.93 per share, payable on that date in accordance with the Company’s charter to the holders of Class L common stock as of that date. The dividend was recorded as a reduction to Class L common stock. No dividends were declared or paid during fiscal year 2011.
During fiscal year 2012, the Company paid dividends on common stock as follows:
Dividend per share
Total amount (in millions) Payment date
Fiscal year 2012:First quarter $ 0.15 $ 18.0 March 28, 2012Second quarter $ 0.15 $ 18.1 May 16, 2012Third quarter $ 0.15 $ 18.1 August 24, 2012Fourth quarter $ 0.15 $ 15.9 November 14, 2012
On January 31, 2013, we announced that our board of directors approved the next quarterly dividend of $0.19 per share of common stock payable February 20, 2013.
(14) Equity incentive plans
The Company’s 2006 Executive Incentive Plan, as amended, (the “2006 Plan”) provides for the grant of stock-based and other incentive awards. A maximum of 12,191,145 shares of common stock may be delivered in satisfaction of awards under the 2006 Plan, of which a maximum of 5,012,966 shares may be awarded as nonvested (restricted) shares and a maximum of 7,178,179 may be delivered in satisfaction of stock options.
The Dunkin’ Brands Group, Inc. 2011 Omnibus Long-Term Incentive Plan (the “2011 Plan”) was adopted in July 2011, and is the only plan under which the Company currently grants awards. A maximum of 7,000,000 shares of common stock may be delivered in satisfaction of awards under the 2011 Plan.
Total share-based compensation expense, which is included in general and administrative expenses, net, consisted of the following (in thousands):
Fiscal year ended
December 29,
2012December 31,
2011December 25,
2010
Restricted shares $ 132 2,739 6392006 Plan stock options—executive 4,245 1,626 7032006 Plan stock options—nonexecutive 181 202 1192011 Plan stock options 2,026 32 —Other 336 33 —
Total share-based compensation $ 6,920 4,632 1,461Total related tax benefit 2,768 1,852 619
The actual tax benefit realized from stock options exercised during fiscal years 2012 and 2011 was $14.1 million and $438 thousand, respectively. No tax benefit was realized from stock options exercised during fiscal year 2010.

-78-
Nonvested (restricted) shares
The Company historically issued restricted shares of common stock to certain executive officers of the Company. The restricted shares generally vest in three separate tranches with different vesting conditions. In addition to the vesting conditions described below, all three tranches of the restricted shares provide for partial or full accelerated vesting upon change in control. Restricted shares that do not vest are forfeited to the Company.
Tranche 1 shares generally vest in four or five equal annual installments based on a service condition. The weighted average requisite service period for the Tranche 1 shares is approximately 4.4 years, and compensation cost is recognized ratably over this requisite service period.
The Tranche 2 shares generally vest in five annual installments beginning on the last day of the fiscal year of grant based on a service condition and performance conditions linked to annual EBITDA targets, which were not achieved for fiscal years 2010, 2011, and 2012. Total compensation cost for the Tranche 2 shares is determined based on the most likely outcome of the performance conditions and the number of awards expected to vest based on those outcomes, and as such, no compensation cost was recognized in fiscal years 2012, 2011, or 2010 related to Tranche 2 shares. All remaining Tranche 2 shares outstanding were forfeited on the last day of fiscal year 2012 as the EBITDA targets were not achieved.
Tranche 3 shares generally vest in four annual installments based on a service condition, a performance condition, and market conditions. The Tranche 3 shares did not become eligible to vest until achievement of the performance condition, which is defined as an initial public offering or change in control. These events were not considered probable of occurring until such events actually occurred. The market condition relates to the achievement of a minimum investor rate of return on the Sponsor’s (see note 19(a)) shares ranging from 20% to 24% as of specified measurement dates, which occur on the six month anniversary of an initial public offering and every three months thereafter, or on the date of a change in control. As the Tranche 3 shares require the satisfaction of multiple vesting conditions, the requisite service period is the longest of the explicit, implicit, and derived service periods of the service, performance, and market conditions. As the performance condition could not be deemed probable of occurring until an initial public offering or change of control event was completed, no compensation cost was recognized related to the Tranche 3 shares prior to fiscal year 2011. Upon completion of the initial public offering in fiscal year 2011, $2.6 million of expense was recorded related to approximately 0.8 million Tranche 3 restricted shares that were outstanding at the date of the initial public offering. The entire value of the outstanding Tranche 3 shares was recorded upon completion of the initial public offering as the requisite service period, which was equivalent to the implicit service period of the performance condition, had been delivered. With the sale of the Sponsors' remaining shares in August 2012, no further Tranche 3 vesting could occur, and all unvested Tranche 3 shares were accordingly forfeited.
A summary of the changes in the Company’s restricted shares during fiscal year 2012 is presented below:
Number ofshares
Weightedaverage
grant-datefair value
Restricted shares at December 31, 2011 643,142 $ 4.21Granted — —Vested (367,237) 3.40Forfeited (274,856) 3.50Restricted shares at December 29, 2012 1,049 5.44
The fair value of each restricted share was estimated on the date of grant based on recent transactions and third-party valuations of the Company’s common stock. As of December 29, 2012, an immaterial amount of unrecognized compensation cost remains related to restricted shares. The total grant-date fair value of shares vested during fiscal years 2012, 2011, and 2010, was $1.2 million, $484 thousand, and $1.3 million, respectively.
2006 Plan stock options—executive
During fiscal years 2011 and 2010, the Company granted options to executives to purchase 828,040 and 4,750,437 shares of common stock, respectively, under the 2006 Plan. The executive options vest in two separate tranches, 30% allocated as Tranche 4 and 70% allocated as Tranche 5, each with different vesting conditions. In addition to the vesting conditions described below, both tranches provide for partial accelerated vesting upon change in control. The maximum contractual term of the executive options is ten years.
The Tranche 4 executive options generally vest in equal annual amounts over a 5-year period subsequent to the grant date, and as such are subject to a service condition. Certain options provide for accelerated vesting at the date of grant, with 20% of the
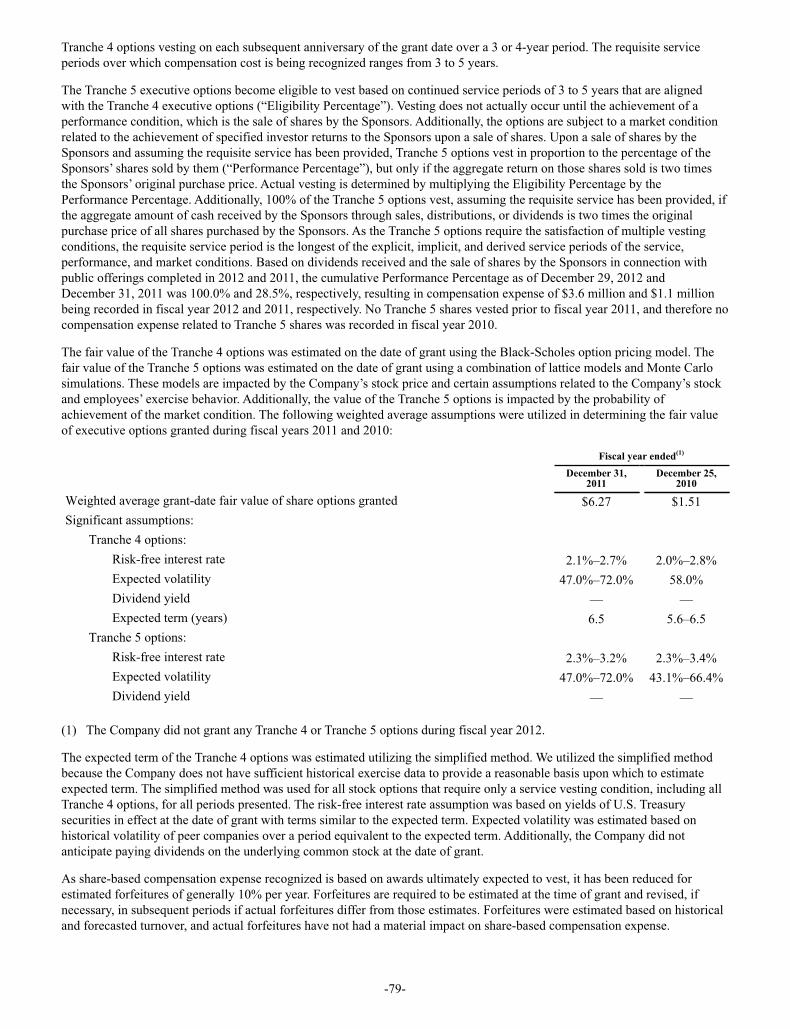
-79-
Tranche 4 options vesting on each subsequent anniversary of the grant date over a 3 or 4-year period. The requisite service periods over which compensation cost is being recognized ranges from 3 to 5 years.
The Tranche 5 executive options become eligible to vest based on continued service periods of 3 to 5 years that are aligned with the Tranche 4 executive options (“Eligibility Percentage”). Vesting does not actually occur until the achievement of a performance condition, which is the sale of shares by the Sponsors. Additionally, the options are subject to a market condition related to the achievement of specified investor returns to the Sponsors upon a sale of shares. Upon a sale of shares by the Sponsors and assuming the requisite service has been provided, Tranche 5 options vest in proportion to the percentage of the Sponsors’ shares sold by them (“Performance Percentage”), but only if the aggregate return on those shares sold is two times the Sponsors’ original purchase price. Actual vesting is determined by multiplying the Eligibility Percentage by the Performance Percentage. Additionally, 100% of the Tranche 5 options vest, assuming the requisite service has been provided, if the aggregate amount of cash received by the Sponsors through sales, distributions, or dividends is two times the original purchase price of all shares purchased by the Sponsors. As the Tranche 5 options require the satisfaction of multiple vesting conditions, the requisite service period is the longest of the explicit, implicit, and derived service periods of the service, performance, and market conditions. Based on dividends received and the sale of shares by the Sponsors in connection with public offerings completed in 2012 and 2011, the cumulative Performance Percentage as of December 29, 2012 and December 31, 2011 was 100.0% and 28.5%, respectively, resulting in compensation expense of $3.6 million and $1.1 million being recorded in fiscal year 2012 and 2011, respectively. No Tranche 5 shares vested prior to fiscal year 2011, and therefore no compensation expense related to Tranche 5 shares was recorded in fiscal year 2010.
The fair value of the Tranche 4 options was estimated on the date of grant using the Black-Scholes option pricing model. The fair value of the Tranche 5 options was estimated on the date of grant using a combination of lattice models and Monte Carlo simulations. These models are impacted by the Company’s stock price and certain assumptions related to the Company’s stock and employees’ exercise behavior. Additionally, the value of the Tranche 5 options is impacted by the probability of achievement of the market condition. The following weighted average assumptions were utilized in determining the fair value of executive options granted during fiscal years 2011 and 2010:
Fiscal year ended(1)
December 31,
2011December 25,
2010
Weighted average grant-date fair value of share options granted $6.27 $1.51Significant assumptions:
Tranche 4 options:Risk-free interest rate 2.1%–2.7% 2.0%–2.8%Expected volatility 47.0%–72.0% 58.0%Dividend yield — —Expected term (years) 6.5 5.6–6.5
Tranche 5 options:Risk-free interest rate 2.3%–3.2% 2.3%–3.4%Expected volatility 47.0%–72.0% 43.1%–66.4%Dividend yield — —
(1) The Company did not grant any Tranche 4 or Tranche 5 options during fiscal year 2012.
The expected term of the Tranche 4 options was estimated utilizing the simplified method. We utilized the simplified method because the Company does not have sufficient historical exercise data to provide a reasonable basis upon which to estimate expected term. The simplified method was used for all stock options that require only a service vesting condition, including all Tranche 4 options, for all periods presented. The risk-free interest rate assumption was based on yields of U.S. Treasury securities in effect at the date of grant with terms similar to the expected term. Expected volatility was estimated based on historical volatility of peer companies over a period equivalent to the expected term. Additionally, the Company did not anticipate paying dividends on the underlying common stock at the date of grant.
As share-based compensation expense recognized is based on awards ultimately expected to vest, it has been reduced for estimated forfeitures of generally 10% per year. Forfeitures are required to be estimated at the time of grant and revised, if necessary, in subsequent periods if actual forfeitures differ from those estimates. Forfeitures were estimated based on historical and forecasted turnover, and actual forfeitures have not had a material impact on share-based compensation expense.
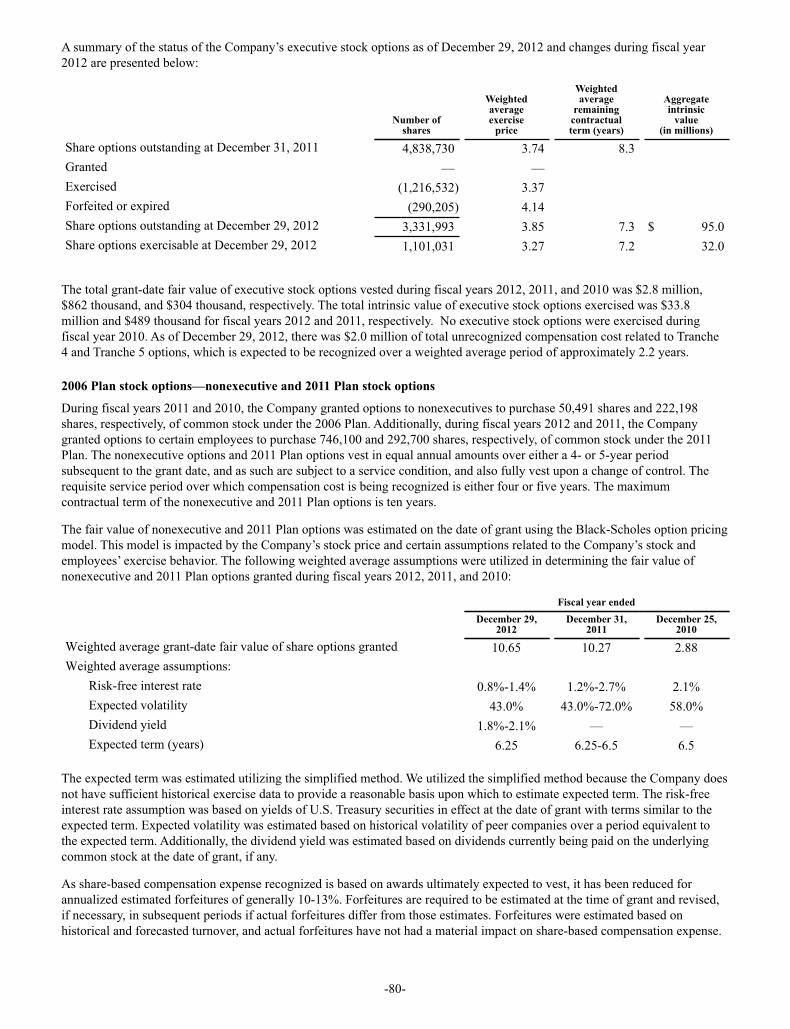
-80-
A summary of the status of the Company’s executive stock options as of December 29, 2012 and changes during fiscal year 2012 are presented below:
Number ofshares
Weightedaverageexercise
price
Weightedaverage
remainingcontractualterm (years)
Aggregateintrinsic
value(in millions)
Share options outstanding at December 31, 2011 4,838,730 3.74 8.3Granted — —Exercised (1,216,532) 3.37Forfeited or expired (290,205) 4.14Share options outstanding at December 29, 2012 3,331,993 3.85 7.3 $ 95.0Share options exercisable at December 29, 2012 1,101,031 3.27 7.2 32.0
The total grant-date fair value of executive stock options vested during fiscal years 2012, 2011, and 2010 was $2.8 million, $862 thousand, and $304 thousand, respectively. The total intrinsic value of executive stock options exercised was $33.8 million and $489 thousand for fiscal years 2012 and 2011, respectively. No executive stock options were exercised during fiscal year 2010. As of December 29, 2012, there was $2.0 million of total unrecognized compensation cost related to Tranche 4 and Tranche 5 options, which is expected to be recognized over a weighted average period of approximately 2.2 years.
2006 Plan stock options—nonexecutive and 2011 Plan stock options
During fiscal years 2011 and 2010, the Company granted options to nonexecutives to purchase 50,491 shares and 222,198 shares, respectively, of common stock under the 2006 Plan. Additionally, during fiscal years 2012 and 2011, the Company granted options to certain employees to purchase 746,100 and 292,700 shares, respectively, of common stock under the 2011 Plan. The nonexecutive options and 2011 Plan options vest in equal annual amounts over either a 4- or 5-year period subsequent to the grant date, and as such are subject to a service condition, and also fully vest upon a change of control. The requisite service period over which compensation cost is being recognized is either four or five years. The maximum contractual term of the nonexecutive and 2011 Plan options is ten years.
The fair value of nonexecutive and 2011 Plan options was estimated on the date of grant using the Black-Scholes option pricing model. This model is impacted by the Company’s stock price and certain assumptions related to the Company’s stock and employees’ exercise behavior. The following weighted average assumptions were utilized in determining the fair value of nonexecutive and 2011 Plan options granted during fiscal years 2012, 2011, and 2010:
Fiscal year ended
December 29,
2012December 31,
2011December 25,
2010
Weighted average grant-date fair value of share options granted 10.65 10.27 2.88Weighted average assumptions:
Risk-free interest rate 0.8%-1.4% 1.2%-2.7% 2.1%Expected volatility 43.0% 43.0%-72.0% 58.0%Dividend yield 1.8%-2.1% — —Expected term (years) 6.25 6.25-6.5 6.5
The expected term was estimated utilizing the simplified method. We utilized the simplified method because the Company does not have sufficient historical exercise data to provide a reasonable basis upon which to estimate expected term. The risk-free interest rate assumption was based on yields of U.S. Treasury securities in effect at the date of grant with terms similar to the expected term. Expected volatility was estimated based on historical volatility of peer companies over a period equivalent to the expected term. Additionally, the dividend yield was estimated based on dividends currently being paid on the underlying common stock at the date of grant, if any.
As share-based compensation expense recognized is based on awards ultimately expected to vest, it has been reduced for annualized estimated forfeitures of generally 10-13%. Forfeitures are required to be estimated at the time of grant and revised, if necessary, in subsequent periods if actual forfeitures differ from those estimates. Forfeitures were estimated based on historical and forecasted turnover, and actual forfeitures have not had a material impact on share-based compensation expense.
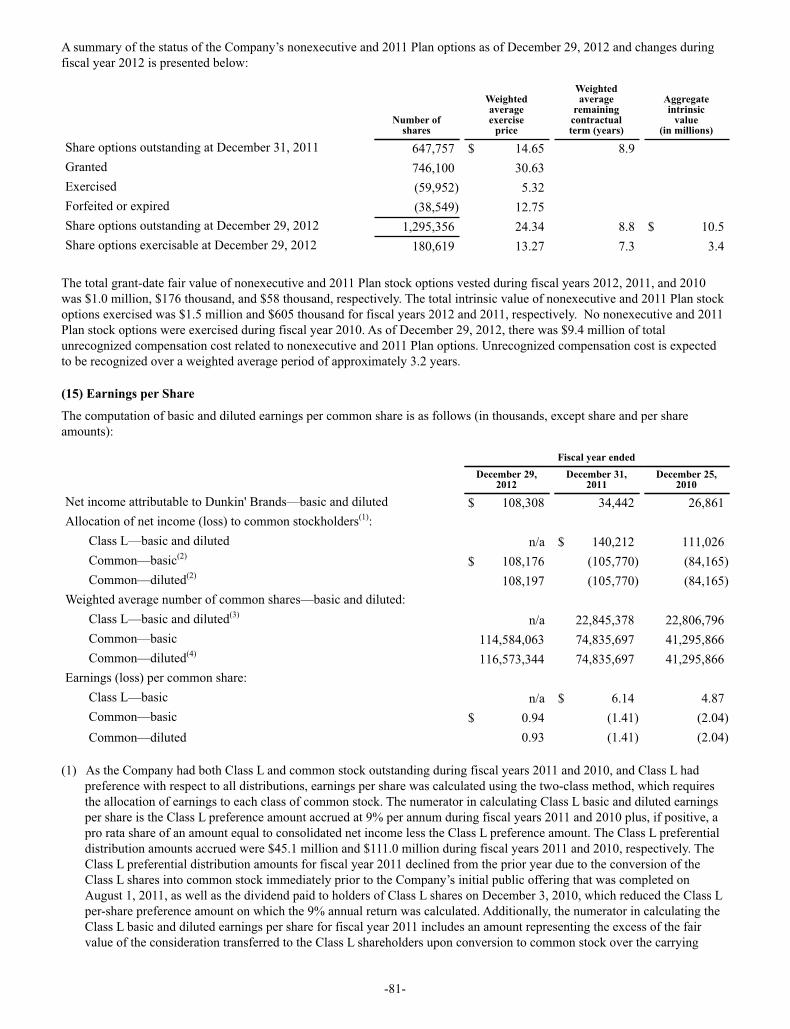
-81-
A summary of the status of the Company’s nonexecutive and 2011 Plan options as of December 29, 2012 and changes during fiscal year 2012 is presented below:
Number ofshares
Weightedaverageexercise
price
Weightedaverage
remainingcontractualterm (years)
Aggregateintrinsic
value(in millions)
Share options outstanding at December 31, 2011 647,757 $ 14.65 8.9Granted 746,100 30.63Exercised (59,952) 5.32Forfeited or expired (38,549) 12.75Share options outstanding at December 29, 2012 1,295,356 24.34 8.8 $ 10.5Share options exercisable at December 29, 2012 180,619 13.27 7.3 3.4
The total grant-date fair value of nonexecutive and 2011 Plan stock options vested during fiscal years 2012, 2011, and 2010 was $1.0 million, $176 thousand, and $58 thousand, respectively. The total intrinsic value of nonexecutive and 2011 Plan stock options exercised was $1.5 million and $605 thousand for fiscal years 2012 and 2011, respectively. No nonexecutive and 2011 Plan stock options were exercised during fiscal year 2010. As of December 29, 2012, there was $9.4 million of total unrecognized compensation cost related to nonexecutive and 2011 Plan options. Unrecognized compensation cost is expected to be recognized over a weighted average period of approximately 3.2 years.
(15) Earnings per Share
The computation of basic and diluted earnings per common share is as follows (in thousands, except share and per share amounts):
Fiscal year ended
December 29,
2012December 31,
2011December 25,
2010
Net income attributable to Dunkin' Brands—basic and diluted $ 108,308 34,442 26,861Allocation of net income (loss) to common stockholders(1):
Class L—basic and diluted n/a $ 140,212 111,026Common—basic(2) $ 108,176 (105,770) (84,165)Common—diluted(2) 108,197 (105,770) (84,165)
Weighted average number of common shares—basic and diluted:Class L—basic and diluted(3) n/a 22,845,378 22,806,796Common—basic 114,584,063 74,835,697 41,295,866Common—diluted(4) 116,573,344 74,835,697 41,295,866
Earnings (loss) per common share:Class L—basic n/a $ 6.14 4.87Common—basic $ 0.94 (1.41) (2.04)Common—diluted 0.93 (1.41) (2.04)
(1) As the Company had both Class L and common stock outstanding during fiscal years 2011 and 2010, and Class L had preference with respect to all distributions, earnings per share was calculated using the two-class method, which requires the allocation of earnings to each class of common stock. The numerator in calculating Class L basic and diluted earnings per share is the Class L preference amount accrued at 9% per annum during fiscal years 2011 and 2010 plus, if positive, a pro rata share of an amount equal to consolidated net income less the Class L preference amount. The Class L preferential distribution amounts accrued were $45.1 million and $111.0 million during fiscal years 2011 and 2010, respectively. The Class L preferential distribution amounts for fiscal year 2011 declined from the prior year due to the conversion of the Class L shares into common stock immediately prior to the Company’s initial public offering that was completed on August 1, 2011, as well as the dividend paid to holders of Class L shares on December 3, 2010, which reduced the Class L per-share preference amount on which the 9% annual return was calculated. Additionally, the numerator in calculating the Class L basic and diluted earnings per share for fiscal year 2011 includes an amount representing the excess of the fair value of the consideration transferred to the Class L shareholders upon conversion to common stock over the carrying

-82-
amount of the Class L shares at the date of conversion, which occurred immediately prior to the Company’s initial public offering. As the carrying amount of the Class L shares was equal to the Class L preference amount, the excess fair value of the consideration transferred to the Class L shareholders was equal to the fair value of the additional 0.2189 of a share of common stock into which each Class L share converted (“Class L base share”), which totaled $95.1 million, calculated as follows:
Class L shares outstanding immediately prior to the initial public offering 22,866,379Number of common shares received for each Class L share 0.2189Common stock received by Class L shareholders, excluding preferential distribution 5,005,775Common stock fair value per share (initial public offering price per share) $ 19.00Fair value of Class L base shares (in thousands) $ 95,110
(2) Net income allocated to common shareholders for the fiscal year 2012 excludes $132 thousand and $111 thousand for basic and diluted earnings per share, respectively, that is allocated to participating securities. Participating securities consist of unvested (restricted) shares that contain a nonforfeitable right to participate in dividends. No net loss was allocated to participating securities for fiscal years 2011 and 2010 as the participating securities do not participate in losses.
(3) The weighted average number of Class L shares in the Class L earnings per share calculation in fiscal years 2011 and 2010 represents the weighted average from the beginning of the period up through the date of conversion of the Class L shares into common shares. There were no Class L common stock equivalents outstanding during fiscal years 2011 and 2010.
(4) The weighted average number of common shares in the common diluted earnings per share calculation for fiscal year 2012 includes the dilutive effect of 1,989,281 restricted shares and stock options, using the treasury stock method. The weighted average number of common shares in the common diluted earnings per share calculation for fiscal years 2011 and 2010 excludes all restricted stock and stock options outstanding, as they would be antidilutive. The weighted average number of common shares in the common diluted earnings per share calculation for all periods excludes all performance-based restricted stock and stock options outstanding for which the performance criteria were not yet met as of the fiscal period end. As of December 29, 2012, there were no common restricted stock awards that were performance-based and for which the performance criteria were not yet met. Additionally, the weighted average number of common shares in the common diluted earnings per share calculation for all periods excludes stock options with an exercise price greater than the average market price for the period ("underwater stock options"). As of December 29, 2012, there were approximately 317,000 underwater stock options that were excluded from the computation of common diluted earnings per share.
(16) Income taxes
Income before income taxes was attributed to domestic and foreign taxing jurisdictions as follows (in thousands):
Fiscal year ended
December 29,
2012December 31,
2011December 25,
2010
Domestic operations $ 172,576 70,034 2,270Foreign operations (10,575) (3,221) 17,176
Income before income taxes $ 162,001 66,813 19,446

-83-
The components of the provision (benefit) for income taxes were as follows (in thousands):
Fiscal year ended
December 29,
2012December 31,
2011December 25,
2010
Current:Federal $ 52,657 34,282 11,497State 6,065 5,733 5,339Foreign 2,601 3,719 4,138
Current tax provision $ 61,323 43,734 20,974Deferred:
Federal $ (5,071) (11,567) (16,916)State 4,373 892 (10,397)Foreign (6,248) (688) (1,076)
Deferred tax benefit (6,946) (11,363) (28,389)Provision (benefit) for income taxes $ 54,377 32,371 (7,415)
The provision for income taxes from continuing operations differed from the expense computed using the statutory federal income tax rate of 35% due to the following:
Fiscal year ended
December 29,
2012December 31,
2011December 25,
2010
Computed federal income tax expense, at statutory rate 35.0% 35.0% 35.0 %Permanent differences:
Impairment of investment in BR Korea — 9.8 —Other permanent differences 0.7 0.9 1.7State income taxes 5.2 6.9 1.8Benefits and taxes related to foreign operations (2.9) (6.8) (33.4)Changes in enacted tax rates and apportionment 2.8 3.0 (27.2)Uncertain tax positions (6.3) 1.9 (16.1)Other (0.9) (2.2) 0.1
33.6% 48.5% (38.1)%
During fiscal year 2012, the Company recorded a net tax benefit of $10.2 million primarily related to the reversal of reserves for uncertain tax positions, including interest and penalty, net of federal and state tax benefit as applicable, for which settlement with the taxing authorities was reached, and recognized a deferred tax expense of $4.6 million due to estimated changes in apportionment and enacted changes in future state income tax rates. The Company recognized deferred tax expense of $1.9 million in fiscal year 2011 due to enacted changes in future state income tax rates. In fiscal year 2010, the Company recognized a deferred tax benefit of $5.7 million, due to changes in the estimated apportionment of income among the states in which the Company earns income and enacted changes in future state income tax rates. These changes in estimates and enacted tax rates affect the tax rate expected to be in effect in future periods when the deferred tax assets and liabilities reverse.
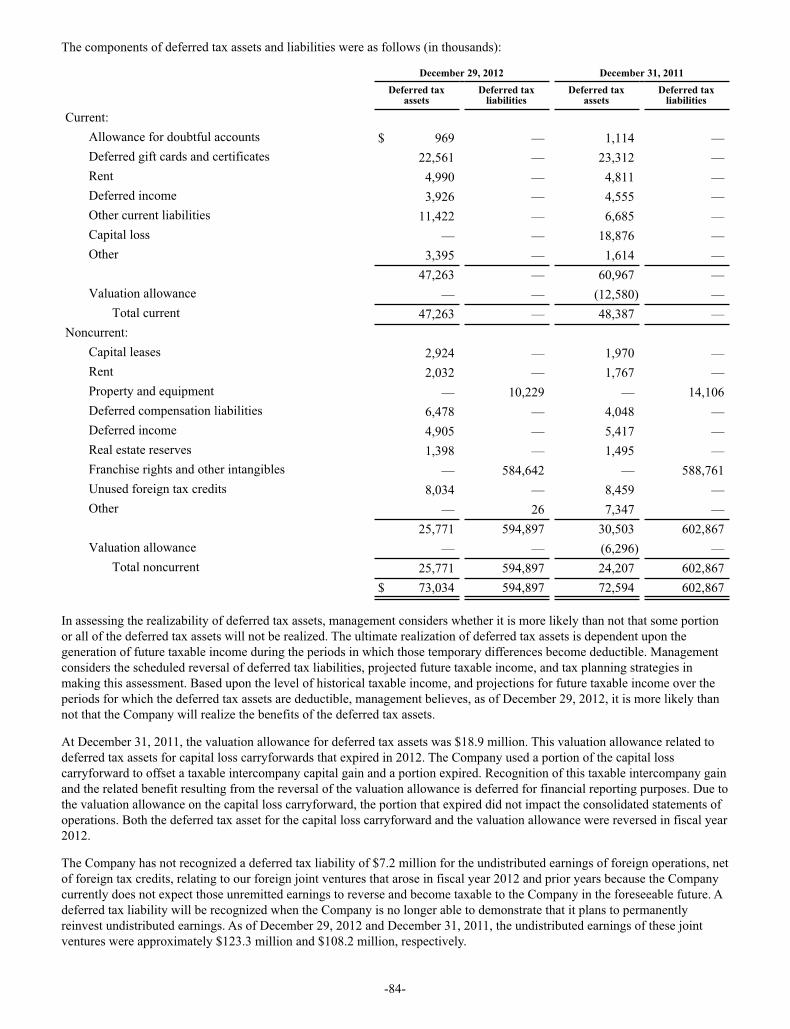
-84-
The components of deferred tax assets and liabilities were as follows (in thousands):
December 29, 2012 December 31, 2011
Deferred tax
assetsDeferred tax
liabilitiesDeferred tax
assetsDeferred tax
liabilities
Current:Allowance for doubtful accounts $ 969 — 1,114 —Deferred gift cards and certificates 22,561 — 23,312 —Rent 4,990 — 4,811 —Deferred income 3,926 — 4,555 —Other current liabilities 11,422 — 6,685 —Capital loss — — 18,876 —Other 3,395 — 1,614 —
47,263 — 60,967 —Valuation allowance — — (12,580) —
Total current 47,263 — 48,387 —Noncurrent:
Capital leases 2,924 — 1,970 —Rent 2,032 — 1,767 —Property and equipment — 10,229 — 14,106Deferred compensation liabilities 6,478 — 4,048 —Deferred income 4,905 — 5,417 —Real estate reserves 1,398 — 1,495 —Franchise rights and other intangibles — 584,642 — 588,761Unused foreign tax credits 8,034 — 8,459 —Other — 26 7,347 —
25,771 594,897 30,503 602,867Valuation allowance — — (6,296) —
Total noncurrent 25,771 594,897 24,207 602,867$ 73,034 594,897 72,594 602,867
In assessing the realizability of deferred tax assets, management considers whether it is more likely than not that some portion or all of the deferred tax assets will not be realized. The ultimate realization of deferred tax assets is dependent upon the generation of future taxable income during the periods in which those temporary differences become deductible. Management considers the scheduled reversal of deferred tax liabilities, projected future taxable income, and tax planning strategies in making this assessment. Based upon the level of historical taxable income, and projections for future taxable income over the periods for which the deferred tax assets are deductible, management believes, as of December 29, 2012, it is more likely than not that the Company will realize the benefits of the deferred tax assets.
At December 31, 2011, the valuation allowance for deferred tax assets was $18.9 million. This valuation allowance related to deferred tax assets for capital loss carryforwards that expired in 2012. The Company used a portion of the capital loss carryforward to offset a taxable intercompany capital gain and a portion expired. Recognition of this taxable intercompany gain and the related benefit resulting from the reversal of the valuation allowance is deferred for financial reporting purposes. Due to the valuation allowance on the capital loss carryforward, the portion that expired did not impact the consolidated statements of operations. Both the deferred tax asset for the capital loss carryforward and the valuation allowance were reversed in fiscal year 2012.
The Company has not recognized a deferred tax liability of $7.2 million for the undistributed earnings of foreign operations, net of foreign tax credits, relating to our foreign joint ventures that arose in fiscal year 2012 and prior years because the Company currently does not expect those unremitted earnings to reverse and become taxable to the Company in the foreseeable future. A deferred tax liability will be recognized when the Company is no longer able to demonstrate that it plans to permanently reinvest undistributed earnings. As of December 29, 2012 and December 31, 2011, the undistributed earnings of these joint ventures were approximately $123.3 million and $108.2 million, respectively.
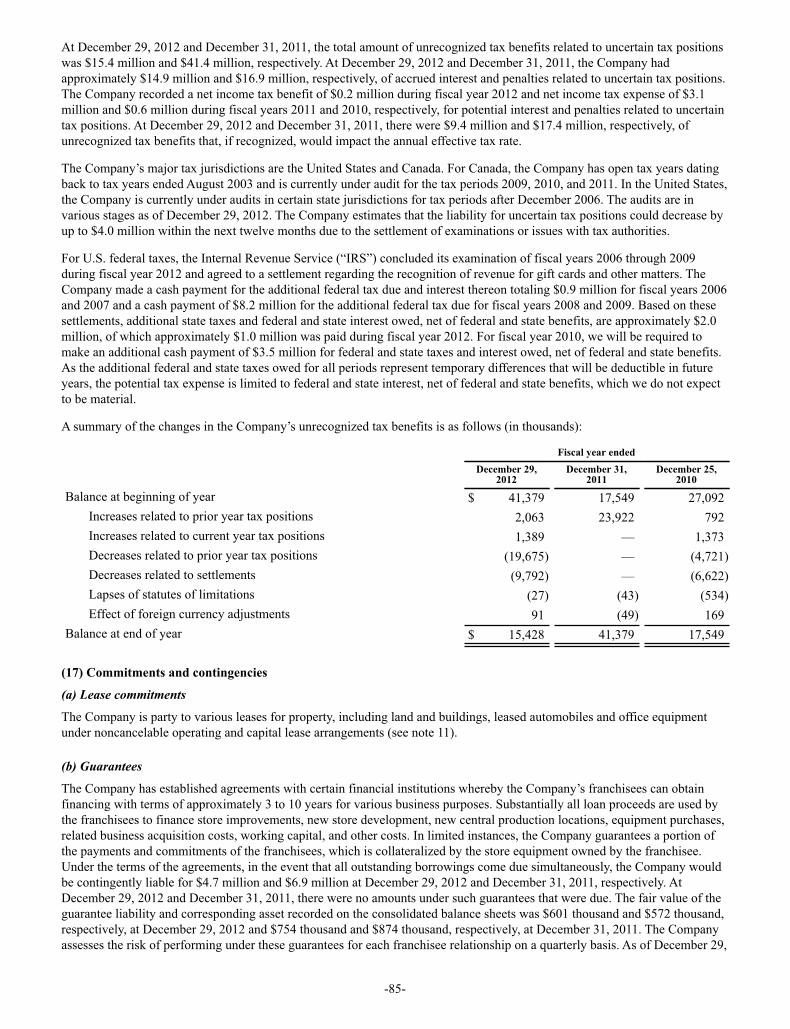
-85-
At December 29, 2012 and December 31, 2011, the total amount of unrecognized tax benefits related to uncertain tax positions was $15.4 million and $41.4 million, respectively. At December 29, 2012 and December 31, 2011, the Company had approximately $14.9 million and $16.9 million, respectively, of accrued interest and penalties related to uncertain tax positions. The Company recorded a net income tax benefit of $0.2 million during fiscal year 2012 and net income tax expense of $3.1 million and $0.6 million during fiscal years 2011 and 2010, respectively, for potential interest and penalties related to uncertain tax positions. At December 29, 2012 and December 31, 2011, there were $9.4 million and $17.4 million, respectively, of unrecognized tax benefits that, if recognized, would impact the annual effective tax rate.
The Company’s major tax jurisdictions are the United States and Canada. For Canada, the Company has open tax years dating back to tax years ended August 2003 and is currently under audit for the tax periods 2009, 2010, and 2011. In the United States, the Company is currently under audits in certain state jurisdictions for tax periods after December 2006. The audits are in various stages as of December 29, 2012. The Company estimates that the liability for uncertain tax positions could decrease by up to $4.0 million within the next twelve months due to the settlement of examinations or issues with tax authorities.
For U.S. federal taxes, the Internal Revenue Service (“IRS”) concluded its examination of fiscal years 2006 through 2009 during fiscal year 2012 and agreed to a settlement regarding the recognition of revenue for gift cards and other matters. The Company made a cash payment for the additional federal tax due and interest thereon totaling $0.9 million for fiscal years 2006 and 2007 and a cash payment of $8.2 million for the additional federal tax due for fiscal years 2008 and 2009. Based on these settlements, additional state taxes and federal and state interest owed, net of federal and state benefits, are approximately $2.0 million, of which approximately $1.0 million was paid during fiscal year 2012. For fiscal year 2010, we will be required to make an additional cash payment of $3.5 million for federal and state taxes and interest owed, net of federal and state benefits. As the additional federal and state taxes owed for all periods represent temporary differences that will be deductible in future years, the potential tax expense is limited to federal and state interest, net of federal and state benefits, which we do not expect to be material.
A summary of the changes in the Company’s unrecognized tax benefits is as follows (in thousands):
Fiscal year ended
December 29,
2012December 31,
2011December 25,
2010
Balance at beginning of year $ 41,379 17,549 27,092Increases related to prior year tax positions 2,063 23,922 792Increases related to current year tax positions 1,389 — 1,373Decreases related to prior year tax positions (19,675) — (4,721)Decreases related to settlements (9,792) — (6,622)Lapses of statutes of limitations (27) (43) (534)Effect of foreign currency adjustments 91 (49) 169
Balance at end of year $ 15,428 41,379 17,549
(17) Commitments and contingencies
(a) Lease commitments
The Company is party to various leases for property, including land and buildings, leased automobiles and office equipment under noncancelable operating and capital lease arrangements (see note 11).
(b) Guarantees
The Company has established agreements with certain financial institutions whereby the Company’s franchisees can obtain financing with terms of approximately 3 to 10 years for various business purposes. Substantially all loan proceeds are used by the franchisees to finance store improvements, new store development, new central production locations, equipment purchases, related business acquisition costs, working capital, and other costs. In limited instances, the Company guarantees a portion of the payments and commitments of the franchisees, which is collateralized by the store equipment owned by the franchisee. Under the terms of the agreements, in the event that all outstanding borrowings come due simultaneously, the Company would be contingently liable for $4.7 million and $6.9 million at December 29, 2012 and December 31, 2011, respectively. At December 29, 2012 and December 31, 2011, there were no amounts under such guarantees that were due. The fair value of the guarantee liability and corresponding asset recorded on the consolidated balance sheets was $601 thousand and $572 thousand, respectively, at December 29, 2012 and $754 thousand and $874 thousand, respectively, at December 31, 2011. The Company assesses the risk of performing under these guarantees for each franchisee relationship on a quarterly basis. As of December 29,

-86-
2012 and December 31, 2011, the Company had recorded reserves for such guarantees of $389 thousand and $390 thousand, respectively.
The Company has entered into a third-party guarantee with a distribution facility of franchisee products that ensures franchisees will purchase a certain volume of product over a 10-year period. As product is purchased by the Company’s franchisees over the term of the agreement, the amount of the guarantee is reduced. As of December 29, 2012 and December 31, 2011, the Company was contingently liable for $6.8 million and $7.8 million, respectively, under this guarantee. The Company has also entered into a third-party guarantee with this distribution facility that ensures franchisees will sell a certain volume of product each year over a 5-year period. As of December 29, 2012, the Company was contingently liable for $7.5 million under this guarantee. Additionally, the Company has various supply chain contracts that provide for purchase commitments or exclusivity, the majority of which result in the Company being contingently liable upon early termination of the agreement or engaging with another supplier. As of December 29, 2012 and December 31, 2011, we were contingently liable under such supply chain agreements for approximately $57.5 million and $23.9 million, respectively. The Company assesses the risk of performing under each of these guarantees on a quarterly basis, and, based on various factors including internal forecasts, prior history, and ability to extend contract terms, we have not recorded any liabilities related to these commitments.
As a result of assigning our interest in obligations under property leases as a condition of the refranchising of certain restaurants and the guarantee of certain other leases, we are contingently liable on certain lease agreements. These leases have varying terms, the latest of which expires in 2026. As of December 29, 2012 and December 31, 2011, the potential amount of undiscounted payments the Company could be required to make in the event of nonpayment by the primary lessee was $5.6 million and $10.5 million, respectively. Our franchisees are the primary lessees under the majority of these leases. The Company generally has cross-default provisions with these franchisees that would put them in default of their franchise agreement in the event of nonpayment under the lease. We believe these cross-default provisions significantly reduce the risk that we will be required to make payments under these leases. Accordingly, we do not believe it is probable that the Company will be required to make payments under such leases, and we have not recorded a liability for such contingent liabilities.
(c) Letters of credit
At December 29, 2012 and December 31, 2011, the Company had standby letters of credit outstanding for a total of $11.5 million and $11.2 million, respectively. There were no amounts drawn down on these letters of credit.
(d) Legal matters
In May 2003, a group of Dunkin’ Donuts franchisees from Quebec, Canada filed a lawsuit against the Company on a variety of claims, based on events which primarily occurred 10 to 15 years ago, including but not limited to, alleging that the Company breached its franchise agreements and provided inadequate management and support to Dunkin’ Donuts franchisees in Quebec (“Bertico litigation”). On June 22, 2012, the Quebec Superior Court found for the plaintiffs and issued a judgment against the Company in the amount of approximately C$16.4 million (approximately $15.9 million), plus costs and interest, representing loss in value of the franchises and lost profits. During the second quarter of 2012, the Company increased its estimated liability related to the Bertico litigation by $20.7 million to reflect the judgment amount and estimated plaintiff legal costs and interest. During the third and fourth quarters of 2012, the Company accrued an additional $493 thousand for interest that continues to accrue on the judgment amount, resulting in an estimated liability of $25.8 million, including the impact of foreign exchange, as of December 29, 2012. The Company had recorded an estimated liability of approximately $3.9 million as of December 31, 2011, representing the Company’s best estimate within the range of losses which could be incurred in connection with this matter. The Company strongly disagrees with the decision reached by the Court and believes the damages awarded were unwarranted. As such, the Company is vigorously appealing the decision.
The Company is engaged in several matters of litigation arising in the ordinary course of its business as a franchisor. Such matters include disputes related to compliance with the terms of franchise and development agreements, including claims or threats of claims of breach of contract, negligence, and other alleged violations by the Company. At December 29, 2012 and December 31, 2011, contingent liabilities, excluding the Bertico litigation, totaling $1.5 million and $736 thousand, respectively, were included in other current liabilities in the consolidated balance sheets to reflect the Company’s estimate of the potential loss which may be incurred in connection with these matters. While the Company intends to vigorously defend its positions against all claims in these lawsuits and disputes, it is reasonably possible that the losses in connection with all matters could increase by up to an additional $12.0 million based on the outcome of ongoing litigation or negotiations.
(18) Retirement plans
401(k) Plan
Employees of the Company, excluding employees of certain international subsidiaries, participate in a defined contribution retirement plan, the Dunkin’ Brands, Inc. 401(k) Retirement Plan (“401(k) Plan”), under Section 401(k) of the Internal Revenue
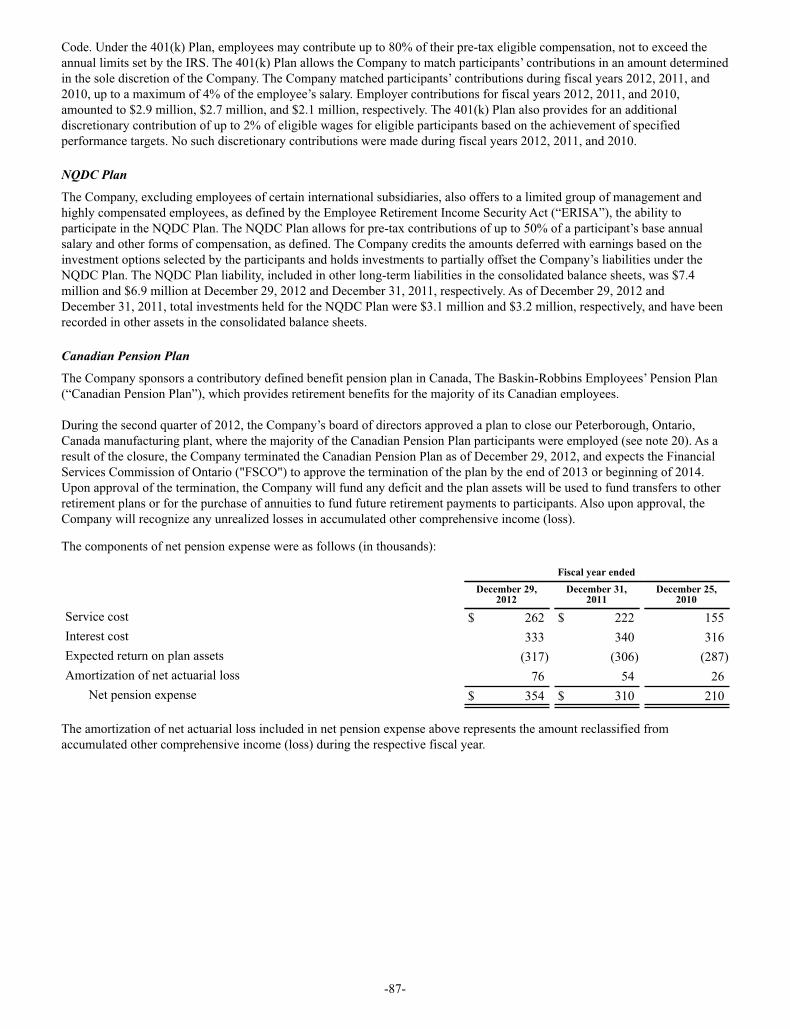
-87-
Code. Under the 401(k) Plan, employees may contribute up to 80% of their pre-tax eligible compensation, not to exceed the annual limits set by the IRS. The 401(k) Plan allows the Company to match participants’ contributions in an amount determined in the sole discretion of the Company. The Company matched participants’ contributions during fiscal years 2012, 2011, and 2010, up to a maximum of 4% of the employee’s salary. Employer contributions for fiscal years 2012, 2011, and 2010, amounted to $2.9 million, $2.7 million, and $2.1 million, respectively. The 401(k) Plan also provides for an additional discretionary contribution of up to 2% of eligible wages for eligible participants based on the achievement of specified performance targets. No such discretionary contributions were made during fiscal years 2012, 2011, and 2010.
NQDC Plan
The Company, excluding employees of certain international subsidiaries, also offers to a limited group of management and highly compensated employees, as defined by the Employee Retirement Income Security Act (“ERISA”), the ability to participate in the NQDC Plan. The NQDC Plan allows for pre-tax contributions of up to 50% of a participant’s base annual salary and other forms of compensation, as defined. The Company credits the amounts deferred with earnings based on the investment options selected by the participants and holds investments to partially offset the Company’s liabilities under the NQDC Plan. The NQDC Plan liability, included in other long-term liabilities in the consolidated balance sheets, was $7.4 million and $6.9 million at December 29, 2012 and December 31, 2011, respectively. As of December 29, 2012 and December 31, 2011, total investments held for the NQDC Plan were $3.1 million and $3.2 million, respectively, and have been recorded in other assets in the consolidated balance sheets.
Canadian Pension Plan
The Company sponsors a contributory defined benefit pension plan in Canada, The Baskin-Robbins Employees’ Pension Plan (“Canadian Pension Plan”), which provides retirement benefits for the majority of its Canadian employees.
During the second quarter of 2012, the Company’s board of directors approved a plan to close our Peterborough, Ontario, Canada manufacturing plant, where the majority of the Canadian Pension Plan participants were employed (see note 20). As a result of the closure, the Company terminated the Canadian Pension Plan as of December 29, 2012, and expects the Financial Services Commission of Ontario ("FSCO") to approve the termination of the plan by the end of 2013 or beginning of 2014. Upon approval of the termination, the Company will fund any deficit and the plan assets will be used to fund transfers to other retirement plans or for the purchase of annuities to fund future retirement payments to participants. Also upon approval, the Company will recognize any unrealized losses in accumulated other comprehensive income (loss).
The components of net pension expense were as follows (in thousands):
Fiscal year ended
December 29,
2012December 31,
2011December 25,
2010
Service cost $ 262 $ 222 155Interest cost 333 340 316Expected return on plan assets (317) (306) (287)Amortization of net actuarial loss 76 54 26
Net pension expense $ 354 $ 310 210
The amortization of net actuarial loss included in net pension expense above represents the amount reclassified from accumulated other comprehensive income (loss) during the respective fiscal year.

-88-
The table below summarizes other balances for fiscal years 2012, 2011, and 2010 (in thousands):
Fiscal year ended
December 29,
2012December 31,
2011December 25,
2010
Change in benefit obligation:Benefit obligation, beginning of year $ 6,050 6,042 5,087
Service cost 262 222 155Interest cost 333 340 316Employee contributions 88 81 69Benefits paid (275) (479) (218)Curtailment gain (1,084) — —Actuarial loss (gain) 2,854 (95) 417Foreign currency loss (gain), net 121 (61) 216
Benefit obligation, end of year $ 8,349 6,050 6,042Change in plan assets:
Fair value of plan assets, beginning of year $ 4,945 4,797 4,247Expected return on plan assets 317 306 287Employer contributions 662 798 310Employee contributions 88 81 69Benefits paid (275) (479) (218)Actuarial loss (27) (505) (74)Foreign currency gain (loss), net 99 (53) 176
Fair value of plan assets, end of year $ 5,809 4,945 4,797Reconciliation of funded status:
Funded status $ (2,540) (1,105) (1,245)Net amount recognized at end of period $ (2,540) (1,105) (1,245)
Amounts recognized in the balance sheet consist of:Accrued benefit cost $ (2,540) (1,105) (1,245)
Net amount recognized at end of period $ (2,540) (1,105) (1,245)
The investments of the Canadian Pension Plan consisted of one pooled investment fund (“pooled fund”) at December 29, 2012 and December 31, 2011. The pooled fund is comprised of numerous underlying investments and is valued at the unit fair values supplied by the fund’s administrator, which represents the fund’s proportionate share of underlying net assets at market value determined using closing market prices. The pooled fund is considered Level 2, as defined by U.S. GAAP, because the inputs used to calculate the fair value are derived principally from observable market data. The objective of the pooled fund is to generate both capital growth and income, while maintaining a relatively low level of risk. To achieve its objectives, the pooled fund invests in a number of underlying funds that have holdings in a number of different asset classes while also investing directly in equities and fixed instruments issued from around the world. The Canadian Pension Plan assumes a concentration of risk as it is invested in only one investment. The risk is mitigated as the pooled fund consists of a diverse range of underlying investments. The allocation of the assets within the pooled fund consisted of the following:
December 29,2012
December 31,2011
Equity securities 60% 58%Debt securities 39 39Other 1 3
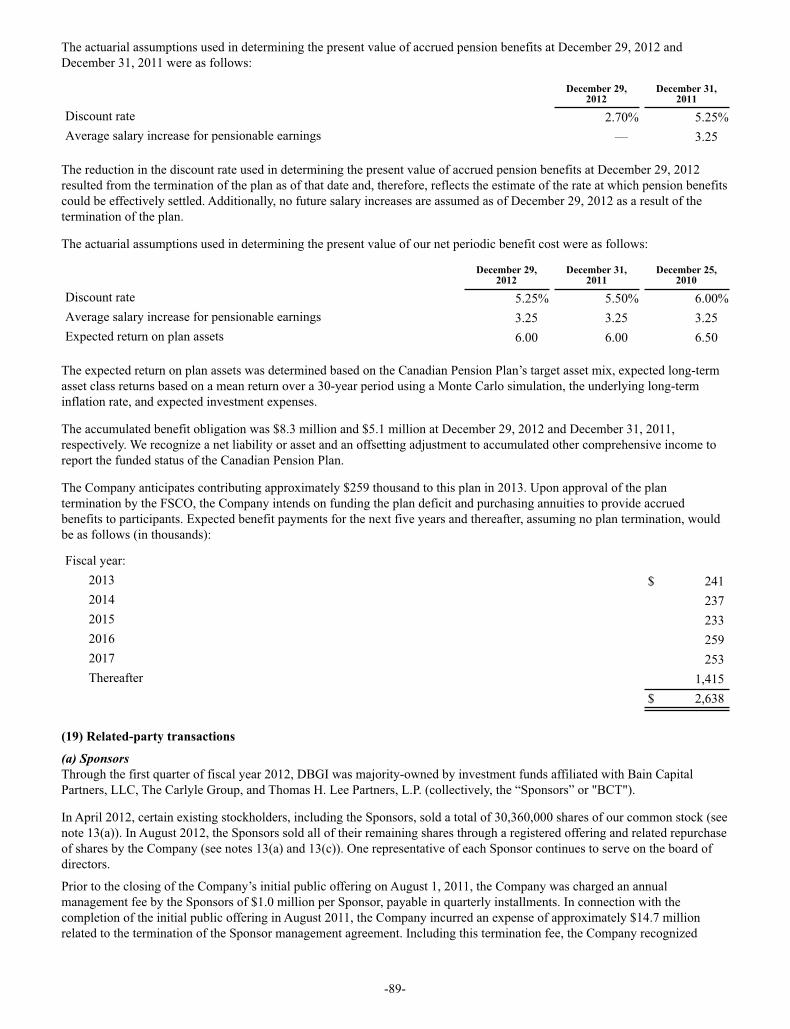
-89-
The actuarial assumptions used in determining the present value of accrued pension benefits at December 29, 2012 and December 31, 2011 were as follows:
December 29,2012
December 31,2011
Discount rate 2.70% 5.25%Average salary increase for pensionable earnings — 3.25
The reduction in the discount rate used in determining the present value of accrued pension benefits at December 29, 2012 resulted from the termination of the plan as of that date and, therefore, reflects the estimate of the rate at which pension benefits could be effectively settled. Additionally, no future salary increases are assumed as of December 29, 2012 as a result of the termination of the plan.
The actuarial assumptions used in determining the present value of our net periodic benefit cost were as follows:
December 29,2012
December 31,2011
December 25,2010
Discount rate 5.25% 5.50% 6.00%Average salary increase for pensionable earnings 3.25 3.25 3.25Expected return on plan assets 6.00 6.00 6.50
The expected return on plan assets was determined based on the Canadian Pension Plan’s target asset mix, expected long-term asset class returns based on a mean return over a 30-year period using a Monte Carlo simulation, the underlying long-term inflation rate, and expected investment expenses.
The accumulated benefit obligation was $8.3 million and $5.1 million at December 29, 2012 and December 31, 2011, respectively. We recognize a net liability or asset and an offsetting adjustment to accumulated other comprehensive income to report the funded status of the Canadian Pension Plan.
The Company anticipates contributing approximately $259 thousand to this plan in 2013. Upon approval of the plan termination by the FSCO, the Company intends on funding the plan deficit and purchasing annuities to provide accrued benefits to participants. Expected benefit payments for the next five years and thereafter, assuming no plan termination, would be as follows (in thousands):
Fiscal year:2013 $ 2412014 2372015 2332016 2592017 253Thereafter 1,415
$ 2,638
(19) Related-party transactions
(a) SponsorsThrough the first quarter of fiscal year 2012, DBGI was majority-owned by investment funds affiliated with Bain Capital Partners, LLC, The Carlyle Group, and Thomas H. Lee Partners, L.P. (collectively, the “Sponsors” or "BCT").
In April 2012, certain existing stockholders, including the Sponsors, sold a total of 30,360,000 shares of our common stock (see note 13(a)). In August 2012, the Sponsors sold all of their remaining shares through a registered offering and related repurchase of shares by the Company (see notes 13(a) and 13(c)). One representative of each Sponsor continues to serve on the board of directors.
Prior to the closing of the Company’s initial public offering on August 1, 2011, the Company was charged an annual management fee by the Sponsors of $1.0 million per Sponsor, payable in quarterly installments. In connection with the completion of the initial public offering in August 2011, the Company incurred an expense of approximately $14.7 million related to the termination of the Sponsor management agreement. Including this termination fee, the Company recognized

-90-
$16.4 million and $3.0 million of expense during fiscal years 2011 and 2010, respectively, related to Sponsor management fees, which is included in general and administrative expenses, net in the consolidated statements of operations.
At December 29, 2012 and December 31, 2011, certain affiliates of the Sponsors held $52.4 million and $64.8 million, respectively, of term loans, issued under the Company’s senior credit facility. The terms of these loans are identical to all other term loans issued to unrelated lenders in the senior credit facility.
The Sponsors have historically held a substantial interest in our Company as well as several other entities. The existence of such common ownership and management control could result in differences within our operating results or financial position than if the entities were autonomous; however, we believe such transactions were negotiated at arms-length. The Company made payments to entities in which the Sponsors have ownership interests totaling approximately $1.6 million, $979 thousand, and $769 thousand during fiscal years 2012, 2011, and 2010, respectively, primarily for the purchase of training services and leasing of restaurant space. At December 29, 2012 and December 31, 2011, the Company had a net payable of $150 thousand and $127 thousand, respectively, to these entities.
(b) Joint ventures
The Company received royalties from its joint ventures as follows (in thousands):
Fiscal year ended
December 29,
2012December 31,
2011December 25,
2010
BR Japan $ 2,549 2,473 2,110BR Korea 3,662 3,371 2,990
$ 6,211 5,844 5,100
At December 29, 2012 and December 31, 2011, the Company had $1.2 million and $1.0 million, respectively, of royalties receivable from its joint ventures which were recorded in accounts receivable, net of allowance for doubtful accounts, in the consolidated balance sheets.
The Company made net payments to its joint ventures totaling approximately $1.6 million, $2.8 million, and $1.5 million, in fiscal years 2012, 2011, and 2010, respectively, primarily for the purchase of ice cream products and incentive payments.
(c) Board of directors
Certain family members of one of our directors hold an ownership interest in an entity that owns and operates Dunkin’ Donuts restaurants and holds the right to develop additional restaurants under store development agreements. During fiscal years 2012 and 2011, the Company received $961 thousand and $713 thousand, respectively, in royalty and rental payments from this entity. No amounts were received during fiscal year 2010. During fiscal year 2012, the Company recognized $174 thousand of income primarily related to initial franchise fees and renewals with this entity. All material terms of the franchise and store development agreements with this entity are consistent with other unrelated franchisees in the market.
(20) Closure of manufacturing plant
During the second quarter of 2012, the Company’s board of directors approved a plan to close our Peterborough, Ontario, Canada manufacturing plant, which supplied ice cream to certain of Baskin-Robbins' international markets. Manufacturing of ice cream products that had been produced in Peterborough began transitioning to existing third-party partner suppliers during the third quarter of 2012, and production ceased at the plant at the end of September 2012. The majority of the costs and activities related to the closure of the plant and transition to third-party suppliers occurred in fiscal year 2012, with the exception of the settlement of our Canadian pension plan, which is subject to government approval that may not be obtained until the end of 2013 or early 2014.
During fiscal year 2012, the Company recorded costs related to the plant closure of $11.9 million, including $4.2 million of accelerated depreciation on property, plant, and equipment, $2.7 million of incremental ice cream production costs, $2.0 million of ongoing termination benefits, $1.1 million of one-time termination benefits, and $1.9 million of other costs related to the closing and transition. The accelerated depreciation and the incremental ice cream production costs are included in depreciation and cost of ice cream products, respectively, in the consolidated statements of operations, while all other costs are included in general and administrative expenses, net in the consolidated statements of operations. The Company also expects to incur additional costs of approximately $3.0 million to $4.0 million primarily related to the settlement of our Canadian pension plan upon final government approval.

-91-
The Company has recorded reserves for severance and other related benefits associated with the Peterborough plant closure. The changes in reserves related to the plant closure during fiscal year 2012 were as follows (in thousands):
Fiscal year ended December 29, 2012Ongoing Termination
BenefitsOne-Time Termination
Benefits Total
Balance at December 31, 2011 $ — — —Costs incurred and charged to expense 1,976 1,102 3,078Costs paid or settled (1,361) (1,059) (2,420)Impact of foreign exchange rates 21 12 33Balance at December 29, 2012 $ 636 55 691
The Company expects to pay any remaining accrued termination benefits in the first and second quarters of fiscal year 2013.
(21) Allowance for doubtful accounts
The changes in the allowance for doubtful accounts were as follows (in thousands):
Accountsreceivable
Notes and otherreceivables
Balance at December 26, 2009 $ 5,768 1,345Provision for doubtful accounts, net 13 1,492Write-offs and other (263) (394)
Balance at December 25, 2010 5,518 2,443Provision for doubtful accounts, net 745 1,274Write-offs and other (3,550) (1,396)
Balance at December 31, 2011 2,713 2,321Provision for doubtful accounts, net 513 (1,055)Write-offs and other (743) (62)
Balance at December 29, 2012 $ 2,483 1,204
(22) Quarterly financial data (unaudited)
Three months ended
March 31,
2012June 30,
2012September 29,
2012December 29,
2012 (In thousands, except per share data)
Total revenues $ 152,372 172,387 171,719 161,703Operating income(1) 55,195 46,138 70,345 67,751Net income attributable to Dunkin' Brands(1) 25,950 18,497 29,526 34,335Earnings per share(1):
Common – basic 0.22 0.15 0.26 0.32Common – diluted 0.21 0.15 0.26 0.32
Three months ended
March 26,
2011June 25,
2011September 24,
2011December 31,
2011 (In thousands, except per share data)
Total revenues(2) $ 139,213 156,972 163,508 168,505Operating income(2)(3)(4) 44,836 61,794 54,112 44,567Net income (loss) attributable to Dunkin' Brands(2)(3)(4)(5) (1,723) 17,162 7,412 11,591Earnings (loss) per share)(2)(3)(4)(5):
Class L – basic and diluted 0.85 0.83 4.46 n/aCommon – basic and diluted (0.51) (0.04) (1.01) 0.10
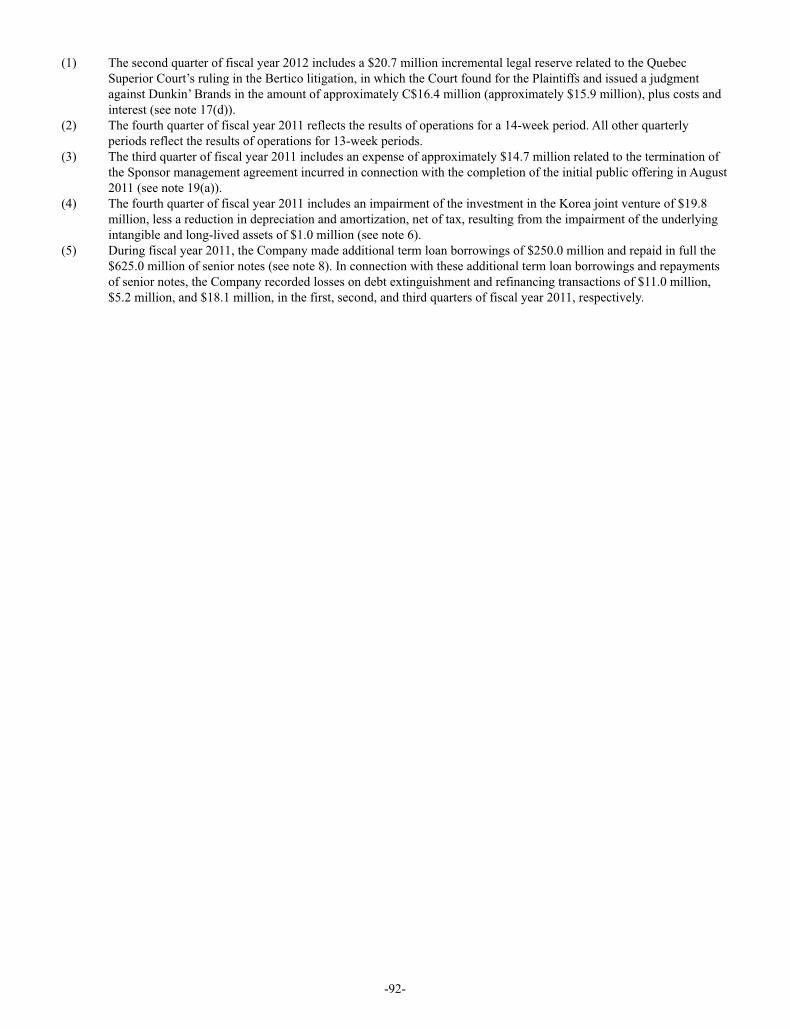
-92-
(1) The second quarter of fiscal year 2012 includes a $20.7 million incremental legal reserve related to the Quebec Superior Court’s ruling in the Bertico litigation, in which the Court found for the Plaintiffs and issued a judgment against Dunkin’ Brands in the amount of approximately C$16.4 million (approximately $15.9 million), plus costs and interest (see note 17(d)).
(2) The fourth quarter of fiscal year 2011 reflects the results of operations for a 14-week period. All other quarterly periods reflect the results of operations for 13-week periods.
(3) The third quarter of fiscal year 2011 includes an expense of approximately $14.7 million related to the termination of the Sponsor management agreement incurred in connection with the completion of the initial public offering in August 2011 (see note 19(a)).
(4) The fourth quarter of fiscal year 2011 includes an impairment of the investment in the Korea joint venture of $19.8 million, less a reduction in depreciation and amortization, net of tax, resulting from the impairment of the underlying intangible and long-lived assets of $1.0 million (see note 6).
(5) During fiscal year 2011, the Company made additional term loan borrowings of $250.0 million and repaid in full the $625.0 million of senior notes (see note 8). In connection with these additional term loan borrowings and repayments of senior notes, the Company recorded losses on debt extinguishment and refinancing transactions of $11.0 million, $5.2 million, and $18.1 million, in the first, second, and third quarters of fiscal year 2011, respectively.

-93-
Item 9. Changes in and Disagreements with Accountants on Accounting and Financial Disclosure
None.
Item 9A. Controls and Procedures.
Disclosure Controls and Procedures
We maintain disclosure controls and procedures (as defined in Rule 13a-15(e) under the Securities Exchange Act of 1934, as amended (the “Exchange Act”)), that are designed to ensure that information that would be required to be disclosed in Exchange Act reports is recorded, processed, summarized and reported within the time periods specified in the SEC's rules and forms, and that such information is accumulated and communicated to our management, including the Chief Executive Officer and the Chief Financial Officer, as appropriate, to allow timely decisions regarding required disclosure.
We carried out an evaluation, under the supervision, and with the participation of our management, including our Chief Executive Officer and Chief Financial Officer, of the effectiveness of the design and operation of our disclosure controls and procedures as of December 29, 2012. Based on that evaluation, our Chief Executive Officer and Chief Financial Officer concluded that, as of December 29, 2012, such disclosure controls and procedures were effective.
Changes in Internal Control over Financial Reporting
There have been no changes in internal control over financial reporting that occurred during the last fiscal quarter that have materially affected, or are reasonably likely to materially affect, the Company's internal control over financial reporting.
Management’s Report on Internal Control Over Financial Reporting
Management of the Company is responsible for establishing and maintaining adequate internal control over financial reporting. Internal control over financial reporting is defined in Rule 13a-15(f) promulgated under the Exchange Act as a process, designed by, or under the supervision of the Company's principal executive and principal financial officers and effected by the Company's board of directors, management and other personnel, to provide reasonable assurance regarding the reliability of financial reporting and the preparation of financial statements for external purposes in accordance with accounting principles generally accepted in the United States of America. Internal control over financial reporting includes maintaining records that in reasonable detail accurately and fairly reflect our transactions and disposition of assets; providing reasonable assurance that transactions are recorded as necessary for preparation of our financial statements; providing reasonable assurance that receipts and expenditures are made only in accordance with management and board authorizations; and providing reasonable assurance regarding prevention or timely detection of unauthorized acquisition, use or disposition of our assets that could have a material effect on our financial statements.
Because of its inherent limitations, internal control over financial reporting is not intended to provide absolute assurance that a misstatement of our financial statements would be prevented or detected. Also, projections of any evaluation of effectiveness to future periods are subject to the risk that controls may become inadequate because of changes in conditions or that the degree of compliance with policies or procedures may deteriorate.
Management, with the participation of the Company's principal executive and principal financial officers, conducted an evaluation of the effectiveness of our internal control over financial reporting as of December 29, 2012 based on the framework and criteria established in Internal Control - Integrated Framework, issued by the Committee of Sponsoring Organizations of the Treadway Commission. This evaluation included review of the documentation of controls, evaluation of the design effectiveness of controls, testing of the operating effectiveness of controls and a conclusion on this evaluation. Based on this evaluation, management concluded that the Company's internal control over financial reporting was effective as of December 29, 2012.
Our independent registered public accounting firm, KPMG, audited the effectiveness of our internal control over financial reporting as of December 29, 2012, as stated in their report which appears herein.
-94-
Report of Independent Registered Public Accounting Firm
The Board of Directors and StockholdersDunkin' Brands Group, Inc.:
We have audited Dunkin' Brands Group, Inc.'s internal control over financial reporting as of December 29, 2012, based on criteria established in Internal Control - Integrated Framework issued by the Committee of Sponsoring Organizations of the Treadway Commission (COSO). Dunkin' Brands Group, Inc.'s management is responsible for maintaining effective internal control over financial reporting and for its assessment of the effectiveness of internal control over financial reporting, included in the accompanying Management's Report on Internal Control over Financial Reporting. Our responsibility is to express an opinion on the Company's internal control over financial reporting based on our audit.
We conducted our audit in accordance with the standards of the Public Company Accounting Oversight Board (United States). Those standards require that we plan and perform the audit to obtain reasonable assurance about whether effective internal control over financial reporting was maintained in all material respects. Our audit included obtaining an understanding of internal control over financial reporting, assessing the risk that a material weakness exists, and testing and evaluating the design and operating effectiveness of internal control based on the assessed risk. Our audit also included performing such other procedures as we considered necessary in the circumstances. We believe that our audit provides a reasonable basis for our opinion.
A company's internal control over financial reporting is a process designed to provide reasonable assurance regarding the reliability of financial reporting and the preparation of financial statements for external purposes in accordance with generally accepted accounting principles. A company's internal control over financial reporting includes those policies and procedures that (1) pertain to the maintenance of records that, in reasonable detail, accurately and fairly reflect the transactions and dispositions of the assets of the company; (2) provide reasonable assurance that transactions are recorded as necessary to permit preparation of financial statements in accordance with generally accepted accounting principles, and that receipts and expenditures of the company are being made only in accordance with authorizations of management and directors of the company; and (3) provide reasonable assurance regarding prevention or timely detection of unauthorized acquisition, use, or disposition of the company's assets that could have a material effect on the financial statements.
Because of its inherent limitations, internal control over financial reporting may not prevent or detect misstatements. Also, projections of any evaluation of effectiveness to future periods are subject to the risk that controls may become inadequate because of changes in conditions, or that the degree of compliance with the policies or procedures may deteriorate.
In our opinion, Dunkin' Brands Group, Inc. maintained, in all material respects, effective internal control over financial reporting as of December 29, 2012, based on criteria established in Internal Control - Integrated Framework issued by COSO.
We also have audited, in accordance with the standards of the Public Company Accounting Oversight Board (United States), the consolidated balance sheets of Dunkin' Brands Group, Inc. and subsidiaries as of December 29, 2012 and December 31, 2011, and the related consolidated statements of operations, comprehensive income, stockholders' equity (deficit), and cash flows for each of the fiscal years in the three-year period ended December 29, 2012 and our report dated February 22, 2013 expressed an unqualified opinion on those consolidated financial statements.
/s/ KPMG LLP
Boston, MassachusettsFebruary 22, 2013
-95-
Item 9B. Other Information
Dunkin' Brands has a classified Board of Directors currently consisting of three classes. As a result of director resignations in August 2012, four directors remained in each of Class I (with terms expiring in 2015) and Class III (with terms expiring in 2014) while no directors remained in Class II. On February 21, 2013, in order to balance the number of directors in the various classes as contemplated by our certificate of incorporation, the Board of Directors determined to re-designate each of Ralph Alvarez and Anthony DiNovi from a Class I director to a Class II director, and re-designate Nigel Travis from a Class III director to a Class II director. In order to comply with technical requirements of Delaware law, this re-designation was implemented by each of Messrs. Alvarez, DiNovi and Travis resigning as a Class I or Class III, as applicable, member of the Board of Directors and simultaneously being elected by the Board of Directors to be a Class II director with a term expiring at our next annual meeting of stockholders in 2013.
PART III
Item 10. Directors, Executive Officers and Corporate Governance
Executive Officers of the Registrant
Set forth below is certain information about our executive officers. Ages are as of February 22, 2013.
Nigel Travis, age 63, has served as Chief Executive Officer of Dunkin' Brands since January 2009. From 2005 through 2008, Mr. Travis served as President and Chief Executive Officer, and on the board of directors of Papa John's International, Inc., a publicly-traded international pizza chain. Prior to Papa John's, Mr. Travis was with Blockbuster, Inc. from 1994 to 2004, where he served in increasing roles of responsibility, including President and Chief Operating Officer. Mr. Travis previously held numerous senior positions at Burger King Corporation. Mr. Travis currently serves on the board of directors of Office Depot, Inc. and formerly served on the boards of Lorillard, Inc. and Bombay Company, Inc.
Paul Carbone, age 46, was named Senior Vice President and Chief Financial Officer on June 4, 2012. Prior to that, Mr. Carbone had served as Vice President, Financial Management of Dunkin' Brands since 2008. Prior to joining Dunkin' Brands, he most recently served as Senior Vice President and Chief Financial Officer for Tween Brands, Inc. Before Tween Brands, Mr. Carbone spent seven years with Limited Brands, Inc., where his roles included Vice President, Finance, for Victoria's Secret.
John Costello, age 65, joined Dunkin' Brands in 2009 and currently serves as President, Global Marketing & Innovation. Prior to joining Dunkin' Brands, Mr. Costello was an independent consultant and served as President and CEO of Zounds, Inc., an early stage developer and hearing aid retailer, from September 2007 to January 2009. Following his departure, Zounds filed for bankruptcy in March 2009. From October 2006 to August 2007, he served as President of Consumer and Retail for Solidus Networks, Inc. (d/b/a Pay By Touch), which filed for bankruptcy in March 2008. Mr. Costello previously served as the Executive Vice President of Merchandising and Marketing at The Home Depot, Senior Executive Vice President of Sears, and Chief Global Marketing Officer of Yahoo!. He has also held leadership roles at several companies, including serving as President of Nielsen Marketing Research U.S.
Richard Emmett, age 57, was named Senior Vice President and General Counsel in December 2009. Mr. Emmett joined Dunkin' Brands from QCE HOLDING LLC (Quiznos) where he served as Executive Vice President, Chief Legal Officer and Secretary. Prior to Quiznos, Mr. Emmett served in various roles including as Senior Vice President, General Counsel and Secretary for Papa John's International. Mr. Emmett currently serves on the board of directors of Francesca's Holdings Corporation.
Ginger Gregory, age 45, joined Dunkin' Brands as our Chief Human Resources Officer in March 2012. Ms. Gregory was previously employed by Novartis AG, where she served in various senior positions since 2005, most recently as Global Head of Human Resources for Novartis Vaccines and Diagnostics.
Giorgio Minardi, age 50, was named President, International of Dunkin' Brands in February 2012. Mr. Minardi joined Dunkin' Brands from Autogrill Corporation, where he served from 2007 to 2011, most recently as Managing Director for Europe and the Middle East. He also served as Autogrill's Chairman in Spain and Belgium, and as President in Switzerland. Mr. Minardi previously held senior positions at Burger King Corporation from 2006 to 2007 and McDonald's Corporation from 1989 to 2005.
Bill Mitchell, age 48, joined Dunkin' Brands in August 2010 and currently serves as President, Baskin-Robbins U.S. and Canada. Mr. Mitchell joined Dunkin' Brands from Papa John's International, where he had served in a variety of roles since 2000, including President of Global Operations, President of Domestic Operations, Operations VP, Division VP and Senior VP of Domestic Operations. Prior to Papa John's, Mr. Mitchell was with Popeyes, a division of AFC Enterprises where he served in various capacities including Senior Director of Franchise Operations.
-96-
Karen Raskopf, age 58, joined Dunkin' Brands in 2009 and currently serves as Senior Vice President and Chief Communications Officer. Prior to joining Dunkin' Brands, she spent 12 years as Senior Vice President, Corporate Communications for Blockbuster, Inc. She also served as head of communications for 7-Eleven, Inc.
Paul Twohig, age 59, joined Dunkin' Donuts U.S. in October 2009 and currently serves as President, Dunkin' Donuts U.S. and Canada. Prior to joining Dunkin' Brands, Mr. Twohig served as a Division Senior Vice President for Starbucks Corporation from December 2004 to March 2009. Mr. Twohig also previously served as Chief Operating Officer for Panera Bread Company.
The remaining information required by this item will be contained in our definitive Proxy Statement for our 2013 Annual Meeting of Stockholders, which will be filed not later than 120 days after the close of our fiscal year ended December 29, 2012 (the “Definitive Proxy Statement”) and is incorporated herein by reference.
Item 11. Executive Compensation
The information required by this item will be contained in the Definitive Proxy Statement and is incorporated herein by reference.
Item 12. Security Ownership of Certain Beneficial Owners and Management and Related Stockholder Matters
The information required by this item will be contained in the Definitive Proxy Statement and is incorporated herein by reference.
Item 13. Certain Relationships and Related Transactions, and Director Independence
The information required by this item will be contained in the Definitive Proxy Statement and is incorporated herein by reference.
Item 14. Principal Accounting Fees and Services
The information required by this item will be contained in the Definitive Proxy Statement and is incorporated herein by reference.
PART IV
Item 15. Exhibits, Financial Statement Schedules
(a) The following documents are filed as part of this report:
1. Financial statements: All financial statements are included in Part II, Item 8 of this report.
2. Financial statement schedules:
For fiscal year 2010, our joint ventures BR Korea Co., Ltd. and B-R 31 Ice Cream Co., Ltd. were deemed significant to us under Rule 3-09 of Regulation S-X, and as such the financial statements of these joint ventures are required to be filed as financial statement schedules herein within six months of their fiscal year end. Accordingly, the financial statements of these joint ventures will be filed via an amendment to this Annual Report on Form 10-K on or before June 29, 2013.
All other financial statement schedules are omitted because they are not required or are not applicable, or the required information is provided in the consolidated financial statements or notes described in Item 15(a)(1) above.
-97-
3. Exhibits:
ExhibitNumber Exhibit Title
3.1 Form of Second Restated Certificate of Incorporation of Dunkin’ Brands Group, Inc. (incorporated byreference to Exhibit 3.1 to the Company’s Registration Statement on Form S-1, File No. 333-173898, asamended on July 11, 2011)
3.2 Form of Second Amended and Restated Bylaws of Dunkin’ Brands Group, Inc. (incorporated by reference toExhibit 3.2 to the Company’s Registration Statement on Form S-1, File No. 333-173898, as amended on July11, 2011)
4.2 Specimen Common Stock certificate of Dunkin’ Brands Group, Inc. (incorporated by reference to Exhibit4.6 to the Company’s Registration Statement on Form S-1, File No. 333-173898, as amended on July 11,2011)
10.1* Dunkin’ Brands Group, Inc. (f/k/a Dunkin’ Brands Group Holdings, Inc.) Amended and Restated 2006Executive Incentive Plan (incorporated by reference to Exhibit 10.1 to the Company’s RegistrationStatement on Form S-1, File No. 333-173898, filed with the SEC on May 4, 2011)
10.2* Form of Option Award under 2006 Executive Incentive Plan (incorporated by reference to Exhibit 10.2 tothe Company’s Registration Statement on Form S-1, File No. 333-173898, filed with the SEC on May 4,2011)
10.3* Form of Restricted Stock Award under 2006 Executive Incentive Plan (incorporated by reference to Exhibit10.3 to the Company’s Registration Statement on Form S-1, File No. 333-173898, filed with the SEC onMay 4, 2011)
10.4* Dunkin’ Brands Group, Inc. Amended & Restated 2011 Omnibus Long-Term Incentive Plan
10.5* Form of Amended Option Award under 2011 Omnibus Long-Term Incentive Plan
10.6* Form of Amended Restricted Stock Unit Award under 2011 Omnibus Long-Term Incentive Plan
10.7* Dunkin’ Brands Group, Inc. Annual Incentive Plan
10.8* Amended and Restated Dunkin’ Brands, Inc. Non-Qualified Deferred Compensation Plan (incorporated byreference to Exhibit 10.6 to the Company’s Registration Statement on Form S-1, File No. 333-173898, filedwith the SEC on May 4, 2011)
10.9* Amended and Restated Executive Employment Agreement among Dunkin’ Brands, Inc., Dunkin’ BrandsGroup, Inc. (f/k/a Dunkin’ Brands Group Holdings, Inc.), and Jon Luther, dated as of December 31, 2008(incorporated by reference to Exhibit 10.8 to the Company’s Registration Statement on Form S-1, File No.333-173898, filed with the SEC on May 4, 2011)
10.10* Transition Agreement of Jon Luther, dated as of June 30, 2010 (incorporated by reference to Exhibit 10.9 tothe Company’s Registration Statement on Form S-1, File No. 333-173898, filed with the SEC on May 4,2011)
10.11* First Amended and Restated Executive Employment Agreement between Dunkin’ Brands, Inc., Dunkin’Brands Group, Inc. and Nigel Travis (incorporated by reference to Exhibit 10.10 to the Company’sRegistration Statement on Form S-1, File No. 333-173898, filed with the SEC on May 4, 2011)
10.12* Amendment No. 1 to First Amended and Restated Executive Employment Agreement between Dunkin’Brands, Inc., Dunkin’ Brands Group, Inc. and Nigel Travis (incorporated by reference to Exhibit 10.1 to theCompany’s Current Report on Form 8-K, File No. 001-35258, filed with the SEC on December 3, 2012)
10.13* Offer Letter to Neil Moses dated September 27, 2010 (incorporated by reference to Exhibit 10.13to theCompany’s Registration Statement on Form S-1, File No. 333-173898, filed with the SEC on May 4, 2011)
10.14* Separation Agreement with Neil Moses dated November 13, 2012
10.15* Offer Letter to John Costello dated September 30, 2009 (incorporated by reference to Exhibit 10.15 to theCompany’s Registration Statement on Form S-1, File No. 333-173898, filed with the SEC on May 4, 2011)
10.16* Form of amendment to Offer Letters (incorporated by reference to Exhibit 10.16(a) to the Company’sRegistration Statement on Form S-1, File No. 333-173898, as amended on July 11, 2011)
10.17* Offer Letter to Ginger Gregory dated March 6, 2012
10.18* Offer Letter to Giorgio Minardi dated February 1, 2012
-98-
10.19* Offer Letter to Paul Carbone dated June 4, 2012
10.20 Form of Non-Competition/Non-Solicitation/Confidentiality Agreement (incorporated by reference to Exhibit10.17 to the Company’s Registration Statement on Form S-1, File No. 333-173898, filed with the SEC onMay 4, 2011)
10.21 Credit Agreement among Dunkin’ Finance Corp, Dunkin’ Brands Holdings, Inc., Dunkin’ Brands, Inc.,Barclays Bank PLC and the other lenders party thereto, dated as of November 23, 2010 (incorporated byreference to Exhibit 10.20 to the Company’s Registration Statement on Form S-1, File No. 333-173898, asamended on June 7, 2011)
10.22 Joinder to Credit Agreement dated as of December 3, 2010 (incorporated by reference to Exhibit 10.21 to theCompany’s Registration Statement on Form S-1, File No. 333-173898, filed with the SEC on May 4, 2011)
10.23 Amendment 1, dated as of February 18, 2011, to the Credit Agreement among Dunkin’ Brands, Inc., Dunkin’Brands Holdings, Inc., Barclays Bank PLC and the other lenders party thereto (incorporated by reference toExhibit 10.22 to the Company’s Registration Statement on Form S-1, File No. 333-173898, filed with theSEC on May 4, 2011)
10.24 Amendment 2, dated as of May 25, 2011, to the Credit Agreement among Dunkin’ Brands, Inc., Dunkin’Brands Holdings, Inc., Barclays Bank PLC and the other lenders party thereto (incorporated by reference toExhibit 10.29 to the Company’s Registration Statement on Form S-1, File No. 333-173898, as amended onJune 7, 2011)
10.25 Amendment 3, dated as of August 9, 2012, to the Credit Agreement among Dunkin’ Brands, Inc., Dunkin’Brands Holdings, Inc., Barclays Bank PLC and the other lenders party thereto (incorporated by reference toExhibit 10.1 to the Company’s Current Report on Form 8-K, File No. 001-35258, filed with the SEC onAugust 9, 2012)
10.26 Amendment 4, dated as of February 14, 2013, to the Credit Agreement among Dunkin’ Brands, Inc., Dunkin’ Brands Holdings, Inc., Barclays Bank PLC and the other lenders party thereto and Amendment No. 1 to the Guaranty among Dunkin' Brands Holdings, Inc., the other guarantors named therein and the Administrative Agent (incorporated by reference to Exhibit 10.1 to the Company’s Current Report on Form 8-K, File No. 001-35258, filed with the SEC on February 14, 2013)
10.27 Security Agreement among the Grantors identified therein and Barclays Bank PLC, dated as of December 3,2010 (incorporated by reference to Exhibit 10.23 to the Company’s Registration Statement on Form S-1, FileNo. 333-173898, filed with the SEC on May 4, 2011)
10.28 Form of Director and Officer Indemnification Agreement (incorporated by reference to Exhibit 10.24 to theCompany’s Registration Statement on Form S-1, File No. 333-173898, as amended on June 7, 2011)
10.29 Lease between LSF3 Royall Street, LLC and Dunkin’ Donuts Incorporated, dated as of October 29, 2003(incorporated by reference to Exhibit 10.25 to the Company’s Registration Statement on Form S-1, File No.333-173898, filed with the SEC on May 4, 2011)
10.30 Assignment of Lease between Dunkin’ Donuts Incorporated and Dunkin’ Brands, Inc., dated as of July 22,2005 (incorporated by reference to Exhibit 10.26 to the Company’s Registration Statement on Form S-1, FileNo. 333-173898, filed with the SEC on May 4, 2011)
10.31 Guaranty delivered with LSF3 Royall Street, LLC Lease dated as of October 29, 2003 (incorporated byreference to Exhibit 10.27 to the Company’s Registration Statement on Form S-1, File No. 333-173898, filedwith the SEC on May 4, 2011)
10.32 Form of Baskin-Robbins Franchise Agreement (incorporated by reference to Exhibit 10.30 to the Company’sRegistration Statement on Form S-1, File No. 333-173898, as amended on June 23, 2011)
10.33 Form of Dunkin’ Donuts Franchise Agreement
10.34 Form of Combined Baskin-Robbins and Dunkin’ Donuts Franchise Agreement
10.35 Form of Dunkin’ Donuts Store Development Agreement (incorporated by reference to Exhibit 10.34 to theCompany’s Annual Report on Form 10-K, File No. 001—35258, filed with the SEC on February 24, 2012)
10.36 Form of Baskin-Robbins Store Development Agreement (incorporated by reference to Exhibit 10.35 to theCompany’s Annual Report on Form 10-K, File No. 001—35258, filed with the SEC on February 24, 2012)
21.1 Subsidiaries of Dunkin’ Brands Group, Inc.
23.1 Consent of KPMG LLP

-99-
31.1 Certification pursuant to Section 302 of Sarbanes Oxley Act of 2002 by Chief Executive Officer
31.2 Certification pursuant to Section 302 of Sarbanes Oxley Act of 2002 by Chief Financial Officer
32.1 Certification of periodic financial report pursuant to Section 906 of Sarbanes Oxley Act of 2002
32.2 Certification of periodic financial report pursuant to Section 906 of Sarbanes Oxley Act of 2002
101 The following financial information from the Company’s Annual Report on Form 10-K for the fiscal yearended December 31, 2011, formatted in Extensible Business Reporting Language, (i) the ConsolidatedBalance Sheets, (ii) the Consolidated Statements of Operations, (iii) the Consolidated Statements ofComprehensive Income, (iv) the Consolidated Statements of Stockholders’ Equity (Deficit), (v) theConsolidated Statements of Cash Flows, and (vi) the Notes to the Consolidated Financial Statements
* Management contract or compensatory plan or arrangement
-100-
SIGNATURES
Pursuant to the requirements of Section 13 or 15(d) of the Securities Exchange Act of 1934, the registrant has duly caused this report to be signed on its behalf by the undersigned, thereunto duly authorized.
Date: February 22, 2013
DUNKIN’ BRANDS GROUP, INC.
By: /s/ Nigel TravisName: Nigel TravisTitle: Chief Executive Officer
Pursuant to the requirements of the Securities and Exchange Act of 1934, this report has been signed below by the following persons on behalf of the Registrant and in the capacities and on the dates indicated.
Signature Title Date
/s/ Nigel Travis Chief Executive Officer and Director (PrincipalExecutive Officer)
February 22, 2013Nigel Travis
/s/ Paul Carbone Chief Financial Officer (Principal Financial and Accounting Officer)
February 22, 2013Paul Carbone
/s/ Jon Luther Director February 22, 2013Jon Luther
/s/ Raul Alvarez Director February 22, 2013Raul Alvarez
/s/ Anthony DiNovi Director February 22, 2013Anthony DiNovi
/s/ Michael Hines Director February 22, 2013Michael Hines
/s/ Sandra Horbach Director February 22, 2013Sandra Horbach
/s/ Mark Nunnelly Director February 22, 2013Mark Nunnelly
/s/ Joseph Uva Director February 22, 2013Joseph Uva

42935.ai 7 3/25/13 11:56 AM42935.ai 7 3/25/13 11:56 AM
Dunkin’ Brands Inc. Leadership Team
Nigel TravisChief Executive Officer
Paul Carbone Chief Financial Officer
Jack Clare Chief Information Officer
John Costello President, Global Marketing & Innovation
Richard EmmettSenior Vice President & General Counsel
Ginger Gregory Senior Vice President & Chief Human Resources Officer
Giorgio Minardi President, Dunkin’ Brands International
Scott MurphySenior Vice President & Chief Supply Officer
Bill MitchellPresident, Baskin-Robbins U.S. & Canada
Karen RaskopfSenior Vice President & Chief Communications Officer
Paul TwohigPresident, Dunkin' Donuts U.S. & Canada
Dunkin' Brands Group, Inc. 130 Royall Street Canton, Mass. 02021
42935.ai 8 3/25/13 11:56 AM42935.ai 8 3/25/13 11:56 AM
Related Documents