BioMed Central Page 1 of 11 (page number not for citation purposes) BMC Genomics Open Access Research article Relationship between metabolic and genomic diversity in sesame (Sesamum indicum L.) Hernán Laurentin 1 , Astrid Ratzinger 2 and Petr Karlovsky* 2 Address: 1 Universidad Centroccidental Lisandro Alvarado, Biologic Sciences Department, Agronomy Faculty, Barquisimeto, Venezuela and 2 University Goettingen, Molecular Phytopathology and Mycotoxin Research Unit, Goettingen, Germany Email: Hernán Laurentin - [email protected]; Astrid Ratzinger - [email protected]; Petr Karlovsky* - [email protected] * Corresponding author Abstract Background: Diversity estimates in cultivated plants provide a rationale for conservation strategies and support the selection of starting material for breeding programs. Diversity measures applied to crops usually have been limited to the assessment of genome polymorphism at the DNA level. Occasionally, selected morphological features are recorded and the content of key chemical constituents determined, but unbiased and comprehensive chemical phenotypes have not been included systematically in diversity surveys. Our objective in this study was to assess metabolic diversity in sesame by nontargeted metabolic profiling and elucidate the relationship between metabolic and genome diversity in this crop. Results: Ten sesame accessions were selected that represent most of the genome diversity of sesame grown in India, Western Asia, Sudan and Venezuela based on previous AFLP studies. Ethanolic seed extracts were separated by HPLC, metabolites were ionized by positive and negative electrospray and ions were detected with an ion trap mass spectrometer in full-scan mode for m/z from 50 to 1000. Genome diversity was determined by Amplified Fragment Length Polymorphism (AFLP) using eight primer pair combinations. The relationship between biodiversity at the genome and at the metabolome levels was assessed by correlation analysis and multivariate statistics. Conclusion: Patterns of diversity at the genomic and metabolic levels differed, indicating that selection played a significant role in the evolution of metabolic diversity in sesame. This result implies that when used for the selection of genotypes in breeding and conservation, diversity assessment based on neutral DNA markers should be complemented with metabolic profiles. We hypothesize that this applies to all crops with a long history of domestication that possess commercially relevant traits affected by chemical phenotypes. Background The diversity of characters among members of a species is an inherent feature of biological complexity. Most studies of biological diversity in crops have focused on morpho- logical characters and DNA markers, covering both ends of the path of gene expression from genome to pheno- type. Genome analysis records and compares the genetic make-up of lineages or individuals based on DNA sequences or fragment patterns. Both sequence analysis and DNA fingerprinting sample genome diversity, which Published: 29 May 2008 BMC Genomics 2008, 9:250 doi:10.1186/1471-2164-9-250 Received: 17 September 2007 Accepted: 29 May 2008 This article is available from: http://www.biomedcentral.com/1471-2164/9/250 © 2008 Laurentin et al; licensee BioMed Central Ltd. This is an Open Access article distributed under the terms of the Creative Commons Attribution License (http://creativecommons.org/licenses/by/2.0 ), which permits unrestricted use, distribution, and reproduction in any medium, provided the original work is properly cited.

Welcome message from author
This document is posted to help you gain knowledge. Please leave a comment to let me know what you think about it! Share it to your friends and learn new things together.
Transcript

BioMed CentralBMC Genomics
ss
Open AcceResearch articleRelationship between metabolic and genomic diversity in sesame (Sesamum indicum L.)Hernán Laurentin1, Astrid Ratzinger2 and Petr Karlovsky*2Address: 1Universidad Centroccidental Lisandro Alvarado, Biologic Sciences Department, Agronomy Faculty, Barquisimeto, Venezuela and 2University Goettingen, Molecular Phytopathology and Mycotoxin Research Unit, Goettingen, Germany
Email: Hernán Laurentin - [email protected]; Astrid Ratzinger - [email protected]; Petr Karlovsky* - [email protected]
* Corresponding author
AbstractBackground: Diversity estimates in cultivated plants provide a rationale for conservationstrategies and support the selection of starting material for breeding programs. Diversity measuresapplied to crops usually have been limited to the assessment of genome polymorphism at the DNAlevel. Occasionally, selected morphological features are recorded and the content of key chemicalconstituents determined, but unbiased and comprehensive chemical phenotypes have not beenincluded systematically in diversity surveys. Our objective in this study was to assess metabolicdiversity in sesame by nontargeted metabolic profiling and elucidate the relationship betweenmetabolic and genome diversity in this crop.
Results: Ten sesame accessions were selected that represent most of the genome diversity ofsesame grown in India, Western Asia, Sudan and Venezuela based on previous AFLP studies.Ethanolic seed extracts were separated by HPLC, metabolites were ionized by positive andnegative electrospray and ions were detected with an ion trap mass spectrometer in full-scan modefor m/z from 50 to 1000. Genome diversity was determined by Amplified Fragment LengthPolymorphism (AFLP) using eight primer pair combinations. The relationship between biodiversityat the genome and at the metabolome levels was assessed by correlation analysis and multivariatestatistics.
Conclusion: Patterns of diversity at the genomic and metabolic levels differed, indicating thatselection played a significant role in the evolution of metabolic diversity in sesame. This resultimplies that when used for the selection of genotypes in breeding and conservation, diversityassessment based on neutral DNA markers should be complemented with metabolic profiles. Wehypothesize that this applies to all crops with a long history of domestication that possesscommercially relevant traits affected by chemical phenotypes.
BackgroundThe diversity of characters among members of a species isan inherent feature of biological complexity. Most studiesof biological diversity in crops have focused on morpho-logical characters and DNA markers, covering both ends
of the path of gene expression from genome to pheno-type. Genome analysis records and compares the geneticmake-up of lineages or individuals based on DNAsequences or fragment patterns. Both sequence analysisand DNA fingerprinting sample genome diversity, which
Published: 29 May 2008
BMC Genomics 2008, 9:250 doi:10.1186/1471-2164-9-250
Received: 17 September 2007Accepted: 29 May 2008
This article is available from: http://www.biomedcentral.com/1471-2164/9/250
© 2008 Laurentin et al; licensee BioMed Central Ltd. This is an Open Access article distributed under the terms of the Creative Commons Attribution License (http://creativecommons.org/licenses/by/2.0), which permits unrestricted use, distribution, and reproduction in any medium, provided the original work is properly cited.
Page 1 of 11(page number not for citation purposes)
BMC Genomics 2008, 9:250 http://www.biomedcentral.com/1471-2164/9/250
is independent of environmental conditions and thedevelopmental stage of the organism [1]. AFLP markers[2] are anonymous and are generally thought to be selec-tively neutral, which probably holds true for many kindsof DNA markers [3]. Even whole-genome sequencing ofpopulations, the ultimate genome diversity survey tool,reveals at most the potential of a population to expressvarious phenotypic features. Approaches based on tran-scriptomics and proteomics can identify gene expressionpatterns that underlie the current phenotype and that areaffected by environment and the developmental stage ofthe organism. The relationship between the abundance ofmRNA and protein molecules on one side and of pheno-typic features relevant for crop production on the other isobscure and cannot yet be exploited for breeding pur-poses even in major crops with extensive genomicresources, let alone in minor or orphan crops.
A third level of gene expression, represented by the meta-bolic constitution of the organism, is directly related tofeatures that are important in plant production. We areinterested in secondary metabolites, because these naturalproducts provide most of the chemical diversity in plants,and are a key factor (i) affecting the resistance of crops topathogens and pests, and (ii) controlling commerciallyrelevant traits such as taste, color, aroma and antioxida-tive properties.
The metabolic phenotype of an organism is analyzed bymetabolomics, whose final goal is to identify and quantifyall of the metabolites present in a sample [4,5]. Such acomplete inventory is not attainable with current technol-ogy even for model organisms, so different types ofmetabolite analysis with more limited scopes serve as sur-rogates. Metabolic fingerprints are a static set of analyticalsignals originating from small molecules (e.g. HPLCpeaks, TLC spots, or mass spectra), which can be used fordiagnostic purposes or to confirm the origin of a sample.In metabolic profiling, which is analogous to transcrip-tion profiling, metabolic signals, either anonymous orassigned to structures, are generated and evaluated quan-titatively for samples originating from different varieties,physiological states or treatments. Term profiling is alsoused for a comprehensive analysis of a class of substancesdefined by common structural features (e.g., oxylipin pro-filing). Alternative definitions of metabolic profiling andfingerprinting [6,7] are likely to lead to confusions when-ever metabolic analysis and genome fingerprinting aretreated jointly.
Sesame (Sesamum indicum L.) is one of the most ancientcrops [8,9]. Sesame seed is highly nutritive (50% oil and25% protein) and may be consumed directly or pressed tofive an oil of excellent quality. Most studies of secondarymetabolites in sesame focused on the lignans sesamin,
sesamol, sesamolin and sesaminol [10-13] in seeds. Thesenatural products have antioxidative properties and mayconfer health-promoting qualities on products containingsesame seeds or oil [14-17]. Sesame lignans also may playa role in the resistance of sesame to insect pests and micro-bial pathogens [18-23]. The metabolism of sesame lign-ans after ingestion is understood to a limited extent [24].Metabolic profiling has not been a part of diversity studiesin sesame.
Our objective in this study was to compare metabolic andgenomic diversity in sesame and to discern the relation-ship between the two sets of data. Based on the differencein the diversification of sesame at the genomic and meta-bolic levels we will assess the usefulness of metabolic pro-files in the identification of parent lines for breedingprograms and in the selection of accessions for biodiver-sity preservation in sesame.
ResultsSesame accessions for this study were selected based onpreviously published AFLP data and represent most of thegenome diversity in sesame from India, Western Asia,Sudan and Venezuela. Among these accessions, eightaccessions have Jaccard similarity coefficients from pair-wise comparisons that range from 0.39 to 0.85. Theseaccessions encompass nearly all of the genome diversitydetected by AFLP in the two-dimensional space of princi-pal coordinate analysis and represent the four previouslydescribed major clusters [25]. The two Venezuelan geno-types, an experimental line and a commercial cultivar,were included because they represent Venezuelan breed-ing products with a Jaccard's similarity coefficient of 0.45[26]. These genotypes represent the two major clusterscomprising Venezuelan commercial cultivars and contain80% of the total genetic diversity of sesame in Venezuela.
Three hundred and eighty one AFLP markers, rangingfrom 100 to 550 base-pairs, were recorded using 8 primercombinations. Ninety-five percent of the markers werepolymorphic. Eighty-eight bands (23%) were unique,ranging from 5 (Turkey) to 21 (India 7) per accession(Table 1).
The reproducibility of the metabolic analysis was verygood because similarity and dissimilarity measures andprincipal component analysis results showed negligibledifferences regarding three independent profiles gener-ated from extracts of Sudan3 accession and compared tothe other 9 accessions. The average of the three replicasobtained for Sudan3 was used for all further analysis.
Eighty-eight dominant metabolic signals were selectedbased on the mass chromatogram quality index, 47 ofthem in negative mode ESI and 41 in positive mode ESI.
Page 2 of 11(page number not for citation purposes)

BMC Genomics 2008, 9:250 http://www.biomedcentral.com/1471-2164/9/250
More than 50% of the signals resulted from peaks elutingin a well-resolved area with retention times between 15and 27 min. Thirty-four signals were common to all acces-sions, 16 in positive mode ESI and 18 in negative modeESI. Eight signals were either accession-specific or presentin all except one accession (Table 2). No association wasfound between the distribution of unique AFLP markersand accession-specific metabolic signals.
The coefficient of correlation between correlation coeffi-cient-based similarity matrix and simple-matching coeffi-cient-based similarity matrix was 0.63 (P < 0.01).Correlation between matrices obtained from AFLP dataand metabolic profiles was not significant. Comparisonsof matrices of metabolic data with Jaccard's coefficientmatrix of AFLP data resulted in a correlation coefficient of
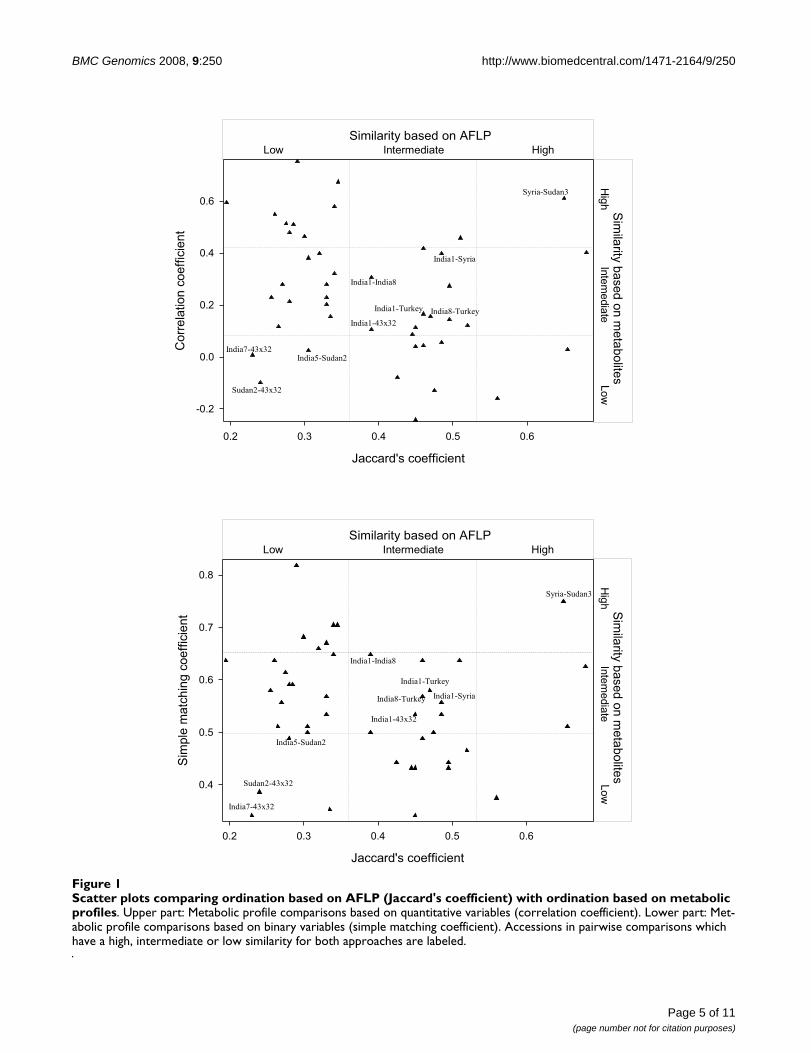
-0.09 (P < 0.33) for the simple matching coefficient matrixand -0.24 (P < 0.18) for the correlation matrix. There wereconsistencies in scatter plots for pairs of accessions thatfell into the same category (high similarity, intermediatesimilarity, or low similarity) for genomic and metabolicdata (Fig. 1). Accession pair Syria-Sudan3 had high simi-larity on both axes, Sudan2–43 × 32, India7–43 × 32, andIndia5-Sudan2 were dissimilar both in metabolic profilesand AFLP fingerprints and pairs India1-India8, India1-Syria, India1-Turkey, India1-43 × 32 and India8-Turkeyhad intermediate similarities.
Biplot of principal coordinate analysis based on AFLPdata calculated from Jaccard's coefficient captured 64% ofthe total variation (Fig. 2). Accessions Sudan2 and India7on one side, and commercial cultivars Inamar and 43 × 32
Table 1: AFLP: Primer combinations and polymorphism of DNA bands
Primer combination Bands total Polymorphic bands Unique bands
(Cy5)E_ACA+M_CAA 55 51 India1 India5 Turkey Sudan3 Inamar 43x32 Total1 1 4 2 1 1 10
(Cy5)E_ACA+M_CAC 53 50 India1 India7 India8 Sudan2 Inamar 43x32 Total1 2 4 2 3 1 13
(Cy5)E_ACA+M_CAG 51 49 India1 Syria Total3 1 4
(Cy5)E_ACA+M_CAT 78 76 India1 India5 India7 Syria Inamar 43x32 Total2 1 1 5 1 1 11
(Cy5)E_ACA+M_CCA 41 38 India7 Inamar 43x32 Total8 1 2 11
(Cy5)E_ACA+M_CCC 37 36 India1 India5 India7 India8 Turkey Sudan2 Inamar 43x32 Total1 4 2 1 1 1 5 1 16
(Cy5)E_ACA+M_CGAA 25 25 India5 India7 Syria Sudan2 Inamar 43x32 Total1 6 2 3 1 2 15
(Cy5)E_ACA+M_CTCA 41 38 India7 India8 Syria 43x32 Total2 4 1 1 8
Table 2: Metabolic signals in sesame seed extracts used in the analysis
Negative mode
Mass range m/z values total m/z values common to all accessions
Number of accession-specific m/z values or values lacking in only one accession
200–400 14 3 2 (Sudan 2) Total: 2400–600 11 1 1 (Turkey) Total: 1600–800 17 10 1 (India 5) Total: 1800–1000 5 4 1 (India 5) Total: 1
Positive mode
Mass range m/z values total m/z values common to all accessions
Number of accession-specific m/z values or values lacking in only one accession
400–600 2 1 0600–800 25 6 1 (India 8) 1 (43 × 32) Total: 2800–1000 14 9 1 (India 5) Total: 1
Page 3 of 11(page number not for citation purposes)
BMC Genomics 2008, 9:250 http://www.biomedcentral.com/1471-2164/9/250
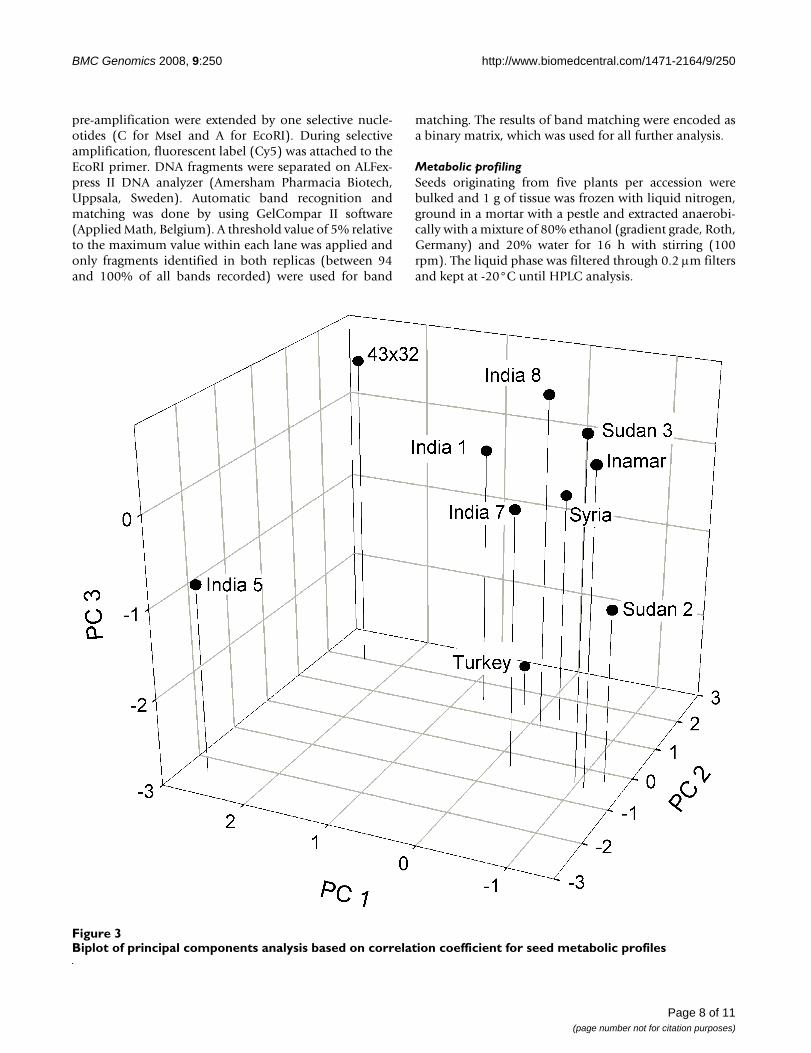
on the other, are the most distinctive. Biplots of principalcomponent/coordinate analysis based on correlationcoefficient, which captured 62% of the variation, and sim-ple matching coefficient, which captured 77% of the vari-ation, had similar patterns in that accessions India5 and43 × 32 formed one group and the remaining eight acces-sions formed a second group. Visual comparison ofbiplots obtained with AFLP and metabolic profiles con-firmed the classification of cultivar 43 × 32 as the mostdistinctive, which explains why Sudan2-43 × 32 was oneof the most dissimilar pairs. Both biplots grouped Syria-Sudan3 as the most similar pair and India1-Syria, India1-Sudan3, India1-Turkey and I8-43 × 32 as pairs with inter-mediate similarities. The most important contradictionbetween both biplots was the placement of India5, India7and Inamar. Based on AFLPs, India7 and Inamar were themost distinctive accessions, whereas metabolic profilesgrouped them together with six other accessions. Theopposite situation was found for India5, which was classi-fied as one of the most distinctive based on metabolic pro-files, but groups together with 5 other accessions based onthe AFLP data.
DiscussionSeed metabolic profiles were unrelated to the geographicorigin of the accessions studied, which is similar to resultsobtained previously for genome diversity as assessed byAFLPs [25]. The relationship patterns generated for theAFLP data and for the seed metabolic profiles were differ-ent. No relevant data from other plant species are availa-ble for comparison, but there are two studies of therelationship between genomic and metabolic diversity inmicroorganisms. In rhizobia (bacteria), metabolic andgenomic data (AFLP) were unrelated [27], while therewere strong similarities between genome variation andmetabolite diversity between two endophytic fungi [28].
If the number of characters reflects the sampling depth,then the metabolic profiles and AFLP fingerprints coveronly a small portion of the underlying character sets. TheAFLP-based analysis appears more robust because it wasbased on 363 polymorphic bands while only 88 signalswere evaluated in the metabolic profiles. However, themetabolic profiles may contain more informationbecause they are based on continuous rather than binaryvariables. To test this hypothesis we transformed the met-abolic data into a binary matrix and compared the binaryand continuous results. The quantitative information(normalized amplitudes of mass signals) did not affectthe similarity patterns and therefore can be neglected indiversity surveys.
Diversity in AFLP patterns and metabolic profiles reflectdifferent facets of genomic polymorphism. AFLPs areinsensitive to gene expression and may occur most fre-
quently in noncoding portions of the genome. Seed met-abolic profiles result from biosynthetic activities inembryo and endosperm based on the expression of asmall fraction of the total genomes. If the samples are rep-resentative, then differences between the diversity pat-terns are due to differences in the diversification of sesameat genomic and metabolic levels. Because the majority ofplant genomes consist of noncoding sequences, mostchanges in AFLP patterns are expected to result from neu-tral mutations fixed by genetic drift rather than by selec-tion. On the other hand all metabolites synthesized by aplant affect its fitness: apart from the metabolic costsincurred, anabolic processes are subjected to differentselection pressures, both positive (e.g., resistance to path-ogens, protection against light, improved disseminationof seeds) and negative (e.g., reduced attractiveness ofseeds for disseminating animals because of a bitter taste,volatiles attracting pests, trigger of the germination ofmicrobial pathogens). The synthesis of many secondarymetabolites is known to be limited to conditions underwhich they enhance the fitness of their producer, limitingthe costs of biosynthesis [41]. Metabolic profiles of ses-ame recorded under different environmental conditionsare therefore likely to differ. For example, exposure tobiotic stress is likely to generate defence-related signals,which may not be present in metabolic profiles of plantsgrown in the absence of pathogens and pests. Regardlessof the progress in analytical technologies, chemical diver-sity revealed by metabolic profiling under a single set ofconditions therefore remains an underestimate of thetotal metabolic capacity of sesame.
The genetic basis of the variation in the metabolic compo-sition on plants was proven by the association betweenmetabolic peaks detected by HPLC-MS and specificgenomic loci in segregating populations of A. thaliana[29]. The disparity between the diversity patterns repre-sented by AFLPs and by metabolic profiles thus providesinsights into the processes that led to the composition ofthe current sesame genome. With the growing availabilityof instrumentation and software tools for nontargetedmetabolite analysis by HPLC-MS [30,31], large-scale met-abolic profiling is becoming a feasible task for diversitystudies in cultivated plants. From a practical point of view,crop improvement programs [32] will benefit from thecomplementation of diversity assessment based on DNAmarkers by metabolic profiling particularly for plants suchas pepper [35,40], mulberry [36,37,39] and fenugreek[38], the commercial value of which is largely affected bycomplex mixtures of secondary metabolites.
In addition to genuine differences in similarity patternsbetween genomic and metabolomic profiles caused bydifferences in diversification rates, non-representativesampling also may lead to inconsistencies. The involve-
Page 4 of 11(page number not for citation purposes)
BMC Genomics 2008, 9:250 http://www.biomedcentral.com/1471-2164/9/250
Page 5 of 11(page number not for citation purposes)
Scatter plots comparing ordination based on AFLP (Jaccard's coefficient) with ordination based on metabolic profilesFigure 1Scatter plots comparing ordination based on AFLP (Jaccard's coefficient) with ordination based on metabolic profiles. Upper part: Metabolic profile comparisons based on quantitative variables (correlation coefficient). Lower part: Met-abolic profile comparisons based on binary variables (simple matching coefficient). Accessions in pairwise comparisons which have a high, intermediate or low similarity for both approaches are labeled.
������������� � ���
��� ��� ��� ��� ���
������� ����� � ���
����
���
���
���
�������������
��� ������
����������
���������
���������
����������
����������������������
����������
� � ��� ���������� !∀������� ���# ∃%
� � ��� ������� ������� ���
# ∃% ∀�
����� �� �
!
������������� � ���
��� ��� ��� ��� ���
� �&������% �∃���� � ���
���
���
���
��∋
��(
����������
���������
���������������������
�����������
����������
� � ��� ������� ������� ���
# ∃% ∀�
����� �� �
!
��� ������
����������
���������
� � ��� ���������� !∀������� ���# ∃%

BMC Genomics 2008, 9:250 http://www.biomedcentral.com/1471-2164/9/250
ment of one accession in many pairwise comparisonswould amplify this distortion. For example, two acces-sions in our set affect 17/45 pairwise comparisons. Thus asmall number of biased data sets may alter the global pat-tern of biplots in a principal components or coordinatesanalysis. In this situation, scatter plots can identify whichdata sets are correlated, which are not, and which are notindependent. Consistencies in scatter plots corroboratethe representativeness of sampling in a particular pairwisecomparison. For example, the pairs Sudan2-43 × 32,India7-43 × 32 and India5-Sudan2 were consistently the
most dissimilar pairs in both the AFLP and the metabolicanalysis. Similarly consistent were the comparison ofpairs Syria-Sudan3 (highly similar for both approaches),and India1-Syria, India1-India8, India1-Turkey, India1-43 × 32 and I8-Turkey (intermediate similarity). Thus, theconsistency of pairwise comparisons is independent ofthe similarity level.
Selection on the metabolome of a plant could distort thecongruency in diversification between neutral DNA mark-ers (AFLP) and metabolic profiles in a manner dependent
Biplot of principal coordinate analysis based on Jaccard's coefficient for AFLPFigure 2Biplot of principal coordinate analysis based on Jaccard's coefficient for AFLP.
Page 6 of 11(page number not for citation purposes)
BMC Genomics 2008, 9:250 http://www.biomedcentral.com/1471-2164/9/250
on the intensity and duration of the selection pressure.Comparative analysis of intra- and interpopulation diver-sity at the genomic and metabolic levels will aid ourunderstanding of the effect of selection on the evolutionof metabolic capacity. Dedicated statistical tools that testthe congruency in diversification of the metabolome andthe genome are not available. However, tools for diversityestimation established in population genetics can beapplied, offering at least qualitative insights.
Plants subjected to selection for metabolic traits shouldevolve faster on the metabolic level than neutral DNAmarkers should at the genomic level, as the rate of fixationof neutral mutations is controlled by only the mutationrate and population size. For example, Turkey-Syria acces-sion pair appears to demonstrate the effect of selection onmetabolic profiles of sesame (compare Fig. 2 and 3).
Common selection pressure exerted on different geno-types may result in different outcomes, i.e. convergentevolution or increased diversification. Increased diversifi-cation occurs when the biochemical basis of traits underselection differs among genotypes, e.g. when unrelatedmetabolic pathways enhance resistance to a commonpathogen. The accession pair India7-Syria are very differ-ent at the genomic level but have similar metabolic phe-notypes, and could have resulted from convergentevolution driven by common selection on genotypes withthe same metabolic potential. Alternatively, neutral mark-ers may have diversified over a long period of time, duringwhich the metabolic phenotype was maintained by con-stant selection pressure.
The third situation encountered in our comparison ofgenomic and metabolic diversity in sesame was that therelative amount of diversification between the membersof a pair was qualitatively similar at both the genomic andthe metabolic levels. Thus pairs that were highly differentat the genomic level also were highly different at the met-abolic level. We suggest that varying selection and com-plex evolutionary histories might explain this kind ofdata. The analysis of the inheritance of metabolic patternsand of the association between metabolic and genomicmarkers might provide deeper insights. We have begun togenerate segregating populations to address these ques-tions.
The purpose of untargeted metabolic profiling in ourwork was to sample metabolic diversity without bias forthe biological activity or practical relevance of the under-lying compounds. One might want to know, however,whether metabolites of particular interest have beenrecovered in ethanol extracts used for the analysis. Themost prominent metabolites of sesame are phenylpropa-noids with one or more methylenedioxybenzole (pipero-
nyl-) moieties such as sesamin and sesaminol. Theselignans occur in free form and as di- and triglucosides andpossess antioxidative properties. Certain sesame lignanslower blood and liver cholesterol levels, qualifying ashealth-promoting agents. In traditional analytical proto-cols, crushed sesame seeds are defatted with hexane priorextraction with ethanol or methanol. The defatting step isoften used in lignan analysis in order to improve therecovery [42], but the lignans of sesame can be extractedfrom oil directly into methanol [43,44], indicating thatdefatting is not necessary. Indeed, an HPLC method forthe analysis of sesame lignans based on extraction with80% ethanol without defatting was described [45]. Simi-larly, extraction of sesame with methanol without defat-ting was used for sesamin determination [46]. In line withthese results, we observed that the recovery of eight ses-ame lignans did not improve substantially by defattingseeds prior ethanol extraction (data not shown), which weused in the comparison of lignan content among sesameaccessions [47]. As long as the life span of reverse phasecolumns is not a matter of concern, defatting seeds priorextraction can be omitted.
ConclusionDiversity patterns in sesame (Sesamum indicum L.) at thegenomic level (neutral DNA markers) and at the meta-bolic level (nontargeted HPLC-MS profiles) differed,often showing a higher diversification rate at the meta-bolic level. For sesame breeders this means that the dis-tances among accessions determined by genomefingerprinting need not reflect differences in metaboliccapacity. Genetic analyses based on neutral markers is notan accurate predictor of the potential of parental lines forbreeding programs aiming to improve traits controlled bymetabolic phenotype such as resistance to pests or taste.The complementation of AFLP fingerprints by metabolicprofiles for breeding and conservation purposes in sesameis recommended.
MethodsPlant materialSeeds were obtained from Centro Nacional de Investiga-ciones Agropecuarias (CENIAP) Germplasm Bank, Vene-zuela (Table 3). Plants were germinated and grown in thegreenhouse with a photoperiod of 12 hours dark and 12hours light at 30°C.
AFLP analysisDNA was extracted from leaves and AFLP analysis was per-formed based on the protocol by Voss et al. [2] with minormodifications as previously reported [25,26], using eightprimer combinations (Table 1). AFLP reactions were per-formed twice for each accession, using restriction enzymesEcoRI and Tru1I (MBI Fermentas, Germany) and compat-ible primers (see Table 1 and Table 7 in [25]). Primers for
Page 7 of 11(page number not for citation purposes)
BMC Genomics 2008, 9:250 http://www.biomedcentral.com/1471-2164/9/250
pre-amplification were extended by one selective nucle-otides (C for MseI and A for EcoRI). During selectiveamplification, fluorescent label (Cy5) was attached to theEcoRI primer. DNA fragments were separated on ALFex-press II DNA analyzer (Amersham Pharmacia Biotech,Uppsala, Sweden). Automatic band recognition andmatching was done by using GelCompar II software(Applied Math, Belgium). A threshold value of 5% relativeto the maximum value within each lane was applied andonly fragments identified in both replicas (between 94and 100% of all bands recorded) were used for band
matching. The results of band matching were encoded asa binary matrix, which was used for all further analysis.
Metabolic profilingSeeds originating from five plants per accession werebulked and 1 g of tissue was frozen with liquid nitrogen,ground in a mortar with a pestle and extracted anaerobi-cally with a mixture of 80% ethanol (gradient grade, Roth,Germany) and 20% water for 16 h with stirring (100rpm). The liquid phase was filtered through 0.2 μm filtersand kept at -20°C until HPLC analysis.
Biplot of principal components analysis based on correlation coefficient for seed metabolic profilesFigure 3Biplot of principal components analysis based on correlation coefficient for seed metabolic profiles
Page 8 of 11(page number not for citation purposes)
BMC Genomics 2008, 9:250 http://www.biomedcentral.com/1471-2164/9/250
For HPLC analysis, 10 μl aliquots of extracts were loadedonto a polar-modified RP-18 phase column (C18-Pyra-mid, Macherey-Nagel, Düren, Germany, 3 μm, 2 × 125mm) and separated at 40°C with a gradient of 10% – 98%methanol at a flow rate of 0.2 ml min-1. The eluent wassubjected to electrospray ionisation (ESI). Ions were ana-lyzed in both positive and negative full scan modebetween 50 and 1000 m/z with an ion trap.
Data processing and analysisRaw data from the metabolic study were processed withthe CODA algorithm (background reduction and spikeelimination [33]). Extracted ion chromatograms with amass quality index of at least 0.85 (according to technicalmanual of ACD/MS Manager v. 8.0, Advanced ChemistryDevelopment, Toronto, Canada) were generated andcompared. Based on these chromatograms, peak tableswere generated. Ten peaks with the highest MCQ value foreach accession were selected. For each peak, matchingpeaks in all accessions were identified, building a set ofpeaks for use in further analysis. Isotope peaks, recog-nized by the difference of one unit in the molecularweight and the same retention time, were combined togenerate one value per metabolite per accession.
Peak areas were standardized twice, first within everyaccession by dividing the area by the total sum of areas ofall peaks for each accession to compensate for loading dif-ferences, and second within every m/z value (across acces-sions) by dividing peak areas by the maximum areawithin the m/z value. The purpose of the second normal-ization was to weight major peaks in each extracted ionchromatogram equally for statistical evaluation, because
the relationship between the amount of a substance thatenters the ion source and the magnitude of the signalrecorded by a mass detector varies among metabolites.Due to the lack of a suitable criterion, no data pretreat-ment was applied [34]. The resulting matrix was used tocalculate correlation coefficients as a measure of similaritybetween pairs of accessions. To assess the effect of differ-ences in signal intensities within extracted ion chromato-grams, the matrix of doubly-normalized intensities wastransformed into a binary matrix by replacing all nonzerovalues with 1. Using the binary matrix, a simple matchingcoefficient was calculated for each pair of accessions. Thecorrelation between the correlation coefficient-basedmatrix and simple matching coefficient-based matrix wascalculated by Mantel test (500 permutations). To visualizethe relationship among accessions according to theirmetabolite content, principal component analysis wasconducted with the correlation matrix. Principal coordi-nate analysis was used for the simple matching coefficientmatrix. Calculations of similarity and dissimilarity coeffi-cients, principal component and coordinate analysis wereperformed with NTSySpc 2.11T (Applied Biostatistics,Setauket (NY), USA).
A binary matrix from the AFLP data was obtained and aJaccard's coefficient similarity matrix was calculated. Therelationship among accessions was visualised as a princi-pal coordinate analysis. Comparison of ordinationobtained by AFLP and metabolite content was based onPearson's correlation and a Mantel test between the matri-ces with 1000 permutations. The two approaches alsowere compared by scatter plots to visualize the correla-tion. The variability range in the scatter plots was split into
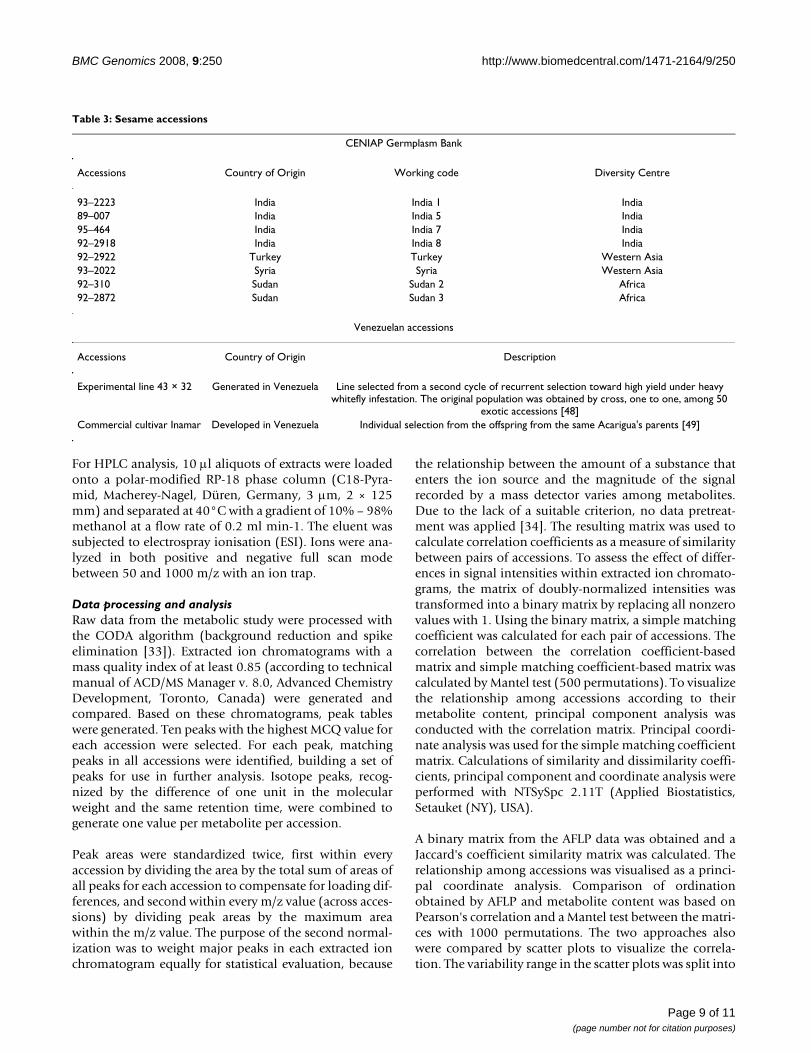
Table 3: Sesame accessions
CENIAP Germplasm Bank
Accessions Country of Origin Working code Diversity Centre
93–2223 India India 1 India89–007 India India 5 India95–464 India India 7 India92–2918 India India 8 India92–2922 Turkey Turkey Western Asia93–2022 Syria Syria Western Asia92–310 Sudan Sudan 2 Africa92–2872 Sudan Sudan 3 Africa
Venezuelan accessions
Accessions Country of Origin Description
Experimental line 43 × 32 Generated in Venezuela Line selected from a second cycle of recurrent selection toward high yield under heavy whitefly infestation. The original population was obtained by cross, one to one, among 50
exotic accessions [48]Commercial cultivar Inamar Developed in Venezuela Individual selection from the offspring from the same Acarigua's parents [49]
Page 9 of 11(page number not for citation purposes)
BMC Genomics 2008, 9:250 http://www.biomedcentral.com/1471-2164/9/250
three sections (high similarity, intermediate similarityand low similarity) on both the X axis and the Y axis. Pair-wise comparisons for the same category in bothapproaches were identified i.e. pairs of accessions thatwere highly similar both in AFLP and metabolic data,pairs that possessed an intermediate similarity in bothdata sets, and pairs dissimilar both in genome and metab-olome. The results of principal coordinate analysis per-formed on AFLP data and principal component analysisperformed on metabolic data were compared visually.
Authors' contributionsHL participated in the design of the study, conducted thegenomic diversity study and statistical analysis, anddrafted the manuscript. AR generated and analyzed meta-bolic profiles. PK conceived the study, participated in theexperimental design and data analysis and wrote parts ofthe manuscript. All authors read and approved the finalversion of the manuscript.
AcknowledgementsThis work was supported by the Programme Alban, European Union Pro-gramme of High Level Scholarships for Latin America, International PhD program for Agricultural Sciences in Göttingen University (IPAG) and Uni-versidad Centroccidental Lisandro Alvarado.
References1. Ovesná J, Poláková K, Leisová L: DNA analyses and their applica-
tions in plant breeding. Czech J Genet Plant Breed 2002, 38:29-40.2. Voss P, Hogers R, Bleeter M, Reijans M, Lee T van de, Hornes M, Fri-
jters A, Pot J, Peleman J, Kuiper M, Zabeau M: AFLP: a new tech-nique for DNA fingerprinting. Nucleic Acids Res 1995,23:4407-4414.
3. Li YC, Korol AB, Fahima T, Beiles A, Nevo E: Microsatellites:Genomic distribution, putative functions and mutationalmechanisms. Molecular Ecology 2002, 11:2453-65.
4. Dunn W, Ellis D: Metabolomics: Current analytical platformsand methodologies. Trends in Analytical Chemistry 2005,24:285-294.
5. Hall RD: Plant metabolomics: From holistic hope, to hype, tohot topic. New Phytologist 2006, 169:453-468.
6. Fiehn O: Metabolomics – the link between genotypes and phe-notypes. Plant Molecular Biology 2002, 48:155-171.
7. Fiehn O, Weckwerth W: Deciphering metabolic networks. EurJ Biochem 2003, 270:579-588.
8. Bedigian D, Harlan J: Evidence for cultivation on sesame in theancient world. Economic Botany 1986, 40:137-154.
9. Bedigian D: Evolution of sesame revisited: domestication,diversity and prospects. Genet Res Crop Evol 2003, 50:779-787.
10. Yoshida H, Takagi S: Effects of seed roasting temperature andtime on the quality characteristics of sesame (Sesamum indi-cum) oil. J Sci Food Agric 1997, 75:19-26.
11. Shyu Y, Hwang L: Antioxidative activity of the crude extract oflignan glycosides from unroasted Burma black sesame meal.Food Research International 2002, 35:357-365.
12. Dachtler M, Put F van de, Stijn F, Beindorff C, Fritsche J: On-line LC-NMR-MS characterization of sesame oil extracts and assess-ment of their antioxidant activity. Eur J Lipid Sci Technol 2003,105:488-496.
13. Shirato-Yasumoto S, Komeichi M, Okuyama Y, Horigane A: A sim-plified HPLC quantification of sesamin and sesamolin in ses-ame seed. SABRAO Journal of Breeding and Genetics 2003, 35:27-34.
14. Kang MH, Naito M, Tsujihara N, Osawa T: Sesamolin inhibits lipidperoxidation in rat liver and kidney. J Nutr 1998,128:1018-1022.
15. Kang MH, Kawai Y, Naito M, Osawa T: Dietary defatted sesameflour decreases susceptibility to oxidative stress in hypercho-lesterolemic rabbits. J Nutr 1999, 129:1885-1890.
16. Kang MH, Naito M, Sakai K, Uchida K, Osawa T: Mode of action ofsesame lignans in protecting low-density lipoprotein againstoxidative damage in vitro. Life Sci 2000, 66:161-171.
17. Miyake Y, Fukumoto S, Okada M, Sakaida K, Nakamura Y, Osawa T:Antioxidative catechol lignans converted from sesamin andsesaminol triglucoside by culturing with Aspergillus. J AgricFood Chem 2005, 53:22-27.
18. Devine G, Denholm I: An unconventional use of piperonylbutoxide for managing the cotton whitefly, Bemisia tabaci(Hemiptera:Aleyrodidae). Bulletin of Entomological Research 1988,88:601-610.
19. Devine G, Ishaaya I, Horowitz A, Denholm I: The response ofpyriproxyfen-resistant and susceptible Bemisia tabaci Genn.(Homoptera:Aleyrodidae) to pyriproxyfen and fenoxycarbalone and in combination with piperonyl butoxide. Pestic Sci1999, 55:405-411.
20. Brooker N, Long J, Stephan S: Field assessment of plant deriva-tive compound for managing fungal soybean diseases. Bio-chemical Society Transactions 2000, 28:917-920.
21. Victor S, Crisóstomo F, Bueno F, Pagnocca F, Fernandes J, Correa A,Bueno O, Hebling J, Bacci M Jr, Vieira P, daSilva F: Toxicity of syn-thetic piperonyl compounds to leaf-cutting ants and theirsymbiotic fungus. Pest Manag Sci 2001, 57:603-608.
22. Harmatha J, Nawrot J: Insect feeding deterrent activity of lign-ans and related phenylpropanoids with a methylenedioxy-phenyl (pyperonyl) structure moiety. Entomologia Experimentaliset Applicata 2002, 104:51-60.
23. Nascimento I, Murata A, Bortoli S, Lopes L: Insecticidad activity ofchemical constituents from Aristolochia pubescens againstAnticarsia gemmatalis larvae. Pest Manag Sci 2004, 60:413-416.
24. Peñalvo J, Heinonen S, Aura A, Adlerreutz H: Dietary sesamin inconverted to enterolactone in humans. J Nutr 2005,135:1056-1062.
25. Laurentin H, Karlovsky P: Genetic relationship and diversity in asesame (Sesamum indicum L.) germplasm collection usingamplified fragment length polymorphism (AFLP). BMC Genet-ics 2006, 7:10.
26. Laurentin H, Karlovsky P: AFLP fingerprinting of sesame (Sesa-mum indicum L.) cultivars: identification, genetic relationshipand comparison of AFLP informativeness parameters.Genetic Resources and Crop Evolution 2007, 54:1437-1446.
27. Wolde-meskel E, Terefework Z, Lindstrom K, Frostegard A: Meta-bolic and genomic diversity of rhizobia isolated from fieldstanding native and exotic woody legumes in southern Ethi-opia. Syst Appl Microbiol 2004, 27:603-611.
28. Seymour F, Cresswell J, Jack P, Lappin-Scott H, Haag H, Talbot N:The influence of genotypic variation on metabolite diversityin populations of two endophytic fungal species. Fungal Genet-ics and Biology 2004, 41:721-734.
29. Keurentjes JJ, Fu J, de Vos CH, Lommen A, Hall RD, Bino RJ, Plas LHvan der, Jansen RC, Vreugdenhil D, Koornneef M: The genetics ofplant metabolism. Natural Genetics 2006, 38:842-849.
30. De Vos RC, Moco S, Lommen A, Keurentjes JJ, Bino RJ, Hall RD:Untargeted large-scale plant metabolomics using liquidchromatography coupled to mass spectrometry. Nature Pro-tocols 2007, 2:778-791.
31. Dixon RA, Gang DR, Charlton AJ, Fiehn O, Kuiper HA, Reynolds TL,Tjeerdema RS, Jeffery EH, German JB, Ridley WP, Seiber JN: Appli-cations of metabolomics in agriculture. J Agric Food Chem 2006,54:8984-8994.
32. Rao N: Plant genetic resources: advancing conservation anduse through biotechnology. African Journal of Biotechnology 2004,3:136-145.
33. Windig W, Phalp JM, Payne AW: Noise and Background Reduc-tion Method for Component Detection in Liquid Chroma-tography/Mass Spectrometry. Anal Chem 1996, 68:3602-3606.
34. Berg RA, Hoefsloot HCJ van den, Westerhuis JA, Smilde AK, WerfMJ, van der : Centering, scaling, and transformations: improv-ing the biological information content of metabolomics data.BMC Genomics 2006, 7:142.
35. Joy N, Abraham Z, Soniya EV: A preliminary assessment ofgenetic relationships among agronomically important culti-vars of black pepper. BMC Genetics 2007, 8:42.
Page 10 of 11(page number not for citation purposes)
http://www.ncbi.nlm.nih.gov/entrez/query.fcgi?cmd=Retrieve&db=PubMed&dopt=Abstract&list_uids=7501463
http://www.ncbi.nlm.nih.gov/entrez/query.fcgi?cmd=Retrieve&db=PubMed&dopt=Abstract&list_uids=7501463
http://www.ncbi.nlm.nih.gov/entrez/query.fcgi?cmd=Retrieve&db=PubMed&dopt=Abstract&list_uids=9614163
BMC Genomics 2008, 9:250 http://www.biomedcentral.com/1471-2164/9/250
Publish with BioMed Central and every scientist can read your work free of charge
"BioMed Central will be the most significant development for disseminating the results of biomedical research in our lifetime."
Sir Paul Nurse, Cancer Research UK
Your research papers will be:
available free of charge to the entire biomedical community
peer reviewed and published immediately upon acceptance
cited in PubMed and archived on PubMed Central
yours — you keep the copyright
Submit your manuscript here:http://www.biomedcentral.com/info/publishing_adv.asp
BioMedcentral
36. Bhattacharya E, Ranade SA: Molecular distinction amongst vari-eties of mulberry using RAPD and DAMD profiles. BMC PlantBiology 2001, 1:3.
37. Awasthi AK, Nagaraja GM, Naik GV, Kanginakudru S, Thangavelu K,Nagaraju J: Genetic diversity and relationships in mulberry(genus Morus) as revealed by RAPD and ISSR marker assays.BMC Genetics 2004, 5:1.
38. Dangi RS, Lagu MD, Choudhary LB, Ranjekar PK, Gupta VS: Assess-ment of genetic diversity in Trigonella foenum-graecum andTrigonella caerulea using ISSR and RAPD markers. BMC PlantBiol 2004, 4:13.
39. Bhattacharya E, Dandin SB, Ranade SA: Single primer amplifica-tion reaction methods reveal exotic and indigenous mul-berry varieties are similarly diverse. J Biosci 2005, 30:669-77.
40. Tam SM, Mhiri C, Vogelaar A, Kerkveld M, Pearce SR, GrandbastienMA: Comparative analyses of genetic diversities withintomato and pepper collections detected by retrotranspo-son-based SSAP, AFLP and SSR. Theor Appl Genet 2005,110:819-31.
41. Secondary Metabolites in Soil Ecology. In Soil Biology Volume 2.Edited by: Karlovsky P, Varma A. New York: Springer; 2007:1-19.
42. Willför SM, Smeds AI, Holmbom BR: Chromatographic analysisof lignans. J Chromatography 2006, 1112:64-77.
43. Dachtler M, Put FHM van de, Stijn Fv, Beindorff CM, Fritsche J: On-line LC-NMR-MS characterization of sesame oil extracts andassessment of their antioxidant activity. Eur J Lipid Sci Technol2003, 105:488-96.
44. Lim JS, Adachi Y, Takahashi Y, Ide T: Comparative analysis of ses-ame lignans (sesamin and sesamolin) in affecting hepaticfatty acid metabolism in rats. Br J Nutr 2007, 97:85-95.
45. Yasumoto SS, Komeichi M, Okuyama Y, Horigane A: A simplifiedHPLC quantification of sesamin and sesamolin in sesameseed. SABRAO J Breed Gen 2003, 35:27-34.
46. Williamson KS, Morris JB, Pye QN, Kamat CD, Hensley K: A surveyof sesamin and composition of tocopherol variability fromseeds of eleven diverse sesame (Sesamum indicum L.) geno-types using HPLC-PAD-ECD. Phytochem Anal 2007 in press. DOI:10.1002/pca.1050
47. Hettwer U, Laurentin H, Karlovsky P: Determination of antioxi-dative furofuran lignans in sesame seeds by HPLC-MS. In Pro-ceedings of the Second International Symposium on Recent Advances inFood Analysis, Last Minute Posters: Prague Edited by: Hajslova J, NielenMWF. Abingdon: Taylor and Francis; 2006:15. 2–4 November 2005
48. Laurentin H, Layrisse A, Quijada P: Evaluación de dos ciclos deselección recurrente para altos rendimientos de semilla enuna población de ajonjolí. Agronomía Tropical (Maracay) 2000,50:521-535.
49. Mazzani B: Inamar: nueva variedad de ajonjolí producida en elInstituto Nacional de Agricultura. Agronomía Tropical (Maracay)1953, 3:211-213.
Page 11 of 11(page number not for citation purposes)
Related Documents


