Divergent Routes to Oral Cancer Keith D. Hunter, 1,2 Johanna K. Thurlow, 1 Janis Fleming, 1 Paul J.H. Drake, 1 J. Keith Vass, 1 Gabriela Kalna, 3 Des J. Higham, 3 Pawel Herzyk, 4 D. Gordon MacDonald, 2 E. Ken Parkinson, 1 and Paul R. Harrison 1 1 The Beatson Institute for Cancer Research, 2 Oral Pathology, Glasgow Dental Hospital and School; 3 Department of Mathematics, University of Strathclyde; and 4 The Sir Henry Wellcome Functional Genomics Facility, Institute of Biomedical and Life Sciences, University of Glasgow, Glasgow, United Kingdom Abstract Most head and neck squamous cell carcinoma (HNSCC) patients present with late-stage cancers, which are difficult to treat. Therefore, early diagnosis of high-risk premalignant lesions and incipient cancers is important. HNSCC is currently perceived as a single progression mechanism, resulting in immortal invasive cancers. However, we have found that f40% of primary oral SCCs are mortal in culture, and these have a better prognosis. About 60% of oral premalignancies (dysplasias) are also mortal. The mortal and immortal tumors are generated in vivo as judged by p53 mutations and loss of p16 INK4A expression being found only in the original tumors from which the immortal cultures were derived. To investigate the relationships of dysplasias to SCCs, we did microarray analysis of primary cultures of 4 normal oral mucosa biopsies, 19 dysplasias, and 16 SCCs. Spectral clustering using the singular value decomposition and other bioinformatic techni- ques showed that development of mortal and immortal SCCs involves distinct transcriptional changes. Both SCC classes share most of the transcriptional changes found in their respective dysplasias but have additional changes. Moreover, high-risk dysplasias that subsequently progress to SCCs more closely resemble SCCs than nonprogressing dysplasias. This indicates for the first time that there are divergent mortal and immortal pathways for oral SCC development via inter- mediate dysplasias. We believe that this new information may lead to new ways of classifying HNSCC in relation to prognosis. (Cancer Res 2006; 66(15): 7405-13) Introduction Head and neck squamous cell carcinoma (HNSCC) patients often develop a series of premalignancies and SCCs over a number of years, many of which are genetically related, being derived by separate mutations within the same abnormal mucosal ‘‘field’’ altered by exposure to carcinogens or growth promoters in tobacco or alcohol (1, 2). Loss of heterozygosity (LOH) studies show that oral cancers develop from a field of altered mucosa that is polyclonal (1). However, most oral carcinomas are clonal (3), suggesting that carcinomas develop from earlier lesions by a succession of cumulative genetic changes (4). Second field or second primary cancers may subsequently develop, distinguishable from recurrences by their patterns of allele loss (1). Although most HNSCC patients present without prior diagnosis of premalignancy, two main types of premalignancy are well documented: leukoplakias (white patches) and erythroplakias (red patches). Erythroplakias are much more likely to show histologic features of dysplasia and progress to SCC (5). However, a major clinical problem is that there is no clear correlation between histologic grade of dysplasia and prognosis in individual cases. Various genetic and gene expression changes are found in oral dysplasias but single molecular markers do not have sufficient predictive power to identify high-risk lesions (6). The only previous gene expression profiling study of oral dysplasias did not address the question of progression (7). We have previously shown heterogeneity in HNSCCs and dysplasias with respect to their mortality/immortality status in culture, with f40% of HNSCCs (8, 9) and 60% of dysplasias being mortal (10, 11). This raises the question about whether there are separate routes for mortal and immortal HNSCC development via preceding mortal and immortal dysplasias. To test this idea, we have examined the gene expression relationships of mortal and immortal HNSCCs in relation to the various premalignant types, including high-risk dysplastic lesions that subsequently progressed to SCC. Materials and Methods Clinical samples. Ethical approval (with informed consent) was granted by the Glasgow Dental Hospital Area Ethics Committee (10MAR97/ AGN4vi) and the Edinburgh Dental Hospital Area Ethics Committee (before 1995). Cells and culture conditions. Details have previously been reported (8–11). Cells were freshly thawed from early passage stocks in DMEM medium containing 10% FCS, 0.4 Ag/mL hydrocortisone, 10 ng/mL cholera toxin, 5 Ag/mL insulin, 8 Ag/mL transferrin, 30 Ag/mL adenine, and 10 ng/mL epidermal growth factor. Cells were used at subconfluent densities after removal of feeders immediately before analysis. Microarray experiments and analysis. RNA was obtained with the RNeasy Total RNA Isolation Kit (Qiagen, Gatwick, Sussex, United Kingdom). Double-stranded cDNA made using the Superscript Double Stranded cDNA Synthesis Kit (Invitrogen, Inchinnan, Renfrewshire, United Kingdom) was labeled using the Enzo Bioarray High Yield Transcript Labelling Kit (Affymetrix, Abbington, Oxon, United Kingdom). Fragmented cRNAs were then hybridized to Affymetrix U133A&B chips by the Cancer Research UK Microarray Facility at the Paterson Institute for Cancer Research in Manchester, United Kingdom. Data were normalized using the RMAexpress method (12). Genes were analyzed further if classified as expressed in >5 of 80 samples by the Affymetrix MAS 5.0 software. Significant differences in gene expression were determined using the statistical analysis of microarrays software (SAM; TIGR open access Note: Figures 1-6, Supplementary Figures S1-S2 and Tables S1-S6 are available at http://www.beatson.gla.ac.uk/supplement/harrison. K.D. Hunter and J.K. Thurlow contributed equally to this work. Current address for E. Ken Parkinson: Centre for Clinical and Diagnostic Oral Sciences, Institute for Cell and Molecular Sciences, 4, Newark Street, London E1 2AT, United Kingdom. D.G. MacDonald, deceased December 12, 2005. Requests for reprints: Paul Harrison, The Beatson Institute for Cancer Research, Garscube Estate, Switchback Road, Bearsden, Glasgow G61 1BD, United Kingdom. Phone: 44-0-141-330-3975; Fax: 44-0-141-942-6521; E-mail: p.r.harrison@beatson. gla.ac.uk. I2006 American Association for Cancer Research. doi:10.1158/0008-5472.CAN-06-0186 www.aacrjournals.org 7405 Cancer Res 2006; 66: (15). August 1, 2006 Research Article Research. on February 16, 2016. © 2006 American Association for Cancer cancerres.aacrjournals.org Downloaded from

Welcome message from author
This document is posted to help you gain knowledge. Please leave a comment to let me know what you think about it! Share it to your friends and learn new things together.
Transcript
Divergent Routes to Oral Cancer
Keith D. Hunter,1,2
Johanna K. Thurlow,1Janis Fleming,
1Paul J.H. Drake,
1
J. Keith Vass,1Gabriela Kalna,
3Des J. Higham,
3Pawel Herzyk,
4
D. Gordon MacDonald,2E. Ken Parkinson,
1and Paul R. Harrison
1
1The Beatson Institute for Cancer Research, 2Oral Pathology, Glasgow Dental Hospital and School; 3Department of Mathematics,University of Strathclyde; and 4The Sir Henry Wellcome Functional Genomics Facility, Institute of Biomedical andLife Sciences, University of Glasgow, Glasgow, United Kingdom
Abstract
Most head and neck squamous cell carcinoma (HNSCC)patients present with late-stage cancers, which are difficultto treat. Therefore, early diagnosis of high-risk premalignantlesions and incipient cancers is important. HNSCC is currentlyperceived as a single progression mechanism, resulting inimmortal invasive cancers. However, we have found thatf40% of primary oral SCCs are mortal in culture, and thesehave a better prognosis. About 60% of oral premalignancies(dysplasias) are also mortal. The mortal and immortal tumorsare generated in vivo as judged by p53 mutations and loss ofp16INK4A expression being found only in the original tumorsfrom which the immortal cultures were derived. To investigatethe relationships of dysplasias to SCCs, we did microarrayanalysis of primary cultures of 4 normal oral mucosa biopsies,19 dysplasias, and 16 SCCs. Spectral clustering using thesingular value decomposition and other bioinformatic techni-ques showed that development of mortal and immortal SCCsinvolves distinct transcriptional changes. Both SCC classesshare most of the transcriptional changes found in theirrespective dysplasias but have additional changes. Moreover,high-risk dysplasias that subsequently progress to SCCs moreclosely resemble SCCs than nonprogressing dysplasias. Thisindicates for the first time that there are divergent mortaland immortal pathways for oral SCC development via inter-mediate dysplasias. We believe that this new information maylead to new ways of classifying HNSCC in relation to prognosis.(Cancer Res 2006; 66(15): 7405-13)
Introduction
Head and neck squamous cell carcinoma (HNSCC) patientsoften develop a series of premalignancies and SCCs over a numberof years, many of which are genetically related, being derived byseparate mutations within the same abnormal mucosal ‘‘field’’altered by exposure to carcinogens or growth promoters in tobaccoor alcohol (1, 2). Loss of heterozygosity (LOH) studies show thatoral cancers develop from a field of altered mucosa that is
polyclonal (1). However, most oral carcinomas are clonal (3),suggesting that carcinomas develop from earlier lesions by asuccession of cumulative genetic changes (4). Second field orsecond primary cancers may subsequently develop, distinguishablefrom recurrences by their patterns of allele loss (1).
Although most HNSCC patients present without prior diagnosisof premalignancy, two main types of premalignancy are welldocumented: leukoplakias (white patches) and erythroplakias (redpatches). Erythroplakias are much more likely to show histologicfeatures of dysplasia and progress to SCC (5). However, a majorclinical problem is that there is no clear correlation betweenhistologic grade of dysplasia and prognosis in individual cases.Various genetic and gene expression changes are found in oraldysplasias but single molecular markers do not have sufficientpredictive power to identify high-risk lesions (6). The only previousgene expression profiling study of oral dysplasias did not addressthe question of progression (7).
We have previously shown heterogeneity in HNSCCs anddysplasias with respect to their mortality/immortality status inculture, with f40% of HNSCCs (8, 9) and 60% of dysplasias beingmortal (10, 11). This raises the question about whether there areseparate routes for mortal and immortal HNSCC development viapreceding mortal and immortal dysplasias. To test this idea, we haveexamined the gene expression relationships of mortal and immortalHNSCCs in relation to the various premalignant types, includinghigh-risk dysplastic lesions that subsequently progressed to SCC.
Materials and Methods
Clinical samples. Ethical approval (with informed consent) was granted
by the Glasgow Dental Hospital Area Ethics Committee (10MAR97/
AGN4vi) and the Edinburgh Dental Hospital Area Ethics Committee
(before 1995).Cells and culture conditions. Details have previously been reported
(8–11). Cells were freshly thawed from early passage stocks in DMEM
medium containing 10% FCS, 0.4 Ag/mL hydrocortisone, 10 ng/mLcholera toxin, 5 Ag/mL insulin, 8 Ag/mL transferrin, 30 Ag/mL adenine,
and 10 ng/mL epidermal growth factor. Cells were used at subconfluent
densities after removal of feeders immediately before analysis.
Microarray experiments and analysis. RNA was obtained with theRNeasy Total RNA Isolation Kit (Qiagen, Gatwick, Sussex, United
Kingdom). Double-stranded cDNA made using the Superscript Double
Stranded cDNA Synthesis Kit (Invitrogen, Inchinnan, Renfrewshire, United
Kingdom) was labeled using the Enzo Bioarray High Yield TranscriptLabelling Kit (Affymetrix, Abbington, Oxon, United Kingdom). Fragmented
cRNAs were then hybridized to Affymetrix U133A&B chips by the Cancer
Research UK Microarray Facility at the Paterson Institute for CancerResearch in Manchester, United Kingdom. Data were normalized using the
RMAexpress method (12). Genes were analyzed further if classified as
expressed in >5 of 80 samples by the Affymetrix MAS 5.0 software.
Significant differences in gene expression were determined using thestatistical analysis of microarrays software (SAM; TIGR open access
Note: Figures 1-6, Supplementary Figures S1-S2 and Tables S1-S6 are available athttp://www.beatson.gla.ac.uk/supplement/harrison.
K.D. Hunter and J.K. Thurlow contributed equally to this work.Current address for E. Ken Parkinson: Centre for Clinical and Diagnostic Oral
Sciences, Institute for Cell and Molecular Sciences, 4, Newark Street, London E1 2AT,United Kingdom.
D.G. MacDonald, deceased December 12, 2005.Requests for reprints: Paul Harrison, The Beatson Institute for Cancer Research,
Garscube Estate, Switchback Road, Bearsden, Glasgow G61 1BD, United Kingdom.Phone: 44-0-141-330-3975; Fax: 44-0-141-942-6521; E-mail: [email protected].
I2006 American Association for Cancer Research.doi:10.1158/0008-5472.CAN-06-0186
www.aacrjournals.org 7405 Cancer Res 2006; 66: (15). August 1, 2006
Research Article
Research. on February 16, 2016. © 2006 American Association for Cancercancerres.aacrjournals.org Downloaded from

software TMEV), or by ANOVA, carried out in R-package.5 Rank Products
(13) and Iterative Group Analysis were also used to identify differentiallyexpressed gene classes (14) by the Sir Henry Wellcome Functional
Genomics Facility (http://www.gla.ac.uk/functionalgenomics/rp/affy_ana-
lysis.html). Spectral clustering using the singular decomposition value was
done as previously described (15, 16). If the expression data for M genesand N samples are arranged in an M � N matrix, with the element on the
ith row and jth column representing gene i in sample j , then the singular
decomposition value expresses this matrix as the product of three
matrices: an M � M orthogonal matrix, U; an M � N diagonal matrix, S(with nonnegative elements on the diagonal ordered from high to low);
and the transpose of an N � N orthogonal matrix, V. The columns of U
can be used to assign numerical values to the genes and the columns of V
can be used to assign numerical values to the samples. The first columns,U1 and V1, represent the overall background conditions and are not useful
for analysis. The second columns, U2 and V2, may be viewed as
partitioning the genes and samples, respectively, into clusters. Ifcomponents r and s of V2 are relatively close, then this means that
sample r and sample s are close. Similarly, V3 is another (orthogonal)
assignment of real values to samples that can be used to cluster. Hence,
samples that are close in this two-dimensional ordering can be viewed assimilar.
Quantitative reverse transcription-PCR. The Finnzymes DyNAmo
SYBR Green 2-Step qRT-PCR Kit (F-430 S/L) was used with the MJ
Research Chromo4 Detection System. cDNA was prepared using 1 AgmRNA, random hexamer primers, and M-MuLV RNase H+ reverse
transcriptase: primer extension, 10 minutes 25jC; cDNA synthesis,
30 minutes 37jC; termination, 5 minutes 85jC. One microliter of product
was subjected to 35 cycles of PCR using Thermus brockianus DNA
polymerase and SYBR Green: initial denaturation, 15 minutes 95jC;denaturation, 10 seconds 94jC; annealing, 30 seconds 58jC; extension,
30 seconds 72jC (in some cases followed by heating to 75jC for
12 seconds each cycle before plate reading). For characterization of the
PCR product, a final extension at 72jC was done for 10 minutes followedby a melting curve over 70jC to 95jC (1 second, 0.3jC steps). The size of
the reverse transcription-PCR (RT-PCR) product was determined after
reannealing for 10 minutes at 72jC. Triplicate samples, including minus-
reverse transcriptase and minus-template controls, were analyzed usingthe MJ Research Opticon 3.1 software. RNA levels were calculated relative
to glyceraldehyde-3-phosphate dehydrogenase (GAPDH), h-actin, and
RPLP0 RNAs using the Relative Expression Software Tool (REST; ref. 17).
Primers spanning intron-exon boundaries were designed using Perlprimersoftware with the following constraints: GC content of 40% to 60%;
exclusion of primers containing known genomic repeat sequences or runs
of four identical nucleotides; low probability of primer-dimer formation;screening for primer specificity using the National Center for Biotechnology
Information Blast server. The primers used were GAPDH F 5¶-AAGGCT-GAGAACGGGAAGCTTGTC-3¶, R 5¶-AGCCCCAGCCTTCTCCATGGTGGT-3¶;b-actin F 5¶-AAGATCAAGATCATTGCTCCTCCT-3¶, R 5¶-TCATAGTCCGCC-TAGAAGCA-3¶; CES2 F 5¶-TTAACAAGCCTTTCAAGATGATCCC-3¶, R
5¶-CCAAATGTAGGAGGCAACATCAG-3¶; HES2 F 5¶-CTCATTTCGGAC-CTCGGTT-3¶, R 5¶-TTCGAGCAGTTGGAGTTCT-3¶; ITGAV F 5¶-TAACCAAT-TAGCAACTCGGAC-3¶, R 5¶-ACACATCTGCATAATCATCTCC-3¶; ITGB6 F5¶-CGGCTTTCCAAAGAGATGTC-3¶, R 5¶-GAAGTATGGAATACTACTG-CAAGG-3¶; KLK10 F 5¶-AGCTGATCCAGATGTTATGCTC-3¶, R 5¶-AAACCT-TTGCCACCACTTCC-3¶; MMP9 F 5¶-TCACTTTCCTGGGTAAGGAG-3¶, R5¶-GAACAAACTGTATCCTTGGTC-3¶; DTL F 5¶-TGGCCTAGTAACAG-TAACGA-3¶, R 5¶-AGTATTTGAAGGAAGAGGGAG-3¶; RPLP0 F 5¶-GAAG-GCTGTGGTGCTGATGG-3¶; R 5¶-CCGGATATGAGGCAGCAGTT-3¶;SAT F5 E. Wit and J.K. Vass, unpublished data.
Figure 1. Expression of p53 and p16INK4A
in dysplasia cultures and matchedbiopsies from which they were derived.A, expression of p53 and p16INK4A proteinsmeasured by immunohistochemistry indysplasia biopsies D30 and D47 thatgenerated mortal cultures and dysplasiabiopsies D20 and D34 that generatedimmortal cultures. All photographs weretaken at �10 magnification. B, expressionof p16INK4A mRNA in two dysplasias thatwere mortal in culture (D41 and D48),two dysplasias that were immortal (D4 andD19), and the two dysplasias with atypicalp16INK4A and p53 status (D17 and D38;see text for details). p16INK4A mRNA wasmeasured by RT-PCR using exon 1aprimers specific to p16INK4A. As a control,the levels of GAPDH mRNA weremeasured in the same samples byRT-PCR. Representative of twoexperiments.
Cancer Research
Cancer Res 2006; 66: (15). August 1, 2006 7406 www.aacrjournals.org
Research. on February 16, 2016. © 2006 American Association for Cancercancerres.aacrjournals.org Downloaded from
5¶-GATTATAGAGGCTTTGGCATAGG-3¶, R 5¶-CTTGTCGATCTTGAA-CAGTCTC-3¶.TGFB2 F 5¶-ACTTTCTACAGACCCTACTTCAG-3¶, R 5¶-AGGTT-CCTGTCTTTATGGTG-3¶; and ZIC2 F 5¶-GTTCCAGTGTGAGTTTGAGG-3¶,R 5¶-GACTCATGGACCTTCATGTG-3¶.
Antibodies. Western blotting was done as described (11, 18).
Immunohistochemistry was done by standard procedures. Primary
antibodies used were BIRC5 (Abcam, Cambridge, United Kingdom),
CCNB1 (NeoMarkers, Lab Vision, Newmarket, Middlesex, United Kingdom),CDC2 (Santa Cruz Biotechnology, Insight Biotechnology, Wembley, United
Kingdom), ECT2 (Santa Cruz Biotechnology), HMMR (Dr. Volker Assmann,
University Hospital, Hamburg, Germany), IGFBP2 (Santa Cruz Biotechnol-
ogy), IVL (Sigma, Poole, Dorset, United Kingdom), p16INK4A (Santa CruzBiotechnology), LAP2/TMPO (Abcam), p38 (Cell Signaling, New England
Biolabs, Hitchin, Hertfordshire, United Kingdom), p53 (Santa Cruz
Biotechnology), S100A9 (Santa Cruz Biotechnology), S100P (BD Transduc-tion Laboratories, Becton and Dixon, Cowley, Oxford, United Kingdom),
SMC4L1 (Upstate, MSC/ALPLAB, Newton Abbey, County Antrim, Northern
Ireland), STK6 (Abcam), and UBE2C (Abcam). Sodium citrate was used for
antigen retrieval; Vectastain ABC kit (p53) or Immpress (p16INK4A; VectorLaboratories, Burlingame, CA) kit was used for staining.
Results
Clinical characteristics of tumors. Virtually all the biopsieswere from oral cavity sites (Supplementary Table S1). Erythropla-kias E2, E4, and E5 either had adjacent malignancy present atdiagnosis or developed malignancy at the same site subsequently(19); the outcome of erythroplakia E1 is unavailable. Two ‘‘mixed’’erythroleukoplakias (D19 and D35) also developed SCCs at thesame sites whereas only 1 of 13 of the leukoplakias progressed(D20). None of the 15 SCC cultures or the 16 cultures from
dysplastic lesions (‘‘dysplasia cultures’’) contained human papillo-mavirus (HPV)-16 or HPV18 E6/E7 DNA (by PCR techniquessensitive down to f0.5 copies per cell) (8, 19).6 This probablyreflects the fact that only one biopsy was from pharynx, which ismost commonly associated with HPV infection (20).
SCC and dysplasia cultures. All cultures were isolated andmaintained using the 3T3 feeder layer method, which supportsgrowth of epithelial cells at all stages of cancer progression and isbelieved to maintain in vivo characteristics of tumors (21). Overall,9 of 16 primary SCCs and 7 of 19 dysplasias were immortal inculture (9–11). All three cultures of SCC recurrences wereimmortal, as were two of three cultures from metastases. Thesingle mortal metastasis failed to generate an immortal culturedespite multiple attempts (9).
Immortal SCCs and dysplasias are generated in vivo . Thep53 mutations found in our immortal SCC cell lines were detectedin the original tumors in vivo (8); this is also the case for all fiveimmortal dysplasia biopsies tested using laser capture micro-dissected material (data not shown). Immortal dysplasias showexpression of p53 protein in the suprabasal layers in vivo , whereasin mortal dysplasias p53 expression is restricted to the basal layer(Fig. 1). Seven of eight of our mortal dysplasias express p16INK4A
whereas six of seven immortal dysplasia cultures do not (10, 11).We have now shown that these differences also occur in vivo inthe biopsies from which the cultures were derived (Fig. 1). Two
6 K.D. Hunter, J.K. Thurlow, J. Fleming, P.J.H. Drake, J.K. Vass, G. Kalna, D.J. Higham,P. Herzyk, D.G. MacDonald, E.K. Parkinson, P.R. Harrison, J. Brown, E. Wagner,unpublished data.
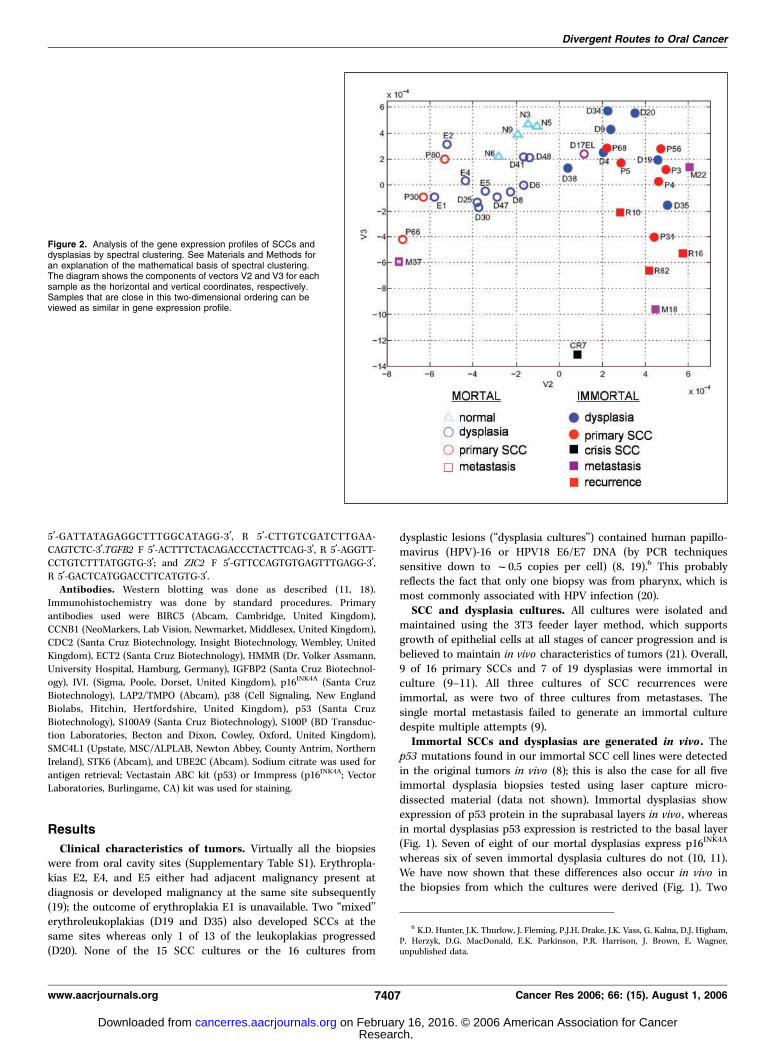
Figure 2. Analysis of the gene expression profiles of SCCs anddysplasias by spectral clustering. See Materials and Methods foran explanation of the mathematical basis of spectral clustering.The diagram shows the components of vectors V2 and V3 for eachsample as the horizontal and vertical coordinates, respectively.Samples that are close in this two-dimensional ordering can beviewed as similar in gene expression profile.
Divergent Routes to Oral Cancer
www.aacrjournals.org 7407 Cancer Res 2006; 66: (15). August 1, 2006
Research. on February 16, 2016. © 2006 American Association for Cancercancerres.aacrjournals.org Downloaded from
dysplasia cultures with atypical p16INK4A expression patterns(10, 11) also have the same phenotypes in vivo ; the extended-life-span D17 dysplasia lacks expression of p16INK4A whereas theimmortal dysplasia D38 continues to express p16INK4A (Fig. 1B).
Gene expression profiling of HNSCCs and dysplasias. Thegene expression data for 16 SCC, 19 dysplasia, and 4 normalmucosa cultures were analyzed by ‘‘spectral clustering,’’ which is auseful and sensitive tool for analyzing complex microarray data.For example, it correctly classifies the three subtypes of leukemia(15, 16) and the known lymphoma, breast, and brain cancersubtypes (15, 22). This method resolves the gene expression datafor all the genes in each of the samples as a series of componentvectors, of which V2 and V3 are the most useful in the presentcontext (see Materials and Methods). The principle is that samplesthat are close in this two-dimensional ordering can be viewed assimilar in overall gene expression profile.
Because the differences between duplicate cultures wereminimal in comparison with differences between cultures fromdifferent biopsies, for clarity, Fig. 2 gives spectral clustering analysisusing the mean expression levels of the duplicate cultures. Thisshows major distinctions between mortal and immortal SCCs andnormal mucosa, principally by vector 2. However, within theimmortal SCC group, the three recurrences and one of the twometastases cluster somewhat separately on vector 3 from the maingroup of primary SCCs. The SCC BICR7 culture (P7) that is in ‘‘M2/crisis’’ (23) differs substantially from all the other SCCs.
The mortal and immortal dysplasias cluster as heterogeneousgroups overlapping the mortal and immortal SCC groups,respectively (Fig. 2). The only samples that cluster between themain mortal and immortal groups are the two dysplasias, D17ELand D38, with atypical p53 status and p16INK4A expression patternsreferred to previously (Fig. 1). Within the mortal dysplasia group,three of the four erythroplakias (especially E1 and E2) clusterseparately from the nonprogressing mortal dysplasias and closest tothe mortal SCCs (Fig. 2). Similarly, the three immortal dysplasiasthat progressed, D19, D20, and D35, cluster closest to immortalSCCs on vector 2 (Fig. 2). Heterogeneity in tumor site locations isunlikely to significantly complicate the analysis because all sampleswere from oral sites, except for three from larynx (B30, B80, andM18). Moreover, spectral clustering relationships of normal mucosa,dysplasia, and SCC cultures are little affected when the three non-oral (laryngeal) samples are removed (Supplementary Fig. S1).
Furthermore, the mortal/immortal gene expression clusteringpatterns do not correlate with smoking status. The only normalmucosa sample from a smoker (N9) clusters within the other normalmucosa cultures from nonsmokers. Virtually all of the mortal andimmortal SCCs were obtained from smokers. Of the dysplasiapatients for which information is available, one of eight mortaldysplasias was from a nonsmoker (D41) and another was from alight smoker (D48) whereas four of seven immortal dysplasias werefrom nonsmokers (D9, D34, D38, and D20). Moreover, mortaldysplasia D41 and immortal dysplasia D38 arose concurrently in thesame patient (a nonsmoker), both in the lateral tongue.
Gene expression differences between mortal and immortalSCCs. Using various statistical methods, SAM, ANOVA, and rankproducts, there are surprisingly few gene expression changes sharedduring the development of both mortal and immortal SCCs(Fig. 3A ; Supplementary Table S2). Iterative Group Analysis showsthat the Gene Ontology–based signatures of mortal and immortalSCC cultures are significantly different, with increases in mitosisand DNA replication categories in immortal SCCs, in contrast to
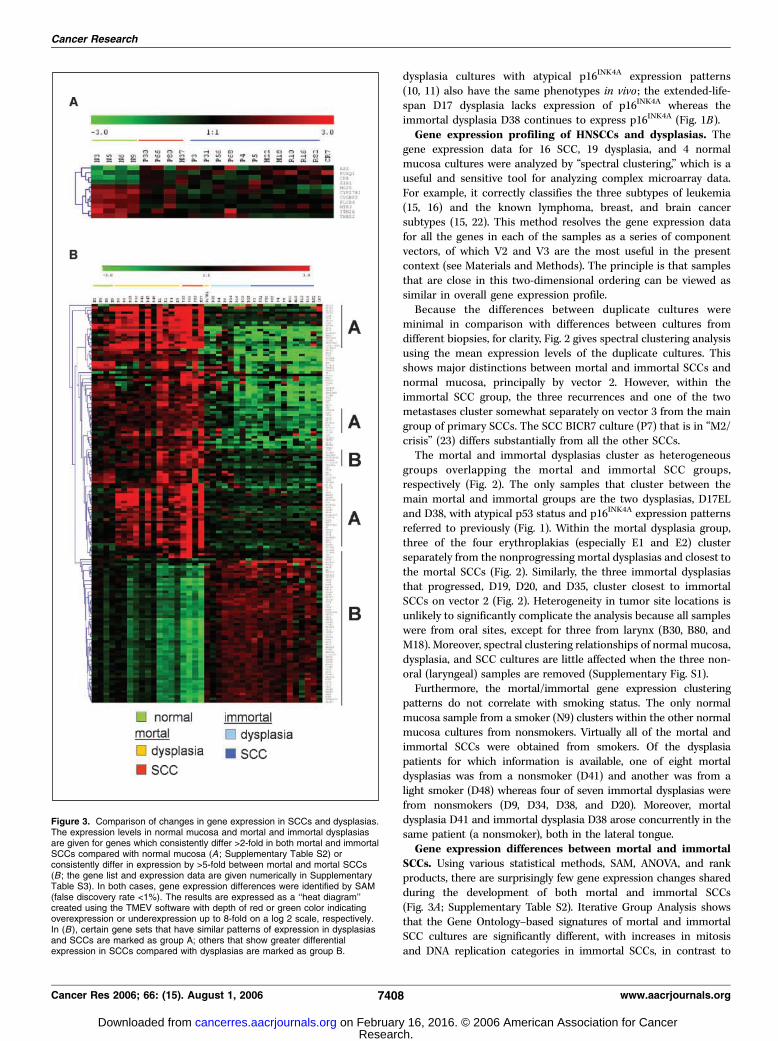
Figure 3. Comparison of changes in gene expression in SCCs and dysplasias.The expression levels in normal mucosa and mortal and immortal dysplasiasare given for genes which consistently differ >2-fold in both mortal and immortalSCCs compared with normal mucosa (A ; Supplementary Table S2) orconsistently differ in expression by >5-fold between mortal and mortal SCCs(B ; the gene list and expression data are given numerically in SupplementaryTable S3). In both cases, gene expression differences were identified by SAM(false discovery rate <1%). The results are expressed as a ‘‘heat diagram’’created using the TMEV software with depth of red or green color indicatingoverexpression or underexpression up to 8-fold on a log 2 scale, respectively.In (B ), certain gene sets that have similar patterns of expression in dysplasiasand SCCs are marked as group A; others that show greater differentialexpression in SCCs compared with dysplasias are marked as group B.
Cancer Research
Cancer Res 2006; 66: (15). August 1, 2006 7408 www.aacrjournals.org
Research. on February 16, 2016. © 2006 American Association for Cancercancerres.aacrjournals.org Downloaded from
increases in extracellular matrix and collagen catabolism categoriesin mortal SCCs. Gene expression differences >5-fold between mortaland immortal SCCs by SAM analysis ( false discovery rate <1%) areillustrated in Fig. 3B and Supplementary Table S3. Immortal SCCsshow increased expression of genes encoding several cell cycleregulators, compared with mortal SCCs (e.g., CCNA2, CCNB1,CCNB2; CDC2, CDC6, CDC20, CDCA7; CDKN3; several MCMs;PCNA; BIRC5), but reduced expression of genes encoding terminaldifferentiation markers [e.g., several keratins (KRT), involucrin (IVL),and the family of small proline-rich proteins (SPRR)], as well as theS100 family of calcium-binding motility proteins and variouskallikreins (KLK; Supplementary Table S3). In contrast, a variety ofadhesion, invasion, and extracellular matrix proteins are up-regulated in mortal SCCs [e.g., CEACAMs, fibronectin (FN1),integrins, metalloproteinases (MMP), periostin (POSTN)], as wellas various chemokines (CXCLs, CCL20, and IL-8) and TGF-h(TGFB2; Supplementary Table S3). Some gene expression changesdistinguish all mortal and immortal cultures (whether dysplasiasor SCCs; Supplementary Table S4).
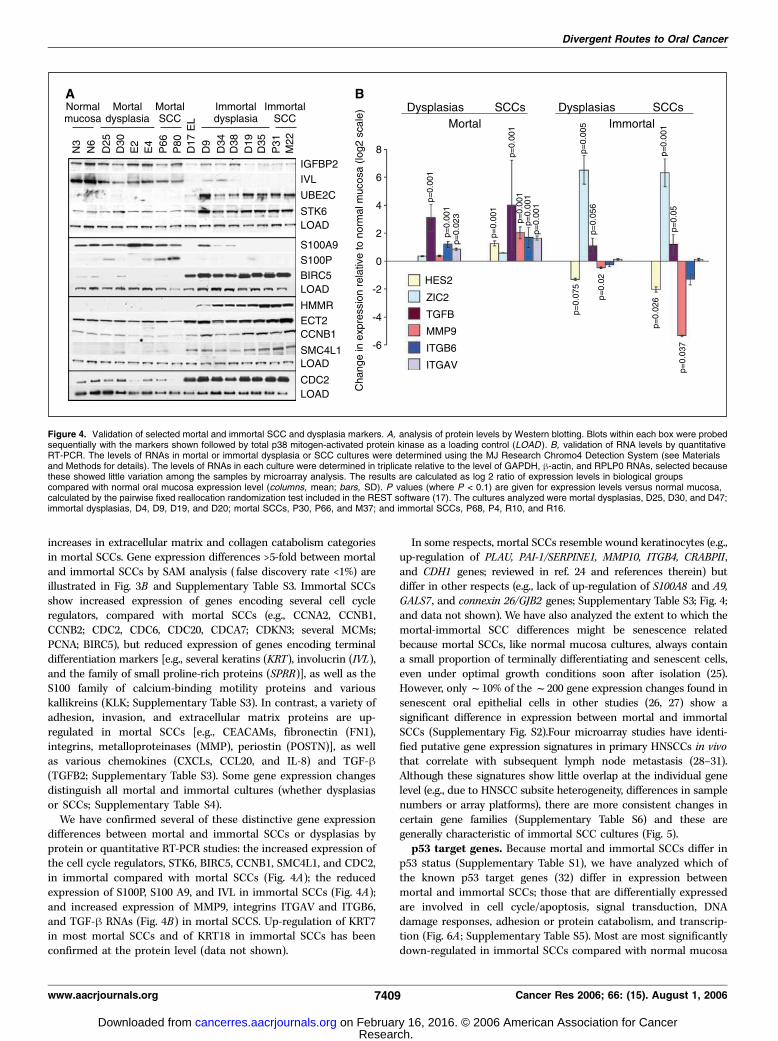
We have confirmed several of these distinctive gene expressiondifferences between mortal and immortal SCCs or dysplasias byprotein or quantitative RT-PCR studies: the increased expression ofthe cell cycle regulators, STK6, BIRC5, CCNB1, SMC4L1, and CDC2,in immortal compared with mortal SCCs (Fig. 4A); the reducedexpression of S100P, S100 A9, and IVL in immortal SCCs (Fig. 4A);and increased expression of MMP9, integrins ITGAV and ITGB6,and TGF-h RNAs (Fig. 4B) in mortal SCCS. Up-regulation of KRT7in most mortal SCCs and of KRT18 in immortal SCCs has beenconfirmed at the protein level (data not shown).
In some respects, mortal SCCs resemble wound keratinocytes (e.g.,up-regulation of PLAU, PAI-1/SERPINE1, MMP10, ITGB4, CRABPII,and CDH1 genes; reviewed in ref. 24 and references therein) butdiffer in other respects (e.g., lack of up-regulation of S100A8 and A9,GALS7, and connexin 26/GJB2 genes; Supplementary Table S3; Fig. 4;and data not shown). We have also analyzed the extent to which themortal-immortal SCC differences might be senescence relatedbecause mortal SCCs, like normal mucosa cultures, always containa small proportion of terminally differentiating and senescent cells,even under optimal growth conditions soon after isolation (25).However, only f10% of the f200 gene expression changes found insenescent oral epithelial cells in other studies (26, 27) show asignificant difference in expression between mortal and immortalSCCs (Supplementary Fig. S2).Four microarray studies have identi-fied putative gene expression signatures in primary HNSCCs in vivothat correlate with subsequent lymph node metastasis (28–31).Although these signatures show little overlap at the individual genelevel (e.g., due to HNSCC subsite heterogeneity, differences in samplenumbers or array platforms), there are more consistent changes incertain gene families (Supplementary Table S6) and these aregenerally characteristic of immortal SCC cultures (Fig. 5).
p53 target genes. Because mortal and immortal SCCs differ inp53 status (Supplementary Table S1), we have analyzed which ofthe known p53 target genes (32) differ in expression betweenmortal and immortal SCCs; those that are differentially expressedare involved in cell cycle/apoptosis, signal transduction, DNAdamage responses, adhesion or protein catabolism, and transcrip-tion (Fig. 6A ; Supplementary Table S5). Most are most significantlydown-regulated in immortal SCCs compared with normal mucosa
Figure 4. Validation of selected mortal and immortal SCC and dysplasia markers. A, analysis of protein levels by Western blotting. Blots within each box were probedsequentially with the markers shown followed by total p38 mitogen-activated protein kinase as a loading control (LOAD ). B, validation of RNA levels by quantitativeRT-PCR. The levels of RNAs in mortal or immortal dysplasia or SCC cultures were determined using the MJ Research Chromo4 Detection System (see Materialsand Methods for details). The levels of RNAs in each culture were determined in triplicate relative to the level of GAPDH, h-actin, and RPLP0 RNAs, selected becausethese showed little variation among the samples by microarray analysis. The results are calculated as log 2 ratio of expression levels in biological groupscompared with normal oral mucosa expression level (columns, mean; bars, SD). P values (where P < 0.1) are given for expression levels versus normal mucosa,calculated by the pairwise fixed reallocation randomization test included in the REST software (17). The cultures analyzed were mortal dysplasias, D25, D30, and D47;immortal dysplasias, D4, D9, D19, and D20; mortal SCCs, P30, P66, and M37; and immortal SCCs, P68, P4, R10, and R16.
Divergent Routes to Oral Cancer
www.aacrjournals.org 7409 Cancer Res 2006; 66: (15). August 1, 2006
Research. on February 16, 2016. © 2006 American Association for Cancercancerres.aacrjournals.org Downloaded from

or mortal SCCs (CCNG2, CDKN1A, TGFA, TRIM22, RRAD, CALD1,RPS27L, and HIG1) but MSH6 and MYBL1 are up-regulated. Thus,these changes correlate with the wild-type or mutant p53 statusof the mortal and immortal SCCs, respectively (SupplementaryTable S1). However, some genes (e.g., BCL2AP1, COL4A1 , and VIM)are up-regulated mainly in mortal SCCs and must therefore be dueto other transcription factor changes.
Two other transcription factors that consistently differ inexpression between mortal and immortal SCCs in the microarraydata are ZIC2 and HES2 (Supplementary Table S3), and this hasbeen confirmed by qRT-PCR (Fig. 4B). ZIC2 is a member of the ZICfamily of Cys2-His2 zinc finger transcription factors whereas HES2is a member of the family of bHLH transcriptional repressors. Thisassociation of ZIC2 and HES2 with immortality is novel.
Mortal and immortal SCCs share most of the transcriptionalchanges found in their respective dysplasias but haveadditional changes. SAM ( false discovery rate <1%) shows that80% of the >2-fold gene expression differences between immortaldysplasias and normal mucosa are retained in immortal SCCs;similarly, 60% of the changes in mortal dysplasias are retained inmortal SCCs. This is also illustrated in Fig. 3B where many of thelargest gene expression differences found between mortal andimmortal SCCs (>5-fold) are already established at the dysplasiastage (e.g., groups marked A). Several of these changes have been
confirmed at the protein level or by quantitative RT-PCR: UBE2C,STK6, S100P, BIRC5, HMMR, ECT2, CCNB1, SMCL1, and CDC2(Fig. 4A) and Zic2, TGFB, ITGAV, and ITGB6 (Fig. 4B).
However, other gene expression changes found in SCCs are lessmarked in dysplasias (e.g., group B, Fig. 3B). Examples of this type thathave been confirmed at the protein or RNA levels include the down-regulation of IGFBP2, IVL, and S100A9 (Fig. 4A) and HES2 (Fig. 4B) inimmortal SCCs; and the up-regulation of spermidine acetyltransfer-ase (SAT) or the down-regulation of the nuclear matrix-associatedprotein, DTL/RAMP, in mortal SCCs (Fig. 6). Other changes occurprincipally only in high-risk dysplasias and the corresponding SCCs[e.g., the down-regulation of kallikrein 10 (KLK10) and carboxylester-ase 2 (CES2) in immortal SCCs and high-risk dysplasias D19, D20,and D35; Fig. 6B]. Interestingly, some of the gene expression changescharacteristic of poor-prognosis HNSCCs in vivo and immortal SCCcultures are also found in the three immortal dysplasias thatsubsequently progressed (D19, D20, and D35; e.g., group A, Fig. 5).This strongly suggests that oral SCCs can develop via low-risk andhigh-risk dysplasias within distinct mortal and immortal pathways.
Discussion
The existence of mortal and immortal dysplasias and SCCsin vivo. Our work indicates that f40% of oral SCCs can develop
Figure 5. Expression of in vivopoor-prognosis HNSCC markers in culturesof normal mucosa, low-risk and high-riskdysplasias, and SCCs. The microarrayexpression levels are given for the mostconsistent in vivo gene expression changesin primary HNSCCs associated in theliterature with lymph node metastasis (seeSupplementary Table S6A ). The data areexpressed as a ‘‘heat map’’ as in Fig. 3.Top and bottom , data for genes that areup-regulated or down-regulated in vivo inpoor-prognosis HNSCCs, respectively. Theactual expression levels are given inSupplementary Table S6B . Where thesegenes show differences in expression in thecultures, most in vivo up-regulated anddown-regulated genes show a similarpattern in immortal SCCs, except for serpinB1 and serpin E1 (group B). Group Adenotes a group of genes that aredown-regulated in immortal SCCs andhigh-risk immortal dysplasias compared withlow-risk immortal dysplasias (KRT13,KRT16, S100A8, S100A9, GJB2, PRSS,KLK7, KLK10, and TRIM22).
Cancer Research
Cancer Res 2006; 66: (15). August 1, 2006 7410 www.aacrjournals.org
Research. on February 16, 2016. © 2006 American Association for Cancercancerres.aacrjournals.org Downloaded from

without acquiring immortality. Whereas our immortal SCC celllines frequently show aneuploidy and LOH at several sitesalso found in SCCs in vivo , such allele loss is rare in mortalSCC cultures, although they may have abnormal modal chromo-some numbers (9). Our data for p53 status and p16INK4A expres-sion in cultures and biopsies of origin show that the geneticdifferences responsible for immortality are established in vivobefore culture. This adds considerable weight to recent evidencethat senescence operates in vivo as well as in vitro (reviewedin ref. 33).
Because mortal neoplastic cells show no LOH using conventionaltechniques (9, 34), it is unlikely that they would have been detectedin the in vivo allele loss studies previously published. Therefore,it remains to be clarified whether mortal and immortal SCCscoexist within the same tumor in vivo . Our previous evidenceshows that neoplastic mortal and immortal cells are geneticallyvery distinct (9–11) with only limited evidence of late conversionfrom the mortal to the immortal state (23). For example, we
were never able to generate an immortal culture from one ‘‘mortal’’SCC (M37) despite multiple attempts (9) and cultures of tworegions of an ‘‘immortal’’ SCC (P56) were both immortal. Moreover,mortal dysplasia D41 and immortal dysplasia D38 both aroseconcurrently in the lateral tongue of same patient. This is allconsistent with our current data supporting the idea that mortaland immortal tumors progress along independent pathways.
Prognosis of mortal and immortal SCCs. We have 10- to 12-year follow-up data for 18 of our SCC patients. Six of 12 patientswith immortal SCCs died during this period from recurrence ofcancer and two from other causes. In contrast, none of the sixpatients with mortal SCCs died from cancer during the sameperiod but two died from other causes; this survival difference islikely to be significant (P = 0.054, Fisher’s exact test). Furthermore,we have shown that the in vivo gene expression profiles of poor-prognosis HNSCCs that subsequently metastasize tend to resemblethose of immortal, rather than mortal, SCC cultures (Fig. 5).Esophageal SCCs that are immortal in culture also have poorer
Figure 6. Consistent differences in geneexpression between biological groups.A, p53 target genes. The mean normalizedmicroarray expression levels for the listedgenes for the different biological groups aregiven (in the case of VIM, reduced by afactor of 10). The microarray data given arefor p53 target genes (32) where thedifferences between groups are >1.7-foldand significant at the P < 0.05 level byANOVA; the microarray expression levelsfor all p53 target genes (32) are given inSupplementary Table S5. Mortal SCCshave normal levels of expression of p53protein whereas immortal SCCs (primariesand recurrences) have mutant p53 (seeSupplementary Table S1 for details).Key for significant expression differences(P < 0.05): 1 , immortal SCCs versusnormal mucosa; 2 , mortal SCCs versusnormal mucosa; 3 , mortal versus immortalSCCs. B, expression of genes in low-riskand high-risk dysplasias and SCCs byquantitative RT-PCR. The relativeexpression levels are given as log 2 ratios(see Fig. 4B for details). P values (whereP < 0.1) are given for expression levelsversus normal mucosa (see Fig. 4B ).
Divergent Routes to Oral Cancer
www.aacrjournals.org 7411 Cancer Res 2006; 66: (15). August 1, 2006
Research. on February 16, 2016. © 2006 American Association for Cancercancerres.aacrjournals.org Downloaded from
survival (35). Many HNSCC studies have reported an associationbetween p53 mutations and poor prognosis (reviewed in ref. 36).Thus, mortal SCCs that develop without p53 mutations may have abetter prognosis because their proliferative life span has beenalmost ‘‘exhausted’’ during the course of their development intoclinically detectable tumors, so that they cannot reestablish aftersurgery/treatment unless they become immortal. However, thepossibility that mortal SCCs possess a small stem cell populationthat is immortal in vivo cannot be ruled out.
Chemokine differences between mortal and immortalSCCs. Mortal SCCs and some mortal dysplasias overexpressTGF-h RNA, in contrast to immortal SCCs and dysplasias (Fig.4B). TGF-h inhibits growth of normal epithelial cells whereas itstimulates invasion of SCCs (37). The majority of immortalHNSCC lines are sensitive to growth inhibition by TGF-h1 (38)but resistant lines behave more aggressively when transplantedorthotopically into athymic mice (39). Mortal SCC cultures alsoexpress a variety of chemokines in culture, such as IL-8, CXCL5,CXCL6, CXCL7, and CCL20, in contrast to immortal SCCs. TheseCXCL family members are involved in leukocyte infiltration,metastasis, and neovascularization of tumors (40). Peritumorallymphocytic infiltration is associated with a better prognosis inother HNSCC studies (41).
Transcriptional regulation of the immortal phenotype. Wehave shown previously that, with very few exceptions, loss ofexpression of RAR-b and p53 gene mutations is consistentlyassociated with dysplasia/SCC immortality in culture (9–11, 18).p53 mediates the senescence of cells in response to DNA strandbreaks created by dysfunctional telomeres and mitotic stress (42).We have now identified differences in the expression of asubgroup of p53 targets between mortal and immortal SCCswhich correlate with p53 mutation status (Fig. 6A). However, afew p53 target genes are more highly expressed in mortal SCCsthan in normal mucosa; because mortal SCCs have normal levelsof p53, we presume that this is due to differences in othertranscription factors.
Many of the cell cycle regulators that are more highly expressedin immortal dysplasias and SCCs (Fig. 4; Tables S2 and S3) areknown E2F target genes (e.g., CDC2, CDC6, CKS1, CDC25B, CCNA,TTK, TK, BUB1, PLK, PCNA, SMC4L1, TOP2A, BIRC5/survivin ;ref. 43). Their overexpression in immortal cells may therefore bedue to release of inhibition of RB-mediated-E2F family members byloss or inactivation of p16INK4A in immortal dysplasias and SCCs(10, 11, 44).
We have now identified other transcription factors that areassociated with immortality, such as down-regulation of HES2mRNA and up-regulation of ZIC2 RNA (Fig. 4B). HES familymembers are well established targets of Notch signaling involvedin intestinal epithelium homeostasis in humans. HES familymembers per se have not yet been implicated in keratinocytebiology, but Notch 1 has been implicated as a tumor suppressorin mouse skin (45) and keratinocyte-specific deletion of Notch1in mice results in epidermal hyperplasia (46). Thus, it may besignificant that Notch3 is down-regulated in immortal SCCs in ourmicroarray experiments (data not shown). ZIC family membersare implicated in control of development but ZIC2 also seems tohave a role in tumorigenesis because it has been identified as atumor antigen in small-cell lung cancer (47) and esophageal SCC(48). We are currently investigating whether manipulating theexpression of HES2 and ZIC2 in mortal or immortal dysplasiasand SCCs affects their life span.
Relationships of SCCs to dysplasias: evidence of divergentroutes to oral malignancy. Our work shows that mortal andimmortal SCCs share most of the transcriptional changes found inmortal and immortal dysplasias but have additional changes.Moreover, high-risk dysplasias that subsequently progress to SCCsmore closely resemble SCCs than nonprogressing dysplasias. Thefact that we can identify these gene expression relationships inunselected dysplasias and SCCs adds to their significance. Thus,mortal and immortal SCCs seem to follow divergent routes ofprogression, one of which is linked to multiple sites of LOH and theother not (9). This suggests that not all oral SCCs develop as asequential accumulation of genetic changes as is commonlyperceived (4). Although we have noticed rare examples ofdysplasias (D17 and D38) and SCCs (BICR7) that are apparentlyintermediate between the mortal and immortal state (10, 11,18, 23), most dysplasias and carcinomas seem to belong to eitherthe mortal or immortal class at diagnosis. The subclassification oforal SCCs described here may have clinical relevance in the futurebecause the different tumor classes may need different therapeuticapproaches.
Our spectral clustering analysis seems to be able to distinguishthe high-risk dysplasias within the subsets of mortal and immortaldysplasias, at least in primary culture. We have been able to identifysome gene expression changes that seem to be characteristic ofthe high-risk mortal or immortal dysplasias available in our study(Figs. 5 and 6B). KLK10 is a member of the kallikrein family oftrypsin-like serine proteases that is down-regulated in a subset ofbreast, prostate, and testicular cancers, although up-regulated inovarian, colon, and pancreatic cancers (reviewed in ref. 49). CES2 iscommonly expressed in tumor tissue and is involved in theactivation of irinotecan, a chemotherapy agent (50). These studiesmake a strong case for further larger-scale in vivo studies toidentify the genetic and gene expression changes associated withdysplasia progression by the mortal and immortal pathways. Theonly previous in vivo gene expression profiling study found that,by hierarchical clustering or principal component analysis, sixmoderate to severe dysplasias clustered close to the group of sevenSCCs, whereas a hyperplasia and a mild focal dysplasia clusteredwith the contralateral unaffected mucosa samples (7). However,no erythroplakias were included in this study nor was thereinformation about whether any of the leukoplakias progressed.Lack of frozen material from the biopsies from which our dysplasiacultures were originally derived precluded an in vivo gene expres-sion profiling in the present study, but long-term prospectivestudies are in progress.
Acknowledgments
Received 1/18/2006; revised 3/29/2006; accepted 5/31/2006.Grant support: Cancer Research UK (J.K. Thurlow, J. Fleming, P.J.H. Drake, J.K.
Vass, E.K. Parkinson, and P.R. Harrison); University of Glasgow (K.D. Hunter, D.G.MacDonald, and P. Herzyk); and Strathclyde University and Engineering and PhysicalScience Research Council grant gr/s62383/01 (G. Kalna and D.J. Higham).
The costs of publication of this article were defrayed in part by the payment of pagecharges. This article must therefore be hereby marked advertisement in accordancewith 18 U.S.C. Section 1734 solely to indicate this fact.
We thank our clinical colleagues, Dr. D. Felix (Glasgow Dental School andHospital), D. Soutar [Plastic Surgery (Canniesburn) Unit, Glasgow RoyalInfirmary], L. Clark (Victoria Hospital, Glasgow, United Kingdom), and RoyMitchell (while at City Hospital, Edinburgh, United Kingdom), for provision ofbiopsies; Dr. V. Assmann (University of Hamburg, Hamburg, Germany) for theanti-HMMR antibody; Prof. Brad Ozanne for his critical interest throughout theproject; and Prof. Dave Gillespie, Prof. Margaret Frame, Prof. Robert Brown, Dr.Kevin Ryan, and Dr. Karin Oien (all at the Beatson Laboratories in Glasgow) andProf. Nalin Thakker (University of Manchester) for valuable comments on themanuscript.
Cancer Research
Cancer Res 2006; 66: (15). August 1, 2006 7412 www.aacrjournals.org
Research. on February 16, 2016. © 2006 American Association for Cancercancerres.aacrjournals.org Downloaded from
Divergent Routes to Oral Cancer
www.aacrjournals.org 7413 Cancer Res 2006; 66: (15). August 1, 2006
References1. Braakhuis BJ, Tabor MP, Kummer JA, Leemans CR,Brakenhoff RH. A genetic explanation of Slaughter’sconcept of field cancerization: evidence and clinicalimplications. Cancer Res 2003;63:1727–30.
2. Mao L, Hong WK, Papadimitrakopoulou VA. Focus onhead and neck cancer. Cancer Cell 2004;5:311–6.
3. Bedi GC, Westra WH, Gabrielson E, Koch W, SidranskyD. Multiple head and neck tumors: evidence for acommon clonal origin. Cancer Res 1996;56:2484–7.
4. Califano J, van der Riet P, Westra W, et al. Geneticprogression model for head and neck cancer:implications for field cancerization. Cancer Res 1996;56:2488–92.
5. Reichart PA, Philipsen HP. Oral erythroplakia—areview. Oral Oncol 2005;41:551–61.
6. Hunter KD, Parkinson EK, Harrison PR. Profiling earlyhead and neck cancer. Nat Rev Cancer 2005;5:127–35.
7. Ha PK, Benoit NE, Yochem R, et al. A transcriptionalprogression model for head and neck cancer. ClinCancer Res 2003;9:3058–64.
8. Burns JE, Baird MC, Clark LJ, et al. Gene mutationsand increased levels of p53 protein in human squamouscell carcinomas and their cell lines. Br J Cancer 1993;67:1274–84.
9. Edington KG, Loughran OP, Berry IJ, Parkinson EK.Cellular immortality: a late event in the progression ofhuman squamous cell carcinoma of the head and neckassociated with p53 alteration and a high frequency ofallele loss. Mol Carcinog 1995;13:254–65.
10. McGregor F, Wagner E, Felix D, Soutar D, ParkinsonK, Harrison PR. Inappropriate retinoic acid receptor-hexpression in oral dysplasias: correlation with acquisi-tion of the immortal phenotype. Cancer Res 1997;57:3886–9.
11. McGregor F, Muntoni A, Fleming J, et al. Molecularchanges associated with oral dysplasia progression andacquisition of immortality: potential for its reversal by5-azacytidine. Cancer Res 2002;62:4757–66.
12. Bolstad BM, Irizarry RA, Astrand M, Speed TP.A comparison of normalization methods for highdensity oligonucleotide array data based on varianceand bias. Bioinformatics 2003;19:185–93.
13. Breitling R, Armengaud P, Amtmann A, Herzyk P.Rank products: a simple, yet powerful, new method todetect differentially regulated genes in replicated micro-array experiments. FEBS Lett 2004;573:83–92.
14. Breitling R, Amtmann A, Herzyk P. Iterative GroupAnalysis (iGA): a simple tool to enhance sensitivity andfacilitate interpretation of microarray experiments.BMC Bioinformatics 2004;5:34.
15. Kluger Y, Basri R, Chang JT, Gerstein M. Spectralbiclustering of microarray data: coclustering genes andconditions. Genome Res 2003;13:703–16.
16. Higham DJ, Kalna G, Vass JK. Analysis of thesingular value decomposition as a tool for processs-ing microarray expression data. In: Handlovicova A,Krive Z, Mikula K, Sevcovik D, editors. Proceedings ofthe ALGORITMY 17th Conference on ScientificComputing. Slovak University of Technology; 2005.p. 250–9.
17. Pfaffl MW, Horgan GW, Dempfle L. Relative expres-
sion software tool (REST) for group-wise comparisonand statistical analysis of relative expression results inreal-time PCR. Nucleic Acids Res 2002;30:e36.
18. Muntoni A, Fleming J, Gordon KE, et al. Senescingoral dysplasias are not immortalized by ectopicexpression of hTERT alone without other molecularchanges, such as loss of INK4A and/or retinoic acidreceptor-h: but p53 mutations are not necessarilyrequired. Oncogene 2003;22:7804–8.
19. Burns JE, Clark LJ, Yeudall WA, et al. The p53 statusof cultured human premalignant oral keratinocytes. Br JCancer 1994;70:591–5.
20. Herrero R, Castellsague X, Pawlita M, et al. Humanpapillomavirus and oral cancer: the InternationalAgency for Research on Cancer multicenter study.J Natl Cancer Inst 2003;95:1772–83.
21. Rheinwald JG, Beckett MA. Tumorigenic keratinocytelines requiring anchorage and fibroblast support cul-tures from human squamous cell carcinomas. CancerRes 1981;41:1657–63.
22. Higham DJ, Kibble M, Kalna G. Spectral clusteringand its use in bioinformatics. J Comput Appl Math.In press 2006.
23. Gordon KE, Ireland H, Roberts M, et al. High levels oftelomere dysfunction bestow a selective disadvantageduring the progression of human oral squamous cellcarcinoma. Cancer Res 2003;63:458–67.
24. Grose R. Common ground in the transcriptionalprofiles of wounds and tumors. Genome Biol 2004;5:228.
25. Edington KG, Berry IJ, O’Prey M, et al. Multistagehead and neck squamous cell carcinoma. In: Pfragner R,Freshney RI, editors. Culture of human tumor cells. NewYork: Wiley-Liss; 2004. p. 261–88.
26. Baek JH, Lee G, Kim SN, et al. Common genesresponsible for differentiation and senescence of humanmucosal and epidermal keratinocytes. Int J Mol Med2003;12:319–25.
27. Kang MK, Kameta A, Shin KH, Baluda MA, Kim HR,Park NH. Senescence-associated genes in normal humanoral keratinocytes. Exp Cell Res 2003;287:272–81.
28. Chung CH, Parker JS, Karaca G, et al. Molecularclassification of head and neck squamous cell carcino-mas using patterns of gene expression. Cancer Cell 2004;5:489–500.
29. Cromer A, Carles A, Millon R, et al. Identification ofgenes associated with tumorigenesis and metastaticpotential of hypopharyngeal cancer by microarrayanalysis. Oncogene 2004;23:2484–98.
30. Roepman P, Wessels LFA, Kettelarij N, et al. Anexpression profile for diagnosis of lymph node metas-tases from primary head and neck squamous cellcarcinomas. Nat Genet 2005;37:182–6.
31. O’Donnell RK, Kupferman M, Wei SJ, et al. Geneexpression signature predicts lymphatic metastasis insquamous cell carcinoma of the oral cavity. Oncogene2005;24:1244–51.
32. Wei CL, Wu Q, Vega VB, et al. A global map of p53transcription-factor binding sites in the human genome.Cell 2006;124:207–19.
33. Sharpless NE, DePinho RA. Cancer: crime andpunishment. Nature 2005;436:636–7.
34. Loughran O, Clark LJ, Bond J, et al. Evidence for theinactivation of multiple replicative life span genes in
immortal human squamous cell carcinoma keratino-cytes. Oncogene 1997;14:1955–64.
35. Shimada Y, Maeda M, Watanabe G, et al. Cell culturein esophageal squamous cell carcinoma and theassociation with molecular markers. Clin Cancer Res2003;9:243–9.
36. Blons H, Laurent-Puig P. TP53 and head and neckneoplasms. Hum Mutat 2003;21:252–7.
37. Derynck R, Akhurst RJ, Balmain A. TGF-h signalingin tumor suppression and cancer progression. Nat Genet2001;29:117–29.
38. Malliri A, Yeudall WA, Nikolic M, Crouch DH,Parkinson EK, Ozanne B. Sensitivity to transforminggrowth factor h 1-induced growth arrest iscommon in human squamous cell carcinoma celllines: c-MYC down-regulation and p21waf1 inductionare important early events. Cell Growth Differ 1996;7:1291–304.
39. Prime SS, Eveson JW, Stone AM, et al. Metastaticdissemination of human malignant oral keratinocytecell lines following orthotopic transplantation reflectsresponse to TGF-h 1. J Pathol 2004;203:927–32.
40. Balkwill F. Cancer and the chemokine network. NatRev Cancer 2004;4:540–50.
41. Hiratsuka H, Imamura M, Ishii Y, Kohama G, KikuchiK. Immunohistologic detection of lymphocyte subpo-pulations infiltrating in human oral cancer with specialreference to its clinical significance. Cancer 1984;53:2456–66.
42. Bartkova J, Horejsi Z, Koed K, et al. DNA damageresponse as a candidate anti-cancer barrier in earlyhuman tumorigenesis. Nature 2005;434:864–70.
43. Blais A, Dynlacht BD. Hitting their targets: anemerging picture of E2F and cell cycle control. CurrOpin Genet Dev 2004;14:527–32.
44. Loughran O, Malliri A, Owens D, et al. Association ofCDKN2A/p16INK4A with human head and neck kera-tinocyte replicative senescence: relationship of dysfunc-tion to immortality and neoplasia. Oncogene 1996;13:561–8.
45. Nicolas M, Wolfer A, Raj K, et al. Notch1 functions asa tumor suppressor in mouse skin. Nat Genet 2003;33:416–21.
46. Rangarajan A, Talora C, Okuyama R, et al. Notchsignaling is a direct determinant of keratinocyte growtharrest and entry into differentiation. EMBO J 2001;20:3427–36.
47. Gure AO, Stockert E, Scanlan MJ, et al.Serological identification of embryonic neural pro-teins as highly immunogenic tumor antigens insmall cell lung cancer. Proc Natl Acad Sci U S A2000;97:4198–203.
48. Shimada H, Nakashima K, Ochiai T, et al.Serological identification of tumor antigens of esoph-ageal squamous cell carcinoma. Int J Oncol 2005;26:77–86.
49. Borgono CA, Diamandis EP. The emerging roles ofhuman tissue kallikreins in cancer. Nat Rev Cancer 2004;4:876–90.
50. Xu G, Zhang W, Ma MK, McLeod HL. Humancarboxylesterase 2 is commonly expressed in tumortissue and is correlated with activation of irinotecan.Clin Cancer Res 2002;8:2605–11.
Research. on February 16, 2016. © 2006 American Association for Cancercancerres.aacrjournals.org Downloaded from
2006;66:7405-7413. Cancer Res Keith D. Hunter, Johanna K. Thurlow, Janis Fleming, et al. Divergent Routes to Oral Cancer
Updated version
http://cancerres.aacrjournals.org/content/66/15/7405
Access the most recent version of this article at:
Material
Supplementary
http://cancerres.aacrjournals.org/content/suppl/2006/08/02/66.15.7405.DC1.html
Access the most recent supplemental material at:
Cited articles
http://cancerres.aacrjournals.org/content/66/15/7405.full.html#ref-list-1
This article cites 47 articles, 17 of which you can access for free at:
Citing articles
http://cancerres.aacrjournals.org/content/66/15/7405.full.html#related-urls
This article has been cited by 8 HighWire-hosted articles. Access the articles at:
E-mail alerts related to this article or journal.Sign up to receive free email-alerts
Subscriptions
Reprints and
To order reprints of this article or to subscribe to the journal, contact the AACR Publications
Permissions
To request permission to re-use all or part of this article, contact the AACR Publications
Research. on February 16, 2016. © 2006 American Association for Cancercancerres.aacrjournals.org Downloaded from
Related Documents