Date of publication xxxx 00, 0000, date of current version xxxx 00, 0000. Digital Object Identifier — District Wise Price Forecasting of Wheat in Pakistan using Deep Learning AHMED RASHEED 1 , MUHAMMAD SHAHZAD YOUNIS 1 , FAROOQ AHMAD 1 , JUNAID QADIR 2 , AND MUHAMMAD KASHIF. 1 1 National University of Sciences and Technology, Islamabad, Pakistan. 2 Information Technology University (ITU), Lahore, Pakistan. Corresponding author: Ahmed Rasheed (e-mail: [email protected]). ABSTRACT Wheat is the main agricultural crop of Pakistan and is a staple food requirement of almost every Pakistani household making it the main strategic commodity of the country whose availability and affordability is the government’s main priority. Wheat food availability can be vastly affected by multiple factors included but not limited to the production, consumption, financial crisis, inflation, or volatile market. The government ensures food security by particular policy and monitory arrangements, which keeps up purchase parity for the poor. Such arrangements can be made more effective if a dynamic analysis is carried out to estimate the future yield based on certain current factors. Future planning of commodity pricing is achievable by forecasting their future price anticipated by the current circumstances. This paper presents a wheat price forecasting methodology, which uses the price, weather, production, and consumption trends for wheat prices taken over the past few years and analyzes them with the help of advance neural networks architecture Long Short Term Memory (LSTM) networks. The proposed methodology presented significantly improved results versus other conventional machine learning and statistical time series analysis methods. INDEX TERMS Time-series analysis, Machine learning, Economic forecasting, Artificial neural networks I. INTRODUCTION P AKISTAN is an agrarian economy in which a major of livelihoods are intimately connected with the agriculture sector. Wheat is the main agricultural crop of Pakistan. It is estimated that 80% of Pakistani farmers grow wheat on an area of around nine million hectares (close to 40% of the country’s total cultivated land) [1]. Wheat heavily influences Pakistan’s gross domestic product (GDP), and it also adds to the earnings brought by foreign exchange. Specifically, wheat accounts 8.9% value-added in agriculture and 1.6% of GDP according to them according to the Government of Pakistan (GOP) statistics [29]. Wheat, in particular, is a crop that provides linkages that stimulate the growth of economics in other sectors. In Pakistan, wheat is also being cultivated in a group shaped cropping system including wheat-cotton, wheat-rice, wheat-sugarcane, and wheat-maize. Of the total areas where the area cultivation is dependent on rain irriga- tion (an area of roughly 1.5 million hectares), wheat-cotton and wheat-rice cropping constitute approximately 60% [30]. The percentage of the area which is being used for the cul- tivation of agricultural purposes is increasing to a relatively higher degree [14]. However, the emphasis on the importance of agriculture has been decreasing over time. The main reason for it can be attributed to the increased urbanization of the population. Even then, there is still a large percentage of the population that lives in rural areas and indulges in the agricultural sector. Various problems have been affecting the cultivation of wheat. Some of these problems include the shortage of water for irrigation, shortage and increased prices of key input, and outdated traditional farming methods. Due to these problems, Pakistan has experienced various ups and downs in the case of the production of wheat. During the seasons in which production is low, the prices of wheat flour and raw wheat boosts up, but it also decreases where there is an increased production of wheat. However, the surplus amount of wheat production affects the farming com- munity, which suffers from a significant loss in revenue. This is mainly because of the insufficient amount of marketing facilities. Therefore, the farmers keep in mind the prospects VOLUME 0, 0000 1 arXiv:2103.04781v1 [cs.LG] 5 Mar 2021

Welcome message from author
This document is posted to help you gain knowledge. Please leave a comment to let me know what you think about it! Share it to your friends and learn new things together.
Transcript
Date of publication xxxx 00, 0000, date of current version xxxx 00, 0000.
Digital Object Identifier —
District Wise Price Forecasting of Wheatin Pakistan using Deep LearningAHMED RASHEED1, MUHAMMAD SHAHZAD YOUNIS1, FAROOQ AHMAD1, JUNAIDQADIR2, AND MUHAMMAD KASHIF.11National University of Sciences and Technology, Islamabad, Pakistan.2 Information Technology University (ITU), Lahore, Pakistan.
Corresponding author: Ahmed Rasheed (e-mail: [email protected]).
ABSTRACTWheat is the main agricultural crop of Pakistan and is a staple food requirement of almost every Pakistanihousehold making it the main strategic commodity of the country whose availability and affordability is thegovernment’s main priority. Wheat food availability can be vastly affected by multiple factors included butnot limited to the production, consumption, financial crisis, inflation, or volatile market. The governmentensures food security by particular policy and monitory arrangements, which keeps up purchase parity forthe poor. Such arrangements can be made more effective if a dynamic analysis is carried out to estimatethe future yield based on certain current factors. Future planning of commodity pricing is achievable byforecasting their future price anticipated by the current circumstances. This paper presents a wheat priceforecasting methodology, which uses the price, weather, production, and consumption trends for wheatprices taken over the past few years and analyzes them with the help of advance neural networks architectureLong Short Term Memory (LSTM) networks. The proposed methodology presented significantly improvedresults versus other conventional machine learning and statistical time series analysis methods.
INDEX TERMSTime-series analysis, Machine learning, Economic forecasting, Artificial neural networks
I. INTRODUCTION
PAKISTAN is an agrarian economy in which a major oflivelihoods are intimately connected with the agriculture
sector. Wheat is the main agricultural crop of Pakistan. It isestimated that 80% of Pakistani farmers grow wheat on anarea of around nine million hectares (close to 40% of thecountry’s total cultivated land) [1]. Wheat heavily influencesPakistan’s gross domestic product (GDP), and it also addsto the earnings brought by foreign exchange. Specifically,wheat accounts 8.9% value-added in agriculture and 1.6%of GDP according to them according to the Government ofPakistan (GOP) statistics [29]. Wheat, in particular, is a cropthat provides linkages that stimulate the growth of economicsin other sectors. In Pakistan, wheat is also being cultivatedin a group shaped cropping system including wheat-cotton,wheat-rice, wheat-sugarcane, and wheat-maize. Of the totalareas where the area cultivation is dependent on rain irriga-tion (an area of roughly 1.5 million hectares), wheat-cottonand wheat-rice cropping constitute approximately 60% [30].The percentage of the area which is being used for the cul-
tivation of agricultural purposes is increasing to a relativelyhigher degree [14].
However, the emphasis on the importance of agriculturehas been decreasing over time. The main reason for it canbe attributed to the increased urbanization of the population.Even then, there is still a large percentage of the populationthat lives in rural areas and indulges in the agriculturalsector. Various problems have been affecting the cultivationof wheat. Some of these problems include the shortage ofwater for irrigation, shortage and increased prices of keyinput, and outdated traditional farming methods.
Due to these problems, Pakistan has experienced variousups and downs in the case of the production of wheat. Duringthe seasons in which production is low, the prices of wheatflour and raw wheat boosts up, but it also decreases wherethere is an increased production of wheat. However, thesurplus amount of wheat production affects the farming com-munity, which suffers from a significant loss in revenue. Thisis mainly because of the insufficient amount of marketingfacilities. Therefore, the farmers keep in mind the prospects
VOLUME 0, 0000 1
arX
iv:2
103.
0478
1v1
[cs
.LG
] 5
Mar
202
1
of future production and prices at the time of cultivation.Hence, there is a need to forecast the area of the cultivation,the yield, and also the production. Such analysis can help inkeeping a healthy balance between pricing and production.Hence, this paper will focus on determining the prospects ofwheat in Pakistan by using past trends as its base.
Future market commodity pricing is of great interest togovernments, investors, and producers. Food type commodi-ties are traded in smaller localized markets, which constitutegross effect towards its supply and pricing. Commodities likewheat have a high impact on the local economy and foodsecurity for the poor. Such commodities are highly traded andare prone to price fluctuation because of multiple factors, in-cluding a higher flux of investment, gross production, globalfinancial outlook, and monitory policies. In the presenceof such complex and highly dynamic factors, commoditypricing forecasting is needed to consider all impactful trendsto provide a reliable resource to investors and governmentsto reduce risks related to price volatility. Forecasting is theprimary tool used again for the prediction on the base of theexisting and past knowledge base. With the forecasting, onecan predict the production of wheat and determine the pa-rameters that will influence production in the coming years.This is done mainly to gather the interest of the people and toattract them to grow the main selling crops more as comparedto others and also to attract people who are not in farmingalready.
In Pakistan, the forecast for the production of major cropsis carried out by the agriculture department. Forecasting ismainly done to find out an estimate of the supply and demandof the produce. It is issued publicly by the United StatesDepartment of Agriculture (USDA, 1999) and is used notonly in the United States but also all throughout the world,including Pakistan. However, in Pakistan, the forecast is onlymade for the production of the crop. Forecasting of wheat’ssupply and demand is foreseen as there is no specializedmechanism designed for the prices of the crops. Anotherreason is the uncertainties associated with the behavior ofthe buyers and sellers as the demand and supply fluctuate.During 2014, the support price of wheat was Rs. 1200/40kg,as announced by the government. This may have a significanteffect on the future cropping pattern. The wheat cultivationhas increased significantly from the years 2011 to 2013 from8.650 million hectares in 2011 to 8.693 million hectares in2013. This increment in crop cultivation is mainly becauseof a gradual rise in the prices of the crop, which was aboutRs. 200, which can be attributed to the increase in the size ofthe grain, which was because of the proper irrigation causedby the timely rains, favorable temperature, and good qualityseeds.
Our main contribution in this study is the forecasting ofthe trends found in the prices over time and the testingof these forecasts with the future trends of the wheat cropin Pakistan. This will be done by using appropriate trendsensitive prediction models to forecast the prices. In thisstudy, we have formulated two cases to predict the future
price values of wheat: in the first one, the price is predictedfor only the next upcoming month, while in the latter, wehave forecasted prices of the next whole year. The latter caseis a unique method by using which the policy and decision-makers can work efficiently by having a sizeable forecast inthe future. This forecasting and the trend analysis will helpthe future policymakers of the country’s agricultural depart-ment to make necessary policy decisions also the farmersand market brokers to base their decisions on future marketoutlook.
II. RELATED WORKMuch work has been done on the forecasting of stock andcommodity prices using the time series analysis techniqueswhile using deep learning models to predict and forecastprices are relatively new. Prices for crops, including wheat,are a highly fluctuating quantity and therefore require predic-tion methods that can provide better accuracy compared topast practices.
As mentioned in an article by Friedman et al. [22] aboutthe impact of the food crisis and domestic wheat prices inPakistan. Between the years 2005 to 2008, those prices roseby about 106%. This increase in prices was not only theimpact of the global food crisis, but it also depended on thehousehold hoarding and the smuggling of wheat produced.He also mentioned how this situation was taken under con-trol. In 2009, the attainment price of wheat was increased,so the domestic prices were stabilized. According to Ahsanet al. (2011) [23], the decline in the quantity of producedwheat is usually related to the increase in prices. In Pakistan,this is mainly because of the natural disasters that maycause water shortage. Another reason is the increased pricesof food at an international level because of the increasingeconomic growth in known countries like China and India.These references make it imperative for prediction systemsto be evolved to avoid a last-minute crisis in a country stillunder development.
Forecasts that are reliable and timely are essential forproviding valuable and significant inputs which are used toget help in planning the agriculture and cultivation, eventhough they are ordinarily full of uncertainties. In this pastresearch [16], we find Rani and Raza conducted a studyon the forecasting of the price of pulses in Pakistan. Theyused the Double Exponential Smoothing Function (DESF)as well as the measures of accuracy such as Mean AbsolutePercentage Error (MAPE) and Root Mean Squared Error(RMSE) to gain the values of the forecasting. Data fromthe years 1975 to 2010 were collected based on averageyearly prices gathered from various issues of the AgricultureStatistics of Pakistan.
When we look at the previously published researches, ithas been proposed that the upcoming prices and the priceprojection can be guessed by using base forecasts. Moreover,they can also be used to evaluate pre-variation chances. Basiscomparison was established for the practical methods offorecasting for raw wheat and wheat flour [15].
2 VOLUME 0, 0000

Machine learning has been used for the prediction ofprices for several quantities. It has also been compared tostatistical models in terms of accuracy. Juntao Wang (2018)[28] used Gaussian Process Kernels, a statistical machinelearning model, to predict prices of housing. The researchdemonstrated that Gaussian kernels performed better in termsof price predictions compared to other kernels, such as expo-nential or quadratic.
Amin Azari (2019) used the Auto-regressive IntegratedMoving Average (ARIMA) model in his research on priceprediction for the vastly popular and immensely valuablecurrency, bitcoin [24] The study also states that the ARIMAmodel proves to be insufficient to capture the volatility andsharp fluctuations of price.
There are various kinds of neural networks. For time seriesanalysis, the most commonly used architecture is RecurrentNeural Network (RNN) [17]. These network architecturesperform well in retaining the pattern of the data given to themby having a recurrent connection with unit delays in them.In RNNs, the feedback path also exists between the layers,which allow the network also to learn the specific portion ofthe pattern given to it [12], [13].
Long Short Term Memory (LSTM) is a particular type ofRNN which perform better by having a memory cell in it[2]. LSTMs are widely used recently to predict the stocks[31], weather data [32], languages [33] and many other usefulfuture predictions.
Karakoyun et al. (2018) [25] demonstrated a clear differ-ence in results when ARIMA is compared with deep learning(LSTM) for bitcoin value prediction for the next 30 days.Both ARIMA and LSTM are widely used for time-seriespredictions. However, LSTM is more efficient in evaluation.
Similarly, another comparison between ARIMA andLSTM was discussed by Akbar Siami Namini (2018) [26],where both methods were used for the forecasting of eco-nomic and financial time series. The purpose of the researchwas to discuss the positions of deep learning models ascompared to traditional statistical models. The research alsoresulted in the superiority of LSTM over ARIMA.
The survey by Kamilaris et al. (2018) [27] states the useof deep learning models in agricultural fields. While deeplearning has been widely used in agriculture for areas suchas plant recognition, crop classification, and classification ofland covers. Deep learning, on its own, is also widely used forcost forecasting; however, it is seldom that the two aspectsof agriculture and cost forecasting are combined. The surveyalso states that a vast majority of the research done in thisregard dates to 2015 or onward, which indicates that deeplearning is a fairly new direction in agriculture.
In this study, we are extending the work done by theseprevious works and providing a comparison of deep learningmodels with statistical models used for time series analysiscatered specifically to crop-price prediction.
Saqib Shakeel et al. [14] proposed a non-linear modelfitting and trend analysis techniques, which include exponen-tial, quadratic, and S-curve models to predict the upcoming
prices of wheat and rice in Pakistan. The data used in thisresearch was yearly data from 1975 to 2013, which is quitelimited. Extending his work, we are proposing a neuralnetwork approach to get better predictions for the price ofwheat every month.
III. PREDICTION TECHNIQUESThere are several techniques used to get time series predic-tion. A few of the popular techniques used in recent studiesfor predicting the prices are used by us to compare the resultsof our proposed model for prediction.
A. BAGGING TREESBagging Trees are the ensembled form of decision trees,which is a tree-like representation of the possible decisionsand their outcomes. Decision trees have had multiple uses inthe investment and financing world for just about anythingfrom gold returns [8] to corporate financial distress [21] andmeasurement of firm performances [9].
Bagging or Bootstrap Aggregation is used when the totalvariance of a decision tree needs reduction. The concept isto generate multiple subsets from training data at randomwith replacement, which results in the training of multipledecision trees using different subsets. The average of all theresults from the decision trees is taken which makes up fora more robust computation than one single decision tree [5]–[7].
B. GAUSSIAN PROCESS REGRESSION (GPR)GPR is an implementation of the Gaussian Process for re-gression purposes. GPR provides an ability to compute un-certainty measures for prediction functions using a Bayesianapproach to the regression that is non-parametric.
Since a functional form does not limit GPR, it calculatesthe probability distribution over all the functions that fit thedataset, unlike Gaussian distribution that calculates the prob-abilities of a set specific function. A prior is specifies, andthe posterior is calculated using training data, the predictiveposterior distribution is then computed on specific points ofinterest [10]. The underlying representation of GPR is givenbelow.
y = xTβ + ε (1)
Here ε (0, σ2) is a Gaussian distribution with mean at 0.The error variance σ2 and coefficients of β are optimallycalculated respective to data.
C. LONG SHORT TERM MEMORY NETWORKNeural networks work similarly to our body’s neural system.The small neurons are linked to each other to form a singlecompound structure.
LSTM network is a modified form of a recurrent neuralnetwork to perform better [2]. The working of the RNNmodel is shown in Figure 1.
VOLUME 0, 0000 3

RNNs suffer from the problem of vanishing gradient as itpropagates back between the layers, so in order to resolve theproblem of vanishing gradient, LSTM works on the principleof gates, which allow the network to choose the weights tokeep or to discard while training. Three gates, input gate,output gate, and forget gate constitute an LSTM cell [3]. Theinput gate is responsible for providing new inputs to the cell.The output gate specifies the output of the cell, and forget thegate is responsible for indicating any prior values that mightbe needed in the future and retains them. An LSTM-NN cellstructure is shown in Figure 2.
FIGURE 2. Basic structure of a LSTM-NN cell [20].
LSTM cells are stacked with each other to form a dencenetwork followed by a fully connected dense layer. TheLSTM used in the proposed study comprises of 50 LSTMcells to give the prediction. Hyper-parameters used for thetraining purpose of LSTM are shown in Table 1.
IV. DATAMonthly prices of wheat for three major districts of Pakistanwhich are Faisalabad, Gujaranwala and Multan from year1991 to 2018 were obtained from the Agriculture MarketingInformation Service (AMIS) Pakistan using their online Ap-plication Program Interfaces (APIs) [19]. Data on prices for
TABLE 1. Network Hyper-parameters
Parameters ValuesMax Epochs 50
Mini Batch Size 10Loss MAE
Activation Function ReLuOptimizer ADAM
these three districts is used for this research. Figure 4 showsthe price trend over the period with a sampling time of oneday.
Smoothing filter was applied to clear out noise and irreg-ularities to help out forecasting algorithms to understand theunderlying trend in data better. Such approaches are helpfulif a predictor set has different granularity among variables.The smoothing function used in this research is the movingaverage filter; it takes a defined window of inputs and takesthe average of all those values and then applies it to theselected one.
Along with the price dataset, to aid the networks in fore-casting values more efficiently, we also gathered data thatshows a correlation with the prices of wheat within the sametime intervals. Table 2 states the features picked to aid thenetworks in forecasting prices along with their co-relationwith the prices. The data with yearly granularity was mappedto the monthly by linearly interpolating the values betweenthe two years.
TABLE 2. List of Features used to aid the prediction of prices
Sr. Features Granularity Co-relationwith prices
1 Domestic consumption of wheat Monthly Data 0.932 Growth rate of wheat Yearly data 0.673 Production of wheat for province Yearly Data 0.894 Production of wheat for Pakistan Yearly Data 0.925 Rainfall Monthly Data 0.126 Average Temperature Monthly Data 0.02
The Rainfall and Temperature data introduces seasonalityto prices of wheat because it has a regular pattern andalso predicts the small changes in the prices as it mimicsthe present time of year and also tells about the effect of
FIGURE 1. Recurrent Neural Network. Here x, y and W represents the input, output and weights while a represents the previous state of the network.
4 VOLUME 0, 0000
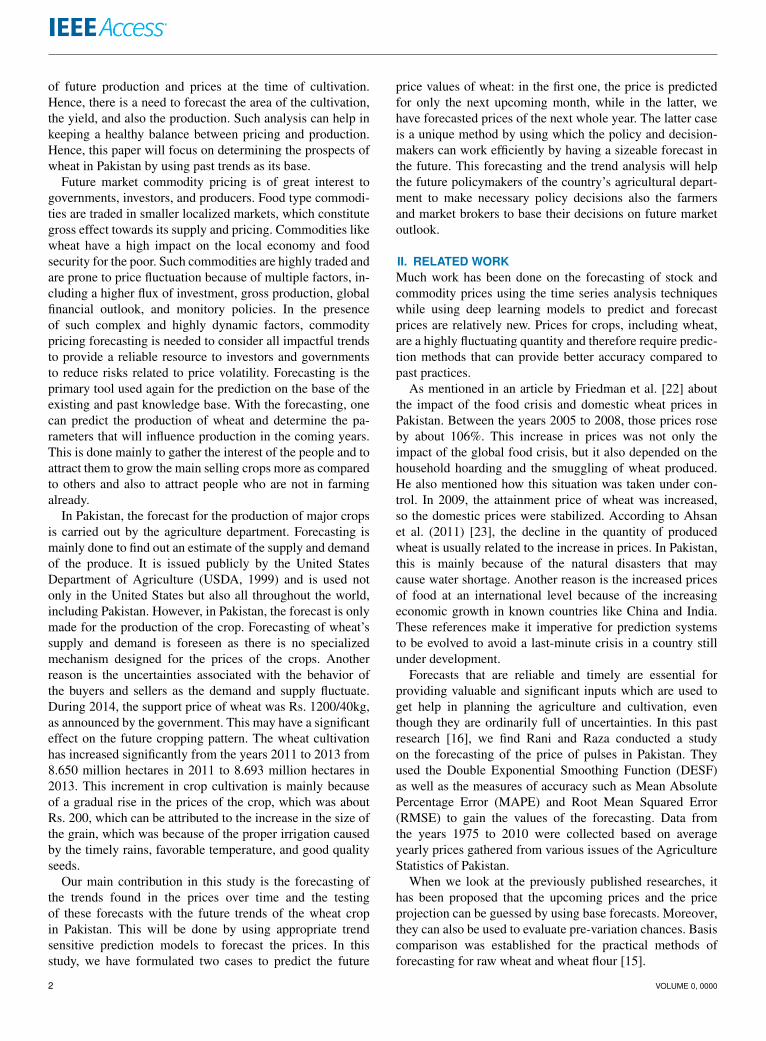
FIGURE 3. Flow diagram of proposed system.
severity of the weather on the wheat prices. The yearly datais interpolated on every month to match the size of otherfeatures and the output.
Data for domestic consumption, growth rate, and pro-duction of wheat were also obtained from AMIS Pakistan.Rainfall and temperature data is obtained from the WorldBank Climate Change Knowledge Portal [18]. All of thiscollected data act as input features to our model under study.
The data obtained is further divided into two subsets,training data, and test data. The training dataset consists ofdata from the year 1991 to 2015 and used by the modelsto train themselves to perform predictions. The test datasetconsists of the last three years from the dataset, 2016 to 2018,which is treated as unseen data to the models, and once themodel is fully trained, we checked its performance for theprediction of prices for unseen data period.
V. METHODOLOGYResearch is initiated with the acquisition of a wheat pricedataset. The acquired dataset is split into training and testdatasets, whereas training data is further processed beforefeeding it into the machine and deep learning algorithms.Trained algorithm models are evaluated with training dataand error performance (MAPE).
Metrics are calculated on the basis of which best model isdiscussed for both processed and raw data. Figure 3 showsthe basic flow of the work we have done in the proposedstudy.
PREPROCESSING VIA MA FILTER
Preprocessing refers to the usage of methods and computa-tion to shape raw data into a processable form. The method
VOLUME 0, 0000 5

FIGURE 4. Original and smoothed wheat prices of (a) Faisalabad, (b) Gujranwala and (c) Multan from 1991 to 2018.
used for this research is the Moving Average Filter (MAFilter). The filter is a simple low-pass filter that takes anaverage of multiple samples and gives a single output point.This results in the smoothing of the data array, which is muchmore feasible and easy for use with neural networks [11].We set the window size of 10 values, the mean of these 10values will be replaced by the actual value in the dataset andeventually the whole dataset is smoothed out. In the Equation2 below, the formula of moving average filter is given. Here xand y are the input and output signals respectively, while W isthe size of the window used for averaging out the input signal.The original and smoothed data trend is shown in Figure 4.
y[i] =1
W
W−1∑j=0
x[i+ j] (2)
The tests were performed by using both the raw andsmoothed data. Since the raw data consists of varying fluc-
tuation, which might affect the results of the forecasting, weused a moving average filter to smooth the input data. Thismoving filter was used because it helps in not losing essentialdata in the smoothing process. Figure 3 shows how the data issplit into training and test data before applying the smoothingprocess. It also represents the training and testing on both thedatasets using above mentioned LSTM model which bringsthe best possible results.
Further, we divided the tests into four unique yet similarcases, which will be predicting wheat prices. These cases areexplained next.
CASE 1: ONE-MONTH PREDICTION WITH PRICE DATAIn case 1, we predicted the price of wheat only for theupcoming month based on the previous values of the costs,the number of prior values used was varied to find the bestresults. This forms a univariate system where we are using
6 VOLUME 0, 0000

only one feature to predict a single value as an output.
CASE 2: ONE-MONTH PREDICTION WITH ALLFEATURESIn case 2, we used a similar architecture, but this time usedall the features of the dataset, along with previous pricedata, to predict the price of wheat for the next month. Thesemultiple numbers of features help the system to predict thevalues more efficiently. The list of features used alongsidethe previous price values is shown in Table 2
CASE 3: ONE-YEAR PREDICTION WITH PRICE DATAIn case 3, instead of forecasting a singular upcoming value,we have predicted the prices for a whole year. This bringsforth the price forecasting of 12 months by only feeding theprevious price values of a few months.
CASE 4: ONE-YEAR PREDICTION WITH ALL FEATURESIn case 4, we predicted the prices for a whole month whilefeeding all the available features to the models. This methodmade the network a little complex, but it can be overlookedas it helped in getting good forecast results for the price ofthe upcoming year. This forms a multivariate system, whichtakes the number of values as described in Table 2 as inputand predicts a number of values as an output.
All these four cases, as shown in Table 3, were trainedon Bagged Trees, GPR, ARIMA, and LSTM in order toget predictions for the test data. Both the datasets, raw andsmoothed, were used one by one to compare the predictedresults.
TABLE 3. Number of Input and Output Parameters for all the cases
Cases Description Features InputMonths
OutputMonths
Case 1 One month prediction with price data 1 12 1Case 2 One month prediction with all features 6 12 1Case 3 One year prediction with price data 1 24 12Case 4 One year prediction with all features 6 24 12
VI. RESULTSFigure 4 shows that the original pattern of prices increasedover a period from 1991 to 2018 in the Faisalabad District ofPakistan.
The smoothing function extracts the right pattern of thedata, which is more comfortable for the network to predict,thus improves the network’s efficiency. All the networks aretrained for both raw and smoothed data. The smoothed datashowed better results compared to the raw data as it helps thenetworks to learn the trend better. For the validation of thenetwork, we used RMSE as an error calculating term. Table4, 5, 6, and 7 shows the results obtained after training andtesting the models mentioned above for each case.
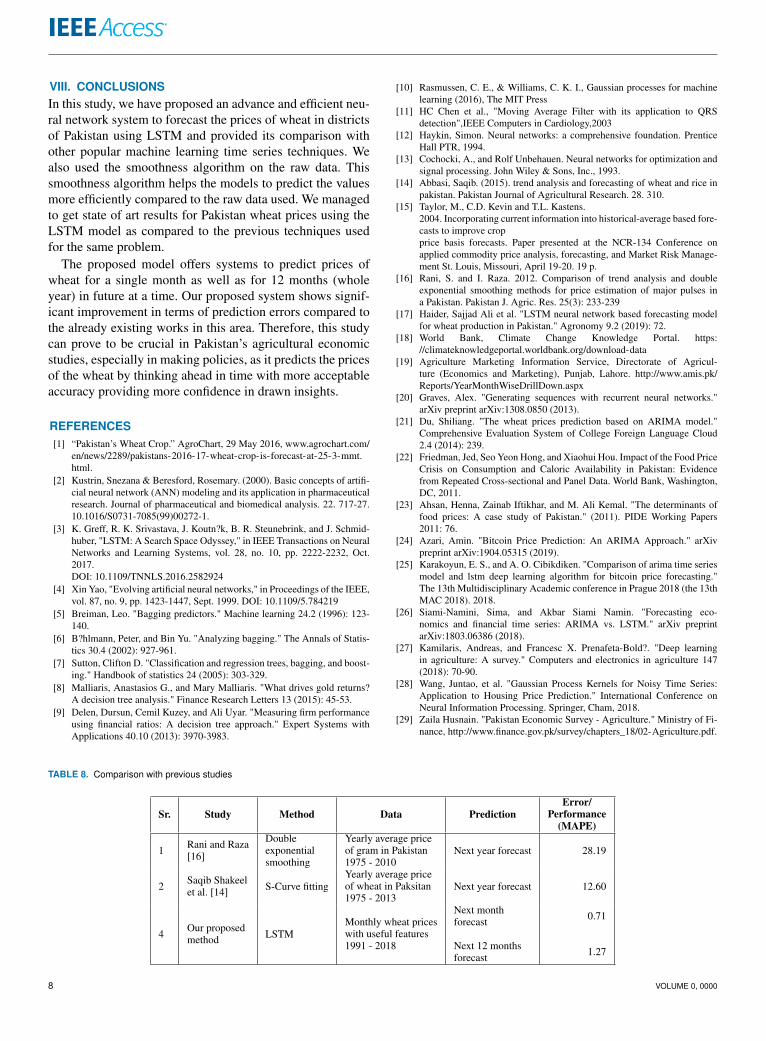
VII. COMPARISON WITH RELATED WORKThe proposed methodology presented in this study to pre-dict the prices of wheat in Pakistan is compared with the
TABLE 4. Results for Case 1: One month prediction with price data
ModelFaisalabad
(RMSE)Gujranwala
(RMSE)Multan(RMSE)
Raw Smooth Raw Smooth Raw SmoothBaggedTrees 166.28 130.36 174.23 120.46 159.31 140.34
GPR 236.62 189.75 184.70 120.35 289.54 140.46ARIMA 257.63 203.83 275.24 189.46 220.43 194.24LSTM 159.19 98.28 160.21 96.13 164.23 104.57
TABLE 5. Results for Case 2: One month prediction with all features
ModelFaisalabad
(RMSE)Gujranwala
(RMSE)Multan(RMSE)
Raw Smooth Raw Smooth Raw SmoothBaggedTrees 170.35 120.29 189.34 113.87 238.36 129.65
GPR 201.32 140.37 240.32 129.49 260.70 150.43ARIMA 240.56 189.45 256.94 153.93 270.86 196.43LSTM 136.34 78.45 149.24 71.62 170.23 82.33
TABLE 6. Results for Case 3: One year prediction with price data
ModelFaisalabad
(RMSE)Gujranwala
(RMSE)Multan(RMSE)
Raw Smooth Raw Smooth Raw SmoothBaggedTrees 259.34 242.54 257.45 220.64 284.76 229.35
GPR 286.78 230.74 314.58 246.53 298.34 236.69ARIMA 268.56 220.34 270.47 257.63 268.80 243.84LSTM 186.74 140.23 179.44 137.25 168.28 132.68
TABLE 7. Results for Case 4: One year prediction with all features
ModelFaisalabad
(RMSE)Gujranwala
(RMSE)Multan(RMSE)
Raw Smooth Raw Smooth Raw SmoothBaggedTrees 205.34 187.69 213.44 170.32 234.37 1787.65
GPR 203.23 174.87 224.43 160.93 230.18 168.91ARIMA 283.34 193.24 260.76 184.78 274.52 197.32LSTM 185.73 146.83 204.61 150.72 172.13 148.21
approaches used in similar previous works. Dataset of annualgranularity was used in previous researches in predict thenext year price value of wheat. We can see from Figure 4 thatthe prices vary a lot within a single year and if we are able topredict the value of next month instead of singular value foran year, it would be more useful. Other than that in this studywe focused on prices of wheat at district level, the pricesvary from district to district because of multiple reasons liketransport, weather and population. So if we are able to predictthe price of wheat for a mandi in a specific district it wouldalso helps the authorities to keep track on the price variationwithin districts. Table 8 compares the techniques, dataset, andtheir prediction errors with our proposed method (LSTM) topredict prices for a single month as well as for a whole yearconsisting of 12 months. The single month prediction is muchbetter as than the whole year one as it is predicting lesseramount of data.
VOLUME 0, 0000 7
VIII. CONCLUSIONSIn this study, we have proposed an advance and efficient neu-ral network system to forecast the prices of wheat in districtsof Pakistan using LSTM and provided its comparison withother popular machine learning time series techniques. Wealso used the smoothness algorithm on the raw data. Thissmoothness algorithm helps the models to predict the valuesmore efficiently compared to the raw data used. We managedto get state of art results for Pakistan wheat prices using theLSTM model as compared to the previous techniques usedfor the same problem.
The proposed model offers systems to predict prices ofwheat for a single month as well as for 12 months (wholeyear) in future at a time. Our proposed system shows signif-icant improvement in terms of prediction errors compared tothe already existing works in this area. Therefore, this studycan prove to be crucial in Pakistan’s agricultural economicstudies, especially in making policies, as it predicts the pricesof the wheat by thinking ahead in time with more acceptableaccuracy providing more confidence in drawn insights.
REFERENCES[1] “Pakistan’s Wheat Crop.” AgroChart, 29 May 2016, www.agrochart.com/
en/news/2289/pakistans-2016-17-wheat-crop-is-forecast-at-25-3-mmt.html.
[2] Kustrin, Snezana & Beresford, Rosemary. (2000). Basic concepts of artifi-cial neural network (ANN) modeling and its application in pharmaceuticalresearch. Journal of pharmaceutical and biomedical analysis. 22. 717-27.10.1016/S0731-7085(99)00272-1.
[3] K. Greff, R. K. Srivastava, J. Koutn?k, B. R. Steunebrink, and J. Schmid-huber, "LSTM: A Search Space Odyssey," in IEEE Transactions on NeuralNetworks and Learning Systems, vol. 28, no. 10, pp. 2222-2232, Oct.2017.DOI: 10.1109/TNNLS.2016.2582924
[4] Xin Yao, "Evolving artificial neural networks," in Proceedings of the IEEE,vol. 87, no. 9, pp. 1423-1447, Sept. 1999. DOI: 10.1109/5.784219
[5] Breiman, Leo. "Bagging predictors." Machine learning 24.2 (1996): 123-140.
[6] B?hlmann, Peter, and Bin Yu. "Analyzing bagging." The Annals of Statis-tics 30.4 (2002): 927-961.
[7] Sutton, Clifton D. "Classification and regression trees, bagging, and boost-ing." Handbook of statistics 24 (2005): 303-329.
[8] Malliaris, Anastasios G., and Mary Malliaris. "What drives gold returns?A decision tree analysis." Finance Research Letters 13 (2015): 45-53.
[9] Delen, Dursun, Cemil Kuzey, and Ali Uyar. "Measuring firm performanceusing financial ratios: A decision tree approach." Expert Systems withApplications 40.10 (2013): 3970-3983.
[10] Rasmussen, C. E., & Williams, C. K. I., Gaussian processes for machinelearning (2016), The MIT Press
[11] HC Chen et al., "Moving Average Filter with its application to QRSdetection",IEEE Computers in Cardiology,2003
[12] Haykin, Simon. Neural networks: a comprehensive foundation. PrenticeHall PTR, 1994.
[13] Cochocki, A., and Rolf Unbehauen. Neural networks for optimization andsignal processing. John Wiley & Sons, Inc., 1993.
[14] Abbasi, Saqib. (2015). trend analysis and forecasting of wheat and rice inpakistan. Pakistan Journal of Agricultural Research. 28. 310.
[15] Taylor, M., C.D. Kevin and T.L. Kastens.2004. Incorporating current information into historical-average based fore-casts to improve cropprice basis forecasts. Paper presented at the NCR-134 Conference onapplied commodity price analysis, forecasting, and Market Risk Manage-ment St. Louis, Missouri, April 19-20. 19 p.
[16] Rani, S. and I. Raza. 2012. Comparison of trend analysis and doubleexponential smoothing methods for price estimation of major pulses ina Pakistan. Pakistan J. Agric. Res. 25(3): 233-239
[17] Haider, Sajjad Ali et al. "LSTM neural network based forecasting modelfor wheat production in Pakistan." Agronomy 9.2 (2019): 72.
[18] World Bank, Climate Change Knowledge Portal. https://climateknowledgeportal.worldbank.org/download-data
[19] Agriculture Marketing Information Service, Directorate of Agricul-ture (Economics and Marketing), Punjab, Lahore. http://www.amis.pk/Reports/YearMonthWiseDrillDown.aspx
[20] Graves, Alex. "Generating sequences with recurrent neural networks."arXiv preprint arXiv:1308.0850 (2013).
[21] Du, Shiliang. "The wheat prices prediction based on ARIMA model."Comprehensive Evaluation System of College Foreign Language Cloud2.4 (2014): 239.
[22] Friedman, Jed, Seo Yeon Hong, and Xiaohui Hou. Impact of the Food PriceCrisis on Consumption and Caloric Availability in Pakistan: Evidencefrom Repeated Cross-sectional and Panel Data. World Bank, Washington,DC, 2011.
[23] Ahsan, Henna, Zainab Iftikhar, and M. Ali Kemal. "The determinants offood prices: A case study of Pakistan." (2011). PIDE Working Papers2011: 76.
[24] Azari, Amin. "Bitcoin Price Prediction: An ARIMA Approach." arXivpreprint arXiv:1904.05315 (2019).
[25] Karakoyun, E. S., and A. O. Cibikdiken. "Comparison of arima time seriesmodel and lstm deep learning algorithm for bitcoin price forecasting."The 13th Multidisciplinary Academic conference in Prague 2018 (the 13thMAC 2018). 2018.
[26] Siami-Namini, Sima, and Akbar Siami Namin. "Forecasting eco-nomics and financial time series: ARIMA vs. LSTM." arXiv preprintarXiv:1803.06386 (2018).
[27] Kamilaris, Andreas, and Francesc X. Prenafeta-Bold?. "Deep learningin agriculture: A survey." Computers and electronics in agriculture 147(2018): 70-90.
[28] Wang, Juntao, et al. "Gaussian Process Kernels for Noisy Time Series:Application to Housing Price Prediction." International Conference onNeural Information Processing. Springer, Cham, 2018.
[29] Zaila Husnain. "Pakistan Economic Survey - Agriculture." Ministry of Fi-nance, http://www.finance.gov.pk/survey/chapters_18/02-Agriculture.pdf.
TABLE 8. Comparison with previous studies
Sr. Study Method Data PredictionError/
Performance(MAPE)
1 Rani and Raza[16]
Doubleexponentialsmoothing
Yearly average priceof gram in Pakistan1975 - 2010
Next year forecast 28.19
2 Saqib Shakeelet al. [14] S-Curve fitting
Yearly average priceof wheat in Paksitan1975 - 2013
Next year forecast 12.60
4 Our proposedmethod LSTM
Monthly wheat priceswith useful features1991 - 2018
Next monthforecast
Next 12 monthsforecast
0.71
1.27
8 VOLUME 0, 0000
[30] Haider, Afzaal. “Wheat in Pakistan.” Pakistan Agricultural ResearchCouncil, https://tinyurl.com/PARCWheatStatusPaper.
[31] Nelson, David MQ, Adriano CM Pereira, and Renato A. de Oliveira."Stock market’s price movement prediction with LSTM neural networks."2017 International joint conference on neural networks (IJCNN). IEEE,2017.
[32] Qing, Xiangyun, and Yugang Niu. "Hourly day-ahead solar irradianceprediction using weather forecasts by LSTM." Energy 148 (2018): 461-468.
[33] Sundermeyer, Martin, Ralf Schlüter, and Hermann Ney. "LSTM neuralnetworks for language modeling." Thirteenth annual conference of theinternational speech communication association. 2012.
AHMED RASHEED earned his Bachelor’s de-gree in Electrical Engineering, majoring in Elec-trical Power, from Air University Islamabad, Pak-istan. He is currently an Electrical EngineeringMaster’s student majoring in Digital System andSignal Processing, at School of Electrical Engi-neering and Computer Science (SEECS) at theNational University of Sciences and Technology(NUST) Islamabad, Pakistan. He is also serving asa Research Assistant at the laboratory of Adaptive
Signal Processing (ASP) at SEECS, specializing in handling machine learn-ing, deep learning, time series prediction and biomedical image processingtasks.
MUHAMMAD SHAHZAD YOUNIS received thebachelor’s degree from National University ofSciences and Technology, Islamabad, Pakistan, in2002, the master’s degree from the University ofEngineering and Technology, Taxila, Pakistan, in2005, and the PhD degree from University Tech-nology PETRONAS, Perak, Malaysia in 2009,respectively. Before joining National Universityof Sciences and Technology (NUST), he was As-sistant Manager at a research and development
organization named AERO where he worked on different signal processingand embedded system design applications. He is currently working as anAssistant professor in the Department of Electrical Engineering in Schoolof Electrical Engineering and Computer Science (SEECS)-NUST. He haspublished more than 25 papers in domestic and international journals andconferences. His research interests include Statistical Signal Processing,Adaptive Filters, Convex Optimization Biomedical signal processing, wire-less communication modelling and digital signal processing.
FAROOQ AHMAD earned his Bachelor’s degreein Electrical Engineering(Electronics) from AirUniversity Islamabad, Pakistan. He is currentlyan Electrical Engineering Master’s student ma-joring in Power and Control Systems, at Schoolof Electrical Engineering and Computer Science(SEECS), National University of Sciences andTechnology (NUST) Islamabad, Pakistan. He isalso serving as a Project Engineer at the laboratoryof Adaptive Signal Processing (ASP) at SEECS.
His research interest is in in IoT and data-driven control.
JUNAID QADIR (SM? 14) completed his BS inElectrical Engineering from UET, Lahore, Pak-istan and his PhD from University of New SouthWales, Australia in 2008. He is currently an As-sociate Professor at the Information TechnologyUniversity (ITU)-Punjab, Lahore, Pakistan. He isthe Director of the IHSAN Lab at ITU that focuseson deploying ICT for development and is engagedin systems and networking research. Prior to join-ing ITU, he was an Assistant Professor at the
School of Electrical Engineering and Computer Sciences (SEECS), NationalUniversity of Sciences and Technology (NUST), Pakistan. At SEECS, hedirected the Cognet Lab at SEECS that focused on cognitive networkingand the application of computational intelligence techniques in networking.He has been awarded the highest national teaching award in Pakistan?thehigher education commission’s (HEC) best university teacher award?for theyear 2012-2013. He has been nominated for this award twice (2011, and2012-2013). His research interests include the application of algorithmic,machine learning, and optimization techniques in networks. In particular, heis interested in the broad areas of wireless networks, cognitive networking,software-defined networks, and cloud computing. He is a regular reviewerfor a number of journals and has served in the program committee ofa number of international conferences. He serves as an Associate Editorfor IEEE Access, IEEE Communication Magazine, and Springer NatureBig Data Analytics. He was the lead guest editor for the special issue"Artificial Intelligence Enabled Networking" in IEEE Access and the featuretopic "Wireless Technologies for Development" in IEEE CommunicationsMagazine. He is a member of ACM, and a senior member of IEEE.
MUHAMMAD KASHIF received his Bachelor inElectronic Engineering from Ghulam Ishaq KhanInstitute of Engineering, Sciences and Technology(GIKI), Swabi, Pakistan in 2016. He has worked asTrainee Engineer in Thermovision (PVT) ltd from2016-17. He is currently enrolled in MS Elec-trical Engineering (Power and Control Systems)Program 2017 in NUST, Islamabad, Pakistan. Heis working as Research Assistant in ASP Lab,SEECS, NUST. His research interest is in power
system monitoring and analysis, development of smart sensors.
VOLUME 0, 0000 9
Related Documents