This work is licensed under a Creative Commons Attribution 4.0 International License. ORIGINAL SCIENTIFIC PAPER Croat. Chem. Acta 2018, 91(1), 29–41 Published online: April 9, 2018 DOI: 10.5562/cca3202 Distribution of Trace Elements in Waters of the Zrmanja River Estuary (Eastern Adriatic Coast, Croatia) Željka Fiket,* Maja Ivanić, Martina Furdek Turk, Nevenka Mikac, Goran Kniewald Ruđer Bošković Institute, Division for Marine and Environmental Research, Bijenička c. 54, HR-10000 Zagreb, Croatia * Corresponding author’s e-mail address: [email protected] RECEIVED: July 27, 2017 REVISED: January 31, 2018 ACCEPTED: March 2, 2018 Abstract: This study aims to investigate the geochemical characteristics of waters of the highly stratified Zrmanja River estuary (eastern Adriatic coast, Croatia). For that purpose, data on salinity and distribution of 16 elements in surface and bottom water of the Zrmanja River estuary was used to assess the spatial variation of trace elements in the estuary water and to identify the main processes governing these variations. The composition of the investigated water was found to be determined primarily by natural factors. Mass concentration levels of dissolved elements were relatively low and typical for unpolluted waters and are considered to primarily reflect the geological and hydrogeological background of the catchment area. The distribution of element mass concentrations along the water column was found to primarily reflect different water masses, the river on the surface and sea at the bottom. Deviation from conservative behaviour for some elements in the bottom water is due to adsorption and desorption processes from the particulate phases. Keywords: trace elements, geochemistry, estuary, Zrmanja River, Adriatic. INTRODUCTION STUARIES represent unique water systems, a vital link between the land and the sea. As habitats and breeding locations for a great number of aquatic species, they are critically important ecosystems. Changes in water quality conditions could, however, have a great impact on the aquatic resources in estuaries. Due to fresh- and seawater mixing, estuaries are characterized by a pronounced gradient of several parameters, namely salinity, temperature, pH, redox potential as well as particle composition. Thus, they often act as a trap for material discharged by rivers, which, unfortunately, may also include various contaminants and pollutants associated with anthropogenic activities. [1–6] The Zrmanja River estuary is a semi-enclosed bay embedded in a karstic landscape of the eastern Adriatic coast (Figure 1a). It represents a highly indented system which includes part of the Zrmanja River, downstream from the Jankovića Buk to the Novigrad Sea, the Novigrad Sea and the Karin Sea, and the strait connecting the Novigrad Sea with the Velebit Channel. [7] The Zrmanja River is a typical karstic river with its drainage area responsible for a negligible yield of the river-borne material. [8] In addition to the Zrmanja River, the estuary is fed by the inflow of the Karišnica River, a small river in the southern part of the Karin Sea. Despite the prevalent karstic landscape, dozens of smaller and/or intermittent streams draining the Eocene flysch deposits in the hinterland discharge significant amounts of fine-grained material to the middle part of the estuary, the Novigrad Sea and the Karin Sea, [8,9] influencing water geochemistry as well. Although the wider area is poorly populated, recognized anthropogenic pressures include the reversible Velebit hydroelectric power plant, located in the upper part of the river, and the decommissioned alumina factory Jadral, located on the right bank of the river canyon, about 8 km upstream from the mouth of the Zrmanja River into the Novigrad Sea. Previous studies [8–11] confirmed the impact of these factors on the hydrological regime of the Zrmanja River as well as on the composition of river sediments and sedimentation dynamics. Despite the E

Welcome message from author
This document is posted to help you gain knowledge. Please leave a comment to let me know what you think about it! Share it to your friends and learn new things together.
Transcript
This work is licensed under a Creative Commons Attribution 4.0 International License.
O R I G I N A L S C I E N T I F I C P A P E R
Croat. Chem. Acta 2018, 91(1), 29–41 Published online: April 9, 2018 DOI: 10.5562/cca3202
Distribution of Trace Elements in Waters of the Zrmanja River Estuary
(Eastern Adriatic Coast, Croatia)
Željka Fiket,* Maja Ivanić, Martina Furdek Turk, Nevenka Mikac, Goran Kniewald Ruđer Bošković Institute, Division for Marine and Environmental Research, Bijenička c. 54, HR-10000 Zagreb, Croatia * Corresponding author’s e-mail address: [email protected]
RECEIVED: July 27, 2017 REVISED: January 31, 2018 ACCEPTED: March 2, 2018
Abstract: This study aims to investigate the geochemical characteristics of waters of the highly stratified Zrmanja River estuary (eastern Adriatic coast, Croatia). For that purpose, data on salinity and distribution of 16 elements in surface and bottom water of the Zrmanja River estuary was used to assess the spatial variation of trace elements in the estuary water and to identify the main processes governing these variations. The composition of the investigated water was found to be determined primarily by natural factors. Mass concentration levels of dissolved elements were relatively low and typical for unpolluted waters and are considered to primarily reflect the geological and hydrogeological background of the catchment area. The distribution of element mass concentrations along the water column was found to primarily reflect different water masses, the river on the surface and sea at the bottom. Deviation from conservative behaviour for some elements in the bottom water is due to adsorption and desorption processes from the particulate phases. Keywords: trace elements, geochemistry, estuary, Zrmanja River, Adriatic.
INTRODUCTION STUARIES represent unique water systems, a vital link between the land and the sea. As habitats and
breeding locations for a great number of aquatic species, they are critically important ecosystems. Changes in water quality conditions could, however, have a great impact on the aquatic resources in estuaries. Due to fresh- and seawater mixing, estuaries are characterized by a pronounced gradient of several parameters, namely salinity, temperature, pH, redox potential as well as particle composition. Thus, they often act as a trap for material discharged by rivers, which, unfortunately, may also include various contaminants and pollutants associated with anthropogenic activities.[1–6] The Zrmanja River estuary is a semi-enclosed bay embedded in a karstic landscape of the eastern Adriatic coast (Figure 1a). It represents a highly indented system which includes part of the Zrmanja River, downstream from the Jankovića Buk to the Novigrad Sea, the Novigrad Sea and the Karin Sea, and the strait connecting the Novigrad
Sea with the Velebit Channel.[7] The Zrmanja River is a typical karstic river with its drainage area responsible for a negligible yield of the river-borne material.[8] In addition to the Zrmanja River, the estuary is fed by the inflow of the Karišnica River, a small river in the southern part of the Karin Sea. Despite the prevalent karstic landscape, dozens of smaller and/or intermittent streams draining the Eocene flysch deposits in the hinterland discharge significant amounts of fine-grained material to the middle part of the estuary, the Novigrad Sea and the Karin Sea,[8,9] influencing water geochemistry as well. Although the wider area is poorly populated, recognized anthropogenic pressures include the reversible Velebit hydroelectric power plant, located in the upper part of the river, and the decommissioned alumina factory Jadral, located on the right bank of the river canyon, about 8 km upstream from the mouth of the Zrmanja River into the Novigrad Sea. Previous studies[8–11] confirmed the impact of these factors on the hydrological regime of the Zrmanja River as well as on the composition of river sediments and sedimentation dynamics. Despite the
E

30 Ž. FIKET et al.: Distribution of Trace Elements in Waters …
Croat. Chem. Acta 2018, 91(1), 29–41 DOI: 10.5562/cca3202
mentioned anthropogenic influences on the estuary, prevailing marine phytoplankton species classify the Novigrad Sea in the category of natural oligotrophic areas of the eastern Adriatic.[7,12] Today's river valley developed more than 100 m below the level of the old watercourse, which once led into the Krka River.[10] Contrary to the Zrmanja River, the Krka River has been extensively studied over the last several decades, resulting in numerous publications related to the distribution of metals in water, sediments and biota[13–16] of this area. So far, no systematic study of the geochemical characteristics of water was conducted in the Novigrad area. The aim of this study was, therefore, to provide an insight into the distribution of trace elements in the surface and bottom waters of the Zrmanja River estuary. This is a geographically isolated and extremely indented system, which along the river section includes two small basins characterized by an overall limited communication with the open sea. Isolation makes these systems sensitive to increasing anthropogenic pressures and necessitates its basic characterization in order to preserve it. The objectives of this study were threefold: 1) to assess the levels of trace elements in surface and bottom waters of the estuary; 2) to provide an overview of spatial variations in trace element mass concentrations; 3) to determine the major processes and factors controlling the mass concentration of these elements in the studied waters.
METHODS
Site Description The Zrmanja River and its karstic estuary form a semi-closed bay located in the central part of the eastern Adriatic coast. The total length of the Zrmanja River open watercourse, running from the spring to the mouth of the river in the Novigrad Sea is about 69 km, while its drainage basin covers an area of 907 km2.[17] The Zrmanja River is a typical calcium-bicarbonate enriched karstic water[18] with flow velocities in the range from 5 cm s-1 to 50 cm s–1.[19,20] The majority of the population in this area (around 4500 inhabitants) lives in the Obrovac region, the largest town on the Zrmanja River. The population is primarily employed in the tourism, services and manufacturing industry, while only 4 % of the population is engaged in agriculture, forestry and fisheries.[21] Mariculture activities primarily include shellfish farming in the area of the Novigrad sea, using the traditional farming technology of floating parks.[22] The Zrmanja River estuary is a highly stratified system with a sharp halocline separating the brackish from the marine layer. It is formed by an inflow of the Zrmanja River into the Novigrad Sea (28.7 km²), an enclosed basin
connected in the north-western part to the Velebit Channel and in the south-eastern part to an even smaller basin, the Karin Sea (5.7 km²) (Figure 1b). The denser seawater enters the estuary up to 14 km upstream, to the Jankovića Buk waterfall (Figure 1), forming a salt wedge. In general, the estuary can be divided into three parts: the upper part (downstream from the Jankovića Buk to the Novigrad Sea), the middle part (the Novigrad Sea and the Karin Sea) and the lower part (the strait connecting the Novigrad Sea and the Velebit Channel).[7] The average depth in the central part of the Novigrad Sea and the Karin Sea is about 28 m and 12 m, respectively, whereas depths greater than 30 m occur just in front of the strait connecting the Novigrad Sea to the Velebit Channel. Because of its semi-enclosed character, the Zrmanja River estuary is under a minor influence of waves and currents[23] and can be described as a microtidal estuary. In relation to the total volume of the Novigrad Sea (511.5 × 10⁶ m³), the Zrmanja River brings annually, on average, 2 to 3 times more water (1167 × 106 m³),[24] strongly influencing the physico-chemical and biological,[25] as well as hydrogeological properties[24] of the Novigrad Sea. In winter, at a discharge of 30 m3, flushing period of the brackish layer in the upper estuary was estimated to 1–2 days.[26] In summer, the reduced riverine flow leads to higher salinity and a longer water residence time. For comparison, under typical winter conditions, the residence times of the brackish and marine layers in the Krka River estuary are 6–12 and 15–45 days, respectively.[27]
The Karin Sea is influenced by several watercourses, of which the largest are the rivers Karišnica and Bijela. These rivers are characterized by their overall short length (8.0 km and 6.7 km, respectively) and occasional strong torrential flows. The inflow of fresh water into the Karin Sea results in the formation of a brackish lagoon whose salinity varies throughout the year, depending on the rainfall. The salinity of the Novigrad Sea, as well as the Karin Sea, is, therefore, lower than in the open waters of the Adriatic (38-39), increasing with depth from 3 to 20 in the surface layer and from 20 to 38 in deeper parts.[7] In general, the Zrmanja’s catchment basin is characterized by a complex water circulation[28] pattern, a typical feature of karstic watershed areas. In addition to the mentioned watercourses, there are numerous permanent and temporary springs connected with sinkholes (‘ponors’) in the hinterland, as well as the underwater springs discharging water directly into the estuary, especially during rainy periods.
Reagents and Standard Solutions For the preparation of standard and blank solutions, high purity Milli-Q water obtained with a Millipore purification system (resistivity less than 18 MΩ cm), was used.

Ž. FIKET et al.: Distribution of Trace Elements in Waters … 31
DOI: 10.5562/cca3202 Croat. Chem. Acta 2018, 91(1), 29–41
Standards for multielement analysis were prepared by appropriate dilution of a multielement reference standard (Analytika, Prague, Czech Republic) containing Al, As, Ba, Co, Cr, Cs, Cu, Fe, Li, Mn, Mo, Ni, Rb, Sr and V in which single element standard solution of U (Aldrich, Milwaukee, WI, USA) was added. Working standards, as well as blank solutions, were prepared with the addition of 1 % high purity HNO3 (Fluka, Steinheim, Switzerland) and 1 % high purity HCl acid (Merck, Darmstadt, Germany). All containers used were previously cleaned by soaking for two weeks in 10 % HNO3 solution and rinsed with Milli-Q water before use.
Sampling and Sample Preparation For the purpose of this study surface water samples were taken during the summer period at a total of 15 locations, six of which are from the Zrmanja River (Z1-Z6), six from the Novigrad Sea (N1-N6), two from the Karin Sea (K1-K2) and one from the Velebit Channel (A) (Figure 1b). Samples were collected in plastic bottles previously washed out several times with sampling water. Samples of bottom water represent water above the sediment layer, sampled with gravity corers (UWITEC, Austria). The water samples collected with sediment corers were immediately after sampling decanted into precleaned bottles. In order to minimize the effect of resuspension during core sampling, decanting was delayed until particle settling was ensured and included only the upper third of the solution. The bottom water samples were taken at seven locations, four from the Zrmanja River, two from the Novigrad Sea and one from the Velebit Channel.
The bottom and surface water samples were, immediately after sampling, filtered through 0.45 µm membrane (acetate) filter paper under pressure and acidified with 1 % suprapur HNO3 (v / v). All samples were stored at 4 °C until further analysis. Water samples of salinity above 10 were diluted prior to analysis with HR-ICP-MS in order to reduce the amount of total dissolved solids below 2 %. The water samples of salinity between 10 and 20 were diluted 10 times, and water samples of salinity above 20 were diluted 20 times. The salinity of all samples was determined using a handheld refractometer (Atago, S-10E, Tokyo, Japan).
HR-ICP-MS Analysis Dissolved element mass concentrations in water samples were analyzed by High Resolution Inductively Coupled Plasma Mass Spectrometry (HR-ICP-MS) using an Element 2 instrument (Thermo, Bremen, Germany). Details of the method are given elsewhere.[29] External calibration was used for the quantification. Prior to analysis, In (1 µg L–1) as an internal standard was added to the samples. All samples were analyzed for mass concentration of 16 elements (Al, As, Ba, Co, Cr, Cs, Cu, Fe, Li, Mn, Mo, Ni, Rb, Sr, U and V).
Quality Control Quality control of the analytical procedure was performed by simultaneous analysis of the blank and the certified reference material for water (SLRS-4, National Research Council, Canada). Good agreement between the analysed and the certified mass concentrations within their analytical uncertainties was obtained for all elements (Table 1).
Figure 1. (a) Location of the Zrmanja River estuary; (b) Spatial distribution of sampling locations in the study area.

32 Ž. FIKET et al.: Distribution of Trace Elements in Waters …
Croat. Chem. Acta 2018, 91(1), 29–41 DOI: 10.5562/cca3202
RESULTS
Salinity The measured values of salinity are listed in Table 2. The salinity of surface water of the Zrmanja River equals 2 or 3 in all locations, while the bottom water displayed, as expected, a wider range of values, from 2 to 36. The salinity of the surface waters from the mouth of the Zrmanja River into the Novigrad Sea increased from 3 to 11 and showed slightly higher values in other parts of the Novigrad Sea, 13 or 14. The influence of the small Karišnica River is reflected in the low salinity values of the surface water measured in the Karin Sea, increasing with distance from the mouth of the Karišnica, from 2 to 14. In general, the salinity of the surface water in the studied area did not exceed 17, including the area of the Velebit Channel. The highest salinity was measured in the bottom waters at locations A and N6 equalling 38 and 40, respectively.
Trace Elements in Surface and Bottom Waters
Results of measurement of 16 elements (Al, As, Ba, Co, Cr, Cs, Cu, Fe, Li, Mn, Mo, Ni, Rb, Sr, U, and V) in the surface and the bottom water samples are shown in Table 3.
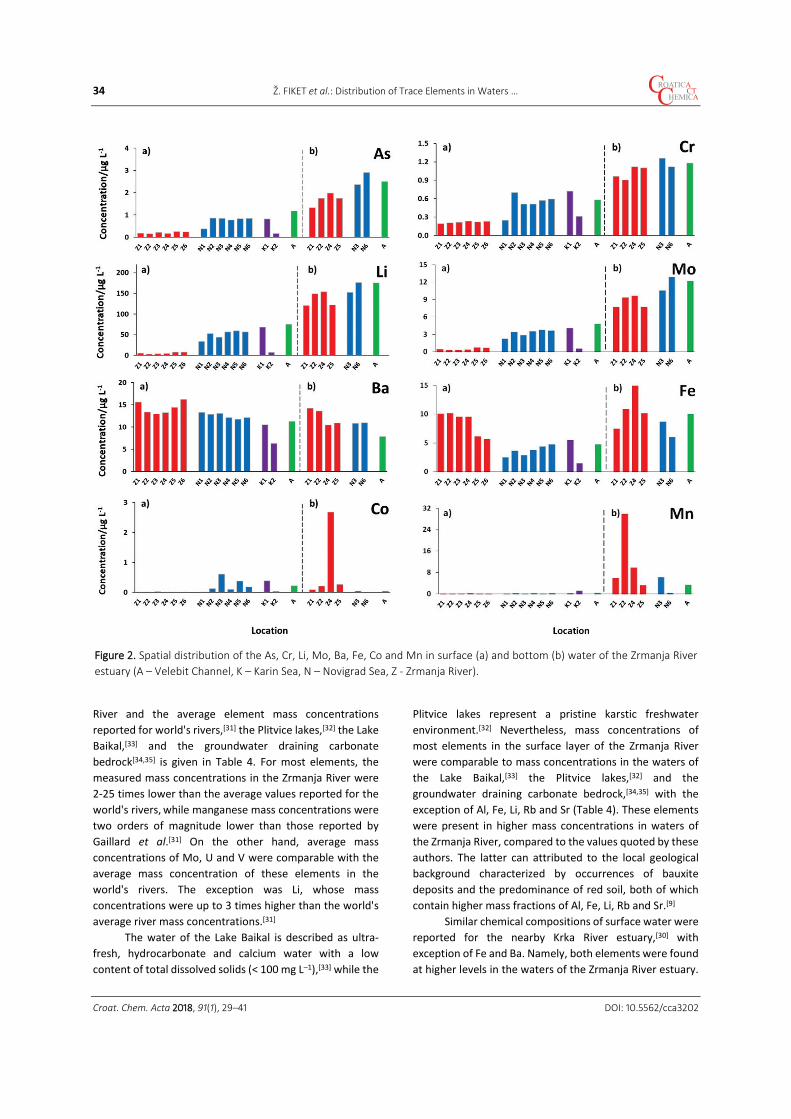
Figure 2 illustrates the distribution of selected elements (As, Cr, Li, Mo, Ba, Fe, Co and Mn) in the estuary water, presenting a cross-section of all measured elements. At all sites, higher mass concentrations of all elements, with the exception of Ba, were measured in the bottom water in comparison to the surface water in the same location (Figure 2). In addition, barium was the only element whose mass concentrations were relatively uniform throughout the study area, regardless of the depth at which the water was sampled and only slightly higher in the area of the Zrmanja River. The biggest differences between surface and bottom waters in the Zrmanja River were observed for Co, Ni and Mn (Figure 2), whose mass concentrations in the bottom water were up to two orders of magnitude higher than in the surface water. For the majority of the measured elements (Al, As, Cr, Cs, Li, Mo, Ni, Rb, Sr, U and V) a similar spatial distribution was obtained, characterized by an increase in mass concentrations from the Zrmanja River and the Karišnica River towards the Novigrad Sea and the Karin Sea, respectively. Somewhat different spatial distributions were noted for Ba, Co, Cu, Fe, Mn and Ni (Figure 2). Barium and iron showed higher values in both surface and bottom water of the Zrmanja River compared to other parts of the estuary, while Co, Cu, Mn, and Ni displayed highest values in the bottom water of the Zrmanja River.
Table 1. Comparison of measured element mass concentra-tions (mean and standard deviation) and certified values (with associated uncertainties), in SLRS-4 certified reference material.
Element Mass concentration / µg L–1
Measured Certified
Al 49.9 ± 1.4 54 ± 4
As 0.74 ± 0.04 0.68 ± 0.06
Ba 12.2 ± 0.7 12.2 ± 0.6
Co 0.038 ± 0.005 0.033 ± 0.008
Cr 0.31 ± 0.02 0.33 ± 0.02
Cs 0.009 ± 0.001 –
Cu 1.80 ± 0.15 1.81 ± 0.08
Fe 103 ± 7 103 ± 5
Li 0.46 ± 0.04 –
Mn 3.31 ± 0.15 3.37 ± 0.18
Mo 0.21 ± 0.03 0.21 ± 0.02
Ni 0.70 ± 0.03 0.67 ± 0.08
Rb 1.50 ± 0.07 –
Sr 25.4 ± 0.6 26.3 ± 3.2
U 0.052 ± 0.005 0.050 ± 0.003
V 0.35 ± 0.01 0.32 ± 0.03
– not specified.
Table 2. Salinity of surface and bottom waters of the Zrmanja River (Z), the Novigrad Sea (N), the Karin Sea (K) and the Velebit Channel (A) (– not specified).
Location Salinity
Surface Bottom
A 17 38
K1 2
K2 14 –
N1 8 –
N2 11 –
N3 10 34
N4 13 –
N5 14 –
N6 14 40
Z1 2 32
Z2 2 32
Z3 2 –
Z4 2 36
Z5 3 25
Z6 2 –
– not specified.
Ž. FIKET et al.: Distribution of Trace Elements in Waters … 33
DOI: 10.5562/cca3202 Croat. Chem. Acta 2018, 91(1), 29–41
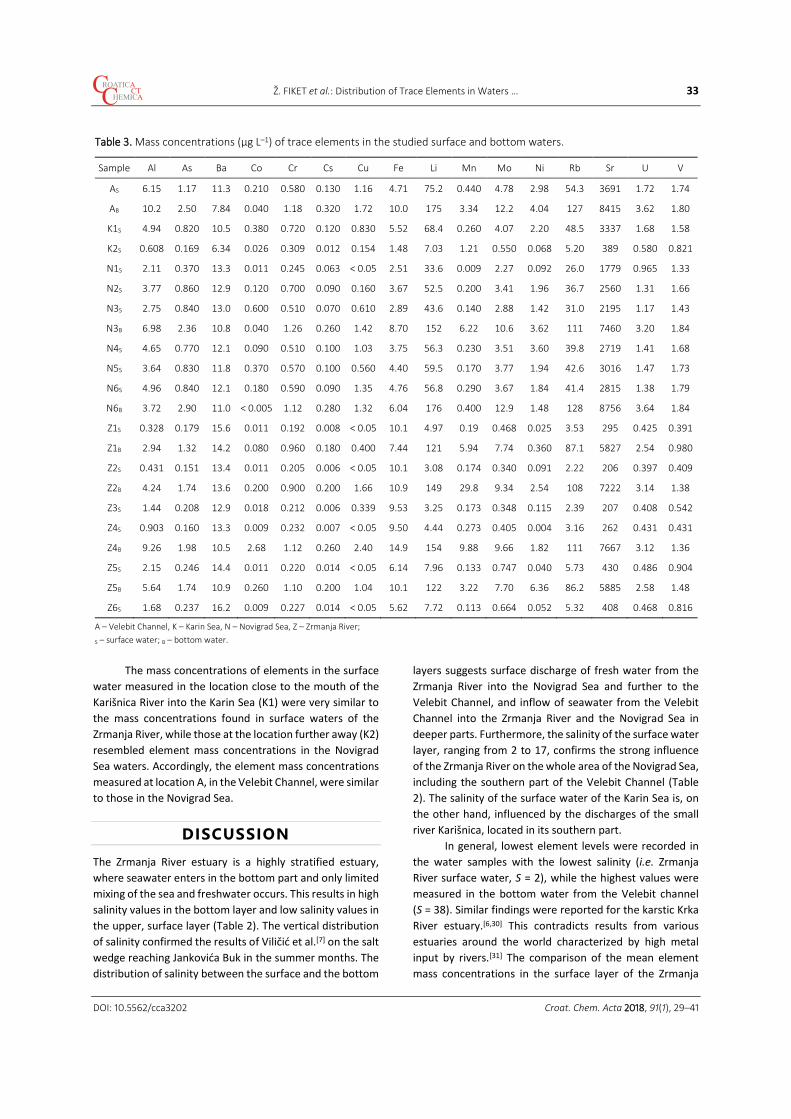
The mass concentrations of elements in the surface water measured in the location close to the mouth of the Karišnica River into the Karin Sea (K1) were very similar to the mass concentrations found in surface waters of the Zrmanja River, while those at the location further away (K2) resembled element mass concentrations in the Novigrad Sea waters. Accordingly, the element mass concentrations measured at location A, in the Velebit Channel, were similar to those in the Novigrad Sea.
DISCUSSION The Zrmanja River estuary is a highly stratified estuary, where seawater enters in the bottom part and only limited mixing of the sea and freshwater occurs. This results in high salinity values in the bottom layer and low salinity values in the upper, surface layer (Table 2). The vertical distribution of salinity confirmed the results of Viličić et al.[7] on the salt wedge reaching Jankovića Buk in the summer months. The distribution of salinity between the surface and the bottom
layers suggests surface discharge of fresh water from the Zrmanja River into the Novigrad Sea and further to the Velebit Channel, and inflow of seawater from the Velebit Channel into the Zrmanja River and the Novigrad Sea in deeper parts. Furthermore, the salinity of the surface water layer, ranging from 2 to 17, confirms the strong influence of the Zrmanja River on the whole area of the Novigrad Sea, including the southern part of the Velebit Channel (Table 2). The salinity of the surface water of the Karin Sea is, on the other hand, influenced by the discharges of the small river Karišnica, located in its southern part. In general, lowest element levels were recorded in the water samples with the lowest salinity (i.e. Zrmanja River surface water, S = 2), while the highest values were measured in the bottom water from the Velebit channel (S = 38). Similar findings were reported for the karstic Krka River estuary.[6,30] This contradicts results from various estuaries around the world characterized by high metal input by rivers.[31] The comparison of the mean element mass concentrations in the surface layer of the Zrmanja
Table 3. Mass concentrations (μg L–1) of trace elements in the studied surface and bottom waters.
Sample Al As Ba Co Cr Cs Cu Fe Li Mn Mo Ni Rb Sr U V
AS 6.15 1.17 11.3 0.210 0.580 0.130 1.16 4.71 75.2 0.440 4.78 2.98 54.3 3691 1.72 1.74
AB 10.2 2.50 7.84 0.040 1.18 0.320 1.72 10.0 175 3.34 12.2 4.04 127 8415 3.62 1.80
K1S 4.94 0.820 10.5 0.380 0.720 0.120 0.830 5.52 68.4 0.260 4.07 2.20 48.5 3337 1.68 1.58
K2S 0.608 0.169 6.34 0.026 0.309 0.012 0.154 1.48 7.03 1.21 0.550 0.068 5.20 389 0.580 0.821
N1S 2.11 0.370 13.3 0.011 0.245 0.063 < 0.05 2.51 33.6 0.009 2.27 0.092 26.0 1779 0.965 1.33
N2S 3.77 0.860 12.9 0.120 0.700 0.090 0.160 3.67 52.5 0.200 3.41 1.96 36.7 2560 1.31 1.66
N3S 2.75 0.840 13.0 0.600 0.510 0.070 0.610 2.89 43.6 0.140 2.88 1.42 31.0 2195 1.17 1.43
N3B 6.98 2.36 10.8 0.040 1.26 0.260 1.42 8.70 152 6.22 10.6 3.62 111 7460 3.20 1.84
N4S 4.65 0.770 12.1 0.090 0.510 0.100 1.03 3.75 56.3 0.230 3.51 3.60 39.8 2719 1.41 1.68
N5S 3.64 0.830 11.8 0.370 0.570 0.100 0.560 4.40 59.5 0.170 3.77 1.94 42.6 3016 1.47 1.73
N6S 4.96 0.840 12.1 0.180 0.590 0.090 1.35 4.76 56.8 0.290 3.67 1.84 41.4 2815 1.38 1.79
N6B 3.72 2.90 11.0 < 0.005 1.12 0.280 1.32 6.04 176 0.400 12.9 1.48 128 8756 3.64 1.84
Z1S 0.328 0.179 15.6 0.011 0.192 0.008 < 0.05 10.1 4.97 0.19 0.468 0.025 3.53 295 0.425 0.391
Z1B 2.94 1.32 14.2 0.080 0.960 0.180 0.400 7.44 121 5.94 7.74 0.360 87.1 5827 2.54 0.980
Z2S 0.431 0.151 13.4 0.011 0.205 0.006 < 0.05 10.1 3.08 0.174 0.340 0.091 2.22 206 0.397 0.409
Z2B 4.24 1.74 13.6 0.200 0.900 0.200 1.66 10.9 149 29.8 9.34 2.54 108 7222 3.14 1.38
Z3S 1.44 0.208 12.9 0.018 0.212 0.006 0.339 9.53 3.25 0.173 0.348 0.115 2.39 207 0.408 0.542
Z4S 0.903 0.160 13.3 0.009 0.232 0.007 < 0.05 9.50 4.44 0.273 0.405 0.004 3.16 262 0.431 0.431
Z4B 9.26 1.98 10.5 2.68 1.12 0.260 2.40 14.9 154 9.88 9.66 1.82 111 7667 3.12 1.36
Z5S 2.15 0.246 14.4 0.011 0.220 0.014 < 0.05 6.14 7.96 0.133 0.747 0.040 5.73 430 0.486 0.904
Z5B 5.64 1.74 10.9 0.260 1.10 0.200 1.04 10.1 122 3.22 7.70 6.36 86.2 5885 2.58 1.48
Z6S 1.68 0.237 16.2 0.009 0.227 0.014 < 0.05 5.62 7.72 0.113 0.664 0.052 5.32 408 0.468 0.816
A – Velebit Channel, K – Karin Sea, N – Novigrad Sea, Z – Zrmanja River;
S – surface water; B – bottom water.
34 Ž. FIKET et al.: Distribution of Trace Elements in Waters …
Croat. Chem. Acta 2018, 91(1), 29–41 DOI: 10.5562/cca3202
River and the average element mass concentrations reported for world's rivers,[31] the Plitvice lakes,[32] the Lake Baikal,[33] and the groundwater draining carbonate bedrock[34,35] is given in Table 4. For most elements, the measured mass concentrations in the Zrmanja River were 2-25 times lower than the average values reported for the world's rivers, while manganese mass concentrations were two orders of magnitude lower than those reported by Gaillard et al.[31] On the other hand, average mass concentrations of Mo, U and V were comparable with the average mass concentration of these elements in the world's rivers. The exception was Li, whose mass concentrations were up to 3 times higher than the world's average river mass concentrations.[31] The water of the Lake Baikal is described as ultra-fresh, hydrocarbonate and calcium water with a low content of total dissolved solids (< 100 mg L–1),[33] while the
Plitvice lakes represent a pristine karstic freshwater environment.[32] Nevertheless, mass concentrations of most elements in the surface layer of the Zrmanja River were comparable to mass concentrations in the waters of the Lake Baikal,[33] the Plitvice lakes,[32] and the groundwater draining carbonate bedrock,[34,35] with the exception of Al, Fe, Li, Rb and Sr (Table 4). These elements were present in higher mass concentrations in waters of the Zrmanja River, compared to the values quoted by these authors. The latter can attributed to the local geological background characterized by occurrences of bauxite deposits and the predominance of red soil, both of which contain higher mass fractions of Al, Fe, Li, Rb and Sr.[9] Similar chemical compositions of surface water were reported for the nearby Krka River estuary,[30] with exception of Fe and Ba. Namely, both elements were found at higher levels in the waters of the Zrmanja River estuary.
Figure 2. Spatial distribution of the As, Cr, Li, Mo, Ba, Fe, Co and Mn in surface (a) and bottom (b) water of the Zrmanja River estuary (A – Velebit Channel, K – Karin Sea, N – Novigrad Sea, Z - Zrmanja River).

Ž. FIKET et al.: Distribution of Trace Elements in Waters … 35
DOI: 10.5562/cca3202 Croat. Chem. Acta 2018, 91(1), 29–41
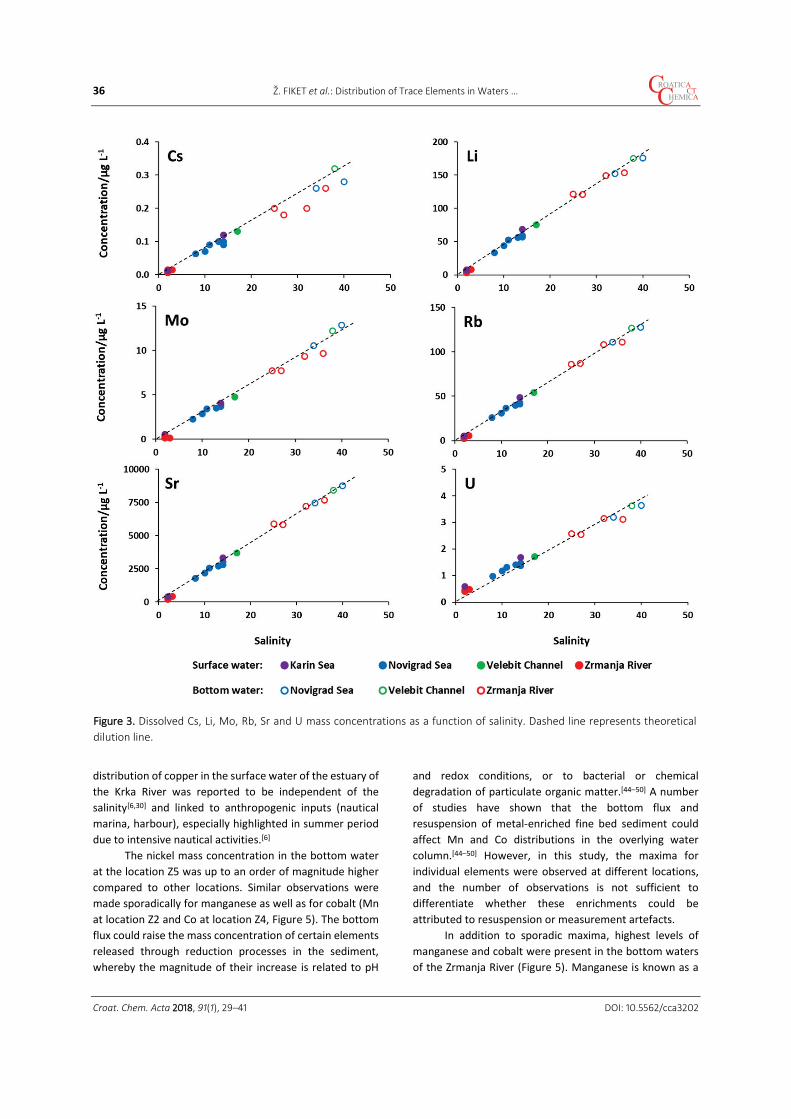
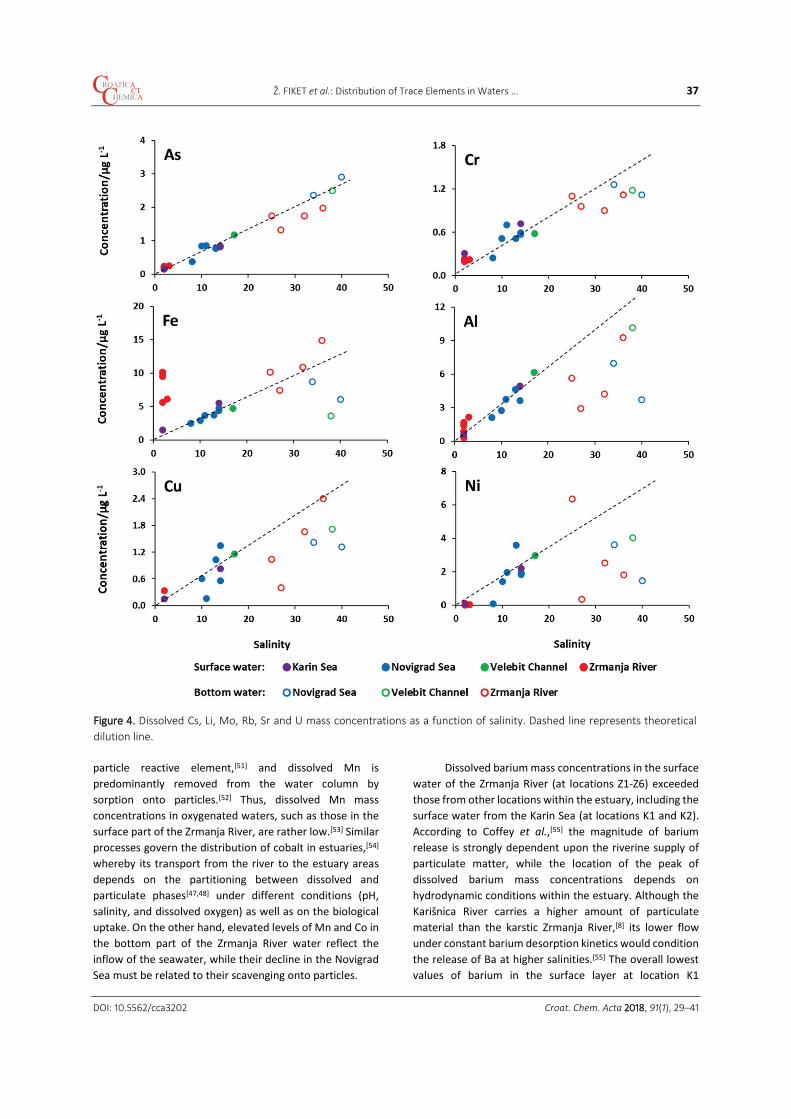
Overall, the measured element mass concentrations in the surface waters of the Zrmanja River estuary were relatively low and typical for unpolluted water. The large discrepancy in the obtained salinity values between the surface and the bottom water was reflected in the water elemental composition as well. The Zrmanja River is a typical karstic, tuffa bearing river,[36] delivering rather low amount of river-borne material into the estuary,[8] particulate as well as dissolved. Compared to the Zrmanja River water, the Adriatic Sea water contains a significantly higher mass concentration of many elements (Table 3). Thus, for correct interpretation, the element mass concentrations will be discussed as a function of salinity. Figures 3–6 show the mass concentrations of measured elements in the surface and the bottom waters in relation to salinity. As shown in Figure 3, elements Cs, Li, Mo, Rb, Sr, and U co-vary in mass concentrations directly with salinity (r = 0.97 to 1.00; p < 0.05), i.e. their behaviour in the Zrmanja River estuary can be described as conservative, as the levels of these elements in different parts of the estuary reflect the intensity of mixing of the river and the sea-water. Similar behaviour was observed in the Krka River estuary for Li, Mo and U.[30] Arsenic and chromium mass concentrations also showed a positive correlation with salinity, but exhibited
slightly lower correlation coefficients than the above-mentioned elements (r = 0.95 and 0.92, respectively; p < 0.05) (Figure 4). The conservative behaviour of arsenic is characteristic for the nearby, well-stratified Krka River estuary,[30,37] while its non-conservative behaviour was usually associated with the biological cycle, diffusion, co-precipitation or anthropogenic inputs.[38] Similarly, the non-conservative behaviour of chromium was reported to be associated with biological uptake, flocculation, or adsorption to particle surfaces.[39] Given the overall low level of metals in the water of the Zrmanja River estuary, levels of As and Cr were considered to predominately reflect the intensity of mixing of the river and the sea-water, while deviation from linearity can be, at least partly, attributed to their removal from the water column by adsorption, co-precipitation and/or biological uptake. The physico-chemical behaviour of iron has been studied in numerous rivers worldwide, under various hydrodynamic conditions.[40] Generally, dissolved iron exhibits non-conservative removal and a rapid decrease in the low salinity zone. This observation is attributed to the flocculation processes. However, the Zrmanja River estuary waters showed an increase in iron mass concentration with salinity (Figure 4), albeit with a certain deviation from the approximated linear trend. In the Novigrad Sea bottom water, iron mass concentrations were somewhat lower than expected by the trendline, suggesting its partial removal from the water column at higher salinities. Due to the slightly basic pH of the river water, prevalence of oxic conditions (up to 95 % in summer period), and low share of suspended solids,[7,8,36] flocculation processes inducing significant Fe removal would be observed only if dissolved Fe mass concentrations where high enough to overpass its solubility, which does not seem to be the case in the Zrmanja River estuary. The observed decrease in iron mass concentrations in the bottom water could thus, presumably, be attributed to its scavenging onto particles. The distribution of Al also showed a deviation from linearity in the bottom layer (Figure 4), suggesting its partial removal from the water column at higher salinities. Various authors argue in favour of both conservative and non-conservative behaviour of aluminium in estuaries and coastal environments.[41–43] In the Zrmanja River estuary, the highest deviation from the expected linear trend was observed for the bottom waters of the Zrmanja River as well as the Novigrad Sea. According to Angel et al.,[43] the presence of suspended particulate material could attenuate dissolved aluminium mass concentrations through adsorption, which is the most probable reason for the observed decline of aluminium mass concentrations in the estuarine bottom waters. Dissolved nickel and copper displayed similar behaviours as aluminium (Figure 4). Interestingly, the
Table 4. Comparison of mean mass concentrations (μg L–1) of measured elements in the surface layer of the Zrmanja River with literature data.[31–34]
Element Zrmanja
River World
rivers[31]
Plitvice
Lakes[32]
Baikal
Lake[33]
Ground-
water[34]
Al 1.28 32 0.731 0.52 –
As 0.203 0.62 0.110 0.41 0.20
Ba 14.5 23 4.59 10.3 5.2
Co 0.011 0.148 0.006 0.034 0.11
Cr 0.217 0.7 0.115 0.048 –
Cs 0.010 0.011 – – 0.003
Cu 0.063 1.48 0.107 0.87 0.19
Fe 8.23 66 0.988 – –
Li 5.65 1.84 0.068 1.93 0.94
Mn 0.168 34 0.186 0.14 –
Mo 0.528 0.420 0.301 1.28 0.16
Ni 0.054 0.810 0.196 0.57 –
Rb 4.02 1.63 – 0.47 0.31
Sr 320 60 39.2 104 197
U 0.442 0.372 0.556 0.50 0.37
V 0.616 0.71 0.873 0.44 – – not measured.
36 Ž. FIKET et al.: Distribution of Trace Elements in Waters …
Croat. Chem. Acta 2018, 91(1), 29–41 DOI: 10.5562/cca3202
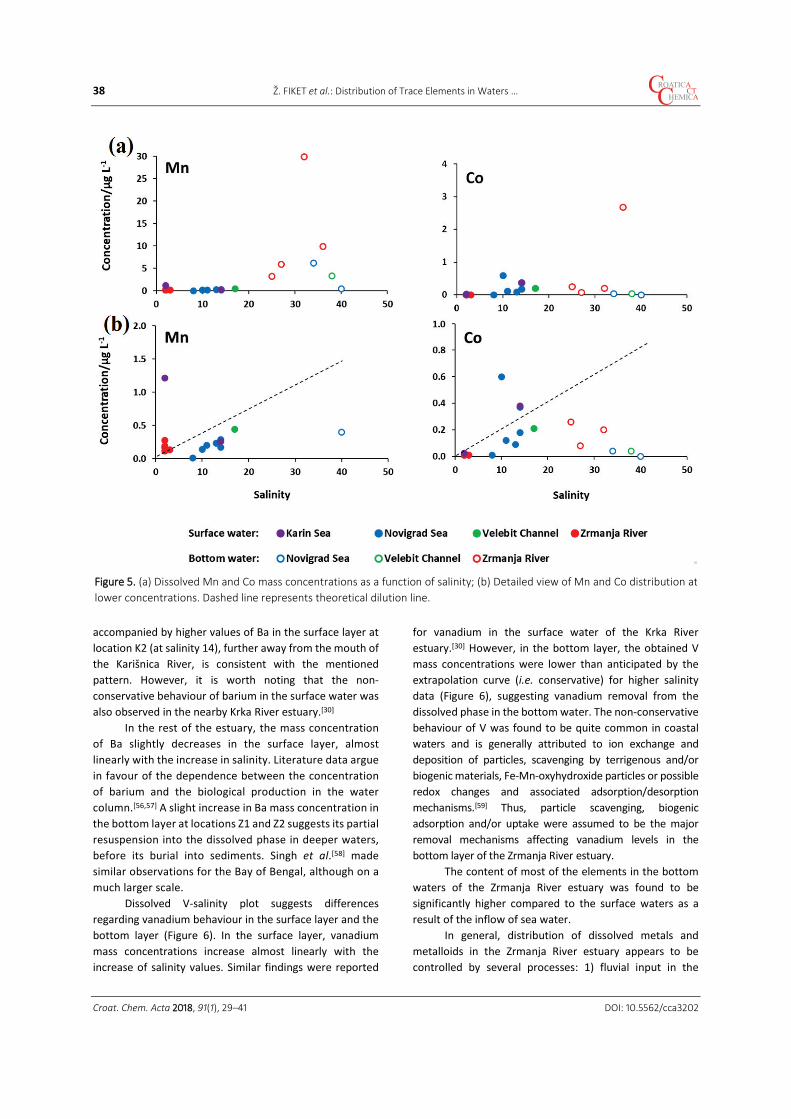
distribution of copper in the surface water of the estuary of the Krka River was reported to be independent of the salinity[6,30] and linked to anthropogenic inputs (nautical marina, harbour), especially highlighted in summer period due to intensive nautical activities.[6] The nickel mass concentration in the bottom water at the location Z5 was up to an order of magnitude higher compared to other locations. Similar observations were made sporadically for manganese as well as for cobalt (Mn at location Z2 and Co at location Z4, Figure 5). The bottom flux could raise the mass concentration of certain elements released through reduction processes in the sediment, whereby the magnitude of their increase is related to pH
and redox conditions, or to bacterial or chemical degradation of particulate organic matter.[44–50] A number of studies have shown that the bottom flux and resuspension of metal-enriched fine bed sediment could affect Mn and Co distributions in the overlying water column.[44–50] However, in this study, the maxima for individual elements were observed at different locations, and the number of observations is not sufficient to differentiate whether these enrichments could be attributed to resuspension or measurement artefacts. In addition to sporadic maxima, highest levels of manganese and cobalt were present in the bottom waters of the Zrmanja River (Figure 5). Manganese is known as a
Figure 3. Dissolved Cs, Li, Mo, Rb, Sr and U mass concentrations as a function of salinity. Dashed line represents theoretical dilution line.
Ž. FIKET et al.: Distribution of Trace Elements in Waters … 37
DOI: 10.5562/cca3202 Croat. Chem. Acta 2018, 91(1), 29–41
particle reactive element,[51] and dissolved Mn is predominantly removed from the water column by sorption onto particles.[52] Thus, dissolved Mn mass concentrations in oxygenated waters, such as those in the surface part of the Zrmanja River, are rather low.[53] Similar processes govern the distribution of cobalt in estuaries,[54] whereby its transport from the river to the estuary areas depends on the partitioning between dissolved and particulate phases[47,48] under different conditions (pH, salinity, and dissolved oxygen) as well as on the biological uptake. On the other hand, elevated levels of Mn and Co in the bottom part of the Zrmanja River water reflect the inflow of the seawater, while their decline in the Novigrad Sea must be related to their scavenging onto particles.
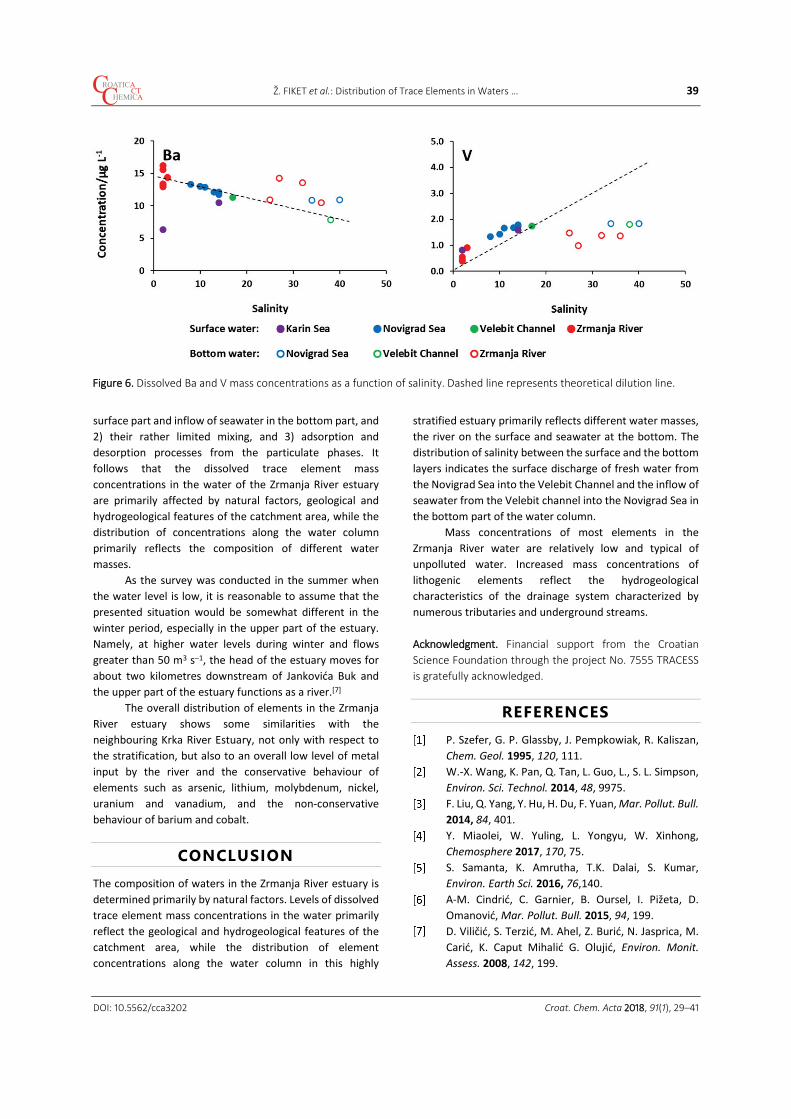
Dissolved barium mass concentrations in the surface water of the Zrmanja River (at locations Z1-Z6) exceeded those from other locations within the estuary, including the surface water from the Karin Sea (at locations K1 and K2). According to Coffey et al.,[55] the magnitude of barium release is strongly dependent upon the riverine supply of particulate matter, while the location of the peak of dissolved barium mass concentrations depends on hydrodynamic conditions within the estuary. Although the Karišnica River carries a higher amount of particulate material than the karstic Zrmanja River,[8] its lower flow under constant barium desorption kinetics would condition the release of Ba at higher salinities.[55] The overall lowest values of barium in the surface layer at location K1
Figure 4. Dissolved Cs, Li, Mo, Rb, Sr and U mass concentrations as a function of salinity. Dashed line represents theoretical dilution line.
38 Ž. FIKET et al.: Distribution of Trace Elements in Waters …
Croat. Chem. Acta 2018, 91(1), 29–41 DOI: 10.5562/cca3202
accompanied by higher values of Ba in the surface layer at location K2 (at salinity 14), further away from the mouth of the Karišnica River, is consistent with the mentioned pattern. However, it is worth noting that the non-conservative behaviour of barium in the surface water was also observed in the nearby Krka River estuary.[30]
In the rest of the estuary, the mass concentration of Ba slightly decreases in the surface layer, almost linearly with the increase in salinity. Literature data argue in favour of the dependence between the concentration of barium and the biological production in the water column.[56,57] A slight increase in Ba mass concentration in the bottom layer at locations Z1 and Z2 suggests its partial resuspension into the dissolved phase in deeper waters, before its burial into sediments. Singh et al.[58] made similar observations for the Bay of Bengal, although on a much larger scale. Dissolved V-salinity plot suggests differences regarding vanadium behaviour in the surface layer and the bottom layer (Figure 6). In the surface layer, vanadium mass concentrations increase almost linearly with the increase of salinity values. Similar findings were reported
for vanadium in the surface water of the Krka River estuary.[30] However, in the bottom layer, the obtained V mass concentrations were lower than anticipated by the extrapolation curve (i.e. conservative) for higher salinity data (Figure 6), suggesting vanadium removal from the dissolved phase in the bottom water. The non-conservative behaviour of V was found to be quite common in coastal waters and is generally attributed to ion exchange and deposition of particles, scavenging by terrigenous and/or biogenic materials, Fe-Mn-oxyhydroxide particles or possible redox changes and associated adsorption/desorption mechanisms.[59] Thus, particle scavenging, biogenic adsorption and/or uptake were assumed to be the major removal mechanisms affecting vanadium levels in the bottom layer of the Zrmanja River estuary. The content of most of the elements in the bottom waters of the Zrmanja River estuary was found to be significantly higher compared to the surface waters as a result of the inflow of sea water. In general, distribution of dissolved metals and metalloids in the Zrmanja River estuary appears to be controlled by several processes: 1) fluvial input in the
Figure 5. (a) Dissolved Mn and Co mass concentrations as a function of salinity; (b) Detailed view of Mn and Co distribution at lower concentrations. Dashed line represents theoretical dilution line.
Ž. FIKET et al.: Distribution of Trace Elements in Waters … 39
DOI: 10.5562/cca3202 Croat. Chem. Acta 2018, 91(1), 29–41
surface part and inflow of seawater in the bottom part, and 2) their rather limited mixing, and 3) adsorption and desorption processes from the particulate phases. It follows that the dissolved trace element mass concentrations in the water of the Zrmanja River estuary are primarily affected by natural factors, geological and hydrogeological features of the catchment area, while the distribution of concentrations along the water column primarily reflects the composition of different water masses. As the survey was conducted in the summer when the water level is low, it is reasonable to assume that the presented situation would be somewhat different in the winter period, especially in the upper part of the estuary. Namely, at higher water levels during winter and flows greater than 50 m3 s–1, the head of the estuary moves for about two kilometres downstream of Jankovića Buk and the upper part of the estuary functions as a river.[7] The overall distribution of elements in the Zrmanja River estuary shows some similarities with the neighbouring Krka River Estuary, not only with respect to the stratification, but also to an overall low level of metal input by the river and the conservative behaviour of elements such as arsenic, lithium, molybdenum, nickel, uranium and vanadium, and the non-conservative behaviour of barium and cobalt.
CONCLUSION The composition of waters in the Zrmanja River estuary is determined primarily by natural factors. Levels of dissolved trace element mass concentrations in the water primarily reflect the geological and hydrogeological features of the catchment area, while the distribution of element concentrations along the water column in this highly
stratified estuary primarily reflects different water masses, the river on the surface and seawater at the bottom. The distribution of salinity between the surface and the bottom layers indicates the surface discharge of fresh water from the Novigrad Sea into the Velebit Channel and the inflow of seawater from the Velebit channel into the Novigrad Sea in the bottom part of the water column. Mass concentrations of most elements in the Zrmanja River water are relatively low and typical of unpolluted water. Increased mass concentrations of lithogenic elements reflect the hydrogeological characteristics of the drainage system characterized by numerous tributaries and underground streams. Acknowledgment. Financial support from the Croatian Science Foundation through the project No. 7555 TRACESS is gratefully acknowledged.
REFERENCES P. Szefer, G. P. Glassby, J. Pempkowiak, R. Kaliszan,
Chem. Geol. 1995, 120, 111. W.-X. Wang, K. Pan, Q. Tan, L. Guo, L., S. L. Simpson,
Environ. Sci. Technol. 2014, 48, 9975. F. Liu, Q. Yang, Y. Hu, H. Du, F. Yuan, Mar. Pollut. Bull.
2014, 84, 401. Y. Miaolei, W. Yuling, L. Yongyu, W. Xinhong,
Chemosphere 2017, 170, 75. S. Samanta, K. Amrutha, T.K. Dalai, S. Kumar,
Environ. Earth Sci. 2016, 76,140. A-M. Cindrić, C. Garnier, B. Oursel, I. Pižeta, D.
Omanović, Mar. Pollut. Bull. 2015, 94, 199. D. Viličić, S. Terzić, M. Ahel, Z. Burić, N. Jasprica, M.
Carić, K. Caput Mihalić G. Olujić, Environ. Monit. Assess. 2008, 142, 199.
Figure 6. Dissolved Ba and V mass concentrations as a function of salinity. Dashed line represents theoretical dilution line.
40 Ž. FIKET et al.: Distribution of Trace Elements in Waters …
Croat. Chem. Acta 2018, 91(1), 29–41 DOI: 10.5562/cca3202
Ž. Fiket, K. Pikelj, M. Ivanić, D. Barišić, N. Vdović, J. Dautović, Ž. Žigovečki Gobac, N. Mikac, V. Bermanec, I. Sondi, G. Kniewald, Reg. Stud. Mar. Sci. 2017, 16, 67.
Ž. Fiket, N. Mikac, G. Kniewald, J. Soils Sediments 2017, 17, 1905.
O. Bonacci, T. Roje-Bonacci, Environ. Earth Sci. 2015, 74, 6767.
Ž. Fiket, N. Mikac, G. Kniewald, J. Geochem. Explor. 2017, 182, 70.
Z. Burić, I. Cetinić, D. Viličić, K. Caput Mihalić, M. Carić, G. Olujić, Mar. Ecol. 2007, 28, 169.
E. Prohić, G. Kniewald, Mar. Chem. 1987, 22, 279. M. Prohić, M. Juračić, Environ. Geol. Water S. 1989,
13, 145. B. Šurija, M. Branica, Sci. Total Environ. 1995, 170,
101. N. Cukrov, V. Cuculić, D. Barišić, S. Lojen, I. Lovrenčić
Mikelić, V. Oreščanin, N. Vdović, Ž. Fiket, B. Čermelj, M. Mlakar, J. Geochem. Explor. 2013, 134, 51.
Statistical Yearbook of the Republic of Croatia, 2009, p.47.
N. Štambuk-Giljanović, Croat. Wat. Manage 2003, 131, 50.
O. Bonacci, Karst Hydrology, Springer Verlag, Berlin, Germany, 1987, p. 184.
O. Bonacci, A. Magdalenić, Ground Water 1993, 31, 767.
Statistical Yearbook of the Republic of Croatia, 2015, p. 49.
National Strategic Plan for Development of Fisheries in Republic of Croatia, 2013, p. 82.
M. Juračić, R. Crmarić, Proceedings of the 3rd Croatian Water Conference (Ed. D. Gereš) 2003, pp. 277–233.
D. Gereš in Manual for Hydraulic Reclamation: Water management aspects of irrigation development in Croatian coastal and inland areas (Eds., N. Ožanić, Č. Benac A. DeLuka Tibljaš I. Vrkljan), Rijeka, Faculty of Civil Engineering, University of Rijeka 2007, pp. 23–68.
Z. Burić, I. Cetinić, D. Viličić, K. Caput Mihalić, M. Carić, G. Olujić, Mar. Ecol. 2007, 28, 169.
G. Olujić, H. Mihanović, M. Carić, Z. Gržetić in Izmjena vode u stratifciranom estuariju Zrmanje, Zbornik radova 4. hrvatske konferencije o vodama (Ed. D. Gereš), Sveučilišna tiskara, Zagreb 2007, pp. 185–192.
T. Legović, Mar. Chem., 1991, 32, 121. O. Bonacci, Hydrolog. Sci. J. 1999, 44, 373. Ž. Fiket, V. Roje, N. Mikac, G. Kniewald, Croat. Chem.
Acta 2007, 80, 91.
N. Mikac, V. Roje, J. Dautović, G. Kniewald, N. Cukrov, Distribution of metals and metalloids in the sediment and the river mouth of the river Krka. In Proceedings of the Symposium Rijeka Krka and Krka National Park Natural and cultural heritage, protection and sustainable development (Ed. D. Marguš), Šibenik, Hrvatska 2007, pp. 823–838.
J. Gaillardet, J. Veirs, B. Dupré in Treatise on geochemistry, Vol. 5 (Ed.: J. I. Drever), Elsevier, Amsterdam 2003, pp. 225–272.
J. Dautović, Ž. Fiket, J. Barešić, M. Ahel, N. Mikac, Aquat. Geochem. 2014, 20, 19.
A. N. Suturin, L. F. Paradina, V. N. Epov, A. R. Semenov, V. L. Lozhkin, L. L. Petrov, Spectrochim. Acta Part B 2003, 58, 277.
C. Potot, G. Féraud, U. Schärer, A. Barats, G. Durrieu, C. Le Poupon, Y. Travi, R. Simler, J. Hydrol. 2012, 472, 126.
Ž. Fiket, M. Rožmarić, M. Krmpotić, Lj. Benedik, Environ. Sci. Pollut. Res. 2015, 22, 6789.
G. Pavlović, E. Prohić, S. Miko, D. Tibljaš, Facies 2002, 46, 27.
P. Seyler J.-M. Martin, Mar. Chem. 1991, 34, 151. P. L. Smedley, D. G. Kinniburgh, Appl. Geochem.
2002, 17, 517. A. M. Shiller, E. A. Boyle, Geochim. Cosmochim. Acta
1991, 55, 3241. B. Ouddane, M. Skiker, J. C. Fischer, M. Wartel, J.
Environ. Monit. 1999, 1, 489. L. Chou, R. Wollast, Deep-Sea Res. 1997, 44, 741. M. T. Brown, K. W. Bruland, Estuar. Coast. Shelf Sci.
2009, 84, 171. B. M. Angel, S. C. Apte, G. E. Batley, L. A. Goldin,
Environ. Chem. 2015, 13, 118. K. S. Johnson, W. M. Berelson, K. H. Coale, T. L. Coley,
V. A. Elrod, W. R. Fairly, H. D.Iams, T. E. Kilgore, J.L. Nowicki, Science 1992, 257, 1242.
E. L. Rue, G. J. Smith, G. A. Cutter, K. W. Bruland, Deep Sea Res. 1997, I/44, 113.
J. S. Roitz, A. R. Flegal, K. W. Bruland, Estuar. Coast. Shelf Sci. 2002, 54, 227.
M. Martino, A. Turner, M. Nimmo, G. E. Millward, Mar. Chem. 2002, 77, 171.
A. Tovar-Sánchez, S. A. Sañudo-Wilhelmy, R. A. Flegal, Estuar. Coast. Shelf Sci. 2004, 60, 717.
S. Audry, G. Blanc, J. Schäfer, G. Chaillou, S. Robert, Geochim. Cosmochim. Acta 2006, 70, 2264.
J. Santos-Echeandia, R. Prego, A. Cobelo-García, G. E. Millward, Mar. Chem. 2009, 117, 77.
D. W. Evans, N. H. Cutshall, F. A. Cross, D. A. Wolfe, Estuar. Coast. Mar. Sci. 1977, 5, 71.
C. D. Hunt, Limnol. Oceanogr. 1983, 28, 302.

Ž. FIKET et al.: Distribution of Trace Elements in Waters … 41
DOI: 10.5562/cca3202 Croat. Chem. Acta 2018, 91(1), 29–41
W. Balzer, Geochim. Cosmochim. Acta 1982, 46, 1153. H. Takata, T. Aono, K. Tagami, S. Uchida, Estuar.
Coast. Shelf Sci. 2010, 89, 294. M. Coffey, F. Dehairs, O. Collette, G. Luther, T. Church,
T. Jickells, Estuar. Coast. Shelf Sci. 1997, 45, 113. F. Baldi, M. Pepi, D. Burrini, G. Kniewald, D. Scali, E.
Lanciotti, Appl. Environ. Microbiol. 1996, 62, 2398.
K. Pfeifer, S. Kasten, C. Hensen, H. D. Schulz, Mar. Geol. 2001, 177, 13.
S. P. Singh, S. K. Singh, R. Bhushan, Mar. Chem. 2013, 154, 12.
D. Wang, S. A. Sañudo Wilhelmy, Mar. Chem. 2009, 117, 52.
Related Documents


