Determination of Arsenic and Other Trace Elements in Bottled Waters by High Resolution Inductively Coupled Plasma Mass Spectrometry @eljka Fiket,* Vibor Roje, Nevenka Mikac, and Goran Kniewald Center for Marine and Environmental Research, Ru|er Bo{kovi} Institute, P.O. Box 180, HR-10002 Zagreb, Croatia RECEIVED MAY 19, 2006; REVISED NOVEMBER 30, 2006; ACCEPTED JANUARY 19, 2007 Concentrations of arsenic and other trace elements in 18 different brands of bottled, mineral and spring, water in Croatia were investigated. For comparison, samples of tap water from Ri- jeka, Lourdes and Zagreb were also analyzed. The high resolution inductively coupled plasma mass spectrometry (HR ICP-MS) was used for the analysis. Results obtained were compared to Croatian maximum allowable levels for trace elements in drinking, mineral and tap water, as well as WHO and EPA drinking water standards. Concentration levels of all analyzed elements investigated in all examined water samples were below the maximum contaminant level pre- scribed by Croatian, WHO and EPA regulations. Keywords arsenic bottled water drinking water HR ICP-MS tap water trace elements * Author to whom correspondence should be addressed. (E-mail: zeljka.fiket@irb.hr) CROATICA CHEMICA ACTA CCACAA 80 (1) 91¿100 (2007) ISSN-0011-1643 CCA-3144 Original Scientific Paper INTRODUCTION Water is an essential component for life and an impor- tant source of intake of trace elements in humans. There- fore, its quality is of great importance to human health. Trace elements can be categorized into those essential to human life, such as Co, Cr, Cu, Fe, Mn, Mo, Se and Zn, and those potentially toxic, like Ag, Al, As, Cd, Pb and Ni. The presence of non-essential and toxic elements does not necessarily indicate that water consumption poses a health risk. Also, certain essential trace elements (e.g., Co, Cr, Fe, Mn, and Se) can be toxic when concentra- tions are raised above specific cut-off levels. Recently, arsenic has become increasingly important in environmental geochemistry because of its significan- ce for human health. It is widely distributed and human exposure is inevitable. Arsenic in drinking water is one of the most serious environmental health hazards faced by populations in many areas of the world, including the northeastern part of Croatia. 1 Arsenic is highly toxic and can lead to a wide range of health problems. 2,3 It is car- cinogenic, mutagenic and teratogenic. 2-4 Among the va- rious sources of As in the environment, drinking water probably poses the greatest threat to human health. Ar- senic is naturally introduced into water by dissolution of minerals and ores, and by the percolation of groundwa- ter through arsenic-enriched rocks. Anthropogenic sour- ces of arsenic are wood preservatives, alloying agents and the combustion of fossil fuels. Inorganic arsenic occurs in the environment in several forms – in natural waters it is mostly found as the trivalent As III arsenite species or the pentavalent arsenate As V . Organic arsenic species, found in seafood, are easily eliminated by the human body and thus much less toxic than inorganic arsenic forms (ref. WHO factsheet 210, 2001). Following accu- mulation of the evidence for chronic toxicological effects of As in drinking water, recommended and regulatory

Welcome message from author
This document is posted to help you gain knowledge. Please leave a comment to let me know what you think about it! Share it to your friends and learn new things together.
Transcript
Determination of Arsenic and Other Trace Elements in Bottled Watersby High Resolution Inductively Coupled Plasma Mass Spectrometry
@eljka Fiket,* Vibor Roje, Nevenka Mikac, and Goran Kniewald
Center for Marine and Environmental Research, Ru|er Bo{kovi} Institute, P.O. Box 180,HR-10002 Zagreb, Croatia
RECEIVED MAY 19, 2006; REVISED NOVEMBER 30, 2006; ACCEPTED JANUARY 19, 2007
Concentrations of arsenic and other trace elements in 18 different brands of bottled, mineraland spring, water in Croatia were investigated. For comparison, samples of tap water from Ri-jeka, Lourdes and Zagreb were also analyzed. The high resolution inductively coupled plasmamass spectrometry (HR ICP-MS) was used for the analysis. Results obtained were compared toCroatian maximum allowable levels for trace elements in drinking, mineral and tap water, aswell as WHO and EPA drinking water standards. Concentration levels of all analyzed elementsinvestigated in all examined water samples were below the maximum contaminant level pre-scribed by Croatian, WHO and EPA regulations.
Keywordsarsenic
bottled waterdrinking water
HR ICP-MStap water
trace elements
* Author to whom correspondence should be addressed. (E-mail: [email protected])
CROATICA CHEMICA ACTACCACAA 80 (1) 91¿100 (2007)
ISSN-0011-1643CCA-3144
Original Scientific Paper
INTRODUCTION
Water is an essential component for life and an impor-tant source of intake of trace elements in humans. There-fore, its quality is of great importance to human health.Trace elements can be categorized into those essential tohuman life, such as Co, Cr, Cu, Fe, Mn, Mo, Se and Zn,and those potentially toxic, like Ag, Al, As, Cd, Pb andNi. The presence of non-essential and toxic elements doesnot necessarily indicate that water consumption poses ahealth risk. Also, certain essential trace elements (e.g.,Co, Cr, Fe, Mn, and Se) can be toxic when concentra-tions are raised above specific cut-off levels.
Recently, arsenic has become increasingly importantin environmental geochemistry because of its significan-ce for human health. It is widely distributed and humanexposure is inevitable. Arsenic in drinking water is oneof the most serious environmental health hazards facedby populations in many areas of the world, including the
northeastern part of Croatia.1 Arsenic is highly toxic andcan lead to a wide range of health problems.2,3 It is car-cinogenic, mutagenic and teratogenic.2-4 Among the va-rious sources of As in the environment, drinking waterprobably poses the greatest threat to human health. Ar-senic is naturally introduced into water by dissolution ofminerals and ores, and by the percolation of groundwa-ter through arsenic-enriched rocks. Anthropogenic sour-ces of arsenic are wood preservatives, alloying agents andthe combustion of fossil fuels. Inorganic arsenic occursin the environment in several forms – in natural waters itis mostly found as the trivalent AsIII arsenite species orthe pentavalent arsenate AsV. Organic arsenic species,found in seafood, are easily eliminated by the humanbody and thus much less toxic than inorganic arsenicforms (ref. WHO factsheet 210, 2001). Following accu-mulation of the evidence for chronic toxicological effectsof As in drinking water, recommended and regulatory
limits of many authorities are being lowered.3,5 Croatiahas set a new limit for As in mineral and spring water of10 µg/L, starting from 1.1.2007.6 The World Health Or-ganization (WHO) guideline value for As in drinkingwater was provisionally lowered in 1993 from 50 to 10µg/L.7 The new recommended value is based largely onanalytical capability. The United States EnvironmentalProtection Agency (EPA) limit was also lowered from50 to 10 µg/L in 2001.8
Trace metals may occur naturally in groundwater invery small amounts and may include arsenic, barium,cadmium, chromium, lead, mercury, selenium, silver andzinc. In small amounts, these are harmless and in somecases even beneficial to health. Amounts over drinkingwater standards may have serious health effects. Essen-tial or non-essential elements, when present at elevatedlevels can cause morphological abnormalities, reducedgrowth, increased mortality and mutagenic effects in hu-mans.9 To avoid potential health hazard caused by ele-vated concentrations of trace elements in drinking water,Croatia has passed regulations for maximum allowablelevels of these elements in drinking and bottled, mineraland spring, water.6,10-12 International standards have alsobeen set by WHO7 and EPA.8
Nowadays, bottled water is widely consumed due toits accessibility, relatively low cost, better taste and lo-wer levels of impurities. Croatian bottled water is alsoan important export article to countries of the EuropeanUnion and must therefore meet their standards for bottledwaters. Apart from the use of bottled water as drinkingwater, it has found usage in food preparation, skin careand filling humidifiers.13
Determination of trace elements in drinking waterrequires a method where low levels of detection can beobtained. In the last decade, inductively coupled plasmamass spectrometry has become a method of choice inanalysis of water samples of different origin.14-17 Doublefocusing sector field ICP-MS enables direct determina-tion of elements of interest with no preconcentration orisolation required.17 Next to the ability for multielementanalysis, double focusing ICP-MS also offers high sen-sitivity over a wide linear range and low limits of detec-tion.16-20
This research was carried out to provide an insightinto the levels of trace elements in bottled, mineral andspring, water currently present on the Croatian market.
Declarations on the chemical composition of bottledwater (given by the producers) generally report onlyconcentrations of major elements (Ca, Mg, Na, and K).In this study, bottled waters are classified as mineral andspring waters according to bottle declaration labels. Thedistinction between mineral and spring water is based ontheir specific characteristics, primarily their total dissolv-ed solids content. According to the US Food and DrugAdministration (FDA),21 mineral water is distinguished
from other types of bottled water by its constant level andrelative proportions of mineral and trace elements at thepoint of emergence from the source, containing not lessthan 250 parts per million of total dissolved solids. Springbottled water is the water derived from an undergroundsource from which water flows naturally to the surfaceof the earth where it is collected only at the spring orthrough a borehole tapping the underground formationfeeding the spring. Attention has been focused particu-larly on trace elements for most of which no data wereavailable for mineral and spring waters of Croatia.
In this paper, the results of investigating the concen-tration of 23 trace elements (Ag, Al, As, B, Ba, Cd, Co,Cr, Cu, Fe, Li, Mn, Mo, Ni, Pb, Sb, Se, Sr, Ti, Tl, U, Vand Zn) in 18 brands of bottled water are presented. Forcomparison, 5 samples of tap water, one from Rijeka andLourdes and three from Zagreb were analyzed for the sameelements. Aims of this study were (1) to quantify the le-vels of trace elements in bottled water in Croatia, and (2)to compare obtained values with the Croatian, WHO andEPA drinking water standards.
EXPERIMENTAL
Instrumentation
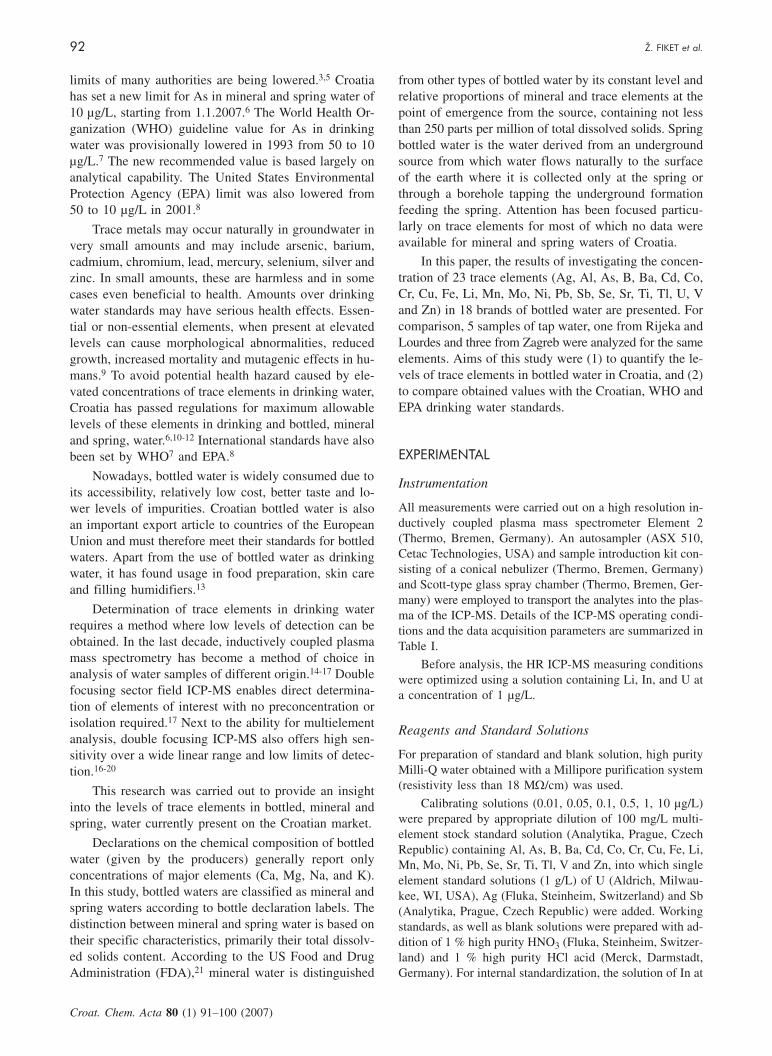
All measurements were carried out on a high resolution in-ductively coupled plasma mass spectrometer Element 2(Thermo, Bremen, Germany). An autosampler (ASX 510,Cetac Technologies, USA) and sample introduction kit con-sisting of a conical nebulizer (Thermo, Bremen, Germany)and Scott-type glass spray chamber (Thermo, Bremen, Ger-many) were employed to transport the analytes into the plas-ma of the ICP-MS. Details of the ICP-MS operating condi-tions and the data acquisition parameters are summarized inTable I.
Before analysis, the HR ICP-MS measuring conditionswere optimized using a solution containing Li, In, and U ata concentration of 1 µg/L.
Reagents and Standard Solutions
For preparation of standard and blank solution, high purityMilli-Q water obtained with a Millipore purification system(resistivity less than 18 MW/cm) was used.
Calibrating solutions (0.01, 0.05, 0.1, 0.5, 1, 10 µg/L)were prepared by appropriate dilution of 100 mg/L multi-element stock standard solution (Analytika, Prague, CzechRepublic) containing Al, As, B, Ba, Cd, Co, Cr, Cu, Fe, Li,Mn, Mo, Ni, Pb, Se, Sr, Ti, Tl, V and Zn, into which singleelement standard solutions (1 g/L) of U (Aldrich, Milwau-kee, WI, USA), Ag (Fluka, Steinheim, Switzerland) and Sb(Analytika, Prague, Czech Republic) were added. Workingstandards, as well as blank solutions were prepared with ad-dition of 1 % high purity HNO3 (Fluka, Steinheim, Switzer-land) and 1 % high purity HCl acid (Merck, Darmstadt,Germany). For internal standardization, the solution of In at
92 @. FIKET et al.
Croat. Chem. Acta 80 (1) 91–100 (2007)
a concentration of 1 µg/L was used. Quantification of traceelement concentration was performed by weighted regres-sion of the calibration curves. All containers used were pre-viously cleaned by soaking for several days in 10 % HNO3solution and rinsed with Milli-Q water before use.
Collection and Preparation of Samples
A total of 24 bottled water, 16 spring and 8 mineral, and 5tap water samples were analyzed for total concentration of23 trace elements (Ag, Al, As, Cd, B, Ba, Co, Cr, Cu, Fe,Li, Mn, Mo, Ni, Pb, Sb, Se, Sr, Ti, Tl, U, V and Zn). Bot-tled water samples were obtained from two Croatian stores.All the brands were in plastic containers with plastic screwcaps and capacity of 1.5 L, except one carbonated water brandin 1 L plastic container. Sparkling bottled waters were de-gassed by leaving overnight in a laminar flow clean airbench.
Tap water samples were collected in polyethylene con-tainers from five different locations. Prior to sampling, thewater was flushed for 2 minutes and the containers wererinsed three times with the water to be sampled. Sampleswere analyzed within two days from the time of collection.
Samples were acidified with 1 % HNO3 and 1 % HCland internal standard was added 24 hours before measure-ments were made. The mixture of HNO3 and HCl was used
as stabilizing agent for water samples since measurementsof Sb require the addition of HCl for quantitative preserva-tion. Also, better flushing of the system and lower retentionof metals in the system is achieved with this mixture. Noadditional dilution of samples was performed. All sampleswere prepared in triplicate. Limits of detection were calcu-lated as three times the standard deviation (3s) of the blankvalues.
Quality Control
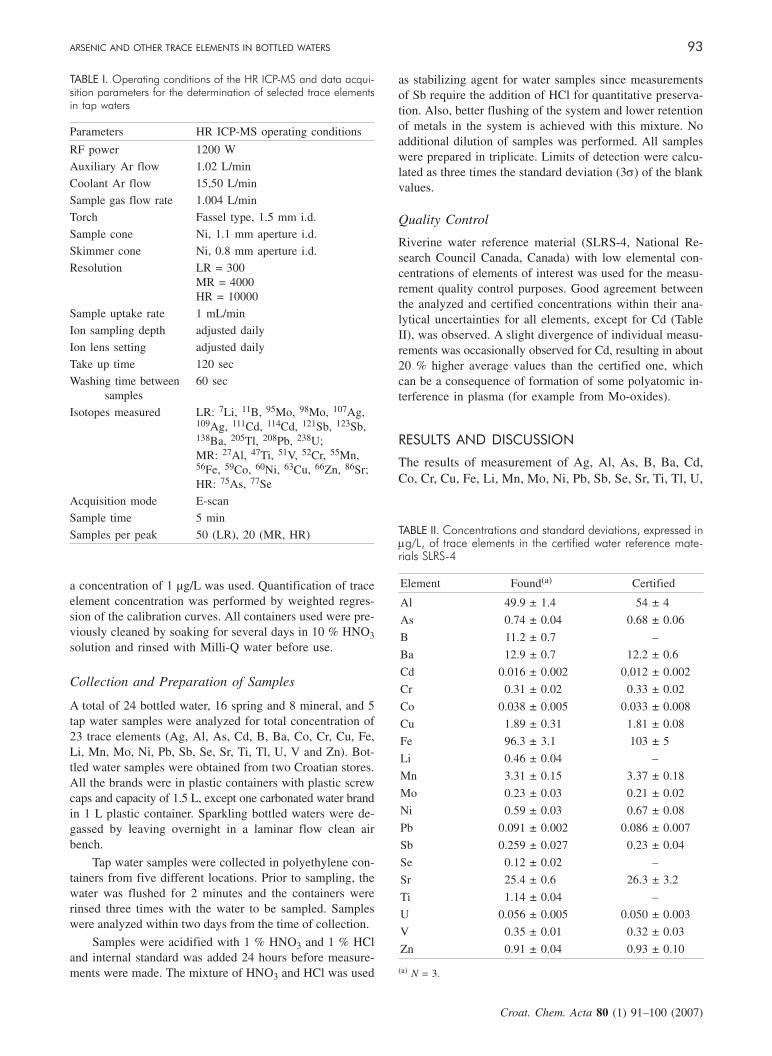
Riverine water reference material (SLRS-4, National Re-search Council Canada, Canada) with low elemental con-centrations of elements of interest was used for the measu-rement quality control purposes. Good agreement betweenthe analyzed and certified concentrations within their ana-lytical uncertainties for all elements, except for Cd (TableII), was observed. A slight divergence of individual measu-rements was occasionally observed for Cd, resulting in about20 % higher average values than the certified one, whichcan be a consequence of formation of some polyatomic in-terference in plasma (for example from Mo-oxides).
RESULTS AND DISCUSSION
The results of measurement of Ag, Al, As, B, Ba, Cd,Co, Cr, Cu, Fe, Li, Mn, Mo, Ni, Pb, Sb, Se, Sr, Ti, Tl, U,
ARSENIC AND OTHER TRACE ELEMENTS IN BOTTLED WATERS 93
Croat. Chem. Acta 80 (1) 91–100 (2007)
TABLE I. Operating conditions of the HR ICP-MS and data acqui-sition parameters for the determination of selected trace elementsin tap waters
Parameters HR ICP-MS operating conditions
RF power
Auxiliary Ar flow
Coolant Ar flow
Sample gas flow rate
Torch
Sample cone
Skimmer cone
Resolution
Sample uptake rate
Ion sampling depth
Ion lens setting
Take up time
Washing time betweensamples
Isotopes measured
Acquisition mode
Sample time
Samples per peak
1200 W
1.02 L/min
15,50 L/min
1.004 L/min
Fassel type, 1.5 mm i.d.
Ni, 1.1 mm aperture i.d.
Ni, 0.8 mm aperture i.d.
LR = 300MR = 4000HR = 10000
1 mL/min
adjusted daily
adjusted daily
120 sec
60 sec
LR: 7Li, 11B, 95Mo, 98Mo, 107Ag,109Ag, 111Cd, 114Cd, 121Sb, 123Sb,138Ba, 205Tl, 208Pb, 238U;MR: 27Al, 47Ti, 51V, 52Cr, 55Mn,56Fe, 59Co, 60Ni, 63Cu, 66Zn, 86Sr;HR: 75As, 77Se
E-scan
5 min
50 (LR), 20 (MR, HR) TABLE II. Concentrations and standard deviations, expressed inmg/L, of trace elements in the certified water reference mate-rials SLRS-4
Element Found(a) Certified
Al
As
B
Ba
Cd
Cr
Co
Cu
Fe
Li
Mn
Mo
Ni
Pb
Sb
Se
Sr
Ti
U
V
Zn
49.9 ± 1.4
0.74 ± 0.04
11.2 ± 0.7
12.9 ± 0.7
0.016 ± 0.002
0.31 ± 0.02
0.038 ± 0.005
1.89 ± 0.31
96.3 ± 3.1
0.46 ± 0.04
3.31 ± 0.15
0.23 ± 0.03
0.59 ± 0.03
0.091 ± 0.002
0.259 ± 0.027
0.12 ± 0.02
25.4 ± 0.6
1.14 ± 0.04
0.056 ± 0.005
0.35 ± 0.01
0.91 ± 0.04
54 ± 4
0.68 ± 0.06
–
12.2 ± 0.6
0.012 ± 0.002
0.33 ± 0.02
0.033 ± 0.008
1.81 ± 0.08
103 ± 5
–
3.37 ± 0.18
0.21 ± 0.02
0.67 ± 0.08
0.086 ± 0.007
0.23 ± 0.04
–
26.3 ± 3.2
–
0.050 ± 0.003
0.32 ± 0.03
0.93 ± 0.10
(a) N = 3.
94
@.
FIK
ET
et
al.
Croat.
Chem
.A
cta80
(1)91–100
(2007)
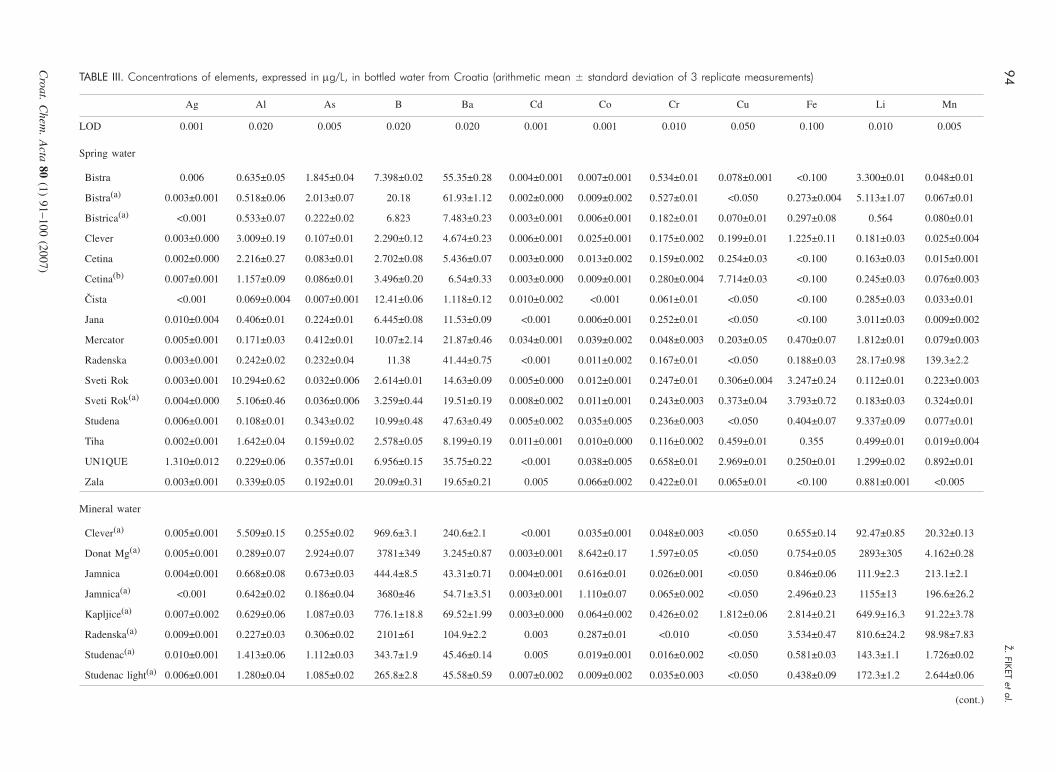
TABLE III. Concentrations of elements, expressed in mg/L, in bottled water from Croatia (arithmetic mean ± standard deviation of 3 replicate measurements)
Ag Al As B Ba Cd Co Cr Cu Fe Li Mn
LOD 0.001 0.020 0.005 0.020 0.020 0.001 0.001 0.010 0.050 0.100 0.010 0.005
Spring water
Bistra 0.006 0.635±0.05 1.845±0.04 7.398±0.02 55.35±0.28 0.004±0.001 0.007±0.001 0.534±0.01 0.078±0.001 <0.100 3.300±0.01 0.048±0.01
Bistra(a) 0.003±0.001 0.518±0.06 2.013±0.07 20.18 61.93±1.12 0.002±0.000 0.009±0.002 0.527±0.01 <0.050 0.273±0.004 5.113±1.07 0.067±0.01
Bistrica(a) <0.001 0.533±0.07 0.222±0.02 6.823 7.483±0.23 0.003±0.001 0.006±0.001 0.182±0.01 0.070±0.01 0.297±0.08 0.564 0.080±0.01
Clever 0.003±0.000 3.009±0.19 0.107±0.01 2.290±0.12 4.674±0.23 0.006±0.001 0.025±0.001 0.175±0.002 0.199±0.01 1.225±0.11 0.181±0.03 0.025±0.004
Cetina 0.002±0.000 2.216±0.27 0.083±0.01 2.702±0.08 5.436±0.07 0.003±0.000 0.013±0.002 0.159±0.002 0.254±0.03 <0.100 0.163±0.03 0.015±0.001
Cetina(b) 0.007±0.001 1.157±0.09 0.086±0.01 3.496±0.20 6.54±0.33 0.003±0.000 0.009±0.001 0.280±0.004 7.714±0.03 <0.100 0.245±0.03 0.076±0.003
^ista <0.001 0.069±0.004 0.007±0.001 12.41±0.06 1.118±0.12 0.010±0.002 <0.001 0.061±0.01 <0.050 <0.100 0.285±0.03 0.033±0.01
Jana 0.010±0.004 0.406±0.01 0.224±0.01 6.445±0.08 11.53±0.09 <0.001 0.006±0.001 0.252±0.01 <0.050 <0.100 3.011±0.03 0.009±0.002
Mercator 0.005±0.001 0.171±0.03 0.412±0.01 10.07±2.14 21.87±0.46 0.034±0.001 0.039±0.002 0.048±0.003 0.203±0.05 0.470±0.07 1.812±0.01 0.079±0.003
Radenska 0.003±0.001 0.242±0.02 0.232±0.04 11.38 41.44±0.75 <0.001 0.011±0.002 0.167±0.01 <0.050 0.188±0.03 28.17±0.98 139.3±2.2
Sveti Rok 0.003±0.001 10.294±0.62 0.032±0.006 2.614±0.01 14.63±0.09 0.005±0.000 0.012±0.001 0.247±0.01 0.306±0.004 3.247±0.24 0.112±0.01 0.223±0.003
Sveti Rok(a) 0.004±0.000 5.106±0.46 0.036±0.006 3.259±0.44 19.51±0.19 0.008±0.002 0.011±0.001 0.243±0.003 0.373±0.04 3.793±0.72 0.183±0.03 0.324±0.01
Studena 0.006±0.001 0.108±0.01 0.343±0.02 10.99±0.48 47.63±0.49 0.005±0.002 0.035±0.005 0.236±0.003 <0.050 0.404±0.07 9.337±0.09 0.077±0.01
Tiha 0.002±0.001 1.642±0.04 0.159±0.02 2.578±0.05 8.199±0.19 0.011±0.001 0.010±0.000 0.116±0.002 0.459±0.01 0.355 0.499±0.01 0.019±0.004
UN1QUE 1.310±0.012 0.229±0.06 0.357±0.01 6.956±0.15 35.75±0.22 <0.001 0.038±0.005 0.658±0.01 2.969±0.01 0.250±0.01 1.299±0.02 0.892±0.01
Zala 0.003±0.001 0.339±0.05 0.192±0.01 20.09±0.31 19.65±0.21 0.005 0.066±0.002 0.422±0.01 0.065±0.01 <0.100 0.881±0.001 <0.005
Mineral water
Clever(a) 0.005±0.001 5.509±0.15 0.255±0.02 969.6±3.1 240.6±2.1 <0.001 0.035±0.001 0.048±0.003 <0.050 0.655±0.14 92.47±0.85 20.32±0.13
Donat Mg(a) 0.005±0.001 0.289±0.07 2.924±0.07 3781±349 3.245±0.87 0.003±0.001 8.642±0.17 1.597±0.05 <0.050 0.754±0.05 2893±305 4.162±0.28
Jamnica 0.004±0.001 0.668±0.08 0.673±0.03 444.4±8.5 43.31±0.71 0.004±0.001 0.616±0.01 0.026±0.001 <0.050 0.846±0.06 111.9±2.3 213.1±2.1
Jamnica(a) <0.001 0.642±0.02 0.186±0.04 3680±46 54.71±3.51 0.003±0.001 1.110±0.07 0.065±0.002 <0.050 2.496±0.23 1155±13 196.6±26.2
Kapljice(a) 0.007±0.002 0.629±0.06 1.087±0.03 776.1±18.8 69.52±1.99 0.003±0.000 0.064±0.002 0.426±0.02 1.812±0.06 2.814±0.21 649.9±16.3 91.22±3.78
Radenska(a) 0.009±0.001 0.227±0.03 0.306±0.02 2101±61 104.9±2.2 0.003 0.287±0.01 <0.010 <0.050 3.534±0.47 810.6±24.2 98.98±7.83
Studenac(a) 0.010±0.001 1.413±0.06 1.112±0.03 343.7±1.9 45.46±0.14 0.005 0.019±0.001 0.016±0.002 <0.050 0.581±0.03 143.3±1.1 1.726±0.02
Studenac light(a) 0.006±0.001 1.280±0.04 1.085±0.02 265.8±2.8 45.58±0.59 0.007±0.002 0.009±0.002 0.035±0.003 <0.050 0.438±0.09 172.3±1.2 2.644±0.06
(cont.)
ARSEN
ICA
ND
OTH
ER
TRA
CE
ELEM
EN
TS
INBO
TTLED
WATERS
95
Croat.
Chem
.A
cta80
(1)91–100
(2007)
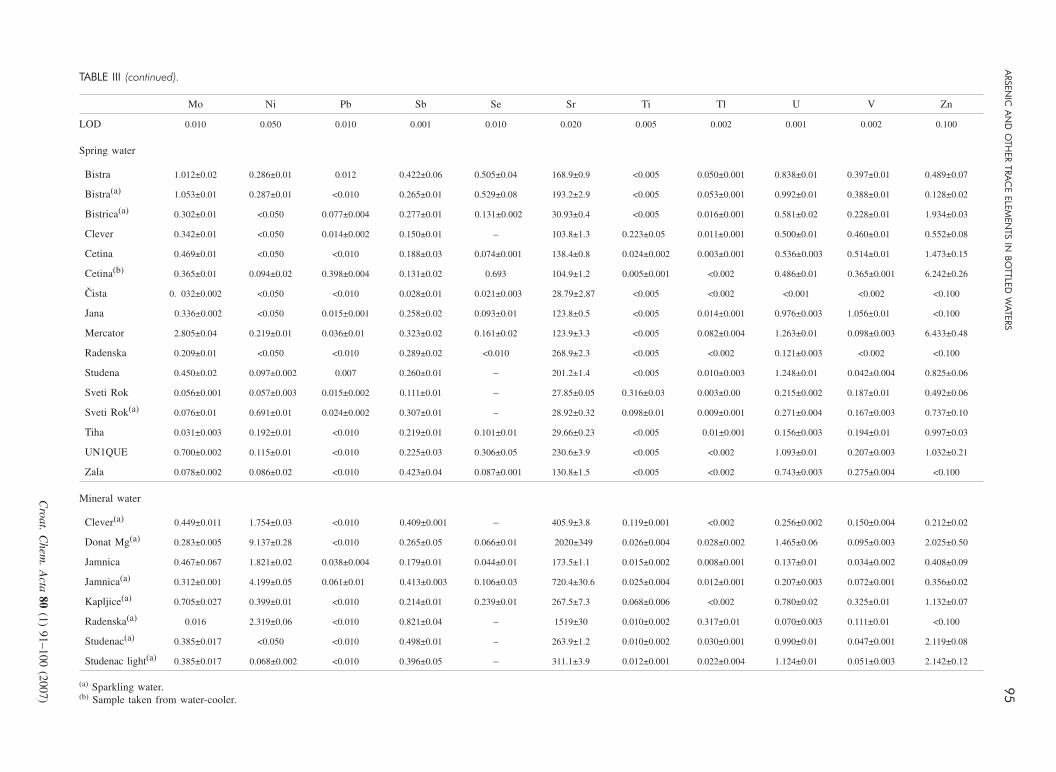
TABLE III (continued).
Mo Ni Pb Sb Se Sr Ti Tl U V Zn
LOD 0.010 0.050 0.010 0.001 0.010 0.020 0.005 0.002 0.001 0.002 0.100
Spring water
Bistra 1.012±0.02 0.286±0.01 0.012 0.422±0.06 0.505±0.04 168.9±0.9 <0.005 0.050±0.001 0.838±0.01 0.397±0.01 0.489±0.07
Bistra(a) 1.053±0.01 0.287±0.01 <0.010 0.265±0.01 0.529±0.08 193.2±2.9 <0.005 0.053±0.001 0.992±0.01 0.388±0.01 0.128±0.02
Bistrica(a) 0.302±0.01 <0.050 0.077±0.004 0.277±0.01 0.131±0.002 30.93±0.4 <0.005 0.016±0.001 0.581±0.02 0.228±0.01 1.934±0.03
Clever 0.342±0.01 <0.050 0.014±0.002 0.150±0.01 – 103.8±1.3 0.223±0.05 0.011±0.001 0.500±0.01 0.460±0.01 0.552±0.08
Cetina 0.469±0.01 <0.050 <0.010 0.188±0.03 0.074±0.001 138.4±0.8 0.024±0.002 0.003±0.001 0.536±0.003 0.514±0.01 1.473±0.15
Cetina(b) 0.365±0.01 0.094±0.02 0.398±0.004 0.131±0.02 0.693 104.9±1.2 0.005±0.001 <0.002 0.486±0.01 0.365±0.001 6.242±0.26
^ista 0. 032±0.002 <0.050 <0.010 0.028±0.01 0.021±0.003 28.79±2.87 <0.005 <0.002 <0.001 <0.002 <0.100
Jana 0.336±0.002 <0.050 0.015±0.001 0.258±0.02 0.093±0.01 123.8±0.5 <0.005 0.014±0.001 0.976±0.003 1.056±0.01 <0.100
Mercator 2.805±0.04 0.219±0.01 0.036±0.01 0.323±0.02 0.161±0.02 123.9±3.3 <0.005 0.082±0.004 1.263±0.01 0.098±0.003 6.433±0.48
Radenska 0.209±0.01 <0.050 <0.010 0.289±0.02 <0.010 268.9±2.3 <0.005 <0.002 0.121±0.003 <0.002 <0.100
Studena 0.450±0.02 0.097±0.002 0.007 0.260±0.01 – 201.2±1.4 <0.005 0.010±0.003 1.248±0.01 0.042±0.004 0.825±0.06
Sveti Rok 0.056±0.001 0.057±0.003 0.015±0.002 0.111±0.01 – 27.85±0.05 0.316±0.03 0.003±0.00 0.215±0.002 0.187±0.01 0.492±0.06
Sveti Rok(a) 0.076±0.01 0.691±0.01 0.024±0.002 0.307±0.01 – 28.92±0.32 0.098±0.01 0.009±0.001 0.271±0.004 0.167±0.003 0.737±0.10
Tiha 0.031±0.003 0.192±0.01 <0.010 0.219±0.01 0.101±0.01 29.66±0.23 <0.005 0.01±0.001 0.156±0.003 0.194±0.01 0.997±0.03
UN1QUE 0.700±0.002 0.115±0.01 <0.010 0.225±0.03 0.306±0.05 230.6±3.9 <0.005 <0.002 1.093±0.01 0.207±0.003 1.032±0.21
Zala 0.078±0.002 0.086±0.02 <0.010 0.423±0.04 0.087±0.001 130.8±1.5 <0.005 <0.002 0.743±0.003 0.275±0.004 <0.100
Mineral water
Clever(a) 0.449±0.011 1.754±0.03 <0.010 0.409±0.001 – 405.9±3.8 0.119±0.001 <0.002 0.256±0.002 0.150±0.004 0.212±0.02
Donat Mg(a) 0.283±0.005 9.137±0.28 <0.010 0.265±0.05 0.066±0.01 2020±349 0.026±0.004 0.028±0.002 1.465±0.06 0.095±0.003 2.025±0.50
Jamnica 0.467±0.067 1.821±0.02 0.038±0.004 0.179±0.01 0.044±0.01 173.5±1.1 0.015±0.002 0.008±0.001 0.137±0.01 0.034±0.002 0.408±0.09
Jamnica(a) 0.312±0.001 4.199±0.05 0.061±0.01 0.413±0.003 0.106±0.03 720.4±30.6 0.025±0.004 0.012±0.001 0.207±0.003 0.072±0.001 0.356±0.02
Kapljice(a) 0.705±0.027 0.399±0.01 <0.010 0.214±0.01 0.239±0.01 267.5±7.3 0.068±0.006 <0.002 0.780±0.02 0.325±0.01 1.132±0.07
Radenska(a) 0.016 2.319±0.06 <0.010 0.821±0.04 – 1519±30 0.010±0.002 0.317±0.01 0.070±0.003 0.111±0.01 <0.100
Studenac(a) 0.385±0.017 <0.050 <0.010 0.498±0.01 – 263.9±1.2 0.010±0.002 0.030±0.001 0.990±0.01 0.047±0.001 2.119±0.08
Studenac light(a) 0.385±0.017 0.068±0.002 <0.010 0.396±0.05 – 311.1±3.9 0.012±0.001 0.022±0.004 1.124±0.01 0.051±0.003 2.142±0.12
(a) Sparkling water.(b) Sample taken from water-cooler.

V and Zn in bottled and tap water are shown in TablesIII and IV, respectively. The majority of elements werefound at part per billion (ppb) level, so all values are re-ported as µg/L. Ranges of concentrations for each indi-vidual element in spring, mineral and tap water aresummarized in Table V. Measured concentrations of ele-ments of interest were compared with the maximum con-taminant level (MCL) regulated by Croatian, WHO andEPA directives for ground, drinking and tap water (TableVI).
Due to its high toxicity and chronic toxicological ef-fects, the recommended and regulatory limits for ARSENIC
in drinking water were recently lowered by many autho-rities.3,5 Structurally very similar to phosphate (PO4
3–), arse-nic in the +5 oxidation state as oxyanion arsenate (AsO4
3–)interferes with the biological function of phosphate, whichis the basis of its toxicity.22 However, the most seriousrisk of human intoxication with arsenic by drinking arse-nic contaminated water comes from AsIII, which is ~60times more toxic than AsV 23,24 and is the prevalent form ofarsenic in anoxic groundwater.3,25 In the analyzed samples,As level was higher in bottled water than in tap water.
96 @. FIKET et al.
Croat. Chem. Acta 80 (1) 91–100 (2007)
TA
BLE
IV.
Conce
ntratio
ns
of
elem
ents
,ex
pre
ssed
inmg/L
,in
tap
wate
rfrom
Cro
atia
(arith
met
icm
ean
±st
andard
dev
iatio
nof
3re
plic
ate
mea
sure
men
ts)
Ag
Al
As
BB
aC
dC
oC
rC
uF
eL
iM
n
Tap
wat
er
Rij
eka
0.00
5±0.
002
4.63
4±0.
060.
05±
0.01
3.47
8±0.
853.
688±
0.14
0.01
2±0.
001
0.00
8±0.
001
0.35
0±0.
002
1.66
6±0.
032.
774±
0.14
0.11
2±0.
030.
058±
0.01
Lou
rdes
0.00
3±0.
001
2.57
8±0.
160.
22±
0.02
5.78
7±0.
066.
807±
0.06
<0.
001
0.01
4±0.
001
0.37
7±0.
010.
622±
0.01
1.36
0±0.
121.
569±
0.02
0.24
4±0.
01
Zag
reb 1
0.00
6±0.
001
4.77
8±0.
320.
26±
0.01
57.5
1±0.
1738
.69±
0.22
0.03
9±0.
001
0.07
3±0.
003
0.14
9±0.
004
10.5
2±0.
1520
.42±
2.45
5.58
3±0.
0426
.955
±0.
62
Zag
reb 2
0.01
3±0.
041.
072±
0.04
0.15
±0.
0116
9.3±
3.1
90.5
8±1.
090.
119±
0.01
0.09
6±0.
020.
464±
0.01
16.6
09±
0.49
7.82
9±1.
011.
059±
0.01
0.52
0±0.
03
Zag
reb 3
0.00
3±0.
001
0.47
6±0.
070.
098±
0.02
69.9
0±7.
1047
.01±
1.43
0.02
7±0.
001
0.06
6±0.
010.
216±
0.00
34.
987±
0.03
10.4
4±0.
062.
907±
0.94
0.69
8±0.
02
Mo
Ni
Pb
Sb
Se
Sr
Ti
Tl
UV
Zn
Tap
wat
er
Rij
eka
0.03
2±0.
003
<0.
050
17.1
8±0.
220.
061±
0.01
0.00
8±0.
002
34.2
7±0.
110.
149±
0.01
0.00
3±0.
001
0.22
0±0.
002
0.48
9±0.
0113
.00±
0.98
Lou
rdes
0.21
0±0.
004
0.06
0±0.
01–
0.13
6±0.
010.
200±
0.03
167.
1±0.
50.
153±
0.01
0.00
3±0.
000
0.52
9±0.
010.
197±
0.00
1–
Zag
reb 1
0.14
6±0.
011.
055±
0.04
0.17
4±0.
010.
161±
0.05
0.13
9±0.
0215
7.2±
1.4
0.25
8±0.
060.
010±
0.01
0.36
4±0.
003
0.66
±0.
0152
.03±
0.19
Zag
reb 2
0.21
0±0.
020.
659±
0.08
4.87
7±1.
894
0.34
5±0.
150.
844±
0.08
316.
6±2.
40.
031±
0.00
10.
018±
0.00
11.
410±
0.01
40.
198±
0.00
316
9.7±
8.2
Zag
reb 3
0.27
±0.
010.
263±
0.01
0.28
3±0.
002
0.06
1±0.
004
0.52
8±0.
1123
0.9±
6.7
0.01
2±0.
001
<0.
002
1.54
4±0.
015
0.13
8±0.
004
208.
2±3.
4
TABLE V. Ranges of concentrations for each individual element inspring, mineral and tap water, expressed in mg/L
Element Tap water Spring water Mineral water
Ag 0.001–0.017 <0.001–1.322 <0.001–0.015
Al 0.40–5.10 0.07–10.91 0.20–5.66
As 0.044–0.269 0.006–2.083 0.143–2.994
B 2.63–172.29 2.17–20.40 262.97–4131.72
Ba 3.5–91.7 1.00–55.63 3.55–242.61
Cd <0.001–0.314 <0.001–0.035 <0.001–0.008
Co 0.007–0.115 <0.001–0.625 0.005–8.813
Cr 0.145–0.470 0.025–0.672 <0.010–1.650
Cu 0.61–22.18 <0.050–7.740 <0.050–1.871
Fe 1.24–22.86 <0.100–4.571 <0.100–3.999
Li 0.08–5.63 0.11–29.15 2.98–3199.20
Mn 0.05–27.57 <0.005–141.56 1.71–222.79
Mo 0.029–0.284 <0.050–2.843 0.073–0.732
Ni <0.050–1.09 <0.050–0.701 <0.050–9.417
Pb 0.169–17.402 <0.010–0.402 <0.010–0.042
Sb 0.056–0.496 0.022–0.485 0.203–0.506
Se 0.006–0.921 <0.010–0.608 0.034–0.250
Sr 34.1–319.0 25.9–271.2 172.4–2371.2
Ti 0.030–0.316 <0.005–0.341 0.008–0.074
Tl <0.002–0.019 <0.002–0.086 <0.002–0.322
U 0.218–1.559 <0.001–1.273 0.067–1.526
V 0.134–0.675 <0.002–1.069 0.032–0.335
Zn 12.02–211.56 <0.100–6.912 0.197–2.263

Maximum concentrations (2–3 µg/L) were obtained fromtwo brands of bottled water, Bistra and Donat Mg. How-ever, all samples examined contain lower concentrationsthan the current WHO and EPA guideline values of 10µg/L. This is a clear indication that all of the analyzedmineral and spring waters are derived from sources thatdo not seem to be influenced by underground aquiferswith elevated As levels in northeastern Croatia.1
ALUMINUM and TITANIUM display a similar patternof concentration distribution in samples. Concentrationsrange from 0.07 to 10.9 µg/L and from below limits ofdetection to 0.34 µg/L for Al and Ti, respectively. Highervalues of Al correspond to higher values of Ti in sam-ples. Maximum concentrations of 10.9 and 0.34 µg/L forAl and Ti, respectively, were recorded in Sveti Rok springwater. The level of Al in all samples was much lower thanthe Croatian, WHO and EPA water standards (50 µg/L),while there are no proposed guideline values for Ti.
Bottled waters contain slightly higher levels of ANTI-
MONY than tap waters. With concentrations ranging from0.022 to 0.506 µg/L all samples were below the proposedEPA safe limits of 6 µg/L. Measured values are, however,much higher than the average concentrations for Sb of afew µg/L in fresh water systems.26 It was recently report-ed that a continual release of Sb from PET containers isobserved and that the Sb concentrations in bottled wa-ters mainly reflect the duration of their storage.27
For BORON, a wide range of concentrations, 2 to4100 µg/L, is observed. Much higher values (up to 4 mg/L)of B were obtained for mineral than for spring and tapwaters All tap waters were below the WHO guidelinevalue of 500 µg/L. However, B in mineral waters was upto 4 times higher than the maximum allowable concen-tration in drinking waters pursuant to Croatian regulations(Table VI). For mineral waters, however, no upper limitfor B has been set to date (it should be defined in 2006according to Ref. 12, NN mineral waters 2004), probablyjust because some natural mineral waters may containvery high concentrations of this element and special guide-lines for B in particular types of mineral water should befixed.
Concentrations of BARIUM display a great diversityamong samples, ranging from 1 to 250 µg. Nevertheless,all samples examined were below the proposed WHOdrinking water standards of 700 µg/L.
The CADMIUM level was significantly higher in tapwater than in bottled water. Contamination of tap waterwith Cd probably originates from the pipe system. In allsamples, the level of Cd was far below the proposedWHO guideline value of 3 µg/L.
Low CHROMIUM concentration (up to 1.6 µg/L) wasfound in all analyzed samples. EPA has recommended100 µg/L of Cr as the safe limit whereas the Croatianmaximum allowable level and the WHO guideline for Crare set at 50 µg/L. Its toxicity is related to the reductionof chromate to CrIII and radicals produced by the reaction.
In all samples, COBALT was present at very low le-vels, partly below detection limits. Where measurable, Coconcentration did not exceed 1 µg/L, except for DonatMg mineral water containing 9 µg/L. No proposed guide-line for Co is available.
By comparing bottled and tap waters, much highervalues of COPPER were obtained in tap water (0.6 to 22µg/L), probably due to properties of pipe systems. Theonly bottled water containing higher concentrations ofCu (~8 µg/L) was Cetina, taken from a water cooler. Thecooling/heating system containing a brass-coil heater canbe the source of elevated concentration of Cu in this sam-ple. Safe limits set by the Croatian and WHO regulationsand EPA standards are 2000 and 1000 µg/L, respectively.
IRON was found at relatively higher concentrationsin tap than in bottled water. The highest values (10 to 20µg/L) were recorded for Zagreb tap waters. All samplesexamined contain concentrations that are lower than thecurrent Croatian and EPA safe limits (300 µg/L).
The widest range of concentrations, from 0.2-3200µg/L was obtained for LITHIUM. Mineral bottled waterscontain up to 200 times more Li than non-mineral andtap waters. No upper limit has been set for this metal indrinking water.
LEAD was found at a very low level in all bottledand two tap water samples with values below 0.4 µg/L.
ARSENIC AND OTHER TRACE ELEMENTS IN BOTTLED WATERS 97
Croat. Chem. Acta 80 (1) 91–100 (2007)
TABLE VI. Maximum contaminant level for trace elements, givenin mg/L, allowed by Croatian, WHO and EPA regulations
Element Croatia WHO EPA
Drinkingwater11
Mineraland springwater5,9,10
Drinkingwater6
Groundand drinking
water7
Ag
Al
As
B
Ba
Cd
Cr
Cu
Fe
Mn
Mo
Ni
Pb
Sb
Se
Tl
U
V
Zn
10
150
10
1000
700
5
50
2000
200
50
–
20
100 (10)(b)
5
10
–
–
5
3000
–
–
50 (10)(a)
–
2000 (1000)(a)
5 (3)(a)
50
1000
–
2000 (500)(a)
–
–
50 (10)(a)
(50)(a)
10
–
–
–
5000
–
200
10
500
700
3
50
2000
300
400
70
20
10
20
10
–
15
–
–
10
50–2000
10
–
2000
5
100
1000
300
50
–
–
15
6
50
2
30
–
5000
(a) 1.1.2007.(b) 2013.

Much higher concentrations were found in two tap wa-ters, from Zagreb and Rijeka. Lead is present in tap wa-ter to some extent as a result of its dissolution from na-tural sources but primarily from household plumbingsystems in which the pipe solder, fittings, or service con-nections to homes contain lead.28,29 The amount of leaddissolved from the plumbing system depends on severalfactors, including the presence of chloride, dissolved oxy-gen, pH, temperature, water hardness and the standingtime of water.30,31
A wide range of concentrations was obtained forMANGANESE, from below limits of detection to 222 µg/L.Three brands, Jamnica, Kapljice and Radenska, containsignificantly higher concentrations of Mn (90-215 µg/L)compared to other bottled and tap waters (up to 30 µg/L).Nevertheless, all values obtained were below the propos-ed safe limits for bottled water in Croatia (2000 µg/L).Mn is widely distributed in the environment and naturallypresent in many surface water and groundwater sources.7
Therefore, Mn levels in mineral water samples reflectthe naturally occurring Mn in water.
MOLYBDENUM concentration in all samples was lessthan 1 µg/L, except for the Mercator (2.8 µg/L) sampleand was slightly lower in tap waters. A health-basedguideline value of 70 µg/L was proposed in 1993 byWHO on the basis of a 2-year study of humans exposedto molybdenum in their drinking water.32
In all the samples, NICKEL was found below the pro-posed WHO safe drinking standard of 70 µg/L. Generallyhigher values were observed in mineral water, with con-centrations up to 9.4 µg/L while in tap and spring watersNi concentration did not exceed 1.1 µg/L. The highestconcentration (9.2 µg/L) was found in the Donat Mg mi-neral water.
SILVER was found at a very low concentration (typi-cally less than 10 µg/L) in all except one sample. Theonly value found at µg/L level (1.3 µg/L) was observedin the spring bottled water UN1QUE. However, even thismuch higher value was about 10 times lower than thecurrent Croatian and EPA safe limits for Ag of 10 µg/L.
Concentrations of SELENIUM were found to be simi-lar in bottled and tap water and far below the proposedCroatian, WHO and EPA safe limits of 10 and 50 µg/L,respectively.
All samples contain substantial amounts of STRON-
TIUM, up to 2 mg/L. Highest values were obtained forDonat Mg and Radenska mineral water also containingthe highest levels of Ca. No health-based guideline va-lues are proposed for Sr.
In all samples, except one, THALLIUM was found atvery low concentrations (up to 0.1 µg/L). The highest con-centration (0.32 µg/L) was detected in bottled Radenskamineral water, still being far below the EPA drinkingwater standard of 2 µg/L.
No significant difference in URANIUM concentra-tions between bottled and tap water was detected. Valuesof U in analyzed samples range from below limits of de-tection to maximal 1.6 µg/L being below the WHO pro-posed guideline of 15 µg/L. This is designated as pro-visional because of outstanding uncertainties regarding thetoxicology and epidemiology of uranium. EPA has re-commended 30 µg/L of U in water as the safe limit fordrinking purposes.
All samples analyzed contain much lower levels ofVANADIUM than the maximum permissible limits of 5µg/L suggested by Croatian regulations. The highest valuewas observed in bottled Jana non-mineral water contain-ing 1 µg/L.
None of the analyzed samples exceeded the levels ofZINC set by the Croatian water quality standards (5000µg/L), although wide discrepancy is observed betweenbottled and tap waters. Bottled waters, mineral and spring,contain up to 7 µg/L of Zn while in tap water significant-ly higher values (12-211 µg/L) were found. The naturalconcentration of zinc in water depends on a multitude offactors such as the nature and age of geological forma-tions through which the water flows, along with biologi-cal, physical and chemical conditions.33 However, muchhigher concentrations of Zn observed in tap water areprobably a result of the pipe system technical conditions.
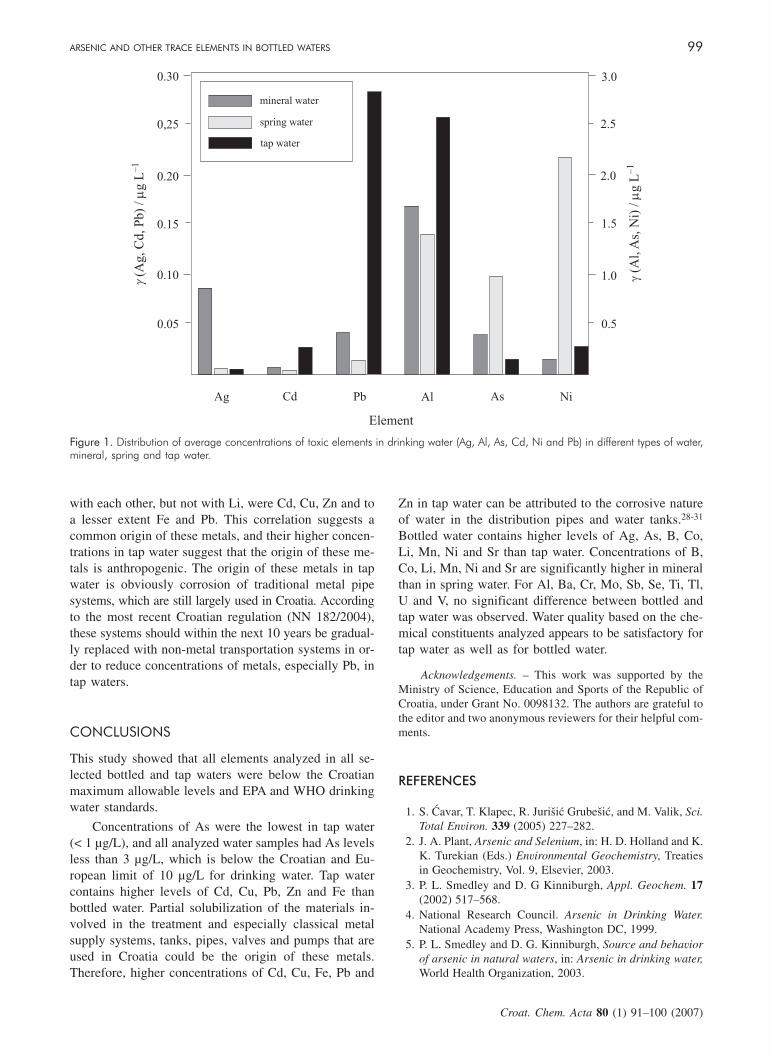
Table V summarizes data for different types of wa-ter, spring, mineral and tap water. We can see from thepresented ranges that some trace elements are of the sameorder of magnitude in all types of analyzed water (Al,Cr, Mo, Sb, Se, Ti, Tl, U and V), some of them are signi-ficantly higher in bottled water, especially in mineralwater (As, Ag, B, Ba, Co, Li, Mn, Ni, Sr) and some aresignificantly higher in tap water (Cd, Cu, Fe, Pb, Zn).Figure 1 shows the distribution of average concentrationsof toxic elements in drinking water (Ag, Al, As, Cd, Niand Pb) between different types of water, mineral, springand tap, analyzed in this study. In order to explain thesedifferences, we were looking for correlation between va-rious elements in bottled and tap water and also for cor-relation between trace elements in bottled water with theconcentration of macroelements (Na, Ca, K and Mg) thatwere declared on the bottles. In bottled water, the con-centration of Li was highly correlated (r > 0.9) with Na,Ca, K and Mg, so Li is a trace element that is a goodindicator of the overall mineral content of water. There-fore, for elements that are highly correlated with Li (r >0.8) as are As, B, Co, Cr, Ni and Sr, we can suppose to beof natural origin. A good correlation of these elementswith Li was found both in bottled and tap water, indi-cating that these elements are of natural origin in all ty-pes of analyzed water. Higher concentrations of Ag, B,Ba, Co, Li, Mn, Ni, Sr obtained in mineral waters are thusa consequence of high contents of minerals in these waters.The other group of elements showing good correlation
98 @. FIKET et al.
Croat. Chem. Acta 80 (1) 91–100 (2007)
with each other, but not with Li, were Cd, Cu, Zn and toa lesser extent Fe and Pb. This correlation suggests acommon origin of these metals, and their higher concen-trations in tap water suggest that the origin of these me-tals is anthropogenic. The origin of these metals in tapwater is obviously corrosion of traditional metal pipesystems, which are still largely used in Croatia. Accordingto the most recent Croatian regulation (NN 182/2004),these systems should within the next 10 years be gradual-ly replaced with non-metal transportation systems in or-der to reduce concentrations of metals, especially Pb, intap waters.
CONCLUSIONS
This study showed that all elements analyzed in all se-lected bottled and tap waters were below the Croatianmaximum allowable levels and EPA and WHO drinkingwater standards.
Concentrations of As were the lowest in tap water(< 1 µg/L), and all analyzed water samples had As levelsless than 3 µg/L, which is below the Croatian and Eu-ropean limit of 10 µg/L for drinking water. Tap watercontains higher levels of Cd, Cu, Pb, Zn and Fe thanbottled water. Partial solubilization of the materials in-volved in the treatment and especially classical metalsupply systems, tanks, pipes, valves and pumps that areused in Croatia could be the origin of these metals.Therefore, higher concentrations of Cd, Cu, Fe, Pb and
Zn in tap water can be attributed to the corrosive natureof water in the distribution pipes and water tanks.28-31
Bottled water contains higher levels of Ag, As, B, Co,Li, Mn, Ni and Sr than tap water. Concentrations of B,Co, Li, Mn, Ni and Sr are significantly higher in mineralthan in spring water. For Al, Ba, Cr, Mo, Sb, Se, Ti, Tl,U and V, no significant difference between bottled andtap water was observed. Water quality based on the che-mical constituents analyzed appears to be satisfactory fortap water as well as for bottled water.
Acknowledgements. – This work was supported by theMinistry of Science, Education and Sports of the Republic ofCroatia, under Grant No. 0098132. The authors are grateful tothe editor and two anonymous reviewers for their helpful com-ments.
REFERENCES
1. S. ]avar, T. Klapec, R. Juri{i} Grube{i}, and M. Valik, Sci.Total Environ. 339 (2005) 227–282.
2. J. A. Plant, Arsenic and Selenium, in: H. D. Holland and K.K. Turekian (Eds.) Environmental Geochemistry, Treatiesin Geochemistry, Vol. 9, Elsevier, 2003.
3. P. L. Smedley and D. G Kinniburgh, Appl. Geochem. 17(2002) 517–568.
4. National Research Council. Arsenic in Drinking Water.National Academy Press, Washington DC, 1999.
5. P. L. Smedley and D. G. Kinniburgh, Source and behaviorof arsenic in natural waters, in: Arsenic in drinking water,World Health Organization, 2003.
ARSENIC AND OTHER TRACE ELEMENTS IN BOTTLED WATERS 99
Croat. Chem. Acta 80 (1) 91–100 (2007)
g(A
g,C
d,P
b)
/m
gL
–1
Element
AsAg AlPb NiCd
gm
(Al,
As,
Ni)
/g
L–1
1.0
2.0
3.0
2.5
1.5
0.5
0.30
0,25
0.20
0.15
0.10
0.05
mineral water
spring water
tap water
Figure 1. Distribution of average concentrations of toxic elements in drinking water (Ag, Al, As, Cd, Ni and Pb) in different types of water,mineral, spring and tap water.
6. Regulations on mineral, spring and table water (in Croat.),Narodne Novine, No. 2, 2005.
7. WHO, Guidelines for drinking water quality, 3rd ed., WorldHealth Organization, Geneva, 2004.
8. EPA, Drinking water standards, Office of Drinking Water,US Environmental Protection Agency, Washington DC,2003.
9. S. M. Pier and K. Bang Moon, Environment and health, in:N. M. Trieff (Ed.) Ann. Arbor Science, The ButterworthGroup, 1980, p. 127.
10. Regulations on primary standards for mineral, spring andtable water (in Croat.), Narodne Novine, No. 58, 1998.
11. Amendment to the regulations on primary standards for mi-neral, spring and table water (in Croat.), Narodne Novine,No. 17, 1999.
12. Regulations on health safety of drinking water (in Croat.),Narodne Novine, No. 182, 2004.
13. D. W. Warburton, Can. J. Microbiol. 39 (1993) 158–168.14. F. Vanhaecke, J. Goossens, R. Dams, and C. Vandecasteele,
Talanta 40 (1993) 975–979.15. L. Moens, H. Vanhoe, F. Vanhaecke, J. Goossens, M. Camp-
bell, and R. Dams, J. Anal. At. Spectrom. 3 (1994) 187–191.16. I. Rodushkin and T. Ruth, J. Anal. At. Spectrom. 10 (1997)
1181–1185.17. J. Riondato, F. Vanhaecke, L. Moens, and R. Dams, J. Anal.
At. Spectrom. 12 (1997) 933–937.18. U. Giessmann and U. Greb, Fresenius J. Anal. Chem. 350
(1994) 186–193.19. J. Riondato, F. Vanhaecke, L. Moens, and R. Dams, J. Anal.
At. Spectrom. 15 (2000) 341–345.20. L. Moens, F. Vanhaecke, J. Riondato, and R. Dams, J. Anal.
At. Spectrom. 10 (1995) 569–574.
21. L. M. Posnick and H. Kim, Food Safety Magazine, Aug./Sep. 2002.
22. D. H. Nies, Appl. Microbiol. Biotech. 51 (1999) 730–750.23. J. F. Ferguson and J. Davis, Water Res. 6 (1972) 1259–1274.24. J. Ryu, S. Guo, R. Dahlgren, and R. A. Zierenberg, Geo-
chim. Cosmochim. Acta 66 (2002) 2981–2994.25. M. Stoeppler, Arsenic, in: E. Merian, M. Anke, M. Inhat,
and M. Stoeppler (Ed.), Elements and their Compounds inthe Environment, Metals and their compounds, Vol. 2, 2nd
ed., Wiley-VCH, Weinheim, 2003, pp. 1321–1364.26. M. A. Rish, Antimony, in: E. Merian, M. Anke, M. Inhat,
M. Stoeppler (Ed.), Elements and their Compounds in theEnvironment, Metals and their compounds, Vol. 2, 2nd ed.Wiley-VCH, Weinheim, 2003, pp. 659–667.
27. W. Shotyk, M. Krachler, and B. Chen. J. Environ. Monit. 8(2006) 288–292.
28. M. A. Saleh, E. Ewane, J. Jones, and B. L. Wilson, J. FoodCompos. Anal. 14 (2001) 127–152.
29. I. Al-Saleh and I. Al-Doush, Sci. Total Environ. 216 (1998)181–192.
30. M. R. Schock, J. Am. Water Works Assoc. 81 (1989) 88.31. M. R. Schock, J. Am. Water Works Assoc. 82 (1990) 59.32. M. K. Anke, Molybdenum, in: E. Merian, M. Anke, M. Inhat,
and M. Stoeppler, (Ed.), Elements and their Compounds inthe Environment, Metals and their compounds, Vol. 2, 2nd
ed., Wiley-VCH, Weinheim, 2003., pp. 1007–1037.33. S. Peganova and K. Eder, Zinc, in: E. Merian, M. Anke, M.
Inhat, and M. Stoeppler, (Eds.), Elements and their Com-pounds in the Environment, Metals and their compounds,Vol. 2, 2nd ed., Wiley-VCH, Weinheim, 2003, pp. 1203–1240.
SA@ETAK
Odre|ivanje arsena i drugih elemenata u tragovima u konzumnoj vodi iz boce metodomspektrometrije masa visoke razlu~ivosti s induktivno spregnutom plazmom
@eljka Fiket, Vibor Roje, Nevenka Mikac i Goran Kniewald
Odre|ivane su koncentracije arsena i drugih elemenata u tragovima u 18 razli~itih marki mineralnih i iz-vorskih konzumnih voda u bocama, u Hrvatskoj. Za usporedbu analizirani su i uzorci vodovodnih voda iz Rije-ke, Lourdesa i Zagreba. Analize su provedene na spektrometru masa visoke razlu~ivosti s induktivno spregnutomplazmom (HR ICP-MS). Dobiveni rezultati uspore|ivani su s najve}om dopu{tenom koli~inom za elemente utragovima u vodi za pi}e te mineralnim i izvorskim vodama prema hrvatskom, WHO i EPA standardu za vode.Koncentracije svih analiziranih elemenata bile su u svim uzorcima ispod najve}e dopu{tene koli~ine premahrvatskim, WHO i EPA standardima.
100 @. FIKET et al.
Croat. Chem. Acta 80 (1) 91–100 (2007)
Related Documents