1 23 Arabian Journal for Science and Engineering ISSN 1319-8025 Volume 39 Number 5 Arab J Sci Eng (2014) 39:3499-3510 DOI 10.1007/s13369-014-1011-0 Distribution of Damage in Plan of Dual Steel Frames Gholamreza Abdollahzadeh, Soheil Niknafs & Saeed Rabbanifar

Welcome message from author
This document is posted to help you gain knowledge. Please leave a comment to let me know what you think about it! Share it to your friends and learn new things together.
Transcript

1 23
Arabian Journal for Science andEngineering ISSN 1319-8025Volume 39Number 5 Arab J Sci Eng (2014) 39:3499-3510DOI 10.1007/s13369-014-1011-0
Distribution of Damage in Plan of DualSteel Frames
Gholamreza Abdollahzadeh, SoheilNiknafs & Saeed Rabbanifar
1 23
Your article is protected by copyright and
all rights are held exclusively by King Fahd
University of Petroleum and Minerals. This e-
offprint is for personal use only and shall not
be self-archived in electronic repositories. If
you wish to self-archive your article, please
use the accepted manuscript version for
posting on your own website. You may
further deposit the accepted manuscript
version in any repository, provided it is only
made publicly available 12 months after
official publication or later and provided
acknowledgement is given to the original
source of publication and a link is inserted
to the published article on Springer's
website. The link must be accompanied by
the following text: "The final publication is
available at link.springer.com”.
Arab J Sci Eng (2014) 39:3499–3510DOI 10.1007/s13369-014-1011-0
RESEARCH ARTICLE - CIVIL ENGINEERING
Distribution of Damage in Plan of Dual Steel Frames
Gholamreza Abdollahzadeh · Soheil Niknafs ·Saeed Rabbanifar
Received: 17 September 2012 / Accepted: 31 March 2013 / Published online: 11 March 2014© King Fahd University of Petroleum and Minerals 2014
Abstract Earthquake events with magnitudes larger thaneight Richter along subduction zones have been reportedworldwide. Due to large number of load reversals and ex-cessive hysteretic energy, the effect of cumulative damageon structural components due to deterioration becomes crit-ical for buildings designed based on current seismic codes.By specifying the damage index of a structure from its realinelastic behavior, the required criterion for strengtheningwould be given. In this paper, three steel structures withdual systems consisting of intermediate moment-resistingframes and concentrically braced ones were selected and de-signed based on ASD method of UBC-97. Then, for eval-uating inelastic behavior, these structures were subjected tothree earthquake records and the nonlinear dynamic analyseswere carried out by the PERFORM 3D (VER 4.0.1) software.Next, hysteretic energy and damage measure were computedfor all members of the structures. It is observed that in spiteof uniformity of strength ratios along height and also amongresisting elements of each story, structural damages amongsuch members do not confirm this uniformity and most of thedamage of columns and beams is correlated to the externalbracing frames. Of course, some regularity in the damagedistribution has been seen in plans of buildings, so that con-centration of damage in the center of the plan is less thanthat of external frames. Thus, approaching the center of theplans, the damage imposed on the members decreases.
G. Abdollahzadeh (B) · S. RabbanifarFaculty of Civil Engineering, Babol University of Technology,Babol, Irane-mail: [email protected]
S. NiknafsDepartment of Civil Engineering, Amol University, Amol, Iran
Keywords Seismic damage index · Hysteretic energy ·Nonlinear dynamic analysis
1 Introduction
In recent years, the general evolution of the structural de-sign criteria adopted for the modern structures and the ma-jor importance of the evaluation of the seismic behavior ofexisting under-designed buildings have extended the objec-tives in the seismic design; safety against the collapse re-mains the most important objective, while performance interms of functionality and economy is assumed to play acentral role in the design criteria [1,2]. Therefore, severalauthors have discussed the need of an improvement of the
123
Author's personal copy
3500 Arab J Sci Eng (2014) 39:3499–3510
current earthquake-resistant design methods in order not onlyto avoid the collapse for destructive earthquake, but also tolimit the seismic damage for moderate earthquakes. Mov-ing from a simple force-strength approach the new designphilosophy tends toward multi-level probabilistic structuralperformance criteria [3–5]. Also in the seismic design ofstructures, the concepts of damage and vulnerability play acentral role. It is accepted that standard design procedures,based on the concept of the force reduction factor, even ifadequate in most practical cases, do not result in structurespossessing uniform and indexes or damage indicators havebecome popular [6]. Modern codes for seismic design implylarge values of the seismic force reduction factor relying onthe design and detailing strategy, which allows a substantialdissipation of hysteretic energy supplied by spreading theductility demands in large parts of the structure [7].
For more than a decade now, performance-based seismicdesign (PBSD) has been at the forefront of earthquake engi-neering research. One of the prime aspects of PBSD is therealistic characterization of seismic structural damage and itsdirect incorporation in the design or performance evaluationmethodology. In addition, a major emphasis is also placedon the consideration of all the uncertainties in the designand evaluation of structures. The various modes of charac-terizing the potential seismic damage lead to various PBSDapproaches [8].
The present study focuses on the evaluation of the damagedistribution pattern in all parts of dual steel buildings accord-ing to Park–Ang damage index, designed in accordance withUBC-97 [9]. To obtain parameters of damage indexes, non-linear dynamic analyses have been carried out using PER-FORM 3D Software. The PERFORM 3D is a complete andpowerful program to perform nonlinear dynamic analysesthrough which many nonlinear parameters could be achieved.Therefore, this program had been used for nonlinear dynamicmodeling.
2 Damage Indexes for Structures
Some parameters of the building response have been pro-posed as indexes of structural damage. They are shortly called
damage indexes. Each damage index uses specific damageparameters and the parameters used to categorize the dam-age index. Damage indexes are usually normalized so thattheir value is equal to zero when there is no damage and isequal to unity when total collapse or failure occurs. On theother hand, a damage parameter is a quantity that is used forestimating the damage. A damage index can involve a com-bination of one or more damage variables in its calculation.As a result, to calculate damage indexes, damage parametersshould also be normalized [10].
The earliest damage indexes were mostly based on dis-placement or rotational ductility only. For example, Banonet al. [11] used the rotational ductility (μθ) at the end of astructural member as its damage index:
μθ = θm
θy= 1 + θm − θy
θy(1)
where θm is the maximum rotation (including both elasticand plastic rotations) under an earthquake and θy is the yieldrotation, considering the member’s anti-symmetric doublecurvature bending with the point of contra flexure in its mid-span. Such ductility-based damage indexes fail to take intoaccount the effects of repeated cycles including the strengthand stiffness degradations under low-cycle fatigue. The “flex-ural damage ratio” [11] and the “modified flexural damageratio” [12] are two other damage indexes also suffer fromthese shortcomings. One of the earliest cumulative damageparameters was the “normalized cumulative rotation” [11],which is defined as the ratio of the sum of all plastic ro-tations (except for unloading parts) in inelastic springs tothe yield rotation. Several other researchers [13–15] also de-fined similar displacement-/rotation-based cumulative dam-age indexes, while some others [16,17] followed a low-cyclefatigue-based approach to define damage indexes in terms ofthe number of cycles to failure.
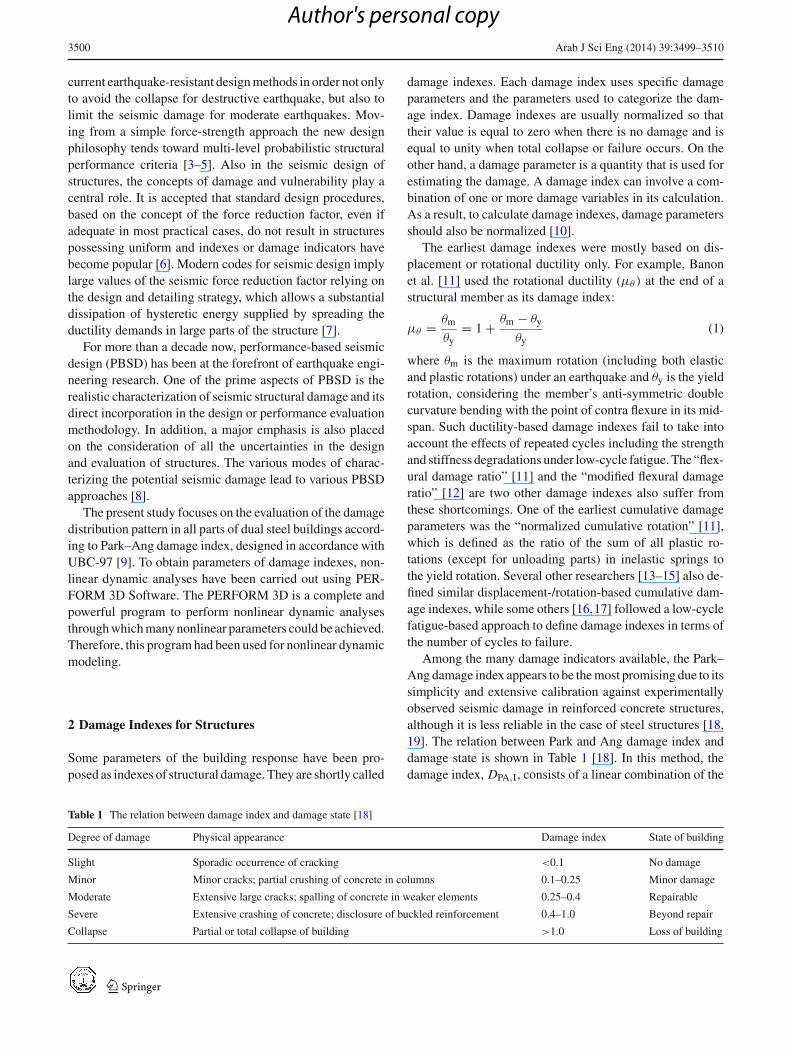
Among the many damage indicators available, the Park–Ang damage index appears to be the most promising due to itssimplicity and extensive calibration against experimentallyobserved seismic damage in reinforced concrete structures,although it is less reliable in the case of steel structures [18,19]. The relation between Park and Ang damage index anddamage state is shown in Table 1 [18]. In this method, thedamage index, DPA,I, consists of a linear combination of the
Table 1 The relation between damage index and damage state [18]
Degree of damage Physical appearance Damage index State of building
Slight Sporadic occurrence of cracking <0.1 No damage
Minor Minor cracks; partial crushing of concrete in columns 0.1–0.25 Minor damage
Moderate Extensive large cracks; spalling of concrete in weaker elements 0.25–0.4 Repairable
Severe Extensive crashing of concrete; disclosure of buckled reinforcement 0.4–1.0 Beyond repair
Collapse Partial or total collapse of building >1.0 Loss of building
123
Author's personal copy
Arab J Sci Eng (2014) 39:3499–3510 3501
ductility and energy dissipation indexes:
DPA,I=Umax
Uu+ β
QrUu
∑dE, (2)
where Umax = is the maximum response deformation, Uu =the ultimate deformation under monotonic loading,
∑dE =
dissipated hysteretic energy, Qr = yield strength, and β =is a nonnegative constant.
The global damage index is a weighted average of thelocal damage indexes and the dissipated energy is chosen asthe weighting function. The global damage index is given bythe following relation:
DIG =∑n
i=1 DIL Ei∑ni=1 Ei
(3)
where DIG is the global damage index, DIL is the local dam-age index after Park–Ang, Ei is the energy dissipated at lo-cation I and n is the number of locations at which the localdamage is computed.
Values of β about 0.15, derived by fitting test results [20],were used in the literature for reinforced concrete structures[21], while in the case of steel structures a value ofβ = 0.025,which is used in the present study, can be adopted [22]. Acomparison of the effectiveness of different damage indexescan be found in many research publications [20,23–26].
3 PERFORM 3D Performance
The PERFORM 3D software [27] has been used for numer-ical modeling and analyzing of the structures. In a detailedfinite element model, each beam or column member is di-vided into a number of elements along its length as shown inFig. 1, schematically.
There are many different finite elements that might beused. In general, they can be of low or high order and can
Fig. 1 Detailed finite element model [27]
Fig. 2 Finite element model with hinges [27]
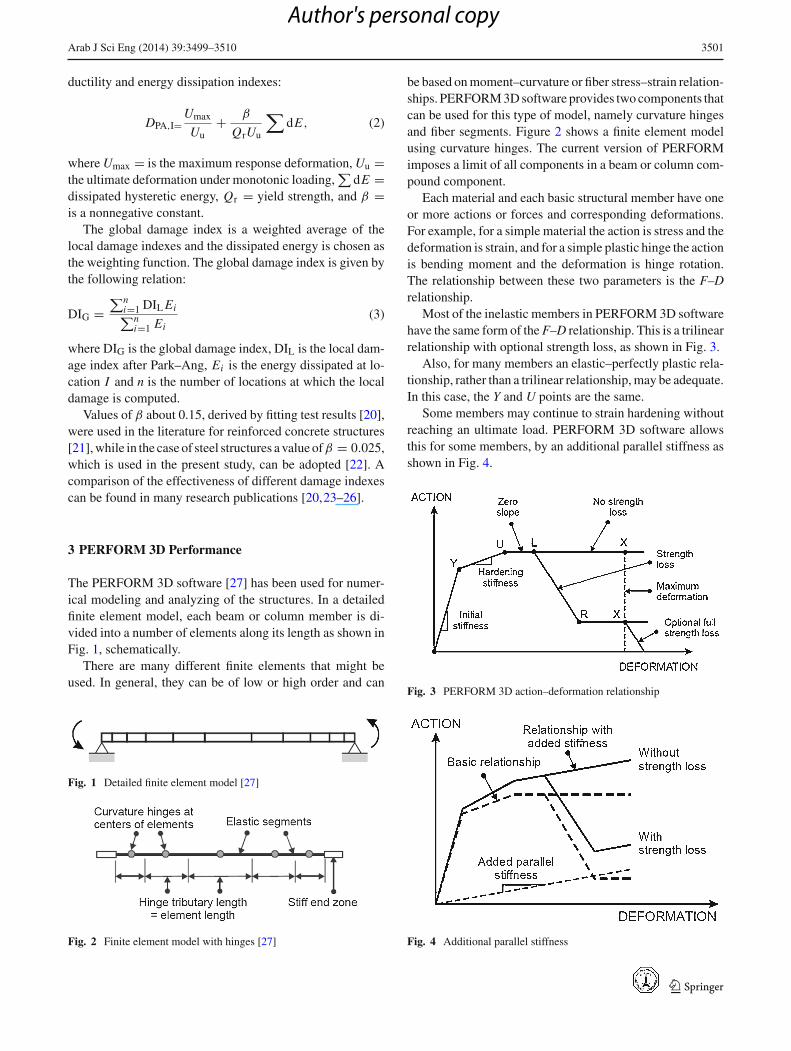
be based on moment–curvature or fiber stress–strain relation-ships. PERFORM 3D software provides two components thatcan be used for this type of model, namely curvature hingesand fiber segments. Figure 2 shows a finite element modelusing curvature hinges. The current version of PERFORMimposes a limit of all components in a beam or column com-pound component.
Each material and each basic structural member have oneor more actions or forces and corresponding deformations.For example, for a simple material the action is stress and thedeformation is strain, and for a simple plastic hinge the actionis bending moment and the deformation is hinge rotation.The relationship between these two parameters is the F–Drelationship.
Most of the inelastic members in PERFORM 3D softwarehave the same form of the F–D relationship. This is a trilinearrelationship with optional strength loss, as shown in Fig. 3.
Also, for many members an elastic–perfectly plastic rela-tionship, rather than a trilinear relationship, may be adequate.In this case, the Y and U points are the same.
Some members may continue to strain hardening withoutreaching an ultimate load. PERFORM 3D software allowsthis for some members, by an additional parallel stiffness asshown in Fig. 4.
Fig. 3 PERFORM 3D action–deformation relationship
Fig. 4 Additional parallel stiffness
123
Author's personal copy
3502 Arab J Sci Eng (2014) 39:3499–3510
Fig. 5 Strength loss
In a structural member, “brittle” strength loss can becaused by a number of effects, including tensile fracture, con-crete crushing, concrete shear failure, and buckling. When a
Fig. 6 FEMA356 action–deformation relationship
component loses strength, if possible the lost strength is re-distributed to adjacent members and the resulting behaviorcan be complex.
Usually it is not permissible to deform an inelastic memberbeyond the L point. It means that the deformation capacity isusually smaller than the L point deformation. For example,the FEMA 356 criteria generally allow deformation beyondthe L point only for certain secondary members at the collapseprevention performance level. Figure 5 shows the action–deformation relationships for FEMA 356 (Q–� relationship)and PERFORM 3D (F–D relationship).
In the FEMA 356 relationship, there is sudden strengthloss at Point C and total strength loss at Point E. In the PER-FORM relationship, strength loss begins at Point L and canbe sudden or gradual. It is likely that strength loss in an actualstructure will be gradual, and hence sudden strength loss isnot realistic. Also in the FEMA 356 relationship, there is to-
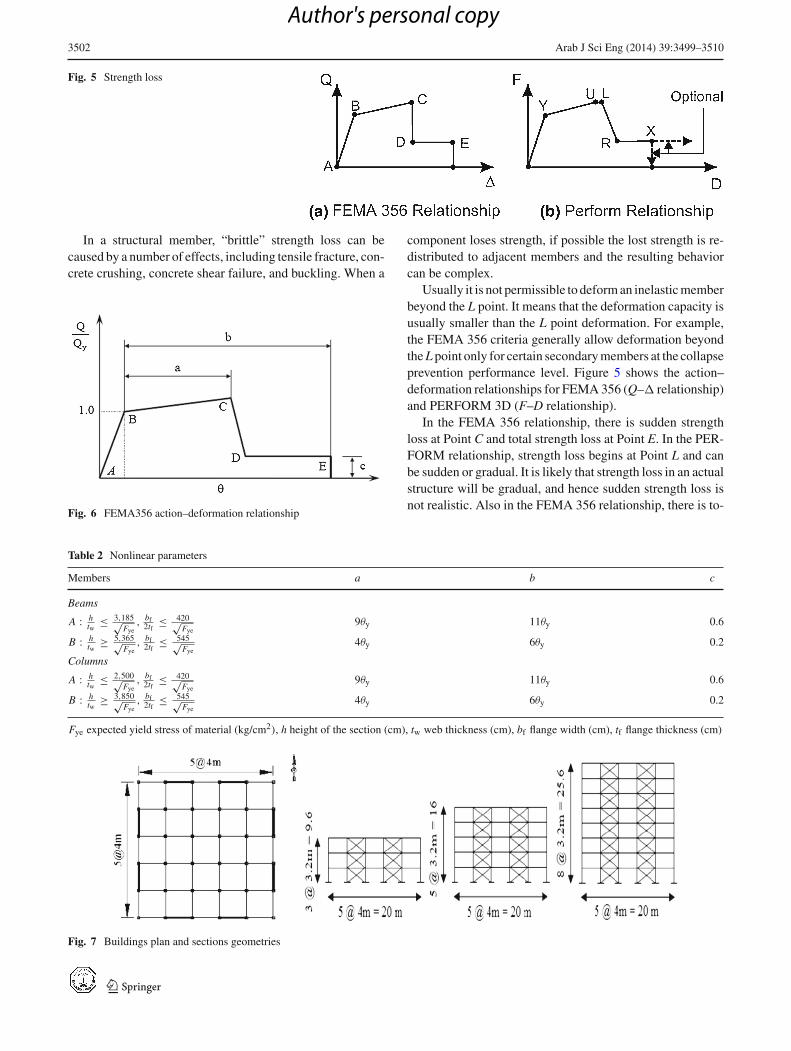
Table 2 Nonlinear parameters
Members a b c
Beams
A : htw
≤ 3,185√Fye
, bf2tf
≤ 420√Fye
9θy 11θy 0.6
B : htw
≥ 5,365√Fye
, bf2tf
≤ 545√Fye
4θy 6θy 0.2
Columns
A : htw
≤ 2,500√Fye
, bf2tf
≤ 420√Fye
9θy 11θy 0.6
B : htw
≥ 3,850√Fye
, bf2tf
≤ 545√Fye
4θy 6θy 0.2
Fye expected yield stress of material (kg/cm2), h height of the section (cm), tw web thickness (cm), bf flange width (cm), tf flange thickness (cm)
Fig. 7 Buildings plan and sections geometries
123
Author's personal copy
Arab J Sci Eng (2014) 39:3499–3510 3503
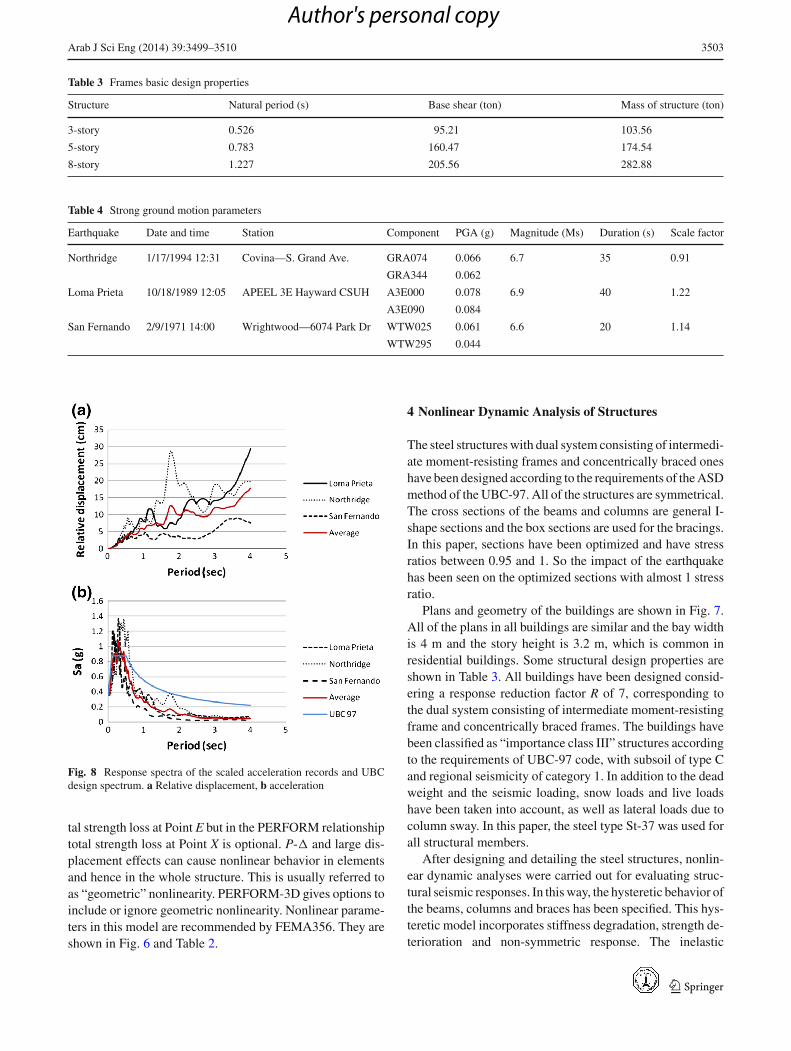
Table 3 Frames basic design properties
Structure Natural period (s) Base shear (ton) Mass of structure (ton)
3-story 0.526 95.21 103.56
5-story 0.783 160.47 174.54
8-story 1.227 205.56 282.88
Table 4 Strong ground motion parameters
Earthquake Date and time Station Component PGA (g) Magnitude (Ms) Duration (s) Scale factor
Northridge 1/17/1994 12:31 Covina—S. Grand Ave. GRA074 0.066 6.7 35 0.91
GRA344 0.062
Loma Prieta 10/18/1989 12:05 APEEL 3E Hayward CSUH A3E000 0.078 6.9 40 1.22
A3E090 0.084
San Fernando 2/9/1971 14:00 Wrightwood—6074 Park Dr WTW025 0.061 6.6 20 1.14
WTW295 0.044
Fig. 8 Response spectra of the scaled acceleration records and UBCdesign spectrum. a Relative displacement, b acceleration
tal strength loss at Point E but in the PERFORM relationshiptotal strength loss at Point X is optional. P-� and large dis-placement effects can cause nonlinear behavior in elementsand hence in the whole structure. This is usually referred toas “geometric” nonlinearity. PERFORM-3D gives options toinclude or ignore geometric nonlinearity. Nonlinear parame-ters in this model are recommended by FEMA356. They areshown in Fig. 6 and Table 2.
4 Nonlinear Dynamic Analysis of Structures
The steel structures with dual system consisting of intermedi-ate moment-resisting frames and concentrically braced oneshave been designed according to the requirements of the ASDmethod of the UBC-97. All of the structures are symmetrical.The cross sections of the beams and columns are general I-shape sections and the box sections are used for the bracings.In this paper, sections have been optimized and have stressratios between 0.95 and 1. So the impact of the earthquakehas been seen on the optimized sections with almost 1 stressratio.
Plans and geometry of the buildings are shown in Fig. 7.All of the plans in all buildings are similar and the bay widthis 4 m and the story height is 3.2 m, which is common inresidential buildings. Some structural design properties areshown in Table 3. All buildings have been designed consid-ering a response reduction factor R of 7, corresponding tothe dual system consisting of intermediate moment-resistingframe and concentrically braced frames. The buildings havebeen classified as “importance class III” structures accordingto the requirements of UBC-97 code, with subsoil of type Cand regional seismicity of category 1. In addition to the deadweight and the seismic loading, snow loads and live loadshave been taken into account, as well as lateral loads due tocolumn sway. In this paper, the steel type St-37 was used forall structural members.
After designing and detailing the steel structures, nonlin-ear dynamic analyses were carried out for evaluating struc-tural seismic responses. In this way, the hysteretic behavior ofthe beams, columns and braces has been specified. This hys-teretic model incorporates stiffness degradation, strength de-terioration and non-symmetric response. The inelastic
123
Author's personal copy
3504 Arab J Sci Eng (2014) 39:3499–3510
DIB
R=
0.7
2D
IBR
= 0
.72
DIBR= 0.392 DIBR= 0.377D
IBR
= 0
.698
DIB
R=
0.6
99
DIB
= 0
.095
DIB= 0.042
Damage index of story 1
DIB
= 0
.088
DIB
= 0
.09
DIB
= 0
.036
DIC= 0.394 DIC= 0.477
DIB= 0.04
DIC= 0.344
DIC= 0.674
DIC= 0.495
DIC= 0.65
DIC= 0.649 DIC= 0.233 DIC= 0.121
DIBR= 0.622 DIBR= 0.627
DIC= 0.154 DIC= 0.107
DIC= 0.237
DIC= 0.219 DIC= 0.094
DIC
= 0
.47
DIC= 0.602DIB= 0.054 350.0=BID530.0=BID
DIB= 0.033
DIC= 0.557 DIC= 0.574DIC= 0.587
DIC
= 0
.702
DIC
= 0
.477
DIC
= 0
.717
DIC= 0.098 DIC= 0.037 DIC= 0.036 DIC= 0.07
DIC= 0.477
DIB
R=
0.6
29D
IBR
= 0
.353
DIBR= 0.388 DIBR= 0.246
DIB
R=
0.2
43D
IBR
= 0
.441
DIB= 0.034
Damage index of story 2
DIC= 0.407 DIC= 0.431
DIB= 0.036
DIC= 0.385
DIC= 0.57
DIC= 0.628
DIC= 0.703
DIC= 0.644
DIBR= 0.481 DIBR= 0.363
DIC
= 0.
454
DIC= 0.717DIB= 0.038 40.0=BID240.0=BID
DIC= 0.699 DIC= 0.504DIC= 0.609
DIC
= 0.
608
DIC
= 0.
698
DIC
= 0
.711
DIC= 0.04
DIC= 0.48
DIB= 0.036
DIC= 0.035
DIB
R=
0.7
2D
IBR
= 0
.72
DIBR= 0.615 DIBR= 0.62
DIB
R=
0.5
82D
IBR
= 0
.545
Damage index of story 3
DIB
= 0
.036
DIC= 0.057
DIC= 0.207
DIC= 0.265
DIC= 0.341
DIC= 0.171 DIC= 0.181
DIBR= 0.707 DIBR= 0.707
DIC= 0.075 DIC= 0.044
DIC= 0.038
DIC= 0.044 DIC= 0.047
DIC
= 0
.257
DIC= 0.338DIB= 0.036
DIC= 0.355
DIC
= 0
.469
DIC
= 0
.232
DIC
= 0
.527
DIC= 0.06 DIC= 0.034 DIC= 0.034
DIC= 0.089
962.0=CID932.0=CID211.0=CID
DIC= 0.044
DIC= 0.045
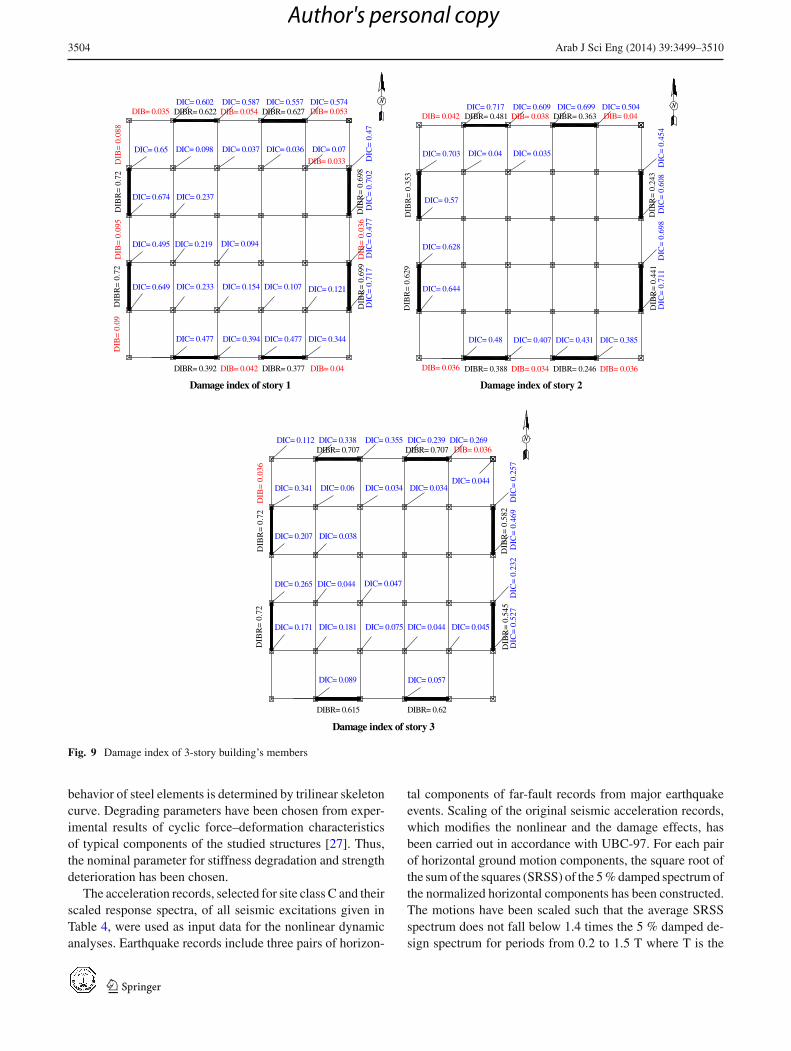
Fig. 9 Damage index of 3-story building’s members
behavior of steel elements is determined by trilinear skeletoncurve. Degrading parameters have been chosen from exper-imental results of cyclic force–deformation characteristicsof typical components of the studied structures [27]. Thus,the nominal parameter for stiffness degradation and strengthdeterioration has been chosen.
The acceleration records, selected for site class C and theirscaled response spectra, of all seismic excitations given inTable 4, were used as input data for the nonlinear dynamicanalyses. Earthquake records include three pairs of horizon-
tal components of far-fault records from major earthquakeevents. Scaling of the original seismic acceleration records,which modifies the nonlinear and the damage effects, hasbeen carried out in accordance with UBC-97. For each pairof horizontal ground motion components, the square root ofthe sum of the squares (SRSS) of the 5 % damped spectrum ofthe normalized horizontal components has been constructed.The motions have been scaled such that the average SRSSspectrum does not fall below 1.4 times the 5 % damped de-sign spectrum for periods from 0.2 to 1.5 T where T is the
123
Author's personal copy
Arab J Sci Eng (2014) 39:3499–3510 3505
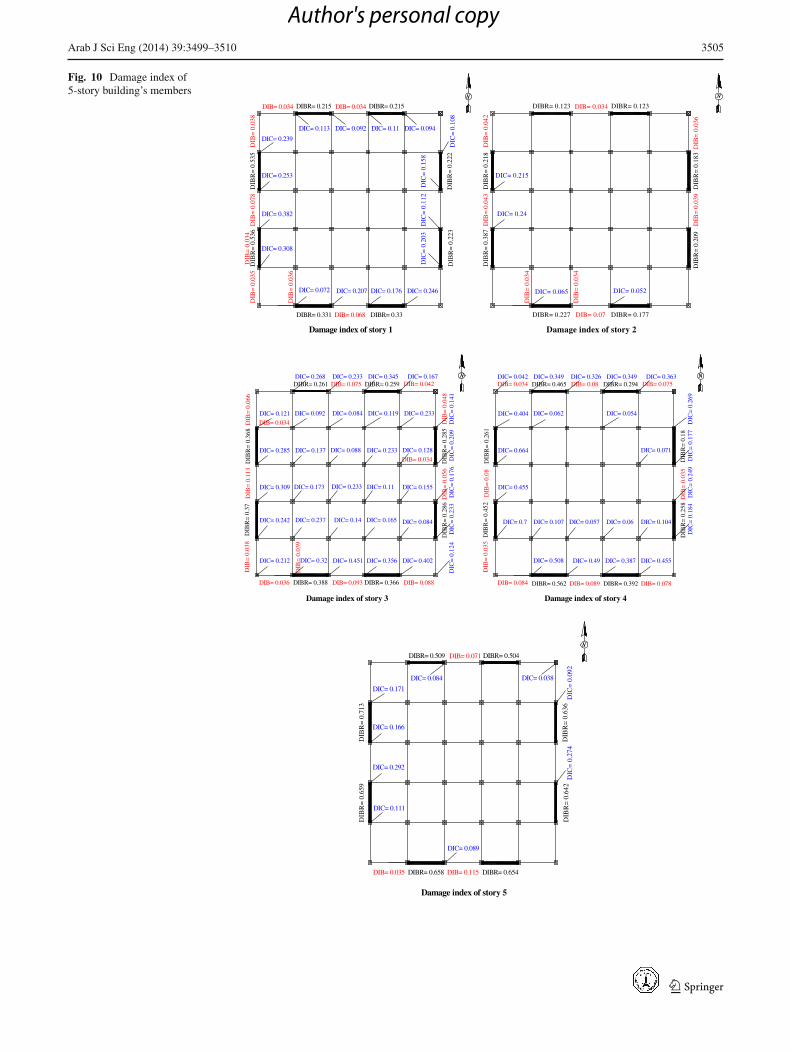
Fig. 10 Damage index of5-story building’s members
DIBR= 0.331 DIBR= 0.33
DIB
R=
0.2
22D
IBR
= 0
.223
DIB= 0.068
Damage index of story 1
DIC= 0.207 DIC= 0.176 DIC= 0.246
DIC= 0.253
DIC= 0.382
DIC= 0.239
DIC= 0.308
DIC= 0.072
DIBR= 0.215 DIBR= 0.215
DIC= 0.113 DIC= 0.092 DIC= 0.11 DIC= 0.094
DIB= 0.034 DIB= 0.034
DIC
= 0
.203
DIC
= 0
.112
DIC
= 0
.158
DIC
= 0
.108
DIB
= 0
.038
DIB
R=
0.5
35D
IB=
0.0
78D
IBR
= 0
.536
DIB
= 0
.035
DIB
= 0
.034
DIB
= 0
.036
DIBR= 0.227 DIBR= 0.177DIB= 0.07
Damage index of story 2
DIC= 0.052
DIC= 0.215
DIC= 0.24
DIBR= 0.123 DIBR= 0.123DIB= 0.034
DIB
= 0
.042
DIB
R=
0.2
18D
IB=
0.0
43D
IBR
= 0
.387
DIB
= 0
.034
DIB
= 0
.039
DIB
R=
0.18
3D
IBR
= 0
.209
DIB
= 0
.036
DIB
= 0
.034
DIC= 0.065
DIB
R=
0.3
7D
IBR
= 0
.368
DIB
R=
0.2
85
DIB
= 0
.113
Damage index of story 3
DIB
= 0.
066
DIB
= 0.
038
DIC= 0.451 DIC= 0.356 DIC= 0.402
DIC= 0.285
551.0=CID903.0=CID
DIC= 0.121
DIC= 0.242 DIC= 0.237
DIC= 0.128
DIC= 0.084
DIC= 0.212
DIB
= 0
.039
DIBR= 0.261 DIBR= 0.259
DIC= 0.14 DIC= 0.165
DIC= 0.137 DIC= 0.233
DIC= 0.173 DIC= 0.233 DIC= 0.11
DIC
= 0
.141
DIC= 0.268DIB= 0.075
DIB
= 0
.048
DIB= 0.034
DIB= 0.034
DIB= 0.042
DIC
= 0
.209
DIB
= 0
.056
DIC
= 0
.176
DIB
R=
0.2
86D
IC=
0.23
3D
IC=
0.1
24
DIC= 0.167DIC= 0.345DIC= 0.233
DIC= 0.119DIC= 0.084 332.0=CID290.0=CID
DIC= 0.088
DIB= 0.036 DIBR= 0.388 DIB= 0.093 DIBR= 0.366 DIB= 0.088
DIC= 0.32
DIB
R=
0.4
52D
IBR
= 0
.261
DIBR= 0.562 DIBR= 0.392
DIB
R=
0.1
8
DIB
= 0
.08
DIB= 0.089
Damage index of story 4
DIB
= 0
.035
DIC= 0.49 DIC= 0.387
DIB= 0.078
DIC= 0.455
DIC= 0.664
DIC= 0.455
DIC= 0.404
DIC= 0.071
DIC= 0.104
DIBR= 0.465 DIBR= 0.294
DIC
= 0
.269
DIC= 0.349DIB= 0.08 DIB= 0.075
DIC
= 0
.177
DIB
= 0.
035
DIC
= 0
.249
DIB
R=
0.2
58D
IC=
0.1
84
DIC= 0.363DIC= 0.349DIC= 0.326
DIC= 0.054DIC= 0.062
DIB= 0.034DIC= 0.042
DIB= 0.084
DIC= 0.508
DIC= 0.06DIC= 0.057DIC= 0.107DIC= 0.7
DIBR= 0.658 DIBR= 0.654
DIB
R=
0.6
36D
IBR
= 0
.642
DIB= 0.115
Damage index of story 5
DIC= 0.166
DIC= 0.292
DIC= 0.171
DIC= 0.084
DIB
R=
0.7
13D
IBR
= 0
.659
DIC= 0.038
DIC
= 0
.274
DIC
= 0
.092
DIB= 0.035
DIC= 0.111
DIB= 0.071 DIBR= 0.504DIBR= 0.509
DIC= 0.089
123
Author's personal copy
3506 Arab J Sci Eng (2014) 39:3499–3510
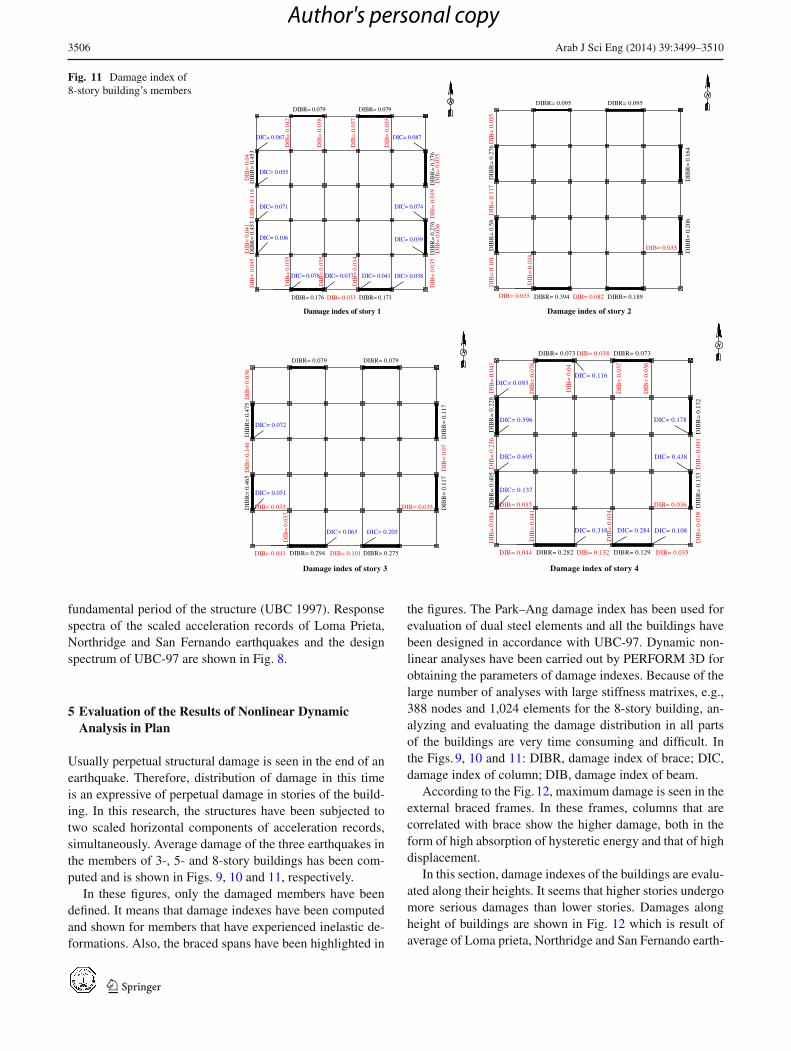
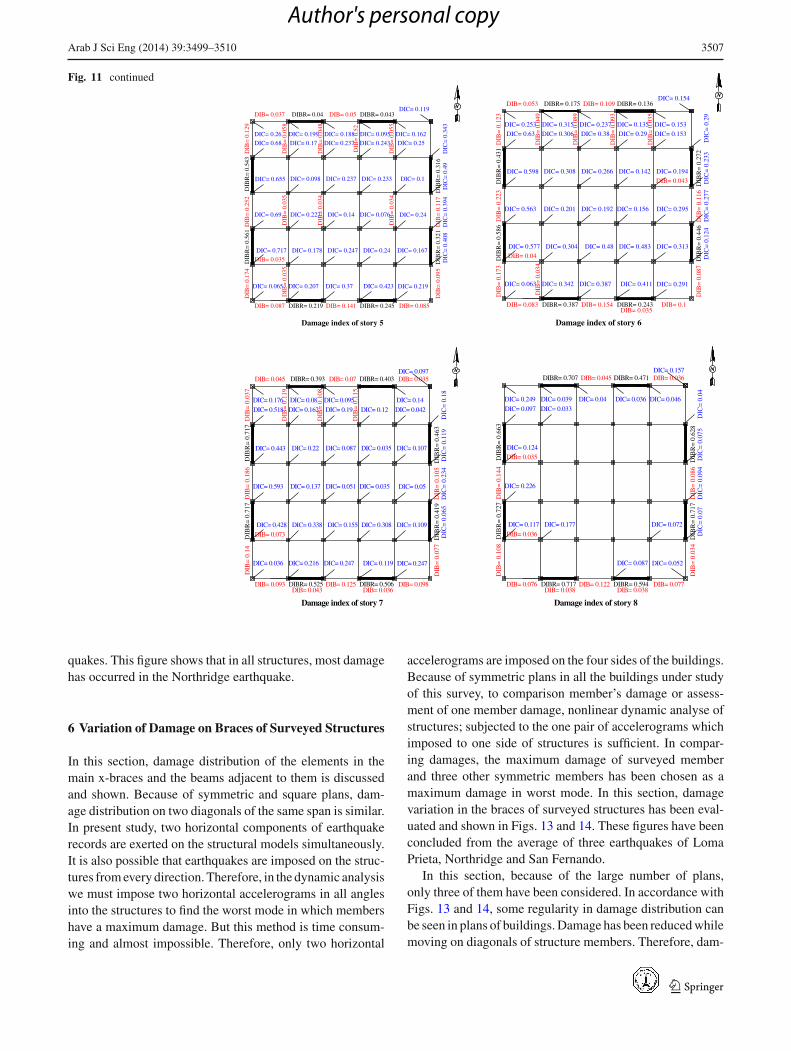
Fig. 11 Damage index of8-story building’s members
Damage index of story 3
DIC= 0.072
DIC= 0.051
DIBR= 0.079 DIBR= 0.079
DIB
R=
0.4
75D
IB=
0.1
46D
IBR
= 0
.465
DIB
R=
0.1
17D
IB=
0.0
7D
IBR
= 0
.117
DIB
= 0
.037
DIC= 0.065 DIC= 0.205
DIB
= 0
.036
DIB= 0.041 DIBR= 0.294 DIB= 0.101 DIBR= 0.275
DIB= 0.035DIB= 0.033
Damage index of story 4
DIC= 0.108
DIC= 0.596
834.0=CID596.0=CID
DIC= 0.137
DIBR= 0.073 DIBR= 0.073
DIB
= 0
.04
DIB
= 0
.036
DIC= 0.093
DIB
= 0
.076
DIB
R=
0.2
28D
IB=
0.2
36D
IBR
= 0
.405
DIB
= 0
.084
DIB
R=
0.1
32D
IB=
0.0
91D
IBR
= 0
.133
DIB
= 0
.039
DIB
= 0
.041
DIC= 0.318
DIB
= 0
.034
DIC= 0.284
DIB
= 0
.041
DIC= 0.178
DIB= 0.044 DIBR= 0.282 DIB= 0.132 DIBR= 0.129 DIB= 0.035
630.0=BID530.0=BID
DIB= 0.038
DIC= 0.116
DIB
= 0
.037
DIBR= 0.176 DIBR= 0.173DIB= 0.033
Damage index of story 1
DIC= 0.038
DIC= 0.055
470.0=CID170.0=CID
DIC= 0.106
DIC= 0.087
DIC= 0.039
DIBR= 0.079 DIBR= 0.079
DIB
= 0
.038
DIB
= 0
.037
DIB
= 0
.035
DIC= 0.067
DIB
= 0
.042
DIB
R=
0.45
3D
IB=
0.04
DIB
= 0.
118
DIB
R=
0.4
53D
IB=
0.04
1D
IB=
0.04
5
DIB
R=
0.2
76D
IB=
0.0
39D
IBR
= 0
.276
DIB
= 0.
035
DIB
= 0
.036
DIB
= 0
.035
DIB
= 0.
035
DIC= 0.078
DIB
= 0.
035
DIC= 0.037
DIB
= 0.
034
DIC= 0.041
DIBR= 0.394 DIBR= 0.189DIB= 0.082
Damage index of story 2
DIBR= 0.095 DIBR= 0.095
DIB
R=
0.2
76D
IB=
0.1
17D
IBR
= 0
.58
DIB
= 0
.101
DIB
R=
0.1
64D
IBR
= 0
.206
DIB
= 0
.034
DIB
= 0
.035
DIB= 0.035
DIB= 0.035
fundamental period of the structure (UBC 1997). Responsespectra of the scaled acceleration records of Loma Prieta,Northridge and San Fernando earthquakes and the designspectrum of UBC-97 are shown in Fig. 8.
5 Evaluation of the Results of Nonlinear DynamicAnalysis in Plan
Usually perpetual structural damage is seen in the end of anearthquake. Therefore, distribution of damage in this timeis an expressive of perpetual damage in stories of the build-ing. In this research, the structures have been subjected totwo scaled horizontal components of acceleration records,simultaneously. Average damage of the three earthquakes inthe members of 3-, 5- and 8-story buildings has been com-puted and is shown in Figs. 9, 10 and 11, respectively.
In these figures, only the damaged members have beendefined. It means that damage indexes have been computedand shown for members that have experienced inelastic de-formations. Also, the braced spans have been highlighted in
the figures. The Park–Ang damage index has been used forevaluation of dual steel elements and all the buildings havebeen designed in accordance with UBC-97. Dynamic non-linear analyses have been carried out by PERFORM 3D forobtaining the parameters of damage indexes. Because of thelarge number of analyses with large stiffness matrixes, e.g.,388 nodes and 1,024 elements for the 8-story building, an-alyzing and evaluating the damage distribution in all partsof the buildings are very time consuming and difficult. Inthe Figs. 9, 10 and 11: DIBR, damage index of brace; DIC,damage index of column; DIB, damage index of beam.
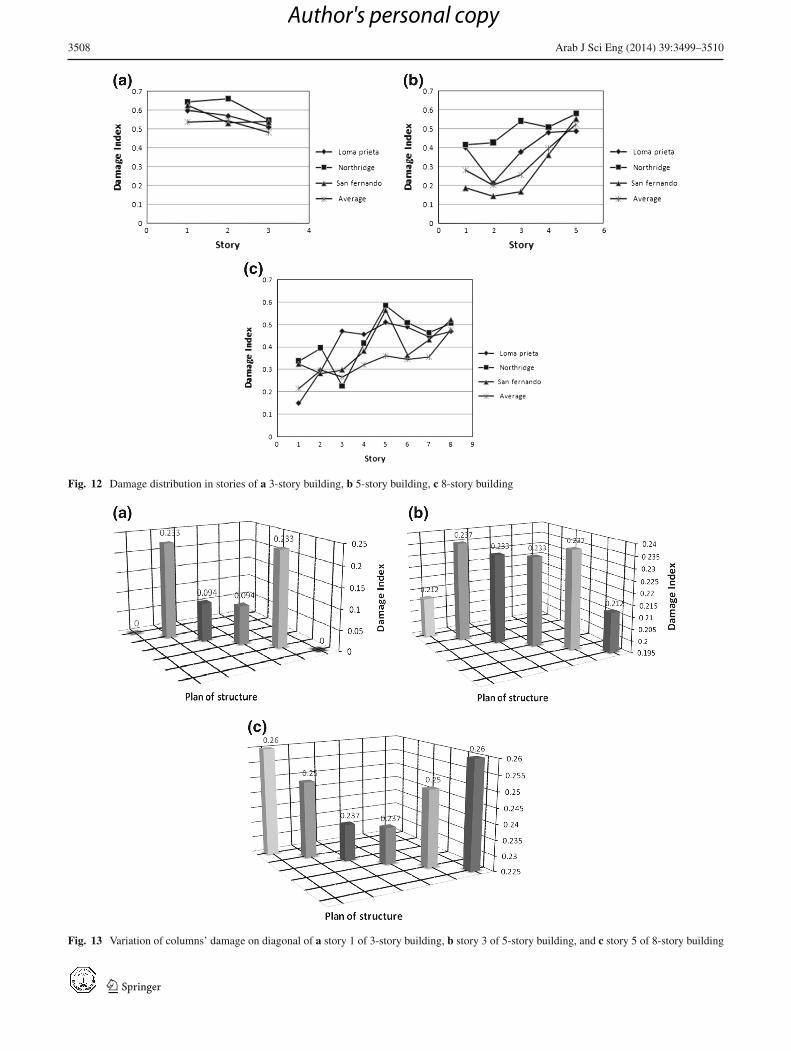
According to the Fig. 12, maximum damage is seen in theexternal braced frames. In these frames, columns that arecorrelated with brace show the higher damage, both in theform of high absorption of hysteretic energy and that of highdisplacement.
In this section, damage indexes of the buildings are evalu-ated along their heights. It seems that higher stories undergomore serious damages than lower stories. Damages alongheight of buildings are shown in Fig. 12 which is result ofaverage of Loma prieta, Northridge and San Fernando earth-
123
Author's personal copy
Arab J Sci Eng (2014) 39:3499–3510 3507
Fig. 11 continued
Damage index of story 5
DIC= 0.219
DIC= 0.655
DIC= 0.24
DIC= 0.25
DIBR= 0.04 DIBR= 0.043
DIB
R=
0.5
43D
IB=
0.2
52D
IBR
= 0
.561
DIB
= 0.
174
DIB
R=
0.3
16D
IB=
0.1
17D
IBR
= 0.
321
DIB
= 0
.095
DIB
= 0.
035
DIC= 0.207 DIC= 0.37 DIC= 0.423
DIB
= 0
.129
580.0=BID780.0=BID
DIB= 0.037 DIB= 0.05
DIBR= 0.219 DIB= 0.141 DIBR= 0.245
DIB= 0.035
DIC= 0.69
DIB
= 0
.035
DIB
= 0
.034
DIB
= 0
.034
DIC= 0.26 DIC= 0.199 DIC= 0.188 DIC= 0.095 DIC= 0.162
DIB
= 0
.058
DIB
= 0
.048
DIB
= 0
.52
DIB
= 0
.055
DIC= 0.17 DIC= 0.237 DIC= 0.243
DIC= 0.098 DIC= 0.237 DIC= 0.233 DIC= 0.1
DIC= 0.227 DIC= 0.14 DIC= 0.076
DIC= 0.717 DIC= 0.178 DIC= 0.247 DIC= 0.24 DIC= 0.167
DIC= 0.065
DIC= 0.119
DIC
= 0
.408
DIC
= 0
.394
DIC
= 0
.49
DIC
= 0
.343
DIC= 0.68
Damage index of story 6
DIC= 0.291
DIC= 0.598
DIC= 0.295
DIC= 0.153
DIBR= 0.175 DIBR= 0.136
DIB
R=
0.4
31D
IB=
0.2
23D
IBR
= 0
.586
DIB
= 0
.173
DIB
R=
0.2
72D
IB=
0.1
16D
IBR
= 0
.446
DIB
= 0
.087
DIB
= 0
.034
DIC= 0.342 DIC= 0.387 DIC= 0.411
DIB
= 0
.123
1.0=BID380.0=BID
DIB= 0.053 DIB= 0.109
DIBR= 0.387 DIB= 0.154 DIBR= 0.243
DIB= 0.04
DIC= 0.563
DIC= 0.253 DIC= 0.315 DIC= 0.237 DIC= 0.135 DIC= 0.153
DIB
= 0
.049
DIB
= 0
.089
DIB
= 0
.093
DIB
= 0
.035
DIC= 0.306 DIC= 0.38 DIC= 0.29
DIC= 0.308 DIC= 0.266 DIC= 0.142 DIC= 0.194
DIC= 0.201 DIC= 0.192 DIC= 0.156
DIC= 0.577 DIC= 0.304 DIC= 0.48 DIC= 0.483 DIC= 0.313
DIC= 0.063
DIC= 0.154
DIC
= 0
.124
DIC
= 0
.277
DIC
= 0
.233
DIC
= 0
.29
DIC= 0.63
DIB= 0.035
DIB= 0.043
Damage index of story 7
DIC= 0.247
DIC= 0.443
DIC= 0.05
DIC= 0.042
DIBR= 0.393 DIBR= 0.403
DIB
R=
0.71
7D
IB=
0.1
86D
IBR
= 0
.717
DIB
= 0
.14
DIB
R=
0.46
3D
IB=
0.1
05D
IBR
= 0
.419
DIB
= 0
.077
DIC= 0.216 DIC= 0.247 DIC= 0.119
DIB
= 0
.037
890.0=BID390.0=BID
DIB= 0.045 DIB= 0.07
DIBR= 0.525 DIB= 0.125 DIBR= 0.506
DIB= 0.073
DIC= 0.593
DIC= 0.176 DIC= 0.08 DIC= 0.095 DIC= 0.14
DIB
= 0
.119
DIB
= 0
.108
DIB
= 0
.115
DIC= 0.162 DIC= 0.19 DIC= 0.12
DIC= 0.22 DIC= 0.087 DIC= 0.035 DIC= 0.107
DIC= 0.137 DIC= 0.051 DIC= 0.035
DIC= 0.428 DIC= 0.338 DIC= 0.155 DIC= 0.308 DIC= 0.109
DIC= 0.036
DIC
= 0
.065
DIC
= 0
.234
DIC
= 0
.119
DIC
= 0
.18
DIC= 0.518
DIB= 0.036
DIB= 0.035DIC= 0.097
DIB= 0.043
Damage index of story 8
DIC= 0.052
DIC= 0.124
DIBR= 0.707 DIBR= 0.471
DIB
R=
0.6
63D
IB=
0.1
44D
IBR
= 0
.727
DIB
= 0
.108
DIB
R=
0.6
28D
IB=
0.0
86D
IBR
= 0
.717
DIB
= 0
.034
DIC= 0.087
770.0=BID670.0=BID
DIB= 0.045
DIBR= 0.717 DIB= 0.122 DIBR= 0.594
DIB= 0.036
DIC= 0.226
DIC= 0.249 DIC= 0.039 DIC= 0.04 DIC= 0.046
DIC= 0.033
270.0=CID771.0=CID711.0=CID
DIC
= 0
.07
DIC
= 0
.094
DIC
= 0
.075
DIC
= 0
.04
DIC= 0.097
DIB= 0.038
DIB= 0.036DIC= 0.157
DIB= 0.038
DIB= 0.035
DIC= 0.036
quakes. This figure shows that in all structures, most damagehas occurred in the Northridge earthquake.
6 Variation of Damage on Braces of Surveyed Structures
In this section, damage distribution of the elements in themain x-braces and the beams adjacent to them is discussedand shown. Because of symmetric and square plans, dam-age distribution on two diagonals of the same span is similar.In present study, two horizontal components of earthquakerecords are exerted on the structural models simultaneously.It is also possible that earthquakes are imposed on the struc-tures from every direction. Therefore, in the dynamic analysiswe must impose two horizontal accelerograms in all anglesinto the structures to find the worst mode in which membershave a maximum damage. But this method is time consum-ing and almost impossible. Therefore, only two horizontal
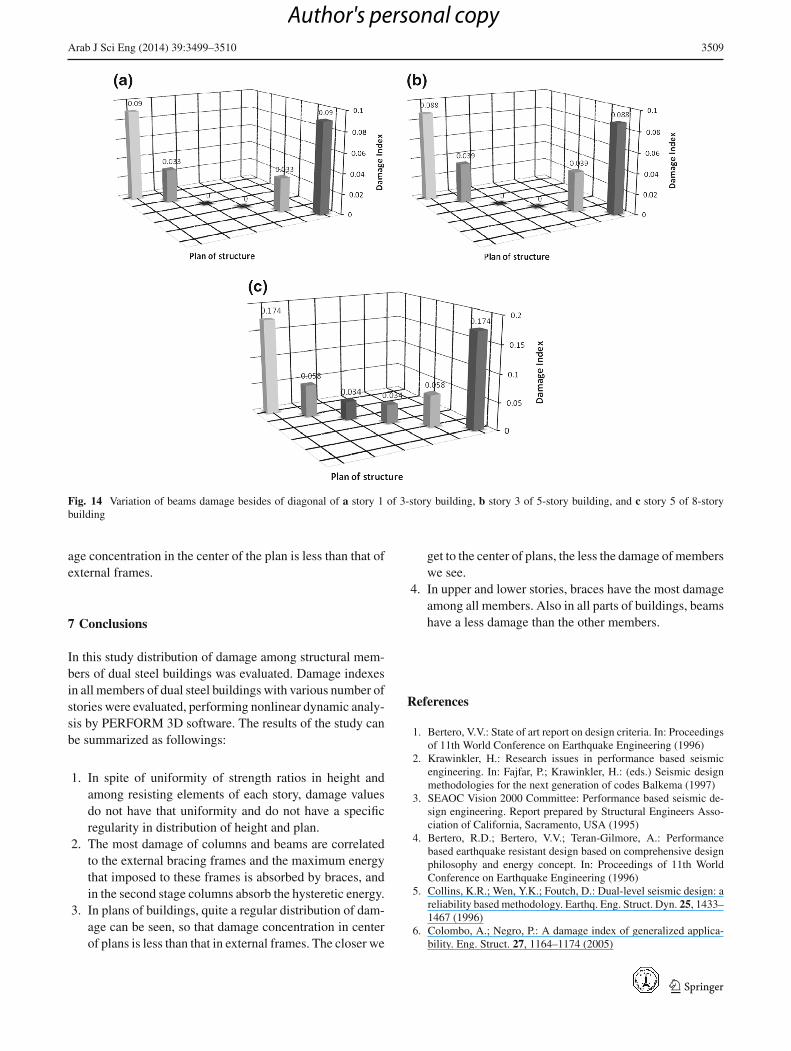
accelerograms are imposed on the four sides of the buildings.Because of symmetric plans in all the buildings under studyof this survey, to comparison member’s damage or assess-ment of one member damage, nonlinear dynamic analyse ofstructures; subjected to the one pair of accelerograms whichimposed to one side of structures is sufficient. In compar-ing damages, the maximum damage of surveyed memberand three other symmetric members has been chosen as amaximum damage in worst mode. In this section, damagevariation in the braces of surveyed structures has been eval-uated and shown in Figs. 13 and 14. These figures have beenconcluded from the average of three earthquakes of LomaPrieta, Northridge and San Fernando.
In this section, because of the large number of plans,only three of them have been considered. In accordance withFigs. 13 and 14, some regularity in damage distribution canbe seen in plans of buildings. Damage has been reduced whilemoving on diagonals of structure members. Therefore, dam-
123
Author's personal copy
3508 Arab J Sci Eng (2014) 39:3499–3510
Fig. 12 Damage distribution in stories of a 3-story building, b 5-story building, c 8-story building
Fig. 13 Variation of columns’ damage on diagonal of a story 1 of 3-story building, b story 3 of 5-story building, and c story 5 of 8-story building
123
Author's personal copy
Arab J Sci Eng (2014) 39:3499–3510 3509
Fig. 14 Variation of beams damage besides of diagonal of a story 1 of 3-story building, b story 3 of 5-story building, and c story 5 of 8-storybuilding
age concentration in the center of the plan is less than that ofexternal frames.
7 Conclusions
In this study distribution of damage among structural mem-bers of dual steel buildings was evaluated. Damage indexesin all members of dual steel buildings with various number ofstories were evaluated, performing nonlinear dynamic analy-sis by PERFORM 3D software. The results of the study canbe summarized as followings:
1. In spite of uniformity of strength ratios in height andamong resisting elements of each story, damage valuesdo not have that uniformity and do not have a specificregularity in distribution of height and plan.
2. The most damage of columns and beams are correlatedto the external bracing frames and the maximum energythat imposed to these frames is absorbed by braces, andin the second stage columns absorb the hysteretic energy.
3. In plans of buildings, quite a regular distribution of dam-age can be seen, so that damage concentration in centerof plans is less than that in external frames. The closer we
get to the center of plans, the less the damage of memberswe see.
4. In upper and lower stories, braces have the most damageamong all members. Also in all parts of buildings, beamshave a less damage than the other members.
References
1. Bertero, V.V.: State of art report on design criteria. In: Proceedingsof 11th World Conference on Earthquake Engineering (1996)
2. Krawinkler, H.: Research issues in performance based seismicengineering. In: Fajfar, P.; Krawinkler, H.: (eds.) Seismic designmethodologies for the next generation of codes Balkema (1997)
3. SEAOC Vision 2000 Committee: Performance based seismic de-sign engineering. Report prepared by Structural Engineers Asso-ciation of California, Sacramento, USA (1995)
4. Bertero, R.D.; Bertero, V.V.; Teran-Gilmore, A.: Performancebased earthquake resistant design based on comprehensive designphilosophy and energy concept. In: Proceedings of 11th WorldConference on Earthquake Engineering (1996)
5. Collins, K.R.; Wen, Y.K.; Foutch, D.: Dual-level seismic design: areliability based methodology. Earthq. Eng. Struct. Dyn. 25, 1433–1467 (1996)
6. Colombo, A.; Negro, P.: A damage index of generalized applica-bility. Eng. Struct. 27, 1164–1174 (2005)
123
Author's personal copy
3510 Arab J Sci Eng (2014) 39:3499–3510
7. Dimova, S.L.; Negro, P.: Seismic assessment of an industrial framestructure designed according to Eurocodes. Part 2: Capacity andvulnerability. Eng. Struct. 27, 724–735 (2005)
8. Ghosh, S.; Datta, D.; Katakdhond, A.A.: Estimation of the Park–Ang damage index for planar multi-storey frames using equivalentsingle-degree systems. Eng. Struct. 33, 2509–2524 (2011)
9. Uniform building code. In: International conference of buildingofficials (1997)
10. Estekanchi, H.; Arjomandi, K.: Comparison of damage indexes innonlinear time history analysis of steel moment frames. Asian J.Civ. Eng. 8, 629–646 (2007)
11. Banon, H.; Biggs, J.M.; Irvine, H.M.; ASCE: Seismic damagein reinforced concrete frames. J. Struct. Eng, 107(9), 29–1713(1981)
12. Roufaiel, M.S.L.; Meyer, C.; ASCE: Analytical modeling of hys-teretic behavior of R/C frames. J. Struct. Eng. 113(3), 57–429(1987)
13. Stephens, J.E.; Yao, J.T.P.; ASCE: Damage assessment using re-sponse measurement. J. Struct. Eng. 113(4), 787–801 (1987)
14. Wang, M.L.; Shah, S.P.: Reinforced concrete hysteresis modelbased in the damage concept. Earthq. Eng. Struct. Dyn. 15(8), 993–1003 (1987)
15. Powell, G.H.; Allahabadi, R.: Seismic damage prediction by de-terministic methods: concepts and procedures. Earthq. Eng. Struct.Dyn. 16(5), 34–719 (1988)
16. Jeong, G.D.; Iwan, W.D.: Effect of earthquake duration on damageof structures. Earthq. Eng. Struct. Dyn. 16(8), 11–1201 (1988)
17. Chung, Y.S.; Meyer, C.; Shinozuka, M.: Modeling of concrete dam-age. ACI Struct. J. 86(3), 71–259 (1989)
18. Park, Y.J.; Ang, A.H.-S.: Mechanistic seismic damage model forreinforced concrete. Struct. Eng. 111(4), 722–739 (1985)
19. Park, Y.J.; Ang, A.H.-S.; Wen, Y.K.: Damage-limiting a seismicdesign of buildings. Earthq. Spectra. 3(1), 1–26 (1987)
20. Cosenza, E.; Manfredi, G.; Ramasco, R.: The use of damage func-tional in Earthquake resistant design: a comparison among differentprocedures. Struct. Dyn. Earthq. Eng. 22, 68–855 (1993)
21. Park, Y.J.: Seismic damage analysis and damage-limiting designof R/C structures. Ph.D thesis. Department of Civil Engineering,University of Illinois, Ubana (IL) (1984)
22. Cosenza, E.; Manfredi, G.: Classificazione e comportamentosis-mico di modelliciclicidegradanti. In: Proceedings of workshopon Danneggiamentociclico e prove pseudo-dinamiche, pp. 59–74(1994)
23. Carr, A.J.; Tabuchi, M.: The structural ductility and the damageindex for reinforced concrete structure under seismic excitation.In: 2nd European conference on structural dynamics, vol. 1, pp.76–169 (1993)
24. Kunnath, S.K.; Jenne, C.: Seismic damage assessment of inelas-tic RC structures. In: 5th US national conference on earthquakeengineering, vol. 1, pp. 55–64 (1994)
25. Ghobarah, A.; Abou-Elfath, H.; Biddah, A.: Response-based dam-age assessment of structures. Earthq. Eng. Struct. Dyn. 28(1), 79–104 (1999)
26. Castiglioni, C.A.; Pucinotti, R.: Failure criteria and cumulativedamage models for steel components under cyclic loading. J. Con-str. Steel Res. 65, 751–765 (2009)
27. Powell, G.H.: CSI Perform 3D, User Guide, Version 4.0.1.RAMInternational, L.L.C., University of California, Berkeley (2006)
123
Author's personal copy
Related Documents