1 DAMAGE ASSESSMENT OF MASONRY INFILLED FRAMES 1 Tanja KALMAN ŠIPOŠ 1 ,Vladimir SIGMUND 2 ABSTRACT There are many different parameters that affect the behavior of masonry-infilled reinforced concrete frames under earthquake loadings and it is difficult to predict. Selection of the parameters, that have the greatest impact on the response system, was carried out on the EDIF database of 113 one- storey one- bay infilled frame tests processed by statistical sensitivity analysis. Those parameters were height to length ratio, longitudinal reinforcement ratio of column and compressive strengths of concrete and masonry infill. A simplified and reliable analytical model, based on the equivalent diagonal and validated on different experimental tests, has been adopted for extensive studies on seismic vulnerability of infilled frame buildings. We investigated the seismic response and the influence of the masonry infills on the global structural response in terms of inter-storey drift ratio and damage states by incremental dynamic analysis. Results are presented in order to determine the relationship between infill’s type and damage state for low-rise infilled framed buildings. INTRODUCTION The buildings with reinforced-concrete frames infilled with masonry (“framed-masonry”) under earthquake excitation behave neither as frames nor as confined masonry walls. Their behaviour depends on many different parameters and on the expected drift. The masonry infill wall within the reinforced-concrete frame increases system stiffness and strength, at small and medium drifts. It also could cause irregularities, in both geometrical and mechanical distribution of infills, and could lead to undesirable failure mechanisms that compromise the bearing capacity of the structure. Due to the incomplete understanding of such composite structures there is a lack of code guidance. That limits the engineer’s ability to design these structures taking into account both, the beneficial and detrimental properties. In order to increase the understanding of the „framed-masonry“structural elements we have collected the experimental database of infilled frames –EDIF. It has been organized in a way that could be used for the performance evaluation and for calibration of the numerical model. Due to the high variability of mechanical properties of masonry and their uncertainty, their properties were divided into three groups that represented a wide number of possible situations that could happen in practice. A lower bound was represented by weak infill, the upper bound with strong infill and medium infill panel had a range of compressive strengths between them. Further, we parametrically investigated the seismic response “framed-masonry” structures, with the numerical model that was simple enough in the computation and elaboration of results, and sufficiently refined for adequate simulation of the main behavioural characteristics. Such reliable and calibrated numerical model was used for the parametric analysis and damage assessment of the “framed-masonry” structures. 1 Senior research assistant, Faculty of Civil Engineering, Osijek, Croatia, [email protected] 2 Full professor, Faculty of Civil Engineering, Osijek, Croatia, [email protected]

Welcome message from author
This document is posted to help you gain knowledge. Please leave a comment to let me know what you think about it! Share it to your friends and learn new things together.
Transcript

1
DAMAGE ASSESSMENT OF MASONRY INFILLED FRAMES
1
Tanja KALMAN ŠIPOŠ1,Vladimir SIGMUND2
ABSTRACT
There are many different parameters that affect the behavior of masonry-infilled reinforced
concrete frames under earthquake loadings and it is difficult to predict. Selection of the parameters,
that have the greatest impact on the response system, was carried out on the EDIF database of 113
one- storey one- bay infilled frame tests processed by statistical sensitivity analysis. Those parameters
were height to length ratio, longitudinal reinforcement ratio of column and compressive strengths of
concrete and masonry infill. A simplified and reliable analytical model, based on the equivalent
diagonal and validated on different experimental tests, has been adopted for extensive studies on
seismic vulnerability of infilled frame buildings. We investigated the seismic response and the
influence of the masonry infills on the global structural response in terms of inter-storey drift ratio and
damage states by incremental dynamic analysis. Results are presented in order to determine the
relationship between infill’s type and damage state for low-rise infilled framed buildings.
INTRODUCTION
The buildings with reinforced-concrete frames infilled with masonry (“framed-masonry”) under
earthquake excitation behave neither as frames nor as confined masonry walls. Their behaviour
depends on many different parameters and on the expected drift. The masonry infill wall within the
reinforced-concrete frame increases system stiffness and strength, at small and medium drifts. It also
could cause irregularities, in both geometrical and mechanical distribution of infills, and could lead to
undesirable failure mechanisms that compromise the bearing capacity of the structure. Due to the
incomplete understanding of such composite structures there is a lack of code guidance. That limits the
engineer’s ability to design these structures taking into account both, the beneficial and detrimental
properties.
In order to increase the understanding of the „framed-masonry“structural elements we have
collected the experimental database of infilled frames –EDIF. It has been organized in a way that
could be used for the performance evaluation and for calibration of the numerical model. Due to the
high variability of mechanical properties of masonry and their uncertainty, their properties were
divided into three groups that represented a wide number of possible situations that could happen in
practice. A lower bound was represented by weak infill, the upper bound with strong infill and
medium infill panel had a range of compressive strengths between them. Further, we parametrically
investigated the seismic response “framed-masonry” structures, with the numerical model that was
simple enough in the computation and elaboration of results, and sufficiently refined for adequate
simulation of the main behavioural characteristics. Such reliable and calibrated numerical model was
used for the parametric analysis and damage assessment of the “framed-masonry” structures.
1Senior research assistant, Faculty of Civil Engineering, Osijek, Croatia, [email protected]
2Full professor, Faculty of Civil Engineering, Osijek, Croatia, [email protected]

2
On the basis of EDIF database and parametric analysis done with the calibrated numerical model a practical displacement-based damage evaluation methodology has been suggested.
EXPERIMENTAL DATABASE OF INFILLED FRAMES
The collected experimental database (Experimental Database of Infilled Frames – EDIF) contains data of 113 published tests of the basic ‘‘framed-masonry’’ composite system. It contains all available input and output data systematized in a way applicable for performance evaluation. Input data were selected considering their availability and uniformity. Primary geometrical properties of the frames were span length (L) and story height (H). Dimensions of the frame elements and longitudinal reinforcement in the columns were taken as secondary parameters expressed as moments of inertia and reinforcement ratios. All parameters were expressed as dimensionless in all possible cases (a= height to length ratio, b= ratio of moments of inertia of beam to column, g= ratio of column width to the thickness of masonry infill, rb = longitudinal reinforcement ratio of beam and rc = longitudinal reinforcement ratio of column). The material properties of the frames consisted of the concrete compressive strength (fck) and its modulus of elasticity (Ec) as well as steel yield strength (fy).The properties of the masonry infill were compressive strength (fk) modulus of elasticity (Ei)and thickness of the masonry infill wall (t).The applied lateral loading sequence in the tests was either static–mono-tonic, cyclic or seismic excitation and the chosen parameters in the EDIF database were horizontal loading(monotonic or cyclic) and axial vertical load (N) applied to the columns.
For representing the behavior of the framed-masonry composite measured resistance envelope curve was replaced by bilinear curve obtained by the equal energy rule (Figure 1.). Two points on the idealized bilinear primary curve, important for description of the system behavior, could be obtained from the EDIF database by using the Artificial Neural Network algorithms trained on it, that is yield (Vy and dy) and capping point (Vu and du) as well as the Failure mode (FM).
Figure1. Bilinear approximation of the primary curve in the EDIF database
A statistical sensitivity analysis, based on the forward stepwise method, was used for
elimination of the unimportant parameters in the learning process of the ANN (Kalman Šipoš at all, 2013). Forward stepwise method assesses the change in the mean squared error of the network by sequentially adding input neurons to the neural network (rebuilding the neural network at each step). According to the results of the ANN, the most important input parameters were: a= height to length ratio, rc = longitudinal reinforcement ratio of column and compressive strengths of concrete (fck) and masonry infill (fk).
CALIBRATION AND VALIDATION OF THE NUMERICAL MODEL
The behaviour of the “framed-masonry” structural elements has been analysed using the existing nonlinear element models used for modelling the frame and infill-panel elements. Its calibration was done on three samples taken from the EDIF database, and its validation was performed on the model of multi-storey multi-bay “framed-masonry” building structures tested in the European
dy, Vy
yield point
du, Vu
ultimate point
0
0,1
0,2
0,3
0,4
0,5
0,6
0
0,1
0,2
0,3
0,4
0,5
0,6
0 0,2 0,4 0,6 0,8 1 1,2
Ba
se s
hea
r r
ati
o H
/V
Drift (%)
Bare frame
Infilled frame with hollow
masonry units
Bilinear aproximation
Phase 2Phase 3
Ph
ase 1
T. Kalman Šipoš and V. Sigmund 3
laboratories. It has been proven that calibrated model could be applied with sufficient reliability, for the parametric analysis of the real “framed-masonry” buildings.
All numerical analyses were performed by the Seismostruct v6.5 (2013). RC frame elements were modeled as force-based elements with concentrated plastic hinges at the ends. The nonlinear confined concrete model and the nonlinear model for reinforcing steel were used. The masonry infill wall was modeled as the infill panel model with calibrated parameters of hysteretic behavior. The initial diagonal width, w1, was determined according to proposal of Stafford Smith and Carter (1969). It is based on the parameter λh which presents a measure of the relative stiffness of the frame to infill. Reduced area of the compressed diagonal depends on the stiffness coefficient λh, according to recommendations of Decanini (1986). Corresponding deformations were determined according to the limit states: start of reduction of the initial area Ams1 corresponds to deformation at the end of linear elastic behaviour (εm/3) while Ams2 secondary area is reached at 70% of the maximum compressive stress and the associated strain corresponds to the 1.5×εm (Figure 2).
0
4
8
12
16
0 0,0025 0,005 0,0075 0,01 0,0125
Com
pre
ssiv
e st
ren
gth
fm
(MP
a)
Deformation ε(%)
Ams2
Ams1
ε1 ε2 εm
0,7×fm’
fm’
0,3×fm
’
Figure 2. Variability of the areas and associated deformations
Table 1. Material and geometric properties of the experimental samples
Parameter Legend N2 C1 M2
l (m) frame span 2.5 1.9 2.3 h(m) frame height 1.425 1.425 1.61 b/hstup (m) column dimensions 0.2/0.2 0.2/0.2 0.22/0.22 Istup (m
4) moment of inertia of column 1.3E-04 1.3E-04 2E-04 Ec( kN/m2) concrete modulus of elasticity 3.56E+07 3.53E+07 1.26E+07 h' (m) height of the infill 1.3 1.3 1.5 l' (m) length of the infill 2.3 1.7 2.08 Q (°) angle of diagonal 29.48 37.41 35.80 t(m) thickness of infill 0.16 0.12 0.12 d(m) length of diagonal 2.64 2.14 2.56 fk(kN/m2) masonry compressive strength 2740 5100 14400 Ei (kN/m2) masonry modulus of elasticity 1.21E+06 4.23E+06 5.48E+06
SSC (1969)
λh stiffness parameter 2.30 3.01 4.11 w initial width of diagonal 0.46 0.56 0.77 Ams1 initial area of diagonal 0.46 0.56 0.77
Decanini (1986)
Ams2=%Ams1 secondary area of diagonal 77.4 73.4 68.2
Kaushik (2007) εm
deformation that corresponds to the maximum value of the compressive strength
0.0024 0.0027 0.0039
Figure 2. ε1 deformation that corresponds to the initial area 0.00082 0.00089 0.0013 ε2 deformation that corresponds to the secondary area 0.0037 0.004 0.0059

4
Three samples from the EDIF database were selected according to the compressive strength of the masonry infill as the samples with weak, medium and strong infill type. From the experiments conducted by Colangelo (2005) taken was one sample as frame with weak infill (N2) and the other as frame with medium infill type (C1). The sample with strong infill type (M2) was tested by Žarnić (1985). All three samples were produced and tested in a scale 1:2.
Experimental results are presented as primary load-displacement curve characterized by two points: yielding and ultimate capacity of the framed-masonry element. The quality of the calculated results, obtained by described method, is evaluated by their relative error to the experimentally obtained values for the characteristic values (displacements and forces) in Table 2. According to the results relative average error for all four parameters was 8%, while largest error was 12% for the yield drift.
Figure 3.Calculated and measured results of the samples
Table 2. Evaluation of the calibration for samples
N2 C1 M2
exp SSC exp SSC exp SSC
dy (%) yield drift 0.035 0.04{14}1 0.029 0.032 {10}1 0.042 0.047{12}1
du (%) ultimate drift 0.561 0.6{7} 0.42 0.45{7} 0.53 0.49{8}
Vy (kN) yield force 75 67{11} 90 87{3} 240 202{16}
Vu (kN) ultimate force 195 194{1} 190 183 {4} 324 319{2}
1 - Values in brackets {} represent the relative errors expressed in percentage of values determined numerically in relation to the experimental ones
After calibration of the numerical model, its validation was done on a three story building named PATRAS (Fardis, 1997.). The building was designed according to Eurocodes for intermediate level of ductility (DCM) for the design ground acceleration of 0.3g with class C25/30 concrete and reinforcement S500.It had two spansof 4m and 6m, first floor storey height was 3.5 meters and other floors were 3 meters high. The side columns were 40/40 cm and the central one was 45/45 cm. The beams were 30/45 cm and the slab was 15 cm thick. Compressive strength of concrete ranged from 24.1 to 51.8 MPa, the yield strength of reinforcement was 55.5 MPa, masonry infill units were UNIBRICK 11.2 cm with vertical holes and the compressive strength of the infill was 2.4 MPa with elastic modulus of 2.5 GPa .The building was tested in 1:1 scale under pseudo-dynamic excitation (Verzeletti et al, 1997) that represented the Eurocode 8 response spectrum with a maximum ground acceleration of 0.45g.
The numerical model of the Patras building is shown in Figure 4 and the analysis was performed in Seismostruct v6,5 (2013) by use of the previously calibrated data, as explained (Table 3).
0
100
200
0 0,5 1 1,5
Forc
e (k
N)
d (%)
N2-Stafford-Smith and Carter
N2- experiment
0
100
200
0 0,5 1 1,5
Forc
e(k
N)
d (%)
C1-Stafford-Smith and Carter
C1- experiment
0
200
400
0 0,5 1 1,5
Forc
e (k
N)
d (%)
M2-Stafford-Smith and Carter
M2- experiment

T. Kalman Šipoš and V. Sigmund 5
Figure 4. Numerical model of the PATRAS building with the excitation time history
Table 3.Material and geometric properties of the masonry infill
PATRAS fk
(MPa)
Ei
(MPa) εm εu ε1 ε2 λh
fmθ∗
(MPa)
Ams1
(m2)
Ams2
(%Ams1)
ground (4m)
2.4 2500 0.0032 0.0088 0.00107 0.0048
2.51 0.273 0.216 76.17
ground (6m) 2.33 0.283 0.281 76.64
1. floor(4m) 2.22 0.258 0.199 77.83
1. floor(6m) 2.12 0.263 0.229 78.47
The calculated and experimental results are compared by the relative errors of the maximum
and minimum floor displacement and base shear and by their correlation values. Based on the
relationship shown in the Figure 5 to 7 the maximum relative error was 8% and the mean relative error
was 4% for floor displacements and 2% for the base shear. Correlation values in all cases showed
values higher than 0.9.
It could be concluded that the adopted numerical model was capable of predicting the
behaviour of the real structure exposed to earthquake excitation.
Figure 5. Measured and calculated displacements of the first and second floor
-0,5
-0,25
0
0,25
0,5
0 2 4 6 8 10
ag
(g
)
Time (s)
-2
-1
0
1
2
0 1 2 3 4 5 6 7 8 9 10
1. f
loor
dis
pla
cem
ent
(cm
)
Time (s)
experiment numerical model
-4
-2
0
2
4
0 1 2 3 4 5 6 7 8 9 10
2. f
loor
dis
pla
cem
ent
(cm
)
Time (s)
experiment numerical model

6
Figure 6. Measured and calculated displacements of the third floor
Figure 7. Measured and calculated base shears
PARAMETRIC ANALYSIS
The previously explained calibration process turned out the reliable numerical tool and
valuable support for further extensive parametric investigations of the framed-masonry buildings with
an aim of developing a methodology for damage assessment of the framed-masonry structures.
Model building was a three-storey RC framed-masonry building with parameters of the
masonry infill type according to the results of the forward stepwise method. Ground floor was 3.75 m,
and other floors were 3m high (Figure 7). Bay span was 4 m, columns were 40/40cm and the beams
30/50. The masonry infill type was varied according to its compressive strength as weak, medium and
strong infill (1.17 MPa, 2.92 MPa and 5.01 MPa).
Figure 8. The model building with element dimensions
In order to simplify the design of framed-masonry buildings, we correlated the required capacity
and area of framed-masonry in relation to the area of floors by the surface ratio (Equation (1).
-6
-3
0
3
6
0 1 2 3 4 5 6 7 8 9 10
3. f
loor
dis
pla
cem
ent
(cm
)
Time (s)
experiment numerical model
-2
-1
0
1
2
0 1 2 3 4 5 6 7 8 9 10
Base
sh
ear
(×1000)
kN
Time (s)
experiment numerical model
beam 30/50cm
5φ18
4φ18
Q335:φ8/15cm
column 40/40cm
8φ25
T. Kalman Šipoš and V. Sigmund 7
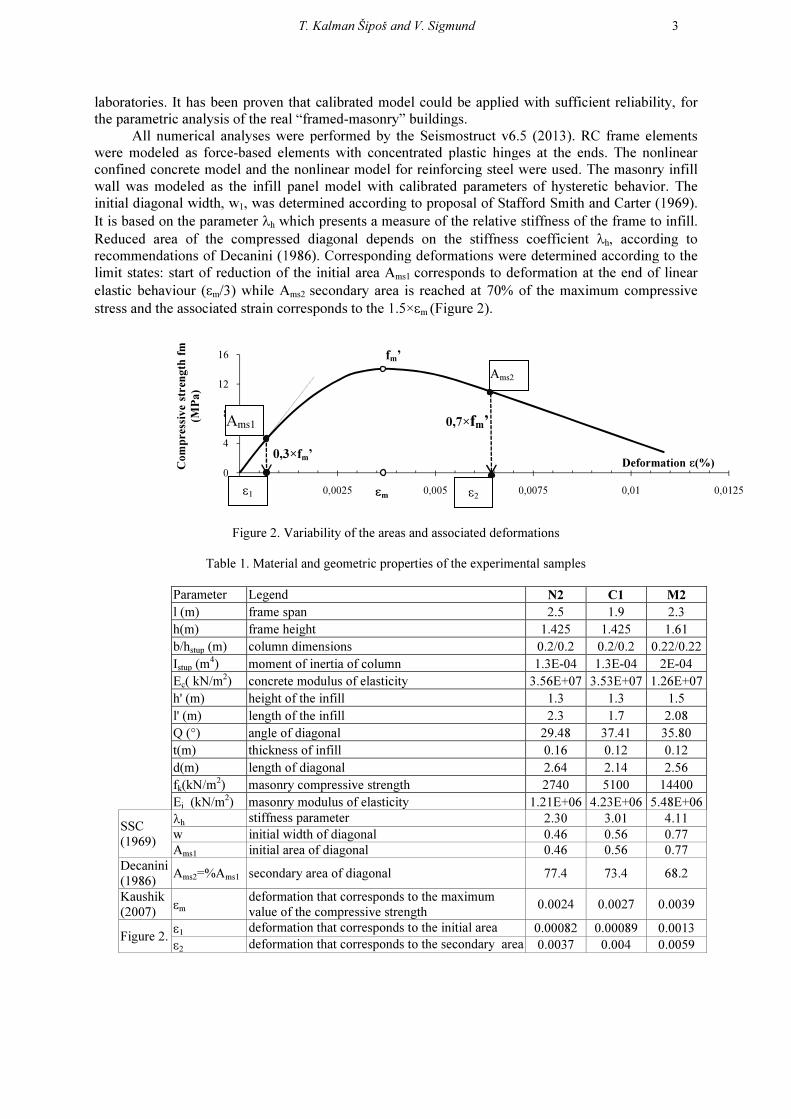
Analyzed infilled frame(framed-masonry) area (AIF= AI+AFR; AI=infill’s area; AFR=frame area) in the
direction of the earthquake and the corresponding floor area (AF), were expressed in percentage (ρ =
3%, 4%, 5%) ratios.
F
IF
A
A=ρ
(1)
Figure 9. Surface ratio
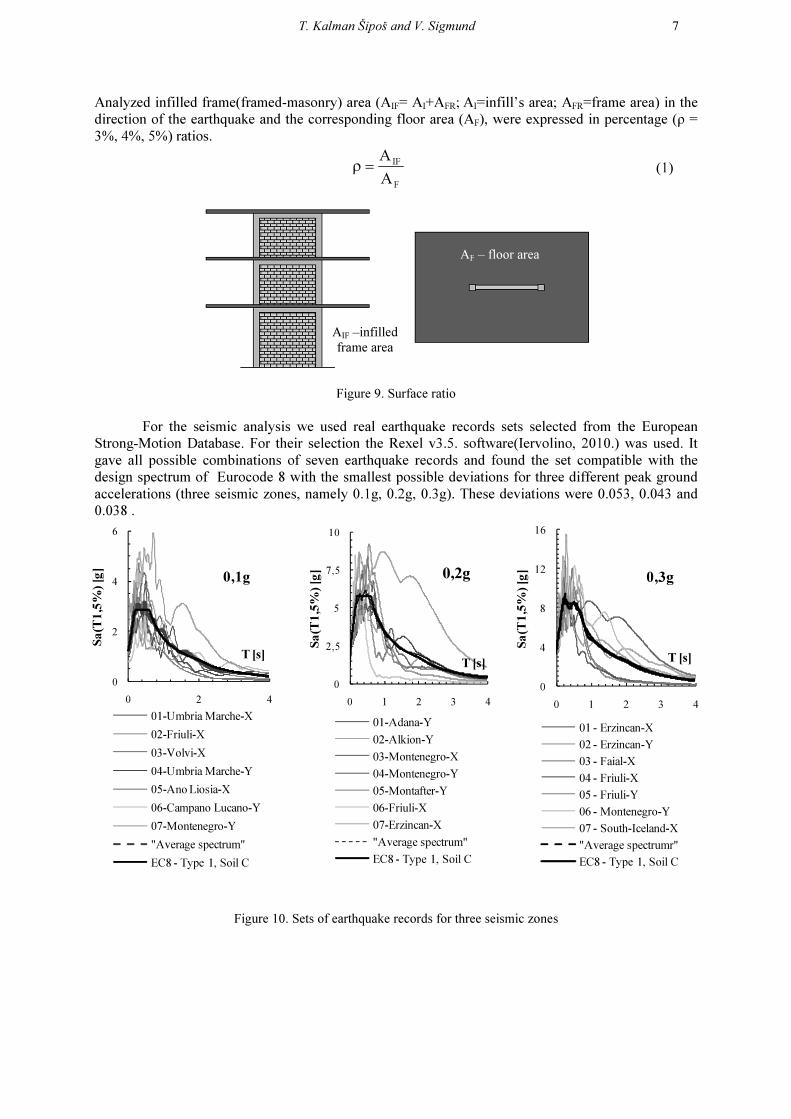
For the seismic analysis we used real earthquake records sets selected from the European
Strong-Motion Database. For their selection the Rexel v3.5. software(Iervolino, 2010.) was used. It
gave all possible combinations of seven earthquake records and found the set compatible with the
design spectrum of Eurocode 8 with the smallest possible deviations for three different peak ground
accelerations (three seismic zones, namely 0.1g, 0.2g, 0.3g). These deviations were 0.053, 0.043 and
0.038 .
Figure 10. Sets of earthquake records for three seismic zones
0
2
4
6
0 2 4
Sa
(T1
,5%
) [g
]
T [s]
0,1g
01-Umbria Marche-X
02-Friuli-X
03-Volvi-X
04-Umbria Marche-Y
05-Ano Liosia-X
06-Campano Lucano-Y
07-Montenegro-Y
"Average spectrum"
EC8 - Type 1, Soil C
0
2,5
5
7,5
10
0 1 2 3 4
Sa
(T1
,5%
) [g
]
T [s]
0,2g
01-Adana-Y
02-Alkion-Y
03-Montenegro-X
04-Montenegro-Y
05-Montafter-Y
06-Friuli-X
07-Erzincan-X
"Average spectrum"
EC8 - Type 1, Soil C
0
4
8
12
16
0 1 2 3 4
Sa
(T1
,5%
) [g
]
T [s]
0,3g
01 - Erzincan-X
02 - Erzincan-Y
03 - Faial-X
04 - Friuli-X
05 - Friuli-Y
06 - Montenegro-Y
07 - South-Iceland-X
"Average spectrumr"
EC8 - Type 1, Soil C
AF – floor area
AIF –infilled frame area

8
DAMAGE ASSESSMENT METHODOLOGY
In order to evaluate the calculated structural behavior of framed-masonry buildings four damage
states, “Slight”, “Moderate”, “Extensive”, and “Near collapse” were used (Table 4). The limit values in terms of inter‒storey drift ratio (IDR) for each limit state were determined on the basis of data from the EDIF experimental database.
Table 4. Damage states and corresponding inter‒storey drift ratio range, IDR (%)
Damage state Description IDR (%)
Slight damage Fine cracks in infill IDR<0,10
Moderate damage Cracking at infill‒frame interfaces 0.10≤IDR<0.30
Extensive damage Extensive cracking of infills, falling masonry units, out‒of‒plane bulging 0.30≤IDR<0.75
Near collapse Partial failure of many infills, damage in frame members, some fail in shear IDR≥0.75
By definition of the damage states and incremental dynamic analysis of the nonlinear numerical
models we obtained the results presented thru the fragility curves. They represent discrete limit state probabilities with consideration of a level of structural damage for assessment of the seismic fragility.
For each model building the incremental dynamic analysis curves were calculated according to the variation of inter-story drift ratio in relation to the intensity measure and spectral acceleration (T1,5%) for the set of seven earthquake records corresponding to the particular earthquake intensity. For each limit state and for each earthquake values from IDA curves, a cumulative vulnerability curve were presented as lognormal function. The probable level of structural damage, for a given period and spectral acceleration of medium response spectrum for specific earthquake seismic zone, is the condition with the highest probability of occurrence (Figure 11).
Figure 11. IDA curves, fragility curves and definition of relevant damage state
The results of 27 model buildings obtained from the incremental dynamic analysis are summarized and presented according to the level of structural damage in Figure 12. They indicate an expected trend of damage increase in the direction of a stronger seismic load. Damage could be reduced by increasing the ρ ratio and/or by using the higher strength of the masonry infill wall. Three-story framed-wall building, with no or little damage, could be located in the area of the peak seismic acceleration of up to 0.1 g with a compulsory use of the medium and strong infill with compressive strength higher than 2.5 MPa.
0
0,5
1
1,5
2
0% 1% 2%
Sa(T
1,5
%)
[g]
IDR [%]
IDA curves 3S4L2I2F_4%_0,2g
01-Adana-Y
02-Alkion-Y
03-Montenegro
04-Montenegro-Y
05-Montafter-Y
06-Friuli-X
07-Erzincan-X
00,10,20,30,40,50,60,70,80,9
1
0 0,5 1 1,5 2
Cu
mu
lati
ve
pro
babi
lity
Sa(T1,5%) [g]
Fragility curves3S4L2I2F_4%_0,2g
Moderate damage
Extensive damage
Near colapse
0
0,1
0,2
0,3
0,4
0,5
0,6
0,7
0,8
0,9
1
Dis
cret
e p
rob
abil
ity
Sa (T1=0,17s)=0,65g
Slight damage
Moderate damage
Extensive damage
Near colapse

T. Kalman Šipoš and V. Sigmund 9
Slight damage IDR<0,10%
Moderate damage 0,10% ≤ IDR<0,30%
Extensive damage 0,30% ≤ IDR<0,75%
Near colapse IDR ≥ 0,75%
Figure 12. IDA results of the model building with three different masonry strengths and three peak ground acceleration levels expressed by damage levels
In order to further observe the trend of damage according to the building’s height and variation
of inter-story drift ratios by floors, the IDA results have been presented for every earthquake record for particular seismic zone (with normalized scale factor) in Figure 13. The damage was expressed by the mean inter-story drift ratio per floor. Higher values of IDR (%) were in the lower half of the building. The range of values for the lowest seismic zone was 0.03-0.19 %, from 0.05 to 0.61 % for the second, and from 0.08 to 1.88 % for the third seismic zone. It depended on the combination of the applied masonry types with surface ratio, ρ. This also revealed the importance of applying the surface ratio, ρ, in the numerical model. Its lower value led to the increased damage. The comparison of the damage levels from the incremental dynamic analysis (Figure 12) and damages according to the maximum value of the individual building inter-story drift ratio from time history analysis (Figure 13) presents a very good compatibility. It differed only in 18% of buildings with small deviations from the limit values of IDR (%).
fram
e
infi
ll
flo
or ρ=3% ρ=4% ρ=5%
0.1g 0.2g 0.3g 0.1g 0.2g 0.3g 0.1g 0.2g 0.3g
Inte
r-st
ory
dri
ft r
atio
(%
) wea
k 3 0.14 0.29 0.34 0.08 0.17 0.24 0.07 0.13 0.22
2 0.17 0.48 1.15 0.13 0.31 0.69 0.11 0.23 0.41
1 0.13 0.36 0.76 0.09 0.25 0.45 0.08 0.18 0.29
med
ium
3 0.07 0.22 0.34 0.05 0.12 0.3 0.04 0.05 0.18
2 0.11 0.52 0.73 0.08 0.33 0.71 0.06 0.12 0.43
1 0.10 0.33 0.67 0.07 0.22 0.51 0.04 0.14 0.33
stro
ng 3 0.06 0.19 0.32 0.04 0.11 0.31 0.03 0.05 0.08
2 0.07 0.34 0.70 0.08 0.27 0.42 0.05 0.08 0.16
1 0.08 0.24 0.48 0.07 0.21 0.39 0.04 0.08 0.14
Slight damage IDR<0,10%
Moderate damage 0,10% ≤ IDR<0,30%
Extensive damage 0,30% ≤ IDR<0,75%
Near colapse IDR ≥ 0,75%
Figure 13. IDR (%) values for normalized factor of IDA analysis
Type of infill weak medium strong
ρ (%) 3 4 5 3 4 5 3 4 5
dam
age
stat
e 0,1g
0,2g
0,3g

10
The results are presented in a way to establish the relationship between the infill type and
damage state for the analyzed three story (low-rise) framed-masonry buildings.
Figure 14. Damage states in relation to the infill’s strength According to the results shown in the Figure 14 it is obvious that the behavior of low-rise
framed-masonry building is completely defined by the type of masonry infill. Correspondence of results for 0.2g and 0.3g peak ground acceleration indicated that damage states could be reliably predicted with the difference in the first higher damage level.
CONCLUSIONS
The assessment methodology for low rise framed-masonry buildings has been outlined. It was arrived at by use of the calibrated numerical model. It has been calibrated on the experimental database of tested framed-masonry elements and further validated on the tested full-scale building. The numerical model was used for parametric analysis of these structural elements with particular attention focused on the effect of mechanical properties of infill panels and their influence to the global structural response. Three different strengths of masonry infill walls were: weak, medium and strong. This choice was also made with the purpose of obtaining an upper and lower limit of the results, thus giving a reasonable range for the evaluation of their seismic response.
The results of analyses performed on the infilled frame showed that the typology of masonry panels, whether weak or strong, has a moderate influence on the global structural response. The strength of the masonry infills gives a contribution to the maximum resistance of the building but, also the level of deformation experienced by the frame are moderately influenced by the characteristics of the infill panels. According to the damage states achieved in parametric analysis it can be concluded that the damage of infilled frames increases with increasing seismic load until the failure of infill, if the weak infill type is used. The use of medium and strong type of infill will reduce damage to the first lower level of damage states in relation to the application of a weak type. An importance of applying the surface ratio ρ in the numerical model was observed. Its lower value led to the increased damage (to the first higher level of damage states).
It is important to emphasise that an analysis has been performed for a fully and uniformly infilled frame, which structural response is strongly influenced by the presence of the infill panels.
A more exhaustive parametric analysis on masonry infilled structures, considering the effects of number of stories, types of reinforced concrete frames according to reinforcement ratios, infill dimensions, relative stiffness frame/infill, etc., would help to extend the analysis of infilled framed building model here proposed for a more wide range of conditions. This could lead to practical
0
1
2
3
3 4 5
ρ (%)
weak infill
medium infill
strong infill
near colapse
extensive damage
moderate damage
slight damage
0,1g
0
1
2
3
3 4 5
ρ (%)
weak infill
medium infill
strong infill
near colapse
extensive damage
moderate damage
slight damage
0,2g
0
1
2
3
3 4 5
ρ (%)
weak infill
medium infill
strong infill
near colapse
extensive damage
moderate damage
slight damage
0,3g

T. Kalman Šipoš and V. Sigmund 11
methodology valid for a broad range of situations, which could be considered in future seismic structural assessment standards.
The research presented in this paper is a part of the research project “Seismic design of infilled frames”, No. 149–1492966–1536, supported by the Ministry of Science, Education and Sports of the Republic of Croatia and its support is gratefully acknowledged.
REFERENCES
Colangelo F (2005) ”Pseudo-dynamic seismic response of reinforced concrete frames infilled with non-structural brick masonry”, Earthquake engineering and structural dynamics. 34:1219–1241.
Crisafulli FJ (1997) Seismic behavior of reinforced concrete sructures with masony infills, PhD Thesis. Christchurch, New Zealand.
Decanini LD and Fantin GE (1986) “Modelos simplificados de la mampostería incluida en pórticos.Características de rigidez y resistencia lateral en estadolímite” (in Spanish), Jornadas Argentinas de Ingeniería Estructural, Buenos Aires, Argentina, Vol. 2, pp. 817-836.
Fardis MN (1996), Experimental and numerical investigations on the seismic response of R.C. infilled frames and recommendations for code provisions, ECOEST and PREC8 Report No.6, LNEC, Lisbon.
Ghobarah A (2001), “Performance-based design in earthquake engineering: state of development”, Engineering Structures 23, pp. 878-884.
Grubišić M, Kalman Šipoš T, Sigmund V.(2013) „Seismic Fragility Assessment of Masonry Infilled Reinforced Concrete Frames” Proceedings of International Conference on Earthquake Engineering - SE-50EEE / Skopje
Iervolino I, Galasso C, and Cosenza E, (2010), “Rexel: computer aided record selection for code based seismic structural analysis” Bulletin of Earthquake Engineering 8: 339–362.
Kalman Šipoš T, Sigmund V, Hadzima-Nyarko M, (2013) „Earthquake performance of infilled frames using neural networks and experimental database“ Engineering structures 51:113-127
Kaushik HB, Rai DC, Jain SK (2007) “Stress-Strain Characteristics of Clay Brick Masonry under Uniaxial Compression” Journal of Materials in Civil Engineering,19(9), pp.728-739.
Mander JB, Priestley MJN, and Park R. (1988) “Theoretical stress-strain model for confined concrete”. ASCE Journal of Structural Engineering 114(8): 1804–1826.
Menegotto M., and Pinto PE. (1973). "Method of Analysis for Cyclically Loaded Reinforced Concrete Plane Frames Including Changes in Geometry and Non-Elastic Behavior of Elements under Combined Normal Force and Bending", Proceedings, IABSE Symposium on Resistance and Ultimate Deformability ofStructures Acted on by Well Defined Repeated Loads, Lisbon, pp. 15-22.
Negro Pand Verzeletti G. (1996) “Effect of infills on the global behaviour of r/c frames: energy considerations from pseudodynamic tests,” Earthquake Engineering and Structural Dynamics, Vol. 25(8), pp. 753-773.
Seismosoft (2013) "SeismoStruct v6.5–A computer program for static and dynamic nonlinear analysis of framed structures,"available fromhttp://www.seismosoft.com.
Stafford-Smith B, Carter C. (1969) “A method for the analysis of infilled frames”, Proc. Instn. Civ.Engrs. 44, 31–48.
ŽarnićR (1985) The analysis of R/C frames with masonry infill under seismic actions, (in Slovene), FGG Ljubljana.
Žarnić R (1992) Inelastic response of r/c frames with masonry infill, Ph.D. Thesis, University of Ljubljana, Slovenia.
Related Documents