1 Distribution and function of muscarinic receptor subtypes in the ovine submandibular gland By G. Tobin* # , A.T. Ryberg*, S. Gentle § and the late A.V. Edwards § *Department of Pharmacology, the Sahlgrenska Academy at Göteborg University, Medicinaregatan 15D, Goteborg 413 90, Sweden and § Physiological Laboratory, University of Cambridge, Downing Street, Cambridge, CB2 3EG, UK Running title: Muscarinic receptors in the ovine submandibular gland Keywords: saliva, vasodilatation, muscarinic receptor # Corresponding author: [email protected] Articles in PresS. J Appl Physiol (December 1, 2005). doi:10.1152/japplphysiol.00779.2005 Copyright © 2005 by the American Physiological Society.

Welcome message from author
This document is posted to help you gain knowledge. Please leave a comment to let me know what you think about it! Share it to your friends and learn new things together.
Transcript
1
Distribution and function of muscarinic receptor subtypes in
the ovine submandibular gland
By
G. Tobin*#, A.T. Ryberg*, S. Gentle
§ and the late A.V. Edwards
§
*Department of Pharmacology, the Sahlgrenska Academy at Göteborg University,
Medicinaregatan 15D, Goteborg 413 90, Sweden and §Physiological Laboratory,
University of Cambridge, Downing Street, Cambridge, CB2 3EG, UK
Running title: Muscarinic receptors in the ovine submandibular gland
Keywords: saliva, vasodilatation, muscarinic receptor
#Corresponding author: [email protected]
Articles in PresS. J Appl Physiol (December 1, 2005). doi:10.1152/japplphysiol.00779.2005
Copyright © 2005 by the American Physiological Society.
2
The effects of muscarinic receptor antagonists on responses to electrical stimulation of the
chorda-lingual nerve were determined in pentobarbitone-anaesthetized sheep and
correlated to the morphology of tissue specimens. Stimulation at 2 Hz continuously, or in
bursts of 1 s at 20 Hz every 10 s, for 10 min induced similar submandibular fluid
responses (19±3 vs. 21±3 l.min-1
g gland-1
), while vasodilatation was greater during
stimulation in bursts (-52±4 vs. -43±5 %; P<0.01). Continuous stimulation at 8 Hz induced
substantially greater responses (66±9 l.min-1
.g gland-1
and -77±3 %). While atropine (0.5
mg.kg-1
I.V.) abolished the secretory response at 2 and 20 (1:10 s) Hz, a small response
persisted at 8 Hz (<5 %). The “M1-selective” antagonist pirenzepine (40 g.kg-1
I.V.)
reduced the fluid response at all frequencies tested (P < 0.05-0.01), most conspicuously at
2 Hz (reduced by 69 %). Methoctramine (“M2/M4-selective”; 100 g.kg-1
IV; n=5) had
no effect on fluid or the vascular responses but increased the protein output at 2 (+90 %, P
< 0.05) and 8 Hz (+45 %, P <0.05). The immunoblotting showed distinct bands for
muscarinic M1, M3, M4 and M5 receptors, and immunohistochemistry showed
muscarinic M1 and M3 receptors to occur in the parenchyma. Thus, muscarinic M1
receptors contribute to the secretory response to parasympathetic stimulation but have
little effect on the vasodilatation in the ovine submandibular gland. Increased transmitter
release caused by blockade of neuronal inhibitory receptors of the M4 subtype would
explain the increase in protein output.
3
Introduction
The increase in salivary flow evoked by muscarinic agonists has generally been attributed
to activation of muscarinic receptors solely of the M3 subtype (Caulfield, 1993; Baum &
Wellner, 1999). This concept has been supported by findings obtained in studies using
subtype-specific antisera as well as by functional studies on rat parotid glands (Dai et al.,
1991). However, contradictory results have been found in the examination of other
salivary glands. Binding and molecular experiments on the rat submandibular gland have
indicated the expression of muscarinic M1 and M5 receptors in addition to the muscarinic
M3 receptors (Hammer et al., 1980; Buckley & Burnstock, 1986; Martos et al., 1987;
Vilaro et al., 1990; Flynn et al., 1997). Functional significance of muscarinic M1
receptors for the secretory response has been reported, in vivo as well as in vitro, in the
rabbit submandibular gland (Tobin, 1995) and in the rat sublingual (Culp et al., 1996;
Tobin et al., 2002), and of muscarinic M1 as well as M5 receptors in the rat
submandibular gland (Meloy et al., 2001; Tobin et al., 2002).
In salivary glands, parasympathetic nerve transmission may involve not only the classical
autonomic transmitter acetylcholine but also non-adrenergic, non-cholinergic transmitters
(Ekström, 1999). The parasympathetically nerve-evoked vasodilatation, which is evoked
by non-adrenergic, non-cholinergic transmitters, is particularly resistant to atropine
(Edwards, 1999). However, a secretory response also persists after full atropinization in
salivary glands of several species including the ovine submandibular gland (Edwards et
al., 2003), albeit much reduced and, preferentially, at high-frequency stimulation
(Ekström, 1999). In ovine salivary glands, the neuropeptides vasoactive intestinal peptide
and calcitonin gene-related peptide seem to mediate most of the atropine-resistant
parasympathetic responses (Edwards et al., 1988; Edwards et al., 2003). Nevertheless,
4
acetylcholine acting on muscarinic receptors is the principal stimulation for evoking fluid
responses in salivary glands (Cook et al., 1994), while the vasodilator response, although
markedly resistant to atropine, has a cholinergic component particularly at low-frequency
stimulation (Edwards, 1999; Edwards et al., 2003). The specific muscarinic receptor
mediating vasodilatation in salivary glands has not been characterized, although functional
studies in the rat parotid gland indicate that this response may be mediated, at least in part,
via muscarinic M3 receptors (Tobin, 1998).
Nerve transmission in the parasympathetic innervation of salivary glands may be
modulated by prejunctional muscarinic receptors (Tobin, 1995, 1998, 2002). In rat
salivary glands, muscarinic M1 receptors normally facilitate transmitter release during
short, intense nerve activity. At low frequencies, on the other hand, muscarinic M2
receptors, or possibly muscarinic M4 receptors, inhibit cholinergic as well as peptidergic
transmission, but only after some delay. Furthermore, it was first described in the feline
submandibular gland that stimulation of the parasympathetic innervation in a burst pattern
at high frequencies causes a conspicuous enhancement of vasodilatation and secretion in
comparison with continuous stimulation (Bloom & Edwards, 1979; Andersson et al.,
1982b). These observations have subsequently been confirmed in salivary glands of other
species including the ovine submandibular gland (Andersson et al., 1982a; Tobin et al.,
1990; Tobin, 1998, 2002). The phenomena have been attributed to the release of
neuropeptides, which preferentially occurs at high stimulation frequencies (Bloom &
Edwards, 1979; Andersson et al., 1982a), and to a short-lasting stimulation activating
facilitator and not inhibitory receptor mechanisms (Tobin, 1998, 2002).
In the present study, the contribution of muscarinic receptors other than the M3 subtype to
the in vivo responses in ovine salivary glands was determined using antagonists with
5
different muscarinic profiles (pirenzepine, methoctramine, p-fluorohexahydro-sila-
diphenidol, atropine (Caulfield, 1993; Eglen & Nahorski, 2000)). The effects of these
antagonists were examined on responses evoked by electrical stimulation at varying
frequencies and patterns of the parasympathetic chorda tympanic nerve and morphological
correlates sought by employing Western blotting and immunohistochemistry. A
preliminary report of some of these results has been published previously (Tobin &
Edwards, 2004).
Methods
Animals
The experiments were carried out on 18 adult ewes of various breeds (35-72 kg body
weight) under the Animals Scientific Procedures Act (1986); Project Licence PPL
80/1316. Food but not water was withheld for 48 h prior to each experiment. Anaesthesia
was induced and maintained with sodium pentobarbitone (Sagatal, Rhône Mérieux Ltd.,
Harlow, U.K.; 15-30 mg kg-1
I.V. and then 0.1 – 0.3 mg min-1
kg –1
I.V. (adjusted to
maintain a stable blood pressure)). At the end of each experiment the animal was given a
lethal dose of barbiturate (Pentoject, Animalcare Ltd., York, U.K.; ca 15 ml 20% w/v) and
the ipsi- and contra-lateral submandibular glands dissected out and weighed (18±2 vs.
13±1 g; n=13).
Surgical and experimental procedures
The trachea was intubated and then exposed via a mid-line incision low in the neck. The
ipsilateral ascending cervical sympathetic nerve was identified and cut. An arterial
catheter was introduced into the abdominal aorta via a femoral artery and later employed
to monitor arterial blood pressure and heart rate; samples of arterial blood were also
6
collected periodically for measurements of packed cell volume (at start of experiment:
28±1 %; at the end: 26±1 %; n=13). The femoral vein was cannulated to provide a conduit
for the continuous infusion of sodium pentobarbitone. The chorda-lingual nerve was
exposed and cut and the submandibular duct was cannulated with the widest bore nylon
tubing practicable. The free end was then positioned above a photoelectric drop-counter.
A neighbouring length of the hypoglossal nerve was excised in order to minimise spread
of stimulus. Each of the tributaries of the ipsilateral linguofacial vein, except that draining
the submandibular gland, was ligated. The animal was heparinized (Mutiparin. CP
Pharmaceuticals Ltd., Wrexham, U.K.; 1000 i.u. kg –1
I.V.) and the linguofacial vein
cannulated with a short length of polythene tubing. The submandibular venous effluent
was thereby diverted through a second photoelectric drop-counter and returned to the
animal by a pump, via the ipsilateral jugular vein, in such a way as to match input to
output. Finally, a bipolar platinum stimulating electrode was placed under the duct and
chorda tympani close to the hilum of the gland. The protocol involved parasympathetic
stimulation at 2 and 8 Hz continuously for 10 min (20 V square-wave; 10 msec pulse-
width), and intermittent stimulation at 20 Hz given for 1 s at 10 s intervals for 10 min.
This thus resulted in the same total number of impulses as 2 Hz given continuously. The
stimulation was applied at the specified frequencies before and after administration of
antagonists at doses previously validated to be selective; examined in pilot experiments
(n=3) and compared with results from the literature (“M1-selective”; pirenzepine
dihydrochloride, 40 µg kg-1
I.V. (100 nmol kg-1
); “M2/M4-selective”; methoctramine
tetrahydrochloride, 100 g kg-1
IV (140 nmol kg-1
); “M3(M1/M5)-selective”; p-fluoro-
hexahydro-sila-diphenidol hydrochloride (pFHHSiD, 4 µg kg-1
I.V. (10 nmol kg-1
; all
from Sigma, St. Louis, US (Tobin, 1995; Tobin & Sjogren, 1995; Tobin, 1998, 2002;
Tobin et al., 2002)). The rates of flow of submandibular blood and saliva were recorded
photometrically drop by drop and also estimated gravimetrically. No spontaneous flow of
7
saliva occurred. During stimulation collection of samples was delayed for 2 min in order
to ensure complete evacuation of the submandibular dead space. The samples of blood
were weighed for gravimetric estimation of blood flow and then returned to the animal to
preserve the circulating blood volume. Aortic blood pressure and heart rate were
monitored continuously by means of a pressure transducer and amplifier. In three animals
the responses to nerve stimulation were also determined following the administration of
atropine (atropine sulphate, Sigma; 0.5 mg kg-1
, I.V. (2 µmol kg-1
).
Immunohistochemistry and immunoblotting
After administration of a lethal dose of anaesthetic, tissue from the contralateral
submandibular gland was dissected out from the animal for histological examinations; a
central, lower part of the gland was removed. The specimens were either fixed in
phosphate buffered 4 % paraformaldehyde (pH 7.0), and then embedded in paraffin, or
immediately placed in -80° C until prepared for Western immunoblotting.
For the immunohistochemical investigation of muscarinic receptor expression, transverse
sections of the different specimens were prepared in a cryostat at a thickness of 4 µm. The
sections were de-paraffinized by heating the slides to 60 °C for 15 minutes and then
subjecting them to two 30-minute changes in 100% xylene; the sections were then re-
hydrated by serial incubations in 100%, 95%, 85% and 70% ethanol, followed by tris-
buffered saline (TBS). Then the sections were immersed in 10 mM citrate buffer (pH 6.0)
and were microwaved for four cycles of 6 min. Endogenous peroxidase was blocked with
0.03% hydrogen peroxidase for 30 min. Non-specific protein binding was blocked with
5% bovine serum albumin (BSA) in TBS for 30 min. The sections were thereupon
incubated overnight at room temperature in a humidified chamber with polyclonal rabbit
anti-mAChR subtype specific antibodies (Research and Diagnostic Antibodies, Berkley,
8
US) diluted 100 x in TBS containing 1% BSA. The presence of the muscarinic receptors
was revealed using an avidin-biotin-complex immunoperoxidase method (ABC Staining
System, Santa Cruz Biotechnology, Santa Cruz, US; system used following the
manufacturer’s instructions) that uses 3,3P-diaminobenzidine (DAB) as a substrate. The
sections were counterstained using Mayer’s hematoxylin (Histolab, Göteborg, Sweden).
As a negative control, duplicate sections were immunostained without exposure to the
primary antibody, which resulted in no brown staining of the tissue. As an additional
control, the antibodies were pre-absorbed with the appropriate immunogen before
proceeding as described above.
Muscarinic receptor expression in the ovine submandibular gland was examined using
Western blotting. All tissues were homogenized in ice cold PE buffer (phosphate EDTA
buffer) containing 0.1 mM leupeptin (Sigma, St Louis, US), 0.1 mM pepstatin (Sigma),
1.5 mM aprotinin (Sigma), 4 mM Pefabloc SC (Fulka Chemie, Buchs, Swittzerland), 50
µM sodium fluoride (Sigma), 0.2 µM sodium orthovanadate and 5 mM CHAPS (Sigma).
The lysate was heated to 70 °C for 10 minutes in a reducing sample buffer. The proteins
were fractionated by reducing NuPAGE 4-12 % Bis-Tris gels (Invitrogen, Carlsbad, US)
and electroblotted onto PDVF membranes (Invitrogen), which when were incubated in
PBS-T (PBS-T: phosphate-buffered saline containing 0.3 % Tween 20 (Sigma))
containing 0.2 % I-Block (Tropix, Bedford, US) to block non-specific binding. The
membranes were then incubated overnight with polyclonal antibodies directed against
each of the five muscarinic receptors respectively (Research and Diagnostic Antibodies,
Berkley, US). The antibodies were used at the following dilutions: 1:500 (anti-M1, anti-
M3 and anti-M4), 1:2000 (anti-M2) and 1:2500 (anti-M5). The antibodies were validated
using positive controls. The binding was visualized with a chemilumniscent detection
system that utilizes enzyme-linked immunodetection, detected using enhanced
9
chemiluminescence, visualized by Flour-S (BioRad, Hercules, US) and analyzed using the
QuantityOne software (version 4.4.1, build 067; BioRad). For negative controls primary
antibodies were omitted in the procedure described above. As an additional control the
antibodies were pre-absorbed with the appropriate peptide immunogen as well, before
proceeding as described above.
Estimations
Submandibular vascular resistance (SVR) was estimated by dividing the perfusion
(arterial blood) pressure (mm Hg) by the submandibular blood flow ( l min-1 [g gland]-1
)
and expressed as the % changes from experimental time=0. Results are expressed as mean
values ± S.E.M. and were assessed statistically (Prism 4, GraphPad Software Inc., US) by
means of paired or unpaired Student’s t test or by repeated measures ANOVA followed by
a Bonferroni test as appropriate with n =number of animals. P values less than 0.05 are
considered to be statistically significant. All flows and outputs are expressed per unit
weight of the contralateral gland.
Results
Cardiovascular and secterory responses to stimulation of the parasympathetic innervation
Under resting conditions, in the absence of any stimulation, no fluid secretion occurred
from the submandibular gland. The mean glandular blood flow was 0.33±0.04 ml min-1
g
gland-1
(n=13) and did not vary significantly during the resting periods throughout the
experiments: After the three basal stimulations performed in the absence of any antagonist
(after 120 – 180 min), the blood flow was still 0.30±0.03 ml min-1
g gland-1
(n=13). Mean
10
aortic blood pressure (92±5 vs. 88±4 mmHg) and heart rate (107±4 vs. 103±5 bpm) did
not differ significantly before and after stimulation.
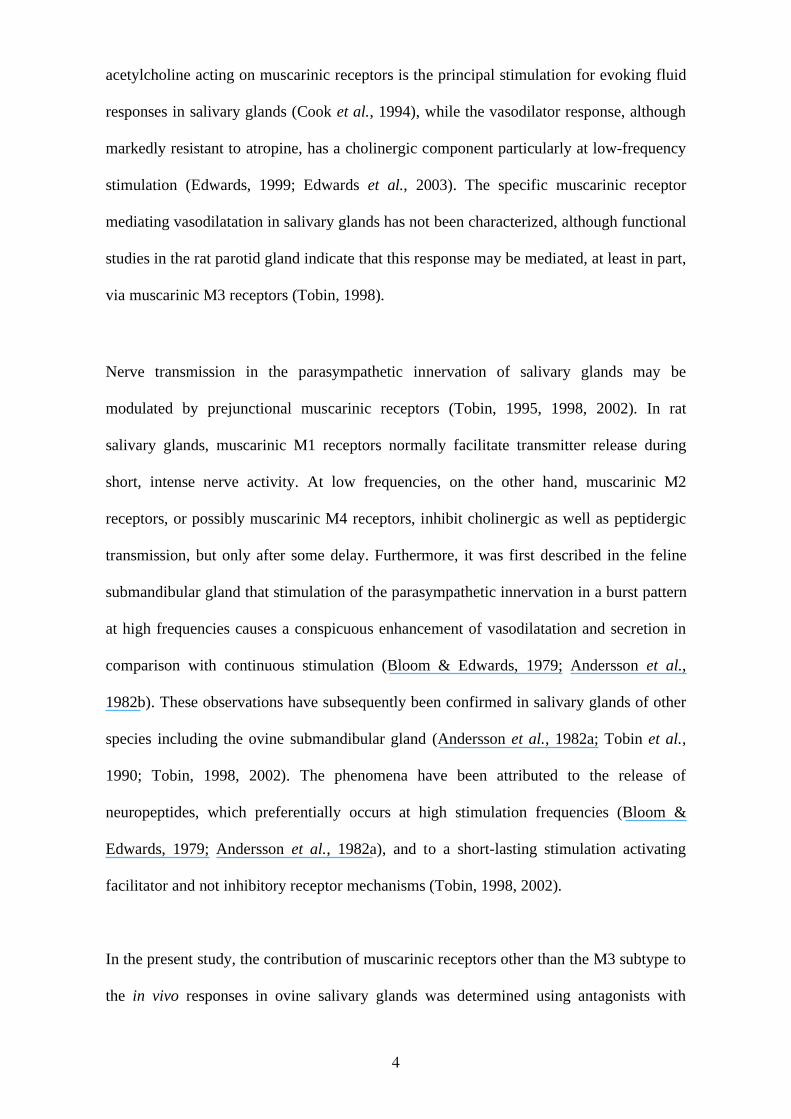
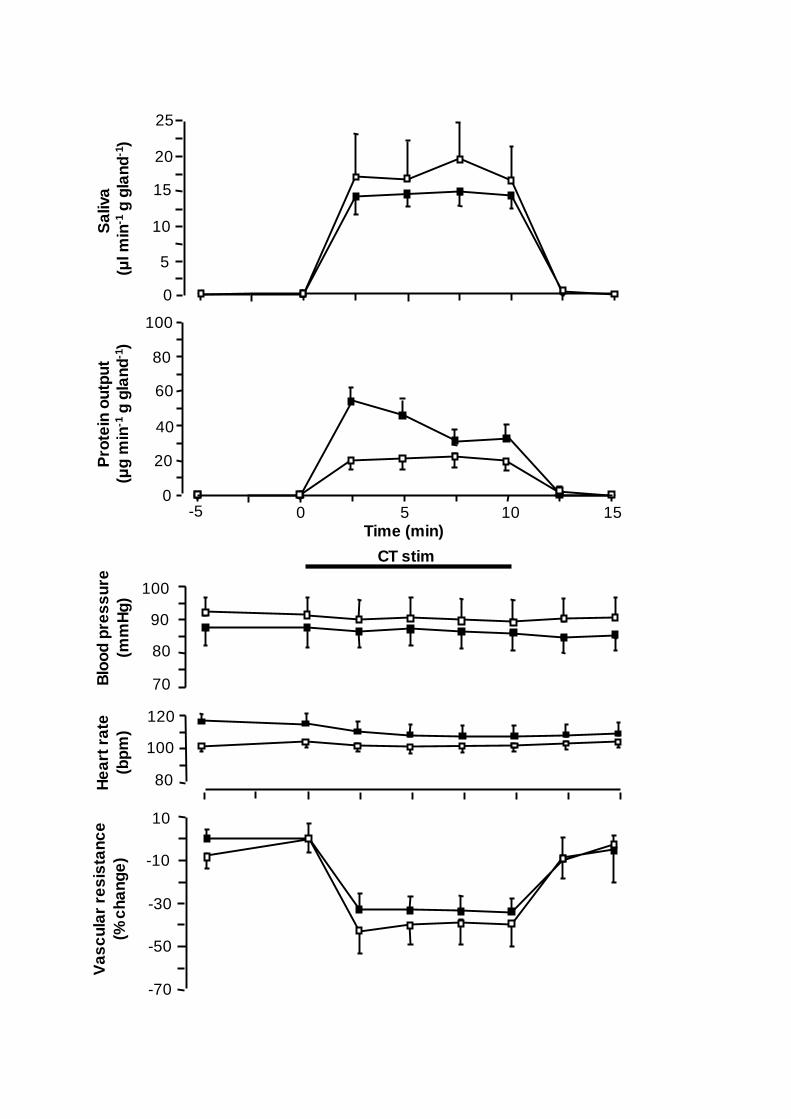
Stimulation of the peripheral end of the chorda tympani at 2 and 8 Hz produced a
frequency-dependent increase in the flow of saliva and a fall in the submandibular
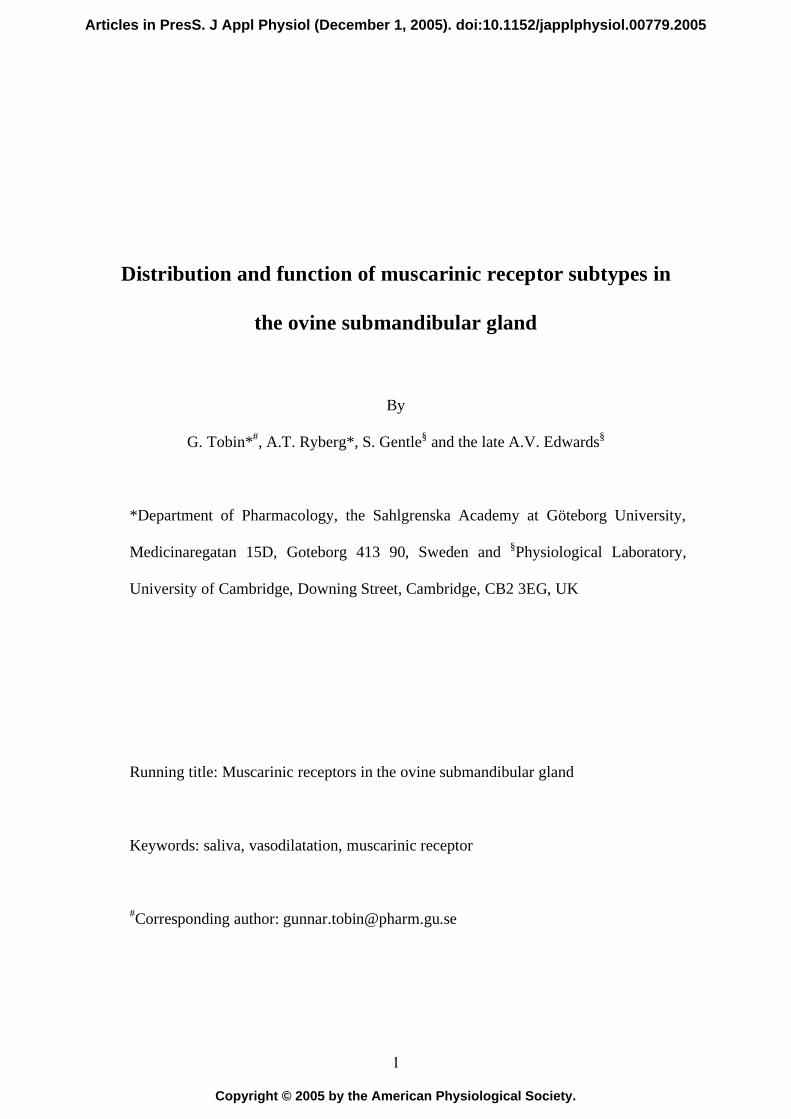
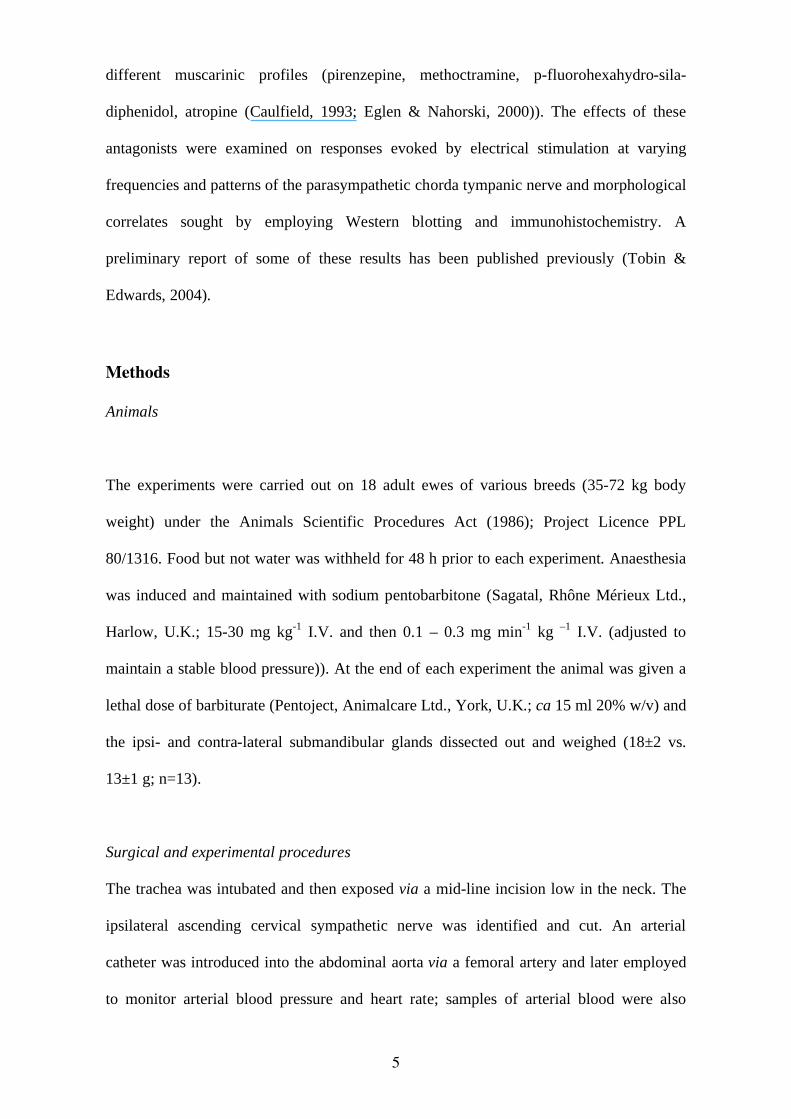
vascular resistance without affecting aortic blood pressure or heart rate (Fig. 1). Typical
responses from a single animal are illustrated in figure 2, which demonstrates the rapidity
of the onset of salivation and the associated vasodilatation in response to continuous
stimulation at 8 Hz. Both responses were well maintained for the duration of stimulation
and subsided gradually towards the initial values over a 5 – 10 min period after cessation
of stimulation. Stimulation at 8 Hz induced a mean flow of saliva over the 10 min
stimulation period that was approximately three times as large as that to 2 Hz (66±9 vs.
19±3 µl min-1
g gland-1
; P<0.001, n=13; Fig. 1). Also the mean decrease in SVR (-77±3
% vs. -43±5 %; P<0.001, n=13) was significantly greater at 8 Hz. This change in vascular
resistance corresponded to a mean blood flow of 0.53±0.05 ml min-1
g gland-1
at 2 Hz and
of 1.24±0.13 ml min-1
g gland-1
at 8 Hz. Stimulation at 20 Hz given in bursts for 1 s at 10 s
intervals (1:10), by so delivering precisely the same number of impulses to the chorda
tympani fibres over the 10 min test period as the continuous stimulation at 2 Hz, produced
instantaneous flow of saliva and fall in SVR similarly well-maintained during stimulation
and steadily subsiding thereafter (Fig. 1). The mean vasodilator response (mean blood
flow: 0.60±0.07 ml min-1
g gland-1
) during stimulation at 20 Hz given in bursts was
significantly greater than that during stimulation at 2 Hz continuously (-52±4 vs. -43±5 %;
P<0.01; n=13) but no such difference was recorded between the effects of the two patterns
of stimulation regarding the flow of saliva (21±3 and 19±3 µl min-1
g gland-1
at 20 Hz 1:10
and at 2 Hz, respectively). Continuous stimulation at 8 Hz was thus substantially and
significantly more effective than any of the other two stimulation patterns regarding flow
11
of saliva and change in SVR, but also regarding saliva protein output (P<0.01-0.001). The
mean protein output over the stimulation period in response to 8 Hz was 100±27 µg min-1
g gland-1
, and to 2 Hz and 20 Hz 1:10 s, 18±5 and 25±7 µg min-1
g gland-1
, respectively.
Whereas the output at 8 Hz was significantly greater than any of the other stimulation
patterns (P<0.01-0.001; n=13), the mean output over the whole period did not differ
significantly between 2 Hz and 20 Hz 1:10. However, during the initial few minutes (2-4)
of the stimulation period, a significantly greater output in response to the intermittent
stimulation at 20 Hz occurred in comparison with that to 2 Hz given continuously (17±4
vs. 27±6 µg min-1
g gland-1
; P<0.05, n=13). Furthermore, the latency of the secretory
response was invariably reduced when the intermittent pattern of stimulation was
employed at this range (2 Hz: 34 ± 8 s; 20 Hz 1:10: 16 ± 2 s; P<0.05; n=13). Also
stimulation at 8 Hz evoked a more instantaneous secretory response (13 ± 1 s; P<0.05;
n=13) than stimulation at 2 Hz did, but the latency did not differ from that at 20 Hz 1:10.
Responses following the administration of muscarinic antagonists
Pre-treatment with atropine (0.5 mg kg-1
I.V.; n=3) effectively abolished the secretion of
saliva at 2 and 20 Hz 1:10, but a small atropine-resistant response was observed during
chorda tympani stimulation at the higher frequency of stimulation (Fig. 2). This small
response at continuous stimulation at 8 Hz was characterized by a long latency (90 – 180
s) and the maximal flow over the 10 min stimulation period amounted to 2±0.5 µl min-1
g
gland-1
. It was invariably associated with an intense vasodilatation in the gland and the rise
in blood flow preceded the onset of salivation. The fall in SVR at 8 Hz was closely similar
before and after administration of atropine, whereas the fall in SVR during stimulation at 2
Hz continuously and 20 Hz 1:10 were -37±6 % and -44±7 % in the absence of atropine but
only -15±5 % and -36±3 % in the presence, respectively.
12
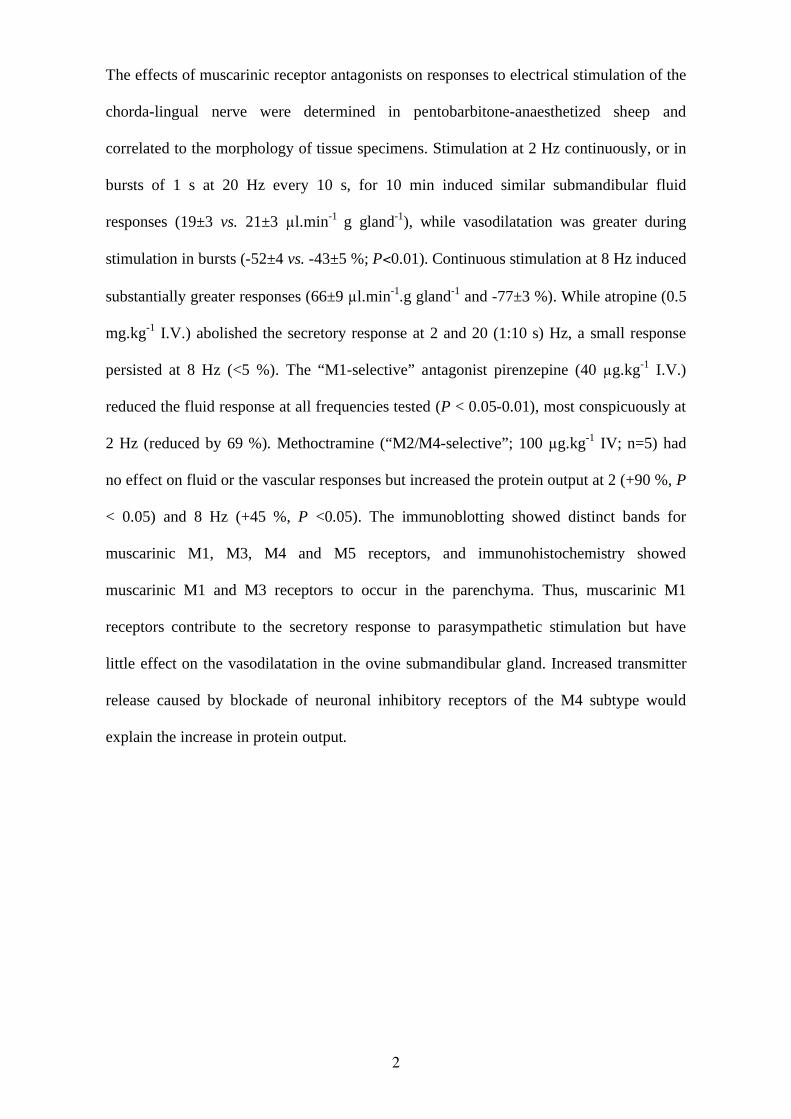
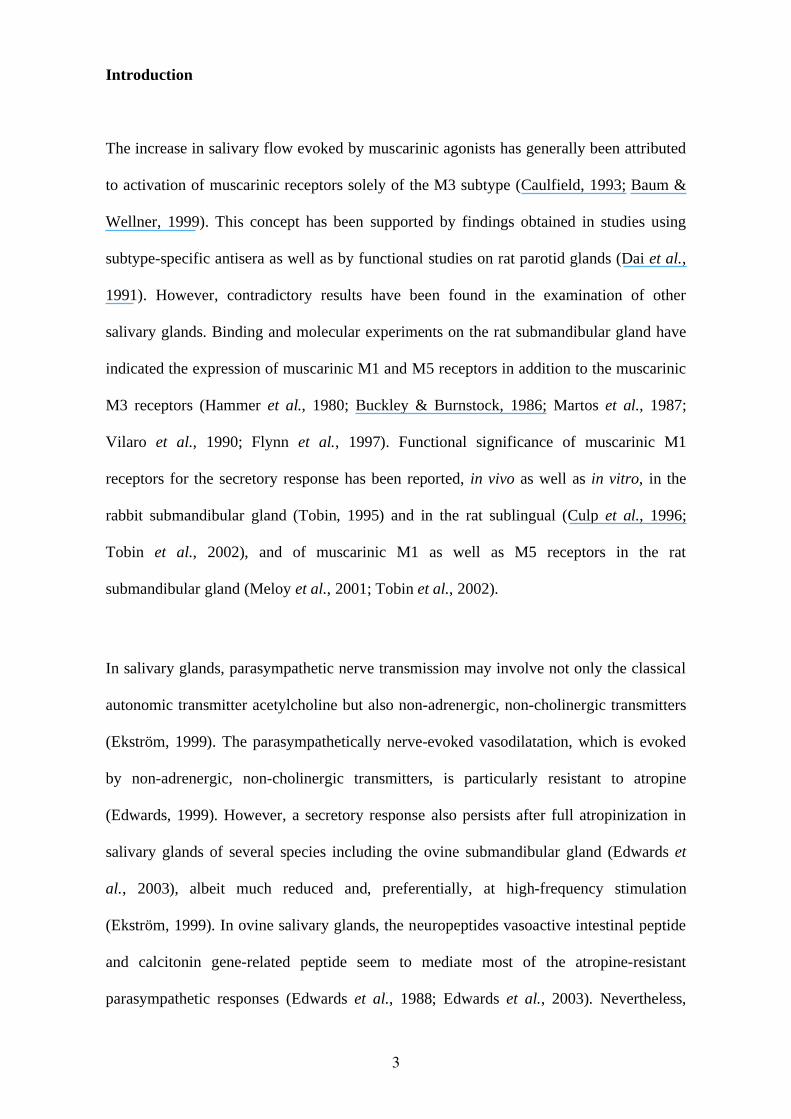
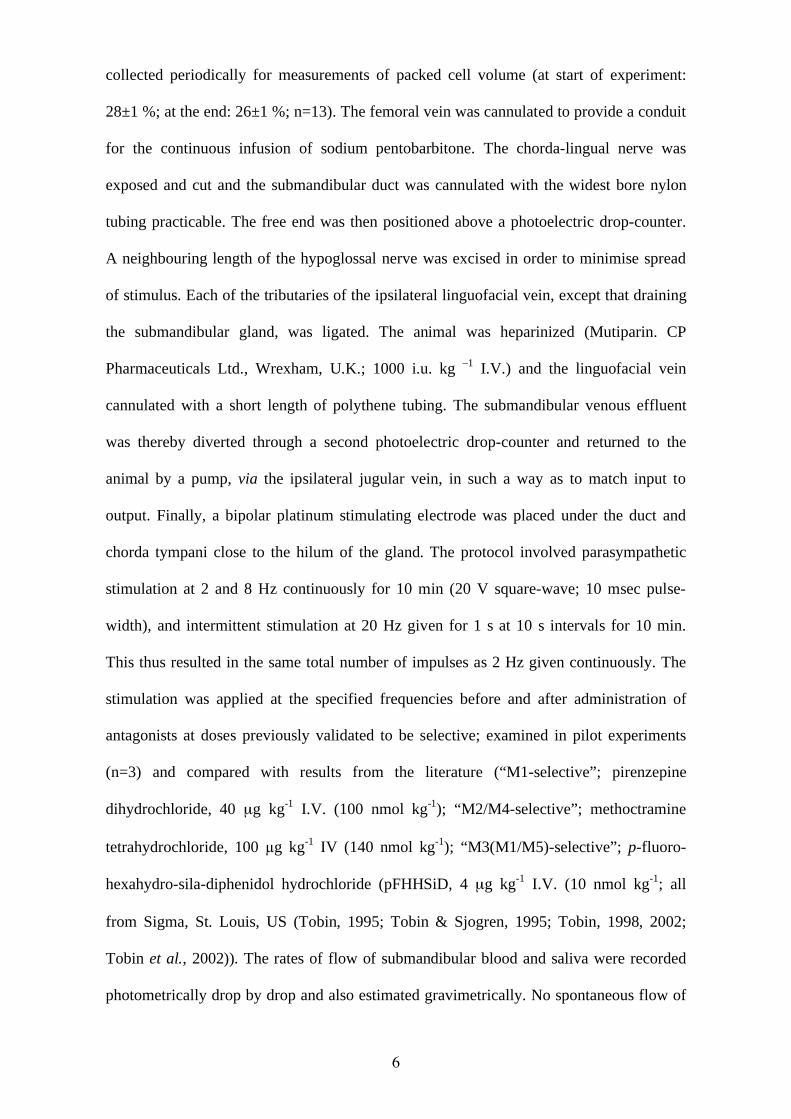
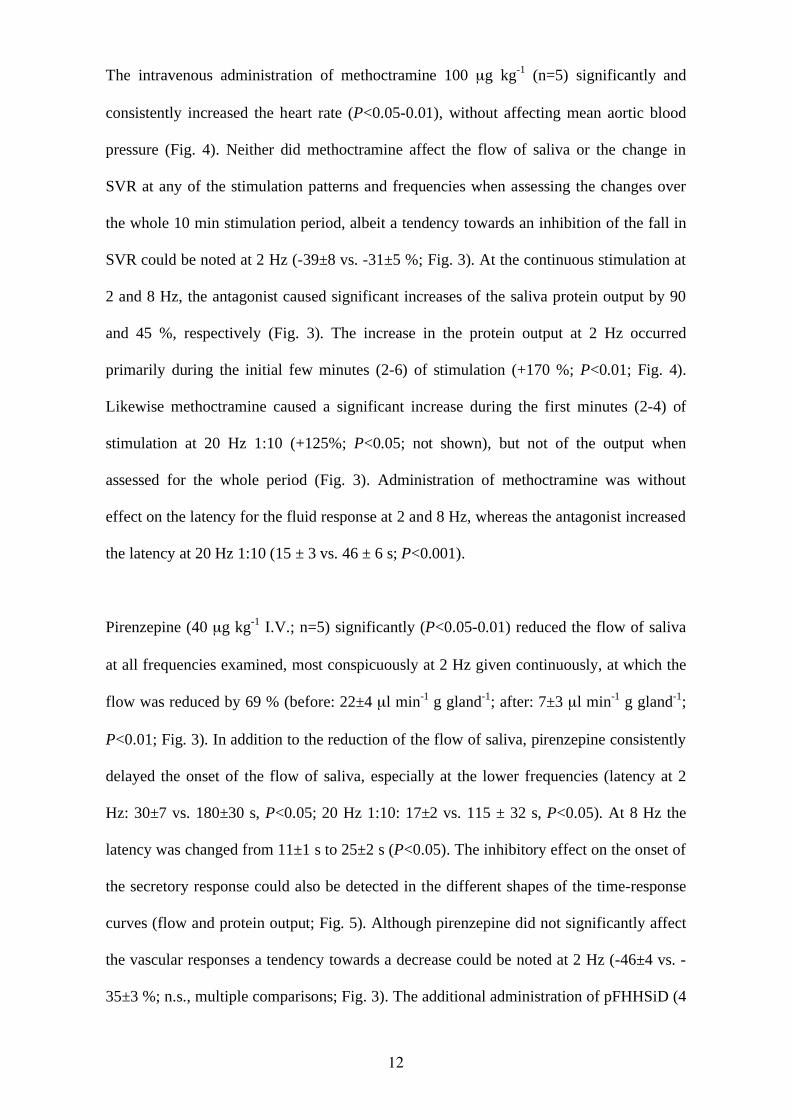
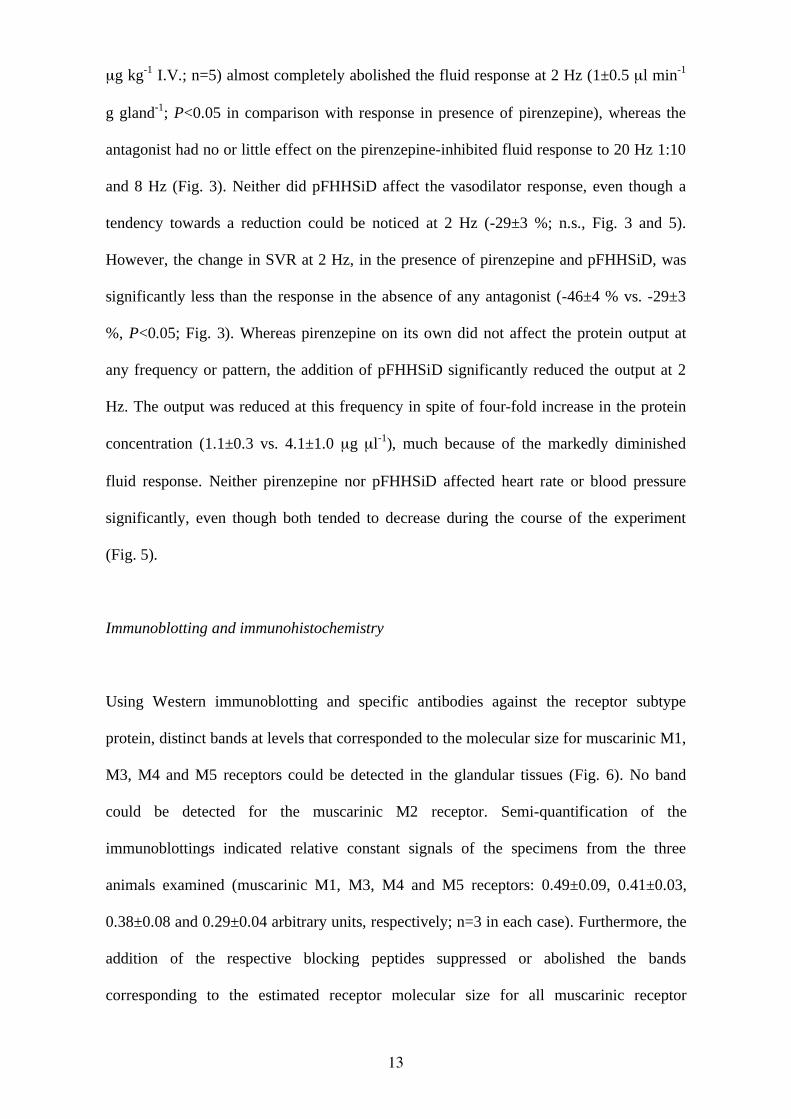
The intravenous administration of methoctramine 100 µg kg-1
(n=5) significantly and
consistently increased the heart rate (P<0.05-0.01), without affecting mean aortic blood
pressure (Fig. 4). Neither did methoctramine affect the flow of saliva or the change in
SVR at any of the stimulation patterns and frequencies when assessing the changes over
the whole 10 min stimulation period, albeit a tendency towards an inhibition of the fall in
SVR could be noted at 2 Hz (-39±8 vs. -31±5 %; Fig. 3). At the continuous stimulation at
2 and 8 Hz, the antagonist caused significant increases of the saliva protein output by 90
and 45 %, respectively (Fig. 3). The increase in the protein output at 2 Hz occurred
primarily during the initial few minutes (2-6) of stimulation (+170 %; P<0.01; Fig. 4).
Likewise methoctramine caused a significant increase during the first minutes (2-4) of
stimulation at 20 Hz 1:10 (+125%; P<0.05; not shown), but not of the output when
assessed for the whole period (Fig. 3). Administration of methoctramine was without
effect on the latency for the fluid response at 2 and 8 Hz, whereas the antagonist increased
the latency at 20 Hz 1:10 (15 ± 3 vs. 46 ± 6 s; P<0.001).
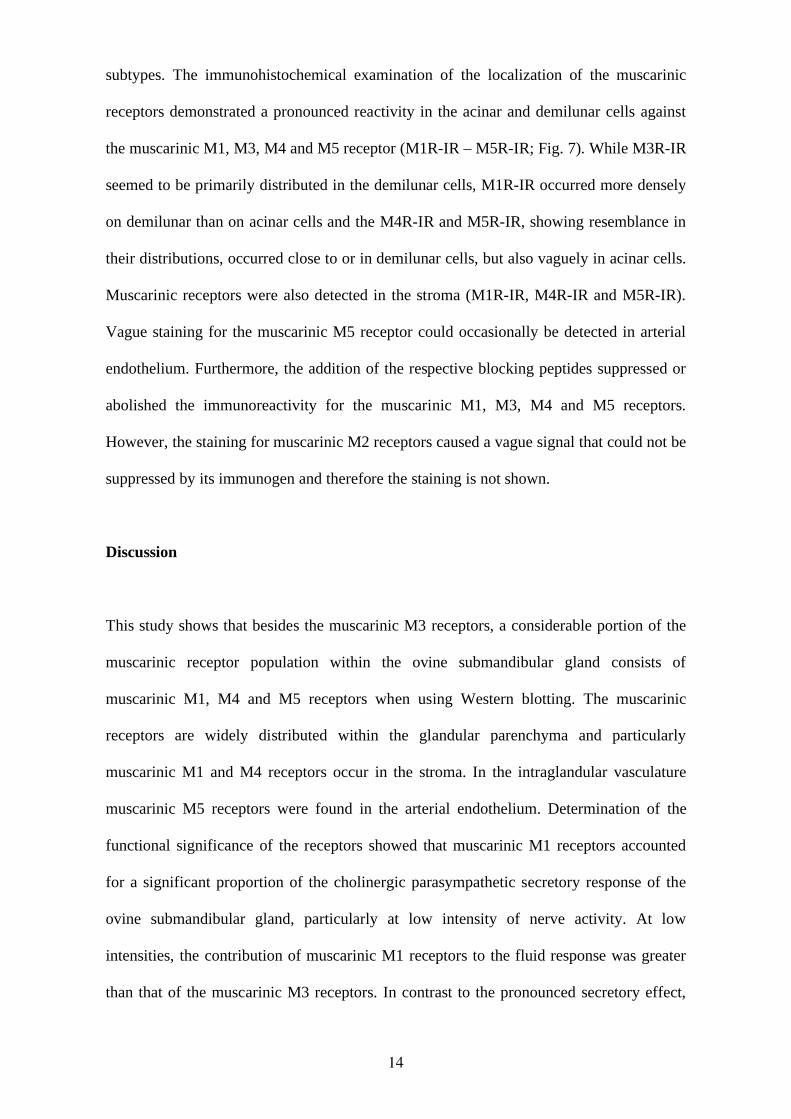
Pirenzepine (40 µg kg-1
I.V.; n=5) significantly (P<0.05-0.01) reduced the flow of saliva
at all frequencies examined, most conspicuously at 2 Hz given continuously, at which the
flow was reduced by 69 % (before: 22±4 µl min-1
g gland-1
; after: 7±3 µl min-1
g gland-1
;
P<0.01; Fig. 3). In addition to the reduction of the flow of saliva, pirenzepine consistently
delayed the onset of the flow of saliva, especially at the lower frequencies (latency at 2
Hz: 30±7 vs. 180±30 s, P<0.05; 20 Hz 1:10: 17±2 vs. 115 ± 32 s, P<0.05). At 8 Hz the
latency was changed from 11±1 s to 25±2 s (P<0.05). The inhibitory effect on the onset of
the secretory response could also be detected in the different shapes of the time-response
curves (flow and protein output; Fig. 5). Although pirenzepine did not significantly affect
the vascular responses a tendency towards a decrease could be noted at 2 Hz (-46±4 vs. -
35±3 %; n.s., multiple comparisons; Fig. 3). The additional administration of pFHHSiD (4
13
µg kg-1
I.V.; n=5) almost completely abolished the fluid response at 2 Hz (1±0.5 µl min-1
g gland-1
; P<0.05 in comparison with response in presence of pirenzepine), whereas the
antagonist had no or little effect on the pirenzepine-inhibited fluid response to 20 Hz 1:10
and 8 Hz (Fig. 3). Neither did pFHHSiD affect the vasodilator response, even though a
tendency towards a reduction could be noticed at 2 Hz (-29±3 %; n.s., Fig. 3 and 5).
However, the change in SVR at 2 Hz, in the presence of pirenzepine and pFHHSiD, was
significantly less than the response in the absence of any antagonist (-46±4 % vs. -29±3
%, P<0.05; Fig. 3). Whereas pirenzepine on its own did not affect the protein output at
any frequency or pattern, the addition of pFHHSiD significantly reduced the output at 2
Hz. The output was reduced at this frequency in spite of four-fold increase in the protein
concentration (1.1±0.3 vs. 4.1±1.0 µg µl-1
), much because of the markedly diminished
fluid response. Neither pirenzepine nor pFHHSiD affected heart rate or blood pressure
significantly, even though both tended to decrease during the course of the experiment
(Fig. 5).
Immunoblotting and immunohistochemistry
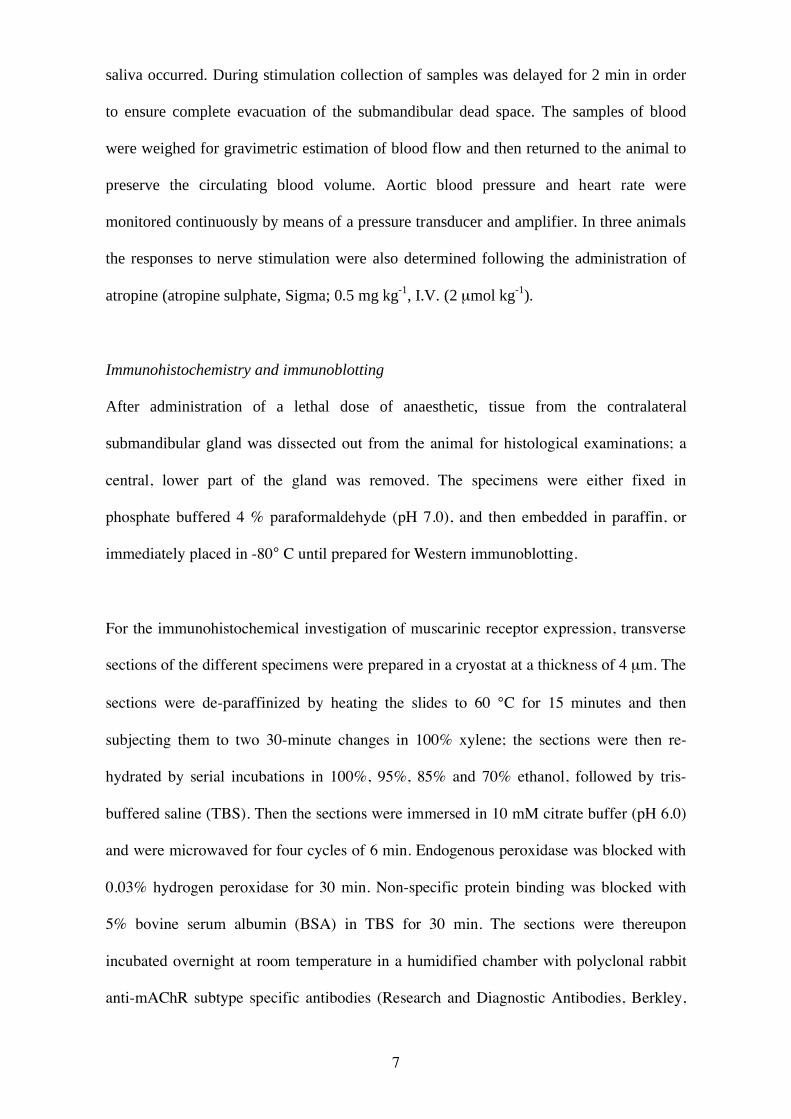
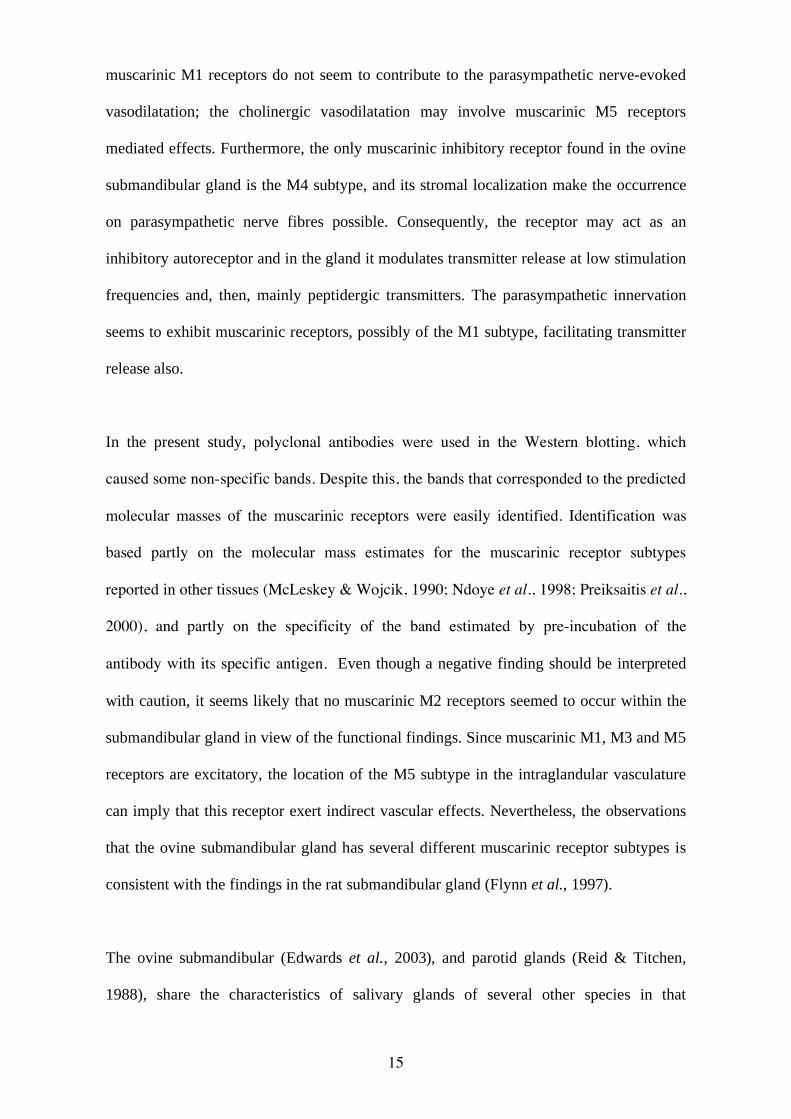
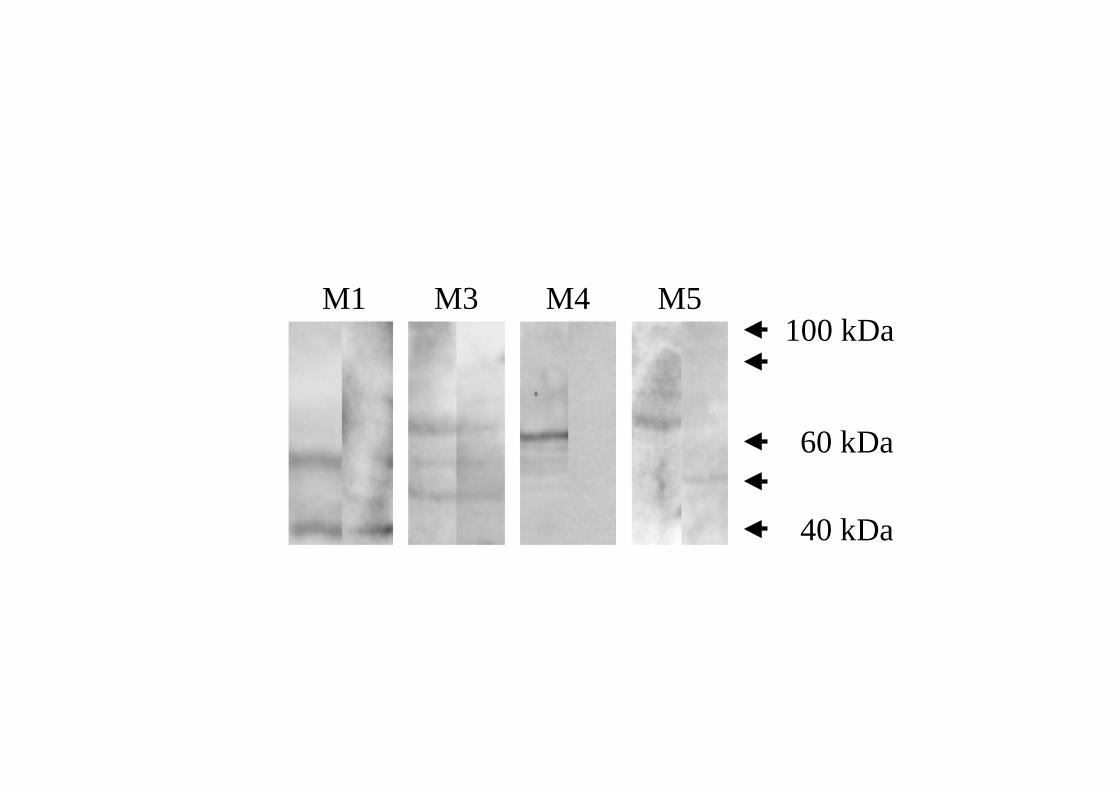
Using Western immunoblotting and specific antibodies against the receptor subtype
protein, distinct bands at levels that corresponded to the molecular size for muscarinic M1,
M3, M4 and M5 receptors could be detected in the glandular tissues (Fig. 6). No band
could be detected for the muscarinic M2 receptor. Semi-quantification of the
immunoblottings indicated relative constant signals of the specimens from the three
animals examined (muscarinic M1, M3, M4 and M5 receptors: 0.49±0.09, 0.41±0.03,
0.38±0.08 and 0.29±0.04 arbitrary units, respectively; n=3 in each case). Furthermore, the
addition of the respective blocking peptides suppressed or abolished the bands
corresponding to the estimated receptor molecular size for all muscarinic receptor
14
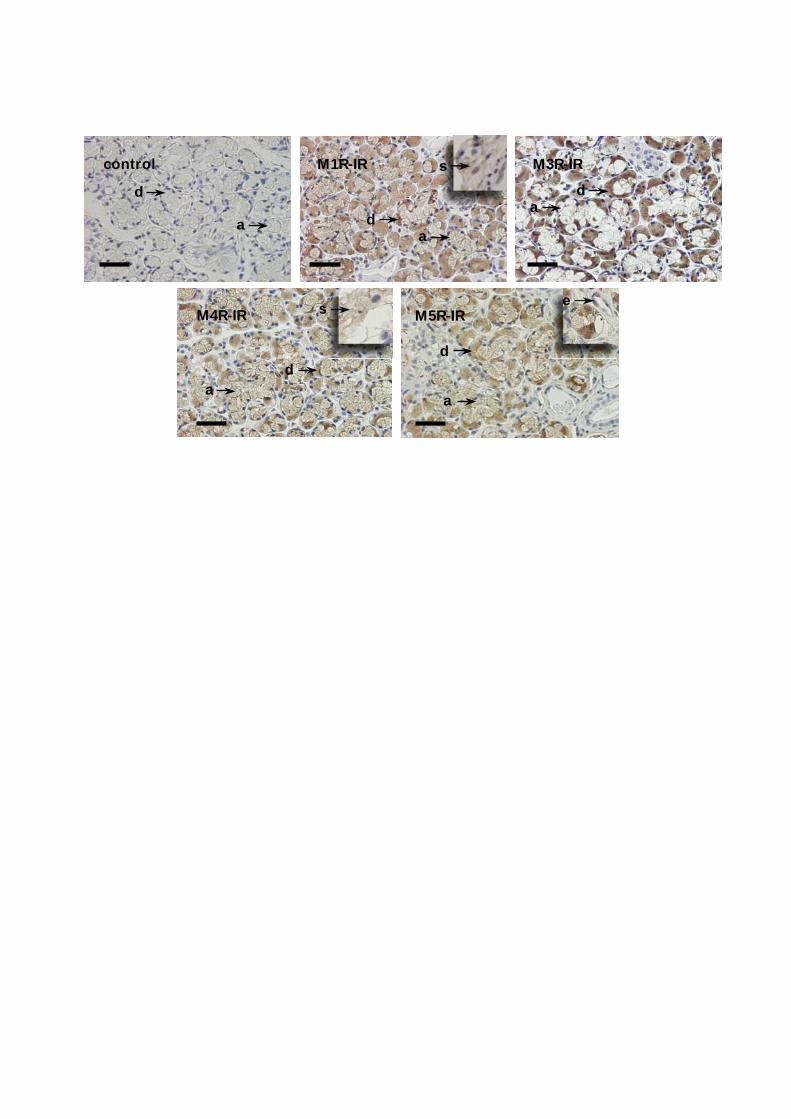
subtypes. The immunohistochemical examination of the localization of the muscarinic
receptors demonstrated a pronounced reactivity in the acinar and demilunar cells against
the muscarinic M1, M3, M4 and M5 receptor (M1R-IR – M5R-IR; Fig. 7). While M3R-IR
seemed to be primarily distributed in the demilunar cells, M1R-IR occurred more densely
on demilunar than on acinar cells and the M4R-IR and M5R-IR, showing resemblance in
their distributions, occurred close to or in demilunar cells, but also vaguely in acinar cells.
Muscarinic receptors were also detected in the stroma (M1R-IR, M4R-IR and M5R-IR).
Vague staining for the muscarinic M5 receptor could occasionally be detected in arterial
endothelium. Furthermore, the addition of the respective blocking peptides suppressed or
abolished the immunoreactivity for the muscarinic M1, M3, M4 and M5 receptors.
However, the staining for muscarinic M2 receptors caused a vague signal that could not be
suppressed by its immunogen and therefore the staining is not shown.
Discussion
This study shows that besides the muscarinic M3 receptors, a considerable portion of the
muscarinic receptor population within the ovine submandibular gland consists of
muscarinic M1, M4 and M5 receptors when using Western blotting. The muscarinic
receptors are widely distributed within the glandular parenchyma and particularly
muscarinic M1 and M4 receptors occur in the stroma. In the intraglandular vasculature
muscarinic M5 receptors were found in the arterial endothelium. Determination of the
functional significance of the receptors showed that muscarinic M1 receptors accounted
for a significant proportion of the cholinergic parasympathetic secretory response of the
ovine submandibular gland, particularly at low intensity of nerve activity. At low
intensities, the contribution of muscarinic M1 receptors to the fluid response was greater
than that of the muscarinic M3 receptors. In contrast to the pronounced secretory effect,
15
muscarinic M1 receptors do not seem to contribute to the parasympathetic nerve-evoked
vasodilatation; the cholinergic vasodilatation may involve muscarinic M5 receptors
mediated effects. Furthermore, the only muscarinic inhibitory receptor found in the ovine
submandibular gland is the M4 subtype, and its stromal localization make the occurrence
on parasympathetic nerve fibres possible. Consequently, the receptor may act as an
inhibitory autoreceptor and in the gland it modulates transmitter release at low stimulation
frequencies and, then, mainly peptidergic transmitters. The parasympathetic innervation
seems to exhibit muscarinic receptors, possibly of the M1 subtype, facilitating transmitter
release also.
In the present study, polyclonal antibodies were used in the Western blotting, which
caused some non-specific bands. Despite this, the bands that corresponded to the predicted
molecular masses of the muscarinic receptors were easily identified. Identification was
based partly on the molecular mass estimates for the muscarinic receptor subtypes
reported in other tissues (McLeskey & Wojcik, 1990; Ndoye et al., 1998; Preiksaitis et al.,
2000), and partly on the specificity of the band estimated by pre-incubation of the
antibody with its specific antigen. Even though a negative finding should be interpreted
with caution, it seems likely that no muscarinic M2 receptors seemed to occur within the
submandibular gland in view of the functional findings. Since muscarinic M1, M3 and M5
receptors are excitatory, the location of the M5 subtype in the intraglandular vasculature
can imply that this receptor exert indirect vascular effects. Nevertheless, the observations
that the ovine submandibular gland has several different muscarinic receptor subtypes is
consistent with the findings in the rat submandibular gland (Flynn et al., 1997).
The ovine submandibular (Edwards et al., 2003), and parotid glands (Reid & Titchen,
1988), share the characteristics of salivary glands of several other species in that
16
stimulation of the parasympathetic innervation at relatively high frequencies produces an
atropine-resistant fluid secretion mediated by peptidergic transmitters. In the current
experiments, an atropine-resistant fluid response appeared at 8 Hz, whereas stimulation at
2 Hz and 20 Hz in bursts was below the threshold frequency (totally atropine-sensitive).
Concerning the vasodilatation, on the other hand, it was almost totally resistant to atropine
at high frequencies and a significant reduction in the presence of muscarinic antagonists
occurred only at 2 Hz. Furthermore, the comparison of the responses to 2 and 20 Hz in
bursts, showed no significant difference in salivary flow, whereas the vasodilatation as
well as protein output were greater at 20 Hz in bursts. Since peptides, such as VIP and
CGRP, have been shown to be particularly potent in evoking vasodilatation and protein
output (Lundberg et al., 1982; Reid & Heywood, 1988; Ekström & Tobin, 1990; Buckle et
al., 1995), the present findings at 20 Hz in bursts fit well with the idea that the release of
peptides is increased at the high-frequency intermittent stimulation. A recent study on the
ovine submandibular gland showed that stimulation at 20 Hz efficiently released VIP from
the parasympathetic innervation and that intermittent stimulation was a more efficient
mode of stimulation than a continuous (Edwards et al., 2003). Even though an overt
atropine-resistant response is absent, peptidergic transmitters may anyway act in concert
with the classical transmitters, e.g. acetylcholine, and enlarge the amount or alter the
quality of the saliva (Lundberg et al., 1982; Ekström & Tobin, 1990).
The interpretation of the results from experiment, in which muscarinic antagonists with
different selectivity profiles was employed, is usually hampered by the narrow selectivity
window of the antagonists. However, it must be emphasized that pirenzepine and
methoctramine were used at doses previously validated in vivo for their selectivity for
muscarinic M1 and M2/M4 receptors, respectively (Tobin, 1995, 1998, 2002; Tobin et al.,
2002). Notably, methoctramine discriminates very poorly between muscarinic M2 and M4
17
receptors (2 times greater affinity for M2 over M4) in contrast to the more substantial
affinity difference for the inhibitory (muscarinic M2 and M4 receptors) over the excitatory
receptors (muscarinic M1, M3 and M5 receptors; (Caulfield & Birdsall, 1998; Eglen &
Nahorski, 2000)). In order to avoid an “unselective” effect by the “muscarinic M3 receptor
antagonist” pFHHSiD, an exceptionally low dose was used (4 µg kg-1
(10 nmol kg-1
) I.V.).
This dose is more than 10 times lower than the expected threshold dose for inhibiting
effects via the muscarinic M1 and M5 receptor (Tobin & Sjogren, 1995; Eglen &
Nahorski, 2000). Nevertheless, the current addition of the pFHHSiD to the pirenzepine
blockade served mainly to verify the selectivity of the pirenzepine antagonism. Overall,
the selectivity of the antagonist doses used in the current study is supported by the
following observations in the current experiments. First, methoctramine, and only
methoctramine, significantly raised the heart rate. Secondly, in general methoctramine had
opposite effects to the other two antagonists. Thirdly, pirenzepine had a substantially
greater inhibitory effect on secretion than on vasodilatation, and lastly, the extremely low
dose of pFHHSiD caused, in the presence of a larger pirenzepine dose, a significant
reduction in the parasympathetic nerve-evoked secretion; in pilot studies, when pFHHSiD
was given before pirenzepine, a small reduction occurred followed by a large pirenzepine
inhibitory effect. However, there appears to be one exception, even though not statistical
significant: pirenzepine showed strong tendencies towards increasing the protein output at
8 Hz. In this context, it is worth noting that the “muscarinic M1 receptor antagonist”
pirenzepine shows greater inhibitory potency on muscarinic M4 receptor-mediated effects
than on effects mediated by any of the other of the muscarinic M2-M5 receptor subtypes
(Eglen & Nahorski, 2000).
In the current study, the ovine submandibular gland was shown to belong to the glands in
which muscarinic M1 receptors evoke a flow of saliva. In previous studies, muscarinic M1
18
receptor-activated salivary flow has been demonstrated in the rabbit submandibular gland
(Tobin, 1995) and in the rat sublingual gland (Culp et al., 1996; Tobin et al., 2002). In
these glands, as well as the murine parotid gland (Watson et al., 1996), a co-expression of
muscarinic M1 and M3 receptors occurs, and in the sublingual gland of the rat a
simultaneous activation of both subtypes seems to be a prerequisite for evoking a maximal
fluid response (Luo et al., 2001). Because of the number of different ways positive
interactions could be exerted regarding the fluid response, it is hard to make any absolute
estimation of the relative contribution to the fluid response of muscarinic M1 and M3
receptors in the current study. Nevertheless, at low frequencies muscarinic M1 receptors
account for a large part, if not nearby the whole secretory response. Furthermore, in no
case was a maximal secretory response elicited under muscarinic M1 receptor blockade.
The contribution of other muscarinic receptor subtypes than M3 is supported by findings
in knockout mice also. Here, in muscarinic M1 receptor knockouts a decreased flow of
saliva occurs and in M1/M3 double knockouts a trace secretion seem to persists in
response to pilocarpine (Gautam et al., 2004). Regarding vasodilation, both pirenzepine
and pFHHSiD showed less inhibitory potency on the atropine-sensitive part than on
salivation; only when the two drugs were combined was statistical significance attained.
The obvious explanation is that muscarinic M1 receptors do not contribute to the
vasodilatation, but further, the lesser inhibitory potency of pFHHSiD could imply that a
receptor subtype other than the muscarinic M3 receptor is involved.
In the rat parotid and submandibular glands, pre-treatment with methoctramine may
double the parasympathetic nerve-evoked fluid secretion (Tobin, 1998, 2002). This effect
is attributable to a blockade of inhibitory muscarinic receptors on glandular nerve fibres,
and affects the neuronal release of acetylcholine as well as that of VIP (Tobin et al., 1991;
Tobin et al., 1994; Tobin, 1998). Also in sheep, the VIP submandibular output has been
19
shown to increase substantially by pre-treatment with atropine (Edwards et al., 2003).
However, it has not been established previously which particular type of muscarinic
receptor is responsible for presynaptic inhibition of VIP release in the sheep. The
morphological findings in the current study indicated the existence of only one subtype of
inhibitory muscarinic receptor in the submandibular gland, namely the M4 subtype located
within the stroma. In contrast to the findings in rats (Tobin, 1998, 2002) and rabbits
(Tobin, 1995), no enhancement of fluid secretion occurred in the presence of muscarinic
receptor blockade in the sheep. However, responses that could be attributed to the release
of VIP, i.e. protein output and vasodilatation were enhanced by methoctramine. In view of
the morphological findings, and the fact that methoctramine shows almost identical
affinity for muscarinic M2 and M4 receptors, it seems most plausible to ascribe the
increased responses to a blockade of muscarinic M4 receptors that enhanced release of
VIP. In salivary glands of rats and rabbits, facilitation of the nerve transmission occurs by
acetylcholine acting on muscarinic M1 receptors located prejunctionally (Tobin, 1995,
1998, 2002). A similar facilitator mechanism may occur in the ovine submandibular gland,
since pirenzepine invariably increased the latencies of both fluid and protein output (see
figure 5).
Thus, the ovine submandibular gland shows the same muscarinic receptor characteristics
as salivary glands in rabbits (Tobin, 1995) and rats (Culp et al., 1996; Luo et al., 2001;
Tobin et al., 2002) in that acetylcholine acting on muscarinic M1 receptors contribute
substantially to the secretory response. Other common features seem to be the occurrence
of prejunctional muscarinic receptors that inhibit or facilitate the release of transmitter
(Tobin, 1995, 1998, 2002). The cholinergic blood flow regulation in the ovine
submandibular gland may involve endothelial muscarinic M5 receptors, possibly via
20
nitric-oxide. Nonetheless, the present in vivo study provides compelling evidence for
muscarinic M1 receptors mediating a large part of the parasympathetic fluid response.
Ackowledgement
This study was supported by the Swedish Dental Society, Wilhelm and Martina Lundgrens
Foundation and Magn. Bergvall´s Foundation. We are indebted to professor Abigail
Fowden for valuable comments on the manuscript and to Histo-Center, Va Frolunda,
Sweden, for expert technical assistance (sectioning for immunohistochemistry).
References
Andersson PO, Bloom SR & Edwards AV. (1982a). Parotid responses to stimulation of
the parasympathetic innervation in bursts in weaned lambs. J Physiol 330, 163-
174.
Andersson PO, Bloom SR, Edwards AV & Jarhult J. (1982b). Effects of stimulation of the
chorda tympani in bursts on submaxillary responses in the cat. J Physiol 322, 469-
483.
Baum BJ & Wellner RB. (1999). Receptors in salivary glands. In Frontiers of oral
biology, ed. Linden RWA, pp. 44-58. Karger, Basel.
Bloom SR & Edwards AV. (1979). The relationship between release of vasoactive
intestinal peptide in the salivary gland of the cat in response to parasympathetic
stimulation and the atropine resistant vasodilatation. J Physiol 295, 35-36.
21
Buckle AD, Parker SJ, Bloom SR & Edwards AV. (1995). The role of nitric oxide in the
control of protein secretion in the submandibular gland of the cat. Exp Physiol 80,
1019-1030.
Buckley NJ & Burnstock G. (1986). Autoradiographic localization of peripheral M1
muscarinic receptors using [3H]pirenzepine. Brain Res 375, 83-91.
Caulfield MP. (1993). Muscarinic receptors--characterization, coupling and function.
Pharmacol Ther 58, 319-379.
Caulfield MP & Birdsall NJ. (1998). International Union of Pharmacology. XVII.
Classification of muscarinic acetylcholine receptors. Pharmacol Rev 50, 279-290.
Cook DI, Van Lennep EW, Roberts ML & Young JA. (1994). Secretion by the major
salivary glands. In Physiology of the Gastrointestinal tract, ed. Johnson LR, pp.
1061-1117. Raven, New York.
Culp DJ, Luo W, Richardson LA, Watson GE & Latchney LR. (1996). Both M1 and M3
receptors regulate exocrine secretion by mucous acini. Am J Physiol 271, C1963-
1972.
Dai YS, Ambudkar IS, Horn VJ, Yeh CK, Kousvelari EE, Wall SJ, Li M, Yasuda RP,
Wolfe BB & Baum BJ. (1991). Evidence that M3 muscarinic receptors in rat
parotid gland couple to two second messenger systems. Am J Physiol 261, C1063-
1073.
22
Edwards AV. (1999). Autonomic control of salivary blood flow. In Frontiers of oral
biology, ed. Linden RWA, pp. 101-117. Karger, Basel.
Edwards AV, Reid AM & Titchen DA. (1988). Actions of exogenous calcitonin gene
related peptide on the ovine submaxillary gland. In The Australian Physiological
and Pharmacological Society, pp. 203P.
Edwards CM, Corkery PP & Edwards AV. (2003). Submandibular responses to
stimulation of the parasympathetic innervation in anesthetized sheep. J Appl
Physiol 95, 1598-1605.
Eglen RM & Nahorski SR. (2000). The muscarinic M(5) receptor: a silent or emerging
subtype? Br J Pharmacol 130, 13-21.
Ekström J. (1999). Role of nonadrenergic, noncholinergic autonomic transmitters in
salivary glandular activities. In Frontiers of oral biology, ed. Linden RWA, pp. 94-
130. Karger, Basel.
Ekström J & Tobin G. (1990). Protein secretion in salivary glands of cats in vivo and in
vitro in response to vasoactive intestinal peptide. Acta Physiol Scand 140, 95-103.
Flynn DD, Reever CM & Ferrari-DiLeo G. (1997). Pharmacological strategies to
selectively label and localize muscarinic receptor subtypes. Drug Dev Res 40, 104-
116.
23
Gautam D, Heard TS, Cui Y, Miller G, Bloodworth L & Wess J. (2004). Cholinergic
stimulation of salivary secretion studied with M1 and M3 muscarinic receptor
single- and double-knockout mice. Mol Pharmacol 66, 260-267.
Hammer R, Berrie CP, Birdsall NJ, Burgen AS & Hulme EC. (1980). Pirenzepine
distinguishes between different subclasses of muscarinic receptors. Nature 283,
90-92.
Lundberg JM, Anggard A & Fahrenkrug J. (1982). Complementary role of vasoactive
intestinal polypeptide (VIP) and acetylcholine for cat submandibular gland blood
flow and secretion. Acta Physiol Scand 114, 329-337.
Luo W, Latchney LR & Culp DJ. (2001). G protein coupling to M1 and M3 muscarinic
receptors in sublingual glands. Am J Physiol Cell Physiol 280, C884-896.
Martos F, Monferini E, Giraldo E, De Paoli AM & Hammer R. (1987). Characterization of
muscarinic receptors in salivary and lacrimal glands of the rat. Eur J Pharmacol
143, 189-194.
McLeskey SW & Wojcik WJ. (1990). Identification of muscarinic receptor subtypes
present in cerebellar granule cells: prevention of [3H]propylbenzilyl choline
mustard binding with specific antagonists. Neuropharmacology 29, 861-868.
Meloy TD, Daniels DV, Hegde SS, Eglen RM & Ford AP. (2001). Functional
characterization of rat submaxillary gland muscarinic receptors using
microphysiometry. Br J Pharmacol 132, 1606-1614.
24
Ndoye A, Buchli R, Greenberg B, Nguyen VT, Zia S, Rodriguez JG, Webber RJ, Lawry
MA & Grando SA. (1998). Identification and mapping of keratinocyte muscarinic
acetylcholine receptor subtypes in human epidermis. J Invest Dermatol 111, 410-
416.
Preiksaitis HG, Krysiak PS, Chrones T, Rajgopal V & Laurier LG. (2000).
Pharmacological and molecular characterization of muscarinic receptor subtypes in
human esophageal smooth muscle. J Pharmacol Exp Ther 295, 879-888.
Reid AM & Heywood LH. (1988). A comparison of the effects of vasoactive intestinal
polypeptide on secretion from the submaxillary gland of the sheep and pig. Regul
Pept 20, 211-221.
Reid AM & Titchen DA. (1988). Atropine-resistant secretory responses of the ovine
parotid gland to reflex and direct parasympathetic stimulation. Q J Exp Physiol 73,
413-424.
Tobin G. (1995). Muscarinic receptor subtypes in the submandibular gland and the urinary
bladder of the rabbit: in vivo and in vitro functional comparisons of receptor
antagonists. J Auton Pharmacol 15, 451-463.
Tobin G. (1998). Presynaptic muscarinic M1 and M2 receptor modulation of
auriculotemporal nerve transmission in the rat. J Auton Nerv Syst 72, 61-71.
25
Tobin G. (2002). Presynaptic muscarinic receptor mechanisms and submandibular
responses to stimulation of the parasympathetic innervation in bursts in rats. Auton
Neurosci 99, 111-118.
Tobin G & Edwards AV. (2004). The role of muscarinic receptors in the control of ovine
submandibular function. J Physiol 555, C19.
Tobin G, Ekstrom J, Bloom SR & Edwards AV. (1991). Atropine-resistant submandibular
responses to stimulation of the parasympathetic innervation in the anaesthetized
ferret. J Physiol 437, 327-339.
Tobin G, Ekstrom J & Edwards AV. (1990). Submandibular responses to stimulation of
the parasympathetic innervation in bursts in the anaesthetized ferret. J Physiol
(Lond) 431, 417-425.
Tobin G, Ekstrom J, Ekman R & Hakanson R. (1994). Influence of atropine on the
depletion of vasoactive intestinal peptide, substance P and calcitonin gene-related
peptide from rat parotid gland in response to parasympathetic nerve stimulation.
Acta Physiol Scand 150, 463-465.
Tobin G, Giglio D & Gotrick B. (2002). Studies of muscarinic receptor subtypes in
salivary gland function in anaesthetized rats. Auton Neurosci 100, 1-9.
Tobin G & Sjogren C. (1995). In vivo and in vitro effects of muscarinic receptor
antagonists on contractions and release of [3H]acetylcholine in the rabbit urinary
bladder. Eur J Pharmacol 281, 1-8.
26
Vilaro MT, Palacios JM & Mengod G. (1990). Localization of m5 muscarinic receptor
mRNA in rat brain examined by in situ hybridization histochemistry. Neurosci Lett
114, 154-159.
Watson EL, Abel PW, DiJulio D, Zeng W, Makoid M, Jacobson KL, Potter LT & Dowd
FJ. (1996). Identification of muscarinic receptor subtypes in mouse parotid gland.
Am J Physiol 271, C905-913.
Figure legends
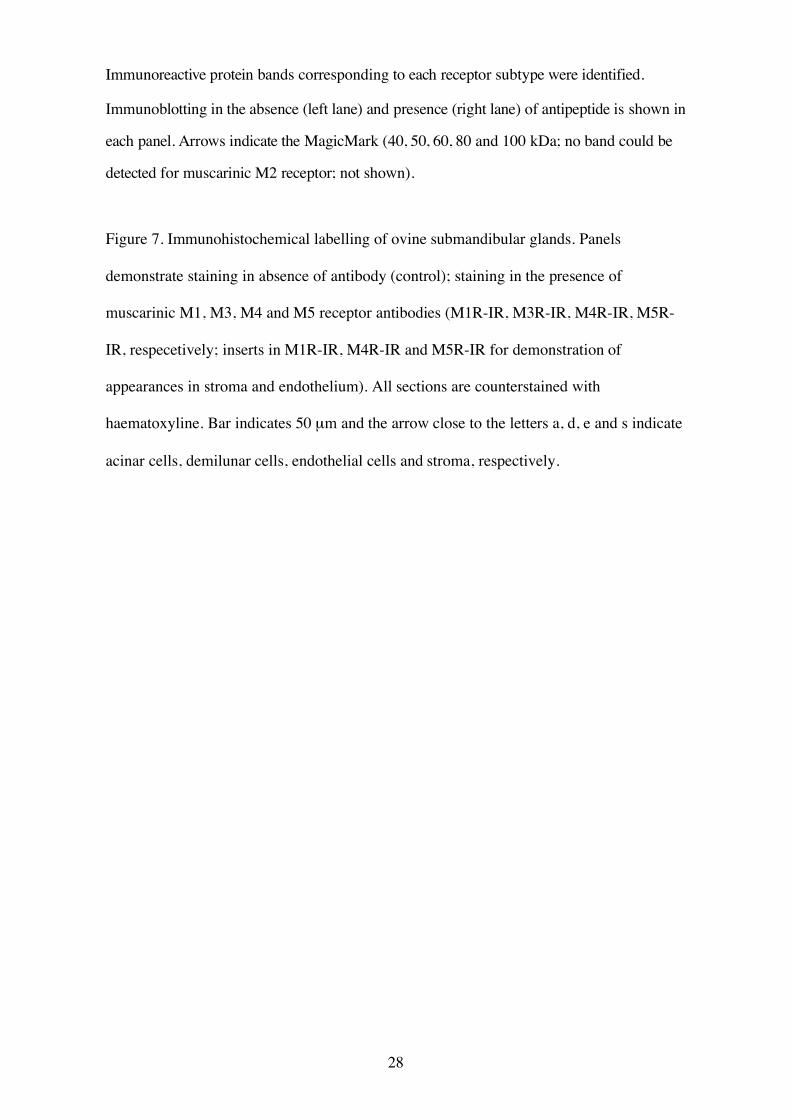
Figure 1. Comparison of the changes in submandibular flow of saliva (upper panel),
submandibular protein output (second panel from top), mean aortic blood pressure (middle
panel), mean heart rate (second panel from bottom) and submandibular vascular resistance
(bottom panel) in response to chorda tympani stimulation at 2 Hz continously ( ),
20 Hz in bursts (1:10 s; ) and 8 Hz continuously ( ) for 10 min in 13 anaesthetized
sheep. Vertical bars: S.E. M. value. Horizontal bar: duration of stimulation (CT stim).
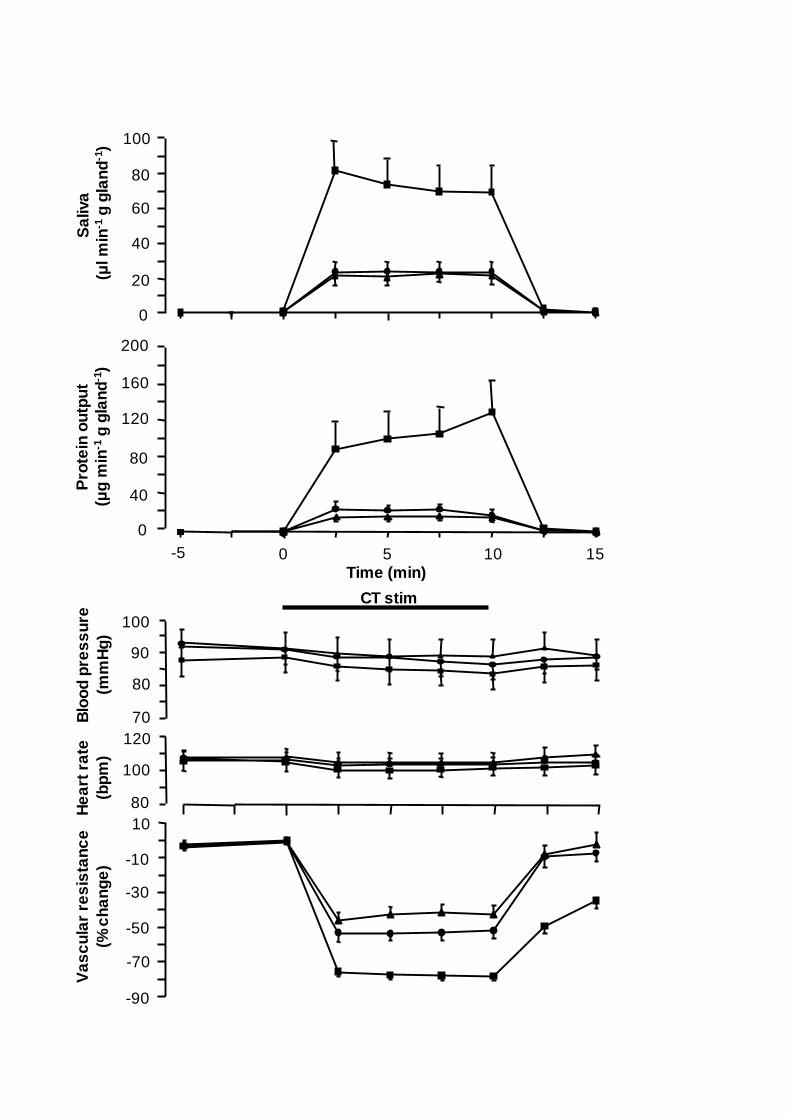
Figure 2. Registrations in a single anaesthetized sheep before and after intravenous injection
of atropine (0.5 mg kg-1). Panels show changes in mean aortic blood pressure (upper panel),
in heart rate (next panel below), in submandibular blood flow (second panel from bottom)
and in submandibular flow of saliva (bottom panel). Middle registration shows the event
marker (stimulation at 8 Hz continuously for 10 minutes).
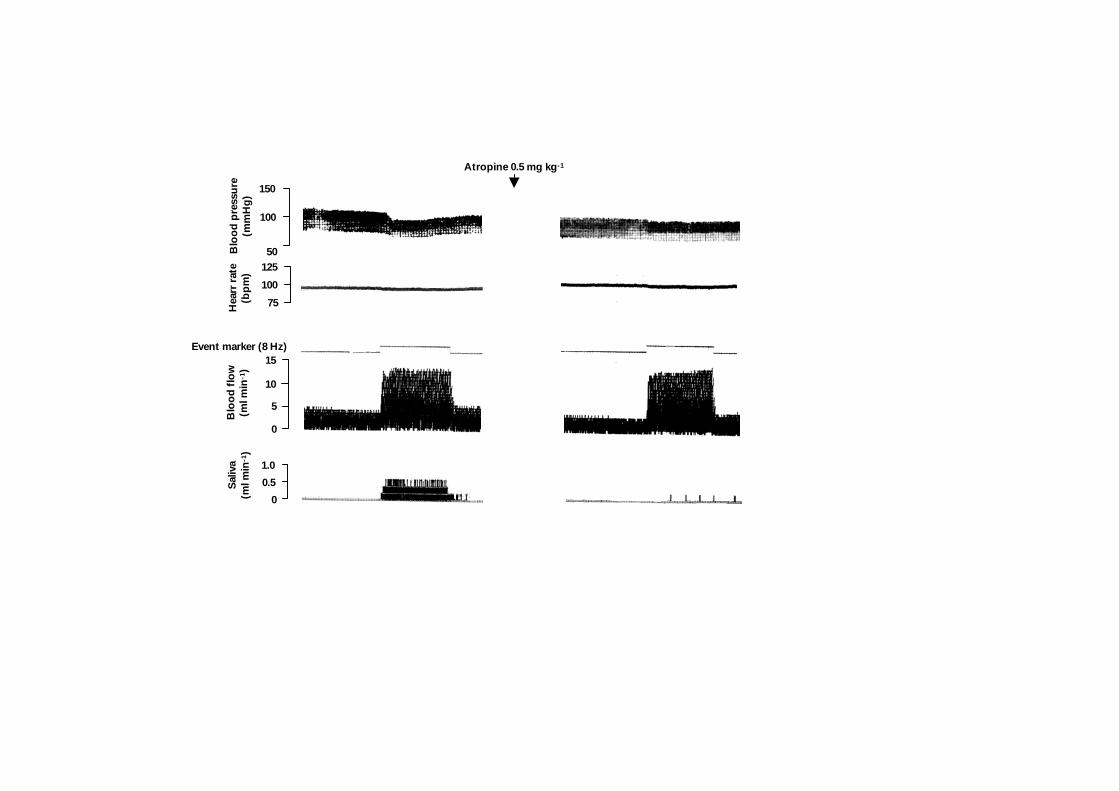
Figure 3. Comparison of the submandibular changes in mean salivary secretion (left
panels), in mean protein output (middle panels) and in mean vascular resistance (right
panels) over the 10 min stimulation period. The column doublets (upper panels) and
27
triplets (lower panels) in each panel show from left to right the mean responses to chorda
tympani stimulation at 2 Hz continuously, 20 Hz in bursts and 8 Hz continuously. The
upper panels show the mean responses in the absence ( ) and presence ( ) of
methoctramine (100 µg kg-1 I.V.) in five anaesthetized sheep and the lower panels show
the mean responses in the absence ( ) and presence of pirenzepine (40 µg kg-1 I.V.)
before ( ) and after administration pFHHSiD (4 g kg-1
I.V.) in five other anaesthetized
sheep.Vertical bars: S.E. M. *P<0.05, ** P<0.01.
Figure 4. Comparison of the changes in submandibular flow of saliva (upper panel),
submandibular protein output (second panel from top), mean aortic blood pressure (middle
panel), mean heart rate (second panel from bottom) and submandibular vascular resistance
(bottom panel) in response to chorda tympani stimulation at 2 Hz continously for 10 min in
the absence ( ) and in the presence of methoctramine (100 µg kg-1 I.V.; ) in five
anaesthetized sheep. Vertical bars: S.E. M. value. Horizontal bar: duration of stimulation (CT
stim).
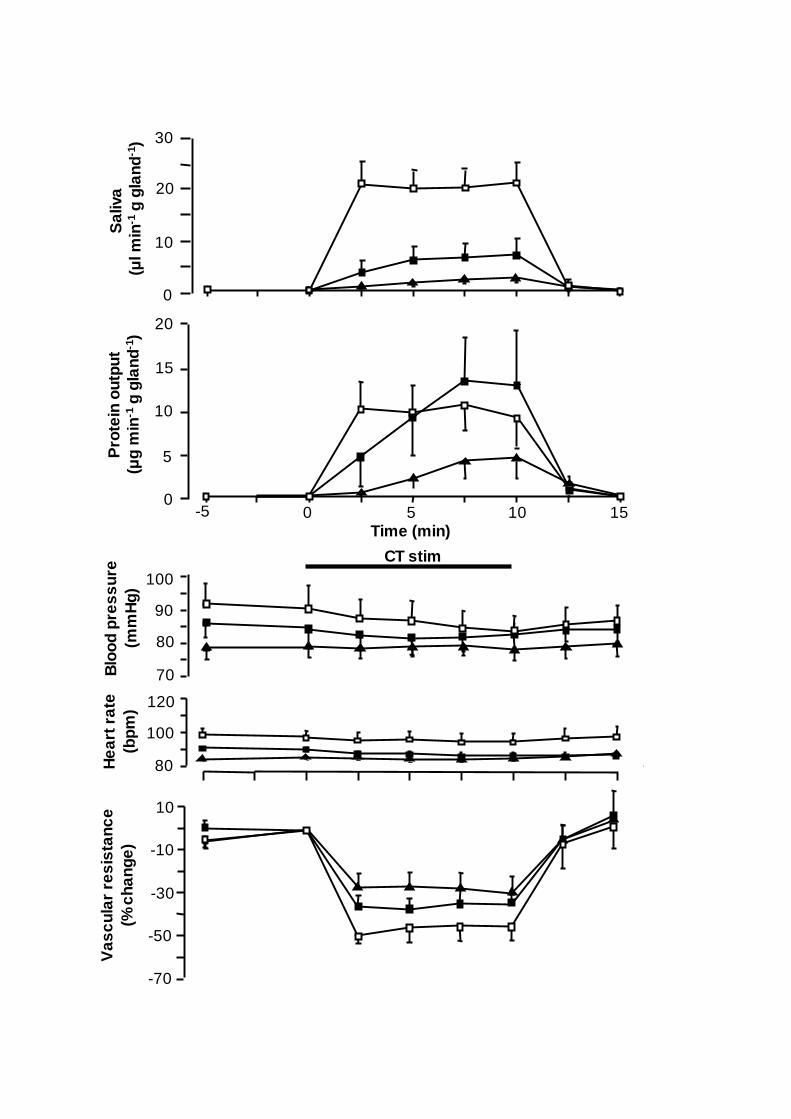
Figure 5. Comparison of the changes in submandibular flow of saliva (upper panel),
submandibular protein output (second panel from top), mean aortic blood pressure (middle
panel), mean heart rate (second panel from bottom) and submandibular vascular resistance
(bottom panel) in response to chorda tympani stimulation at 2 Hz continously for 10 min in
the absence of antagonists ( ) and in the presence of pirenzepine (40 µg kg-1 I.V.; )
before and after administration of pFHHSiD (4 g kg-1
I.V.; ) in five anaesthetized sheep.
Vertical bars: S.E. M. value. Horizontal bar: duration of stimulation (CT stim).
Figure 6. Immunoblotting for muscarinic M1 and M3-M5 receptor subtypes in the ovine
submandibular gland. Bands corresponding to the predicted molecular mass of the
respective receptor subtype are indicated by arrows to the right of each image (M1 = 53
kDa, M3 = 67 kDa, M4 = 57 kDa, and M5 = 67 kDa; see Preiksaitis et al., 2000).
28
Immunoreactive protein bands corresponding to each receptor subtype were identified.
Immunoblotting in the absence (left lane) and presence (right lane) of antipeptide is shown in
each panel. Arrows indicate the MagicMark (40, 50, 60, 80 and 100 kDa; no band could be
detected for muscarinic M2 receptor; not shown).
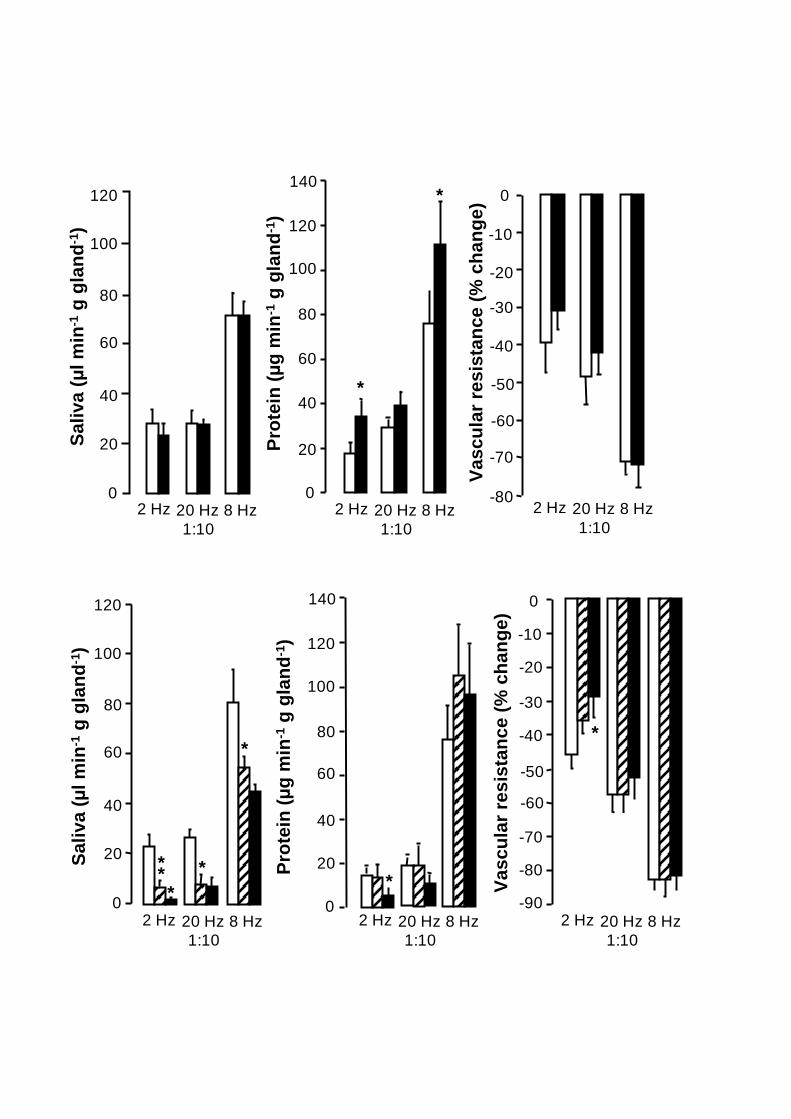
Figure 7. Immunohistochemical labelling of ovine submandibular glands. Panels
demonstrate staining in absence of antibody (control); staining in the presence of
muscarinic M1, M3, M4 and M5 receptor antibodies (M1R-IR, M3R-IR, M4R-IR, M5R-
IR, respecetively; inserts in M1R-IR, M4R-IR and M5R-IR for demonstration of
appearances in stroma and endothelium). All sections are counterstained with
haematoxyline. Bar indicates 50 µm and the arrow close to the letters a, d, e and s indicate
acinar cells, demilunar cells, endothelial cells and stroma, respectively.
0
20
40
60
80
100
Sa
liva
(l m
in-1
g g
lan
d-1
)
Pro
tein
ou
tpu
t
(g
min
-1 g
gla
nd
-1)
0
40
80
120
160
200
Va
sc
ula
r re
sis
tan
ce
(% c
ha
ng
e)
-30
-90
10
-70
-50
-10
70
80
90
100
Blo
od
pre
ss
ure
(mm
Hg
)
80
100
120
He
art
ra
te
(bp
m)
Time (min)0 5 10 15-5
CT stim
1.0
0
10
0
15
5
0.5
125
50
150
100
Blo
od
pre
ssu
re
(mm
Hg
)
100
75
Hearr
rate
(bp
m)
Blo
od
flo
w
(ml m
in-1
)S
aliva
(ml m
in-1
)
Event marker (8 Hz)
Atropine 0.5 mg kg-1
*
*
***
*
Sa
liv
a (
l m
in-1
g g
lan
d-1
)S
ali
va
(l
min
-1 g
gla
nd
-1)
Pro
tein
(g
min
-1 g
gla
nd
-1)
Pro
tein
(g
min
-1 g
gla
nd
-1)
Va
sc
ula
r re
sis
tan
ce
(%
ch
an
ge
)
Va
sc
ula
r re
sis
tan
ce
(%
ch
an
ge
)
0
20
40
60
80
100
120
0
20
40
60
80
100
120
*
0
20
40
60
80
100
120
140
0
20
40
60
80
100
120
140
*-90
-80
-70
-60
-50
-40
-30
-20
0
-10
-80
-70
-60
-50
-40
-30
-20
0
-10
2 Hz 20 Hz
1:10
8 Hz 2 Hz 20 Hz
1:10
8 Hz 2 Hz 20 Hz
1:10
8 Hz
2 Hz 20 Hz
1:10
8 Hz 2 Hz 20 Hz
1:10
8 Hz 2 Hz 20 Hz
1:10
8 Hz
*
0
5
10
15
20
25
Sa
liva
(l m
in-1
g g
lan
d-1
)
Pro
tein
ou
tpu
t
(g
min
-1 g
gla
nd
-1)
0
20
40
60
80
100
Time (min)0 5 10 15-5
CT stim
70
80
90
100
Blo
od
pre
ss
ure
(mm
Hg
)
80
100
120
He
art
ra
te
(bp
m)
Va
sc
ula
r re
sis
tan
ce
(% c
ha
ng
e)
-30
10
-70
-50
-10
0
10
20
30
Sa
liva
(l m
in-1
g g
lan
d-1
)
Pro
tein
ou
tpu
t
(g
min
-1 g
gla
nd
-1)
0
5
10
15
20
70
80
90
100
Blo
od
pre
ss
ure
(mm
Hg
)
80
100
120
He
art
ra
te
(bp
m)
Va
sc
ula
r re
sis
tan
ce
(% c
ha
ng
e)
-30
10
-70
-50
-10
Time (min)0 5 10 15-5
CT stim
M1 M3 M4 M5100 kDa
40 kDa
60 kDa
M4R-IR
control M1R-IR M3R-IR
M5R-IR
a
d
ad
s
a
d
se
d
a
da
Related Documents