APPLIED AND ENVIRONMENTAL MICROBIOLOGY, Mar. 2010, p. 1486–1496 Vol. 76, No. 5 0099-2240/10/$12.00 doi:10.1128/AEM.02288-09 Copyright © 2010, American Society for Microbiology. All Rights Reserved. Distribution and Diversity of Escherichia coli Populations in the South Nation River Drainage Basin, Eastern Ontario, Canada Emilie Lyautey, 1 Zexun Lu, 1 David R. Lapen, 2 Graham Wilkes, 2 Andrew Scott, 1 Tanya Berkers, 1 Thomas A. Edge, 3 and Edward Topp 1 * Agriculture and Agri-Food Canada, London, Ontario, Canada N5V 4T3 1 ; Agriculture and Agri-Food Canada, Ottawa, Ontario, Canada K1A 0C6 2 ; and Environment Canada, Burlington, Ontario, Canada L7R 4A6 3 Received 22 September 2009/Accepted 16 December 2009 We investigated the prevalence and diversity of Escherichia coli strains isolated from surface waters from multiple watersheds within the South Nation River basin in eastern Ontario, Canada. The basin is composed of mixed but primarily agricultural land uses. From March 2004 to November 2007, a total of 2,004 surface water samples were collected from 24 sampling sites. E. coli densities ranged from undetectable to 1.64 10 5 CFU 100 ml 1 and were correlated with stream order and proximity to livestock production systems. The diversity of 21,307 E. coli isolates was characterized using repetitive extragenic palindromic PCR (rep-PCR), allowing for the identification of as many as 7,325 distinct genotypes, without capturing all of the diversity. The community was temporally and spatially dominated by a few dominant genotypes (clusters of more than 500 isolates) and several genotypes of intermediary abundance (clustering between 10 and 499 isolates). Simpson diversity indices, assessed on a normalized number of isolates per sample, ranged from 0.050 to 0.668. Simpson indices could be statistically discriminated on the basis of year and stream order, but land use, discharge, weather, and water physical-chemical properties were not statistically important discriminators. The detection of Campylobacter species was associated with statistically lower Simpson indices (greater diversity; P < 0.05). Waterborne E. coli isolates from genotypes of dominant and intermediary abundance were clustered with isolates obtained from fecal samples collected in the study area over the same period, and 90% of the isolates tested proved to share genotypes with fecal isolates. Overall, our data indicated that the densities and distribution of E. coli in these mixed-use watersheds were linked to stream order and livestock-based land uses. Waterborne E. coli populations that were distinct from fecal isolates were detected and, on this basis, were possibly naturalized E. coli strains. Escherichia coli is ubiquitously distributed in fecal material from humans and warm-blooded animals (38). The detection of E. coli in water is an implicit indicator of recent fecal con- tamination and therefore of the risk of cooccurrence of enteric pathogens that can cause illness in susceptible populations (62). Many jurisdictions evaluate and mandate compliance with drinking and recreational water quality standards on the basis of the presence and abundance of E. coli (14, 44). For example, Canadian recreational water quality standards stipu- late that E. coli densities in excess of a geometric mean of 200 CFU per 100 ml indicate that the water is unsuitable for swim- ming and bathing (23). In a background of increasing occurrence of microbial con- tamination of surface water, a variety of methods for elucidat- ing the sources of fecal contamination have been developed, and these microbial source tracking (MST) methods are rec- ommended components of fecal pollution abatement strategies (16, 57). So-called library-dependent MST methods compare environmental isolates to collections of isolates obtained from likely sources of fecal pollution in the area of investigation. The host source is distinguished on the basis of the similarity of environmental isolates to reference fecal isolates. Comparison can be undertaken on the basis of genomic fingerprinting methods, including repetitive extragenic palindromic PCR (rep-PCR), ribotyping, or pulsed-field gel electrophoresis (PFGE) (13, 17, 31, 54, 57). A variety of studies using these methods have revealed enormous diversity in the fecal and environmental E. coli populations. For example, 461 distinct PFGE genotypes and 175 distinct enterobacterial repetitive intergenic consensus (ERIC)-PCR genotypes were detected in a collection of 555 E. coli strains isolated from river water in Texas (10). As many as 291 and 94 rep-PCR genotypes were distinguished in collections of 643 river isolates and 353 beach water E. coli isolates, respectively (43). Significant diversity was also revealed using multilocus enzyme electrophoresis (MLEE) and multilocus sequence typing (MLST) on 185 E. coli isolates from freshwater beaches, where an average of 40 alleles per locus were detected (59). Almost 60% of 657 E. coli isolates in a fecal reference collection had unique (i.e., de- tected in only one individual) fingerprints determined by rep- PCR (32). Extensive diversity of E. coli was also observed in soils in temperate climates, where the growth and persistence of “naturalized” populations without any known fecal input have been found (7, 28, 30). Naturalized populations have been dominated by the B1 phylogroup and may have adapted in ways that enhance their survival in temperate secondary habitats (59). The temporal and spatial diversity of E. coli may not be a significant factor in coarse-source (e.g., human versus animal) classification of E. coli by means of ribotyping proce- dures (48). Ultimately, the characterization and understanding * Corresponding author. Mailing address: Agriculture and Agri- Food Canada, 1391 Sandford Street, London, Ontario, Canada N5V 4T3. Phone: (519) 457-1470, ext. 235. Fax: (519) 457-3997. E-mail: [email protected]. Published ahead of print on 28 December 2009. 1486

Welcome message from author
This document is posted to help you gain knowledge. Please leave a comment to let me know what you think about it! Share it to your friends and learn new things together.
Transcript
APPLIED AND ENVIRONMENTAL MICROBIOLOGY, Mar. 2010, p. 1486–1496 Vol. 76, No. 50099-2240/10/$12.00 doi:10.1128/AEM.02288-09Copyright © 2010, American Society for Microbiology. All Rights Reserved.
Distribution and Diversity of Escherichia coli Populations in the SouthNation River Drainage Basin, Eastern Ontario, Canada�
Emilie Lyautey,1 Zexun Lu,1 David R. Lapen,2 Graham Wilkes,2 Andrew Scott,1 Tanya Berkers,1Thomas A. Edge,3 and Edward Topp1*
Agriculture and Agri-Food Canada, London, Ontario, Canada N5V 4T31; Agriculture and Agri-Food Canada, Ottawa,Ontario, Canada K1A 0C62; and Environment Canada, Burlington, Ontario, Canada L7R 4A63
Received 22 September 2009/Accepted 16 December 2009
We investigated the prevalence and diversity of Escherichia coli strains isolated from surface waters frommultiple watersheds within the South Nation River basin in eastern Ontario, Canada. The basin is composedof mixed but primarily agricultural land uses. From March 2004 to November 2007, a total of 2,004 surfacewater samples were collected from 24 sampling sites. E. coli densities ranged from undetectable to 1.64 � 105
CFU 100 ml�1 and were correlated with stream order and proximity to livestock production systems. Thediversity of 21,307 E. coli isolates was characterized using repetitive extragenic palindromic PCR (rep-PCR),allowing for the identification of as many as 7,325 distinct genotypes, without capturing all of the diversity. Thecommunity was temporally and spatially dominated by a few dominant genotypes (clusters of more than 500isolates) and several genotypes of intermediary abundance (clustering between 10 and 499 isolates). Simpsondiversity indices, assessed on a normalized number of isolates per sample, ranged from 0.050 to 0.668. Simpsonindices could be statistically discriminated on the basis of year and stream order, but land use, discharge,weather, and water physical-chemical properties were not statistically important discriminators. The detectionof Campylobacter species was associated with statistically lower Simpson indices (greater diversity; P < 0.05).Waterborne E. coli isolates from genotypes of dominant and intermediary abundance were clustered withisolates obtained from fecal samples collected in the study area over the same period, and 90% of the isolatestested proved to share genotypes with fecal isolates. Overall, our data indicated that the densities anddistribution of E. coli in these mixed-use watersheds were linked to stream order and livestock-based land uses.Waterborne E. coli populations that were distinct from fecal isolates were detected and, on this basis, werepossibly naturalized E. coli strains.
Escherichia coli is ubiquitously distributed in fecal materialfrom humans and warm-blooded animals (38). The detectionof E. coli in water is an implicit indicator of recent fecal con-tamination and therefore of the risk of cooccurrence of entericpathogens that can cause illness in susceptible populations(62). Many jurisdictions evaluate and mandate compliancewith drinking and recreational water quality standards on thebasis of the presence and abundance of E. coli (14, 44). Forexample, Canadian recreational water quality standards stipu-late that E. coli densities in excess of a geometric mean of 200CFU per 100 ml indicate that the water is unsuitable for swim-ming and bathing (23).
In a background of increasing occurrence of microbial con-tamination of surface water, a variety of methods for elucidat-ing the sources of fecal contamination have been developed,and these microbial source tracking (MST) methods are rec-ommended components of fecal pollution abatement strategies(16, 57). So-called library-dependent MST methods compareenvironmental isolates to collections of isolates obtained fromlikely sources of fecal pollution in the area of investigation.The host source is distinguished on the basis of the similarity ofenvironmental isolates to reference fecal isolates. Comparison
can be undertaken on the basis of genomic fingerprintingmethods, including repetitive extragenic palindromic PCR(rep-PCR), ribotyping, or pulsed-field gel electrophoresis(PFGE) (13, 17, 31, 54, 57). A variety of studies using thesemethods have revealed enormous diversity in the fecal andenvironmental E. coli populations. For example, 461 distinctPFGE genotypes and 175 distinct enterobacterial repetitiveintergenic consensus (ERIC)-PCR genotypes were detected ina collection of 555 E. coli strains isolated from river water inTexas (10). As many as 291 and 94 rep-PCR genotypes weredistinguished in collections of 643 river isolates and 353 beachwater E. coli isolates, respectively (43). Significant diversity wasalso revealed using multilocus enzyme electrophoresis(MLEE) and multilocus sequence typing (MLST) on 185 E.coli isolates from freshwater beaches, where an average of 40alleles per locus were detected (59). Almost 60% of 657 E. coliisolates in a fecal reference collection had unique (i.e., de-tected in only one individual) fingerprints determined by rep-PCR (32). Extensive diversity of E. coli was also observed insoils in temperate climates, where the growth and persistenceof “naturalized” populations without any known fecal inputhave been found (7, 28, 30). Naturalized populations havebeen dominated by the B1 phylogroup and may have adaptedin ways that enhance their survival in temperate secondaryhabitats (59). The temporal and spatial diversity of E. coli maynot be a significant factor in coarse-source (e.g., human versusanimal) classification of E. coli by means of ribotyping proce-dures (48). Ultimately, the characterization and understanding
* Corresponding author. Mailing address: Agriculture and Agri-Food Canada, 1391 Sandford Street, London, Ontario, Canada N5V4T3. Phone: (519) 457-1470, ext. 235. Fax: (519) 457-3997. E-mail:[email protected].
� Published ahead of print on 28 December 2009.
1486
of the diversity of populations of selected microorganisms insurface watercourses affected by multiple sources of fecal pol-lution (as in agricultural watershed settings, for example) maybe more critical for assessing the specific impacts of contami-nation-mitigating measures than previously thought. For in-stance, restricting the access of cattle on pasture to adjacentwater by implementing vegetative buffering along watercoursescreates habitat for varied wildlife, which then contribute tofecal pollution. In this context, the diversity in populations ofindicator bacteria could be useful for better understanding howchanges in landscape use influence fecal source inputs.
As part of a research program evaluating the impact of agri-culture on water quality and the efficacy of better agriculturalmanagement practices to mitigate agricultural pollution, we haveconducted a multiyear study of the microbiological water qualityfor a suite of different-sized watersheds in the South Nation Riverbasin in eastern Ontario, Canada (41, 46, 61). Land use in thisriver basin is mixed, consisting primarily of agricultural activities,light urban development, and interspersed wildlife habitat. Sur-face water systems in the study region differ widely in their con-tributing areas and therefore in their discharges (61).
In the work undertaken here, we sought to determine thespatial and seasonal variability in the density and the structureof populations of E. coli in surface waters within the SouthNation River basin. The specific objectives of the study were (i)to characterize the seasonal distribution and abundance of E.coli in different watershed settings within the river basin, (ii) toevaluate the spatial distribution of E. coli densities and diver-sity with respect to upstream land use activities, (iii) to userep-PCR to elucidate the dominant E. coli genotypes and thediversity of E. coli populations and to explore linkages topathogen presence, season, and environmental and land usevariables, and (iv) using rep-PCR, to evaluate the concordancebetween waterborne isolates and fecal isolates obtained fromwithin the study area. The study is distinguished by an intensive4-year sampling of numerous (n � 24) sites that differed intheir stream order and proximal land use activity; the number
of E. coli isolates (�21,000) included in the analysis; and theuse of two distinct rep-PCR fingerprinting methods (ERIC andBOXA1R) to characterize the isolates. Furthermore, we usedclassification and Regression Tree (CART) analysis to evalu-ate relationships between the abundance and diversity of E.coli in water samples and environmental and land use vari-ables.
MATERIALS AND METHODS
Characterization of sampling sites and surface water sampling. The SouthNation River basin is located in eastern Ontario, Canada. The total area of thebasin is approximately 3,900 km2. The topography in the region is generally flat;subsurface tile drainage and groundwater are the primary flow contributors.Roughly 60% of the land use in the South Nation watershed is farming, consist-ing primarily of dairy operations and cropping systems that receive manure(Statistics Canada’s 1996 agriculture census data are available at http://ceps.statcan.ca/english/profil/PlaceSearchForm1.cfm).
Surface water was sampled from 24 discrete locations within an area of ap-proximately 200 km2 (41). The sample sites were located on tributaries to theSouth Nation River and on the South Nation River proper. Land use and streamorder information were characterized using data from an intensive roadsidesurvey, remote sensing imagery (e.g., LANDSAT and SPOT series), and digitalelevation model (DEM) databases of the study region (9, 41, 46) (Table 1). Thevarious watercourses (ranging in size from drainage ditches, to tributaries ofvarious sizes, to the main reach of the South Nation River) were characterizedas follows. A DEM was “filled” using ArcMap Geographic Information Systemssoftware, version 9.1, and the Spatial Analyst package (Environmental SystemsResearch Institute [ESRI], Redlands, CA), removing small defects and/or sinks(areas of no outward flow), in the surface of the DEM. Next, flow direction wascalculated on the filled DEM, and subsequently flow accumulation was calcu-lated, in order to determine the direction of flow on a cell-by-cell basis and thenumber of upstream cells contributing to each contributing cell and coincidentsampling location. Stream thresholds were identified in order to produce arepresentative drainage network, and the Shreve order (49) was calculated usingthe Stream Order routine in Spatial Analyst and was assigned to water samplesite locations. The larger the watercourse, the larger the Shreve order (Table 1).
From March 2004 to November 2007, a total of 2,004 water samples were col-lected for enumeration of E. coli. With the exception of one sample site (designatedMST-1), 1-liter samples of surface water were collected from within a 0.5-m depth ofthe surface directly into sterile containers (Systems Plus, Woodstock, ON, Canada).Samples from MST-1 were taken from a municipal drinking water intake, whichdraws water from a depth of about 6 m within the South Nation River.
TABLE 1. List of landscape variables (independent criteria) used in CART analyses
Variable namea Variable description (unit)b
SHREVE ......................................Stream order. Lower orders (numbers) represent smaller tributaries, while higher orders (numbers) representlarger watercourses. Shreve’s method adds the order of each converging branch together regardless of size.
DBARN_xK .................................Barn density in catchment area 2, 5, 10, and 20 km upstream (obs. km�2)DDEVHI_xK ...............................High-density development in catchment area 2, 5, 10, and 20 km upstream (obs. km�2)DDEVLO_xK ..............................Low-density development in catchment area 2, 5, 10, and 20 km upstream (obs. km�2)DFORE_xK..................................Forest density in catchment area 2, 5, 10, and 20 km upstream (obs. km�2)DPAST_xK...................................Pasture density in catchment area 2, 5, 10, and 20 km upstream (obs. km�2)CROPP-xK ...................................Cropland coverage in catchment area 2, 5, 10, and 20 km upstream (km2 km�2)DEVELP-xK ................................Developed land coverage in catchment area 2, 5, 10, and 20 km upstream (km2 km�2)FORAGEP-xK.............................Forage land coverage in catchment area 2, 5, 10, and 20 km upstream (km2 km�2)PASTP-xK ....................................Pasture land coverage in catchment area 2, 5, 10, and 20 km upstream (km2 km�2)SHRUBP-xK ................................Shrub land coverage in catchment area 2, 5, 10, and 20 km upstream (km2 km�2)VEGP-xK......................................Forest coverage in catchment area 2, 5, 10, and 20 km upstream (km2 km�2)WATWETP-xK............................Water plus wetland coverage in catchment area 2, 5, 10, and 20 km upstream (km2 km�2)BASIN_(landuse) ........................Cropland, developed land, forage land, pasture land, and forest coverage in entire catchment area (km2 km�2)NUD_(landuse) ...........................Upstream distances (km) from sample location to nearest land use observations listed above and further land
use observations, including poultry barns (POULTRY BARN), pasture with livestock access to sampledtributary (PASTURE ACCESS), horse barns (HORSE BARN), hog barns (HOG BARN), dairy operations(DAIRY OP), and cattle barns (CATTLE BARN)
a x, maximum upstream distance from the sample site at which the sample site catchment area was defined.b obs., number of observations.
VOL. 76, 2010 DISTRIBUTION AND DIVERSITY OF E. COLI IN A WATERSHED 1487
Water isolates of E. coli for detailed genotypic analysis were obtained from 5(MST-1, MST-5, MST-6, MST-9, and MST-15) of the 24 sample sites. Thesewere chosen as representative of different stream orders and land use activitieswithin the river basin. Briefly, MST-1 is located on the South Nation River(Shreve stream order, 50,846), MST-5 on the Little Castor River (Shreve streamorder, 1,695), MST-6 on the Payne River (Shreve stream order, 3,942), MST-9 onButternut Creek (Shreve stream order, 1,090), and MST-15 on a municipaldrainage ditch (Shreve stream order, 54). Water samples (n � 311) were col-lected on a biweekly basis from March 2004 to August 2007 (Table 2).
Fecal sampling. Between April 2004 and September 2007, fecal samples (n �150) were collected from a variety of sources within the study area (40). Theseincluded livestock and companion animals (alpaca, bovine, dog, horse, poultry,rabbit, sheep, and swine), avian wildlife (goose and gull), mammalian wildlife(beaver, deer, fox, groundhog, moose, muskrat, and raccoon), and human waste-water (septic tanks, wastewater treatment plant effluent). Wildlife fecal materialwas obtained directly from animals by local trappers. Livestock slurry or solidmanure samples were obtained from several commercial farms either once or onseveral different dates.
E. coli enumeration, isolation, and confirmation. Water and fecal sampleswere shipped on ice packs within 24 h to Agriculture and Agri-Food Canada(AAFC) laboratories in London, Ontario, Canada, where they were analyzedimmediately. Water samples were enumerated as described elsewhere (61).Briefly, 10- to 100-ml portions of water were filtered through sterile, 0.45-�m-pore-size, 47-mm-diameter cellulose acetate filters (Pall Gelman GN-6; VWRInternational, Mississauga, ON, Canada), and the filters were plated onto mFCbasal medium (Difco, Fisher Scientific, Ottawa, ON, Canada) supplemented with100 mg liter�1 of 3-bromo-4-chloro-5-indolyl-�-D-glucopyranoside (BCIG)(hexylammonium salt; Inverness Medical, Ottawa, ON, Canada [11]) and thenincubated overnight at 44.5°C. Fecal samples were serially diluted in sodiummetaphosphate buffer (2 g liter�1) and mixed thoroughly. E. coli from fecalmaterial was isolated on mFC-BCIG medium as described previously (39). Allsingle colonies were restreaked twice onto LB agar (Difco, Fisher Scientific).Isolates were considered to be E. coli if they grew at 44.5°C, had a positivereaction for �-D-glucuronidase (blue color on mFC-BCIG agar), fermentedlactose, and produced indole. Confirmed isolates were inoculated into sterile96-well microtiter plates containing 100 �l well�1 of LB broth and were incu-bated overnight at 37°C. Sterile glycerol (Sigma-Aldrich Canada Ltd., Missis-sauga, ON, Canada) was then added to each well at a final concentration of 15%(vol/vol), and the plates were stored at �70°C. For this study, 21,307 water and10,966 fecal E. coli isolates were confirmed and further genotyped by rep-PCR.
Additional microbiological analyses of water. A subset (n � 180) of the 311water samples from which diversity indices were determined was also analyzedfor the presence of Salmonella spp., Campylobacter spp., E. coli O157:H7, Cryp-tosporidium oocysts, and Giardia cysts. The pathogen abundance data and de-tailed descriptions of the methodology used to obtain them have been publishedpreviously (46, 61).
Rep-PCR fingerprinting. Cell suspensions of E. coli were prepared by inocu-lating 100 �l of fresh LB broth per well in a sterile 96-well microtiter plate withfrozen stock cultures. Cells were grown statically at 37°C overnight and were cen-trifuged at 710 � g for 25 min (Centra CL3 microplate centrifuge; Thermo IEC,Needham Heights, MA). The supernatant was removed, and cells were resuspendedin 100 �l sterile Milli-Q water and agitated at 1,000 rpm with a microplate shaker(Sarstedt, Montreal, QC, Canada) for 5 min. The cell suspension either was useddirectly as a template for the PCR or was frozen at �20°C until required.
Bacteria were genotyped by both ERIC-PCR and BOX-PCR, with primersdescribed elsewhere (58). The final reaction mixture (25 �l) consisted of 1� PCRbuffer (Promega, Madison, WI), 1.5 mM MgCl2, 0.1 mg ml�1 gelatin, 200 �Meach deoxynucleoside triphosphate (Invitrogen, Burlington, ON, Canada), 2 �M
(each) forward and reverse primers ERIC-1 and ERIC, 1 U of Taq polymerase(Promega, Madison, WI), and 2 �l of the E. coli cell suspension as a template forERIC-PCR. The same protocol was used for BOX-PCR except that the gelatinwas replaced with 1% (vol/vol) dimethyl sulfoxide, and the single primerBOXA1R was used. Amplification was performed with a Thermo MBS Satellite0.2 thermocycler (VWR International, Mississauga, ON, Canada) as follows.After an initial denaturation at 94°C for 10 min, 34 cycles of denaturation (94°Cfor 3 s; 92°C for 30 s), annealing (50°C for 1 min), and extension (65°C for 1 min)were performed, followed by a final extension (65°C for 8 min). PCR productswere resolved by horizontal electrophoresis in a 25-cm by 50-cm gel (Gator A3-1;Owl Separations, Portsmouth, NH) prepared with 1.5% (wt/vol) agarose (In-vitrogen, Mississauga, ON, Canada) and 1� Tris-borate-EDTA buffer. Six mi-croliters of loading dye was added to 25 �l of the PCR product, and 7 �l of thismixture was loaded into wells fitted to an 8-mm by 1-mm comb tooth size. Everyeighth well received the MassRuler DNA ladder (Fermentas, Burlington, ON,Canada). Gels were subjected to 2.5 V cm�1 for 16 h in 1� Tris-borate-EDTAbuffer. The gel was stained with 1 �g ml�1 ethidium bromide solution for 10 minand was destained in Milli-Q water for 10 min. Gel images were captured as16-bit tagged-image format file (TIFF) images by using AlphaEase FC softwareand an Alpha Innotech digital gel documentation system (Fisher Scientific).
Computer-assisted image analysis and cluster assignment. Gel images werenormalized, and fingerprints were assigned to isolates, with the BioNumericssoftware package (version 4.5; Applied Maths, Kortrijk, Belgium) as describedelsewhere (15). Filtering and background subtraction were optimized for eachimage independently according to the methodology available at http://www.ecolirep.umn.edu/addinggelimages.shtml. The positions of fingerprints on gelswere normalized using the MassRuler DNA ladder as the external standard inthe range of 300 bp to 6,000 bp. Strains were assigned to different clusters bycalculating the similarity coefficients with the curve-based Pearson similaritycoefficient. Similarity trees were generated using the unweighted-pair groupmethod using average linkages. Repeated experiments where the same isolatefingerprint was run on different gels under similar conditions consistently showedan average similarity of 85%. Hence, clusters were initially assigned using thesoftware on the basis of 85% similarity, and the final assignments were deter-mined on the basis of careful and laborious visual inspection.
Fingerprint data analysis. The diversity captured in the E. coli collections wasestimated by rarefaction analysis using the analytical approximation algorithm ofreference 27, and 95% confidence intervals were estimated (24). Calculationswere performed with the freeware program Analytical Rarefaction 1.3, availableat http://www.uga.edu/strata/software/. Curves were plotted using SigmaPlot(version 9.1; SPSS Inc., Chicago, IL). The asymptotes of the rarefaction curves wereestimated using the Michaelis-Menten equation, which is available in SigmaPlot asthe one-site saturation ligand model (26). The asymptote is a measure of richnessat sampling saturation and was used to estimate the fraction of total communitydiversity captured within the E. coli collection and the number of isolates re-quired to capture half of the predicted diversity. The SigmaPlot curve fitter usesthe Marquardt-Levenberg algorithm to find the coefficients that give the best fitbetween the equation and the data (42). The Simpson diversity indices forpopulations of E. coli were calculated with the software calculator available atthe Chang Bioscience website, and confidence intervals were calculated (21, 50).The Wilcoxon signed-rank test (a nonparametric form of the paired Student ttest) was carried out using SPSS software for Windows (version 15.0; SPSS Inc.,Chicago, IL) and was used to determine whether Simpson index values calcu-lated from water samples with decreasing numbers of randomly chosen isolateswere coming from the same distribution (P, 0.05).
E. coli abundance and Simpson diversity index linkages with season andenvironmental and land use variables. We determined if the abundance of E.coli varied coherently with season, stream order, and land use (e.g., the density
TABLE 2. Sample period, number of water samples collected, and number of E. coli isolates genotyped using BOX-PCR and ERIC-PCR foreach site and each year
Site Dates of sample collectionNo. of samples (no. of isolates) fingerprinted
2004 2005 2006 2007 Total
MST-1 29 Mar. 2004 to 13 Aug. 2007 19 (1,477) 18 (1,712) 29 (998) 6 (96) 69 (4,283)MST-5 25 Apr. 2004 to 13 Aug. 2007 22 (1,671) 27 (3,489) 23 (640) 9 (180) 81 (5,980)MST-6 25 Apr. 2004 to 13 Aug. 2007 20 (1,552) 26 (3,704) 21 (652) 9 (180) 76 (5,458)MST-9 25 Apr. 2005 to 13 Aug. 2007 —a 22 (3,326) 21 (407) 10 (200) 53 (3,933)MST-15 30 Aug. 2005 to 30 July 2007 — 9 (1,205) 18 (360) 5 (88) 32 (1,653)
a —, the site was not sampled in 2004.
1488 LYAUTEY ET AL. APPL. ENVIRON. MICROBIOL.
of agricultural, human, or wildlife fecal sources in proximity to each samplinglocation) as follows. Potential landscape sources of seasonal E. coli pollution inthe study area were determined by predicting seasonal E. coli densities on thebasis of land use and stream order (Table 1). The statistical approach used tomake these determinations is regression tree analysis in the data-mining softwareCART version 6.0 (Salford Systems, San Diego, CA) (5, 53). CART is a well-established automated nonparametric binary recursive partitioning (decisiontree) methodology. These CART-based exploratory analyses can help identifyspatial and temporal hot spots for E. coli contamination and, thus, potentiallandscape sources of fecal contamination. Data on the densities of E. coli inwater (the “dependent variable” or target variable”; expressed in CFU 100 ml�1)were grouped into “data nodes” defined on the basis of land use and streamorder attributes (“predictor variables”; described in Table 1) by using CART.Due to the sensitivity of least-square regression methods to outliers and het-eroscedasticity properties not uncommon in E. coli density data, the least abso-lute deviation (LAD) regression criteria were employed for these data in CART.Thus, the mean absolute deviation (MAD) rather than the standard deviation(SD) was used to describe within-node data dispersion. The general assumptionsand overall CART modeling approach used here, except for the use of LADrather than least-squares methods, have been described previously (36). Forpurposes of brevity, we present only CART results reflecting, at a maximum, two(secondary) tree levels.
CART was also used to determine if the diversity of E. coli populations wasrelated to land use, climate, season, and environmental varibles. The Simpsondiversity indices (dependent variable) were evaluated in terms of the indepen-dent land use variables (Table 1), as well as the year, the season, and additionalwater physical/chemical variables (Table 3). For these CART analyses, the least-squares approach was used because of the relatively small impact of outliers. Inaddition, the association of the occurrence of pathogens (Campylobacter, Salmo-nella, Cryptosporidium oocysts, Giardia cysts [61]) with CART-produced Simpsonindex groups was summarized.
RESULTS
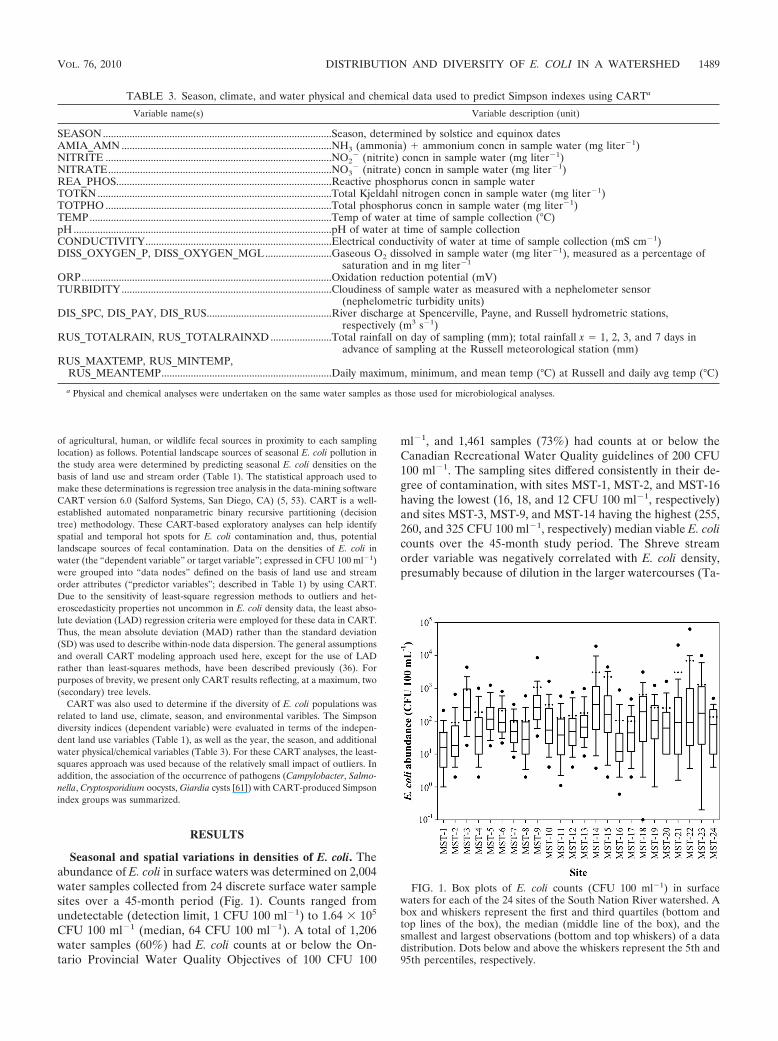
Seasonal and spatial variations in densities of E. coli. Theabundance of E. coli in surface waters was determined on 2,004water samples collected from 24 discrete surface water samplesites over a 45-month period (Fig. 1). Counts ranged fromundetectable (detection limit, 1 CFU 100 ml�1) to 1.64 � 105
CFU 100 ml�1 (median, 64 CFU 100 ml�1). A total of 1,206water samples (60%) had E. coli counts at or below the On-tario Provincial Water Quality Objectives of 100 CFU 100
ml�1, and 1,461 samples (73%) had counts at or below theCanadian Recreational Water Quality guidelines of 200 CFU100 ml�1. The sampling sites differed consistently in their de-gree of contamination, with sites MST-1, MST-2, and MST-16having the lowest (16, 18, and 12 CFU 100 ml�1, respectively)and sites MST-3, MST-9, and MST-14 having the highest (255,260, and 325 CFU 100 ml�1, respectively) median viable E. colicounts over the 45-month study period. The Shreve streamorder variable was negatively correlated with E. coli density,presumably because of dilution in the larger watercourses (Ta-
TABLE 3. Season, climate, and water physical and chemical data used to predict Simpson indexes using CARTa
Variable name(s) Variable description (unit)
SEASON ......................................................................................Season, determined by solstice and equinox datesAMIA_AMN ...............................................................................NH3 (ammonia) � ammonium concn in sample water (mg liter�1)NITRITE .....................................................................................NO2
� (nitrite) concn in sample water (mg liter�1)NITRATE....................................................................................NO3
� (nitrate) concn in sample water (mg liter�1)REA_PHOS.................................................................................Reactive phosphorus concn in sample waterTOTKN ........................................................................................Total Kjeldahl nitrogen concn in sample water (mg liter�1)TOTPHO .....................................................................................Total phosphorus concn in sample water (mg liter�1)TEMP...........................................................................................Temp of water at time of sample collection (°C)pH .................................................................................................pH of water at time of sample collectionCONDUCTIVITY......................................................................Electrical conductivity of water at time of sample collection (mS cm�1)DISS_OXYGEN_P, DISS_OXYGEN_MGL .........................Gaseous O2 dissolved in sample water (mg liter�1), measured as a percentage of
saturation and in mg liter�1
ORP..............................................................................................Oxidation reduction potential (mV)TURBIDITY...............................................................................Cloudiness of sample water as measured with a nephelometer sensor
(nephelometric turbidity units)DIS_SPC, DIS_PAY, DIS_RUS...............................................River discharge at Spencerville, Payne, and Russell hydrometric stations,
respectively (m3 s�1)RUS_TOTALRAIN, RUS_TOTALRAINXD .......................Total rainfall on day of sampling (mm); total rainfall x � 1, 2, 3, and 7 days in
advance of sampling at the Russell meteorological station (mm)RUS_MAXTEMP, RUS_MINTEMP,
RUS_MEANTEMP................................................................Daily maximum, minimum, and mean temp (°C) at Russell and daily avg temp (°C)
a Physical and chemical analyses were undertaken on the same water samples as those used for microbiological analyses.
FIG. 1. Box plots of E. coli counts (CFU 100 ml�1) in surfacewaters for each of the 24 sites of the South Nation River watershed. Abox and whiskers represent the first and third quartiles (bottom andtop lines of the box), the median (middle line of the box), and thesmallest and largest observations (bottom and top whiskers) of a datadistribution. Dots below and above the whiskers represent the 5th and95th percentiles, respectively.
VOL. 76, 2010 DISTRIBUTION AND DIVERSITY OF E. COLI IN A WATERSHED 1489
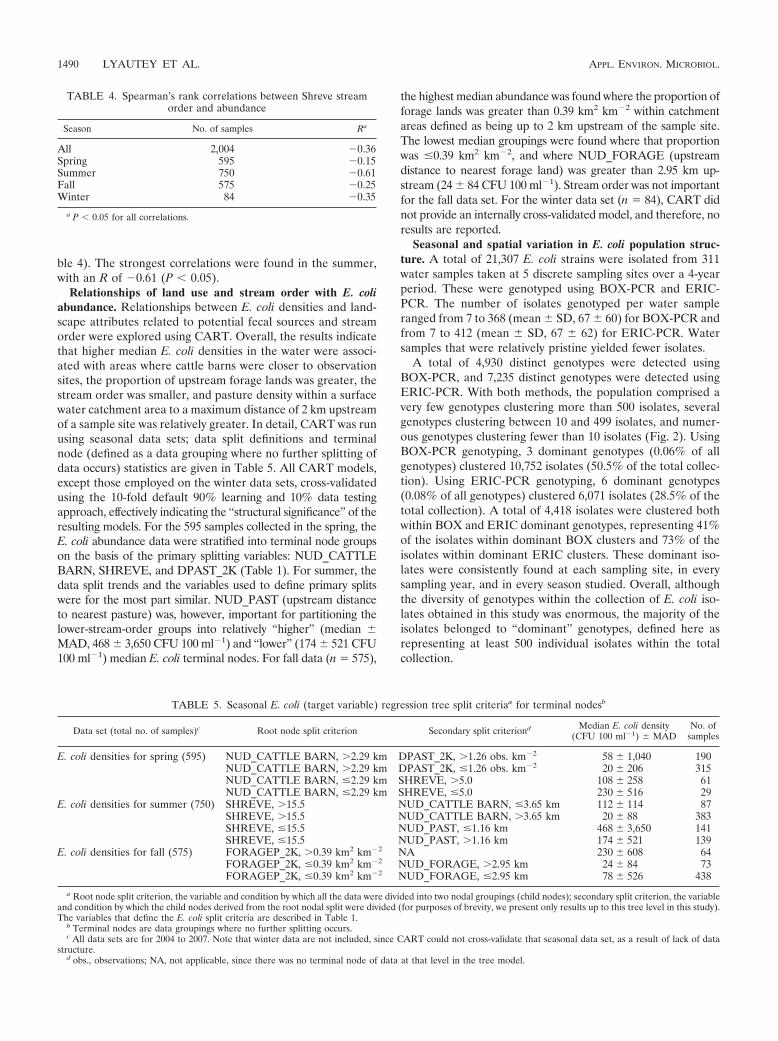
ble 4). The strongest correlations were found in the summer,with an R of �0.61 (P � 0.05).
Relationships of land use and stream order with E. coliabundance. Relationships between E. coli densities and land-scape attributes related to potential fecal sources and streamorder were explored using CART. Overall, the results indicatethat higher median E. coli densities in the water were associ-ated with areas where cattle barns were closer to observationsites, the proportion of upstream forage lands was greater, thestream order was smaller, and pasture density within a surfacewater catchment area to a maximum distance of 2 km upstreamof a sample site was relatively greater. In detail, CART was runusing seasonal data sets; data split definitions and terminalnode (defined as a data grouping where no further splitting ofdata occurs) statistics are given in Table 5. All CART models,except those employed on the winter data sets, cross-validatedusing the 10-fold default 90% learning and 10% data testingapproach, effectively indicating the “structural significance” of theresulting models. For the 595 samples collected in the spring, theE. coli abundance data were stratified into terminal node groupson the basis of the primary splitting variables: NUD_CATTLEBARN, SHREVE, and DPAST_2K (Table 1). For summer, thedata split trends and the variables used to define primary splitswere for the most part similar. NUD_PAST (upstream distanceto nearest pasture) was, however, important for partitioning thelower-stream-order groups into relatively “higher” (median MAD, 468 3,650 CFU 100 ml�1) and “lower” (174 521 CFU100 ml�1) median E. coli terminal nodes. For fall data (n � 575),
the highest median abundance was found where the proportion offorage lands was greater than 0.39 km2 km�2 within catchmentareas defined as being up to 2 km upstream of the sample site.The lowest median groupings were found where that proportionwas �0.39 km2 km�2, and where NUD_FORAGE (upstreamdistance to nearest forage land) was greater than 2.95 km up-stream (24 84 CFU 100 ml�1). Stream order was not importantfor the fall data set. For the winter data set (n � 84), CART didnot provide an internally cross-validated model, and therefore, noresults are reported.
Seasonal and spatial variation in E. coli population struc-ture. A total of 21,307 E. coli strains were isolated from 311water samples taken at 5 discrete sampling sites over a 4-yearperiod. These were genotyped using BOX-PCR and ERIC-PCR. The number of isolates genotyped per water sampleranged from 7 to 368 (mean SD, 67 60) for BOX-PCR andfrom 7 to 412 (mean SD, 67 62) for ERIC-PCR. Watersamples that were relatively pristine yielded fewer isolates.
A total of 4,930 distinct genotypes were detected usingBOX-PCR, and 7,235 distinct genotypes were detected usingERIC-PCR. With both methods, the population comprised avery few genotypes clustering more than 500 isolates, severalgenotypes clustering between 10 and 499 isolates, and numer-ous genotypes clustering fewer than 10 isolates (Fig. 2). UsingBOX-PCR genotyping, 3 dominant genotypes (0.06% of allgenotypes) clustered 10,752 isolates (50.5% of the total collec-tion). Using ERIC-PCR genotyping, 6 dominant genotypes(0.08% of all genotypes) clustered 6,071 isolates (28.5% of thetotal collection). A total of 4,418 isolates were clustered bothwithin BOX and ERIC dominant genotypes, representing 41%of the isolates within dominant BOX clusters and 73% of theisolates within dominant ERIC clusters. These dominant iso-lates were consistently found at each sampling site, in everysampling year, and in every season studied. Overall, althoughthe diversity of genotypes within the collection of E. coli iso-lates obtained in this study was enormous, the majority of theisolates belonged to “dominant” genotypes, defined here asrepresenting at least 500 individual isolates within the totalcollection.
TABLE 4. Spearman’s rank correlations between Shreve streamorder and abundance
Season No. of samples Ra
All 2,004 �0.36Spring 595 �0.15Summer 750 �0.61Fall 575 �0.25Winter 84 �0.35
a P � 0.05 for all correlations.
TABLE 5. Seasonal E. coli (target variable) regression tree split criteriaa for terminal nodesb
Data set (total no. of samples)c Root node split criterion Secondary split criteriond Median E. coli density(CFU 100 ml�1) MAD
No. ofsamples
E. coli densities for spring (595) NUD_CATTLE BARN, 2.29 km DPAST_2K, 1.26 obs. km�2 58 1,040 190NUD_CATTLE BARN, 2.29 km DPAST_2K, �1.26 obs. km�2 20 206 315NUD_CATTLE BARN, �2.29 km SHREVE, 5.0 108 258 61NUD_CATTLE BARN, �2.29 km SHREVE, �5.0 230 516 29
E. coli densities for summer (750) SHREVE, 15.5 NUD_CATTLE BARN, �3.65 km 112 114 87SHREVE, 15.5 NUD_CATTLE BARN, 3.65 km 20 88 383SHREVE, �15.5 NUD_PAST, �1.16 km 468 3,650 141SHREVE, �15.5 NUD_PAST, 1.16 km 174 521 139
E. coli densities for fall (575) FORAGEP_2K, 0.39 km2 km�2 NA 230 608 64FORAGEP_2K, �0.39 km2 km�2 NUD_FORAGE, 2.95 km 24 84 73FORAGEP_2K, �0.39 km2 km�2 NUD_FORAGE, �2.95 km 78 526 438
a Root node split criterion, the variable and condition by which all the data were divided into two nodal groupings (child nodes); secondary split criterion, the variableand condition by which the child nodes derived from the root nodal split were divided (for purposes of brevity, we present only results up to this tree level in this study).The variables that define the E. coli split criteria are described in Table 1.
b Terminal nodes are data groupings where no further splitting occurs.c All data sets are for 2004 to 2007. Note that winter data are not included, since CART could not cross-validate that seasonal data set, as a result of lack of data
structure.d obs., observations; NA, not applicable, since there was no terminal node of data at that level in the tree model.
1490 LYAUTEY ET AL. APPL. ENVIRON. MICROBIOL.
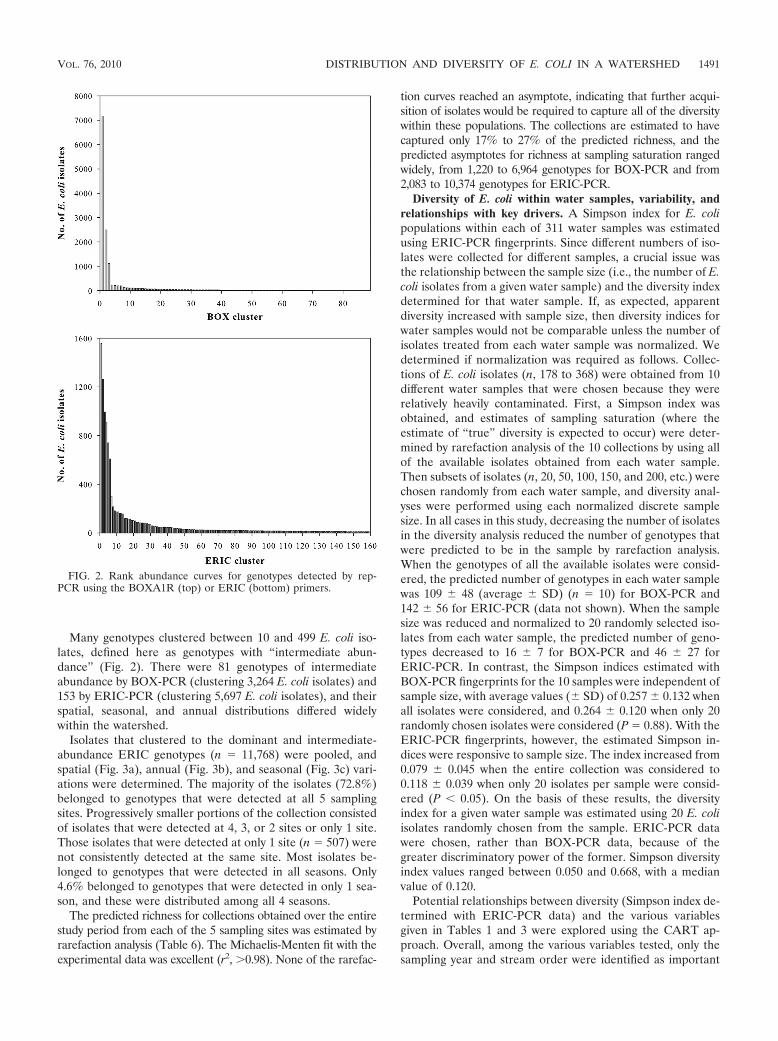
Many genotypes clustered between 10 and 499 E. coli iso-lates, defined here as genotypes with “intermediate abun-dance” (Fig. 2). There were 81 genotypes of intermediateabundance by BOX-PCR (clustering 3,264 E. coli isolates) and153 by ERIC-PCR (clustering 5,697 E. coli isolates), and theirspatial, seasonal, and annual distributions differed widelywithin the watershed.
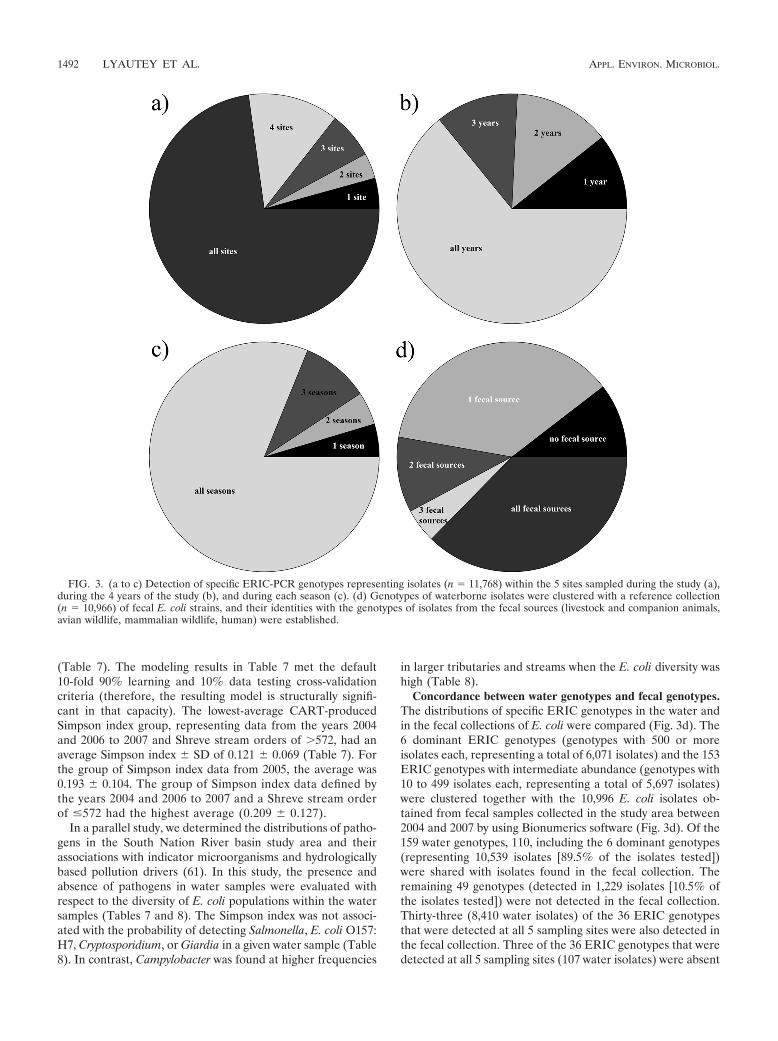
Isolates that clustered to the dominant and intermediate-abundance ERIC genotypes (n � 11,768) were pooled, andspatial (Fig. 3a), annual (Fig. 3b), and seasonal (Fig. 3c) vari-ations were determined. The majority of the isolates (72.8%)belonged to genotypes that were detected at all 5 samplingsites. Progressively smaller portions of the collection consistedof isolates that were detected at 4, 3, or 2 sites or only 1 site.Those isolates that were detected at only 1 site (n � 507) werenot consistently detected at the same site. Most isolates be-longed to genotypes that were detected in all seasons. Only4.6% belonged to genotypes that were detected in only 1 sea-son, and these were distributed among all 4 seasons.
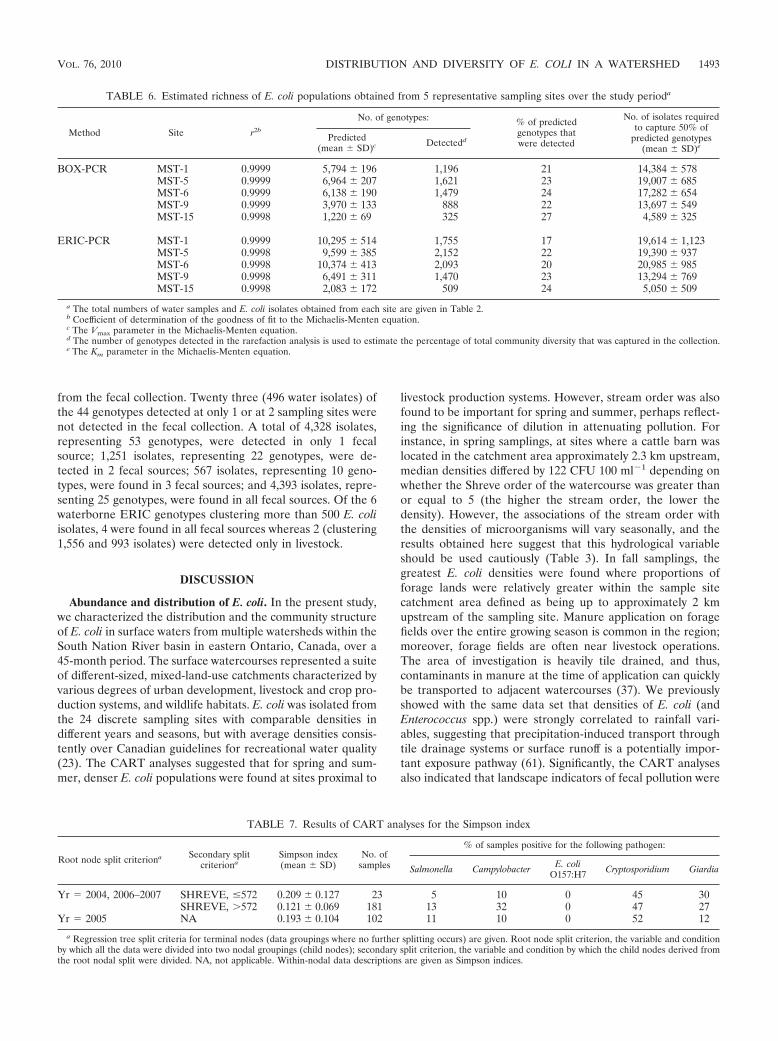
The predicted richness for collections obtained over the entirestudy period from each of the 5 sampling sites was estimated byrarefaction analysis (Table 6). The Michaelis-Menten fit with theexperimental data was excellent (r2, 0.98). None of the rarefac-
tion curves reached an asymptote, indicating that further acqui-sition of isolates would be required to capture all of the diversitywithin these populations. The collections are estimated to havecaptured only 17% to 27% of the predicted richness, and thepredicted asymptotes for richness at sampling saturation rangedwidely, from 1,220 to 6,964 genotypes for BOX-PCR and from2,083 to 10,374 genotypes for ERIC-PCR.
Diversity of E. coli within water samples, variability, andrelationships with key drivers. A Simpson index for E. colipopulations within each of 311 water samples was estimatedusing ERIC-PCR fingerprints. Since different numbers of iso-lates were collected for different samples, a crucial issue wasthe relationship between the sample size (i.e., the number of E.coli isolates from a given water sample) and the diversity indexdetermined for that water sample. If, as expected, apparentdiversity increased with sample size, then diversity indices forwater samples would not be comparable unless the number ofisolates treated from each water sample was normalized. Wedetermined if normalization was required as follows. Collec-tions of E. coli isolates (n, 178 to 368) were obtained from 10different water samples that were chosen because they wererelatively heavily contaminated. First, a Simpson index wasobtained, and estimates of sampling saturation (where theestimate of “true” diversity is expected to occur) were deter-mined by rarefaction analysis of the 10 collections by using allof the available isolates obtained from each water sample.Then subsets of isolates (n, 20, 50, 100, 150, and 200, etc.) werechosen randomly from each water sample, and diversity anal-yses were performed using each normalized discrete samplesize. In all cases in this study, decreasing the number of isolatesin the diversity analysis reduced the number of genotypes thatwere predicted to be in the sample by rarefaction analysis.When the genotypes of all the available isolates were consid-ered, the predicted number of genotypes in each water samplewas 109 48 (average SD) (n � 10) for BOX-PCR and142 56 for ERIC-PCR (data not shown). When the samplesize was reduced and normalized to 20 randomly selected iso-lates from each water sample, the predicted number of geno-types decreased to 16 7 for BOX-PCR and 46 27 forERIC-PCR. In contrast, the Simpson indices estimated withBOX-PCR fingerprints for the 10 samples were independent ofsample size, with average values ( SD) of 0.257 0.132 whenall isolates were considered, and 0.264 0.120 when only 20randomly chosen isolates were considered (P � 0.88). With theERIC-PCR fingerprints, however, the estimated Simpson in-dices were responsive to sample size. The index increased from0.079 0.045 when the entire collection was considered to0.118 0.039 when only 20 isolates per sample were consid-ered (P � 0.05). On the basis of these results, the diversityindex for a given water sample was estimated using 20 E. coliisolates randomly chosen from the sample. ERIC-PCR datawere chosen, rather than BOX-PCR data, because of thegreater discriminatory power of the former. Simpson diversityindex values ranged between 0.050 and 0.668, with a medianvalue of 0.120.
Potential relationships between diversity (Simpson index de-termined with ERIC-PCR data) and the various variablesgiven in Tables 1 and 3 were explored using the CART ap-proach. Overall, among the various variables tested, only thesampling year and stream order were identified as important
FIG. 2. Rank abundance curves for genotypes detected by rep-PCR using the BOXA1R (top) or ERIC (bottom) primers.
VOL. 76, 2010 DISTRIBUTION AND DIVERSITY OF E. COLI IN A WATERSHED 1491
(Table 7). The modeling results in Table 7 met the default10-fold 90% learning and 10% data testing cross-validationcriteria (therefore, the resulting model is structurally signifi-cant in that capacity). The lowest-average CART-producedSimpson index group, representing data from the years 2004and 2006 to 2007 and Shreve stream orders of 572, had anaverage Simpson index SD of 0.121 0.069 (Table 7). Forthe group of Simpson index data from 2005, the average was0.193 0.104. The group of Simpson index data defined bythe years 2004 and 2006 to 2007 and a Shreve stream orderof �572 had the highest average (0.209 0.127).
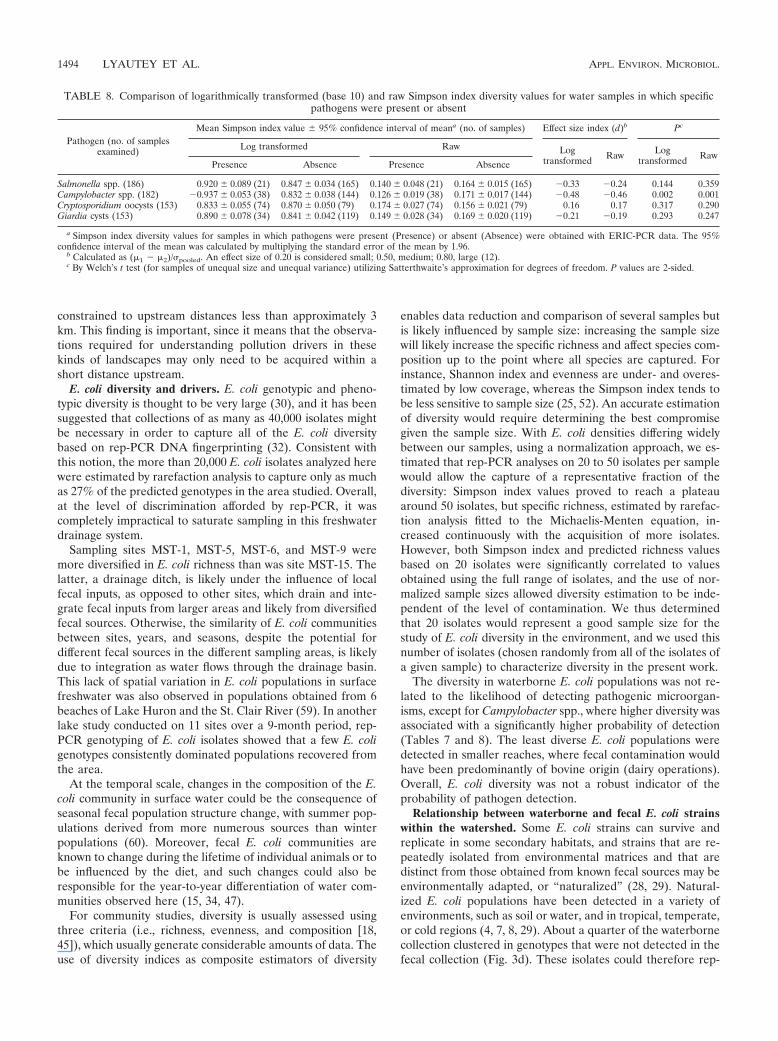
In a parallel study, we determined the distributions of patho-gens in the South Nation River basin study area and theirassociations with indicator microorganisms and hydrologicallybased pollution drivers (61). In this study, the presence andabsence of pathogens in water samples were evaluated withrespect to the diversity of E. coli populations within the watersamples (Tables 7 and 8). The Simpson index was not associ-ated with the probability of detecting Salmonella, E. coli O157:H7, Cryptosporidium, or Giardia in a given water sample (Table8). In contrast, Campylobacter was found at higher frequencies
in larger tributaries and streams when the E. coli diversity washigh (Table 8).
Concordance between water genotypes and fecal genotypes.The distributions of specific ERIC genotypes in the water andin the fecal collections of E. coli were compared (Fig. 3d). The6 dominant ERIC genotypes (genotypes with 500 or moreisolates each, representing a total of 6,071 isolates) and the 153ERIC genotypes with intermediate abundance (genotypes with10 to 499 isolates each, representing a total of 5,697 isolates)were clustered together with the 10,996 E. coli isolates ob-tained from fecal samples collected in the study area between2004 and 2007 by using Bionumerics software (Fig. 3d). Of the159 water genotypes, 110, including the 6 dominant genotypes(representing 10,539 isolates [89.5% of the isolates tested])were shared with isolates found in the fecal collection. Theremaining 49 genotypes (detected in 1,229 isolates [10.5% ofthe isolates tested]) were not detected in the fecal collection.Thirty-three (8,410 water isolates) of the 36 ERIC genotypesthat were detected at all 5 sampling sites were also detected inthe fecal collection. Three of the 36 ERIC genotypes that weredetected at all 5 sampling sites (107 water isolates) were absent
FIG. 3. (a to c) Detection of specific ERIC-PCR genotypes representing isolates (n � 11,768) within the 5 sites sampled during the study (a),during the 4 years of the study (b), and during each season (c). (d) Genotypes of waterborne isolates were clustered with a reference collection(n � 10,966) of fecal E. coli strains, and their identities with the genotypes of isolates from the fecal sources (livestock and companion animals,avian wildlife, mammalian wildlife, human) were established.
1492 LYAUTEY ET AL. APPL. ENVIRON. MICROBIOL.
from the fecal collection. Twenty three (496 water isolates) ofthe 44 genotypes detected at only 1 or at 2 sampling sites werenot detected in the fecal collection. A total of 4,328 isolates,representing 53 genotypes, were detected in only 1 fecalsource; 1,251 isolates, representing 22 genotypes, were de-tected in 2 fecal sources; 567 isolates, representing 10 geno-types, were found in 3 fecal sources; and 4,393 isolates, repre-senting 25 genotypes, were found in all fecal sources. Of the 6waterborne ERIC genotypes clustering more than 500 E. coliisolates, 4 were found in all fecal sources whereas 2 (clustering1,556 and 993 isolates) were detected only in livestock.
DISCUSSION
Abundance and distribution of E. coli. In the present study,we characterized the distribution and the community structureof E. coli in surface waters from multiple watersheds within theSouth Nation River basin in eastern Ontario, Canada, over a45-month period. The surface watercourses represented a suiteof different-sized, mixed-land-use catchments characterized byvarious degrees of urban development, livestock and crop pro-duction systems, and wildlife habitats. E. coli was isolated fromthe 24 discrete sampling sites with comparable densities indifferent years and seasons, but with average densities consis-tently over Canadian guidelines for recreational water quality(23). The CART analyses suggested that for spring and sum-mer, denser E. coli populations were found at sites proximal to
livestock production systems. However, stream order was alsofound to be important for spring and summer, perhaps reflect-ing the significance of dilution in attenuating pollution. Forinstance, in spring samplings, at sites where a cattle barn waslocated in the catchment area approximately 2.3 km upstream,median densities differed by 122 CFU 100 ml�1 depending onwhether the Shreve order of the watercourse was greater thanor equal to 5 (the higher the stream order, the lower thedensity). However, the associations of the stream order withthe densities of microorganisms will vary seasonally, and theresults obtained here suggest that this hydrological variableshould be used cautiously (Table 3). In fall samplings, thegreatest E. coli densities were found where proportions offorage lands were relatively greater within the sample sitecatchment area defined as being up to approximately 2 kmupstream of the sampling site. Manure application on foragefields over the entire growing season is common in the region;moreover, forage fields are often near livestock operations.The area of investigation is heavily tile drained, and thus,contaminants in manure at the time of application can quicklybe transported to adjacent watercourses (37). We previouslyshowed with the same data set that densities of E. coli (andEnterococcus spp.) were strongly correlated to rainfall vari-ables, suggesting that precipitation-induced transport throughtile drainage systems or surface runoff is a potentially impor-tant exposure pathway (61). Significantly, the CART analysesalso indicated that landscape indicators of fecal pollution were
TABLE 6. Estimated richness of E. coli populations obtained from 5 representative sampling sites over the study perioda
Method Site r2b
No. of genotypes: % of predictedgenotypes thatwere detected
No. of isolates requiredto capture 50% of
predicted genotypes(mean SD)e
Predicted(mean SD)c Detectedd
BOX-PCR MST-1 0.9999 5,794 196 1,196 21 14,384 578MST-5 0.9999 6,964 207 1,621 23 19,007 685MST-6 0.9999 6,138 190 1,479 24 17,282 654MST-9 0.9999 3,970 133 888 22 13,697 549MST-15 0.9998 1,220 69 325 27 4,589 325
ERIC-PCR MST-1 0.9999 10,295 514 1,755 17 19,614 1,123MST-5 0.9998 9,599 385 2,152 22 19,390 937MST-6 0.9998 10,374 413 2,093 20 20,985 985MST-9 0.9998 6,491 311 1,470 23 13,294 769MST-15 0.9998 2,083 172 509 24 5,050 509
a The total numbers of water samples and E. coli isolates obtained from each site are given in Table 2.b Coefficient of determination of the goodness of fit to the Michaelis-Menten equation.c The Vmax parameter in the Michaelis-Menten equation.d The number of genotypes detected in the rarefaction analysis is used to estimate the percentage of total community diversity that was captured in the collection.e The Km parameter in the Michaelis-Menten equation.
TABLE 7. Results of CART analyses for the Simpson index
Root node split criteriona Secondary splitcriteriona
Simpson index(mean SD)
No. ofsamples
% of samples positive for the following pathogen:
Salmonella Campylobacter E. coliO157:H7 Cryptosporidium Giardia
Yr � 2004, 2006–2007 SHREVE, �572 0.209 0.127 23 5 10 0 45 30SHREVE, 572 0.121 0.069 181 13 32 0 47 27
Yr � 2005 NA 0.193 0.104 102 11 10 0 52 12
a Regression tree split criteria for terminal nodes (data groupings where no further splitting occurs) are given. Root node split criterion, the variable and conditionby which all the data were divided into two nodal groupings (child nodes); secondary split criterion, the variable and condition by which the child nodes derived fromthe root nodal split were divided. NA, not applicable. Within-nodal data descriptions are given as Simpson indices.
VOL. 76, 2010 DISTRIBUTION AND DIVERSITY OF E. COLI IN A WATERSHED 1493
constrained to upstream distances less than approximately 3km. This finding is important, since it means that the observa-tions required for understanding pollution drivers in thesekinds of landscapes may only need to be acquired within ashort distance upstream.
E. coli diversity and drivers. E. coli genotypic and pheno-typic diversity is thought to be very large (30), and it has beensuggested that collections of as many as 40,000 isolates mightbe necessary in order to capture all of the E. coli diversitybased on rep-PCR DNA fingerprinting (32). Consistent withthis notion, the more than 20,000 E. coli isolates analyzed herewere estimated by rarefaction analysis to capture only as muchas 27% of the predicted genotypes in the area studied. Overall,at the level of discrimination afforded by rep-PCR, it wascompletely impractical to saturate sampling in this freshwaterdrainage system.
Sampling sites MST-1, MST-5, MST-6, and MST-9 weremore diversified in E. coli richness than was site MST-15. Thelatter, a drainage ditch, is likely under the influence of localfecal inputs, as opposed to other sites, which drain and inte-grate fecal inputs from larger areas and likely from diversifiedfecal sources. Otherwise, the similarity of E. coli communitiesbetween sites, years, and seasons, despite the potential fordifferent fecal sources in the different sampling areas, is likelydue to integration as water flows through the drainage basin.This lack of spatial variation in E. coli populations in surfacefreshwater was also observed in populations obtained from 6beaches of Lake Huron and the St. Clair River (59). In anotherlake study conducted on 11 sites over a 9-month period, rep-PCR genotyping of E. coli isolates showed that a few E. coligenotypes consistently dominated populations recovered fromthe area.
At the temporal scale, changes in the composition of the E.coli community in surface water could be the consequence ofseasonal fecal population structure change, with summer pop-ulations derived from more numerous sources than winterpopulations (60). Moreover, fecal E. coli communities areknown to change during the lifetime of individual animals or tobe influenced by the diet, and such changes could also beresponsible for the year-to-year differentiation of water com-munities observed here (15, 34, 47).
For community studies, diversity is usually assessed usingthree criteria (i.e., richness, evenness, and composition [18,45]), which usually generate considerable amounts of data. Theuse of diversity indices as composite estimators of diversity
enables data reduction and comparison of several samples butis likely influenced by sample size: increasing the sample sizewill likely increase the specific richness and affect species com-position up to the point where all species are captured. Forinstance, Shannon index and evenness are under- and overes-timated by low coverage, whereas the Simpson index tends tobe less sensitive to sample size (25, 52). An accurate estimationof diversity would require determining the best compromisegiven the sample size. With E. coli densities differing widelybetween our samples, using a normalization approach, we es-timated that rep-PCR analyses on 20 to 50 isolates per samplewould allow the capture of a representative fraction of thediversity: Simpson index values proved to reach a plateauaround 50 isolates, but specific richness, estimated by rarefac-tion analysis fitted to the Michaelis-Menten equation, in-creased continuously with the acquisition of more isolates.However, both Simpson index and predicted richness valuesbased on 20 isolates were significantly correlated to valuesobtained using the full range of isolates, and the use of nor-malized sample sizes allowed diversity estimation to be inde-pendent of the level of contamination. We thus determinedthat 20 isolates would represent a good sample size for thestudy of E. coli diversity in the environment, and we used thisnumber of isolates (chosen randomly from all of the isolates ofa given sample) to characterize diversity in the present work.
The diversity in waterborne E. coli populations was not re-lated to the likelihood of detecting pathogenic microorgan-isms, except for Campylobacter spp., where higher diversity wasassociated with a significantly higher probability of detection(Tables 7 and 8). The least diverse E. coli populations weredetected in smaller reaches, where fecal contamination wouldhave been predominantly of bovine origin (dairy operations).Overall, E. coli diversity was not a robust indicator of theprobability of pathogen detection.
Relationship between waterborne and fecal E. coli strainswithin the watershed. Some E. coli strains can survive andreplicate in some secondary habitats, and strains that are re-peatedly isolated from environmental matrices and that aredistinct from those obtained from known fecal sources may beenvironmentally adapted, or “naturalized” (28, 29). Natural-ized E. coli populations have been detected in a variety ofenvironments, such as soil or water, and in tropical, temperate,or cold regions (4, 7, 8, 29). About a quarter of the waterbornecollection clustered in genotypes that were not detected in thefecal collection (Fig. 3d). These isolates could therefore rep-
TABLE 8. Comparison of logarithmically transformed (base 10) and raw Simpson index diversity values for water samples in which specificpathogens were present or absent
Pathogen (no. of samplesexamined)
Mean Simpson index value 95% confidence interval of meana (no. of samples) Effect size index (d)b Pc
Log transformed Raw Logtransformed Raw Log
transformed RawPresence Absence Presence Absence
Salmonella spp. (186) 0.920 0.089 (21) 0.847 0.034 (165) 0.140 0.048 (21) 0.164 0.015 (165) �0.33 �0.24 0.144 0.359Campylobacter spp. (182) �0.937 0.053 (38) 0.832 0.038 (144) 0.126 0.019 (38) 0.171 0.017 (144) �0.48 �0.46 0.002 0.001Cryptosporidium oocysts (153) 0.833 0.055 (74) 0.870 0.050 (79) 0.174 0.027 (74) 0.156 0.021 (79) 0.16 0.17 0.317 0.290Giardia cysts (153) 0.890 0.078 (34) 0.841 0.042 (119) 0.149 0.028 (34) 0.169 0.020 (119) �0.21 �0.19 0.293 0.247
a Simpson index diversity values for samples in which pathogens were present (Presence) or absent (Absence) were obtained with ERIC-PCR data. The 95%confidence interval of the mean was calculated by multiplying the standard error of the mean by 1.96.
b Calculated as (�1 � �2)/�pooled. An effect size of 0.20 is considered small; 0.50, medium; 0.80, large (12).c By Welch’s t test (for samples of unequal size and unequal variance) utilizing Satterthwaite’s approximation for degrees of freedom. P values are 2-sided.
1494 LYAUTEY ET AL. APPL. ENVIRON. MICROBIOL.
resent a sizable “naturalized” population. Alternatively, thefecal collection may have significantly underrepresented thetotal diversity of E. coli within the area during the experiment,and the ability to source all environmental isolates is thereforenot complete. Finally, in spite of the supposed robustness ofthe method (33), rearrangements that modify the abundanceor the location of rep-PCR primer binding sites within thegenome could potentially create new apparent “genotypes” notdetected in fecal populations.
About one-third of the water isolates clustered with thelivestock and companion animal fecal isolates (Fig. 3d). This isin agreement with the spatial relationships between E. coliabundance in the water and proximity to sources of cattlemanure pollution from the numerous dairy farms in the area(Table 4). About half of the isolates belonged to genotypesthat were detected in multiple fecal sources. Perhaps the di-gestive system of ruminants is a unique niche selecting fordistinct genotypes within the area of study, whereas monogas-trics tend to harbor a larger diversity of shared types (20).Overall, the study identified a few very dominant genotypesthat were detected in one fecal source and many genotypesthat were detected in multiple sources.
Based on the 22 complete genome sequences of E. coli thatare currently available, the E. coli pangenome (the completecomplement of noncore genes distributed within individualswithin the species) has been estimated to comprise at least42,500 gene families (51), significantly more than the humangenome. Studies have revealed enormous diversity in E. colipopulations in primary and various secondary habitats. Theseinclude feces from various mammalian and avian hosts (2, 22),stored dairy and swine manure (39), home septic systems (19),fresh and marine surface water (35, 43, 56), beach sand (59),soils (7), and the freshwater macrophytic green algaCladophora (8). Many aspects of this enormous diversity haveimportance for the assessment and management of water qual-ity. First, rep-PCR is a microbial source tracking (MST)method commonly employed to elucidate the source of fecalpollution of surface water (16, 32, 57). Environmental isolatesare compared to reference isolates from potential fecal sources(e.g., human, livestock, wildlife) in the area of investigation,and the likely host source is assigned on the basis of similarityof rep-PCR fingerprints. The tractability of this library-depen-dent MST method is contingent on the ability to undertakerepresentative sampling, the host specificity of the fingerprintsobtained, and the persistence of fecal genotypes in secondaryhabitats. Second, the diversity of environmental populationsmay reflect how impacted they are by point or diffuse sourcesof fecal pollution. For example, isolated collections of E. coliwere obtained from a marine coastal area that was exposed tostorm water sewerage following significant precipitation events(6). The diversity of populations determined by rep-PCR wasdistinctly higher before than after precipitation events, indicat-ing that populations dominated by sewage contamination weresignificantly less diverse than background populations of E. coliin this saline aquatic environment. Third, the structure of sur-viving populations is in part due to differential survival insecondary habitats. Different strains of E. coli differ widely intheir abilities to persist or proliferate in manured soils (55) orsubtropical waters and sediments (1), potentially confound-ing quantitative relative source assignation by MST (3).
Finally, environmental isolates of E. coli that are distinctfrom fecal isolates may represent types that have becomeuniquely adapted for extraintestinal survival and prolifera-tion (7, 28, 30).
In summary, we demonstrated here that E. coli abundanceand distribution in mixed-use watersheds were linked to thesize of the watercourse, as well as agricultural land uses asso-ciated with livestock production systems. E. coli populationsproved to be genotypically diverse, although dominant geno-types were observed across sites, seasons, and sampling years.A comparison of waterborne and fecal E. coli populationssuggested the occurrence of naturalized E. coli populations inthe watershed studied and detected dominant genotypes thatwere shared among multiple sources, or were found in live-stock only. Temporal changes in E. coli water populations werelikely to be related to changes in fecal inputs over time, em-phasizing the necessity of constructing temporally integrativefecal libraries when microbial source tracking approaches areconsidered.
ACKNOWLEDGMENTS
This work was funded in part by the AAFC National Water QualitySurveillance Research Program and the Watershed Evaluation of Ben-eficial Management Practice (WEBs) program. E. Lyautey and Z. Luwere supported by the NSERC Visiting Fellowship in GovernmentLaboratories program.
We thank the South Nation Conservation Authority for assistance inobtaining samples.
REFERENCES
1. Anderson, K. L., J. E. Whitlock, and V. J. Harwood. 2005. Persistence anddifferential survival of fecal indicator bacteria in subtropical waters andsediments. Appl. Environ. Microbiol. 71:3041–3048.
2. Anderson, M. A., J. E. Whitlock, and V. J. Harwood. 2006. Diversity anddistribution of Escherichia coli genotypes and antibiotic resistance pheno-types in feces of humans, cattle, and horses. Appl. Environ. Microbiol.72:6914–6922.
3. Barnes, B., and D. M. Gordon. 2004. Coliform dynamics and the implicationsfor source tracking. Environ. Microbiol. 6:501–509.
4. Beversdorf, L. J., S. M. Bornstein-Forst, and S. L. McLellan. 2007. Thepotential for beach sand to serve as a reservoir for Escherichia coli and thephysical influences on cell die-off. J. Appl. Microbiol. 102:1372–1381.
5. Breiman, L., J. Freidman, R. Olshen, and C. Stone. 1984. Classification andregression trees. Wadsworth International, Pacific Grove, CA.
6. Brownell, M. J., V. J. Harwood, R. C. Kurz, S. M. McQuaig, J. Lukasik, andT. M. Scott. 2007. Confirmation of putative stormwater impact on waterquality at a Florida beach by microbial source tracking methods and struc-ture of indicator organism populations. Water Res. 41:3747–3757.
7. Byappanahalli, M. N., R. L. Whitman, D. A. Shively, M. J. Sadowsky, and S.Ishii. 2006. Population structure, persistence, and seasonality of autochtho-nous Escherichia coli in temperate, coastal forest soil from a Great Lakeswatershed. Environ. Microbiol. 8:504–513.
8. Byappanahalli, M. N., R. L. Whitman, D. A. Shively, J. Ferguson, S. Ishii,and M. J. Sadowsky. 2007. Population structure of Cladophora-borne Esch-erichia coli in nearshore water of Lake Michigan. Water Res. 41:3649–3654.
9. Canadian Soil Information System (CanSIS). 2004. Ontario Soils Datalayer(version 2004 and 2005). Agriculture and Agri-Food Canada, Eastern Cerealand Oilseeds Research Centre, Ottawa, Ontario, Canada.
10. Casarez, E. A., S. D. Pillai, and G. D. Di Giovanni. 2007. Genotype diversityof Escherichia coli isolates in natural waters determined by PFGE and ERIC-PCR. Water Res. 41:3643–3648.
11. Ciebin, B. W., M. H. Brodsky, R. Reddington, G. Horsnell, A. Choney, G.Palmateer, A. Ley, R. Joshi, and G. Shears. 1995. Comparative evaluation ofmodified m-FC and m-TEC media for membrane filter enumeration ofEscherichia coli in water. Appl. Environ. Microbiol. 61:3940–3942.
12. Cohen, J. 1992. A power primer. Quantitative methods in psychology. Psy-chol. Bull. 11:155–159.
13. Dombek, P. E., L. K. Johnson, S. T. Zimmerley, and M. J. Sadowsky. 2000.Use of repetitive DNA sequences and the PCR to differentiate Escherichiacoli isolates from human and animal sources. Appl. Environ. Microbiol.66:2572–2577.
14. Dufour, A. P. 1984. Health effects criteria for fresh recreational waters.
VOL. 76, 2010 DISTRIBUTION AND DIVERSITY OF E. COLI IN A WATERSHED 1495
Office of Research and Development, U.S. Environmental ProtectionAgency, Research Triangle Park, NC.
15. Duriez, P., and E. Topp. 2007. Temporal dynamics and impact of manurestorage on antibiotic resistance patterns and population structure of Esche-richia coli isolates from a commercial farm. Appl. Environ. Microbiol. 73:5486–5493.
16. Edge, T. A., and K. A. Schaefer (ed.). 2006. Microbial source tracking inaquatic ecosystems: the state of the science and an assessment of needs.National Water Research Institute, Burlington, Ontario, Canada.
17. Farber, J. M. 1996. An introduction of the hows and whys of moleculartyping. J. Food Prot. 59:1091–1101.
18. Forney, L. J., X. Zhou, and C. J. Brown. 2004. Molecular microbial ecology:land of the one-eyed king. Curr. Opin. Microbiol. 7:210–220.
19. Gordon, D. M., S. Bauer, and J. R. Johnson. 2002. The genetic structure ofEscherichia coli populations in primary and secondary habitats. Microbiology148:1513–1522.
20. Gordon, D. M., and A. Cowling. 2003. The distribution and genetic structureof Escherichia coli in Australian vertebrates: host and geographic effects.Microbiology 149:3575–3586.
21. Grundmann, H., S. Hori, and G. Tanner. 2001. Determining confidenceintervals when measuring genetic diversity and the discriminatory abilities oftyping methods for microorganisms. J. Clin. Microbiol. 39:4190–4192.
22. Hansen, D. L., S. Ishii, M. J. Sadowsky, and R. E. Hicks. 2009. Escherichiacoli populations in Great Lakes waterfowl exhibit spatial stability and tem-poral shifting. Appl. Environ. Microbiol. 75:1546–1551.
23. Health and Welfare Canada. 1992. Guidelines for Canadian recreationalwater quality. H49-70/1991E. Ministry of Supply and Services Canada,Ottawa, Ontario, Canada.
24. Heck, K. L. J., G. van Belle, and D. Simberloff. 1975. Explicit calculation ofthe rarefaction diversity measurement and the determination of sufficientsample size. Ecology 56:1459–1461.
25. Hill, T. C. J., K. A. Walsh, J. A. Harris, and B. F. Moffett. 2003. Usingecological diversity measures with bacterial communities. FEMS Microbiol.Ecol. 43:1–11.
26. Hughes, J. B., J. J. Hellmann, T. H. Ricketts, and B. J. M. Bohannan. 2001.Counting the uncountable: statistical approaches to estimating microbialdiversity. Appl. Environ. Microbiol. 67:4399–4406.
27. Hurlbert, S. H. 1971. The nonconcept of species diversity: a critique andalternative parameters. Ecology 52:577–586.
28. Ishii, S., W. B. Ksoll, R. E. Hicks, and M. J. Sadowsky. 2006. Presence andgrowth of naturalized Escherichia coli in temperate soils from Lake Superiorwatersheds. Appl. Environ. Microbiol. 72:612–621.
29. Ishii, S., D. L. Hansen, R. E. Hicks, and M. J. Sadowsky. 2007. Beach sandand sediments are temporal sinks and sources of Escherichia coli in LakeSuperior. Environ. Sci. Technol. 41:2203–2209.
30. Ishii, S., and M. J. Sadowsky. 2008. Escherichia coli in the environment:implications for water quality and human health. Microbes Environ. 23:101–108.
31. Ishii, S., and M. J. Sadowsky. 2009. Applications of the rep-PCR DNAfingerprinting technique to study microbial diversity, ecology and evolution.Environ. Microbiol. 11:733–740.
32. Johnson, L. K., M. B. Brown, E. A. Carruthers, J. A. Ferguson, P. E.Dombek, and M. J. Sadowsky. 2004. Sample size, library composition, andgenotypic diversity among natural populations of Escherichia coli from dif-ferent animals influence accuracy of determining sources of fecal pollution.Appl. Environ. Microbiol. 70:4478–4485.
33. Kang, H. P., and W. M. Dunne. 2003. Stability of repetitive-sequence PCRpatterns with respect to culture age and subculture frequency. J. Clin. Mi-crobiol. 41:2694–2696.
34. Katouli, M., A. Lund, P. Wallgren, I. Kuhn, O. Soderlind, and R. Mollby.1995. Phenotypic characterization of intestinal Escherichia coli of pigs duringsuckling, postweaning, and fattening periods. Appl. Environ. Microbiol. 61:778–783.
35. Kon, T., S. C. Weir, E. T. Howell, H. Lee, and J. T. Trevors. 2007. Geneticrelatedness of Escherichia coli isolates in interstitial water from a LakeHuron (Canada) beach. Appl. Environ. Microbiol. 73:1961–1967.
36. Lapen, D. R., G. C. Topp, E. G. Gregorich, H. N. Hayhoe, and W. E. Curnoe.2001. Divisive field-scale associations between corn yields, management, andsoil information. Soil Tillage Res. 58:193–206.
37. Lapen, D. R., E. Topp, C. D. Metcalfe, H. Li, M. Edwards, N. Gottschall, P.Bolton, W. Curnoe, M. Payne, and A. Beck. 2008. Pharmaceutical and per-sonal care products in tile drainage following land application of municipalbiosolids. Sci. Total Environ. 399:50–65.
38. Leclerc, H., D. A. A. Mossel, S. C. Edberg, and C. B. Struijk. 2001. Advances
in the bacteriology of the Coliform group: their suitability as markers ofmicrobial water safety. Annu. Rev. Microbiol. 55:201–234.
39. Lu, Z., D. R. Lapen, A. Scott, A. Dang, and E. Topp. 2005. Identifying hostsources of fecal pollution: diversity of Escherichia coli in confined dairy andswine production systems. Appl. Environ. Microbiol. 71:5992–5998.
40. Lyautey, E., A. Hartmann, F. Pagotto, K. Tyler, D. R. Lapen, G. Wilkes, P.Piveteau, A. Rieu, W. J. Robertson, D. T. Medeiros, T. A. Edge, V. Gannon,and E. Topp. 2007. Characteristics and frequency of detection of fecal Lis-teria monocytogenes shed by livestock, wildlife, and humans. Can. J. Micro-biol. 53:1158–1167.
41. Lyautey, E., D. R. Lapen, G. Wilkes, K. McCleary, F. Pagotto, K. Tyler, A.Hartmann, P. Piveteau, A. Rieu, W. J. Robertson, D. T. Medeiros, T. A. Edge,V. Gannon, and E. Topp. 2007. Distribution and characteristics of Listeriamonocytogenes isolates from surface waters of the South Nation River wa-tershed, Ontario, Canada. Appl. Environ. Microbiol. 73:5401–5410.
42. Marquardt, D. W. 1963. An algorithm for least squares estimation of pa-rameters. J. Soc. Ind. Appl. Math. 11:431–441.
43. McLellan, S. L. 2004. Genetic diversity of Escherichia coli isolated fromurban rivers and beach water. Appl. Environ. Microbiol. 70:4658–4665.
44. National Research Council and Committee on Indicators for WaterbornePathogens (ed.). 2004. Indicators for waterborne pathogens. National Acad-emies Press, Washington, DC.
45. Purvis, A., and A. Hector. 2000. Getting the measure of biodiversity. Nature405:212–219.
46. Ruecker, N. J., S. L. Braithwaite, E. Topp, T. Edge, D. R. Lapen, G. Wilkes,W. Robertson, D. Medeiros, C. W. Sensen, and N. F. Neumann. 2007.Tracking host sources of Cryptosporidium spp. in raw water for improvedhealth risk assessment. Appl. Environ. Microbiol. 73:3945–3957.
47. Russell, J. B., F. Diez-Gonzalez, and G. N. Jarvis. 2000. Effects of diet shiftson Escherichia coli in cattle. J. Dairy Sci. 83:863–873.
48. Scott, T. M., J. Caren, G. R. Nelson, T. A. Jenkins, and J. Lukasik. 2004.Tracking sources of fecal pollution in a South Carolina watershed by ribotyp-ing Escherichia coli: a case study. Environ. Forensics 5:15–19.
49. Shreve, R. L. 1966. Statistical law of stream numbers. J. Geol. 74:17–37.50. Simpson, E. H. 1949. Measurement of diversity. Nature 163:688.51. Snipen, L., T. Almoy, and D. Ussery. 2009. Microbial comparative pan-
genomics using binomial mixture models. BMC Genomics 10:385.52. Soetaert, K., and C. Heip. 1990. Sample-size dependence of diversity indexes
and the determination of sufficient sample-size in a high-diversity deep-seaenvironment. Mar. Ecol. Prog. Ser. 59:305–307.
53. Steinberg, D., and M. Golovnya. 2007. CART 6.0 user’s guide. SalfordSystems, San Diego, CA.
54. Stoeckel, D. M., M. V. Mathes, K. E. Hyer, C. Hagedorn, H. Kator, J.Lukasik, T. L. O’Brien, T. W. Fenger, M. Samadpour, K. M. Strickler, andB. A. Wiggins. 2004. Comparison of seven protocols to identify fecal con-tamination sources using Escherichia coli. Environ. Sci. Technol. 38:6109–6117.
55. Topp, E., M. Welsh, Y. C. Tien, A. Dang, G. Lazarovits, K. Conn, and H.Zhu. 2003. Strain-dependent variability in growth and survival of Escherichiacoli in agricultural soil. FEMS Microbiol. Ecol. 44:303–308.
56. Udenika Wijesinghe, R., Y. A. Feng, C. W. Wood, D. M. Stoeckel, and J. N.Shaw. 2009. Population dynamics and genetic variability of Escherichia coli ina mixed land-use watershed. J. Water Health 7:484–496.
57. U.S. Environmental Protection Agency. June 2005. Microbial source trackingguide document. EPA/600/R-05/064. National Risk Management ResearchLaboratory, Office of Research and Development, U.S. EPA, Cincinnati,OH.
58. Versalovic, J., M. Schneider, F. J. De Bruijn, and J. R. Lupski. 1994.Genomic fingerprinting of bacteria using repetitive sequence-based polymer-ase chain reaction. Methods Mol. Cell. Biol. 5:25–40.
59. Walk, S. T., E. W. Alm, L. M. Calhoun, J. M. Mladonicky, and T. S. Whittam.2007. Genetic diversity and population structure of Escherichia coli isolatedfrom freshwater beaches. Environ. Microbiol. 9:2274–2288.
60. Whitman, R. L., K. Przybyla-Kelly, D. A. Shively, M. B. Nevers, and M. N.Byappanahalli. 2008. Sunlight, season, snowmelt, storm, and source affectE. coli populations in an artificially ponded stream. Sci. Total Environ.390:448–455.
61. Wilkes, G., T. Edge, V. Gannon, C. Jokinen, E. Lyautey, D. Medeiros, N.Neumann, N. Ruecker, E. Topp, and D. R. Lapen. 2009. Seasonal relation-ships among indicator bacteria, pathogenic bacteria, Cryptosporidium oo-cysts, Giardia cysts, and hydrological indices for surface waters within anagricultural landscape. Water Res. 43:2209–2223.
62. Yates, M. V. 2007. Classical indicators in the 21st century—far and beyondthe coliform. Water Environ. Res. 79:279–286.
1496 LYAUTEY ET AL. APPL. ENVIRON. MICROBIOL.
Related Documents