Dispelling the myth of “smart drugs”: Cannabis and alcohol use problems predict nonmedical use of prescription stimulants for studying Amelia M. Arria a, b, ⁎, Holly C. Wilcox c , Kimberly M. Caldeira a , Kathryn B. Vincent a , Laura M. Garnier-Dykstra a , Kevin E. O'Grady d a Center on Young Adult Health and Development, University of Maryland School of Public Health, Department of Family Science, 1142 School of Public Health Building, College Park, MD 20742, USA b Parents Translational Research Center, Treatment Research Institute, 600 Public Ledger Building; 150 S. Independence Mall West; Philadelphia, PA 19106, USA c Department of Psychiatry and Behavioral Sciences, Johns Hopkins University, 550 N. Broadway Room 206A, Baltimore, MD 21205, USA d Department of Psychology, University of Maryland, College Park, 3147 Biology/Psychology Building, College Park, MD 20742, USA HIGHLIGHTS ► Nonmedical prescription stimulant use (NPS) for studying among 984 college students. ► Four-year trajectories of cannabis/alcohol use problems, skipping class, GPA. ► Increasing cannabis use problems predicted declining GPA via skipping class. ► Indirect path: cannabis trajectory to skipping trajectory to GPA trajectory to NPS. ► Results were similar for separate models on alcohol and cannabis use problems. abstract article info Keywords: Academic Performance Alcohol Cannabis College students Nonmedical use of prescription stimulants This study tested the hypothesis that college students' substance use problems would predict increases in skip- ping classes and declining academic performance, and that nonmedical use of prescription stimulants (NPS) for studying would occur in association with this decline. A cohort of 984 students in the College Life Study at a large public university in the US participated in a longitudinal prospective study. Interviewers assessed NPS; Diagnostic and Statistical Manual of Mental Disorders, Fourth Edition (DSM-IV) cannabis and alcohol use disorders; and fre- quency of skipping class. Semester grade point average (GPA) was obtained from the university. Control vari- ables were race, sex, family income, high school GPA, and self-reported attention deficit hyperactivity disorder diagnosis. Longitudinal growth curve modeling of four annual data waves estimated the associations among the rates of change of cannabis use disorder, percentage of classes skipped, and semester GPA. The associations between these trajectories and NPS for studying were then evaluated. A second structural model substituted alcohol use disorder for cannabis use disorder. More than one-third (38%) reported NPS for studying at least once by Year 4. Increases in skipping class were associated with both alcohol and cannabis use disorder, which were associated with declining GPA. The hypothesized relationships between these trajectories and NPS for studying were confirmed. These longitudinal findings suggest that escalation of substance use problems during college is related to increases in skipping class and to declining academic performance. NPS for studying is asso- ciated with academic difficulties. Although additional research is needed to investigate causal pathways, these results suggest that nonmedical users of prescription stimulants could benefit from a comprehensive drug and alcohol assessment to possibly mitigate future academic declines. © 2012 Elsevier Ltd. All rights reserved. 1. Introduction Nonmedical use of prescription stimulants (NPS), defined as use without one's own legitimate prescription or using the drug in a way that is inconsistent with a doctor's orders, is quite prevalent among college students (Arria, Caldeira, O'Grady, Vincent, Johnson, et al., 2008; Arria & DuPont, 2010; Arria, O'Grady, Caldeira, Vincent, & Wish, 2008; Carroll, McLaughlin, & Blake, 2006; DeSantis, Webb, & Noar, 2008; Garnier-Dykstra, Caldeira, Vincent, O'Grady, & Arria, 2012; McCabe, West, & Wechsler, 2007), and is now the second most Addictive Behaviors 38 (2013) 1643–1650 Abbreviations: NPS, nonmedical use of prescription stimulants; GPA, grade point aver- age; ADHD, attention deficit hyperactivity disorder; Y 1 , Year 1; IRB, Institutional Review Board; NSDUH, National Survey on Drug Use and Health; DSM-IV, Diagnostic and Statisti- cal Manual of Mental Disorders, Fourth Edition; LVGCM, latent variable growth curve modeling; CFI, Comparative Fit Index; RMSEA, Root Mean Square Error of Approximation. ⁎ Corresponding author at: Center on Young Adult Health and Development, 1142 School of Public Health Building, College Park, MD 20742, USA. Tel.: +1 301 405 9795; fax: +1 301 314 1013. E-mail addresses: [email protected] (A.M. Arria), [email protected] (H.C. Wilcox), [email protected] (K.M. Caldeira), [email protected] (K.B. Vincent), [email protected] (L.M. Garnier-Dykstra), [email protected] (K.E. O'Grady). 0306-4603/$ – see front matter © 2012 Elsevier Ltd. All rights reserved. http://dx.doi.org/10.1016/j.addbeh.2012.10.002 Contents lists available at SciVerse ScienceDirect Addictive Behaviors

Welcome message from author
This document is posted to help you gain knowledge. Please leave a comment to let me know what you think about it! Share it to your friends and learn new things together.
Transcript
Addictive Behaviors 38 (2013) 1643–1650
Contents lists available at SciVerse ScienceDirect
Addictive Behaviors
Dispelling the myth of “smart drugs”: Cannabis and alcohol use problems predictnonmedical use of prescription stimulants for studying
Amelia M. Arria a,b,⁎, Holly C. Wilcox c, Kimberly M. Caldeira a, Kathryn B. Vincent a,Laura M. Garnier-Dykstra a, Kevin E. O'Grady d
a Center on Young Adult Health andDevelopment, University ofMaryland School of Public Health, Department of Family Science, 1142 School of Public Health Building, College Park, MD20742, USAb Parents Translational Research Center, Treatment Research Institute, 600 Public Ledger Building; 150 S. Independence Mall West; Philadelphia, PA 19106, USAc Department of Psychiatry and Behavioral Sciences, Johns Hopkins University, 550 N. Broadway Room 206A, Baltimore, MD 21205, USAd Department of Psychology, University of Maryland, College Park, 3147 Biology/Psychology Building, College Park, MD 20742, USA
H I G H L I G H T S
► Nonmedical prescription stimulant use (NPS) for studying among 984 college students.► Four-year trajectories of cannabis/alcohol use problems, skipping class, GPA.► Increasing cannabis use problems predicted declining GPA via skipping class.► Indirect path: cannabis trajectory to skipping trajectory to GPA trajectory to NPS.► Results were similar for separate models on alcohol and cannabis use problems.
Abbreviations: NPS, nonmedical use of prescription stiage; ADHD, attention deficit hyperactivity disorder; Y1, YBoard; NSDUH, National Survey on Drug Use and Health;cal Manual of Mental Disorders, Fourth Edition; LVGCMmodeling; CFI, Comparative Fit Index; RMSEA, Root Mean⁎ Corresponding author at: Center on Young Adult H
School of Public Health Building, College Park, MD 2074fax: +1 301 314 1013.
E-mail addresses: [email protected] (A.M. Arria), [email protected] (K.M. Caldeira), [email protected] ([email protected] (L.M. Garnier-Dykstra), ogrady@umd
0306-4603/$ – see front matter © 2012 Elsevier Ltd. Allhttp://dx.doi.org/10.1016/j.addbeh.2012.10.002
a b s t r a c t
a r t i c l e i n f oKeywords:
Academic PerformanceAlcoholCannabisCollege studentsNonmedical use of prescription stimulantsThis study tested the hypothesis that college students' substance use problems would predict increases in skip-ping classes and declining academic performance, and that nonmedical use of prescription stimulants (NPS) forstudyingwould occur in associationwith this decline. A cohort of 984 students in the College Life Study at a largepublic university in theUSparticipated in a longitudinal prospective study. Interviewers assessedNPS;Diagnosticand Statistical Manual of Mental Disorders, Fourth Edition (DSM-IV) cannabis and alcohol use disorders; and fre-quency of skipping class. Semester grade point average (GPA) was obtained from the university. Control vari-ables were race, sex, family income, high school GPA, and self-reported attention deficit hyperactivity disorderdiagnosis. Longitudinal growth curve modeling of four annual data waves estimated the associations amongthe rates of change of cannabis use disorder, percentage of classes skipped, and semester GPA. The associationsbetween these trajectories and NPS for studying were then evaluated. A second structural model substitutedalcohol use disorder for cannabis use disorder. More than one-third (38%) reported NPS for studying at leastonce by Year 4. Increases in skipping class were associated with both alcohol and cannabis use disorder, whichwere associated with declining GPA. The hypothesized relationships between these trajectories and NPS forstudying were confirmed. These longitudinal findings suggest that escalation of substance use problems duringcollege is related to increases in skipping class and to declining academic performance. NPS for studying is asso-ciated with academic difficulties. Although additional research is needed to investigate causal pathways, theseresults suggest that nonmedical users of prescription stimulants could benefit from a comprehensive drug andalcohol assessment to possibly mitigate future academic declines.
© 2012 Elsevier Ltd. All rights reserved.
mulants; GPA, grade point aver-ear 1; IRB, Institutional ReviewDSM-IV, Diagnostic and Statisti-, latent variable growth curveSquare Error of Approximation.ealth and Development, 11422, USA. Tel.: +1 301 405 9795;
[email protected] (H.C. Wilcox),K.B. Vincent),.edu (K.E. O'Grady).
rights reserved.
1. Introduction
Nonmedical use of prescription stimulants (NPS), defined as usewithout one's own legitimate prescription or using the drug in away that is inconsistent with a doctor's orders, is quite prevalentamong college students (Arria, Caldeira, O'Grady, Vincent, Johnson,et al., 2008; Arria & DuPont, 2010; Arria, O'Grady, Caldeira, Vincent,& Wish, 2008; Carroll, McLaughlin, & Blake, 2006; DeSantis, Webb,& Noar, 2008; Garnier-Dykstra, Caldeira, Vincent, O'Grady, & Arria,2012; McCabe, West, & Wechsler, 2007), and is now the second most
1644 A.M. Arria et al. / Addictive Behaviors 38 (2013) 1643–1650
common form of illicit drug use after cannabis (Johnston, O'Malley,Bachman, & Schulenberg, 2012). An earlier report by our group ob-served that more college students initiated NPS between their fresh-man and sophomore year than any other drug (Arria, Caldeira,O'Grady, Vincent, Fitzelle, et al., 2008). Lifetime prevalence estimatesof NPS vary, but are as high as 35% at some US universities (DeSantiset al., 2008; Low & Gendaszek, 2002).
While several cross-sectional research studies have found thatnonmedical users of prescription stimulants tend to have lowergrade point averages (GPA) than non-users (Clegg-Kraynok, McBean,& Montgomery-Downs, 2011; McCabe, Knight, Teter, & Wechsler,2005; McCabe, Teter, & Boyd, 2006), media reports (Carey, 2008;Talbot, 2009) and some scientific commentaries (Greely et al., 2008;Maher, 2008) have debated the potential benefits of prescription stim-ulant use for individuals without attention deficit hyperactivity disor-der (ADHD) to improve concentration and academic performance.Although these purported benefits have yet to be substantiated scien-tifically, research with college student samples has shown that themost frequently reported reason for NPS is to purportedly improveconcentration so as to enhance academic performance (Clegg-Kraynoket al., 2011; DeSantis, Noar & Webb, 2009, 2010; DeSantis et al., 2008;Garnier-Dykstra et al., 2012; Low & Gendaszek, 2002; Rabiner et al.,2009; Teter, McCabe, Cranford, Boyd, & Guthrie, 2005; Teter, McCabe,LaGrange, Cranford, & Boyd, 2006; White, Becker-Blease, & Grace-Bishop, 2006). Yet the academicmotives for NPS contrast with a patternof other associated behaviors that would appear to impede nonmedicalusers' of prescription stimulants academic performance, such as spend-ing less time studying, skipping more classes, and spending more timesocializing than their counterparts (Arria, O'Grady, Caldeira, Vincent, &Wish, 2008).
Earlier cross-sectional studies have also consistently shown thatnonmedical users of prescription stimulants have a history of heavyalcohol use and illicit drug involvement, particularly cannabis use(Arria, Caldeira, O'Grady, Vincent, Johnson, et al., 2008; DeSantis etal., 2009; McCabe et al., 2005; Teter, McCabe, Boyd, & Guthrie, 2003).McCabe et al. (2005) found that students who engaged in NPS weremore than ten times more likely to use cannabis during the past yearthan non-users. Other correlates of NPS include demographic char-acteristics, with minorities being at lower risk than whites (DuPont,Coleman, Bucher, & Wilford, 2008; McCabe et al., 2005, 2006; Teteret al., 2006). Although men are more likely to engage in NPS, thereare no significant sex differences in the motivations for use (Low &Gendaszek, 2002; Teter et al., 2005). Fraternity/sorority membershipand high levels of parental education are also significantly associatedwith NPS (McCabe et al., 2005).
The aim of the current study was to extend previous cross-sectional findings by using latent growth curve modeling to explicatethe longitudinal relationships between cannabis/alcohol use disorder,skipping class, and academic performance. Furthermore, using thisstatistical modeling approach, we attempted to investigate the rela-tionship between the various rates of change over time in cannabis/alcohol use disorder, skipping class, and GPA and NPS. We tested thefollowing hypotheses: a) increases in cannabis use disorder predict in-creases in skipping class, which in turn predict decreases in academicperformance as measured by a declining GPA; and b) NPS for studypurposes occurs in association with these cannabis-related decreasesin academic performance. Given that students who engage in NPSare likely to have alcohol-related problems, we also evaluated parallelmodels substituting alcohol use disorder for cannabis use disorder.
2. Methods
2.1. Study design
This study uses data from the College Life Study, a longitudinal pro-spective study of college students (Arria, Caldeira, O'Grady, Vincent,
Fitzelle, et al., 2008; Vincent et al., 2012). Sample selection took placein two stages. First, a screening surveywas administered to 3401 incom-ing first-time, first-year students ages 17 to 19, during new-student ori-entation in 2004 at one large, public university in themid-Atlantic regionof the US. The first stage response ratewas 89%. Next, a stratified randomsample of screener participantswas selected to participate in a longitudi-nal study, beginning with a two-hour baseline interview administeredduring their first year of college by a trained interviewer (Year 1: Y1).Purposive sampling strategies were employed to oversample studentswho had used an illicit drug or nonmedically used a prescription drugat least once prior to study entry. The second-stage response rate was87% and yielded a sample size of 1253, which was representative of thefirst-year class with respect to race, sex, and socioeconomic status(Arria, Caldeira, O'Grady, Vincent, Fitzelle, et al., 2008). Similar inter-views were administered annually. Participants received $5 and $50 forparticipating in the screener and each annual interview, respectively.The study was approved by the university IRB. Informed consent wasobtained for participation in all data collection waves and a federal Cer-tificate of Confidentiality was acquired.
2.2. Participants
Out of the original 1253 participants, the present analytic sampleconsisted of the 984 (78.5%) individuals who were enrolled at thehome university for at least one semester during all four years, com-pleted at least one follow-up assessment (Y2 through Y4), and hadnon-missing data on all independent variables in the structural equa-tion model (see Section 2.4.). The remaining 269 individuals wereexcluded as follows: 185 with gaps in enrollment at the home univer-sity, 35 with no follow-up assessments, and 49 missing data on one ormore independent variables. The inclusion sample was not signifi-cantly different from the excluded subset with respect to sex or familyincome, but was slightly younger and overly representative of whites.
2.3. Measures
2.3.1. NPS for studyingAnnually, from Y1 through Y4, students were asked about their
past-year NPS via items adapted from the National Survey on DrugUse and Health (NSDUH; Substance Abuse & Mental Health ServicesAdministration, 2003). Participants were given show cards withdrug names and color photos of various pills, including Ritalin®,Adderall®, Adderall XR®, Concerta®, and others. Methamphetamineand amphetamine use were excluded from this series of questionson NPS, but were assessed with separate questions. Interviewersexplained that NPS involved taking any prescription stimulant “thatwas not prescribed for you or that you took only for the experienceor feeling they caused,” excluding any over-the-counter medications.
Participants were asked the reasons they had for using each pre-scription stimulant, and interviewers later recoded the verbatim re-sponses into categories, one of which was to “improve focus/study/work.” We operationalized our dichotomous dependent variable asany NPS to improve focus/study/work at any point from Y1 throughY4. Notably, NPS motives were not mutually exclusive; 24% of individ-uals in our “NPS for studying” group also reported motives related topartying or getting high. Because our hypotheses concerned academicdifficulties that might be related to NPS, it was important that ouroutcome variable reflect use for study purposes. The small minorityof individuals who engaged in NPS only for recreational reasons(i.e., to party or get high, but not for studying) were coded as “0” onthe outcome variable. Henceforth, we use the term “NPS” to denoteNPS for studying (regardless of other possible motives).
2.3.2. Cannabis use disorderAnnually, students who used cannabis five or more times during
the past year were assessed for cannabis use disorder, using questions
1645A.M. Arria et al. / Addictive Behaviors 38 (2013) 1643–1650
adapted from the NSDUH (Substance Abuse & Mental Health ServicesAdministration, 2003). Items in this series correspond to the Diagnos-tic and Statistical Manual of Mental Disorders, Fourth Edition (DSM-IV)criteria (American Psychiatric Association, 1994) for past-year abuseand dependence. Dependence cases were defined by the endorsementof three or more of the following six criteria as a result of their canna-bis use: tolerance, using more than intended, being unable to cutdown, spending a lot of time obtaining or using, giving up importantactivities, or continuing to use despite problemswith physical ormen-tal health. Abuse cases were defined as non-dependent individualswho endorsed one or more of the following four problems resultingfrom their cannabis use: having serious problems at home, work, orschool; regularly putting oneself in physical danger; repeatedly get-ting into trouble with the law; or continuing use despite problemswith family or friends. A five-level “cannabis group” variable at Y1
and each of the subsequent 3 years was coded as follows: −1 = nopast-year use; 0 = presumptive non-case (used b5 times in pastyear); 1 = use without any endorsed problems; 2 = diagnostic or-phans (use with problems, but not enough to meet criteria for abuseor dependence); 3 = abuse; 4 = dependence.
2.3.3. Skipping classAnnually, students were asked about the number of class sessions
they were scheduled to take per week and the number of class ses-sions they typically skipped per week. To standardize the measureof skipping behavior across course loads of varying intensity, the per-cent of classes skipped was computed [(number of sessions skipped/number of sessions scheduled)×100].
2.3.4. GPAGPA data for each of eight semesters was culled from university
administrative databases.
2.3.5. Other covariatesThe following variables were used as covariates because of their
potential association with GPA. Sex was coded by the interviewer atY1. Race was self-reported and later dichotomized as white versusnon-white. High school GPA was obtained from university data, asallowed by informed consent. Family income was approximatedfrom the average adjusted gross income of their home ZIP code(MelissaDATA, 2003). Alcohol use disorder (abuse or dependence)was assessed annually via methods similar to those described abovefor cannabis and coded as a five-level “alcohol group” variable foreach year. Self-reported ADHD diagnosis was a dichotomous variablebased on responses to Y4 interview questions asking whether theywere ever diagnosed with ADHD or took any prescribed medicationsfor ADHD. No information was gathered regarding how the diagnosiswas made or who made it.
2.4. Data analysis
A latent variable growth curve modeling (LVGCM; Duncan,Duncan, & Strycker, 2006) approach was taken to examine changesin substance use, skipping class, and GPA and their relationships tothe dichotomous outcome variable NPS. LVGCM can be seen as a spe-cial form of structural equation modeling, in that it estimates changesin unmeasured or latent variables, in this case, growth trajectories—orrates of change over time—in a variable or variables that have beenassessed on multiple occasions. Goals of LVGCM include estimationof the growth trajectory of the latent variable or variables, and deter-mination of the relationships between the growth trajectories in twoor more of the latent variables, as well as the ability of the growthtrajectories to predict outcomes. An advantage of LVGCM is that thisstatistical method does not require complete data for all repeatedmeasures to determine unbiased estimates of the model parameters.Nevertheless, an overwhelming majority of our sample (92%) had
complete data for all four years. In the present study, the growth tra-jectories of three variables (substance use, skipping class, and GPA)were examined with the goal of determining whether the rate ofchange in substance use predicted the rate of change in skippingclass, and whether, in turn, the rate of change in skipping class pre-dicted the rate of change in GPA. Finally, the ability of these threerates of change to directly explain NPS was examined.
Latent growth models (Muthén, 2008) were estimated usingMplus 5.0 (Muthén & Muthén, 2007). First, growth models were de-veloped to find the best-fitting individual longitudinal growthmodelsfor cannabis group, skipping class, and GPA, with the intercept termspecified as the Y1 observation. The slope included all available mea-surement points: four for cannabis group (annual), four for skippingclass (annual), and eight for GPA (each semester).
Three indicators of model fit were evaluated: the χ2 goodness-of-fittest, the Comparative Fit Index (CFI; Bentler, 1990), and the Root MeanSquare Error of Approximation (RMSEA; Browne & Cudeck, 1993). Al-though non-significant χ2 values are typically considered indicative ofgood model fit, χ2 values are typically influenced by large samplesizes; thus, other indices should be considered (Kline, 2006). Generally,a value of 0.90 or greater on the CFI (Bentler, 1990) and a RMSEA valueof b0.05 indicates good fit (0.05-0.08 acceptable fit and >0.10 poor fit).
Second, the path model that included the three individual growthtrajectories and NPS was developed. Third, the path model in the pre-vious step was run adjusting all paths for race, sex, high school GPA,family income, self-reported ADHD diagnosis, and the Y1 alcoholgroup variable. Paths were included from each intercept to their re-spective slopes for cannabis group, skipping class, and GPA. Fourth,the path model with covariates was pruned by dropping paths thatwere not statistically significant by conventional standards (pb0.05).Hypothesized predictor variables were retained in the model if theywere significant at pb0.05.
Finally, the model was refit after substituting the alcohol groupvariables for the cannabis group variables, holding constant Y1 canna-bis group and the same set of control variables as above.
3. Results
3.1. Sample characteristics
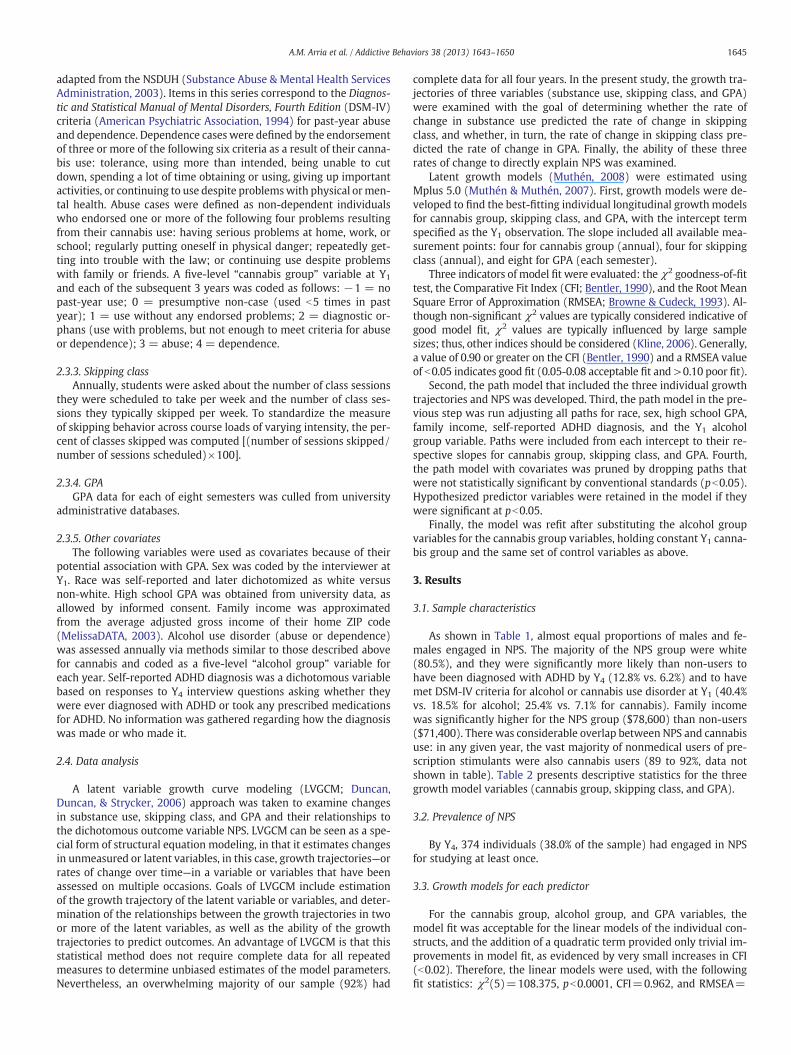
As shown in Table 1, almost equal proportions of males and fe-males engaged in NPS. The majority of the NPS group were white(80.5%), and they were significantly more likely than non-users tohave been diagnosed with ADHD by Y4 (12.8% vs. 6.2%) and to havemet DSM-IV criteria for alcohol or cannabis use disorder at Y1 (40.4%vs. 18.5% for alcohol; 25.4% vs. 7.1% for cannabis). Family incomewas significantly higher for the NPS group ($78,600) than non-users($71,400). There was considerable overlap between NPS and cannabisuse: in any given year, the vast majority of nonmedical users of pre-scription stimulants were also cannabis users (89 to 92%, data notshown in table). Table 2 presents descriptive statistics for the threegrowth model variables (cannabis group, skipping class, and GPA).
3.2. Prevalence of NPS
By Y4, 374 individuals (38.0% of the sample) had engaged in NPSfor studying at least once.
3.3. Growth models for each predictor
For the cannabis group, alcohol group, and GPA variables, themodel fit was acceptable for the linear models of the individual con-structs, and the addition of a quadratic term provided only trivial im-provements in model fit, as evidenced by very small increases in CFI(b0.02). Therefore, the linear models were used, with the followingfit statistics: χ2(5)=108.375, pb0.0001, CFI=0.962, and RMSEA=
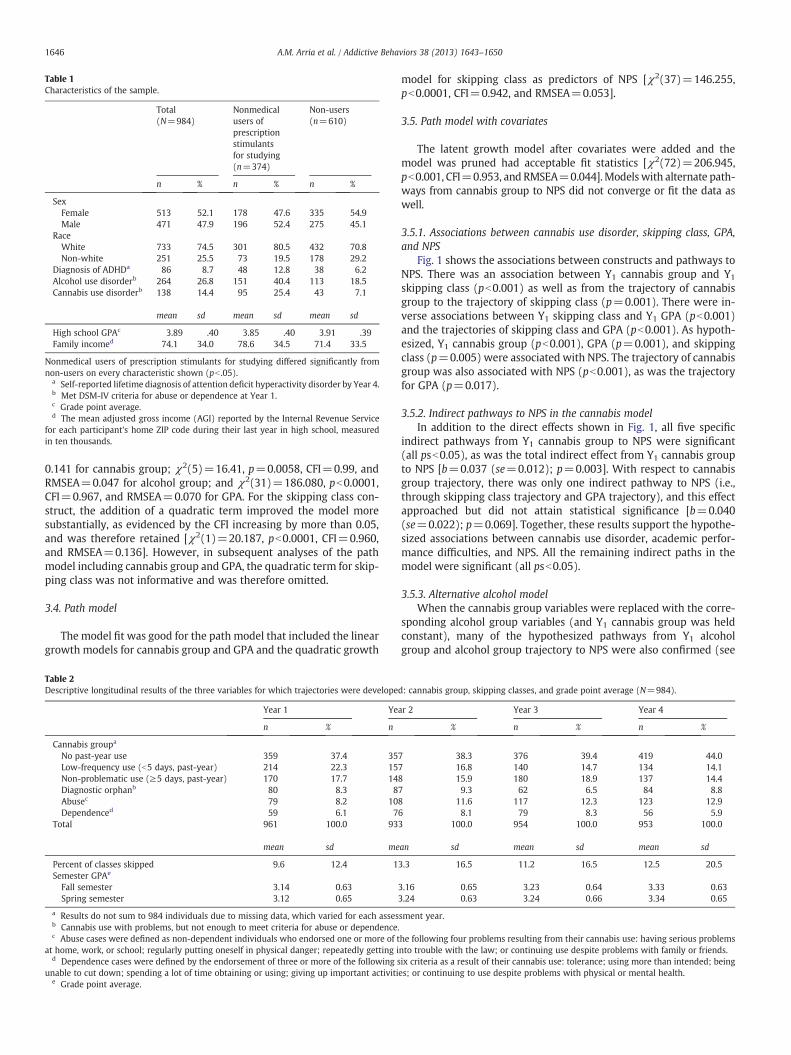
Table 1Characteristics of the sample.
Total(N=984)
Nonmedicalusers ofprescriptionstimulantsfor studying(n=374)
Non-users(n=610)
n % n % n %
SexFemale 513 52.1 178 47.6 335 54.9Male 471 47.9 196 52.4 275 45.1
RaceWhite 733 74.5 301 80.5 432 70.8Non-white 251 25.5 73 19.5 178 29.2
Diagnosis of ADHDa 86 8.7 48 12.8 38 6.2Alcohol use disorderb 264 26.8 151 40.4 113 18.5Cannabis use disorderb 138 14.4 95 25.4 43 7.1
mean sd mean sd mean sd
High school GPAc 3.89 .40 3.85 .40 3.91 .39Family incomed 74.1 34.0 78.6 34.5 71.4 33.5
Nonmedical users of prescription stimulants for studying differed significantly fromnon-users on every characteristic shown (pb .05).
a Self-reported lifetime diagnosis of attention deficit hyperactivity disorder by Year 4.b Met DSM-IV criteria for abuse or dependence at Year 1.c Grade point average.d The mean adjusted gross income (AGI) reported by the Internal Revenue Service
for each participant's home ZIP code during their last year in high school, measuredin ten thousands.
1646 A.M. Arria et al. / Addictive Behaviors 38 (2013) 1643–1650
0.141 for cannabis group; χ2(5)=16.41, p=0.0058, CFI=0.99, andRMSEA=0.047 for alcohol group; and χ2(31)=186.080, pb0.0001,CFI=0.967, and RMSEA=0.070 for GPA. For the skipping class con-struct, the addition of a quadratic term improved the model moresubstantially, as evidenced by the CFI increasing by more than 0.05,and was therefore retained [χ2(1)=20.187, pb0.0001, CFI=0.960,and RMSEA=0.136]. However, in subsequent analyses of the pathmodel including cannabis group and GPA, the quadratic term for skip-ping class was not informative and was therefore omitted.
3.4. Path model
The model fit was good for the path model that included the lineargrowth models for cannabis group and GPA and the quadratic growth
Table 2Descriptive longitudinal results of the three variables for which trajectories were develope
Year 1 Ye
n % n
Cannabis groupa
No past-year use 359 37.4 35Low-frequency use (b5 days, past-year) 214 22.3 15Non-problematic use (≥5 days, past-year) 170 17.7 14Diagnostic orphanb 80 8.3 8Abusec 79 8.2 10Dependenced 59 6.1 7
Total 961 100.0 93
mean sd me
Percent of classes skipped 9.6 12.4 1Semester GPAe
Fall semester 3.14 0.63Spring semester 3.12 0.65
a Results do not sum to 984 individuals due to missing data, which varied for each assesb Cannabis use with problems, but not enough to meet criteria for abuse or dependence.c Abuse cases were defined as non-dependent individuals who endorsed one or more of t
at home, work, or school; regularly putting oneself in physical danger; repeatedly getting id Dependence cases were defined by the endorsement of three or more of the following s
unable to cut down; spending a lot of time obtaining or using; giving up important activitie Grade point average.
model for skipping class as predictors of NPS [χ2(37)=146.255,pb0.0001, CFI=0.942, and RMSEA=0.053].
3.5. Path model with covariates
The latent growth model after covariates were added and themodel was pruned had acceptable fit statistics [χ2(72)=206.945,pb0.001, CFI=0.953, and RMSEA=0.044].Modelswith alternate path-ways from cannabis group to NPS did not converge or fit the data aswell.
3.5.1. Associations between cannabis use disorder, skipping class, GPA,and NPS
Fig. 1 shows the associations between constructs and pathways toNPS. There was an association between Y1 cannabis group and Y1
skipping class (pb0.001) as well as from the trajectory of cannabisgroup to the trajectory of skipping class (p=0.001). There were in-verse associations between Y1 skipping class and Y1 GPA (pb0.001)and the trajectories of skipping class and GPA (pb0.001). As hypoth-esized, Y1 cannabis group (pb0.001), GPA (p=0.001), and skippingclass (p=0.005) were associated with NPS. The trajectory of cannabisgroup was also associated with NPS (pb0.001), as was the trajectoryfor GPA (p=0.017).
3.5.2. Indirect pathways to NPS in the cannabis modelIn addition to the direct effects shown in Fig. 1, all five specific
indirect pathways from Y1 cannabis group to NPS were significant(all psb0.05), as was the total indirect effect from Y1 cannabis groupto NPS [b=0.037 (se=0.012); p=0.003]. With respect to cannabisgroup trajectory, there was only one indirect pathway to NPS (i.e.,through skipping class trajectory and GPA trajectory), and this effectapproached but did not attain statistical significance [b=0.040(se=0.022); p=0.069]. Together, these results support the hypothe-sized associations between cannabis use disorder, academic perfor-mance difficulties, and NPS. All the remaining indirect paths in themodel were significant (all psb0.05).
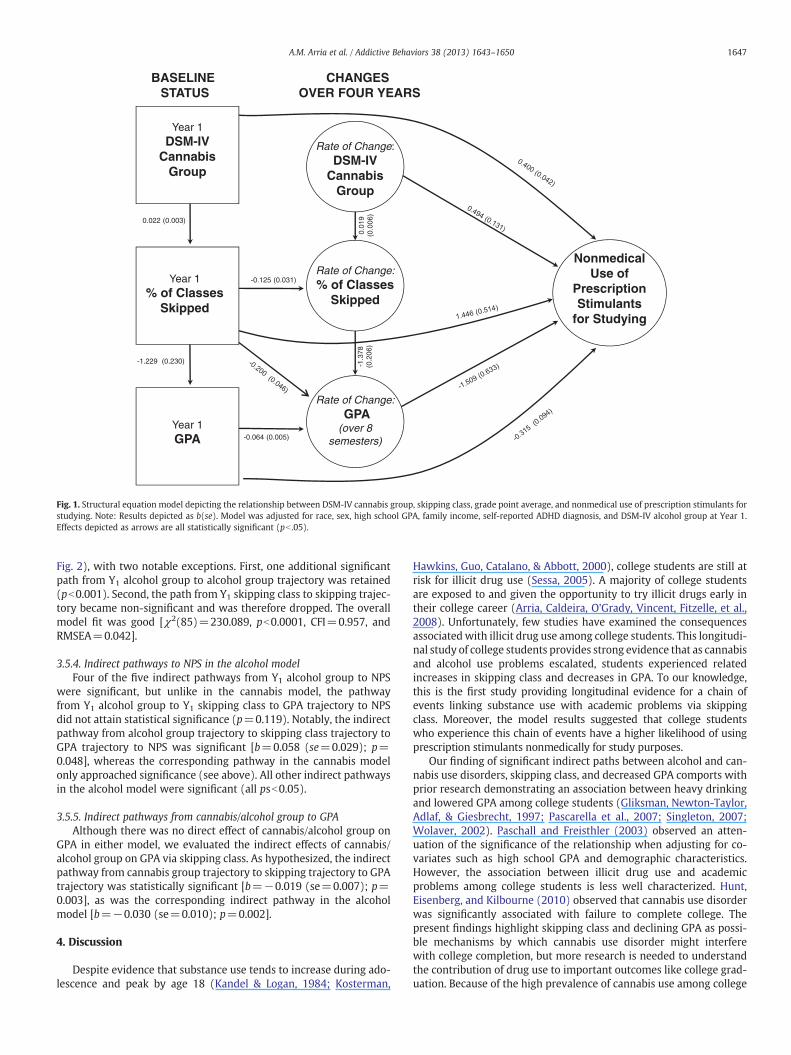
3.5.3. Alternative alcohol modelWhen the cannabis group variables were replaced with the corre-
sponding alcohol group variables (and Y1 cannabis group was heldconstant), many of the hypothesized pathways from Y1 alcoholgroup and alcohol group trajectory to NPS were also confirmed (see
d: cannabis group, skipping classes, and grade point average (N=984).
ar 2 Year 3 Year 4
% n % n %
7 38.3 376 39.4 419 44.07 16.8 140 14.7 134 14.18 15.9 180 18.9 137 14.47 9.3 62 6.5 84 8.88 11.6 117 12.3 123 12.96 8.1 79 8.3 56 5.93 100.0 954 100.0 953 100.0
an sd mean sd mean sd
3.3 16.5 11.2 16.5 12.5 20.5
3.16 0.65 3.23 0.64 3.33 0.633.24 0.63 3.24 0.66 3.34 0.65
sment year.
he following four problems resulting from their cannabis use: having serious problemsnto trouble with the law; or continuing use despite problems with family or friends.ix criteria as a result of their cannabis use: tolerance; using more than intended; beinges; or continuing to use despite problems with physical or mental health.
Year 1DSM-IV
CannabisGroup
Year 1GPA
Year 1% of Classes
Skipped
Rate of Change:DSM-IV
CannabisGroup
Rate of Change:GPA
(over 8 semesters)
Rate of Change:% of Classes
Skipped
NonmedicalUse of
PrescriptionStimulants
for Studying
0.022 (0.003)
0.01
9(0
.006
)-1.229 (0.230) -1
.378
(0.2
06)
-0.064 (0.005)
BASELINESTATUS
CHANGESOVER FOUR YEARS
-0.125 (0.031)
Fig. 1. Structural equation model depicting the relationship between DSM-IV cannabis group, skipping class, grade point average, and nonmedical use of prescription stimulants forstudying. Note: Results depicted as b(se). Model was adjusted for race, sex, high school GPA, family income, self-reported ADHD diagnosis, and DSM-IV alcohol group at Year 1.Effects depicted as arrows are all statistically significant (pb .05).
1647A.M. Arria et al. / Addictive Behaviors 38 (2013) 1643–1650
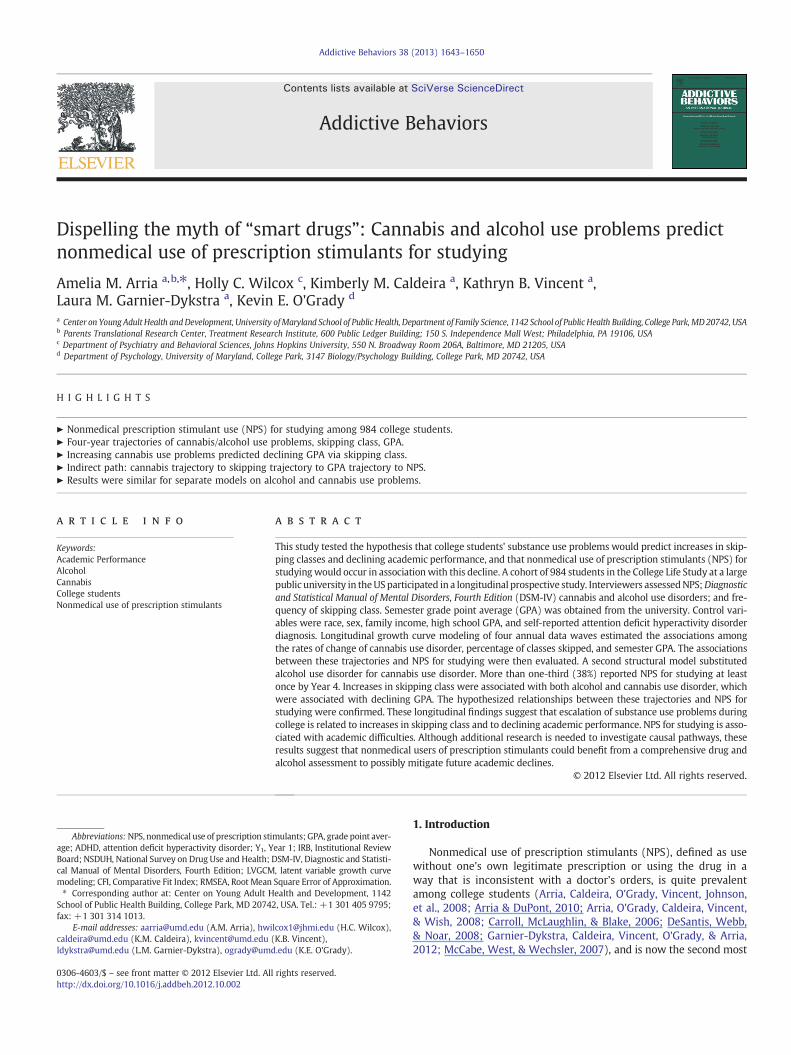
Fig. 2), with two notable exceptions. First, one additional significantpath from Y1 alcohol group to alcohol group trajectory was retained(pb0.001). Second, the path from Y1 skipping class to skipping trajec-tory became non-significant and was therefore dropped. The overallmodel fit was good [χ2(85)=230.089, pb0.0001, CFI=0.957, andRMSEA=0.042].
3.5.4. Indirect pathways to NPS in the alcohol modelFour of the five indirect pathways from Y1 alcohol group to NPS
were significant, but unlike in the cannabis model, the pathwayfrom Y1 alcohol group to Y1 skipping class to GPA trajectory to NPSdid not attain statistical significance (p=0.119). Notably, the indirectpathway from alcohol group trajectory to skipping class trajectory toGPA trajectory to NPS was significant [b=0.058 (se=0.029); p=0.048], whereas the corresponding pathway in the cannabis modelonly approached significance (see above). All other indirect pathwaysin the alcohol model were significant (all psb0.05).
3.5.5. Indirect pathways from cannabis/alcohol group to GPAAlthough there was no direct effect of cannabis/alcohol group on
GPA in either model, we evaluated the indirect effects of cannabis/alcohol group on GPA via skipping class. As hypothesized, the indirectpathway from cannabis group trajectory to skipping trajectory to GPAtrajectory was statistically significant [b=−0.019 (se=0.007); p=0.003], as was the corresponding indirect pathway in the alcoholmodel [b=−0.030 (se=0.010); p=0.002].
4. Discussion
Despite evidence that substance use tends to increase during ado-lescence and peak by age 18 (Kandel & Logan, 1984; Kosterman,
Hawkins, Guo, Catalano, & Abbott, 2000), college students are still atrisk for illicit drug use (Sessa, 2005). A majority of college studentsare exposed to and given the opportunity to try illicit drugs early intheir college career (Arria, Caldeira, O'Grady, Vincent, Fitzelle, et al.,2008). Unfortunately, few studies have examined the consequencesassociatedwith illicit drug use among college students. This longitudi-nal study of college students provides strong evidence that as cannabisand alcohol use problems escalated, students experienced relatedincreases in skipping class and decreases in GPA. To our knowledge,this is the first study providing longitudinal evidence for a chain ofevents linking substance use with academic problems via skippingclass. Moreover, the model results suggested that college studentswho experience this chain of events have a higher likelihood of usingprescription stimulants nonmedically for study purposes.
Our finding of significant indirect paths between alcohol and can-nabis use disorders, skipping class, and decreased GPA comports withprior research demonstrating an association between heavy drinkingand lowered GPA among college students (Gliksman, Newton-Taylor,Adlaf, & Giesbrecht, 1997; Pascarella et al., 2007; Singleton, 2007;Wolaver, 2002). Paschall and Freisthler (2003) observed an atten-uation of the significance of the relationship when adjusting for co-variates such as high school GPA and demographic characteristics.However, the association between illicit drug use and academicproblems among college students is less well characterized. Hunt,Eisenberg, and Kilbourne (2010) observed that cannabis use disorderwas significantly associated with failure to complete college. Thepresent findings highlight skipping class and declining GPA as possi-ble mechanisms by which cannabis use disorder might interferewith college completion, but more research is needed to understandthe contribution of drug use to important outcomes like college grad-uation. Because of the high prevalence of cannabis use among college

Year 1DSM-IVAlcoholGroup
Year 1GPA
Year 1% of Classes
Skipped
Rate of Change:DSM-IVAlcoholGroup
Rate of Change:GPA
(over 8 semesters)
Rate of Change:% of Classes
Skipped
NonmedicalUse of
PrescriptionStimulants
for Studying
0.024 (0.004)
0.01
8(0
.006
)-1.583 (0.260) -1
.647
(0.2
54)
-0.064 (0.005)
BASELINESTATUS
CHANGESOVER FOUR YEARS
-0.158 (0.013)
Fig. 2. Structural equation model depicting the relationship between DSM-IV alcohol group, skipping class, grade point average, and nonmedical use of prescription stimulants forstudying. Note: Results depicted as b(se). Model was adjusted for race, sex, high school GPA, family income, self-reported ADHD diagnosis, and DSM-IV cannabis group at Year 1.Effects depicted as solid arrows are all statistically significant (pb .05).
1648 A.M. Arria et al. / Addictive Behaviors 38 (2013) 1643–1650
students (Johnston, O'Malley, Bachman, & Schulenberg, 2010) and itsknown association with short-term memory deficits and concentra-tion difficulties (Ashton, 2001; Tennant & Groesbeck, 1972), more re-search is warranted on the possible association between cannabis andacademic outcomes, including college GPA and retention.
Several limitations of the study should be noted. First, althoughacademic data were derived from administrative datasets, our find-ings rely heavily on self-reported data on illicit drug use, and whilewe have no indication that underreporting occurred, the possibilityof social desirability bias cannot be ruled out. Second, because all par-ticipants were sampled from one university, results may not be gen-eralizable to institutions located in other regions of the country orsmaller private colleges. Third, our models did not take into accountother possible constructs that might influence GPA, such as academicmajor or course difficulty level. Fourth, the variable for skipping classwas operationalized as “percentage of classes skipped” and was highlyskewedwithmany zeros. Fifth, we investigated NPS for studying some-time during college as a single outcome variable. Our data should not beinterpreted to provide causal evidence of a relationship between declin-ing academic performance and NPS. Future studies should utilize largersamples to understand the possible causal pathways and disentanglethe temporal association between academic performance difficultiesand NPS. Because NPS was typically infrequent in this sample (Arria,Caldeira, O'Grady, Vincent, Johnson, et al., 2008), we dichotomized it(use/non-use) and therefore cannot speculate as to a possible dose–response relationship between substance-related academic problemsand NPS frequency. Future studies should address whether more fre-quent NPS, although rare, is associated with more severe academicproblems and perhaps precipitous declines in GPA. Finally, prescriptionstimulants are nonmedically used for a variety of motives, albeit mostcommonly for study purposes among college students (Garnier-Dykstra
et al., 2012). The overwhelming majority of our sample engaged inNPS for this purpose, so our sample size did not allow for meaningfulcomparisons between individuals who used NPS for study purposeswith individuals who used NPS solely for recreational purposes. Futurelongitudinal studies should investigate the predictors of use for differ-ent motives.
Despite these limitations, this study demonstrated that even infre-quent NPS was associated with a chain of underlying events—that iscannabis use, skipping class, and decreased GPA. The study findingssuggest that individuals who engage in NPS, even infrequently,might benefit from a comprehensive evaluation of the reasons under-lying their academic difficulties, including a confidential assessment ofheavy alcohol consumption and illicit drug use involvement. Whilesuch an evaluation might seem difficult to implement given limitedresources, it is possible that such assessments could be provided bypersonnel within existing academic assistance centers and perhapsby academic advisors themselves. Such a strategy would not be cost-prohibitive because it would only involve training existing personnel,butmight be beneficial for recognizing and addressing the early stagesof drug problems and thereby prevent the eventual development ofmore severe academic problems or dismissal. Certainly, college shouldbe seen as a unique opportunity for this kind of early intervention. Bycapitalizing on the individual'smotivation to succeed, an academic ad-visormight be able to reveal how the student's substance usemight beinterfering with their achievement of academic and career goals.
Rather than a group preoccupied with achieving academically, thegeneral picture that emerges is that students who engage in NPS forstudy purposes appear to be struggling academically, perhaps as aresult of their heavy drinking and other drug involvement. For thesestudents, the likely motive underlying their NPS is to help them stayafloat academically, rather than gaining an extra edge. It is also
1649A.M. Arria et al. / Addictive Behaviors 38 (2013) 1643–1650
possible that students who have a fairly good GPA who engage in NPSdo so to help them study for exams or work on projects that they putoff until the last minute because of their drinking, other drug use, andtime spent socializing. For them, NPS might be a way of maintainingtheir current GPAs, and perhaps not to make up for poor grades orgain an academic edge. Whether or not NPS—even if preceded by sub-stance use problems and skipping class—is associated with subse-quent improvement in academic performance or maintenance of acertain GPA remains to be seen. Although we did control for highschool GPA, our longitudinal growth curve model approach did notallow for the simultaneous examination of college GPA as both arisk factor and an outcome.
Parents may be another target group for indicated prevention ef-forts. Anecdotally, many of our students who engage in NPS haveopenly disclosed this information to their parents. Some studentshave reported that their parents have either facilitated or encouragedthem to continue using prescription stimulants nonmedically if thestudent believes it might help themmanage their academic workload.What is probably not revealed to parents by students is the frequencyof their own cannabis and alcohol use and the extent to which theyskip class. Therefore, the information from this study could be usefulfor parents who might be naively condoning or facilitating NPS be-cause they have the best of intentions for their college-age child aswell as being financially invested in their success. Parents shouldhave conversations about the context in which NPS is occurring.Parents can and should facilitate early intervention efforts to addressan early drug problem that might be compromising academic success.
This study focused on a small but important piece of the overallpicture of the relationship between drug use and academic perfor-mance. Future research is encouraged to more fully explain the possi-ble contribution of illicit drug use to declining academic performancein college and, in particular, the relationship to interruptions in col-lege enrollment and possible college dropout. While this study fo-cused on class attendance as an intermediary between substance useand academic outcomes, future studies should examine the possiblerole of other factors such as sleep (Gaultney, 2010) and study hours(Williams, Powell, & Wechsler, 2003). This line of research could havecritical importance for improving college retention among young adultsin the US.
Role of funding sourceFunding for this study was provided by the National Institute on Drug Abuse
(R01-DA14845 and P50-DA027841). The National Institute on Drug Abuse had no fur-ther role in the study design; in the collection, management, analysis, and interpreta-tion of the data; in the writing of the manuscript; or in the decision to submit the paperfor publication.
ContributorsA.M. Arria and K.E. O'Grady contributed to the overall scientific direction of the
project. A.M. Arria, H.C. Wilcox, and K.M. Caldeira developed the manuscript. K.M.Caldeira, L.M. Garnier-Dykstra, and K.B. Vincent managed the literature searches andsummaries of previous work. H.C. Wilcox and K.M. Caldeira performed the statisticalanalyses. K.B. Vincent managed the day-to-day operational aspects of data collectionand supervised staff involved in data collection. All authors assisted with writing andapproved the final manuscript.
Conflicts of interestAmelia M. Arria received a small research grant from Ortho McNeil Janssen Scien-
tific Affairs in 2008. All other authors declare that they have no conflicts of interest.
AcknowledgmentsSpecial thanks are given to Gillian Pinchevsky, Emily Winick, Rebecca Baron, the
interviewing team, and the participants.
References
American Psychiatric Association (1994). Diagnostic and Statistical Manual of MentalDisorders: DSM-IV (4th ed.). Washington, DC: American Psychiatric Press.
Arria, A. M., Caldeira, K. M., O'Grady, K. E., Vincent, K. B., Fitzelle, D. B., Johnson, E. P., &Wish, E. D. (2008). Drug exposure opportunities and use patterns among college
students: Results of a longitudinal prospective cohort study. Substance Abuse,29(4), 19–38. http://dx.doi.org/10.1080/08897070802418451.
Arria, A. M., Caldeira, K. M., O'Grady, K. E., Vincent, K. B., Johnson, E. P., & Wish, E. D.(2008). Nonmedical use of prescription stimulants among college students: Asso-ciations with attention-deficit-hyperactivity disorder and polydrug use. Pharmaco-therapy, 28(2), 156–169. http://dx.doi.org/10.1592/phco.28.2.156.
Arria, A. M., & DuPont, R. L. (2010). Nonmedical prescription stimulant use among collegestudents:Whywe need to do something and what we need to do. Journal of AddictiveDiseases, 29(4), 417–426. http://dx.doi.org/10.1080/10550887.2010.509273.
Arria, A. M., O'Grady, K. E., Caldeira, K. M., Vincent, K. B., & Wish, E. D. (2008).Nonmedical use of prescription stimulants and analgesics: Associations with socialand academic behaviors among college students. Journal of Drug Issues, 38(4),1045–1060. http://dx.doi.org/10.1177/002204260803800406.
Ashton, C. H. (2001). Pharmacology and effects of cannabis: A brief review. The BritishJournal of Psychiatry, 178, 101–106. http://dx.doi.org/10.1192/bjp. 178.2.101.
Bentler, P. M. (1990). Comparative fit indexes in structural models. Psychological Bulle-tin, 107(2), 238–246. http://dx.doi.org/10.1037//0033-2909.107.2.238.
Browne, M. W., & Cudeck, R. (1993). Alternative ways of assessing model fit. In K. A.Bollen, & J. S. Long (Eds.), Testing Structural Equation Models (pp. 136–162). BeverlyHills, CA: Sage.
Carey, B. (2008, March 9). Brain enhancement is wrong, right? New York Times, pp. 1.Carroll, B. C., McLaughlin, T. J., & Blake, D. R. (2006). Patterns and knowledge of
nonmedical use of stimulants among college students. Archives of Pediatrics & Ad-olescent Medicine, 160(5), 481–485. http://dx.doi.org/10.1001/archpedi.160.5.481.
Clegg-Kraynok, M. M., McBean, A. L., & Montgomery-Downs, H. E. (2011). Sleep qualityand characteristics of college students who use prescription psychostimulantsnonmedically. Sleep Medicine, 12(6), 598–602. http://dx.doi.org/10.1016/j.sleep.2011.01.012.
DeSantis, A., Noar, S. M., & Webb, E. (2009). Nonmedical ADHD stimulant use in frater-nities. Journal of Studies on Alcohol and Drugs, 70(6), 952–954.
DeSantis, A., Noar, S. M., & Webb, E. M. (2010). Speeding through the frat house: Aqualitative exploration of nonmedical ADHD stimulant use in fraternities. Journalof Drug Education, 40(2), 157–171. http://dx.doi.org/10.2190/DE.40.2.d.
DeSantis, A. D., Webb, E. M., & Noar, S. M. (2008). Illicit use of prescription ADHD med-ications on a college campus: A multimethological approach. Journal of AmericanCollege Health, 57(3), 315–323. http://dx.doi.org/10.3200/JACH.57.3.315-324.
Duncan, T. E., Duncan, S. C., & Strycker, L. A. (2006). An introduction to latent variablegrowth curve modeling: Concepts, issues, and applications (2nd ed.). Mahwah, NJ:Lawrence Erlbaum Associates Publishers.
DuPont, R. L., Coleman, J. J., Bucher, R. H., &Wilford, B. B. (2008). Characteristics andmotivesof college students who engage in nonmedical use of methylphenidate. The AmericanJournal on Addictions, 17(3), 167–171. http://dx.doi.org/10.1080/10550490802019642.
Garnier-Dykstra, L. M., Caldeira, K. M., Vincent, K. B., O'Grady, K. E., & Arria, A. M.(2012). Nonmedical use of prescription stimulants during college: Four-yeartrends in exposure opportunity, use, motives, and sources. Journal of American Col-lege Health, 60(3), 226–234. http://dx.doi.org/10.1080/07448481.2011.589876.
Gaultney, J. F. (2010). The prevalence of sleep disorders in college students: Impact on aca-demic performance. Journal of American College Health, 59(2), 91–97. http://dx.doi.org/10.1080/07448481.2010.483708.
Gliksman, L., Newton-Taylor, B., Adlaf, E., & Giesbrecht, N. (1997). Alcohol and otherdrug use by Ontario university students: The roles of gender, age, year of study,academic grades, place of residence and programme of study. Drugs: Education,Prevention, and Policy, 4(2), 117–129.
Greely, H., Sahakian, B., Harris, J., Kessler, R. C., Gazzaniga, M., Campbell, P., & Farah, M.J. (2008). Towards responsible use of cognitive-enhancing drugs by the healthy.Nature, 456(7223), 702–705. http://dx.doi.org/10.1038/456702a.
Hunt, J., Eisenberg, D., & Kilbourne, A.M. (2010). Consequences of receipt of a psychiatric di-agnosis for completion of college. Psychiatric Services, 61(4), 399–404. http://dx.doi.org/10.1176/appi.ps.61.4.399.
Johnston, L. D., O'Malley, P. M., Bachman, J. G., & Schulenberg, J. E. (2010). Monitoringthe future: National survey results on drug use, 1975–2009. College students andadults ages 19–50, volume II. Bethesda, MD: National Institute on Drug Abuse.
Johnston, L. D., O'Malley, P. M., Bachman, J. G., & Schulenberg, J. E. (2012). Monitoringthe Future: National survey results on drug use, 1975–2011. College students andadults ages 19–50, volume II. Ann Arbor: Institute for Social Research, The Universi-ty of Michigan.
Kandel, D. B., & Logan, J. A. (1984). Patterns of drug use from adolescence to young adult-hood: I. Periods of risk for initiation, continued use, and discontinuation. AmericanJournal of Public Health, 74(7), 660–666. http://dx.doi.org/10.2105/AJPH.74.7.660.
Kline, R. B. (2006). Principles and practices of structural equation modeling (2nd ed.).New York, NY: The Guilford Press.
Kosterman, R., Hawkins, J. D., Guo, J., Catalano, R. F., & Abbott, R. D. (2000). The dynamicsof alcohol and marijuana initiation: Patterns and predictors of first use in adoles-cence. American Journal of Public Health, 90(3), 360–366.
Low, K. G., & Gendaszek, A. E. (2002). Illicit use of psychostimulants among collegestudents: A preliminary study. Psychology, Health & Medicine, 7(3), 283–287.http://dx.doi.org/10.1080/13548500220139386.
Maher, B. (2008). Poll results: Look who's doping. Nature, 452(7188), 674–675.http://dx.doi.org/10.1038/452674a.
McCabe, S. E., Knight, J. R., Teter, C. J., & Wechsler, H. (2005). Non-medical use ofprescription stimulants among US college students: Prevalence and correlatesfrom a national survey. Addiction, 99(1), 96–106. http://dx.doi.org/10.1111/j.1360-0443.2005.00944.x.
McCabe, S. E., Teter, C. J., & Boyd, C. J. (2006). Medical use, illicit use and diversion ofprescription stimulant medication. Journal of Psychoactive Drugs, 38(1), 43–56.http://dx.doi.org/10.1080/02791072.2006.10399827.
1650 A.M. Arria et al. / Addictive Behaviors 38 (2013) 1643–1650
McCabe, S. E., West, B. T., & Wechsler, H. (2007). Trends and college-level characteris-tics associated with the non-medical use of prescription drugs among US collegestudents from 1993 to 2001. Addiction, 102(3), 455–465. http://dx.doi.org/10.1111/j.1360-0443.2006.01733.x.
MelissaDATA (2003). Income tax statistics lookup. Retrieved May 28, 2008, from.http://www.melissadata.com/lookups/taxzip.asp
Muthén, B. O. (2008). Latent variable hybrids: Overview of old and newmodels. In G. R.Hancock, & K. M. Samuelsen (Eds.), Advances in latent variable mixture models(pp. 1–24). Charlotte, NC: Information Age Publishing.
Muthén, L. K., & Muthén, B. O. (2007). Mplus: User's guide (Fifth ed.). Los Angeles, CA:Muthén & Muthén.
Pascarella, E. T., Tagliapietra-Nicoli, G., Goodman, K. M., Park, S., Seifert, T. A., &Whitt, E.J. (2007). College student binge drinking and academic achievement: A longitudi-nal replication and extension. Journal of College Student Development, 48(6),715–727. http://dx.doi.org/10.1353/csd.2007.0060.
Paschall, M. J., & Freisthler, B. (2003). Does heavy drinking affect academic perfor-mance in college? Findings from a prospective study of high achievers. Journal ofStudies on Alcohol, 64(4), 515–519.
Rabiner, D. L., Anastopoulos, A. D., Costello, E. J., Hoyle, R. H., McCabe, S. E., &Swartzwelder, H. S. (2009). Motives and perceived consequences of nonmedicalADHDmedication use by college students: Are students treating themselves for at-tention problems? Journal of Attention Disorders, 13(3), 259–270. http://dx.doi.org/10.1177/1087054708320399.
Sessa, F. M. (2005). The influence of perceived parenting on substance use during thetransition to college: A comparison of male residential and commuter students.Journal of College Student Development, 46(1), 62–74. http://dx.doi.org/10.1353/csd.2005.0010.
Singleton, R. A. (2007). Collegiate alcohol consumption and academic performance.Journal of Studies on Alcohol and Drugs, 68(4), 548–555.
Substance Abuse andMental Health Services Administration (2003). 2002 National Sur-vey on Drug Use and Health Questionnaire. Rockville, MD: Office of Applied Studies.
Talbot, M. (April 27). Brain gain: The underground world of “neuroenhancing” drugs. TheNew Yorker.
Tennant, F. S., Jr., & Groesbeck, C. J. (1972). Psychiatric effects of hashish. Archives of GeneralPsychiatry, 27(1), 133–136. http://dx.doi.org/10.1001/archpsyc.1972.01750250117016.
Teter, C. J., McCabe, S. E., Boyd, C. J., & Guthrie, S. K. (2003). Illicit methylphenidate usein an undergraduate student sample: Prevalence and risk factors. Pharmacothera-py, 23(5), 609–617. http://dx.doi.org/10.1592/phco.23.5.609.34187.
Teter, C. J., McCabe, S. E., Cranford, J. A., Boyd, C. J., & Guthrie, S. K. (2005). Prevalenceand motives for illicit use of prescription stimulants in an undergraduate studentsample. Journal of American College Health, 53(6), 253–262. http://dx.doi.org/10.3200/JACH.53.6.253-262.
Teter, C. J., McCabe, S. E., LaGrange, K., Cranford, J. A., & Boyd, C. J. (2006). Illicit use ofspecific prescription stimulants among college students: Prevalence, motives, androutes of administration. Pharmacotherapy, 26(10), 1501–1510. http://dx.doi.org/10.1592/phco.26.10.1501.
Vincent, K. B., Kasperski, S. J., Caldeira, K. M., Garnier-Dykstra, L. M., Pinchevsky, G. M.,O'Grady, K. E., & Arria, A. M. (2012). Maintaining superior follow-up rates in a longi-tudinal study: Experiences from theCollege Life Study. International Journal ofMultipleResearch Approaches, 6(1), 56–72. http://dx.doi.org/10.5172/mra.2012.6.1.56.
White, B. P., Becker-Blease, K. A., & Grace-Bishop, K. (2006). Stimulant medication use,misuse, and abuse in an undergraduate and graduate student sample. Journal of Amer-ican College Health, 54(5), 261–268. http://dx.doi.org/10.3200/JACH.54.5.261-268.
Williams, J., Powell, L. M., & Wechsler, H. (2003). Does alcohol consumption reducehuman capital accumulation? Evidence from the College Alcohol Study. AppliedEconomics, 35(10), 1227–1239. http://dx.doi.org/10.1080/0003684032000090735.
Wolaver, A. M. (2002). Effects of heavy drinking in college on study effort, gradepoint average, and major choice. Contemporary Economic Policy, 20(4), 415–428.http://dx.doi.org/10.1093/cep/20.4.415.
Related Documents