RESEARCH ARTICLE Disease-related income and economic productivity loss in New Zealand: A longitudinal analysis of linked individual-level data Tony Blakely ID 1,2 *, Finn Sigglekow ID 2 , Muhammad Irfan ID 2 , Anja Mizdrak ID 2 , Joseph Dieleman ID 3 , Laxman Bablani ID 1 , Philip Clarke 4 , Nick Wilson ID 2 1 Population Interventions Unit, Melbourne School of Population and Global Health, University of Melbourne, Melbourne, Australia, 2 Burden of Disease Epidemiology, Equity and Cost-Effectiveness Programme, Department of Public Health, University of Otago, Wellington, New Zealand, 3 Institute of Health Metrics and Evaluation, University of Washington, Seattle, Washington State, United States of America, 4 Health Economics Research Centre, Nuffield Department of Population Health, University of Oxford, Oxford, United Kingdom * [email protected] Abstract Background Reducing disease can maintain personal individual income and improve societal economic productivity. However, estimates of income loss for multiple diseases simultaneously with thorough adjustment for confounding are lacking, to our knowledge. We estimate individual- level income loss for 40 conditions simultaneously by phase of diagnosis, and the total income loss at the population level (a function of how common the disease is and the individ- ual-level income loss if one has the disease). Methods and findings We used linked health tax data for New Zealand as a high-income country case study, from 2006 to 2007 to 2015 to 2016 for 25- to 64-year-olds (22.5 million person-years). Fixed effects regression was used to estimate within-individual income loss by disease, and cause-deletion methods to estimate economic productivity loss at the population level. Income loss in the year of diagnosis was highest for dementia for both men (US$8,882; 95% CI $6,709 to $11,056) and women ($7,103; $5,499 to $8,707). Mental illness also had high income losses in the year of diagnosis (average of about $5,300 per year for males and $4,100 per year for females, for 4 subcategories of: depression and anxiety; alcohol related; schizophrenia; and other). Similar patterns were evident for prevalent years of diagnosis. For the last year of life, cancers tended to have the highest income losses, (e.g., colorectal cancer males: $17,786, 95% CI $15,555 to $20,018; females: $14,192, $12,357 to $16,026). The combined annual income loss from all diseases among 25- to 64-year-olds was US $2.72 billion or 4.3% of total income. Diseases contributing more than 4% of total PLOS MEDICINE PLOS Medicine | https://doi.org/10.1371/journal.pmed.1003848 November 30, 2021 1 / 19 a1111111111 a1111111111 a1111111111 a1111111111 a1111111111 OPEN ACCESS Citation: Blakely T, Sigglekow F, Irfan M, Mizdrak A, Dieleman J, Bablani L, et al. (2021) Disease- related income and economic productivity loss in New Zealand: A longitudinal analysis of linked individual-level data. PLoS Med 18(11): e1003848. https://doi.org/10.1371/journal.pmed.1003848 Academic Editor: Zirui Song, Massachusetts General Hospital, UNITED STATES Received: July 16, 2020 Accepted: October 13, 2021 Published: November 30, 2021 Peer Review History: PLOS recognizes the benefits of transparency in the peer review process; therefore, we enable the publication of all of the content of peer review and author responses alongside final, published articles. The editorial history of this article is available here: https://doi.org/10.1371/journal.pmed.1003848 Copyright: © 2021 Blakely et al. This is an open access article distributed under the terms of the Creative Commons Attribution License, which permits unrestricted use, distribution, and reproduction in any medium, provided the original author and source are credited. Data Availability Statement: These data are available in the Statistics New Zealand Integrated Data Laboratory. Details on how to access this data can be found at https://www.stats.govt.nz/

Welcome message from author
This document is posted to help you gain knowledge. Please leave a comment to let me know what you think about it! Share it to your friends and learn new things together.
Transcript
RESEARCH ARTICLE
Disease-related income and economic
productivity loss in New Zealand: A
longitudinal analysis of linked individual-level
data
Tony BlakelyID1,2*, Finn SigglekowID
2, Muhammad IrfanID2, Anja MizdrakID
2,
Joseph DielemanID3, Laxman BablaniID
1, Philip Clarke4, Nick WilsonID2
1 Population Interventions Unit, Melbourne School of Population and Global Health, University of Melbourne,
Melbourne, Australia, 2 Burden of Disease Epidemiology, Equity and Cost-Effectiveness Programme,
Department of Public Health, University of Otago, Wellington, New Zealand, 3 Institute of Health Metrics and
Evaluation, University of Washington, Seattle, Washington State, United States of America, 4 Health
Economics Research Centre, Nuffield Department of Population Health, University of Oxford, Oxford, United
Kingdom
Abstract
Background
Reducing disease can maintain personal individual income and improve societal economic
productivity. However, estimates of income loss for multiple diseases simultaneously with
thorough adjustment for confounding are lacking, to our knowledge. We estimate individual-
level income loss for 40 conditions simultaneously by phase of diagnosis, and the total
income loss at the population level (a function of how common the disease is and the individ-
ual-level income loss if one has the disease).
Methods and findings
We used linked health tax data for New Zealand as a high-income country case study, from
2006 to 2007 to 2015 to 2016 for 25- to 64-year-olds (22.5 million person-years). Fixed
effects regression was used to estimate within-individual income loss by disease, and
cause-deletion methods to estimate economic productivity loss at the population level.
Income loss in the year of diagnosis was highest for dementia for both men (US$8,882;
95% CI $6,709 to $11,056) and women ($7,103; $5,499 to $8,707). Mental illness also had
high income losses in the year of diagnosis (average of about $5,300 per year for males and
$4,100 per year for females, for 4 subcategories of: depression and anxiety; alcohol related;
schizophrenia; and other). Similar patterns were evident for prevalent years of diagnosis.
For the last year of life, cancers tended to have the highest income losses, (e.g., colorectal
cancer males: $17,786, 95% CI $15,555 to $20,018; females: $14,192, $12,357 to
$16,026).
The combined annual income loss from all diseases among 25- to 64-year-olds was US
$2.72 billion or 4.3% of total income. Diseases contributing more than 4% of total
PLOS MEDICINE
PLOS Medicine | https://doi.org/10.1371/journal.pmed.1003848 November 30, 2021 1 / 19
a1111111111
a1111111111
a1111111111
a1111111111
a1111111111
OPEN ACCESS
Citation: Blakely T, Sigglekow F, Irfan M, Mizdrak
A, Dieleman J, Bablani L, et al. (2021) Disease-
related income and economic productivity loss in
New Zealand: A longitudinal analysis of linked
individual-level data. PLoS Med 18(11): e1003848.
https://doi.org/10.1371/journal.pmed.1003848
Academic Editor: Zirui Song, Massachusetts
General Hospital, UNITED STATES
Received: July 16, 2020
Accepted: October 13, 2021
Published: November 30, 2021
Peer Review History: PLOS recognizes the
benefits of transparency in the peer review
process; therefore, we enable the publication of
all of the content of peer review and author
responses alongside final, published articles. The
editorial history of this article is available here:
https://doi.org/10.1371/journal.pmed.1003848
Copyright: © 2021 Blakely et al. This is an open
access article distributed under the terms of the
Creative Commons Attribution License, which
permits unrestricted use, distribution, and
reproduction in any medium, provided the original
author and source are credited.
Data Availability Statement: These data are
available in the Statistics New Zealand Integrated
Data Laboratory. Details on how to access this data
can be found at https://www.stats.govt.nz/
disease-related income loss were mental illness (30.0%), cardiovascular disease (15.6%),
musculoskeletal (13.7%), endocrine (8.9%), gastrointestinal (7.4%), neurological (6.5%),
and cancer (4.5%).
The limitations of this study include residual biases that may overestimate the effect of
disease on income loss, such as unmeasured time-varying confounding (e.g., divorce lead-
ing to both depression and income loss) and reverse causation (e.g., income loss leading to
depression). Conversely, there may also be offsetting underestimation biases, such as
income loss in the prodromal phase before diagnosis that is misclassified to “healthy” person
time.
Conclusions
In this longitudinal study, we found that income loss varies considerably by disease. Never-
theless, mental illness, cardiovascular, and musculoskeletal diseases stand out as likely
major causes of economic productivity loss, suggesting that they should be prioritised in pre-
vention programmes.
Author summary
Why was this study done?
• Quantifying income loss from incident or prevalent disease helps generate a fully
rounded burden of disease on society.
• These income losses are often used to estimate productivity losses and conversely can be
used to quantify productivity gains in future cost-effectiveness studies of treatments and
prevention.
• However, existing income loss studies are often just for one disease at a time, making
them both noncomparable with other estimates for other diseases but also likely overes-
timating the income loss from diseases due to nonaccounted comorbidity.
What did the researchers do and find?
• We used routine health data for an entire high-income country (New Zealand) linked to
income–tax data to create a full-population panel study of 25- to 64-year-olds for disease
and income status, year by year during 2006 to 2007 to 2015 to 2016.
• We then used an econometric method—fixed effects regression—to estimate the
within-individual income loss in the year they develop disease, years they are prevalent
with disease, and last year of life if dying of that disease.
• Income loss in the year of diagnosis was highest for dementia and also high for mental
illness. Similar patterns were evident for prevalent years of diagnosis. For the last year of
life, cancers tended to have the highest income losses.
• The combined annual income loss from all diseases among 25- to 64-year-olds was US
$2.72 billion or 4.3% of total income for 25- to 64-year-olds. Diseases contributing more
PLOS MEDICINE Disease-related income loss for New Zealand
PLOS Medicine | https://doi.org/10.1371/journal.pmed.1003848 November 30, 2021 2 / 19
integrated-data/apply-to-use-microdata-for-
research/. Or contact SNZ at:
[email protected]. Applicants to use
the data will need ethics approval and a data
integration approval from SNZ. At this point in
time, only researchers based in NZ can access the
data through either data laboratories on site at
SNZ, and satellite-laboratories in a number of NZ
institutions (e.g. hosted by NZ universities).
Funding: The BODE3 Programme is funded by
New Zealand Health Research Council (10/248, 16/
443) and the Ministry of Business, Innovation and
Employment (UOOX1406). Authors funded by
these grants include TB, FS, MI, AM, LM and NW.
The funders had no role in study design, data
collection and analysis, decision to publish, or
preparation of the manuscript.
Competing interests: The authors have declared
that no competing interests exist.
Abbreviations: FCA, friction cost approach; FE,
fixed effects; HCA, human capital approach; ICD,
International Classification of Disease; IDI,
Integrated Data Infrastructure; IRD, Inland
Revenue Department; MHINC, Mental Health
Information National Collection; NMDS, National
Minimum Data Set; NZBDS, NZ Burden of Disease
Study; OLS, ordinary least squares; PHRIMD,
Programme for the Integration of Mental Health
Data; SEP, socioeconomic position; SNZ, Statistics
New Zealand.
than 4% of total disease related income loss were mental illness (30.0%); cardiovascular
disease (15.6%); musculoskeletal (13.7%), endocrine (8.9%), gastrointestinal (7.4%),
neurological (6.5%), and cancer (4.5%).
What do these findings mean?
• At 4.3% of all national income among 25- to 64-year-olds, disease-related income loss is
sizeable—and particularly so for mental illnesses (consistent with burden of disease
studies).
• As longevity increases, the health sector should increasingly consider the wider societal
impacts of health system interventions—including on economic productivity. To do
this well requires estimates of disease-related income loss from studies (like this one)
that analyse all diseases together to overcome confounding by comorbidity.
• If a comparable and robust data-based of disease-related income loss estimates is built
up in multiple countries, the productivity gains from health system interventions should
be more reliably quantified in the future.
Introduction
Health shocks adversely affect labour force participation [1], incomes, and productivity [2,3].
Estimates of income loss following diagnosis of disease may be used as ancillary estimates of
the individual burden from poor health, and the aggregate societal economic productivity loss
[4–6]. These income loss estimates can also inform policy on sickness benefit and health insur-
ance and can be used in prioritisation of preventive interventions. As longevity increases and
populations have older age structures, there is an increasing need for health interventions to
be assessed not only on health sector impacts (i.e., health gains and health system expenditure),
but also on the impact of interventions on wider society—including workforce productivity
given the need to support an increasingly aged population.
There are large variations in contexts, data, and methods used to estimate disease-related
income loss. Studies often focus on a single disease, limiting the ability to compare across dif-
ferent diseases. In addition, confounding by comorbidities (or other diseases) is often ignored
in studies that estimate income loss from one disease in isolation (e.g., ischaemic heart disease
[7], rheumatoid arthritis [8], cancer [9]) leading to likely overestimation of income loss for a
given disease. Put another way, if such studies were undertaken separately for all diseases, the
sum of income loss across these studies would (likely greatly) exceed the actual income loss
from all diseases considered together. Even studies from Scandinavia, with population-wide
disease registers linked to taxation or employment data, have also focused on single diseases
such as diabetes [10], breast cancer [11], and injury [12]. We are aware of only one study that
has considered multiple diseases simultaneously in estimating productivity loss for a national
cohort [4]. On the other hand, some studies only include income loss or productivity loss from
deaths [13,14] tallying up all income loss had the person hypothetically lived to (say) 65 years
of age (which also ignores competing morbidity and competing mortality risk).
To overcome the limitations in previous studies on disease-related income loss and provide
income loss estimates that are comparable across diseases, we used population-wide panel data
on disease and injury events linked to income data. We estimated income loss while the partic-
ipant is alive or in the tax year of their death, for adults 25 to 64 years of age, adjusting for all
PLOS MEDICINE Disease-related income loss for New Zealand
PLOS Medicine | https://doi.org/10.1371/journal.pmed.1003848 November 30, 2021 3 / 19
diseases simultaneously to overcome confounding, which we believe is unique. There is also
likely to be further confounding by socioeconomic position (SEP), in that SEP causes both var-
iations in disease rates and income (loss); we aimed to estimate the income loss a person
would have avoided had they counterfactually not developed the given disease. Our inference
target was the average citizen or total population—not just those employed; accordingly, we
estimated income loss estimates averaged across all citizens. Specifically, our research objec-
tives were to determine (1) individual-level disease-specific income loss estimates by phase of
diagnosis; and (2) population-level estimates of total income loss by disease and the ranking of
disease contributions to income loss in the total population.
Methods
We created a cohort of the entire New Zealand usually resident population 25 to 64 years of
age during the observation window of 2006 to 2007 to 2015 to 2016, using linked administra-
tive health and income/tax data.
The study was approved by Statistics New Zealand (SNZ) for undertaking in the SNZ Inte-
grated Data Infrastructure (IDI) and separately approved by the University of Otago Ethics
Committee. This study is reported as per the RECORD guideline (S1 Checklist).
Population
New Zealand is a high-income country with a population of 5 million people with a median
age of 38 years, 16% of the population 65 years of age and older, and a life expectancy of 81.4
years. Most New Zealanders are of European extraction with sizeable populations of Māori
(Indigenous population; 16.5%), Asian (15.1%), and Pacific peoples (8.1%; 2018 Census data).
The GDP per capita in 2018 was about US$42,000, ranked about 30th among all countries.
Over 80% of total health expenditure is government funded (through tax revenue). Regarding
income protection, a separate accident insurance corporation exists that will cover 80% of
one’s wage or salary while incapacitated, but income protection in the event of sickness is pat-
chy comprising: accrued sick leave from one’s employer; income protection insurance from
private insurance companies; and a relatively low publicly funded sickness benefit safety net.
Datasets
The health data comprised the following national datasets, all linkable with the National
Health Index unique identifier: the National Minimum Data Set (NMDS) for all inpatient
events since 1988; cancer registrations since 1995; retail pharmaceuticals since 2005; mental
health event data since 2000 (Programme for the Integration of Mental Health Data
(PHRIMD) and Mental Health Information National Collection (MHINC)); virtual diabetes
register; and mortality data during the 2006 to 2007 to 2015 to 2016 observation window.
The income data were sourced from Inland Revenue Department (IRD) data collated for all
New Zealand residents, from 2 sources: automatic filings from employers to IRD for wages
and salary under the “pay as you earn” system; and self-employed income from annual returns
submitted by residents.
Multiple government datasets (including the above health and income data) are available to
users of the SNZ IDI (available to New Zealand–resident researchers by application to SNZ).
All datasets are prelinked (before researchers have access) using a resident population spine
that is maintained by SNZ (a detailed data profile and methods regarding the SNZ IDI is pub-
lished elsewhere [15]). Our study cohort was taken from a SNZ resident population [16] and
includes anyone with activity in the IRD, health, education, and Accident Compensation Cor-
poration datasets within 12 months prior to the reference date (31 March of each year) and
PLOS MEDICINE Disease-related income loss for New Zealand
PLOS Medicine | https://doi.org/10.1371/journal.pmed.1003848 November 30, 2021 4 / 19
excludes individuals classified as having moved overseas (i.e., if the total length of time spent
overseas was at least 10 of the 12 months spanning the reference date (6 months either side of
the reference date). The population was modified to include individuals who died within 1
year prior to the reference date.
Variables
We included the following covariates and interaction terms in the models (by sex):
Diseases. We used the NZ Burden of Disease Study (NZBDS) condition groupings
[17,18] to select 14 aggregated and 40 disaggregate-level diseases or conditions (see S1 Table
for coding, S2 Table for categories, NZBDS categories with insufficient data or no variation
over time (dental and congenital) were excluded). To determine if any of these diseases were
prevalent before or were incident during the 2006 to 2007 to 2015 to 2016 observation window,
a thorough case finding algorithm was applied consistent with that used for the NZBDS (S1
Table). In general terms, International Classification of Disease (ICD) codes for events and
disease-specific drug combinations were developed, disease by disease; primary and secondary
hospitalisation diagnoses were used in the look-back period (i.e., pre-2006 to 2007) to deter-
mine presence or absence of disease, but only primary diagnoses were used to determine inci-
dent disease in the 2006 to 2007 to 2015 to 2016 observation window. Once a person was
diagnosed with a disease, they were assumed to have that disease for the rest of their life—
except skin disorders, infections, internal injuries, poison injuries, and other injuries who only
had the disease for the year, and cancers where survival beyond 5 years for lung, 8 years for
colorectal, 10 years for “other” cancers, and 20 years for breast and prostate resulted in that
person being recoded as being free of that cancer (based on statistical cure times) [19]. Each
disease was coded by phase as not present (reference category), diagnosed in that year, died in
that year of that disease, and otherwise prevalent. Note, therefore, the costs for the first 2 cate-
gories are for people with an average of 6 months in that state (but for the diagnosis category
still including the time and costs for events preceding the diagnosis date in the same tax year).
Income. Each eligible resident was assigned a total pretax income as collected by IRD for
each tax year 1 April to 31 March, for the 10 years. In main analyses, self-employed income
included sole trader income but excluded income from partnerships (if not paid as personal
income), rental properties, company directorships, and shareholdings. It is important to note
that if an individual received sick pay from their employer at the same level as their usual
income, their income (apparent to us) did not change—meaning that we missed this compo-
nent of income loss relevant to the underlying construct of productivity loss. All annual total
income was inflation adjusted to the 2020 reference year using the consumer price index, then
converted to US$2020 using the NZ-USA OECD purchasing power parity of 1.445.
Covariates. Age was treated as a 5-year categorical variable for main effects and grouped
to 25- to 39-, 40- to 49-, 50- to 59-, and 60- to 64-year-old categories for interaction with
diseases.
Each individual was assigned to one ethnic group in a prioritised manner (given individuals
can nominate more than one self-identified ethnic group), in order of the following: Māori
(indigenous population of New Zealand), Pacific peoples, Asian peoples, and the rest as Other
(i.e., largely European).
To allow for time-varying confounding by changing SEP, and variations in income loss by
SEP, we assigned each individual person-year to a quintile of deprivation using a validated
small area deprivation measure called NZDep [20]. The NZDep measure is a principal compo-
nents calculated index using 9 census variables at a small area (meshbock) level of about 100
people: proportion of income as benefit receipt; household income; housing tenure; sole
PLOS MEDICINE Disease-related income loss for New Zealand
PLOS Medicine | https://doi.org/10.1371/journal.pmed.1003848 November 30, 2021 5 / 19
parent family; unemployment; qualifications; household crowding; telephone access; and car
access. (We did not use a comorbidity index per se, but rather as all models were adjusted for
all other diseases (be that the 14 or 40 disease level) we consider this adjustment for confound-
ing by other diseases as equivalent to adjusting for comorbidity).
Analyses
Our analytical plan for this study was to follow the analyses we previously conducted (and pub-
lished in this journal) for disease-related health system expenditure [21]. We, however, devi-
ated from this previous approach to use fixed effects (FE) regression analyses for the “main
analyses,” reporting ordinary least squares (OLS) regression in sensitivity analyses due to con-
cerns about residual confounding (below).
Fixed effects regression modelling. We used an “excess” or “net” cost approach [21–25],
with total income as the dependent variable in the regression analyses (uses within individual
variation that removes time-invariant confounding [26] with cluster-adjusted standard errors).
Conceptually, this excess costing approach examines how individual’s incomes vary year by
year, corresponding to their disease status in each year. If the average difference in income in
people’s first year of diagnosis of stroke (compared to their own pre-stroke years) was $5,000
(adjusted for other changes over time such as other diseases and changing deprivation), then
this is the income loss.
Observations were only excluded if they had missing geocode for assigning NZDep
(0.96%). Observations were censored after the year of death and if not eligible to be in the usu-
ally resident population (e.g., it was possible for a person living overseas for a period to con-
tribute person observations in early and late years but be censored for midyears). Due to
extreme income outliers, we further excluded year observations with a total income that was
negative and less than the 0.1th percentile or greater than the 99.9th percentile.
The FE regression model is
yit ¼ b1xit þ ai þ uit ; t ¼ 1; 2; 3; . . . . . . . . . ::T
where yit is the dependent variable, income of the individual i (inflation adjusted) in time
period or tax year t; xit represents
• the independent variables (i.e., main effects for time-varying covariates [disease-phase (nil,
first year, prevalent, and last year of life if dying of the disease); tax year (categorical); 5-year
age-group (categorical); deprivation quintile (categorical); and a dummy variable for dying
in that year if dying of a disease not included in model;
• interactions of the disease-phase variable (our “main exposure” or variable of interest) with a
4-level age category covariate; ethnicity (Māori, Pacific, Asian, and European Other; time
invariant characteristics can be included in interactions with time-varying covariates, here
because of likely varying income loss by ethnicity); and deprivation. (These interactions
were included to allow for likely variations in income loss by disease with age and ethnicity;
while not a research question per se in this study, allowing for such interactions is important
in the cause-deleted analyses below that estimate total income loss from disease across the
population.)
β1 represents the coefficient for the independent variables (with the standard error used to
generate 95% CI); ai is the unknown intercept for each individual; and uit is the idiosyncratic
error term.
Cause-deleted analyses. We used a cause-deleted approach to estimate population-level
income loss from disease. First, we predicted back onto every individual their expected income
PLOS MEDICINE Disease-related income loss for New Zealand
PLOS Medicine | https://doi.org/10.1371/journal.pmed.1003848 November 30, 2021 6 / 19
loss, using their disease covariates and the matching regression coefficients (including for
interactions). Then, disease by disease, we set everyone’s disease values to 0 (i.e., no disease);
predicted each individual’s cause-deleted income loss; and the difference between the as-
observed and cause-deleted models total predicted income was the cause-deleted income loss
attributable to each disease.
Sensitivity analyses. While FE regression has the strong advantage of removing all time-
invariant confounding, it also has a disadvantage of relying on within-individual differences in
income before and after diagnosis. For some chronic diseases such as diabetes, mental illness,
and respiratory disease, the year during which our case finding algorithms determine a person
to be incident is somewhat arbitrary—as it assumes a discontinuity in health at that point,
when indeed the person may have had slowly progressing impacts on their health leading up
to (say) their first hospitalisation. This will mean a bias towards underestimating income loss.
A between-person regression approach does not suffer from this bias but is prone to residual
confounding by SEP. Therefore, the OLS regressions also restricted observations to only those
people with no disease 2 years before the observation window and adjusted for prior average
income (continuous variable) in the 2-year period 2003 to 2004 to 2004 to 2005.
The case finding algorithm for depression and anxiety used a reasonably stringent case defi-
nition—some contact with some publicly funded mental health services (e.g., hospitalisation,
acute assessment). Much depression and anxiety is treated in primary care, often with antide-
pressants, and is not registered on the PRIMHD database. We, therefore, also used an
extended case definition in sensitivity analyses that included receipt of mental health medica-
tion—although this will now overestimate income loss due to disease as, for example, antide-
pressants have treatment indications other than just depression. Conversely, due to variability
in quality and duration of pharmaceutical records (especially in the look-back period), we ran
analyses where pharmaceutical records were not used in case finding (for all diseases).
Results
There were 22.5 million person-year observations over the 10-year observation period, of
which 49.5% of observations were for a person with at least one disease or condition (Table 1).
The total income was $606 billion (all cost values in US$, 2020), of which 45.4% was generated
by people with at least one diagnosis or condition in the year. Person-years for people with a
gastrointestinal condition were most common at 15.1% of all person-years (3.4 million (S2
Table) out of 22.5 million total person-years), followed by musculoskeletal diseases 14.3%.
Objective 1: Individual-level disease-specific income loss estimates by
phase of diagnosis
Figs 1 and 2 show the FE regression coefficients—inflation and purchase power parity adjusted
to US$—by sex and two of the disease phases: first year of diagnosis and prevalent disease.
These per capita income losses represent the reference case person (age 50 to 54, Other/Euro-
pean ethnic group, living in the middle quintile of neighbourhoods ranked by deprivation).
Income losses tended to be greater for males. Income loss in the year of diagnosis was highest
for dementia for both men ($8,882; 95% CI $6,709 to $11,056) and women ($7,103; $5,499 to
$8,707). Traumatic brain injury, mental illness, and lung cancer cases had the next largest
income losses for males and females. One disease had a significant increase in income post-
diagnosis, namely migraine for females ($446, 95% CI $265 to $627). Similar patterns were evi-
dent for prevalent years of diagnosis.
Income loss in the last year of life was (unsurprisingly) high for all diseases, given on aver-
age 6 months of income was lost if the person was employed at the time of death and greater
PLOS MEDICINE Disease-related income loss for New Zealand
PLOS Medicine | https://doi.org/10.1371/journal.pmed.1003848 November 30, 2021 7 / 19
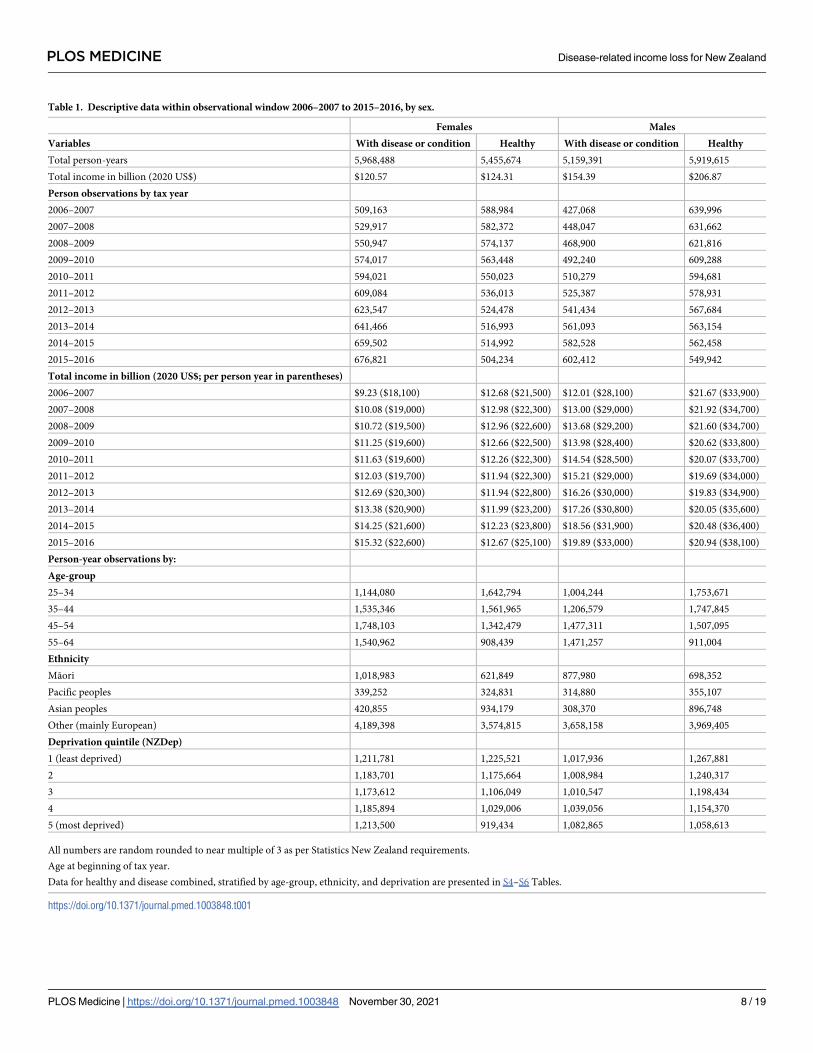
Table 1. Descriptive data within observational window 2006–2007 to 2015–2016, by sex.
Females Males
Variables With disease or condition Healthy With disease or condition Healthy
Total person-years 5,968,488 5,455,674 5,159,391 5,919,615
Total income in billion (2020 US$) $120.57 $124.31 $154.39 $206.87
Person observations by tax year
2006–2007 509,163 588,984 427,068 639,996
2007–2008 529,917 582,372 448,047 631,662
2008–2009 550,947 574,137 468,900 621,816
2009–2010 574,017 563,448 492,240 609,288
2010–2011 594,021 550,023 510,279 594,681
2011–2012 609,084 536,013 525,387 578,931
2012–2013 623,547 524,478 541,434 567,684
2013–2014 641,466 516,993 561,093 563,154
2014–2015 659,502 514,992 582,528 562,458
2015–2016 676,821 504,234 602,412 549,942
Total income in billion (2020 US$; per person year in parentheses)
2006–2007 $9.23 ($18,100) $12.68 ($21,500) $12.01 ($28,100) $21.67 ($33,900)
2007–2008 $10.08 ($19,000) $12.98 ($22,300) $13.00 ($29,000) $21.92 ($34,700)
2008–2009 $10.72 ($19,500) $12.96 ($22,600) $13.68 ($29,200) $21.60 ($34,700)
2009–2010 $11.25 ($19,600) $12.66 ($22,500) $13.98 ($28,400) $20.62 ($33,800)
2010–2011 $11.63 ($19,600) $12.26 ($22,300) $14.54 ($28,500) $20.07 ($33,700)
2011–2012 $12.03 ($19,700) $11.94 ($22,300) $15.21 ($29,000) $19.69 ($34,000)
2012–2013 $12.69 ($20,300) $11.94 ($22,800) $16.26 ($30,000) $19.83 ($34,900)
2013–2014 $13.38 ($20,900) $11.99 ($23,200) $17.26 ($30,800) $20.05 ($35,600)
2014–2015 $14.25 ($21,600) $12.23 ($23,800) $18.56 ($31,900) $20.48 ($36,400)
2015–2016 $15.32 ($22,600) $12.67 ($25,100) $19.89 ($33,000) $20.94 ($38,100)
Person-year observations by:
Age-group
25–34 1,144,080 1,642,794 1,004,244 1,753,671
35–44 1,535,346 1,561,965 1,206,579 1,747,845
45–54 1,748,103 1,342,479 1,477,311 1,507,095
55–64 1,540,962 908,439 1,471,257 911,004
Ethnicity
Māori 1,018,983 621,849 877,980 698,352
Pacific peoples 339,252 324,831 314,880 355,107
Asian peoples 420,855 934,179 308,370 896,748
Other (mainly European) 4,189,398 3,574,815 3,658,158 3,969,405
Deprivation quintile (NZDep)
1 (least deprived) 1,211,781 1,225,521 1,017,936 1,267,881
2 1,183,701 1,175,664 1,008,984 1,240,317
3 1,173,612 1,106,049 1,010,547 1,198,434
4 1,185,894 1,029,006 1,039,056 1,154,370
5 (most deprived) 1,213,500 919,434 1,082,865 1,058,613
All numbers are random rounded to near multiple of 3 as per Statistics New Zealand requirements.
Age at beginning of tax year.
Data for healthy and disease combined, stratified by age-group, ethnicity, and deprivation are presented in S4–S6 Tables.
https://doi.org/10.1371/journal.pmed.1003848.t001
PLOS MEDICINE Disease-related income loss for New Zealand
PLOS Medicine | https://doi.org/10.1371/journal.pmed.1003848 November 30, 2021 8 / 19
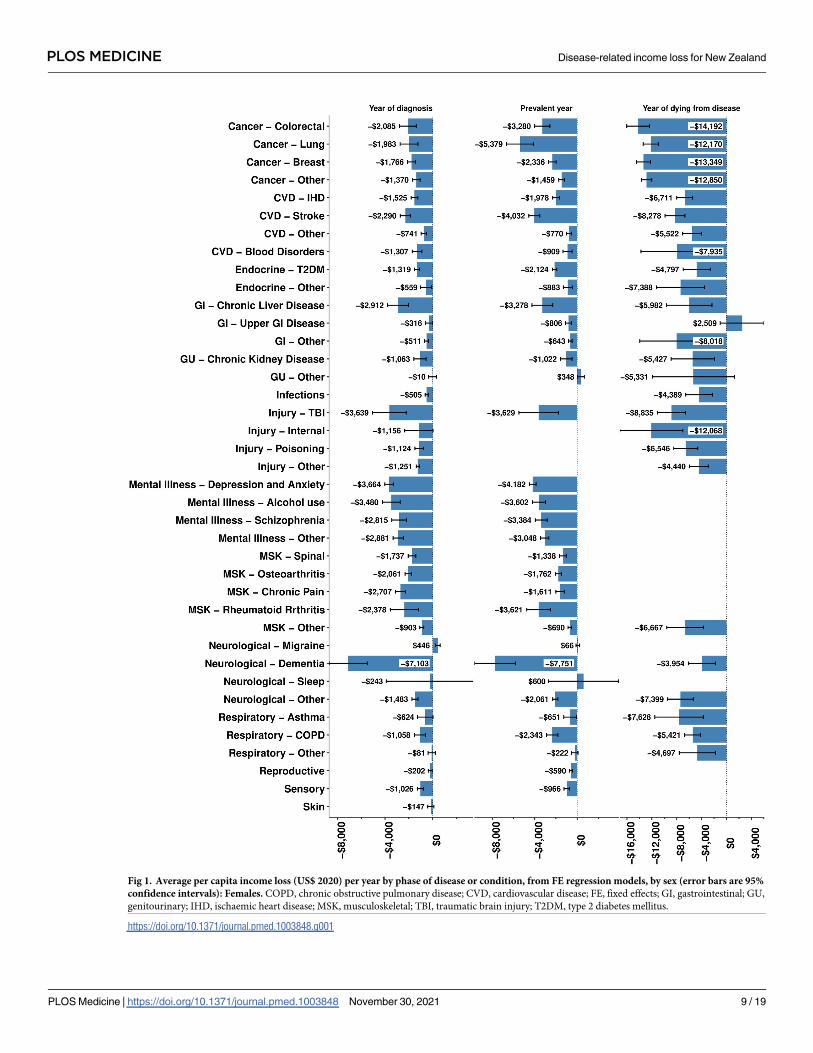
Fig 1. Average per capita income loss (US$ 2020) per year by phase of disease or condition, from FE regression models, by sex (error bars are 95%
confidence intervals): Females. COPD, chronic obstructive pulmonary disease; CVD, cardiovascular disease; FE, fixed effects; GI, gastrointestinal; GU,
genitourinary; IHD, ischaemic heart disease; MSK, musculoskeletal; TBI, traumatic brain injury; T2DM, type 2 diabetes mellitus.
https://doi.org/10.1371/journal.pmed.1003848.g001
PLOS MEDICINE Disease-related income loss for New Zealand
PLOS Medicine | https://doi.org/10.1371/journal.pmed.1003848 November 30, 2021 9 / 19
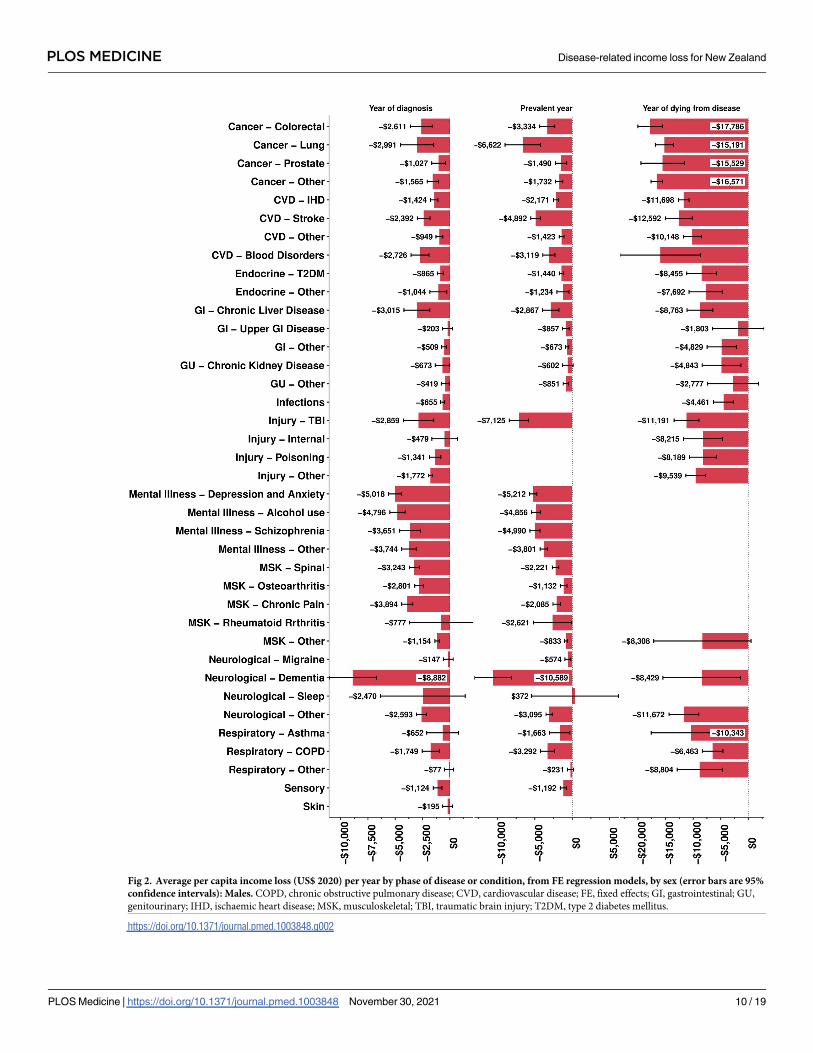
Fig 2. Average per capita income loss (US$ 2020) per year by phase of disease or condition, from FE regression models, by sex (error bars are 95%
confidence intervals): Males. COPD, chronic obstructive pulmonary disease; CVD, cardiovascular disease; FE, fixed effects; GI, gastrointestinal; GU,
genitourinary; IHD, ischaemic heart disease; MSK, musculoskeletal; TBI, traumatic brain injury; T2DM, type 2 diabetes mellitus.
https://doi.org/10.1371/journal.pmed.1003848.g002
PLOS MEDICINE Disease-related income loss for New Zealand
PLOS Medicine | https://doi.org/10.1371/journal.pmed.1003848 November 30, 2021 10 / 19
for males than females (Figs 1 and 2). Cancers tended to have the highest income losses in the
last year of life, e.g., colorectal cancer for males ($17,786, 95% CI $15,555 to $20,018) and
females ($14,192, $12,357 to $16,026).
Objective 2: Population-level estimates of total income loss by disease
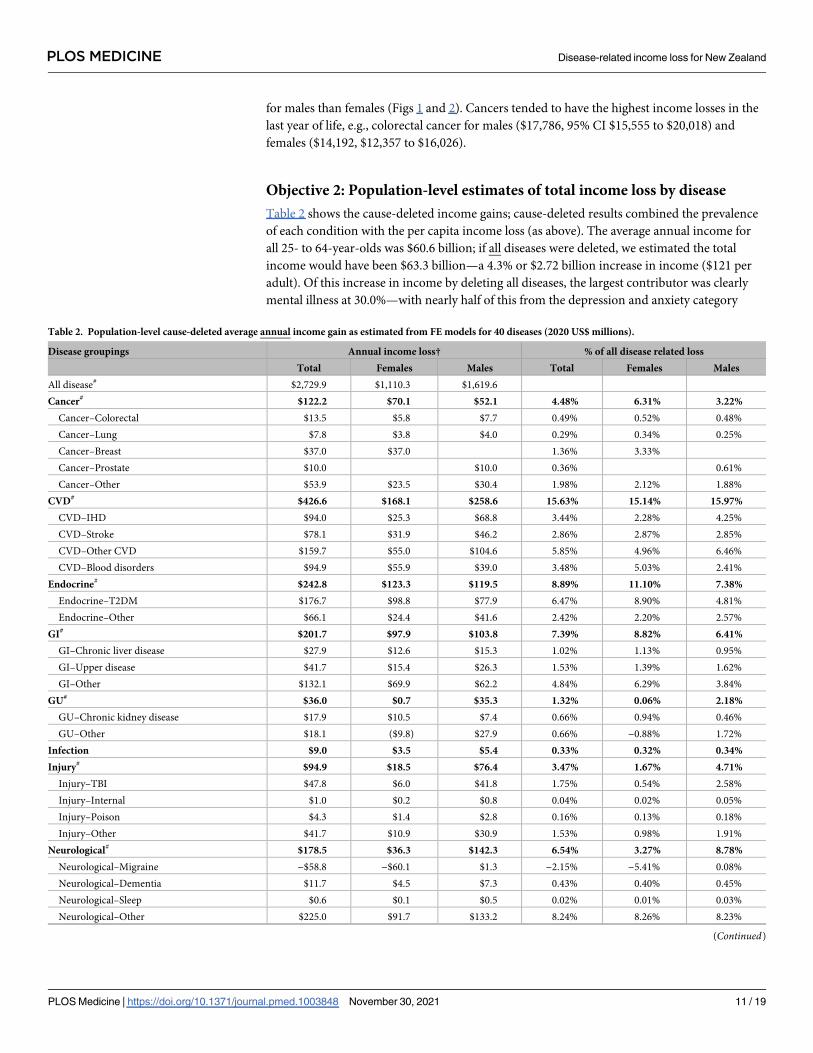
Table 2 shows the cause-deleted income gains; cause-deleted results combined the prevalence
of each condition with the per capita income loss (as above). The average annual income for
all 25- to 64-year-olds was $60.6 billion; if all diseases were deleted, we estimated the total
income would have been $63.3 billion—a 4.3% or $2.72 billion increase in income ($121 per
adult). Of this increase in income by deleting all diseases, the largest contributor was clearly
mental illness at 30.0%—with nearly half of this from the depression and anxiety category
Table 2. Population-level cause-deleted average annual income gain as estimated from FE models for 40 diseases (2020 US$ millions).
Disease groupings Annual income loss† % of all disease related loss
Total Females Males Total Females Males
All disease# $2,729.9 $1,110.3 $1,619.6
Cancer# $122.2 $70.1 $52.1 4.48% 6.31% 3.22%
Cancer–Colorectal $13.5 $5.8 $7.7 0.49% 0.52% 0.48%
Cancer–Lung $7.8 $3.8 $4.0 0.29% 0.34% 0.25%
Cancer–Breast $37.0 $37.0 1.36% 3.33%
Cancer–Prostate $10.0 $10.0 0.36% 0.61%
Cancer–Other $53.9 $23.5 $30.4 1.98% 2.12% 1.88%
CVD# $426.6 $168.1 $258.6 15.63% 15.14% 15.97%
CVD–IHD $94.0 $25.3 $68.8 3.44% 2.28% 4.25%
CVD–Stroke $78.1 $31.9 $46.2 2.86% 2.87% 2.85%
CVD–Other CVD $159.7 $55.0 $104.6 5.85% 4.96% 6.46%
CVD–Blood disorders $94.9 $55.9 $39.0 3.48% 5.03% 2.41%
Endocrine# $242.8 $123.3 $119.5 8.89% 11.10% 7.38%
Endocrine–T2DM $176.7 $98.8 $77.9 6.47% 8.90% 4.81%
Endocrine–Other $66.1 $24.4 $41.6 2.42% 2.20% 2.57%
GI# $201.7 $97.9 $103.8 7.39% 8.82% 6.41%
GI–Chronic liver disease $27.9 $12.6 $15.3 1.02% 1.13% 0.95%
GI–Upper disease $41.7 $15.4 $26.3 1.53% 1.39% 1.62%
GI–Other $132.1 $69.9 $62.2 4.84% 6.29% 3.84%
GU# $36.0 $0.7 $35.3 1.32% 0.06% 2.18%
GU–Chronic kidney disease $17.9 $10.5 $7.4 0.66% 0.94% 0.46%
GU–Other $18.1 ($9.8) $27.9 0.66% −0.88% 1.72%
Infection $9.0 $3.5 $5.4 0.33% 0.32% 0.34%
Injury# $94.9 $18.5 $76.4 3.47% 1.67% 4.71%
Injury–TBI $47.8 $6.0 $41.8 1.75% 0.54% 2.58%
Injury–Internal $1.0 $0.2 $0.8 0.04% 0.02% 0.05%
Injury–Poison $4.3 $1.4 $2.8 0.16% 0.13% 0.18%
Injury–Other $41.7 $10.9 $30.9 1.53% 0.98% 1.91%
Neurological# $178.5 $36.3 $142.3 6.54% 3.27% 8.78%
Neurological–Migraine −$58.8 −$60.1 $1.3 −2.15% −5.41% 0.08%
Neurological–Dementia $11.7 $4.5 $7.3 0.43% 0.40% 0.45%
Neurological–Sleep $0.6 $0.1 $0.5 0.02% 0.01% 0.03%
Neurological–Other $225.0 $91.7 $133.2 8.24% 8.26% 8.23%
(Continued)
PLOS MEDICINE Disease-related income loss for New Zealand
PLOS Medicine | https://doi.org/10.1371/journal.pmed.1003848 November 30, 2021 11 / 19
(13.1%). For aggregated disease categories contributing more than 5% of this total disease-
related income loss, the rank order after mental illness was as follows: cardiovascular disease
(15.6%); musculoskeletal (13.7%), endocrine (8.9%), gastrointestinal (7.4%), and neurological
(6.5%). Other notable findings included type 2 diabetes mellitus contributing to 6.5% of all dis-
ease-related income loss and, conversely, cancer only contributing 4.5% and injury only 3.5%.
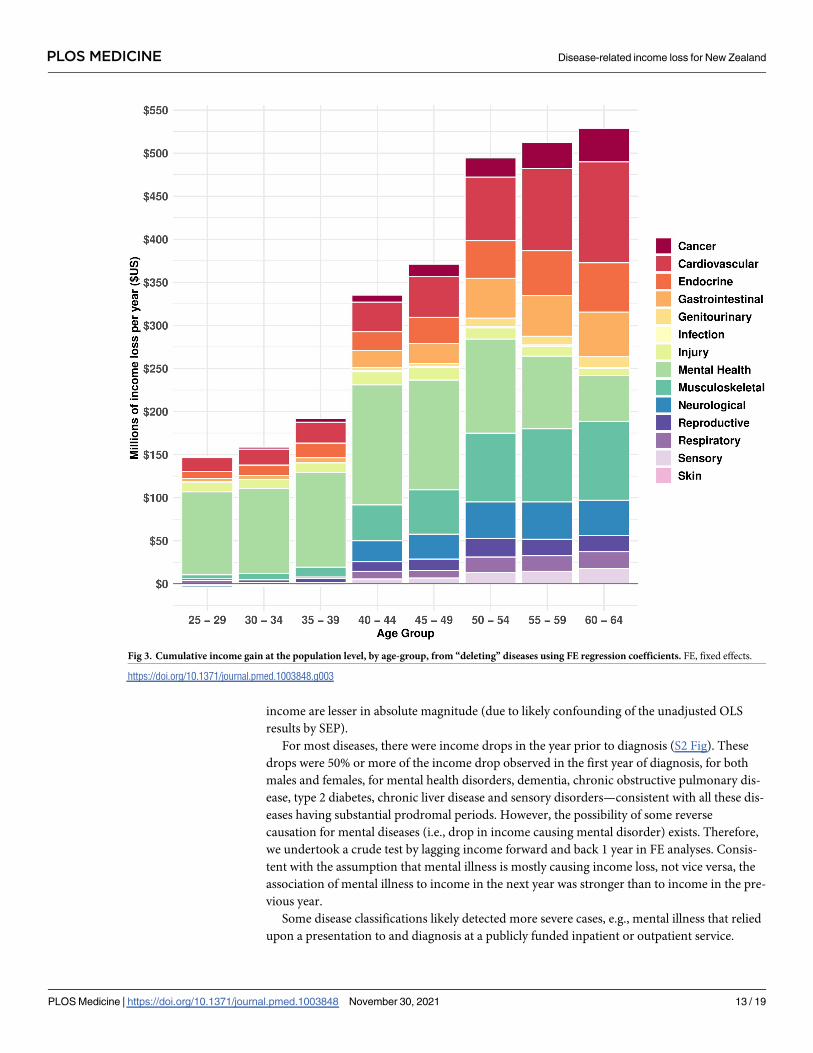
Fig 3 shows the cause-deleted income gains by age (sexes combined) by 14-level grouping.
Unsurprisingly, the income gain increases with age. Mental illness stands out as the major
cause of income loss at younger ages and continues to be a major contributor into older ages.
Conversely, musculoskeletal and the vascular and blood category make increasingly large con-
tributions at older ages.
Sensitivity analyses
S1 Fig shows the comparison of the FE regression results (above) with the between person
OLS regression estimates of income loss per person, and OLS regression on only those with no
disease prior to the observation window and additionally adjusted for average income before
the observation window. First, the income loss estimates are greater using OLS estimates—
more so in absolute terms for last year of life if dying of the disease, but more so relatively for
diagnosis year and prevalent cases. Second, and as expected, the OLS results adjusted for prior
Table 2. (Continued)
Disease groupings Annual income loss† % of all disease related loss
Total Females Males Total Females Males
Mental illness# $817.9 $343.1 $474.8 29.96% 30.90% 29.32%
Mental illness–Depression and anxiety $356.2 $201.5 $154.7 13.05% 18.15% 9.55%
Mental illness–Alcohol $156.1 $37.1 $119.1 5.72% 3.34% 7.35%
Mental illness–Schizophrenia $85.2 $23.9 $61.3 3.12% 2.15% 3.78%
Mental illness–Other $220.5 $80.7 $139.8 8.08% 7.27% 8.63%
MSK# $372.8 $112.2 $260.6 13.66% 10.10% 16.09%
MSK–Spine $106.1 $36.5 $69.6 3.89% 3.29% 4.30%
MSK–Osteoarthritis $41.6 $21.4 $20.1 1.52% 1.93% 1.24%
MSK–Chronic pain $46.6 $15.2 $31.4 1.71% 1.37% 1.94%
MSK–Rheumatoid arthritis $7.0 $5.4 $1.7 0.26% 0.48% 0.10%
MSK–Other $171.5 $33.7 $137.8 6.28% 3.03% 8.51%
Skin $0.7 $0.2 $0.5 0.03% 0.02% 0.03%
Sensory $52.6 $14.9 $37.7 1.93% 1.34% 2.33%
Reproductive $93.7 $93.7 3.43% 8.44%
Respiratory# $80.4 $27.9 $52.6 2.95% 2.51% 3.25%
Respiratory–COPD $25.0 $10.8 $14.2 0.92% 0.97% 0.88%
Respiratory–Asthma $59.6 $28.8 $30.8 2.18% 2.60% 1.90%
Respiratory–Other −$4.2 −$11.8 $7.6 −0.15% −1.06% 0.47%
†The change in income for the total population, between their observed disease status and a counterfactual of the given diseases deleted (i.e., setting disease dummies all
to no disease), using the FE regression coefficients to predict the difference in income between the observed and counterfactual states. Divided by 10 to give annual
income loss. The total disease-related income loss ($2,729 million) was 4.31% of all income earnt if diseases were deleted (4.34% for females, 4.29% for males).#Rather than just one disease’s dummy coefficients being set to 0, all diseases (or all diseases within the given disease grouping) were set to 0.
COPD, chronic obstructive pulmonary disease; CVD, cardiovascular disease; FE, fixed effects; GI, gastrointestinal; GU, genitourinary; IHD, ischaemic heart disease;
MSK, musculoskeletal; TBI, traumatic brain injury; T2DM, type 2 diabetes mellitus.
https://doi.org/10.1371/journal.pmed.1003848.t002
PLOS MEDICINE Disease-related income loss for New Zealand
PLOS Medicine | https://doi.org/10.1371/journal.pmed.1003848 November 30, 2021 12 / 19
income are lesser in absolute magnitude (due to likely confounding of the unadjusted OLS
results by SEP).
For most diseases, there were income drops in the year prior to diagnosis (S2 Fig). These
drops were 50% or more of the income drop observed in the first year of diagnosis, for both
males and females, for mental health disorders, dementia, chronic obstructive pulmonary dis-
ease, type 2 diabetes, chronic liver disease and sensory disorders—consistent with all these dis-
eases having substantial prodromal periods. However, the possibility of some reverse
causation for mental diseases (i.e., drop in income causing mental disorder) exists. Therefore,
we undertook a crude test by lagging income forward and back 1 year in FE analyses. Consis-
tent with the assumption that mental illness is mostly causing income loss, not vice versa, the
association of mental illness to income in the next year was stronger than to income in the pre-
vious year.
Some disease classifications likely detected more severe cases, e.g., mental illness that relied
upon a presentation to and diagnosis at a publicly funded inpatient or outpatient service.
Fig 3. Cumulative income gain at the population level, by age-group, from “deleting” diseases using FE regression coefficients. FE, fixed effects.
https://doi.org/10.1371/journal.pmed.1003848.g003
PLOS MEDICINE Disease-related income loss for New Zealand
PLOS Medicine | https://doi.org/10.1371/journal.pmed.1003848 November 30, 2021 13 / 19
Using mental illness as an example, if we added community dispensed pharmaceuticals (e.g.,
antidepressants) to the case classification algorithm, prevalent person years of depression and
anxiety increased from 3.6% to 14.4%, but commensurately the per person income loss more
than halved (as less severe disease was being included, and conditions other than anxiety and
depression that share the same pharmaceutical treatments). At the aggregate level of all mental
illness, in terms of cause-deleted analyses, the wider case definition using pharmaceuticals
increased the percentage of all income loss from mental illness from 30.0% to 39.9%.
Conversely, excluding pharmaceuticals from all our base–case finding algorithms made lit-
tle difference to FE regression results.
Discussion
Diseases cause substantial income loss. For a counterfactual scenario of no disease and using
income loss from diagnosis to the year of death (but not after the year of death), our results
suggest that the 25- to 64-year-old population’s income would be 4.3% greater. For aggregated
disease categories contributing more than 4% of this total disease-related income loss, the rank
order was as follows: mental illness (30.0%); cardiovascular disease (15.6%); musculoskeletal
(13.7%), endocrine (8.9%), gastrointestinal (7.4%), neurological (6.5%), and cancer (4.5%).
Migraine was the only disease that resulted in a (modest) increase in income, for females only,
but with 95% confidence intervals excluding the null. While it could be a chance finding, it is
also not implausible: A diagnosis of migraine may lead to better treatment and more produc-
tivity; conversely, increased stress in the workplace due to longer hours or more responsibili-
ties with career advancement (and, therefore, income) may trigger migraines. The finding of
high per capita income loss for people with dementia in their first year of diagnosis and if prev-
alent was unexpected but also based on relatively few people (Figs 1 and 2); it may be that
dementias before the age of 65 selectively impact the ability to work of high-income occupa-
tions. Unsurprisingly, there is a strong correlation between aggregate disease-related income
loss and health loss from the same conditions measured in disability-adjusted life years and
years of life lived with disability—due to both being largely driven by the prevalence of the con-
dition (S4 Fig).
The pattern of income loss in the current study is similar to that observed by Kinge and col-
leagues in Norway [4] (see S2 Fig for a comparative breakdown), albeit the Kinge and col-
leagues study used more approximation methods than our actual linked data. Generalizability
to other high-income countries, the duration, and generosity of employer sick leave may vary
with other countries; in our analysis, employer-funded sick leave was not able to be “seen” as it
is simply part of salary or income. Therefore, the reader will need to be aware of this if their
conceptualization of income loss (or productivity loss) includes employer sick pay. Second, the
extent of assistance provided to people with health conditions to return to (paid) work varies
by country. Third, the extent of disease-related income loss is likely to vary with the unemploy-
ment rate. If unemployment is high, then disease-related income loss is likely to be higher due
to a greater pool of competitors for the same job (but, conversely and rather brutally, the pro-
ductivity loss to society will be less as the sick person is more easily “replaced” in the work-
force). Nevertheless, the general patterns we observe likely hold in other countries—and our
study is a valuable template for future comparison studies.
There are 2 main approaches to estimate economic productivity losses: (a) human capital
approach (HCA); and (b) friction cost approach (FCA) [5,6]. In the HCA, productivity losses
are equated to losses of income. In the FCA, the illness and reduced work capacity of an indi-
vidual is assumed to be replaced by another citizen after a certain time if the economy has
structural unemployment or other means to replace workers (e.g., immigration). Our study
PLOS MEDICINE Disease-related income loss for New Zealand
PLOS Medicine | https://doi.org/10.1371/journal.pmed.1003848 November 30, 2021 14 / 19
uses an HCA among the living (i.e., loss of income compared to the participant’s “healthy
self”) and a hybrid approach among decedents whereby income loss in the tax year of death is
included, which on average includes the 6 months predeath and (complete income loss) 6
months postdeath. We do not include income loss in years after death, equivalent to an FCA
of people being “replaceable” in the workforce.
We believe that our study is a substantial advance in methods and data over previous stud-
ies. First, by adjusting for many diseases in one model, we provide estimates of how diseases
compare against one another and prevent overestimation of income loss due to the presence of
comorbidities. Second, we use population-wide linked health and tax data, over 10 years, offer-
ing high power and avoiding selection biases that may arise with panel studies and attrition.
Third, we have data on health conditions prior to the 10-year observation window to ascertain
preexisting health status, which allows us to accurately estimate income loss by stage of
disease.
There are limitations of our study. First, while the income/tax data is an objective income
assessment, it is not perfect for the measure of productivity; employers will continue to pay
employees who are sick during their sickness leave entitlement period, and we had no data on
this. Accordingly, we underestimate “productivity loss” to some extent. It would be a useful
extension to our study to impute this employer-funded sick pay using external survey data—
however, we doubt that it will change the relative income loss and rankings by disease. Second,
our FE regression models remove all time-invariant confounding by design and measured
time-varying confounders, but they are likely to underestimate income loss due to failure to
“capture” any deterioration in income prior to diagnosis using our case finding criteria.
Hence, we ran between-person OLS regression models, for a healthy cohort at the outset and
adjusting for income before the observation window, as a sensitivity analysis. The truth proba-
bly lies somewhere between the FE estimates and the OLS estimates in the model adjusted for
prior income. We favour the FE analyses because it removes time-invariant confounding by
design. Also, in the between-person analyses, we noted patterns consistent with some residual
confounding, for example, in people contracting breast cancer and prostate cancer (which
tend to be higher SEP, the latter due to unequal uptake by SEP in prostate-specific antigen test-
ing) have higher incomes after diagnosis—likely due to residual confounding by SEP. Con-
versely, there are likely competing residual biases in the FE regression towards overestimation.
Residual time-varying confounding likely remains, for example, divorce as a cause of both
income loss and depression. Also, reverse causation may inflate some estimates, for example,
again the mental health estimates whereby low income causes poor mental health (although in
sensitivity analyses, we found that the association of mental illness with income loss lagged 1
year was stronger than the association of income with mental illness lagged 1 year—suggesting
that any reverse causation is “less” than the direction of causation we assumed).
We find that absolute income losses by disease are generally higher for males than females,
but relative income losses are similar—reflecting known inequities in pay between males and
females. However, it must be noted that we used a population-wide approach, not an analysis
restricted to only those employed. Given that females have lower workforce participation, our
estimated income loss among all females getting a disease will for this reason alone be less than
among all males (with higher employment rates) getting the same disease. If results such as
ours are to be used in prioritising health interventions based on their ability to improve indi-
vidual incomes and aggregate productivity, we recommend careful attention to, and correction
for, structural societal inequalities. A similar argument applies to diseases with varying rates by
ethnicity and SEP; income loss by disease will vary in at least one of absolute or relative terms
by SEP. Also, there may be subadditive or superadditive impacts on income loss from having
2, 3, or more conditions compared to the independent and separate (unconfounded) income
PLOS MEDICINE Disease-related income loss for New Zealand
PLOS Medicine | https://doi.org/10.1371/journal.pmed.1003848 November 30, 2021 15 / 19
loss for each condition as reported in this paper. These questions were beyond the scope of
this study and will be pursued as additional follow-up publications.
There are important implications of this study. First, disease advocacy groups and research-
ers often invoke large estimates of the economic impact of their disease of choice, using studies
with highly variable methods and not allowing for comorbidity. Our analysis provides a realistic
and “confined within the total income envelope” estimate of income loss, conducted compara-
tively across diseases. Second, a major implication of our study is that preventing diseases that
cause substantial income loss to individuals, and economic productivity loss to society at the
aggregate level, justify greater weighting in prioritising intervention programmes. For example,
our findings suggest that preventing mental illness, musculoskeletal diseases, and cardiovascular
disease might justify some more weighting, if we also value the contribution of health interven-
tions to economic outcomes. While the exact absolute value of income loss in our study is sub-
ject to our assumptions, the relative comparisons are robust between diseases—all diseases were
analysed together with similar assumptions. We argue that such comparability of estimates by
disease, especially by phase of disease, at least within one country, opens a useful policy door to
estimating the impact of interventions (e.g., salt reduction in bread that lowers stroke and
ischaemic heart disease rates, e.g., obesity reduction programmes; e.g., treatments) on income
loss in addition to the usual health gain and health expenditure impacts. Such additional analy-
ses should be a useful adjunct to prioritise health interventions, if a desirable additional impact
of interventions in the health sector is improvements in economic productivity. However, such
analyses must be handled carefully, given the potential equity implications (e.g., sex as above).
In summary, we used a unique data base of repeated disease and tax income measures on
an entire population. FE regression estimated the within-individual change in income when
developing disease among 25- to 64-year-olds. Income loss among individuals developing dis-
ease was highest for dementia (noting this was dementia onset before the age of 65 years), fol-
lowed by mental illness. From a total population perspective, combining the prevalence of
disease with the income loss estimates per individual, the 3 largest causes of income loss were
mental illness, cardiovascular disease, and musculoskeletal diseases. Our study is a major
advance, including all diseases simultaneously and quantifying within-individual income loss.
We encourage other countries to also conduct such comparable analyses and then further to
trial including such income loss estimates as additional considerations in intervention prioriti-
sation with policymakers.
Supporting information
S1 Table. Disease and condition case definitions.
(DOCX)
S2 Table. Observation person-years and total income (2020 US$, millions) by diseases by
phase.
(DOCX)
S3 Table. Annual income loss (US$ 2020) for 14 and 40 diseases and conditions models
predicted by fixed effects regression for 50- to 54-year-olds (95% confidence intervals in
parentheses).
(DOCX)
S4 Table. Descriptive data (healthy and diseased combined) within observational window
2006–2007 to 2015–2016 by sex and age.
(DOCX)
PLOS MEDICINE Disease-related income loss for New Zealand
PLOS Medicine | https://doi.org/10.1371/journal.pmed.1003848 November 30, 2021 16 / 19
S5 Table. Descriptive data (healthy and diseased combined) within observational window
2006–2007 to 2015–2016 by sex and ethnicity.
(DOCX)
S6 Table. Descriptive data (healthy and combined) within observational window 2006–
2007 to 2015–2016 by sex and deprivation.
(DOCX)
S7 Table. Annual income loss (US$ 2020) for 14 and 40 disease models predicted by OLS
regression for 50- to 54-year-olds (95% confidence intervals in parentheses).
(DOCX)
S1 Fig. Annual income loss by disease phase for 3 model specifications: FE (main analysis);
OLS unadjusted for prior income; OLS adjusted for prior income and restricted to health
people at beginning of observation window. COPD, chronic obstructive pulmonary disease;
CVD, cardiovascular disease; FE, fixed effects; GI, gastrointestinal; GU, genitourinary; MSK,
musculoskeletal; OLS, ordinary least squares; TBI, traumatic brain injury; T2DM, type 2 diabe-
tes mellitus.
(DOCX)
S2 Fig. Comparison of income within-individual income change for year before diagnosis
and first year of diagnosis, FE model. COPD, chronic obstructive pulmonary disease; CVD,
cardiovascular disease; FE, fixed effects; GI, gastrointestinal; GU, genitourinary; MSK, muscu-
loskeletal; TBI, traumatic brain injury; T2DM, type 2 diabetes mellitus.
(DOCX)
S3 Fig. Proportionate contribution of diseases to HCA productivity loss in Norway in 2013
[4]. HCA, human capital approach.
(DOCX)
S4 Fig. Cause-deleted income gain, plotted against YLDs and DALYs in 2011 from the
GBD for 25- to 64-year-olds in NZ. CVD, cardiovascular disease; DALY, disability-adjusted
life year; IHD, ischaemic heart disease; YLD, years lost to disability.
(DOCX)
S1 Checklist. The RECORD statement—Checklist of items, extended from the STROBE
statement, which should be reported in observational studies using routinely collected
health data.
(DOCX)
Acknowledgments
We thank Sheree Gibbs and Jonas Kinge for comments on drafts of the paper.
The opinions, findings, recommendations, and conclusions expressed in this file are those
of the author(s), not Statistics NZ, Ministry of Health, or Inland Revenue.
Statistics NZ statement
The results in this paper are not official statistics. They have been created for research purposes
from the Integrated Data Infrastructure (IDI), managed by Statistics New Zealand.
Access to the anonymised data used in this study was provided by Statistics NZ under the
security and confidentiality provisions of the Statistics Act 1975. Only people authorised by
the Statistics Act 1975 are allowed to see data about a particular person, household, business,
PLOS MEDICINE Disease-related income loss for New Zealand
PLOS Medicine | https://doi.org/10.1371/journal.pmed.1003848 November 30, 2021 17 / 19
or organisation, and the results in this file have been confidentialised to protect these groups
from identification and to keep their data safe.
Careful consideration has been given to the privacy, security, and confidentiality issues
associated with using administrative and survey data in the IDI. Further detail can be found in
the Privacy impact assessment for the Integrated Data Infrastructure available from www.stats.
govt.nz.
The results are based in part on tax data supplied by Inland Revenue to Statistics NZ under
the Tax Administration Act 1994. This tax data must be used only for statistical purposes, and
no individual information may be published or disclosed in any other form, or provided to
Inland Revenue for administrative or regulatory purposes.
Any person who has had access to the unit record data has certified that they have been
shown, have read, and have understood section 81 of the Tax Administration Act 1994, which
relates to secrecy. Any discussion of data limitations or weaknesses is in the context of using
the IDI for statistical purposes and is not related to the data’s ability to support Inland Reve-
nue’s core operational requirements.
Author Contributions
Conceptualization: Tony Blakely, Joseph Dieleman, Nick Wilson.
Formal analysis: Finn Sigglekow, Muhammad Irfan, Anja Mizdrak, Laxman Bablani.
Methodology: Tony Blakely, Finn Sigglekow, Joseph Dieleman.
Resources: Tony Blakely, Nick Wilson.
Supervision: Tony Blakely.
Writing – original draft: Tony Blakely.
Writing – review & editing: Tony Blakely, Finn Sigglekow, Muhammad Irfan, Anja Mizdrak,
Joseph Dieleman, Laxman Bablani, Philip Clarke, Nick Wilson.
References1. Berkowitz M, Johnson WG. Health and Labor Force Participation. J Hum Resour. 1974; 9(1):117–28.
https://doi.org/10.2307/145048
2. Garland A, Jeon SH, Stepner M, Rotermann M, Fransoo R, Wunsch H, et al. Effects of cardiovascular
and cerebrovascular health events on work and earnings: a population-based retrospective cohort
study. CMAJ. 2019; 191(1):E3–E10. Epub 2019 Jan 9. https://doi.org/10.1503/cmaj.181238 PMID:
30617227
3. Boom D, Canning CG, Kotschy K, Prettner K, Schunemann J. Health and economic growth: reconciling
the micro and macro evidence. NBER Working Papers. 2019;(26003).
4. Kinge JM, Saelensminde K, Dieleman J, Vollset SE, Norheim OF. Economic losses and burden of dis-
ease by medical conditions in Norway. Health Policy. 2017; 121(6):691–8. Epub 2017 May 4. https://
doi.org/10.1016/j.healthpol.2017.03.020 PMID: 28461038.
5. Krol M, Brouwer W, Rutten F. Productivity costs in economic evaluations: past, present, future. Pharma-
coeconomics. 2013; 31(7):537–49. https://doi.org/10.1007/s40273-013-0056-3 PMID: 23620213.
6. Pritchard C, Sculpher M. Productivity Costs: Principles and Practice in Economic Evaluation. London:
Office of Health Economics; 2000.
7. Herrin J, Cangialose CB, Boccuzzi SJ, Weintraub WS, Ballard DJ. Household Income Losses Associ-
ated With Ischaemic Heart Disease For US Employees. Pharmacoeconomics. 2000; 17(3):304–14.
https://doi.org/10.2165/00019053-200017030-00008 PMID: 10947305
8. Wolfe F, Michaud K, Choi HK, Williams R. Household income and earnings losses among 6,396 per-
sons with rheumatoid arthritis. J Rheumatol. 2005; 32(10):1875–83. PMID: 16206340
PLOS MEDICINE Disease-related income loss for New Zealand
PLOS Medicine | https://doi.org/10.1371/journal.pmed.1003848 November 30, 2021 18 / 19
9. Zajacova A, Dowd JB, Schoeni RF, Wallace RB. Employment and income losses among cancer survi-
vors: Estimates from a national longitudinal survey of American families. Cancer. 2015; 121(24):4425–
32. Epub 2015 Oct 27. https://doi.org/10.1002/cncr.29510 PMID: 26501494
10. Persson S, Johansen P, Andersson E, Lindgren P, Thielke D, Thorsted BL, et al. Days absent from
work as a result of complications associated with type 2 diabetes: Evidence from 20 years of linked
national registry data in Sweden. Diabetes Obes Metab. 2020; 22(9):1586–97. Epub 2020 Apr 25.
https://doi.org/10.1111/dom.14070 PMID: 32329136
11. Dahl FA, Saltytė Benth J, Aas E, Lurås H. Economic productivity loss due to breast cancer in Norway–a
case control study using the human capital approach. Nord J Health Econ. 2017; 5(2):70–83. https://
doi.org/10.5617/njhe.2981
12. Haikonen K, Lillsunde PM. Burden of Fire Injuries in Finland: Lost Productivity and Benefits. J Public
Health Res. 2016; 5(2):705. https://doi.org/10.4081/jphr.2016.705 PMID: 27747204.
13. Carter HE, Schofield D, Shrestha R. The long-term productivity impacts of all cause premature mortality
in Australia. Aust N Z J Public Health. 2017; 41(2):137–43. https://doi.org/10.1111/1753-6405.12604
PMID: 27868363
14. Zheng H, Ehrlich F, Amin J. Productivity loss resulting from coronary heart disease in Australia. Appl
Health Econ Health Policy. 2010; 8(3):179–89. https://doi.org/10.2165/11530520-000000000-00000
PMID: 20408602
15. Milne BJ, Atkinson J, Blakely T, Day H, Douwes J, Gibb S, et al. Data Resource Profile: The New Zea-
land Integrated Data Infrastructure (IDI). Int J Epidemiol. 2019; 48(3):677–e. Epub 2019 Feb 23. https://
doi.org/10.1093/ije/dyz014 PMID: 30793742.
16. Gibb S, Bycroft C, Matheson-Dunning N. Identifying the New Zealand resident population in the Inte-
grated Data Infrastructure (IDI). Wellington: Statistic New Zealand, 2016 Contract No.: ISBN: 978-0-
908350-33-9 (online).
17. Ministry of Health. Health Loss in New Zealand: A report from the New Zealand Burden of Diseases,
Injuries and Risk Factors Study, 2006–2016. Wellington: Ministry of Health, 2013 Contract No.: ISBN:
978-0-478-40297-1 (online).
18. Ministry of Health. Health Loss in New Zealand 1990–2013: A report from the New Zealand Burden of
Diseases, Injuries and Risk Factors Study. Wellington: Ministry of Health, 2016 Contract No.: ISBN:
978-0-947515-39-3 (online).
19. Costilla R, Tobias M, Blakely T. The burden of cancer in New Zealand: a comparison of incidence and
DALY metrics and its relevance for ethnic disparities. Aust N Z J Public Health. 2013; 37(3):218–25.
Epub 2013 Jun 5. https://doi.org/10.1111/1753-6405.12062 PMID: 23731103.
20. Salmond C, Crampton P, Atkinson J. NZDep2006 Index of Deprivation. Wellington: Department of
Public Health, University of Otago; 2007.
21. Blakely T, Kvizhinadze G, Atkinson J, Dieleman J, Clarke P. Health system costs for individual and
comorbid noncommunicable diseases: An analysis of publicly funded health events from New Zealand.
PLoS Med. 2019; 16(1):e1002716. Epub 2019 Jan 9. https://doi.org/10.1371/journal.pmed.1002716
PMID: 30620729
22. Barlow WEP. Overview of Methods to Estimate the Medical Costs of Cancer. Med Care. 2009; 47
(7_Supplement_1):S33–S6. https://doi.org/10.1097/MLR.0b013e3181a2d847 PMID: 19536013
23. Fireman BH, Quesenberry CP, Somkin CP, Jacobson AS, Baer D, West D, et al. Cost of care for cancer
in a health maintenance organization. Health Care Financ Rev. 1997; 18(4):51–76. Epub 1997 Jul 1.
PMID: 10175613.
24. Lipscomb J, Barnett PG, Brown ML, Lawrence W, Yabroff KR. Advancing the science of health care
costing. Med Care. 2009; 47(7 Suppl 1):S120–6. Epub 2009 Jun 19. https://doi.org/10.1097/MLR.
0b013e3181a9d366 PMID: 19536003.
25. Mariotto AB, Yabroff KR, Shao Y, Feuer EJ, Brown ML. Projections of the cost of cancer care in the
United States: 2010–2020.[Erratum appears in J Natl Cancer Inst. 2011 Apr 20;103(8):699]. J Natl Can-
cer Inst. 2011; 103(2):117–28. https://doi.org/10.1093/jnci/djq495 PMID: 21228314
26. Gunasekara FI, Richardson K, Carter K, Blakely T. Fixed effects analysis of repeated measures data.
Int J Epidemiol. 2014; 43(1):264–9. https://doi.org/10.1093/ije/dyt221 PMID: 24366487.
PLOS MEDICINE Disease-related income loss for New Zealand
PLOS Medicine | https://doi.org/10.1371/journal.pmed.1003848 November 30, 2021 19 / 19
Minerva Access is the Institutional Repository of The University of Melbourne
Author/s:Blakely, T;Sigglekow, F;Irfan, M;Mizdrak, A;Dieleman, J;Bablani, L;Clarke, P;Wilson, N
Title:Disease-related income and economic productivity loss in New Zealand: A longitudinalanalysis of linked individual-level data
Date:2021-11-01
Citation:Blakely, T., Sigglekow, F., Irfan, M., Mizdrak, A., Dieleman, J., Bablani, L., Clarke, P. &Wilson, N. (2021). Disease-related income and economic productivity loss in New Zealand:A longitudinal analysis of linked individual-level data. PLOS MEDICINE, 18 (11), https://doi.org/10.1371/journal.pmed.1003848.
Persistent Link:http://hdl.handle.net/11343/296294
License:CC BY
Related Documents