DISCRETE WAVELET PACKET TRANSFORM FOR ELECTROENCEPHALOGRAM BASED VALENCE-AROUSAL EMOTION RECOGNITION OYENUGA WASIU OLAKUNLE MASTER OF SCIENCE UNIVERSITI UTARA MALAYSIA 2015

Welcome message from author
This document is posted to help you gain knowledge. Please leave a comment to let me know what you think about it! Share it to your friends and learn new things together.
Transcript

DISCRETE WAVELET PACKET TRANSFORM FOR
ELECTROENCEPHALOGRAM BASED VALENCE-AROUSAL
EMOTION RECOGNITION
OYENUGA WASIU OLAKUNLE
MASTER OF SCIENCE
UNIVERSITI UTARA MALAYSIA
2015

i
Permission to Use
In presenting this thesis in fulfilment of the requirements for a postgraduate degree
from Universiti Utara Malaysia, I agree that the Universiti Library may make it
freely available for inspection. I further agree that permission for the copying of this
thesis in any manner, in whole or in part, for scholarly purpose may be granted by
my supervisor(s) or, in their absence, by the Dean of Awang Had Salleh Graduate
School of Arts and Sciences. It is understood that any copying or publication or use
of this thesis or parts thereof for financial gain shall not be allowed without my
written permission. It is also understood that due recognition shall be given to me
and to Universiti Utara Malaysia for any scholarly use which may be made of any
material from my thesis.
Requests for permission to copy or to make other use of materials in this thesis, in
whole or in part, should be addressed to:
Dean of Awang Had Salleh Graduate School of Arts and Sciences
UUM College of Arts and Sciences
Universiti Utara Malaysia
06010 UUM Sintok
ii
Abstrak
Pengecaman emosi berasaskan elektroensefalogram (EEG) telah mendapat
perhatian yang tinggi.Hal ini disebabkan ianya adalah suatu kaedah tak invasif
untuk mendapatkan isyarat daripada otak dan ianya boleh menunjukkan keadaan
emosi secara terus. Walau bagaimanapun, isu-isu yang mencabar berkaitan
pengecaman keadaan emosi berasaskan EEG ini adalah ianya memerlukan kaedah
dan algoritma yang direka bentuk dengan baik dan proses untuk mendapatkan ciri-
ciri yang diperlukan daripada isyarat EEG yang kompleks, tidak menentu dan
berbilang saluran demi memperoleh prestasi pengelasan yang optimum. Tujuan
kajian ini adalah untuk membongkar kaedah pengeluaran ciri dan kombinasi
beberapa saluran elektrod yang melaksanakan pengecaman emosi valens-
kebangkitan yang berasaskan EEG yang optimum. Berdasarkan hal ini, eksperimen
telah dijalankan terhadap dua pengecaman emosi untuk mengelaskan keadaan
emosi manusia kepada valens tinggi/rendah atau kebangkitan tinggi/rendah.
Eksperimen yang pertama bertujuan untuk menilai prestasi Pengubahan Diskret
Riak Paket (DWPT) sebagai satu kaedah pengeluaran ciri. Eksperimen kedua
adalah bertujuan untuk mengenalpasti kombinasi saluran-saluran elektrod yang
mengecam emosi dengan optimum berdasarkan model valens-kebangkitan dalam
pengecaman emosi EEG. Dalam menilai hasil kajian ini, satu penanda aras
digunakan untuk melaksanakan pengelasan emosi. Dalam eksperimen pertama, ciri-
ciri entropi bagi jalur teta, alfa, beta dan gama dikeluarkan melalui 10 saluran EEG
iaitu Fp1, Fp2, F3, F4, T7, T8, P3, P4, O1, dan O2 menggunakan DWPT dengan
Mesin Jejarian Asas Fungsi-Sokongan Vektor (RBF-SVM) digunakan sebagai
pengelas. Dalam eksperimen kedua, eksperimen pengelasan diulang dengan
menggunakan 4 saluran frontal EEG Fp1, Fp2, F3 dan F4. Keputusan eksperimen
pertama menunjukkan ciri-ciri entropi yang dikeluarkan dengan menggunakan
DWPT adalah lebih baik daripada ciri-ciri kuasa jalur. Manakala keputusan
eksperimen pengelasan kedua menunjukkan kombinasi 4 saluran frontal lebih
signifikan daripada kombinasi 10 saluran.
Kata kunci: Pengubahan Diskret Riak Paket, Elektroensefalogram, Pengecaman
emosi, Entropi, Fungsi Jejarian Asas, Mesin vektor sokongan.
iii
Abstract
Electroencephalogram (EEG) based emotion recognition has received considerable
attention as it is a non-invasive method of acquiring physiological signals from the
brain and it could directly reflect emotional states. However, the challenging issues
regarding EEG-based emotional state recognition is that it requires well-designed
methods and algorithms to extract necessary features from the complex, chaotic, and
multichannel EEG signal in order to achieve optimum classification performance.
The aim of this study is to discover the feature extraction method and the
combination of electrode channels that optimally implements EEG-based valence-
arousal emotion recognition. Based on this, two emotion recognition experiments
were performed to classify human emotional states into high/low valence or
high/low arousal. The first experiment was aimed to evaluate the performance of
Discrete Wavelet Packet Transform (DWPT) as a feature extraction method. The
second experiment was aimed at identifying the combination of electrode channels
that optimally recognize emotions based on the valence-arousal model in EEG
emotion recognition. In order to evaluate the results of this study, a benchmark EEG
dataset was used to implement the emotion classification. In the first experiment, the
entropy features of the theta, alpha, beta, and gamma bands through the 10 EEG
channels Fp1, Fp2, F3, F4, T7, T8, P3, P4, O1, and O2 were extracted using DWPT
and Radial Basis Function-Support Vector Machine (RBF-SVM) was used as the
classifier. In the second experiment, the classification experiments were repeated
using the 4 EEG frontal channels Fp1, Fp2, F3, and F4. The result of the first
experiment showed that entropy features extracted using DWPT are better than
bandpower features. While the result of the second classification experiment shows
that the combination of the 4 frontal channels is more significant than the
combination of the 10 channels.
Keywords: Discrete wavelet packet transform, Electroencephalogram, Emotion
recognition, Entropy, Radial basis function, Support vector machine.

iv
Acknowledgement
All praise is due to Allah, who by His grace I completed this task. May His peace
and blessing be upon His prophet, Muhammad (S.A.W.).
Special thanks to my Mother and Father for their love and guidance. I also thank my
dear wife for her love, passion and understanding throughout my studies. I wish to
also thank my brothers and sisters for caring about me during times of ease and
hardship. I will like to show gratitude to my supervisor Dr. Farzana Kabir Ahmad for
her guidance and patience during this research work. I will also like to extend my
gratitude to Associate Professor Fadzilah Siraj, Dr. Nooraini Yusoff, Dr. Husniza
Husni, and Dr. Azizi Bin Ab Aziz, I have gained a lot from them all that have
contributed to the success of this work.
Thank you all may Allah help you too.
v
Table of Contents
Permission to Use ..................................................................................................................... i
Abstrak ..................................................................................................................................... ii
Abstract ................................................................................................................................... iii
Acknowledgement .................................................................................................................. iv
Table of Contents ..................................................................................................................... v
List of Tables ........................................................................................................................ viii
List of Figures ......................................................................................................................... ix
List of Abbreviations .............................................................................................................. xi
CHAPTER ONE INTRODUCTION ..................................................................... 12
1.1 Introduction .......................................................................................................... 12
1.2 Background of the Study ...................................................................................... 13
1.2.1 Emotion Recognition ................................................................................. 13
1.2.2 Brain Activities in Emotional States .......................................................... 14
1.2.3 Methods of Acquiring Electrical Signals from the Brain .......................... 19
1.2.4 Characteristics of EEG Signals .................................................................. 21
1.2.5 Emotion Elicitation .................................................................................... 22
1.2.6 Modelling Emotional States ....................................................................... 23
1.2.7 EEG-Based Emotion Recognition ............................................................. 24
1.3 Problem Statements .............................................................................................. 25
1.4 Research Questions .............................................................................................. 28
1.5 Research Objectives ............................................................................................. 28
1.6 Significance of the Study ..................................................................................... 29
1.7 Scope of the Study ............................................................................................... 29
1.8 Organization of the Report ................................................................................... 30
1.9 Chapter Summary................................................................................................. 30
CHAPTER TWO LITERATURE REVIEW ........................................................ 31
2.1 Introduction .......................................................................................................... 31
2.2 EEG-Based Emotion Recognition Process .......................................................... 31
2.2.1 EEG Signal Acquisition Phase ................................................................... 32
vi
2.2.2 Pre-Processing Phase ................................................................................. 35
2.2.3 Feature Extraction Phase ............................................................................ 35
2.2.4 Feature Selection Phase ............................................................................. 37
2.2.5 Classification Phase ................................................................................... 38
2.3 DEAP EEG Dataset Details ................................................................................. 39
2.3.1 MATLAB Pre-Processed DEAP EEG Dataset Description ...................... 39
2.3.2 Previous Works on Emotion Recognition Using DEAP EEG Dataset ...... 43
2.4 DWPT Details ...................................................................................................... 46
2.5 RBF-SVM Details ................................................................................................ 48
2.5.1 SVM as A Linear Classifier ....................................................................... 48
2.5.2 Soft Margin Extension ............................................................................... 51
2.5.3 SVM as a Non-linear classifier .................................................................. 52
2.5.4 Prameter Selection ..................................................................................... 52
2.6 Signal Processing Tool ......................................................................................... 53
2.7 Chapter Summary................................................................................................. 54
CHAPTER THREE METHODOLOGY ............................................................... 55
3.1 Introduction .......................................................................................................... 55
3.2 Phase 1 ................................................................................................................. 55
3.3 Phase 2 ................................................................................................................. 57
3.4 Phase 3 ................................................................................................................. 70
3.5 Chapter Summary................................................................................................. 81
CHAPTER FOUR RESULTS ................................................................................. 82
4.1 Phase 1 Results: Algorithm for DWPT and Entropy ........................................... 82
4.2 Phase 2 Results ..................................................................................................... 85
4.2.1 Average Accuracy and F1-Score for 10 Channels ..................................... 85
4.2.2 Results of DWPT Compared With Powerband.......................................... 87
4.3 Phase 3 Results ..................................................................................................... 89
4.3.1 Averagre Accuracy and F1-Score for 4 Channels ..................................... 89
4.3.2 Results of 4 Channels Compared With 10 Channels ................................. 92
4.4 Chapter Summary................................................................................................. 94
CHAPTER FIVE CONCLUSION ......................................................................... 95

vii
REFERENCES ......................................................................................................... 97
viii
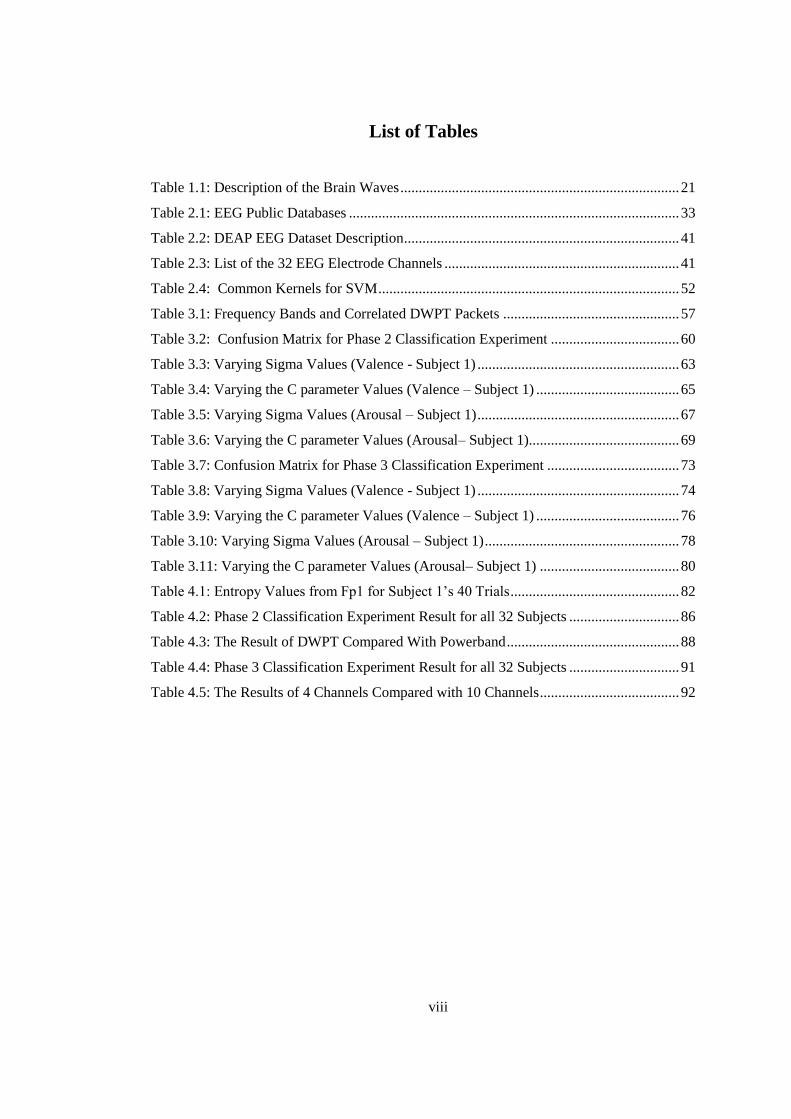
List of Tables
Table 1.1: Description of the Brain Waves ............................................................................ 21
Table 2.1: EEG Public Databases .......................................................................................... 33
Table 2.2: DEAP EEG Dataset Description ........................................................................... 41
Table 2.3: List of the 32 EEG Electrode Channels ................................................................ 41
Table 2.4: Common Kernels for SVM .................................................................................. 52
Table 3.1: Frequency Bands and Correlated DWPT Packets ................................................ 57
Table 3.2: Confusion Matrix for Phase 2 Classification Experiment ................................... 60
Table 3.3: Varying Sigma Values (Valence - Subject 1) ....................................................... 63
Table 3.4: Varying the C parameter Values (Valence – Subject 1) ....................................... 65
Table 3.5: Varying Sigma Values (Arousal – Subject 1) ....................................................... 67
Table 3.6: Varying the C parameter Values (Arousal– Subject 1)......................................... 69
Table 3.7: Confusion Matrix for Phase 3 Classification Experiment .................................... 73
Table 3.8: Varying Sigma Values (Valence - Subject 1) ....................................................... 74
Table 3.9: Varying the C parameter Values (Valence – Subject 1) ....................................... 76
Table 3.10: Varying Sigma Values (Arousal – Subject 1) ..................................................... 78
Table 3.11: Varying the C parameter Values (Arousal– Subject 1) ...................................... 80
Table 4.1: Entropy Values from Fp1 for Subject 1’s 40 Trials .............................................. 82
Table 4.2: Phase 2 Classification Experiment Result for all 32 Subjects .............................. 86
Table 4.3: The Result of DWPT Compared With Powerband ............................................... 88
Table 4.4: Phase 3 Classification Experiment Result for all 32 Subjects .............................. 91
Table 4.5: The Results of 4 Channels Compared with 10 Channels ...................................... 92
ix
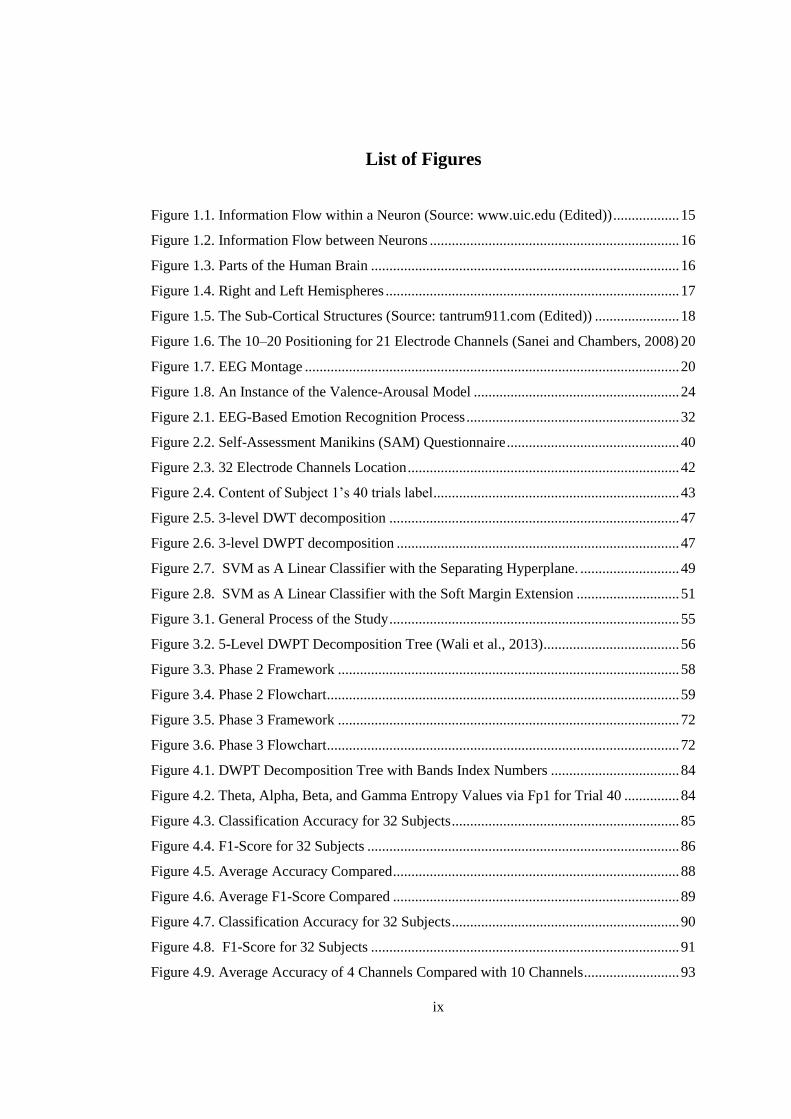
List of Figures
Figure 1.1. Information Flow within a Neuron (Source: www.uic.edu (Edited)) .................. 15
Figure 1.2. Information Flow between Neurons .................................................................... 16
Figure 1.3. Parts of the Human Brain .................................................................................... 16
Figure 1.4. Right and Left Hemispheres ................................................................................ 17
Figure 1.5. The Sub-Cortical Structures (Source: tantrum911.com (Edited)) ....................... 18
Figure 1.6. The 10–20 Positioning for 21 Electrode Channels (Sanei and Chambers, 2008) 20
Figure 1.7. EEG Montage ...................................................................................................... 20
Figure 1.8. An Instance of the Valence-Arousal Model ........................................................ 24
Figure 2.1. EEG-Based Emotion Recognition Process .......................................................... 32
Figure 2.2. Self-Assessment Manikins (SAM) Questionnaire ............................................... 40
Figure 2.3. 32 Electrode Channels Location .......................................................................... 42
Figure 2.4. Content of Subject 1’s 40 trials label ................................................................... 43
Figure 2.5. 3-level DWT decomposition ............................................................................... 47
Figure 2.6. 3-level DWPT decomposition ............................................................................. 47
Figure 2.7. SVM as A Linear Classifier with the Separating Hyperplane. ........................... 49
Figure 2.8. SVM as A Linear Classifier with the Soft Margin Extension ............................ 51
Figure 3.1. General Process of the Study ............................................................................... 55
Figure 3.2. 5-Level DWPT Decomposition Tree (Wali et al., 2013) ..................................... 56
Figure 3.3. Phase 2 Framework ............................................................................................. 58
Figure 3.4. Phase 2 Flowchart ................................................................................................ 59
Figure 3.5. Phase 3 Framework ............................................................................................. 72
Figure 3.6. Phase 3 Flowchart ................................................................................................ 72
Figure 4.1. DWPT Decomposition Tree with Bands Index Numbers ................................... 84
Figure 4.2. Theta, Alpha, Beta, and Gamma Entropy Values via Fp1 for Trial 40 ............... 84
Figure 4.3. Classification Accuracy for 32 Subjects .............................................................. 85
Figure 4.4. F1-Score for 32 Subjects ..................................................................................... 86
Figure 4.5. Average Accuracy Compared .............................................................................. 88
Figure 4.6. Average F1-Score Compared .............................................................................. 89
Figure 4.7. Classification Accuracy for 32 Subjects .............................................................. 90
Figure 4.8. F1-Score for 32 Subjects .................................................................................... 91
Figure 4.9. Average Accuracy of 4 Channels Compared with 10 Channels .......................... 93

x
Figure 4.10. Average F1-Score of 4 Channels Compared with 10 Channels ........................ 94
xi
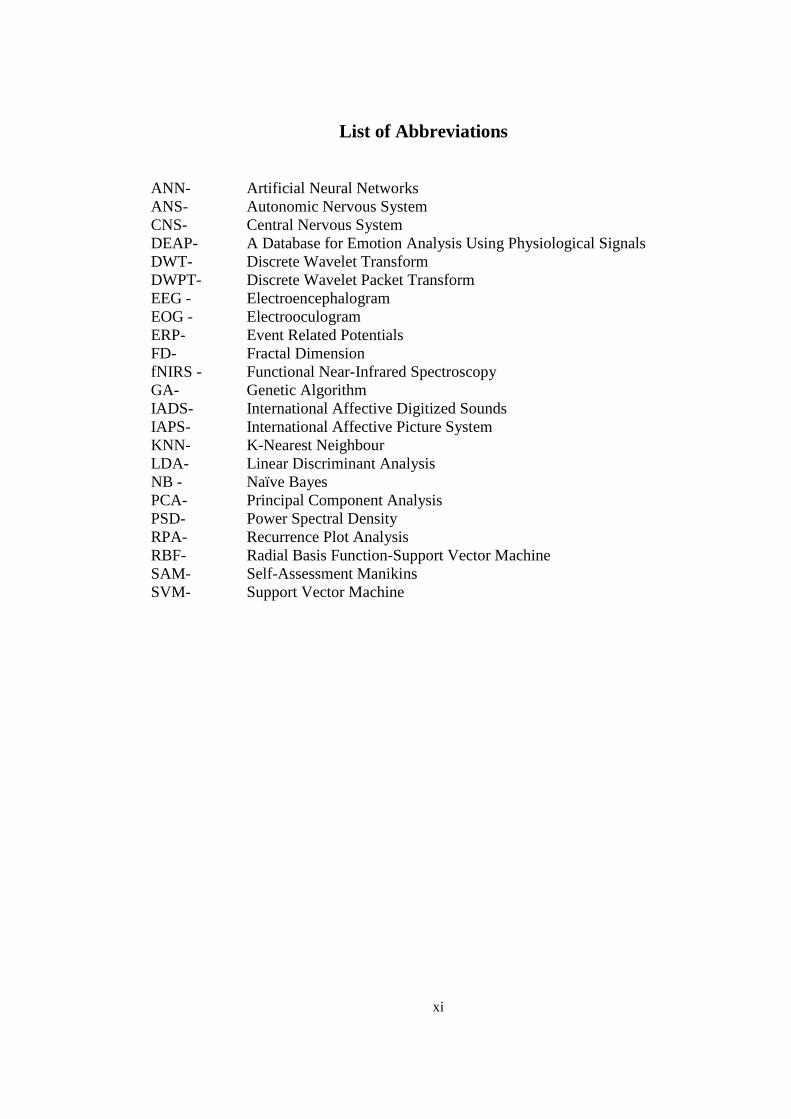
List of Abbreviations
ANN- Artificial Neural Networks
ANS- Autonomic Nervous System
CNS- Central Nervous System
DEAP- A Database for Emotion Analysis Using Physiological Signals
DWT- Discrete Wavelet Transform
DWPT- Discrete Wavelet Packet Transform
EEG - Electroencephalogram
EOG - Electrooculogram
ERP- Event Related Potentials
FD- Fractal Dimension
fNIRS - Functional Near-Infrared Spectroscopy
GA- Genetic Algorithm
IADS- International Affective Digitized Sounds
IAPS- International Affective Picture System
KNN- K-Nearest Neighbour
LDA- Linear Discriminant Analysis
NB - Naïve Bayes
PCA- Principal Component Analysis
PSD- Power Spectral Density
RPA- Recurrence Plot Analysis
RBF- Radial Basis Function-Support Vector Machine
SAM- Self-Assessment Manikins
SVM- Support Vector Machine
12
CHAPTER ONE
INTRODUCTION
1.1 Introduction
Human beings express various emotions during daily activities and interactions with
other people. In human daily interactions, these emotions are recognized through
facial expression, voice, or body gesture. The task of recognizing emotions is simple
for human, however computers capability of recognizing human emotions is still
diminished (Amaral, Ferreira, Aquino, and Castro (2013).
In affective computing, facial expressions, body gestures, and vocal intonation have
been used to recognize human emotions (Fu, Yang, and Hou, 2011). However, due
to the fact that human can control the facial expressions, body gestures, and vocal
intonation voluntarily, various studies have used physiological bio-signals from the
peripherals of the human body to recognize emotions (Kim, Bang, and Kim, 2004;
Kim and André, 2006; Kim and André, 2008; Picard, Vyzas, and Healey, 2001). The
electrical signals from the brain itself acquired by Electroencephalograms (EEG) are
recently used to recognize human emotions (Jatupaiboon, Pan-ngum, and Israsena,
2013; Lin, Wang, Jung, Wu, Jeng, Duann and Chen, 2010; Wang, Nie, and Lu,
2011).
The non-linearity, non-stationary, and chaotic properties of the EEG signals have
created great problems that lead to thorough signal processing and analysis (Sanei
and Chambers, 2008). In other words, to achieve optimal results, there is a need to
systematically choose the methods and techniques that will be applied when
13
implementing emotion recognition using EEG signals. This problem calls for more
research in this field in order to attain better and more accurate results in EEG signal
processing and analysis.
1.2 Background of the Study
This section presents the bases of emotion recognition and how EEG can be used for
acquiring the neural activities of the brain in order to recognize emotions.
1.2.1 Emotion Recognition
According to Torres, Orozco, and Alvarez (2013), emotion is “a psycho-
physiological process that affects the behaviour of an individual with respect to a
particular situation, and plays an important role in human communication. Emotion
has also been defined as “a psychological state or process that functions in the
management of maintaining the balance of information processes in the brain and the
relevant goals” (Stickel, Ebner, Steinbach-Nordmann, Searle, and Holzinger, 2009).
Conventional approaches such as studying facial expressions, body gestures, and
vocal intonations have been used in affective computing for recognizing human
emotions (Lin et al., 2010). The results from these approaches were not reliable and
not satisfactory, for the fact that human could control their facial expression, body
gestures, or vocal intonation voluntarily (Liu, Sourina, and Nguyen, 2011; Singh et
al., 2012). For this reason, researches have been conducted using some physiological
responses in recognizing human emotions. This approach uses various magnetic or
electronic devices to assess some bio-signals from the human body. The results from
14
the use of physiological responses provide more detailed information in recognizing
different human emotions states (Lin et al., 2010).
The earlier methods of recording these bio-signals were via the Autonomic Nervous
System (ANS) such as respiration rate, pupil dilation, blood pressure, heart rate,
papillary dilation or contraction, galvanic skin resistance, pulse rate (Bos, 2007).
Recently researchers were able to gain more insight in recognizing different human
emotion states via the Central Nervous System (CNS), using signals from the brain
activity that were recorded from the scalp with the aid of an electronic device called
EEG (Singh et al., 2012). Signals captured through EEG have been proved to be
more effective in providing more information on mental activities and emotional
states. Therefore compared to the bio-signals from the ANS, emotions can better be
recognized using EEG (Chanel, Kronegg, Grandjean, and Pun, 2006).
1.2.2 Brain Activities in Emotional States
The brain cells called neurons are responsible for generating signals or electrical
pulses in the brain. Neurons generate these electrical pulses for the purpose of
communicating with other neurons. These electric pulses are called action potentials
or spikes. An action potential occur when there is fast opening and closing of sodium
and potassium ion channels on the neuron membrane causing fast inflow of sodium
ions and slower outflow of potassium ions. As a result, a rise in voltage will occur
inside the cell and when this voltage increase reaches a certain threshold, a spike will
occur (Dayan and Abbott, 2000).
15
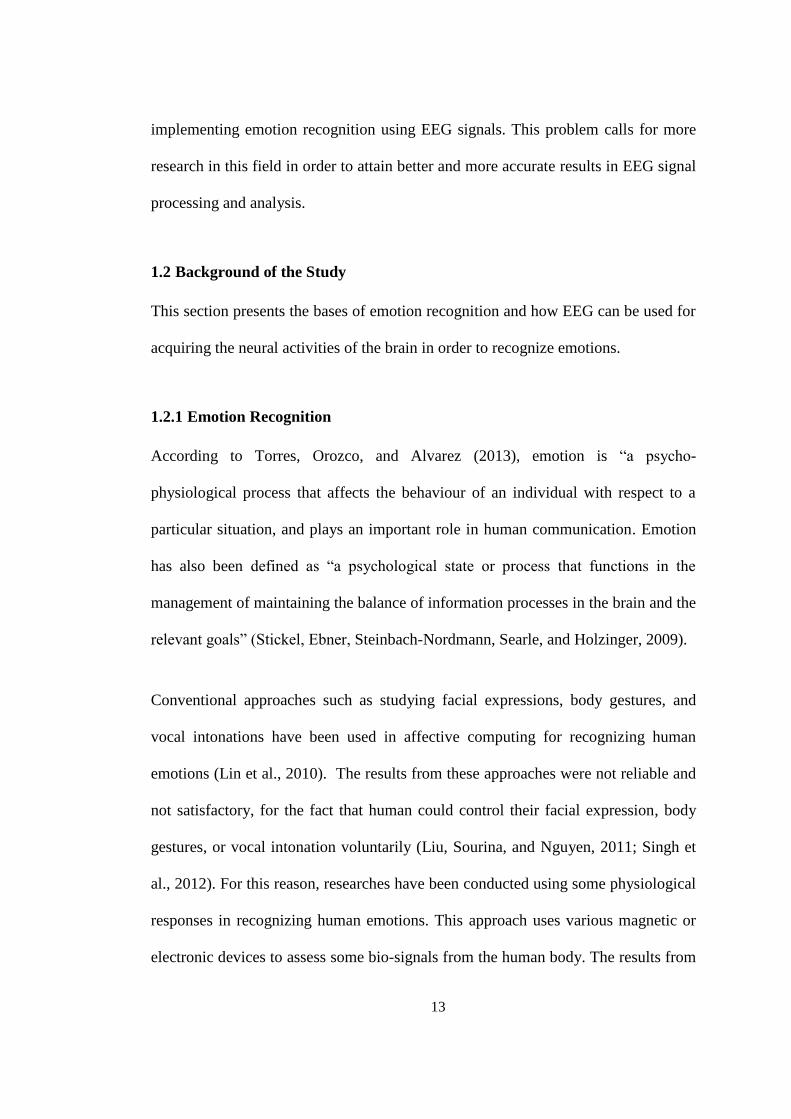
Figure 1.1. Information Flow within a Neuron (Source: www.uic.edu (Edited))
Neurons communicate by firing sequences of spikes. These spikes travel from the
axon of a neuron to the dendrite of another neighbouring neuron. These processes
together represent the brain electrical activity (Dayan and Abbott, 2000). This
electrical activity can be acquired with EEG placed on the scalp and it represents the
field potentials resulting from the combined activity of many neurons (Bos, 2007).
16
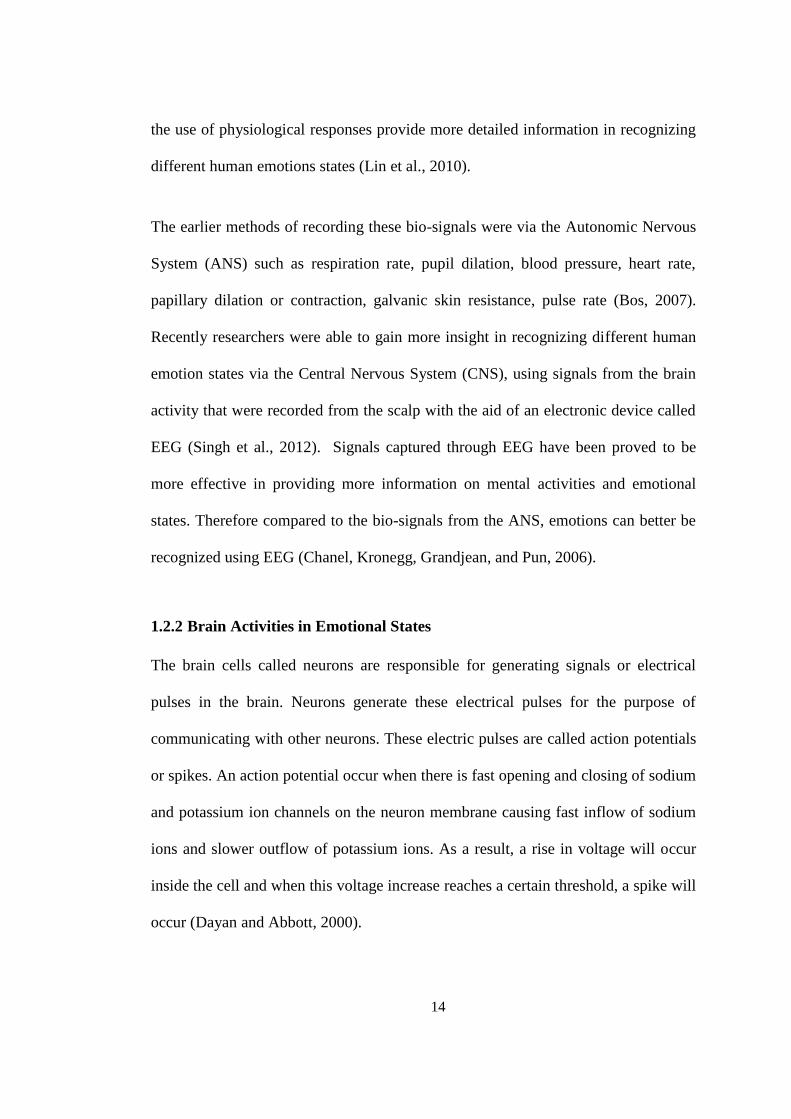
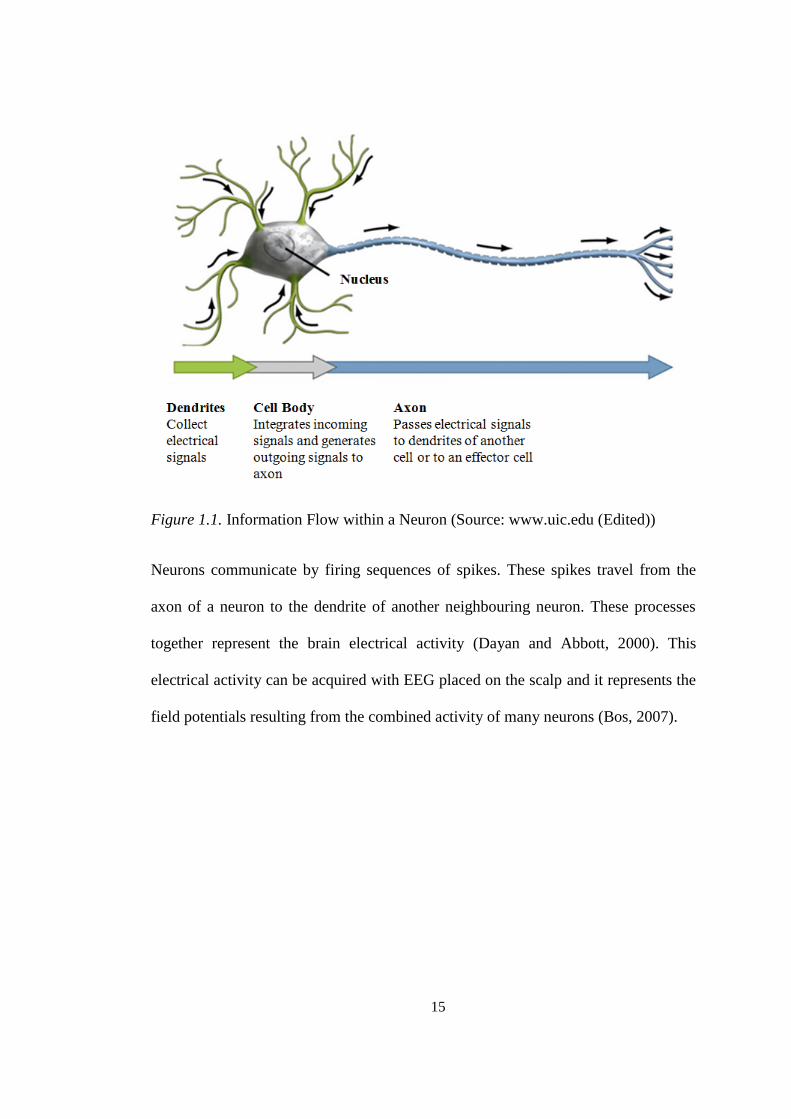
Figure 1.2. Information Flow between Neurons
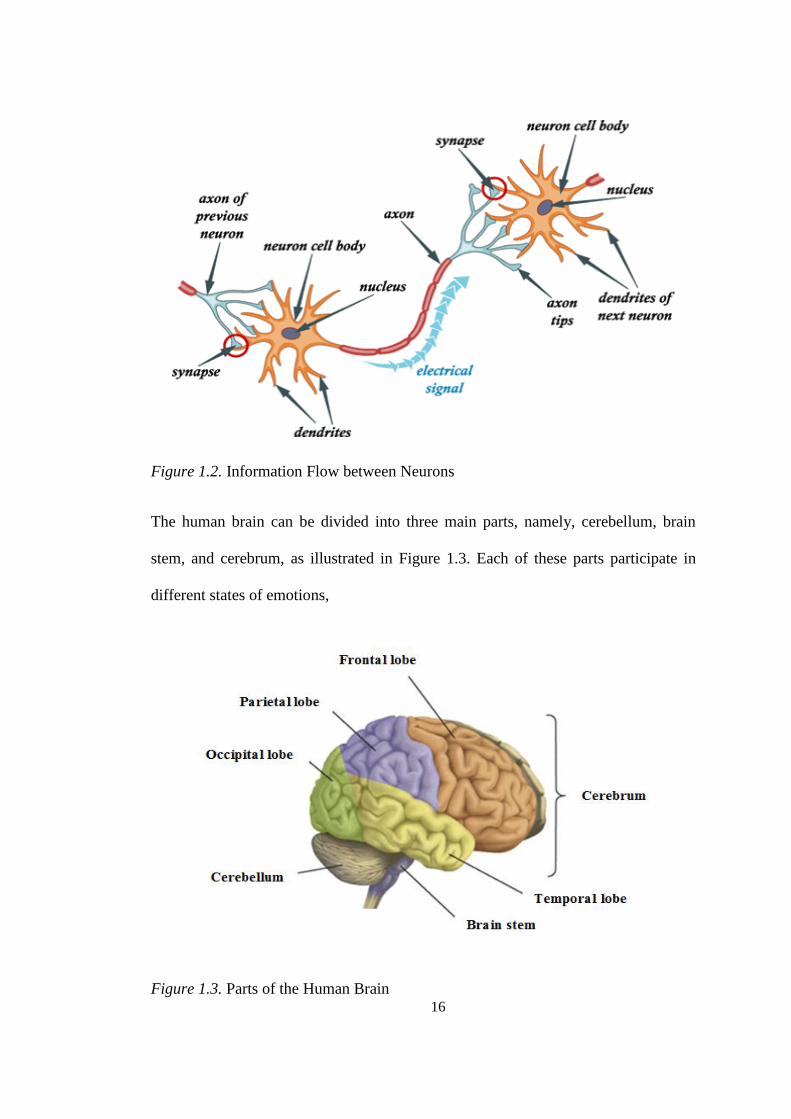
The human brain can be divided into three main parts, namely, cerebellum, brain
stem, and cerebrum, as illustrated in Figure 1.3. Each of these parts participate in
different states of emotions,
Figure 1.3. Parts of the Human Brain
17
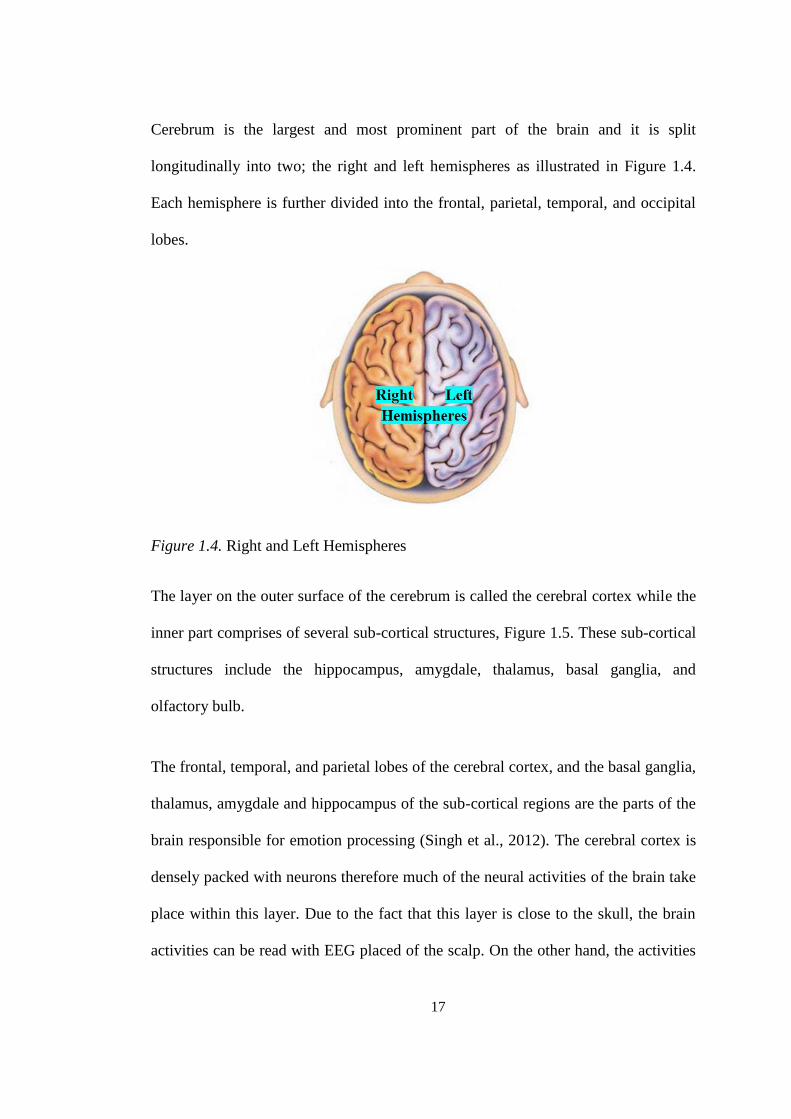
Cerebrum is the largest and most prominent part of the brain and it is split
longitudinally into two; the right and left hemispheres as illustrated in Figure 1.4.
Each hemisphere is further divided into the frontal, parietal, temporal, and occipital
lobes.
Figure 1.4. Right and Left Hemispheres
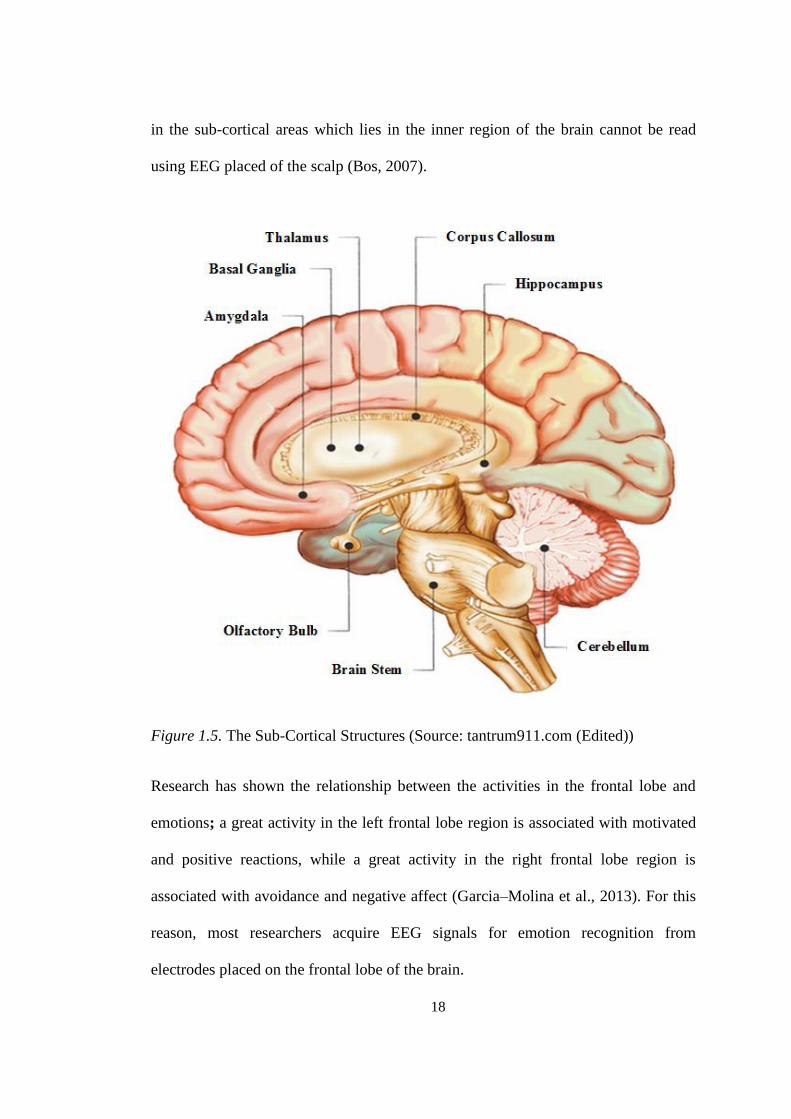
The layer on the outer surface of the cerebrum is called the cerebral cortex while the
inner part comprises of several sub-cortical structures, Figure 1.5. These sub-cortical
structures include the hippocampus, amygdale, thalamus, basal ganglia, and
olfactory bulb.
The frontal, temporal, and parietal lobes of the cerebral cortex, and the basal ganglia,
thalamus, amygdale and hippocampus of the sub-cortical regions are the parts of the
brain responsible for emotion processing (Singh et al., 2012). The cerebral cortex is
densely packed with neurons therefore much of the neural activities of the brain take
place within this layer. Due to the fact that this layer is close to the skull, the brain
activities can be read with EEG placed of the scalp. On the other hand, the activities
18
in the sub-cortical areas which lies in the inner region of the brain cannot be read
using EEG placed of the scalp (Bos, 2007).
Figure 1.5. The Sub-Cortical Structures (Source: tantrum911.com (Edited))
Research has shown the relationship between the activities in the frontal lobe and
emotions; a great activity in the left frontal lobe region is associated with motivated
and positive reactions, while a great activity in the right frontal lobe region is
associated with avoidance and negative affect (Garcia–Molina et al., 2013). For this
reason, most researchers acquire EEG signals for emotion recognition from
electrodes placed on the frontal lobe of the brain.
19
1.2.3 Methods of Acquiring Electrical Signals from the Brain
Practically there are two ways of acquiring electrical signals from the brain. One
method is by physically implanting one or more electrodes inside the brain, this
method is known as the invasive or intracranial method. Another method known as
the non-invasive method is when EEG is placed on the scalp (Sanei and Chambers,
2008). Though the invasive method gives more access to neural activity as it allow
access to a single neuron or very local field potentials. However, it is avoided due to
the fact that it requires surgery and also the results from the non-invasive methods
are very encouraging.
To acquire raw EEG data using the the non-invasive method, electrodes are placed
on the scape of participants following some standard of EEG electrode montage. One
of the standardized sets of electrode location system is the 10-20 system shown in
Figure 1.6. The conventional 10-20 system allows 21 electrode positioning. The
system was later modified to accommodate more electrodes. Researchers perform
experiments that are aimed at achieving some objectives. Number of electrodes used
in experiments varies from 1 to 64 electrode channels or more according to the aim
of the experiment.

20
Figure 1.6. The 10–20 Positioning for 21 Electrode Channels (Sanei and Chambers,
2008)
Figure 1.7. EEG Montage
21
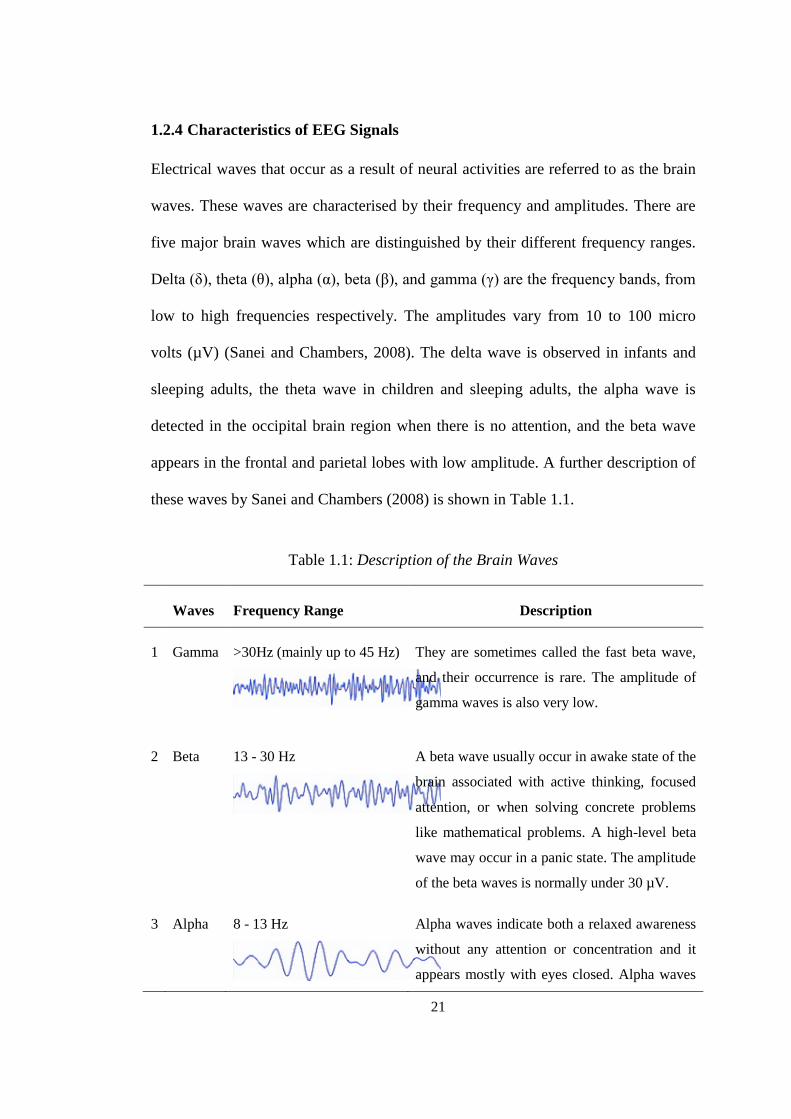
1.2.4 Characteristics of EEG Signals
Electrical waves that occur as a result of neural activities are referred to as the brain
waves. These waves are characterised by their frequency and amplitudes. There are
five major brain waves which are distinguished by their different frequency ranges.
Delta (δ), theta (θ), alpha (α), beta (β), and gamma (γ) are the frequency bands, from
low to high frequencies respectively. The amplitudes vary from 10 to 100 micro
volts (µV) (Sanei and Chambers, 2008). The delta wave is observed in infants and
sleeping adults, the theta wave in children and sleeping adults, the alpha wave is
detected in the occipital brain region when there is no attention, and the beta wave
appears in the frontal and parietal lobes with low amplitude. A further description of
these waves by Sanei and Chambers (2008) is shown in Table 1.1.
Table 1.1: Description of the Brain Waves
Waves Frequency Range Description
1 Gamma
>30Hz (mainly up to 45 Hz)
They are sometimes called the fast beta wave,
and their occurrence is rare. The amplitude of
gamma waves is also very low.
2 Beta
13 - 30 Hz
A beta wave usually occur in awake state of the
brain associated with active thinking, focused
attention, or when solving concrete problems
like mathematical problems. A high-level beta
wave may occur in a panic state. The amplitude
of the beta waves is normally under 30 µV.
3 Alpha
8 - 13 Hz Alpha waves indicate both a relaxed awareness
without any attention or concentration and it
appears mostly with eyes closed. Alpha waves
22
is eliminated or reduced by opening the eyes,
by anxiety, by hearing unfamiliar sounds, or by
mental concentration or attention. An alpha
wave has amplitude of normally less than 50
µV.
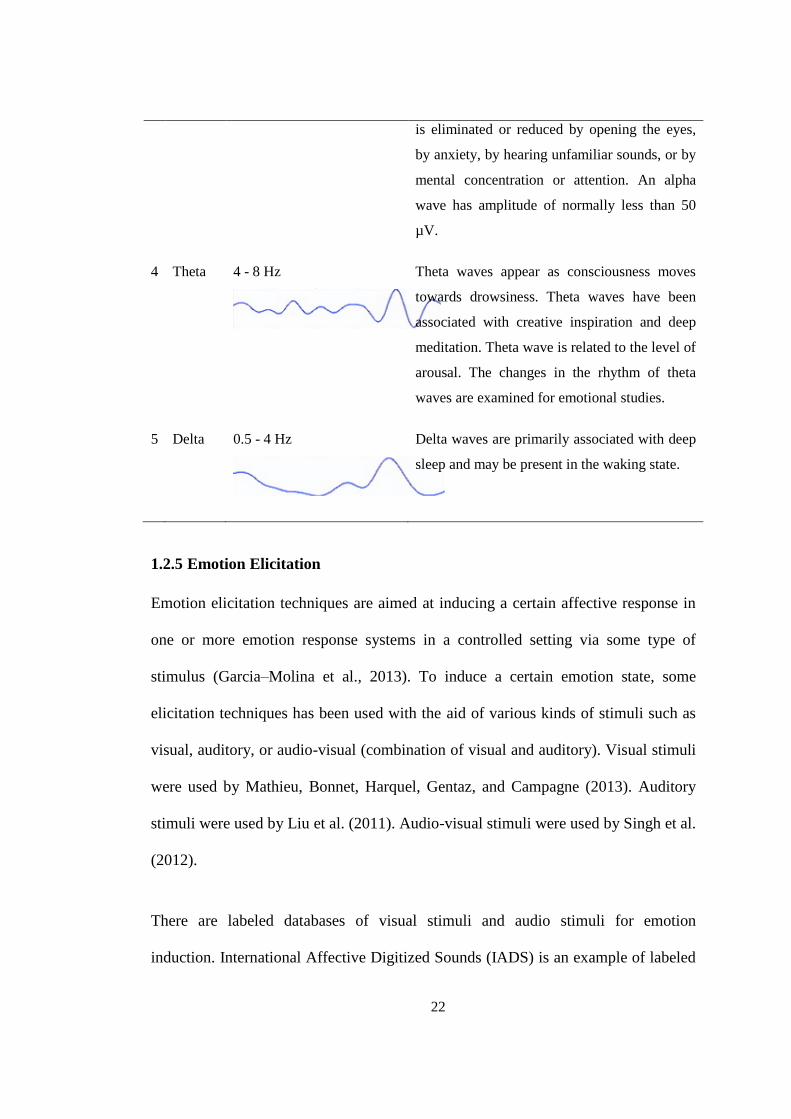
4 Theta
4 - 8 Hz
Theta waves appear as consciousness moves
towards drowsiness. Theta waves have been
associated with creative inspiration and deep
meditation. Theta wave is related to the level of
arousal. The changes in the rhythm of theta
waves are examined for emotional studies.
5 Delta
0.5 - 4 Hz
Delta waves are primarily associated with deep
sleep and may be present in the waking state.
1.2.5 Emotion Elicitation
Emotion elicitation techniques are aimed at inducing a certain affective response in
one or more emotion response systems in a controlled setting via some type of
stimulus (Garcia–Molina et al., 2013). To induce a certain emotion state, some
elicitation techniques has been used with the aid of various kinds of stimuli such as
visual, auditory, or audio-visual (combination of visual and auditory). Visual stimuli
were used by Mathieu, Bonnet, Harquel, Gentaz, and Campagne (2013). Auditory
stimuli were used by Liu et al. (2011). Audio-visual stimuli were used by Singh et al.
(2012).
There are labeled databases of visual stimuli and audio stimuli for emotion
induction. International Affective Digitized Sounds (IADS) is an example of labeled
23
audio stimuli database (Bradley and Lang 2007) while International Affective
Picture System (IAPS) is an example of labeled visual stimuli database (Lang,
Bradley, and Cuthbert, 2005). The IAPS is a database of images with an emotional
content and IADS is a database of sound or music pieces with an emotional content.
1.2.6 Modelling Emotional States
There is currently no standardized model of categorizing emotions. Previous studies
have shown two perspectives of emotion classification: discrete and dimensional.
Theories that support the discrete perspective suggested that there are some emotions
that form a core set of basic emotions from which all other emotions (secondary) can
be formed. One example is Paul Ekman’s (1987) six basic emotion; joy, sadness,
anger, disgust, fear, and surprise. On the other hand, theories that support the
dimensional perspective propose the concept that emotions can be mapped as per
their differing in degree on one or another dimension. A well know example is the
Circumplex Model of Affect or the Valence-Arousal model by Russel (1980).
The dimensional perspective is preferable in emotion recognition researches due to
numbers of advantages over discrete. Some of these advantages are as follows. With
dimensional model, it is possible to represent discrete emotions in the space of the
dimensional model coordinate system without using labels by giving the emotion a
location as point in this space. The intensity of the emotions can as well be
represented in this space (Chanel, 2009; Liu et al., 2011).
24
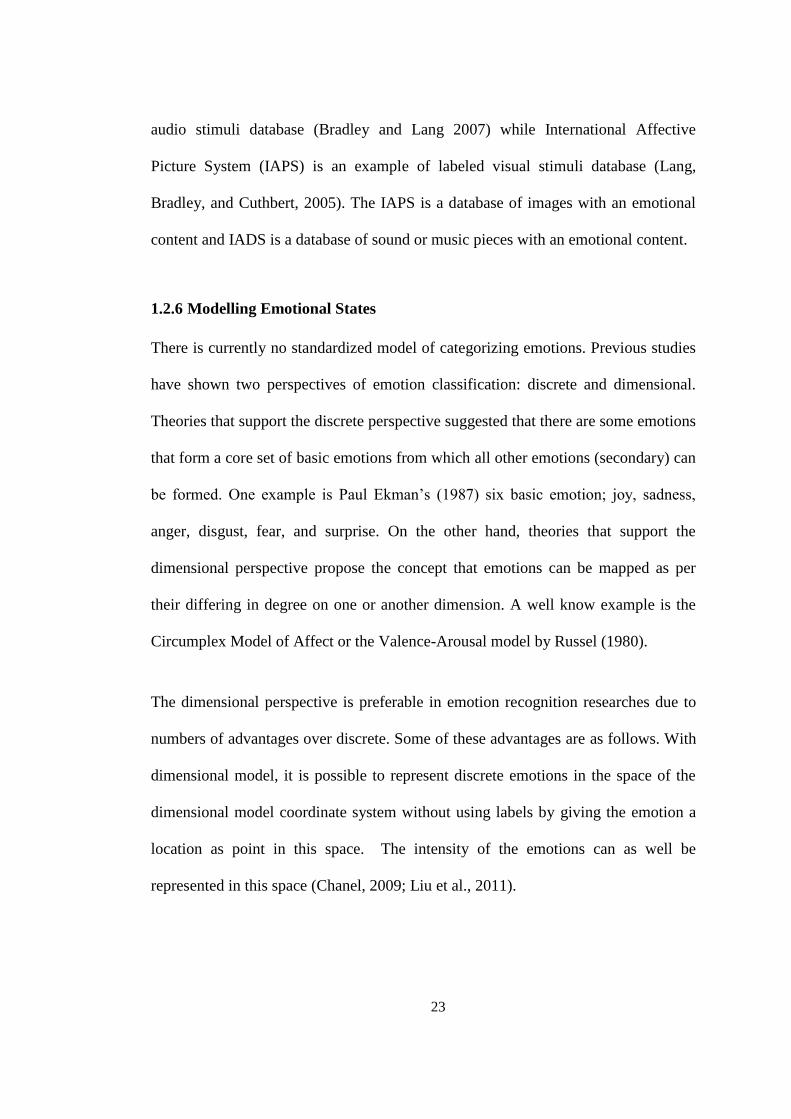
Figure 1.8. An Instance of the Valence-Arousal Model
The Valence-Arousal model is mostly adopted in researches to classify emotions. It
is a bipolar model where two orthogonal dimensions, arousal and valence
dimensions, are used to model emotions. The valence dimension ranges from highly
positive to highly negative, whereas the arousal dimension ranges from excitement
or agitation to calmness (Kensinger, 2004; Liu et al., 2011). Discrete emotions can
be mapped to the Valence-Arousal coordinate system, for instance sad can be
mapped to be negative valence and low arousal.
1.2.7 EEG-Based Emotion Recognition
There are five stages involved in EEG-based emotion recognition experiment. First,
raw EEG signals are acquired using the invasive or non-invasive method. The raw
EEG data will then be pre-processed by removing noise. The following stage is the
25
feature extraction stage, whereby necessary features are extracted from the EEG
signal. The next is the feature selection stage; this is done for dimensionality
reduction. Lastly is classification stage. Details of all these stages are discussed in
the next chapter.
1.3 Problem Statements
Human emotion recognition is seen has one of the key steps toward advanced
human-computer interactions. The advancement in computational algorithms and
techniques has recently added to the promising results in emotion recognition
researches. In this field of research, the brain signals (electrical potentials) acquired
through EEG has proved to be a better method for human emotion recognition
(Chanel, Kronegg, Grandjean and Pun, 2006). However, due to the non-linearity,
non-stationary, and chaotic nature of the EEG signals, EEG signal processing has
been an extensive research area and several signal processing techniques have been
tested in order to attain better and more accurate results for EEG signal processing
and analysis.
Comparative analyses based on the results from available studies are in some cases
not possible. In other words, it is very difficult to conclude on a model due to the fact
that various researchers have used different experimental setups and have chosen
different set of features to be analyzed in their studies. For example, some studies
have performed experimental setup for EEG-based emotion recognition which are
different from others (AlZoubi, Calvo and Stevens, 2009; Khalili and Moradi, 2009;
Murugappan et al., 2011). In the study carried out by AlZoubi, Calvo and Stevens
26
(2009), EEG signals were acquired by the 6 bipolar channels F3-F4, C3-C4, Cz-PO,
F3-Cz, Fz-C3, and Fz-PO to recognize 10 discrete self-elicited emotions based on
Power Spectral Density (PSD) features. Khalili and Moradi (2009) performed own
experiment using 54 electrodes to acquire EEG signals to recognize picture elicited
emotions on three classes (positively excited, negatively excited, and calm) of the
valence-arousal coordinate based on statistical features of the frequency bands theta,
alpha, beta, and gamma. In the study carried out by Murugappan et al.(2011), EEG
signals were acquired from 64 electrodes to recognize five discrete video elicited
emotions based on entropy features of the frequency bands delta, theta, alpha, beta,
and gamma. Due to difference in experimental setups and choice of features, it might
be difficult to come out with a clear and concise conclusion or a model for EEG
emotion recognition based on findings from studies like these.
Based on this fact, some researchers have conducted analysis on benchmark EEG
datasets in order to compare techniques and methods used in implementing EEG
emotion recognition with other studies using the same dataset. The aim of using
different feature sets, algorithms, and techniques on the same dataset is to compare
the results in order to note the combination of feature sets and techniques that works
well in EEG signal processing. Inspired by this, the present study aimed at
performing analysis on a benchmark EEG signal dataset from the DEAP (A
Database for Emotion Analysis Using Physiological Signals) database (Koelstra et
al., 2012). DEAP is a multimodal dataset containing physiological signals and
targeted emotions based on the valence-arousal model (Russel, 1980). It is expected
27
that effective comparative analyses and more precise conclusions can be made when
different methods and techniques are being applied to the same set of data.
Feature extraction is the most important process in EEG signal processing (Riera
Sardà, 2012). It involves some algorithms that allow extraction of hidden
information from the signals. The choice of feature extraction method is very
important to accurately classify emotions using EEG signals. Due to the importance
of the feature extraction process, this study aims at measuring the effect of Discrete
Wavelet Packet Transform (DWPT) feature extraction method in EEG-based
valence-arousal emotion recognition. DWPT is an advanced form of wavelet
transform and it has recently been used in EEG signal processing to decompose EEG
signals in Wali et al. (2013) and Murugappan et al. (2013) in order to classify driver
distraction levels. Based on this, DWPT is proposed to be used as the feature
extraction method for recognizing emotions based on the valence-arousal model by
classifying human emotional states into high/low valence or high/low arousal. The
benchmark dataset was used in order to compare the result of this study.
As EEG signals are acquired through multichannel electrodes, ranging from 1 to 60
useable electrode channels. Another important concern in EEG-based emotion
recognition is to identify the combination of electrode channels that gives higher
classification accuracy. Based on this, further experiment aiming at identifying the
combination of electrode channels for EEG-based valence-arousal emotion
recognition will be performed in this study.
28
1.4 Research Questions
This study is expected to answer the following questions.
1. How can an algorithm for DWPT feature extraction method be developed for
EEG based valence-arousal emotion recognition?
2. How can the developed alogorithm be evaluated?
3. What is the combination of electrode channels that optimally recognize
emotions in EEG based valence-arousal emotion recognition?
1.5 Research Objectives
The main objective of this study is to discover the feature extraction method and the
combination of electrode channels that optimally implements EEG-based valence-
arousal emotion recognition. The sub-objectives are;
1. To develop an algorithm for DWPT feature extraction method for EEG based
valence-arousal emotion recognition.
2. To evaluate the developed algorithm.
3. To identify the combination of electrode channels that optimally recognize
emotions in EEG based valence-arousal emotion recognition.
29
1.6 Significance of the Study
Growing number of affective computing researches have recently developed EEG-
based emotion recognition systems that can recognize emotional state of human to
establish affective human-computer interactions. However, there are still needs to
discover methods and algorithms that will give better results. This can be achieved
by using different methods, algorithms and techniques on the same dataset in order
to compare the results and note the combination of feature sets and techniques that
works well in EEG signal processing.
The importance of this present work is to propose DWPT as a feature extraction
method and identify the combination of electrode channels that can be used with it.
This result of this study is a model for EEG-based emotion recognition. Specifically
adding to the effort of discovering feature extraction method and combination of
electrode channels that gives best result.
1.7 Scope of the Study
The implementation of this study is based on a public EEG dataset from DEAP
repository (Koelstra et al., 2012). The pre-processed version of the dataset is used, so
the scope of this work would be limited to this dataset. The target emotions to be
identified are the two classes of valence (high/low) and the two classes of arousal
(high/low).
30
1.8 Organization of the Report
The report is organized into five chapters. The description of each chapter is as
follows.
Chapter One presents an introduction to this research. It presents the problem that the
research wants to address. It also describes the research questions and objectives. The
significance and scope of this research are also discussed.
Chapter Two discusses about the review of literatures. It provides descriptions and
discussions of the issues related to the research. The discussions lead to the findings
in this research.
Chapter Three discusses about the methodology used in this research. It presents the
design of the experiments and explanation on how the experiments were performed.
In Chapter Four, the results of the experiments performed in this research are
presented and the results were compared with previous related study.
In Chapter Five, conclusions are made based on the results of this research and
finally future research plans are described.
1.9 Chapter Summary
This chapter introduces the background of this study and also presents the problem
that the study wants to address. Subsequently the research questions and objectives
are laid down in order to address the problems. The significance and scope of this
study are also discussed in this chapter.
31
CHAPTER TWO
LITERATURE REVIEW
2.1 Introduction
This chapter discusses each of the five stages involved in EEG-based emotion
recognition and the methods and techniques that have been used in each stage. The
dataset used in this study together with the previous studies carried out using this
dataset were also discussed.
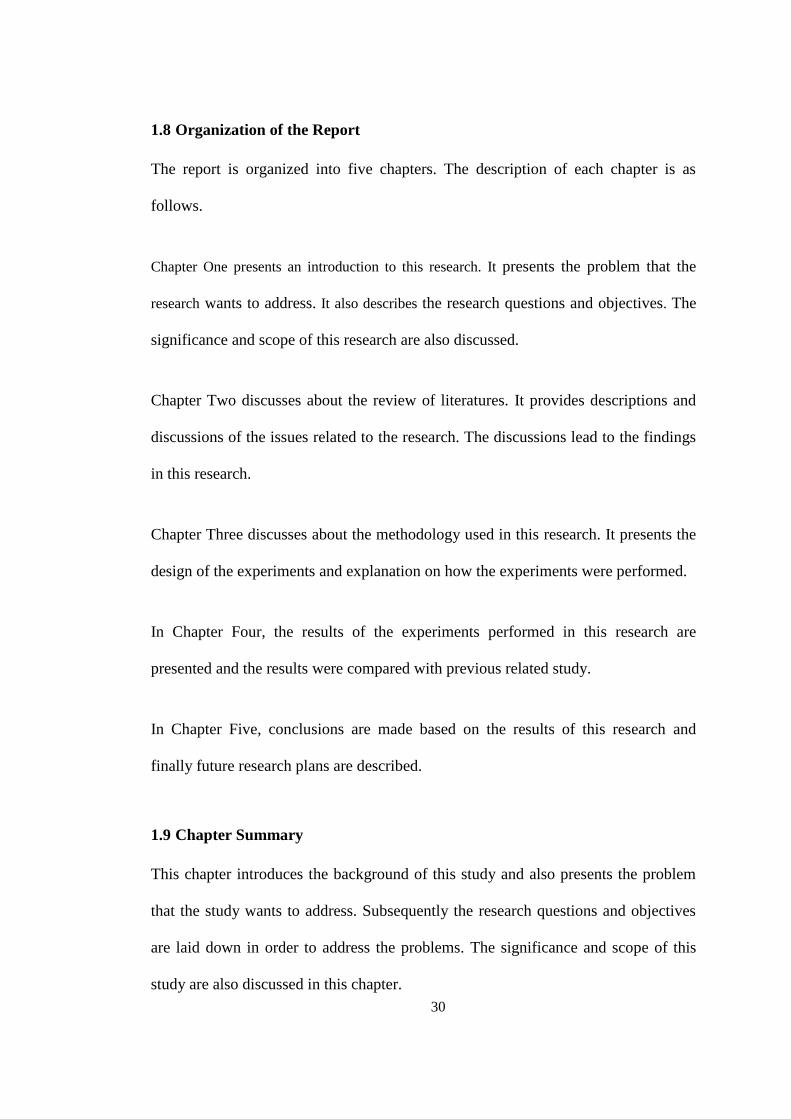
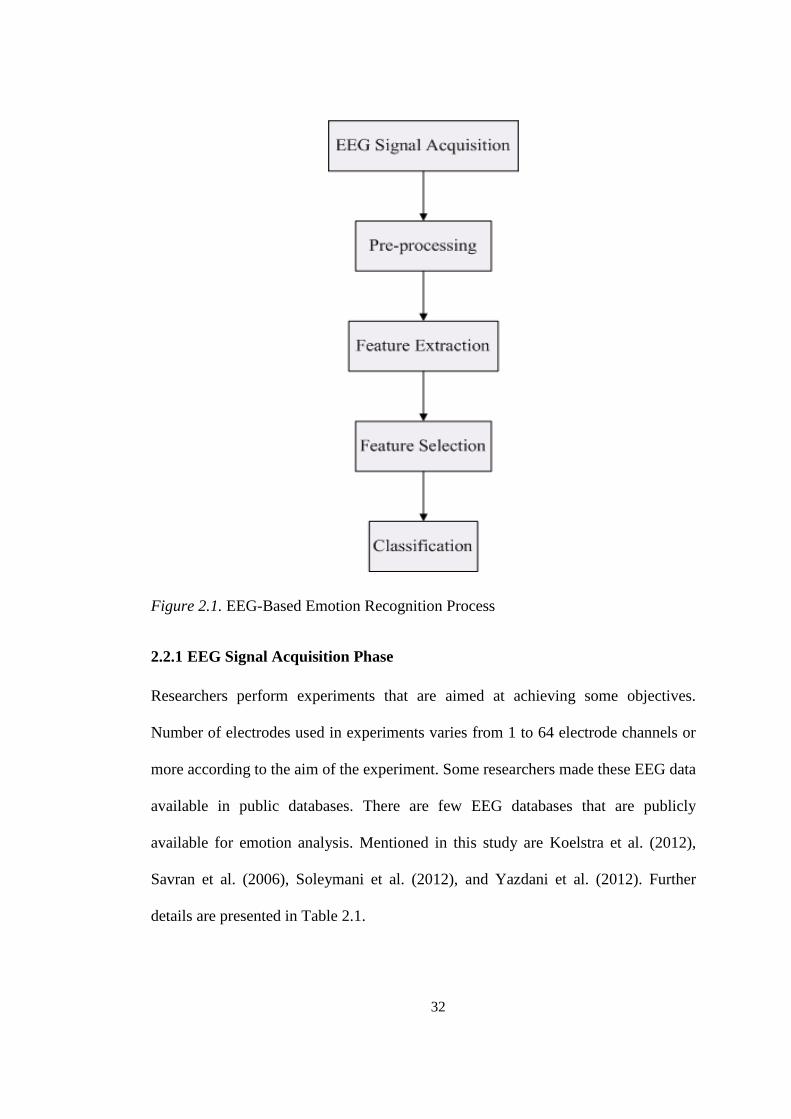
2.2 EEG-Based Emotion Recognition Process
In order to recognize emotions, researches have been carried out using valence-
arousal model as the basis of emotion classification (Bos, 2007; Chanel et al., 2006;
Kwon, Ahn, Hong, Park, Park, and Jun, 2013; Lin et al., 2010; Stickel, Ebner,
Steinbach-Nordmann, Searle, and Holzinger, 2009). First, raw EEG data are
collected either by experiments or via databases. The raw EEG data will then be pre-
processed, next is extracting necessary features followed by feature selection and
lastly is classification. Figure 2.1 shows these steps and all the stages are elaborated
as follows.
32
Figure 2.1. EEG-Based Emotion Recognition Process
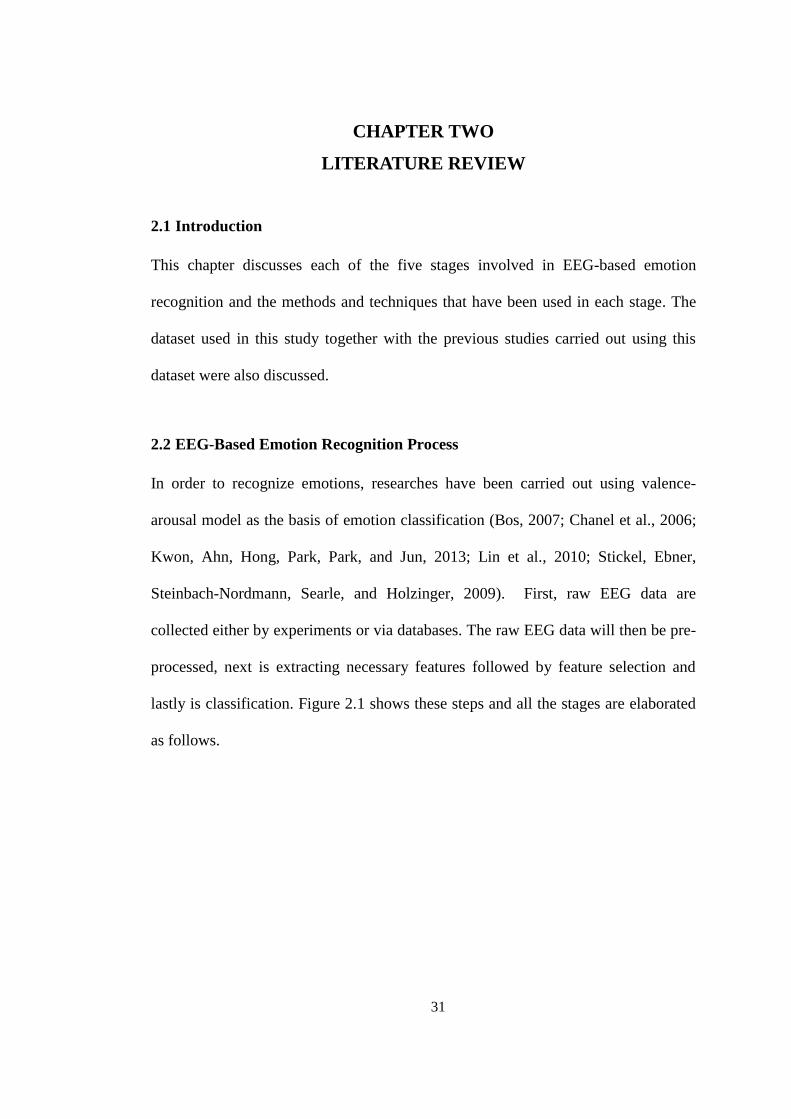
2.2.1 EEG Signal Acquisition Phase
Researchers perform experiments that are aimed at achieving some objectives.
Number of electrodes used in experiments varies from 1 to 64 electrode channels or
more according to the aim of the experiment. Some researchers made these EEG data
available in public databases. There are few EEG databases that are publicly
available for emotion analysis. Mentioned in this study are Koelstra et al. (2012),
Savran et al. (2006), Soleymani et al. (2012), and Yazdani et al. (2012). Further
details are presented in Table 2.1.
33
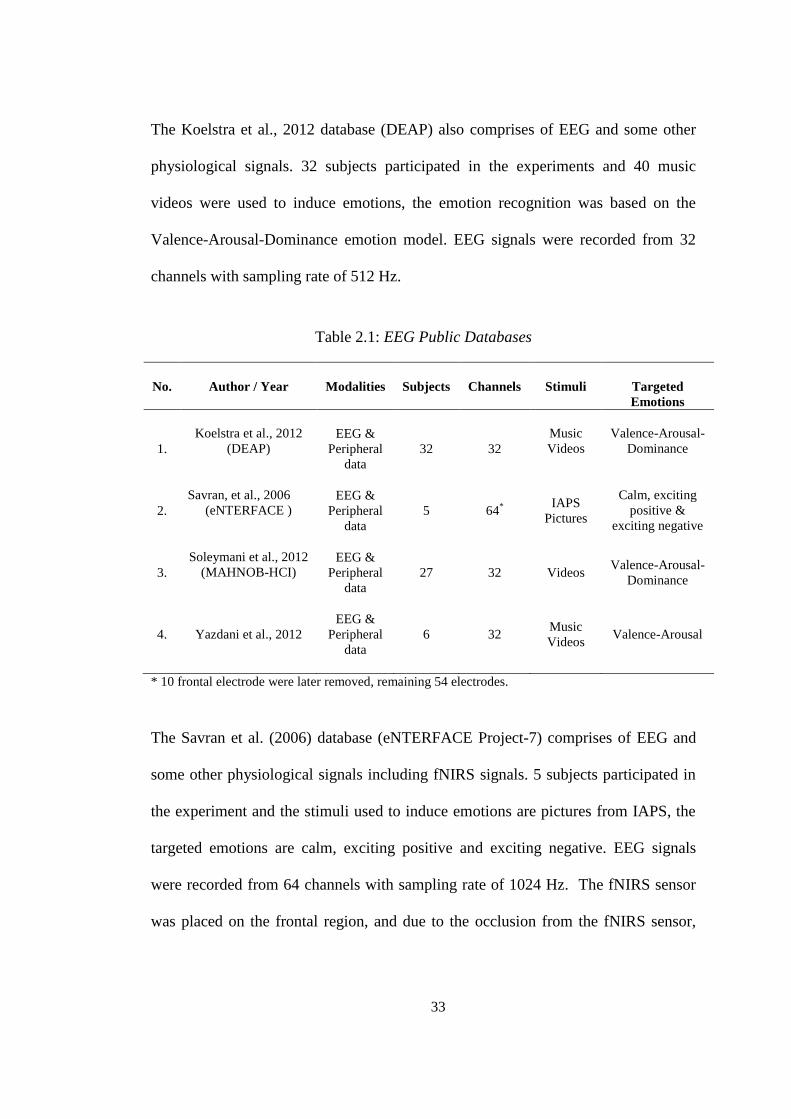
The Koelstra et al., 2012 database (DEAP) also comprises of EEG and some other
physiological signals. 32 subjects participated in the experiments and 40 music
videos were used to induce emotions, the emotion recognition was based on the
Valence-Arousal-Dominance emotion model. EEG signals were recorded from 32
channels with sampling rate of 512 Hz.
Table 2.1: EEG Public Databases
No. Author / Year Modalities Subjects Channels Stimuli Targeted
Emotions
1.
Koelstra et al., 2012
(DEAP) EEG &
Peripheral
data
32 32
Music
Videos
Valence-Arousal-
Dominance
2.
Savran, et al., 2006
(eNTERFACE ) EEG &
Peripheral
data
5 64*
IAPS
Pictures
Calm, exciting
positive &
exciting negative
3.
Soleymani et al., 2012
(MAHNOB-HCI) EEG &
Peripheral
data
27 32 Videos Valence-Arousal-
Dominance
4. Yazdani et al., 2012
EEG &
Peripheral
data
6 32 Music
Videos Valence-Arousal
* 10 frontal electrode were later removed, remaining 54 electrodes.
The Savran et al. (2006) database (eNTERFACE Project-7) comprises of EEG and
some other physiological signals including fNIRS signals. 5 subjects participated in
the experiment and the stimuli used to induce emotions are pictures from IAPS, the
targeted emotions are calm, exciting positive and exciting negative. EEG signals
were recorded from 64 channels with sampling rate of 1024 Hz. The fNIRS sensor
was placed on the frontal region, and due to the occlusion from the fNIRS sensor,
34
EEG data acquired from AF7, AF8, AFz, Fp1, Fp2, Fpz, F5, F6, F7, and F8 were
removed.
The Yazdani et al. (2012) database comprises of EEG and some other physiological
signals. 6 subjects participated in the experiment and the stimuli used to induce
emotions are music videos, the emotion recognition was based on the Valence-
Arousal model. EEG signals were recorded from 32 channels with sampling rate of
512 Hz.
The Soleymani et al. (2012) database (MAHNOB-HCI, Experiment-1) comprises of
EEG and some other physiological signals. 27 subjects participated in the
experiments and 20 videos were used to induce emotions, the emotion recognition
was based on the Valence-Arousal-Dominance emotion model. EEG signals were
recorded from 32 channels with sampling rate of 256 Hz.
Comparing the databases, the DEAP database has some advantages over others and
they are listed as follows:
An initial experiment was done to choose the stimuli.
Large participants; it has a large amount of subjects, that is 32 subjects.
A total 40 music videos were used, leading to 40 trials for each subject.
This dataset has been used by other researchers for comparative analyses.
The frontal channels were removed from eNTERFACE.
35
2.2.2 Pre-Processing Phase
Due to the method of acquisition of the EEG signals from the brain, there is need to
pre-process these signals before use. Pre-processing involves application of filters to
remove artefacts, like eye blinking and noises due to electronic amplifier,
interference from power cables or other external interference so as to get cleaner
signals. Murugappan, Rizon, Nagarajan, Yaacob, Hazry, and Zunaidi, (2008) uses
Average Mean Reference (AMR) to reduce the signal noise. Surface Laplacian (SL)
filter has also been used to remove artefacts and noise by Murugappan, Nagarajan,
and Yaacob (2011).
2.2.3 Feature Extraction Phase
In emotion recognition, the features are the characteristics of EEG signals that help
in distinguishing different emotions (Hosseini, and Khalilzadeh, 2010). Feature
extraction is the process of extracting necessary features from the cleaned EEG
signals. It involves some algorithms that allow extraction of hidden information from
signals and it is regarded as the most important process in EEG signal processing
(Riera Sardà, 2012).
The choice of feature extraction approach is very important to accurately classify
emotions using EEG signals. Feature extraction approaches that have been
implemented in EEG emotion recognition can be categorized into three. One
approach is the use of time domain analyses such as statistical parameters like mean,
standard deviation, variance, and power. Other time domain analyses are Fractal
Dimension (FD), Hjorth parameters, and Event Related Potentials (ERP). A second
36
approach is the use of frequency domain analysis. Frequency domain features like
Band Power can be extracted using Fourier Transform (FT) and Discrete Fourier
Transform (DFT) or by computing the Power Spectral Density (PSD). The third
approach is the Time-Frequency domain analysis. Time-Frequency domain features
like energy and entropy can be extracted using techniques such as the Discrete
Wavelet Transform (DWT).
Time domain analysis such as the statistical parameters and frequency domain
analysis such as FT and DFT are regarded as linear analysis (Hosseini and
Khalilzadeh, 2010). Some researchers have used linear analysis, whereas linear
analysis only preserves the power spectrum but destroys the spike wave structure
(Liu et al., 2011). FT and DFT were also not able to deal with non-stationary signals
because they miss local changes in high frequency components while considering the
whole time domain (Singh et al., 2012).
Considering the non-linearity and non-stationary properties of the EEG signals, some
researchers have used Fractal Dimension (FD) and Discrete Wavelet Transform
(DWT). FD is found to be suitable for the analysis of non-linear systems (Hosseini,
and Naghibi-Sistani, 2009; Hosseini, and Khalilzadeh, 2010; Liu et al., 2011). DWT
has also been found to be suitable for non-stationary and time-varying signals as it
allows simultaneous time and frequency signal analysis and it has been successfully
used by Murugappan et al. (2008), Murugappan et al. (2009), and Murugappan et al.
(2011) with promising results. Discrete Wavelet Packet Transform (DWPT) which is
an advance form of the DWT has recently been used in EEG signal processing.

37
DWPT was used to decompose EEG signals in Wali et al. (2013) and Murugappan et
al. (2013) in order to classify driver distraction levels.
The result from Murugappan, Nagarajan, and Yaacob (2011) shows that entropy
features captures the non-linearity of the EEG signals over different emotions better
than other linear statistical features like power, standard deviation, and variance. The
result from Rached and Perkusich (2013) also shows that entropy features give
higher accuracy than the energy features.
2.2.4 Feature Selection Phase
Feature selection also called dimensionality reduction is necessary before performing
classification. Choice of feature set plays a major role in emotion recognition (Singh
et al., 2012). The features that would be used for EEG emotion recognition needs to
be carefully and systematically chosen due to the fact that EEG signals are
multichannel and complex signals. In feature selection, the extracted features are
analyzed so as to understand as well as extract a subset of the features by removing
redundant features and maintaining only the informative features. The result will be
the feature vectors which can be used for classification analysis.
Feature selection techniques involve some computational algorithms like Principal
Component Analysis (PCA) and Genetic Algorithm (GA). Statistical analysis like F-
score Index has also been used for feature selection. Lin et al. (2010) has used F-
score index for feature reduction and feature selection. PCA is a standard technique
used for data reduction and feature selection due to the fact that it accounts for equal
information distribution among input vectors in the data set (Mazaeva, Ntuen, and
38
Lebby, 2001). GA has also been used by Peterson, Knight, Kirby, Anderson, and
Thaut (2005), Hosseini, and Khalilzadeh (2010), Hosseini (2012), and Yang, Singh,
Hines, Schlaghecken, Iliescu, Leeson, and Stocks (2012).
Unlike other works that based feature selection by applying algorithms on the data,
the selection of features used in this work are obtained from emotion classification
research findings from previous literatures.
2.2.5 Classification Phase
Classification of these features can be done based on the similarity in their patterns.
Techniques used in classification include K-Nearest Neighbour (KNN), Linear
Discriminant Analysis (LDA), Support Vector Machine (SVM), and Artificial
Neural Networks (ANN). SVM is the most popularly used as EEG signal classifier
(Jatupaiboon, Pan-ngum, and Israsena, 2013). Li and Lu (2009) achieved an
accuracy of 93.5% with SVM for classification of two emotional state; happiness
and sadness. Although SVM is a linear system, but by adding the kernel function, it
can be used in a non-linear system (Sanei and Chambers, 2008). Artificial Neural
Network (ANN) is another commonly used classifier. Self-Organizing Map (SOM)
(Gráfová, Vyšata, and Procházka, 2010) and Multilayer Perceptron with Back-
Propagation (MLP-BP) are some kind of ANN that has been used for EEG signals
classifying. MLP-BP was used by Rached and Perkusich (2013) to classify EEG
signals into four emotional states and recorded a highest classification accuracy of
95.56%.
39
2.3 DEAP EEG Dataset Details
The dataset used in this study is the EEG dataset from the DEAP database (Koelstra
et al., 2012). EEG signals and other physiological signals were acquired in this
experiment. This study is only interested in the EGG signals. The EEG database
consists of signals recorded from 32 subjects while watching music video. The
signals were recorded in 40 trials of experiments for each subject, that is, each
participant was asked to watch 40 music videos. The participant were asked to rate
their emotional state based on the video after each trial. The questionnaire used for
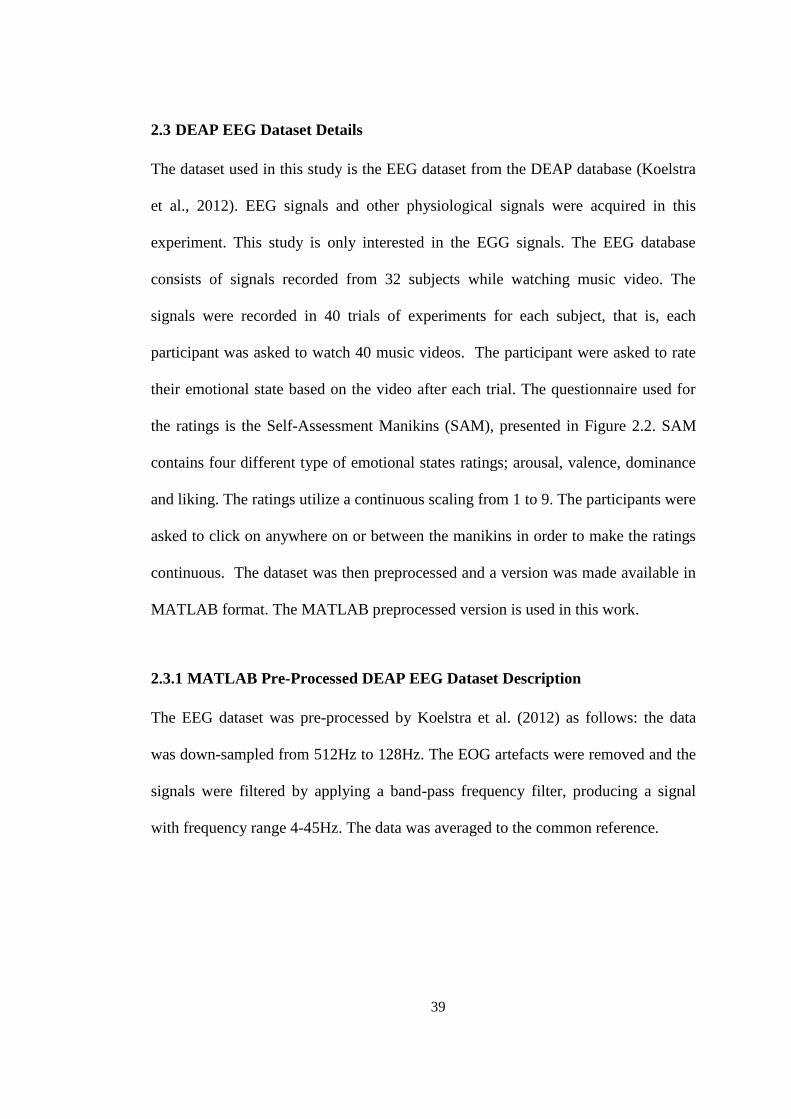
the ratings is the Self-Assessment Manikins (SAM), presented in Figure 2.2. SAM
contains four different type of emotional states ratings; arousal, valence, dominance
and liking. The ratings utilize a continuous scaling from 1 to 9. The participants were
asked to click on anywhere on or between the manikins in order to make the ratings
continuous. The dataset was then preprocessed and a version was made available in
MATLAB format. The MATLAB preprocessed version is used in this work.
2.3.1 MATLAB Pre-Processed DEAP EEG Dataset Description
The EEG dataset was pre-processed by Koelstra et al. (2012) as follows: the data
was down-sampled from 512Hz to 128Hz. The EOG artefacts were removed and the
signals were filtered by applying a band-pass frequency filter, producing a signal
with frequency range 4-45Hz. The data was averaged to the common reference.
40
Figure 2.2. Self-Assessment Manikins (SAM) Questionnaire
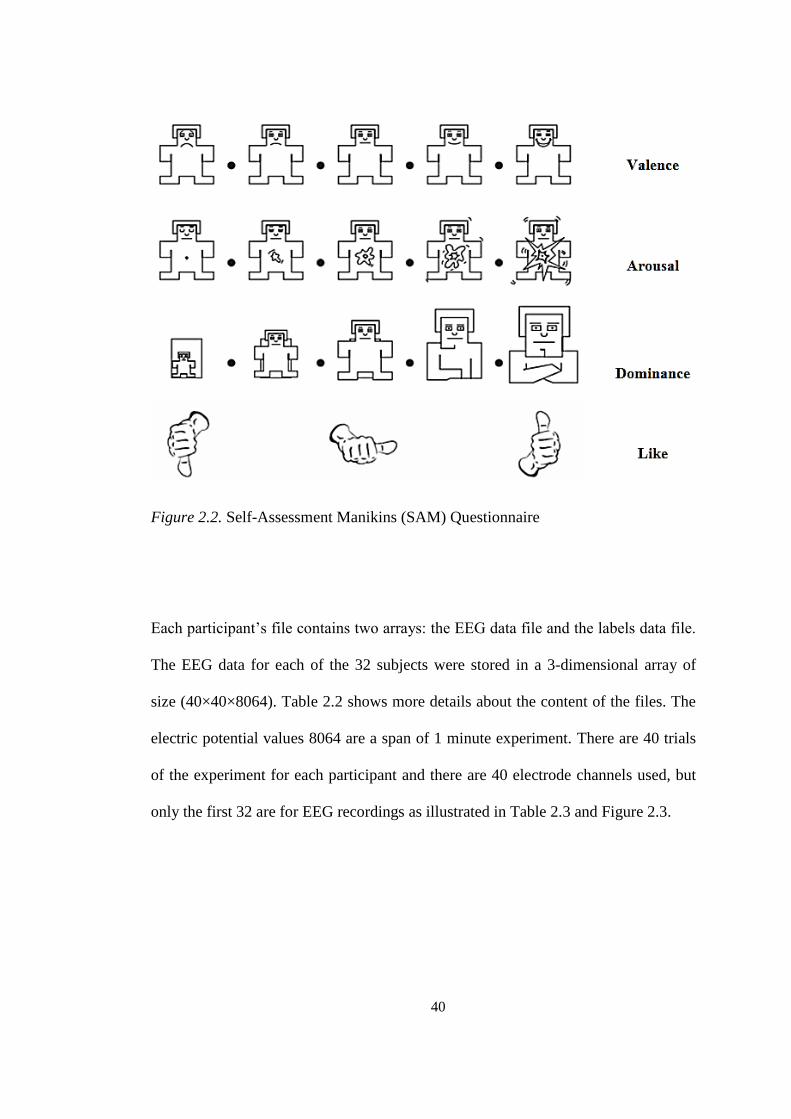
Each participant’s file contains two arrays: the EEG data file and the labels data file.
The EEG data for each of the 32 subjects were stored in a 3-dimensional array of
size (40×40×8064). Table 2.2 shows more details about the content of the files. The
electric potential values 8064 are a span of 1 minute experiment. There are 40 trials
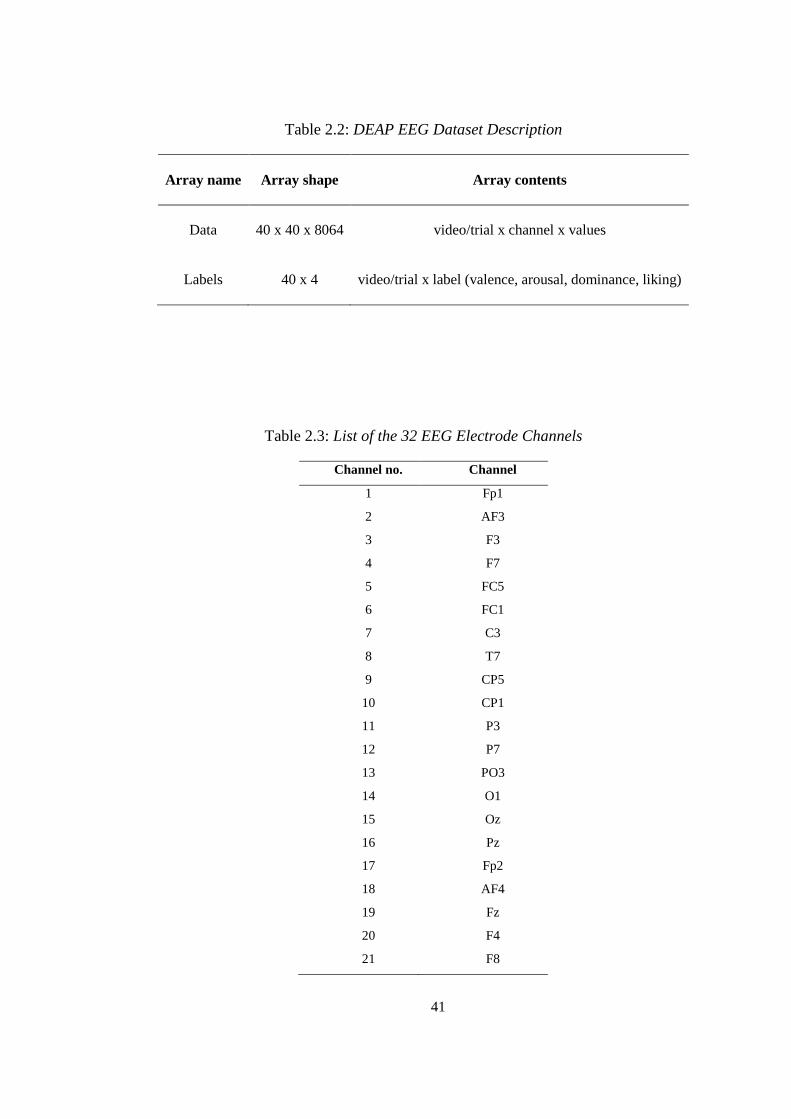
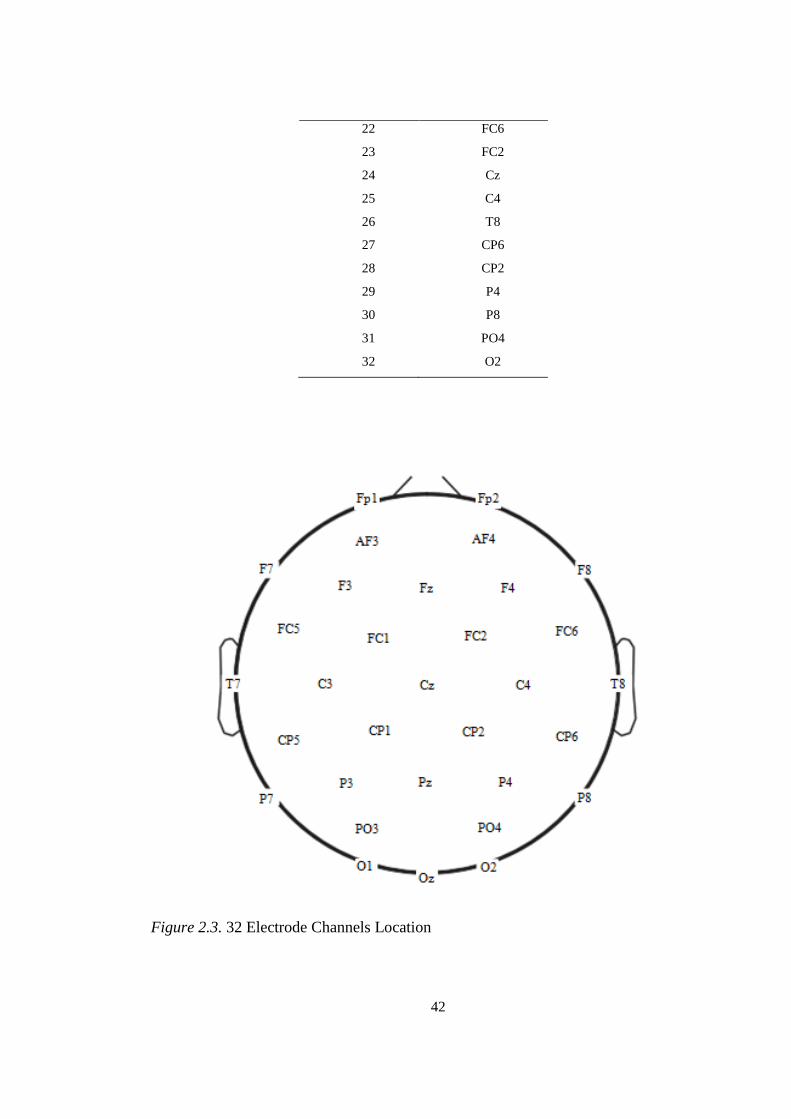
of the experiment for each participant and there are 40 electrode channels used, but
only the first 32 are for EEG recordings as illustrated in Table 2.3 and Figure 2.3.
41
Table 2.2: DEAP EEG Dataset Description
Array name Array shape Array contents
Data 40 x 40 x 8064 video/trial x channel x values
Labels 40 x 4 video/trial x label (valence, arousal, dominance, liking)
Table 2.3: List of the 32 EEG Electrode Channels
Channel no. Channel
1 Fp1
2 AF3
3 F3
4 F7
5 FC5
6 FC1
7 C3
8 T7
9 CP5
10 CP1
11 P3
12 P7
13 PO3
14 O1
15 Oz
16 Pz
17 Fp2
18 AF4
19 Fz
20 F4
21 F8
42
22 FC6
23 FC2
24 Cz
25 C4
26 T8
27 CP6
28 CP2
29 P4
30 P8
31 PO4
32 O2
Figure 2.3. 32 Electrode Channels Location
43
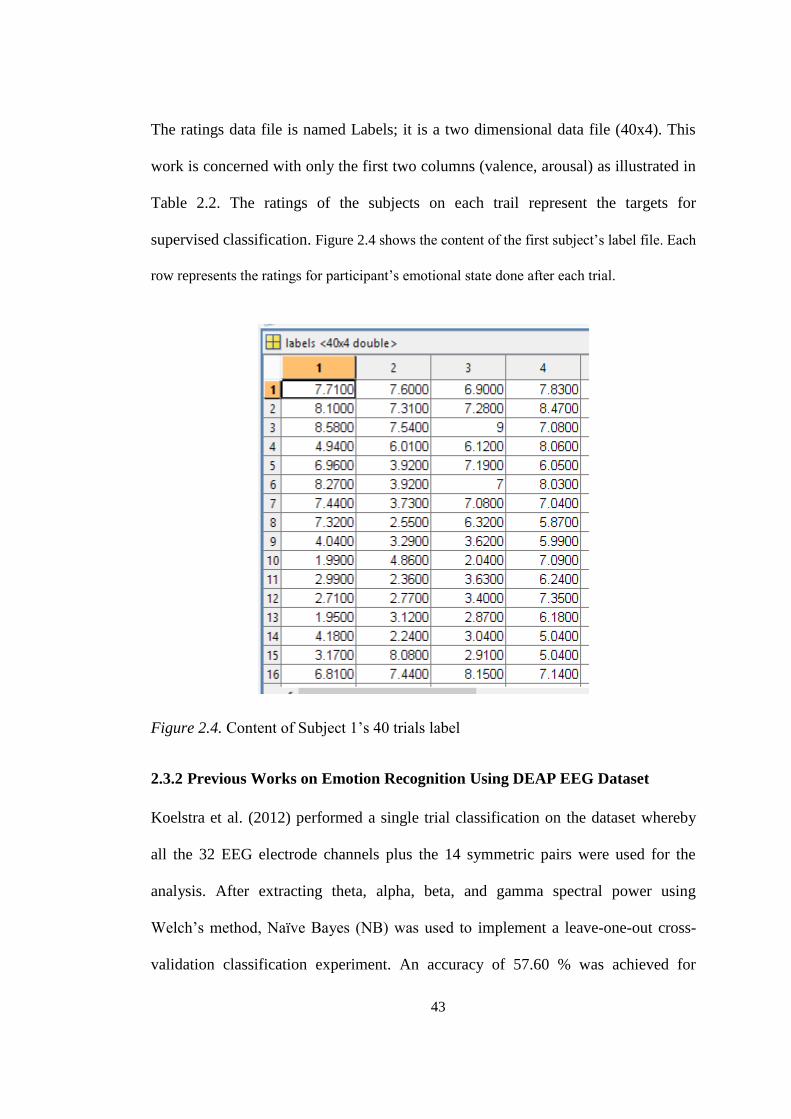
The ratings data file is named Labels; it is a two dimensional data file (40x4). This
work is concerned with only the first two columns (valence, arousal) as illustrated in
Table 2.2. The ratings of the subjects on each trail represent the targets for
supervised classification. Figure 2.4 shows the content of the first subject’s label file. Each
row represents the ratings for participant’s emotional state done after each trial.
Figure 2.4. Content of Subject 1’s 40 trials label
2.3.2 Previous Works on Emotion Recognition Using DEAP EEG Dataset
Koelstra et al. (2012) performed a single trial classification on the dataset whereby
all the 32 EEG electrode channels plus the 14 symmetric pairs were used for the
analysis. After extracting theta, alpha, beta, and gamma spectral power using
Welch’s method, Naïve Bayes (NB) was used to implement a leave-one-out cross-
validation classification experiment. An accuracy of 57.60 % was achieved for
44
classifying emotion into low/high valence and 62.00 % for low/high arousal. The F1-
scores were also calculated, 0.563 was achieved for classifying emotion into
low/high valence and 0.583 for low/high arousal.
Bahari ans Janghorbani (2013) applied Recurrence Plot Analysis (RPA) on the
dataset to extract non-linear features from all the 32 electrode channels. KNN was
used to implement a leave-one-out cross-validation classification experiment and an
accuracy of 58.05% was achieved for classifying emotion into low/high Valence and
64.56% for low/high Arousal.
Naser and Saha (2013) applied DT-CWPT on the dataset to extract delta, theta, beta,
and gamma energy features from all the 32 EEG electrode channels plus the 14
symmetric pairs. SVM was used to implement a leave-one-out cross-validation
classification experiment and an accuracy of 64.30% was achieved for classifying
emotion into low/high Valence and 66.20% for low/high Arousal.
Theta, alpha, beta, and gamma spectral power features were extracted from all the 32
EEG electrode channels plus the 14 symmetric pairs by Rozgić, Vitaladevuni, and
Prasad (2013). RBF-SVM was used to implement a leave-one-out cross-validation
classification experiment and an accuracy of 76.90% was achieved for classifying
emotion into low/high Valence and 68.40% for low/high Arousal.
Theta, alpha, beta, and gamma spectral power features were extracted from all the 32
EEG electrode channels plus the 14 symmetric pairs by Zhuang, Rozgi, and Crystal
(2014). RBF-SVM was also used to implement a leave-one-out cross-validation
45
classification experiment and an accuracy of 70.90% was achieved for classifying
emotion into low/high Valence and 67.10% for low/high Arousal.
Theta, alpha, beta, and gamma band power features were also extracted from the
Fp1, Fp2, F3, F4, T7, T8, P3, P4, O1, and O2 channels by Wichakam and Vateekul
(2014). RBF-SVM was used to implement a leave-one-out cross-validation
classification experiment and an accuracy of 64.90% was achieved for classifying
emotion into low/high Valence and 65.00% for low/high Arousal. The F1-scores
were also calculated, 0.514 was achieved for classifying emotion into low/high
Valence and 0.508 for low/high Arousal.
The result from the study carried out by Wichakam and Vateekul (2014) for
analyzing the feature extraction method shows that bandpower method is better than
the PSD by wavelet transform method for valence-arousal model based EEG
emotion recognition. Based on this result, the present study aimed at applying
DWPT for extracting entropy features and comparing the result with that of
Wichakam and Vateekul (2014). Entropy features extracted by DWPT is proposed
based on the findings from the review of literatures presented in section 2.2.3.
Another conclusion that can be made from the study carried out by Wichakam and
Vateekul (2014) in identifying the combination of electrode channels is that the 10
channels Fp1, Fp2, F3, F4, T7, T8, P3, P4, O1, and O2 gives better accuracy than
using all the 32 channels for valence-arousal model based EEG emotion recognition.
Based on this finding, the present study will perform a further experiment to
compare the combination of the 10 channels Fp1, Fp2, F3, F4, T7, T8, P3, P4, O1,
46
and O2 used in Wichakam and Vateekul (2014) with the combination of 4 frontal
channels Fp1, Fp2, F3, and F4 used in Bastos-Filho, Ferreira, Atencio, Arjunan, and
Kumar (2012), Singh, Jati, Khasnobish, Bhattacharyya, Konar, Tibarewala, and
Janarthanan (2012), and Petrantonakis and Hadjileontiadis (2010).
In summary, two classification experiments will be performed in the study. The first
experiment is to compare the result of entropy features extracted by DWPT with the
bandpower features extracted by Wichakam and Vateekul (2014). The second
experiment is to compare the combination 4 frontal channels Fp1, Fp2, F3, and F4
with that of the combination of 10 channels Fp1, Fp2, F3, F4, T7, T8, P3, P4, O1,
and O2.
The following sections discuss DWPT as a feature extraction method and RBF-SVM
as a classifier. The implementation of emotion classification for the two experiments
is then explained in subsequent sections.
2.4 DWPT Details
DWPT is used as the feature extraction technique; it is a form of DWT. The DWT is
based on multi-resolution analysis of wavelet transform and it is the method of
repeatedly filtering a given signal with two filters; a high band-pass filter and low
band-pass filter, which cut the frequency domain in the middle. Subsequently DWT
decomposes the signal into an approximation (A) and detailed signal (D)
corresponding to different frequency ranges, while conserving the time information
of the signal. The resulting approximation signal is further divided into new
approximation and detailed signal.
47
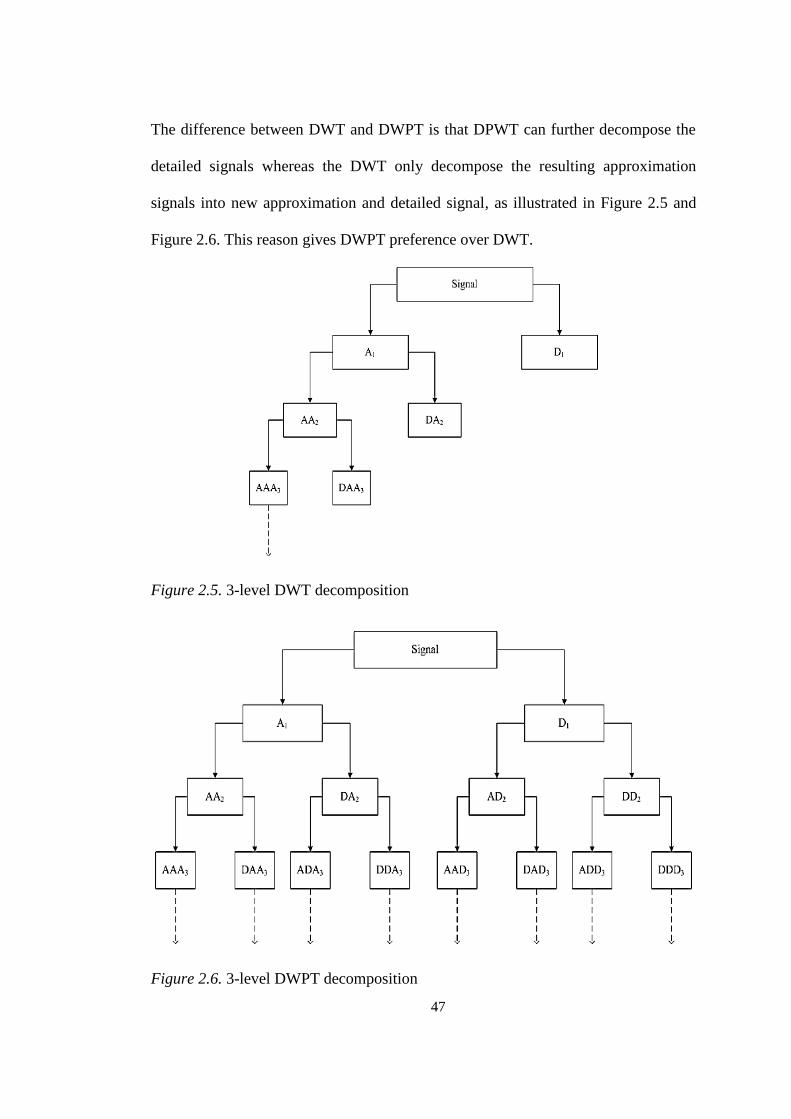
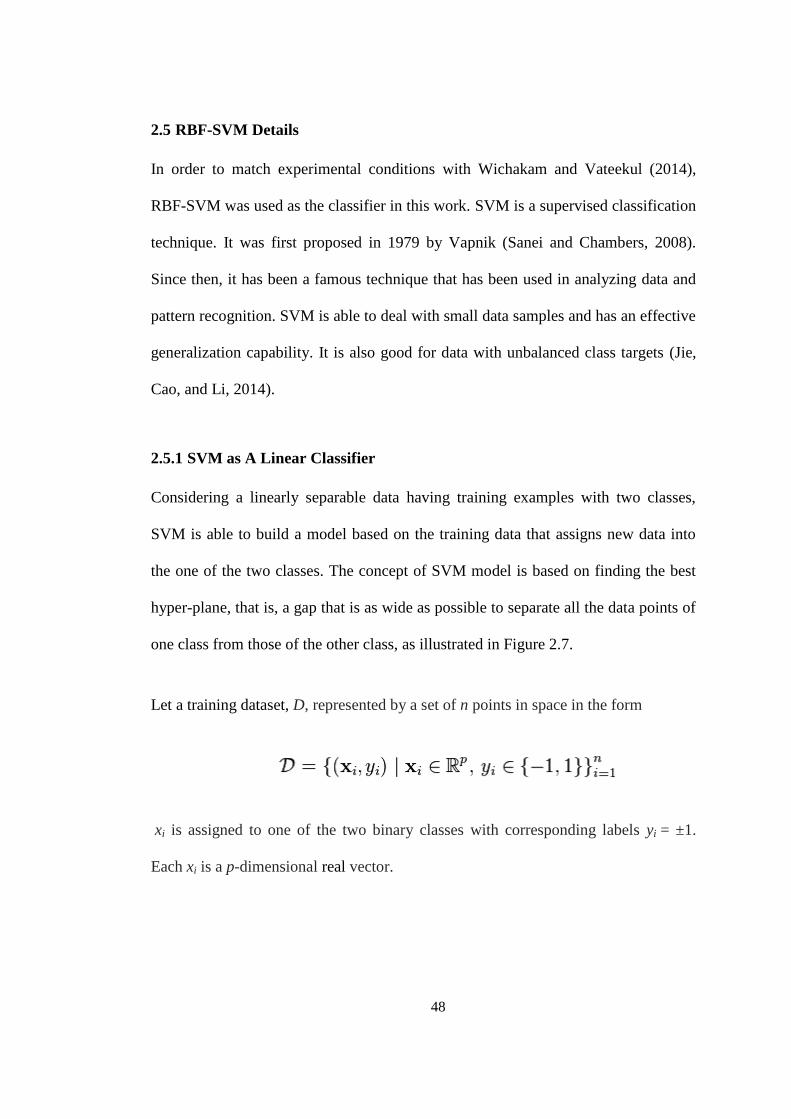
The difference between DWT and DWPT is that DPWT can further decompose the
detailed signals whereas the DWT only decompose the resulting approximation
signals into new approximation and detailed signal, as illustrated in Figure 2.5 and
Figure 2.6. This reason gives DWPT preference over DWT.
Figure 2.5. 3-level DWT decomposition
Figure 2.6. 3-level DWPT decomposition
48
2.5 RBF-SVM Details
In order to match experimental conditions with Wichakam and Vateekul (2014),
RBF-SVM was used as the classifier in this work. SVM is a supervised classification
technique. It was first proposed in 1979 by Vapnik (Sanei and Chambers, 2008).
Since then, it has been a famous technique that has been used in analyzing data and
pattern recognition. SVM is able to deal with small data samples and has an effective
generalization capability. It is also good for data with unbalanced class targets (Jie,
Cao, and Li, 2014).
2.5.1 SVM as A Linear Classifier
Considering a linearly separable data having training examples with two classes,
SVM is able to build a model based on the training data that assigns new data into
the one of the two classes. The concept of SVM model is based on finding the best
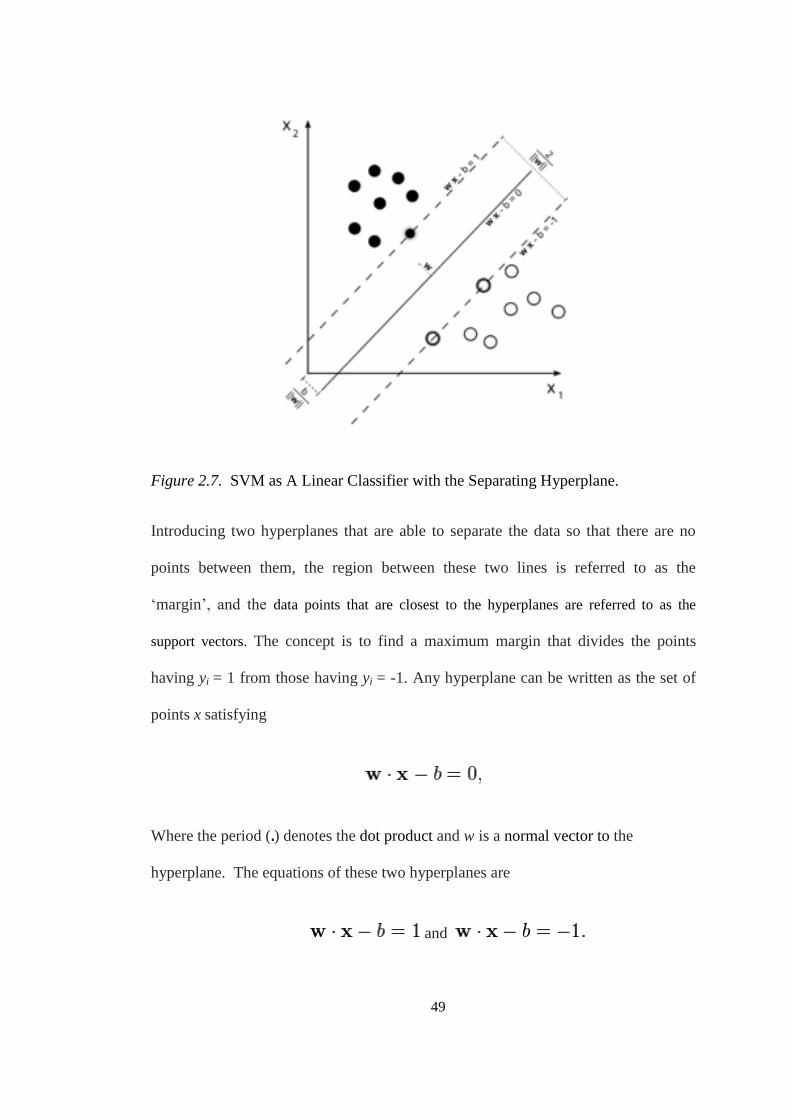
hyper-plane, that is, a gap that is as wide as possible to separate all the data points of
one class from those of the other class, as illustrated in Figure 2.7.
Let a training dataset, D, represented by a set of n points in space in the form
xi is assigned to one of the two binary classes with corresponding labels yi = ±1.
Each xi is a p-dimensional real vector.
49
Figure 2.7. SVM as A Linear Classifier with the Separating Hyperplane.
Introducing two hyperplanes that are able to separate the data so that there are no
points between them, the region between these two lines is referred to as the
‘margin’, and the data points that are closest to the hyperplanes are referred to as the
support vectors. The concept is to find a maximum margin that divides the points
having yi = 1 from those having yi = -1. Any hyperplane can be written as the set of
points x satisfying
Where the period ( ) denotes the dot product and w is a normal vector to the
hyperplane. The equations of these two hyperplanes are
and
50
And the distance between these two hyperplanes is . Therefore, maximizing
distance between these two hyperplanes is equivalent to minimizing . By adding
a constraint in order to prevent the data points from falling into the margin; for each
class either
(of the first class)
or
(of the second.)
Both of these constraints are written as:
The optimization problem can be written as a quadratic programming
optimization problem;
subject to: (for any )

51
2.5.2 Soft Margin Extension
Considering a non-perfectly linearly separable data, a soft margin is introduced in
order to allow some data points of one class to appear on the other side of the
boundary, as illustrated in Figure 2.8. This is implemented by introducing slack
variables, ξi ≥ 0, which measure the degree of misclassification of the data xi.
Figure 2.8. SVM as A Linear Classifier with the Soft Margin Extension
The quadratic programming problem becomes
subject to: (for any )
52
The constant C is a penalty parameter. Increasing C places more weight on the slack
variables ξi, meaning the optimization attempts to make a stricter separation between
the classes. Also reducing C towards 0 makes misclassification less important.
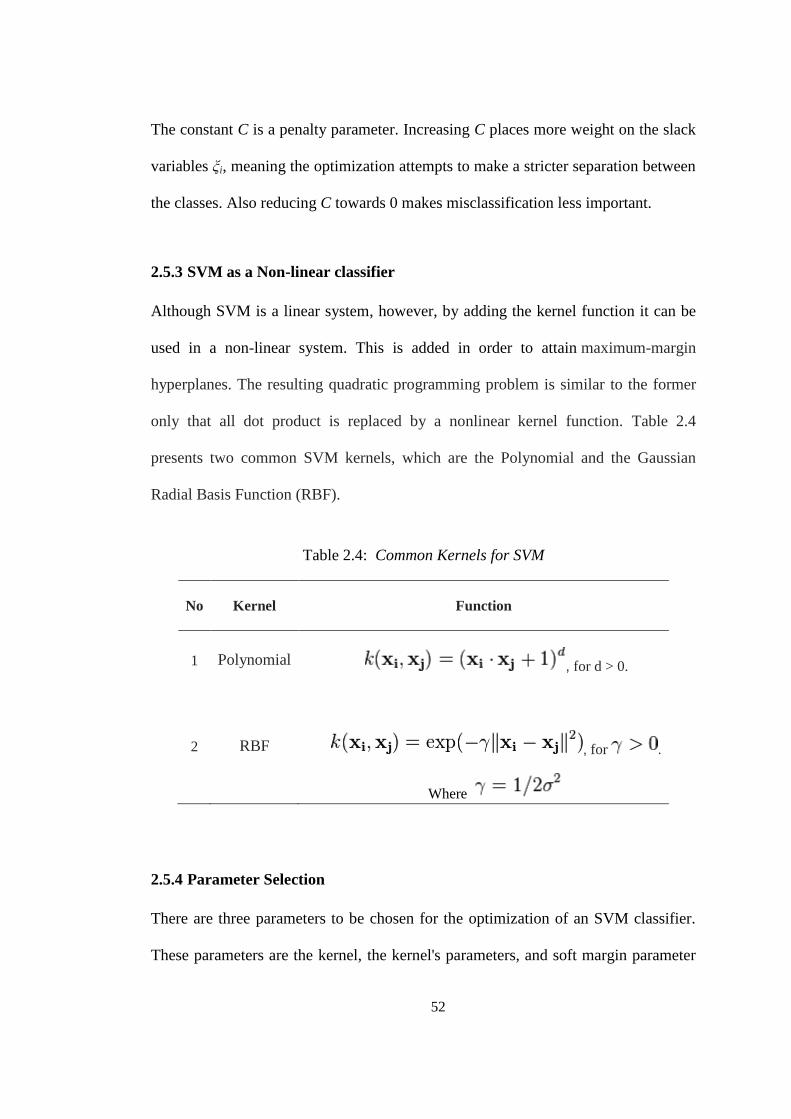
2.5.3 SVM as a Non-linear classifier
Although SVM is a linear system, however, by adding the kernel function it can be
used in a non-linear system. This is added in order to attain maximum-margin
hyperplanes. The resulting quadratic programming problem is similar to the former
only that all dot product is replaced by a nonlinear kernel function. Table 2.4
presents two common SVM kernels, which are the Polynomial and the Gaussian
Radial Basis Function (RBF).
Table 2.4: Common Kernels for SVM
No Kernel Function
1 Polynomial , for d > 0.
2 RBF , for .
Where
2.5.4 Parameter Selection
There are three parameters to be chosen for the optimization of an SVM classifier.
These parameters are the kernel, the kernel's parameters, and soft margin parameter
53
C. When using the RBF kernel, two parameter gamma (γ) and C are needed to be
tuned. The best combination of both parameters is often selected by performing
search with exponentially growing sequences of γ and C. An example is the range
{2−6
,..., 26} for both parameters.
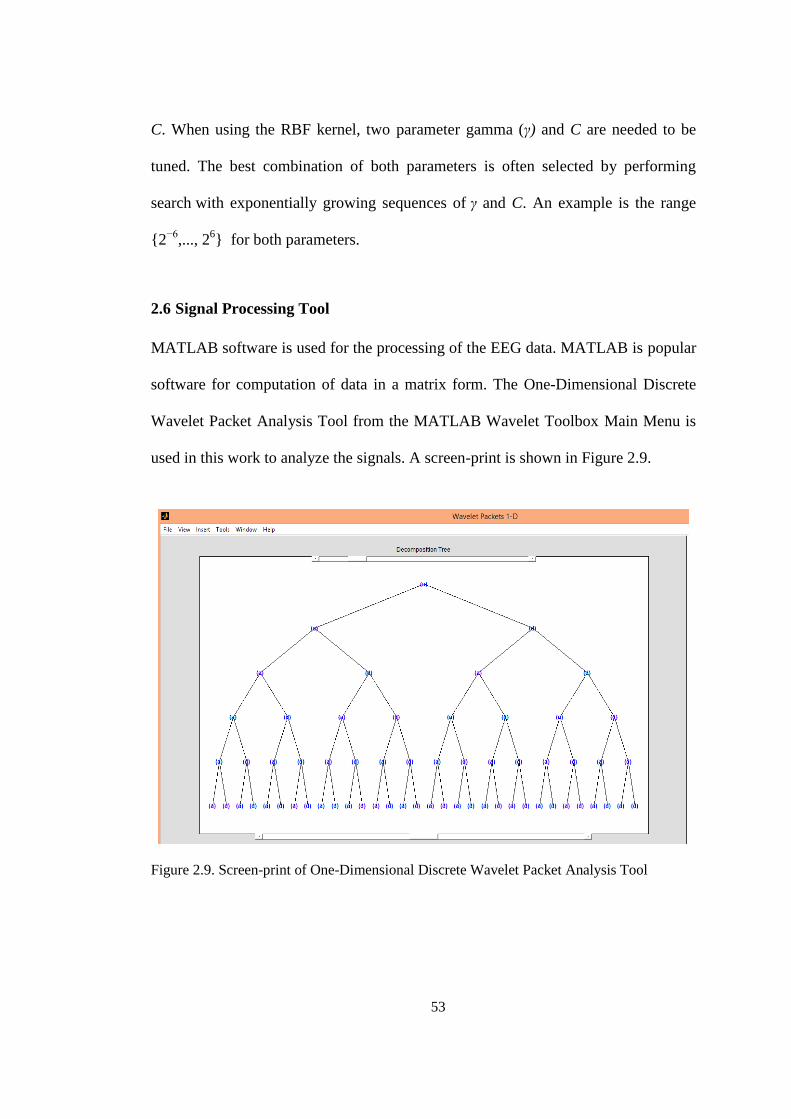
2.6 Signal Processing Tool
MATLAB software is used for the processing of the EEG data. MATLAB is popular
software for computation of data in a matrix form. The One-Dimensional Discrete
Wavelet Packet Analysis Tool from the MATLAB Wavelet Toolbox Main Menu is
used in this work to analyze the signals. A screen-print is shown in Figure 2.9.
Figure 2.9. Screen-print of One-Dimensional Discrete Wavelet Packet Analysis Tool

54
2.7 Chapter Summary
In this chapter, EEG-based emotion recognition process was discussed and previous
literatures were reviewed regarding the five stages involved in EEG-based emotion
recognition process. Details about the dataset used for analyses in this study were
discussed and previous literatures that have used the same dataset were reviewed.
55
CHAPTER THREE
METHODOLOGY
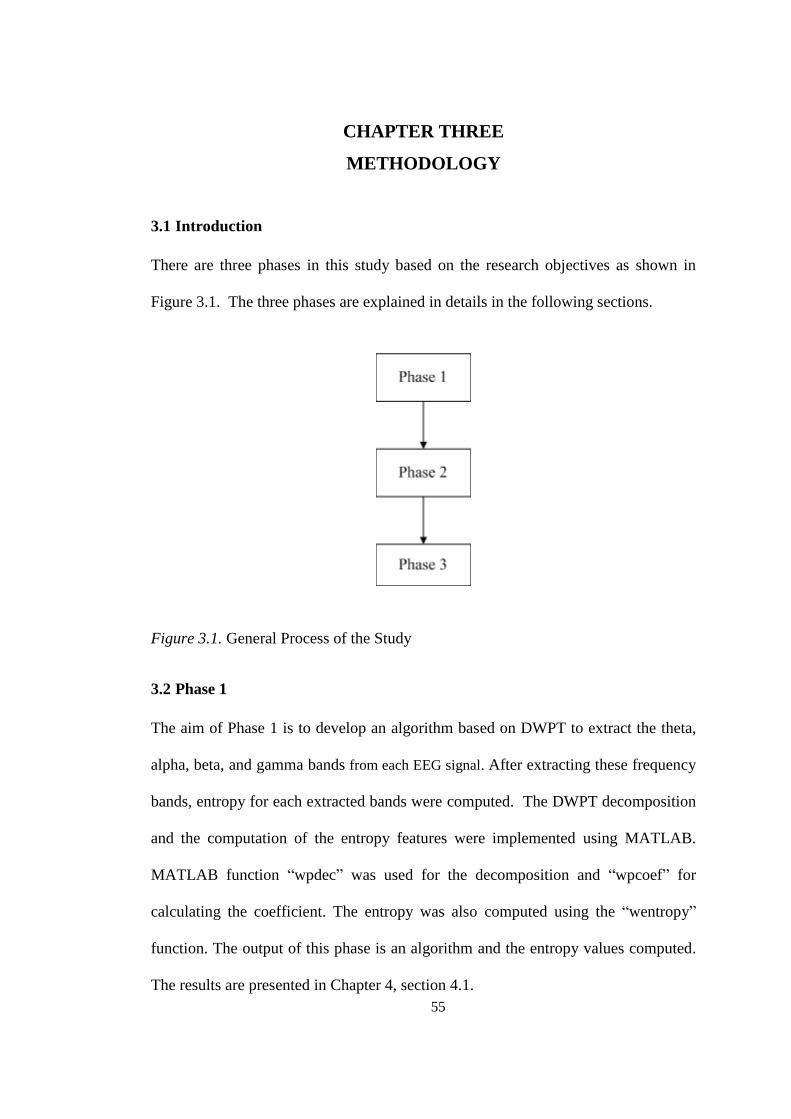
3.1 Introduction
There are three phases in this study based on the research objectives as shown in
Figure 3.1. The three phases are explained in details in the following sections.
Figure 3.1. General Process of the Study
3.2 Phase 1
The aim of Phase 1 is to develop an algorithm based on DWPT to extract the theta,
alpha, beta, and gamma bands from each EEG signal. After extracting these frequency
bands, entropy for each extracted bands were computed. The DWPT decomposition
and the computation of the entropy features were implemented using MATLAB.
MATLAB function “wpdec” was used for the decomposition and “wpcoef” for
calculating the coefficient. The entropy was also computed using the “wentropy”
function. The output of this phase is an algorithm and the entropy values computed.
The results are presented in Chapter 4, section 4.1.
56
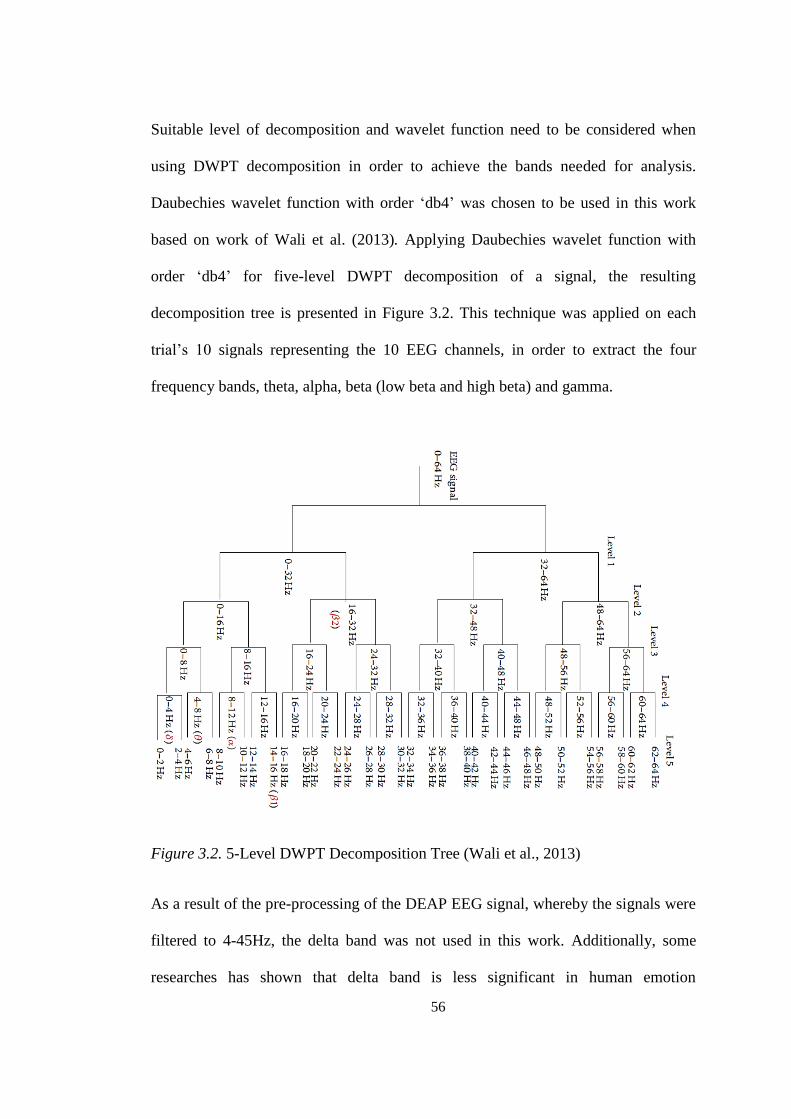
Suitable level of decomposition and wavelet function need to be considered when
using DWPT decomposition in order to achieve the bands needed for analysis.
Daubechies wavelet function with order ‘db4’ was chosen to be used in this work
based on work of Wali et al. (2013). Applying Daubechies wavelet function with
order ‘db4’ for five-level DWPT decomposition of a signal, the resulting
decomposition tree is presented in Figure 3.2. This technique was applied on each
trial’s 10 signals representing the 10 EEG channels, in order to extract the four
frequency bands, theta, alpha, beta (low beta and high beta) and gamma.
Figure 3.2. 5-Level DWPT Decomposition Tree (Wali et al., 2013)
As a result of the pre-processing of the DEAP EEG signal, whereby the signals were
filtered to 4-45Hz, the delta band was not used in this work. Additionally, some
researches has shown that delta band is less significant in human emotion
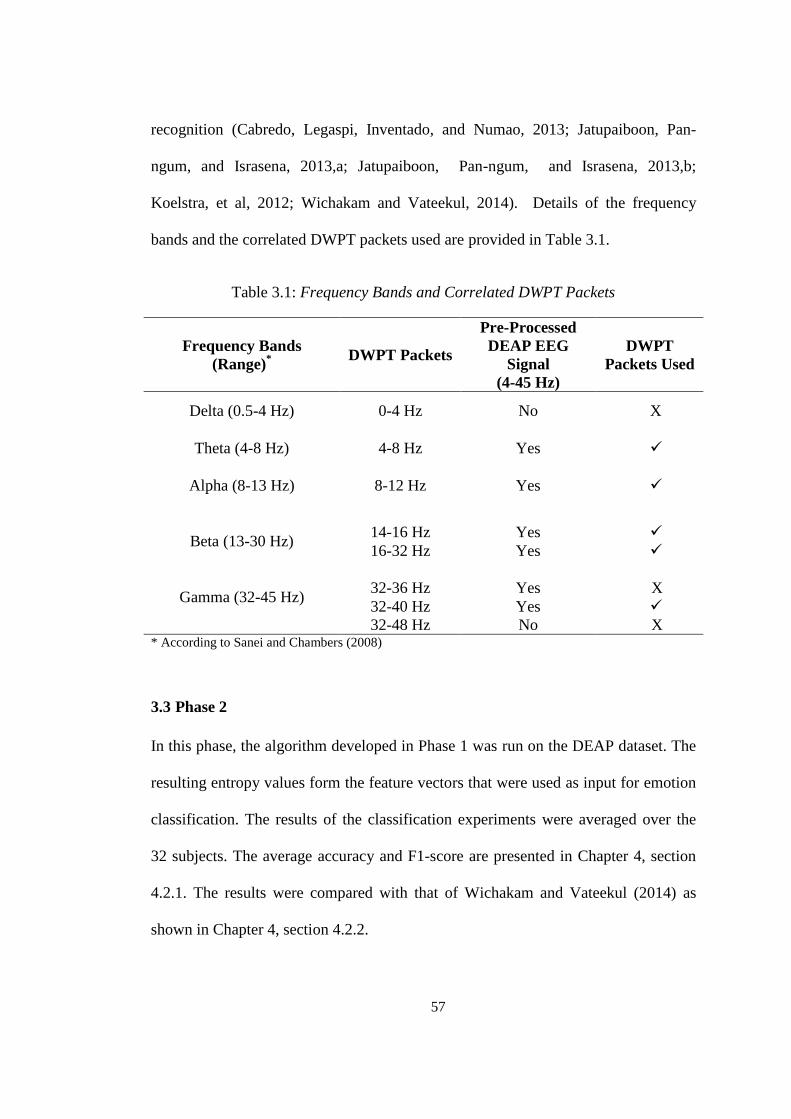
57
recognition (Cabredo, Legaspi, Inventado, and Numao, 2013; Jatupaiboon, Pan-
ngum, and Israsena, 2013,a; Jatupaiboon, Pan-ngum, and Israsena, 2013,b;
Koelstra, et al, 2012; Wichakam and Vateekul, 2014). Details of the frequency
bands and the correlated DWPT packets used are provided in Table 3.1.
Table 3.1: Frequency Bands and Correlated DWPT Packets
Frequency Bands
(Range)*
DWPT Packets
Pre-Processed
DEAP EEG
Signal
(4-45 Hz)
DWPT
Packets Used
Delta (0.5-4 Hz) 0-4 Hz No X
Theta (4-8 Hz) 4-8 Hz Yes
Alpha (8-13 Hz) 8-12 Hz Yes
Beta (13-30 Hz)
14-16 Hz
Yes
16-32 Hz Yes
Gamma (32-45 Hz)
32-36 Hz
Yes
X
32-40 Hz Yes
32-48 Hz No X * According to Sanei and Chambers (2008)
3.3 Phase 2
In this phase, the algorithm developed in Phase 1 was run on the DEAP dataset. The
resulting entropy values form the feature vectors that were used as input for emotion
classification. The results of the classification experiments were averaged over the
32 subjects. The average accuracy and F1-score are presented in Chapter 4, section
4.2.1. The results were compared with that of Wichakam and Vateekul (2014) as
shown in Chapter 4, section 4.2.2.
58
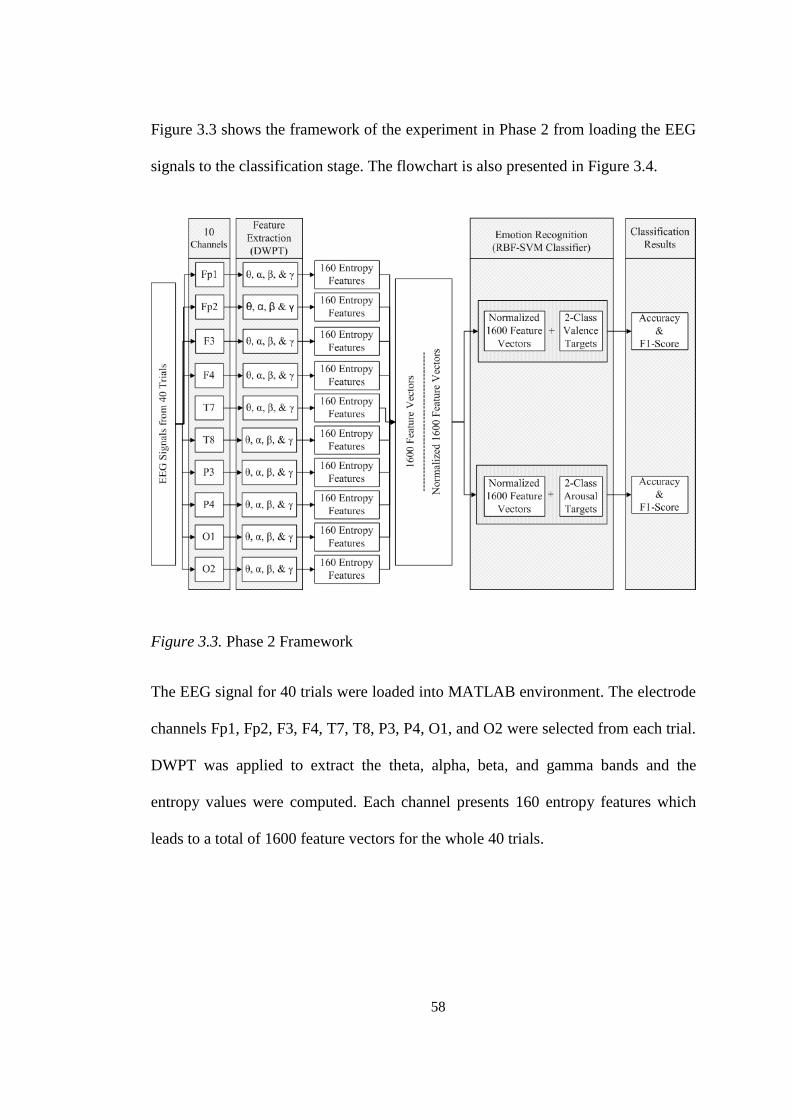
Figure 3.3 shows the framework of the experiment in Phase 2 from loading the EEG
signals to the classification stage. The flowchart is also presented in Figure 3.4.
Figure 3.3. Phase 2 Framework
The EEG signal for 40 trials were loaded into MATLAB environment. The electrode
channels Fp1, Fp2, F3, F4, T7, T8, P3, P4, O1, and O2 were selected from each trial.
DWPT was applied to extract the theta, alpha, beta, and gamma bands and the
entropy values were computed. Each channel presents 160 entropy features which
leads to a total of 1600 feature vectors for the whole 40 trials.
59
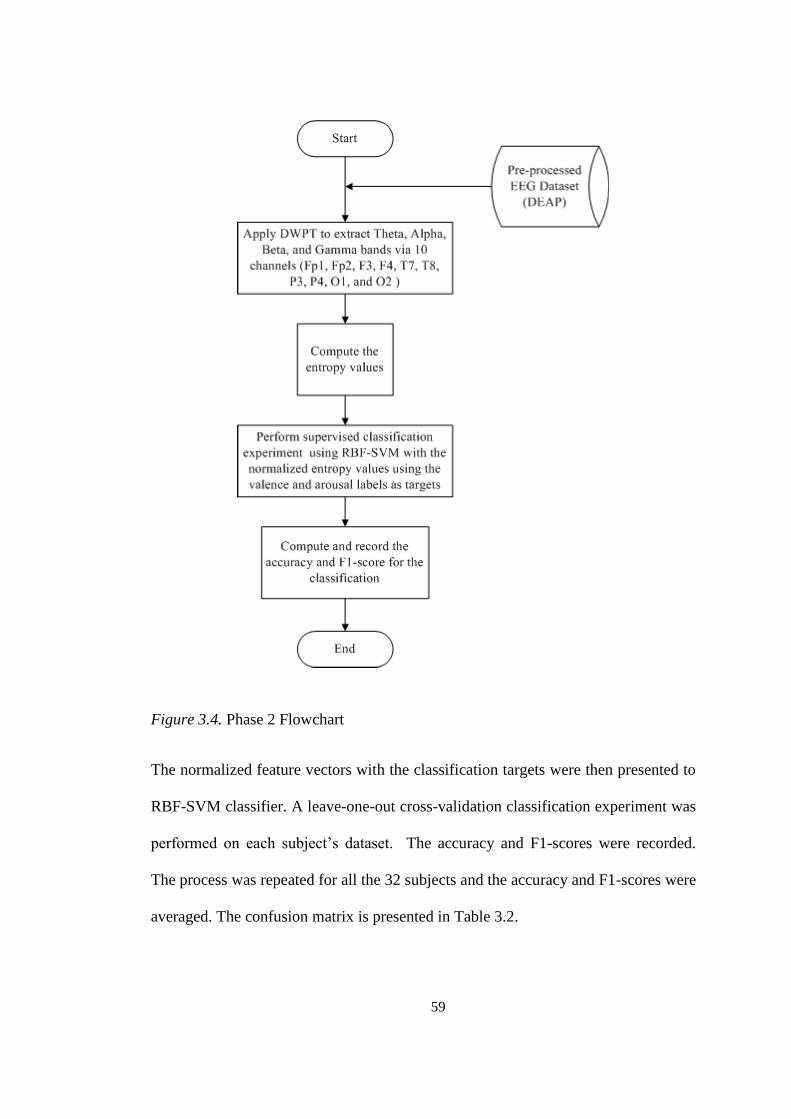
Figure 3.4. Phase 2 Flowchart
The normalized feature vectors with the classification targets were then presented to
RBF-SVM classifier. A leave-one-out cross-validation classification experiment was
performed on each subject’s dataset. The accuracy and F1-scores were recorded.
The process was repeated for all the 32 subjects and the accuracy and F1-scores were
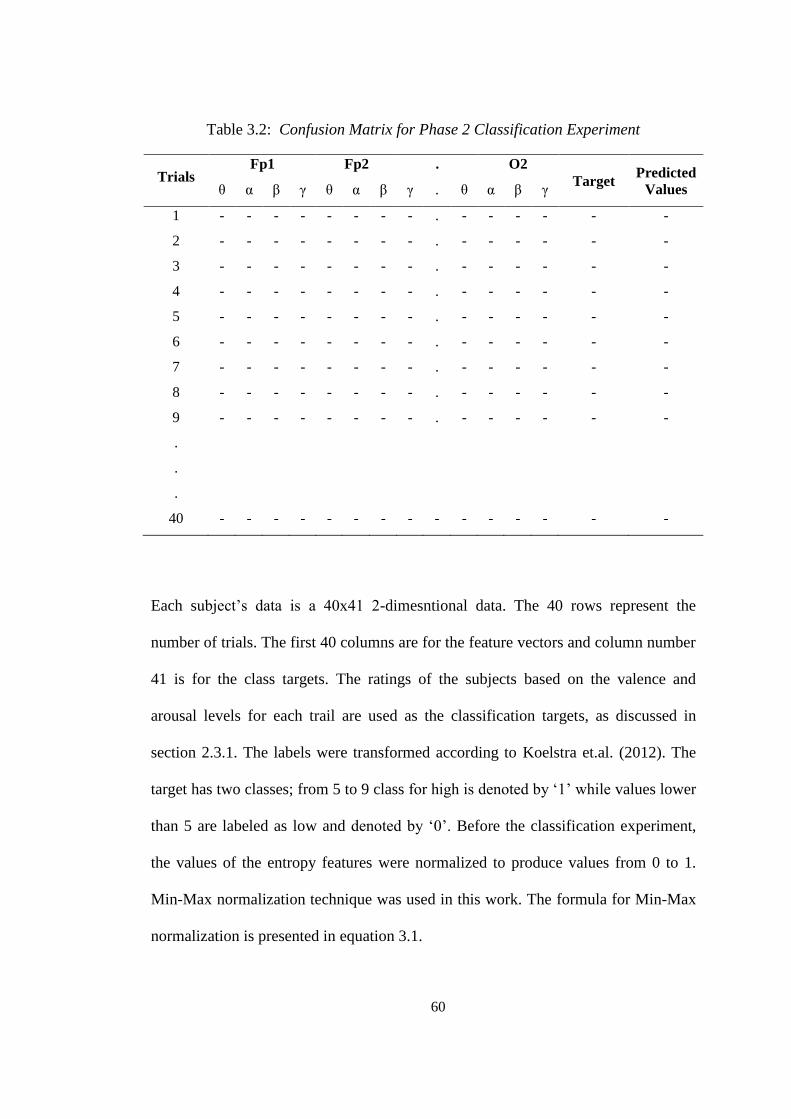
averaged. The confusion matrix is presented in Table 3.2.
60
Table 3.2: Confusion Matrix for Phase 2 Classification Experiment
Trials Fp1 Fp2 . O2
Target Predicted
Values θ α β γ θ α β γ . θ α β γ
1 - - - - - - - - . - - - - - -
2 - - - - - - - - . - - - - - -
3 - - - - - - - - . - - - - - -
4 - - - - - - - - . - - - - - -
5 - - - - - - - - . - - - - - -
6 - - - - - - - - . - - - - - -
7 - - - - - - - - . - - - - - -
8 - - - - - - - - . - - - - - -
9 - - - - - - - - . - - - - - -
.
.
.
40 - - - - - - - - - - - - - - -
Each subject’s data is a 40x41 2-dimesntional data. The 40 rows represent the
number of trials. The first 40 columns are for the feature vectors and column number
41 is for the class targets. The ratings of the subjects based on the valence and
arousal levels for each trail are used as the classification targets, as discussed in
section 2.3.1. The labels were transformed according to Koelstra et.al. (2012). The
target has two classes; from 5 to 9 class for high is denoted by ‘1’ while values lower
than 5 are labeled as low and denoted by ‘0’. Before the classification experiment,
the values of the entropy features were normalized to produce values from 0 to 1.
Min-Max normalization technique was used in this work. The formula for Min-Max
normalization is presented in equation 3.1.
61
(3.1)
Where,
Xn = new value for variable X
X0 = original value for variable X
Xmin = minimum value of the attribute
Xmax = maximum value of the attribute
MATLAB was used to process the normalization as well as to implement the RBF-
SVM classification. Using leave-one-out cross validation, one trial was left out as the
testing dataset while the remaining 39 as the training datasets were used to train the
classifier and then the testing dataset is used for testing.
As the Gaussian RBF function was used as the kernel function, there is need to tune
the two parameters γ and C in order to search for the best combination. The range
{2−6
,..., 26} was utilized as the search range for both (Rozgic et al., 2013; Zhuang et
al., 2014). The MATLAB functions ’svmtrain’ was used to train the SVM classifier.
The option 'qp' representing Quadratic Programming was chosen for the 'method'
used to find the separating hyperplane. MATLAB utilizes the ‘boxconstraint' for
setting the value of the parameter C. The option 'rbf' representing the RBF kernel
was used for the 'kernel_function'. MATLAB utilizes sigma (σ) as the scaling factor
for the RBF kernel; it is represented as 'rbf_sigma'. The relationship between σ and γ
is:
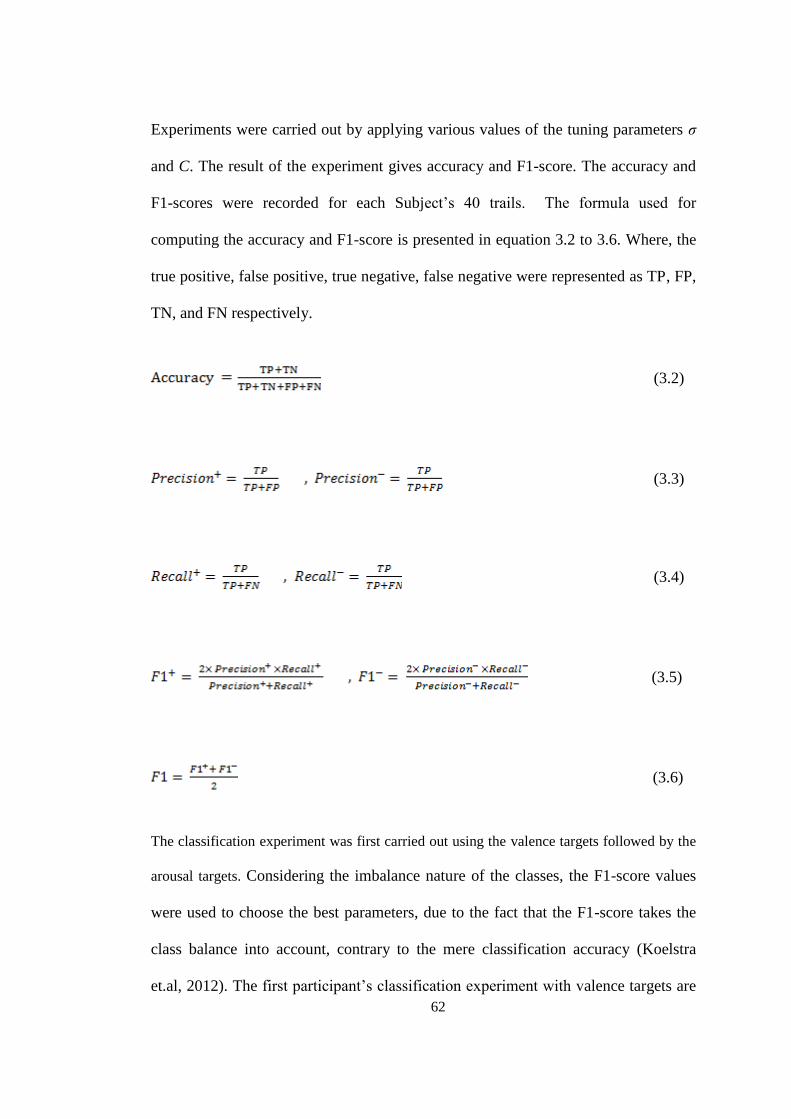
62
Experiments were carried out by applying various values of the tuning parameters σ
and C. The result of the experiment gives accuracy and F1-score. The accuracy and
F1-scores were recorded for each Subject’s 40 trails. The formula used for
computing the accuracy and F1-score is presented in equation 3.2 to 3.6. Where, the
true positive, false positive, true negative, false negative were represented as TP, FP,
TN, and FN respectively.
(3.2)
(3.3)
(3.4)
(3.5)
(3.6)
The classification experiment was first carried out using the valence targets followed by the
arousal targets. Considering the imbalance nature of the classes, the F1-score values
were used to choose the best parameters, due to the fact that the F1-score takes the
class balance into account, contrary to the mere classification accuracy (Koelstra
et.al, 2012). The first participant’s classification experiment with valence targets are
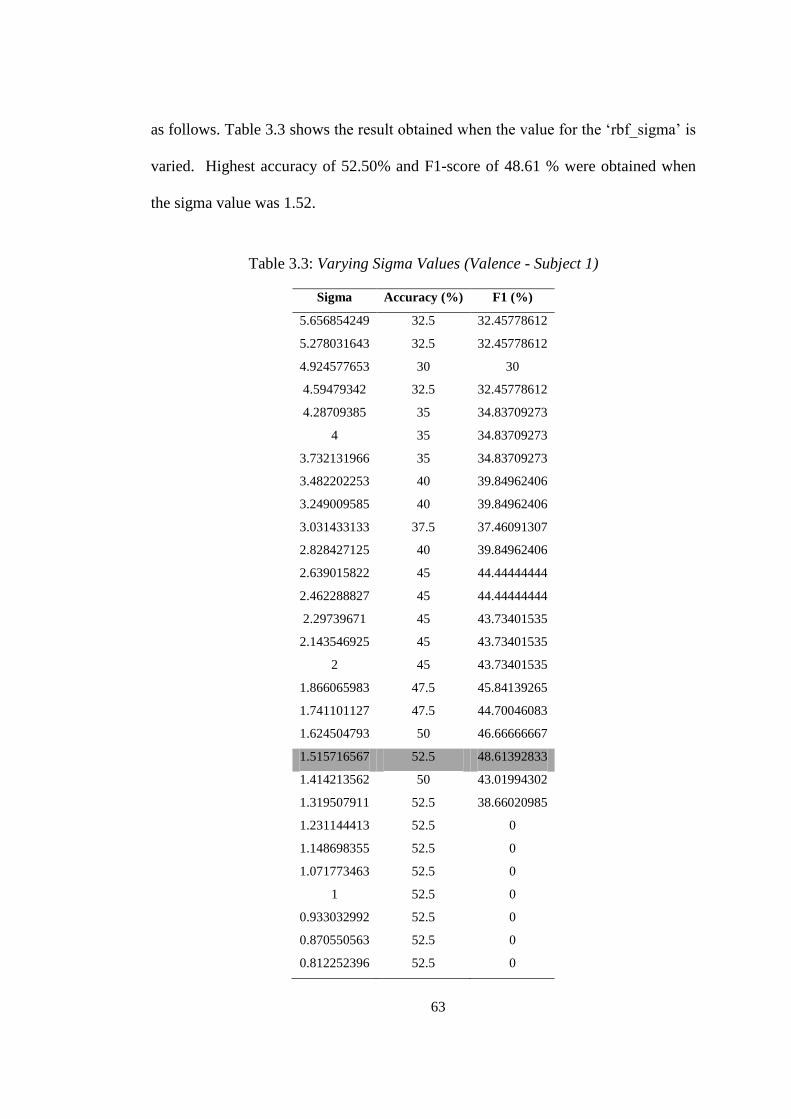
63
as follows. Table 3.3 shows the result obtained when the value for the ‘rbf_sigma’ is
varied. Highest accuracy of 52.50% and F1-score of 48.61 % were obtained when
the sigma value was 1.52.
Table 3.3: Varying Sigma Values (Valence - Subject 1)
Sigma Accuracy (%) F1 (%)
5.656854249 32.5 32.45778612
5.278031643 32.5 32.45778612
4.924577653 30 30
4.59479342 32.5 32.45778612
4.28709385 35 34.83709273
4 35 34.83709273
3.732131966 35 34.83709273
3.482202253 40 39.84962406
3.249009585 40 39.84962406
3.031433133 37.5 37.46091307
2.828427125 40 39.84962406
2.639015822 45 44.44444444
2.462288827 45 44.44444444
2.29739671 45 43.73401535
2.143546925 45 43.73401535
2 45 43.73401535
1.866065983 47.5 45.84139265
1.741101127 47.5 44.70046083
1.624504793 50 46.66666667
1.515716567 52.5 48.61392833
1.414213562 50 43.01994302
1.319507911 52.5 38.66020985
1.231144413 52.5 0
1.148698355 52.5 0
1.071773463 52.5 0
1 52.5 0
0.933032992 52.5 0
0.870550563 52.5 0
0.812252396 52.5 0

64
0.757858283 52.5 0
0.707106781 52.5 0
0.659753955 52.5 0
0.615572207 52.5 0
0.574349177 52.5 0
0.535886731 52.5 0
0.5 52.5 0
0.466516496 52.5 0
0.435275282 52.5 0
0.406126198 52.5 0
0.378929142 52.5 0
0.353553391 52.5 0
0.329876978 52.5 0
0.307786103 52.5 0
0.287174589 52.5 0
0.267943366 52.5 0
0.25 52.5 0
0.233258248 52.5 0
0.217637641 52.5 0
0.203063099 52.5 0
0.189464571 52.5 0
0.176776695 52.5 0
0.164938489 52.5 0
0.153893052 52.5 0
0.143587294 52.5 0
0.133971683 52.5 0
0.125 52.5 0
0.116629124 52.5 0
0.10881882 52.5 0
0.10153155 52.5 0
0.094732285 52.5 0
0.088388348 52.5 0
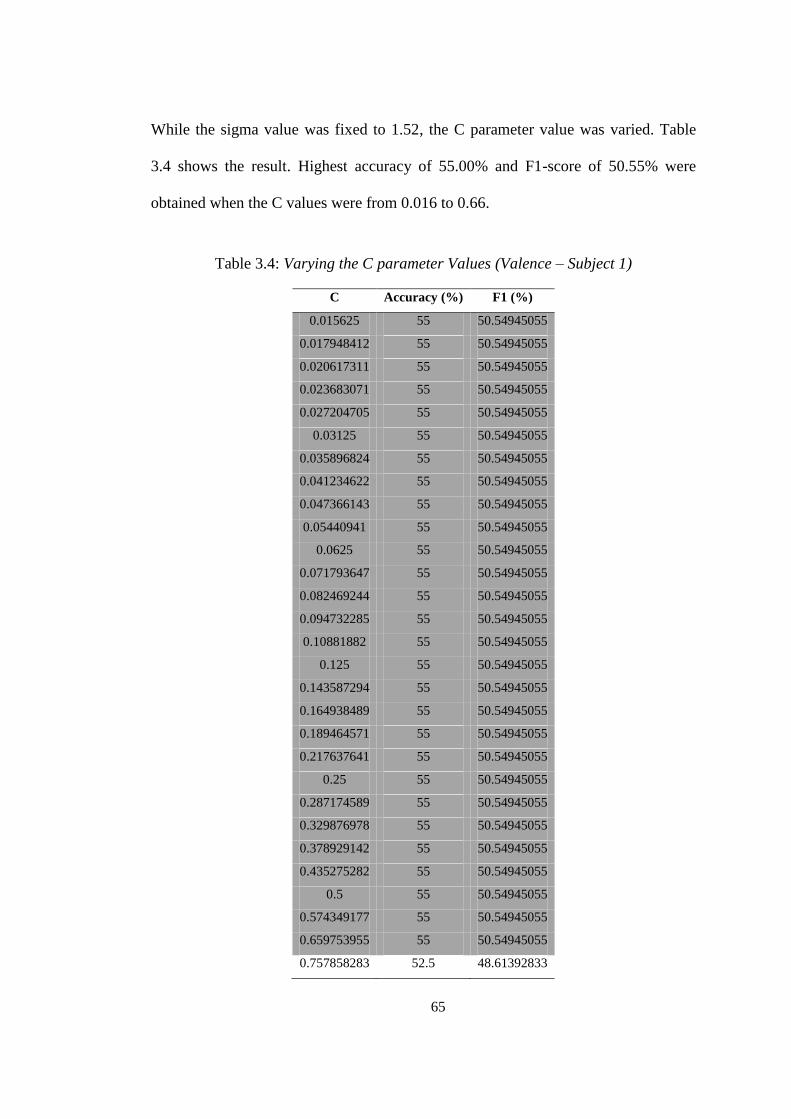
65
While the sigma value was fixed to 1.52, the C parameter value was varied. Table
3.4 shows the result. Highest accuracy of 55.00% and F1-score of 50.55% were
obtained when the C values were from 0.016 to 0.66.
Table 3.4: Varying the C parameter Values (Valence – Subject 1)
C Accuracy (%) F1 (%)
0.015625 55 50.54945055
0.017948412 55 50.54945055
0.020617311 55 50.54945055
0.023683071 55 50.54945055
0.027204705 55 50.54945055
0.03125 55 50.54945055
0.035896824 55 50.54945055
0.041234622 55 50.54945055
0.047366143 55 50.54945055
0.05440941 55 50.54945055
0.0625 55 50.54945055
0.071793647 55 50.54945055
0.082469244 55 50.54945055
0.094732285 55 50.54945055
0.10881882 55 50.54945055
0.125 55 50.54945055
0.143587294 55 50.54945055
0.164938489 55 50.54945055
0.189464571 55 50.54945055
0.217637641 55 50.54945055
0.25 55 50.54945055
0.287174589 55 50.54945055
0.329876978 55 50.54945055
0.378929142 55 50.54945055
0.435275282 55 50.54945055
0.5 55 50.54945055
0.574349177 55 50.54945055
0.659753955 55 50.54945055
0.757858283 52.5 48.61392833
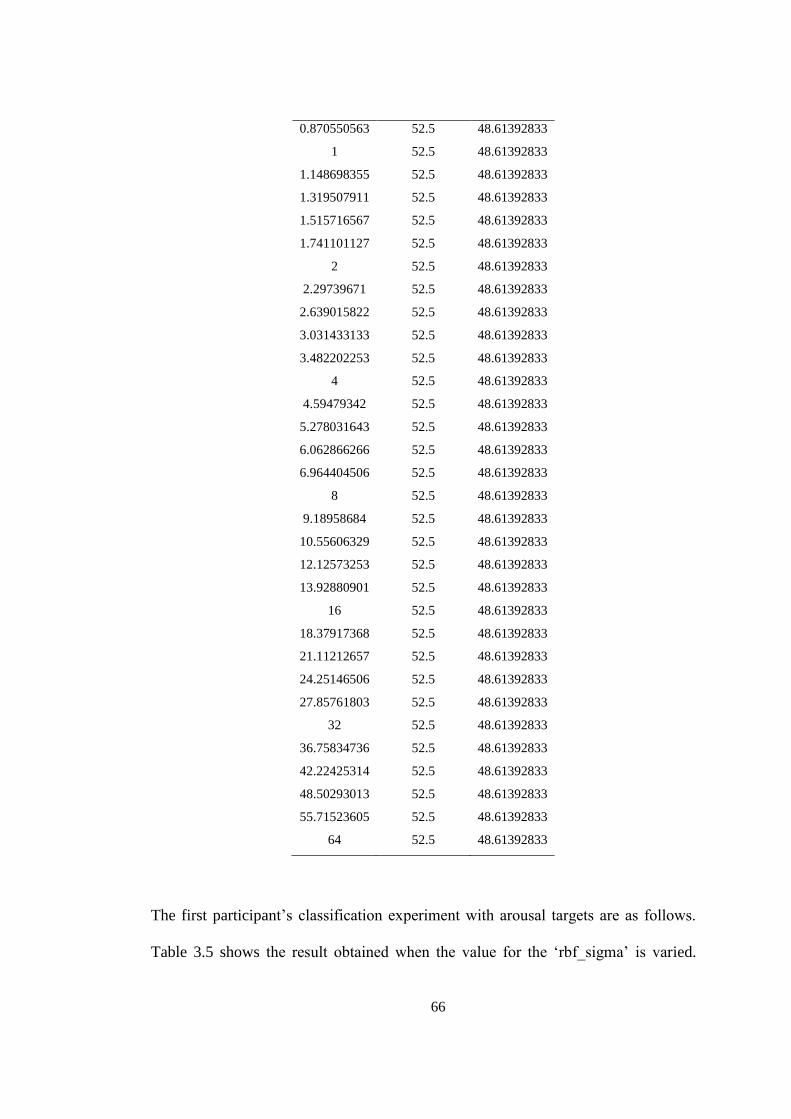
66
0.870550563 52.5 48.61392833
1 52.5 48.61392833
1.148698355 52.5 48.61392833
1.319507911 52.5 48.61392833
1.515716567 52.5 48.61392833
1.741101127 52.5 48.61392833
2 52.5 48.61392833
2.29739671 52.5 48.61392833
2.639015822 52.5 48.61392833
3.031433133 52.5 48.61392833
3.482202253 52.5 48.61392833
4 52.5 48.61392833
4.59479342 52.5 48.61392833
5.278031643 52.5 48.61392833
6.062866266 52.5 48.61392833
6.964404506 52.5 48.61392833
8 52.5 48.61392833
9.18958684 52.5 48.61392833
10.55606329 52.5 48.61392833
12.12573253 52.5 48.61392833
13.92880901 52.5 48.61392833
16 52.5 48.61392833
18.37917368 52.5 48.61392833
21.11212657 52.5 48.61392833
24.25146506 52.5 48.61392833
27.85761803 52.5 48.61392833
32 52.5 48.61392833
36.75834736 52.5 48.61392833
42.22425314 52.5 48.61392833
48.50293013 52.5 48.61392833
55.71523605 52.5 48.61392833
64 52.5 48.61392833
The first participant’s classification experiment with arousal targets are as follows.
Table 3.5 shows the result obtained when the value for the ‘rbf_sigma’ is varied.
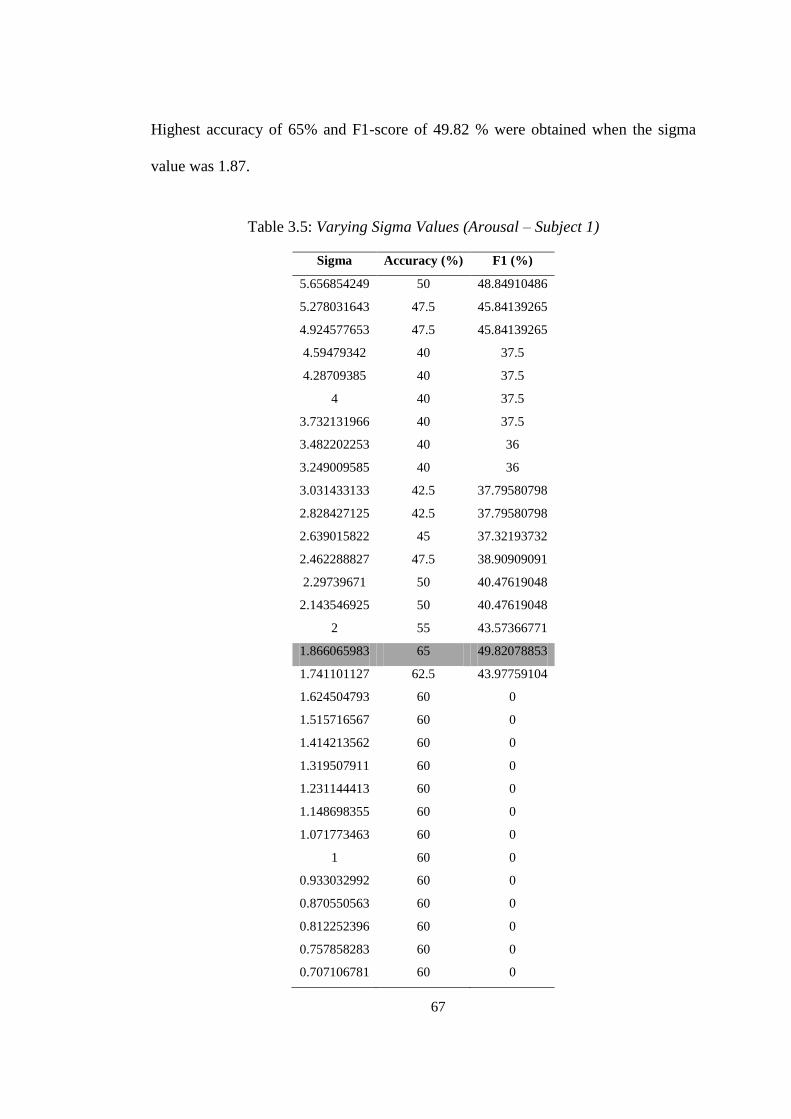
67
Highest accuracy of 65% and F1-score of 49.82 % were obtained when the sigma
value was 1.87.
Table 3.5: Varying Sigma Values (Arousal – Subject 1)
Sigma Accuracy (%) F1 (%)
5.656854249 50 48.84910486
5.278031643 47.5 45.84139265
4.924577653 47.5 45.84139265
4.59479342 40 37.5
4.28709385 40 37.5
4 40 37.5
3.732131966 40 37.5
3.482202253 40 36
3.249009585 40 36
3.031433133 42.5 37.79580798
2.828427125 42.5 37.79580798
2.639015822 45 37.32193732
2.462288827 47.5 38.90909091
2.29739671 50 40.47619048
2.143546925 50 40.47619048
2 55 43.57366771
1.866065983 65 49.82078853
1.741101127 62.5 43.97759104
1.624504793 60 0
1.515716567 60 0
1.414213562 60 0
1.319507911 60 0
1.231144413 60 0
1.148698355 60 0
1.071773463 60 0
1 60 0
0.933032992 60 0
0.870550563 60 0
0.812252396 60 0
0.757858283 60 0
0.707106781 60 0
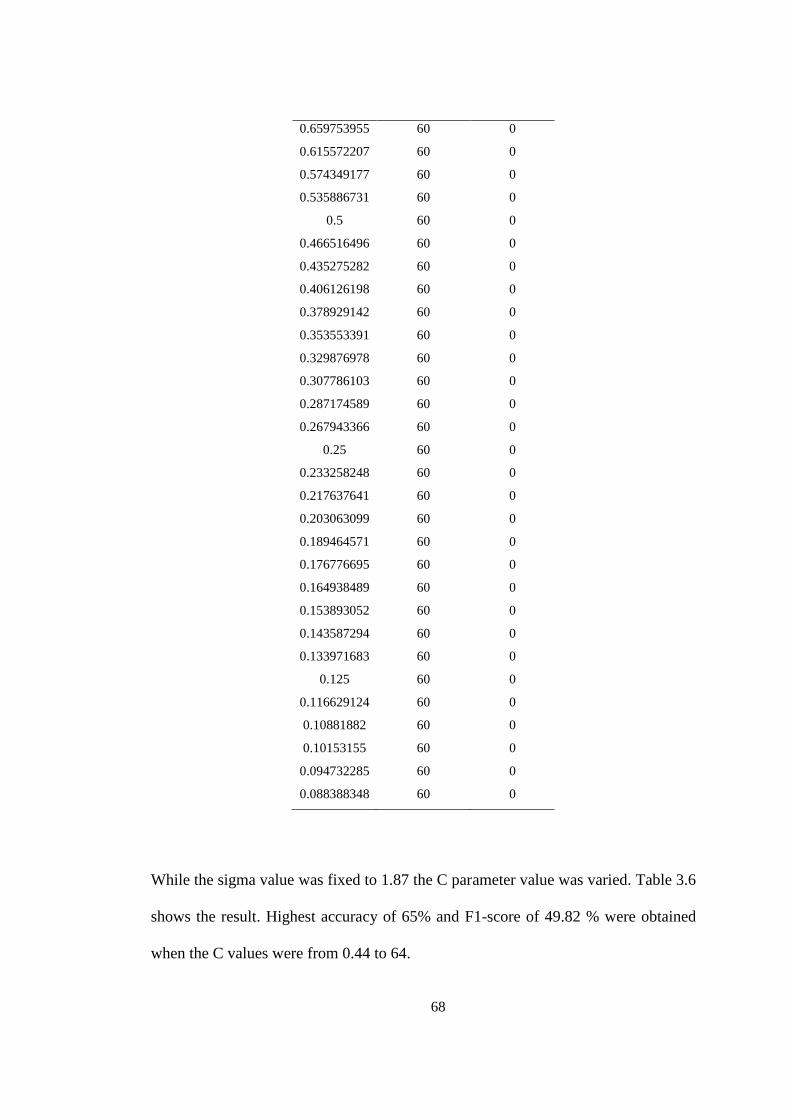
68
0.659753955 60 0
0.615572207 60 0
0.574349177 60 0
0.535886731 60 0
0.5 60 0
0.466516496 60 0
0.435275282 60 0
0.406126198 60 0
0.378929142 60 0
0.353553391 60 0
0.329876978 60 0
0.307786103 60 0
0.287174589 60 0
0.267943366 60 0
0.25 60 0
0.233258248 60 0
0.217637641 60 0
0.203063099 60 0
0.189464571 60 0
0.176776695 60 0
0.164938489 60 0
0.153893052 60 0
0.143587294 60 0
0.133971683 60 0
0.125 60 0
0.116629124 60 0
0.10881882 60 0
0.10153155 60 0
0.094732285 60 0
0.088388348 60 0
While the sigma value was fixed to 1.87 the C parameter value was varied. Table 3.6
shows the result. Highest accuracy of 65% and F1-score of 49.82 % were obtained
when the C values were from 0.44 to 64.
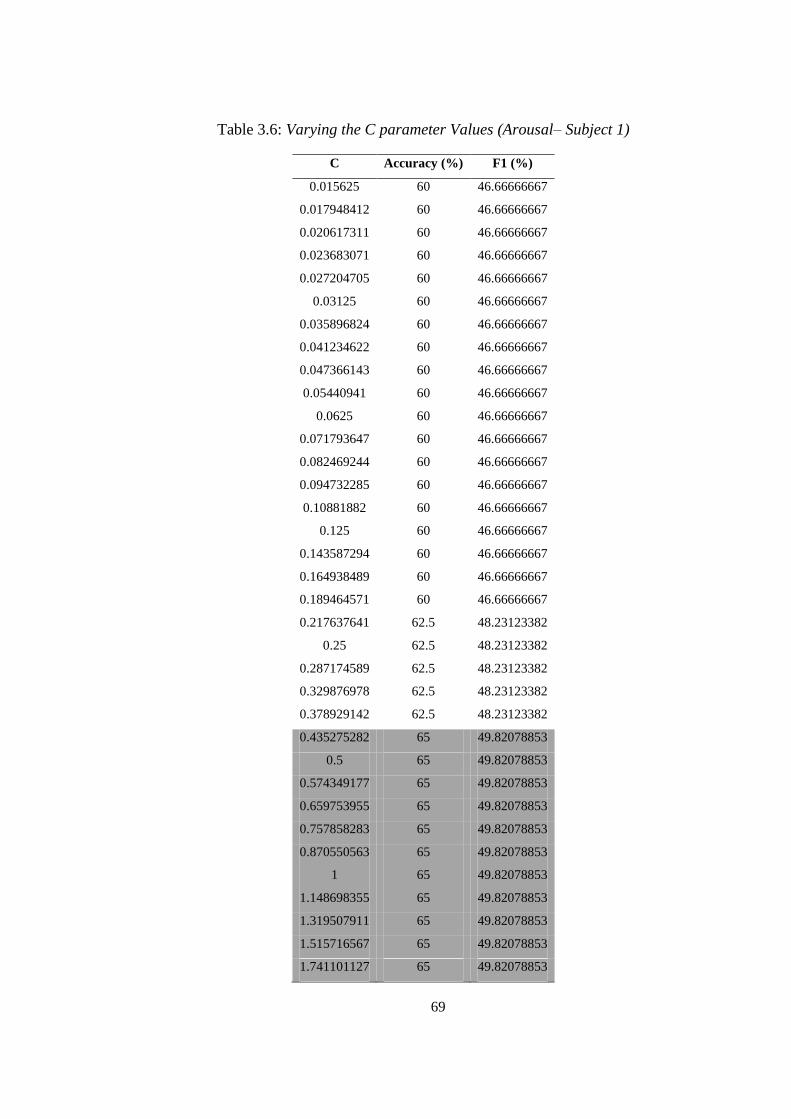
69
Table 3.6: Varying the C parameter Values (Arousal– Subject 1)
C Accuracy (%) F1 (%)
0.015625 60 46.66666667
0.017948412 60 46.66666667
0.020617311 60 46.66666667
0.023683071 60 46.66666667
0.027204705 60 46.66666667
0.03125 60 46.66666667
0.035896824 60 46.66666667
0.041234622 60 46.66666667
0.047366143 60 46.66666667
0.05440941 60 46.66666667
0.0625 60 46.66666667
0.071793647 60 46.66666667
0.082469244 60 46.66666667
0.094732285 60 46.66666667
0.10881882 60 46.66666667
0.125 60 46.66666667
0.143587294 60 46.66666667
0.164938489 60 46.66666667
0.189464571 60 46.66666667
0.217637641 62.5 48.23123382
0.25 62.5 48.23123382
0.287174589 62.5 48.23123382
0.329876978 62.5 48.23123382
0.378929142 62.5 48.23123382
0.435275282 65 49.82078853
0.5 65 49.82078853
0.574349177 65 49.82078853
0.659753955 65 49.82078853
0.757858283 65 49.82078853
0.870550563 65 49.82078853
1 65 49.82078853
1.148698355 65 49.82078853
1.319507911 65 49.82078853
1.515716567 65 49.82078853
1.741101127 65 49.82078853
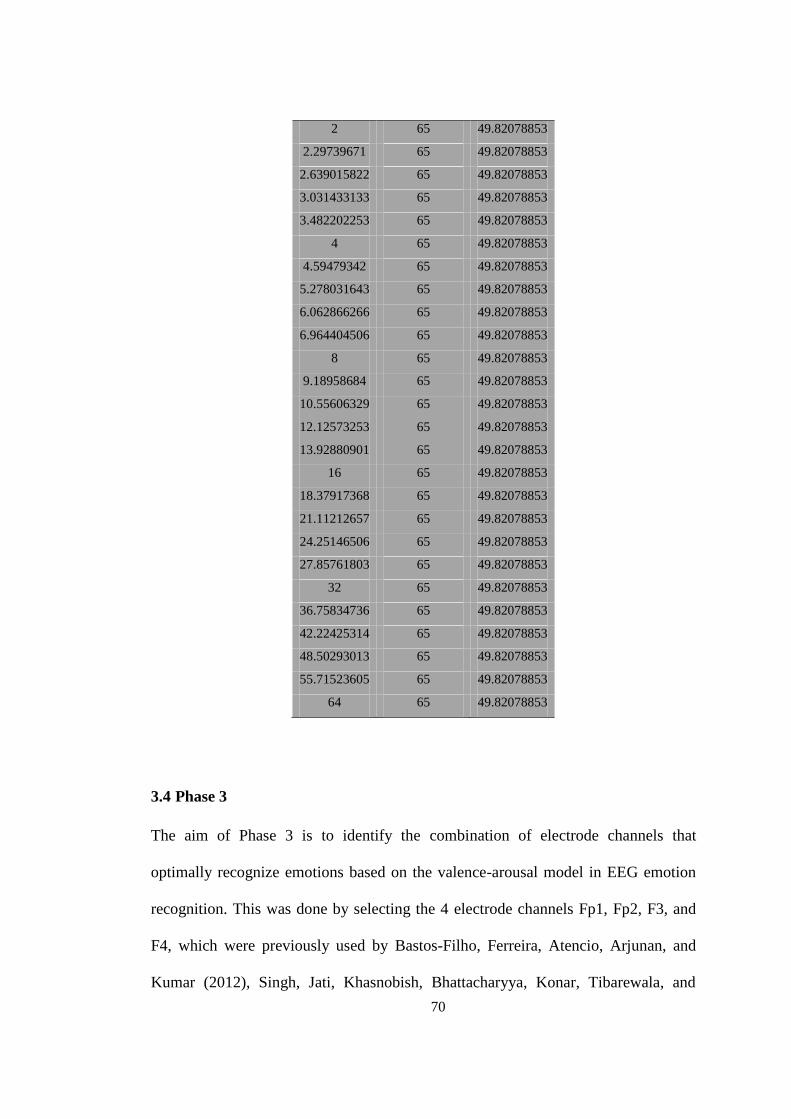
70
2 65 49.82078853
2.29739671 65 49.82078853
2.639015822 65 49.82078853
3.031433133 65 49.82078853
3.482202253 65 49.82078853
4 65 49.82078853
4.59479342 65 49.82078853
5.278031643 65 49.82078853
6.062866266 65 49.82078853
6.964404506 65 49.82078853
8 65 49.82078853
9.18958684 65 49.82078853
10.55606329 65 49.82078853
12.12573253 65 49.82078853
13.92880901 65 49.82078853
16 65 49.82078853
18.37917368 65 49.82078853
21.11212657 65 49.82078853
24.25146506 65 49.82078853
27.85761803 65 49.82078853
32 65 49.82078853
36.75834736 65 49.82078853
42.22425314 65 49.82078853
48.50293013 65 49.82078853
55.71523605 65 49.82078853
64 65 49.82078853
3.4 Phase 3
The aim of Phase 3 is to identify the combination of electrode channels that
optimally recognize emotions based on the valence-arousal model in EEG emotion
recognition. This was done by selecting the 4 electrode channels Fp1, Fp2, F3, and
F4, which were previously used by Bastos-Filho, Ferreira, Atencio, Arjunan, and
Kumar (2012), Singh, Jati, Khasnobish, Bhattacharyya, Konar, Tibarewala, and
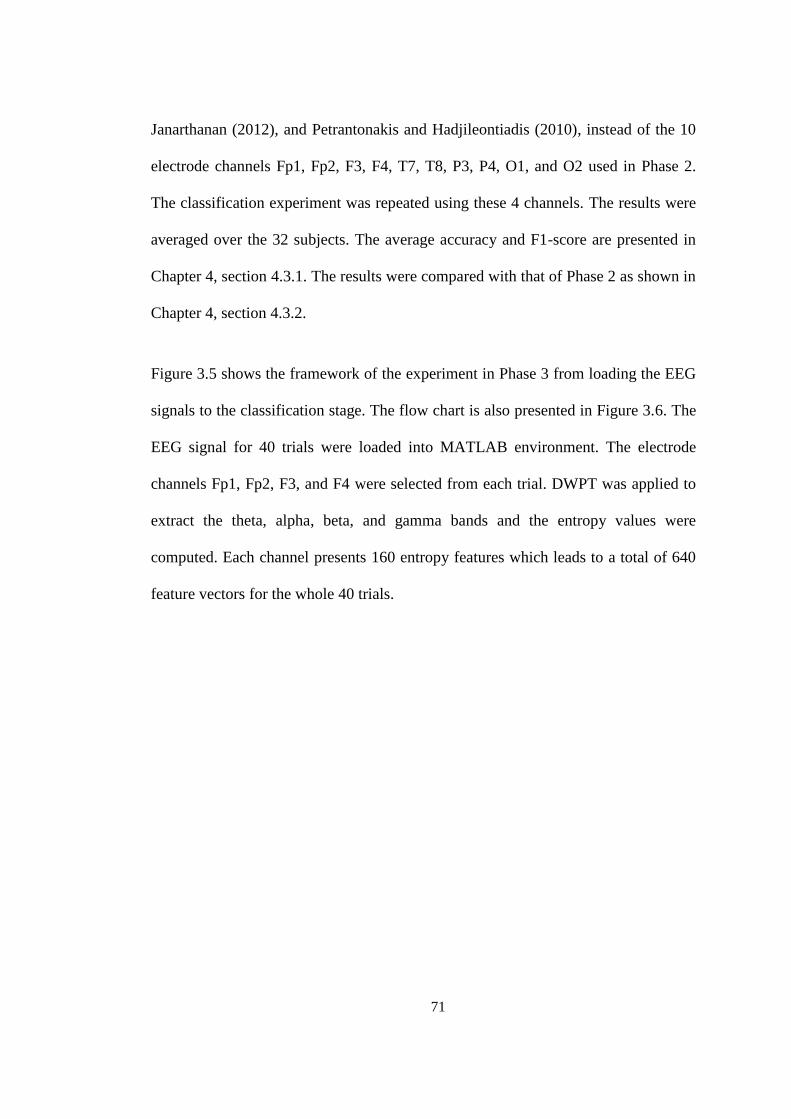
71
Janarthanan (2012), and Petrantonakis and Hadjileontiadis (2010), instead of the 10
electrode channels Fp1, Fp2, F3, F4, T7, T8, P3, P4, O1, and O2 used in Phase 2.
The classification experiment was repeated using these 4 channels. The results were
averaged over the 32 subjects. The average accuracy and F1-score are presented in
Chapter 4, section 4.3.1. The results were compared with that of Phase 2 as shown in
Chapter 4, section 4.3.2.
Figure 3.5 shows the framework of the experiment in Phase 3 from loading the EEG
signals to the classification stage. The flow chart is also presented in Figure 3.6. The
EEG signal for 40 trials were loaded into MATLAB environment. The electrode
channels Fp1, Fp2, F3, and F4 were selected from each trial. DWPT was applied to
extract the theta, alpha, beta, and gamma bands and the entropy values were
computed. Each channel presents 160 entropy features which leads to a total of 640
feature vectors for the whole 40 trials.
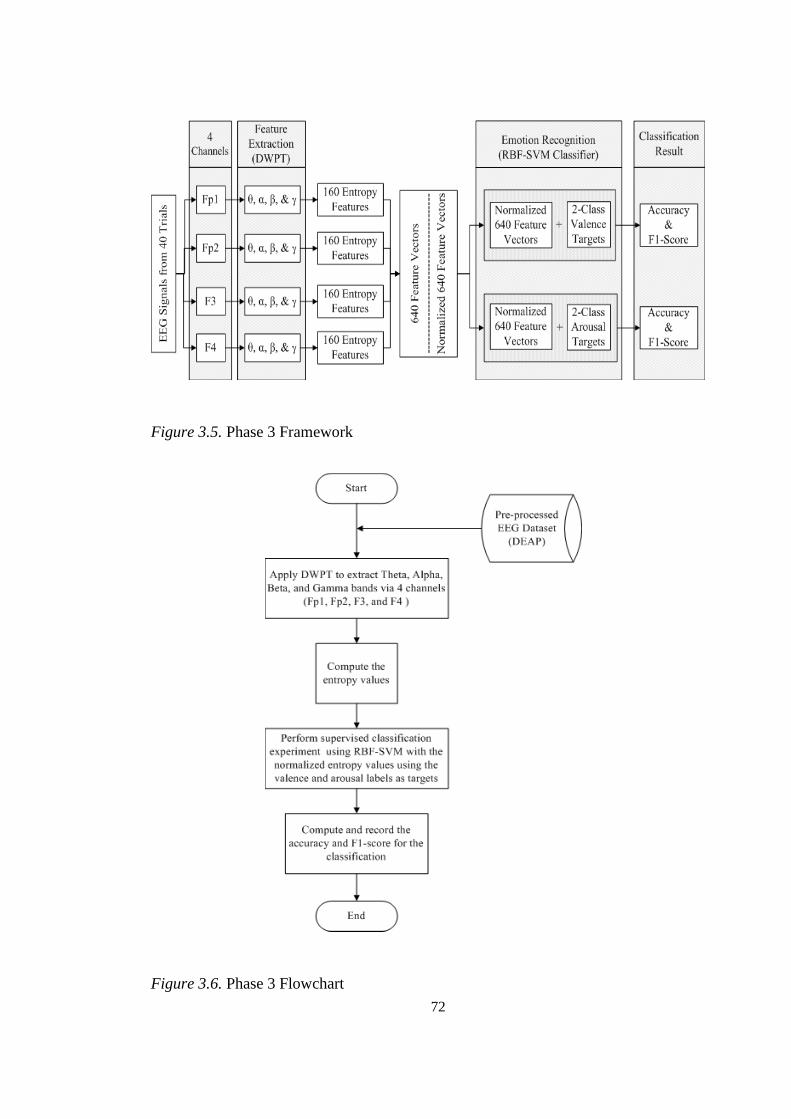
72
Figure 3.5. Phase 3 Framework
Figure 3.6. Phase 3 Flowchart
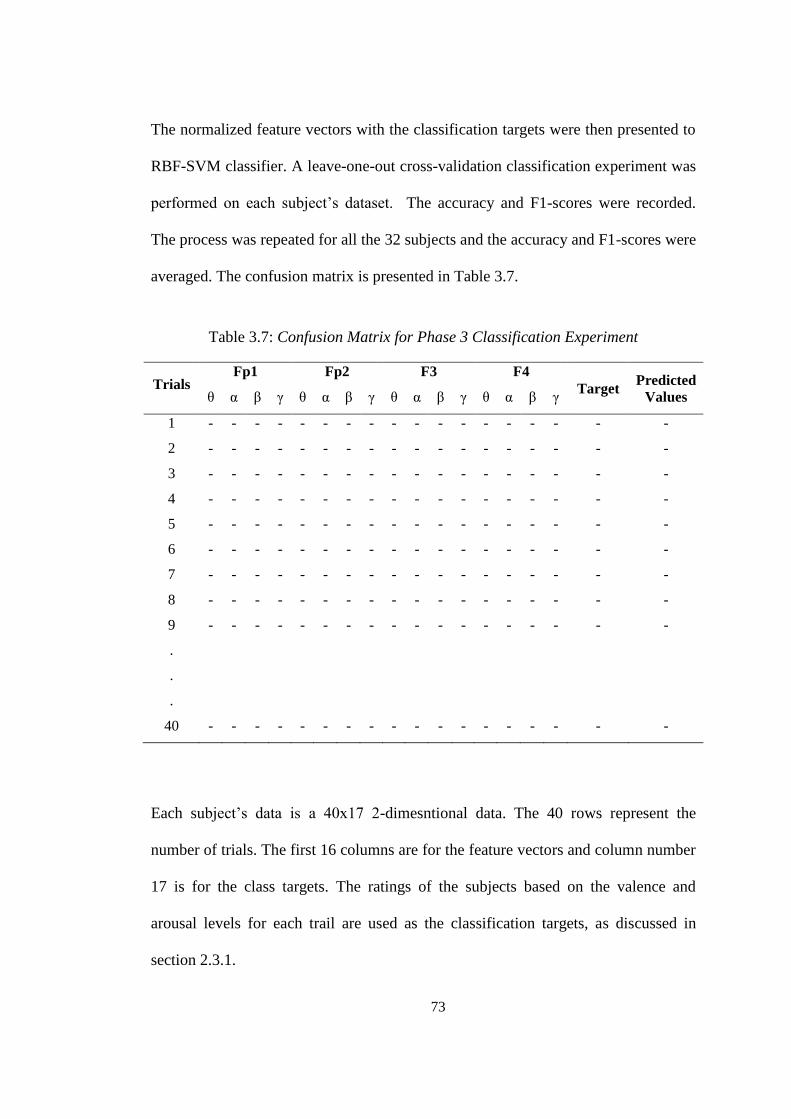
73
The normalized feature vectors with the classification targets were then presented to
RBF-SVM classifier. A leave-one-out cross-validation classification experiment was
performed on each subject’s dataset. The accuracy and F1-scores were recorded.
The process was repeated for all the 32 subjects and the accuracy and F1-scores were
averaged. The confusion matrix is presented in Table 3.7.
Table 3.7: Confusion Matrix for Phase 3 Classification Experiment
Trials Fp1 Fp2 F3 F4
Target Predicted
Values θ α β γ θ α β γ θ α β γ θ α β γ
1 - - - - - - - - - - - - - - - - - -
2 - - - - - - - - - - - - - - - - - -
3 - - - - - - - - - - - - - - - - - -
4 - - - - - - - - - - - - - - - - - -
5 - - - - - - - - - - - - - - - - - -
6 - - - - - - - - - - - - - - - - - -
7 - - - - - - - - - - - - - - - - - -
8 - - - - - - - - - - - - - - - - - -
9 - - - - - - - - - - - - - - - - - -
.
.
.
40 - - - - - - - - - - - - - - - - - -
Each subject’s data is a 40x17 2-dimesntional data. The 40 rows represent the
number of trials. The first 16 columns are for the feature vectors and column number
17 is for the class targets. The ratings of the subjects based on the valence and
arousal levels for each trail are used as the classification targets, as discussed in
section 2.3.1.
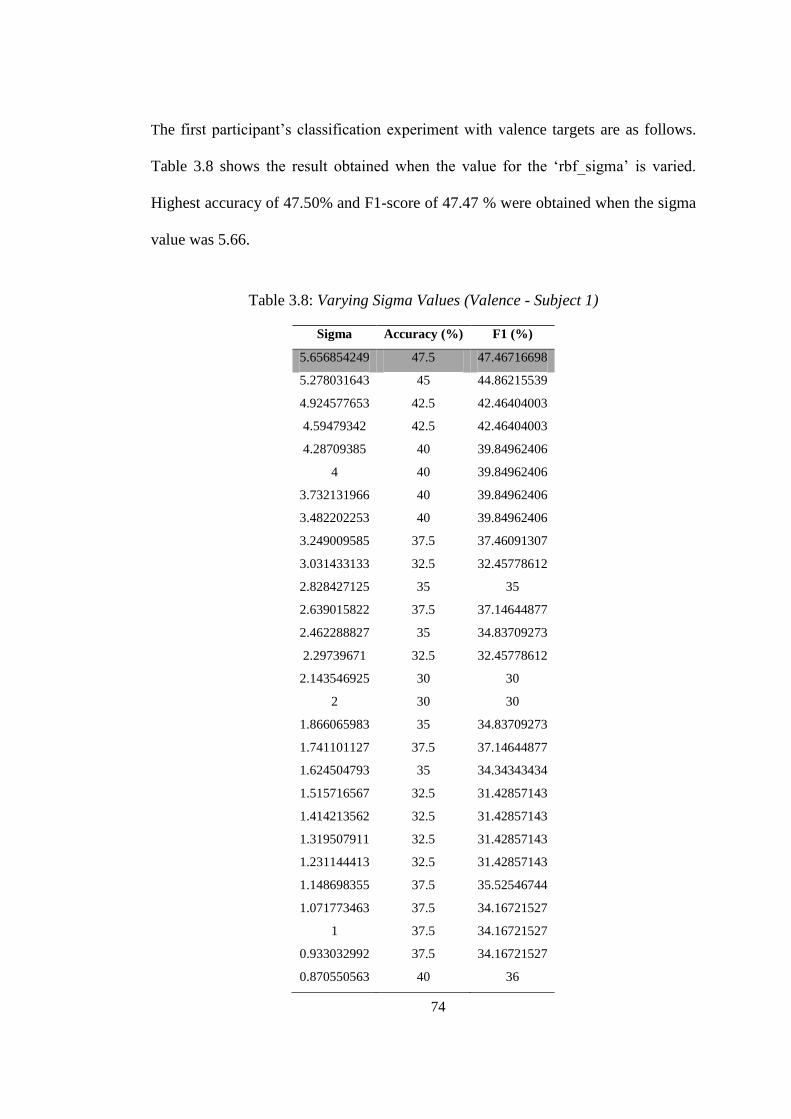
74
The first participant’s classification experiment with valence targets are as follows.
Table 3.8 shows the result obtained when the value for the ‘rbf_sigma’ is varied.
Highest accuracy of 47.50% and F1-score of 47.47 % were obtained when the sigma
value was 5.66.
Table 3.8: Varying Sigma Values (Valence - Subject 1)
Sigma Accuracy (%) F1 (%)
5.656854249 47.5 47.46716698
5.278031643 45 44.86215539
4.924577653 42.5 42.46404003
4.59479342 42.5 42.46404003
4.28709385 40 39.84962406
4 40 39.84962406
3.732131966 40 39.84962406
3.482202253 40 39.84962406
3.249009585 37.5 37.46091307
3.031433133 32.5 32.45778612
2.828427125 35 35
2.639015822 37.5 37.14644877
2.462288827 35 34.83709273
2.29739671 32.5 32.45778612
2.143546925 30 30
2 30 30
1.866065983 35 34.83709273
1.741101127 37.5 37.14644877
1.624504793 35 34.34343434
1.515716567 32.5 31.42857143
1.414213562 32.5 31.42857143
1.319507911 32.5 31.42857143
1.231144413 32.5 31.42857143
1.148698355 37.5 35.52546744
1.071773463 37.5 34.16721527
1 37.5 34.16721527
0.933032992 37.5 34.16721527
0.870550563 40 36
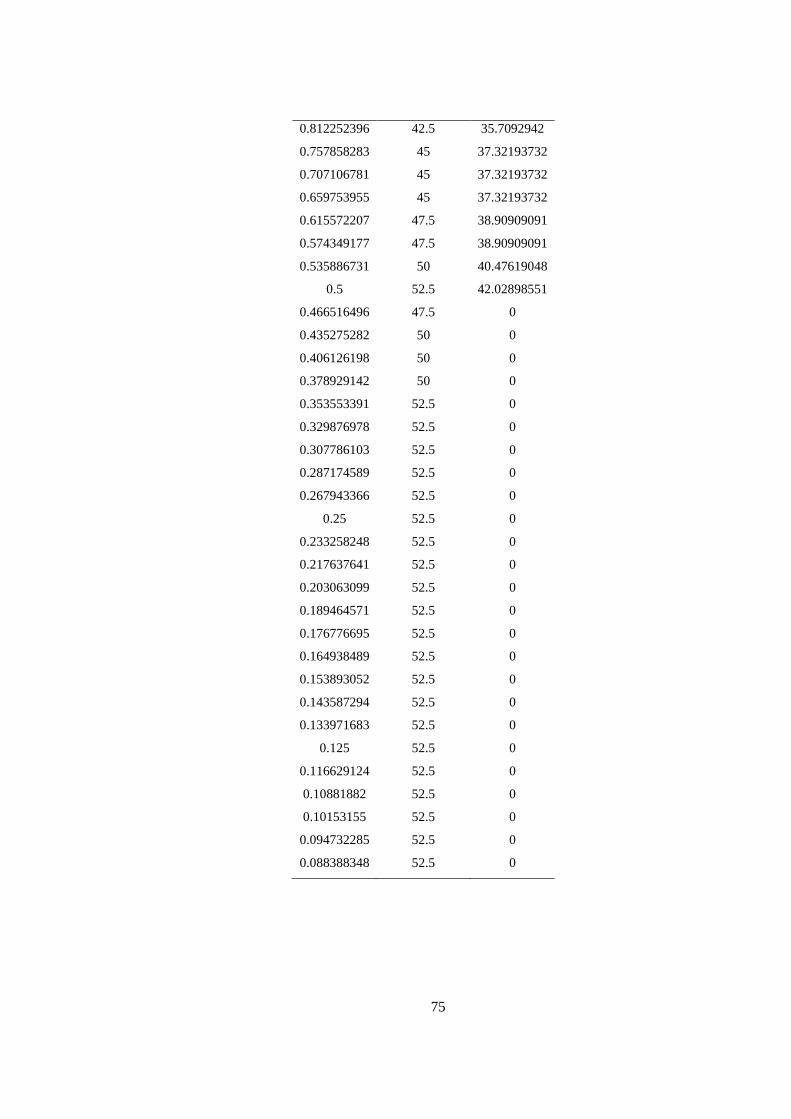
75
0.812252396 42.5 35.7092942
0.757858283 45 37.32193732
0.707106781 45 37.32193732
0.659753955 45 37.32193732
0.615572207 47.5 38.90909091
0.574349177 47.5 38.90909091
0.535886731 50 40.47619048
0.5 52.5 42.02898551
0.466516496 47.5 0
0.435275282 50 0
0.406126198 50 0
0.378929142 50 0
0.353553391 52.5 0
0.329876978 52.5 0
0.307786103 52.5 0
0.287174589 52.5 0
0.267943366 52.5 0
0.25 52.5 0
0.233258248 52.5 0
0.217637641 52.5 0
0.203063099 52.5 0
0.189464571 52.5 0
0.176776695 52.5 0
0.164938489 52.5 0
0.153893052 52.5 0
0.143587294 52.5 0
0.133971683 52.5 0
0.125 52.5 0
0.116629124 52.5 0
0.10881882 52.5 0
0.10153155 52.5 0
0.094732285 52.5 0
0.088388348 52.5 0

76
While the sigma value was fixed to 5.66, the C parameter value was varied. Table
3.9 shows the result. Highest accuracy of 52.50% and F1-score of 52.47% were
obtained when the C values were from 48.50 to 64.
Table 3.9: Varying the C parameter Values (Valence – Subject 1)
C Accuracy (%) F1 (%)
0.015625 50 48.84910486
0.017948412 50 48.84910486
0.020617311 50 48.84910486
0.023683071 50 48.84910486
0.027204705 50 48.84910486
0.03125 50 48.84910486
0.035896824 50 48.84910486
0.041234622 50 48.84910486
0.047366143 50 48.84910486
0.05440941 50 48.84910486
0.0625 50 48.84910486
0.071793647 50 48.84910486
0.082469244 50 48.84910486
0.094732285 50 48.84910486
0.10881882 50 48.84910486
0.125 50 48.84910486
0.143587294 50 48.84910486
0.164938489 47.5 46.66666667
0.189464571 47.5 46.66666667
0.217637641 47.5 47.20301697
0.25 47.5 47.20301697
0.287174589 47.5 47.20301697
0.329876978 47.5 47.46716698
0.378929142 47.5 47.46716698
0.435275282 47.5 47.46716698
0.5 47.5 47.46716698
0.574349177 47.5 47.46716698
0.659753955 47.5 47.46716698
0.757858283 47.5 47.46716698
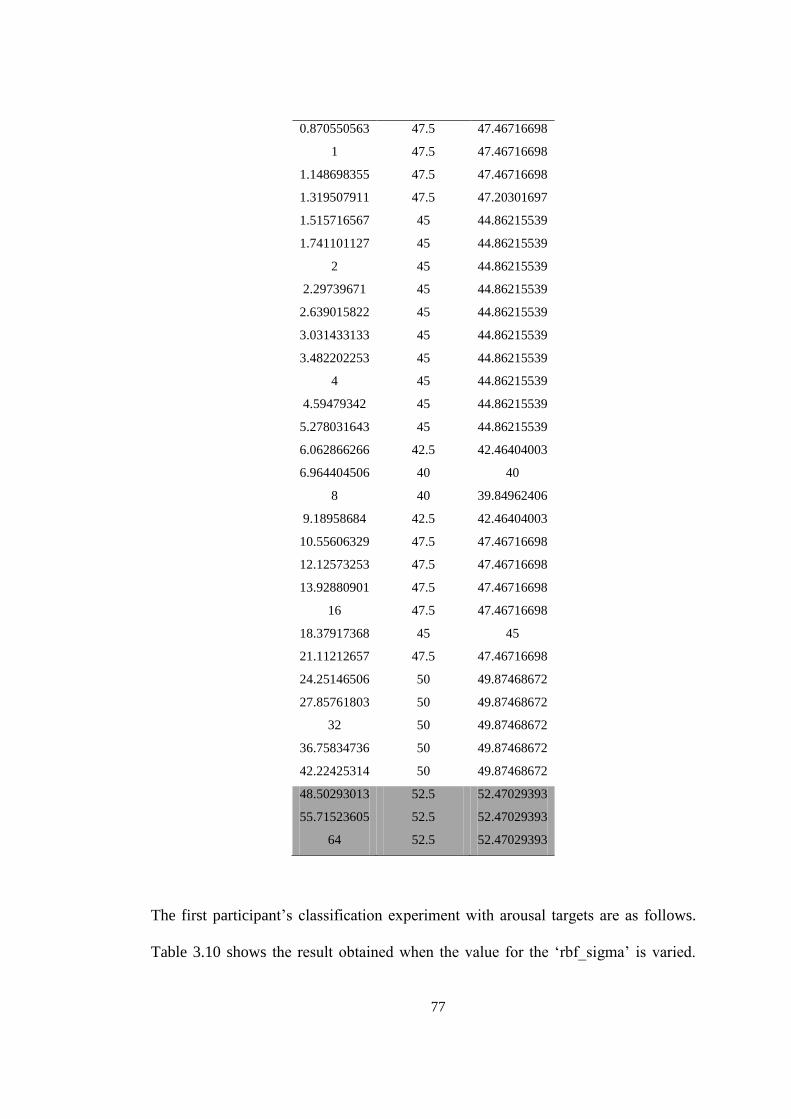
77
0.870550563 47.5 47.46716698
1 47.5 47.46716698
1.148698355 47.5 47.46716698
1.319507911 47.5 47.20301697
1.515716567 45 44.86215539
1.741101127 45 44.86215539
2 45 44.86215539
2.29739671 45 44.86215539
2.639015822 45 44.86215539
3.031433133 45 44.86215539
3.482202253 45 44.86215539
4 45 44.86215539
4.59479342 45 44.86215539
5.278031643 45 44.86215539
6.062866266 42.5 42.46404003
6.964404506 40 40
8 40 39.84962406
9.18958684 42.5 42.46404003
10.55606329 47.5 47.46716698
12.12573253 47.5 47.46716698
13.92880901 47.5 47.46716698
16 47.5 47.46716698
18.37917368 45 45
21.11212657 47.5 47.46716698
24.25146506 50 49.87468672
27.85761803 50 49.87468672
32 50 49.87468672
36.75834736 50 49.87468672
42.22425314 50 49.87468672
48.50293013 52.5 52.47029393
55.71523605 52.5 52.47029393
64 52.5 52.47029393
The first participant’s classification experiment with arousal targets are as follows.
Table 3.10 shows the result obtained when the value for the ‘rbf_sigma’ is varied.
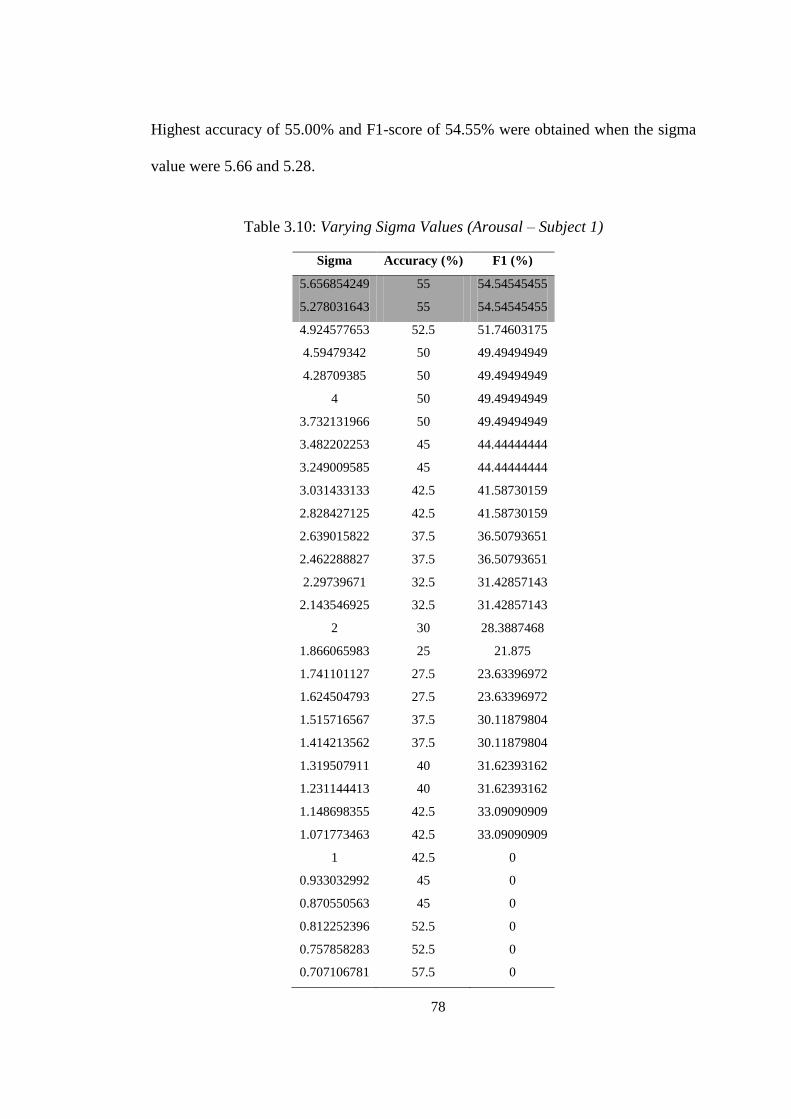
78
Highest accuracy of 55.00% and F1-score of 54.55% were obtained when the sigma
value were 5.66 and 5.28.
Table 3.10: Varying Sigma Values (Arousal – Subject 1)
Sigma Accuracy (%) F1 (%)
5.656854249 55 54.54545455
5.278031643 55 54.54545455
4.924577653 52.5 51.74603175
4.59479342 50 49.49494949
4.28709385 50 49.49494949
4 50 49.49494949
3.732131966 50 49.49494949
3.482202253 45 44.44444444
3.249009585 45 44.44444444
3.031433133 42.5 41.58730159
2.828427125 42.5 41.58730159
2.639015822 37.5 36.50793651
2.462288827 37.5 36.50793651
2.29739671 32.5 31.42857143
2.143546925 32.5 31.42857143
2 30 28.3887468
1.866065983 25 21.875
1.741101127 27.5 23.63396972
1.624504793 27.5 23.63396972
1.515716567 37.5 30.11879804
1.414213562 37.5 30.11879804
1.319507911 40 31.62393162
1.231144413 40 31.62393162
1.148698355 42.5 33.09090909
1.071773463 42.5 33.09090909
1 42.5 0
0.933032992 45 0
0.870550563 45 0
0.812252396 52.5 0
0.757858283 52.5 0
0.707106781 57.5 0
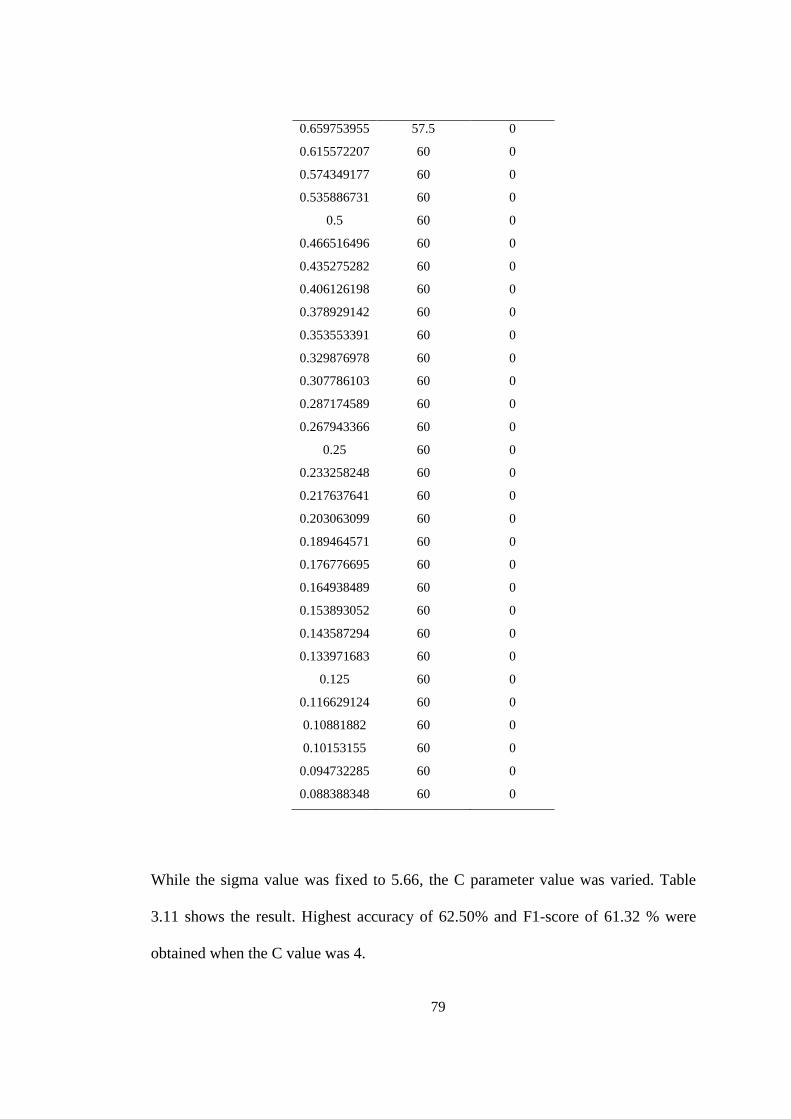
79
0.659753955 57.5 0
0.615572207 60 0
0.574349177 60 0
0.535886731 60 0
0.5 60 0
0.466516496 60 0
0.435275282 60 0
0.406126198 60 0
0.378929142 60 0
0.353553391 60 0
0.329876978 60 0
0.307786103 60 0
0.287174589 60 0
0.267943366 60 0
0.25 60 0
0.233258248 60 0
0.217637641 60 0
0.203063099 60 0
0.189464571 60 0
0.176776695 60 0
0.164938489 60 0
0.153893052 60 0
0.143587294 60 0
0.133971683 60 0
0.125 60 0
0.116629124 60 0
0.10881882 60 0
0.10153155 60 0
0.094732285 60 0
0.088388348 60 0
While the sigma value was fixed to 5.66, the C parameter value was varied. Table
3.11 shows the result. Highest accuracy of 62.50% and F1-score of 61.32 % were
obtained when the C value was 4.

80
Table 3.11: Varying the C parameter Values (Arousal– Subject 1)
C Accuracy (%) F1 (%)
0.015625 55 54.88721805
0.017948412 55 54.88721805
0.020617311 55 54.88721805
0.023683071 55 54.88721805
0.027204705 55 54.88721805
0.03125 55 54.88721805
0.035896824 55 54.88721805
0.041234622 55 54.88721805
0.047366143 55 54.88721805
0.05440941 55 54.88721805
0.0625 55 54.88721805
0.071793647 55 54.88721805
0.082469244 55 54.88721805
0.094732285 55 54.88721805
0.10881882 55 54.88721805
0.125 55 54.88721805
0.143587294 55 54.88721805
0.164938489 55 54.88721805
0.189464571 55 54.88721805
0.217637641 55 54.88721805
0.25 55 54.88721805
0.287174589 55 54.88721805
0.329876978 55 54.88721805
0.378929142 55 54.88721805
0.435275282 55 54.88721805
0.5 55 54.88721805
0.574349177 57.5 57.25958517
0.659753955 57.5 57.25958517
0.757858283 57.5 57.25958517
0.870550563 57.5 57.25958517
1 55 54.54545455
1.148698355 55 54.54545455
1.319507911 55 54.54545455
1.515716567 55 54.54545455
1.741101127 55 54.54545455
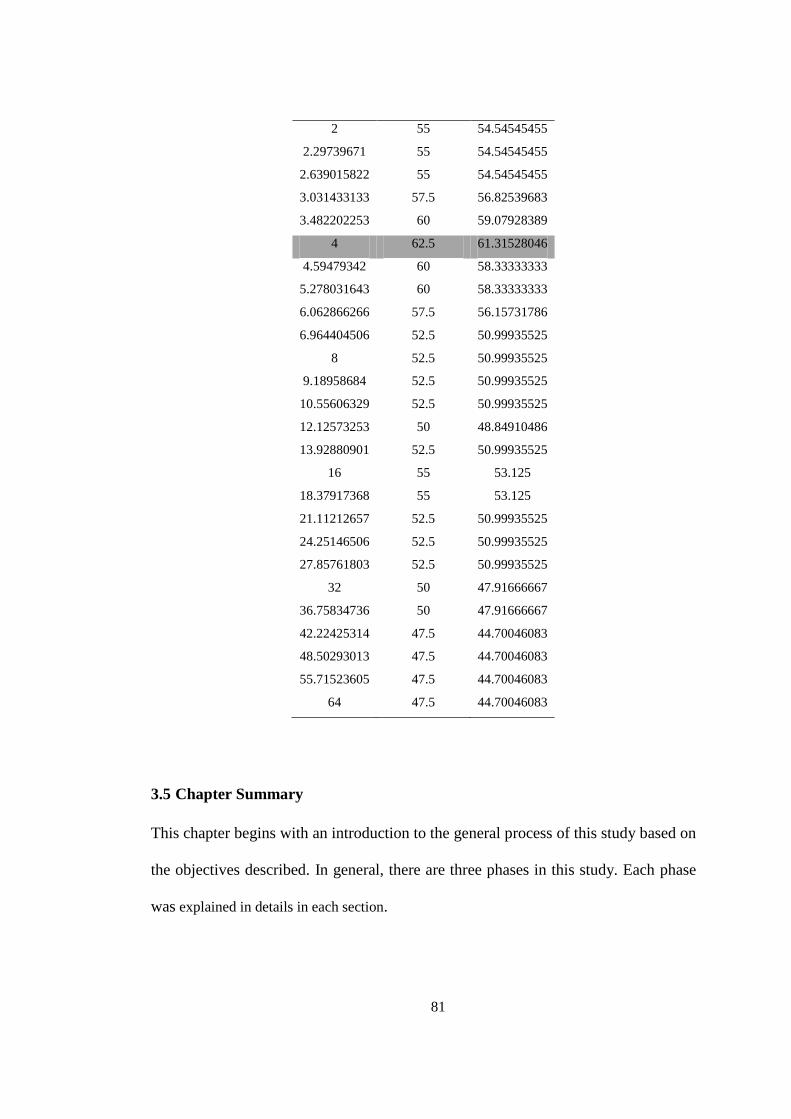
81
2 55 54.54545455
2.29739671 55 54.54545455
2.639015822 55 54.54545455
3.031433133 57.5 56.82539683
3.482202253 60 59.07928389
4 62.5 61.31528046
4.59479342 60 58.33333333
5.278031643 60 58.33333333
6.062866266 57.5 56.15731786
6.964404506 52.5 50.99935525
8 52.5 50.99935525
9.18958684 52.5 50.99935525
10.55606329 52.5 50.99935525
12.12573253 50 48.84910486
13.92880901 52.5 50.99935525
16 55 53.125
18.37917368 55 53.125
21.11212657 52.5 50.99935525
24.25146506 52.5 50.99935525
27.85761803 52.5 50.99935525
32 50 47.91666667
36.75834736 50 47.91666667
42.22425314 47.5 44.70046083
48.50293013 47.5 44.70046083
55.71523605 47.5 44.70046083
64 47.5 44.70046083
3.5 Chapter Summary
This chapter begins with an introduction to the general process of this study based on
the objectives described. In general, there are three phases in this study. Each phase
was explained in details in each section.
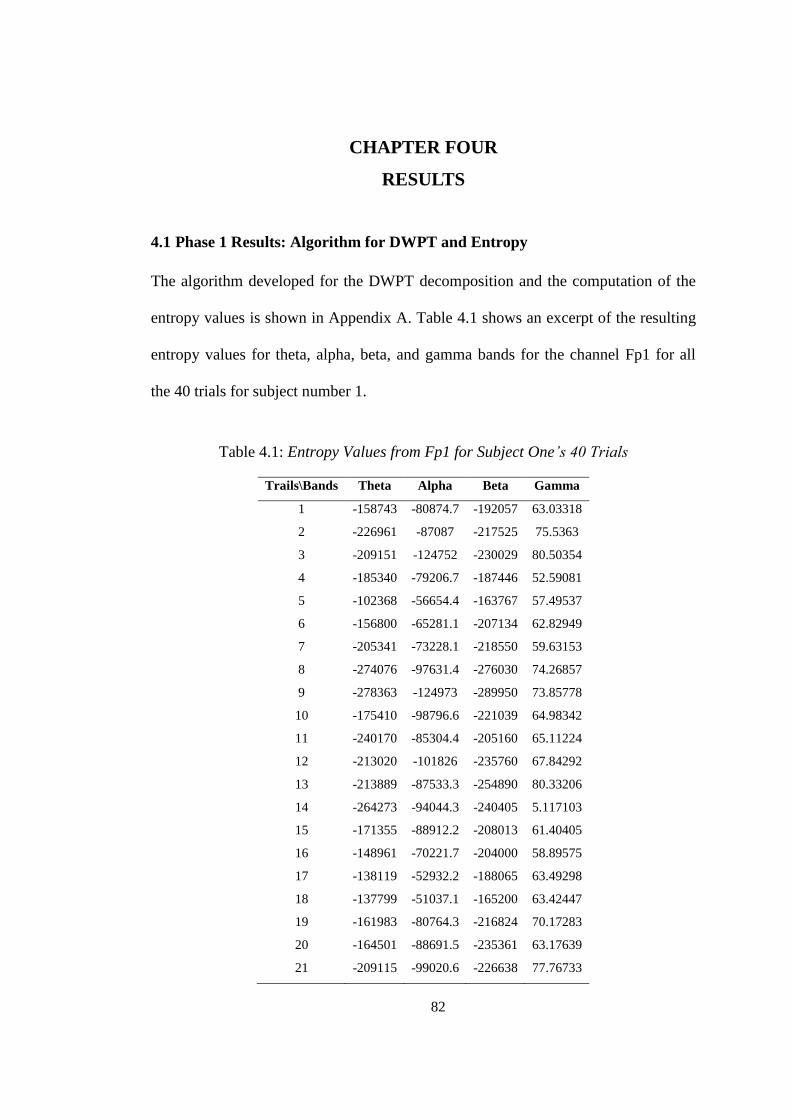
82
CHAPTER FOUR
RESULTS
4.1 Phase 1 Results: Algorithm for DWPT and Entropy
The algorithm developed for the DWPT decomposition and the computation of the
entropy values is shown in Appendix A. Table 4.1 shows an excerpt of the resulting
entropy values for theta, alpha, beta, and gamma bands for the channel Fp1 for all
the 40 trials for subject number 1.
Table 4.1: Entropy Values from Fp1 for Subject One’s 40 Trials
Trails\Bands Theta Alpha Beta Gamma
1 -158743 -80874.7 -192057 63.03318
2 -226961 -87087 -217525 75.5363
3 -209151 -124752 -230029 80.50354
4 -185340 -79206.7 -187446 52.59081
5 -102368 -56654.4 -163767 57.49537
6 -156800 -65281.1 -207134 62.82949
7 -205341 -73228.1 -218550 59.63153
8 -274076 -97631.4 -276030 74.26857
9 -278363 -124973 -289950 73.85778
10 -175410 -98796.6 -221039 64.98342
11 -240170 -85304.4 -205160 65.11224
12 -213020 -101826 -235760 67.84292
13 -213889 -87533.3 -254890 80.33206
14 -264273 -94044.3 -240405 5.117103
15 -171355 -88912.2 -208013 61.40405
16 -148961 -70221.7 -204000 58.89575
17 -138119 -52932.2 -188065 63.49298
18 -137799 -51037.1 -165200 63.42447
19 -161983 -80764.3 -216824 70.17283
20 -164501 -88691.5 -235361 63.17639
21 -209115 -99020.6 -226638 77.76733
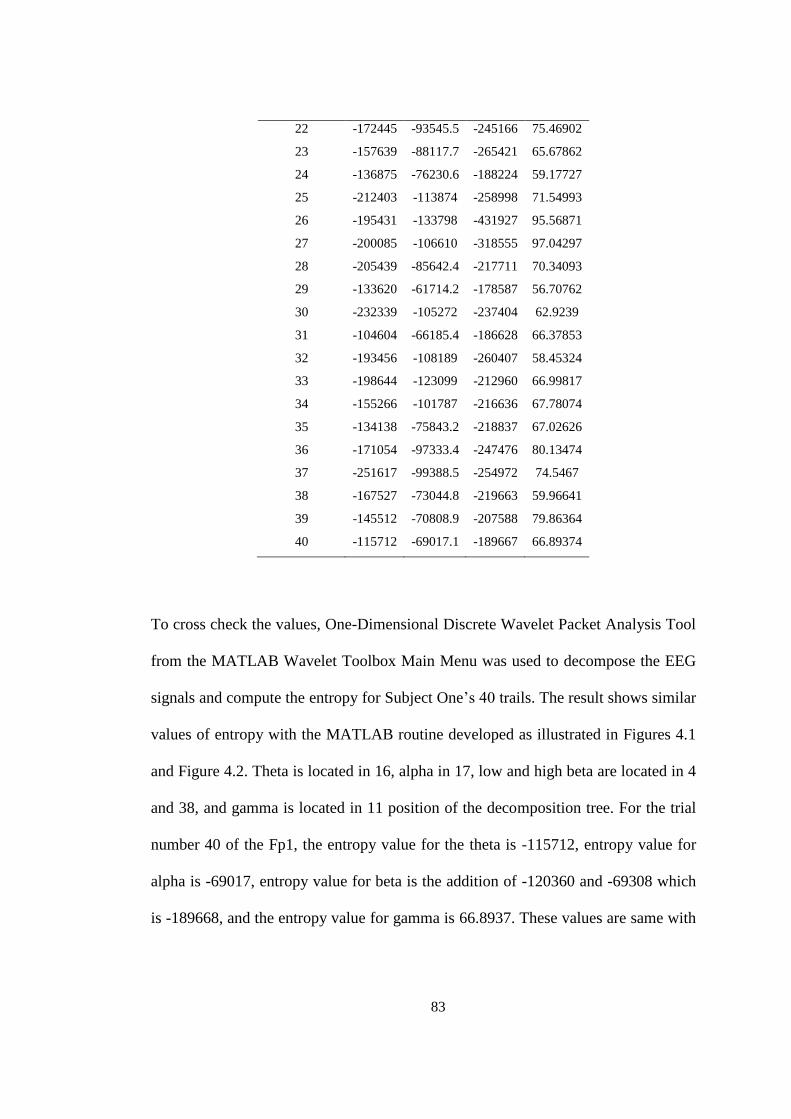
83
22 -172445 -93545.5 -245166 75.46902
23 -157639 -88117.7 -265421 65.67862
24 -136875 -76230.6 -188224 59.17727
25 -212403 -113874 -258998 71.54993
26 -195431 -133798 -431927 95.56871
27 -200085 -106610 -318555 97.04297
28 -205439 -85642.4 -217711 70.34093
29 -133620 -61714.2 -178587 56.70762
30 -232339 -105272 -237404 62.9239
31 -104604 -66185.4 -186628 66.37853
32 -193456 -108189 -260407 58.45324
33 -198644 -123099 -212960 66.99817
34 -155266 -101787 -216636 67.78074
35 -134138 -75843.2 -218837 67.02626
36 -171054 -97333.4 -247476 80.13474
37 -251617 -99388.5 -254972 74.5467
38 -167527 -73044.8 -219663 59.96641
39 -145512 -70808.9 -207588 79.86364
40 -115712 -69017.1 -189667 66.89374
To cross check the values, One-Dimensional Discrete Wavelet Packet Analysis Tool
from the MATLAB Wavelet Toolbox Main Menu was used to decompose the EEG
signals and compute the entropy for Subject One’s 40 trails. The result shows similar
values of entropy with the MATLAB routine developed as illustrated in Figures 4.1
and Figure 4.2. Theta is located in 16, alpha in 17, low and high beta are located in 4
and 38, and gamma is located in 11 position of the decomposition tree. For the trial
number 40 of the Fp1, the entropy value for the theta is -115712, entropy value for
alpha is -69017, entropy value for beta is the addition of -120360 and -69308 which
is -189668, and the entropy value for gamma is 66.8937. These values are same with
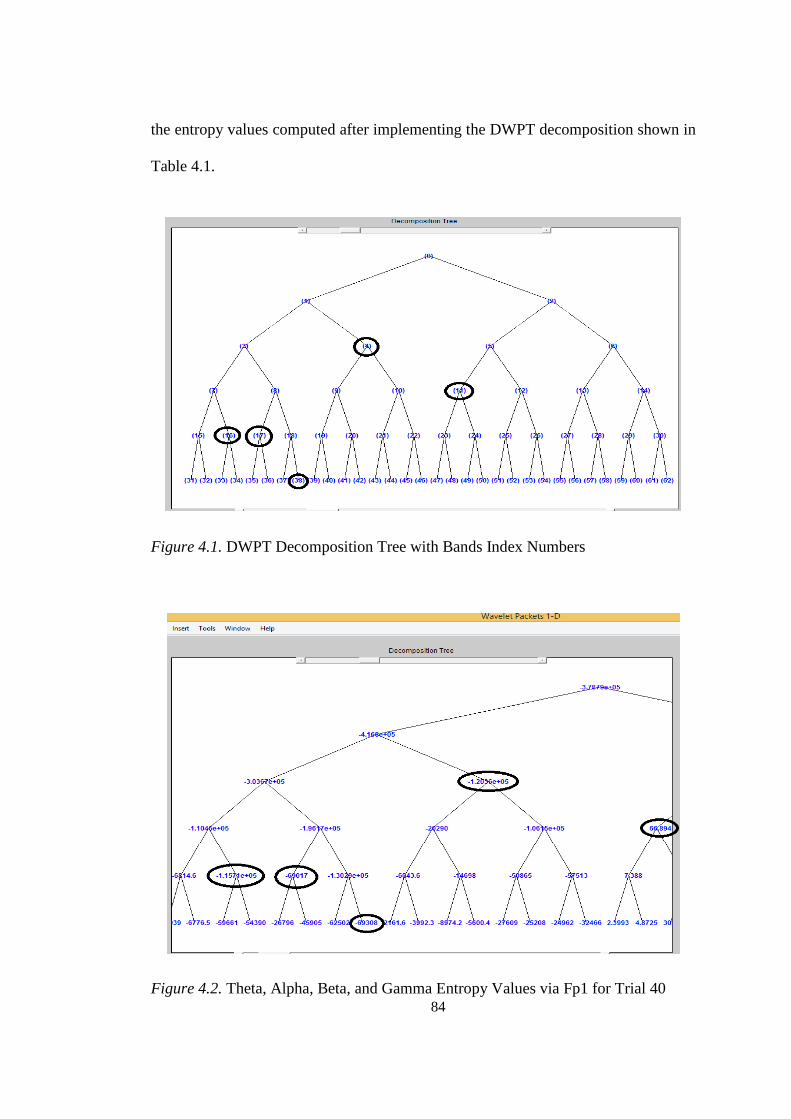
84
the entropy values computed after implementing the DWPT decomposition shown in
Table 4.1.
Figure 4.1. DWPT Decomposition Tree with Bands Index Numbers
Figure 4.2. Theta, Alpha, Beta, and Gamma Entropy Values via Fp1 for Trial 40
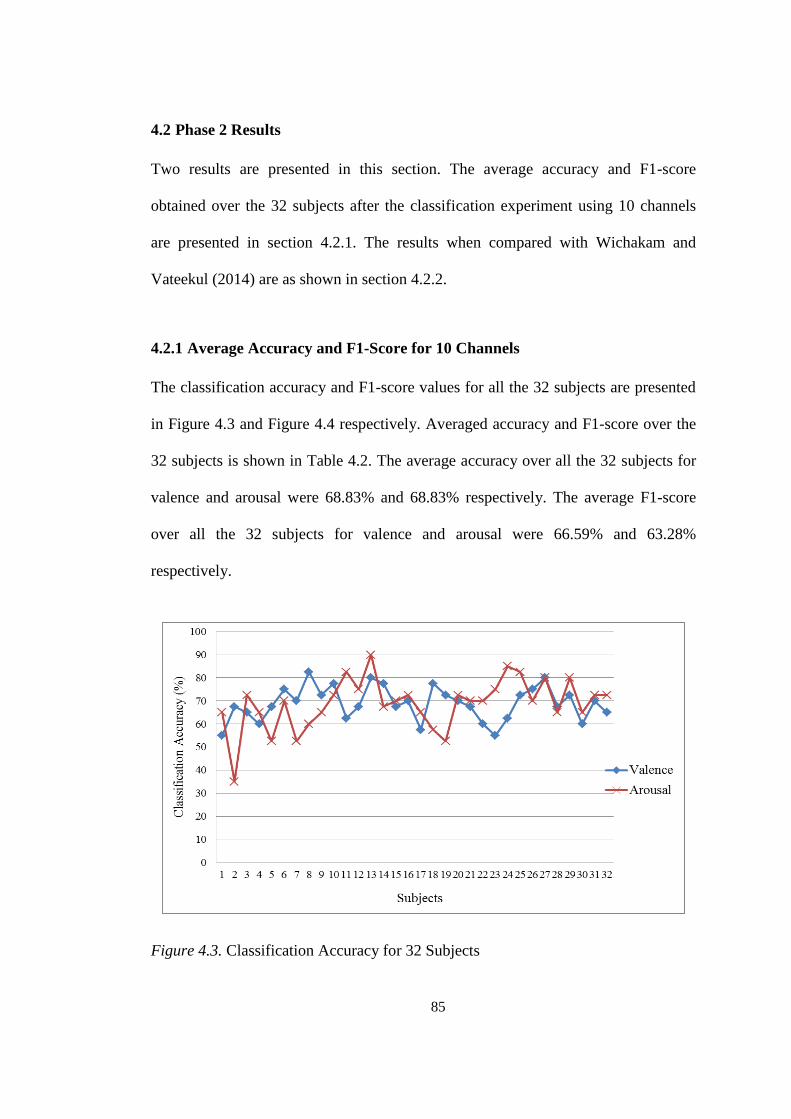
85
4.2 Phase 2 Results
Two results are presented in this section. The average accuracy and F1-score
obtained over the 32 subjects after the classification experiment using 10 channels
are presented in section 4.2.1. The results when compared with Wichakam and
Vateekul (2014) are as shown in section 4.2.2.
4.2.1 Average Accuracy and F1-Score for 10 Channels
The classification accuracy and F1-score values for all the 32 subjects are presented
in Figure 4.3 and Figure 4.4 respectively. Averaged accuracy and F1-score over the
32 subjects is shown in Table 4.2. The average accuracy over all the 32 subjects for
valence and arousal were 68.83% and 68.83% respectively. The average F1-score
over all the 32 subjects for valence and arousal were 66.59% and 63.28%
respectively.
Figure 4.3. Classification Accuracy for 32 Subjects
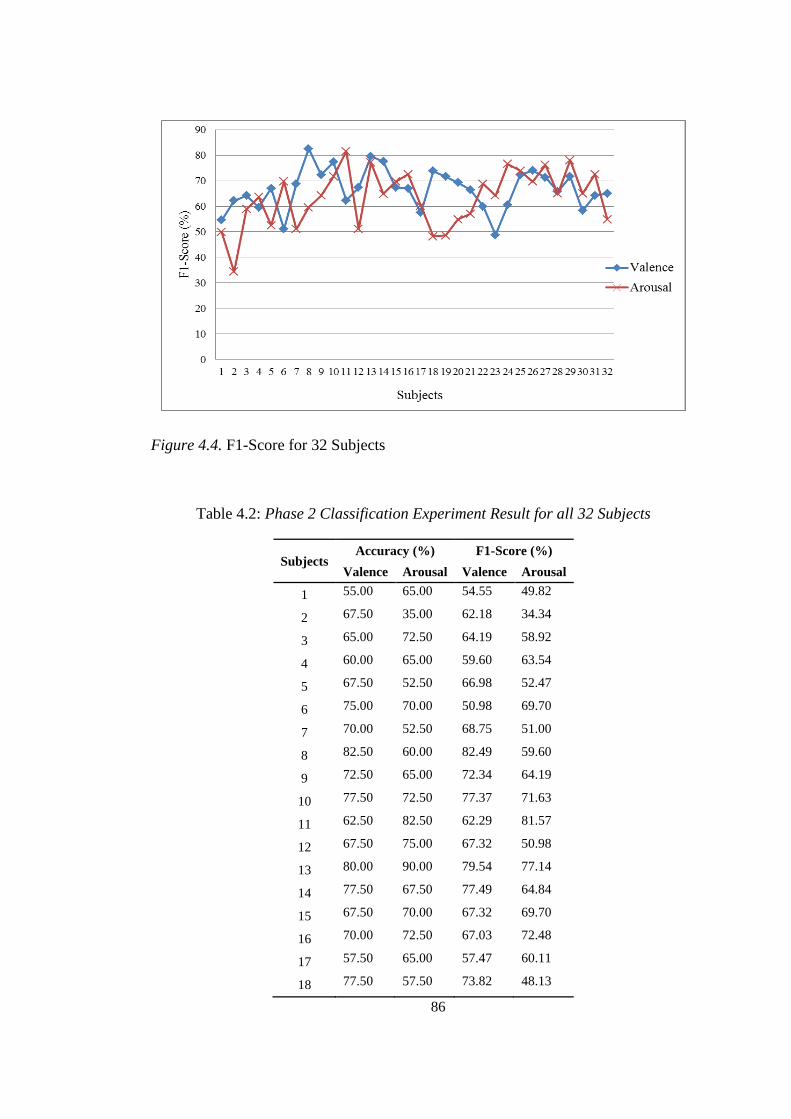
86
Figure 4.4. F1-Score for 32 Subjects
Table 4.2: Phase 2 Classification Experiment Result for all 32 Subjects
Subjects Accuracy (%) F1-Score (%)
Valence Arousal Valence Arousal
1 55.00 65.00 54.55 49.82
2 67.50 35.00 62.18 34.34
3 65.00 72.50 64.19 58.92
4 60.00 65.00 59.60 63.54
5 67.50 52.50 66.98 52.47
6 75.00 70.00 50.98 69.70
7 70.00 52.50 68.75 51.00
8 82.50 60.00 82.49 59.60
9 72.50 65.00 72.34 64.19
10 77.50 72.50 77.37 71.63
11 62.50 82.50 62.29 81.57
12 67.50 75.00 67.32 50.98
13 80.00 90.00 79.54 77.14
14 77.50 67.50 77.49 64.84
15 67.50 70.00 67.32 69.70
16 70.00 72.50 67.03 72.48
17 57.50 65.00 57.47 60.11
18 77.50 57.50 73.82 48.13
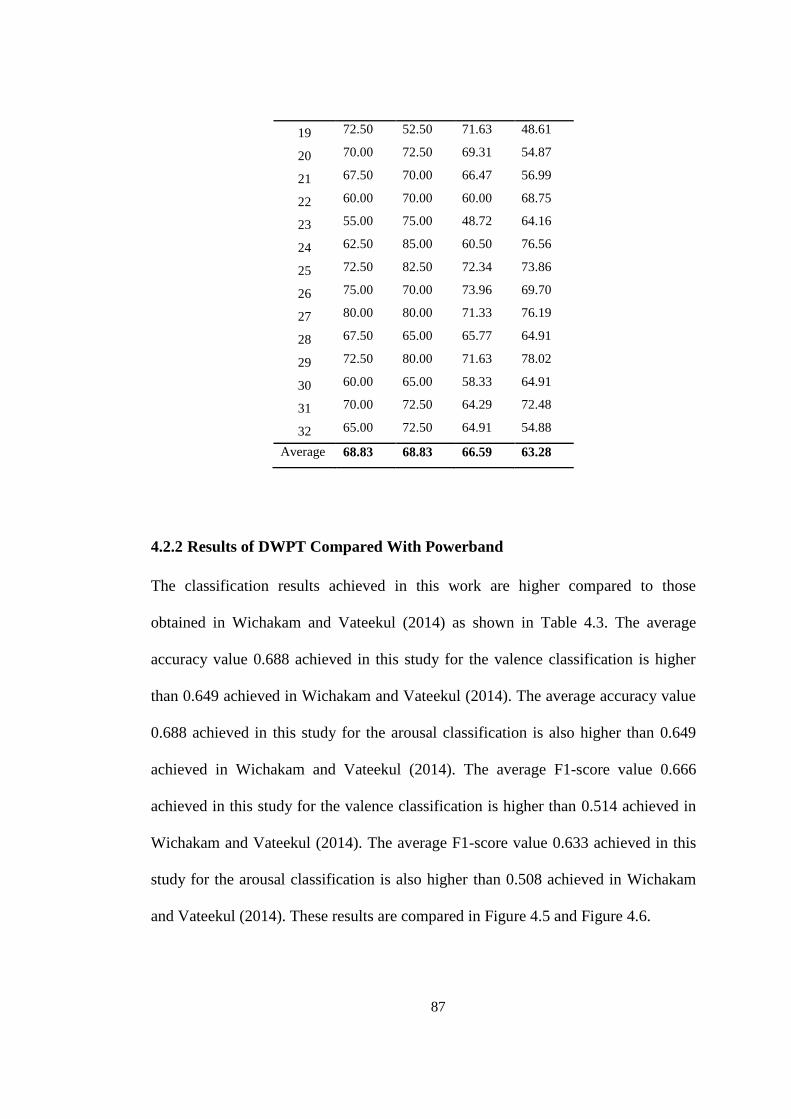
87
19 72.50 52.50 71.63 48.61
20 70.00 72.50 69.31 54.87
21 67.50 70.00 66.47 56.99
22 60.00 70.00 60.00 68.75
23 55.00 75.00 48.72 64.16
24 62.50 85.00 60.50 76.56
25 72.50 82.50 72.34 73.86
26 75.00 70.00 73.96 69.70
27 80.00 80.00 71.33 76.19
28 67.50 65.00 65.77 64.91
29 72.50 80.00 71.63 78.02
30 60.00 65.00 58.33 64.91
31 70.00 72.50 64.29 72.48
32 65.00 72.50 64.91 54.88
Average 68.83 68.83 66.59 63.28
4.2.2 Results of DWPT Compared With Powerband
The classification results achieved in this work are higher compared to those
obtained in Wichakam and Vateekul (2014) as shown in Table 4.3. The average
accuracy value 0.688 achieved in this study for the valence classification is higher
than 0.649 achieved in Wichakam and Vateekul (2014). The average accuracy value
0.688 achieved in this study for the arousal classification is also higher than 0.649
achieved in Wichakam and Vateekul (2014). The average F1-score value 0.666
achieved in this study for the valence classification is higher than 0.514 achieved in
Wichakam and Vateekul (2014). The average F1-score value 0.633 achieved in this
study for the arousal classification is also higher than 0.508 achieved in Wichakam
and Vateekul (2014). These results are compared in Figure 4.5 and Figure 4.6.
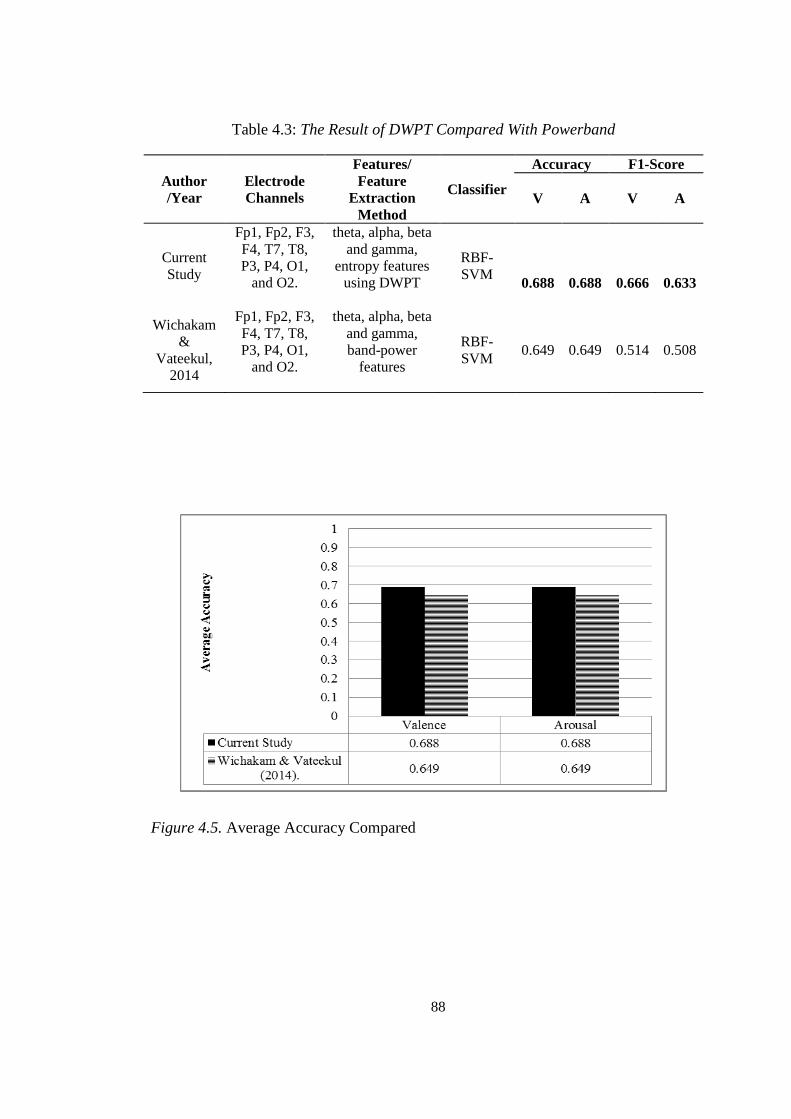
88
Table 4.3: The Result of DWPT Compared With Powerband
Author
/Year
Electrode
Channels
Features/
Feature
Extraction
Method
Classifier
Accuracy F1-Score
V A V A
Current
Study
Fp1, Fp2, F3,
F4, T7, T8,
P3, P4, O1,
and O2.
theta, alpha, beta
and gamma,
entropy features
using DWPT
RBF-
SVM
0.688
0.688
0.666
0.633
Wichakam
&
Vateekul,
2014
Fp1, Fp2, F3,
F4, T7, T8,
P3, P4, O1,
and O2.
theta, alpha, beta
and gamma,
band-power
features
RBF-
SVM 0.649 0.649 0.514 0.508
Figure 4.5. Average Accuracy Compared
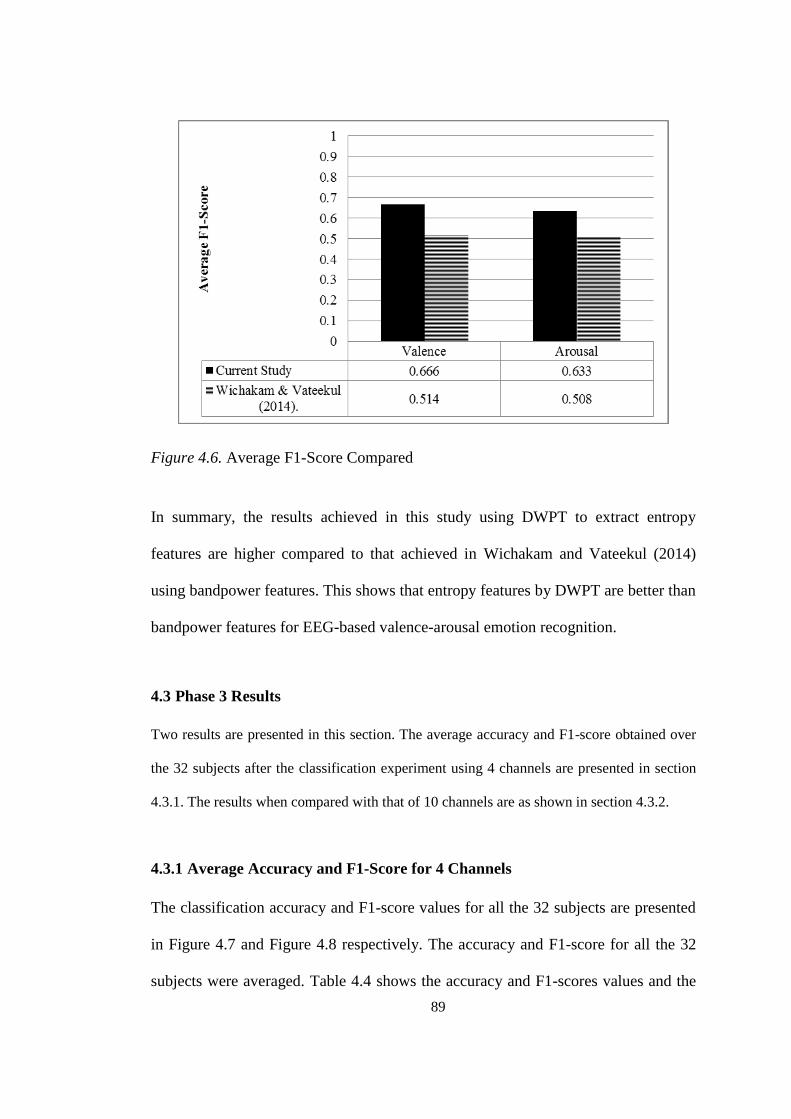
89
Figure 4.6. Average F1-Score Compared
In summary, the results achieved in this study using DWPT to extract entropy
features are higher compared to that achieved in Wichakam and Vateekul (2014)
using bandpower features. This shows that entropy features by DWPT are better than
bandpower features for EEG-based valence-arousal emotion recognition.
4.3 Phase 3 Results
Two results are presented in this section. The average accuracy and F1-score obtained over
the 32 subjects after the classification experiment using 4 channels are presented in section
4.3.1. The results when compared with that of 10 channels are as shown in section 4.3.2.
4.3.1 Average Accuracy and F1-Score for 4 Channels
The classification accuracy and F1-score values for all the 32 subjects are presented
in Figure 4.7 and Figure 4.8 respectively. The accuracy and F1-score for all the 32
subjects were averaged. Table 4.4 shows the accuracy and F1-scores values and the
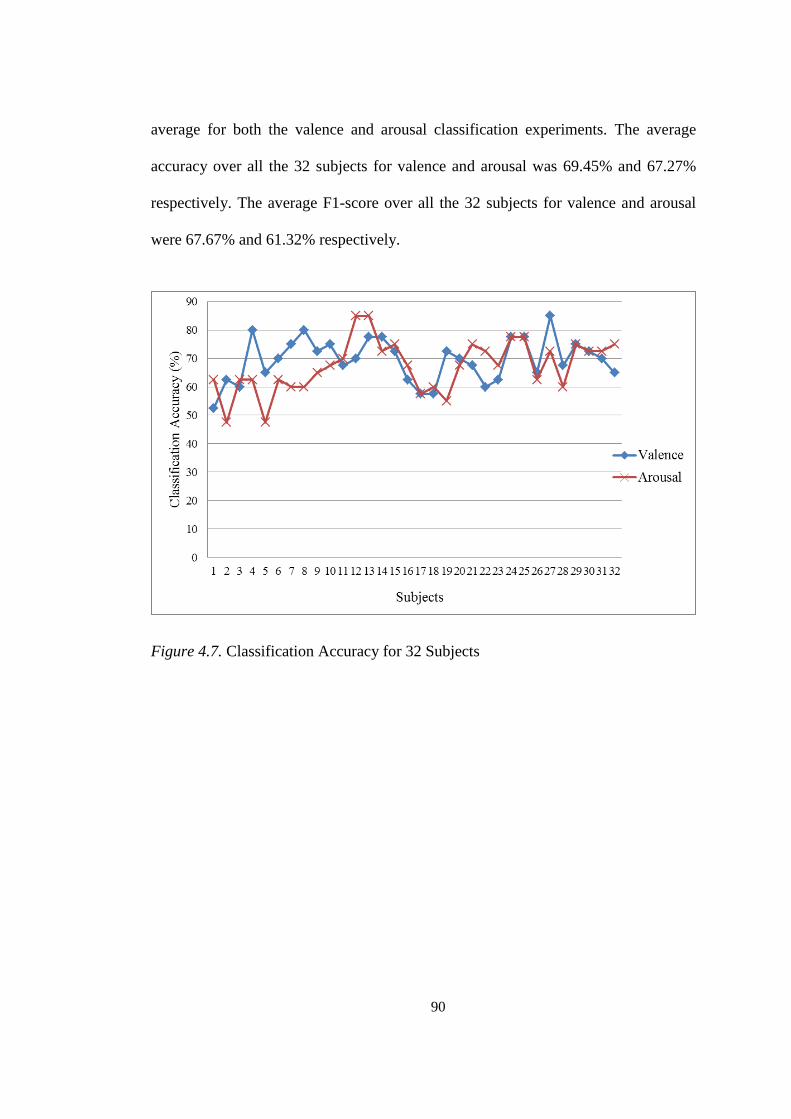
90
average for both the valence and arousal classification experiments. The average
accuracy over all the 32 subjects for valence and arousal was 69.45% and 67.27%
respectively. The average F1-score over all the 32 subjects for valence and arousal
were 67.67% and 61.32% respectively.
Figure 4.7. Classification Accuracy for 32 Subjects
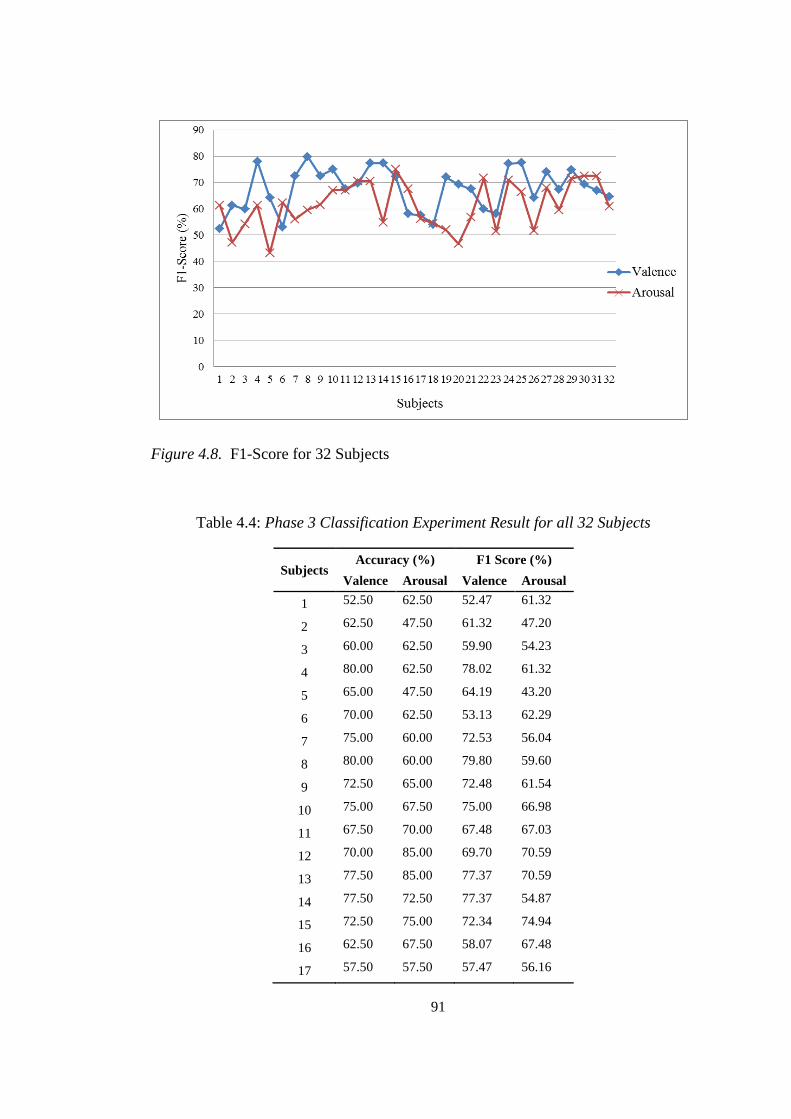
91
Figure 4.8. F1-Score for 32 Subjects
Table 4.4: Phase 3 Classification Experiment Result for all 32 Subjects
Subjects Accuracy (%) F1 Score (%)
Valence Arousal Valence Arousal
1 52.50 62.50 52.47 61.32
2 62.50 47.50 61.32 47.20
3 60.00 62.50 59.90 54.23
4 80.00 62.50 78.02 61.32
5 65.00 47.50 64.19 43.20
6 70.00 62.50 53.13 62.29
7 75.00 60.00 72.53 56.04
8 80.00 60.00 79.80 59.60
9 72.50 65.00 72.48 61.54
10 75.00 67.50 75.00 66.98
11 67.50 70.00 67.48 67.03
12 70.00 85.00 69.70 70.59
13 77.50 85.00 77.37 70.59
14 77.50 72.50 77.37 54.87
15 72.50 75.00 72.34 74.94
16 62.50 67.50 58.07 67.48
17 57.50 57.50 57.47 56.16
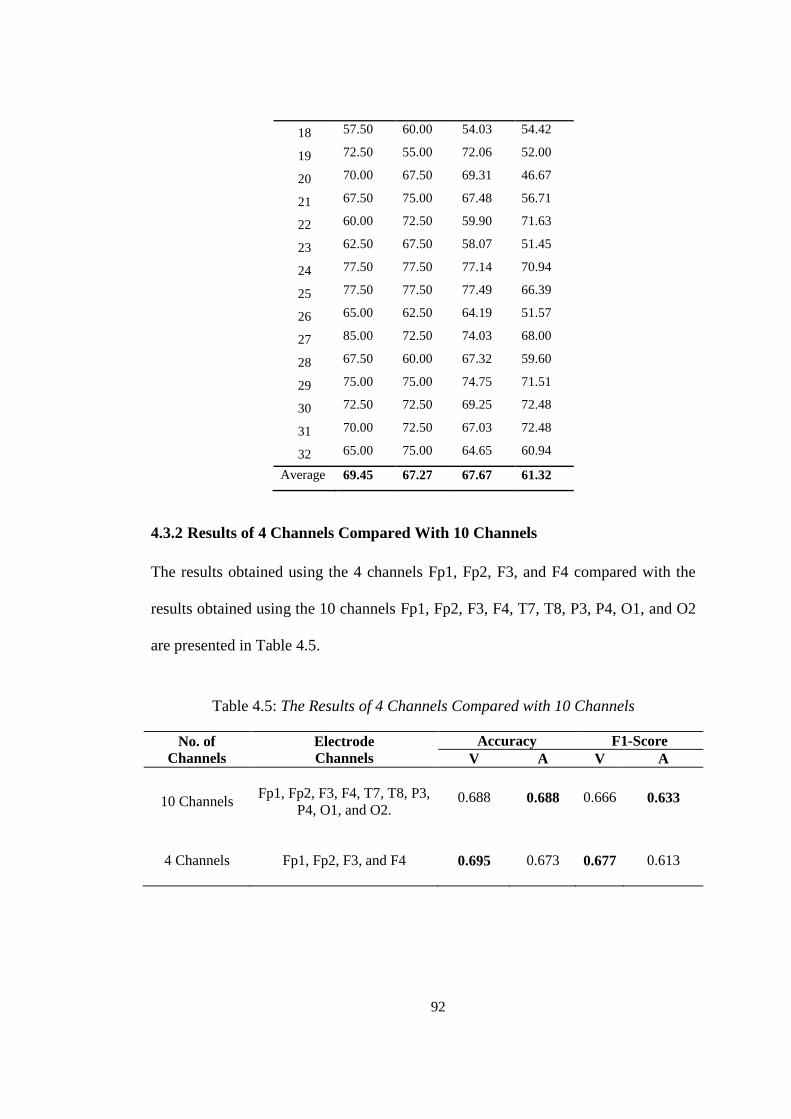
92
18 57.50 60.00 54.03 54.42
19 72.50 55.00 72.06 52.00
20 70.00 67.50 69.31 46.67
21 67.50 75.00 67.48 56.71
22 60.00 72.50 59.90 71.63
23 62.50 67.50 58.07 51.45
24 77.50 77.50 77.14 70.94
25 77.50 77.50 77.49 66.39
26 65.00 62.50 64.19 51.57
27 85.00 72.50 74.03 68.00
28 67.50 60.00 67.32 59.60
29 75.00 75.00 74.75 71.51
30 72.50 72.50 69.25 72.48
31 70.00 72.50 67.03 72.48
32 65.00 75.00 64.65 60.94
Average 69.45 67.27 67.67 61.32
4.3.2 Results of 4 Channels Compared With 10 Channels
The results obtained using the 4 channels Fp1, Fp2, F3, and F4 compared with the
results obtained using the 10 channels Fp1, Fp2, F3, F4, T7, T8, P3, P4, O1, and O2
are presented in Table 4.5.
Table 4.5: The Results of 4 Channels Compared with 10 Channels
No. of
Channels
Electrode
Channels
Accuracy F1-Score
V A V A
10 Channels
Fp1, Fp2, F3, F4, T7, T8, P3,
P4, O1, and O2.
0.688 0.688 0.666 0.633
4 Channels
Fp1, Fp2, F3, and F4
0.695 0.673 0.677 0.613
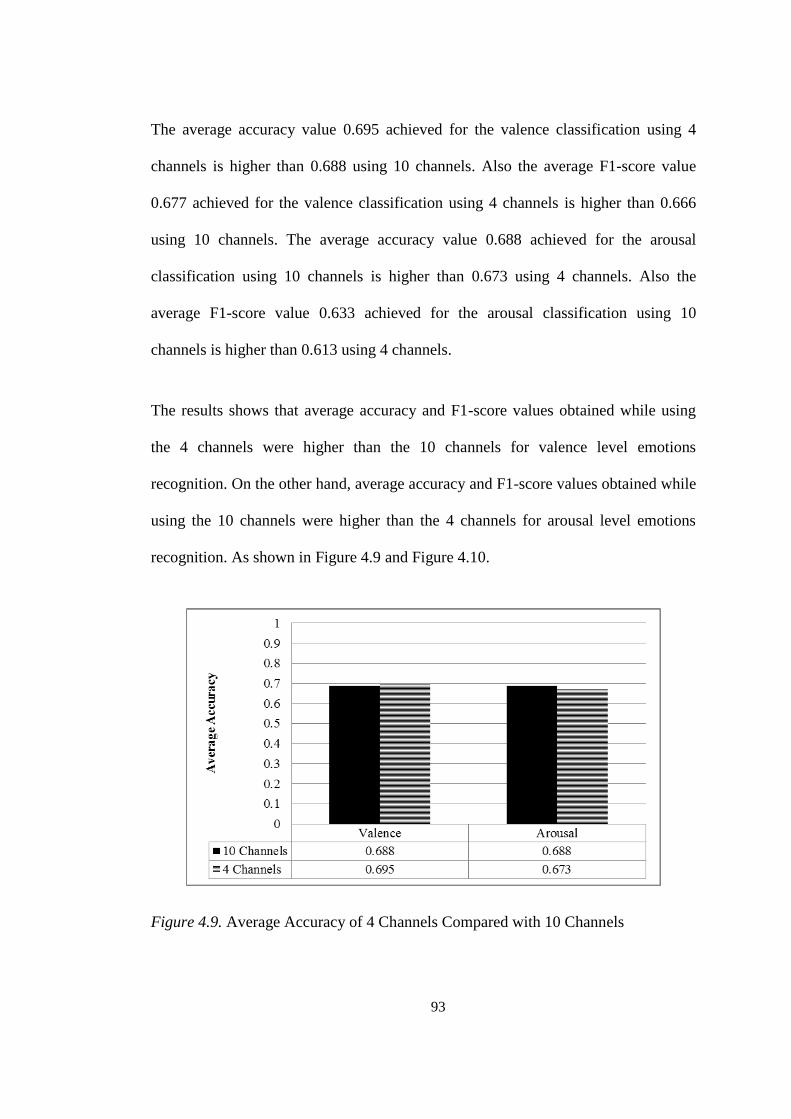
93
The average accuracy value 0.695 achieved for the valence classification using 4
channels is higher than 0.688 using 10 channels. Also the average F1-score value
0.677 achieved for the valence classification using 4 channels is higher than 0.666
using 10 channels. The average accuracy value 0.688 achieved for the arousal
classification using 10 channels is higher than 0.673 using 4 channels. Also the
average F1-score value 0.633 achieved for the arousal classification using 10
channels is higher than 0.613 using 4 channels.
The results shows that average accuracy and F1-score values obtained while using
the 4 channels were higher than the 10 channels for valence level emotions
recognition. On the other hand, average accuracy and F1-score values obtained while
using the 10 channels were higher than the 4 channels for arousal level emotions
recognition. As shown in Figure 4.9 and Figure 4.10.
Figure 4.9. Average Accuracy of 4 Channels Compared with 10 Channels
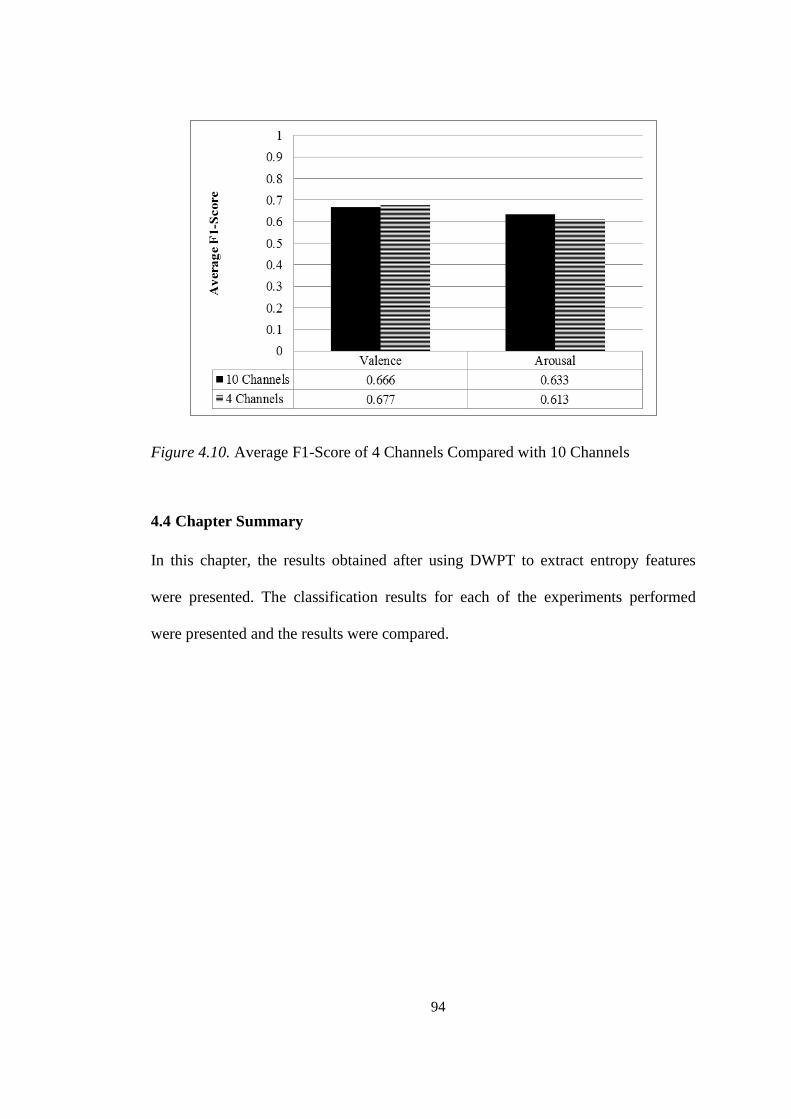
94
Figure 4.10. Average F1-Score of 4 Channels Compared with 10 Channels
4.4 Chapter Summary
In this chapter, the results obtained after using DWPT to extract entropy features
were presented. The classification results for each of the experiments performed
were presented and the results were compared.
95
CHAPTER FIVE
CONCLUSION
Based on the main objective of this study, that is to discover the feature extraction
method and the combination of electrode channels that optimally implements EEG-
based valence-arousal emotion recognition, DWPT was proposed as a feature
extraction method and two emotion recognition experiments were performed to
classify human emotional states into high/low valence or high/low arousal.
The first experiment was aimed at comparing the results of the study carried out by
Wichakam and Vateekul (2014) using bandpower features to the result achieved in
this study using DWPT to extract entropy features. The entropy features of the theta,
alpha, beta, and gamma bands through 10 EEG channels Fp1, Fp2, F3, F4, T7, T8,
P3, P4, O1, and O2 were extracted using DWPT and RBF-SVM was used as the
classifier. The result of this experiment showed that entropy features extracted using
DWPT are better than the bandpower features. Moreover it has previously been
showed in Wichakam and Vateekul (2014) that bandpower method is better than the
PSD by wavelet transform method. So it can be concluded that entropy by DWPT is
better than bandpower and subsequently better than the PSD by wavelet transform
method.
The second experiment was aimed at comparing the result achieved in the first
experiment using the 10 channels with another combination of 4 channels Fp1, Fp2,
F3, and F4 in order to identify the combination of electrode channels that optimally
recognize emotions based on the valence-arousal model in EEG emotion recognition.

96
The result of the second classification experiment shows that the combination of the
4 channels gives higher accuracy than the combination the 10 channels for only
valence level emotion recognition. On the other hand, the combination of the 10
channels gives higher accuracy than the 4 channels for only arousal level emotions
recognition. This result indicated that the combination of the 4 frontal channels Fp1,
Fp2, F3, and, F4 are significant for EEG-based emotion recognition in the valence-
arousal space and the addition of the remaining 6 channels T7, T8, P3, P4, O1, and
O2 are not essential. Moreover, it has previously been identified by Wichakam and
Vateekul (2014) that 10 channels give higher accuracy than 32 channels. So it can be
concluded that the combination of the 4 channels are better than the combination of
the 10 channels and subsequently better than the combination of the 32 channels.
This finding is in line with other previous studies that have proved that human
emotions can be recognized by acquiring brain signals from the frontal region of the
brain (Coan and Allen, 2004; Davidson, 2004) and specifically these 4 frontal
channels (Bastos-Filho, Ferreira, Atencio, Arjunan, and Kumar, 2012; Singh, Jati,
Khasnobish, Bhattacharyya, Konar, Tibarewala, and Janarthanan, 2012;
Petrantonakis and Hadjileontiadis, 2010).
Future works should be focused on implementing these combinations of channels
and feature extraction method on another dataset in order to validate the result and
findings in this work. Further effort should be made to utilize these findings to build
systems that are specific in solving real life medical problems.
97
REFERENCES
Aftanas, L. I., Reva, N. V., Varlamov, A. A., Pavlov, S. V., & Makhnev, V. P.
(2004). Analysis of evoked EEG synchronization and desynchronization in
conditions of emotional activation in humans: temporal and topographic
characteristics. Neuroscience and behavioral physiology, 34(8), 859-867.
AlZoubi, O., Calvo, R. A., & Stevens, R. H. (2009). Classification of EEG for affect
recognition: an adaptive approach. In AI 2009: Advances in Artificial
Intelligence (pp. 52-61). Springer Berlin Heidelberg
Amaral, V., Ferreira, L. A., Aquino, P. T., & de Castro, M. C. F. (2013). EEG signal
classification in usability experiments. In Biosignals and Biorobotics
Conference (BRC), 2013 ISSNIP (pp. 1-5). IEEE.
Bahari, F., & Janghorbani, A. (2013). EEG-based emotion recognition using
Recurrence Plot analysis and K nearest neighbor classifier. In Biomedical
Engineering (ICBME), 2013 20th Iranian Conference on (pp. 228-233).
IEEE.
Bastos-Filho, T. F., Ferreira, A., Atencio, A. C., Arjunan, S., & Kumar, D. (2012,
December). Evaluation of feature extraction techniques in emotional state
recognition. In Intelligent Human Computer Interaction (IHCI), 2012 4th
International Conference on (pp. 1-6). IEEE.
Bos, D. O. (2007). EEG-based Emotion Recognition: The Influence of Visual and
Auditory Stimuli. Capita Selecta Paper. Retrieved from
http://scholar.google.com/scholar?hl=en&btnG=Search&q=intitle:EEG-
based+Emotion+Recognition+The+Influence+of+Visual+and+Auditory+Sti
muli#2
Cabredo, R., Legaspi, R. S., Inventado, P. S., & Numao, M. (2013). Discovering
Emotion-Inducing Music Features Using EEG Signals. JACIII, 17(3), 362-
370.)
Chanel, G., Kronegg, J., Grandjean, D., & Pun, T. (2006). Emotion assessment:
Arousal evaluation using EEG’s and peripheral physiological signals. In
Multimedia content representation, classification and security (pp. 530-537).
Springer Berlin Heidelberg.
98
Chanel, G. (2009). Emotion assessment for affective computing based on brain and
peripheral signals (Doctoral dissertation, University of Geneva).
Coan, J. A., & Allen, J. J. (2004). Frontal EEG asymmetry as a moderator and
mediator of emotion. Biological psychology, 67(1), 7-50.
Dauwels, J., & Vialatte, F. (2010). Topics in Brain Signal Processing. Nanyang
Technological University, Singapore (IEEE J-STSP), ISSN1941-0484.
Davidson, R. J. (2004). What does the prefrontal cortex “do” in affect: perspectives
on frontal EEG asymmetry research. Biological psychology,67(1), 219-234.
Dayan, P., & Abbott, L. (2000). Theoretical neuroscience: computational and
mathematical modeling of neural systems. Retrieved from http://cns-
classes.bu.edu/cn510/Papers/Theoretical Neuroscience Computational and
Mathematical Modeling of Neural Systems - Peter Dayan, L. F. Abbott.pdf
Delorme, A., & Makeig, S. (2004). EEGLAB: an open source toolbox for analysis of
single-trial EEG dynamics including independent component analysis.
Journal of neuroscience methods, 134(1), 9-21.
Fu, S. Y., Yang, G. S., & Hou, Z. G. (2011, July). Spiking neural networks based
cortex like mechanism: a case study for facial expression recognition. In
Neural Networks (IJCNN), The 2011 International Joint Conference on (pp.
1637-1642). IEEE.
Garcia–Molina, G., Tsoneva, T., & Nijholt, A. (2013). Emotional brain–computer
interfaces. International Journal of Autonomous and Adaptive
Communications Systems, 6(1), 9-25.
Gráfová, L., Vyšata, O., & Procházka, A. (2010). Feature Analysis of EEG Signals
Using SOM. Institute of Chemical Technology Department of Computing
and Control Engineering, Technicka. Retrieved from
http://dsp.vscht.cz/konference_matlab/MATLAB10/full_text/031_Grafova.p
df
Hosseini, S. A., & Khalilzadeh, M. A. (2010, April). Emotional stress recognition
system using EEG and psychophysiological signals: Using new labelling
process of EEG signals in emotional stress state. In Biomedical Engineering
and Computer Science (ICBECS), 2010 International Conference on (pp. 1-
6). IEEE.
99
Hosseini, S., & Naghibi-Sistani, M. (2009). Classification of Emotional Stress Using
Brain Activity. Retrieved from http://cdn.intechweb.org/pdfs/18027.pdf
Hosseini, S. A. (2012). Classification of Brain Activity in Emotional States Using
HOS Analysis. International Journal of Image, Graphics and Signal
Processing (IJIGSP), 4(1), 21.
Hwang, H. J., Kim, S., Choi, S., & Im, C. H. (2013). EEG-Based Brain-Computer
Interfaces: A Thorough Literature Survey. International Journal of Human-
Computer Interaction, 29(12), 814-826.
Jahankhani, P., Kodogiannis, V., & Revett, K. (2006, October). EEG signal
classification using wavelet feature extraction and neural networks. In
Modern Computing, 2006. JVA'06. IEEE John Vincent Atanasoff 2006
International Symposium on (pp. 120-124). IEEE.
Jatupaiboon, N., Pan-ngum, S., & Israsena, P. (2013, a). Emotion classification using
minimal EEG channels and frequency bands. In Computer Science and
Software Engineering (JCSSE), 2013 10th International Joint Conference on
(pp. 21-24). IEEE.
Jatupaiboon, N., Pan-ngum, S., & Israsena, P. (2013,b). Real-time EEG-based
happiness detection system. The Scientific World Journal, 2013.
Jie, X., Cao, R., & Li, L. (2014). Emotion recognition based on the sample entropy
of EEG. Bio-medical materials and engineering, 24(1), 1185-1192.
Kensinger, E. A. (2004). Remembering emotional experiences: The contribution of
valence and arousal. Reviews in the Neurosciences, 15(4), 241-252.
Khalili, Z., & Moradi, M. H. (2009). Emotion recognition system using brain and
peripheral signals: using correlation dimension to improve the results of
EEG. In Neural Networks, 2009. IJCNN 2009. International Joint
Conference on (pp. 1571-1575). IEEE.
Kim, J., & André, E. (2006). Emotion recognition using physiological and speech
signal in short-term observation. In Perception and interactive technologies
(pp. 53-64). Springer Berlin Heidelberg.
Kim, J., & André, E. (2008). Emotion recognition based on physiological changes in
music listening. Pattern Analysis and Machine Intelligence, IEEE
Transactions on, 30(12), 2067-2083.
100
Kim, K. H., Bang, S. W., & Kim, S. R. (2004). Emotion recognition system using
short-term monitoring of physiological signals. Medical and biological
engineering and computing, 42(3), 419-427.
Kiymik, M. K., Akin, M., & Subasi, A. (2004). Automatic recognition of alertness
level by using wavelet transform and artificial neural network. Journal of
neuroscience methods, 139(2), 231-240.
Koelstra, S., Muhl, C., Soleymani, M., Lee, J. S., Yazdani, A., Ebrahimi, T., ... &
Patras, I. (2012). Deap: A database for emotion analysis; using physiological
signals. Affective Computing, IEEE Transactions on, 3(1), 18-31.
Kwon, M., Ahn, M., Hong, J. H., Park, S., Park, T., & Jun, S. C. (2013, November).
Valence detection for image stimulated EEG data. In Neural Engineering
(NER), 2013 6th International IEEE/EMBS Conference on (pp. 109-112).
IEEE.
Li, M., & Lu, B. L. (2009). Emotion classification based on gamma-band EEG. In
Engineering in Med-icine and Biology Society, 2009. EMBC 2009. Annual
International Conference of the IEEE (pp. 1223-1226). IEEE.
Lin, Y. P., Wang, C. H., Jung, T. P., Wu, T. L., Jeng, S. K., Duann, J. R., & Chen, J.
H. (2010). EEG-based emotion recognition in music listening. Biomedical
Engineering, IEEE Transactions on, 57(7), 1798-1806.
Liu, Y., Sourina, O., & Nguyen, M. K. (2011). Real-time EEG-based emotion
recognition and its applications. In Transactions on computational science
XII(pp. 256-277). Springer Berlin Heidelberg.
Mathieu, N. G., Bonnet, S., Harquel, S., Gentaz, E., & Campagne, A. (2013,
November). Single-trial ERP classification of emotional processing. In
Neural Engineering (NER), 2013 6th International IEEE/EMBS Conference
on (pp. 101-104). IEEE.
Mauss, I. B., & Robinson, M. D. (2009). Measures of emotion: A review. Cognition
and emotion, 23(2), 209-237.
Mazaeva, N., Ntuen, C., & Lebby, G. (2001, July). Self-Organizing Map (SOM)
model for mental workload classification. In IFSA World Congress and 20th
NAFIPS International Conference, 2001. Joint 9th (Vol. 3, pp. 1822-1825).
IEEE.
101
Murugappan, M., Rizon, M., Nagarajan, R., Yaacob, S., Hazry, D., & Zunaidi, I.
(2008, January). Time-frequency analysis of EEG signals for human emotion
detection. In 4th Kuala Lumpur International Conference on Biomedical
Engineering 2008 (pp. 262-265). Springer Berlin Heidelberg.
Murugappan, M., Rizon, M., Nagarajan, R., Yaacob, S., Zunaidi, I., & Hazry, D.
(2008, August). Lifting scheme for human emotion recognition using EEG.
In Information Technology, 2008. ITSim 2008. International Symposium on
(Vol. 2, pp. 1-7). IEEE.
Murugappan, M., Rizon, M., Nagarajan, R., & Yaacob, S. (2009). FCM clustering of
Human Emotions using Wavelet based Features from EEG. The official
Journal of the Biomedical Fuzzy Systems Association, 35.
Murugappan, M., Ramachandran, N., & Sazali, Y. (2010). Classification of human
emotion from EEG using discrete wavelet transform. Journal of Biomedical
Science and Engineering, 03(04), 390–396. doi:10.4236/jbise.2010.34054
Murugappan, M., Nagarajan, R., & Yaacob, S. (2011). Combining spatial filtering
and wavelet transform for classifying human emotions using EEG Signals.
Journal of Medical and Biological Engineering, 31(1), 45-51.
Murugappan, M., Wali, M. K., Ahmmad, R. B., & Murugappan, S. (2013).
Subtractive fuzzy classifier based driver drowsiness levels classification
using EEG. In Communications and Signal Pro-cessing (ICCSP), 2013
International Conference on (pp. 159-164). IEEE.
Naser, D. S., & Saha, G. (2013). Recognition of emotions induced by music videos
using DT-CWPT. In Medical Informatics and Telemedicine (ICMIT), 2013
Indian Conference on (pp. 53-57). IEEE.
Pei, M., Goodman, E. D., Punch, W. F., & Ding, Y. (1995, June). Genetic algorithms
for classification and feature extraction. In Classification Society Conference.
Peterson, D. A., Knight, J. N., Kirby, M. J., Anderson, C. W., & Thaut, M. H.
(2005). Feature selection and blind source separation in an EEG-based brain-
computer interface. EURASIP Journal on Advances in Signal Processing,
2005(19), 3128-3140.
102
Petrantonakis, P. C., & Hadjileontiadis, L. J. (2010). Emotion recognition from EEG
using higher order crossings. Information Technology in Biomedicine, IEEE
Transactions on, 14(2), 186-197.
Picard, R. W., Vyzas, E., & Healey, J. (2001). Toward machine emotional
intelligence: Analysis of affective physiological state. Pattern Analysis and
Machine Intelligence, IEEE Transactions on, 23(10), 1175-1191.
Posner, J., Russell, J. A., & Peterson, B. S. (2005). The circumplex model of affect:
An integrative approach to affective neuroscience, cognitive development,
and psychopathology. Development and psychopathology, 17(03), 715-734.
Rached, T. S., & Perkusich, A. (2013). Emotion Recognition Based on Brain-
Computer Interface Systems. Retrieved from
http://cdn.intechopen.com/pdfs/44926/InTech-
Emotion_recognition_based_on_brain_computer_interface_systems.pdf
Raymer, M. L., Punch, W. F., Goodman, E. D., Sanschagrin, P. C., & Kuhn, L. A.
(1997, July). Simultaneous feature extraction and selection using a masking
genetic algorithm. In Proceedings of the 7th International Conference on
Genetic Algorithms, San Francisco, CA (pp. 561-567).
Riera Sardà, A. (2012). Computational Intelligence Techniques for Electro-
Physiological Data Analysis. Retrieved from
http://www.tesisenred.net/handle/10803/107818
Rozgic, V., Vitaladevuni, S. N., & Prasad, R. (2013). Robust EEG emotion
classification using segment level decision fusion. In Acoustics, Speech and
Signal Processing (ICASSP), 2013 IEEE International Conference on (pp.
1286-1290). IEEE.
Russell, J. A. (1980). A circumplex model of affect. Journal of personality and social
psychology, 39(6), 1161.
Sanei, S., & Chambers, J. A. (2008). EEG signal processing. John Wiley & Sons.
Retrieved from
http://medcontent.metapress.com/index/A65RM03P4874243N.pdf
Singh, G., Jati, A., Khasnobish, A., Bhattacharyya, S., Konar, A., Tibarewala, D. N.,
& Janarthanan, R. (2012, July). Negative emotion recognition from
stimulated EEG signals. In Computing Communication & Networking
103
Technologies (ICCCNT), 2012 Third International Conference on (pp. 1-8).
IEEE.
Stickel, C., Ebner, M., Steinbach-Nordmann, S., Searle, G., & Holzinger, A. (2009).
Emotion detection: application of the valence arousal space for rapid
biological usability testing to enhance universal access. In Universal Access
in Human-Computer Interaction. Addressing Diversity (pp. 615-624).
Springer Berlin Heidelberg.
Scherer, K. R. (2005). What are emotions? And how can they be measured? Social
Science Information, 44(4), 695–729. doi:10.1177/0539018405058216
Tsai, P. Y., Hu, W., Kuo, T. B., & Shyu, L. Y. (2009). A portable device for real
time drowsiness detection using novel active dry electrode system. In
Engineering in Medicine and Biology Society, 2009. EMBC 2009. Annual
International Conference of the IEEE (pp. 3775-3778). IEEE.
Torres, C. A., Orozco, A. A., & Alvarez, M. A. (2013, July). Feature selection for
multimodal emotion recognition in the arousal-valence space. In Engineering
in Medicine and Biology Society (EMBC), 2013 35th Annual International
Conference of the IEEE (pp. 4330-4333). IEEE.
Wang, X. W., Nie, D., & Lu, B. L. (2011, January). EEG-based emotion recognition
using frequency domain features and support vector machines. In Neural
Information Processing (pp. 734-743). Springer Berlin Heidelberg.
Wali, M. K., Murugappan, M., & Ahmmad, B. (2013). Wavelet packet transform
based driver distrac-tion level classification using EEG. Mathematical
Problems in Engineering, 2013.
Yang, J., Singh, H., Hines, E. L., Schlaghecken, F., Iliescu, D. D., Leeson, M. S., &
Stocks, N. G. (2012). Channel selection and classification of
electroencephalogram signals: An artificial neural network and genetic
algorithm-based approach. Artificial intelligence in medicine, 55(2), 117-
126.
Wichakam, I., & Vateekul, P. (2014). An evaluation of feature extraction in EEG-
based emotion pre-diction with support vector machines. In Computer
Science and Software Engineering (JCSSE), 2014 11th International Joint
Conference on (pp. 106-110). IEEE.
104
Youn, Y., Jeon, H., Jung, H., & Lee, H. (2007). Discrete wavelet packet transform
based energy detec-tor for cognitive radios. In Vehicular Technology
Conference, 2007. VTC2007-Spring. IEEE 65th (pp. 2641-2645). IEEE.
Yuen, C. T., San, W. S., Seong, T. C., & Rizon, M. (2011). Classification of human
emotions from EEG signals using statistical features and neural network.
International Journal of Integrated Engineering, 1(3).
Zhuang, X., Rozgic, V., & Crystal, M. (2014). Compact unsupervised EEG response
representation for emotion recognition. In Biomedical and Health Informatics
(BHI), 2014 IEEE-EMBS International Conference on (pp. 736-739). IEEE.
Related Documents


![Basis Selection for Wavelet Regression - NeurIPS · 2.1 DISCRETE WAVELET TRANSFORM The Discrete Wavelet Transform (DWT) [Daubechies, 92] is implemented as a series of projections](https://static.cupdf.com/doc/110x72/60d408b2fe3b0d42d144857b/basis-selection-for-wavelet-regression-neurips-21-discrete-wavelet-transform.jpg)