CONFERENCE ROOM PAPER ESCAP/CST/2018/CRP.2 Distr.: For participants only 24 September 2018 English only Economic and Social Commission for Asia and the Pacific Committee on Statistics Sixth session Bangkok, 16–19 October 2018 Item 3(d) of the provisional agenda * Review of progress by the groups responsible for the regional initiatives of the Committee with respect to the collective vision and framework for action: disaster- related statistics B18-01095 (E) TP260918 Disaster-related Statistics Framework ** Summary The Expert Group on Disaster-related Statistics in Asia and the Pacific was established by the Commission in its resolution 70/2, with extensions and adjustments to its mandate made by the Commission in its resolutions 72/11 and 73/7. A summary of the progress of work by the Expert Group and the main questions for consideration by this Committee are contained in the Committee Document titled: “Advancing official statistics for the 2030 Agenda for Sustainable Development: progress in implementing the existing regional initiatives of the Committee on Statistics" (ECAP/CST/2018/2). In May 2018, the Expert Group reported the results of its work to the 74th ESCAP Commission Session in the form of a summary (ESCAP 74/24) 1 and by issuing online the Final Draft version of the Disaster Related Statistics Framework as a main substantive output of its work. In considering the results of the work of the Expert Group and the technical nature of the main output, the Commission requested the Committee on Statistics, at its sixth session, and the Committee on Disaster Risk Reduction, at its sixth session (in 2019), to review the results of the work of the Expert Group and to submit those reviews to the Commission at its seventy-sixth session (Commission Resolution 74/6) 2 . The Expert Group’s recommendations on future regional collaboration to strengthen disaster-related statistics are also contained in its Summary Report to the 74th Commission Session. * ESCAP/CST/2018/L.1/Rev.1. ** This document is being issued without formal editing. 1 Report of the Expert Group to the 74 th ESCAP Commission Session: https://www.unescap.org/commission/74/document/E74_24E.pdf. 2 74th ESCAP Commission Session Resolution 74/6 “Advancing Disaster-related Statistics in Asia and the Pacific”: https://www.unescap.org/commission/74/document/E74_RES6E.pdf.

Welcome message from author
This document is posted to help you gain knowledge. Please leave a comment to let me know what you think about it! Share it to your friends and learn new things together.
Transcript

CONFERENCE ROOM PAPER
ESCAP/CST/2018/CRP.2
Distr.: For participants only
24 September 2018
English only
Economic and Social Commission for Asia and the Pacific
Committee on Statistics
Sixth session
Bangkok, 16–19 October 2018
Item 3(d) of the provisional agenda*
Review of progress by the groups responsible for the
regional initiatives of the Committee with respect to the
collective vision and framework for action: disaster-
related statistics
B18-01095 (E) TP260918
Disaster-related Statistics Framework **
Summary
The Expert Group on Disaster-related Statistics in Asia and the Pacific was
established by the Commission in its resolution 70/2, with extensions and adjustments to
its mandate made by the Commission in its resolutions 72/11 and 73/7.
A summary of the progress of work by the Expert Group and the main questions
for consideration by this Committee are contained in the Committee Document titled:
“Advancing official statistics for the 2030 Agenda for Sustainable Development: progress
in implementing the existing regional initiatives of the Committee on Statistics"
(ECAP/CST/2018/2).
In May 2018, the Expert Group reported the results of its work to the 74th ESCAP
Commission Session in the form of a summary (ESCAP 74/24)1 and by issuing online
the Final Draft version of the Disaster Related Statistics Framework as a main substantive
output of its work. In considering the results of the work of the Expert Group and the
technical nature of the main output, the Commission requested the Committee on
Statistics, at its sixth session, and the Committee on Disaster Risk Reduction, at its sixth
session (in 2019), to review the results of the work of the Expert Group and to submit
those reviews to the Commission at its seventy-sixth session (Commission Resolution
74/6)2. The Expert Group’s recommendations on future regional collaboration to
strengthen disaster-related statistics are also contained in its Summary Report to the 74th
Commission Session.
* ESCAP/CST/2018/L.1/Rev.1.
** This document is being issued without formal editing.
1 Report of the Expert Group to the 74th ESCAP Commission Session:
https://www.unescap.org/commission/74/document/E74_24E.pdf.
2 74th ESCAP Commission Session Resolution 74/6 “Advancing Disaster-related
Statistics in Asia and the Pacific”:
https://www.unescap.org/commission/74/document/E74_RES6E.pdf.

ESCAP/CST/2018/CRP.2
2 B18-01095
In accordance with the Commission Resolution 74/63, the Committee is requested
to review and endorse:
(a) the Final Draft of the Disaster-related Statistics Framework;
(b) the recommendations of the Expert Group concerning its future priorities
and working mechanism as contained in paragraphs 11 to 13 of document ESCAP/74/24.
(c) To task the Expert Group with conveying the results of the review by the
Committee to the Committee on Disaster Risk Reduction at its sixth session, in 2019;
(d) To request the Expert Group to provide guidance to the secretariat on the
preparation of the report to the Statistical Commission at its fiftieth session.
3 Disaster-related Statistics Framework, Final Draft, produced by the Expert Group:
http://communities.unescap.org/asia-pacific-expert-group-disaster-related-
statistics/content/drsf.


Expert Group on Disaster-related Statistics in Asia and the Pacific
Disaster-related Statistics Framework
May 2018
This document is published without formal editing.


DISASTER-RELATED STATISTICS FRAMEWORK (DRSF)
Expert Group on Disaster-related Statistics in Asia and the Pacific Page i
EXECUTIVE SUMMARY
The Disaster-related Statistics Framework (DRSF) was developed through an iterative and
interactive process by the Expert Group on Disaster-related Statistics in Asia and the Pacific from
2014-2018.
During the process of developing the DRSF, several important events or initiatives coincided with
the Expert Group’s mission. Therefore, the Asia-Pacific Expert Group established partnerships
and worked with the intention to create alignment and clear and simple inter-operability with
related projects or emerging requirements of national statistical systems.
Most notably, the World Conference on Disaster Risk Reduction (WCDRR) in 2015 led to adoption
of the Sendai Framework for Disaster Risk Reduction 2015-2030 and subsequently a collection
of agreed international indicators and terminologies for monitoring its implementation (UNGA,
2015 and UNISDR, 2017).
The Sendai Framework represents a new global consensus on core concepts and targets and
overall statistical requirements for disaster risk reduction. The Sendai Framework describes
statistics requirements for global monitoring, via the Sendai Framework Monitor4 for the seven
global targets for disaster risk reduction.
The adoption of the Sendai Framework and inclusion of disaster risk reduction targets in the
Sustainable Development Goals (SDGs) has created enhanced demand for investments for
development of accessible databases for disaster risk management and for improved
international comparability of statistics for monitoring risks and impacts from disasters. A main
objective of the DRSF is to generate relevant statistics that are used for calculating international
indicators for reporting to the Sendai Framework and SDGs global monitoring systems, managed
through the UNISDR Sendai Framework Monitor.
For consistency, the Inter-Agency and Expert Group on Sustainable Development Goal Indicators
(IAEG-SDGs) decided to align their indicators with selected Sendai Framework indicators for the
disaster-related targets for Sustainable Development Goal monitoring.5 Targets for reducing
disaster impacts appear prominently across three of the 18 SDGS: including 3 indicators (1.5.1,
1.5.2 and 1.5.3) under Goal 1 “End poverty in all its forms for all people everywhere” and also
including targets under Goal 11 “Make Cities and Human Settlement, Inclusive, Safe, Resilient and
goal 13 “Take Urgent Action to Combat Climate Change and its Impacts”.
Whereas core concepts and indicators for disaster risk reduction (DRR) for international
monitoring have been defined in the Sendai Framework and SDGs, there is a need to translate the
agreed concepts and definitions into specific instructions and technical recommendations for
production and dissemination of statistics.
Disaster-related statistics includes, but is not limited to, statistics about disaster occurrences and
their impacts. Disaster-related statistics also includes statistical information used for risk
4 https://sendaimonitor.unisdr.org/
5 See United Nations Statistics Commission Document E/CN.3/2017/2.

DISASTER-RELATED STATISTICS FRAMEWORK (DRSF)
Page ii Expert Group on Disaster-related Statistics in Asia and the Pacific
assessment and post-disaster impact assessments, which rely on analyses of a variety of sources
of data on the population, society, and economy, like censuses, surveys, and other instruments
used in official statistics for multiple purposes.
Each disaster is different, unpredictable, and creates significant changes to the social and
economic context for affected regions. Disaster risk is unevenly dispersed within countries,
across the world and over time. To identify authentic trends, rather than random fluctuations or
effects of extreme values, much of the analyses of disaster related statistics requires a coherent
time series and depends on clear and well-structured statistical compilations. This context put
an exceptionally high value for harmonizing of measurement for related statistics over time and,
as much as feasible, across countries and regions.
Statistics on impacts of disasters are linked to uniquely identifiable disaster occurrences.
Collections of these statistics need to be structured and documented in such a way as to maintain
the links to relevant characteristics of the underlying disaster occurrence (e.g. timing, location,
hazard type), while also remaining accessible to users as inputs for cross-disaster analyses, e.g.
monitoring indicators over time or in models for predicting and minimizing disaster risk. Thus, a
basic challenge in disaster-related statistics is to make statistics accessible for use in multiple
forms and purposes of analyses, while maintaining harmonized and coherent compilations via
structured use of metadata.
Disasters have the potential to affect all elements of society and they threaten sustainable
development in many places around the world. However, disasters have also inspired
international solidarity and have become a major component of international aid. International
efforts to reduce disaster risk will be strengthened by improved statistics on the costs and the
factors of risk associated with disasters. Better quality statistics leads to improved capacities for
research, monitoring, and development of new evidence-based policies.
A core element for the statistical framework is measurement of factors of risk, i.e. probabilities
associated with a hazard, exposure to the hazard, according to location of population and
infrastructure, vulnerabilities and coping capacity. Disaster risk can be analysed at different
scales – e.g. level of individuals or households, communities, regions, countries, and
internationally. Therefore, this statistical framework is applicable at multiple scales, and can be
applied flexibly, depending on the requirements of users of the statistics.
Understanding disaster risk involves an integration of statistics on the social, environmental and
economic conditions of particularly defined geographic areas. The DRSF is not locked to any
specific indicator or level of aggregation. On the other hand, there is also a need for consistency
for analyses of time series, which depends on standardizing certain methodological elements over
time, such as clear definitions for variables, groupings of variables, and rules for scope of
measurement and disaggregation.
DRSF contains internally-coherent and internationally consistent guidance for utilizing existing
data to produce information relevant to all the phases of disaster risk management, including for
risk identification, prevention, and mitigation as well as for disaster preparedness, response and
recovery. The process of development involved extensively studying current practices, pilot
studies to test draft recommendations based on real compilations of data by official agencies,
open consultations online, and a series of expert meetings, workshops and seminars.

DISASTER-RELATED STATISTICS FRAMEWORK (DRSF)
Expert Group on Disaster-related Statistics in Asia and the Pacific Page iii
Frameworks for official statistics have been developed for many other cross-cutting topics and
fields of research, and the DRSF draws inspiration and its structure from the other similar types
of guidance adopted by the United Nations Statistics Commission on other complex topics such
as International Recommendations for Water Statistics and Tourism Statistics. A common
objective from these and other examples of international recommendations for statistics is the
need to develop a common baseline of information, or basic range of internationally-comparable
statistics, collected from a diverse range of existing sources of data that are typically dispersed
across multiple government agencies.
The main users of this framework are expected to be national disaster management agencies
(NDMAs) and national statistics offices (NSOs), but there are a diverse range of other national
stakeholders involved in collections of relevant data, such as ministries of environment, mapping
agencies and land management authorities, ministries of finance, ministries of health, economic
and social development policy makers, meteorological organizations, and so on.
The Expert Group process facilitated development of many important international partnerships
for statistical development, including the Global Partnership for Disaster-related Statistics,
founded by the United Nations Office for Disaster Risk Reduction (UNISDR), the Economic
Commission for Europe (UNECE) and the UN Economic and Social Commission for Asia and the
Pacific (ESCAP) at the First UN World Data Forum in January 2017.
People depend on their governments, which conduct, by law, many of the functions related to
disaster risk management, particularly response and recovery and risk reduction. As a statistical
framework, the DRSF only has bearing on production, dissemination and analyses of official
statistics and does not influence national laws or policies for disaster risk management. Although
legal contexts vary significantly among countries, a basic range of disaster-related statistics can
be produced with reasonable international comparability. The objective of this international
statistical framework is to harmonize, as much as feasible, across national statistics systems
towards comparable measurements of disaster risk, disaster impacts, and risk reduction
interventions.
Statistics provide the context and a broad vision for comparisons and for a deeper understanding
of risk across individual and multiple hazards. Harmonized statistics are used to inform
international support and boost solidarity, not only for responding to major disasters but also for
addressing risks on a continuous basis, utilizing support from international cooperation.

DISASTER-RELATED STATISTICS FRAMEWORK (DRSF)
Page iv Expert Group on Disaster-related Statistics in Asia and the Pacific
ACKNOWLEDGEMENTS
On behalf of the Chair of the Expert Group, Romeo Soon Recide (Philippine Statistics Authority),
the Secretariat would like to express its sincere and deep appreciation for all the experts and
senior officials listed below from governments, international organizations, and universities that
participated in expert group meetings, workshops, surveys of current practices, pilot studies,
and/or online consultations for the development of this handbook:
Experts from member States (listed in alphabetical order by country)
Artavazd Davtyan (Ministry of Emergency Situations, Armenia), Rashad Gasimzade (Ministry of
Emergency Situations, Azerbaijan), Md. Rafiqul Islam (Bangladesh Bureau of Statistics), Sultan
Mahmud (Ministry of Disaster Management and Relief, Bangladesh), Cheku Dorji (National
Statistics Bureau, Bhutan), Pema Thinley (Department of Disaster Management, Bhutan), Nana
Yan (Institute of Remote Sensing and Digital Earth – RADI, China), Litiana Naidoleca Bainimarama
(National Disaster Management Office, Fiji), Poasa Naimila (Fiji Bureau of Statistics), Agus Wibowo
(BPS-Statistics Indonesia), Choril Maksum (BPS-Statistics, Indonesia), Hermawan Agustina (BNPB-
Disaster Management Agency of Indonesia), Indra Murty Surbakti (BPS-Statistics, Indonesia),
Ridwan Yunus (BNPB-Indonesia/UNDP), Wyandin Imawan (BPS-Statistics Indonesia), Sahar
Sahebi Araghi (Statistical Centre of Iran), Nobuyoshi Hara (Tohoku University), Satoru Nishikawa
(Japan Water Agency), Setsuko Saya (Cabinet Office, Japan), Takeya Kimio (JICA, Japan), Yuichi
Ono (Tohoku University/Global Centre for Disaster Statistics), Zaitun binti Mohd Taha
(Department of Statistics, Malaysia), Aishath Shahuda, and Ashiyath Shazna (National Bureau of
Statistics of Maldives), Fathimath Tasneem (National Disaster Management Centre, Maldives),
Francisco Javier Nava Jimenez (National Institute of Statistics and Geography, Mexico), Arrunaa
Chadrabal (National Emergency Management Agency, Mongolia), Odbayar Mishigdorj (National
Agency for Meteorology and Environmental Monitoring, Information and Research Institute of
Meteorology, Hydrology and Environment, Mongolia), Tungalag Chuluunbaatar (National
Statistics Office of Mongolia), Cing Lun Huai, San Myint, and Kyaw San Oo (Central Statistical
Organization, Myanmar), Andrew Hancock , Chase O’brien, Daren Allen, Gary Dunnet, Ian
Newman, Jeff Cope, and Rosemary Goodyear (Statistics New Zealand), Deniece Krizia Ballesteros,
Kathreen Ong, Rownie Aura G. Abella, and Relan Jay Asuncion (Office of Civil Defense, National
Disaster Risk Reduction and Management Council of Philippines) , Lisa Grace Bersales, and
Rowell Casaclang (Philippine Statistics Authority), Eun ha Chang (Center for International
Development and Cooperation, Korean Women’s Development Institute), Chihun Lee, and Yong-
kyun Kim (Ministry of Interior and Safety, Republic of Korea), Hae Ryun Kim (National Statistics
Office, Republic of Korea), Ranjith Weerasekara, S.M.H.N Samarkone, W.A.D.R.D. Athukorala, and
W.P.S. Sisilarathna (Department of Census and Statistic, Sri Lanka), Budsara Sangaroon (National
Statistical Office, Thailand), Chainarong Vasanasomsithi, and Kanokporn Chucherd (Department
of Disaster Prevention and Mitigation, Thailand), Peter Korisa, and Zoe Touteniaki Ayong
(National Disaster Management Office, Vanuatu).

DISASTER-RELATED STATISTICS FRAMEWORK (DRSF)
Expert Group on Disaster-related Statistics in Asia and the Pacific Page v
Experts from international agencies and universities (alphabetical order):
Anggraini Dewi (ADPC)
Alexander Loschky (UNSD)
Antony Omondi Abilla (UN-Habitat)
Benson Sim (UNSD)
Catherine Gamper (OECD)
Chee Hai Teo (UNDP/GGIM)
Daniele Ehrlich (EU-JRC)
David Kasdan (Sungkyunkwan University)
Debarati Guha-Sapir (CRED)
Francesca Perucci (UNSD)
Greg Scott (UNDP/GGIM)
Galmira Markova (FAO)
Haoyi Chen (UNSD)
Herman Smith (UNSD)
Julio Serje (UNISDR)
Li Zhaoxi (UNDP)
Marcus Newbury (UNSD)
Masaru Arakida (ADPC)
Michael Nagy (UNECE)
Michael Smedes (UNSD)
Michelle Yonetani (IDMC)
Meimei Leung (World Vision)
Nancy Chin (UNSD)
Peeranan Towashiraporn (ADPC)
Philip Bright (SPC)
Rachel Scott (OECD)
Rajesh Sharma (UNDP)
Ralf Becker (UNSD)
Reena Shah (UNSD)
Rhea Katsanakis (UNISDR)
Ritsuko Yamazaki-Honda (UNISDR)
Robert Smith (Midsummer Analytics)
Sanjaya Bhatia (UNISDR)
Sanny Jegillos (UNDP)
Seonmi Choi (UN Environment)
Sara Duerto Valero (UN Women)
Sarah Wade-Apicella (UNISDR)
Scott Pontifex (SPC)
Steven Ramage (GEO)
Sujit Mohanty (UNISDR)
Yongyi Min (UNSD)
Yi Sun (The Hong Kong Polytechnic
University)
Expert Group meetings and consolations and drafting of this handbook was managed by the
Statistics Division and the Information and Communications Technology and Disaster Risk
Reduction Division (IDD) of ESCAP. The project was led by Daniel Clarke (Statistics Division) and
Puji Pujiono (IDD), under the overall guidance of Shamika Sirimanne, Margarita Guerrero, Tiziana
Bonapace, Kilaparti Ramakrishna and Rikke Munk Hansen. This project was conducted with
crucial support from: Jean Louis Weber (Independent expert and senior Consultant to ESCAP),
Jessica Gardner, Dyah Rahmawati Hizbaron, Wenyun (Rachel) Qian, Trevor Clifford, Gao Xian
Peh, Youjin Choe, Joo Yeon Moon, Arman Bidarbakht Nia, Tanja Sejersen, Yejin Ha, Sharita Serrao,
Sung Eun Kim, Teerapong Praphotjanaporn, Rajalakshmi Kanagavel, Yea Eun Song, Krisana
Boonpriroje, Nasikarn Nitiprapathananun, Emma Kasemsuwan, Nixie Mabanag Abarquez, and
Panita Rattanakittiaporn.
Cover page credit
Yavuz Sariyildiz/shutterstock.com

DISASTER-RELATED STATISTICS FRAMEWORK (DRSF)
Page vi Expert Group on Disaster-related Statistics in Asia and the Pacific
CONTENTS
EXECUTIVE SUMMARY i
ACKNOWLEDGEMENTS iv
PART 1 12
MAIN CONCEPTS FOR MEASUREMENT 12
CHAPTER 1: INTRODUCTION 13
Background 13
Demands for a statistical framework 15
Use of this handbook 21
CHAPTER 2: MAIN CONCEPTS FOR MEASUREMENT 22
Basic range of disaster related statistics 25
CHAPTER 3: DISASTER RISK 27
Background 27
Scope of measurement 28
Estimating exposure to hazards 29
Hazard mapping 30
Exposure statistics 33
Vulnerability 34
Gender and disaster vulnerability 35
Physical vulnerability 37
Coping capacity 38
CHAPTER 4: IMPACTS STATISTICS 40
Background 40
Attribution of impacts 40
Core sources for impacts statistics 41
Damage and loss database structures 41
Time series aggregation 42
Geographic aggregation 43
Human impacts 44
Demographic and social disaggregation 44
Deaths or missing persons 44
Injured and ill 45
Displacement 45
Impacts to livelihood 46
Material impacts 47

DISASTER-RELATED STATISTICS FRAMEWORK (DRSF)
Expert Group on Disaster-related Statistics in Asia and the Pacific Page vii
Impacts to agriculture 49
Economic loss 50
Economic loss and poverty 54
Disruptions to basic services 54
CHAPTER 5: DISASTER RISK REDUCTION ACTIVITY 56
International assistance 59
PART II 60
TOOLS AND GUIDANCE FOR IMPLEMENTATION 60
CHAPTER 6: BASIC STEPS FOR IMPLEMENTATION 61
Institutional arrangements for disaster-related statistics 61
Statistical coordination 62
Roles and responsibilities 63
Geographic Information Systems (GIS) 64
Metadata and quality assurance 66
Prioritization 68
Development of Technical Standards 69
CHAPTER 7: BASIC RANGE OF DISASTER-RELATED STATISTICS 70
Summary tables of disaster occurrences (A tables) 71
Selected background statistics and exposure to hazards (B tables) 72
Summary tables of human impacts (C tables) 73
Summary tables of direct material impacts (D tables) 74
Summary tables of direct material impacts in monetary terms (E tables) 74
Summary material impacts to Agriculture (F table) 74
Summary tables of direct environmental impacts (G tables) 75
Disaster Risk Reduction Expenditure and Transfers (DRRE Tables) 75
Measurement units for material impacts statistics 75
Dwellings 77
CHAPTER 8: DEFINITIONS AND CLASSIFICATIONS 79
Hazards types 79
Classification for objects of material impacts 81
Draft provisional classification for objects of material impacts from disasters 83
Disaster Risk Reduction Characteristic Activities (DRRCA) Classification 88
DRRCA classification 89
CHAPTER 9: COLLECTION AND ANALYSES OF STATISTICS IN THE DRM CYCLE 92
Before a disaster 92

DISASTER-RELATED STATISTICS FRAMEWORK (DRSF)
Page viii Expert Group on Disaster-related Statistics in Asia and the Pacific
Population and social statistics for risk assessments 93
Mapping and environmental monitoring 94
Disaster preparedness 96
During a disaster 97
Data collected during a disaster occurrence 98
After a disaster 99
Statistics for post-disaster assessment 99
Post-disaster assessment data sources 100
Population and health administrative data after a disaster 101
Mapping and environmental monitoring 103
ANNEX 104
GLOSSARY 125
BIBLIOGRAPHY 133
____________________________

DISASTER-RELATED STATISTICS FRAMEWORK (DRSF)
Expert Group on Disaster-related Statistics in Asia and the Pacific Page ix
FIGURES
Figure 1.1 Information pyramid for disaster risk reduction 16
Figure 1.2 National and international applications for harmonized national disaster-related
statistics 17
Figure 1.3 Cycle of disaster risk management 18
Figure 1.4 Uses of disaster-related data 20
Figure 2.1 From disaster occurrence to disaster impact statistics collection 23
Figure 2.2 Components of the DRSF 26
Figure 3.1 Grid-based data assimilation 29
Figure 3.2 Exposure to hazards 30
Figure 3.3 Households with household emergency plan, by region, 2008 and 2010 39
Figure 4.1 Database model for disaster impacts statistics 42
Figure 6.1 Population exposed to hazards measurement 64
Figure 7.1 Basic range of disaster-related statistics before, during and after a disaster 71
Figure 7.2 From Data Model to Summary Tables 73
TABLE
Table 1.1 Statistics in disaster-risk reduction decision making 19
BOXES
Box 1: Example recording of basic characteristics of disaster occurrence 22
Box 2: Sudden and slow-onset disasters 25
Box 3: Hazard and risk mapping example: BNPB-Indonesia Ina RISK 32
Box 4: Pilot tests for an approach to population exposure statistics 34
Box 5: Utilizing household survey for collecting data on human impacts 47
Box 6: Economic loss and the SNA 53

DISASTER-RELATED STATISTICS FRAMEWORK (DRSF)
Page x Expert Group on Disaster-related Statistics in Asia and the Pacific
ABBREVIATIONS/ACRONYMS
BNPB Badan Nasional Penanggulangan Bencana (Disaster Management Agency)
of Indonesia
CRED Centre for Research on the Epidemiology of Disasters
DALA Damage and Loss Assessment
DRI Disaster Risk Index
DRM Disaster Risk Management
DRR Disaster Risk Reduction
DRSF Disaster-related Statistics Framework
DRRCA DRR-Characteristic Activities
EMDAT CRED Emergency Events Database
FDES Framework for the Development of Environment Statistics
GIS Geographic Information System
GFDRR World Bank Global Facility for Disaster Risk Reduction (GFDRR)
NDMAs National Disaster Management Agencies
NSOs National Statistics Offices
NSSs National Statistical systems
OEIWG Open-ended Intergovernmental Expert Working Group on Indicators and
Terminology relating to Disaster Risk Reduction
ODA Overseas Development Assistance
PDNA Post-Disaster Needs Assessment
SDI Spatial Data Infrastructure
SNA System of National Accounts
SEEA System of Environmental-Economic Accounting
TFMEED Task Force of Measurement of Extreme Events and Disasters
UNECE United Nations Economic Commission for Europe
UNISDR United Nations Office for Disaster Risk Reduction


DISASTER-RELATED STATISTICS FRAMEWORK (DRSF)
Page 12 Expert Group on Disaster-related Statistics in Asia and the Pacific
PART1
MAINCONCEPTSFORMEASUREMENT

DISASTER-RELATED STATISTICS FRAMEWORK (DRSF)
Expert Group on Disaster-related Statistics in Asia and the Pacific Page 13
CHAPTER 1: INTRODUCTION
Background
In May 2014, ESCAP Resolution E/ESCAP/RES/70/2 on “Disaster-related Statistics in
Asia and the Pacific”, established the Expert Group on Disaster-related Statistics in Asia and the
Pacific and requested it to develop a basic range of disaster-related statistics along with guidance
for implementation.
The ESCAP Resolution 70/2, establishing this Expert Group, recognized better use of
disaggregated data as a challenge for evidence-based disaster risk management policy in the Asia-
Pacific region. The document stressed the importance of disaggregated data related to disasters
in enabling a comprehensive assessment of the socioeconomic effects of disasters and
strengthening evidence-based policymaking at all levels for disaster risk reduction and climate
change adaptation.
Since 2005, there has been an international consensus on the need to “develop systems of
indicators of disaster risk and vulnerability at national and sub-national scales that will enable
decision-makers to assess the impact of disasters on social, economic and environmental
conditions and disseminate the results to decision-makers, the public and population at risk.” (UN
Hyogo Framework for Action, 2005, p.9).
The demand for internationally comparable methods for producing statistical evidence
for disaster risk reduction received renewed and increased attention internationally with the
adoption by the UN General Assembly of the Sendai Framework for Disaster Risk Reduction and
with prominent inclusion of disaster risk reduction targets within the UN Sustainable
Development Goals (SDGs).
The 2030 Agenda for Sustainable Development established 17 Goals and 169 targets for
the eradication of poverty and the achievement of sustainable development. In March 2016, the
47th Session of the United Nations Statistical Commission (UNSC) agreed to a Global Indicator
Framework, specifying 230 indicators for measuring progress towards the Sustainable
Development Goals. In the SDGs, there are 11 disaster-related targets, spanning many of the 17
goals, and covered by 5 indicators, including under Goal 1: “End poverty in all its forms
everywhere”, Goal 11 “Make Cities and Human Settlement, Inclusive, Safe, Resilient and
Sustainable” and Goal 13 “Take Urgent Action to Combat Climate Change and its Impacts” The
inter-agency expert group (IAEG) on SDG indicators, decided that the definitions for these
indicators would align with indicators adopted for international monitoring of the Sendai
Framework.
The Sendai Framework for Disaster Risk Reduction was adopted at the Third UN World
Conference in Sendai, Japan, in March 2015. It is the outcome of stakeholder consultations
initiated in March 2012 and inter-governmental negotiations from July 2014 to March 2015,
supported by the United Nations Office for Disaster Risk Reduction (UNISDR) at the request of
the UN General Assembly. After the adoption of the Sendai Framework, an intergovernmental
process was established to reach agreement on terminologies and indicators for monitoring the
targets of the Sendai Framework. This intergovernmental process completed and was endorsed
by the UN General Assembly in December, 2016. To help ensure cohesion between national

DISASTER-RELATED STATISTICS FRAMEWORK (DRSF)
Page 14 Expert Group on Disaster-related Statistics in Asia and the Pacific
compilations of official statistics with demands for global indicators, the terminologies used in
the DRSF are aligned with this Report. 6
The Sendai Framework contains a statement of outcome for 2030, which is to achieve a
substantial reduction of disaster risk and losses, to lives, livelihoods and health and to the
economic, physical, social, cultural, environmental assets of persons, businesses, communities
and countries. The Sendai Framework establishes four priorities for action:
1) Understanding disaster risk;
2) Strengthening disaster risk governance to manage disaster risk;
3) Investing in disaster risk reduction for resilience; and
4) Enhancing disaster preparedness for effective response and to “build back better” in
recovery, rehabilitation and reconstruction.
The targets for monitoring progress in the framework are:
1) Reduce global disaster mortality;
2) Reduce the number of affected people;
3) Reduce direct disaster economic loss;
4) Reduce disaster damage to critical infrastructure and disruption of basic services,
among them health and educational facilities;
5) Increase the number of countries with national and local disaster risk reduction
strategies;
6) Enhance international cooperation; and
7) Increase the availability of and access to multi-hazard early warning systems and
disaster risk information
A collection of 38 independent (including compound) indicators were adopted for global
monitoring of all seven Sendai Framework targets. The Sendai Framework global monitoring
indicators and associated terminologies were developed by governments and international
experts through the Open-ended Inter-Governmental Expert Working Group on Indicators and
Terminology relating to Disaster Risk Reduction (OEIWG). Two of the Sendai Framework
Indicators: Deaths from disasters and direct economic loss from disasters are included in the
SDGs.
At the 21st Conference of the Parties (COP 21) of the United Nations Framework
Convention on Climate Change (UNFCCC) in Paris (December 2015), a new agreement on
accelerating and intensifying the efforts to combat climate change was made. The work to develop
modules and procedures for the implementation of the Paris Agreement will utilize the rich
experience with the reporting and review/analysis of climate-related information and data under
the UNFCCC. The Paris Agreement requires all Parties to put forward their best efforts to address
climate change through “nationally determined contributions” (NDCs) and to strengthen these
efforts in the years ahead. The Paris Declaration also refers to the Sendai Framework and the
SDGs.
6 A/71/644: “Report of the open-ended intergovernmental expert working group on indicators and terminology
relating to disaster risk reduction”

DISASTER-RELATED STATISTICS FRAMEWORK (DRSF)
Expert Group on Disaster-related Statistics in Asia and the Pacific Page 15
UNISDR, as the custodian agency for international monitoring of the Sendai Framework
indicators, has launched an international monitoring process and online tool, called the Sendai
Monitor7 for collecting figures for the agreed international indicators from official national
sources, particularly NDMAs and NSOs.
UNISDR Technical Guidance for indicators reporting (UNISDR, 2017) was developed
following adoption of global agreement on the indicators and associated terminologies (UNGA,
2015).
One of the main objectives of this handbook is to generate statistics that are used for
calculating relevant international indicators for reporting to the Sendai Framework Monitor and
SDGs global monitoring systems. This handbook complements the guidance on indicators by
focussing on the underlying statistical infrastructure. In the case of disaster-related statistics,
this requires integration from a diverse variety of data sources and many different government
agencies. A framework is required to supply the basic data inputs used for calculating
international indicators, as well as to meet other related, but often broader and more in-depth,
information needs for policy at the national and local levels.
According to the Sendai Framework, a disaster is “a serious disruption of the functioning
of a community or a society at any scale due to hazardous events interacting with conditions of
exposure, vulnerability and capacity, leading to one or more of the following: human, material,
economic and environmental losses and impacts.” (UNGA, 2016).
For development of this handbook, the Expert Group on Disaster-related Statistics in Asia
and the Pacific consulted with a broad spectrum of disaster risk reduction and statistical experts
and with established groups and forums focussing on related topics, including: the UNECE Task
Force on Extreme Events and Disasters, UN Expert Group on Statistical Classifications, the
Advisory Expert Group on National Accounts, UN Expert Group on Environment Statistics, and
the UN Committee of Experts on Global Geospatial Information Management (UN-GGIM).
Each of the existing groups or initiatives and publications bring their own perspectives.
This handbook is an attempt to create a harmonized description of statistical requirements and
solutions with a focus on disaster risk management.
Demands for a statistical framework
Within this context of a globally agreed policy framework and global indicators
monitoring systems, governments have put increased attention to development of nationally
centralized databases for a basic range of disaster-related statistics. As development of
centralized disaster-related databases is a new endeavour in nearly all countries, there is a strong
demand for technical guidance and sharing of tools and good practices internationally.
Basic requirements for the international indicator monitoring systems include
comparability of concepts and methods for measurement across disaster occurrences. Thus,
these systems depend heavily on coordination and consistency at the national and local levels,
which can be accomplished via the adoption and application of a commonly agreed measurement
framework.
7 https://sendaimonitor.unisdr.org/

DISASTER-RELATED STATISTICS FRAMEWORK (DRSF)
Page 16 Expert Group on Disaster-related Statistics in Asia and the Pacific
Presently, countries have different practices for compiling data and preparing statistical
tables related to disasters, which makes it difficult to make comparisons or conduct time series
analyses covering multiple disasters. The DRSF has the potential to address challenges for
creating coherence across data sources and to incorporate statistics related to all types of
disasters (regardless of scale), towards a nationally centralized and internationally-coherent
basic range of disaster-related statistics.
Statistical databases are summaries of collections of raw data gathered from many
sources, including operational databases, surveys, censuses, monitoring systems, and
administrative records.
Indicators are calculated from these databases for monitoring progress and to provide
targeted information to policy-makers and the public to help inform disaster risk reduction.
Where possible, indicators should be used to identify and encourage actions to reduce risk and
create sustainable development before disasters occur. For example, indicators of disaster risk
can be developed, based on variables measuring exposure vulnerability and coping capacity and
can be used to unambiguously reveal progress with reducing overall risk of the population in a
country or region. Such indicators are built upon integration of a very broad spectrum of data and
multiple data sources, including population, social, economic and environmental data used for
estimating probabilities of hazards.
A statistical framework thus rests in the middle of the theoretical information pyramid.
The production of statistical tables inevitably involves some degree of aggregation and summary
of basic microdata, but the statistics framework also needs to be relatively complete and flexible
for calculating a broad range of indicators and for facilitating other types of analyses as well.
Figure 1.1
Information pyramid for disaster risk reduction
The goal of this framework is to produce statistical compilations that will assist
applications designed for disaster risk reduction, especially in national and international
indicators reporting, and statistical analyses as required for decision-making at national and local
levels.
Indicators
Summary statistics (DRSF)
Sources of basic data(censuses, surveys, admin. records, data collected during response, etc.)

DISASTER-RELATED STATISTICS FRAMEWORK (DRSF)
Expert Group on Disaster-related Statistics in Asia and the Pacific Page 17
Figure 1.2
National and international applications for harmonized national disaster-related
statistics
This statistical framework pertains strictly to measurement only, and does affect the
existing policies or official duties of government agencies with respect to intervening in disaster
risk management. However, implementation of the statistical framework should help national
agencies to define and implement clear requirements, roles and responsibilities across
government for collection and sharing of data, and for making statistics accessible for policy-
relevant research and monitoring purposes.
The framework should also help to identify opportunities to utilize existing data sources
within the national statistical system (NSS). In some cases, adaptions to the sources or to the way
that data are shared between agencies are needed to fit the purposes for disaster risk reduction
statistical analysis. It is usually more efficient and cost effective to adapt and reuse existing data
sources rather than to establish new collections in response to each new policy question or
indicator. Efficiency in the statistical system also needs to be balanced with the requirements
consistency and other basic quality criteria of statistical outputs.
The UNECE Task Force on Measurement of Extreme Events and Disasters (TF-MEED)8
produced a comprehensive report on the roles of national statistics office in close collaboration
with the Asia-Pacific Expert Group on Disaster-related Statistics. A principle role for statistics
offices and other government agencies is to provide the baseline (related) statistics, which are
essential for disaster-risk management.
8 https://www.unece.org/stats/ces/in-depth-reviews/meed.html

DISASTER-RELATED STATISTICS FRAMEWORK (DRSF)
Page 18 Expert Group on Disaster-related Statistics in Asia and the Pacific
The risk management cycle is a useful concept for understanding the demands for
statistics, and the various perspectives of decision-makers at the national level, and their
relationship to the data collection or analysis. While there are some overlapping statistical
requirements to support decision-making across the different phases of the cycle of disaster risk
management, there are also important differences.
Figure 1.3
Cycle of disaster risk management
Source: Diagram adapted from Thailand Department of Disaster Prevention and Mitigation (DDPM)
During an emergency, responding agencies have special requirements regarding
timeliness, accuracy and level of geographic detail to serve operational purposes in a coordinated
emergency response. The priority is to save lives and minimize other damaging effects on the
population. In contrast to these operational uses of data, statistics are used in broader risk
assessments or for monitoring impacts over time, in which case more time is available to give
attention to accuracy, comparability between sources, consistency over time, or other qualitative
characteristics of the information. Statistics are designed to provide summaries for analyses by
regions or by groups of people or businesses and are never used for identifying specific
individuals.

DISASTER-RELATED STATISTICS FRAMEWORK (DRSF)
Expert Group on Disaster-related Statistics in Asia and the Pacific Page 19
Table 1.1 provides an overview of issues faced by decision-makers and a sample of the
demand for statistics in each phase of the risk management cycle.
Table 1.1
Statistics in disaster-risk reduction decision making
Typical issues in the different
phases of disaster risk
management
Typical decisions and plans
to be made
Sample of use of statistics
‘Peace time’: Risk Assessment
• Disaster risks can be estimated
but are not known
• Development investments
should be informed by risk
profiles
• Use of best available
knowledge so that
development does not
exacerbate existing (and or
create new) disaster risks
• Prioritizing investments in risk
reduction
• How to invest in development
while avoiding new risks
• Guide policies for reducing
exposure and for vulnerable
groups (including, potentially,
via relocation outside of
hazard areas)
• Dynamic hazard profiles
(magnitude, temporal and spatial
distribution)
• Vulnerability and baseline of
exposure: (demographic and,
socioeconomic statistics) e.g.
baseline of exposure in areas
prone to hazards and identifying
vulnerable groups
• Learning from experience of past
disasters, e.g. effectiveness of
early warning systems
‘Peace time’: Risk Mitigation and
Preparedness
• Risk Profiles are changing as
new information becomes
available and development in
potentially vulnerable areas
takes place
• Early warning systems and
other monitoring systems,
where available, are delivering
information on risks and
possibilities for mitigating
impacts
• Introduction of new measures
to reduce disaster risk
• Introduction of mechanisms to
improve or ensure sufficient
early warning and adequate
preparedness
• How to invest in risk reduction
measures as an integrated part
of the broader poverty
reduction and sustainable
development initiatives
• Whether and how to
discourage development in
hazardous areas
• Scale, locations and other
characteristics of investment in
disaster risk reduction
• Signals of slowly developing risks
approaching thresholds to a
potential disaster
• Level of awareness, preparedness,
and investment against disasters
by households, businesses, and
communities
• Identifying factors that cause and
or exacerbate disaster risks, e.g.,
environmental degradation, highly
vulnerable infrastructure, or
extreme poverty.
Emergency: Response
• Imperative is to act quickly
and efficiently to save lives and
mitigate unnecessary suffering
• Sufficient scale of injection of
resources to bring crisis under
control
• Urgent demand to meet
overwhelming needs for places
where vital systems and
delivery of basic services were
affected
• Determine the geographic
scale of the disaster and
prioritize needs for emergency
relief
• How to make the response the
most efficient
• How to manage needs given
impacts to local supplies of
goods and services (how to
address temporary
interference to local services
supply)
• How to mount emergency
response while also putting in
place requirements for
medium and long-term
recovery
• Disaster occurrence, including
temporal, and spatial spread of
the event
• Disaster type and characteristics
of impacts, e.g., rapid or slow
onset, intensive or extensive
impacts.
• Immediate indication of impacts
on population, damage, losses, and
disruption of basic services
• Recovery needs, which potentially
could be increasing
• Disaster response: who, what,
where, when, and how much

DISASTER-RELATED STATISTICS FRAMEWORK (DRSF)
Page 20 Expert Group on Disaster-related Statistics in Asia and the Pacific
Typical issues in the different
phases of disaster risk
management
Typical decisions and plans
to be made
Sample of use of statistics
Medium and long-term recovery
• Yet unaddressed humanitarian
needs
• Risk that fragile communities
could regress into a new
emergency crisis if recovery
needs are not met
• Less spotlight on initial
response may translate to less
resources for recovery
• Often a normal development
policy-planning cycle resumes
with many requirements but, ,
with less available resources
due to disaster
• How to prioritize recovery of
economic sectors and
determination of appropriate
scale of re-building effort in
affected location
• How to determine appropriate
level of investment required
for complete recovery from
impacts for disasters:
• Returning to consideration of
future risk identification and
mitigation (see risk
assessment)
• Comprehensive and credible post-
disaster accounting for damage,
losses, and disruption of functions
/services
• Requirements for economic
recovery, e.g., direct and economic
losses.
• Coping capacity of communities,
localities and sectors
• New post-disaster inputs for
calculation of risk of future
incidents
Reference: Developed by Asia-Pacific Expert Group in collaboration with the UNECE TF-MEED.
The scope for demands for a basic range of disaster-related statistics and indicators can
be seen within a broader context, which also includes operational databases that are used for
emergency response (Figure 1.3).
Figure 1.4
Uses of disaster-related data
Data Collection
Hazard
Exposure
Vulnerability
Coping Capacity
Disaster Impact
DRR Activity
Ideally, disaster-related statistics will become an integrated part of the broader
sustainable development planning of the country at national and local levels. An example is the
integration of disaster risk assessments into land use planning and building resilience to disasters
as a part of the broader strategy against multi-dimensional poverty. For instance, areas identified
as having high probabilities of exposure to a hazard could be imposed with restrictions on
constructions or appropriate requirements for resilience of structures against hazards. Such
interventions could further be designed or targeted in a way that also creates additional benefits
Summary & Time
Series Statistics
• Risk Assessment
• Post Disaster
Assessment
• Indicators/Monitoring
• Empirical Research
Operational Uses
• Emergency Response
• Evacuations
• Early Warning
Systems
• Disaster Risk
Management Planning
Integrated Sustainable
Development Policy
• Infrastructure
Development
• Land use planning
• Poverty Reduction
• Economic
Development Planning

DISASTER-RELATED STATISTICS FRAMEWORK (DRSF)
Expert Group on Disaster-related Statistics in Asia and the Pacific Page 21
for poverty reduction in the relevant communities since reducing poverty can be an effective
means at building resilience to disasters, and vice versa.
Use of this handbook
This handbook provides recommendations on methodologies for how to apply
internationally agreed concepts and terminologies to production of official statistics. This
includes technical recommendations on estimation for a basic range of disaster-related statistics
used for multiple purposes, including calculation of indicators used for national and international
monitoring. Not all recommendations are applicable in all cases and in some cases the demands
for statistics require much more detail or a broader scope of measurement than what is presented
here. Thus, the basic range of disaster-related statistics can be considered as a general target for
the national statistics system for producing internationally harmonized statistics, noting that the
disaster risk or policy context in each country will likely introduce special or additional
requirements or potential measurement solutions that are specific to that country.
The remainder of Part 1 (Chapters 2-5) outlines the conceptual framework for a basic
range of disaster-related statistics, applying and interpreting the concepts from the Sendai
Framework and related references on disaster risk management for the practice of data collection
and statistical compilations. Part 2 of this handbook (Chapters 6-9) provides guidance for
implementation of the framework, including practical steps for organizing data and tools to
support the process of national integration and harmonization across data sources, such as
classifications, definitions, advice on measurement units, and summary tables as sample
compilations of the complete basic range of disaster-related statistics.

DISASTER-RELATED STATISTICS FRAMEWORK (DRSF)
Page 22 Expert Group on Disaster-related Statistics in Asia and the Pacific
CHAPTER 2: MAIN CONCEPTS FOR MEASUREMENT
A disaster is: “A serious disruption of the functioning of a community or a society due to
hazardous events interacting with conditions of exposure, vulnerability and capacity, leading to
one or more of the following: human, material, economic and environmental losses and impacts.”
-UNISDR, adopted by the UN General Assembly via the Report of the OEIWG (2016).
For each disaster occurrence, there are at least three characteristics of the event that
should be recorded in a centralized database for the compilation of basic statistics on impacts
from the disaster. The three characteristics are:
a. Timing (date, year, time and duration of emergency period)
b. Location and geographic scale (regions/provinces/country(ies) and affected area in a
GIS format, e.g. shapefile)
c. Hazard type (e.g. geological, meteorological)
In addition, each disaster occurrence has a unique identifier code for ease of reference
and querying within a multi-disaster database. There are international initiatives for unique
naming and coding of hazards, which can be utilized, where applicable, by the national agencies,
such as the GLobalIDEntifier number (GLIDE) initiative.9
Box 1: Example Recording of Basic Characteristics of Disaster Occurrence
A simple example for recording a disaster occurrence, which is used as the basis for identifying impact
statistics, can be demonstrated using a hypothetical example. Let us imagine the case of a sudden flood
disaster affecting a specific area in Central Thailand. The hazard type (flood) is indicated within the
alphanumeric code of this occurrence (FL).
Authorities in the affected area were surprised by the flood, caused by sudden intense rain, and they
called for an emergency, which lasted for 4 days, at the beginning of May. Geographic reference or
location of the disaster can be referenced according to official policy by a responsible agency in Thailand.
In this example, the hypothetical flood disaster resulted in an emergency in one district and in one
province of Thailand, called Samut Prakan. In addition, if available, a geospatial data file can be stored
within the database for mapping and recording the spatial boundaries of the hazard area, e.g., inundation
area, and/or impacts area, e.g., a contiguous area within which direct impacts were observed.
Code Geo 1 Geo 2 Geo 3 Geo 4 Em.
beginning
Em. End
(d-m-y)
Fl2018-01-
THA
Central
Region
Chao Phraya
River Basin
Samut
Prakan
Central
District
01-05-18 04-05-18
9 The GLIDE is a project initiated and maintained by the Asian Disaster Reduction Center (ADRC) in collaboration with
ISDR, CRED, UNDP, IFRC, FAO, World Bank, OFDA/USAID, La Red, and OCHA/ReliefWeb,
http://www.glidenumber.net/glide/public/about.jsp

DISASTER-RELATED STATISTICS FRAMEWORK (DRSF)
Expert Group on Disaster-related Statistics in Asia and the Pacific Page 23
These characteristics of disasters are used for making connections between variables to
develop time series statistics, such as, the long-term trends of impacts from disasters by hazard
type.
Each disaster is different, and the disaster risk context differs greatly across countries and
regions. However, by applying common broad measurement principles for identifying and
recording disaster occurrences, a degree of harmonization for the scope of measurement for
impact statistics can be achieved.
From the international definition of a disaster, two basic criteria are needed for
measurement of disaster occurrences and impacts in alignment with the international indicators
and Sendai Framework Monitor:
a. “human, material, economic and environmental losses and impacts” (i.e., observation of
significant impact)) and
b. “A serious disruption of the functioning of a community or a society” (e.g., an emergency).
Figure 2.1
From disaster occurrence to disaster impact statistics collection
For Sendai Framework Monitor, no impact thresholds are placed for observation of
disaster occurrences for compilation of the disaster impacts statistics used for monitoring the
targets. The Sendai Framework “will apply to the risk of small-scale and large-scale, frequent and
infrequent, sudden and slow-onset disasters caused by natural or man-made hazards, as well as
Disaster: “A serious disruption of the
functioning of a community or a society due to
hazardous events interacting with conditions
of exposure, vulnerability and capacity,
leading to one or more of the following:
human, material, economic and environmental
losses and impacts.”
1st Criterion: A “serious
disruption”, which creates an
action, i.e: an emergency
2nd Criterion: Objectively
observable “human material,
economic and environmental
losses and impacts”
a) Timing (date and duration
of emergency)
b) Location and scale
(country, region, district,
spatial area)
c) Hazard type (e.g.
geological,
Observation of direct
material and human impacts

DISASTER-RELATED STATISTICS FRAMEWORK (DRSF)
Page 24 Expert Group on Disaster-related Statistics in Asia and the Pacific
related environmental, technological and biological hazards and risks.” (United Nations, 2015,
paragraph 15).
An impacts threshold is an analytical tool used for analysis and comparisons. Thresholds
are a form of filtering of the broader compilation of basic statistics, to meet certain analytical
requirements or as a method of achieving some specific targeted quality characteristics of the
datasets needed for a specific purpose. As mentioned, there is no specific threshold criteria global
monitoring of the Sendai Framework indicators by UNISDR. But, threshold criteria may be useful
in other cases. For example, within EMDAT, minimum threshold criteria were defined so that the
compilations focus primarily on moderate to large-scale emergencies, of which EMDATs data
sources are likely to have relatively better-quality statistics in terms of completeness and
reliability. Such filtering of impacts thresholds can be useful for various analyses, but do not affect
the original basic compilations of data, which should contain the complete and unfiltered data.
So, referring, for example, to our hypothetical case in Box 1 of a flood in Thailand (Fl2018-
01-THA), if none of the EMDAT criteria10 is met, then this flood occurrence and its consequences
would be counted in the national database but not in EMDAT. Sendai Framework global
monitoring also does not put any specific reporting requirements regarding geographic
referencing or geographic scale. For other uses of the statistics, the geographic scale of the
emergency could be a useful standard reference for characterising the geographic scale of the
disaster occurrence.
Inconsistencies in scope of measurement for disasters, can come about because different
countries face risks from a different group of hazards. Some hazards are common only in tropical
or non-tropical climates, some affect only coastal areas or areas with hills or mountains. Thus,
current national databases for classifying hazards types, vary from country to country. Many
countries have an officially adopted list of hazard types and definitions inscribed into the national
laws for disaster response. In these cases, the scope of official data collections (and metadata)
should align with the scope and terminology from the national laws.
National agencies are encouraged to follow the scope of hazards defined for Sendai
Framework monitoring. This recommendation is to report nationally aggregated statistics
according to the overall coverage of IRDR Peril Classification and Hazard (IRDR, 2014), and for
two additional categories of hazards defined for the Sendai Framework: environmental hazards
and technological hazards (see Chapter 8 for complete discussion). For all cases, a formal
glossary of the hazard types should be published as part of the core metadata alongside the
statistics.
An emergency (at local, national or regional level) is a common signal or indicator of a
disaster occurrence and its timing. Emergencies, whether declared or undeclared, can take a wide
variety of forms depending on the type of hazard and laws and administrative policies of the
responsible government. Standardization of emergency declarations policy is not necessary for
the compilation of statistics. However, a general acknowledgement of an emergency situation by
officially responsible agencies is usually the catalyst that triggers collection of official data on the
impacts of an emergency situation. This aligns well with the concept of an acknowledgement of
10 EMDAT Criteria is: ten (10) or more people reported killed, or Hundred (100) or more people reported affected, or
Declaration of a state of emergency, or Call for international assistance

DISASTER-RELATED STATISTICS FRAMEWORK (DRSF)
Expert Group on Disaster-related Statistics in Asia and the Pacific Page 25
abnormal disruption, according the norms and standards of the country, and a basic criterion in
the international definition for a disaster.
The UN World Health Organisation (WHO) defines an emergency as a managerial
decision or response in terms of extraordinary measures. A “state of emergency” demands to “be
declared” or imposed by somebody in authority who, at a certain moment, will declare a state of
emergency. Thus, the emergency is usually defined in time and space, as … it implies rule of
engagement and an exit strategy.” (WHO Glossary). Thus, in contrast to a disaster occurrence, an
emergency, if applicable, has a specific duration of time.
A characteristic that causes the nature of emergencies to vary is the situation of either a
sudden or slow-onset disaster (see Chapter 8). Sometimes, for slowly evolving risks leading to
a disaster, the emergency response may take the form of initiating collection of data for
monitoring the situation, followed by implementation of a series of preventative measures (such
as evacuations or other responses to boost coping capacity and minimize impacts). For other
emergencies, especially sudden or unexpected hazards, there is more likely to be an explicit
emergency declaration or request for rapid mobilization of resources for response.
Box 2: Sudden and slow-onset disasters
Recall, previously, in our hypothetical scenario, the central district of Samut Prakan, Thailand,
experienced sudden flooding in May 2018 which also surprised the authorities. Meanwhile, imagine
there is also an area of northeastern Thailand, which had not received rain for many months, causing
significant hardship and significant losses to agricultural production in that region. By June, the
hardships and risk caused local and national authorities to initiate an urgent programme to collect data
on the current impacts and to analyze future risks.
Although there may not have been a specific emergency call, an unusual disruption was observed in Roi
Et, and action has been taken to record observations on the impacts. Thus, the slow onset drought
disaster can now be recorded and classified in official records in the hypothetical sample below.
Code Geo 1 Geo 2 Geo 3 Geo 4 Em.
beginning
Em. End
(d-m-y)
Fl2018-01-THA Central
Region
Chao Phraya
River Basin
Samuth
Prakhan
Central
District
01-05-18 04-05-18
Dr2019-01-
THA
Northeast Mekong Roi Et 01-06-18 01-06-18
Basic range of disaster related statistics
Collection of statistics related to disasters is applicable for disasters of any scale or
magnitude and there is a clear demand for a nationally coherent measurement framework for
application at different scales. (UN, 2015, Paragraph 15, ibid).
Components of the basic range of disaster-related statistics are shown in Figure 2.2.

DISASTER-RELATED STATISTICS FRAMEWORK (DRSF)
Page 26 Expert Group on Disaster-related Statistics in Asia and the Pacific
Figure 2.2
Components of the Disaster-related Statistics Framework (DRSF)
The boxes in this Figure 2.2 represent a useful way of broadly organizing the basic range
of disaster-related statistics, but there are also data that have multiple uses in analysis and
therefore may appear in multiple components. Since there are relationships between these
components, there are advantages of having a centralized database that covers all components of
disaster-related statistics.
Nearly all elements in Figure 2.2 can be measured, or estimated, from direct observation
and incorporated into a centralized database of disaster-related statistics. One exception is the
measurement of indirect impacts from disasters, which are characterized as consequences of a
disaster. These need to be estimated via application of assumptions or other type of modelled
scenario analysis to estimate a quantified range of values for indirect consequences to the
economy or other changes to social conditions after a disaster.
The basic demands for disaster impacts statistics include reviewing the trends across
occurrences for risk assessment, which may require analysis over a long period (perhaps 50-100
year trends). Thus, it is critically important that the counts and descriptive characteristics of
disaster occurrences are produced consistently over time and across different occurrences.

DISASTER-RELATED STATISTICS FRAMEWORK (DRSF)
Expert Group on Disaster-related Statistics in Asia and the Pacific Page 27
CHAPTER 3: DISASTER RISK
Background
Improved utilization of official statistics for understanding disaster risk is the basic
motivation for the development of a DRSF and its implementation in national statistical systems.
Improved understanding of risk is also the number one priority of the Sendai Framework.
Disaster risk “is the potential loss of life, injury, or destroyed or damaged assets which
could occur to a system, society or a community in a specific period, determined probabilistically
as a function of hazard, exposure, vulnerability and capacity.” (UNISDR, 2017).
Disasters are the outcome of present conditions of risk, including exposure to a hazard
and the related patterns of population and socioeconomic development. (United Nations, 2015).
These risks are geographically concentrated and unevenly distributed (Birkman, 2013).
Measurement must account for extreme variability of risk with a broad coverage of the land and
population while also producing disaggregated statistics for relatively high-risk hotspots.
Paragraph 6 of the Sendai Framework covers the issue of risk drivers: “More dedicated
action needs to be focused on tackling underlying disaster risk drivers, such as the consequences
of poverty and inequality, climate change and variability, unplanned and rapid urbanization, poor
land management and compounding factors such as demographic change, weak institutional
arrangements, non-risk-informed policies, lack of regulation and incentives for private disaster
risk reduction investment, complex supply chains, limited availability of technology,
unsustainable uses of natural resources, declining ecosystems, pandemics and epidemics.”
Disaster risk is dynamic and its measurement is captured, in part, by common work of
NSOs and other providers of official statistics at the national level. Areas of statistics covered
include: demographic changes, poverty and inequality, structure of the economy, expenditure,
economic production, conditions of ecosystems, and land management.
The focus in the DRSF is to clarify the role of official statistics and how they can be made
as accessible as possible for risk assessments.
Two complementary types of risk assessment have been observed internationally
(Bikman, 2013): risk indices and hotspots. Disaster risk indices (DRIs) can be developed for
individual hazard types (e.g. for floods or cyclones) or multi-hazard risk, i.e. an index covering
multiple hazard types. High risk areas will vary in geographic scale and do not align specifically
with administrative boundaries used by governments. The hotspots approach thus follows a
similar model that has been used in the domain of biodiversity and focuses on applying analyses
at a more geographically detailed level, utilizing data that can indicate relatively high levels of
likelihood for hazards overlain with geographic information on exposure and vulnerabilities.
Example of risk indices ares the World Risk Index (WRI) of United Nations University
World Risk Reports,11 the Inform Index for Risk Management12 (sample below), and UNDP’s
11 https://ias.unu.edu/en/
12 http://www.inform-index.org/

DISASTER-RELATED STATISTICS FRAMEWORK (DRSF)
Page 28 Expert Group on Disaster-related Statistics in Asia and the Pacific
Disaster Risk Index (DRI).13 An example of a risk hotspot would be an area with relatively high
probabilities of hazard coupled with specific vulnerabilities or low resilience in case of disasters.
Sample of National Scale IMPACT Index Score for Disaster Risk
Source: www.inform-index.org
Modern analyses of disaster risk incorporate both approaches through geographically
disaggregated statistics and analysis using hazard profiles coupled with geographic information
systems (GIS). An advantage of the GIS-based production of statistics for risk assessment is the
potential to apply the methods to produce summary statistics at different geographic levels, e.g.
at the global, regional or national level, and for hotspots.
Many interesting examples are emerging, for example the disaster management agency
of Indonesia (BNPB), is tracking statistical information on exposure of population, as well as for
economic activities (derived from local tax revenue records) and on children (from
administrative records on enrolment in schools) in relation to the hazard areas of the country.
Scope of measurement
In the literature and current practice of many disaster management agencies, disaster risk
is defined for measurement according to three core elements: exposure to hazards, vulnerability
and coping capacity.
���� � �������������, ������������, �������
13http://www.undp.org/content/undp/en/home/librarypage/crisis-prevention-and-recovery/reducing-disaster-
risk--a-challenge-for-development.html

DISASTER-RELATED STATISTICS FRAMEWORK (DRSF)
Expert Group on Disaster-related Statistics in Asia and the Pacific Page 29
This basic definition for measurement of risk has also been known as the PAR model
(Birkman, 2013). Risk of impacts from a disaster is not driven only by the magnitude14 of the
hazard (e.g. force of energy of the earthquake or category of storm) but also by social factors that
create exposure, vulnerability and coping capacity (UNISDR, 2015).
Statistics for disaster risk assessment are developed by the assimilation of datasets in
geographic information systems (GIS) and by integration of the relevant data sources for risk
mapping. Risk maps are used to produce functional maps but also statistical tables summarizing
risks faced for a given study area and to show relative degrees of risks across geographic areas.
Integration and assimilation of data in GIS makes it possible to produce time series information
in ways that were not previously possible, such as estimation of exposure to hazards.
Figure 3.1
Grid-based data assimilation
Source: Weber, CBD (2014)
Estimating exposure to hazards
There are two main elements to measuring exposure to hazards; These are:
a. a probabilistic map of the hazard and
b. a complementary map of the population, critical infrastructure (and other objects of
interest such as high nature value ecosystems) on the exposure side.
The mapped area meeting of overlap is the exposure to hazards measurement. Producing
statistics that can be used for estimating the exposure to various hazards is one of primary
14 Magnitude, as the term is used here, refers to the hazard (rather than disaster) and is distinctly different from the
geographic scale of a disaster (discussed earlier) or the scale of impacts. Note, also, that neither information on
magnitude of hazards nor on scale of disasters are relevant for international indicators reporting for the Sendai
Framework Monitor.

DISASTER-RELATED STATISTICS FRAMEWORK (DRSF)
Page 30 Expert Group on Disaster-related Statistics in Asia and the Pacific
responsibilities of national statistics offices (particularly from national population and housing
censuses).
Figure 3.2
Exposure to hazards
Hazard mapping
For hazard mapping, many variables can be relevant and are usually available from the
official sources of disaster management, meteorological and geographic information for a country
or region of a country.
A collection of the spatial, intensity, and temporal characteristics for a set of potential
hazards is known as a hazard catalogue. There are various approaches to developing maps of
potential hazards, depending on the type of hazard and the approach used to assess probabilities
of a hazard occurrence.
Deterministic risk models are used to assess the impact of specific events on exposure.
Typical scenarios for a deterministic analysis include examining past historical events, worst-case
scenarios, or possible events that reoccur at different times. A probabilistic risk model contains a
compilation of all possible “impact scenarios” for a specific hazard and geographical area. A goal
for probabilistic hazard modelling is a convergence of results and for this a long-time series of
input data is usually necessary. A simulation of 100 years of hazard events is usually too short to
determine the return period for most hazard types, particularly infrequent hazards such as a
tsunami.
Hazard mapping is usually the responsibility of disaster management and specialized
scientific agencies monitoring underlying phenomena associated with different types of hazards,
e.g., geological and hydrological authorities. There is currently a lack of international
standardized approaches or guidance materials for hazard mapping. However, it is important that
users of disaster-related statistics are aware of the basic methodologies and availability of hazard
maps. Therefore, hazard mapping, particularly for use in producing statistics for disaster risk
management is recommended for the DRSF list of topics for further study.

DISASTER-RELATED STATISTICS FRAMEWORK (DRSF)
Expert Group on Disaster-related Statistics in Asia and the Pacific Page 31
Sample for flood hazard frequency and distribution map for Thailand and
surrounding areas
Reference: Center for Hazards and Risk Research - CHRR - Columbia University Center for International Earth Science
Information Network - CIESIN - Columbia University. 2005. Global Flood Hazard Frequency and Distribution. Palisades,
NY: NASA Socioeconomic Data and Applications Centre (SEDAC).
The above sample, part of a global map from Colombia University and NASA-SEDAC is
based on a database on historical flood hazard occurrences. Building on this mapped information
on past occurrences, hazard maps should be developed, incorporating a variety of predictive
variables available as spatial datasets, such as digitized elevation models and average
precipitation. National agencies have a crucial responsibility to produce and regularly update
hazard catalogues for their countries at suitable levels of resolution for use in informing national
and local risk reduction policies.

DISASTER-RELATED STATISTICS FRAMEWORK (DRSF)
Page 32 Expert Group on Disaster-related Statistics in Asia and the Pacific
Box 3: Hazard and risk mapping example: BNPB-Indonesia InaRISK
The BNPB Indonesia example provides a good practice example of the types of data inputs
likely to be needed for hazard mapping, such as:
a. Knowledge of the distribution of
soil-type to model the spatial
variation of ground acceleration
from an earthquake,
b. Water supply and use balances and
other statistical information used
for tracking the hydrological cycle
and use of water in the economy
c. Values for surface roughness to
define the distribution of wind
speed from a tropical cyclone;
d. A digital elevation model (DEM) to
determine potential flood height or
other hazard features.
InaRISK is risk analysis information for
Indonesia covering each of the core risk
factors: hazard exposure, vulnerability,
capacity. The method employs data
analyses across space, utilizing a
gridded assimilation approach to
predict probabilities for impacts from
disasters, including: potential of losses
life, financial losses, physical damage, and exposed natural resources. The assessments are
conducted for 9 different types of hazards, with varying characteristics in terms of frequency
and possibility of advanced warning.
Source: BNPB-Indonesia, 2016
There are a variety of software tools and other resources available for probabilistic
hazard modelling software, by hazard type or for multiple hazards. The following were identified
through the Expert Group’s study:
• The Australian Government’s Earthquake Risk Model,
http://www.ga.gov.au/scientific-topics/hazards/earthquake/capabilties/modelling
/eqrm
• BNPB Indonesia’s InARisk, http://inarisk.bnpb.go.id/
• Probabilistic Risk Assessment Platform (CAPRA), http://www.ecapra.org/
• European Commission Joint Research Centre Flood Hazard Maps,
http://data.jrc.ec.europa.eu/collection/floods
• European Plate Observer System (EPOS) Seismic Hazard Portal,
http://www.seismicportal.eu/
• Institute of Remote Sensing and Digital Earth (RADI) and Chinese Academy of
Sciences (CAS) Drought Mechanism
• Hazard elements in the Index of Risk Management (INFORM)

DISASTER-RELATED STATISTICS FRAMEWORK (DRSF)
Expert Group on Disaster-related Statistics in Asia and the Pacific Page 33
• UNISDR Global Assessment Report on Disaster Risk Reduction (GAR),
http://www.preventionweb.net/english/hyogo/gar/2015/en/home/data.php
• OpenQuake Platform, by the GEM Foundation, https://platform.openquake.org/
• Rapid Analysis and Spatialisation of Risk (RASOR), http://www.rasor-project.eu/
• U.S. Environmental Protection Agency’s CAMEO, https://www.epa.gov/cameo
The outputs of hazard analyses include:
• Location and extent for geographical analysis of hazards,
• Frequency and duration for temporal analysis of hazards,
• Scale and intensity for dimensional analysis of hazards,
• Probability of occurrence of hazards, and
• Physical, economic, environmental and social vulnerability factors.15
According to IPCC, three changes are likely to be observed for climate-related hazards for
some geographic regions because of rising global temperatures: increases in frequency, severity,
and decreased predictability of hazards. Thus, climate change has contributed to the dynamic
nature of hazards, as an input into the formula for assessing risk.
Exposure statistics
For the exposure side of hazard exposure estimation, the objective is to measure people,
housing, buildings (or built-up areas), transportation facilities and other infrastructure, land use,
production capacities and other potentially important variables located in the hazard areas, such
as important ecosystems, crop areas and economic data for assessing exposure of economic
assets and activities.
Exposure statistics have dual purposes. In addition to one of the three basic metrics for
disaster risk, exposure statistics also are used as baseline statistics for assessing impacts after a
disaster, (e.g. for estimating the value of economic impacts).
15 European Commission (2010)

DISASTER-RELATED STATISTICS FRAMEWORK (DRSF)
Page 34 Expert Group on Disaster-related Statistics in Asia and the Pacific
Box 4: Pilot tests for an approach to population exposure statistics
A methodology was developed and
tested among Expert Group countries
during 2016 and 2017 for estimating
population exposure using the available
population data from census authorities.
A step-by-step manual was produced
describing the steps to replicate the
output statistics for any country (or
region). Pilot tests of the methodology
utilizing publicly available census data,
processed satellite imagery in the form
of a new product from the German
Aerospace agency (DLR) called the
Global Urban Footprint (GUF), and maps
of land cover, and hazard maps found from various international sources on the internet. The data were
integrated in GIS and used to produce test estimates for population exposure to hazards in 6 countries:
Bangladesh, Fiji, Indonesia, the Philippines, Republic of Korea, and Thailand. This method was
developed, and pilot tested among countries in Asia and the Pacific to demonstrate the possibilities for
applying census statistics for estimating exposure to hazards for analysis at different scales, based on
the available population data by administrative region (which can be accessed from national statistics
offices at different scales, depending on the country).
The image reveals a sample output utilizing a hazard map (shaded areas) for floods produced by
CIESIN/SEDAC (reference above) combined with the ESCAP pilot gridded population density estimates
(yellow-orange-red) based on population census from Thailand National Statistics Office and the GUF.
See the Expert Group website (http://communities.unescap.org/asia-pacific-expert-group-disaster-
related-statistics/content/drsf) for complete description of methodology and the manual.
The same basic principles of assimilation of data with hazard maps with population and
social data (see, e.g., Box 4) apply to information about the physical infrastructure. Geospatial
data on location of critical infrastructure and land cover, including agricultural areas by type of
crops and various types of ecologically important areas, e.g., protected areas are fundamental
inputs used for assessing exposure to hazards before a disaster and as baseline referencing for
assessing impacts after a disaster.
Hazard exposure statistics can be presented in the form of maps that can be simply
converted into standardized statistical tables, such as in the example shown in DRSF Table B1a
(see Annex).
Vulnerability
The Sendai Framework recommendations adopted by the UN General Assembly in 2016
defined vulnerability as “the conditions determined by physical, social, economic and
environmental factors or processes which increase the susceptibility of an individual, a
community, assets or systems to the impacts of hazards.”
If the statistics used in vulnerability assessments are gathered and updated on a regular
basis by geographic regions, and specifically for hazard areas within countries, disaster

DISASTER-RELATED STATISTICS FRAMEWORK (DRSF)
Expert Group on Disaster-related Statistics in Asia and the Pacific Page 35
management agencies would have a priori information on extent and specific locations (among
other characteristics) of vulnerability for developing targeted disaster risk reduction or response
strategies at local and national levels, in alignment with the overarching objective of SDGs and of
not leaving anyone behind.
There are many social-economic factors affecting vulnerability such as age of a person at
the time of the disaster, or persons with disabilities which can be significant in situations where
physical fitness is necessary for survival. Gender can be a factor, for example due to emergence
of violence and sexual abuse after disasters. Poverty, which correlates with less healthy and less
safe environments and poor education is another possible factor.
There are also many forms of disaster vulnerability that are derived from the context of
the infrastructure or other characteristics of the built landscape. For example, poor access to
freshwater and to adequate sanitation facilities are factors of disaster vulnerability and an area
where basic services will be urgently required for restoration and recovery after a disaster. These
factors may be particularly significant for women and girls.
Vulnerability is an extension of initial exposure statistics by adding statistics on relevant
characteristics, or disaggregation of the population, infrastructure or land uses exposed to a
hazard, such as the elements in tables B1a and B1b (see Annex), i.e., by sex, age, income, and
disability.
A short list of basic variables likely to be factors for vulnerability measurement in risk
assessment, should include:
• Median household disposable income;
• Education enrolment, by age group and level of achievement and by male and female
heads of households;
• Information on assets of households, such as type of dwelling;
• Other human development statistics, by age group, including evidence related to
nutrition and childhood health;
• Type of employment, e.g., identifying households engaged in agriculture or fishing; and
• Urban versus rural distribution of affected or exposed areas
A variety of characteristics of individuals may combine in complex ways to create
vulnerabilities to a disaster where it otherwise might not have existed. Thus, it is important to
produce statistics the basic social and demographic characteristics of populations, especially in
high risk areas. An important example of an element of complex (or intersectional) sources of
vulnerability is gender.
Gender and disaster vulnerability
Gender intersects with a range of other socio-economic factors affecting vulnerability. Gender
refers to the social norms that shape the behaviours and roles that women and men, girls and
boys, are expected to play in any society. The expectations, power and influence of women and
men differs between societies, and typically changes over time. Gender is therefore an essential
factor to be considered in how people experience and are affected by disasters. It often interacts
with other factors, such as socio-economic status, to increase or decrease vulnerability. For
example, in some settings, women and children may be more vulnerable than men to the impacts

DISASTER-RELATED STATISTICS FRAMEWORK (DRSF)
Page 36 Expert Group on Disaster-related Statistics in Asia and the Pacific
of disasters because of having less access to and control of resources or a lesser role in decision-
making before, during and after an event.
Gender must be a key determinant in any disaster related vulnerability assessment
However, sex-disaggregated data on the effects of natural hazards on mortality and morbidity are
currently available only for a small number of cases, mostly from research literature. Adequate
monitoring of the impacts on the lives of women and men may require that some data
disaggregated by sex and age are recorded for smaller areas of a country. Therefore, sex and
geographic disaggregation is an important area for further development of disaster-related
statistics by NSOs and NDMAs.
Disasters have different effects on women, men, girls and boys. Gender roles and norms
also play an important role in the aftermath of disasters, including in terms of access to
livelihoods and participation in reconstruction efforts.
Additional dimensions associated with gender that impact vulnerability status include
safety and security associated with increases of the prevalence of sexual and physical violence
and harassment in situations of instability, such as post disaster settings, and barriers to
participating in decision making. Climate-change related drought is known to drive increases in
child marriage rates among the most vulnerable communities, as parents are more likely to
choose to marry their daughters off much earlier in exchange for dowries for survival.16 Exposure
to violence may render women survivors physically and psychologically unable to fully engage in
disaster recovery. Prevalence of sexual or physical violence and the presence of gender
inequalities in post-disaster recovery processes are perpetuated partly due to women’s limited
participation in decision making, including for designing and shaping public governance
institutions and recovery plans that involve women in assessing risk and setting up inclusive
prevention strategies.
Children are more vulnerable than adults because they are dependent and less skilled to
deal with the physical, emotional and psychological impacts of disaster. Young girls may be
particularly at risk during times of disaster as they are often more dependent or protected than
boys and may be seen as an asset or a liability depending on the circumstances. Older women and
men are also vulnerable due to dependency and have needs that must be considered in disaster
risk management. Evidence suggests that women live longer than men, and in ageing societies, the
population affected by a disaster is likely to compose of elderly women in larger numbers. Studies of
ageing populations have revealed location and type of residence can be a good reference for
assessing vulnerability for the elderly, especially in cities.
Explanations of the differences between female and male mortality during the 2004
tsunami, for example, have been formulated in terms of gender. Women’s and girls’ higher
vulnerability was associated with lower access to information, the lack of life skills such as
swimming ability, constrained mobility outside their home, and the increased vulnerability of
women staying home with children at the time of the sea-level rise. Gender differences were not
the only factor. The physiological attributes of females and males at different ages have a
substantial impact on vulnerability during tsunamis. For example, a quantitative assessment of
sex and age differences in mortality based on a longitudinal survey before and after the tsunami
in Indonesia showed that some of the explanation lies in differences in physical strength, stamina
16 https://www.theguardian.com/society/2017/nov/26/climate-change-creating-generation-of-child-brides-in-africa

DISASTER-RELATED STATISTICS FRAMEWORK (DRSF)
Expert Group on Disaster-related Statistics in Asia and the Pacific Page 37
and running and swimming ability. Overall, prime-age males were the most likely to survive the
tsunami because they were the strongest. Their presence in the household at the time of tsunami
also had a protective effect on the survival of wives and children. 17
In some contexts, women’s ability to cope after disasters may also be less than that of men
because of their limited economic empowerment. Evidence shows that women are less likely than
men to own productive assets, including land and machinery and are therefore more dependent
on natural resources, which might be compromised because of disasters. They are less likely than
men to have a bank account and access to financing, which limits their flexibility in responding to
financial constraints. In single-headed households, women are more likely to have custodianship
of children and therefore incur in additional expenses and responsibilities.
Household survey data indicates that in four of every five households (80 per cent)
without water on premises, it is women and girls who oversee water collection, and a large share
of them also bear the burden of collecting firewood and fodder18. In addition, in heavily
agriculture-dependent areas in Africa and Asia and the Pacific, women are much more likely than
men to work in the agricultural sector. When water sources, land and forests are affected byf
natural disasters, women and girls are more likely to see their livelihoods compromised and are
often forced to spend more time carrying out these tasks, which impinges on their available time
for paid employment, education and leisure.
Physical vulnerability
Vulnerability applies not only to individuals or households, but also infrastructure, which
is sometimes called “physical vulnerability”. In most cases, physical vulnerability also stems
from other social-economic or environmental problems. Relatively poor households often have
little choice other than to accept relatively less resilient shelters in their dwellings or work places.
Moreover, poorer communities, such as slums19 or lower income areas of urban sprawl, are often
the most likely to be situated in areas with high exposure to hazards.
Physical vulnerability also applies to descriptions of land and water bodies. Although
pollution in water bodies is generally considered an environmental problem, in the context of
disaster risk, pollution also causes social and economic vulnerability because, in the case of a
disaster, it can lead to significantly worse impacts to human lives and health and to the economic
costs of recovery.
The 2010 World Development Report (World Bank, 2010), focusing on climate change,
stated that “natural systems, when well-managed, can reduce human vulnerability”. Examining
and supporting cases of positive synergies between environmental protections, also called ‘pro
poor environmental policies’ is one of the objectives for the United Nations Poverty and
Environment Initiative (PEI). Wherever environments are heavily polluted or degraded, it is
often the relatively poor populations that are more likely to be disproportionately affected and,
therefore, more vulnerable in the event of a disaster.
17 Oxfam International, 2005 for India and Indonesia
18 UN Women’s SDG report on gender, page 105 (analysis from MICS and DHS surveys)
19 A slum household suffers: lack of access to improved water source, lack of access to improved sanitation facilities,
lack of sufficient living area, lack of housing durability or lack of security of tenure (UN-Habitat,2016)

DISASTER-RELATED STATISTICS FRAMEWORK (DRSF)
Page 38 Expert Group on Disaster-related Statistics in Asia and the Pacific
Population density and geographic location are the basic dimensions of exposure
measurement, but they also can be factors for vulnerability. Many rural communities face
marginally higher vulnerabilities due to the generally poorer access to transportation, health
facilities, and other types of critical infrastructure or support services. The largest share of people
living in poverty also tends to be in rural areas in developing countries. On the other hand, other
facets of rural communities, such as informal community support systems, can be sources of
resilience.
High population density is the defining characteristic of the urban centres, particularly in
the high-population megacities, many of which are in coastal zones or otherwise hazardous
locations. This is particularly the case in Asia and the Pacific, where high population density is
common. While there are social benefits to having large groups of people concentrated within
small geographic areas, such concentrations can be inherently vulnerable to impacts from
hazards, especially in urban slums.
There are also macroeconomic vulnerabilities including, diversity of the economic
structure, and importance of particular sectors, such as agriculture or fishing.
Coping capacity
Coping capacity is reflected in many factors related to the resilience of households,
businesses, communities, social-ecological systems, and whole countries against external shocks
in the form of a disaster. This is the ability of households or businesses or infrastructure to
recover from external shocks without sustaining major permanent negative impacts, and instead
moving towards opportunities for improvements in the future, e.g., “building back better”.
Many strategies for coping with disasters are informal and not managed by governments,
and therefore difficult to measure. For example, one of the coping mechanisms in the case of
drought or other types of climate or hydrological-related hazards is migration, either
permanently or temporarily, in search of a livelihood outside the worst affected areas. Population
movements that correspond with a disaster can sometimes be captured via statistics from
population censuses or population administrative records. It is more difficult to attribute
movements specifically to hazards or a past disaster.
There also are coping mechanisms which can be captured by statistics based on
government records, e.g. expenditures or from surveys of preparedness of households or
businesses in potentially exposed areas.
Household preparedness to disasters can be measured from household surveys, for
example. After major earthquakes struck the Canterbury province of New Zealand, survey results
revealed significant increases in disaster preparedness of households. e.g., rationing emergency
food and water storage. The New Zealand General Social Survey20 asked New Zealanders about a
range of factors of basic preparedness for disasters and found significant differences in results
for the factors studied across regions and over time.
20 http://archive.stats.govt.nz/browse_for_stats/people_and_communities/well-being/nzgss-info-releases.aspx

DISASTER-RELATED STATISTICS FRAMEWORK (DRSF)
Expert Group on Disaster-related Statistics in Asia and the Pacific Page 39
Figure 3.3
Households with household emergency plan, by region, 2008 and 2010
Disaster management agencies need to consider the best available risk information to
design and implement activities to reduce the impacts of disasters, including through educational
programmes, early warning, systems, and other methods for strengthening resilience through
improved preparedness.
People are not equally able to access the resources and opportunities (or knowledge and
information about hazards). The same social processes involved in the disadvantages of poverty
(or other sources of vulnerabilities) can also have a significant role in determining their level of
preparedness and access to information and knowledge. (Wisner et al., 2003).
Example Statistics on percentages of households attending training or simulations
in hazard areas
Source: BNPB-Indonesia, 2013
The example above comes from a study of disaster preparedness in Padang City of
Indonesia. These types of statistics should also be disaggregated, where feasible, by sex, age,
income groups, disability and for urban and rural areas. Table B3 (Annex) is a sample list of
relevant statistics by geographic regions for coping capacity assessment.

DISASTER-RELATED STATISTICS FRAMEWORK (DRSF)
Page 40 Expert Group on Disaster-related Statistics in Asia and the Pacific
CHAPTER 4: IMPACTS STATISTICS
Background
The Sendai Framework Monitor and associated Technical Guidance (UNISDR, 2017)
provides explanatory guidance and the scope of reporting requirement for inputs into aggregated
analyses and monitoring of progress for indicators on disaster impacts at the international level.
Other references and tools preceded the global Sendai Framework Monitor, and they
complement it as related references or additional sources of statistics, such as: DesInventar21 ,
the European Union-JRC Working Group on Disaster Damage and Loss Data22, UNISDR Global
Assessment Reports (GAR)23, EMDAT24, SIGMA from Swiss Reinsurance and NatCat from Munich
Re25, and IRDR Guidelines on Measuring Losses from Disasters (IRDR, 2015).26.
Post disaster needs assessments (PDNAs) are a form of post-disaster analyses, designed
to provide information and the overall picture of costs and estimated needs for recovery,
especially following large disasters.
Impacts statistics are the inputs for conducting post disaster assessments and for
computing indicators, brought together in common compilations, commonly known as loss and
damage databases.
The objectives in the DRSF are to synthesize and elaborate, where relevant, current
international guidance and provide recommendations or suggested good practices to improve
coverage and consistency in the collections of basic statistics across and for all types of disasters.
Attribution of impacts
The classic challenge for producing impacts statistics is the attribution of particular data
to a disaster. This is a direct causal relationship, and statistical reference to a disaster. For
example, a fatality can be attributed as death from a disaster if it was caused by one of the
nationally identified hazard types. Not all cases will be equally clear attributions, therefore a
minor statistical error can be expected in disaster impact statistics due to challenges with
attribution.
Traditionally, data on direct impacts focussed on observations in the disaster area
immediately after a disaster. However, direct impacts can take a variety of forms, including
sudden and immediate impacts but also delayed consequences, (e.g. buildings collapsing or
21 Under transformation into Desinventar-Sendai, see: https://www.desinventar.net/
22 European Commission-JRC (2015)
23 GAR is a series of assessment reports released by UNISDR, see: https://www.unisdr.org/we/inform/gar
24A database of disasters and disaster impacts with global coverage and covering the period from 1900 to present,
www.emdat.be
25 Sigma and NatCat Armenia proprietary datasets available through paid subscription
26 IRDR (2015), Guidelines on Measuring Losses from Disasters: Human and Economic Impact Indicators (IRDR DATA
Publication No.2), Beijing: Integrated Research on Disaster Risk

DISASTER-RELATED STATISTICS FRAMEWORK (DRSF)
Expert Group on Disaster-related Statistics in Asia and the Pacific Page 41
demolished several weeks after an earthquake, persons dying from injuries weeks or months
after the event). Modern statistical systems can produce statistics on a much broader range of
impacts and do not depend only on what could be observed and recorded during or immediately
after an emergency.
Core sources for impacts statistics
A general checklist of steps or methodological approaches can be summarized for impacts
statistics as observed from current practices in national statistical systems:
a. Initially, disaster management agencies observe and assess direct impacts during and
immediately after an emergency as a part of the disaster response. These initial
observations can be summarized and converted into statistics, e.g. aggregated by
geographic area.
b. Baseline, or background, statistics for the location of the disaster, such as basic
characteristics of infrastructure and population known prior to the hazard can be
used to complement the initial observations by disaster management agencies and
assist in the production of complementary metrics used for impacts statistics.
Background statistics provide contextual information to convert some of the initial
observations of damages or other disruptions into comparable units of measurement,
to develop appropriate aggregations and disaggregation.27
c. Review of the outputs of monitoring instruments, like remote sensing imagery from
satellites or local tracking of basic services or other economic activities is one of the
important types of background statistics, particularly for disasters. Interpretation of
remote sensing imagery is a crucial tool for assessing impacts, including estimating
the extent of losses and for deepening the understanding of how risk factors
contributed to the disaster. Other types of monitoring systems, such as collections of
reports to response or to insurance agencies may be a source of data on disruptions
to basic services.
d. Not all impacts can be observed directly, thus another crucial step involves
compilations of regular sources of time series statistics within the national statistical
system, such as the population and housing census, business surveys, and
compilations of other records of economic activity, which can be used to evaluate
trends (before and after the disaster) and estimate statistics on the impacts. This
includes trends for estimating indirect impacts, such as effects on GDP or for analyses
of links with population movements.
Damage and loss database structures
National databases need to adopt a clear and specific structure for organizing the
components of impacts and related signifiers or metadata. Figure 4.1, is a version of a database
model from the European Commission-JRC (2015). This model demonstrates the recommended
general approach for structuring the integration of multiple datasets related to disaster impacts
across disaster occurrences in a centralized national database.
In this modified presentation of the European model, each box constitutes an individual
compilation of data and metadata, which are linked to the unique event ID and therefore may be
27 For example, baseline statistics on the economy in the affected area, like average values of agricultural production,
are used to estimate economic loss

DISASTER-RELATED STATISTICS FRAMEWORK (DRSF)
Page 42 Expert Group on Disaster-related Statistics in Asia and the Pacific
instantly queried according to the basic characteristics of disasters, i.e., timing, location,
geographic scale of emergency, and hazard type.
Figure 4.1
Database model for disaster impacts statistics
Source: adapted version of a diagram in European Commission-JRC (2015)
Time series aggregation
The recommendation for compilation of impact statistics used for producing indicators
or in time series analysis is to make compilations on an annual basis, at minimum (see also IRDR,
2015), and the Sendai Framework Monitor is collecting impacts statistics as annual aggregations
for each year within its scope.
Aggregation for time series analyses, or for analyses by hazard types or location, means
the statistics are no longer attached to a specific disaster occurrence, but the basic data are
retained within the nationally centralized database according to the basic structure in figure 4.1,
for potential other future use in research (e.g. comparisons of impacts between two individual
occurrences).
For assessing trends over time, a long-time series of impact statistics is required due to
the inherent randomness over space and time of exposure to hazards. For example, for the Sendai
Framework Monitoring, governments specified 10-year periods of 2020-2030, as compared with
2005-2015 for the affected population indicators.

DISASTER-RELATED STATISTICS FRAMEWORK (DRSF)
Expert Group on Disaster-related Statistics in Asia and the Pacific Page 43
Geographic aggregation
Statistics on disaster impacts can be presented according to hazard types and according
to geographic regions within the country, as shown in the example DRSF impacts tables (C, D, E,
F & G tables – see Annex).
Geographic aggregation of location specific information or geo-referenced statistics can
be easily customized, according to specific uses, with GIS. For the purpose of the Sendai
Framework aggregations, observations related to specific disaster occurrences are reported for
the national scale or for other smaller administrative regions within the country, e.g., districts,
municipalities, provinces – Admin. 03, 02, 01 or other types of defined regions, like river basins.
Impacts statistics are recorded according to a specific disaster occurrence and,
sometimes, a disaster area (or ‘disaster footprint’) is defined for a specific event.28
A simple three-category system (small moderate, and large disasters) is a common
practice of national agencies for indicating and grouping the scale of impacts from a disaster.
There is no requirement or instruction. The geographic scale of the administration of an
emergency response and recovery effort, e.g., local, national or regional scale is recommended as
a simply proxy measure for categorizing scale of disasters. While categorizing the scale of disaster
areas is not relevant for the international monitoring of Sendai Framework indicators, this
information may be useful for other purposes given the differences in associated risks.
Large disasters are disasters in which the emergency is at a national (or higher) scale
and have special characteristics of interest for analysis because they are relatively rare but have
extensive and long-term effects on sustainable development. Large disasters tend to generate
more data compared to small disasters and they are often covered by post- disaster assessment
studies29. The impacts of large disasters often cross administrative boundaries, including
international borders, and therefore recordings of statistics for large scale events are usually
applicable to multiple reporting regions.
Medium and small-scale disasters refer to emergencies at smaller than national
geographic scales. On aggregate, across disasters, the small and medium disasters tend to cause
greater impacts to a country or region because they are more frequent than large disasters. This
distinction is related to the concept of intensive and extensive risk from disasters developed in
UNISDR (2015). “Extensive risk is used to describe the risk associated with low-severity, high-
frequency events, mainly associated with highly localized hazards. Intensive risk is used to
describe the risk associated to high-severity, mid to low-frequency events, mainly associated with
major hazards.” Small disasters have impacts limited to relatively small local areas, for example
concentrated severe storms. Medium-scale disasters are defined by a threshold of impacts
causing emergency reaction from authorities from multiple administrative regional authorities –
such as from multiple, villages, districts or provinces.
28. Currently, there is no internationally standardized methodology for tracing a ‘disaster footprint’. However, it is
recommended to define disaster areas, where feasible, as tracing the contiguous areas where direct impacts could be
observed. It is further recommended to identify with standard geographic referencing the lowest level of
administrative region (usually Admin 03) for which basic background statistics on the population are available.
29 such as Cyclone Evan that caused major economic destruction in Fiji (Government of Fiji, 2013) and Samoa
(Government of Samoa, 2012)

DISASTER-RELATED STATISTICS FRAMEWORK (DRSF)
Page 44 Expert Group on Disaster-related Statistics in Asia and the Pacific
Human impacts
Three tables (C1, C2, and C3) are shown in the Annex of tables for organizing the list of
basic range human impacts elements according to geographic regions, hazards types, or
demographic and social categories
Some data and statistics relate to both the human and material categories of impacts. For
example, the same data sources that are used for accounting for damaged or destroyed dwellings
(and Sendai Framework Target C for economic loss) should also be applicable for estimating the
number of people whose houses were damaged due to hazardous events (a Sendai Framework
indicator under Target B for affected population).
Besides statistics on the various forms of impacts from disasters on people, there is also
a demand for aggregated counts of the “affected population” after a disaster, for example as an
indicator for international monitoring of the Sendai Framework (UNGA, 2015). There is also a
need to produce disaggregated statistics on people affected by disasters for a full understanding
of post-disaster recovery needs and for use in future risk assessments.
Demographic and social disaggregation
Disasters affect groups of people differently. There has been a strong call from expert
groups working on SDG and Sendai Framework indicators for disaggregation of disaster impacts
for assessment of relevant vulnerabilities. The ESCAP Resolution 70/2 of May 2014, establishing
the Asia-Pacific Expert Group emphasized the importance of disaggregated statistics for “enabling
a comprehensive assessment of the socioeconomic effects of disasters and strengthening
evidence-based policymaking at all levels for disaster risk reduction and climate change
adaptation”.
Technical Guidance in the Sendai Framework Monitoring (UNISDR, 2017) calls for
disaggregation of people by hazard, geography, sex, age, disability and income.
The Sendai Framework Monitor collects age disaggregated statistics according to three
groups: 0-15, 16-64 and 65+. In addition to meeting this minimum grouping for international
reporting purposes, collection of impacts to infant children (0-4 years old) is also recommended,
since children at this age are dependent on a parent, or other guardian, in an emergency.
Statistics disaggregated by social and demographic categories will become progressively
more available and simpler to estimate for future disaster occurrences through increased
experience with compiling summary statistics before and after disasters, and via linking datasets.
Deaths or missing persons
Each country defines deaths and missing persons differently according to their own
national laws. For example, countries may use different time periods and procedures for missing
persons including the reclassification of cause of death. The statistics will reflect the national
legislation and policies. It is not expected that these differences will significantly affect the
analyses or comparisons of statistics in the long-term because the basic concepts remain the same
across countries.

DISASTER-RELATED STATISTICS FRAMEWORK (DRSF)
Expert Group on Disaster-related Statistics in Asia and the Pacific Page 45
The general framework for attribution of death or missing persons includes two broad
types of scenarios:
a. Deaths or missing persons occurring during an emergency period (or deaths caused
by an injury or illness sustained during an emergency) and believed to be caused by a
hazard, and
b. Indirect fatalities associated with a hazard. An example is deaths from illnesses
caused by consequences (poor access to water and sanitation, exposure to unsanitary
or unsafe conditions) resulting from a hazard.
Deaths or missing persons are typically reported by different levels of local and national
government and usually at some stage are shared in official reports to the public via the press.
Commonly there is a need to revise original reported counts on deaths (and other human
impacts) following the emergency and after there has been sufficient time to assess the sources
and to verify data collected. The revised estimates must be stored in the centralized compilations
of disaster impacts statistics across occurrences and utilized for calculating indicators.
A key consideration of compilation of revised figures is to ensure that the final official
counts of deaths after a disaster are also incorporated into the broader official system of
administrative records (i.e., the civil registration system) and statistics, which is also the source
used for the long-term official statistics on mortality and health of the population (See Chapter
9).
Injured and ill
Aside from death, the two-other main physical impacts from disasters to humans are
injuries and illness. The relative importance of injuries or illnesses will vary depending on the
characteristics of the underlying hazard as well as on social factors, especially the vulnerability
factors of the population in an affected area and the seriousness of the illness or injury.
In Bangladesh, for example, illness is a more frequently occurring impact from disasters
compared to injuries, overall. But, the frequencies for injuries or illnesses vary by hazard type
and depending on the age and gender of the exposed population. (Bangladesh Bureau of Statistics,
2016)
Displacement
For all types of movement of the population that are a direct consequence of a hazard,
including evacuations and permanent relocations of people due to a disaster, the suggested term
is displacement.
The Open-Ended Intergovernmental Working Group (OEIWG) decided to exclude
displacement statistics from indicators on affected population for the Sendai Framework
Monitor. Developing consistent approaches of measurement on displacement is difficult because
there are many different types of displacement of people during and after a disaster. Therefore,
the concept is only relevant for existing statistics that may be used in analyses and national or
local levels, in accordance with the Sendai Framework paragraphs 28 (d) and 33(h).

DISASTER-RELATED STATISTICS FRAMEWORK (DRSF)
Page 46 Expert Group on Disaster-related Statistics in Asia and the Pacific
In the adopted terminology for the Sendai Framework (UNGA, 2015), evacuation is
defined as: “moving people and assets temporarily to safer places before, during or after the
occurrence of a hazardous event in order to protect them.” Data on evacuations could be used for
assessing impacts to population, but evacuations are also a method of disaster risk reduction.
Both analytical perspectives can be accommodated in statistics if observations of evacuations are
accessible in the database.
The nature of displacement (and its measurement) varies according to length of time (e.g.
temporary or permanent) and whether displacement was arranged (or ordered or financed) by
governing agencies. Sometimes movement of people related to a disaster is a matter of voluntary
and self-funded choice. There are also cases, especially for large disasters, in which governing
authorities order and provide support for evacuation or relocation of populations in designated
affected areas. The latter case is more easily measured, but both could be important for tracking
impacts of disasters, and the responses of people, over time.
Population movements that correspond with a disaster can sometimes be captured via
statistics from population censuses or population administrative records. It is more difficult to
attribute movements specifically to hazards or a past disaster without posing a specific query in
census or survey questionnaires.
A common cause of displacement after a disaster is damaged or destroyed dwellings,
which, is data that can be reutilized for multiple perspectives in statistical tables, starting with
the accounting of material impacts variables (below). There are also cases where the dwelling
structure may have received negligible damages but due to the changes of circumstances
regarding the location of the dwelling, the area is deemed unsafe for continued residential
occupation. Most broadly, displacement statistics can be summarized according to permanent or
temporary displacement.
Impacts to livelihood
Impacts (or disruptions) to livelihoods is a concept from the internationally adopted
recommendations for the Sendai Framework monitor (UNGA, 2015). UNISDR guidance defines
livelihoods as: “the capacities, productive assets (both living and material) and activities required
for securing a means of living, on a sustainable basis, with dignity.” The concept is broad and the
OEIWG deferred o national practices for measurement for Sendai Framework indicators.
A core factor for sustainable livelihood for which impacts are measured in some countries
is impacts to employment. For measurement units, impacts to employment can be measured
similarly with disruptions to basic services (see last section in this chapter), i.e., in terms of
number of people affected and length of time affected.
Utilizing a specially designed household survey, the Bangladesh Bureau of Statistics
reported statistics (see Box 5) on impacts to employment (and other basic factors of livelihood
like access to water and sanitation) across the affected population, according to numbers of
individuals affected by geographic regions and as a distribution of the number of days missed.

DISASTER-RELATED STATISTICS FRAMEWORK (DRSF)
Expert Group on Disaster-related Statistics in Asia and the Pacific Page 47
Box 5: Utilizing household survey for collecting data on human impacts
Where feasible, household surveys are a potential good option for collecting data on direct and indirect
impacts from historical disasters by posing specific questions to households in areas that recently
experienced a disaster. A well-documented example is available from the Bangladesh Bureau of
Statistics, which collected and published extensive statistics on effects of disasters on the population
through a national sample household survey though the Impact of Climate Change on Human Life
(ICCHL) Programme.
Included within the scope of the national survey in Bangladesh was statistics on impacts to livelihood,
including temporary losses in education and employment.
Number of households missing work due to disasters by hazards and
distribution by number of days missed, 2009-2014
Bangladesh Disaster-related Statistics, “Household distribution of number of non-working days due to
last natural disaster by categories, 2009’-14”. (ICCHL; BBS; SID; Ministry of Planning , 2016)
http://www.bbs.gov.bd/site/page/76c9d52f-0a19-4563-99aa-9f5737bbd0d7/Environment--Climate-
Change-&-Disaster
Physical human impacts (deaths or missing, injuries, and illnesses) always happen within
the geographic area of the disasters. Impacts to livelihood, however, which are indirect effects,
could potentially happen to people outside of a geographic area defined by the physical or
material impacts from the hazard.
Material impacts
Direct material impacts are equivalent to “damages” as the term is used in many other
related references (EU-JRC, FAO, PDNA)30. DRSF uses the term “direct impacts” for consistency
with UNISDR (2017) and to avoid confusion between damaged and destroyed assets.
Direct material impacts constitute the scope for valuing direct economic loss according
to the definition adopted for the Sendai Framework Monitor. Material impacts to the
environment and cultural assets are distinguished due to differences in measurement units and
valuation for economic loss measurement.
30 PDNA, FAO, and JRC use the terminology of damages and losses. Physical Damages to infrastructure are contrasted
to losses, which is equivalent to indirect impacts in the Sendai Framework and DRSF.
Total 1-7 8-15 16-30 31+
Drought 325242 8.16 3.61 2.69 1.47 0.39 12.09
Flood 1071377 26.93 4.98 10.62 9.39 1.94 17.63
Water logging 442145 11.12 4.88 3.23 2.05 0.96 14.85
Cyclone 762788 19.17 12.05 4.51 1.95 0.66 9.33
Tornado 129754 3.27 2.65 0.45 0.14 0.03 5.72
Storm/ Tidal Surge 316257 7.95 4.92 1.5 1.06 0.47 10.08
Thunderstorm 253272 6.37 3.73 2.14 0.46 0.04 7.6
River/ Costal Erosion 143973 3.62 1.23 1.13 0.92 0.34 16.86
Landslides 2019 0.05 0.04 0.01 0 0 5.67
Salinity 60064 1.51 1.18 0.24 0.08 0.01 6.8
Hailsotrm 2998410 7.51 6.29 0.76 0.34 0.12 5.3
Others (Fog, Cold wave etc.) 173708 4.37 2.91 1.16 0.26 0.04 7.15
Total 3979008 100 48.46 28.44 18.12 4.98 12.13
Number of households
mising work
Number of non-working days missed (%) Average no. of
working days Hazard Type

DISASTER-RELATED STATISTICS FRAMEWORK (DRSF)
Page 48 Expert Group on Disaster-related Statistics in Asia and the Pacific
Regarding measurement units, direct observations of material impacts from a disaster are
compiled, initially, in physical terms, (e.g. in terms of area (sq. m), or counts of units or buildings
by type) that are damaged or destroyed (see measurement units menu in Chapter 7).
Material impacts can also be represented in relation to the numbers of people exposed or
affected by the impacts. This includes, where possible, disaggregated statistics, e.g., by gender or
by income categories) on populations exposed to material impacts of disasters. Disruptions to
basic services are caused by material impact, with direct consequences on affected people.
The observation of impacts, initially in physical terms, is critical inputs for estimating the
scale of the impacts of the disaster from an economic perspective, both in volume terms31, and in
terms of money. For developing systems for compiling time series in monetary terms, (i.e.
economic losses), it is crucial that the basic data in physical terms is compiled in national
databases following a defined structure. (see Annex of tables and Classification of Objects of
Impacts in Chapter 8).
The difference between direct and indirect impacts is an important concept for the
Sendai Framework targets and indicators. Direct impacts include physical (partial or total)
damage. Indirect economic loss is “a decline in economic value added as a consequence of direct
economic loss and/or human and environmental impacts.” (UNISDR, 2017) Direct impacts tend
to be relatively more immediate impacts of a disaster and they are the objects of emergency
response. Indirect impacts affect individuals, businesses, and the public in proximity of the
disaster area and sometimes these effects will continue for years or possibly even for decades
after a disaster. Examples of indirect impacts include depressed demand for goods and services,
and other effects to prices, increased debt or dependence on imports, disruptions to supply chains
for products or for services like education, and so on.
The scope of measurement for the direct material impacts is defined according to the
stocks of physical objects (see list of objects of direct material impacts in Chapter 8) that were
damaged or destroyed as direct result of a specific disaster occurrence. Especially important for
disaster impacts statistics is critical infrastructure and agricultural crops.
Critical Infrastructure is “the physical structures, facilities, networks and other assets
which provide services that are essential to the social and economic functioning of a community
or society.” (UNISDR, 2017). A list of critical infrastructure types is presented as a sub-group of
the broader classification of the objects of direct material impacts in Chapter 8.
In addition to damages to critical infrastructure and other components of the built-up
landscape, another important form of direct material impacts is damage to the land and other
natural resources, especially agricultural land, destruction of trees, and damages to the conditions
of important ecosystems such as forests and water bodies.
The System of Environmental-Economic Accounting (SEEA) 2012 – Central Framework is
an internationally agreed standard for producing comparable statistics on the environment and
its relationship with the economy, following a similar accounting structure as the SNA. According
to SEEA, environmental assets are “the naturally occurring living and non-living components of
31 See definition of measurement in volume terms measurement from System of National Accounts 2008

DISASTER-RELATED STATISTICS FRAMEWORK (DRSF)
Expert Group on Disaster-related Statistics in Asia and the Pacific Page 49
the Earth, together constituting the biophysical environment, which may provide benefits to
humanity.”
Land and natural resources are also economic assets and are included within the SNA
assets boundary, and therefore, in principle, a part of the overall scope of national asset
accounting. However, some of the natural benefits from ecosystems that are recognized in SEEA
are beyond the scope of SNA and are not currently valued in monetary terms. An example is the
natural protections against hazards provided by vegetation. Natural ecosystems provide a natural
barrier, and thus a boost to coping capacity in the form of natural protection along coastlines or
upstream. These benefits are recognized as ecosystem services in the SEEA Experimental
Ecosystem Accounting Framework.
Environmental assets are a potentially important component for the basic range of
disaster-related statistics. Generally, these assets were not included within the scope of the
Sendai Framework Monitor. However, some items, such as trees or agricultural land are counted
in Sendai Framework Indicator C2 “Direct agricultural loss attributed to disasters”, depending on
the nature of the objects that have been lost.
Impacts to agriculture
In economic terms, impacts to agriculture are often among the most significant after
disasters. This is partly because, as a land intensive activity, agriculture faces a relatively large
exposure to hazards.
To capture the full impact of disasters on the agriculture sector, the Food and Agriculture
Organisation of the United Nations (FAO) has developed a methodology for damage and loss
assessment, which is integrated, through a collaborative process with UNISDR, into the Sendai
Framework Monitoring Process within the structure of indicators for direct economic loss. The
FAO methodology distinguishes between damage (total or partial destruction of physical assets),
and loss (changes in economic flows arising from a disaster).32
Impacts to each subsector of agriculture can be divided into two main components:
production and assets. Production damage is measured in terms of the value of destroyed
agricultural inputs (seeds, fertiliser, feed and fodder) and outputs (stored produce). Production
loss is measured in terms of the value of agricultural production lost from the disaster. Assets
damage is measured in terms of the value of the destroyed facilities, machinery, tools, and key
infrastructure related to agricultural production. The monetary value of damaged assets is
calculated using the replacement or repair cost. This allows for an estimation of the extent and
value of damage and loss for all components in each subsector.
Table F (see annex) was developed by FAO following the basic format of the DRSF basic
range tables and describes the key components of the damage and loss assessment methodology
for agriculture.
The assessment of production loss should be done for all primary crops. Primary crops
are those that come directly from the land without having undergone any real processing, apart
32 This FAO terminology (“damages” and losses”) corresponds with several other references, as noted above, and
essentially corresponds with the direct impacts and indirect impacts distinction from the Sendai Framework and
utilized in DRSF.

DISASTER-RELATED STATISTICS FRAMEWORK (DRSF)
Page 50 Expert Group on Disaster-related Statistics in Asia and the Pacific
from cleaning. Primary crops are divided into annual and perennial crops. Annual crops are those
that are both sown and harvested during the same agricultural year, sometimes more than once;
perennial crops are sown or planted once and not replanted after each annual harvest. Annual
primary crops include cereals, pulses, roots and tubers, sugar crops, some oil-bearing crops, some
fibre crops and vegetables, tobacco, and fodder crops. Perennial primary crops include fruits and
berries, nuts, some oil-bearing crops and spices and herbs.
There are basic differences in approaches to valuation of losses for seasonal crops and
perennial crops (or livestock or other types of multi-use assets). These differences are necessary
because of differences of nature of the losses. Destruction of seasonal crops can be assessed as a
one-time loss, which hopefully can be recovered over time and will not directly affect the next
harvest, whereas losses of perennial crops relate to expected future returns that would have
extended beyond the season in which the disaster happened.
For annual (or seasonal) crops, loss is measured as the anticipated (but unrealized)
market value of the finished product for the affected crops. However, production loss for
perennial crops is measured in terms of the discounted expected yield.
Livestock, forests (both cultivated and non-cultivated forests are recognized as assets for
forests), aquaculture and forestry are included in the FAO methodology and in Sendai Framework
Monitor for direct economic loss.
These resources, and the perennial crops, are assessed for calculation of monetary
indicator terms in relation to the discounted expected yield, which requires the following
statistics:
a. Pre-disaster value of perennial crops or animals killed by the disaster;
b. Replacement cost of fully/partially damaged assets, at post-disaster price;
c. Difference between expected and actual value from survived animals and perennial
crops in a disaster year; and
d. Discounted expected value from dead animals until full recovery and/or replacement
of livestock.
Impacts to the land itself, or to land improvements, should, in principle, also be included.
Damaged or destroyed buildings and machinery used by agricultural enterprises are valued
according to replacement costs, as generally recommended for direct economic loss
measurement in the Sendai Framework Monitor (see below).
Economic loss
It is important to consider the multiple ways economies are affected by disasters because
some of these economic impacts are difficult to attribute with a causal relationship with the
disaster, and therefore could be missed. Direct material impacts tend to be more explicitly
observable, but there is still usually a need for estimations or to utilize multiple data sources for
valuation of thes impacts. The agriculture case (above) is a good example of the challenges,
stemming from the need to adopt conventions for handling monetary valuations of different types
of impacts differently, e.g., perennial and annual crops.
Economic loss statistics must be built on a clear and consistently applied concept of
measurement, to avoid mixing figures incoherently (e.g. mixing stock with flow measures) or

DISASTER-RELATED STATISTICS FRAMEWORK (DRSF)
Expert Group on Disaster-related Statistics in Asia and the Pacific Page 51
double-counting. Some types of economic losses are implicitly included in national accounts and
other economic statistics, but they are not easily disentangled as impacts variables and, due to
accounting rules, some values will appear as positive contributions to key indicators like GDP and
investment. 33
One of the economic responses after a disaster emergency period and recovery is a short-
term boost in construction activities, which can give a misleading impression of resilience and
economic growth because the losses of assets, to which the construction is replacing, do not affect
the computation of GDP directly. However, there are also indirect effects to GDP, which are more
difficult to measure, and it is important to develop a complete description, as much as is feasible,
of the overall effects of disasters on the economy.
Reducing “direct disaster economic loss” by 2030 is target C in the Sendai Framework and
a target under multiple sustainable development goals – in relation to poverty reduction (Goal 1),
sustainable cities and human settlements (Goal 11), and climate change action (Goal 13). Direct
economic loss is defined for international monitoring of Sendai Framework and SDG targets as
"the monetary value of total or partial destruction of physical assets existing in the affected area."
Assets are defined in the System of National Accounts (SNA) as stores of value
“representingabenefitorseriesofbenefitsaccruingtotheeconomicownerbyholdingorusing
theentityoveraperiodoftime.Itisameansoftransferringvaluefromoneaccountingperiodto
another.“(SNA2008,para3.30). Inotherwords,assetshaveanintrinsicvaluerepresentedby
theirexpectedbenefitstoownersandthisvaluecanbelostorreduceddirectlybyadisaster.
Proposed for direct economic lossmeasurement for the Sendai Framework and SDGs
monitoring inUNISDR (2017) is the cost for replacement (e.g. reconstruction/restoration) of
damagedordestroyedassets,whichisadifferentconceptcomparedtomeasuringchangestothe
valuesofassets(seebox5oneconomiclossandtheSNA).Replacementorreconstructioncosts
(although they may be estimated) represent actual flows of financial resources that were
necessarytorestorethephysicalassetsbacktoitspreviousconditionbeforethedisaster.Thus,
thestatisticsusedintheSendaiFrameworkandSDGseconomiclossindicatorarealsoametricof
investmentsforpost-disasterrecovery.
Use of replacement costs for measuring direct economic loss is practical for several
reasons:(a)thevaluesarerelativelyeasytointerpretforanalysis,(b)theyareapartofthebroader
productiveactivitiesoftheeconomyandthuscanbecompareddirectlywithGDP,and, (c)the
valuesarealsoacomponentofdisasterriskreductionexpendituresaccounting(nextchapter).
AlthoughthedefinitionprovidedfortheSendaiFrameworkMonitorreferstoassets,also
forconsiderationformeasurementofdirecteconomiclossare“householdconsumerdurables”,a
classofproduct,suchasprivateownedcars,whichtechnicallyarenotincludedasassetsinthe
SNA,buthaveavalueintheirownfinalusebyhouseholds.
Several primary sources for estimating the value of replacement costs for damaged or
destroyed assets can be utilized in a complementary way.
33 For example, reconstruction or repairs of assets after a disaster are productive and income-earning activities, thus
contributing positively to GDP in periods after a disaster. Research after disasters in the United States has shown that
a short-term increase in GDP and employment can be commonly observed at the local level in areas after a disaster. In
part, this is an effect of efforts for recovery of direct economic losses, according of the Sendai Framework definition.

DISASTER-RELATED STATISTICS FRAMEWORK (DRSF)
Page 52 Expert Group on Disaster-related Statistics in Asia and the Pacific
a. Governing agencies responsible for the relevant types of infrastructure (roads,
buildings, agricultural land etc.) may conduct an assessment as part of the immediate
disaster response and recovery, which could include estimated replacement costs
based on existing (pre-disaster) statistics on average per unit costs by infrastructure
type in the affected region.
b. Estimation based on average costs, as proposed in UNISDR (2017), noting that such
estimations could be prone to inaccuracies, depending on the variance in costs across
space. When using average per unit costs or other proxies for estimating replacement
costs, there will always be a degree of uncertainty, which should be quantified and
included in the metadata.
c. Direct observations of expenditures for recovery will be available for some s from
reports or surveys of businesses or reports of expenses by the government agencies,
e.g., Ministry of Transport for the case of roads, or from reports from records of
insurance claims covering a disaster. 34
Bycombiningdata sources, areasonably reliableandcoherentpictureofexpenses for
recovery of assets should be feasible and compiled into tables like E1A (see Annex), and for
producinganestimateforaggregatedexpenditureforrecovery.
Although the basic measurement objective for the Sendai Framework direct economic
loss indicator is to quantify the recovery of the affected physical assets, of course not all damaged
or destroyed assets will be recovered. There may not be precisely a replacement of the assets that
existed before the disaster. Some assets will simply be written off whereas others will be replaced
by different new assets. The costs of “build back better”, for example, are different from the
costs of recovering losses. These additional costs, represented by structural measures with a
purpose of disaster risk mitigation, e.g., seismic resilience of buildings are also useful statistics,
and an important component of the overall economic investment in disaster risk reduction (see
next Chapter).
IntheSystemofNationalAccounts(SNA),thereisarecordingforchangestothevalueof
acountry’sstockofassetscausedbycatastrophiclosses.35
34 Note that not all replacement expenditures can be observed (or even take place), not all assets will have been insured,
and suitable proxies (e.g. average per unit costs for affected assets) are not always available. Thus, some combination
of compilation of these statistics with estimation based on proxies is a common practice across disasters for compiling
replacement costs.
35 “The volume changes recorded as catastrophic losses in the other changes in the volume of assets account are the
result of large scale, discrete and recognizable events that may destroy a significantly large number of assets within
any of the asset categories. Such events will generally be easy to identify. They include major earthquakes, volcanic
eruptions, tidal waves, exceptionally severe hurricanes, drought and other natural disasters; acts of war, riots and other
political events; and technological accidents such as major toxic spills or release of radioactive particles into the air.
Included here are such major losses as deterioration in the quality of land caused by abnormal flooding or wind
damage; destruction of cultivated assets by drought or outbreaks of disease; destruction of buildings, equipment or
valuables in forest fires or earthquakes.” [SNA 12.46]

DISASTER-RELATED STATISTICS FRAMEWORK (DRSF)
Expert Group on Disaster-related Statistics in Asia and the Pacific Page 53
Box 6: Economic loss and the SNA
The costs associated with replacement of direct impacts are already incorporated implicitly within the
SNA as productive (i.e. positive) activities. Indirect impacts will implicitly affect GDP in the year of the
disaster (and subsequent years after). The total (direct and indirect) effects of a disaster on GDP are
ambiguous within the national accounts.
However, as there is a strong demand from policy-makers and researchers, many statistics offices
and/or national accounts authorities produce analysis, especially after very large disasters, utilizing
national accounts and the sources of national accounts statistics to estimate the indirect effects of a
disaster, and thus produce an unambiguous assessment of the effects of a hazard on economic activities
by sector and for the whole economy. Several important references can be noted, e.g.: Escobar, C-G
(2011), USBEA (2009), and Statistics New Zealand (2012b).
In principle, values for the direct impacts to assets, valued in terms of losses to value of the asset base,
are already included, in this case explicitly, in the SNA, through a special recording called catastrophic
losses. These losses are represented as a special type of change (“other changes in volume”) to the
national balance sheet for physical assets. This is a change in the stock of assets, which has no direct or
explicit effect on the flows portion of the accounting framework, such as production and income.
The figure below is a simplified representation of the relevant stocks and flows according the SNA,
including the recording for catastrophic losses on the left side, which represents changes to stocks of
assets and with the flow variables on the right side, which includes activities like reconstruction.
Catastrophic Losses in the SNA
The direct impacts from disasters recorded in the SNA Other Changes in Volume to Asset account cover
losses in asset values from relatively large-scale occurrences (see definition from SNA), and therefore
should be appended with estimates of the costs of damages from smaller scale events as well.
The valuation of catastrophic losses in the SNA matches with the approach developed by FAO for
measuring losses to perennial crops and livestock (see Impacts to Agriculture), i.e. by assessing the
change in asset values (discounted expected return).
For many disasters, especially large disasters, the indirect economic impacts are likely to
be much larger in value compared to the values for destruction of assets and there is a strong
interest for measures of indirect economic losses from disasters, for example to produce
estimates of the effect of disasters on GDP growth. However, an initial focus on reliable
measurement of direct economic costs is a sensible priority because the input data are also basic

DISASTER-RELATED STATISTICS FRAMEWORK (DRSF)
Page 54 Expert Group on Disaster-related Statistics in Asia and the Pacific
building blocks upon which assessments and modelling of indirect economic impacts can be
developed later.
In summary, while there is a strong international demand for internationally comparable
indicators for direct economic loss, there is also an interest to produce multiple related figures,
where possible, in order to meet different purposes of economic analysis, including assessments
of the indirect economic impacts of disasters, and accounting for costs of expenditure for the
post- disaster rebuilding and the broader measurement of disaster risk reduction expenditures,
including costs for building back better.
Economic loss and poverty
The demand for direct economic loss from disasters measurement goes beyond the
aggregate losses by country or for regions within a country. Although there is no requirement for
disaggregation of economic losses by individuals (or types of individuals) for the Sendai
Framework Indicators. There are other national or local-scale analytical purposes for providing
disaggregated statistics for focused analyses for risk reduction, e.g., for people in vulnerable
situations. This can be accomplished, to a certain extent, via disaggregation by income of human
impact statistics, in particular households affected by damages to their dwellings or other assets,
and by rigorous mapping of vulnerabilities before and after a disaster.
Another important link for understanding this relationship with poverty reduction is
statistics on financial support to households during and after a disaster. For example, statistics
should be compiled, where feasible, after each disaster on households receiving financial or other
support by geographic regions and also compile summary statistics on coverage of insured losses
versus uninsured losses.
If a poor household’s dwelling is destroyed, the replacement costs are very small from the
perspective of GDP, but extremely large from the perspective of that household, especially if the
impacts were uninsured. The indirect impacts, e.g., displacement, loss of employment or reduced
income could be even worse. It is important to compile and retain the basic data and metadata
on material impacts and the people affected to allow for the possibility of disaggregated analyses
focussing on poverty and leaving no one behind.
Disruptions to basic services
Disruptions to the functioning of a community or a society is one of the defining elements
of disasters (UNGA, 2015). These disruptions are typically connected with material impacts from
disasters and sometimes statistics on disruptions can be produced based on the same basic data
inputs used for assessing material impacts after a disaster.
The measurement of disruptions to basic services was one of the issues discussed by the
OEIWG to develop suitable recommendations for international monitoring of indicators. The
OEIWG concluded that the international monitoring of indicators could be accomplished via the
counts of relevant numbers of critical infrastructure types, as the disruptions are consequences
of material impacts to critical infrastructure.
In addition, to help guide compilation of statistics for these indicators, UNISDR developed
a list of the basic services that could be disrupted by disasters as follows:

DISASTER-RELATED STATISTICS FRAMEWORK (DRSF)
Expert Group on Disaster-related Statistics in Asia and the Pacific Page 55
• Health Services (CPC 86: “Human health services”);
• Educational Services (ISIC 85);
• Public Administration Services (CPC 91 “Administrative services of the government”);
• Transport Services (ISIC 49: “Land transport and transport via pipelines”, ISIC 50
“Water transport”, ISIC 51: “Air transport”);
• Electricity and Energy Services (ISIC 35: “Electricity, gas, steam and air conditioning
supply”);
• Water Services (ISIC 36: “Water collection, treatment and supply”); and
• ICT Services (CPC 4 “Telecommunications, broadcasting and information supply
services”)
The portions of these services provided by government are included as part of the UN
Central Product Classification (CPC rev 2.1), within Section 9: “Community, social and personal
services” and in the International Standard Industrial Classification of All Economic Activities
(ISIC Rev 4) Sections O, P, or Q.
For cases where additional data are available on the nature of the disruptions to basic
services, national agencies might also consider development of an additional collection of two
other key dimensions for analysis of the disruptions to basic services. This can be done, for
example, by counting the number of people impacted and the length of time of the disruptions
(see Table D2 in the Annex). Although this information is not relevant for international reporting
under the Sendai Framework or SDGs, some official statistical agencies are already collecting such
information and are encouraged to continue.

DISASTER-RELATED STATISTICS FRAMEWORK (DRSF)
Page 56 Expert Group on Disaster-related Statistics in Asia and the Pacific
CHAPTER 5: DISASTER RISK REDUCTION ACTIVITY
Disaster risk reduction-related (DRR) activities are activities that boost coping capacities
of society where a disaster occurs or may occur. Outcomes of these investments e.g. coverage of
early warning systems and the basic knowledge and preparedness of households (see Coping
Capacity, Chapter 3), affect the overall risk profile for a given community or region within a
country. The costs of investment in DRR are expenditures or transfers for activities with a disaster
risk reduction (DRR) purpose.
A main area of interest about disaster risk reduction activity statistics is national DRR
expenditure. The size of this expenditure can be compared with other activities and with total
GDP. Risk analyses can benefit from comparisons between investment within the categories of
DRR activities, like post-disaster reconstruction expenditures and post-disaster “structural
measures” for future disaster prevention, e.g., build back better as discussed in Chapter 4.
The Report of the OECD Joint Expert Meeting on Disaster Loss Data “Improving the
Evidence Base on the Costs of Disasters: Key Findings from an OECD Survey” (OECD, 2016), made
a connection between statistics on impacts and investment in disaster risk reduction as follows:
“The rationale for the work on improving the evidence base on the cost of disasters is grounded in the evidence that recent shocks from natural and man-made disasters continue to cause significant social and economic losses across OECD countries. The increase in damages is widely considered to outpace national investments in disaster risk reduction, but this claim is more intuitive than supported by evidence. Indeed, there is hardly any comparable data available on national expenditure for disaster risk management.”
Investment in disaster risk reduction has been shown, via case studies, to be highly
efficient and financially smart investments if compared to risk of potential losses.36 The case can
be strengthened by development of robust statistical evidence for the costs and benefits of DRR
activities over time. Moreover, monitoring current risk situations, including existing investments
in risk reduction, can be used for identifying new investment opportunities that have the
potential to significantly reduce risk or prevent unacceptable risks.
Many national governments have previously conducted ad hoc studies of disaster risk
expenditures, known as DRM expenditure reviews. The aim for producing DRR economic
statistics, is to separate values for expenditure with a DRR purpose, for regular annual accounting
of relevant expenditures. This way, governments can track the trends of investments in reducing
risks of disasters and to make assessments with respect to the measured risk and with respect to
the costs of impacts when a disaster occurs.
OECD (2014) provided examples from a selection of OECD and non-OECD member states
over time. Relevant expenditures tend to be on the rise for the countries with available time series
statistics, but trends vary by types of expenditure. For example, after large disasters there are
large spikes in DRR expenditures for response, recovery and reconstruction. These trends and
peak values can be compared with the broader and more stable trend of other forms of DRR
expenditures for a cross-country and cross-disaster analyses of how costs of DRR are manifested
36 See, e.g., UNDP, 2004

DISASTER-RELATED STATISTICS FRAMEWORK (DRSF)
Expert Group on Disaster-related Statistics in Asia and the Pacific Page 57
and how they might be addressed efficiently and with minimum impacts to people. For example,
the sample trend analysis below was produced using actual data on expenses related to
emergency response or recovery from multiple sources for a country that experienced a very
large disaster in 2013.
Sample of trend in expenditures related to disaster response and recovery
(millions of US Dollars)
Moreover, the relevant expenses by government and other actors after a disaster are also
used for estimating direct economic loss. (see chapter 4)
Expenditure statistics are typically aggregated at national scale, but equally important is
to identify statistics on transfers, including transfers from the national budget (or from
international sources) to local projects and local government. Producing statistics on transfers is
crucial for identifying beneficiaries and potential gaps or opportunities for targeted interventions
to reduce risks.
The publicly-financed disaster risk reduction activities, particularly disaster recovery, are
often transfers from central government budgets to local authorities, and/or international
transfers, or Overseas Development Assistance (ODA). If the activities with a DRR purpose can be
specifically identified and isolated from the broader national aggregates, than these transfers can
be tracked through balance of payments and national accounts statistics like other types of
transfers and activities (production, investment, employment) in the economy.
The Sendai Framework describes disaster risk reduction (DRR) as a scope of work
“aimed at preventing new disaster risks as well as reducing existing disaster risks and managing
residual risk, all of which contributes to strengthening resilience. DRR encompasses all aspects of
work including the management of residual risk, i.e. managing risks that cannot be prevented or
reduced, and are known to give rise to, or already, materialize into a disaster event.” (UNISDR,
2017).
Expenditures on disaster risk reduction may be difficult to identify and isolate from
current transactions because they are implicitly recorded as part of a broader classification of
transactions. There are two complementary approaches that can be applied for isolating the
relevant values and producing statistics for a DRR activities, particularly the quantifications, in
monetary terms, of DRR transfers and expenditures.
The first approach is to produce a focused analysis of transfers from relevant institutions
and to analyse transfers and expenditures for a particular geographic region and time period
0
50
100
150
200
250
300
2007 2008 2009 2010 2011 2012 2013 2014 2015

DISASTER-RELATED STATISTICS FRAMEWORK (DRSF)
Page 58 Expert Group on Disaster-related Statistics in Asia and the Pacific
where there is a large-scale disaster recovery underway. Existing government finance and
statistics are derived from administrative records or outcomes of surveys or censuses businesses
and household activities, including trends. Analysis of trends, in the case of recovery from large
scale disasters will indicate specific and temporary diversions in the trends, which can be used
for estimation of expenditures for DRR activities for the recovery in those areas. Furthermore, a
post-disaster recovery period is an opportune moment to establish coordination mechanism
between government agencies for sharing data or producing proxy measurement for tracking
disaster risk reduction characteristic activities (DRRCA).
The second approach is to develop a series of functional accounts and indicators that track
all types of transfers and expenditures in the economy with a specific DRR purpose. Statisticians
develop specific functional classifications in order to define the domain of interest, e.g., the SEEA
classification of environmental activities, and DRR-characteristic activities (DRRCA) are defined
to objectively identify shares of expenditures or transfers with a DRR purpose. The same
approach is also utilized for several other important cross-cutting domains of the economy, e.g.,
health, tourism, education, environment), often designed as “satellite accounts”. These satellite
accounts are specially designed extracts (or “satellites”) of the system of national accounts (SNA).
Satellite accounts have the same structure and accounting rules as the core SNA, but with a
specifically designed scope for a functional purpose, such as monitoring DRR-related activities.
The provisional classification of DRRCA has been developed (see chapter 8), starting from
the Sendai Framework and the terminologies adopted for the Framework in UNGA (2015). The
scope of DRRCA activities is:
a. Disaster Risk Prevention;
b. Disaster Risk Mitigation;
c. Disaster Management;
d. Disaster Recovery; and
e. General Government, Research & Development, Education Expenditure
Disaster risk reduction characteristic transfers include:
a. Internal transfers between public government services;
b. Risk transfers, insurance premiums and indemnities;
c. Disaster related international transfers; and
d. Other transfers
Typical outputs from accounts of expenditures or transfers of DRR activity, following the
basic framework of the SNA, will include:
a. Total national expenditure with a DRR purpose;
b. DRR expenditure by source of financing, e.g., central government, local government,
private sector;
c. DRR expenditures and transfer by beneficiaries;
d. DRR expenditure by type of DRR activity, e.g., disaster preparedness, recovery and
reconstruction, early warning systems;
e. Values of transfers from central government to local authorities; and

DISASTER-RELATED STATISTICS FRAMEWORK (DRSF)
Expert Group on Disaster-related Statistics in Asia and the Pacific Page 59
f. Values of transfers from international donors, i.e., DRR-related overseas development
assistance (ODA).
International assistance
Overseas development assistance (ODA) is defined by OECD37 as flows to countries and
territories on and to multilateral development institutions which are a) provided by official
agencies, including state and local governments, or by their executing agencies; and ii. each
transaction of which: a) is administered with the promotion of the economic development and
welfare of developing countries as its main objective; and b) is concessional in character and
conveys a grant element of at least 25 per cent (calculated at a discount rate of 10 per cent). ODA’s
are international compilations of statistics.
Humanitarian assistance is the portion of ODA in the OECD database related to three
sectors: and Disaster Prevention and Preparedness, Emergency Response, and Reconstruction
Relief and Rehabilitation. OECD has created publicly accessible time series compilations of ODA
by categories and by donors and recipients. It is worth noting that an estimate of around 80 per
cent of the international flows of humanitarian assistance are for conflict-related settings, or
other types of complex disaster situations involving refugee crises or violent conflicts.
While hazards and disasters are events happening randomly in terms of timing and
location, DRR is a continuous activity needed to strengthen society’s resistance and resilience and
thus DRR statistics should be compiled on a continuous and periodic basis (e.g. as annual
accounts). In this way, DRR statistics could become an integrated and relatively conventional
domain of statistics, as an extension to the existing national accounts.
However, there are also special demands for analysis of DRR activities at certain periods,
such as immediately after a large-scale disaster, and emergencies sometimes spur a boost in DRR
expenditures and international transfers, which can be tracked via regular compilations of the
statistics and then linked with specific disasters for analysis (see sample trend above).
37 Stats.oecd.org
DISASTER-RELATED STATISTICS FRAMEWORK (DRSF)
Page 60 Expert Group on Disaster-related Statistics in Asia and the Pacific
PARTII
TOOLSANDGUIDANCEFOR
IMPLEMENTATION

DISASTER-RELATED STATISTICS FRAMEWORK (DRSF)
Expert Group on Disaster-related Statistics in Asia and the Pacific Page 61
CHAPTER 6: BASIC STEPS FOR IMPLEMENTATION
The Fundamental Principles of Official Statistics were adopted by the UN General
Assembly at its 68th Session in 2014. (A/RES/68/261).38 Guidelines for Implementation for the
Fundamental Principles of Official Statistics were developed and finalized by the UN Statistics
Commission in 2015.39 The Fundamental Principles describes the core responsibilities and
quality criteria for work on official statistics. Understanding these principles helps identify
opportunities and challenges for agencies involved with disaster-related statistics. (see also ECE
TF-MEED).
UNDP (2009) summarizes a basic checklist of steps for establishing an institutional
environment for official disaster-related statistics:
Step 1– Create an enabling environment for disaster risk reduction
Step 2 – Find an appropriate 'home' for the database
Step 3 – Integrate use of official statistics for design and monitoring of national strategies
disaster risk reduction
Step 4 – Collect, enter and validate data
Step 5 – Conduct analysis, manage data and ensure sustainability
Institutional arrangements for disaster-related statistics
NSOs are typically empowered by national law to promote national statistical quality
aligned with the commitment to the Fundamental Principles of Official Statistics. One of the ways
that NSOs respond to these responsibilities is by establishing and enforcing methodological
standards. This supports the development of transparent and consistent time series.
NSOs have a responsibility for continuous review of new tools for improving the
availability and quality of statistics, including the use of big data and geospatial information. This
can be done in collaboration, where applicable, with other producers of statistics. In reviewing
new tools and new opportunities, NSOs also need to identify and address as an integrated part of
the broader official statistical systems, emerging areas of demand for statistics, such as disaster-
related statistics.
For institutions at an early stage of creating a nationally centralized database or system
for compilation of disaster-related statistics, one of the vital steps is to design a database and
system of information flows for accessing coherent and well-documented data for organization
into standardized tables.
Ultimately, the roles or potential contributions of NDMAs, NSOs and others for production
and compilation of relevant official data should be reflected in the governing policies, such as the
national statistical law, national statistical policy, and work programmes. This would allow the
facilitation and access to necessary resources to build and sustain capacities for developing and
managing national databases.
38 (A/RES/68/261), https://unstats.un.org/unsd/dnss/gp/FP-New-E.pdf
39 https://unstats.un.org/unsd/dnss/gp/impguide.aspx

DISASTER-RELATED STATISTICS FRAMEWORK (DRSF)
Page 62 Expert Group on Disaster-related Statistics in Asia and the Pacific
Many guidelines on institutional arrangements already exist, especially for the
development of systems for compiling statistics on disaster impacts (also known as loss and
damage databases), particularly from the European Union and UNDP. In addition, the UNECE Task
Force for Measuring Extreme Events and Disaster (TF-MEED) developed a complementary report
on the role of national statistics offices for disaster-related statistics.
UNDP Guidelines and lessons for establishing disaster loss databases (UNDP, 2009)
emphasized the importance of engagement of partners from the initial stages of database
development, to promote a clear and common understanding of the expected scope for the data
collection and its importance for tracking and reducing disaster risk.
The goal of partnerships is “to create a database initiative in conjunction with other
disaster-related capacity building activities and within government structures to ensure local
ownership and management of the data.” It is important to ensure that data collection and
validation are conducted in alignment with nationally-adopted framework and standards for data
sources and methodologies.
A centralized database does not require that all related basic data are stored physically in
the same place or on the same server. Rather, the objective should be institutional and
technological solutions (e.g. via a centralized online portal) for accessing the basic range of
disaster-related statistics with a seamless system of database queries. These queries can be used
for calculating indicators, conducting risk and post-disaster assessments, and other statistical
purposes that arise during the phases of disaster risk management.
When data is organised in a geospatial interface (with codes and format compatible with
use in geographic information systems), the databases will have inherent flexibility in terms of
geographic scale and level of detail of analysis, so that the same basic data inputs can be
(re)utilized for complementary analyses at virtually any geographic scale.
Statistical coordination
Once a suitable institutional environment has been established for producing a basic
range of disaster-related statistics, TF-MEED identified some core functions for the national
statistical system, as follows:
• Produce primary data;
• Produce baseline official statistics;
• Provide geospatial information;
• Coordinate information flows;
• Provide data sharing platforms;
• Maintain disaster database; and
• Produce official statistics and indicators on climate change and disasters
Statistical coordination is a particularly important factor for the DRSF because most of
the compilations of statistics involve close collaboration between disaster management agencies,
and several other producers of official data. The current situation for disaster-related statistics in
countries is that data collections are scattered and dispersed among a variety of governing
agencies, in varying formats and according to different frameworks.
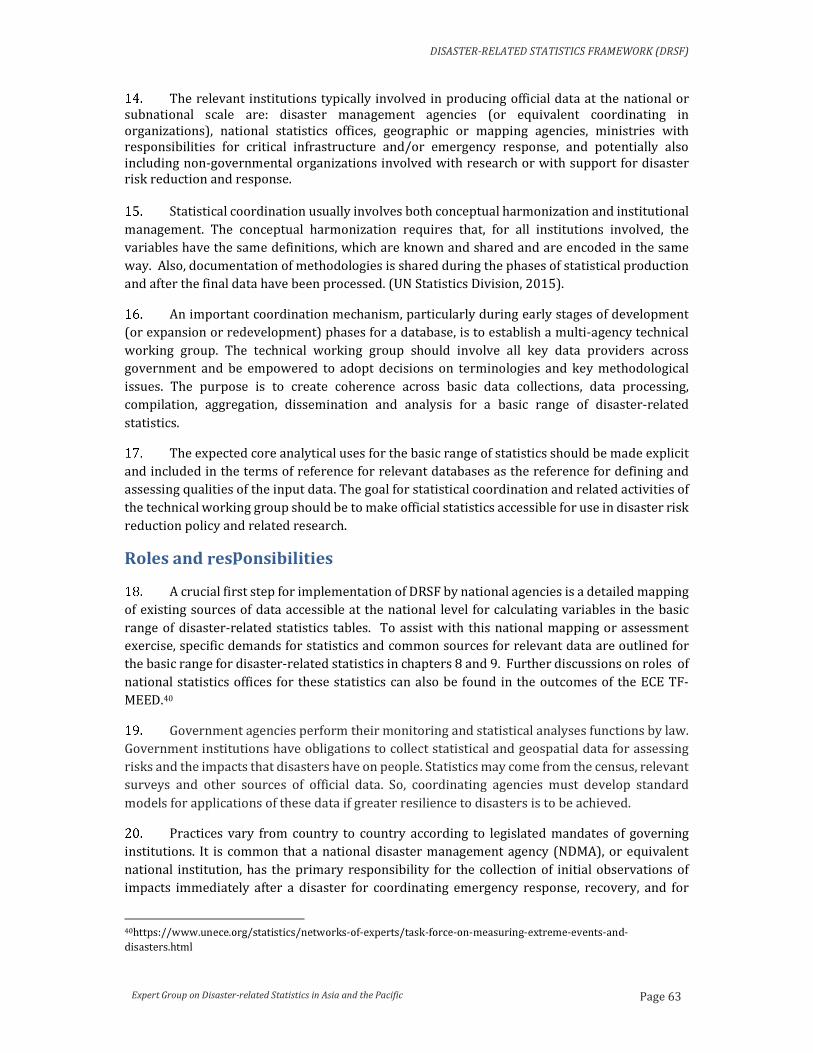
DISASTER-RELATED STATISTICS FRAMEWORK (DRSF)
Expert Group on Disaster-related Statistics in Asia and the Pacific Page 63
The relevant institutions typically involved in producing official data at the national or
subnational scale are: disaster management agencies (or equivalent coordinating in
organizations), national statistics offices, geographic or mapping agencies, ministries with
responsibilities for critical infrastructure and/or emergency response, and potentially also
including non-governmental organizations involved with research or with support for disaster
risk reduction and response.
Statistical coordination usually involves both conceptual harmonization and institutional
management. The conceptual harmonization requires that, for all institutions involved, the
variables have the same definitions, which are known and shared and are encoded in the same
way. Also, documentation of methodologies is shared during the phases of statistical production
and after the final data have been processed. (UN Statistics Division, 2015).
An important coordination mechanism, particularly during early stages of development
(or expansion or redevelopment) phases for a database, is to establish a multi-agency technical
working group. The technical working group should involve all key data providers across
government and be empowered to adopt decisions on terminologies and key methodological
issues. The purpose is to create coherence across basic data collections, data processing,
compilation, aggregation, dissemination and analysis for a basic range of disaster-related
statistics.
The expected core analytical uses for the basic range of statistics should be made explicit
and included in the terms of reference for relevant databases as the reference for defining and
assessing qualities of the input data. The goal for statistical coordination and related activities of
the technical working group should be to make official statistics accessible for use in disaster risk
reduction policy and related research.
Roles and responsibilities
A crucial first step for implementation of DRSF by national agencies is a detailed mapping
of existing sources of data accessible at the national level for calculating variables in the basic
range of disaster-related statistics tables. To assist with this national mapping or assessment
exercise, specific demands for statistics and common sources for relevant data are outlined for
the basic range for disaster-related statistics in chapters 8 and 9. Further discussions on roles of
national statistics offices for these statistics can also be found in the outcomes of the ECE TF-
MEED.40
Government agencies perform their monitoring and statistical analyses functions by law.
Government institutions have obligations to collect statistical and geospatial data for assessing
risks and the impacts that disasters have on people. Statistics may come from the census, relevant
surveys and other sources of official data. So, coordinating agencies must develop standard
models for applications of these data if greater resilience to disasters is to be achieved.
Practices vary from country to country according to legislated mandates of governing
institutions. It is common that a national disaster management agency (NDMA), or equivalent
national institution, has the primary responsibility for the collection of initial observations of
impacts immediately after a disaster for coordinating emergency response, recovery, and for
40https://www.unece.org/statistics/networks-of-experts/task-force-on-measuring-extreme-events-and-
disasters.html

DISASTER-RELATED STATISTICS FRAMEWORK (DRSF)
Page 64 Expert Group on Disaster-related Statistics in Asia and the Pacific
official reporting to the government and to the media. Some of these initial functions related to
data collection are governed by national laws or policies. For example, identification and coding
of a disaster occurrence and for collection and management of data on missing persons. All
related methodological practices and procedures of disaster management for collecting and
managing data should also be shared for coordination with agencies involved in the technical
working group.
Through implementation of DRSF it will be possible to: (i) improve production of statistics
from existing databases and (ii) bridge the representations of the realm of disasters and risk
reduction on the one hand, with the socio-economic statistics on the other. The bridge between
the two domains of statistical information is essential for producing indicators. This bridge
requires strong partnership between disaster management agencies, national statistical offices,
and other official sources of relevant data. It also requires a mutual understanding of core
concepts and the methods for applying the concepts to the practice of producing coherent
statistics.
Geographic Information Systems (GIS)
There are growing challenges to predicting disaster risk due to climate change and other
factors of the modern globalized world. However, from a technical perspective, there are many
enhanced opportunities, such as the free availability of software and methodologies for making
use of new data sources, like remote sensing, mobile phone datasets, and especially the use of
geographic information systems (GIS) for assimilation of data. For example, Figure 6.1 shows an
example for calculation of exposure of population to a hazard, by using GIS to create multiple
layers of statistic derived from geospatial data. Statistics, e.g. numbers or proportions of exposed
people by administrative areas, can be calculated directly from the maps.
Figure 6.1
Population exposed to hazards measurement
Sources: Right Map: UN Environment-GRID’S frequency of flood hazard map. Left map: Population census 2015 from
KOSTAT, resampled by UNESCAP to the DLR’s Global Urban Footprint
GIS is an indispensable tool for producing and analysing disaster-related statistics for
their use in disaster risk reduction policy. While emphasizing the tremendous opportunity for
evidence-based policy from these new tools, the World Bank’s Global Facility for Disaster Risk
Reduction (GFDRR) alerted that “these advances and innovations create a need for better

DISASTER-RELATED STATISTICS FRAMEWORK (DRSF)
Expert Group on Disaster-related Statistics in Asia and the Pacific Page 65
standards and transparency, which would enable replicating risk results by other actors,
reporting on modelling assumptions and uncertainty, and so forth.”
Increasingly, traditional data sources of the national statistical system like household and
business registers, household and business surveys, and population and housing censuses are
conducted with use of detailed geographic referencing. The geographic referencing may be
confidential at the level of individual records, but summary statistics can be disseminated for
defined areas, e.g. hazard areas. The broad trend has been a rapid expansion in the possibilities,
using affordable tools and the existing data, towards increased flexibility and level of detail for
geographic disaggregation of statistics on risk. For example, utilizing tablets for surveys and
census interviews and preparing datasets in GIS-accessible formats have become common
practices across the globe, whereas such advancements hardly existed within national statistics
offices a mere decade ago.
Nearly all components of the basic range of disaster-related statistic depend on GIS for
compilation, integration, or analysis and therefore establishing a database infrastructure in GIS,
or a spatial data infrastructure (SDI) is a critical early step in the development of disaster-related
statistics.
One of the advantages of working with data in GIS software is flexibility to present
statistics at different scales, and combining multiple layers of variables. Agencies responsible for
the underlying statistics should develop a common set of policies and standards for geographic
reference and for managing GIS files, which can be used to maintain a minimum standard of
reliability, accuracy, and relevant protections of confidentiality so that the statistics can be used
at different scales for disaster risk reduction.
Geo-referencing is the coding of data, statistics and indicators according to geographic
location, either point location (coordinates) or area (a standard reference shape or polygon).
Adopting and implementing common intra-governmental norms and standards, including
standards for place names and georeferenced coding is crucial for using GIS to seamlessly share,
integrate and use geospatial information for improved decision making. (UNGGIM, 2015)
In addition, advancement of accessibility to geospatial data, like remote sensing, is a major
opportunity for managers of disaster-related statistics to study factors of risk, for visual
assessments of impacts, and as a resource for integrating and capturing new added values from
existing and more traditional sources of data, such as sample surveys.
With the increased use of geo-referencing and emergence of analytical tools in GIS,
geospatial information and services now “contribute vastly to the overarching effort of
preventing or reducing the social, economic, and environmental impacts of disasters.” UNGGIM
(2017)
A standard spatial data infrastructure (SDI) allows for the integration of geospatial
datasets, such as satellite imagery, e.g., visual spectral imagery in a disaster area immediately
after the occurrence, which are often crucially important data sources for producing or validating
statistics before and after a disaster.
At a minimum, variables identified for vulnerability to disasters should be compiled to the
lowest available sub-national administrative regions. In DRSF background statistical tables, all
variables are organized according to pre-defined geographic regions within countries. In

DISASTER-RELATED STATISTICS FRAMEWORK (DRSF)
Page 66 Expert Group on Disaster-related Statistics in Asia and the Pacific
reporting tables, geographic disaggregation is predetermined by existing practices and
requirements of users. GIS provides the opportunity to modify geographic regions for specific
analysis.
Often it is useful to define homogenous regions – e.g. urban and rural, residential and non-
residential, and agricultural land. The European Joint-Research Council Guidance (De Groeve et
al., 2013) describes three common layers of organization and use of disaster impacts data:
• Local civil protection;
• National/Regional assessment centres; and
• Hazard specific national authorities
Some specific requirements, e.g., level of geographic detail and timeliness will vary across
different applications of the data, but, in principle, the same sources of data can be utilized for
multiple purposes and for multiple scale of analyses and decision-making. The adoption of a
harmonized framework and common standards, e.g. for geo-referencing and for geographic
aggregation, will help ensure that reliable data can be accessed and used more efficiently, and
reused for analyses at multiple phases of disaster risk management.
Metadata and quality assurance
Collection of data is usually resource intensive. Comprehensive documentation of the
outputs from a data source is a vital protection for the value of that data for future use in statistical
analyses. Metadata is the cornerstone for creating coherence across datasets. The issues
discussed in this handbook, such as units of measurement, scope of measurement, definitions for
key technical terms, and methods used for monetary valuation, are all key examples of
methodological choices, for which multiple options are always possible. Sometimes the best
choice is not the most obvious one and sometimes choices involve a practical compromise
between the different qualitative dimensions of data (accuracy, reliability, relevance, simplicity).
Documentation of these choices, in a comprehensive manual, glossary, and/ or technical annex
attached to statistical releases should be standard practice.
The main role of metadata is descriptions explaining fundamental information about data,
which are used for interpreting the data in analyses. Metadata also serves an additional purpose
in facilitating a query system and developing an efficient structure in databases so that the same
basic input data can be reused for multiple purposes.
A centralized database on disaster-related statistics must include a system of unique
identifiers and coding for individual disaster occurrences and their main characteristics.
Identifier codes within the datasets are an efficient method for linking data with metadata and
for establishing links between related variables. Three characteristics of each disaster occurrence
are recorded (see Chapter 2) . A complete nationally-adopted official glossary of hazard types41
is an example, particular to disaster-related statistics, of important data for users for interpreting
the statistics. As noted in Chapter 2, this glossary might simply replicate a list and legally adopted
definitions for hazards, if available, as legislated for DRM purposes.
41 The IRDR Hazard Glossary and Peril Classification (IRDR,2014) and Sendai Framework Indicator Technical
Guidelines (UNISDR, 2017) should be utilized, as relevant, as references for harmonizing with international definitions

DISASTER-RELATED STATISTICS FRAMEWORK (DRSF)
Expert Group on Disaster-related Statistics in Asia and the Pacific Page 67
Currently, disaster occurrences and impacts information is typically stored as a set of
records (see, for example, Desinventar.net). Given a standardized use of reference to time (“Start
date”) and location (“geographic name”), basic statistics on disaster occurrences and impacts
could be queried from these underlying records for multiple disaster occurrences over a specified
period, e.g. 2015-2030. However, accounting for the requirements of storing metadata and
microdata from multiple separate collections requires a functional database structure. that
integrates the impact statistics according to a model of relationships between components of the
basic range of disaster-related statistics (see figure 4.1 in Chapter 4 and figure 7.2 in Chapter 7).
Each disaster occurrence may have many sources of data that are compiled and utilized
to describe the relevant variables attached to that disaster. Usually, each data collection, when
integrated, needs to be accompanied by a package of metadata explanations plus notes on
revisions or other relevant details.
A standard practice for estimations or use of proxies for measurement is to include a
confidence interval and related information to explain the expected accuracy of the figures and
to correctly interpret the statistics and apply the values to their analysis appropriately. For
example, indicators on economic impacts of disasters (both direct and indirect) are typically
dependent on estimation or the use of average values (see UNISDR, 2017).
Another purpose for metadata is to inform continuous improvements to the scope,
coverage, and accuracy of statistics and their use in analyses. “A first step in handling of
uncertainty is to be aware of it at different levels of data collection and recording and
communication: fitness for use (i.e., how well data model fits to application field), measurement
errors while collecting data, processing errors while recording data and interpretation errors
while communicating it. A second step is to be transparent when showing/visualizing the
uncertainty at different levels. Only then, the overall quality of data can be assessed, and users
can use the data in their work.” (EU-JRC, 2015).
The European Joint Research Centre (EU-JRC, 2015) introduced a concept of the “data
curator” for the different elements of data production, including (but not limited to) the:
- Calculation of codified values of database fields accompanied with method used;
- Identification of unclear or missing values that should be investigated;
- Conversion into the unit defined by methodology;
- Utilization of external references for the validation and verification process; and
- Applying an event identifier to provide relations to background information which is
not (primarily/necessarily) part of disaster loss database, e.g., hazard event
characteristics.
For most components of the basic range of disaster-related statistics, particularly the
disaster impacts and many of the variables used for risk assessment, the data curator is typically
the disaster management agency, or equivalent national institution. However, national statistics
offices and other ministries or agencies will often retain the primary responsibility for many of
the background statistics that are used in the impacts and risk assessments, such as baseline
statistics on the population and economy.

DISASTER-RELATED STATISTICS FRAMEWORK (DRSF)
Page 68 Expert Group on Disaster-related Statistics in Asia and the Pacific
Prioritization
One of the purposes of developing a basic range of disaster-related statistics is to help
national statistical systems to identify and adopt priorities for statistical development for disaster
risk management. For statistical systems at an early stage of the development of nationally
harmonized disasters statistics, a limited core, first-tier compilation of statistics should be
established as a basis for gradually expanding into a broader collection of data in the future.
The Sendai Framework and SDG targets provide broad macro-scale priorities for policy
and a common international approach to monitoring progress. Within the basic range tables (see
Annex) the input variables used (as numerators or denominators) in the internationally adopted
indicators (SDGs and Sendai Framework) have been highlighted.
Some data inputs are utilized for multiple analytical purposes and appear as basic
building blocks in multiple components of the basic range of disaster-related statistics, thus they
are systemically important priorities for establishing a basic range of statistics. For example, the
primary characteristics of a disaster occurrence (see Figure 3 in Chapter 2): timing, location,
hazard type and magnitude, are minimum requirements to identify disasters and describe their
basic characteristics. These are core data elements for developing databases and time series
statistics on disaster impacts.
Another example of systemically important data are the inputs used for exposure
statistics, (population, land and infrastructure) in hazard areas. These statistics are used for risk
assessment, emergency response and as baseline statistics for measuring impacts after a disaster.
Another factor for prioritization is the current priority policy questions for decision-
makers in the country. These priorities will vary but some common priorities can be identified
for each of the main types or phases of disaster risk reduction decision-making (see Chapter 6).
The prioritization of qualitative aspects of the statistics, e.g., relevance, precision,
timeliness) is a function of the expected uses. For example, if the statistics will be utilized in time
series analysis (e.g. indicator reporting and monitoring over time, then consistency, metadata
transparency and international comparability are priorities for making the data accessible for
their intended uses. In contrast, during an emergency, urgent accessibility to data at flexible
scales (including detailed geographic reference with the best available accuracy) are the first
priorities.
Case studies developed Expert Group on Disaster-related Statistics in Asia and the Pacific
show examples of how official statistics can be used or presented in a variety of way, in maps and
tables, to meeting multiple purposes, potentially expanding upon the basic range of disaster-
related statistics.
Statistics for relatively large disasters benefit from greater attention from post-disaster
assessments and specially targeted data collections after the occurrences. Smaller and more
frequent disaster occurrences will also have data on impacts collected and compiled into national
databases, but they will rely more heavily on the regular and continuous sources of official
statistics, such as including questions in household surveys or extracting information from
monitoring systems operating in areas of the country exposed to hazards. Therefore, an
additional consideration for prioritization is addressing challenges with coverage of extensive

DISASTER-RELATED STATISTICS FRAMEWORK (DRSF)
Expert Group on Disaster-related Statistics in Asia and the Pacific Page 69
disaster risks, or the small and medium-scale disasters, that may not be as well captured by the
existing compilations of impacts data and analysis.
Development of Technical Standards
After a suitable institutional environment has been established, with development of
priorities, responsible agencies are ready to establish standards for developing the databases for
harmonization and consistency in the variables over time. Key steps towards achieving technical
standardization or harmonization for the content of national databases are:
a. Identify a basic range of statistics and mapping of existing data sources (see Chapters
8 and 9);
b. Adopt common definitions, an official glossary of hazard types (for statistical
purposes), classification systems (where relevant), and standards for measurement
units for each variable across the involved institutions producing official data.
(Reference tools for this step are provided in Chapters 7 and 8); and
c. Develop database structure and establish sustainable and regular compilations of
data using SDI.

DISASTER-RELATED STATISTICS FRAMEWORK (DRSF)
Page 70 Expert Group on Disaster-related Statistics in Asia and the Pacific
CHAPTER 7: BASIC RANGE OF DISASTER-RELATED STATISTICS
A collection of summary statistics tables was developed for the DRSF as the basic
templates for extracting statistics from the underlying databases in line with the
recommendations in this handbook and comprehensively for the basic range of disaster-related
statistics. The DRSF Basic Range of Disaster-related Statistics tables are presented in the Annex
and also are available in spreadsheet (.xls) format on the expert group’s website.42 The Basic
Range of Disaster-related Statistics tables was developed based on pilot studies and extensive
discussions by the expert group. Each variable is a potential output from querying the national
disaster-related statistics databases. The tables are comprehensive of the basic range according
to multiple purposes by national agencies according to their own needs, such as for gap
assessments.43
Most of the statistics in the basic range are compatible with GIS, meaning that the
variables are associated with a standardized system of geo-referenced coding.
One of the advantages of working with data in geographic information system (GIS) is that
statistics can be produced and calculated and reported flexibly at different geographic levels
according to administrative and/or functional classifications of geographic areas (e.g. provinces,
municipalities, river basins, buffer areas, hazard areas). The sample DRSF basic range tables
provide a generic presentation (“Geo Region 1”, “…”), adaptable to the different needs or
availability of geographically disaggregated data.
A general minimum recommendation for the disaster impacts statistics is to attribute
human and material impacts according to the district or municipality level of administrative
region.
The basic range of disaster related statistics is organized according to generic tables or
categories of tables, as follows:
o A: Summary tables of disaster occurrences;
o B: Selected background statistics and exposure to hazards;
o C: Summary tables of human impacts;
o D: Summary tables of direct material impacts in physical terms;
o E: Summary tables of direct material impacts in monetary terms;
o F: Summary of material impacts to Agriculture;
o G: Summary table of direct environmental impacts; and
o DRRE: Disaster risk reduction expenditure accounting
42 http://communities.unescap.org/asia-pacific-expert-group-disaster-related-statistics/content/drsf
43 Note: these tables are not designed for international collection of or monitoring of statistics using. The tables are
presented as a tool for use by agencies responsible for developing relevant official statistics. The only relevant
internationally agreed monitoring systems are the Sendai Framework Monitor and the SDG Indicators.

DISASTER-RELATED STATISTICS FRAMEWORK (DRSF)
Expert Group on Disaster-related Statistics in Asia and the Pacific Page 71
The scope for the basic range of disaster-related statistics (Figure 2.2) can be summarized
in terms of a basic timeline, in relation to the cycle of disaster management. This relates to before,
during and after the disaster occurrence.
Figure 7.1
Basic range of disaster-related statistics before, during and after a disaster
Summary tables of disaster occurrences (A tables)
Identifying a disaster occurrence is an essential element for centralized compilations of
impacts statistics because of the need to attribute impacts specifically to disasters (Chapter 2).
Additionally, long-term series of data on disaster occurrences and their basic characteristics
(geography, timing, hazard type) are useful for many different types of trend analyses, such as
the dynamics of risk and for measuring the relative intensity of impacts from individual
occurrences over time.
A register or listing of disaster occurrences with data on their basic characteristics is the
basic structure that has been used in Desinventar as in the sample below, drawing from the
example seen previously, in Chapter 2.

DISASTER-RELATED STATISTICS FRAMEWORK (DRSF)
Page 72 Expert Group on Disaster-related Statistics in Asia and the Pacific
Sample of registry of disaster occurrences
Code Geo 1 Geo 2 Geo 3 Geo 4 Em.
beginning
Em. End
(d-m-y)
Fl2018-01-THA Central
Region
Chao Phraya
River Basin
Samut
Prakan
Central
District
01-05-18 04-05-18
Dr2019-01-THA Northeast Mekong Roi Et 01-06-18 01-06-18
…… …… …… …… …… …… ……
Table A1 (see annex) is an organized extraction (or database query) from these types of
basic records on disaster occurrences as initially recorded and archived by disaster management
agencies. Logical groups for organizing statistics on disasters and their impacts are by geographic
regions and by types of hazard, over time.
Selected background statistics and exposure to hazards (B tables)
A basic range of background statistics used in risk assessments are summarized in tables
B1, B2, and B3.
Exposure to hazards is generally calculated by disaster management agencies, utilizing
statistics from various sources for mapping hazards and mapping exposure of population, land
and infrastructure derived from the existing official sources.
Measures of vulnerability are potentially vital background statistics, but difficult to define
a priori and may involve complex relations with multiple factors. To develop an empirical
approach to measuring vulnerability prior to a disaster, there is a need to develop a basic
minimum selection of categories for disaggregated statistics describing the population and
infrastructure, especially for hazard areas, as was developed as an example in Table B1b:
Population Exposure by social groups, as:
• Age groups;
• Sex;
• Urban vs. rural populations;
• Persons with disabilities; and
• Economic poor (income below national or international poverty)
By agreement in the Sendai Framework, governments report on number of people per
100,000 that are covered by early warning information through local governments or through
national dissemination mechanisms. These and other underlying statistics for describing coping
capacity, or resilience, to disasters could be extracted from official databases to produce a
summary resembling table B3: Coping Capacity Background Statistics.
There are also background statistics compiled on a regular basis primarily for other
purposes that may need to be investigated for estimating magnitudes of impacts in disaster areas.
An example (not included in tables in the Annex) is collection of data on crop values, on average
by growing areas, which are used for estimation of economic impacts to agriculture.

DISASTER-RELATED STATISTICS FRAMEWORK (DRSF)
Expert Group on Disaster-related Statistics in Asia and the Pacific Page 73
Summary tables of human impacts (C tables)
Impacts statistics (C, D, and E tables) are collected and coded in association with each
individual disaster occurrence, following the basic model in Figure 4.1 and could be summarized
as annual or multi-year statistics according to hazard types, geographic region, and according to
demographic and social categories (where applicable).
These records can be summarized in statistics for each variable according to hazard types
or geographic regions for annual monitoring by utilizing the references to the characteristics of
the disaster occurrences.
Figure 7.2
From Data Model to Summary Tables
As mentioned in Chapter 4, a simple aggregation across human impacts creates multiple
possibilities for double-counting of the same individuals. This issue is potentially managed by
estimation of numbers of multiple impacts to the same individuals for an adjustment at the
bottom of the table. If it is possible to adjust for double-counting in the totals, there will be two
related but conceptually distinct aggregated counts across human impacts categories (see bottom
of C tables)44: the total number of impacts, including individuals impacted in multiple ways
(which is the Sendai Framework “affected population” indicator) or the number of people
experiencing one or more impacts.
For disaggregation by social groups, references to national definitions should be applied,
and documented clearly in metadata for: urban and rural, poor (i.e. national poverty line if it
exists), and persons with disabilities. Sex and age disaggregation can have a variety of uses in
analysis and should always be included in compilations of human impacts wherever possible. It
is recognised that practices may differ across countries (e.g. for defining age group categories).
The Sendai Framework Monitor compiles statistics from reporting agencies on impacts by three
44 For example, if as direct consequence of a disaster, two people are injured, and one person is both injured and had
her house destroyed, the total number of persons impacted is 2 and the total number of human impacts (Sendai
Framework indicator B1) is 3. Neither figure is wrong, they are simply measurements of slightly different things.

DISASTER-RELATED STATISTICS FRAMEWORK (DRSF)
Page 74 Expert Group on Disaster-related Statistics in Asia and the Pacific
categories: 0-15, 16-64 and 65+. However, as discussed in Chapter 4, other groupings, e.g. a
category for infants (e.g. 0-4 years old) may be important for assessing vulnerability.
Summary tables of direct material impacts (D tables)
Direct material impact (D) tables are for recording direct material impacts in "physical"
terms, such as area (sq. m.) of damages or number of buildings, by categories. Recommendations
for physical measurement units are presented later in this Chapter.
Direct impacts to cultural heritage and to the environment are identified separately due
to special characteristics regarding measurement units and monetary valuation. Cultural heritage
is unowned (or part of public owned infrastructure) with special value to the population and often
they are irreplaceable.
Disruptions of basic services from a Disaster (D2 tables) are presented as an optional
extension of direct material impacts tables, especially impacts to critical infrastructure. In the
Sendai Framework, disruptions to services are consequence of damaged or destroyed
infrastructure and the global indicator refers to statistics on numbers of units of critical
infrastructure damaged or destroyed. However, some national agencies are also collecting data
number of people affected and length of time by the types of disruptions.
Summary tables of direct material impacts in monetary terms (E
tables)
Material impacts are estimated at first in physical terms (D tables) and then, compilations
of the costs for reconstruction or replacement are applied to produce international indicators on
Direct Economic Loss according to the Sendai Framework indicators (E tables). Also, the FAO
developed a table, consistent with the DRSF format (Table F), which specifies the scope of basic
range material impacts statistics relevant to agriculture, forestry, and fisheries.
The direct material impacts in monetary terms are broadly the same as direct material
impacts (D tables), the difference being that the measurement units is amount of money.
Monetary valuations of material impacts needed for calculating direct economic loss (SDG 1.5.2
and Sendai Framework Target C indicators) are based, in most cases, according to the costs of
reconstruction or replacement of damaged or destroyed assets.
As discussed in Chapter 4, the monetary values compilations for material impacts
normally requires a combination of data sources, including insurance claims assessments or
assessments for cost of reconstruction, the recorded values of assets prior to a disaster (where
available), records of actual transactions for recovery of damages (expenditure on post-disaster
reconstruction) and average costs of crops or other exposed assets for estimating costs of
damages based on average per unit values.
Summary material impacts to Agriculture (F table)
The FAO developed a table, consistent with the DRSF format (Table F), which specifies the
scope of basic range material impacts statistics relevant to agriculture, forestry, and fisheries, by
hazard types.

DISASTER-RELATED STATISTICS FRAMEWORK (DRSF)
Expert Group on Disaster-related Statistics in Asia and the Pacific Page 75
Impacts to agriculture presents some special considerations regarding measurement
units, and particularly for monetary valuation of the impacts (see discussion in Chapter 4).
Summary tables of direct environmental impacts (G tables)
Environmental impacts variables (G tables) are built upon a nationally standardized
classification of land cover types (such as the 14-class example presented in the G tables in the
Annex). There are also functional categories of land cover that could be of special interest for
assessing direct impacts such as designated biological reserves and World Heritage sites.
Monitoring impacts to water resources, ideally, should be an extension of data collection
and monitoring programmes of national and regional water authorities.
Emissions of sulphur associated with volcanic eruptions and carbon emissions from
wildfires are typically estimated by institutions responsible for official scientific monitoring of
atmospheric conditions. Some national space agencies or other international scientific
organizations are monitoring these emissions globally.
Disaster Risk Reduction Expenditure and Transfers (DRRE Tables)
The DRRE tables are sample accounting tables, to be developed as special functional
accounts or “satellite accounts” of the national accounts, following, as much as possible, the
standard practices of the System of National Accounts (SNA).
While disasters, and their impacts, are occurring randomly, disaster risk reduction is a
continuous activity. Certain activities such as post disaster reconstruction are boosted in the
recovery period after a major disaster and are related to disaster response and informed by the
gradual improvements in knowledge on disaster risks and strategies to minimize them.
The disaster risk reduction activity accounting tables have been developed in alignment
with the standards and formats of the System of National Accounts (SNA) because the information
in these tables are extractions from the broader aggregated accounting framework for the whole
economy. In principle, DRRE tables could be derived from the same data sources that are used in
national accounts. This is dependent on the possibility of separately identifying the portions of
activities with a primary disaster risk reduction purpose.
Measurement units for material impacts statistics
Recommendations for measurement units for the objects of material impacts as classified
in Chapter 6 and in the D tables are specified below. Measurement units are a basic and vital
consideration for the design of basic data collections on impacts and their compilation into
nationally centralized databases.
There are multiple possibilities for measurement units and for material impacts statistics
and national compilations should aim to converge toward consistency across disaster
occurrences for improved quality of disaster impacts time series statistics. The options are not
mutually exclusive, and for some cases, e.g., dwellings it is necessary to collect the same
information in multiple units of measurement, e.g., number of people and number of units.

DISASTER-RELATED STATISTICS FRAMEWORK (DRSF)
Page 76 Expert Group on Disaster-related Statistics in Asia and the Pacific
Thus, presented below is a ‘menu’ of recommendations for measurement units by
category of material impacts, focussing on critical infrastructure and noting that for some cases
multiple options from the menu might be selected for data collection.
Infrastructure is heterogeneous by nature. It includes buildings, equipment, land, and
inventories. There is no possibility to produce an aggregated count of total damages to critical
infrastructure without a common unit of measurement across all the relevant types of assets (i.e.
monetary valuation).
Initially impacts to critical infrastructure are observed in physical terms, individually for
each type of infrastructure or type of damages. For many types of critical infrastructure, a simple
option is to count number of units, e.g., buildings, and where possible these counts are made more
meaningful by utilizing categories already used in statistics or in their management by
governments. For example, many countries use a tiered system to classify the different types of
health facilities (from large hospitals down to small clinics). Thus, databases could keep records
of numbers of tier 1, tier 2 and tier 3 facilities damaged or destroyed over time.
Defining the measurement units applies both to statistics on impacts and statistics on
exposure of critical infrastructure, prior to the disaster. These compilations need to be
coordinated closely with the relevant ministries, e.g., Ministry of Education, Ministry of Health,
and Ministry of Transport who are typically responsible for official categorizations of facilities (if
available) and the general monitoring and management of the infrastructure.
Menu of physical measurement units for material impacts
Measurement units
Dwellings No. of units
(households)
No. of people Area in sq. m.
Critical infrastructures
Hospitals, health
facilities
No. of buildings by
official category (tier 1,
tier 2,)
capacity (no. of
beds)
sq. m.
Education facilities No. of buildings by
official category (tier 1,
tier 2,)
capacity (no. of
students)
sq. m.
Other critical public
administration
buildings
no. of units
Public monuments no. of units
Religious buildings no. of buildings by
official category
Roads km capacity (avg. daily
traffic affected)
no. of roads by
official category
Bridges km capacity (avg. daily
traffic affected)
no. of bridges by
official category
Railway km Capacity (avg. daily
passenger and/or
tonnes of shipping)

DISASTER-RELATED STATISTICS FRAMEWORK (DRSF)
Expert Group on Disaster-related Statistics in Asia and the Pacific Page 77
Airports no. of buildings by
official category
capacity (avg. daily
traffic affected)
Ports no. of units by official
category
capacity (avg. daily
traffic affected)
Transport equipment no. of units
Electricity generation
facilities
no. of units capacity (no. of
people affected)
Electricity grids no. of units capacity (no. of
people affected)
ICT Equipment capacity (no. of people
affected)
no. of units
Dams no. of units by official
category
no. of units capacity (no. of
people affected)
Water supply
infrastructure
no. of units capacity (no. of
people affected)
Water sewage &
treatment systems
no. of units capacity (no. of
people affected)
Agriculture land,
livestock, fish stocks,
and managed forests
sq. km capacity (food
production
affected)
Dwellings
For the special case of dwellings, the number of units is mostly aligned with number of
households impacted. Individual buildings may have multiple units, e.g., apartment buildings
affected by a disaster and the number of units should be developed as a good approximation for
the number of households affected by damaged or destroyed dwellings, i.e., counts of units, not
counts of buildings.
If basic data on the number of individuals residing within each affected dwelling are not
available for the impacts assessment, this can be estimated based on statistics on average
household size within the affected area. However, compilers should take into account that
household sizes vary geographically and by other factors, e.g., poverty that are also potentially
correlated to disaster impacts.
It’s also useful to compile data, where feasible, on estimated size or area of damages (in
terms of square meters of damage) as an input for estimating expected costs of the damages. The
severity of impacts is linked to the distinction a damaged or destroyed asset, an important
distinction especially in the case of dwellings because a destroyed dwelling results in temporary
or permanent displacement of the household and damages need to be repaired (either with or
without temporary displacement).
Dwellings No. of units
(households)
No. of
people
Area in sq. m Cost of impacts in local
currency
Damaged
Destroyed

DISASTER-RELATED STATISTICS FRAMEWORK (DRSF)
Page 78 Expert Group on Disaster-related Statistics in Asia and the Pacific
If data are available for identifying shares of cases of insured or uninsured losses, an
additional disaggregation could be introduced, such as:
Dwellings No. of units
(households)
No. of
people
Area in sq. m Cost of impacts in local
currency
Of which
costs insured
Of which
costs uninsured
Of which
insurance
status unknown

DISASTER-RELATED STATISTICS FRAMEWORK (DRSF)
Expert Group on Disaster-related Statistics in Asia and the Pacific Page 79
CHAPTER 8: DEFINITIONS AND CLASSIFICATIONS
Standard definitions and classifications for statistics are developed and adopted by
national and international agencies to ensure a reasonable comparability in use of terminologies
and in aggregated scope of measurement between countries and over time. Statistical
classifications group and organise information meaningfully and systematically, usually in
discrete, exhaustive and mutually exclusive sets of categories that are defined according to a set
of criteria for similarity. (Hancock, 2013)
Statistical classifications are exhaustive listings of the contents of defined categories, even
if not all elements are commonly measured currently as part of official statistical systems.
Exhaustiveness in the classifications is an important factor for the classification’s function as a
description for the groups of concepts, ideas, events, or objects that constitute the topic.
Classifications are tools for explanation and elaboration of coverage of the available data,
statistics, or indicators, including cases where not all elements are relevant or could be measured.
In other words, classifications do not define what should be measured in every instance, rather
they are tools for clarifying scope of measurement in each instance.
The United Nations Statistics Commission has developed a set of principles and essential
components for statistical classifications (Hoffman and Chamie, 1999). For development of new
classifications or categories for statistics, it is important to build on sound and established
concepts and practices but also incorporate emerging conceptual or technological innovations to
produce a system that will remain robust and applicable for the harmonization of statistics across
countries for producing time series statistics in the long-run.
During the development of DRSF, the Expert Group, identified three gaps in terms of
classifications systems or complete definitions for disaster-related statistics: (i) hazard types (ii)
the objects of direct material impacts, and (iii) disaster risk reduction activities (DRRCA).
In response to these gaps, the Expert Group developed a set of provisional
recommendations, including two proposed provisional classifications. This chapter elaborates
recommendations for development of these classifications, as a contribution to further
consultation, at the global level, towards increased international harmonization of related
statistics.
Further study is recommended, including pilot testing implementation by official national
agencies, for the following proposed provisional classifications and definitions, followed by
further consultations towards standardization at the global level, for all three of the topics
covered in this chapter.
Hazards types
As mentioned in Chapter 2, lists of relevant hazards are developed at the national scale,
in some cases according to official policy legislated by government. Disaster risk is also extremely
variable across country and regions within countries and not all hazard types are relevant in
each country. Thus, countries have different lists of relevant hazard types at the detailed level.
However, at the broad aggregated level, this diverse range of hazards can be summarized, for

DISASTER-RELATED STATISTICS FRAMEWORK (DRSF)
Page 80 Expert Group on Disaster-related Statistics in Asia and the Pacific
statistical purposes, in comparable aggregates that are useful for analysis of trends and for
informed risk reduction.45
Methodological guidance for monitoring the Sendai Framework indicators recommended
utilizing the IRDR Peril and Hazard Glossary (IRDR 2014). In IRDR (2014), the most aggregated
level in the classification is called the hazard “family”:
a. Geophysical;
b. Hydrological;
c. Meteorological and Climatological;
d. Biological; and
e. Other (e.g., technological and environmental hazards)
There are two additional categories of hazard types identified for monitoring the Sendai
Framework monitoring: “technological hazards”46 and “environmental hazards”.47.
Other types of hazards excluded from the scope of IRDR (2014) are violent conflicts,
including civil war and the associated human crises, e.g. refugee crises. The OECD estimates that
approximately 80 per cent of international transfers of humanitarian aid goes to complex
disasters and conflict-related settings.48. However, these circumstances are excluded from the
scope of Sendai Framework monitoring, according to the Report of the OEIWG (UN, 2015), which
excludes "the occurrence or risk of armed conflicts and other situations of social instability or
tension which are subject to international humanitarian law and national legislation".
The IRDR glossary has a hierarchic structure, meaning it presents multiple levels of
aggregation, called “Family” (see above), “Main Event”, and “Peril”. There are established lists of
hazard types for data collection in many countries, usually approximately corresponding with the
“Main Event” or “Peril” levels in IRDR (2013). However, for international comparisons the more
aggregated family level is the most comparable and suitable for a wide range of purposes.
There are also other aggregations or grouping of hazard types that are of particular
interest for trends analyses, such as climate-related disasters, which can be derived from a
grouping of IRDR hazard types. These are hazards in the meteorological and hydrological hazard
families as defined by IRDR (2014).49
45 For example, if country ‘A’ records statistics for floods, flash floods and country ‘B’ records statistics only for a generic
category called floods, the two countries’ statistics could still be broadly coherent and comparable at the level of
hydrological disasters.
46Technological hazards “originate from technological or industrial conditions, dangerous procedures, infrastructure
failures or specific human activities. Examples include industrial pollution, nuclear radiation, toxic wastes, dam failures, transport accidents, factory explosions, fires and chemical spills. Technological hazards also may arise directly as a
result of the impacts of a natural hazard event.”- UNGA (2015)
47 Environmental hazards “may include chemical, natural and biological hazards. They can be created by environmental
degradation or physical or chemical pollution in the air, water and soil. However, many of the processes and
phenomena that fall into this category may be termed drivers of hazard and risk rather than hazards in themselves,
such as soil degradation, deforestation, loss of biodiversity, salinization and sea-level rise.” - UNGA (2015),
48 See statistics on humanitarian aid at stats.oecd.org
49 Alignment with meteorological and hydrological families of IRDR can be broadly applied for scope for measurement
of climate-related disasters. However, some special distinctions may be needed in the details, for example to distinguish

DISASTER-RELATED STATISTICS FRAMEWORK (DRSF)
Expert Group on Disaster-related Statistics in Asia and the Pacific Page 81
Climate is “the synthesis of weather conditions in a given area, characterized by long-
term statistics (mean values, variances, probabilities of extreme values, etc.) of the
meteorological elements in that area.” (WMO, 2017). The Intergovernmental Panel on Climate
Change (IPCC) has indicated a strong likelihood that climate change will lead to increases in
frequency and severity of related hazards, and reduce overall predictability of such hazards based
on historical records (see, e.g., IPCC, 2012 and Birkman, 2013). Trends will be different and
unevenly distributed across the globe. Statistics are needed for assessing how climate change may
be impacting disaster risk for different countries or different regions over time.
A cascading multiple-hazard disaster occurrence is a disaster in which one type of
hazard, such as a strong storm causes one or more additional hazards, e.g., flooding or landslides,
creating combined impacts to the population, infrastructure and the environment. Cascading
multiple-hazard are not two events with proximate timing or locations by coincidence. They are
events that are causally linked to the same original trigger hazard, and thus are part of a single
(multi-hazard) disaster occurrence. Cascading multi-hazard disasters can be reported as their
own specialized category of hazard types, noting for categorization purposes the original trigger
hazard, e.g. storm, as well as the connected hazards, e.g., floods, landslide.
Given enough available data and the right monitoring infrastructure, slowly evolving
catastrophic risk or “slow onset disasters”50, can potentially be identified as major risks early
on in order to develop preventative and mitigation measures to reduce risks of impacts. A
“sudden-onset disaster”51 is characterized by having very little, if any, prior warning to a specific
event. Sudden-onset disasters do not always end as quickly and definitively as they begin.
Earthquakes, for example, often are followed with aftershocks. Volcanic eruptions can be either
sudden or slow-evolving disasters. Thus, one of the unfortunate and common characteristics for
both slow-onset and sudden-onset disasters is that they are difficult to determine, in concrete
measurement terms, exactly when the hazards begin and when the impacts of disasters cease.
Classification for objects of material impacts
A classification for objective material impacts is needed to define, delineate and create
comparability in scope of measurement for aggregated statistics on direct material impacts. The
European Joint-Research Centre (JRC, 2005) called these objects the “affected elements”.
The “affected elements” are a subset of all the exposed elements of the physical
infrastructure from the risk assessment statistics. They define the scope of disaster impacts in
terms of geographic areas, indicators, and (initially measured in physical terms) represent the
scope for valuations of direct economic loss indicators.
Implementation of this objective material impact classification is used to:
between fires that are accidents caused directly by human activities in urban area as compared to wildfires that are
consequences of extreme climate conditions (dry heat). Further study of relationships between hazard types and
analyses of climate change is suggested as an area for further study.
50 “A slow-onset disaster emerges gradually over time. Slow-onset disasters could be associated with, e.g., drought,
desertification, sea level rise, epidemic disease.” (UNGA, 2015)
51 “A sudden-onset disaster is one triggered by a hazardous event that emerges quickly or unexpectedly. Sudden-
onset disasters could be associated with, e.g., earthquake, volcanic eruption, flash flood, chemical explosion, critical
infrastructure failure, and transport accident.” (UNGA, 2015).

DISASTER-RELATED STATISTICS FRAMEWORK (DRSF)
Page 82 Expert Group on Disaster-related Statistics in Asia and the Pacific
a. create comparability in scope of measurement for aggregated statistics on disaster
impacts, e.g., direct economic loss measurement;
b. improve coherence in categorization or cross-disaster compilations of material
impacts statistics, noting that sometimes impacts assessments are conducted or
indicators calculated based on incomplete information; and
c. help establish linkages, where relevant, between post-disaster collection of data on
impacts by disaster management agencies with the existing systems of baseline
economic statistics and to address the specialized functional requirement for an
applied definition for critical infrastructure.
Recommendations on measurements units (size/length, area, etc.), for recording
statistics in physical terms for each of the affected objects are provided in Chapter 5
Although one of the principle recommendations for developing statistical classifications
(see Hancock, 2013) is, as much as feasible, to create statistical balance across the categories in a
classification structure, there is an intentional imbalance in the presentation below, mainly
because of the need for a detailed focus on critical infrastructure.
The classification below is designed as a comprehensive response to statistical demands
for disaster-related statistics. However, further testing and development is recommended
involving classifications experts and utilizing actual data collected on material impacts from a
disaster.
Most of the groupings and definitions utilized in this section come from one of two
sources:
a. The “Report of the open-ended intergovernmental expert working group on
indicators and terminology relating to disaster risk reduction” (2015), which was
further elaborated for the Sendai Framework Monitor in UNISDR (2017).
b. The 2008 edition of the System of National Accounts (UN, 2008), as well as some
aligned or related sources of definitions such as the International Central Product
Classification (CPC), Ver.2.1, the UN Central Product Classification (CPC ver. 2.1) and
the System of Environmental-Economic Accounts –Central Framework (SEEA).
Each object can be either damaged or destroyed. Damages are the partial physical
destruction to buildings or other objects. Destroyed assets are assets which are beyond repair.
A destroyed asset is a total loss in terms of asset value and replacement would require a complete
reconstruction.
The scope of this classification was developed in relation to the definition of assets from
the SNA, because the Sendai Framework definition for direct economic loss (see Chapter 2) refers
explicitly to impacts on assets. An exception is household consumer durables, which are not
assets according to the SNA definition, but are potentially important objects of direct material
impacts from disasters.

DISASTER-RELATED STATISTICS FRAMEWORK (DRSF)
Expert Group on Disaster-related Statistics in Asia and the Pacific Page 83
Draft provisional classification for objects of material impacts from
disasters
1. Buildings and structures
Buildings and related structures, fixtures or land improvements.
1.1 Dwelling
Residences, including residential buildings or parts of building or other structures used as
residences.
SNA defines dwellings as “buildings, or designated parts of buildings, that are used entirely or
primarily as residences, including any associated structures, such as garages, and all permanent
fixtures customarily installed in residences. Houseboats, barges, mobile homes and caravans used
as principal residences of households are also included, as are public monuments identified
primarily as dwellings. [SNA 10.68]; CPC Ver 2.1 class 5311.
1.2 Critical buildings and structures
Critical buildings and structures are defined as a specialized sub-category of buildings and
structures for disaster statistics.
The physical structures, facilities, networks and other assets which provide services that are
essential to the social and economic functioning of a community or society are critical buildings
and structures. [UNGA, 2015]. Most critical infrastructures are assets involved in providing non-
profit services, according to the SNA.
1.2.1 Healthcare facilities
Defined in CPC 5312 (“non-residential buildings”) heath care facilities are: health centres, clinics,
local, regional and tertiary hospitals, outpatient centres, health laboratories and in general
facilities used by primary health providers.
1.2.2 Education facilities
Defined in CPC under 5312 “non-residential buildings” education facilities are: play schools,
kindergartens, primary, secondary or middle schools, technical-vocational schools, colleges,
universities, training centres, adult education, military schools and prison schools.
1.2.3 Public monuments
Public monuments are identifiable because of their historical, national, regional, local, religious
or symbolic significance [SNA 10.78]. Public monuments include religious buildings or other
facilities that often have additional functions for the community, including as refuge or assembly
areas in the case of an emergency.
1.2.4 Other critical public administration buildings
Public buildings providing public services, other than those already mentioned are included in
this category.

DISASTER-RELATED STATISTICS FRAMEWORK (DRSF)
Page 84 Expert Group on Disaster-related Statistics in Asia and the Pacific
They include buildings used for refuge, assembly or as evacuation centres not otherwise classified
(e.g. excluding public monuments), as well as buildings belonging to emergency response
institutions, such as fire, police, army and emergency operation stations.
1.2.5 Roads
Defined in CPC under 532 “Civil engineering works”, roads include highways, paved roads and
unpaved roads.
1.2.6 Bridges
Defined in CPC under 532 “Civil engineering works”, bridges include road bridges and railroad
bridges.
1.2.7 Railway
Railways include surface railroads, underground railroads and railway stations.
1.2.8 Airports
Airports include international airports, National airports; “Passenger Transport Services (CPC
64) and Freight Transport Services (CPC 65).
1.2.9 Piers
Piers include National and International ports, Fisheries ports, and other docks and piers;
“Passenger Transport Services “(CPC 64) and “Freight Transport Services” (CPC 65)
1.2.10 Transport equipment
Transport equipment within SNA asset definition (excluding consumer durables) consists of
equipment for moving people and objects. Examples include products other than parts included
in CPC 2.0 division 49, transport equipment, such as motor vehicles, trailers and semi-trailers,
ships, railway and tramway locomotives and rolling stock; aircraft and spacecraft; and
motorcycles, bicycles, etc. [SNA 10.84]. It includes pipelines for transporting oil or gas.
1.2.11 Electricity generation facilities
Electricity generation facilities include, power stations and substations, refineries and CPC 532
“Civil engineering works”.
1.2.12 Electricity grids
Electricity grids include power grids, transmission lines; CPC 532 “Civil engineering works”.
1.2.13 ICT equipment
Information, computer and telecommunications (ICT) equipment consists of devices using
electronic controls and the electronic components forming part of these devices. Examples are
products within CPC 2.0 categories 452 and 472. In practice, this narrows the coverage of ICT
equipment mostly to computer hardware and telecommunications equipment. [SNA 10.85]; ICT
equipment includes telephone networks and other communication networks, related facilities for
internet connectivity, radio and television stations.

DISASTER-RELATED STATISTICS FRAMEWORK (DRSF)
Expert Group on Disaster-related Statistics in Asia and the Pacific Page 85
1.2.14 Dams
Dams are artificial barriers presenting the flow of water for one or more purposes, including
electricity production and water storage; CPC 532 “Civil engineering works”.
1.2.15 Water supply infrastructure
Water supply infrastructure includes drinking water supply systems (water outlets, water
treatment plants, aqueducts and canals which carry drinking water, storage tanks), wells, and
reservoirs; CPC 532: “Civil engineering works”.
1.2.16 Water sewage and treatment systems
Water sewage and treatment systems includes sanitation and sanitary sewage systems and
collection and treatment of solid waste; CPC 532: “Civil engineering works”.
1.2.17 Other critical infrastructures
Other critical infrastructures include buildings or structures with critical functions, particularly
for disaster risk reduction or other protection functions, not elsewhere included, such as
underground water infiltration trenches and storage systems, regional storm water reservoirs,
flood protection walls and river defences, drainage systems and water storage systems. It also
includes canals and other water management systems classified as critical but not included under
water supply or treatment systems above. It may also include military installations and weapons
systems.
1.3 Other buildings and structures
Other buildings and structures includes all other buildings and structures, defined according to
CPC and not designated as critical. These include commercial buildings or public government
buildings, or facilities not included as critical. Also included are waste management plants and
landfills and parks and green areas, or other permanent structures not otherwise classified.
2. Machinery and equipment
Machinery and equipment covers transport equipment, machinery for information,
communication and telecommunications (ICT) equipment, and other machinery and equipment.
2.1 Critical machinery and equipment
Critical machinery and equipment are defined as a sub-category of assets for disaster statistics,
particularly transportation, communication, and other equipment used for emergency response.
Critical machinery and equipment includes machinery and equipment used within critical
buildings or other structures for providing basic services, such as equipment in health facilities,
education facilities, and transportation equipment classified as critical.
2.2 Other machinery and equipment
Other machinery and equipment consists of machinery and equipment not classified as critical in
1.3. Examples include products included in the International Central Product Classification (CPC),
CPC Ver.2.1 divisions 43, general purpose machinery; 44, special purpose machinery; 45, office,

DISASTER-RELATED STATISTICS FRAMEWORK (DRSF)
Page 86 Expert Group on Disaster-related Statistics in Asia and the Pacific
accounting and computing equipment; 46, electrical machinery and apparatus; 47, radio,
television and communication equipment and apparatus; and 48, medical appliances, precision
and optical instruments, watches and clocks.
3 Environmental resources
3.1 Agricultural Land
Agricultural land consists of the ground, including the soil covering and any associated surface
waters, over which ownership rights are enforced and from which economic benefits can be
derived by their owners by holding or using them (SNA, 2018). Agricultural land includes the land
and improvements to land used for production of agriculture.
3.2 Managed forests
Managed forests include areas that have a long-term documented management plan. They include
planted forests, which are predominantly composed of trees established through planting and/or
deliberate seeding.
3.3 Primary/Natural forest
Primary/natural forests are defined as forest areas other than managed or planted forests. They
are naturally regenerated forests of native species, where there are no clearly visible indications
of human activities and the ecological processes have not been significantly disturbed. Key
characteristics of primary forests are that: (a) they show natural forest dynamics, such as natural
tree species composition, occurrence of dead wood, natural age structure and natural
regeneration processes; (b) the area is large enough to maintain its natural characteristics; and
(c) there has been no known significant human intervention or the last significant human
intervention occurred long enough in the past to have allowed the natural species composition
and processes to hav e become re-established. [SEEA 5.286]
3.4 Cultivated biological resources
3.4.1 Livestock
Livestock are animal resources yielding repeat products and includes animals whose natural
growth and regeneration are under the direct control, responsibility and management of
institutional units. They include breeding stocks, dairy cattle, draft animals, sheep or other
animals used for wool production and animals used for transportation, racing or entertainment.
Animals raised for slaughter, including poultry, are not fixed assets but inventories. (SNA)
3.4.2 Fish stock and fisheries
Fish stock and fisheries includes aquatic resources yielding repeat products, consisting of aquatic
resources maintained for controlled reproduction. These include aquatic plants (seaweeds),
crustaceans, diadromous fishes, freshwater fishes, marine fishes and mollusks.
3.4.3 Work-in-progress Agricultural Crops – for all primary crops
“Work-in-progress consists of output produced by an enterprise that is not yet sufficiently
processed to be in a state in which it is normally supplied to other institutional units. Work-in-
progress occurs in all industries, but is especially important in those in which some time is needed

DISASTER-RELATED STATISTICS FRAMEWORK (DRSF)
Expert Group on Disaster-related Statistics in Asia and the Pacific Page 87
to produce a unit of finished output, for example, in agriculture, or in industries producing
complex fixed assets such as ships, dwellings, software or films. Although work-in progress is
output that has not reached the state in which it is normally supplied to others, its ownership is
nevertheless transferable, if necessary. For example, it may be sold under exceptional
circumstances such as the liquidation of the enterprise.” [SNA 10.134]
See FAO Indicative Crop Classification (ICC)
3.4.4 Annual crops
Annual crops are those that are both sown and harvested during the same agricultural year,
sometimes more than once;
3.4.5 Perennial crops
Perennial crops are sown or planted once and are not replanted after each annual harvest. Annual
perennial crops include cereals, pulses, roots and tubers, sugar crops, some oil-bearing crops,
some fiber crops and vegetables, tobacco, and fodder crops. Perennial primary crops include
fruits and berries, nuts, some oil-bearing crops and spices and herbs.
3.5 Non-cultivated biological resources
Non-cultivated biological resources consist of animals, birds, fish and plants that yield both once-
only and repeat products over which ownership rights are enforced but for which natural growth
or regeneration is not under the direct control, responsibility and management of institutional
units. Examples are virgin forests and fisheries within the territory of the country. [SNA 10.182]
3.6 Water resources
Water resources consist of surface and groundwater resources used for extraction to the extent
that their scarcity leads to the enforcement of ownership or use rights, market valuation and some
measure of economic control. [SNA 10.184]
4. Valuables (SNA asset definition)
Valuables are produced goods of considerable value that are not used primarily for purposes of
production or consumption but are held as stores of value over time. Valuables are expected to
appreciate or at least not to decline in real value, nor to deteriorate over time under normal
conditions. They consist of precious metals and stones, jewellery, works of art, etc. Valuables may
be held by all sectors of the economy. [SNA 10.13]
4.1 Art objects, music instruments
Paintings, sculptures, etc., recognized as works of art and antiques are treated as valuables when
they are not held by enterprises for sale. In principle, museum exhibits are included under
valuables. [SNA 10.153]
4.2 Other valuables
Other valuables not elsewhere classified include such items as collections of stamps, coins,
porcelain, books etc. that have a recognized market value and fine jewellery, fashioned out of
precious stones, and metals of significant and realizable value. [SNA 10.154]

DISASTER-RELATED STATISTICS FRAMEWORK (DRSF)
Page 88 Expert Group on Disaster-related Statistics in Asia and the Pacific
5. Inventories (SNA asset definition)
Inventories are produced assets that consist of goods and services, which came into existence in
the current period or in an earlier period, and that are held for sale, used in production or for
other use at a later date. [SNA 10.142]
5.1 Inventories of agricultural crops
Includes all primary crops; see FAO Indicative Crop Classification (ICC)
5.2 Inventories of agricultural inputs
Products used as inventories in production of crops; includes seeds, fertilizer, feed, and fodder.
5.3 Other inventories
Other inventories include all other produced assets aligned with SNA definition for inventories.
6. Household consumer durables
Household consumer durables are durable goods acquired by households, which are held over
multiple accounting periods but are not used in a production process (and therefore not classified
as assets). An example is privately owned automobiles. The Classification of Individual
Consumption According to Purpose (COICOP), which is currently under revision, clarifies the
difference between durable versus non-durable or semi-durable goods.
Disaster Risk Reduction Characteristic Activities (DRRCA)
Classification
The Sendai Framework describes disaster risk reduction (DRR) as a scope of work “aimed
at preventing new and reducing existing disaster risk and managing residual risk, all of which
contributes to strengthening resilience. DRR encompasses all aspects of work including the
management of residual risk, i.e. managing risks that cannot be prevented nor reduced, and are
known to give raise to, or already, materialize into a disaster event.”
The DRR-characteristic activities (DRRCA) classification is presented as a draft tool for
defining and categorizing this specific domain of interest for the purpose of consistently
producing statistics on expenditures and transfers/investments for DRR (see Chapter 5).
The terms and definitions used in the proposed DRRCA classification are extracted, as
much as possible, from the Sendai Framework and terminologies agreed for Sendai Framework
Monitoring (see UNGA, 2015 and UNISDR, 2017).
The DRRCA classification and its definitions are provided to help compilers with
identifying and organizing the data and metadata from government finance statistics and should
be applied and adapted with more detailed descriptions at the national level.
DRRCA is a classification of activities. As such, it has a relationship, conceptually, to the
United Nations Standard Industrial Classification of All Economic Activities (ISIC), Revision 4.
Most DRR-characteristics activities are a part of government (and thus would relate to Section 0
in ISIC, Revision 4: “Public Administration and Defence; compulsory social security”), but there

DISASTER-RELATED STATISTICS FRAMEWORK (DRSF)
Expert Group on Disaster-related Statistics in Asia and the Pacific Page 89
can also be characteristic activities initiated by (or funded by) institutions outside of the public
sector, such as domestic non-profit institutions or international development organizations.
DRRCA classification
1. Disaster risk prevention
Activities and measures to avoid existing and new disaster risks.
1.1 Risk prevention in advance of hazardous event
Risk prevention in advance of a hazardous event is a concept and intention to avoid potential
adverse impacts of hazardous events. While certain disaster risks cannot be eliminated,
prevention aims at reducing vulnerability and exposure in such contexts where, as a result, the
risk of disaster is removed. Examples include dams or embankments that eliminate flood risks,
land-use regulations that do not permit any settlement in high-risk zones, seismic engineering
designs that ensure the survival and function of a critical building in any likely earthquake and
immunization against vaccine-preventable diseases.
1.2 Risk prevention in or after a hazardous event
Risk prevention in or after hazardous events relates to prevention measures taken to prevent
secondary hazards or their consequences. Included are measures to prevent contamination of
water supplies or measures to eliminate natural dams caused by earthquake-induced landslides
and/or rock falls.
2. Disaster risk mitigation
Disaster risk mitigation includes activities and measures to reduce or lessen existing disaster risk
or to limit the adverse impacts of a hazardous event. Mitigation differs from prevention in that it
is reactive to an identified and currently existing risk or impending threat. Thus, the activities
mitigate for specific threats, instead of general risk prevention.
2.1 Structural measures, constructions
Structural measures and constructions include any physical construction to reduce or avoid
possible impacts of hazards, or application of engineering techniques to achieve hazard
resistance and resilience in structures or systems. Common structural measures for disaster risk
reduction include constructed dams, flood levies, ocean wave barriers, earthquake-resistant
construction, and evacuation shelters. Structural measures will include “building back better”
after a disaster.
2.2 Non-structural measures
Non-structural measures are any measures not involving physical construction that uses
knowledge, practice or agreement to reduce risks and impacts through their integration in
sustainable development plans and programmes, through policies and laws, public awareness
raising, training and education typically to reduce vulnerability and exposure. Non-structural
measures may include risk transfers paid/received (e.g. insurance purchases).

DISASTER-RELATED STATISTICS FRAMEWORK (DRSF)
Page 90 Expert Group on Disaster-related Statistics in Asia and the Pacific
2.3 Land-use planning
Land- use planning can help to mitigate disasters and reduce risks by discouraging settlements
and construction of key installations in hazard-prone areas, including consideration of service
routes for transport, power, water, sewage and other critical facilities.
2.4 Early warning systems management
Early warning systems management incorporates inter-related sets of hazard warnings, risk
assessments, communication and preparedness activities that enable individuals, communities,
businesses and others to take timely action to reduce their risks.
3. Disaster risk management
Disaster risk management is the organization and management of resources and responsibilities
for creating and implementing preparedness and addressing all aspects of emergencies and
others plans to respond to, and to decrease the impact of disasters. The plans set out the goals
and specific objectives for reducing disaster risks together with related actions to accomplish
these objectives.
3.1 Preparedness
Preparedness is the knowledge and capacities developed by governments, professional response
and recovery organizations, communities and individuals to effectively anticipate, respond to,
and recover from, the impacts of likely, imminent or current disasters.
3.2 Emergency management
Emergency management includes national-level plans that are specific to each level of
administrative responsibility and adapted to different social and geographical circumstances. The
time frame and responsibilities for implementation and the sources of funding should be specified
in the plan. Linkages to sustainable development and climate change adaptation plans should be
made where possible.
3.3 Emergency supply of commodities
Emergency supply of commodities includes resources and responsibilities for providing
emergency support of commodities during a disaster.
3.4 Other disaster responses
Other disaster responses include provision of emergency services and public assistance by
private and community sectors, as well as volunteer participation.
4. Disaster recovery
Disaster recovery involves the restoring or improving of livelihoods and health, as well as
economic, physical, social, cultural and environmental assets, systems and activities, of a disaster-
affected community or society, aligning with the principles of sustainable development and “build
back better”, to avoid or reduce future disaster risk.

DISASTER-RELATED STATISTICS FRAMEWORK (DRSF)
Expert Group on Disaster-related Statistics in Asia and the Pacific Page 91
4.1 Relocation
Relocation is t the movement of people, for different reasons or circumstances because of risk or
disaster, permanently from their places of residence to new sites.
4.2 Rehabilitation
Rehabilitation involves the rapid and basic restoration of services and facilities for the return to
normal functioning of a community or a society affected by a disaster.
4.3 Reconstruction
Reconstruction involves the medium and longer-term repair and sustainable restoration of
critical infrastructures, services, housing, facilities and livelihoods required for full functioning of
communities and livelihoods of residents in a region affected by a disaster.
5. General government, research and development, education expenditure
5.1 General government expenditure for disaster risk reduction
General government expenditure for disaster risk reduction is expenditure, which must be
estimated indirectly, incurred by general government on both individual consumption goods and
services and collective consumption services, with an explicit disaster risk reduction purpose.
5.2 Research and development, risk assessment, and information
Risk assessments (and associated risk mapping) include: a review of the technical characteristics
of hazards such as their location, intensity, frequency and probability; the analysis of exposure
and vulnerability including the physical social, health, economic and environmental dimensions;
and the evaluation of the effectiveness of prevailing and alternative coping capacities in respect
to likely risk scenarios.
ISO 31000 defines risk assessment as a process made up of three processes: risk identification,
risk analysis, and risk evaluation.
Risk information includes all studies, information and mapping required to understand the risk
drivers and underlying risk factors.
5.3 Education for disaster risk reduction
Education for disaster risk reduction includes natural and engineering science, training of risks
professionals and risk specialist medicine professionals.

DISASTER-RELATED STATISTICS FRAMEWORK (DRSF)
Page 92 Expert Group on Disaster-related Statistics in Asia and the Pacific
CHAPTER 9: COLLECTION AND ANALYSES OF STATISTICS IN THE
DRM CYCLE
Statistics in this framework are derived from a wide variety of sources. Important data
sources for compiling the basic range of disaster-related statistics include:
• Population and housing census, household surveys,
• Monitoring data from geophysical, meteorological and geographic organizations,
• The national accounts and its sources such as enterprise surveys,
• Administrative records on the population (e.g. CRVS) and on public services (e.g.
education)
• Government finance statistics,
• Disaster management agency assessments and monitoring,
• Ministry of environment assessments and monitoring, administrative records of health
and safety institutions
• specialized surveys targeting disaster-affected households and businesses (where
possible)
Mapping the existing data sources with the prioritized requirements for a basic range of
disasters related statistics is crucial for development of disaster-related statistics.
Before a disaster
Risk statistics are the baseline information about the population or infrastructure
compiled prior to a disaster for risk areas whereas impacts statistics are information for
describing a population affected by a specific disaster occurrence and affected area. However,
the disaggregation of statistics on the human impacts, in many cases, simply mirror the categories
that were identified in the vulnerability assessments – e.g. children, the elderly and the income
poor. Eventually, collections and analyses of statistics before and after a disaster should become
a systematic and mutually reinforcing set of linked processes used to improve one another and
built upon the same basic initial data collections. For example, baseline statistics on economic
activity for areas exposed to hazards are reused for estimating costs of damages in impacts
assessments.
Components of basic range of disaster-related statistics: before a disaster
Exposure to Hazards
Vulnerability
Coping Capacity
DRR Activity
Risk assessment is a process to determine the nature, extent, and locations of risk, by
analysing exposure and conditions of vulnerability to hazards and present coping capacities
against all types of disaster impacts. A comprehensive risk assessment process consists of
understanding of current situation, needs and gaps, hazard assessment, exposure assessment,

DISASTER-RELATED STATISTICS FRAMEWORK (DRSF)
Expert Group on Disaster-related Statistics in Asia and the Pacific Page 93
vulnerability analysis, loss/impact analysis, risk profiling and evaluation and formulation or
revision of disaster risk reduction strategies and action plans.52
Risk assessment incorporates statistical information from past disasters in combination
with a broad variety of current social economic statistics for developing risk profiles in relation
to geographic data on potential hazards.
Population and social statistics for risk assessments
Population censuses and household surveys are critical sources of data on the population,
including their location and basic demographic and social characteristics. These data are the basic
inputs for measuring exposure and vulnerability to hazards.
Examples of descriptive statistics on the population used in risk assessment from the
population and housing census and household surveys are:
• Population density by location
• Characteristics of dwellings (e.g. construction materials)
• Median household disposable income
• Education enrolment, by sex, age group and level of achievement
• Information on assets of households, such as type of dwelling
• Other human development statistics, by age group, including evidence related to
nutrition and childhood health,
The primary sampling units for censuses (or census blocks) are instruments for
organizing census collection operations and usually contain somewhere between 50-350
households, depending on the country and region. The level of geographic aggregation for census
data that are available to most users is usually at the level of administrative region (e.g. provinces,
municipalities or administrative level 01, 02 and 03 – e.g. districts, provinces, regions).
Since censuses, in principle, include everyone, then it is possible to analyse census data at
a fine level geographic disaggregation as long as individual confidentiality is not compromised.
Estimation of exposure of population to hazards statistics on population is built upon at
the population data at the most detailed geographic scale (highest geographic resolution) as
available in order to overlay this information in GIS with the maps of hazard areas to calculate
the numbers in the overlapping areas.
Generally, the higher the geographic detail of the population aggregates, the more
accurate the estimates of population in hazard areas. Level of geographic disaggregation varies
by data sources, but the information can be integrated using GIS and utilized for multi-scale
analyses
For example, the Statistics Development Division of the Secretariat for the Pacific
Community (SPC) has developed a methodology to estimate coastal populations with higher
levels of geographic resolution than the administrative reporting areas, utilizing census data, see
52http://www.undp.org/content/dam/undp/library/crisis%20prevention/disaster/2Disaster%20Risk%20Reductio
n%20-%20Risk%20Assessment.pdf

DISASTER-RELATED STATISTICS FRAMEWORK (DRSF)
Page 94 Expert Group on Disaster-related Statistics in Asia and the Pacific
the SPC PRISM (see also Andrew et al., forthcoming). While the SPC mapping of coastal
populations was not developed specifically for disaster risk assessment, it is a good example of
the type of data and approach to compilations in GIS that is fundamentally important for risk
assessment and feasible using currently accessible datasets, such as census data at the highest
geographic level of disaggregation as available in the county.
Pilot studies for the population exposed to hazards estimation methodology conducted as
part of the DRSF pilot studies were conducted based on public access (admin 02 or Admin 03)
datasets and revealed that, with high quality data on built-up areas such as the DLR Global Urban
Footprint (GUF) produced from radar satellite images (accessible at https://urban-
tep.eo.esa.int/#), it is possible to use these census datasets to estimate exposures of population
in relation to hazard areas.
Censuses are conducted, in most cases, on a 10-year cycle, with intra-census period
updates made in between, based on projections and use of other sources like population
administrative records and surveys. An active collaboration for producing and sharing of these
statistics is needed between national statistics offices and the other entities in government with
the relevant geographic information on location of hazards and agencies responsible for
conducting risk assessments.
At the macroeconomic scale, summary statistics on structure of employment (e.g. shares
of employment by main categories of activity.) and metrics for levels of inequality can be used for
assessing vulnerabilities or coping capacity. Structural macroeconomic vulnerabilities can be
measured, in some cases, such as aggregated statistics on shares of employment or production
activities in agriculture, tourism, or other categories of potential interest for risk assessment. The
potential for producing such aggregated economic statistics according to hazard area should also
be investigated, such as via use of administrative data.
Mapping and environmental monitoring
One of the basic inputs for developing exposure statistics are land cover and land use
maps and, where available, the cadastres of municipalities. Land cover and land use maps, among
other kinds of geospatial information, provide the necessary baseline information for defining
specific geographic objects of interest in risk assessment.
Development of hazard maps and profiles should include, as much as possible, data and
lessons learntabout hazards from passed disasters. The other key components for developing
hazard maps are a collection of standard collections of national mapping and environmental
mapping agencies, such as:
• Elevation map, also known as the digital elevation model (DEM)
• Meteorological data (for predicting flood, landslide, drought)
• Distribution of solid types (important for predicting risk associated with earthquakes)
• Values for surface roughness (used in assessing tropical cyclone hazard)
• Slope and river flow values (flood)
• Slope and geological features for hillsides and mountain sides (landslide)
• Impervious surfaces (can increase risks associated with floods or storms)

DISASTER-RELATED STATISTICS FRAMEWORK (DRSF)
Expert Group on Disaster-related Statistics in Asia and the Pacific Page 95
• Scale, locations and other characteristics of investment in disaster risk reduction (such
as technical infrastructure)
• Monitoring signals of slowly developing risks approaching thresholds to a potential
disaster (e.g. changes of land use in disaster-prone areas, changing practices in
agriculture or fishing).
• Urban versus rural distribution of exposed areas
• Mapping of ecologically important areas or ‘hot spots’ and protected areas
• Mapped statistics on ecological condition53 or sites identified for environmental
degradation, e.g. polluted water bodies
Hazard maps are developed utilising specialized expertise relevant to each hazard, e.g.
earthquakes, volcanoes, extreme meteorological events, floods, tsunami, etc. Hazard data
typically are produced as official products by national meteorological, geological, hydrological,
disaster management, or other scientific organizations working within or in collaboration with
governments.
Hazard mapping also involves probabilistic modelling, utilizing the available data and in
relation to a defined time period (extreme events are more probable the longer the timespan
under study) and a confidence interval chosen by the experts. Different degrees of exposure or
probabilities of a hazard are used to produce multiple mapped layers according to different
expected degrees of risk (high, medium and low exposure).
Internationally, compilation of hazard maps, derived from a variety of sources and with
international scope can be found at UNEP-GRID54, the Group on Earth Observations’ Geoportal55
and the Pacific Catastrophe Risk Assessment and Financing Initiative (PCRAFI).56
On the exposure side, land cover and land use maps, as well as other sources of related
information, such as cadastres, maps of critical ecosystems or hotspots, maps of critical
infrastructure, and a broad range of other geographic information can be important inputs for
analyses in relation to hazards. In addition, statistics describing environmental condition, for
example related to the quality of water bodies or characteristics of forests, which are also
important inputs for use in measurement of factors of vulnerabilities to disasters.
GIS can be used for integration of a comprehensive repository of relevant geographic
information. Multiple layers of mapped data can be integrated to produce statistics relatively
simply if the maps can be gathered and consolidated into a centralized database for disaster risk
reduction purposes.
One of the key data sources for risk assessment, including for producing hazard
catalogues is remote sensing, and particularly satellite imagery. Land cover mapping and
mapping of impervious surfaces, human settlements, and built-up areas, for example, can be
53See Weber (2014)
54 www.grid.unep.ch/
55 http://www.geoportal.org/
56 http://pcrafi.spc.int/

DISASTER-RELATED STATISTICS FRAMEWORK (DRSF)
Page 96 Expert Group on Disaster-related Statistics in Asia and the Pacific
produced as a snapshot at different moments in time from interpretation of various forms of
satellite imagery, including visible light at daytime, night lights, radar imagery, and so on.
Disaster preparedness
In some cases, for example for slowly developing catastrophic risks like drought, high
probability of disaster impacts can be anticipated and therefore pre-emptively counter-acted by
localized boosting of coping capacities. This includes the development/enhancement of an overall
preparedness strategy, policy, and institutional structure. Warning and forecasting of
capabilities, and plans for helping at-risk communities by being alert and to hazards and ready
for action are key preparedness functions of governments.
Preparedness is defined as the knowledge and capacities developed by governments,
professional response and recovery organizations, communities and individuals to effectively
anticipate, respond to, and recover from, the impacts of likely, imminent or current disasters.
Preparedness exists at multiple scales, e.g.: household preparedness, preparedness of
communities, preparedness of disaster response facilities, and preparedness of countries or
regions within countries.
Statistics on household preparedness against disaster impacts have been collected in
many countries from household censuses or surveys by incorporating the topic into the
questionnaires (see examples in chapter 3 and in table B3 in the annex).
Where possible, statistics on the amounts and locations of investment in disaster risk
reduction (see Chapter 5) are important for assessing coping capacities in risk areas and for
monitoring effectiveness of such interventions, over time.
Relevant information at the community or higher scale of analysis include:
• Adoption and implementation national disaster plans;
• Type and number of shelters in place;
• Type and number of internationally certified emergency response and recovery
specialists; early warning systems for all major hazards;
• Emergency supplies and equipment stockpiles;
• Number of volunteers;
• Expenditure on disaster risk reduction;
• Total official international support (ODA) for DRR.
One of the critical elements of preparedness for many hazards types is coverage of the
population and business by early warning systems management. Early warning systems are
designed based on an optimization of risk reduction utilizing the results of risk assessments.
1. Use of early warning systems in the case of impending disaster is informed by statistics
on likelihood of the hazard and expected degree of impacts, according to the calculated exposure.
Below is a simplified example of a decision matrix for applying available data on exposure.

DISASTER-RELATED STATISTICS FRAMEWORK (DRSF)
Expert Group on Disaster-related Statistics in Asia and the Pacific Page 97
Sample of impact matrix for informing preparedness initiatives or developing
early warning systems
L
ike
lih
oo
d High
Medium
Low
Minor Moderate Severe
Potential Impacts
Source: World Bank (2016)
During a disaster
Disaster response are the “actions taken directly before, during or immediately after a
disaster in order to save lives, reduce health impacts, ensure public safety and meet the basic
subsistence needs of the people affected.” (UNGA, 2015).
A spatial data infrastructure (SDI) is an effective means for integrating relevant data
sources from the pre-disaster compilations, along with real time information about the disaster
occurrence for rapid assessment and decision-making by the disaster response authorities and
for response putting resources in the right places for efficiently meeting needs.
This includes geo-referenced data on:
• Timing and geographic location of the hazard
• Population exposure in hazard area
• Vulnerable groups in hazard area
• Critical infrastructure, including disaster emergency response facilities and shelters
inside and outside of hazard area
• Vulnerable areas, such as potentially hazardous areas which could increase the impact;
storage or use of hazardous substances, landfills, polluted areas, etc.
• Businesses in hazard area
• Agriculture in hazard areas
Statistics fit for the purpose for disaster-response, at minimum, are geo-coded; attached
with sufficient metadata to facilitate interoperability with operations systems; and are routinely
accessible, with emergency protocols.
The UN Office for the Coordination of Humanitarian Assistance (OCHA) and several other
cooperating agencies that work in humanitarian crisis situations have developed guidance for
rapid assessment57, as part of the emergency response during a disaster. Rapid assessments are
tools used for coordinated emergency response, rather than for producing statistics. However, in
many cases, the same data used for emergency assessments can be reutilized for estimation of
statistics on disaster impacts after the emergency period.
57 See, e.g., www.acaps.org

DISASTER-RELATED STATISTICS FRAMEWORK (DRSF)
Page 98 Expert Group on Disaster-related Statistics in Asia and the Pacific
Data collected during a disaster occurrence
Immediately after a disaster, the responsible agencies must first acknowledge the
situation of an emergency or of impacts to make a record for a disaster occurrence and assign a
unique identifier for the occurrence (see Chapter 2). Once this is established, a part of the
immediate disaster response will normally include a range of potential data collections for
estimating and recording statistics on the impacts.
A part of the response to disasters is provisioning various types of support to households
or enterprises. Depending on the nature of the disaster and capacities for response, this may
include:
• Support for evacuation or relocation
• Transfers of other basic needs like food, water, and other supplies
• Medical assistance and other emergency response services
• Transfers of financial resources to help local institutions with recovery efforts.
Support to households or businesses by local or national government agencies is
commonly accompanied by a system of registration and/or collection of basic information for
those receiving support. These administrative records from disaster response and recovery can
be digitally stored as non-public databases, from which statistics can be derived, including, if
designed properly, disaggregated statistics by characteristics like age and sex, disability,
employment, and income.
However, disaggregated information describing the characteristics of impacted
population may not be known at the time of the disaster and compilation of statistics is not the
priority during an emergency. Therefore, disaggregation of impacts may involve a secondary step
of estimation and linking between multiple data sources after the disaster (see below). For cases
where data on basic characteristics of people that were impacted are incomplete, the unknown
cases should still be recorded and classified as unknown (e.g. categories are male, female, and sex
unidentified), leaving the possibility for filling these gaps through estimation later.
The main responsibilities for compilation of statistics during the disaster are national
disaster management agencies, line-ministries (such as the Ministry of Interior, Ministry of
Agriculture, and Ministry of Health) and sub-national administrative bodies (such as municipal
administrations). Also, research institutions and NGOs (e.g., Red Cross or Red Crescent) play an
important role in disaster response and recovery, including collecting data during an emergency.
Noting that the verified statistics on disaster impacts may take some time to finalize,
eventually the data collected during, and as part of, the emergency response from a disaster can
be a crucial resource for producing impacts statistics and for potentially improving
methodologies for future risk or post disaster assessment methodologies.

DISASTER-RELATED STATISTICS FRAMEWORK (DRSF)
Expert Group on Disaster-related Statistics in Asia and the Pacific Page 99
After a disaster
Statistics for post-disaster assessment
Disaster recovery is the process of restoring or improving of livelihoods and health, as
well as economic, physical, social, cultural and environmental assets, systems and activities, of a
disaster-affected community or society, aligning with the principles of sustainable development
and “building back better”, to avoid or reduce future disaster risk. (UNISDR, 2017)
After an emergency period, NDMAs coordinate a process to compile data on impacts and
produce assessments of the impacts, that are used for multiple purposes, including to inform the
recovery but also for monitoring trends of impacts overtime (e.g. Sendai Framework monitoring)
and as inputs into future risk assessments.
The post disaster recovery may include:
• Relocation of people who, for different reasons or circumstances because of risk or
disaster, have moved permanently from their places of residence to new sites.
• Rehabilitation: the rapid and basic restoration of services and facilities for the return
to normal functioning of a community or a society affected by a disaster.
• Reconstruction: the medium and longer-term repair and sustainable restoration of
critical infrastructures, services, housing, facilities and livelihoods required for full
functioning of communities and livelihoods of residents in a region affected by a
disaster.
These elements of recovery may be captured in statistics through a combination of direct
observations by recovery organizations or related institutions along with estimations based on
analysis of trends in economic and social data (e.g. population movement and construction
activities) collected before and after a disaster as a part of the usual compilations of official
statistics. In this case many of the key data sources mentioned for risk assessment before the
disaster (e.g. census, economic statistics or land cover maps) come back into use, but with the
new post-disaster compilations, for making comparison to the pre-disaster situation.
Measures for the various forms of direct impacts (found in C, D, E, F, and G tables in the
annex) are also compiled in post disaster assessments, including Post-Disaster Needs Assessment
(PDNA) studies, using the conceptual framework and methodologies developed initially by the
Economic Commission for Latina America and the Caribbean (ECLAC) and now managed by the
UN Development Group, the World Bank and the European Union.58
PDNAs contain two perspectives: the quantifications of physical damages and economic
losses and the identification of socio-economic recovery needs based on information obtained
from the affected population.59 PDNAs also typically incorporate estimations for both direct and
indirect economic impacts. The DALA methodology “focuses on the conceptual and
methodological aspects of measuring or estimating the damage caused by disasters to capital
stocks and losses in the production flows of goods and services, as well as any temporary effects
on the main macroeconomic variables.” (ECLAC, 2003).
58http://www.undp.org/content/undp/en/home/librarypage/crisis-prevention-and-recovery/pdna.html
59http://www.worldbank.org/en/events/2017/06/12/post-disaster-needs-assessment-for-resilient-recovery

DISASTER-RELATED STATISTICS FRAMEWORK (DRSF)
Page 100 Expert Group on Disaster-related Statistics in Asia and the Pacific
Utilizing, where possible, data collected before and during a disaster to evaluate and
provide the context for measuring impacts, most of the basic range of impacts statistics will be
compiled through a combination of data sources in the weeks and months or years after a
disaster.60
Post-disaster assessment data sources
The common data sources and actions for collecting data for impacts statistics after a
disaster are summarized as follows.
First, there may have been a primary observation of material or human impact during a
disaster. These are the initial reports, during or immediately following an emergency, which are
subject to revision. An example is the disaster management agency or estimations of numbers of
dwellings damaged and destroyed based on observations during disaster recovery.
Second, compilations of statistics from administrative records from disaster response and
recovery along with related estimations of human impacts, such as number of individuals affected
by the damaged and destroyed dwellings.
Third, records from government authorities, insurance companies, or other sources of
data on degree of magnitude and monetary values for the material impacts and disruptions to
basic services.
Fourth, targeted follow-up surveys are designed, where possible, to collect additional
information and to fill gaps in information on impacts to the population and to businesses in the
affected area.
Fifth, analyses of regular sources of time series statistics, available before and after a
disaster, are used to test hypotheses and produce estimations on impacts. Relevant sources for
these impact assessments could include virtually all types of sources used in official statistics. Key
examples include the population and housing census, household surveys, business surveys and
censuses, the national accounts, employment surveys, and before-and-after satellite imagery.
For the economic valuation of the material impacts to assets from disasters (direct
economic loss), many sources need to be considered, especially: values for insurance claims, data
collected from establishment surveys or administrative records on reconstruction and recovery,
and estimations based on baseline statistics on infrastructure, average construction costs, and
detailed data from the sources of agriculture statistics (see Chapter 4).
Costs of disaster risk reduction characteristic activities, especially relevant expenses after
a disaster like reconstruction expenses related to the recovery, but also interventions for
mitigating impacts after disasters are compiled from common data sources, used in national
accounts, especially, in this case, administrative records on government expenditures.
60Previous studies (e.g. Groppo and Kraehnert) have shown the possibility for identifying potential long-term impacts
from disasters up to 10 years after the initial emergency because disasater may have effects on fundamental
development capacities such as education and early childhood development There is no current standard time frame
for a length of time reference for studying the effects of disasters. The time period may depend, among other factors,
on the nature of the hazard and the coping capacity of impacted communities.

DISASTER-RELATED STATISTICS FRAMEWORK (DRSF)
Expert Group on Disaster-related Statistics in Asia and the Pacific Page 101
Although, the national accounts are not a primary source of statistics for assessing direct
economic impacts of disasters, in principle all of the direct and indirect impacts of disasters are
incorporated in the national accounts, implicitly or explicitly.
For most countries in Asia and the Pacific, Africa and Europe, producing national accounts
is a responsibility of national statistics offices. However, in some countries, including in most of
the countries in Latin American and the Caribbean, national accounts are compiled by Central
Banks. Another arrangement (e.g. in the United States and in Thailand) is production of national
accounts by a specialized economic advisory council within the government. Regardless of the
institutional arrangements of a particular country, exchange of data and metadata and a
collaboration between national accounts and the centralized database on disaster impacts
statistics is an important step for validation, for creating coherence across the national statistical
system, and for identifying inputs for modelling the indirect impacts of a disaster.
Population and health administrative data after a disaster
The usual source of official records for deaths and causes of death, where it could be
determined, are civil registration authorities and the Ministry of Health, which is responsible for
maintaining and monitoring health information systems. In the event of a disaster, particularly
for large scale disasters, records for deaths or missing is, in the short-term, commonly tabulated
as part of the emergency response and initial assessment of human and material impacts from
disasters. These figures are reported by and to the different levels of local and national
government and usually at some stage are shared in official reports to the public.
For countries with well-functioning systems for registration of deaths, mortality statistics
are derived from administrative records (i.e. civil registration systems), which record all deaths
and causes of deaths. As most countries do not yet have fully comprehensive systems for
recording vital events, often surveys are used to supplement for producing statistics on
deaths. These statistics have many important uses for the broader statistical system, including for
estimating the rate of growth of populations and for investigating public health issues, such as
trends in mortality from different types of health challenges. These civil records are
complemented by broader health information systems (HIS), which are managed by health
ministries, in collaboration with resident health institutions, like hospitals. Health administrative
records contain confidential information, but can be utilized to produce broad summary statistics
that describe trends in the population without revealing private information about individuals.
A critical step for ensuring consistency in the statistical systems and completeness of data
across different applications of mortality statistics, is that the cases of deaths resulting from
disasters are also incorporated correctly and completely into the broader civil registration
system and aggregated mortality statistics for the country.
In principle, deaths are recorded in civil registers and/or in health information systems
according to a standard classification for causes of death. The current international classification
is called the international Statistical Classification of Diseases and Related Health Problems – 10th
revision, or ICD 10 (2016).61 ICD 10 is managed by the World Health Organisation(WHO). ICD10
does not include specific coding for deaths from disaster, but includes a general category for
“External Causes for Morbidity and Mortality” (codes V01-Y98), which includes classes for
61http://apps.who.int/classifications/icd10/browse/2016/en, https://icdlist.com/icd-10/index

DISASTER-RELATED STATISTICS FRAMEWORK (DRSF)
Page 102 Expert Group on Disaster-related Statistics in Asia and the Pacific
exposure to many different types of hazards that are either related to or beyond the scope of the
Sendai Framework.
The first group of external causes of mortality in ICD10 are related to accidents,
particularly transport accidents, which may or may not be relevant the scope of disaster risk
reduction, depending on if there was a direct relationship with a hazard fitting within the scope
of the Sendai Framework. The second group of external causes of mortality in the ICD10 index
include exposure to fire, smoke, or heat (X00-X19), or other types of hazards or “forces of nature
(X30-X39), and “accidental exposure to other specific factors” (X52-X58).
Many countries face challenges for producing statistics from civil registration of good
coverage for cause of death. Attributing deaths to disasters has special challenges. Where
possible, the preferred practice for official records on cause of deaths is diagnosis by a trained
medical professional. These professionals are trained for identifying diseases and other likely
internal causes of death. Typically, medical professionals are not trained and may not be
authorized to attribute deaths to a specific external event like a disaster.
A useful example to learn from and potentially to emulate for disaster-related deaths is
current practices for collecting, compiling and reporting statistics on traffic accidents. As
explained in an Information Note for by the Secretariat for the Pacific Community (SPC) and the
Brisbane Accord Group62, there are three main interacting sources of data used for compiling
statistics on road-related deaths:
• National Health Information Systems (HIS): for data on hospital admissions and
emergency room attendance due to traffic crashes and their outcomes, and deaths
certified by a medical practitioner.
• National Civil Registration (CR) Systems: for data on deaths both in and outside of
hospitals. These systems usually record cause of death (linked to the health
information systems and police records) as well, and may include outcomes from
coroner’s cases in countries where those processes are applicable.
• Police Incident Information Systems: for data on traffic incidents attended, including
data on both the outcome (in the case of an injury or death), and conditions that
contributed to the crash occurring. Other systems to collect data from first responders
- such as data from paramedical services (ambulance or fire service) may also exist
within the police information systems, health information systems or independently.
Overall, improvements to national systems for vital statistics, especially mortality and
cause of death statistics is an important priority for statistical development in many countries
and further progress in this domain more generally could also benefit the reliability and
completeness of statistics on disasters.
One of the other crucial uses for administrative data for disaster-related statistics is for
linking records of individuals from various administrative sources (including civil registration,
but also other sources related to, e.g. education enrolment, tax enrolment, etc.) with data collected
on disaster impacts. Linking with administrative data is a potential method for describing the
population affected in terms of relevant disaggregation categories – e.g. by sex, age, disability,
income, etc. These are estimated calculations for each category, based on linking records between
microdata on human impacts with the relevant administrative sources. Protection of
62http://www.pacific-crvs.org/images/doc/CRVS_Notes/Road_Related_Deaths.pdf

DISASTER-RELATED STATISTICS FRAMEWORK (DRSF)
Expert Group on Disaster-related Statistics in Asia and the Pacific Page 103
confidentiality is an important point for emphasis in the use of the administrative records after a
disaster, because these records need to be protected against use for identifying individuals.
Mapping and environmental monitoring
The prediction of probabilities of future events can be improved by information from past
disasters. Probability of hazards is dynamic (for example due to climate change). Therefore, the
probabilistic models need to be updated at regular intervals, integrating new information as it
becomes available.
The basic physical information, including areas affected by a hazard should be compared,
where feasible to the pre-disaster predicted hazard areas. Over time, mapping of information on
actual hazards, especially relatively frequent hazards, could be utilized to evaluate and improve
the accuracy of hazard mapping for disaster risk measurement and for risk reduction
interventions. However, the possibilities for mapping the disaster area (or ‘disaster footprint’)
vary depending on the hazard type and currently there are no standard methodologies yet for
post-disaster footprint mapping.
In addition to mapping the physical hazard, another post-disaster mapping exercise that
is potentially relevant both for improving pre-disaster risk assessments but also as a tool for
impacts assessment, is to define contiguous areas in which direct material impacts could be
observed.
Flood hazards are one the relatively simple cases. Flood areas can be mapped after a
disaster utilizing remote sensing to define the inundation area. An example was produced by
Columbia University, Center for International Earth Science Information Network (CIESIN) and
NASA Socioeconomic Data and Applications Centre (SEDAC), in which mapped data on historical
flood hazards from 1985-2003 was used to produce a global map of flood hazard frequency and
distribution.63 With the continuous development of disaster-related statistics globally, GIS-
compatible statistics for will become progressively accessible to governments for use in reducing
risks before and after disaster.
63 http://sedac.ciesin.columbia.edu/data/set/ndh-flood-hazard-frequency-distribution

DISASTER-RELATED STATISTICS FRAMEWORK (DRSF)
Page 104 Expert Group on Disaster-related Statistics in Asia and the Pacific
ANNEX
BASIC RANGE OF DISASTER-RELATED STATISTICS TABLES
Statistical tables are organised into worksheets according to basic components in the DSRF. The
variables represent queries from a disaster-related statistics database. The tables are
comprehensive of the Basic Range of Disaster-related Statistics and can be used by national
agencies as a tool for assessing gaps and identifying opportunities to produce new statistics for
disaster risk reduction.
Geo regions are officially designated geographic regions of relevance to the reporting, such as
national (aggregate), regional or province (admin 02), district (admin 03), or other geographic
regions important to the compilation or analysis, e.g. river catchments.
The relevant time period varies by tables and according to the analysis. For most impact
statistics, a time period of at least 3-5 years is the most relevant given randomness and large year-
to-year fluctuations in disaster occurrences and their impacts. DRRE tables, on the other hand,
should be compiled annually, as with other national accounts.
A Summary tables of disaster occurrences
A1 Summary table of disaster occurrences, by hazards types, scale, and geographic region
A tables count numbers of occurrences according to the hazards, scale and geographical
classifications. Disaster occurrences are background statistics, i.e. they are useful for providing
context variables for statistics in other tables
B Selected Background Statistics and Exposure to hazards
B1a Population Background Statistics and Hazard Exposure by geographic regions
B1b Population Exposure by social groups
B2 Exposure of Land and Infrastructure by Hazard Type
B3 Coping Capacity Background Statistics
B tables are for assessing availability of background statistics (sometimes also called "baseline
statistics") as well as hazard exposure statistics, which are compiled prior to disaster
occurrences, and updated over time according to the relevant categories (hazard types and
geographic zonings). Exposure statistics serve multiple purposes, in particular for calculating
indicators of risk, as well for assessing impacts.
C Summary tables of human impacts
C1 Summary table of human impacts by hazards types
C2 Summary table of human impacts by geographic regions
C3 Summary table of human impacts by demographic and social categories
C tables are for compiling data related to affected populations (impacts on people) according to
hazard types, geographic regions (national total, regions/states, municipalities, or river
catchments), and demographic and social categories (age, gender, urban and rural, poor, and
disabled). Selected optional sub-categories of impacts (e.g. major or minor injuries) are included
in the table for compilation and compilers may wish to insert additional sub-categories according
to the data availability and demand for statistics.

DISASTER-RELATED STATISTICS FRAMEWORK (DRSF)
Expert Group on Disaster-related Statistics in Asia and the Pacific Page 105
D Summary tables of direct material impacts in physical terms
D1a Summary table of direct material impacts by hazards types
D1b Summary table of direct material impacts by hazards types and geographic regions
D1c Summary of agricultural impacts by hazard types and geographical regions
D2a Disruption of basic services from a disaster by hazard type
D2b Disruption of basic services from a disaster, by geographic region
D tables are for recording direct material impacts in "physical" terms, such as area or number of
buildings. The supplemental category of "critical infrastructure" are included in the tables as an
initial proposal for measuring the critical material impacts of disasters from the disaster risk
reduction perspective.
E Summary tables of direct material impacts in monetary terms
E1a Summary table of direct material impacts by hazards types
E1b Summary table of direct material impacts by hazards types and geographic regions
E tables mostly replicate the D_MAT tables and are for recording the impacts in monetary values,
when it is relevant and possible, to calculate the direct economic losses, aligned with the Sendai
Framework definition
F Agriculture
F1 Summary of material impacts to Agriculture by hazards types
F1 was developed by FAO in alignment with requirements for Sendai Framework monitoring and
for presentation in DRSF.
G Summary tables of direct environmental impacts
G1 Summary table of direct environmental impacts by hazards types
G2 Summary table of direct environmental impacts by hazards types and geographic regions
G tables extend the compilations on direct material impacts to include impacts to the
environment.
DRRE Disaster risk reduction expenditure account
DRRE_Activ. Production expenditure account (current plus investment) by characteristic
activities
DRRE_Trans. Transfers expenditure account and DRR National Expenditure
DRRE are satellite accounting tables developed to assess the feasibility for compiling DRR
expenditure accounts based on existing data sources used in the national accounts or based on
reporting from NDMA and other partner agencies.

DISASTER-RELATED STATISTICS FRAMEWORK (DRSF)
Page 106 Expert Group on Disaster-related Statistics in Asia and the Pacific
A Summary of disaster occurrences
A1 Summary table of disaster occurrences, by hazards types, scale, and geographic
region Measurement units: counts of occurrences

DISASTER-RELATED STATISTICS FRAMEWORK (DRSF)
Expert Group on Disaster-related Statistics in Asia and the Pacific Page 107
B Selected Background Statistics and Exposure to hazards
B1a Population Background Statistics and Hazard Exposure by geographic
regions
Measurement units: see column at right

DISASTER-RELATED STATISTICS FRAMEWORK (DRSF)
Page 108 Expert Group on Disaster-related Statistics in Asia and the Pacific
B1b Population Exposure by social groups Measurement units: Number of people

DISASTER-RELATED STATISTICS FRAMEWORK (DRSF)
Expert Group on Disaster-related Statistics in Asia and the Pacific Page 109
B Disaster Risk Reduction Expenditure Account
B3 Coping Capacity Background Statistics

DISASTER-RELATED STATISTICS FRAMEWORK (DRSF)
Page 110 Expert Group on Disaster-related Statistics in Asia and the Pacific
B2 Exposure of Land and Infrastructure by Hazard Type Measurement units: see below table

DISASTER-RELATED STATISTICS FRAMEWORK (DRSF)
Expert Group on Disaster-related Statistics in Asia and the Pacific Page 111
C Summary of Human Impacts
C1 Summary table of human impacts by hazards types
Measurement units: Number of people, except 1.5.3, which is number of days

DISASTER-RELATED STATISTICS FRAMEWORK (DRSF)
Page 112 Expert Group on Disaster-related Statistics in Asia and the Pacific
C2 Summary of human impacts by hazard type and geographic regions
Measurement units: Number of people, except 1.5.3, which is number of days
1 - Summary of Human ImpactsRegion 1 Region 2 Region 3 …
Adjustment for multiple counting of
events by Regions (-)NATIONAL TOTAL
1.1 Deaths or missing SDG 1.5.1/Sendai A-1 SDG 1.5.1/Sendai A-1 SDG 1.5.1/Sendai A-1 SDG 1.5.1/Sendai A-1 SDG 1.5.1/Sendai A-1
1.1.1 DeathsSendai A-2 Sendai A-2 Sendai A-2 Sendai A-2 Sendai A-2
1.1.2 MissingSendai A-3 Sendai A-3 Sendai A-3 Sendai A-3 Sendai A-3
1.2 Injured or ill Sendai B-2 Sendai B-2 Sendai B-2 Sendai B-2 Sendai B-2
1.2.1 Major injuries
1.2.2 Minor injuries
1.2.3 Ilnesses
1.3 Displaced
1.3.1 Permanent relocations due to
destroyed dwelling Sendai B-4 Sendai B-4 Sendai B-4 Sendai B-4 Sendai B-4
1.3.2 Other Displaced
1.4 Dwellings Damaged
1.4.1 Number of people whose
houses were damaged due to
hazardous events
Sendai B-3 Sendai B-3 Sendai B-3 Sendai B-3 Sendai B-3
1.5 Loss of Jobs/occupations
1.5.1 Direct losses of
jobs/occupations in industry
and services
Sendai B-5 Sendai B-5 Sendai B-5 Sendai B-5 Sendai B-5
1.5.2 Direct losses of
jobs/occupations in agriculture
1.5.3 Losses of days of activity
1.5.3.1 Direct losses of days of activity
in agriculture
1.5.3.2 Direct losses of days of activity
in industry and services
1.6 Number of people
evacuated or receiving
1.6.1 Number of people who
receieved aid. Including food
1.6.2 Supported with evacuation
1.6.3 Non-supported evacuations
1.6.4 Number of people who
receieved aid after a disaster
1.7 Otherwise affected
1.8 Affected Population (no
of impacts)SDG 1.5.1/Sendai B-1 SDG 1.5.1/Sendai B-1 SDG 1.5.1/Sendai B-1 SDG 1.5.1/Sendai B-1 SDG 1.5.1/Sendai B-1
1.9 Multiple counts,
individuals (minus)
1.10 Total Human Impactas
(no of people)
Variables 1.4 an 1.3.3 based on measurement of damage and destruction to dwellings (material impacts tables)
Multiple counts is an adjustment for aggregation in terms of numbe of people (instead of number of impacts), see Chapter 6 for further explanation.

DISASTER-RELATED STATISTICS FRAMEWORK (DRSF)
Expert Group on Disaster-related Statistics in Asia and the Pacific Page 113
C3 Summary table of affected population by demographic and social categories Measurement units: Number of people, except 1.5.3, which is number of days

DISASTER-RELATED STATISTICS FRAMEWORK (DRSF)
Page 114 Expert Group on Disaster-related Statistics in Asia and the Pacific
D Summary tables of direct material impacts
D1a Summary table of direct material impacts by hazards types Measurement unit: see column at right

DISASTER-RELATED STATISTICS FRAMEWORK (DRSF)
Expert Group on Disaster-related Statistics in Asia and the Pacific Page 115
D1b Summary table of direct material impacts by hazards types and
geographic regions Measurement unit: see column at right
Geo Region 1 Geo Region 2 Geo Region 3 …Adjustment for multiple
counts by Regions (-)NATIONAL
TOTAL Measurement units
Direct economic material impacts
1-Direct impacts on fixed assets or consumer durables
1.1 Dwellings (number) no. of units
1.1.1 Dwellings destroyed (number) no. of units
1.1.2 Dwellings damaged (number) no. of units
1.2 Buildings and structures sq. km
1.2.1 Critical buildings & structures Sendai D-4 Sendai D-4 Sendai D-4 Sendai D-4 Sendai D-4 sq. m
1.2.2 Other buildings and structures sq. m
1.3 Machinery and equipment
1.3.1 Critical machinery and equipment Sendai D-4 Sendai D-4 Sendai D-4 Sendai D-4 Sendai D-4 no. of units
1.3.2 Other machinery and equipment no. of units
1.4 Consumer Durables
2-Direct impacts on valuables (SNA asset definition)
2.1 Art objects, music instruments no. of units
2.2 Other valuables no. of units
3-Natural resources
3.1 Land, incl. soil sq. km
3.2 Agriculture land sq. km
3.3 Primary forests sq. km
3.4 Livestock no. of units
3.5 Fish stocks sq. km
3.6 Freshwater sq. km
3.7 Other natural resources sq. km
4-Critical goods & services
4.1 Inventories (SNA asset definition)
4.1.1 Agriculture (incl. immature crops) tons
4.1.2 Inventories/ other products tons
5 Critical infrastructures [1.2], [1.3][1.2], [1.3][1.2], [1.3][1.2], [1.3]
5.1 Hospitals, health facilities Sendai D-2 Sendai D-2 Sendai D-2 Sendai D-2 Sendai D-2 no. of units
5.2 Education facilities Sendai D-3 Sendai D-3 Sendai D-3 Sendai D-3 Sendai D-3 no. of units
5.3 Other critical public administration buildings Sendai D-4 Sendai D-4 Sendai D-4 Sendai D-4 Sendai D-4 no. of units
5.4 Public monuments no. of units
5.4.1 Religious buildings no. of buildings
5.5 Roads km
5.6 Bridges no. of units
5.7 Rail stations km
5.8 Airports no. of units
5.9 Piers no. of units
5.10 Transport equipments no. of units
5.11 Electricity generation facilities no. of units
5.12 Electricity grids no. of people
5.13 ICT Equipments no. of units
5.14 Dams no. of units
5.15 Water supply infrastructure no. of units
5.16 Water sewage & treatment systems no. of units
5.17 Other critical infrastructures no. of units
6 Direct impact on cultural heritage
6.1 Direct impact on cultural heritage zones sq. km
6.1.1 UNESCO cultural heritage sites sq. km
6.1.2 National cultural heritage designations sq. km
6.1.3 Urban heritage sq. km
6.1.4 Other heritage designations sq. km
6.2 Direct impact on cultural heritage objects
6.2.1 Buildings and monuments no. of units
6.2.2 Cultural heritage valuables [2]
6.2.3 Other components no. of units
For definitions see Material Impacts Classification in Chapter 8
Distinguishing between damaged or destroyed is feasible for all variables and may be reported depending on demand. For the case of dwellings, destroyed dwellings results in displacement

DISASTER-RELATED STATISTICS FRAMEWORK (DRSF)
Page 116 Expert Group on Disaster-related Statistics in Asia and the Pacific
D2a Disruption of basic services from a Disaster by hazard type
Measurement unit: number of people and period of time

DISASTER-RELATED STATISTICS FRAMEWORK (DRSF)
Expert Group on Disaster-related Statistics in Asia and the Pacific Page 117
D2b Disruption of basic services from a Disaster, by geographic region Measurement units: number of people and period of time

DISASTER-RELATED STATISTICS FRAMEWORK (DRSF)
Page 118 Expert Group on Disaster-related Statistics in Asia and the Pacific
E Summary tables of direct material impacts in monetary terms
E1a Direct material impacts by hazards types
Measurement units: national currency (estimated costs for recovery
of damages)

DISASTER-RELATED STATISTICS FRAMEWORK (DRSF)
Expert Group on Disaster-related Statistics in Asia and the Pacific Page 119
E1b Summary table of direct material impacts by hazards types and
geographic regions Measurement units: national currency (estimated cost of damages)
Re
gio
n 1
Re
gio
n 2
Re
gio
n 3
Re
gio
n …
Ad
just
men
t fo
r m
ult
iple
co
un
tin
g o
f
even
ts b
y R
eg
ion
s (-
)
NA
TIO
NA
L T
OT
AL
1-Direct impacts on fixed assets or consumer durables
1.1 Dwell ings (number) Sendai C-4 Sendai C-4 Sendai C-4 Sendai C-4 Sendai C-4
1.1.1 Dwellings destroyed (number)
1.1.2 Dwellings damaged (number)
1.2 Bui ldings and structures
1.2.1 Critical buildings & structures Sendai C-5 Sendai C-5 Sendai C-5 Sendai C-5 Sendai C-5
1.2.2 Other buildings and structures Sendai C-3 Sendai C-3 Sendai C-3 Sendai C-3
1.3 Machinery and equipment
1.3.1 Critical machinery and equipment Sendai C-5 Sendai C-5 Sendai C-5 Sendai C-5 Sendai C-5
1.3.2 Other machinery and equipment
1.4 Consumer Durables
2-Direct impacts on valuables (SNA asset definition)
2.1 Art objects, music instruments
2.2 Other valuables
3-Natural resources
3.1 Land, incl . soi l
3.2 Agriculture land Sendai C-2 Sendai C-2 Sendai C-2 Sendai C-2 Sendai C-2
3.3 Primary forests
3.4 Livestock
3.5 Fish stocks
3.6 Freshwater
3.7 Other natural resources
4-Critical infrastructures [1.2.1]
4.1 Hospitals , health faci l ities Sendai C-5 Sendai C-5 Sendai C-5 Sendai C-5 Sendai C-5
4.1.1 Medical services during the emergency for people injured or
ill
4.2 Education facil i ties
4.3 Other critical publ ic administration bui ldings
4.4 Public monuments
4.4.1 Religious buildings
4.5 Roads
4.6 Bridges
4.7 Rai lway
4.8 Airports
4.9 Ports
4.10 Transport equipments
4.11 Electricity generation facil i ties
4.12 Electricity grids
4.13 ICT Equipments
4.14 Dams
4.15 Water supply infrastructure
4.16 Water sewage & treatment systems
4.17 Other critical infrastructures Sendai C-5 Sendai C-5 Sendai C-5 Sendai C-5 Sendai C-5
5-Restoration costs for Direct impact on cultural heritage Sendai C-6 Sendai C-6 Sendai C-6 Sendai C-6 Sendai C-6
7-Total Direct Economic Loss [1.1-1.3 + 2 + 3 + 4] SDG 1.5.2, Sendai C-1 SDG 1.5.2, Sendai C-1 SDG 1.5.2, Sendai C-1 SDG 1.5.2, Sendai C-1 SDG 1.5.2, Sendai C-1
Measurement units: national currency (estimated cost of damages)
6-Other direct costs associated with disaster recovery
(e.g. emergency medical services)
Monetary valuation for costs of material impacts normally requires a combination of data sources, particulraly: insurance claims assessments or assessments for cost of reconstruction, the recorded values of
assets prior to a disaster (where available), records of actual transactions for recovery of damages, i .e. expenditure on post-disaster reconstruction, and average costs of crops or other exposed assets for
estimating costs of damages based on average per unit values.

DISASTER-RELATED STATISTICS FRAMEWORK (DRSF)
Page 120 Expert Group on Disaster-related Statistics in Asia and the Pacific
F Material impacts to Agriculture
F1 Summary of material impacts to Agriculture by hazards types
Geo
-phy
sica
lH
ydro
logi
cal
Met
eoro
logi
cal &
Clim
atol
ogic
alBi
olog
ical
Oth
erTO
TAL
Mea
urem
ent
unit
s
1.1
Area
aff
ecte
d by
cro
p ty
pe
SDG
1.5
.2, S
end
ai C
-2SD
G 1
.5.2
, Sen
dai C
-2SD
G 1
.5.2
, Se
ndai
C-2
SDG
1.5
.2, S
enda
i C-2
SDG
1.5
.2, S
end
ai C
-2SD
G 1
.5.2
, Se
nda
i C-2
hect
ares
1.2
Stor
ed p
rodu
ce d
estr
oyed
Sen
dai
C-2
Send
ai C
-2Se
nd
ai C
-2Se
ndai
C-2
Sen
dai C
-2Se
ndai
C-2
tonn
es
1.3
Stro
red
inpu
ts d
estr
oyed
Sen
dai
C-2
Send
ai C
-2Se
nd
ai C
-2Se
ndai
C-2
Sen
dai C
-2Se
ndai
C-2
tonn
es
1.4
Equi
pmen
t/m
achi
nery
des
troy
edSe
nd
ai C
-2Se
ndai
C-2
Sen
dai
C-2
Send
ai C
-2Se
nda
i C-2
Send
ai C
-2un
its
1.5
Dis
coun
ted
yiel
d va
lue
of p
erre
nial
tree
s un
til r
epla
ntin
gcu
rren
cy
1.6
Post
-dia
ster
sho
rt-r
un m
aint
enan
ce c
osts
curr
ency
SDG
1.5
.2, S
end
ai C
-2SD
G 1
.5.2
, Sen
dai C
-2SD
G 1
.5.2
, Se
ndai
C-2
SDG
1.5
.2, S
enda
i C-2
SDG
1.5
.2, S
end
ai C
-2SD
G 1
.5.2
, Se
nda
i C-2
2.1
Num
ber
of a
nim
als
kill
ed
Sen
dai
C-2
Send
ai C
-2Se
nd
ai C
-2Se
ndai
C-2
Sen
dai C
-2Se
ndai
C-2
anim
als
2.2
Stro
red
prod
ucts
, fee
d an
d fo
dder
des
troy
edSe
nd
ai C
-2Se
ndai
C-2
Sen
dai
C-2
Send
ai C
-2Se
nda
i C-2
Send
ai C
-2to
nnes
2.3
Equi
pmen
t/m
achi
nery
des
troy
edSe
nd
ai C
-2Se
ndai
C-2
Sen
dai
C-2
Send
ai C
-2Se
nda
i C-2
Send
ai C
-2un
its
2.4
Dis
coun
ted
valu
e of
live
stoc
k pr
oduc
ts fr
om d
ead
anim
als
unti
l ful
l
reco
very
curr
ency
2.5
Post
-dia
ster
sho
rt-r
un m
aint
enan
ce c
osts
curr
ency
3-Fo
rest
rySD
G 1
.5.2
, Se
ndai
C-2
SDG
1.5
.2, S
enda
i C-2
SDG
1.5
.2, S
end
ai C
-2SD
G 1
.5.2
, Sen
dai C
-2SD
G 1
.5.2
, Se
ndai
C-2
SDG
1.5
.2, S
en
dai C
-2
3.1
Area
dam
aged
or
dest
roye
dSe
nd
ai C
-2Se
ndai
C-2
Sen
dai
C-2
Send
ai C
-2Se
nda
i C-2
Send
ai C
-2he
ctar
es
3.2
Stor
ed w
ood
volu
me
dest
roye
dSe
nd
ai C
-2Se
ndai
C-2
Sen
dai
C-2
Send
ai C
-2Se
nda
i C-2
Send
ai C
-2to
nnes
4-A
quac
ultu
reSD
G 1
.5.2
, Se
ndai
C-2
SDG
1.5
.2, S
enda
i C-2
SDG
1.5
.2, S
end
ai C
-2SD
G 1
.5.2
, Sen
dai C
-2SD
G 1
.5.2
, Se
ndai
C-2
SDG
1.5
.2, S
en
dai C
-2
4.1
Prod
ucti
on fr
om la
nd-b
ased
pon
dsSe
nd
ai C
-2Se
ndai
C-2
Sen
dai
C-2
Send
ai C
-2Se
nda
i C-2
Send
ai C
-2to
nnes
4.2
Prod
ucti
on fr
om w
ater
bas
ed c
ages
and
pen
dsSe
nd
ai C
-2Se
ndai
C-2
Sen
dai
C-2
Send
ai C
-2Se
nda
i C-2
Send
ai C
-2to
nnes
4.3
Stor
ed p
rodu
ctio
n lo
stSe
nd
ai C
-2Se
ndai
C-2
Sen
dai
C-2
Send
ai C
-2Se
nda
i C-2
Send
ai C
-2to
nnes
4.4
Faci
liti
es d
estr
oyed
unit
s
4.5
Post
-dia
ster
sho
rt-r
un m
aint
enan
ce c
osts
Sen
dai
C-2
Send
ai C
-2Se
nd
ai C
-2Se
ndai
C-2
Sen
dai C
-2Se
ndai
C-2
curr
ency
SDG
1.5
.2, S
end
ai C
-2SD
G 1
.5.2
, Sen
dai C
-2SD
G 1
.5.2
, Se
ndai
C-2
SDG
1.5
.2, S
enda
i C-2
SDG
1.5
.2, S
end
ai C
-2SD
G 1
.5.2
, Se
nda
i C-2
curr
ency
5.1
Smal
l sca
le p
rodu
ctio
n lo
ssSe
nd
ai C
-2Se
ndai
C-2
Sen
dai
C-2
Send
ai C
-2Se
nda
i C-2
Send
ai C
-2to
nnes
5.2
Coas
tal p
rodu
ctio
n lo
ssSe
nd
ai C
-2Se
ndai
C-2
Sen
dai
C-2
Send
ai C
-2Se
nda
i C-2
Send
ai C
-2un
its
5.3
Indu
stri
al (l
arge
-sca
le) p
rodu
ctio
n lo
stSe
nd
ai C
-2Se
ndai
C-2
Sen
dai
C-2
Send
ai C
-2Se
nda
i C-2
Send
ai C
-2to
nnes
5.4
Faci
liti
es d
estr
oyed
(fis
hing
gea
r, e
ngin
es, v
esse
ls, s
tora
ge, e
tc.)
Sen
dai
C-2
Send
ai C
-2Se
nd
ai C
-2Se
ndai
C-2
Sen
dai C
-2Se
ndai
C-2
unit
s
This
tabl
e w
as p
repa
red
for u
se in
DRS
F by
FA
O S
tatit
ics
Dir
ecto
rate
, fo
r mor
e in
form
atio
n or
tech
nica
l gui
danc
e, p
leas
e co
ntac
t FA
O S
tati
stic
s, R
ome
http
://w
ww
.fao.
org/
stat
isti
cs/s
tand
ards
/en/
Def
initi
ons
acco
rdin
g to
nat
iona
l pra
cgti
ces f
or a
gric
ultg
rue
stat
itsi
cs, a
nd cu
rren
t int
erni
aton
al s
tand
ards
, suc
h as
the
Syst
em o
f Nat
iona
l Acc
ount
s (SN
A, 2
018)
and
cur
rent
sta
ndar
ds fr
om F
AO
:
Haz
ard
type
s
5 - F
ishe
ries
2-Li
vest
ock
1-Cr
ops

DISASTER-RELATED STATISTICS FRAMEWORK (DRSF)
Expert Group on Disaster-related Statistics in Asia and the Pacific Page 121
G Summary tables of direct environmental impacts
G1 Summary table of direct environmental impacts by hazards types at
country level Measurement units: see column at right

DISASTER-RELATED STATISTICS FRAMEWORK (DRSF)
Page 122 Expert Group on Disaster-related Statistics in Asia and the Pacific
G2 Summary table of direct environmental impacts by hazards types and geographic
regions
Measurement units: see column at right
Region
1
Region
2
Region
3 …
Adjustment for multiple
counting of events by
Regions (-)
NATIONAL
TOTALMeasurement units
Direct environmental impact
1 Direct impacts on ecosystems by land cover types
1.1 Urban and associated developed areas hectares
1.2 Homogeneous herbaceous cropland hectares
1.3 Agriculture plantations, permanent crops hectares
1.4 Agriculture associations and mosaics hectares
1.5 Pastures and natural grassland hectares
1.6 Forest tree cover hectares
1.7 Shrubland, bushland, heathland hectares
1.8 Sparsely vegetated areas hectares
1.9 Natural vegetation associations and mosaics hectares
1.10 Barren land hectares
1.11 Permanent snow and glaciers hectares
1.12 Open wetlands hectares
1.13 Inland water bodies hectares
1.14 Coastal water bodies and inter-tidal areas hectares
2 Loss of critical ecosystems
2.1 Man And Biosphere and other biological reserves (UNESCO, UNEP) hectares
2.2 Other designated ecosystems/habitats hectares
2.3 Ecosystems hosting threatened species (IUCN Red List) hectares
2.4 Other critical ecosystems hectares
3 Losses of natural water resource (quantitative/qualitative)
3.1 Losses due to pollution of natural surface water no. of water bodies
3.2 Losses due to pollution of groundwater no. of water bodies
3.3 Losses due to destruction of natural surface water reserves no. of water bodies
3.4 Losses due to destruction of groundwater reserves no. of water bodies
4 Direct impacts to the atmosphere or climate change
4.1 Emissions of GHGs tonnes
4.2 Loss of carbon sequestration capacity tonnes
4.3 Other direct impact on global warming
4.4 Emissions of So2 tonnes
4.5 Emission of other (non-GHG) air pollutants (specify) tonnes
Data sources: Collaboration between national monitoring authorities for land cover, water resources, and atmospheric conditions with
initial impacts assessments of NDMAs after a disaster

DISASTER-RELATED STATISTICS FRAMEWORK (DRSF)
Expert Group on Disaster-related Statistics in Asia and the Pacific Page 123
DRRE Disaster Risk Reduction Expenditure Account
DRRE_A Production expenditure account (current plus investment) by characteristic
activities Measurement units: Local currency (US$ PPP)

DISASTER-RELATED STATISTICS FRAMEWORK (DRSF)
Page 124 Expert Group on Disaster-related Statistics in Asia and the Pacific
DRRE_B Transfers expenditure account & DRR National
Expenditure Measurement units: Local currency (US$ PPP)

DISASTER-RELATED STATISTICS FRAMEWORK (DRSF)
Expert Group on Disaster-related Statistics in Asia and the Pacific Page 125
GLOSSARY
Term Definition
Affected Population Sum of categories of selected direct human impacts: deaths, missing,
injured, ill, evacuated, relocated, and otherwise affected. Annotation:
People can be affected directly or indirectly. Affected people may
experience short-term or long-term or long-term consequences to
their lives, livelihoods or health and to their economic physical,
social, cultural and environmental assets. In addition, people who are
missing or dead may be considered as directly affected. (see UNGA,
2015)
Asset A store of value representing a benefit or series of benefits accruing
to the economic owner by holding or using the entity over a period
of time. It is a means of carrying forward value from one accounting
period to another.
Attribution to a
disaster
A direct causal relationship with a disaster; statistical reference with
an identifiable disaster occurrence.
Building back better Structural measures with a disaster risk mitigation purpose (e.g.
seismic resilience in building reconstruction). Note, costs of building
back better are distinct and should be separated, where feasible,
from reconstruction costs used to estimate direct economic loss.
Cascading multi-
hazard disasters
A disaster in which one type of hazard (such as a strong storm)
causes one or more additional hazards (e.g. flooding or landslides),
creating combined impacts to the population, infrastructure and the
environment.
Catastrophic losses The volume changes to assets recorded as catastrophic losses in the
other changes in the volume of assets account, which are the result
of large scale, discrete and recognizable events that may destroy a
significantly large number of assets within any of the asset
categories. They include major earthquakes, volcanic eruptions,
tidal waves, exceptionally severe hurricanes, drought and other
natural disasters; acts of war, riots and other political events; and
technological accidents such as major toxic spills or release of
radioactive particles into the air. (SNA, 2008)
Climate The synthesis of weather conditions in a given area, characterized by
long-term statistics (mean values, variances, probabilities of extreme
values, etc.) of the meteorological elements in that area. (WMO)

DISASTER-RELATED STATISTICS FRAMEWORK (DRSF)
Page 126 Expert Group on Disaster-related Statistics in Asia and the Pacific
Term Definition
Climate Change A change in the state of the climate that can be identified (e.g., by
using statistical tests) by changes in the mean and/or the variability
of its properties and that persists for an extended period, typically
decades or longer.
Climate-related
hazard
Climate-related hazards is a category of hazards that are
consequences of climatological activity, and thus have the potential
to be affected by climate change.
Coping Capacity Coping capacity is factors for resilience of household, businesses,
communities, regions, and whole countries against external shocks
in the form of a disaster. This is the ability for households or
businesses or infrastructure to respond to external shocks without
sustaining major permanent negative impacts, and instead guiding
towards opportunities for improvements in the future (e.g. “building
back better”).
Critical
infrastructure
The physical structures, facilities, networks and other assets which
provide services that are essential to the social and economic
functioning of a community or society. (UNGA, 2015)
Cultural heritage
objects
Culturally important objects (such as important artefacts) located in
cultural heritage zones with special value to a population.
Cultural heritage
zones
Areas previously designated for historical and cultural significance
(e.g. UNESCO World Heritage sites or other nationally or regionally
designated locations).
Damages Material impacts to that could be recovered, in principle, through
future repairs.
Direct impacts Impacts happening during or shortly following disaster directly
triggered by a hazard. Direct impacts include impacts to humans and
material impacts.
Direct economic loss The monetary value of total or partial destruction of physical assets
existing in the affected area. (See UNGA, 2015)
Disaster "A serious disruption of the functioning of a community or a society
at any scale due to hazardous events interacting with conditions of
exposure, vulnerability and capacity, leading to one or more of the
following: human, material, economic and environmental losses and
impacts.” (UNISDR, UNGA, 2015)
Destroyed Material impacts resulting total loss of an object, beyond recovery
except through replacement construction and/or relocation.

DISASTER-RELATED STATISTICS FRAMEWORK (DRSF)
Expert Group on Disaster-related Statistics in Asia and the Pacific Page 127
Term Definition
Disaster
Management
The organization and management of resources and responsibilities
for creating and implementing preparedness and addressing all
aspects of emergencies and others plans to respond to, and to
decrease the impact of, disasters and to build back better.
Disaster response Actions taken directly before, during or immediately after a disaster
in order to save lives, reduce health impacts, ensure public safety and
meet the basic subsistence needs of the people affected; includes
operational response, which are the coordinated actions of
emergency responders, utilizing detailed data on the location of
disaster, population, critical infrastructure, and other relevant
priority concerns
Disaster risk “the potential loss of life, injury, or destroyed or damaged assets
which could occur to a system, society or a community in a specific
period of time, determined probabilistically as a function of hazard,
exposure, vulnerability and capacity.” (UN, 2015)
Annotation: The definition of disaster risk reflects the concept of
hazardous events and disasters as the outcome of continuously present
conditions of risk. Disaster risk comprises different types of potential
losses which are often difficult to quantify. Nevertheless, with
knowledge of the prevailing hazards and the patterns of population
and socioeconomic development, disaster risks can be assessed and
mapped, in broad terms at least.
Disaster Risk
Reduction
A scope of work “aimed at preventing new and reducing existing
disaster risk and managing residual risk, all of which contributes to
strengthening resilience. DRR encompasses all aspects of work
including the management of residual risk, i.e. managing risks that
cannot be prevented nor reduced, and are known to give rise to, or
already, materialize into a disaster event.” (UNISDR, 2017)
Disaster Risk
Mitigation
Activities and measures to reduce or lessen existing disaster risk or
to limit the adverse impacts of a hazardous event. Mitigation differs
from prevention in that it is reactive to an identified and currently
existing risk or impending threat. Thus, the activities mitigate for
specific threats, instead of general risk prevention.
Disaster Risk
Prevention
Activities with an intention to intention to avoid potential adverse
impacts of hazardous events. While certain disaster risks cannot be
eliminated, prevention aims at reducing vulnerability and exposure
in such contexts where, as a result, the risk of disaster is removed.
Displacement Movement of the population as a direct result of a hazard, including
evacuations and permanent relocations of people due to a disaster

DISASTER-RELATED STATISTICS FRAMEWORK (DRSF)
Page 128 Expert Group on Disaster-related Statistics in Asia and the Pacific
Term Definition
Dwellings Buildings, or designated parts of buildings, and other structures, that
are used entirely or primarily as residences, including any associated
structures, such as garages, and all permanent fixtures customarily
installed in residences.
Early warning
systems management
An interrelated set of hazard warning, risk assessment,
communication and preparedness activities that enable individuals,
communities, businesses and others to take timely action to reduce
their risks."
Emergency
management
The organization and management of resources and responsibilities,
which predominantly focused on immediate and short-term needs,
for addressing all aspects of emergencies and effectively respond to
a hazardous event or a disaster. The set of specialized agencies that
have specific responsibilities and objectives in serving and
protecting people and property in emergency situations including
agencies such as civil protection authorities, police, fire, ambulance,
paramedic and emergency medicine services, Red Cross and Red
Crescent societies, and specialized emergency units of electricity,
transportation, communications and other related services
organizations.
Environmental assets The naturally occurring living and non-living components of the
Earth, together constituting the biophysical environment, which may
provide benefits to humanity. (SEEA, 2012)
Environmental
hazard
"May include chemical, natural and biological hazards. They can be
created by environmental degradation or physical or chemical
pollution in the air, water and soil. However, many of the processes
and phenomena that fall into this category may be termed drivers of
hazard and risk rather than hazards in themselves, such as soil
degradation, deforestation, loss of biodiversity, salinization and sea-
level rise." (UN, 2015)
Evacuations Moving people and assets temporarily to safer places before, during
or after the occurrence of a hazardous event in order to protect them.
Extensive and
Intensive Risk from
Disasters
“Extensive risk is used to describe the risk associated with low-
severity, high-frequency events, mainly associated with highly
localized hazards. Intensive risk is used to describe the risk
associated to high-severity, mid to low-frequency events, mainly
associated with major hazards.” (UNISDR-GAR, 2015)
Extreme Weather
Event
An extreme weather event is an event that is rare at a particular place
and time of year. Definitions of rare vary, but an extreme weather
event would normally be as rare as or rarer than the 10th or 90th
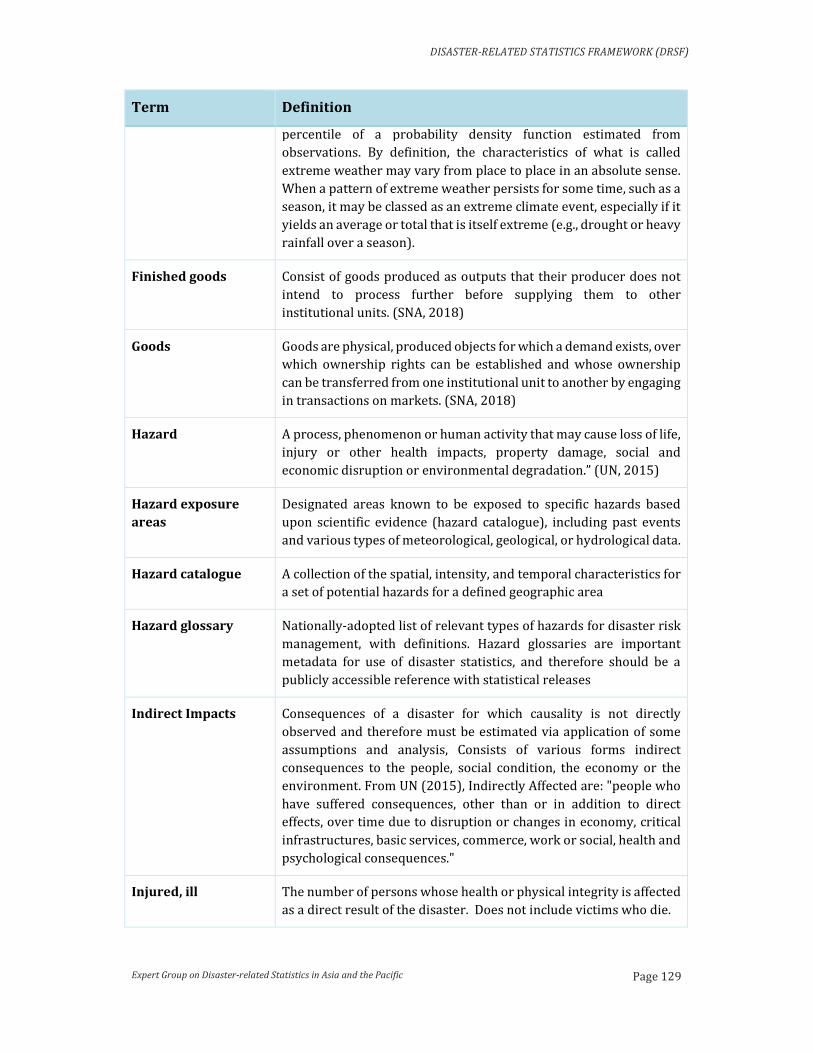
DISASTER-RELATED STATISTICS FRAMEWORK (DRSF)
Expert Group on Disaster-related Statistics in Asia and the Pacific Page 129
Term Definition
percentile of a probability density function estimated from
observations. By definition, the characteristics of what is called
extreme weather may vary from place to place in an absolute sense.
When a pattern of extreme weather persists for some time, such as a
season, it may be classed as an extreme climate event, especially if it
yields an average or total that is itself extreme (e.g., drought or heavy
rainfall over a season).
Finished goods Consist of goods produced as outputs that their producer does not
intend to process further before supplying them to other
institutional units. (SNA, 2018)
Goods Goods are physical, produced objects for which a demand exists, over
which ownership rights can be established and whose ownership
can be transferred from one institutional unit to another by engaging
in transactions on markets. (SNA, 2018)
Hazard A process, phenomenon or human activity that may cause loss of life,
injury or other health impacts, property damage, social and
economic disruption or environmental degradation.” (UN, 2015)
Hazard exposure
areas
Designated areas known to be exposed to specific hazards based
upon scientific evidence (hazard catalogue), including past events
and various types of meteorological, geological, or hydrological data.
Hazard catalogue A collection of the spatial, intensity, and temporal characteristics for
a set of potential hazards for a defined geographic area
Hazard glossary Nationally-adopted list of relevant types of hazards for disaster risk
management, with definitions. Hazard glossaries are important
metadata for use of disaster statistics, and therefore should be a
publicly accessible reference with statistical releases
Indirect Impacts Consequences of a disaster for which causality is not directly
observed and therefore must be estimated via application of some
assumptions and analysis, Consists of various forms indirect
consequences to the people, social condition, the economy or the
environment. From UN (2015), Indirectly Affected are: "people who
have suffered consequences, other than or in addition to direct
effects, over time due to disruption or changes in economy, critical
infrastructures, basic services, commerce, work or social, health and
psychological consequences."
Injured, ill The number of persons whose health or physical integrity is affected
as a direct result of the disaster. Does not include victims who die.

DISASTER-RELATED STATISTICS FRAMEWORK (DRSF)
Page 130 Expert Group on Disaster-related Statistics in Asia and the Pacific
Term Definition
Inventories Produced assets that consist of goods and services, which came into
existence in the current period or in an earlier period, and that are
held for sale, use in production or other use at a later date.
Land Land consists of the ground, including the soil covering and any
associated surface waters, over which ownership rights are enforced
and from which economic benefits can be derived by their owners by
holding or using them. (SNA, 2008)
Land-use planning Systematic assessment of physical, social and economic factors in
such a way as to encourage and assist land users in selecting options
that increase their productivity, are sustainable and meet the needs
of society. Land- use planning can help to mitigate disasters and
reduce risks, for example by discouraging settlements and
construction of key installations in hazard-prone areas, including
consideration of service routes for transport, power, water, sewage
and other critical facilities.
Large disasters Large disasters are disasters in which the emergency is at a national
(or higher) sale and have special characteristics of interest for
analysis because they are relatively rare but have sweeping and long-
term effects on sustainable development
Magnitude Strength, force of energy or related characteristic of a hazard. These
are scientific measurements based on continuous scientific
monitoring, utilizing a measurement scale defined by specialists in
the relevant physical science (e.g. Richter or Local Magnitude scale
(ML) for earth shaking).
Medical costs Total expenditure on health measures the final use by resident units
of health care goods and services plus gross capital formation in
health care provider industries (institutions where health care is the
predominant activity).
Medium and small-
scale disasters
Disasters with emergencies at smaller than national geographic
scales, which usually result in fewer and less intensive impacts, but
may be more frequent occurrences, and thus, the cumulative effect
can be very significant, and represent large shares of the total
number of disaster impacts for a country or region over time.
Missing The number of persons whose whereabouts since the disaster is
unknown. It includes people who are presumed dead. After some
amount of time, missing become part of the count of deaths.

DISASTER-RELATED STATISTICS FRAMEWORK (DRSF)
Expert Group on Disaster-related Statistics in Asia and the Pacific Page 131
Term Definition
Natural resources Non-produced fixed assets, consisting of naturally occurring
resources such as land, water resources, uncultivated forests and
deposits of minerals that have an economic value.
Non-structural
measures
Any measure not involving physical construction that uses
knowledge, practice or agreement to reduce risks and impacts
through their integration in sustainable development plans and
programmes, in particular through policies and laws typically to
reduce vulnerability and exposure, public awareness raising,
training and education.
Official Development
Assistance(ODA)
ODA is defined as flows to countries and territories on and to
multilateral development institutions which are: a) provided by
official agencies, including state and local governments, or by their
executing agencies; and ii. each transaction of which: a) is
administered with the promotion of the economic development and
welfare of developing countries as its main objective; and b) is
concessional in character and conveys a grant element of at least
25% (calculated at a discount rate of 10 per cent). (See OECD)
Physical
Vulnerability
See definition of vulnerability (below) as applied to land and
infrastructure, such as buildings, roads, and other built-up areas
Preparedness The knowledge and capacities developed by governments,
professional response and recovery organizations, communities and
individuals to effectively anticipate, respond to, and recover from,
the impacts of likely, imminent or current disasters.
Reconstruction The medium and longer-term repair and sustainable restoration of
critical infrastructures, services, housing, facilities, and livelihoods
required for full functioning of a community or a society affected by
a disaster. (UN, 2015)
Relocated People who, for different reasons or circumstances because of risk
or disaster, have moved permanently from their places of residence
to new sites (safer areas).
Risk Assessment A process to determine the nature, extent, and locations of risk, by
analysing exposure and conditions of vulnerability to hazards and
present coping capacities against all types of disaster impacts. A
comprehensive risk assessment process consists of understanding of
current situation, needs and gaps, hazard assessment, exposure
assessment, vulnerability analysis, loss/impact analysis, risk
profiling and evaluation and formulation or revision of disaster risk
reduction strategies and action plan.

DISASTER-RELATED STATISTICS FRAMEWORK (DRSF)
Page 132 Expert Group on Disaster-related Statistics in Asia and the Pacific
Term Definition
Services Services are the result of a production activity that changes the
conditions of the consuming units, or facilitates the exchange of
products or financial assets. (SNA, 2008)
Slow onset disaster A disaster that emerges gradually over time. Slow-onset disasters
could be associated with, e.g., drought, desertification, sea level rise,
epidemic disease. (UN, 2015)
Structural measures Any physical construction to reduce or avoid possible impacts of
hazards, or application of engineering techniques to achieve hazard
resistance and resilience in structures or systems. Common
structural measures for disaster risk reduction include constructed
dams, flood levies, ocean wave barriers, earthquake-resistant
construction, and evacuation shelters.
Sudden-onset
disaster
A disaster triggered by a hazardous event that emerges quickly or
unexpectedly. Sudden-onset disasters could be associated with, e.g.,
earthquake, volcanic eruption, flash flood, chemical explosion,
critical infrastructure failure, and transport accident. (UNGA, 2015)
Technological hazard "originate from technological or industrial conditions, dangerous
procedures, infrastructure failures or specific human activities.
Examples include industrial pollution, nuclear radiation, toxic
wastes, dam failures, transport accidents, factory explosions, fires
and chemical spills. Technological hazards also may arise directly as
a result of the impacts of a natural hazard event." (UNGA, 2015)
Urban Slum
household
A slum household suffers: lack of access to improved water source,
lack of access to improved sanitation facilities, lack of sufficient living
area, lack of housing durability or lack of security of tenure. (UN-
Habitat, 2016)
Valuables Produced goods of considerable value that are not used primarily for
purposes of production or consumption but are held as stores of
value over time.
Vulnerability The conditions determined by physical, social, economic and
environmental factors or processes which increase the susceptibility
of an individual, a community, assets or systems to the impacts of
hazards. (UN, 2015)

DISASTER-RELATED STATISTICS FRAMEWORK (DRSF)
Expert Group on Disaster-related Statistics in Asia and the Pacific Page 133
BIBLIOGRAPHY
Bangladesh Bureau of Statistics (2016). Disaster-related Statistics 2015: Climate Change an
Natural Disaster Perspectives. Impact of Climate Change on Human Life (ICCHL)
Programme. Government of the People’s Republic of Bangladesh. Dhaka, Bangladesh
Birkmann, J. (2013). Measuring Vulnerability to Natural Hazards: Towards Disaster Resilient
Societies. United Nations University Press.
Bell, Heather, Doug Bousche et al. (2010) ASEAN Regional Risk and Vulnerability Assement
Guidelines. U.S. AID and ASEAN. http://asean.org/storage/2012/05/ASEAN-Regional-
RVA-Guidelines-final.pdf
BNPB (2013) Pilot Survey of Knowledge, Attitudes and Practice, Disaster Preparedness in Padang
City 2013. National Agency for Disaster Management (BNPB), Statistics Indonesia (BPS)
and United Nations Population Fund (UNFPA). Jakarta
BNPB (2016), Risiko Bencana Indonesia (RBI). [Methodologis for InARisk -Disaster Risk
Monitoring Methodology of Indonesia - Avail. in Indonesian Language] National Agency
for Disaster Management (BNPB). Jakarta
German Aerospace Agency (2018) Global Urban Footprint. Datasets access during 2017 and
2019. http://www.dlr.de/eoc/en/desktopdefault.aspx/tabid-9628/16557_read-40454/
Group on Earth Observations (2018) Geo Portal. Accessed during 2017 and 2018,
www.geoportal.org
European Commission (2010) Mapping of Risk Web-platforms and Risk Data: Collection of Good
Practices. Antofie, T. E., Doherty, B., Marin. JRC109146 Luxembourg
European Commission-JRC (2015) Guidance for Recording and Sharing Disaster Damage and
Loss Data. EU Expert Working group on Disaste Damamge and Loss Data. European
Commission, Joint Research Centre, Institute for the Protection and Security of the
Citizen. Ispra, Italy.
European Commission-JRC (2017) Loss Database Architecture for Disaster Risk Management.
European Commission, Joint Research Centre, Ispra, Italy.
Escobar, C-G (2011). Accounting for the impact of the earthquake on the Chilean national
accounts. Paper presented at Working Party of National Accounts, Octobe, 2011, Paris.
Germanwatch (2016). Global Climate Risk Index 2016. Sönke Kreft, David Eckstein, Lukas
Dorsch & Livia Fischer www.germanwatch.org. Bonn
Goverment of Fiji (2013) Post-Disaster Needs Assessment:Tropical Cyclone Evan, 17th December
2012. Published by Applied Geoscience and Technology Division, Secretariat of the
Pacific Community (SPC-SOPAC) 2013 Government of Fiji with United Nations, World
Bank-GFDRR, and the Secretariat of the Pacific Community (SPC).
Government of Samoa (2013) Post-Disaster Needs AssessmentCyclone Evan 2012. Government of
Samoa with World Bank-GFDRR, Australian AID, New Zealand Foreight Affairs and
Trade Aid Programme and United Nations.

DISASTER-RELATED STATISTICS FRAMEWORK (DRSF)
Page 134 Expert Group on Disaster-related Statistics in Asia and the Pacific
Groppo, Valeria and Kati Kraehnernt (2015) The Impact of Extreme Weather Events on Education
DIW-Berlin Discussion Paper 1534, 11 December 2015,
http://www.diw.de/discussionpapers
Groppo, Valeria and Kati Kraehnernt (2016) Extreme Weather Events and Child Height: Evidence
from Mongolia, World Development Vol 86, ppp 9-78, 2016. Elsevier.
Gupta, Sushil (2010) Synthesis Report on Ten ASEAN Countries Disaster Risk Asessment. ASEAN
Disaster Risk Management Initative. With World Bank and UNISDR. December. 2010
Marin Ferre, M. do O, A.; Poljansek K., Casjus Valles, A. (2018) Disaster Damges and Loss Data for
Policy: Pre and post-event damage asessment and collection of data for evidence-based
policies. Europoean Commission-JRC. Publication Office of the European Union,
Luxembourg, 2018 JRC1101366
Goodyear, Rosemary (2014). Housing in greater Christchurch after the earthquakes: Trends in
housing from the Census of Population and Dwellings 1991-2013 . www.stats.govt.nz. ISBN
978-0-478-42905-3
Hancock, Andrew (2013) Best Practice Guidelines fo Developing Internartional Stastiical
Classaification. Expert Group Meeting on Internaitnal Stastistical Classications, New York,
13-15 May, 2013, https://unstats.un.org/unsd/class/intercop/expertgroup/2013/AC267-
5.PDF
Hooffman Eivind an Mary Chamie (1999) Standard Stastistical Classifications: Basic Principles
Thirtieth SEssion of the United Nations Statiical Commision, New YOrk 1-5 March, 1999,
https://unstats.un.org/unsd/class/family/basicprinciples_1999.pdf
OECD (2014) Improving the evidence base on the costs of disasters: Towards an OECD framework
for accounting risk management expenditures and losses of disaster. 11-12 November,
2014, 4th Meeting of the OECD High Level Risk Forum. Paris, France.
OECD (2016) Improving the Evidence Baseon the Costs of Disasters: Key Findings from an OECD
Survey. Joint Expert Meeting on Disaster Loss Data. 26-28 October2016.
ICCHL; BBS; SID; Ministry of Planning Government of the People's Republic of Bangladesh.
(2016). Bangladesh Disaster-Related Statisitcs 2015: Climate Change and Natural Disaster
Perspectives . Bangladesh Bureau of Statistics .
IPCC (2014): Climate Change 2014: Synthesis Report. Contribution of Working Groups I, II and III
to the Fifth Assessment Report of the Intergovernmental Panel on Climate Change [Core
Writing Team, R.K. Pachauri and L.A. Meyer (eds.)]. IPCC, Geneva, Switzerland, 151 pp
IPCC (2012). Managing the Risks of Extreme Events and Disasters to Advance ClimateChange
Adaptation. A Special Report of Working Groups I and II of theIntergovernmental Panel on
Climate Change [Field, C.B., V. Barros, T.F. Stocker,D. Qin, D.J. Dokken, K.L. Ebi, M.D.
Mastrandrea, K.J. Mach, G.-K. Plattner, S.K. Allen,M. Tignor, and P.M. Midgley (eds.)].
Cambridge University Press, Cambridge, UK,and New York, NY, USA, 582 pp.
IRDR (2015), Guidelines on Measuring Losses from Disasters: Human and Economic Impact
Indicators (IRDR DATA Publication No.2), Beijing: Integrated Research on Disaster Risk
IRDR (2014), Peril Classification and Hazard Glossary (IRDR DATA Publication No.1), Beijing:
Integrated Research on Disaster Risk
Kasdan O-K (2016) Considering socio-cultural factors of disaster risk management.

DISASTER-RELATED STATISTICS FRAMEWORK (DRSF)
Expert Group on Disaster-related Statistics in Asia and the Pacific Page 135
Disaster Prevention and Management, Vol. 25 Iss 4 pp. 464 - 477
Murray, V., G. McBean, M. Bhatt, S. Borsch, T.S. Cheong, W.F. Erian, S. Llosa, F. Nadim, M. Nunez,
R. Oyun, and A.G. Suarez,2012: Case studies. In: Managing the Risks of Extreme Events and
Disasters to Advance Climate Change Adaptation [Field, C.B., V. Barros, T.F. Stocker, D.
Qin, D.J. Dokken, K.L. Ebi, M.D. Mastrandrea, K.J. Mach, G.-K. Plattner, S.K. Allen, M.
Tignor, and P.M. Midgley (eds.)]. A Special Report of Working Groups I and II of the
Intergovernmental Panel on Climate Change (IPCC) Cambridge University Press,
Cambridge, UK, and New York, NY, USA, pp. 487-542.
Andrew, Neil et al. (forthcoming) Coastal proximity of populations in 22 Pacific Island Countries
and Territories. Neil L. Andrew, Phil Bright, Luis de la Rua, Shwu Jiu Teoh, Mathew
Vickers. Australian National Centre for Ocean Resources and Security, The Pacific
Community and World Fish
Serje. J and S. Ponserre (2015), Loss Data and Extensive Risk Analysis, Annex 2 of Global
Assessment Report on Disaster Risk Reduction 2015.
http://www.preventionweb.net/english/hyogo/gar/2015/en/gar-pdf/Annex2-
Loss_Data_and_Extensive_Risk_Analysis.pdf
Statistics New Zealand (2012a). How prepared are New Zealanders for a natural disaster?
Wellington: Statistics New Zealand
Statistics New Zealand (2012b). Accounting for the economic effects of the 2010/11 Canterbury
earthquakes in New Zealand’s national accounts. Available from www.stats.govt.nz.
Tome De Groeve, Poljansek, Karmen, Ehrlich, Daniele (2013) Recording Disaster Losses:
Recommendations for a European Approach. JRC Scientific and Policy Reports. European
Commission. Joint Research Centre. Institute for the Protection and the Security of the
Citizen. Italy. ISBN 978-92-79-32690-5
United Nations (2008) International Standard Industrial Classification of All Economic Activities
Revision 4. Department of Social and Economic Affairs ISBN: 978-92-1-161518-0, New
York, New York
United Nations (2015) Sendai Framework for Disaster Risk Reduction 2015-2030. Adopted at the
Third UN World Confer on Diaster Risk Reduction, Sendai, Japan, March 18,2015
UNDP (2009) Risk Knowledge Fundamentals, Guidelines and Lessons for Establishing and
Institutionalizing Disaster Loss Databases. UNDP Regional Office for Asia and Pacific.
Bangkok, Thailand.
UNDP (2014) Reducing Disaster Risk: A Challenge for Development: A Global Report. UNDP. New
York, New York.
UN-GGIM (2015): A Guide to the Role of Standards in Geospatial Information Management. Open
Geospatial Consortium (OGC); The International Organization for Standards (ISO)
Technical Committee 211 Geographic information/Geomatics; and the International
Hydrographic Organization (IHO). August 2015.
http://ggim.un.org/documents/Standards%20Guide%20for%20UNGGIM%20-
%20Final.pdf
UNGGIM (2017) Strategic Framework on Geospatial Information and Services for Disasters.
Working Group on Geospatial Information and Services for Disasters. (WG-GISD). The
United Nations Committee of Experts onGlobal Geospatial Information Management
(UN-GGIM) ggim.un.org

DISASTER-RELATED STATISTICS FRAMEWORK (DRSF)
Page 136 Expert Group on Disaster-related Statistics in Asia and the Pacific
UNGA (2015) UN General Assembly, Seventy-first session. (1 December 2016). Report of the
open-ended intergovernmental expert working group on indicators and terminology
relating to disaster risk reduction. (A/71/644).
UN Department of Economic and Social Affairs (2003) Handbook of Statistical Organization,
Third Edition: The Operation and Organization of a Statistical Agency, ISBN 92-1-161459-
7, United Nations, New York
(https://unstats.un.org/unsd/publication/SeriesF/SeriesF_88E.pdf)
UNECLAC (2003) Handbook for Estimating the Socio-economic and Environmental Effects of
Disasters. United Nations Economic Commision for Latin America and the Carribea
(ECLAC). Santiago.
UNECLAC (2014) Handbook for Disaster Assessment. Unietd Nations Economic Commision for
Latin America and the Carribea (ECLAC). Santiago.
UNESCAP, Seventieth session. (13 June 2014 ). Resolution 70/2 (2014) [Disaster-related statistics
in Asia and the Pacific]. (E/ESCAP/RES/70/2).
UNESCAP, Seventy-second session . (24 May 2016). Resolution 72/11 (2016) [Advancing
disaster-related statistics in Asia and the Pacific for implementation of internationally
agreed development goals]. (E/ESCAP/RES/72/11).
UNESCAP (2017). Leave No One Behind, Disaster Resilience for Sustainable Development, Asia-
Pacific Disaster Report 2017. Bangkok
United Nations Framework Convention on Climate Change (2015). Adotpion of the Paris
Agreement, Conference of the Parties: 21st Session. FCCC/CP/2015/L.9/Rev.1. 12
December 2015. Paris, France.
UN-Habitat (2016), Slum Almanac 2015-2016; UN-Habitat (2016). UNON Publishing. Nairobi.
UN Statistics Division (2015) United Nations Fundamental Principles of Official Statistics:
Implementation guidelines Friends of the Chair on the Fundamental Principles of Official
Statistics to the UN Statistics Commission, Final Draft. Janauary, 2015.
https://unstats.un.org/unsd/dnss/gp/Implementation_Guidelines_FINAL_without_edit.
UNISDR. (2015). Global Assessment Report on Disaster Risk Reduction . (GAR).
UNISDR (2017). Technical Guidance for Monitoring and Reporting on Progress in Achieving the
Global Targets of the Sendai Framework for Disaster Risk Reduction: Collection of
Technical Notes on Data and Methodology. October, 2017. UNISDR. Geneva, Switzerland.
UNECLAC (2014). Handbook for Disaster Assessment. United Naions. Economic Commission for
Latin America and the Caribbean. Santiago, Chile.
United Nations (2015). UN Fundamental Principles of Official Statistics – Implementation
guidelines, 2015. Final Draft. January, 2015. United Nations Statsitics Division. New York.
https://unstats.un.org/unsd/dnss/gp/impguide.aspx
United Nations, European Commission; IMF; OECD; World Bank. (2009). System of National
Accounts 2008. New York.

DISASTER-RELATED STATISTICS FRAMEWORK (DRSF)
Expert Group on Disaster-related Statistics in Asia and the Pacific Page 137
United Nations (2005), Hyogo Framework for Action 2005-2015: Building the Resilience of
Nations and Communities to Disasters, 22 January 2005, Adopted by the World
Conference on Disaster Reduction A/CONF.206/6
United Nations (2012) System of Environmental-Economic Accounting 201 – Central
Framework. United Nations, European Union, ,Food and Agriculture Organization of the
United Nations, International Monetary Fund, Organisation for Economic Co-operation
and Development and The World Bank. ISBN: 987-92-1-161563-0. New York, USA
United Nations (2015). The Sendai Framework for Disaster Risk Reduction 2015–2030 adopted
at the Third United Nations World Conference on Disaster Risk Reduction, 14 to 18
March 2015, Sendai, Japan
United Nations University (2016). The World Risk Report 2016. worldriskreport.org. Bundnis
Entwisklung Lilft. Berlin.
United Nations University (2017). The World Risk Report: Analysis and Forcastss.
worldriskreport.org. Bundnis Entwisklung Lilft. Berlin.
USBEA (2009). Preview of the 2009 Comprehensive Revisions of the NIPAs: Changes in Definitions
and Presentations. Eugen P. Seskin and Shelly Smith. United States Bureau of Economic
Analysis. March, 2009. Washington.
Weber, J.-L (2014) Ecosystem Natural Capital Accounts: A Quick Start Package. Convention on
Biological Diversity Technical Series 77. https://www.cbd.int/doc/publications/cbd-ts-
77-en.pdf
Wisner, B., Blaikie, P., Cannon, T., & Davis, I. (2003). At risk: Natural hazards, people's
vulnerability and disasters (Second edition ed.). Psychology Press.
World Bank (2010). World Development Report: Development and Climate Change. The World
Bank. Washington D.C. USA
World Bank (2017). Post Disaster Needs Asessment Training Materials. Unpublished for use in
training sources with national governmnent agencies. June, 2017.
World Health Organization (2018) Glossary of Humanitarian Terms - Relief Web
http://www.who.int/hac/about/definitions/en/
WMO (2017). METEOTERM: WMO terminology database. World Meteorological Organization,
Gevena, Switzerland. https://www.wmo.int/pages/prog/lsp/meteoterm_wmo_en.html
Related Documents

![STATISTICS ESCAP Statistics: Implications for Agenda 2030 [a.k.a SDGs] CCSA Twenty-sixth Session 1 October 2015.](https://static.cupdf.com/doc/110x72/56649ee75503460f94bf8590/statistics-escap-statistics-implications-for-agenda-2030-aka-sdgs-ccsa.jpg)