Bangkok, 7 January 2016 Draft Disaster-related Statistics Framework Provisional Unedited Draft for Pilot Testing This note is accompanied with a spreadsheet with detailed statistical tables: DRSF_Draft_Tables.xlsx Contents Contents ............................................................................................................................... 1 Purpose & Background....................................................................................................... 3 Acknowledgements.............................................................................................................. 3 Chapter 1: Scope and Rationale for Framework ............................................................... 4 Figure 1: DRSF Core Set and Enlarged Framework....................................................................... 5 Chapter 2: Definitions of Disasters & Impacts .................................................................. 6 2.1 Defining Disasters ....................................................................................................................... 6 Figure 2: Proposed criteria and data requirements for a statistical definition for disaster occurrence ....................................................................................................................................... 7 Box 1: Conventions on occurrence period and direct impacts ........................................................ 8 2.2 Direct impacts.............................................................................................................................. 8 2.3 Classification of Direct Impacts ................................................................................................. 9 Box 2: Categories for reporting disasters ........................................................................................ 9 Chapter 3: Disaster Risk Reduction Expenditures .......................................................... 10 3.1 A “satellite account” for recording disaster risk reduction expenditures ........................... 10 Box 3 Definition of National Expenditure for Disaster Risk Reduction and other aggregates..... 11 3.2 Disaster Risk Reduction Characteristic Activities (DRRCA) ............................................... 11 Box 3 B Disaster Management and Disaster Risk Reduction ....................................................... 11 3.3. Annotated classification of Disaster Risk Reduction Characteristic Activities and Transfers .......................................................................................................................................... 12 3.4 DRRE Aggregates ..................................................................................................................... 14 3.4 Physical data, maps associated with the satellite account ..................................................... 15

Welcome message from author
This document is posted to help you gain knowledge. Please leave a comment to let me know what you think about it! Share it to your friends and learn new things together.
Transcript
Bangkok, 7 January 2016
Draft Disaster-related Statistics Framework
Provisional Unedited Draft for Pilot Testing
This note is accompanied with a spreadsheet with detailed statistical tables:
DRSF_Draft_Tables.xlsx
Contents
Contents ............................................................................................................................... 1
Purpose & Background ....................................................................................................... 3
Acknowledgements .............................................................................................................. 3
Chapter 1: Scope and Rationale for Framework ............................................................... 4
Figure 1: DRSF Core Set and Enlarged Framework ....................................................................... 5
Chapter 2: Definitions of Disasters & Impacts .................................................................. 6
2.1 Defining Disasters ....................................................................................................................... 6
Figure 2: Proposed criteria and data requirements for a statistical definition for disaster
occurrence ....................................................................................................................................... 7
Box 1: Conventions on occurrence period and direct impacts ........................................................ 8
2.2 Direct impacts .............................................................................................................................. 8
2.3 Classification of Direct Impacts ................................................................................................. 9
Box 2: Categories for reporting disasters ........................................................................................ 9
Chapter 3: Disaster Risk Reduction Expenditures .......................................................... 10
3.1 A “satellite account” for recording disaster risk reduction expenditures ........................... 10
Box 3 Definition of National Expenditure for Disaster Risk Reduction and other aggregates. .... 11
3.2 Disaster Risk Reduction Characteristic Activities (DRRCA) ............................................... 11
Box 3 B Disaster Management and Disaster Risk Reduction ....................................................... 11
3.3. Annotated classification of Disaster Risk Reduction Characteristic Activities and
Transfers .......................................................................................................................................... 12
3.4 DRRE Aggregates ..................................................................................................................... 14
3.4 Physical data, maps associated with the satellite account ..................................................... 15
Chapter 4: Classifications ................................................................................................. 15
4.1 Disasters classification .............................................................................................................. 15
Figure 3: Matrix used to count single and multiple hazard events Error! Bookmark not defined.
4.2 Direct impacts classification ..................................................................................................... 16
DRSF Direct Impacts Classification (detailed DIC v.1) ............................................................... 17
4.3 DRRCA and transfers .............................................................................................................. 18
Chapter 5: Measurement & Compilation ........................................................................ 19
5.1 Measurement Units ................................................................................................................... 20
Figure 5: Possible units of measurements to be used for direct damages (working table) ........... 21
Direct Impacts Classification and measurement units .................................................................. 21
Direct Impacts Classification and measurement units [continued] ............................................... 21
5.2 Valuation, reparations cost ...................................................................................................... 22
5.3 Need for geographic information and GIS ............................................................................. 23
Box 4: Compiling, Reporting, and Analysis with GIS .................................................................. 24
5.5 Double counting, time ............................................................................................................... 25
Chapter 6: Descriptions of tables ..................................................................................... 27
Part 1: The DRSF Core Set Tables.................................................... Error! Bookmark not defined.
Part 2: Additional tables .................................................................... Error! Bookmark not defined.
Part 3: Indicators (Sendai Framework, SDGs, ...) ........................... Error! Bookmark not defined.
Part 4: Maps ........................................................................................ Error! Bookmark not defined.
Chapter 7: Indicators ........................................................................................................ 25
Box 7: Tentative list of indicators based on DRSF ....................... Error! Bookmark not defined.
Chapter 8: Integration with other frameworks ............................................................... 29
Glossary ............................................................................................................................. 29
List of References .............................................................................................................. 29
Annexes .............................................................................................................................. 29
ANNEX 1: IRDR Family and Main Event Classification ............................................................ 30
ANNEX 2: IRDR Peril Classification .......................................................................................... 32
ANNEX 3: Comparison of disaster impact categories and definitions ......................................... 36
ANNEX 4 Composition of the Disaster-Related Statistics Expert Group .................................... 39
Purpose & Background
Through Resolution E/ESCAP/RES/70/2 on “Disaster-related Statistics in Asia and the Pacific”, the
Commission established a regional expert group involving officially nominated experts from national
statistics offices and national disaster management agencies from 14 Asia and Pacific countries along
with experts on statistics or on disaster management information from many international
organizations. The Expert Group has a mandate from the Commission to prioritize development of a
Core Set of disaster-related statistics.
The resolution E/ESCAP/RES/70/2 and priorities established by the Expert Group at its first three
meeting have been confirmed by the Sendai Framework on Disaster Risk Reduction 2015-2030.
In this document, a preliminary statistical framework and set of tables has been developed to support
advancement of a guideline for disaster-related statistics in alignment with the mandate of the Expert
Group and the requirements for monitoring progress towards achievement of the Sendai Framework.
This framework was developed with the intention to facilitate testing of the implementation of the
definitions, classifications and conventions Framework based on existing databases in countries in
Asia and the Pacific. A revision to this document will be prepared by the Secretariat based on results
from the pilot testing towards development of a reference guideline for the Disaster-related Statistics
Framework (DRSF).
Acknowledgements This draft rev. 1 of the Disaster-Related Statistics Framework was prepared by the ESCAP
Secretariat1. Key principles and conventions described in this document were developed based on
recommendations from the three meetings of the Asia and Pacific Expert Group on Disaster-related
Statistics, organized in 2014 and 2015 by the ESCAP Secretariat in response to E/ESCAP/RES/70/2.
This draft takes into account previous discussion of the EG and a survey to countries on their current
practices as well as the outcome of an e-consultation of the EG and based on discussions during a
capacity-building workshop in preparation for pilot tests of the framework convened in Bangkok, 15-
17th December 2015.
1 The first draft has been prepared by Jean-Louis Weber, consultant and Daniel Clarke, ESCAP Statistician. The
revised version has benefited of comments from the Expert Group through the e-consultation and of significant
inputs from Puji Pujiono, ESCAP Regional Adviser on Disaster Risk Reduction, and Dr. Dyah Rahmawati
Hizbaron, consultant.
Chapter 1: Scope and Rationale for Framework
The Core Set of Statistics in this framework is built upon a clearly specified policy demand and
existing mandate for government organization for monitoring, as described in the Sendai Framework.
Monitoring the 7 targets in the Sendai Framework requires, as a basic minimum, good quality
statistics on disaster occurrences and direct impacts.
The Sendai framework contains a statement of outcome, for the next 15 years, to achieve a substantial
reduction of disaster risk and losses, to lives, livelihoods and health and to the economic, physical,
social, cultural, environmental assets of persons, businesses, communities and countries. The
proposed targets in the framework are:
1. Reduce global disaster mortality
2. Reduce the number of affected people
3. Reduce direct disaster economic loss
4. Reduce disaster damage to critical infrastructure and disruption of basic services, among
them health and educational facilities
5. Increase the number of countries with national and local disaster risk reduction strategies
6. Enhance international cooperation
7. Increase the availability of and access to multi-hazard early warning systems and disaster
risk information
The Sendai Framework targets have been followed by specification of a disaster-related target in the
UN Sustainable Development Goals (SDGs). The SDGs provide the globally recognized framework
for the major global public policy priorities, such as ending poverty and ensuring sustainable access to
basic resources. Potentially, there are complex relationships between disasters and development
goals, with influences in both directions.
SDG 11 calls for making cities and human settlements inclusive, safe, resilient and sustainable, with
target 11.5:
“By 2030 significantly reduce the number of deaths and the number of affected people and decrease
the economic losses relative to GDP caused by disasters, including water-related disasters, with the
focus on protecting the poor and people in vulnerable situations”
It is anticipated that implementation of this framework and improving consistency in use of
classifications and definitions for disaster occurrences and direct impacts will be an important
contribution to monitoring and achieving targets for disaster risk reduction and for sustainable
development.
The terms of reference for this Framework are to meet requirements for monitoring the Sendai
Framework targets, which is built on objectives of reducing impacts of disasters and improving
disaster management. The approach in this framework is to align as much as possible, usual
methodologies and classifications in the statistical domain as well as with current practices and
existing databases.
The purpose of the framework is to support production of official statistics, that is data and statistics
produced and reported by the responsible government agencies. There is a demand to prioritize a
Core Set designed to focus on disaster occurrences and direct impacts. This Core Set is presented in
the context of the DRSF.
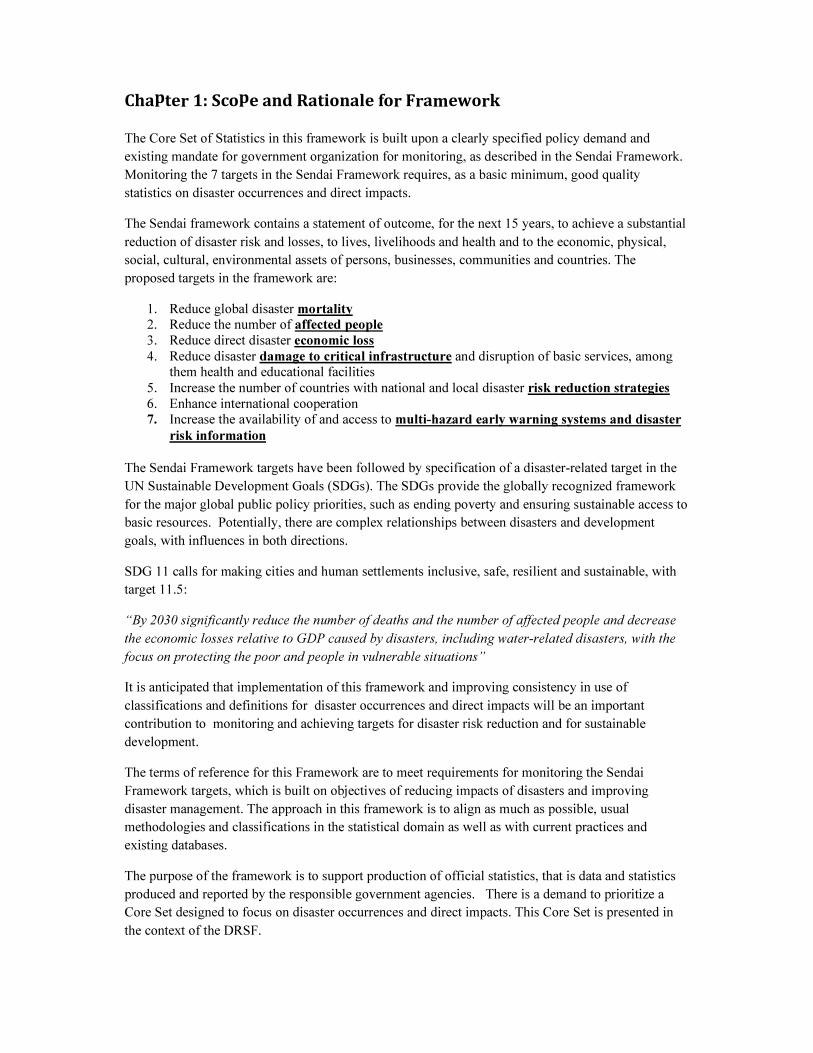
The DRSF is a sketch of the broad picture built around the Core Set. The definitions, classifications
and conventions for the Core Set contribute to defining the structure of the whole DRSF.
Figure 1: DRSF Core Set and Enlarged Framework
The concept for the Core of the DRSF is to apply the following sequence of actions to national
databases: record an event, which initially is a hazard, record the occurrence of a disaster as defined
by the existence of impacts (as show in figure 2), focus on identifying the direct impacts and measure
them from the perspective of human and material impacts.
Building on this Core, the DRSF extends to include disaster management activities and expenditures
and to cultural heritage and environmental impacts. Other blocks shown in the Figure are beyond the
scope of the Core Set, except for the occurrences of hazards, which are the sources of disaster and
also descriptive characteristics recorded in alignment, as much as possible, with the IRDR Peril
Classification and Hazard Glossary (IRDR, 2015). Another extension is proposed for “Disaster
management activities and expenditures” statistics which is essential knowledge for policy
assessment, and therefore listed in the Sendai Framework Targets 5 and 7. It is proposed to consider
including them at an early stage of the process.
Indirect impacts are those which relate to the consequences of the disaster on the further functioning
of the social and economic systems. They are complex processes which require investigations and
research and that are not, for that reason, included in the Core Set. The same considerations apply to
risks and vulnerability to disasters, which combines natural hazards and socio-economic dimensions
which are not part of the Core Set. Both indirect impacts and risks and vulnerability are of utmost
importance and their study is prone at delivering other sets of statistics; they will be incorporated in
DRSF in due time.
Chapter 2 describes definitions and other basic concepts of the Core Set, covering mostly statistics for
Sendai Targets 1 to 4 as well as international comparison (target 6). Chapter 3 provides
recommendations for recording statistics on disaster management activities and expenditures, in line
with current practices of the System of National Accounts for functional analysis. Chapter 4
introduces three classifications developed for the DRSF, namely: classifications for disasters, direct
impacts, and the disaster risk reduction activities (DRRA) and transfers. Chapter 5 reviews selected
core measurement and compilation considerations, particularly measurement units, and the use of GIS
and geospatial information. Chapter 6 contains the core and extended set tables and Chapter 7
concludes with a note on the topic of integration with other existing frameworks and initiatives of
relevance.
Chapter 2: Definitions of Disasters & Impacts
2.1 Defining Disasters
A disaster is:
“a serious disruption of the functioning of society, causing widespread human, material or
environmental losses which exceed the ability of the affected society to cope using only its own
resources”. The United Nations International Strategy for Disaster Reduction (UNISDR)
This framework applies the above general definition but elaborates more specific methods, including
additional definitions of statistical and measurement units, conventions and classifications for
compilers of statistics to produce statistics on occurrences and direct impacts consistently within
DRSF.
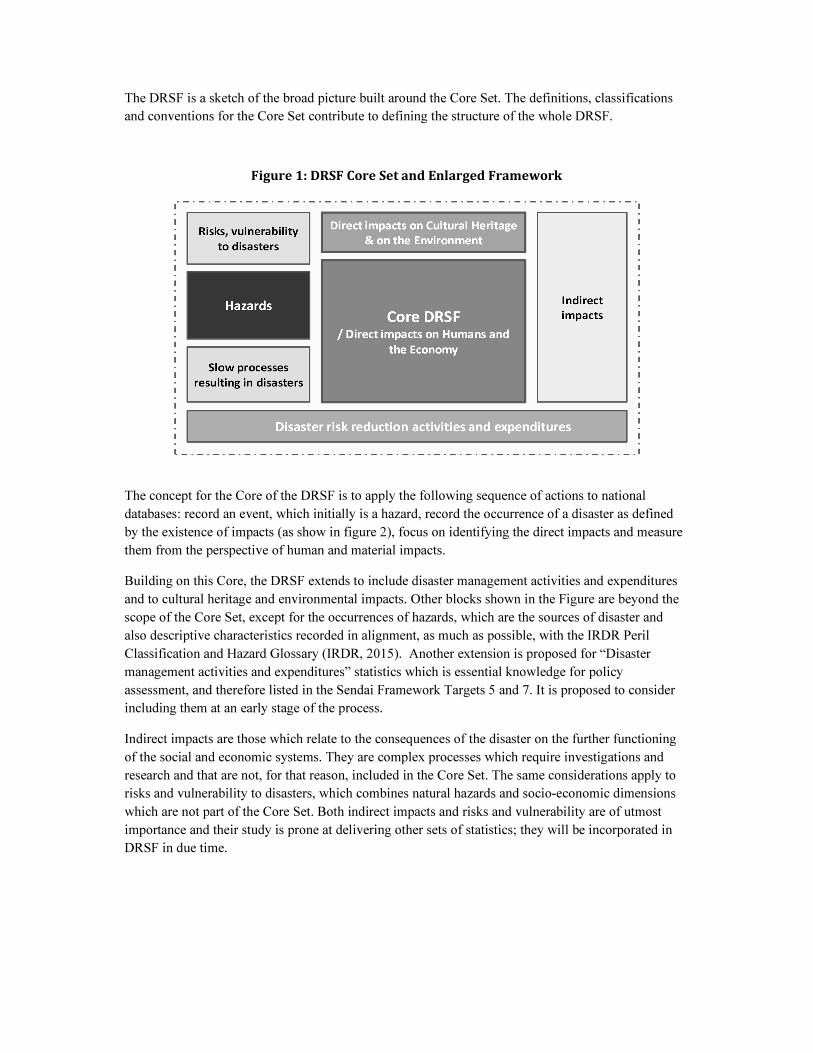
To be considered a disaster occurrence, an observed event must simultaneously meet two criteria:
• The first criterion is existence of social impact. This is an objectively observable social
impact according to an agreed scope and definition of disaster impacts.
• The second criterion is there is a discrete temporal scale (beginning and end to the disaster)
and location (or impact area)
These proposed criteria imply a requirement for collecting three basic types of statistics as part of the
Core Set in the DRSF, needed at least to produce counts of disaster occurrences following this
definition. These requirements are discussed in more detail in the following sections and represented
below:
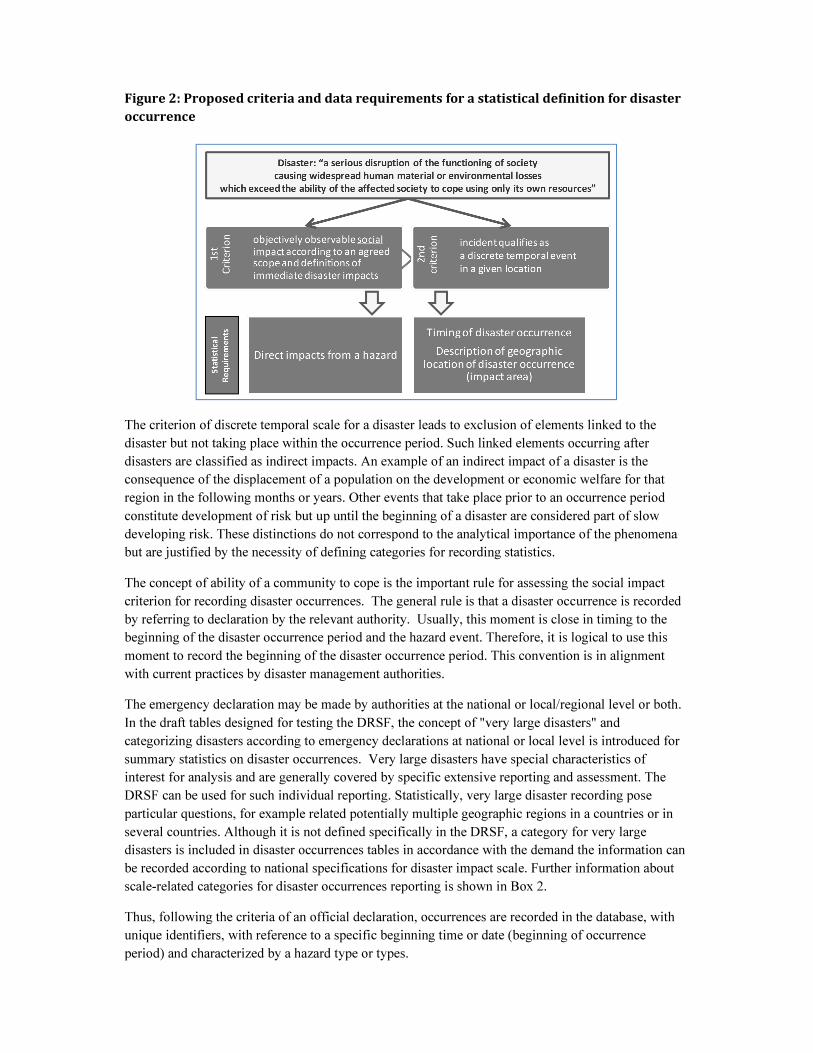
Figure 2: Proposed criteria and data requirements for a statistical definition for disaster
occurrence
The criterion of discrete temporal scale for a disaster leads to exclusion of elements linked to the
disaster but not taking place within the occurrence period. Such linked elements occurring after
disasters are classified as indirect impacts. An example of an indirect impact of a disaster is the
consequence of the displacement of a population on the development or economic welfare for that
region in the following months or years. Other events that take place prior to an occurrence period
constitute development of risk but up until the beginning of a disaster are considered part of slow
developing risk. These distinctions do not correspond to the analytical importance of the phenomena
but are justified by the necessity of defining categories for recording statistics.
The concept of ability of a community to cope is the important rule for assessing the social impact
criterion for recording disaster occurrences. The general rule is that a disaster occurrence is recorded
by referring to declaration by the relevant authority. Usually, this moment is close in timing to the
beginning of the disaster occurrence period and the hazard event. Therefore, it is logical to use this
moment to record the beginning of the disaster occurrence period. This convention is in alignment
with current practices by disaster management authorities.
The emergency declaration may be made by authorities at the national or local/regional level or both.
In the draft tables designed for testing the DRSF, the concept of "very large disasters" and
categorizing disasters according to emergency declarations at national or local level is introduced for
summary statistics on disaster occurrences. Very large disasters have special characteristics of
interest for analysis and are generally covered by specific extensive reporting and assessment. The
DRSF can be used for such individual reporting. Statistically, very large disaster recording pose
particular questions, for example related potentially multiple geographic regions in a countries or in
several countries. Although it is not defined specifically in the DRSF, a category for very large
disasters is included in disaster occurrences tables in accordance with the demand the information can
be recorded according to national specifications for disaster impact scale. Further information about
scale-related categories for disaster occurrences reporting is shown in Box 2.
Thus, following the criteria of an official declaration, occurrences are recorded in the database, with
unique identifiers, with reference to a specific beginning time or date (beginning of occurrence
period) and characterized by a hazard type or types.
As much as possible the use of hazards to describe a disaster is aligned with the IRDR (2015).
However, following the recommendation of the Expert Group, multi-hazard disasters are recorded
separately.
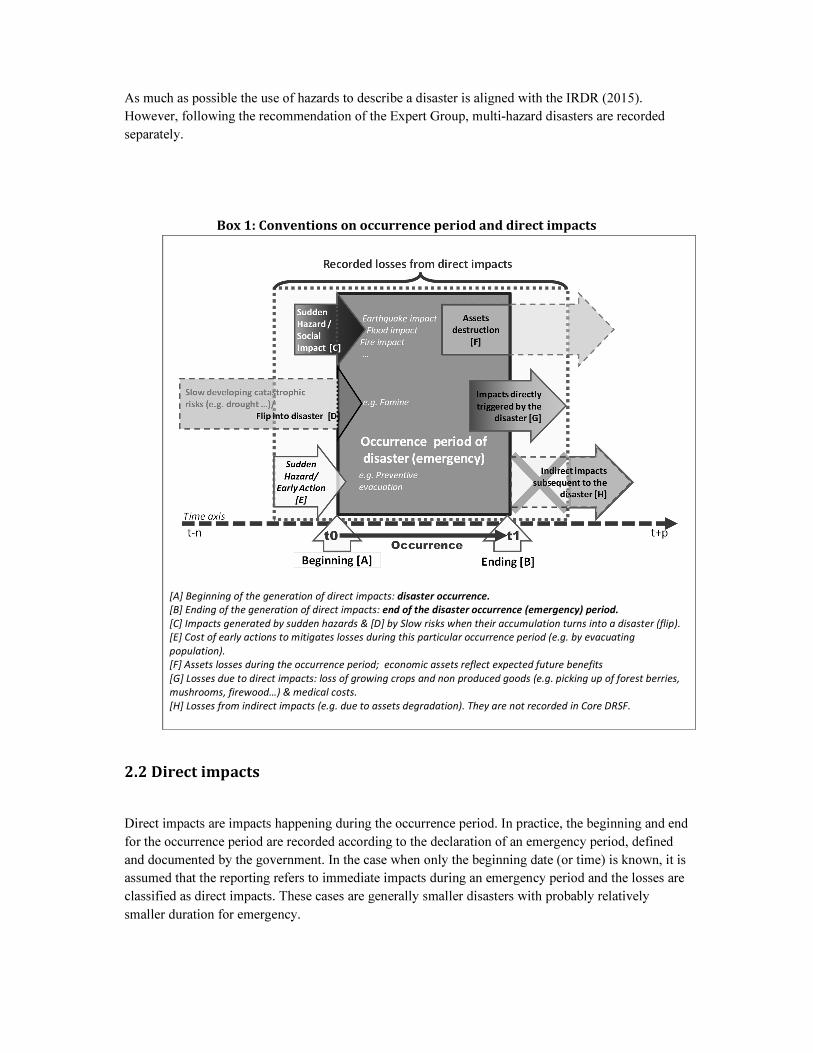
Box 1: Conventions on occurrence period and direct impacts
[A] Beginning of the generation of direct impacts: disaster occurrence.
[B] Ending of the generation of direct impacts: end of the disaster occurrence (emergency) period.
[C] Impacts generated by sudden hazards & [D] by Slow risks when their accumulation turns into a disaster (flip).
[E] Cost of early actions to mitigates losses during this particular occurrence period (e.g. by evacuating
population).
[F] Assets losses during the occurrence period; economic assets reflect expected future benefits
[G] Losses due to direct impacts: loss of growing crops and non produced goods (e.g. picking up of forest berries,
mushrooms, firewood…) & medical costs.
[H] Losses from indirect impacts (e.g. due to assets degradation). They are not recorded in Core DRSF.
2.2 Direct impacts
Direct impacts are impacts happening during the occurrence period. In practice, the beginning and end
for the occurrence period are recorded according to the declaration of an emergency period, defined
and documented by the government. In the case when only the beginning date (or time) is known, it is
assumed that the reporting refers to immediate impacts during an emergency period and the losses are
classified as direct impacts. These cases are generally smaller disasters with probably relatively
smaller duration for emergency.
Direct impacts special cases
Thus, generally, the scope of recording direct impacts within the Core Set of the DRSF is limited to
the shaded box in the centre of the diagram in Box 1, except for two special cases:
Some costs are triggered by a particular disaster, not by an additional event, but may continue after
the emergency period, especially medical care. Also, there can be costs of evacuations or other pre-
emptive measures in anticipation of a disaster prior to the beginning of the disaster occurrence. These
are real and observable costs directly triggered by the disaster occurrence and, by convention, both of
these particular cases are included as direct impacts.
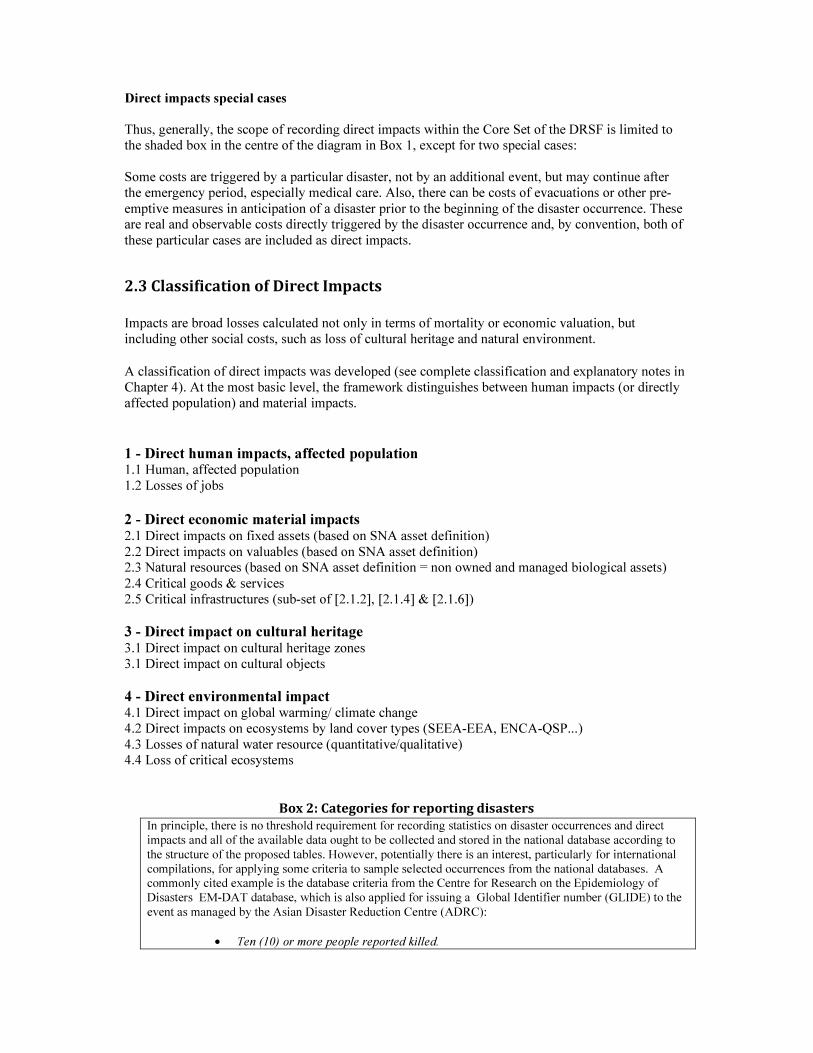
2.3 Classification of Direct Impacts
Impacts are broad losses calculated not only in terms of mortality or economic valuation, but
including other social costs, such as loss of cultural heritage and natural environment.
A classification of direct impacts was developed (see complete classification and explanatory notes in
Chapter 4). At the most basic level, the framework distinguishes between human impacts (or directly
affected population) and material impacts.
1 - Direct human impacts, affected population 1.1 Human, affected population
1.2 Losses of jobs
2 - Direct economic material impacts 2.1 Direct impacts on fixed assets (based on SNA asset definition)
2.2 Direct impacts on valuables (based on SNA asset definition)
2.3 Natural resources (based on SNA asset definition = non owned and managed biological assets)
2.4 Critical goods & services 2.5 Critical infrastructures (sub-set of [2.1.2], [2.1.4] & [2.1.6])
3 - Direct impact on cultural heritage 3.1 Direct impact on cultural heritage zones
3.1 Direct impact on cultural objects
4 - Direct environmental impact
4.1 Direct impact on global warming/ climate change
4.2 Direct impacts on ecosystems by land cover types (SEEA-EEA, ENCA-QSP...)
4.3 Losses of natural water resource (quantitative/qualitative)
4.4 Loss of critical ecosystems
Box 2: Categories for reporting disasters
In principle, there is no threshold requirement for recording statistics on disaster occurrences and direct
impacts and all of the available data ought to be collected and stored in the national database according to
the structure of the proposed tables. However, potentially there is an interest, particularly for international
compilations, for applying some criteria to sample selected occurrences from the national databases. A
commonly cited example is the database criteria from the Centre for Research on the Epidemiology of
Disasters EM-DAT database, which is also applied for issuing a Global Identifier number (GLIDE) to the
event as managed by the Asian Disaster Reduction Centre (ADRC):
• Ten (10) or more people reported killed.
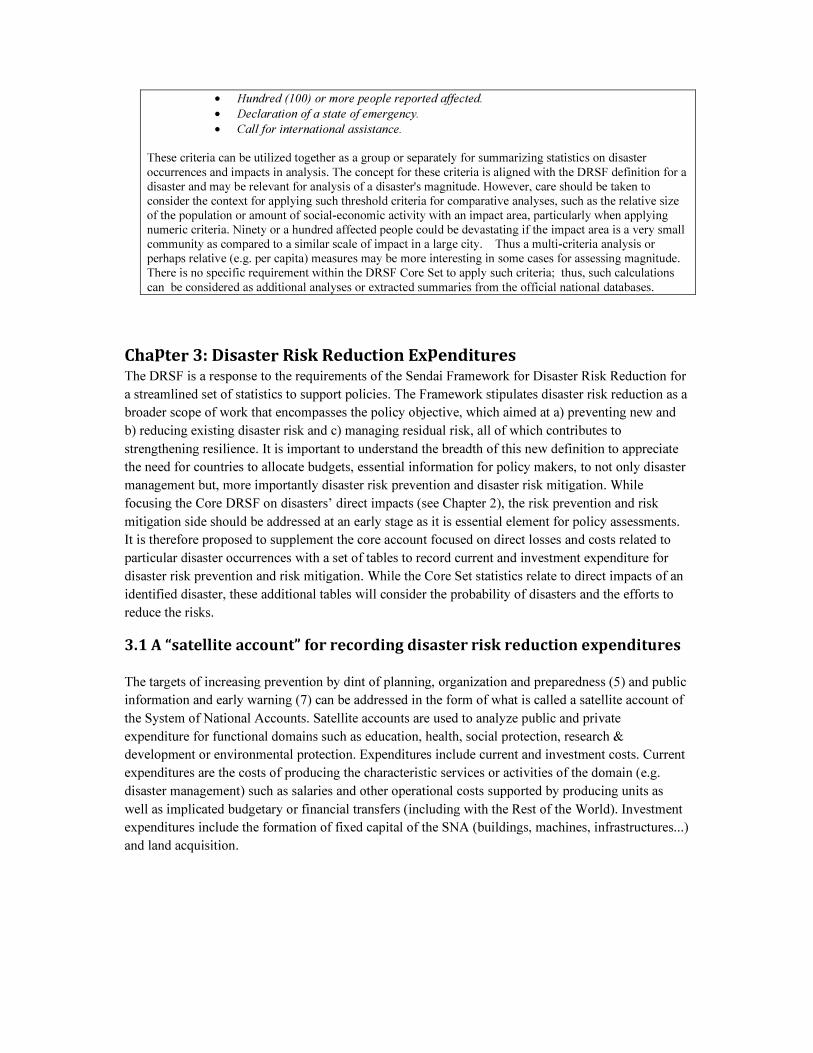
• Hundred (100) or more people reported affected.
• Declaration of a state of emergency.
• Call for international assistance.
These criteria can be utilized together as a group or separately for summarizing statistics on disaster
occurrences and impacts in analysis. The concept for these criteria is aligned with the DRSF definition for a
disaster and may be relevant for analysis of a disaster's magnitude. However, care should be taken to
consider the context for applying such threshold criteria for comparative analyses, such as the relative size
of the population or amount of social-economic activity with an impact area, particularly when applying
numeric criteria. Ninety or a hundred affected people could be devastating if the impact area is a very small
community as compared to a similar scale of impact in a large city. Thus a multi-criteria analysis or
perhaps relative (e.g. per capita) measures may be more interesting in some cases for assessing magnitude.
There is no specific requirement within the DRSF Core Set to apply such criteria; thus, such calculations
can be considered as additional analyses or extracted summaries from the official national databases.
Chapter 3: Disaster Risk Reduction Expenditures The DRSF is a response to the requirements of the Sendai Framework for Disaster Risk Reduction for
a streamlined set of statistics to support policies. The Framework stipulates disaster risk reduction as a
broader scope of work that encompasses the policy objective, which aimed at a) preventing new and
b) reducing existing disaster risk and c) managing residual risk, all of which contributes to
strengthening resilience. It is important to understand the breadth of this new definition to appreciate
the need for countries to allocate budgets, essential information for policy makers, to not only disaster
management but, more importantly disaster risk prevention and disaster risk mitigation. While
focusing the Core DRSF on disasters’ direct impacts (see Chapter 2), the risk prevention and risk
mitigation side should be addressed at an early stage as it is essential element for policy assessments.
It is therefore proposed to supplement the core account focused on direct losses and costs related to
particular disaster occurrences with a set of tables to record current and investment expenditure for
disaster risk prevention and risk mitigation. While the Core Set statistics relate to direct impacts of an
identified disaster, these additional tables will consider the probability of disasters and the efforts to
reduce the risks.
3.1 A “satellite account” for recording disaster risk reduction expenditures
The targets of increasing prevention by dint of planning, organization and preparedness (5) and public
information and early warning (7) can be addressed in the form of what is called a satellite account of
the System of National Accounts. Satellite accounts are used to analyze public and private
expenditure for functional domains such as education, health, social protection, research &
development or environmental protection. Expenditures include current and investment costs. Current
expenditures are the costs of producing the characteristic services or activities of the domain (e.g.
disaster management) such as salaries and other operational costs supported by producing units as
well as implicated budgetary or financial transfers (including with the Rest of the World). Investment
expenditures include the formation of fixed capital of the SNA (buildings, machines, infrastructures...)
and land acquisition.
The common methodology of satellite accounts allows calculating the National Expenditure in the
domain, and to compare it to the National Expenditure of other domains and to the GDP. Detailed
tables report on the relative contribution of sectors (e.g. central, regional, local government,
enterprises, NGOs, households), which are also the beneficiaries. The analysis of how National
Expenditure is financed will allow mapping the flows between sectors (e.g. between central and local
governments) and between the national economy and the Rest of the World (e.g. transfers received
and supplied). Physical data can be attached to satellite accounts as well. Satellite accounts are
convenient tools for monitoring and assessing policies.
Box 3 Definition of National Expenditure for Disaster Risk Reduction and other
aggregates.
The total outcome of characteristics activities performed various sectors involved is made of current
expenditures and investments. This total is the production of the sectors. This production benefits to particular
groups of beneficiaries, generally not in proportion to their contribution to their financing of these activities.
The activity of domain’s producers is financed either from national budgets (public or private) or by funding
from the Rest of the World. Therefore, the National Expenditure for Disaster Risk Reduction will be calculated
as Total Expenditure of the Producers minus transfers received/plus transfers supplied from/to the Rest of the
World.
The satellite account for disaster risk reduction follows the same principle as the Core DRSF in that it
is structured around the concept of direct impacts (see Chapter 2). However, whereas disaster
response policies are to some extent driven by actual events or occurrence, risk prevention and risk
mitigation policies consider the probability of disasters. Disaster risk reduction has to be considered as
a continuous process marked by the irregular and often unpredictable appearance of disasters. The
level of disaster risk reduction will critically determine the magnitude of the direct impacts of a
natural hazard. It records facts anterior, coincident or posterior to the occurrence of the disaster only
as they relate to characteristic activities in the domain (e.g. public awareness raising, delivery of
emergency services or planning and enforcement of prevention measures). These characteristic
activities can also take place during the occurrence of the disaster period, their recording providing a
bridge between the Core DRSF (in the strict sense) and the DM satellite account.
3.2 Disaster Risk Reduction Characteristic Activities (DRRCA)
The scope of a satellite account is usually defined in relation to the characteristic activities of the
domain. A draft classification of Disaster Risk Reduction Characteristic Activities (DRRCA) is
proposed below. It is supplemented with another draft classification aimed at highlighting
Characteristic Transfers taking place in the domain, in particular insurance and international flows.
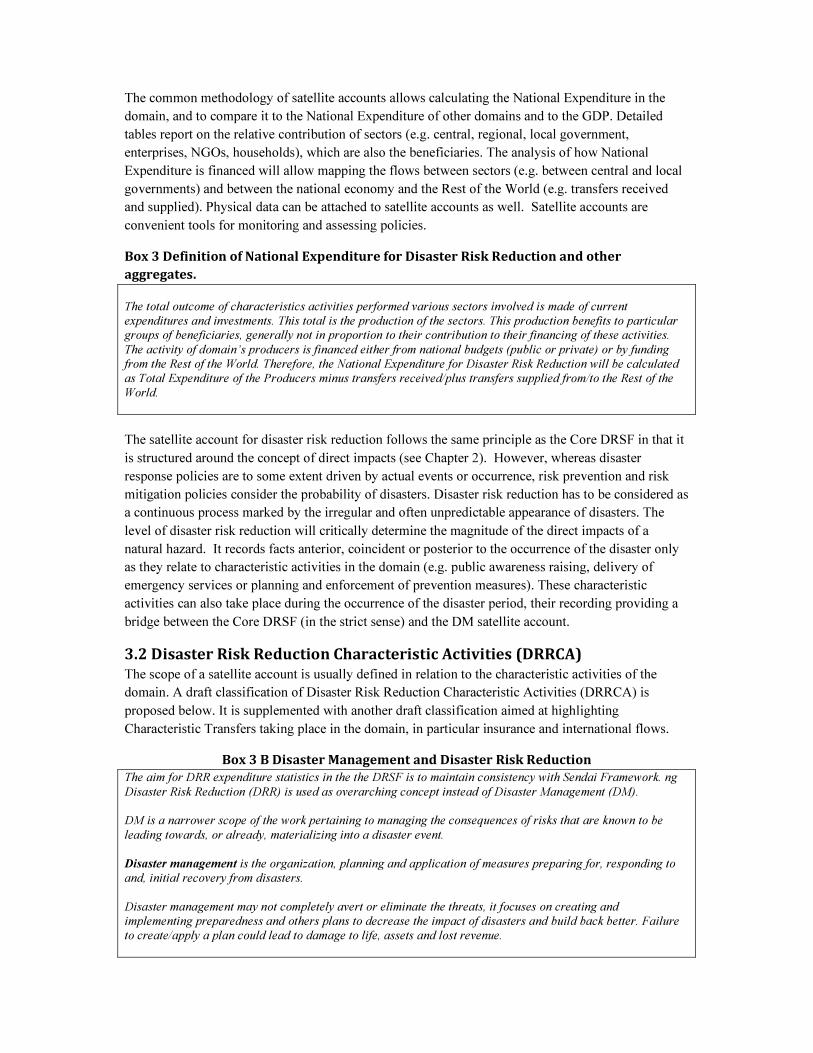
Box 3 B Disaster Management and Disaster Risk Reduction
The aim for DRR expenditure statistics in the the DRSF is to maintain consistency with Sendai Framework. ng
Disaster Risk Reduction (DRR) is used as overarching concept instead of Disaster Management (DM).
DM is a narrower scope of the work pertaining to managing the consequences of risks that are known to be
leading towards, or already, materializing into a disaster event.
Disaster management is the organization, planning and application of measures preparing for, responding to
and, initial recovery from disasters.
Disaster management may not completely avert or eliminate the threats, it focuses on creating and
implementing preparedness and others plans to decrease the impact of disasters and build back better. Failure
to create/apply a plan could lead to damage to life, assets and lost revenue.
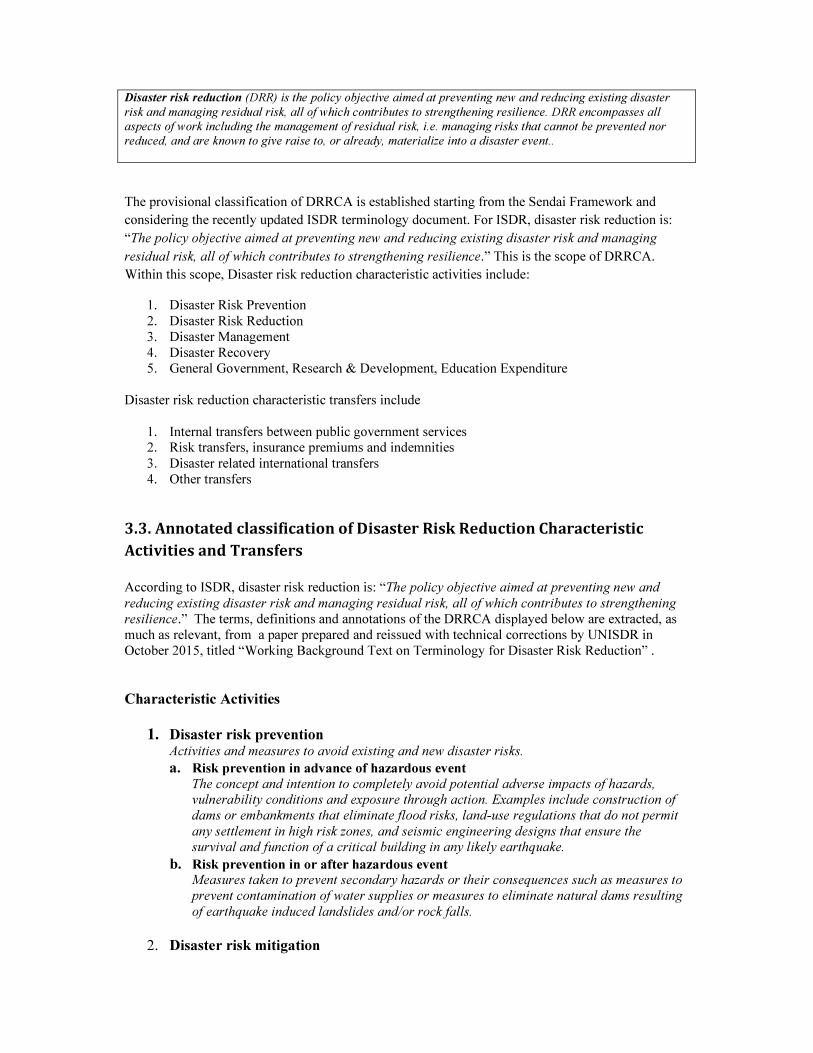
Disaster risk reduction (DRR) is the policy objective aimed at preventing new and reducing existing disaster
risk and managing residual risk, all of which contributes to strengthening resilience. DRR encompasses all
aspects of work including the management of residual risk, i.e. managing risks that cannot be prevented nor
reduced, and are known to give raise to, or already, materialize into a disaster event..
The provisional classification of DRRCA is established starting from the Sendai Framework and
considering the recently updated ISDR terminology document. For ISDR, disaster risk reduction is:
“The policy objective aimed at preventing new and reducing existing disaster risk and managing
residual risk, all of which contributes to strengthening resilience.” This is the scope of DRRCA.
Within this scope, Disaster risk reduction characteristic activities include:
1. Disaster Risk Prevention
2. Disaster Risk Reduction
3. Disaster Management
4. Disaster Recovery
5. General Government, Research & Development, Education Expenditure
Disaster risk reduction characteristic transfers include
1. Internal transfers between public government services
2. Risk transfers, insurance premiums and indemnities
3. Disaster related international transfers
4. Other transfers
3.3. Annotated classification of Disaster Risk Reduction Characteristic
Activities and Transfers
According to ISDR, disaster risk reduction is: “The policy objective aimed at preventing new and
reducing existing disaster risk and managing residual risk, all of which contributes to strengthening
resilience.” The terms, definitions and annotations of the DRRCA displayed below are extracted, as
much as relevant, from a paper prepared and reissued with technical corrections by UNISDR in
October 2015, titled “Working Background Text on Terminology for Disaster Risk Reduction” .
Characteristic Activities
1. Disaster risk prevention Activities and measures to avoid existing and new disaster risks.
a. Risk prevention in advance of hazardous event The concept and intention to completely avoid potential adverse impacts of hazards,
vulnerability conditions and exposure through action. Examples include construction of
dams or embankments that eliminate flood risks, land-use regulations that do not permit
any settlement in high risk zones, and seismic engineering designs that ensure the
survival and function of a critical building in any likely earthquake.
b. Risk prevention in or after hazardous event Measures taken to prevent secondary hazards or their consequences such as measures to
prevent contamination of water supplies or measures to eliminate natural dams resulting
of earthquake induced landslides and/or rock falls.
2. Disaster risk mitigation
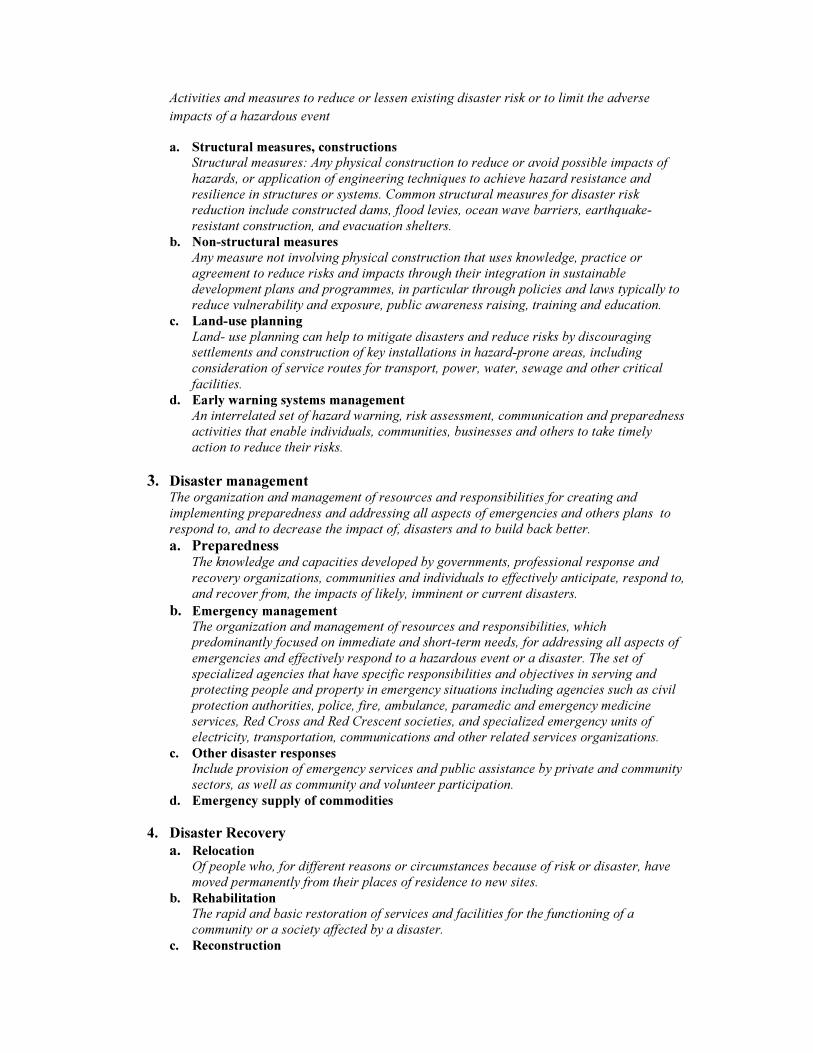
Activities and measures to reduce or lessen existing disaster risk or to limit the adverse
impacts of a hazardous event
a. Structural measures, constructions
Structural measures: Any physical construction to reduce or avoid possible impacts of
hazards, or application of engineering techniques to achieve hazard resistance and
resilience in structures or systems. Common structural measures for disaster risk
reduction include constructed dams, flood levies, ocean wave barriers, earthquake-
resistant construction, and evacuation shelters.
b. Non-structural measures
Any measure not involving physical construction that uses knowledge, practice or
agreement to reduce risks and impacts through their integration in sustainable
development plans and programmes, in particular through policies and laws typically to
reduce vulnerability and exposure, public awareness raising, training and education.
c. Land-use planning
Land- use planning can help to mitigate disasters and reduce risks by discouraging
settlements and construction of key installations in hazard-prone areas, including
consideration of service routes for transport, power, water, sewage and other critical
facilities.
d. Early warning systems management
An interrelated set of hazard warning, risk assessment, communication and preparedness
activities that enable individuals, communities, businesses and others to take timely
action to reduce their risks.
3. Disaster management The organization and management of resources and responsibilities for creating and
implementing preparedness and addressing all aspects of emergencies and others plans to
respond to, and to decrease the impact of, disasters and to build back better.
a. Preparedness The knowledge and capacities developed by governments, professional response and
recovery organizations, communities and individuals to effectively anticipate, respond to,
and recover from, the impacts of likely, imminent or current disasters.
b. Emergency management The organization and management of resources and responsibilities, which
predominantly focused on immediate and short-term needs, for addressing all aspects of
emergencies and effectively respond to a hazardous event or a disaster. The set of
specialized agencies that have specific responsibilities and objectives in serving and
protecting people and property in emergency situations including agencies such as civil
protection authorities, police, fire, ambulance, paramedic and emergency medicine
services, Red Cross and Red Crescent societies, and specialized emergency units of
electricity, transportation, communications and other related services organizations.
c. Other disaster responses
Include provision of emergency services and public assistance by private and community
sectors, as well as community and volunteer participation.
d. Emergency supply of commodities
4. Disaster Recovery a. Relocation
Of people who, for different reasons or circumstances because of risk or disaster, have
moved permanently from their places of residence to new sites.
b. Rehabilitation
The rapid and basic restoration of services and facilities for the functioning of a
community or a society affected by a disaster.
c. Reconstruction
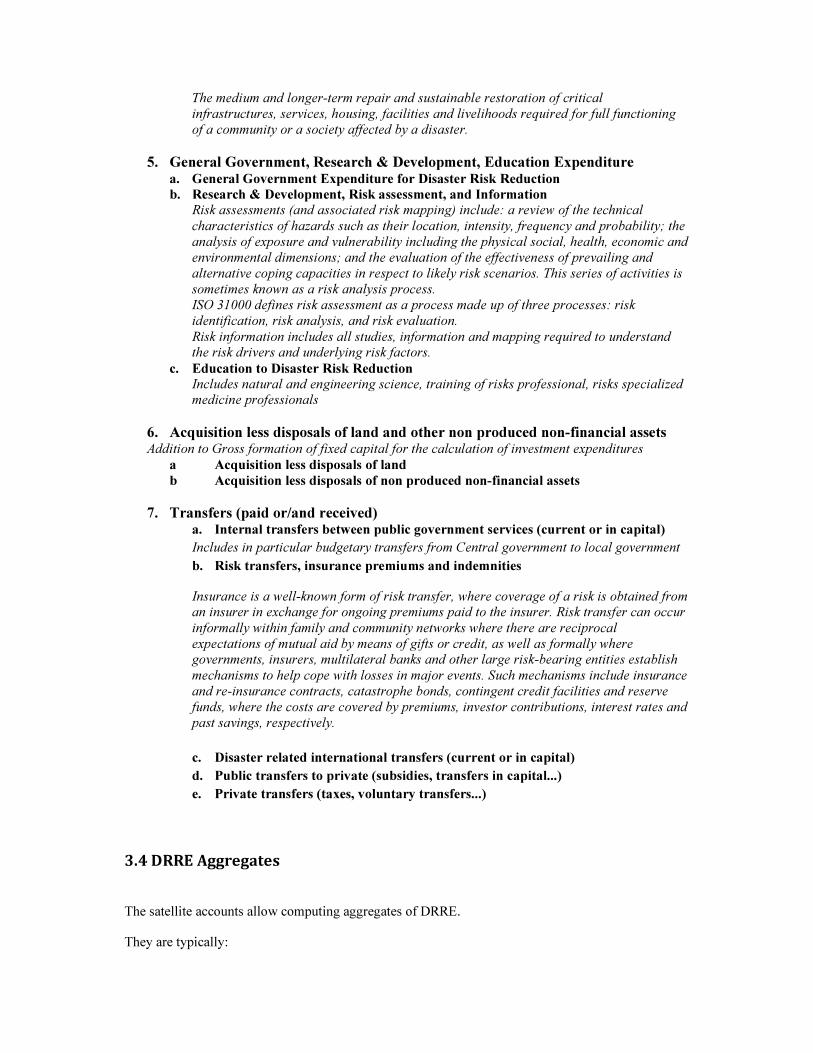
The medium and longer-term repair and sustainable restoration of critical
infrastructures, services, housing, facilities and livelihoods required for full functioning
of a community or a society affected by a disaster.
5. General Government, Research & Development, Education Expenditure a. General Government Expenditure for Disaster Risk Reduction
b. Research & Development, Risk assessment, and Information
Risk assessments (and associated risk mapping) include: a review of the technical
characteristics of hazards such as their location, intensity, frequency and probability; the
analysis of exposure and vulnerability including the physical social, health, economic and
environmental dimensions; and the evaluation of the effectiveness of prevailing and
alternative coping capacities in respect to likely risk scenarios. This series of activities is
sometimes known as a risk analysis process.
ISO 31000 defines risk assessment as a process made up of three processes: risk
identification, risk analysis, and risk evaluation.
Risk information includes all studies, information and mapping required to understand
the risk drivers and underlying risk factors.
c. Education to Disaster Risk Reduction
Includes natural and engineering science, training of risks professional, risks specialized
medicine professionals
6. Acquisition less disposals of land and other non produced non-financial assets Addition to Gross formation of fixed capital for the calculation of investment expenditures
a Acquisition less disposals of land
b Acquisition less disposals of non produced non-financial assets
7. Transfers (paid or/and received) a. Internal transfers between public government services (current or in capital)
Includes in particular budgetary transfers from Central government to local government
b. Risk transfers, insurance premiums and indemnities
Insurance is a well-known form of risk transfer, where coverage of a risk is obtained from
an insurer in exchange for ongoing premiums paid to the insurer. Risk transfer can occur
informally within family and community networks where there are reciprocal
expectations of mutual aid by means of gifts or credit, as well as formally where
governments, insurers, multilateral banks and other large risk-bearing entities establish
mechanisms to help cope with losses in major events. Such mechanisms include insurance
and re-insurance contracts, catastrophe bonds, contingent credit facilities and reserve
funds, where the costs are covered by premiums, investor contributions, interest rates and
past savings, respectively.
c. Disaster related international transfers (current or in capital)
d. Public transfers to private (subsidies, transfers in capital...)
e. Private transfers (taxes, voluntary transfers...)
3.4 DRRE Aggregates
The satellite accounts allow computing aggregates of DRRE.
They are typically:
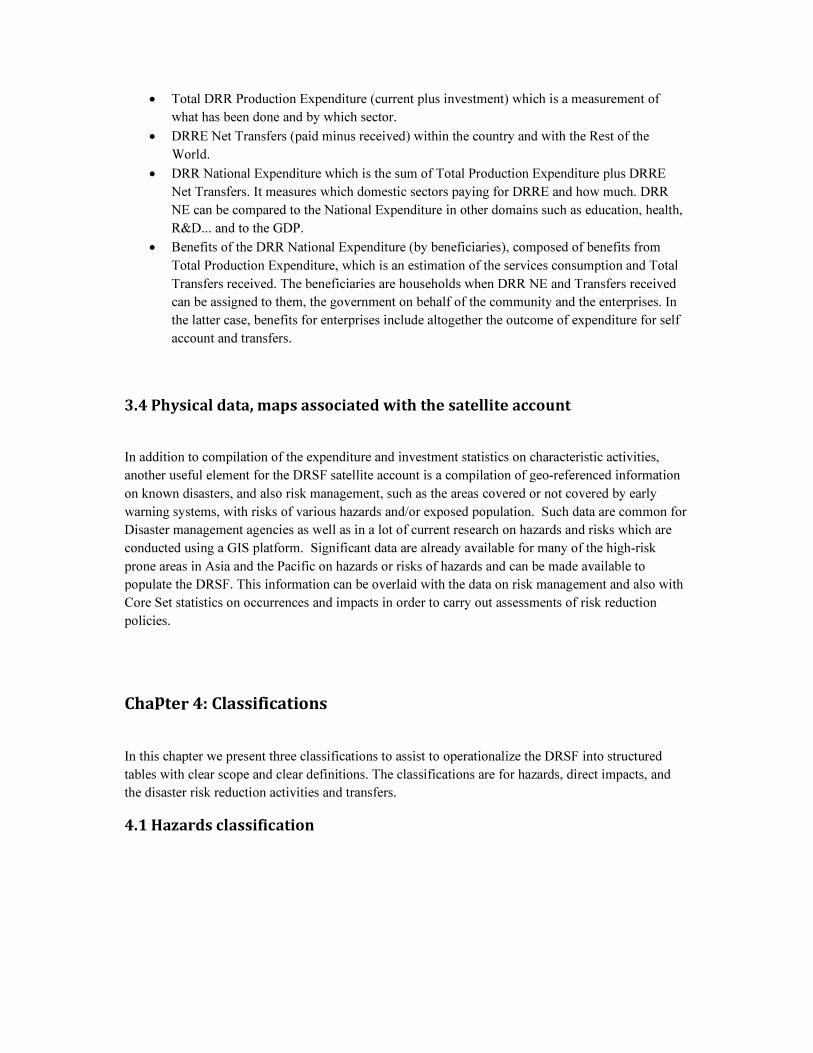
• Total DRR Production Expenditure (current plus investment) which is a measurement of
what has been done and by which sector.
• DRRE Net Transfers (paid minus received) within the country and with the Rest of the
World.
• DRR National Expenditure which is the sum of Total Production Expenditure plus DRRE
Net Transfers. It measures which domestic sectors paying for DRRE and how much. DRR
NE can be compared to the National Expenditure in other domains such as education, health,
R&D... and to the GDP.
• Benefits of the DRR National Expenditure (by beneficiaries), composed of benefits from
Total Production Expenditure, which is an estimation of the services consumption and Total
Transfers received. The beneficiaries are households when DRR NE and Transfers received
can be assigned to them, the government on behalf of the community and the enterprises. In
the latter case, benefits for enterprises include altogether the outcome of expenditure for self
account and transfers.
3.4 Physical data, maps associated with the satellite account
In addition to compilation of the expenditure and investment statistics on characteristic activities,
another useful element for the DRSF satellite account is a compilation of geo-referenced information
on known disasters, and also risk management, such as the areas covered or not covered by early
warning systems, with risks of various hazards and/or exposed population. Such data are common for
Disaster management agencies as well as in a lot of current research on hazards and risks which are
conducted using a GIS platform. Significant data are already available for many of the high-risk
prone areas in Asia and the Pacific on hazards or risks of hazards and can be made available to
populate the DRSF. This information can be overlaid with the data on risk management and also with
Core Set statistics on occurrences and impacts in order to carry out assessments of risk reduction
policies.
Chapter 4: Classifications
In this chapter we present three classifications to assist to operationalize the DRSF into structured
tables with clear scope and clear definitions. The classifications are for hazards, direct impacts, and
the disaster risk reduction activities and transfers.
4.1 Hazards classification
The classification of disasters by hazards types is a direct application of the hazards classification
from IRDR (2015) with the addition of classes for cascading multi-hazard disasters. Cascading multi-
hazard disasters are single events which are linked in time and space - such as, for example, an
earthquake that also causes a tsunami or landslide. These multi-hazard disasters are called cascading
hazards because one hazard directly leads to another. Separate hazards that happen in the same
location or area but that are not otherwise related as a cascading event are separate single-hazard
disasters, with their own discrete spatial and temporal characteristics rather than as multi-hazard
disasters. In the case of multi-hazard disasters, it may be useful to maintain an attribution in the
database to each of the component hazards and/or to a special multi-hazard class (e.g. earthquake-
tsunami). The attribution of disasters to multiple hazards is accommodated in the DRSF with
corrections for double-counting in summary statistics (e.g. total disaster occurrences counts multi-
hazard disasters once). Following this practice, there is no immediate need for a comprehensive
classification of multi-hazard disasters as reporting agencies can make the reference to the component
hazard types in the metadata.
The detailed ISDR Hazards classification is presented in Annexes 1 (Family and Main events) and 2
(Perils).
4.2 Direct impacts classification
Technically the direct impacts classification is built as a list of objects (e.g. individuals, buildings)
which may be impacted in different ways (e.g. damaged or destroyed). The types of impacts are
detailed in the classification of human affected, following the common practices such as the approach
taken in the Disaster Information Management System (DesInventar) initiative of UNISDR and
UNDP. In the case of material impacts, priority is given for simplicity to the types of objects impacted
rather than to the classification of the impacts themselves. However, the distinction between damaged
and destroyed is proposed in the case of dwellings (again following the practice of DesInventar). This
distinction can be specified within the tables for all assets categories if relevant. A comparison of
disaster impact categories and definitions in DESInventar (DES), in the EM-DAT database of the
Centre for Research on the Epidemiology of Disasters (CRED), in the UN Framework for the
Development of Environmental Statistics (FDES) is presented in Annex 3. It will be supplemented
with references to the UN ECLAC Damage and Loss Assessment (DALA) methodology
(forthcoming) .
Material impacts include direct economic impacts, direct impacts on cultural heritage, and direct
environmental impacts. Within direct economic impacts, there are categories for fixed assets,
valuables and natural resources designed for coherence with the definition and categorization of assets
in the System of National Accounts (SNA). For direct economic impacts there is also a sub-set of
classes for critical infrastructure, in order to respect the requirement for statistics on impacts
particularly identified for their importance according to current practices. The scope of critical
infrastructure cuts across multiple categories in the classification scheme. A category for direct
impacts to critical goods and services is also needed so that the framework and tables will capture
important information on direct losses that are technically not accounted for as fixed assets, such as
destruction of crops that were under cultivation and losses to medical services not otherwise captured
by losses to fixed assets. The direct impacts to cultural heritage and to the environment are included
as categories separate from the direct economic impacts because the importance and value of these
losses extend beyond the scope of economic value as defined by the SNA.
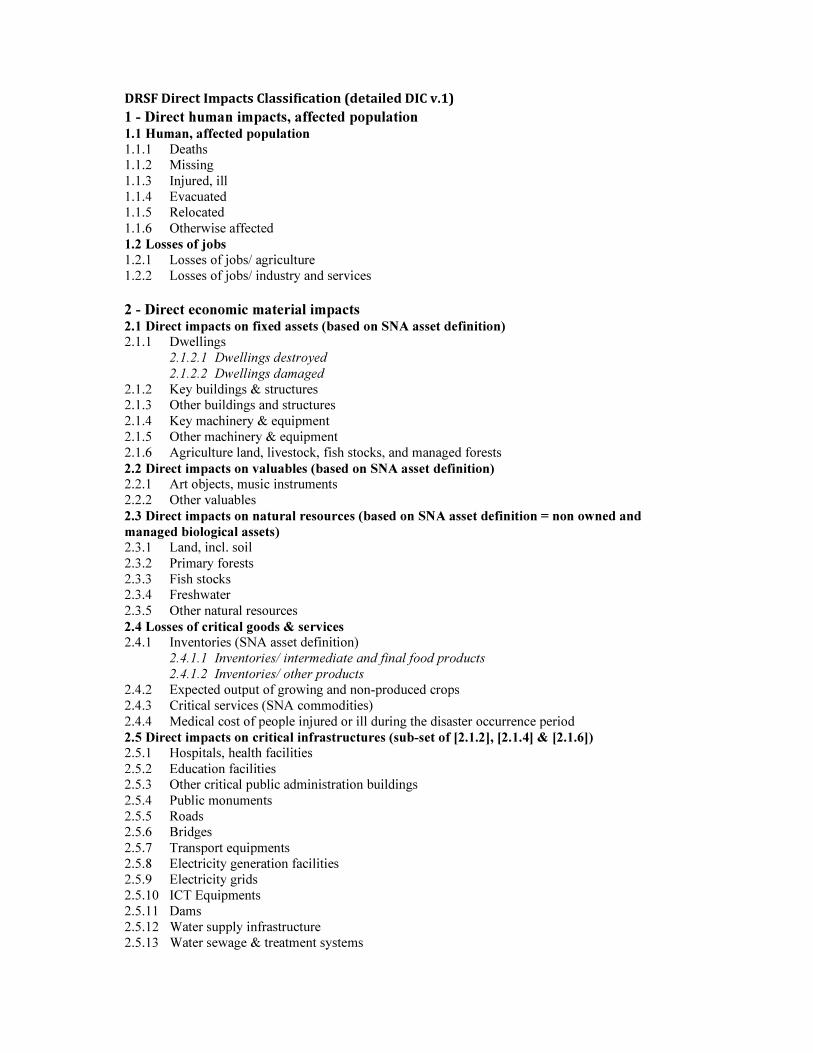
DRSF Direct Impacts Classification (detailed DIC v.1)
1 - Direct human impacts, affected population 1.1 Human, affected population 1.1.1 Deaths
1.1.2 Missing
1.1.3 Injured, ill
1.1.4 Evacuated
1.1.5 Relocated
1.1.6 Otherwise affected
1.2 Losses of jobs
1.2.1 Losses of jobs/ agriculture
1.2.2 Losses of jobs/ industry and services
2 - Direct economic material impacts 2.1 Direct impacts on fixed assets (based on SNA asset definition) 2.1.1 Dwellings
2.1.2.1 Dwellings destroyed
2.1.2.2 Dwellings damaged
2.1.2 Key buildings & structures
2.1.3 Other buildings and structures
2.1.4 Key machinery & equipment
2.1.5 Other machinery & equipment
2.1.6 Agriculture land, livestock, fish stocks, and managed forests
2.2 Direct impacts on valuables (based on SNA asset definition)
2.2.1 Art objects, music instruments
2.2.2 Other valuables
2.3 Direct impacts on natural resources (based on SNA asset definition = non owned and
managed biological assets) 2.3.1 Land, incl. soil
2.3.2 Primary forests
2.3.3 Fish stocks
2.3.4 Freshwater
2.3.5 Other natural resources
2.4 Losses of critical goods & services 2.4.1 Inventories (SNA asset definition)
2.4.1.1 Inventories/ intermediate and final food products
2.4.1.2 Inventories/ other products
2.4.2 Expected output of growing and non-produced crops
2.4.3 Critical services (SNA commodities)
2.4.4 Medical cost of people injured or ill during the disaster occurrence period
2.5 Direct impacts on critical infrastructures (sub-set of [2.1.2], [2.1.4] & [2.1.6])
2.5.1 Hospitals, health facilities
2.5.2 Education facilities
2.5.3 Other critical public administration buildings
2.5.4 Public monuments
2.5.5 Roads
2.5.6 Bridges
2.5.7 Transport equipments
2.5.8 Electricity generation facilities
2.5.9 Electricity grids
2.5.10 ICT Equipments
2.5.11 Dams
2.5.12 Water supply infrastructure
2.5.13 Water sewage & treatment systems
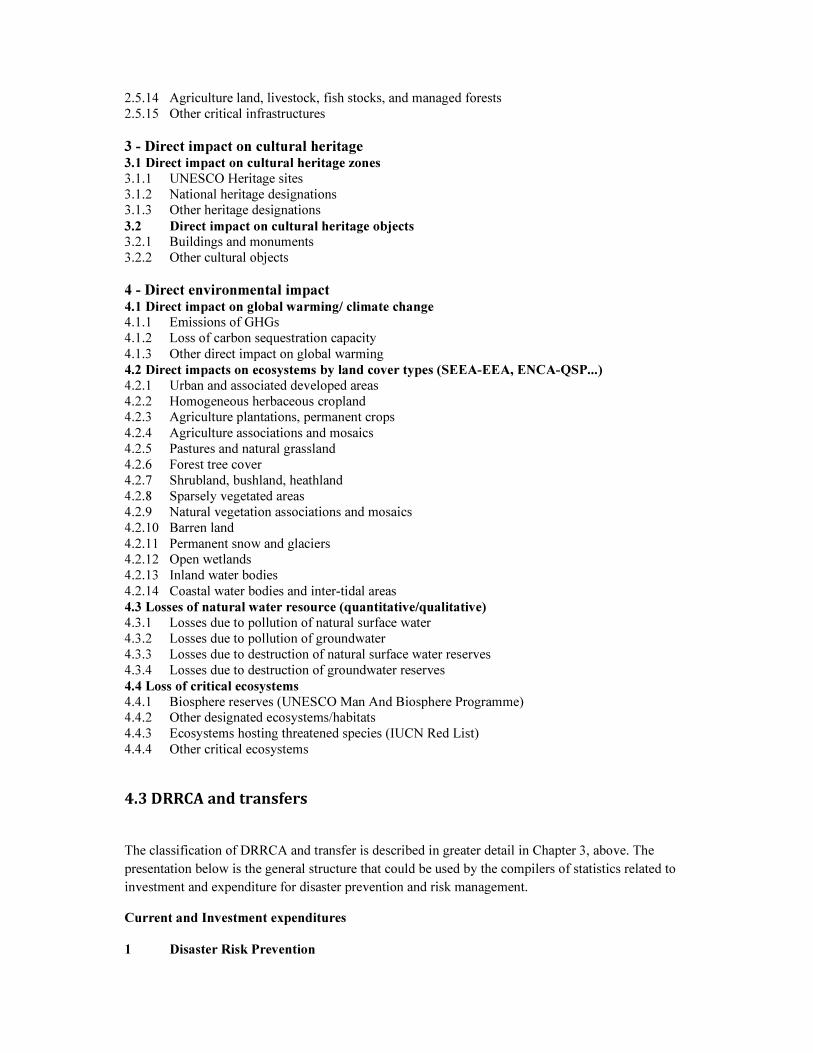
2.5.14 Agriculture land, livestock, fish stocks, and managed forests
2.5.15 Other critical infrastructures
3 - Direct impact on cultural heritage 3.1 Direct impact on cultural heritage zones
3.1.1 UNESCO Heritage sites
3.1.2 National heritage designations
3.1.3 Other heritage designations
3.2 Direct impact on cultural heritage objects
3.2.1 Buildings and monuments
3.2.2 Other cultural objects
4 - Direct environmental impact
4.1 Direct impact on global warming/ climate change 4.1.1 Emissions of GHGs
4.1.2 Loss of carbon sequestration capacity
4.1.3 Other direct impact on global warming
4.2 Direct impacts on ecosystems by land cover types (SEEA-EEA, ENCA-QSP...)
4.2.1 Urban and associated developed areas
4.2.2 Homogeneous herbaceous cropland
4.2.3 Agriculture plantations, permanent crops
4.2.4 Agriculture associations and mosaics
4.2.5 Pastures and natural grassland
4.2.6 Forest tree cover
4.2.7 Shrubland, bushland, heathland
4.2.8 Sparsely vegetated areas
4.2.9 Natural vegetation associations and mosaics
4.2.10 Barren land
4.2.11 Permanent snow and glaciers
4.2.12 Open wetlands
4.2.13 Inland water bodies
4.2.14 Coastal water bodies and inter-tidal areas
4.3 Losses of natural water resource (quantitative/qualitative)
4.3.1 Losses due to pollution of natural surface water
4.3.2 Losses due to pollution of groundwater
4.3.3 Losses due to destruction of natural surface water reserves
4.3.4 Losses due to destruction of groundwater reserves
4.4 Loss of critical ecosystems
4.4.1 Biosphere reserves (UNESCO Man And Biosphere Programme)
4.4.2 Other designated ecosystems/habitats
4.4.3 Ecosystems hosting threatened species (IUCN Red List)
4.4.4 Other critical ecosystems
4.3 DRRCA and transfers
The classification of DRRCA and transfer is described in greater detail in Chapter 3, above. The
presentation below is the general structure that could be used by the compilers of statistics related to
investment and expenditure for disaster prevention and risk management.
Current and Investment expenditures
1 Disaster Risk Prevention
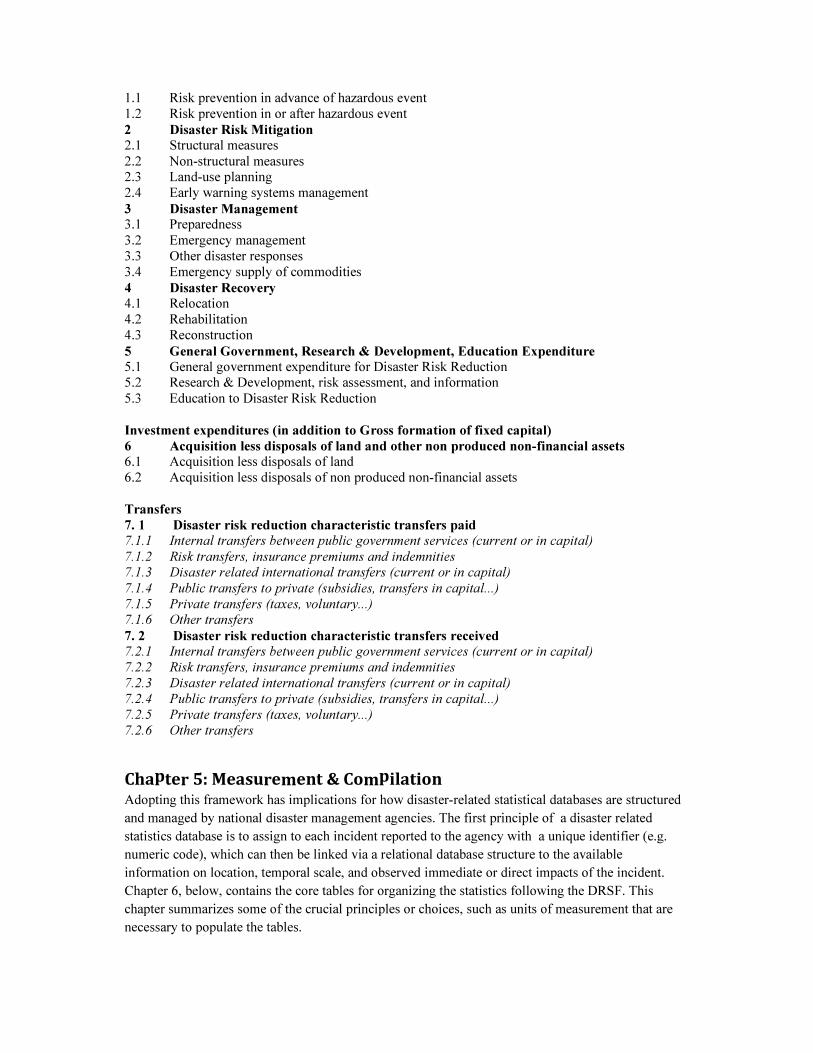
1.1 Risk prevention in advance of hazardous event
1.2 Risk prevention in or after hazardous event
2 Disaster Risk Mitigation
2.1 Structural measures
2.2 Non-structural measures
2.3 Land-use planning
2.4 Early warning systems management
3 Disaster Management
3.1 Preparedness
3.2 Emergency management
3.3 Other disaster responses
3.4 Emergency supply of commodities
4 Disaster Recovery
4.1 Relocation
4.2 Rehabilitation
4.3 Reconstruction
5 General Government, Research & Development, Education Expenditure
5.1 General government expenditure for Disaster Risk Reduction
5.2 Research & Development, risk assessment, and information
5.3 Education to Disaster Risk Reduction
Investment expenditures (in addition to Gross formation of fixed capital)
6 Acquisition less disposals of land and other non produced non-financial assets
6.1 Acquisition less disposals of land
6.2 Acquisition less disposals of non produced non-financial assets
Transfers
7. 1 Disaster risk reduction characteristic transfers paid
7.1.1 Internal transfers between public government services (current or in capital)
7.1.2 Risk transfers, insurance premiums and indemnities
7.1.3 Disaster related international transfers (current or in capital)
7.1.4 Public transfers to private (subsidies, transfers in capital...)
7.1.5 Private transfers (taxes, voluntary...)
7.1.6 Other transfers
7. 2 Disaster risk reduction characteristic transfers received
7.2.1 Internal transfers between public government services (current or in capital)
7.2.2 Risk transfers, insurance premiums and indemnities
7.2.3 Disaster related international transfers (current or in capital)
7.2.4 Public transfers to private (subsidies, transfers in capital...)
7.2.5 Private transfers (taxes, voluntary...)
7.2.6 Other transfers
Chapter 5: Measurement & Compilation Adopting this framework has implications for how disaster-related statistical databases are structured
and managed by national disaster management agencies. The first principle of a disaster related
statistics database is to assign to each incident reported to the agency with a unique identifier (e.g.
numeric code), which can then be linked via a relational database structure to the available
information on location, temporal scale, and observed immediate or direct impacts of the incident.
Chapter 6, below, contains the core tables for organizing the statistics following the DRSF. This
chapter summarizes some of the crucial principles or choices, such as units of measurement that are
necessary to populate the tables.
5.1 Measurement Units
There are several potential approaches for defining the measurement units for direct impacts. One
approach is to compile statistics in monetary terms, e.g. the monetary cost of restoration of a damaged
building or the medical costs. However, prior to monetary valuation, there is an observation of impact
in physical units, such as numbers of individuals, numbers of hospitals or a spatial area (e.g. hectares).
Statistics on disaster impacts in physical terms can be very important information and should be
collected and stored for future analysis. There are difficult questions related to how to aggregate
impacts in physical terms that are not yet resolved. At this stage, counts of people affected give very
acceptable measurements but totals (e.g. of deaths and other affected people) can be difficult to
interpret. The problem is worse with material assets of very different nature and size. In some cases,
one solution can be to weight the physical units according to their main property in terms of service
given. For example, dwellings can be weighted by the number of inhabitants, hospitals by the number
of beds, and so on. A provisional list of suggested units and weights was prepared as guidance for the
testing of the DRSF in countries. Pilot tests will assess feasibility for measurement units of direct
impacts according to currently available data on historical disasters.
It is important to maintain a database of direct impacts in physical terms regardless of whether
statistics are also available for calculating the monetary value of the losses as well. One reason is that
monetary valuation depends on the economic context where and when the impacts take place and not
only the magnitude of the impacts in a broader sense. For example, prices for reconstructing a
damaged dwelling in Japan could be significantly different as compared to prices in Bangladesh. As
discussed below, there are potentially multiple approaches, or multiple prices, that can be applied to
monetary valuation of assets and so maintaining statistics in physical terms will allow greater
flexibility for future analyses of a disaster as compared to statistics in monetary terms only, in which
case it is difficult or impossible to work backwards to interpret the scale of impacts in physical terms
or following an alternative valuation method.
In the case of human impacts, there is an interest to disaggregate statistics on affected populations
according to certain groups (e.g. gender or age groups). But, generally in basic compilation tables the
measurement unit for human impacts is always the counts of individuals. Numbers of households is
another possibility, but this choice is less practical for these particular statistics and would affect the
efficiency for calculating the totals - e.g. total number of deaths or injured.
Below is a working table with some initial suggestions for measurements for each item in the direct
impacts classification. These suggested measurement units will be further discussed and evaluated
through pilot testing of the DRSF in order to develop final recommendations on this issue. The table
also indicates (third column) where monetary valuation is applicable, not applicable, or not relevant.
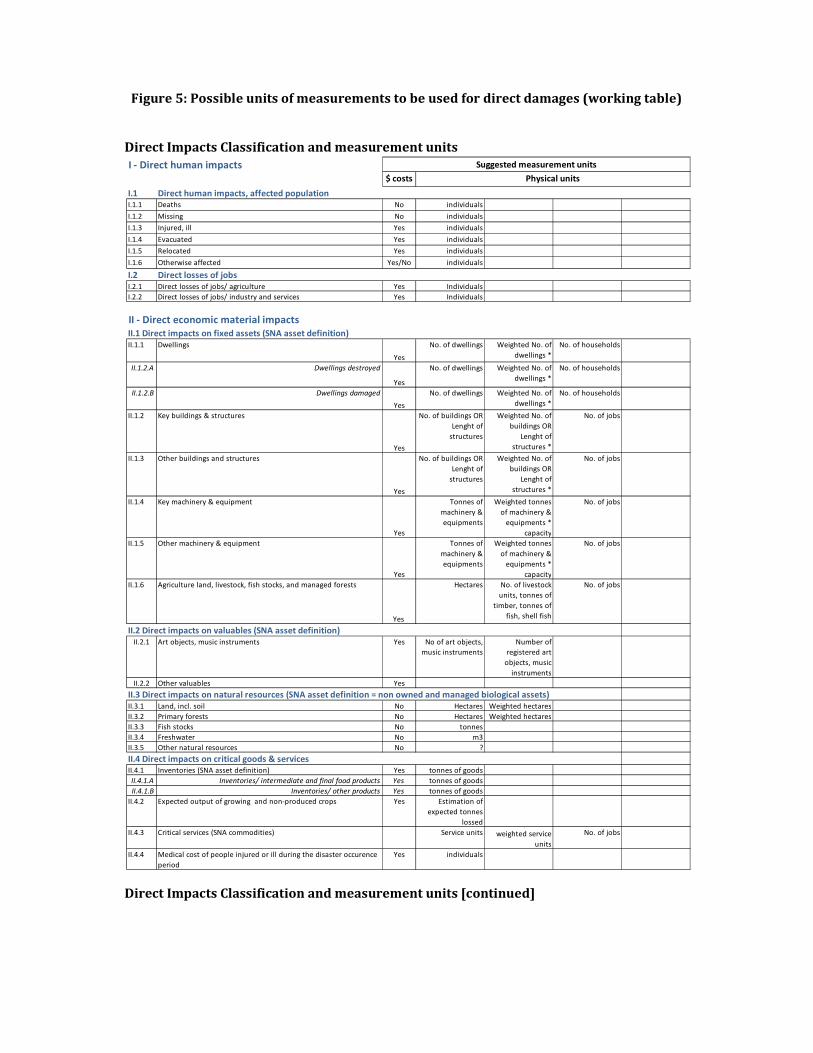
Figure 5: Possible units of measurements to be used for direct damages (working table)
Direct Impacts Classification and measurement units
Direct Impacts Classification and measurement units [continued]
I - Direct human impacts
$ costs
I.1 Direct human impacts, affected populationI.1.1 Deaths No individuals
I.1.2 Missing No individuals
I.1.3 Injured, ill Yes individuals
I.1.4 Evacuated Yes individuals
I.1.5 Relocated Yes individuals
I.1.6 Otherwise affected Yes/No individuals
I.2 Direct losses of jobsI.2.1 Direct losses of jobs/ agriculture Yes Individuals
I.2.2 Direct losses of jobs/ industry and services Yes Individuals
II - Direct economic material impacts
II.1 Direct impacts on fixed assets (SNA asset definition)II.1.1 Dwellings
Yes
No. of dwellings Weighted No. of
dwellings *
capacity
No. of households
II.1.2.A Dwellings destroyed
Yes
No. of dwellings Weighted No. of
dwellings *
capacity
No. of households
II.1.2.B Dwellings damaged
Yes
No. of dwellings Weighted No. of
dwellings *
capacity
No. of households
II.1.2 Key buildings & structures
Yes
No. of buildings OR
Lenght of
structures
Weighted No. of
buildings OR
Lenght of
structures *
capacity
No. of jobs
II.1.3 Other buildings and structures
Yes
No. of buildings OR
Lenght of
structures
Weighted No. of
buildings OR
Lenght of
structures *
capacity
No. of jobs
II.1.4 Key machinery & equipment
Yes
Tonnes of
machinery &
equipments
Weighted tonnes
of machinery &
equipments *
capacity
No. of jobs
II.1.5 Other machinery & equipment
Yes
Tonnes of
machinery &
equipments
Weighted tonnes
of machinery &
equipments *
capacity
No. of jobs
II.1.6 Agriculture land, livestock, fish stocks, and managed forests
Yes
Hectares No. of livestock
units, tonnes of
timber, tonnes of
fish, shell fish
No. of jobs
II.2 Direct impacts on valuables (SNA asset definition)II.2.1 Art objects, music instruments Yes No of art objects,
music instruments
Number of
registered art
objects, music
instruments
II.2.2 Other valuables Yes
II.3 Direct impacts on natural resources (SNA asset definition = non owned and managed biological assets)II.3.1 Land, incl. soil No Hectares Weighted hectares
II.3.2 Primary forests No Hectares Weighted hectares
II.3.3 Fish stocks No tonnes
II.3.4 Freshwater No m3
II.3.5 Other natural resources No ?
II.4 Direct impacts on critical goods & servicesII.4.1 Inventories (SNA asset definition) Yes tonnes of goods
II.4.1.A Inventories/ intermediate and final food products Yes tonnes of goods
II.4.1.B Inventories/ other products Yes tonnes of goods
II.4.2 Expected output of growing and non-produced crops Yes Estimation of
expected tonnes
lossed
II.4.3 Critical services (SNA commodities) Service units
Population
weighted service
units
No. of jobs
II.4.4 Medical cost of people injured or ill during the disaster occurence
period
Yes individuals
Suggested measurement units
Physical units
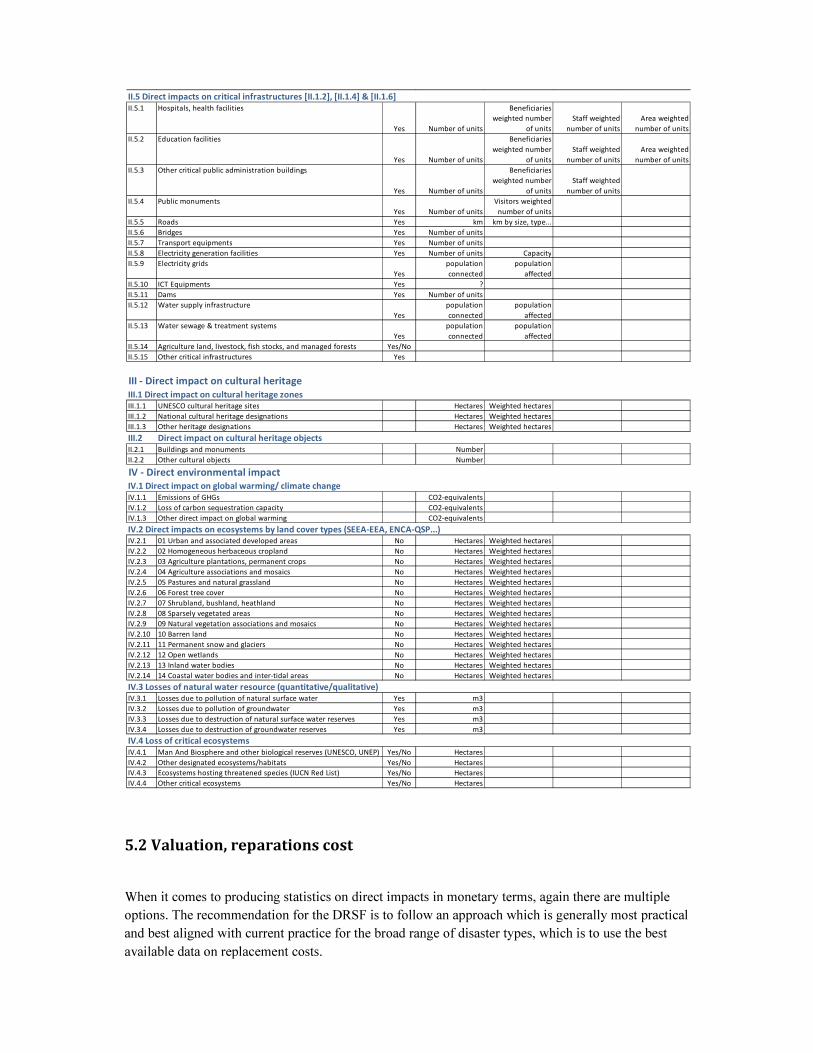
5.2 Valuation, reparations cost
When it comes to producing statistics on direct impacts in monetary terms, again there are multiple
options. The recommendation for the DRSF is to follow an approach which is generally most practical
and best aligned with current practice for the broad range of disaster types, which is to use the best
available data on replacement costs.
II.5 Direct impacts on critical infrastructures [II.1.2], [II.1.4] & [II.1.6]
II.5.1 Hospitals, health facilities
Yes Number of units
Beneficiaries
weighted number
of units
Staff weighted
number of units
Area weighted
number of units
II.5.2 Education facilities
Yes Number of units
Beneficiaries
weighted number
of units
Staff weighted
number of units
Area weighted
number of units
II.5.3 Other critical public administration buildings
Yes Number of units
Beneficiaries
weighted number
of units
Staff weighted
number of units
II.5.4 Public monuments
Yes Number of units
Visitors weighted
number of units
II.5.5 Roads Yes km km by size, type...
II.5.6 Bridges Yes Number of units
II.5.7 Transport equipments Yes Number of units
II.5.8 Electricity generation facilities Yes Number of units Capacity
II.5.9 Electricity grids
Yes
population
connected
population
affected
II.5.10 ICT Equipments Yes ?
II.5.11 Dams Yes Number of units
II.5.12 Water supply infrastructure
Yes
population
connected
population
affected
II.5.13 Water sewage & treatment systems
Yes
population
connected
population
affected
II.5.14 Agriculture land, livestock, fish stocks, and managed forests Yes/No
II.5.15 Other critical infrastructures Yes
III - Direct impact on cultural heritage
III.1 Direct impact on cultural heritage zones
III.1.1 UNESCO cultural heritage sites Hectares Weighted hectares
III.1.2 National cultural heritage designations Hectares Weighted hectares
III.1.3 Other heritage designations Hectares Weighted hectares
III.2 Direct impact on cultural heritage objects
II.2.1 Buildings and monuments Number
II.2.2 Other cultural objects Number
IV - Direct environmental impact
IV.1 Direct impact on global warming/ climate change
IV.1.1 Emissions of GHGs CO2-equivalents
IV.1.2 Loss of carbon sequestration capacity CO2-equivalents
IV.1.3 Other direct impact on global warming CO2-equivalents
IV.2 Direct impacts on ecosystems by land cover types (SEEA-EEA, ENCA-QSP...)
IV.2.1 01 Urban and associated developed areas No Hectares Weighted hectares
IV.2.2 02 Homogeneous herbaceous cropland No Hectares Weighted hectares
IV.2.3 03 Agriculture plantations, permanent crops No Hectares Weighted hectares
IV.2.4 04 Agriculture associations and mosaics No Hectares Weighted hectares
IV.2.5 05 Pastures and natural grassland No Hectares Weighted hectares
IV.2.6 06 Forest tree cover No Hectares Weighted hectares
IV.2.7 07 Shrubland, bushland, heathland No Hectares Weighted hectares
IV.2.8 08 Sparsely vegetated areas No Hectares Weighted hectares
IV.2.9 09 Natural vegetation associations and mosaics No Hectares Weighted hectares
IV.2.10 10 Barren land No Hectares Weighted hectares
IV.2.11 11 Permanent snow and glaciers No Hectares Weighted hectares
IV.2.12 12 Open wetlands No Hectares Weighted hectares
IV.2.13 13 Inland water bodies No Hectares Weighted hectares
IV.2.14 14 Coastal water bodies and inter-tidal areas No Hectares Weighted hectares
IV.3 Losses of natural water resource (quantitative/qualitative)
IV.3.1 Losses due to pollution of natural surface water Yes m3
IV.3.2 Losses due to pollution of groundwater Yes m3
IV.3.3 Losses due to destruction of natural surface water reserves Yes m3
IV.3.4 Losses due to destruction of groundwater reserves Yes m3
IV.4 Loss of critical ecosystems
IV.4.1 Man And Biosphere and other biological reserves (UNESCO, UNEP) Yes/No Hectares
IV.4.2 Other designated ecosystems/habitats Yes/No Hectares
IV.4.3 Ecosystems hosting threatened species (IUCN Red List) Yes/No Hectares
IV.4.4 Other critical ecosystems Yes/No Hectares
Even with the convention to apply replacement costs in valuation of impacts, it is important to note
that there may be two relevant prices. In the case of the destruction of public buildings and other
infrastructures, the full reconstruction price will be recorded (likely at the price of a new asset) as this
amount has to be budgeted by the Government. In the case of compensations to households or
enterprises, it is likely that the price will cover the loss, not always the actual replacement; in addition,
this compensation may happen in the form of a lump sum. All in all, attention will have to be paid to
these differences in replacement costs and case by case the method used need be carefully
documented.
Monetary valuation of the losses of assets and production should be conducted, when endeavored, in
accordance with the valuation principles established in the SNA, which is utilized for a broad range of
purposes, including calculating aggregate indicators for production (GDP), consumption and saving.
In the case of products, the general rule in the case of no observable price is to use the closest
analogy. This rule can be followed for losses of services and goods (e.g. crops).
The valuation of physical assets is complicated and complete compilation of national asset accounting
is not commonly done in Asia and the Pacific. It is therefore recommended not to focus on an
approach in terms of loss of economic value of physical assets. However, it may happen that in some
countries the NSO is doing such calculation. It would in principle include, under the item “Other
changes of volume to assets” of the Balance Sheet of the SNA a measurement for “catastrophic
losses”. In that case, such data can be used if they can be downscaled to the impacted area; as well
data on losses (at the replacement cost) and total non financial asset values can be usefully compared.
The term economic loss is referenced in the Sendai Framework and Sustainable Development Goal
11. UNISDR (August, 2015) has suggested to reserve the use of the term economic loss for the
monetary valuation of impacts to assets and we have adopted this use of the term for this framework
as well.
In theory, it might be possible estimate for direct economic losses associated with deaths, but is not
recommended for DRSF as the issue is controversial and no agreed methodology exists. The basic
suggested principle is to apply the observed recovery and remediation costs. It includes medical costs
and various other costs linked to emergency situation such as evacuation or relocation of a population.
As explained in chapter 2, costs which are directly triggered by the disaster are recorded as being the
result direct impacts; it consists mainly in medical costs of persons injured during the disaster period
and of growing crops and non-produced goods (picked up berries, mushroom, firewood and the like).
In symmetric way, when an evacuation is undertaken in view of mitigating the impacts of an
announced hazard, the costs are considered as part of those of the disaster. This is not the case of the
general disaster management measures which costs all along the year relate to the probability of
disasters; their costs are actual expenditures (current expenditures and investments) which are
recorded in the satellite account (see Chapter 3).
Also, there are no calculations of monetary asset values for the cultural heritage and for environment
assets considered beyond their property of being economic resources. In that case, valuation should
follow the SNA rules based on economic benefits. Cultural and ecological values are not included in
SNA estimations and should be recorded in the DRSF as a function of material losses. Instead,
restoration costs should be estimated and recorded for cultural heritage and the ecosystem.
5.3 Need for geographic information and GIS
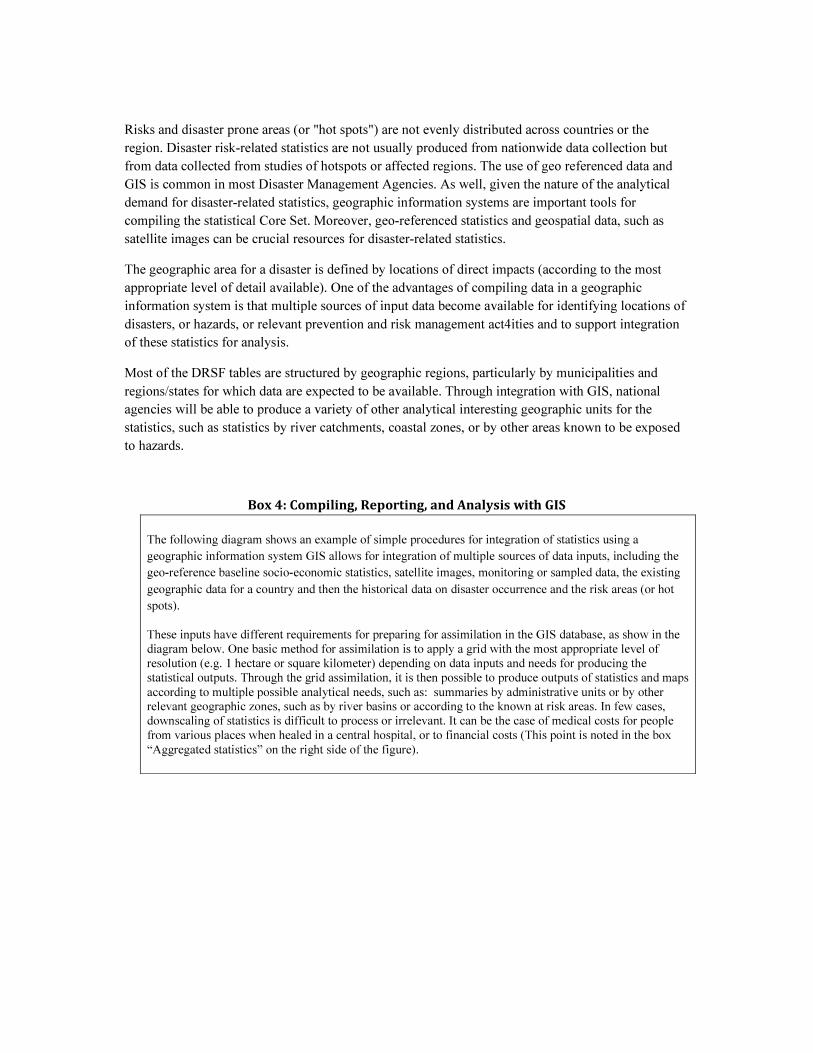
Risks and disaster prone areas (or "hot spots") are not evenly distributed across countries or the
region. Disaster risk-related statistics are not usually produced from nationwide data collection but
from data collected from studies of hotspots or affected regions. The use of geo referenced data and
GIS is common in most Disaster Management Agencies. As well, given the nature of the analytical
demand for disaster-related statistics, geographic information systems are important tools for
compiling the statistical Core Set. Moreover, geo-referenced statistics and geospatial data, such as
satellite images can be crucial resources for disaster-related statistics.
The geographic area for a disaster is defined by locations of direct impacts (according to the most
appropriate level of detail available). One of the advantages of compiling data in a geographic
information system is that multiple sources of input data become available for identifying locations of
disasters, or hazards, or relevant prevention and risk management act4ities and to support integration
of these statistics for analysis.
Most of the DRSF tables are structured by geographic regions, particularly by municipalities and
regions/states for which data are expected to be available. Through integration with GIS, national
agencies will be able to produce a variety of other analytical interesting geographic units for the
statistics, such as statistics by river catchments, coastal zones, or by other areas known to be exposed
to hazards.
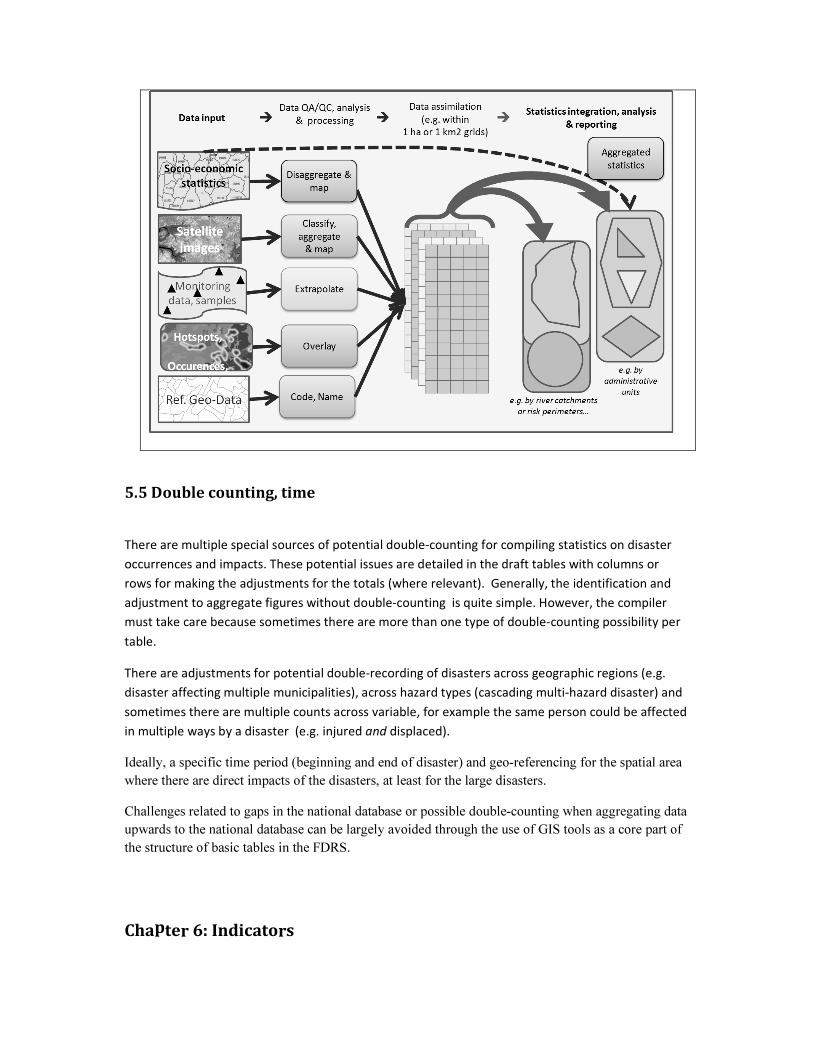
Box 4: Compiling, Reporting, and Analysis with GIS
The following diagram shows an example of simple procedures for integration of statistics using a
geographic information system GIS allows for integration of multiple sources of data inputs, including the
geo-reference baseline socio-economic statistics, satellite images, monitoring or sampled data, the existing
geographic data for a country and then the historical data on disaster occurrence and the risk areas (or hot
spots).
These inputs have different requirements for preparing for assimilation in the GIS database, as show in the
diagram below. One basic method for assimilation is to apply a grid with the most appropriate level of
resolution (e.g. 1 hectare or square kilometer) depending on data inputs and needs for producing the
statistical outputs. Through the grid assimilation, it is then possible to produce outputs of statistics and maps
according to multiple possible analytical needs, such as: summaries by administrative units or by other
relevant geographic zones, such as by river basins or according to the known at risk areas. In few cases,
downscaling of statistics is difficult to process or irrelevant. It can be the case of medical costs for people
from various places when healed in a central hospital, or to financial costs (This point is noted in the box
“Aggregated statistics” on the right side of the figure).
5.5 Double counting, time
There are multiple special sources of potential double-counting for compiling statistics on disaster
occurrences and impacts. These potential issues are detailed in the draft tables with columns or
rows for making the adjustments for the totals (where relevant). Generally, the identification and
adjustment to aggregate figures without double-counting is quite simple. However, the compiler
must take care because sometimes there are more than one type of double-counting possibility per
table.
There are adjustments for potential double-recording of disasters across geographic regions (e.g.
disaster affecting multiple municipalities), across hazard types (cascading multi-hazard disaster) and
sometimes there are multiple counts across variable, for example the same person could be affected
in multiple ways by a disaster (e.g. injured and displaced).
Ideally, a specific time period (beginning and end of disaster) and geo-referencing for the spatial area
where there are direct impacts of the disasters, at least for the large disasters.
Challenges related to gaps in the national database or possible double-counting when aggregating data
upwards to the national database can be largely avoided through the use of GIS tools as a core part of
the structure of basic tables in the FDRS.
Chapter 6: Indicators
The DRSF is a multi-purpose framework for producing statistics providing for a broad range of
possible indicators as inputs to the different stages of disaster risk reduction policy development.
While the purpose of the DRSF is to assist with development of official statistics that could underpin
a range of national and international indicator monitoring requirements, a part of this process is to
identify key indicators with the strongest policy relevance.
Many ratios or other combinations of impacts data with background statistics can be derived from
compilations following from the DRSF to assess progress towards reducing direct impacts from
disasters.
A distinction has to be made between statistical indicators which are implicit to DRSF, which can be
extracted from it and policy indicators. In order to facilitate the computation of basic statistical
indicators, DRSF includes tables with selected background statistics which can be combined with DRS
variables. The presentation of this statistical indicators will allow analysts and policy makers to build
upon that basis develop additional indicators, as required and more importantly to select high level
policy indicators.. Ultimately, the DRSF should allow the production and regular update of the
headline indicators directly relevant to monitoring the seven targets of the Sendai Framework for
Disaster Risk Reduction, 2015 and the Sustainable Development Goals Indicator 11.5 which will be
defined according to SFDRR.
a) Statistical indicators:
Some simple examples of statistical indicators are ratio of DRSF variables with :
• Mortality share of total national population
• Total affected people share of total national population
• Extent of affected area (hectares)
• Mortality share of affected population• Number of damaged or destroyed dwellings share
of total number of dwelling in affected area
• Number of households affected by damaged or destroyed dwellings
• Monetary value of direct impacts to economic assets
• Direct impacts to ecosystems (share by land cover type or/and share of protected natural
habitats
• Damages to critical infrastructures (units weighted by number of affected beneficiaries)
Two simple indicators derived from DRRE satellite accounts relevant to a macro assessment of
disaster risk reduction effort are:
• National disaster risk reduction expenditure (local currency)
• National disaster risk reduction expenditure share of GDP.
b) DRSF and required Sendai Indicators
The first four Sendai Framework targets all refer to reducing direct impacts from disasters on lives,
livelihoods, health and the economic, physical, social, cultural, environmental assets of persons,
businesses, communities and countries. The portions of the DRSF related to measuring disaster
occurrences and direct impacts are well aligned to these targets. The 5th-7th targets in the Sendai
Framework address the need for risk reduction interventions, including through international
cooperation.
Box 6 : Possible input of DRSF to Sendai Indicators (and SDG’s)
Sendai Targets DRSF input to indicators (ref. to Tables coding)
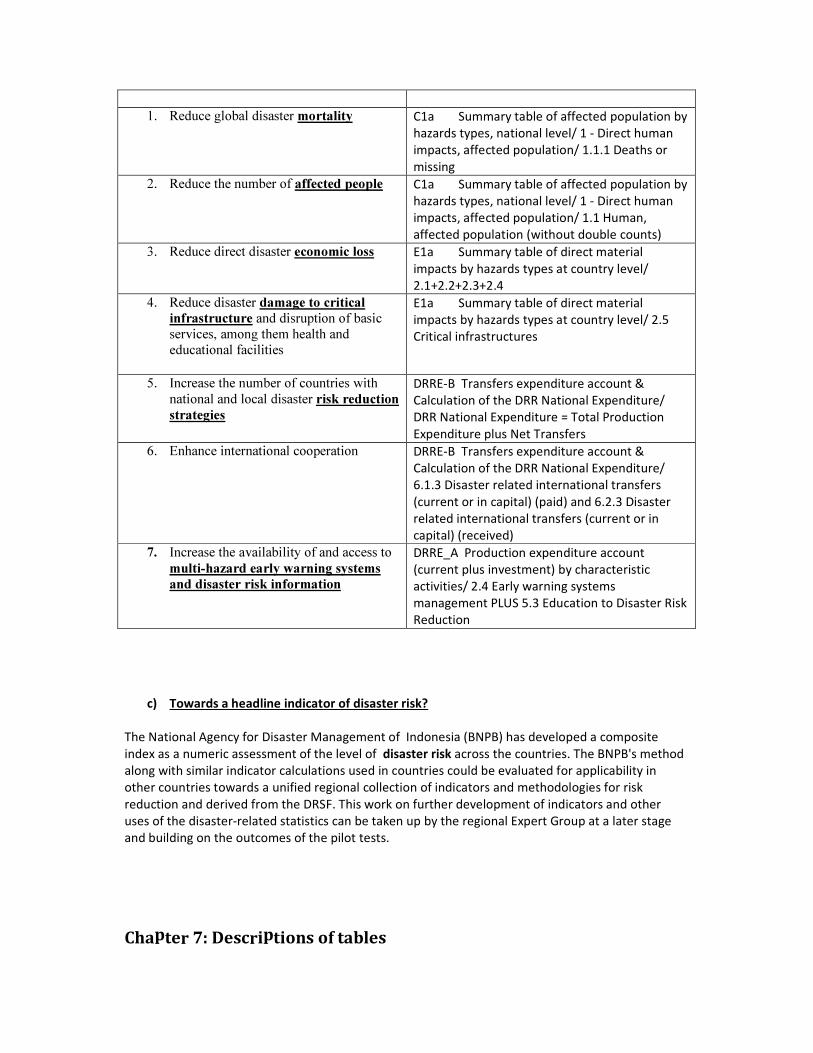
1. Reduce global disaster mortality C1a Summary table of affected population by
hazards types, national level/ 1 - Direct human
impacts, affected population/ 1.1.1 Deaths or
missing
2. Reduce the number of affected people
C1a Summary table of affected population by
hazards types, national level/ 1 - Direct human
impacts, affected population/ 1.1 Human,
affected population (without double counts)
3. Reduce direct disaster economic loss
E1a Summary table of direct material
impacts by hazards types at country level/
2.1+2.2+2.3+2.4
4. Reduce disaster damage to critical
infrastructure and disruption of basic
services, among them health and
educational facilities
E1a Summary table of direct material
impacts by hazards types at country level/ 2.5
Critical infrastructures
5. Increase the number of countries with
national and local disaster risk reduction
strategies
DRRE-B Transfers expenditure account &
Calculation of the DRR National Expenditure/
DRR National Expenditure = Total Production
Expenditure plus Net Transfers
6. Enhance international cooperation
DRRE-B Transfers expenditure account &
Calculation of the DRR National Expenditure/
6.1.3 Disaster related international transfers
(current or in capital) (paid) and 6.2.3 Disaster
related international transfers (current or in
capital) (received)
7. Increase the availability of and access to
multi-hazard early warning systems
and disaster risk information
DRRE_A Production expenditure account
(current plus investment) by characteristic
activities/ 2.4 Early warning systems
management PLUS 5.3 Education to Disaster Risk
Reduction
c) Towards a headline indicator of disaster risk?
The National Agency for Disaster Management of Indonesia (BNPB) has developed a composite
index as a numeric assessment of the level of disaster risk across the countries. The BNPB's method
along with similar indicator calculations used in countries could be evaluated for applicability in
other countries towards a unified regional collection of indicators and methodologies for risk
reduction and derived from the DRSF. This work on further development of indicators and other
uses of the disaster-related statistics can be taken up by the regional Expert Group at a later stage
and building on the outcomes of the pilot tests.
Chapter 7: Descriptions of tables
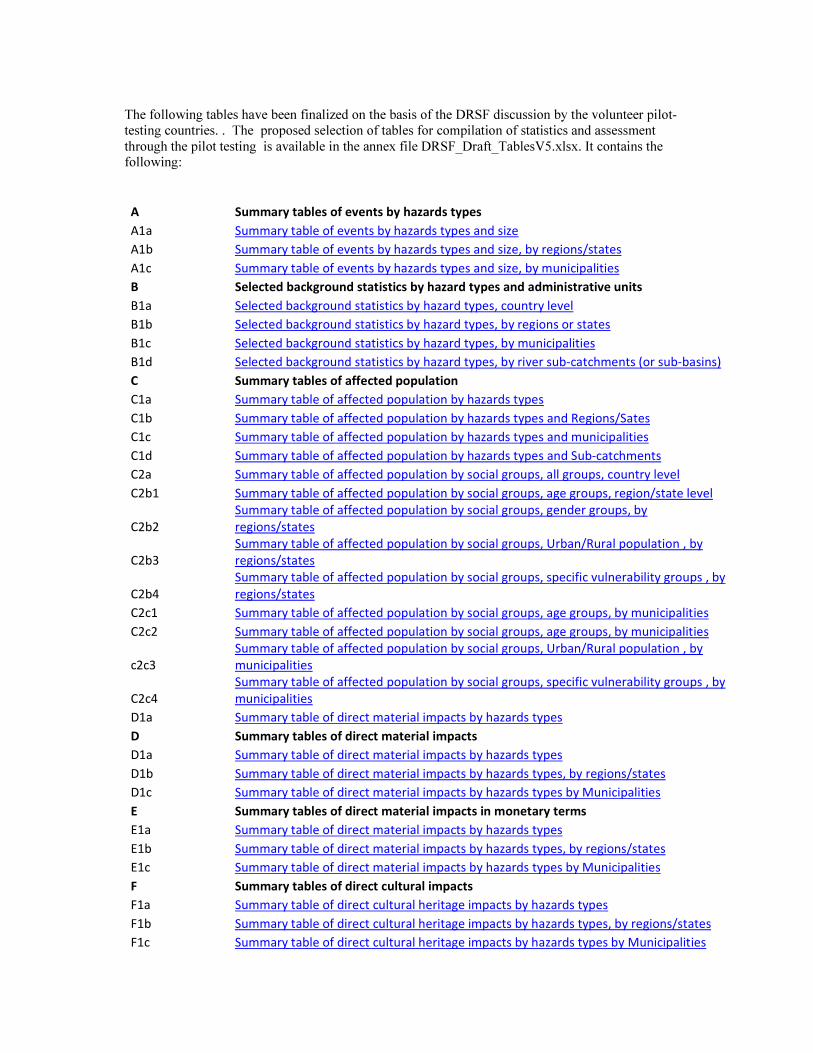
The following tables have been finalized on the basis of the DRSF discussion by the volunteer pilot-
testing countries. . The proposed selection of tables for compilation of statistics and assessment
through the pilot testing is available in the annex file DRSF_Draft_TablesV5.xlsx. It contains the
following:
A Summary tables of events by hazards types
A1a Summary table of events by hazards types and size
A1b Summary table of events by hazards types and size, by regions/states
A1c Summary table of events by hazards types and size, by municipalities
B Selected background statistics by hazard types and administrative units
B1a Selected background statistics by hazard types, country level
B1b Selected background statistics by hazard types, by regions or states
B1c Selected background statistics by hazard types, by municipalities
B1d Selected background statistics by hazard types, by river sub-catchments (or sub-basins)
C Summary tables of affected population
C1a Summary table of affected population by hazards types
C1b Summary table of affected population by hazards types and Regions/Sates
C1c Summary table of affected population by hazards types and municipalities
C1d Summary table of affected population by hazards types and Sub-catchments
C2a Summary table of affected population by social groups, all groups, country level
C2b1 Summary table of affected population by social groups, age groups, region/state level
C2b2
Summary table of affected population by social groups, gender groups, by
regions/states
C2b3
Summary table of affected population by social groups, Urban/Rural population , by
regions/states
C2b4
Summary table of affected population by social groups, specific vulnerability groups , by
regions/states
C2c1 Summary table of affected population by social groups, age groups, by municipalities
C2c2 Summary table of affected population by social groups, age groups, by municipalities
c2c3
Summary table of affected population by social groups, Urban/Rural population , by
municipalities
C2c4
Summary table of affected population by social groups, specific vulnerability groups , by
municipalities
D1a Summary table of direct material impacts by hazards types
D Summary tables of direct material impacts
D1a Summary table of direct material impacts by hazards types
D1b Summary table of direct material impacts by hazards types, by regions/states
D1c Summary table of direct material impacts by hazards types by Municipalities
E Summary tables of direct material impacts in monetary terms
E1a Summary table of direct material impacts by hazards types
E1b Summary table of direct material impacts by hazards types, by regions/states
E1c Summary table of direct material impacts by hazards types by Municipalities
F Summary tables of direct cultural impacts
F1a Summary table of direct cultural heritage impacts by hazards types
F1b Summary table of direct cultural heritage impacts by hazards types, by regions/states
F1c Summary table of direct cultural heritage impacts by hazards types by Municipalities
G Summary tables of direct environmental impacts
G1a Summary table of direct environmental impacts by hazards types
G1b Summary table of direct environmental impacts by hazards types, by regions/states
G1c Summary table of direct environmental impacts by hazards types by Municipalities
DRRE Disaster risk reduction satellite accounting
DRRE_Activities Production expenditure account (current plus investment) by characteristic activities
DRRE_Transfers Transfers expenditure account
Chapter 8: Integration with other frameworks
The DRSF is designed to serve multiple analytical purposes and for integration with policy
monitoring and indicator frameworks that have been established or are under development
internationally.
Compatibility between DRSF and these other frameworks is crucial because the Core Set of the DRSF
will be needed for government agencies to respond to the demands on statistics and indicators for
national or international monitoring of the related frameworks.
Important examples, include the UN Sustainable Development Goals, which proposes indicators on
disasters aligned on the Sendai Framework, the Framework for the Development of Environmental
Statistics, the work of the IPCC on “Managing the Risks of Extreme Events and Disasters to Advance
Climate Change Adaptation” (2012), the United Nations Convention to Combat Desertification
(UNCCD), the Convention on Biological Diversity, other related initiatives by the United Nations
Regional Commissions, and the work led by UNISDR and the Open-ended Intergovernmental Expert
Working Group on Indicators and Terminology Relating to Disaster Risk Reduction.
Further work to coordinate and build coherencies with these other initiatives will continue during the
testing of this preliminary draft of the DRSF.
Glossary <see draft prepared in attached file: drsfglossary_1.xlsx>
List of References <under development>
Annexes
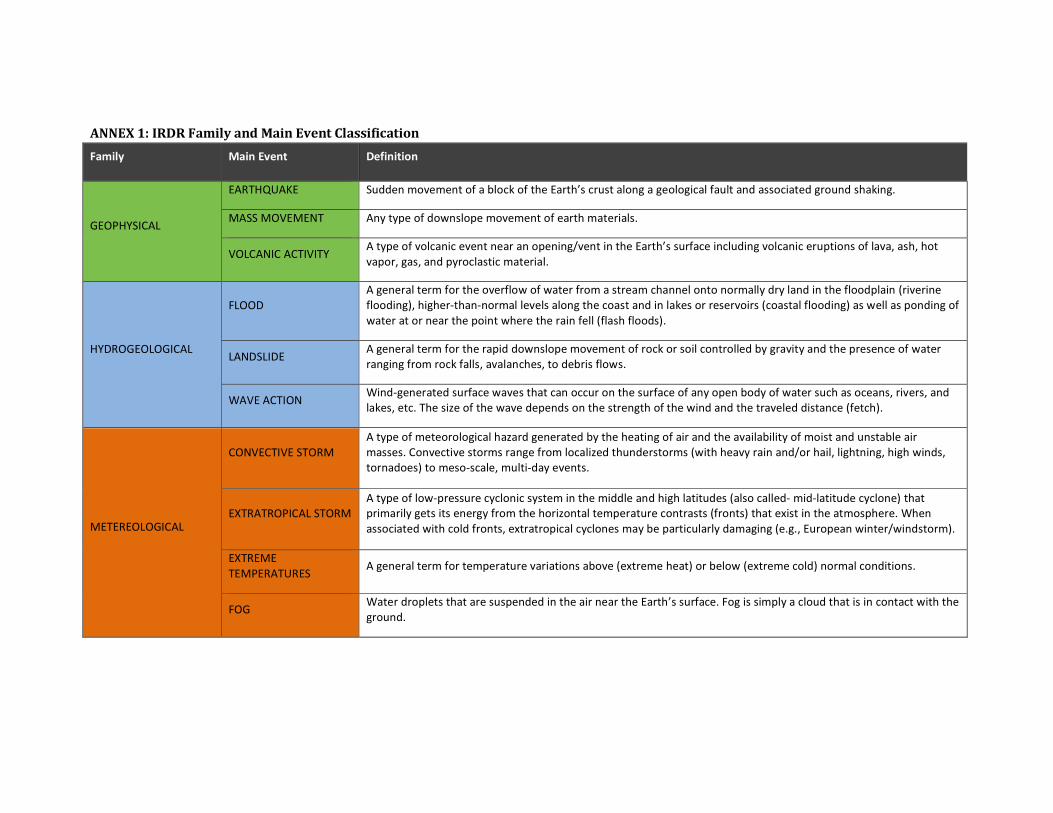
ANNEX 1: IRDR Family and Main Event Classification
Family Main Event Definition
GEOPHYSICAL
EARTHQUAKE Sudden movement of a block of the Earth’s crust along a geological fault and associated ground shaking.
MASS MOVEMENT Any type of downslope movement of earth materials.
VOLCANIC ACTIVITY A type of volcanic event near an opening/vent in the Earth’s surface including volcanic eruptions of lava, ash, hot
vapor, gas, and pyroclastic material.
HYDROGEOLOGICAL
FLOOD
A general term for the overflow of water from a stream channel onto normally dry land in the floodplain (riverine
flooding), higher-than-normal levels along the coast and in lakes or reservoirs (coastal flooding) as well as ponding of
water at or near the point where the rain fell (flash floods).
LANDSLIDE A general term for the rapid downslope movement of rock or soil controlled by gravity and the presence of water
ranging from rock falls, avalanches, to debris flows.
WAVE ACTION Wind-generated surface waves that can occur on the surface of any open body of water such as oceans, rivers, and
lakes, etc. The size of the wave depends on the strength of the wind and the traveled distance (fetch).
METEREOLOGICAL
CONVECTIVE STORM
A type of meteorological hazard generated by the heating of air and the availability of moist and unstable air
masses. Convective storms range from localized thunderstorms (with heavy rain and/or hail, lightning, high winds,
tornadoes) to meso-scale, multi-day events.
EXTRATROPICAL STORM
A type of low-pressure cyclonic system in the middle and high latitudes (also called- mid-latitude cyclone) that
primarily gets its energy from the horizontal temperature contrasts (fronts) that exist in the atmosphere. When
associated with cold fronts, extratropical cyclones may be particularly damaging (e.g., European winter/windstorm).
EXTREME
TEMPERATURES A general term for temperature variations above (extreme heat) or below (extreme cold) normal conditions.
FOG Water droplets that are suspended in the air near the Earth’s surface. Fog is simply a cloud that is in contact with the
ground.
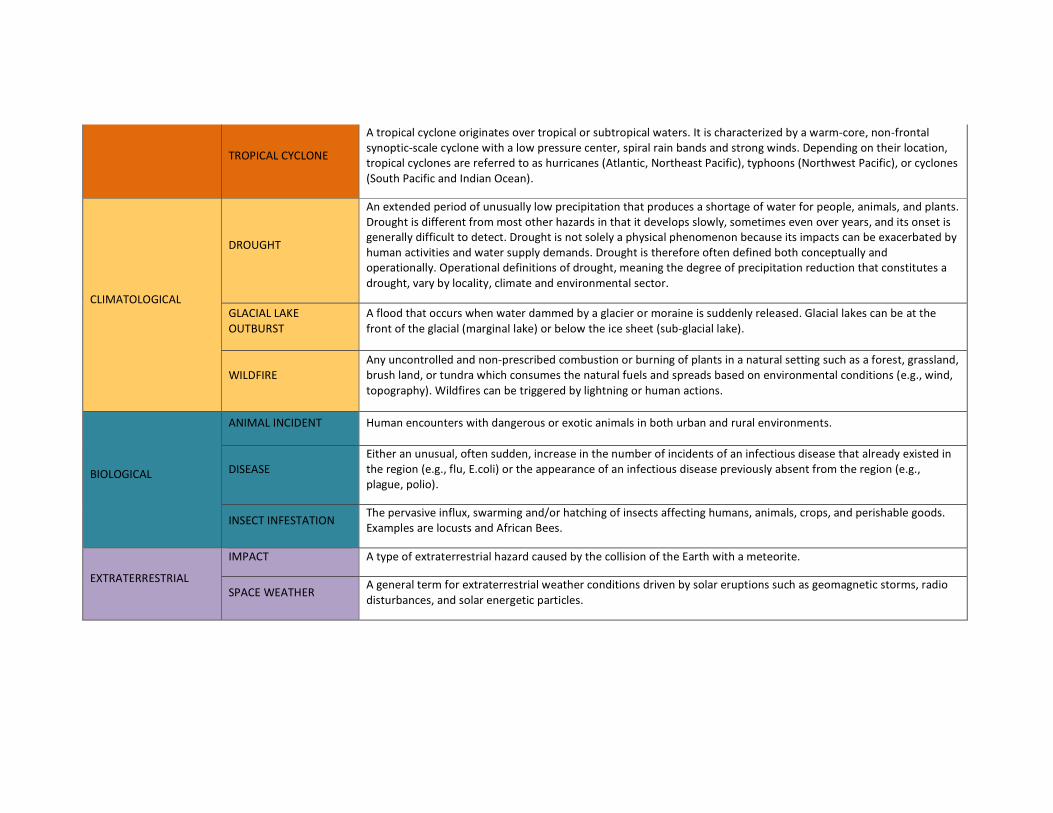
TROPICAL CYCLONE
A tropical cyclone originates over tropical or subtropical waters. It is characterized by a warm-core, non-frontal
synoptic-scale cyclone with a low pressure center, spiral rain bands and strong winds. Depending on their location,
tropical cyclones are referred to as hurricanes (Atlantic, Northeast Pacific), typhoons (Northwest Pacific), or cyclones
(South Pacific and Indian Ocean).
CLIMATOLOGICAL
DROUGHT
An extended period of unusually low precipitation that produces a shortage of water for people, animals, and plants.
Drought is different from most other hazards in that it develops slowly, sometimes even over years, and its onset is
generally difficult to detect. Drought is not solely a physical phenomenon because its impacts can be exacerbated by
human activities and water supply demands. Drought is therefore often defined both conceptually and
operationally. Operational definitions of drought, meaning the degree of precipitation reduction that constitutes a
drought, vary by locality, climate and environmental sector.
GLACIAL LAKE
OUTBURST
A flood that occurs when water dammed by a glacier or moraine is suddenly released. Glacial lakes can be at the
front of the glacial (marginal lake) or below the ice sheet (sub-glacial lake).
WILDFIRE
Any uncontrolled and non-prescribed combustion or burning of plants in a natural setting such as a forest, grassland,
brush land, or tundra which consumes the natural fuels and spreads based on environmental conditions (e.g., wind,
topography). Wildfires can be triggered by lightning or human actions.
BIOLOGICAL
ANIMAL INCIDENT Human encounters with dangerous or exotic animals in both urban and rural environments.
DISEASE
Either an unusual, often sudden, increase in the number of incidents of an infectious disease that already existed in
the region (e.g., flu, E.coli) or the appearance of an infectious disease previously absent from the region (e.g.,
plague, polio).
INSECT INFESTATION The pervasive influx, swarming and/or hatching of insects affecting humans, animals, crops, and perishable goods.
Examples are locusts and African Bees.
EXTRATERRESTRIAL
IMPACT A type of extraterrestrial hazard caused by the collision of the Earth with a meteorite.
SPACE WEATHER A general term for extraterrestrial weather conditions driven by solar eruptions such as geomagnetic storms, radio
disturbances, and solar energetic particles.
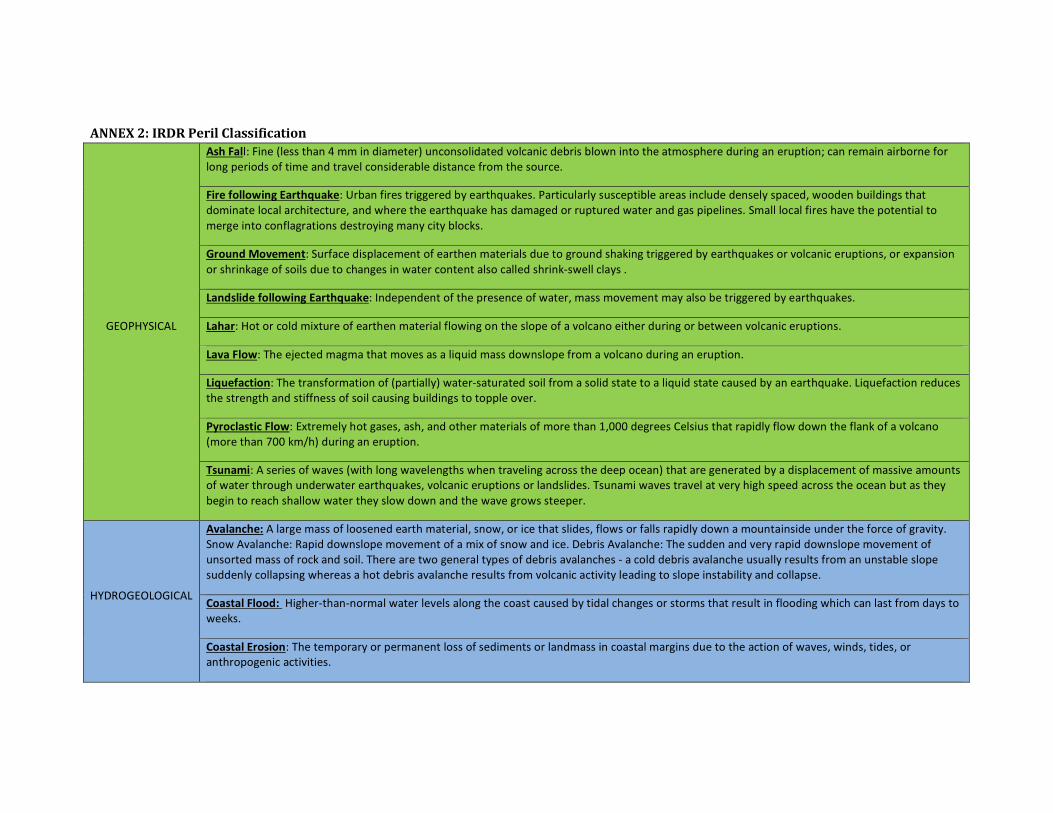
ANNEX 2: IRDR Peril Classification
GEOPHYSICAL
Ash Fall: Fine (less than 4 mm in diameter) unconsolidated volcanic debris blown into the atmosphere during an eruption; can remain airborne for
long periods of time and travel considerable distance from the source.
Fire following Earthquake: Urban fires triggered by earthquakes. Particularly susceptible areas include densely spaced, wooden buildings that
dominate local architecture, and where the earthquake has damaged or ruptured water and gas pipelines. Small local fires have the potential to
merge into conflagrations destroying many city blocks.
Ground Movement: Surface displacement of earthen materials due to ground shaking triggered by earthquakes or volcanic eruptions, or expansion
or shrinkage of soils due to changes in water content also called shrink-swell clays .
Landslide following Earthquake: Independent of the presence of water, mass movement may also be triggered by earthquakes.
Lahar: Hot or cold mixture of earthen material flowing on the slope of a volcano either during or between volcanic eruptions.
Lava Flow: The ejected magma that moves as a liquid mass downslope from a volcano during an eruption.
Liquefaction: The transformation of (partially) water-saturated soil from a solid state to a liquid state caused by an earthquake. Liquefaction reduces
the strength and stiffness of soil causing buildings to topple over.
Pyroclastic Flow: Extremely hot gases, ash, and other materials of more than 1,000 degrees Celsius that rapidly flow down the flank of a volcano
(more than 700 km/h) during an eruption.
Tsunami: A series of waves (with long wavelengths when traveling across the deep ocean) that are generated by a displacement of massive amounts
of water through underwater earthquakes, volcanic eruptions or landslides. Tsunami waves travel at very high speed across the ocean but as they
begin to reach shallow water they slow down and the wave grows steeper.
HYDROGEOLOGICAL
Avalanche: A large mass of loosened earth material, snow, or ice that slides, flows or falls rapidly down a mountainside under the force of gravity.
Snow Avalanche: Rapid downslope movement of a mix of snow and ice. Debris Avalanche: The sudden and very rapid downslope movement of
unsorted mass of rock and soil. There are two general types of debris avalanches - a cold debris avalanche usually results from an unstable slope
suddenly collapsing whereas a hot debris avalanche results from volcanic activity leading to slope instability and collapse.
Coastal Flood: Higher-than-normal water levels along the coast caused by tidal changes or storms that result in flooding which can last from days to
weeks.
Coastal Erosion: The temporary or permanent loss of sediments or landmass in coastal margins due to the action of waves, winds, tides, or
anthropogenic activities.
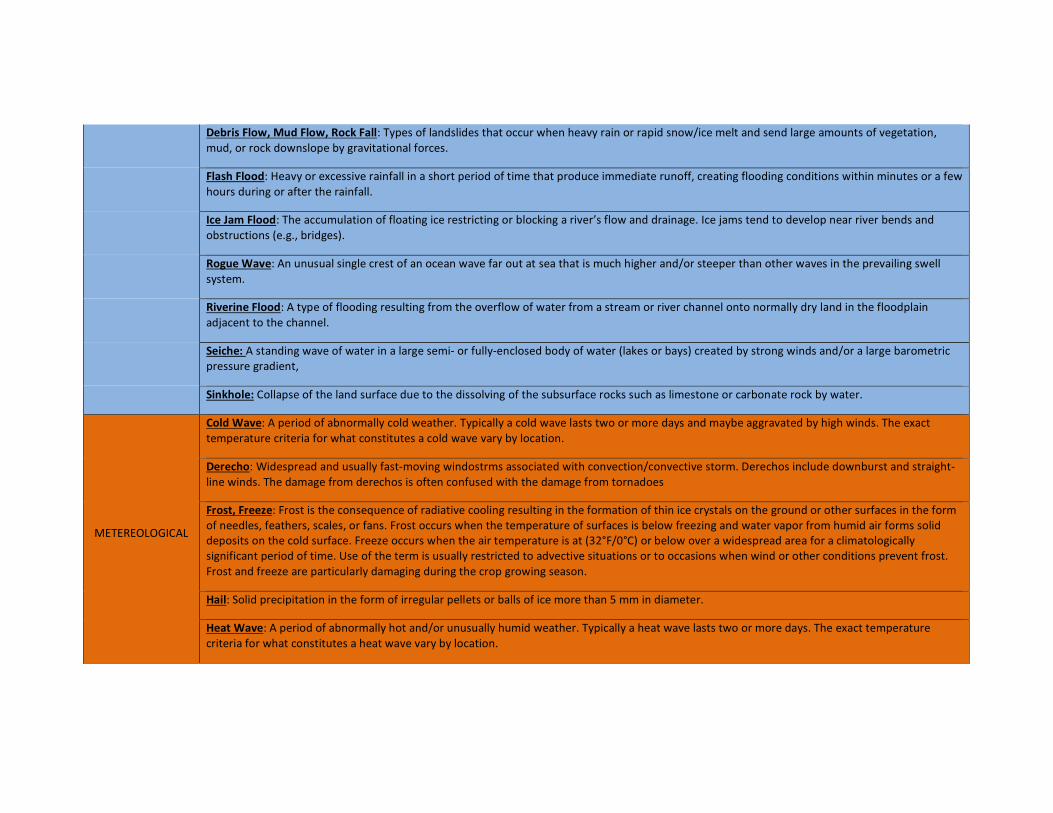
Debris Flow, Mud Flow, Rock Fall: Types of landslides that occur when heavy rain or rapid snow/ice melt and send large amounts of vegetation,
mud, or rock downslope by gravitational forces.
Flash Flood: Heavy or excessive rainfall in a short period of time that produce immediate runoff, creating flooding conditions within minutes or a few
hours during or after the rainfall.
Ice Jam Flood: The accumulation of floating ice restricting or blocking a river’s flow and drainage. Ice jams tend to develop near river bends and
obstructions (e.g., bridges).
Rogue Wave: An unusual single crest of an ocean wave far out at sea that is much higher and/or steeper than other waves in the prevailing swell
system.
Riverine Flood: A type of flooding resulting from the overflow of water from a stream or river channel onto normally dry land in the floodplain
adjacent to the channel.
Seiche: A standing wave of water in a large semi- or fully-enclosed body of water (lakes or bays) created by strong winds and/or a large barometric
pressure gradient,
Sinkhole: Collapse of the land surface due to the dissolving of the subsurface rocks such as limestone or carbonate rock by water.
METEREOLOGICAL
Cold Wave: A period of abnormally cold weather. Typically a cold wave lasts two or more days and maybe aggravated by high winds. The exact
temperature criteria for what constitutes a cold wave vary by location.
Derecho: Widespread and usually fast-moving windostrms associated with convection/convective storm. Derechos include downburst and straight-
line winds. The damage from derechos is often confused with the damage from tornadoes
Frost, Freeze: Frost is the consequence of radiative cooling resulting in the formation of thin ice crystals on the ground or other surfaces in the form
of needles, feathers, scales, or fans. Frost occurs when the temperature of surfaces is below freezing and water vapor from humid air forms solid
deposits on the cold surface. Freeze occurs when the air temperature is at (32°F/0°C) or below over a widespread area for a climatologically
significant period of time. Use of the term is usually restricted to advective situations or to occasions when wind or other conditions prevent frost.
Frost and freeze are particularly damaging during the crop growing season.
Hail: Solid precipitation in the form of irregular pellets or balls of ice more than 5 mm in diameter.
Heat Wave: A period of abnormally hot and/or unusually humid weather. Typically a heat wave lasts two or more days. The exact temperature
criteria for what constitutes a heat wave vary by location.
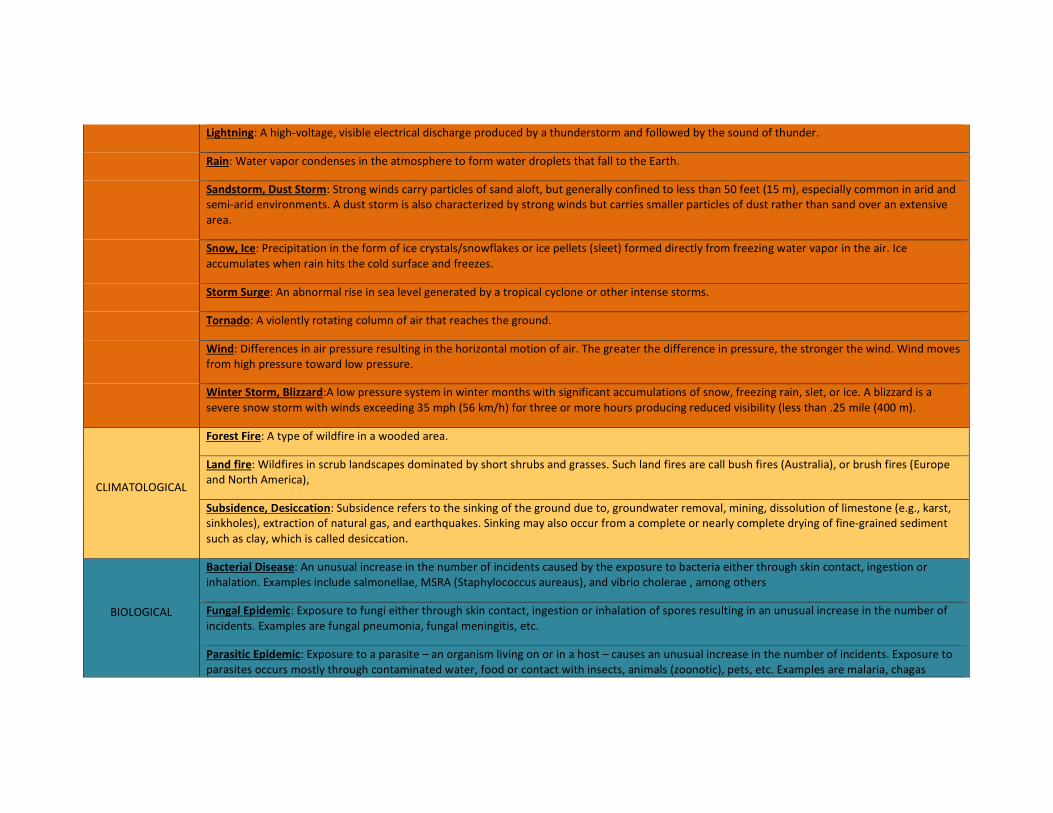
Lightning: A high-voltage, visible electrical discharge produced by a thunderstorm and followed by the sound of thunder.
Rain: Water vapor condenses in the atmosphere to form water droplets that fall to the Earth.
Sandstorm, Dust Storm: Strong winds carry particles of sand aloft, but generally confined to less than 50 feet (15 m), especially common in arid and
semi-arid environments. A dust storm is also characterized by strong winds but carries smaller particles of dust rather than sand over an extensive
area.
Snow, Ice: Precipitation in the form of ice crystals/snowflakes or ice pellets (sleet) formed directly from freezing water vapor in the air. Ice
accumulates when rain hits the cold surface and freezes.
Storm Surge: An abnormal rise in sea level generated by a tropical cyclone or other intense storms.
Tornado: A violently rotating column of air that reaches the ground.
Wind: Differences in air pressure resulting in the horizontal motion of air. The greater the difference in pressure, the stronger the wind. Wind moves
from high pressure toward low pressure.
Winter Storm, Blizzard:A low pressure system in winter months with significant accumulations of snow, freezing rain, slet, or ice. A blizzard is a
severe snow storm with winds exceeding 35 mph (56 km/h) for three or more hours producing reduced visibility (less than .25 mile (400 m).
CLIMATOLOGICAL
Forest Fire: A type of wildfire in a wooded area.
Land fire: Wildfires in scrub landscapes dominated by short shrubs and grasses. Such land fires are call bush fires (Australia), or brush fires (Europe
and North America),
Subsidence, Desiccation: Subsidence refers to the sinking of the ground due to, groundwater removal, mining, dissolution of limestone (e.g., karst,
sinkholes), extraction of natural gas, and earthquakes. Sinking may also occur from a complete or nearly complete drying of fine-grained sediment
such as clay, which is called desiccation.
BIOLOGICAL
Bacterial Disease: An unusual increase in the number of incidents caused by the exposure to bacteria either through skin contact, ingestion or
inhalation. Examples include salmonellae, MSRA (Staphylococcus aureaus), and vibrio cholerae , among others
Fungal Epidemic: Exposure to fungi either through skin contact, ingestion or inhalation of spores resulting in an unusual increase in the number of
incidents. Examples are fungal pneumonia, fungal meningitis, etc.
Parasitic Epidemic: Exposure to a parasite – an organism living on or in a host – causes an unusual increase in the number of incidents. Exposure to
parasites occurs mostly through contaminated water, food or contact with insects, animals (zoonotic), pets, etc. Examples are malaria, chagas
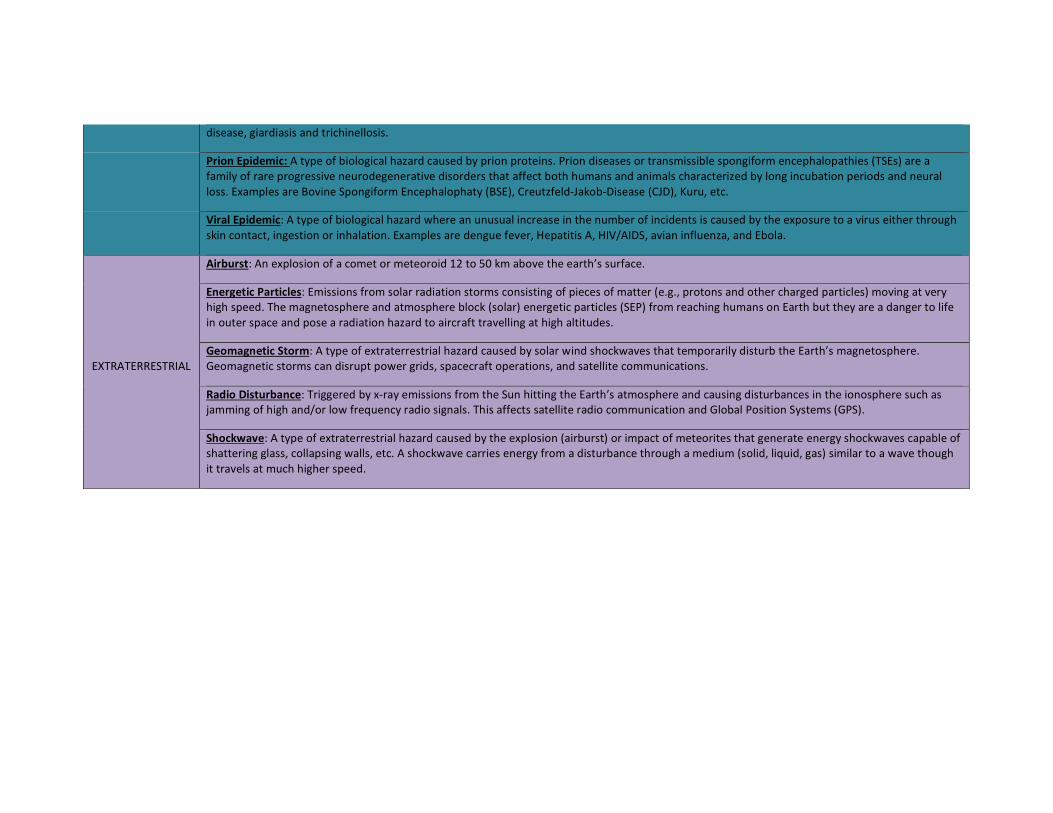
disease, giardiasis and trichinellosis.
Prion Epidemic: A type of biological hazard caused by prion proteins. Prion diseases or transmissible spongiform encephalopathies (TSEs) are a
family of rare progressive neurodegenerative disorders that affect both humans and animals characterized by long incubation periods and neural
loss. Examples are Bovine Spongiform Encephalophaty (BSE), Creutzfeld-Jakob-Disease (CJD), Kuru, etc.
Viral Epidemic: A type of biological hazard where an unusual increase in the number of incidents is caused by the exposure to a virus either through
skin contact, ingestion or inhalation. Examples are dengue fever, Hepatitis A, HIV/AIDS, avian influenza, and Ebola.
EXTRATERRESTRIAL
Airburst: An explosion of a comet or meteoroid 12 to 50 km above the earth’s surface.
Energetic Particles: Emissions from solar radiation storms consisting of pieces of matter (e.g., protons and other charged particles) moving at very
high speed. The magnetosphere and atmosphere block (solar) energetic particles (SEP) from reaching humans on Earth but they are a danger to life
in outer space and pose a radiation hazard to aircraft travelling at high altitudes.
Geomagnetic Storm: A type of extraterrestrial hazard caused by solar wind shockwaves that temporarily disturb the Earth’s magnetosphere.
Geomagnetic storms can disrupt power grids, spacecraft operations, and satellite communications.
Radio Disturbance: Triggered by x-ray emissions from the Sun hitting the Earth’s atmosphere and causing disturbances in the ionosphere such as
jamming of high and/or low frequency radio signals. This affects satellite radio communication and Global Position Systems (GPS).
Shockwave: A type of extraterrestrial hazard caused by the explosion (airburst) or impact of meteorites that generate energy shockwaves capable of
shattering glass, collapsing walls, etc. A shockwave carries energy from a disturbance through a medium (solid, liquid, gas) similar to a wave though
it travels at much higher speed.
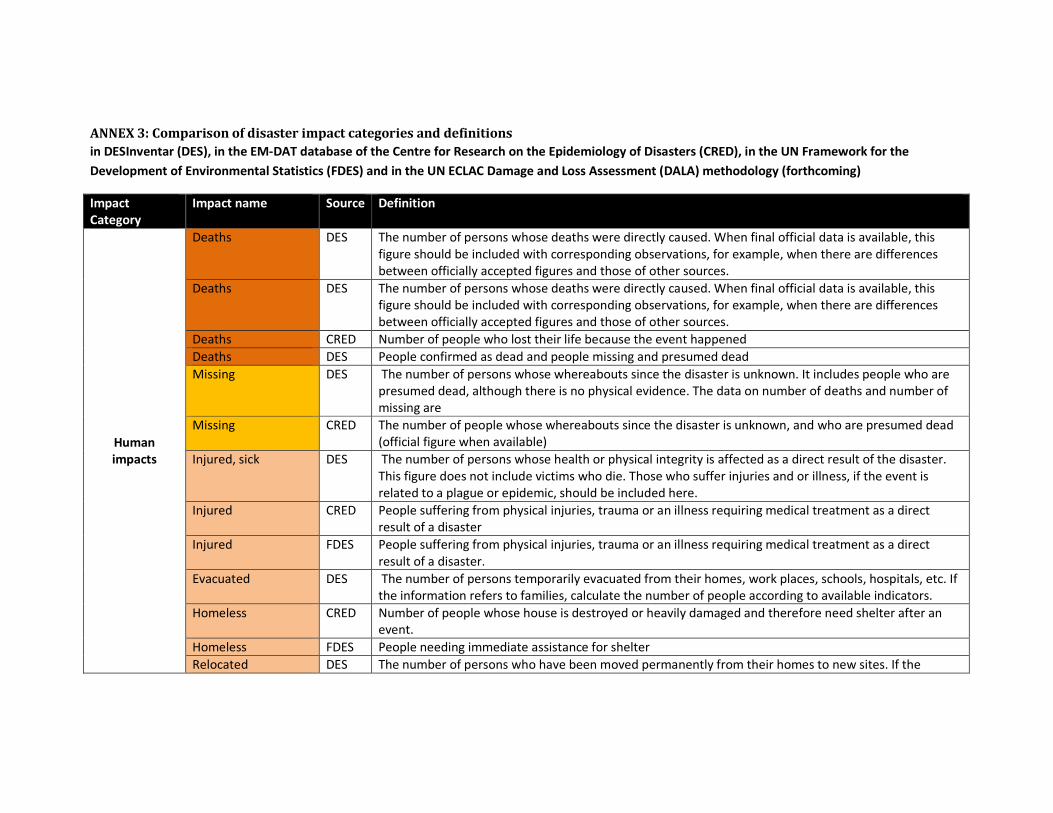
ANNEX 3: Comparison of disaster impact categories and definitions
in DESInventar (DES), in the EM-DAT database of the Centre for Research on the Epidemiology of Disasters (CRED), in the UN Framework for the
Development of Environmental Statistics (FDES) and in the UN ECLAC Damage and Loss Assessment (DALA) methodology (forthcoming)
Impact
Category
Impact name Source Definition
Human
impacts
Deaths DES The number of persons whose deaths were directly caused. When final official data is available, this
figure should be included with corresponding observations, for example, when there are differences
between officially accepted figures and those of other sources.
Deaths DES The number of persons whose deaths were directly caused. When final official data is available, this
figure should be included with corresponding observations, for example, when there are differences
between officially accepted figures and those of other sources.
Deaths CRED Number of people who lost their life because the event happened
Deaths DES People confirmed as dead and people missing and presumed dead
Missing DES The number of persons whose whereabouts since the disaster is unknown. It includes people who are
presumed dead, although there is no physical evidence. The data on number of deaths and number of
missing are
Missing CRED The number of people whose whereabouts since the disaster is unknown, and who are presumed dead
(official figure when available)
Injured, sick DES The number of persons whose health or physical integrity is affected as a direct result of the disaster.
This figure does not include victims who die. Those who suffer injuries and or illness, if the event is
related to a plague or epidemic, should be included here.
Injured CRED People suffering from physical injuries, trauma or an illness requiring medical treatment as a direct
result of a disaster
Injured FDES People suffering from physical injuries, trauma or an illness requiring medical treatment as a direct
result of a disaster.
Evacuated DES The number of persons temporarily evacuated from their homes, work places, schools, hospitals, etc. If
the information refers to families, calculate the number of people according to available indicators.
Homeless CRED Number of people whose house is destroyed or heavily damaged and therefore need shelter after an
event.
Homeless FDES People needing immediate assistance for shelter
Relocated DES The number of persons who have been moved permanently from their homes to new sites. If the
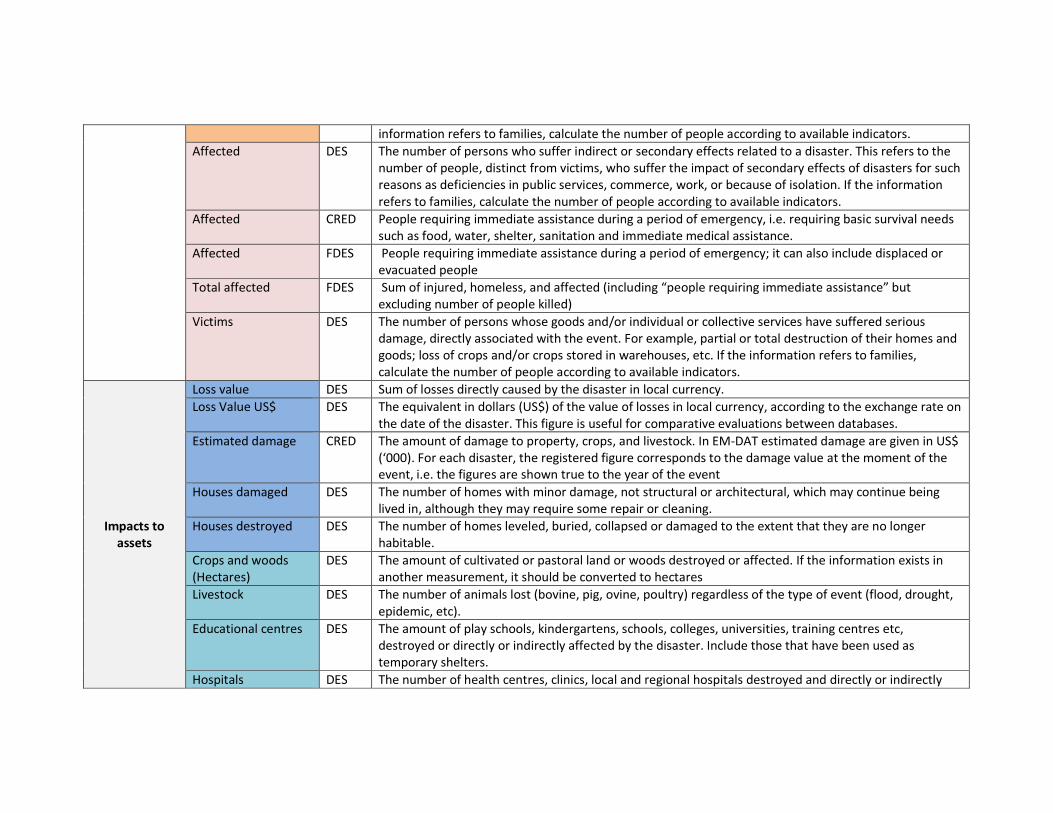
information refers to families, calculate the number of people according to available indicators.
Affected DES The number of persons who suffer indirect or secondary effects related to a disaster. This refers to the
number of people, distinct from victims, who suffer the impact of secondary effects of disasters for such
reasons as deficiencies in public services, commerce, work, or because of isolation. If the information
refers to families, calculate the number of people according to available indicators.
Affected CRED People requiring immediate assistance during a period of emergency, i.e. requiring basic survival needs
such as food, water, shelter, sanitation and immediate medical assistance.
Affected FDES People requiring immediate assistance during a period of emergency; it can also include displaced or
evacuated people
Total affected FDES Sum of injured, homeless, and affected (including “people requiring immediate assistance” but
excluding number of people killed)
Victims DES The number of persons whose goods and/or individual or collective services have suffered serious
damage, directly associated with the event. For example, partial or total destruction of their homes and
goods; loss of crops and/or crops stored in warehouses, etc. If the information refers to families,
calculate the number of people according to available indicators.
Impacts to
assets
Loss value DES Sum of losses directly caused by the disaster in local currency.
Loss Value US$ DES The equivalent in dollars (US$) of the value of losses in local currency, according to the exchange rate on
the date of the disaster. This figure is useful for comparative evaluations between databases.
Estimated damage CRED The amount of damage to property, crops, and livestock. In EM-DAT estimated damage are given in US$
(‘000). For each disaster, the registered figure corresponds to the damage value at the moment of the
event, i.e. the figures are shown true to the year of the event
Houses damaged DES The number of homes with minor damage, not structural or architectural, which may continue being
lived in, although they may require some repair or cleaning.
Houses destroyed DES The number of homes leveled, buried, collapsed or damaged to the extent that they are no longer
habitable.
Crops and woods
(Hectares)
DES The amount of cultivated or pastoral land or woods destroyed or affected. If the information exists in
another measurement, it should be converted to hectares
Livestock DES The number of animals lost (bovine, pig, ovine, poultry) regardless of the type of event (flood, drought,
epidemic, etc).
Educational centres DES The amount of play schools, kindergartens, schools, colleges, universities, training centres etc,
destroyed or directly or indirectly affected by the disaster. Include those that have been used as
temporary shelters.
Hospitals DES The number of health centres, clinics, local and regional hospitals destroyed and directly or indirectly
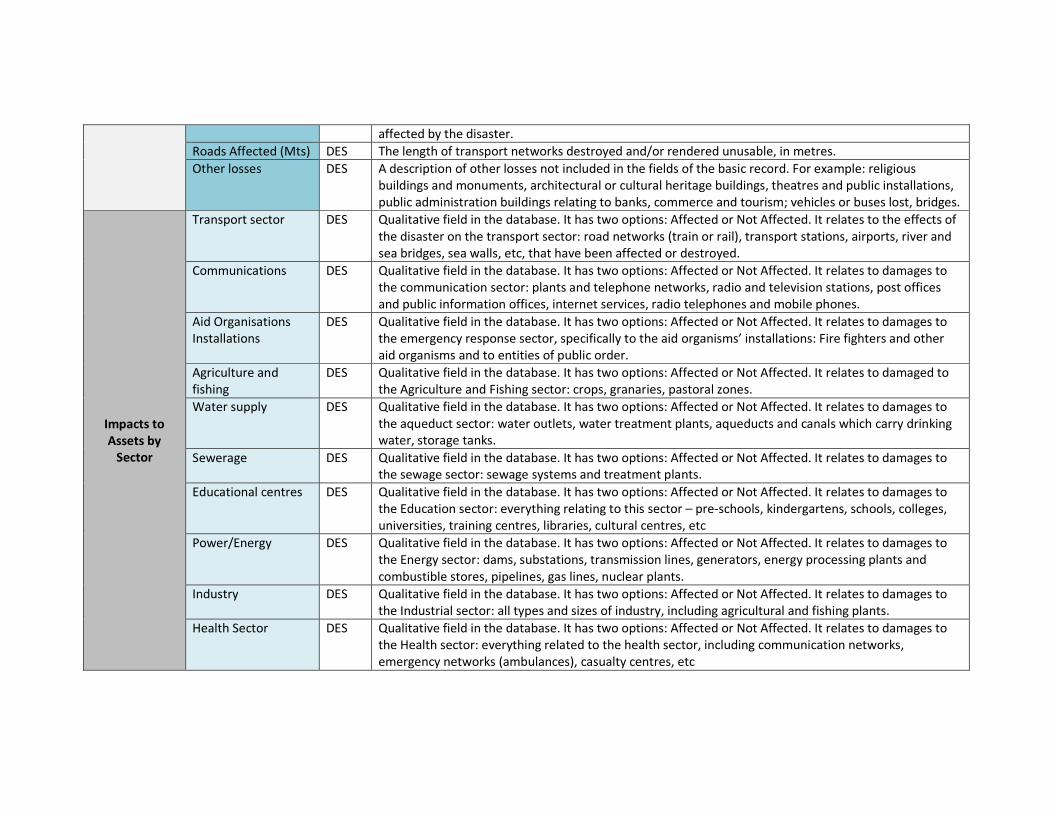
affected by the disaster.
Roads Affected (Mts) DES The length of transport networks destroyed and/or rendered unusable, in metres.
Other losses DES A description of other losses not included in the fields of the basic record. For example: religious
buildings and monuments, architectural or cultural heritage buildings, theatres and public installations,
public administration buildings relating to banks, commerce and tourism; vehicles or buses lost, bridges.
Impacts to
Assets by
Sector
Transport sector DES Qualitative field in the database. It has two options: Affected or Not Affected. It relates to the effects of
the disaster on the transport sector: road networks (train or rail), transport stations, airports, river and
sea bridges, sea walls, etc, that have been affected or destroyed.
Communications DES Qualitative field in the database. It has two options: Affected or Not Affected. It relates to damages to
the communication sector: plants and telephone networks, radio and television stations, post offices
and public information offices, internet services, radio telephones and mobile phones.
Aid Organisations
Installations
DES Qualitative field in the database. It has two options: Affected or Not Affected. It relates to damages to
the emergency response sector, specifically to the aid organisms’ installations: Fire fighters and other
aid organisms and to entities of public order.
Agriculture and
fishing
DES Qualitative field in the database. It has two options: Affected or Not Affected. It relates to damaged to
the Agriculture and Fishing sector: crops, granaries, pastoral zones.
Water supply DES Qualitative field in the database. It has two options: Affected or Not Affected. It relates to damages to
the aqueduct sector: water outlets, water treatment plants, aqueducts and canals which carry drinking
water, storage tanks.
Sewerage DES Qualitative field in the database. It has two options: Affected or Not Affected. It relates to damages to
the sewage sector: sewage systems and treatment plants.
Educational centres DES Qualitative field in the database. It has two options: Affected or Not Affected. It relates to damages to
the Education sector: everything relating to this sector – pre-schools, kindergartens, schools, colleges,
universities, training centres, libraries, cultural centres, etc
Power/Energy DES Qualitative field in the database. It has two options: Affected or Not Affected. It relates to damages to
the Energy sector: dams, substations, transmission lines, generators, energy processing plants and
combustible stores, pipelines, gas lines, nuclear plants.
Industry DES Qualitative field in the database. It has two options: Affected or Not Affected. It relates to damages to
the Industrial sector: all types and sizes of industry, including agricultural and fishing plants.
Health Sector DES Qualitative field in the database. It has two options: Affected or Not Affected. It relates to damages to
the Health sector: everything related to the health sector, including communication networks,
emergency networks (ambulances), casualty centres, etc
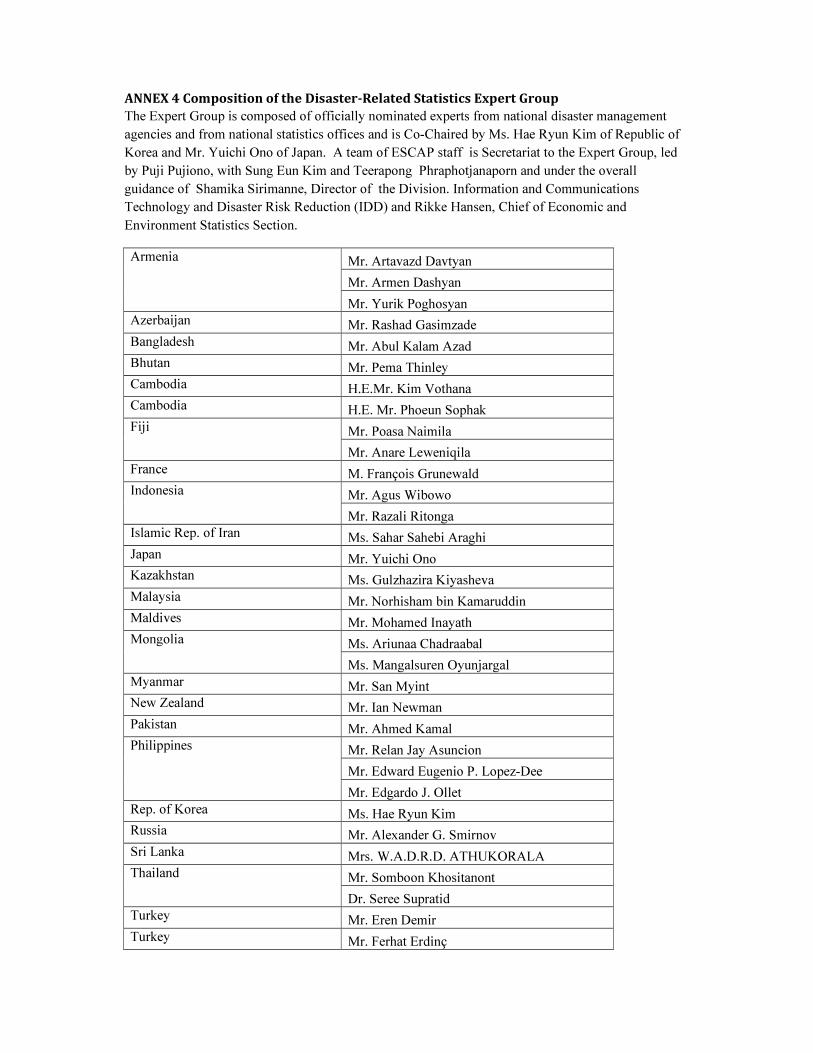
ANNEX 4 Composition of the Disaster-Related Statistics Expert Group
The Expert Group is composed of officially nominated experts from national disaster management
agencies and from national statistics offices and is Co-Chaired by Ms. Hae Ryun Kim of Republic of
Korea and Mr. Yuichi Ono of Japan. A team of ESCAP staff is Secretariat to the Expert Group, led
by Puji Pujiono, with Sung Eun Kim and Teerapong Phraphotjanaporn and under the overall
guidance of Shamika Sirimanne, Director of the Division. Information and Communications
Technology and Disaster Risk Reduction (IDD) and Rikke Hansen, Chief of Economic and
Environment Statistics Section.
Armenia Mr. Artavazd Davtyan
Mr. Armen Dashyan
Mr. Yurik Poghosyan
Azerbaijan Mr. Rashad Gasimzade
Bangladesh Mr. Abul Kalam Azad
Bhutan Mr. Pema Thinley
Cambodia H.E.Mr. Kim Vothana
Cambodia H.E. Mr. Phoeun Sophak
Fiji Mr. Poasa Naimila
Mr. Anare Leweniqila
France M. François Grunewald
Indonesia Mr. Agus Wibowo
Mr. Razali Ritonga
Islamic Rep. of Iran Ms. Sahar Sahebi Araghi
Japan Mr. Yuichi Ono
Kazakhstan Ms. Gulzhazira Kiyasheva
Malaysia Mr. Norhisham bin Kamaruddin
Maldives Mr. Mohamed Inayath
Mongolia Ms. Ariunaa Chadraabal
Ms. Mangalsuren Oyunjargal
Myanmar Mr. San Myint
New Zealand Mr. Ian Newman
Pakistan Mr. Ahmed Kamal
Philippines Mr. Relan Jay Asuncion
Mr. Edward Eugenio P. Lopez-Dee
Mr. Edgardo J. Ollet
Rep. of Korea Ms. Hae Ryun Kim
Russia Mr. Alexander G. Smirnov
Sri Lanka Mrs. W.A.D.R.D. ATHUKORALA
Thailand Mr. Somboon Khositanont
Dr. Seree Supratid
Turkey Mr. Eren Demir
Turkey Mr. Ferhat Erdinç
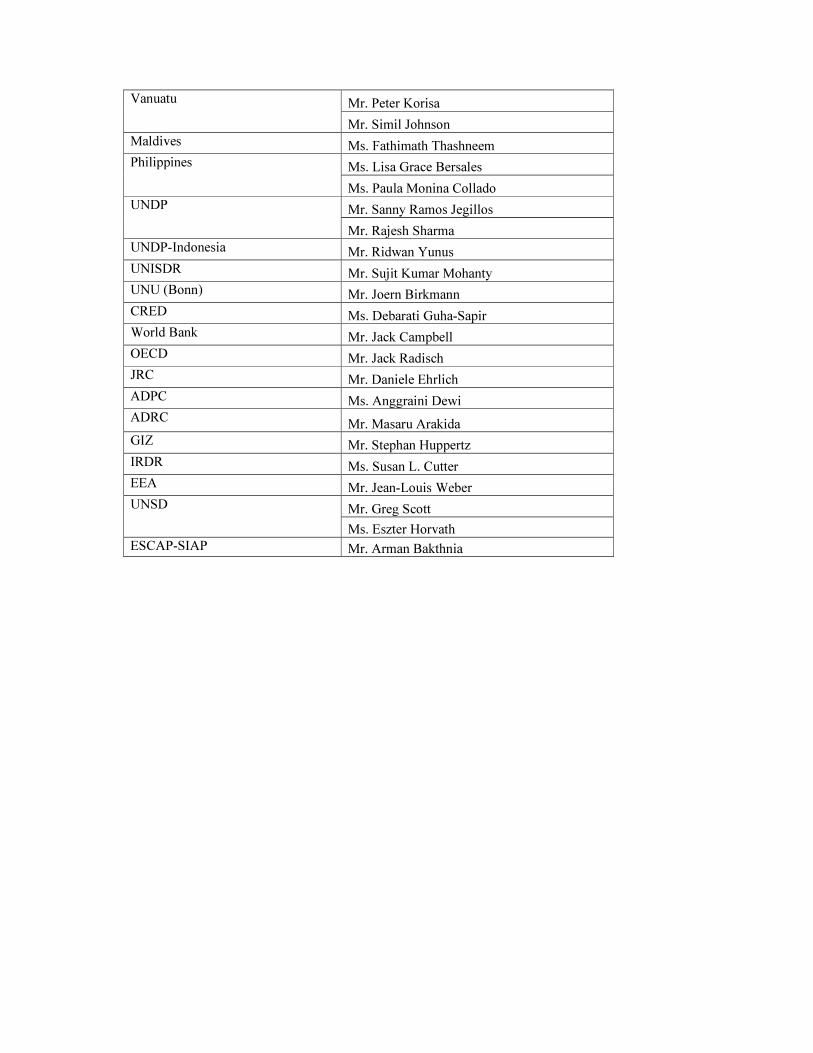
Vanuatu Mr. Peter Korisa
Mr. Simil Johnson
Maldives Ms. Fathimath Thashneem
Philippines Ms. Lisa Grace Bersales
Ms. Paula Monina Collado
UNDP Mr. Sanny Ramos Jegillos
Mr. Rajesh Sharma
UNDP-Indonesia Mr. Ridwan Yunus
UNISDR Mr. Sujit Kumar Mohanty
UNU (Bonn) Mr. Joern Birkmann
CRED Ms. Debarati Guha-Sapir
World Bank Mr. Jack Campbell
OECD Mr. Jack Radisch
JRC Mr. Daniele Ehrlich
ADPC Ms. Anggraini Dewi
ADRC Mr. Masaru Arakida
GIZ Mr. Stephan Huppertz
IRDR Ms. Susan L. Cutter
EEA Mr. Jean-Louis Weber
UNSD Mr. Greg Scott
Ms. Eszter Horvath
ESCAP-SIAP Mr. Arman Bakthnia
Related Documents