Direct Prediction of the Desalination Performance of Porous Carbon Electrodes for Capacitive Deionization S. Porada, L. Borchardt, M. Oschatz, M. Bryjak, J. S. Atchison, K. J. Keesman, S. Kaskel, P. M. Biesheuvel, and V. Presser This manuscript has been published in Energy & Environmental Science OPEN ACCESS Porous carbon Capacitive deionization Pore size distribution -function Predicted salt adsorption capacity 0 5 10 15 20 0 5 10 15 20 Measured adsorption (mg/g) Predicted adsorption (mg/g) HIPE CDC OM CDC Please cite this publication as follows: S. Porada, L. Borchardt, M. Oschatz, M. Bryjak, J.S. Atchison, K.J. Keesman, S. Kaskel, P.M. Biesheuvel and V. Presser, “Direct prediction of the desalination performance of porous carbon electrodes for capacitive deionization,” Energy & Environmental Science 6 3700-3712 (2013). You can download the published version at: http://dx.doi.org/10.1039/c3ee42209g In the published version, calculations of charge storage vs time (porous electrode theory) were wrong (Fig. 7B, Fig. 8A and SI). In the corrected model, the fit of model to data is better by a very large degree. Therefore, the provisions about model validity as expressed in the abstract are no longer necessary.

Welcome message from author
This document is posted to help you gain knowledge. Please leave a comment to let me know what you think about it! Share it to your friends and learn new things together.
Transcript

Direct Prediction of the Desalination Performance
of Porous Carbon Electrodes for Capacitive Deionization
S. Porada, L. Borchardt, M. Oschatz, M. Bryjak, J. S. Atchison, K. J. Keesman,
S. Kaskel, P. M. Biesheuvel, and V. Presser
This manuscript has been published in
Energy & Environmental Science
OPEN ACCESS
Porous carbon
Capacitive
deionization
Pore size distribution
-function
Predicted salt
adsorption capacity
0 5 10 15 200
5
10
15
20
Measu
red
ad
so
rpti
on
(m
g/g
)
Predicted adsorption (mg/g)
TOC
HIPE CDC
OM CDC
Please cite this publication as follows:
S. Porada, L. Borchardt, M. Oschatz, M. Bryjak, J.S. Atchison, K.J. Keesman, S. Kaskel,
P.M. Biesheuvel and V. Presser, “Direct prediction of the desalination performance of
porous carbon electrodes for capacitive deionization,” Energy & Environmental Science 6
3700-3712 (2013).
You can download the published version at:
http://dx.doi.org/10.1039/c3ee42209g
In the published version, calculations of charge storage vs time (porous electrode theory)
were wrong (Fig. 7B, Fig. 8A and SI). In the corrected model, the fit of model to data is
better by a very large degree. Therefore, the provisions about model validity as
expressed in the abstract are no longer necessary.

1
Direct Prediction of the Desalination Performance
of Porous Carbon Electrodes for Capacitive Deionization
S. Porada,a,b
L. Borchardt,c M. Oschatz,
c M. Bryjak,
b J. S. Atchison,
d K. J. Keesman,
a,e
S. Kaskel,c P. M. Biesheuvel,
a,f and V. Presser
d,g,*
aWetsus, Centre of Excellence for Sustainable Water Technology, Oostergoweg 7, 8911 MA
Leeuwarden, The Netherlands. bDepartment of Polymers and Carbon Materials, Faculty of Chemistry,
Wroclaw University of Technology, Wybrzeze Wyspianskiego 27, 50-370 Wroclaw, Poland cDepartment of Inorganic Chemistry, Dresden University of Technology, Bergstraße 66, 01069
Dresden, Germany. dINM - Leibniz-Institute for New Materials, Energy Materials Group, 66123
Saarbrücken, Germany. eBiobased Chemistry & Technology, Wageningen University, Bornse
Weilanden 9, 6708 WG Wageningen, The Netherlands. fDepartment of Environmental Technology,
Wageningen University, Bornse Weilanden 9, 6708 WG Wageningen, The Netherlands. gSaarland
University, Campus D2 2, 66123 Saarbrücken, Germany. *
Corresponding author. Email: [email protected]
Abstract
Desalination by capacitive deionization (CDI) is an emerging technology for the energy- and cost-
efficient removal of ions from water by electrosorption in charged porous carbon electrodes. A variety
of carbon materials, including activated carbons, templated carbons, carbon aerogels, and carbon
nanotubes, have been studied as electrode material for CDI. Using carbide-derived carbons (CDCs)
with precisely tailored pore size distributions (PSD) of micro- and mesopores, we studied
experimentally and theoretically the effect of pore architecture on salt electrosorption capacity and salt
removal rate. Of the reported CDC-materials, ordered mesoporous silicon carbide-derived carbon (OM
SiC-CDC), with a bimodal distribution of pore sizes at 1 and 4 nm, shows the highest salt
electrosorption capacity per unit mass, namely 15.0 mg of NaCl per 1 g of porous carbon in both
electrodes at a cell voltage of 1.2 V (12.8 mg per 1 g of total electrode mass). We present a method to
quantify the influence of each pore size increment on desalination performance in CDI by correlating
the PSD with desalination performance. We obtain a high correlation when assuming the ion
adsorption capacity to increase sharply for pore sizes below one nanometer, in line with previous
observations CDI and for electrical double layer capacitors, but in contrast to the commonly held view
about CDI that mesopores are required to avoid electrical double layer overlap. To quantify the
dynamics of CDI, we develop a two-dimensional porous electrode modified Donnan model. For all
three tested materials, both these containing a fair degree of mesopores, and the one with hardly any
mesopores (TiC-CDC), the model describes data for the accumulation rate of charge (current) and salt
accumulation very well, and also accurately reproduces the effect of an increase in electrode
thickness. Calculation results show that a material with higher electrode porosity is not necessarily
responding faster, as more porosity also implies longer transport pathway across the electrode. Our
work highlights that a direct prediction of CDI performance both for equilibrium and dynamics can be
achieved based on the PSD and knowledge of the geometrical structure of the electrodes.

2
1. Introduction
Providing access to affordable and clean water is one of the key technological, social, and
economical challenges of the 21st
century.1,2,3
For the desalination of water, commercially available
methods include distillation,4 reverse osmosis,
5 and electrodialysis.
6 Novel approaches include ion
concentration polarization in microporous media,7 systems based on batteries,
8,9 forward osmosis,
10
and capacitive deionization (CDI).11-15
CDI is based on an electrochemical cell consisting of an open-meshed channel for water flow, in
contact on both sides with sheets of porous electrodes. Upon applying a cell voltage between the two
electrodes, ions become immobilized by an electrosorption process, that is, cations move into the
cathode (the electrode into which negative electrical charge is transferred), while anions move into the
anode (Fig. 1). After some time, when the electrodes reach their adsorption capacity (which depends
on cell voltage), a discharge cycle is initiated by reducing or reversing the cell voltage, thereby
releasing the salt as a concentrated stream. In the discharging step of the cell, energy recovery is
possible.16, 17
Fig. 1 Schematic illustration of desalination via capacitive deionization (CDI). Upon applying a cell voltage between the two electrodes, anions and cations are electrosorbed within highly porous carbon electrodes, to counterbalance the electrical charge. This immobilization of ions decreases the salt concentration in the flow channel, and results in the production of freshwater.
Salt immobilization by CDI is considered an energy-efficient method for the desalination of
water.15,18
Though typically applied to the desalination of brackish water sources, sea water can also
be desalinated by CDI.19
In combination with ion-selective membrane layers placed in front of the
electrodes, CDI can be used to selectively remove a certain ionic species from a mixture of salts, or to
harvest compounds such as acetic acid, sulphuric acid, insulin, and boron.20-26
Such separation
processes may find use in the treatment of waste water from agriculture, (mining) industry, and
hospitals.
Various configurations for the design, stacking, and water management of CDI cells are possible.
Most work considers a design where the salt water is directed parallel to two equal electrodes, while a
constant cell voltage is maintained, see Fig. 1.13,27,28
However, stacks of electrodes do not necessarily
have to consist of symmetrical cells and, instead, varying the carbon mass between the two electrodes
Feed Water Freshwater
Cation Exchange Membrane
Anion Exchange Membrane
Porous Carbon Electrode
Porous Carbon Electrode
-
-
-
-
+
+
+
+
-
+
++
+
+
+
-
--
-
-
_
+
_
+
cations anions
Current Collector
Current Collector
ele
ctr
ica
l cu
rre
nt
Feed Water Freshwater
Porous Carbon Electrode
Porous Carbon Electrode-
-
-
+
-
+
+ + +
+
+
+
-
--
-
_
+
_
+
cations anions
Current Collector
Current Collector
ele
ctr
ica
l
cu
rre
nt
Vcell
Vcell
Feed Water Freshwater
Cation Exchange Membrane
Anion Exchange Membrane
Porous Carbon Electrode
Porous Carbon Electrode
-
-
-
-
+
+
+
+
-
+
++
+
+
+
-
--
-
-
_
+
_
+
cations anions
Current Collector
Current Collectore
lectr
ica
l cu
rre
nt
Feed Water Freshwater
Porous Carbon Electrode
Porous Carbon Electrode-
-
-
+
-
+
+ + +
+
+
+
-
--
-
_
+
_
+
cations anions
Current Collector
Current Collector
ele
ctr
ica
l
cu
rre
nt
Vcell
Vcell
Feed Water Freshwater
Cation Exchange Membrane
Anion Exchange Membrane
Porous Carbon Electrode
Porous Carbon Electrode
-
-
-
-
+
+
+
+
-
+
++
+
+
+
-
--
-
-
_
+
_
+
cations anions
Current Collector
Current Collector
ele
ctr
ica
l cu
rre
nt
Feed Water Freshwater
Porous Carbon Electrode
Porous Carbon Electrode-
-
-
+
-
+
+ + +
+
+
+
-
--
-
_
+
_
+
cations anions
Current Collector
Current Collector
ele
ctr
ica
l
cu
rre
nt
Vcell
Vcell
cations anions

3
provides the possibility to optimize the usable voltage window.29
Another approach utilizes carbon rods
(called wires) which are sequentially dipped and taken out of the water, instead of using film
electrodes forming a stack through which the water flows.30
Instead of using bare carbon electrodes,
improved energy efficiency has been reported for membrane-CDI (MCDI), where ion-exchange
membranes are placed in front of one or both of the electrodes.26,31-34
Further modifications are the
use of constant current operation,33,35
directing the water flow straight through the electrodes,13,28
or
the use of flowable electrode suspensions.19
Recently, CDI electrodes have also been used to produce
energy from the controlled mixing of river and sea water, based on a reversal of the CDI process.36-42
Electrosorption of ions is an interfacial process and in order to have a maximum contact area
between the electrode and the water, CDI employs high surface area porous carbon electrode
materials. At the water/carbon interface, electrical double layers (EDLs) are formed in which ions are
electrosorbed. It has been stated that for optimum performance, pores should be large enough to have
only a weak EDL-overlap, that is, mesopores are to be preferred over micropores.43-45
However, some
microporous carbons, such as activated carbons14,46
and carbide-derived carbons47
actually
outperform mesoporous carbons. Recently, Porada et al.47
reported that CDI desalination capacity
positively correlates with the volume of pores in the range below 1 nm, while obtaining a negative
correlation with the total pore volume, or with BET specific surface area (BET SSA, ref. 48). The
importance of pores <1 nm has also been demonstrated for the capacitance of EDL-capacitor
electrodes,49,50
for H2 gas storage,51
and for CO2 gas removal capacity.52
These results relate to
equilibrium conditions, and micropores (<2 nm) and especially ultramicropores (<0.8 nm) can pose
severe limitations to ion transport in CDI flow cells. Thus, porous electrodes that combine a large
micropore volume (for a high deionization capacity) with a network of mesopores (between 2 and 50
nm) and macropores (>50 nm) may yield a highly efficient deionization process.43,53,54
For an optimum performance, the design of the various components of the CDI system must be
tuned to achieve both high salt electrosorption capacity and fast kinetics at the same time.
Desalination by porous electrodes is by nature a non-linear phenomenon. Classical transmission-line
models applied to CDI are unsatisfactory as they predict zero salt electrosorption and assume a
constant ionic resistivity in the electrode.15,55
Instead, when ions are being electrosorbed in the EDLs
formed in intraparticle pores (within carbon particles), the interparticle pores (the pores in between the
carbon particles) are subjected to ion starvation and the ionic conductivity will drop dramatically during
desalination. This phenomenon results in an internal ionic electrode resistance that is much higher
than expected on the basis of the performance derived for high salinity electrolytes, as common in
EDLC research. EDLCs are specifically designed to operate at large salt concentrations to have a high
ionic conductivity and maximum capacity. Such a free choice of electrolyte is obviously not possible for
water desalination. Note that the effect of ion starvation and the temporal increase in local resistivity to
ion transport in the interparticle pores is included in the porous electrode theory of our paper.
A variety of carbon materials, including activated carbons, carbon aerogels, carbon xerogels, and
carbon nanotubes, have been studied for desalination by CDI.15,18
New developments of advanced
CDI electrode materials include asymmetric electrodes made of activated carbon coated with alumina
and silica nanoparticles,56
reduced graphene oxide and activated carbon composites,57
graphene

4
electrodes prepared by exfoliation and reduction of graphite oxide,58
carbon nanotubes with polyacrylic
acid,59
carbon fiber webs obtained from electrospinning,60,61
and mesoporous activated carbons.62
Templated carbons, although they require a more elaborate synthesis, are of particular interest as
they provide additional means to precisely tailor the pore network, in order to combine a high
electrosorption capacity with fast salt removal rates. A particularly high level of pore size control has
been documented for carbons synthesized by selective etching of metal carbides with chlorine gas,
called carbide-derived carbons, or CDCs.63
Lately, templated CDCs have been reported60,61
that
combine a large micropore volume with hierarchic mesopores. Compared to conventional
CDCs, templated ordered mesoporous CDCs (OM CDCs) show significantly larger specific surface
areas (~3000 m2/g) and total pore volumes (~2 mL/g).
64 Furthermore, using foam-like CDCs,
synthesized by the “high internal phase emulsion” (HIPE) approach, it is possible to obtain control over
macropores. The resulting material has both high surface areas of up to 2800 m2/g and extremely
large pore volumes of up to ~9 mL/g.65
Fig. 2. Schematic view of the time-dependent two-dimensional porous electrode model, combining a sequence of sub-cells in the flow direction, with ion fluxes into the electrode. A symmetric CDI geometry is assumed, thus only half of a cell is depicted. The electrode contains an electrolyte-filled volume allowing for ion transport, and carbon material in which ions and charge are stored. Electrical current (denoted by “+”) flows through the conductive carbon material.
Despite many studies on various kinds of porous carbons, describing both equilibrium salt
adsorption and the dynamics of the process, tools are not yet available to directly predict the
performance of a certain carbon material and CDI design. The present work is aimed to be a first step
towards a method for direct prediction of desalination performance in CDI. Our approach consists of
two main routes:
1. To extract data of the equilibrium salt adsorption and kinetics of CDI for carbons with precisely
tailored and designed pore architectures. With these data we demonstrate how we can directly predict
the desalination performance of a carbon material based on its pore size distribution (PSD).
2. To use a two-dimensional porous electrode CDI transport model to predict the actual salt
electrosorption kinetics. This model demonstrates how desalination kinetics depend not only on
intraparticle pore morphology, but also on the electrode thickness and interparticle porosity.
Carbon
electrodeHalf of the
CDI cell
Ele
ctr
ica
l
cu
rre
nt
Ion
ic f
lux
cation anion
t = electrode
saturation
t = ion diffusion
from the spacer
t = start of ion
electrosorption
Dil
ute
wate
rSpacer
mid-planeFeed
wate
r

5
In the next sections we briefly describe the porous electrode transport theory, and discuss the
synthesis of carbon materials and electrode architecture. We describe the salt adsorption performance
in terms of equilibrium adsorption and kinetics, present a method to correlate equilibrium adsorption
with PSD, and compare the dynamics of ion adsorption with theoretical predictions.
2. Theoretical Section
To describe salt electrosorption and electrical current in porous carbon electrodes forming a CDI
cell, we extend existing one-dimensional porous electrode theory to two dimensions, to consider both
the flow direction of the aqueous solution through the spacer channel, and the movement of salt in and
out of the electrodes. Within the electrodes, we consider simultaneously ion transport through the
space between the carbon particles, that is, the large transport pathways across the electrode
(interparticle pore volume), and the electrosorption of ions inside carbon particles (intraparticle pore
volume). To describe the latter, a powerful and elegant approach is to assume that the EDLs inside
the intraparticle pore volume are strongly overlapping and, therefore, that the potential in these pores
does not vary with position in the pore. This is the common “Donnan” approach for charged porous
materials. The electrical potential in the intraparticle pore volume is different from that in the
interparticle pore volume (the transport pathways) by a value d. The direct Donnan approach is
modified29,31,47
to consider the Stern layer located in between the electronic and ionic charge, and to
include an attraction energy for the ion when it transfers into the intraparticle pores, described by a
term att.66
The modified Donnan (mD) model equals the limit situation of the Gouy-Chapman-Stern
(GCS) theory when approaching full EDL overlap in micropores where the Debye length is of the order
or larger than the pore size. In addition to GCS theory it includes the adsorption energy att that
reflects that also uncharged carbons adsorb some salt. A difference between the mD and GCS model
is that in the mD model, EDL properties are described per unit pore volume, whereas in the GCS
model charge and salt adsorption are described as function of pore area. Numbers in either definition
can be converted when the pore area/volume ratio is known.
To describe the dynamics of ion transport and charge formation, we set up a two-dimensional
porous electrode theory for a CDI cell consisting of two porous electrodes placed in parallel, with a flat
planar slit, or transport channel, or spacer, in between. In the direction of flow, this transport channel is
mathematically divided into M subsequent sub-cells, see Fig. 2.34
In the porous electrode, two coupled
partial differential equations describe as a function of time and depth in the electrode the salt
concentration in the interparticle pores, the electrostatic potential there, , the charge density, and the
salt electrosorption in the intraparticle pores. The porous electrode transport theory requires various
geometrical measures as inputs (thickness, porosity) that can be calculated from electrode
dimensions. Besides, it requires an estimate of the diffusion coefficient of the ions in the macropores,
which may be lower than the corresponding value in free solution. There are no other fitting functions.
The present model neglects a transport resistance between interparticle pores and intraparticle pores,
which can be incorporated, but requires an additional transport coefficient. Further details of the mD
and transport model are provided in Section 5 of ESI (Electronic Supplementary Information).

6
3. Experimental section
Electrodes from three different CDCs were prepared and compared to establish a basis of reference
materials for further analysis of the salt electrosorption capacity. Details of materials synthesis,
electrode manufacturing and CDI testing are given in ESI. The synthesis methods are summarized in
Fig. 3 for titanium carbide-derived carbon (TiC-CDC, Fig. 3A), ordered mesoporous silicon carbide
derived carbon (OM SiC-CDC, Fig. 3B), and HIPE SiC-CDC (Fig. 3C).
Electrodes were prepared from these powders following the procedure outlined in ref. 47
. A carbon
slurry was prepared by mixing 85 mass% of CDC, 5 mass% of carbon black (Vulcan XC72R, Cabot
Corp., Boston, MA), and 10 mass% of polyvinylidene fluoride (Kynar HSV 900, Arkema Inc.,
Philadelphia, PA); the latter was previously dissolved in N-methyl-2-pyrrolidone. Thus, the final
electrode contains 85 mass% of porous CDC carbon. Electrodes were prepared by painting of the
carbon slurry directly on one or both sides of a graphite current collector, taking care that
approximately the same mass was coated on each side. Results for thickness and total electrode
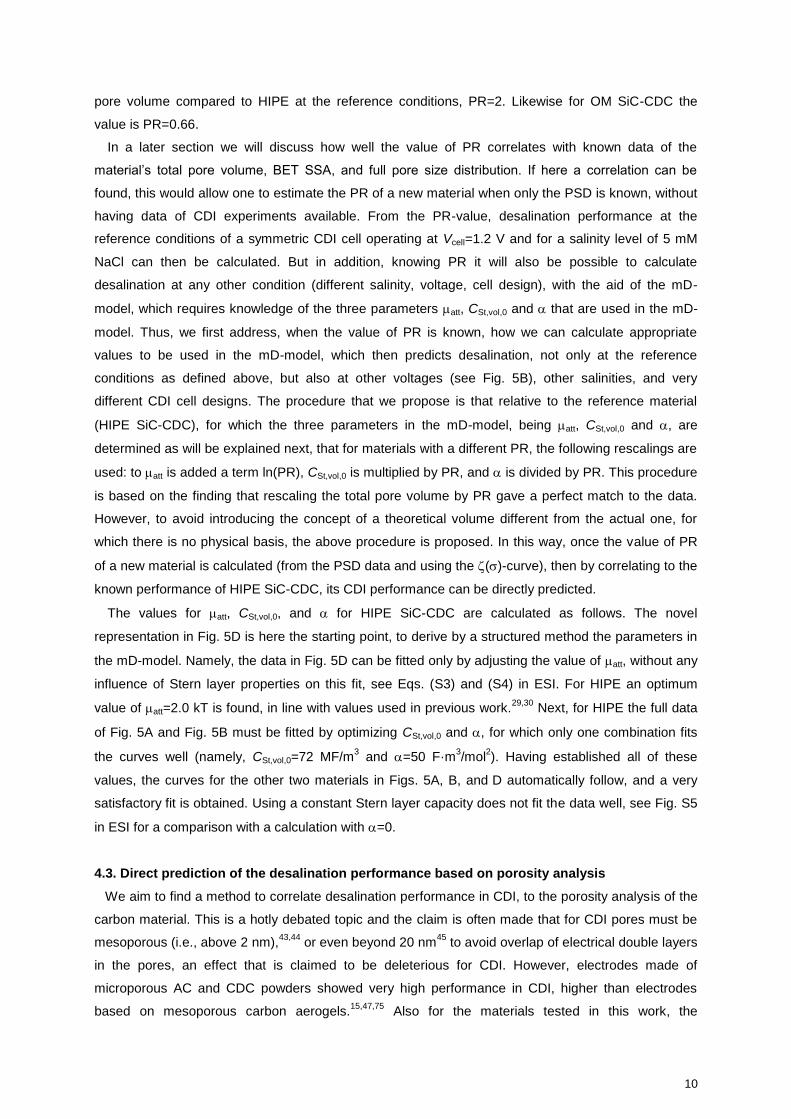
mass density are provided in Table S5. Together with open-meshed porous spacer materials
(thickness sp=350 µm) the current collector/electrode layers are stacked together forming three
parallel cells (i.e., one stack).29,47
The flow of salt solution through the stack is kept constant, flowing
first into a housing around the stack, entering the spacer layers from all four sides, and leaving via a
centrally placed outlet to flow along a conductivity meter placed in-line.
An array of activated carbons and other carbon materials (see ESI) were investigated along with the
CDC materials for comparison. These materials were not painted, but prepared by a wet-casting
technique following the procedure explained in ref. 47. In addition, carbon onions were tested as a
representative of the class of fully graphitic, dense carbon nanoparticles (Fig. S9, ESI) with no
intraparticle porosity. The synthesis of carbon onions is based on the vacuum treatment of
nanodiamonds at 1750°C as outlined in more detail in ESI.
Ion electrosorption occurs when applying a cell voltage Vcell to each of the three cells, defined as the
voltage difference between the positively and negatively polarized electrodes. At the end of the salt
electrosorption step, the cell voltage is reduced to zero and ion desorption begins. The electrical
current running from the cathode to the anode is measured and is integrated over time to provide a
measure for the total charge transferred between the electrodes. This total charge is divided by the
total electrode mass in the stack, mtot, to obtain the charge expressed in C/g, see Fig. 5A, 7A and 8A.
From the conductivity of the effluent solution, the salt concentration is calculated and, thus, by
integrating over time, the salt removal, salt, see ref. 15,47. For each new experiment, the salt
electrosorption/desorption cycle was repeated several times until the differences between cycles
became negligible. We like to stress that in this work, the salt removal data is not obtained from the
first cycle after a new condition has been applied, but instead is obtained when the system has
reached the limit cycle, also called dynamic equilibrium (DE). This is the situation that the same
amount of salt is electrosorbed during the adsorption step as is being removed in the desorption step
of the cycle, as will be typical during practical long-term operation of a CDI system. All experiments
were done using a 5 mM NaCl-solution (290 ppm, 550 µS/cm).

7
Fig. 3. Schematic illustration and SEM images of the synthesis of (A) TiC-CDC, (B) OM SiC-CDC, and (C) HIPE SiC-CDC.
4. Results and Discussion
4.1. Structure of the Porous Carbons
The CDC materials used for this study are produced from selective etching of silicon or titanium
atoms out of a carbide precursor (SiC or TiC), a procedure which results in a material with a high BET
SSA which, in the case of OM SiC-CDC, is as high as 2720 m2/g (Table 1). Fig. 4 displays the
cumulative pore volume of these materials, together with the salt adsorption capacity, or ()-curve, to
be discussed below.
All CDCs investigated in this study are predominantly amorphous, as evidenced by the broad D- and
G-bands observed in Raman spectroscopy (see ESI). TiC-CDC (Fig. 3A) powders are composed of
anisometric particles with a size distribution ranging from approximately 1 to 10 µm and an average
size of ~5 µm. Compared to that, the structures of OM SiC-CDC and HIPE SiC-CDC differ in many
aspects. HIPE SiC-CDC has a cellular pore structure as can be seen from Fig. 3C. Owing to the HIPE
synthesis route, the material exhibits 2 to 4 μm sized cages that are interconnected by 300 to 500 nm
sized windows. The walls are highly porous, but yet in the nanometer range. Thus, this material
exhibits a hierarchical pore structure consisting of macro-, meso-, and micropores. For the other
materials used in this study, macropores are only present in the form of the large pores between
SiC/SBA-15 Ordered mesoporousSiC
(1) polycarbo-silane
(SMP-10)
(2) Pyrolysis00 C,8 Ar
HF(dil.)(1) 800 C, Cl /Ar
(2) 600 C, H2
2
2 step:template removal
nd
Ordered mesoporous SiC-CDC
Ordered mesoporous SiO2 (SBA-15)
1 step:infiltration and
pyrolysis
st 3 step:
silicon extraction
rd
High Internal Phase Emulsion (HIPE)
Poly-HIPE HIPE SiC HIPE SiC-CDC
(1) cross-linking(2) Soxhlet
(3) drying
Pyrolysis700 C, Ar
(1) 700 C, Cl /Ar(2) 600 C, H
2
2
2 step:pyrolysis
nd1 step:
emulsification
st3 step:
silicon extraction
rd
B
C
Microporous
TiC-CDC powder
Dense TiCpowder
A titanium extraction
(1) 800 C, Cl /Ar(2) 600 C, H
2
2
5 µm
5 µm
5 µm

8
carbon particles, but not within the porous particles themselves. OM SiC-CDC was synthesized as a
powder of strand-like particles (Fig. 3B) having an average strand diameter of approximately 1 µm.
These strands are built from nanorods which are arranged in a hexagonal ordered fashion and have
very narrowly distributed mesopores located in between (Fig. 3B). The narrow distribution in mesopore
size is due to the method of nanocasting which employs ordered mesoporous silica templates as
conformally corresponding exo-templates for the resulting CDC.64,67-71
Besides the ordered
mesopores, micropores are also present in OM SiC-CDC. As a consequence, this material has a
hierarchy of micro- and mesopores but no internal macropores.68
Table 1. Pore volume, specific surface area (SSA; calculated with the BET equation48
and quenched solid density functional theory, QSDFT
72), average pore size and local pore size maxima, of the three
CDC-materials The average pore size is the volumetric average; i.e., half of the total pore volume is associated with pores larger or smaller than this value and not reflect, for example, the bimodal pore size distribution in OM SiC-CDC.
Carbon Material Total pore volume BET SSA
QSDFT SSA
Average pore size d50
(mL/g) (m2/g) (nm)
TiC-CDC 0.52 1309 1376 0.67
HIPE SiC-CDC 1.14 2351 2120 1.24
OM SiC-CDC 1.98 2720 2260 4.00
The data for cumulative pore volume, see Fig. 4, show a hierarchical pore size distribution (PSD)
with contributions from micro- and mesopores for HIPE and OM SiC-CDC, while TiC-CDC is
predominantly microporous: more than 90 vol% of the pores is smaller than 2 nm (see Table S1 in
ESI). HIPE SiC-CDC shows a total percentage of 37 vol% of mesopores and for OM SiC-CDC the
majority of the total pore volume is associated with mesopores (~75 vol%). In that regard, HIPE SiC-
CDC has the largest total micropore volume (0.72 mL/g) of the CDC-materials. The hierarchic porosity
of OM SiC-CDC is exemplified by its two narrow distribution maxima at approximately 1 nm and 4 nm.
HIPE SiC-CDC does not show such a strongly pronounced bimodality, but it still exhibits two pore size
distribution maxima at around 1 nm and another one at 2.4 nm.
Fig. 4. Cumulative pore size distributions calculated from QSDFT models, of the three tested CDC-
materials, as well as the suggested correlation function for the ion adsorption capacity, (). PSD curves shifted up by 0.4 mL/g for HIPE SiC-CDC, and 1.0 mL/g for OM SiC-CDC.
1 100.0
0.5
1.0
1.5
2.0
2.5
3.0
3.5
0.11 M
20
TiC-CDC (0.52 mL/g)
OM SiC-CDC (1.98 mL/g)
Cum
ula
tive p
ore
vo
lum
e (
mL/g
)
Pore size (nm)2 3 5 7
HIPE SiC-CDC
(1.14 mL/g)
0.0
0.1
0.2
0.3
0.4
0.5
0.6
0.28 M
0.51 M
Sa
lt a
dsorp
tion
ca
pa
city
(M
)

9
4.2. Equilibrium Desalination Performance
Equilibrium data for salt adsorption and charge are presented in Fig. 5, based on underlying data for
the desalination cycle for which examples given in Fig. S5 and S6 of ESI, using a symmetric CDI cell.
Fig. 5A and 5B presents data for salt adsorption and charge per gram of both electrodes, as function
of cell voltage. In Fig. 5B and 5C, the salt adsorption is presented relative to that at zero cell voltage in
a two-electrode CDI cell. Fig. 5D presents the calculated total ion concentration in the pores (relative
to an uncharged electrode), per mL intraparticle pore volume (for all pores below a size of 30 nm), as
function of the charge, also expressed per mL of intraparticle pores. The data for pore volume are
given in Table 1 and Fig. 4. Fig. 5A and B show that the material with the highest capacitance (namely
of 22.3 F/g at 5 mM NaCl, low-voltage limit), OM SiC-CDC, also has the highest salt adsorption
capacity, namely of 12.8 mg/g at a cell voltage of Vcell=1.2 V. Per gram of carbon (not total electrode)
the adsorption is 15.1 mg/g at 1.2 V.
Figs. 5A and 5B clearly show how with increasing cell voltage both charge and salt adsorption
increase non-linearly. This is different from typical results for EDL capacitors where the charge
increases linearly with voltage (see ref. 15). Fig. 5C plots salt adsorption vs. charge (both expressed in
mol/g; for salt by dividing the data of Fig. 5B by Mw,NaCl and for charge by dividing the results of Fig. 5A
by Faraday’s number), which is a novel representation, which shows how all three datasets overlap.
Fig. 5C also shows that the total ion adsorption is always somewhat less than the charge, i.e., the
charge efficiency (=salt adsorption/charge) is below unity.73
The high suitability of the materials
tested for CDI can be deduced from the fact how close the measured charge efficiency is to unity, with
measured values of generally beyond 0.85. Indeed, Fig. 5C shows how close the data points are to
the “100% charge efficiency”-line, the ideal limit where for each electron transferred one full salt
molecule is removed. Interestingly, beyond the first data points (charge density ~0.1 mmol/g) the data
run parallel to the "100% charge efficiency line" which demonstrates that in this range, for each
additional electron transferred, a full salt molecule is adsorbed, i.e., the differential charge efficiency is
unity.15,74
Fig. 5C clearly makes the point that a strong correlation exists between the capacitance of a
material (how much charge can be stored for a given cell voltage typically evaluated under conditions
of use for EDL capacitors) and desalination performance in CDI.47
Evaluating the data in Fig. 5B per unit pore volume (all pores <30 nm), one can calculate a salt
adsorption of 0.39 M for TiC-CDC, 0.20 M for HIPE SiC-CDC, and 0.13 M for OM SiC-CDC, at a cell
voltage of 1.2 V. This salt adsorption, SA, having dimension M, just as the -function that will be
discussed shortly, see Fig. 4, is equal to half the total ion concentration in the intraparticle pores (<30
nm) as given in Fig. 5D (relative to salt adsorption at zero voltage), evaluated for a symmetric two-
electrode cell. Clearly, per unit pore volume the performance is decreasing in this order, which is
opposite to the order when the more common metric of mg/g is used (as plotted in Fig. 5B). Careful
assessment of the influence of pore size increments on desalination performance is required, and care
must be taken in defining what is the “best” material, which may relate to electrode mass or volume,
dependent on the final application.
Next, we define the performance ratio of a material, or PR. As we will take HIPE SiC-CDC as the
reference, for HIPE this value is unity, PR=1. For TiC-CDC, which has twice the desalination per unit
10
pore volume compared to HIPE at the reference conditions, PR=2. Likewise for OM SiC-CDC the
value is PR=0.66.
In a later section we will discuss how well the value of PR correlates with known data of the
material’s total pore volume, BET SSA, and full pore size distribution. If here a correlation can be
found, this would allow one to estimate the PR of a new material when only the PSD is known, without
having data of CDI experiments available. From the PR-value, desalination performance at the
reference conditions of a symmetric CDI cell operating at Vcell=1.2 V and for a salinity level of 5 mM
NaCl can then be calculated. But in addition, knowing PR it will also be possible to calculate
desalination at any other condition (different salinity, voltage, cell design), with the aid of the mD-
model, which requires knowledge of the three parameters att, CSt,vol,0 and that are used in the mD-
model. Thus, we first address, when the value of PR is known, how we can calculate appropriate
values to be used in the mD-model, which then predicts desalination, not only at the reference
conditions as defined above, but also at other voltages (see Fig. 5B), other salinities, and very
different CDI cell designs. The procedure that we propose is that relative to the reference material
(HIPE SiC-CDC), for which the three parameters in the mD-model, being att, CSt,vol,0 and , are
determined as will be explained next, that for materials with a different PR, the following rescalings are
used: to att is added a term ln(PR), CSt,vol,0 is multiplied by PR, and is divided by PR. This procedure
is based on the finding that rescaling the total pore volume by PR gave a perfect match to the data.
However, to avoid introducing the concept of a theoretical volume different from the actual one, for
which there is no physical basis, the above procedure is proposed. In this way, once the value of PR
of a new material is calculated (from the PSD data and using the ()-curve), then by correlating to the
known performance of HIPE SiC-CDC, its CDI performance can be directly predicted.
The values for att, CSt,vol,0, and for HIPE SiC-CDC are calculated as follows. The novel
representation in Fig. 5D is here the starting point, to derive by a structured method the parameters in
the mD-model. Namely, the data in Fig. 5D can be fitted only by adjusting the value of att, without any
influence of Stern layer properties on this fit, see Eqs. (S3) and (S4) in ESI. For HIPE an optimum
value of att=2.0 kT is found, in line with values used in previous work.29,30
Next, for HIPE the full data
of Fig. 5A and Fig. 5B must be fitted by optimizing CSt,vol,0 and , for which only one combination fits
the curves well (namely, CSt,vol,0=72 MF/m3 and =50 F·m
3/mol
2). Having established all of these
values, the curves for the other two materials in Figs. 5A, B, and D automatically follow, and a very
satisfactory fit is obtained. Using a constant Stern layer capacity does not fit the data well, see Fig. S5
in ESI for a comparison with a calculation with =0.
4.3. Direct prediction of the desalination performance based on porosity analysis
We aim to find a method to correlate desalination performance in CDI, to the porosity analysis of the
carbon material. This is a hotly debated topic and the claim is often made that for CDI pores must be
mesoporous (i.e., above 2 nm),43,44
or even beyond 20 nm45
to avoid overlap of electrical double layers
in the pores, an effect that is claimed to be deleterious for CDI. However, electrodes made of
microporous AC and CDC powders showed very high performance in CDI, higher than electrodes
based on mesoporous carbon aerogels.15,47,75
Also for the materials tested in this work, the

11
predominantly microporous carbons (TiC-CDC, and HIPE SiC-CDC) show a general trend of higher
salt adsorption per unit pore volume than the predominantly mesoporous OM SiC-CDC.
One question remains: what porosity metrics are most suitable to predict CDI performance? In
agreement with ref. 47, we find that desalination is positively correlated, even proportional, with the
volume of pores smaller than 1 nm (see Fig. S3A and Table S1 in ESI), but only for materials that are
mainly microporous. However, when including in the correlation materials with a significant portion of
mesopores, such as HIPE SiC-CDC and even more so for OM SiC-CDC, for these materials a
significant deviation from this proportionality (between salt adsorption and pore volume in pores <1
nm) is observed, with a much higher salt electrosorption than predicted based on this correlation,
which can be explained by the contribution of mesopores to the ion immobilization. This contribution is
not as high, per unit volume, as for micropores, but mesopores nevertheless also contribute to the ion
electrosorption capacity. Thus, this measure of pore volume <1 nm cannot be the input parameter for
a reliable predictive method. This situation is quite different from that in ref. 47 where it was
demonstrated that for microporous carbons (AC and TiC-CDC), a positive correlation between the
volume of pores smaller than 1 nm and the CDI performance could be established with a negative
correlation of salt adsorption with BET SSA and with total pore volume.
A proper metric based on PSD is not just correlated with salt adsorption, but ideally is proportional
with desalination. Proportionality implies that the metric is a true measure of desalination, with an
increase in this metric by say a factor of 2, resulting also in a two-times increased desalination. Such a
metric is more likely to have a chemical-physical basis than a metric that is merely correlated with
desalination. In Fig. S3 of ESI we show four metrics based on the PSD and their proportionality with
the salt adsorption performance: micropore volume <1 nm, <2 nm, total pore volume, and BET SSA.
However, a satisfying fit is not observed in either case. Thus, we cannot establish a clear and
unambiguous proportionality between the salt electrosorption capacity and either of these metrics (see
Fig. S3 in ESI).
Still, porosity measurements present a very facile method to characterize porous carbons and it
remains very attractive to base a predictive CDI performance method on porosity data. We, thus,
propose a new approach to predict the CDI performance, based on considering the relevance to salt
adsorption of each pore size increment, which we call “salt adsorption capacity analysis” (or, -
analysis), which determines the relevance of each size increment to the measured desalination at one
reference condition (Vcell=1.2 V, c=5 mM NaCl, symmetric cell). The function is a property with
dimension M and describes for the reference condition the contribution to desalination by a CDI cell of
a certain pore size, , per unit pore volume (within the carbon in one electrode). Deriving the ()-
function is done by the simultaneous fit of the experimentally available PSD of a set of materials, to
their desalination performance. This analysis quantifies the fact that salt electrosorption depends not
only on the total pore volume, but also on the pore size distribution: the volume associated with some
pores contributes more to the total sorption capacity than other pores.
Mathematically, the aim of the analysis is to find the ()-function, see Fig. 4, by which the salt
adsorptions (SA) of a set of materials (at the reference condition) predicted by Eq. (1), fit as closely as
possible the measured values of SA. Note that the ratio of this SA, to the SA of our reference sample

12
(HIPE SiC-CDC) is the performance ratio, PR. In the ()-analysis, the total salt adsorption in mg/g of
a symmetric two-electrode cell is given by Eq. (1)
max
w,NaCl
0
w,NaCl
0
(mg/g) d
dd ,
d
V
SA M V
VM f f
where Mw,NaCl is the molar mass of NaCl (58.44 g/mol) and V is the pore volume (we will consider in all
cases the pore size distribution up to a size of 30 nm) in mL/g, see Table 1. In the ()-analysis it is
assumed that each material will have a different PSD, see Fig. 4, but that only one common function
for () is allowed. Note that Eq. (1) describes the salt adsorption not per gram of electrode material,
but per gram of carbon, which in all of our experiments is 85% of the electrode mass.
To find the optimum ()-function we have used various methods, using e.g. predefined functions,
but in the end we decided to use a “function-free” approach in which the value of is adjusted
separately for each increment in size , with the only imposed constraint that must be decreasing
with size .
Assuming, instead, as a first approximation to be invariant with pore size , we obtain the parity
plot of Fig. 6A, where for the three CDC-materials, and also for twelve other materials (listed in Table
2) we show the correlation between the predicted value of SA and the measured value. As can be
observed in Fig. 6A, there is a large deviation between measured and predicted salt adsorption when
assuming to be constant at =0.21 M and not varying with pore size.
Next we discuss our results of using a modified ()-function. The optimized ()-function is found
by a least-square fitting procedure of the difference of predicted (see Eq. 1 above) and measured
desalination. Several a-priori constraints are imposed:
1. The full PSD curve is divided in short size ranges of 0.1 nm, for each of which the value of can be
adjusted by the optimization routine, independently of the others.
2. With increasing size , is not allowed to increase, but only to stay constant or decrease. Thus, we
impose the rather stringent condition that the ()-curve must monotonically decrease and the
smallest pore size will have the highest .
3. We assume that beyond a certain size, when EDL overlapping starts to become minor, and
desalination must be proportional with area, that desalination per unit volume must be inversely
proportional with pore size. We impose this condition from an rather arbitrarily size of =6 nm.
We apply this analysis method to the three CDC-materials discussed before, and we arrive at the
()-curve as sketched in Fig. 4, where for a size from 1.1 to 6.0 nm a constant is predicted of
=0.11 M, from a size 0.7-1.1 nm we have =0.28 M and below =0.7 nm =0.51 M. (Note that the
computer routine predicts tiny variations within each “block”, and these slight changes we removed
manually giving the ()-curve plotted in Fig. 4, which was used as input in Fig. 6B). Next the
optimized ()-correlation function is validated by applying it to twelve different materials, see Fig. 6B.
As can be observed, for the three CDC-materials the fit is now perfect, while also for the other

13
materials, the fit between predicted desalination (x-axis) and actual desalination (y-axis) has improved
substantially.
This analysis demonstrates that pores smaller than 1.1 nm contribute more substantially to
desalination than larger pores. The finding of a very high value of the electrosorption capacity
associated with these micropores is in good agreement with our previous study on a comparison of
CDC and AC materials47
and is also in line with the data presented in Table 1 and Fig. S3A (see ESI).
It is closely related to the reported phenomenon of the anomalous increase in capacitance in EDL-
capacitors in subnanometer-sized pores.49,76
In conclusion, the ()-analysis gives the possibility to predict the CDI performance for both common
and specialized carbons, purely based on easy-to-access cumulative PSD data. In contrast to this
accuracy, our results (Fig. 6A and Fig. S3) also underline that a convoluted, single value of pore
analysis such as average pore size, total specific surface area, or total pore volume, is not suited for
direct prediction of the salt electrosorption capacity. Clearly, the complexity of carbon porosity must be
appreciated and PSD data must be combined with consideration of the desalination efficiency of each
pore size increment. A spreadsheet file for the -analysis using arbitrary PSD-data is provided as ESI.
Fig. 5. Equilibrium salt adsorption and charge in porous carbon electrodes prepared from OM SiC-
CDC (squares), HIPE SiC-CDC (circles), and TiC-CDC (triangles). (A) Equilibrium charge F, and (B)
equilibrium salt electrosorption salt, as function of cell voltage, both per gram of both electrodes. (C) Charge and salt adsorption recalculated to mol/g, and plotted one versus the other. (D) Total pore ion
concentration vs charge per unit intraparticle volume (<30 nm). Salt concentration c 5 mM NaCl. Lines represent fits using the modified Donnan model with in (D) µatt,ref as single fitting parameter. (*) Data relative to adsorption at Vcell=0.
0.0 0.2 0.4 0.6 0.8 1.0 1.2 1.40
5
10
15
20
TiC-CDC
HIPE SiC-CDC
OM SiC-CDC
TiC-CDC
HIPE SiC-CDC
OM SiC-CDC
TiC-CDC
HIPE SiC-CDC
Sa
lt a
dso
rptio
n *
(m
g/g
)
Cell voltage (V)
OM SiC-CDC
0.0 0.2 0.4 0.6 0.8 1.0 1.20.0
0.2
0.4
0.6
0.8
1.0
1.2C
To
tal io
n c
on
ce
ntr
atio
n *
(M
)
Charge density (M)
A
100% ch
arge e
fficie
ncy per 1 mL of intraparticle
pore volume < 30 nm
0.0 0.2 0.4 0.6 0.8 1.0 1.2 1.40
5
10
15
20
25
30
35
Ch
arg
e (
C/g
)
Cell voltage (V)
B
per 1 g of total electrode mass
(i.e., considering both electrodes)
per 1 g of total electrode mass
(i.e., considering both electrodes)
0.0 0.1 0.2 0.3 0.40.0
0.1
0.2
0.3
0.4
D
100% ch
arge e
fficie
ncy
Sa
lt a
dso
rptio
n *
(m
mo
l/g
)
Charge density (mmol/g)
TiC-CDC
HIPE SiC-CDC
OM SiC-CDC

14
Table 2. Salt electrosorption performance reported for different electrode materials applied for CDI
(equilibrium adsorption of NaCl as function of total mass of both electrodes combined). salt: equilibrium salt electrosorption; CNTs-RGO: carbon nanotubes and reduced graphene composite; MWCNTs: multi-walled carbon nanotubes; RGO: reduced graphite oxide; AC: activated carbon; CDC: carbide-derived carbon. Entries sorted by ascending salt electrosorption capacity.
Cell voltage
Salt concentration
salt ref.
(V) (mg/L) (mg/g)
CNTs-RGO 1.2 1.6
~50 ~50
0.7 0.9
77
MWCNTs 1.2 ~3000 1.7 78
RGO 2.0 ~65 1.8 79
Carbon xerogel 1.2 ~260 3.1 80
Carbon xerogel 1.2 ~260 3.3 80
Carbon onions 1.2 ~290 3.9 this work
CWZ-22 (AC) 1.2 ~290 5.3 this work
Carbon aerogel 1.3 ~2000 7.1 75
Mast Carbon S-TE3 (AC)
1.2 ~290
7.6 this work
Norit DLC Super50 (AC 1.2 ~290 7.7 this work
Mast Carbon S-TE11 (AC)
1.2 ~290
8.5 this work
Kuraray YP50-F (AC) 1.2 ~290 9.1 this work
Microporous carbon aerogel monoliths
1.25 ~2900 9.6 13
TiC-CDC 1.2 ~290 10.1 this work
TiC-CDC 1.2 ~290 10.4 47
HIPE SiC-CDC 1.2
~290 ~290
11.1 13.6
this work
TiC-CDC 1.2 ~290 12.4 47
OM SiC-CDC 1.2 ~290 12.8 this work
MSP-20 (AC) 1.2 ~290 14.3 this work, 81
4.4. Kinetics of Salt Electrosorption and Charge Transfer
Besides equilibrium electrosorption, the dynamics of ion sorption is of great importance for the
practical application of CDI devices, and for a comprehensive understanding of differences between
different porous carbon materials. In this section we apply for the first time a rigorous procedure based
on a two-dimensional porous electrode theory that predicts the dynamical CDI behavior of a porous
carbon electrode, see ESI, based on ion electrodiffusion through the interparticle pores in the
electrodes, and ion electrosorption in the intraparticle pores. Electrosorption is described by the
modified Donnan (mD) model for which appropriate parameter values for att, CSt,vol,0, and were
derived in section 4.2 (see Fig. 5). The mD model not only predicts desalination at the reference
condition of Vcell=1.2 V and for c=5 mM NaCl, but also for other conditions, and in addition, also
describes electrosorption in a dynamic calculation during which the salt concentration in the
interparticle pores becomes significantly different from c, to drop for a short period during
desalination, while increasing sharply, again only for a short period, during ion release.31
The only
dynamic fitting parameter is the ion diffusion coefficient.

15
As depicted in Fig. 7, porous electrode theory describes the rate of salt electrosorption and charge
accumulation in CDI electrodes very well for the materials with a fair amount of mesopores (HIPE SiC-
CDC, and OM SiC-CDC). The only difference in the input values for these calculations is the electrode
thickness and inter- and intraparticle porosity, all calculated from geometrical measurements (see also
Table 2 and Table S6 in ESI), and the parameters for the mD model obtained from the equilibrium
analysis of section 4.2. The dynamics are described by the ion diffusion coefficient, for which a value
of D=1.3410-9
m2/s is used for all materials (see ESI).
For all three carbide-derived carbons, at Vcell=1.2 V good agreement is observed between measured
and calculated dynamic behavior, with only for OM-CDC the salt electrosorption rate and charge
accumulation rate predicted too high in the intermediate period of 300-400 s (Fig. 7). At Vcell=1.0 V the
same happens for charge, though for salt adsorption the fit is now quite perfect (Fig. S8).
Fig. 6. Parity plots for salt adsorption (c=5 mM, Vcell=1.2 V) for three carbide-derived carbons (grey diamonds) and twelve other materials (red triangles) per gram of carbon in both electrodes combined.
(A) Salt adsorption capacity assumed independent of pore size (B). Optimized ()-function, see Fig. 4.
Fig. 7. (A) Kinetics of charge transfer during the adsorption step, and (B) salt electrosorption in CDI, as function of time for OM SiC-CDC (squares), HIPE SiC-CDC (circles) and TiC-CDC (triangles). Lines are fits using two-dimensional porous electrode theory.
0 5 10 15 20 250
5
10
15
20
25
TiC-CDC, (Ref. 47)
AC- CWZ-22
TiC-CDC-2
(Ref. 47)
TiC-CDC, (Ref. 47) TiC-CDC-1
(Ref. 47)
Carbon aerogel (Ref. 13)
AC-YP50-F
AC-DLC-Super 50
TiC-CDC
HIPE SiC-CDC
OM SiC-CDC
Mea
sure
d s
alt a
dsorp
tio
n (
mg
/g)
Predicted salt adsorption (mg/g)
Carbon xerogel,
(Ref. 80)
=f()
0 5 10 15 20 250
5
10
15
20
25
Carbon onionsCarbon onions
AC- CWZ-22
AC-S-TE11
AC-S-TE3
AC-S-TE11
AC-S-TE3
AC- MSP20AC- MSP20
Carbon aerogel,
(Ref. 13)
AC-YP50-F
AC-DLC-Super 50
TiC-CDC
HIPE SiC-CDC
OM SiC-CDC
Mea
sure
d s
alt a
dsorp
tio
n (
mg
/g)
Predicted salt adsorption (mg/g)
Carbon xerogel,
(Ref. 80)
=f()
A B
0 200 400 600 8000
2
4
6
8
10
12
14
TiC-CDC
HIPE SiC-CDCOM SiC-CDC
Sa
lt a
dso
rptio
n (
mg
/g)
Time (s)
OM SiC-CDC
HIPE SiC-CDC
TiC-CDC
0 200 400 600 8000
5
10
15
20
25
30
c= 5.0 mM
Ch
arg
e (
C/g
)
Time (s)
Vcell
= 1.2 V
c= 5.0 mM
Vcell
= 1.2 V
A B
0 200 400 600 8000
2
4
6
8
10
12
14
Salt a
dsorp
tion (
mg/g
)
Time (s)
OM SiC-CDC
HIPE SiC-CDC
TiC-CDC
B

16
4.5 Effect of Electrode Thickness on Salt Electrosorption and Charge Transfer
As we have seen, ion transport is strongly influenced by the structure of the pore network, with for all
three CDC-materials a good description of the dynamics of desalination performance, as shown in
Fig. 7. To further validate the two-dimensional porous electrode theory for these hierarchical materials,
electrodes characterized by the same mass density but different thicknesses were prepared from OM
SiC-CDC. As shown in Fig. 8A and B, there is a significant influence of the electrode thickness on both
the salt electrosorption rate and the charge transfer rate: by increasing the thickness of the electrodes,
the rate by which the maximum desalination is reached in the CDI process slows down, while as
expected the final equilibrium values (defined per gram of material) remain exactly the same. We see
that this applies for both the charge accumulation rate and the salt electrosorption rate. Fig. 8C and D
analyze theoretically the effect of higher (or lower) electrode packing density (the overall electrode
mass density, as presented in column 2 of Table S5), by reducing the interparticle volume while
keeping the mass and total intraparticle volume the same.
Fig. 8. (A) Salt electrosorption, and (B) charge transfer during the electrosorption step in CDI, as function of time and electrode thickness, L, for electrodes made of OM SiC-CDC. Lines are predictions using two-dimensional porous electrode theory. (C) and (D): calculation results as function of electrode packing density.
0 200 400 600 8000
2
4
6
8
10
12
14
L= 345 m
L= 270 m
L= 345 m
Salt a
dsorp
tion (
mg/g
)
Time (s)
L= 270 m
0 200 400 600 8000
5
10
15
20
25
30
c= 5.0 mM
Charg
e (
C/g
)
Time (s)
Vcell
= 1.2 V
c= 5.0 mM
Vcell
= 1.2 V
A B
0 20 40 60 800
1
2
3
4
5
6
Theoretical
optimum
at 1.2 V
Transport
limited
50%
hig
her p
acking
den
sity
50%
adsorp
tion tim
e (
min
)
Interparticle porosity (%)
OM SiC-CDC,
1.2 V
Long transport
pathways
0 200 400 600 8000
2
4
6
8
10
12
14
unm
odified
50%
sm
aller p
acking
den
sity
Salt a
dsorp
tion (
mg/g
)
Time (s)
C D
0 200 400 600 8000
2
4
6
8
10
12
14
L= 345 m
L= 270 m
L= 345 m
Sa
lt a
dso
rptio
n (
mg
/g)
Time (s)
L= 270 m
0 200 400 600 8000
5
10
15
20
25
30
c= 5.0 mM
Ch
arg
e (
C/g
)
Time (s)
Vcell
= 1.2 V
c= 5.0 mM
Vcell
= 1.2 V
A B
0 20 40 60 800
1
2
3
4
5
6
Theoretical
optimum
at 1.2 V
Transport
limited
50%
hig
her p
acking
den
sity
50
% a
dso
rptio
n tim
e (
min
)
Interparticle porosity (%)
OM SiC-CDC,
1.2 V
Long transport
pathways
0 200 400 600 8000
2
4
6
8
10
12
14
unm
odified
50%
sm
aller p
acking
den
sity
Sa
lt a
dso
rptio
n (
mg
/g)
Time (s)
C D

17
Fig. 8D shows the interesting effect that a reduction of the interparticle volume is at first
advantageous, with the time to reach 50% of the maximum desalination first decreasing (reaching a
minimum value in the range of porosities between 30 and 60%), with this time increasing again for
even lower porosities. The positive effect of a higher packing density of the electrode is that the length
of the pathways for ions to traverse across the electrode goes down (the deepest regions of the
electrode are more quickly reached), while the opposite effect at low porosity is because the transport
pathways are being squeezed out of the electrode, with the apparent resistance for ion transport
increasing (i.e., simply no transport pathways remain).
These observations have a number of important implications, because optimized kinetics are very
important for actual CDI application. As Fig. 8 demonstrates, faster ion electrosorption (per unit mass
of electrode) can be achieved by decreasing the electrode thickness and by optimizing the electrode
porosity. Thus, our study demonstrates that it is not only important to appreciate the micro- and
mesopores present inside a carbon particle, but also to understand the porous carbon electrode in its
entirety. The latter also entails the pores in between the carbon particles, and the total thickness of an
electrode.
5. Conclusions
We have studied capacitive deionization of water using three carbide-derived porous carbon
materials with strongly varying contributions to the total pore volume originating from micro- and
mesopores, and compared performance with various reference materials. We have demonstrated that
there is no direct relationship between salt electrosorption capacity and typical pore metrics such as
BET SSA and the total volume of pores. However, we have demonstrated that the salt electrosorption
capacity can be predicted by analysis of the pore size distribution and the pore volume correlated with
incremental pore size ranges, considering that differently sized pores exhibit a different electrosorption
capacity for the removal of salt ions. This analysis has been validated by comparison to literature data
and other carbon materials and we were able to quite reliably predict the CDI performance of a range
of carbons used for CDI.
Modeling is an important part of CDI performance analysis, not only to access information on the
equilibrium salt removal capacity but also to gain understanding of the ion electrosorption process.
Using the diffusion coefficient as only dynamic fit parameter, two-dimensional porous electrode theory
is capable of predicting the dynamics of charge accumulation and the resulting process of salt
electrosorption for all three CDC-materials to a remarkable degree. Although CDI is a complex
process depending on various parameters, such as pore volume, pore size distribution and process
parameters, our work demonstrates that prediction of the CDI dynamic equilibrium salt adsorption
capacity and the kinetics for flow-by electrodes is feasible. These results will facilitate the rational
development of carbon electrode designs for CDI. An important next step will be to adapt our model to
more advanced CDI techniques, such as flow-through CDI,13,82
CDI using wires,30
or CDI using flowing
electrodes.19

18
References
1. M. A. Shannon, P. W. Bohn, M. Elimelech, J. G. Georgiadis, B. J. Marinas and A. M. Mayes, Nature, 2008, 452, 301.
2. T. Humplik, J. Lee, S. C. O'Hern, B. A. Fellman, M. A. Baig, S. F. Hassan, M. A. Atieh, F. Rahman, T. Laoui, R. Karnik and E. N. Wang, Nanotechnology, 2011, 22, 292001.
3. http://www.un.org/News/Press/docs/2010/ga10967.doc.htm 4. A. D. Khawaji, I. K. Kutubkhanah and J.-M. Wie, Desalination, 2008, 221, 47. 5. L. F. Greenlee, D. F. Lawler, B. D. Freeman, B. Marrot and P. Moulin, Water Research, 2009, 43,
2317. 6. H. Strathmann, Ion-Exchange Membrane Separation Processes, Elsevier, Amsterdam, 2004. 7. A. Mani and M. Z. Bazant, Phys. Rev. E, 2011, 84, 061504. 8. M. Pasta, C. D. Wessells, Y. Cui and F. La Mantia, Nano Letters, 2012, 12, 839-843. 9. M. Pasta, A. Battistel and F. La Mantia, Energy & Environm. Sci., 2012, 5, 9487. 10. T. Y. Cath, A. E. Childress and M. Elimelech, J. Membrane Science, 2006, 281, 70. 11. K.-L. Yang, T.-Y. Ying, S. Yiacoumi, C. Tsouris and E. S. Vittoratos, Langmuir, 2001, 17, 1961. 12. C. J. Gabelich, T. D. Tran and I. H. M. Suffet, Environm. Sci. Techn., 2002, 36, 3010. 13. M. E. Suss, T. F. Baumann, W. L. Bourcier, C. M. Spadaccini, K. A. Rose, J. G. Santiago and M.
Stadermann, Energy & Environm. Sci., 2012, 5, 9511. 14. H. Li, L. Zou, L. Pan and Z. Sun, Environm. Sci. Techn., 2010, 44, 8692. 15. S. Porada, R. Zhao, A. van der Wal, V. Presser and P. M. Biesheuvel, Progress in Material Science
2013, 58, 1388. 16. O. N. Demirer, R. M. Naylor, C. A. Rios Perez, E. Wilkes and C. Hidrovo, Desalination, 2013, 314,
130. 17. P. Dlugolecki and A. van der Wal, Environm. Sci. & Techn., 2013, 47, 4904. 18. L. Zou, in Expanding Issues in Desalination, ed. R. Y. Ning, INTECH, 2011. 19. S.-I. Jeon, H.-R. Park, J.-G. Yeo, S. Yang, C. H. Cho, M. H. Han and D.-K. Kim, Energy &
Environm. Sci., 2013, 6, 1471. 20. H.-H. Jung, S.-W. Hwang, S.-H. Hyun, K.-H. Lee and G.-T. Kim, Desalination, 2007, 216, 377. 21. C.-H. Hou, T.-S. Patricia, S. Yiacoumi and C. Tsouris, J. Chem. Phys., 2008, 129, 224703. 22. E. Avraham, M. Noked, A. Soffer and D. Aurbach, Electrochimica Acta, 2011, 56, 6312. 23. R. Zhao, M. van Soestbergen, H. H. M. Rijnaarts, A. van der Wal, M. Z. Bazant and P. M.
Biesheuvel, J. Colloid Interface Sci., 2012, 384, 38. 24. Y.-J. Kim and J.-H. Choi, Water Research, 2012, 46, 6033. 25. S.-J. Kim, J.-H. Choi and J.-H. Kim, Process Biochemistry, 2012, 47, 2051. 26. Y.-J. Kim, J.-H. Kim and J.-H. Choi, J. Membrane Sci., 2013, 429, 52. 27. A. M. Johnson and J. Newman, J. Electrochem. Soc., 1971, 118, 510. 28. Y. Bouhadana, E. Avraham, M. Noked, M. Ben-Tzion, A. Soffer and D. Aurbach, J. Phys. Chem. C,
2011, 115, 16567. 29. S. Porada, M. Bryjak, A. van der Wal and P. M. Biesheuvel, Electrochim. Acta, 2012, 75, 148. 30. S. Porada, B. B. Sales, H. V. M. Hamelers and P. M. Biesheuvel, J. Phys. Chem. Lett., 2012, 3,
1613. 31. P. M. Biesheuvel, R. Zhao, S. Porada and A. van der Wal, J. Colloid Interface Sci. 2011, 360, 239. 32. J.-Y. Lee, S.-J. Seo, S.-H. Yun and S.-H. Moon, Water Research, 2011, 45, 5375. 33. R. Zhao, P. M. Biesheuvel and A. Van der Wal, Energy & Environm. Sci., 2012, 5, 9520. 34. R. Zhao, O. Satpradit, H. H. M. Rijnaarts, P. M. Biesheuvel and A. van der Wal, Water Research,
2013, 47, 1941. 35. E. Garcia - Quismondo, R. Gomez, F. Vaquero, A. L. Cudero, J. Palma and M. A. Anderson, Phys.
Chem. Chem. Phys., 2013, 15, 7648. 36. D. Brogioli, Phys. Rev.Lett., 2009, 103, 058501. 37. B. B. Sales, M. Saakes, J. W. Post, C. J. N. Buisman, P. M. Biesheuvel and H. V. M. Hamelers,
Environm. Sci.Techn., 2010, 44, 5661. 38. D. Brogioli, R. Zhao and P. M. Biesheuvel, Energy & Environm. Sci., 2011, 4, 772. 39. F. Liu, O. Schaetzle, B. B. Sales, M. Saakes, C. J. N. Buisman and H. V. M. Hamelers, Energy &
Environm. Sci., 2012, 5, 8642. 40. R. A. Rica, R. Ziano, D. Salerno, F. Mantegazza and D. Brogioli, Phys. Rev. Lett., 2012, 109,
156103. 41. D. Brogioli, R. Ziano, R. A. Rica, D. Salerno, O. Kozynchenko, H. V. M. Hamelers and F.
Mantegazza, Energy & Environm. Sci., 2012, 5, 9870. 42. D. A. Vermaas, S. Bajracharya, B. B. Sales, M. Saakes, B. Hamelers and K. Nijmeijer, Energy &
Environm. Sci., 2013, 6, 643.

19
43. L. Zou, L. Li, H. Song and G. Morris, Water Research, 2008, 42, 2340. 44. L. Li, L. Zou, H. Song and G. Morris, Carbon, 2009, 47, 775. 45. C. J. Gabelich, P. Xu and Y. Cohen, Sustainability Sci. Eng., 2010, 2, 295. 46. Z. Peng, D. Zhang, L. Shi and T. Yan, J. Mat. Chem., 2012, 22, 6603. 47. S. Porada, L. Weinstein, R. Dash, A. van der Wal, M. Bryjak, Y. Gogotsi and P. M. Biesheuvel,
ACS Applied Materials & Interfaces, 2012, 4, 1194. 48. S. Brunauer, P. H. Emmett and E. Teller, J. Am. Chem. Soc., 1938, 60, 309. 49. J. Chmiola, G. Yushin, Y. Gogotsi, C. Portet, P. Simon and P. L. Taberna, Science, 2006, 313,
1760. 50. S. Kondrat, V. Presser, C. R. Perez, Y. Gogotsi and A. A. Kornyshev, Energy & Environm. Sci.,
2012, 5, 6474. 51. Y. Gogotsi, C. Portet, S. Osswald, J. M. Simmons, T. Yildirim, G. Laudisio and J. E. Fischer, Int. J.
Hydrogen Energy, 2009, 34, 6314. 52. V. Presser, J. McDonough, S.-H. Yeon and Y. Gogotsi, Energy & Environm. Sci., 2011, 4, 3059. 53. H. B. Li, T. Lu, L. K. Pan, Y. P. Zhang and Z. Sun, J. Mater. Chem., 2009, 19, 6773. 54. X. Wen, D. Zhang, L. Shi, T. Yan, H. Wang and J. Zhang, J. Mat. Chem., 2012, 22, 23835. 55. P. M. Biesheuvel and M. Z. Bazant, Physical Review E, 2010, E81, 031502. 56. L. Han, K. G. Karthikeyan, M. A. Anderson, K. Gregory, J. J. Wouters and A. Abdel-Wahab,
Electrochimica Acta, 2013, 90, 573. 57. H. Li, L. Pan, C. Nie, Y. Liu and Z. Sun, J. Mater. Chem., 2012, 22, 15556. 58. H. Wang, D. Zhang, T. Yan, X. Wen, L. Shi and J. Zhang, J. Mat. Chem., 2012, 22, 23745. 59. C. Nie, L. Pan, Y. Liu, H. Li, T. Chen, T. Lu and Z. Sun, Electrochim. Acta, 2012, 66, 106. 60. M. Wang, Z.-H. Huang, L. Wang, M.-X. Wang, F. Kang and H. Hou, New Journal of Chemistry,
2010, 34, 1843. 61. G. Wang, Q. Dong, Z. Ling, C. Pan, C. Yu and J. Qiu, J. Mat. Chem., 2012, 22, 21819. 62. G. Wang, B. Qian, Q. Dong, J. Yang, Z. Zhao and J. Qiu, Sep. Purif. Techn., 2013, 102, 216. 63. V. Presser, L. Zhang, J. J. Niu, J. McDonough, C. Perez, H. Fong and Y. Gogotsi, Advanced
Energy Materials, 2011, 1, 423. 64. P. Krawiec, E. Kockrick, L. Borchardt, D. Geiger, A. Corma and S. Kaskel, J.Phys. Chem. C, 2009,
113, 7755. 65. M. Oschatz, L. Borchardt, M. Thommes, K. A. Cychosz, I. Senkovska, N. Klein, R. Frind, M.
Leistner, V. Presser, Y. Gogotsi and S. Kaskel, Angewandte Chemie, 2012, 51, 7577. 66. B. Kastening and M. Heins, Electrochimica Acta, 2005, 50, 2487. 67. P. Krawiec, D. Geiger and S. Kaskel, Chemical Communications, 2006, 23, 2469. 68. E. Kockrick, C. Schrage, L. Borchardt, N. Klein, M. Rose, I. Senkovska and S. Kaskel, Carbon,
2010, 48, 1707. 69. Y. Korenblit, M. Rose, E. Kockrick, L. Borchardt, A. Kvit, S. Kaskel and G. Yushin, ACS Nano,
2010, 4, 1337. 70. M. Oschatz, E. Kockrick, M. Rose, L. Borchardt, N. Klein, I. Senkovska, T. Freudenberg, Y.
Korenblit, G. Yushin and S. Kaskel, Carbon, 2010, 48, 3987. 71. M. Rose, Y. Korenblit, E. Kockrick, L. Borchardt, M. Oschatz, S. Kaskel and G. Yushin, Small,
2011, 7, 1108. 72. P. I. Ravikovitch and A. V. Neimark, Langmuir, 2006, 22, 11171. 73. R. Zhao, P. M. Biesheuvel, H. Miedema, H. Bruning and A. van der Wal, J. Phys. Chem. Lett.,
2010, 1, 205. 74. M. D. Levi, S. Sigalov, D. Aurbach and L. Daikhin, J. Phys. Chem. C, 2013, 117, 14876. 75. P. Xu, J. E. Drewes, D. Heil and G. Wang, Water Research, 2008, 42, 2605. 76. R. K. Kalluri, M. M. Biener, M. E. Suss, M. D. Merrill, M. Stadermann, J. G. Santiago, T. F.
Baumann, J. Biener and A. Striolo, Phys. Chem. Chem. Phys., 2013, 15, 2309. 77. H. Li, S. Liang, J. Li and L. He, J. Mat. Chem. A, 2013, 1, 6335. 78. K. Dai, L. Shi, J. Fang, D. Zhang and B. Yu, Materials Letters, 2005, 59, 1989. 79. Z. Wang, B. Dou, L. Zheng, G. Zhang, Z. Liu and Z. Hao, Desalination, 2012, 299, 96. 80. J. Landon, X. Gao, B. Kulengowski, J. K. Neathery and K. Liu, J. Electrochem. Soc., 2012, 159,
A1861. 81. T. Kim and J. Yoon, Journal of Electroanalytical Chemistry, 2013, 704, 169. 82. I. Cohen, E. Avraham, M. Noked, A. Soffer and D. Aurbach, J. Phys. Chem. C, 2011, 115, 19856.

Electronic Supplementary Information 1
Direct Prediction of the Desalination Performance of Porous Carbons
Electrodes for Capacitive Deionization
S. Porada, L. Borchardt, M. Oschatz, M. Bryjak, J. S. Atchison,
K. J. Keesman, S. Kaskel, P. M. Biesheuvel and V. Presser
Electronic Supplementary Information
1. Nitrogen Gas Sorption Analysis of CDC Samples
Gas sorption analysis with Nitrogen was carried out following the experimental procedure outlined in
the experimental section. As seen from Fig. S1, the shape of the TiC-CDC isotherm is of type I
(according to IUPAC classification), indicating dominant presence of micropores (i.e., < 2nm). The
shape of the HIPE SiC-CDC isotherm represents the transition from type I to type V, due to sufficiently
large amount of pores around 1 nm in size (Table S1). In this material small mesopores are present
which contribute 37 vol% of the total pore volume (not including macropores). In case of OM SiC-CDC
the isotherm shape is type IV including a type H4 hysteresis that proves the presence of a secondary
mesoporosity along with a slit-shaped pore geometry. Very narrowly distributed micropores of 1 nm
and mesopores of 4 nm are seen in Fig. 3; the latter encompass a pore volume of 1.5 cm3/g, and,
therefore, contribute significantly to the overall pore volume of this material (Table S1). Macropores,
which do not account to the salt electrosorption capacity, are present in all electrodes, but only in the
case of HIPE SiC-CDC, such macropores are not only present between the particles but also within
the particles (see also ref. 1).
Fig. S1. Nitrogen gas sorption isotherms of TiC-CDC, HIPE SiC-CDC, and OM SiC-CDC at -196°C. STP stands for standard temperature and pressure.
0.00 0.25 0.50 0.75 1.00
0
200
400
600
800
1000
1200
1400
TiC-CDC
HIPE SiC-CDC
Vo
lum
e a
dso
rbed
@
ST
P (
cm
3/g
)
Relative pressure (P/P0)
OM SiC-CDC

Electronic Supplementary Information 2
Table S1. Pore volume and volume / fraction of micro- and mesopores. As defined by IUPAC, micropores are pores with a diameter smaller than 2 nm whereas mesopores are pores with a diameter between 2 and 50 nm. No macropores can be determined with the nitrogen sorption method. The pore volumes were calculated using the quenched solid density functional theory (QSDFT, ref. 2) assuming slit-shaped pores (marked with *) or a mixed QSDFT model for slit and cylindrical pore shapes (marked with
+).
Total pore
volume
Micropore
volume
Fraction of
micropores
Mesopore
volume
Fraction of
mesopores
Volume of
pores < 1 nm
(mL/g) (mL/g) (%) (mL/g) (%) (mL/g)
TiC-CDC* 0.52 0.47 91.3 0.05 8.7 0.43
HIPE SiC-CDC+ 1.14 0.72 63.3 0.42 36.7 0.40
OM SiC-CDC+ 1.98 0.48 24.1 1.50 75.9 0.22
2. Raman Spectroscopy of CDC samples
Raman spectroscopy was carried out on an inVia Raman Spectrometer (Renishaw) using an
excitation wavelength of 514 nm with ≤2 mW output power on the sample and a 50x magnification
objective lens (numeric aperture: 0.75). The focus plane spot size of the laser beam was
approximately 2 µm and the spectral resolution ranged from 0.8 to 1.3 cm-1
within the studied Raman
shift range using a grating of 2400 lines/mm.
All Raman spectra showed a typical spectrum for amorphous carbon, with various degrees of
ordering (Fig. S2, Table S2). Structurally, especially regarding the degree of carbon ordering, both
types of SiC-CDC (i.e., OM and HIPE) are virtually identical. They also exhibit the lowest ID/IG band
ratios which is indicative of a high degree of carbon ordering and a narrow G2-bandwidth of ≈50 cm-1
.
The lower degree of carbon ordering found in TiC-CDC is exhibited by the elevated ID/IG band ratio but
most noticeably by the broad D-band (Fig. S2).
Fig. S2. Raman spectra TiC-CDC, HIPE SiC-CDC, and OM SiC-CDC.
1000 1500 2000 2500 3000
0.0
0.2
0.4
0.6
0.8
1.0
1.2
1.4
1.6
1.8
2.0
2.2
2.4
OM SiC-CDC
HIPE SiC-CDC
TiC-CDC
Ra
ma
n in
ten
sity (
arb
. un
its)
Raman shift (1/cm)

Electronic Supplementary Information 3
Table S2. Parameters of spectral fitting assuming a 4-peak deconvolution of the D- and G-band along with ID/IG band ratios (Lorentzian peak shape is assumed).
Band position
FWHM Peak area
(1/cm) (1/cm) (arb. units)
TiC-CDC D1 1154.7 137.1 441100
ID/IG: 1.57 D2 1343.5 185.7 4359540
G1 1543.8 144.8 2092624
G2 1598.8 62.2 964116
HIPE SiC-CDC
D1 1210.3 171.5 15561359
ID/IG: 1.22 D2 1358.3 125.8 73394112
G1 1563.7 160.2 50542740
G2 1610.0 46.2 22310958
OM SiC-CDC
D1 1179.8 135.9 3583756
ID/IG: 1.26 D2 1332.5 130.3 15820094
G1 1528.7 160.1 9457017
G2 1597.7 53.9 5995670
3. Salt Electrosorption Performance
Table S3 summarizes the performance of nine types of carbon materials and its BET specific
surface area, total pore volume and average pore size applied for capacitive deionization. As can be
seen from Table S3, the specific surface area as calculated by the BET method, BET SSA does not
perfectly correlate with the desalination capacity of porous carbons, and the same conclusion applies
to the total pore volume, volume of pores <1nm and <2nm, and the average pore size, see also Fig.
S3.
Table S3. Selection of salt electrosorption performance reported for different electrode materials applied for CDI. AC: activated carbon; CDC: carbide-derived carbon; MWCNTs: multi-walled carbon nanotubes. All entries are sorted by ascending salt adsorption capacity per 1 g of total electrode mass. * Number given per total electrode volume. (*: This Study)
Cell voltage
Salt concentration
Salt adsorption
Salt adsorption
BET SSA
Total pore
volume
Average pore size
ref.
(V) (mg/L) (mg/g) (mg/mL*) (m
2/g) (mL/g) (nm)
MWCNTs 1.2 ~3000 1.7 - 130 0.38 - 3
Carbon xerogel 1.2 ~260 3.1 - 239 0.42 6.9 4
Microporous carbon aerogel monoliths
1.25 ~2900 9.6 - 500 0.584 - 5
Norit DLC Super50 (AC)
1.2 1.4
~290 ~290
7.7 9.7
3.4 5.2
1707 0.80 1.23 *
Kuraray YP50-F (AC)
1.2 1.4
~290 ~290
9.1 11.0
1450 0.71 1.01 *
TiC-CDC 1.2 1.4
~290 ~290
10.1 13.3
5.4 7.2
1309 0.52 0.67 *
HIPE SiC-CDC 1.2 1.4
~290 ~290
11.1 13.6
1.2 1.5
2351 1.14 1.24 *
OM SiC-CDC 1.2 1.4
~290 ~290
12.8 16.0
1.6 2.0
2720 1.98 4.0 *

Electronic Supplementary Information 4
Fig. S3. Plot of electrosorption capacity versus (A) volume of pores <1nm, (B) volume of pores <2 nm, (C) total pore volume, and (D) BET SSA.
Fig. S4. Cumulative pore size distribution of the studied sample materials. Synthesized CDC materials (A), activated carbons (B), activated carbon and carbons with only outer surface (exohedral carbon; C), and comparison between TiC-CDCs and carbon aerogel (D). The data in Fig. S4A is identical with the data shown in Fig. 4 except that the data has no y-offset and, for that reason, is easier to compare.
0.0 0.1 0.2 0.3 0.4 0.5 0.60
3
6
9
12
15
18
AC-YP50-F
Carbon aerogel,
(Ref. 13)
TiC-CDC-2, (Ref. 47)
TiC-CDC-1, (Ref. 47)
Carbon xerogel, (Ref. 80)
Carbon onions
AC-MSP-20
AC-S-TE11
AC-S-TE3
AC-CWZ-22
AC-DLC Super 50
OM SiC-CDC
TiC-CDC
HIPE SiC-CDC
Sa
lt a
dso
rptio
n (
mg
/g)
Volume of pores < 1 nm (mL/g)
0.0 0.2 0.4 0.6 0.8 1.0 1.2 1.4 1.6 1.8 2.00
3
6
9
12
15
18
AC-S-TE11
TiC-CDC-2, (Ref. 47)
Carbon aerogel
TiC-CDC-1, (Ref. 47)
AC-S-TE3
AC-YP50-FAC-S-TE11
Carbon xerogel, (Ref. 80)
AC-CWZ-22
Carbon xerogel, (Ref. 80)
AC-MSP-20
Carbon onions
Sa
lt a
dso
rptio
n (
mg
/g)
Total pore volume (mL/g)
AC-DLC Super 50
HIPE SiC-CDC
OM SiC-CDC
TiC-CDC
D
0 500 1000 1500 2000 2500 30000
3
6
9
12
15
18
TiC-CDC-2, (Ref. 47)
TiC-CDC-1, (Ref. 47)
AC-S-TE3
AC-S-TE11 AC-YP50-F
AC-DLC Super 50
AC-CWZ-22Carbon onions
Carbon xerogel, (Ref. 80)
Carbon xerogel, (Ref. 80)
AC-MSP-20
Sa
lt a
dso
rptio
n (
mg
/g)
BET SSA (m2/g)
HIPE SiC-CDC
OM SiC-CDC
TiC-CDC
0.0 0.1 0.2 0.3 0.4 0.5 0.6 0.7 0.8 0.9 1.00
3
6
9
12
15
18
TiC-CDC-2, (Ref. 47)
Carbon aerogel,
(Ref. 13)
AC-YP50-F
TiC-CDC-1, (Ref. 47)
Carbon onions
Carbon xerogel, (Ref. 80)
AC-MSP-20
AC-DLC Super 50
AC-CWZ-22
AC-S-TE3
AC-S-TE11
TiC-CDCHIPE SiC-CDC
OM SiC-CDC
Sa
lt a
dso
rptio
n (
mg
/g)
Volume of pores < 2 nm (mL/g)
A B
C
1 100.0
0.2
0.4
0.6
0.8
1.0
1.2
1.4
1 100.0
0.2
0.4
0.6
0.8
1.0
1.2
1.4
1 100.0
0.2
0.4
0.6
0.8
1.0
1.2
1.4
1 100.0
0.2
0.4
0.6
0.8
1.0
1.2
1.4
1.6
1.8
2.0
AC-S-TE11
AC-CWZ-22
AC-YP50-F
AC-MSP-20
Cu
mu
lati
ve
po
re v
olu
me (
mL
/g)
Pore size (nm)
AC-DLC-Super50
Carbon Xerogel, (Ref. 80)
Carbon xerogel,
(Ref. 80)
Carbon onions
Cu
mu
lati
ve
po
re v
olu
me (
mL
/g)
Pore size (nm)
AC-S-TE3
D
TiC-CDC-2, (Ref. 47)Carbon aerogel, (Ref. 13)
Cu
mu
lati
ve
po
re v
olu
me (
mL
/g)
Pore size (nm)
TiC-CDC-1, (Ref. 47)
2 3 5 7 20
2 3 5 7 20207532
2 3 5 7 20
TiC-CDC
OM-SiC-CDC
Cu
mu
lati
ve
po
re v
olu
me (
mL
/g)
Pore size (nm)
HIPE-SiC-CDC
A B
C

Electronic Supplementary Information 5
Table S4 and S5 provide the input parameters that have been used to fit the equilibrium data with
the modified Donnan model (ref. 6).
Table S4. List of input parameter used to fit the modified Donnan model to equilibrium data of salt
electrosorption salt, and F.
Performance ratio PR Volumetric Stern layer capacitance at zero charge
Non-linearity of Stern capacity
Chemical attraction term
CSt,vol,0,(Ref) · PR (Ref)/PR att,(Ref)+ln(PR)
(-) (MF/m3) (F·m
3/mol
2) (kT)
TiC-CDC 2.0 144 25.0 2.7
HIPE SiC-CDC 1.0 72 50.0 2.0
OM SiC-CDC 0.666 48 33.3 1.6
Macroporosity “pmA” (i.e., interparticle porosity) and microporosity “pmi” (i.e., intraparticle porosity)
used to describe the dynamics of salt electrosorption and charge in porous carbon electrodes were
calculated according to
elec elec carbon carbon elec polymer polymer mi
mA
elec
d A m w m w Vp
d A
(S1)
elec elec carbon carbon elec polymer polymer mA
mi
elec
d A m w m w Vp
d A
(S2)
where delec and A stand for the thickness and exchange area of the electrode, melec , wcarbon, and wpolymer
are electrode mass and weight fractions of the carbons equal to 0.9 and polymer material (i.e.,
polymer binder added for mechanical stability) equals to 0.1. Next, ρcarbon and ρpolymer are densities of
the carbon, assumed to be constant and equal to 1.95 g/cm3 for all carbons investigated and for the
carbon black used in this study, and polymer, as provided by the supplier, equals 1.78 g/cm3. Finally,
Vmi is the volume of pores inside carbon (in transport theory called micropores), and VmA is the volume
of transport pathways outside the particles (called in transport theory macropores). For summary of all
the geometrical measures and calculated porosities, see Table S5.
Fig. S5. Equilibrium salt adsorption and charge in porous carbon electrodes prepared from OM SiC-
CDC. Lines represent fits using modified Donnan model with =33.3 F·m3/mol
2 (red line) and
=0 F·m3/mol
2 (blue dashed line).
0.0 0.2 0.4 0.6 0.8 1.0 1.2 1.40
5
10
15
20
CSt,vol,0
= 48.0 MF/m3
OM SiC-CDC
Sa
lt a
dso
rpti
on
(m
g/g
)
Cell voltage (V)
OM SiC-CDCA
B
CSt,vol,0
= 48.0 MF/m3
0.0 0.2 0.4 0.6 0.8 1.0 1.2 1.40
5
10
15
20
25
30
35
Ch
arg
e (
C/g
)
Cell voltage (V)
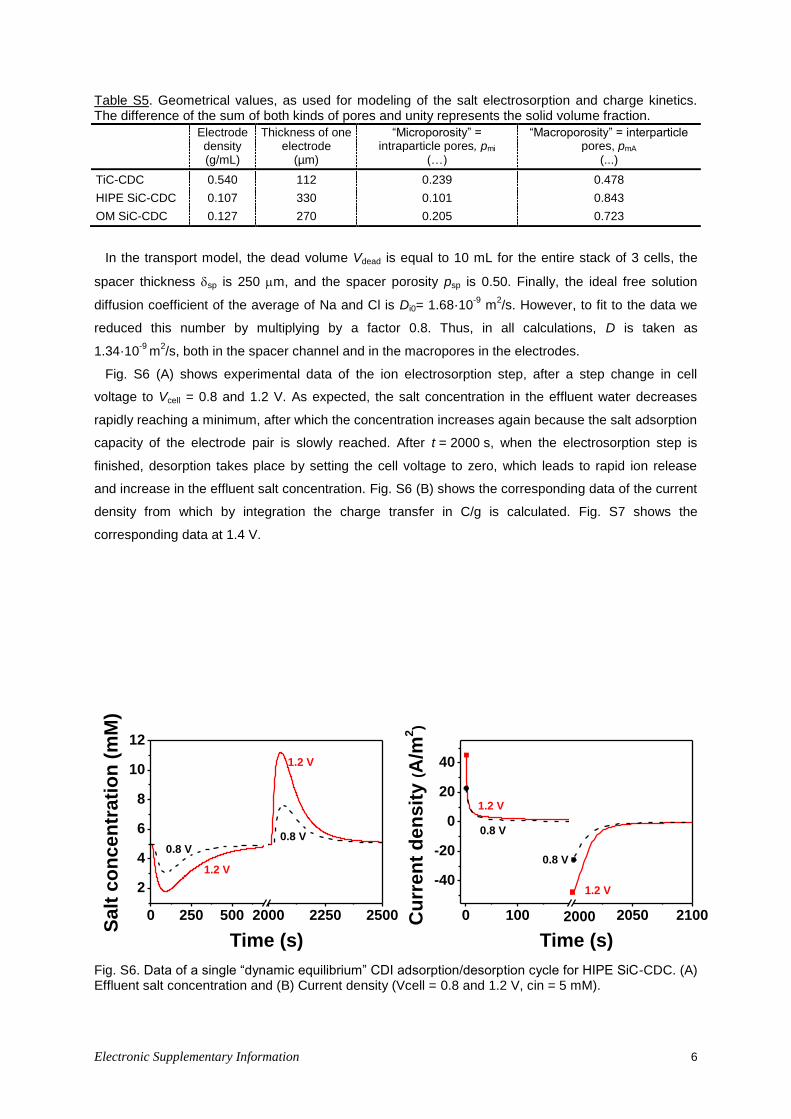
Electronic Supplementary Information 6
Table S5. Geometrical values, as used for modeling of the salt electrosorption and charge kinetics. The difference of the sum of both kinds of pores and unity represents the solid volume fraction.
Electrode density
Thickness of one electrode
“Microporosity” = intraparticle pores, pmi
“Macroporosity” = interparticle pores, pmA
(g/mL) (µm) (…) (...)
TiC-CDC 0.540 112 0.239 0.478
HIPE SiC-CDC 0.107 330 0.101 0.843
OM SiC-CDC 0.127 270 0.205 0.723
In the transport model, the dead volume Vdead is equal to 10 mL for the entire stack of 3 cells, the
spacer thickness sp is 250 m, and the spacer porosity psp is 0.50. Finally, the ideal free solution
diffusion coefficient of the average of Na and Cl is Di0= 1.68·10-9
m2/s. However, to fit to the data we
reduced this number by multiplying by a factor 0.8. Thus, in all calculations, D is taken as
1.34·10-9
m2/s, both in the spacer channel and in the macropores in the electrodes.
Fig. S6 (A) shows experimental data of the ion electrosorption step, after a step change in cell
voltage to Vcell = 0.8 and 1.2 V. As expected, the salt concentration in the effluent water decreases
rapidly reaching a minimum, after which the concentration increases again because the salt adsorption
capacity of the electrode pair is slowly reached. After t = 2000 s, when the electrosorption step is
finished, desorption takes place by setting the cell voltage to zero, which leads to rapid ion release
and increase in the effluent salt concentration. Fig. S6 (B) shows the corresponding data of the current
density from which by integration the charge transfer in C/g is calculated. Fig. S7 shows the
corresponding data at 1.4 V.
Fig. S6. Data of a single “dynamic equilibrium” CDI adsorption/desorption cycle for HIPE SiC-CDC. (A) Effluent salt concentration and (B) Current density (Vcell = 0.8 and 1.2 V, cin = 5 mM).
0 250 500 2000 2250 2500
2
4
6
8
10
12
0.8 V
1.2 V
1.2 V
0.8 V
1.2 V
1.2 V
0.8 V
Sa
lt c
on
ce
ntr
ati
on
(m
M)
Time (s)
0.8 V
0 100 2050 2100
-40
-20
0
20
40
Cu
rre
nt
de
ns
ity
(A
/m2)
Time (s)
2000

Electronic Supplementary Information 7
Fig. S7. Data of a single “dynamic equilibrium” CDI adsorption/desorption cycle for OM SiC-CDC. (A) Effluent salt concentration and (B) Current (Vcell = 1.4 V, cin = 5 mM).
4. Further Theory-Data Comparison Using Two-Dimensional Porous Electrode Theory
In this section we present further data and comparison with theory for the dynamics of salt
adsorption and charge formation for three CDC-materials and for two voltage levels, see Fig. S8.
5. Theoretical Section
5.1 Salt Electrosorption and Charge Storage in Porous Carbon
To describe the dynamics of salt electrosorption and charge in porous carbon electrodes forming a
CDI cell, we jointly consider ion transport through the space between the carbon particles, that is, the
large transport pathways across the electrode (interparticle pore volume), and the electrosorption of
ions inside carbon particles (intraparticle pore volume). To describe the latter, a powerful and elegant
approach is to assume that the EDLs inside the intraparticle pore volume are strongly overlapping and,
therefore, that the potential in these pores does not vary with position in the pore. This is the common
“Donnan” approach for charged porous materials. The electrical potential in the intraparticle pore
volume is different from that in the interparticle pore volume (the transport pathways) by a value d.
It has been recognized that the simple Donnan approach does not describe well various data sets
for salt electrosorption and charge in most microporous carbons, and two modifications are required.6-8
The first modification is to consider the presence of a charge-free Stern layer located in between the
electronic charge in the carbon matrix and the ions that reside in the water-filled intraparticle pore
volume. The second modification is to include a chemical attraction energy for the ion when it transfers
from the space between the carbon particles into the internal carbon pore volume, described by a term
att.9 Thus, in the modified Donnan model, we consider an additional, non-electrostatic, attraction for
the ion to enter the pores of carbon. This attraction term also reflects the experimental reality that
uncharged carbons also adsorb some salt.
The modified Donnan model containing these two modifications is described by the following
equations. First of all, the volumetric concentrations (in mM=mol/m3) of an arbitrary ion j in the pores
inside a carbon particle is given by
0 2000 4000 6000 80000
2
4
6
8
10
12
14
salt adsorption
16.1 mg/g
salt desorption
15.9 mg/g
salt desorption
15.5 mg/g
Salt
co
nc
en
trati
on
(m
M)
Time (s)
salt adsorption
15.9 mg/g
0 500 1000 1500 20000.01
0.1
1
10
Adsorption
Cu
rren
t d
en
sit
y (
A/m
2)
Time (s)
Desorption

Electronic Supplementary Information 8
j,mi mA j d attexpc c z (S3)
where “mi” stands for the pores inside the carbon (intraparticle space, in transport theory called
micropores), and mA for the transport pathways outside the particles (interparticle space, called
macropores). Note that except for the equations in the theory-section, in the remainder of this paper
we adhere to the IUPAC definition of pores,10
where the size of the pore, not the position (i.e., inside or
in between carbon) defines the differentiation between micropores, mesopores, and macropores.
Fig. S8. Salt adsorption and charge formation in CDI cell for (A) TiC-CDC; (B) OM SiC CDC, and (C) HIPE SiC-CDC as function of time (c∞= 5 mM NaCl inflow) and cell voltage. Lines represent comparison with 2D porous electrode theory.
0 200 400 600 8000
2
4
6
8
10
12
14
Salt a
dsorp
tion (
mg/g
)
Time (s)
A
0 200 400 6000
5
10
15
20
25
30TiC-CDCTiC-CDC
Vcell
= 1.2 V
cin= 5.0 mMc
in= 5.0 mM
Charg
e (
C/g
)
Time (s)
Vcell
= 1.0 V
Vcell
= 1.2 V
Vcell
= 1.0 V
0 200 400 600 8000
2
4
6
8
10
12
14
Salt a
dsorp
tion (
mg/g
)
Time (s)
B
C
0 200 400 600 8000
5
10
15
20
25
30OM SiC-CDCOM SiC-CDC V
cell= 1.2 V
cin= 5.0 mMc
in= 5.0 mM
Charg
e (
C/g
)
Time (s)
Vcell
= 1.0 V
Vcell
= 1.2 V
Vcell
= 1.0 V
0 200 400 600 8000
2
4
6
8
10
12
14
Salt a
dsorp
tion (
mg/g
)
Time (s)0 200 400 600
0
5
10
15
20
25
30HIPE SiC-CDCHIPE SiC-CDC
Vcell
= 1.2 V
cin= 5.0 mMc
in= 5.0 mM
Charg
e (
C/g
)
Time (s)
Vcell
= 1.0 V
Vcell
= 1.2 V
Vcell
= 1.0 V
0 200 400 600 8000
2
4
6
8
10
12
14
Salt a
dsorp
tion (
mg/g
)
Time (s)
A
0 200 400 6000
5
10
15
20
25
30TiC-CDCTiC-CDC
Vcell
= 1.2 V
cin= 5.0 mMc
in= 5.0 mM
Charg
e (
C/g
)
Time (s)
Vcell
= 1.0 V
Vcell
= 1.2 V
Vcell
= 1.0 V
0 200 400 600 8000
2
4
6
8
10
12
14
Salt a
dsorp
tion (
mg/g
)
Time (s)
B
C
0 200 400 600 8000
5
10
15
20
25
30OM SiC-CDCOM SiC-CDC V
cell= 1.2 V
cin= 5.0 mMc
in= 5.0 mM
Charg
e (
C/g
)
Time (s)
Vcell
= 1.0 V
Vcell
= 1.2 V
Vcell
= 1.0 V
0 200 400 600 8000
2
4
6
8
10
12
14
Salt a
dsorp
tion (
mg/g
)
Time (s)0 200 400 600
0
5
10
15
20
25
30HIPE SiC-CDCHIPE SiC-CDC
Vcell
= 1.2 V
cin= 5.0 mMc
in= 5.0 mM
Charg
e (
C/g
)
Time (s)
Vcell
= 1.0 V
Vcell
= 1.2 V
Vcell
= 1.0 V
0 200 400 600 8000
2
4
6
8
10
12
14
Salt a
dsorp
tio
n (
mg/g
)
Time (s)
A
0 200 400 6000
5
10
15
20
25
30TiC-CDCTiC-CDC
Vcell
= 1.2 V
cin= 5.0 mMc
in= 5.0 mM
Charg
e (
C/g
)
Time (s)
Vcell
= 1.0 V
Vcell
= 1.2 V
Vcell
= 1.0 V
0 200 400 600 8000
2
4
6
8
10
12
14
Salt a
dsorp
tion (
mg/g
)
Time (s)
B
C
0 200 400 600 8000
5
10
15
20
25
30OM SiC-CDCOM SiC-CDC V
cell= 1.2 V
cin= 5.0 mMc
in= 5.0 mM
Charg
e (
C/g
)
Time (s)
Vcell
= 1.0 V
Vcell
= 1.2 V
Vcell
= 1.0 V
0 200 400 600 8000
2
4
6
8
10
12
14
Salt a
dsorp
tion (
mg/g
)
Time (s)0 200 400 600
0
5
10
15
20
25
30HIPE SiC-CDCHIPE SiC-CDC
Vcell
= 1.2 V
cin= 5.0 mMc
in= 5.0 mM
Charg
e (
C/g
)
Time (s)
Vcell
= 1.0 V
Vcell
= 1.2 V
Vcell
= 1.0 V

Electronic Supplementary Information 9
Considering only a monovalent salt solution, in the interparticle pores (the space within the electrode
located between carbon particles), the anion and cation concentrations are equal because of local
electroneutrality. Hence, cj,mA can be replaced by the corresponding salt concentration, cmA, which will
be a function of time, t (in seconds), and position x (in m) within the electrode, and cj,mi is a function of t
and x. In Eq. S3, zj equals +1 for the cation and -1 for the anion, while d is the dimensionless
Donnan electrostatic potential difference between the pores inside and in between the particles which
can be multiplied by the thermal voltage, VT = R·T/F ≈ 25.7 mV, to obtain a voltage with unit Volt.
Summing up Eq. S3 for both ions directly gives the total ion density in the pores inside a carbon
particle as
ions,mi cation,mi anion,mi mA att d2 exp coshc c c c (S4)
and though it is possible to consider a different att for anions and cations, in the present work we will
assume that they are the same.
The local ionic charge density, ccharge,mi, in the pores inside a porous carbon particle follows from
Eq. S3 as
charge,mi cation,mi anion,mi mA att d2 exp sinhc c c c (S5)
and this volumetric charge density (in mM) relates to the Stern layer potential difference, St,
according to
charge,mi St,vol St T /c C V F (S6)
where CSt,vol is a volumetric Stern layer capacity in F/m3. Note that capital C with subscript “St,vol” is a
volumetric Stern layer capacity in F/m3, and small c with subscript “charge,mi”, “mA”, “j,mi” is a
concentration in mM. For CSt,vol we use the expression
2
St,vol St,vol,0 charge,miC C c (S7)
where the second, empirical, term reflects the experimental observation from previous work that the
Stern layer capacity goes up quadratically with micropore charge, see also section 5.3.6, 11
The modified Donnan model equals the limit situation of the Gouy-Chapman-Stern (GCS) theory
when approaching full EDL overlap in micropores where the Debye length is of the order of, or larger
than, the pore size. In addition to GCS theory it includes a non-electrostatic adsorption energy att. A
difference is that in the Donnan representation EDL properties are described per unit pore volume,
whereas in the GCS model charge and salt adsorption are described as function of pore area.
Numbers in either definition can be converted when the pore area/volume ratio is known.
5.2 Two-Dimensional Theory for Transport and Ion Storage in Porous Electrodes
In this paper, we utilize a novel two-dimensional model for transport and storage of ions and
electrical charge in a CDI cell consisting of two porous electrodes placed parallel, with a flat planar slit,
or transport channel, or spacer, in between. In the direction of flow, this transport channel is
mathematically divided into M subsequent sub-cells, see Fig. 2.12
In the following section, we first
focus on a single sub-cell, and describe ion transport in the perpendicular direction, from electrode to
electrode. Next we describe how all sub-cells are combined together in a unified model for the full CDI
system. We focus on a monovalent salt solution, assuming that the two ion diffusion coefficients are

Electronic Supplementary Information 10
equal (as for KCl). Note that this is an effective diffusion coefficient for transport in the pores between
the porous carbon particles that may include a contribution of pore tortuosity. Extensions to mixtures
with ions of different diffusion coefficients (as must formally also be considered for NaCl) are described
in ref. 13, 14.
In the porous electrode transport model, two coupled partial differential equations must be solved
along with additional algebraic equations.14-16
The complete model contains, as a function of the depth
in the electrode x, and time t, four coupled variables: (1) the salt concentration in the pores between
carbon particles, cmA, (2) the electrostatic potential, mA, (3) the charge density in pores inside the
carbon particles, ccharge,mi, and (4) the net salt electrosorption in such internal pores. The latter variable
will be described by the effective salt concentration, ceff, which is a summation of the total ion
concentration times volume fraction, in the macropores and in the micropores (at location x), which we
have to divide by a factor of 2 to obtain a salt concentration defined per unit total electrode volume.
The effective salt concentration is thus given by
1eff mA mA mi ions,mi2
c p c p c (S8)
where pj is a porosity (volume fraction) defined per total electrode volume. The summation of pmi+pmA
is not equal to one, and the difference is made up of the solid matter in the electrode, such as the
polymeric binder, the skeleton of porous carbon itself, and any other solid component of the carbon
electrode such as conductive additives, see Table S6.
The porous electrode transport theory requires various geometrical measures as inputs (thickness,
porosities) that can be calculated from known electrode dimensions. Besides, it requires an estimate
of the diffusion coefficient of the ions in the macropores, which may be lower than the corresponding
value in free solution. There are no other fitting functions related to transport part of the theory. The
present model neglects a transport resistance between macropores and micropores, which can be
incorporated, but will require an additional transport coefficient, see the section 5.3.
Note that the four variables for which the model is solved (i.e., cmA, mA, ccharge,mi and ceff) depend all
on depth x and time t. It is only after sufficient time that all these variables level off to their equilibrium
value, when all time derivatives become zero. This equilibrium situation can also be described directly
by considering that after sufficient time (after application of a voltage signal), everywhere the
macropore concentration cmA has become the same as the inflow salt concentration c0. Then, using
the modified Donnan model, we can directly calculate the equilibrium situation without having to solve
the full porous electrode transport model.
The spacer channel between the two electrodes is described in the model by a series of
continuously stirred tanks (sub-cells) with a salt concentration csp that is only a function of time,
described by the salt mass balance
sp
sp sub-cell ions v sp,in sp
cp V J A c c
t
(S9)
where Vsub-cell (in m3) is the geometrical volume of the sub-cell, psp is the open porosity of the spacer
channel, A the exchange area of a sub-cell with one electrode (in m2), and v the water volumetric flow
rate running through the cell, i.e., along the electrodes (in m3/s). We assume that the two electrodes

Electronic Supplementary Information 11
behave symmetrically, and as a consequence the ion flux to one electrode, Jions, is equal to the salt
flux to both electrodes.8
In addition to the salt mass balance in the spacer channel, we have to specify two coupled partial
differential equations that describe the transport in the porous electrode. First, within the electrode, a
differential salt mass balance can be set up, given by
2
eff mAmA 2
c cp D
t x
(S10)
with 0<x<Lelec, where Lelec is the electrode thickness, and D the salt diffusion coefficient in the pores
between porous carbon particles. As Eq. S10 shows, we consider all fluxes to be in only one direction,
namely the direction into the electrode, i.e., at cross-angles with the general flow direction of the
solution through the channel, see Fig. 2.
The second partial differential equation describes the charge density in the intraparticle pores of
carbon particles and is given by
charge,mi mAmi mA mA2
cp p D c
t x x
. (S11)
Finally, we need to solve at each position in the electrodes two algebraic equations: (1) Eq. S8; and
(2) the equation for the potential mA that is related to the potential 1 in the carbon matrix according to
d St 1 mA (S12)
with expressions for d and St given by Eqs. S5, S6, and S7.
Boundary conditions required to solve the two partial differential equations are as follows. First of all,
at the backside of the electrode (x=Lelec), we have cmA/x=0 and mA/x=0. At the front-side (where
x=0), the spacer channel concentration, csp, is equal to that in the electrode, cmA. The potential
gradient at x=0 relates to the current J, a relation which will be discussed below.
Initial conditions are as follows. At time zero, we have a certain value for cmA (the same everywhere,
also the same as in the spacer channel). With ccharge,mi=0 everywhere in the electrode, we can use
Eq. S4 and S8 to determine ceff at time zero.
To calculate voltages and currents after time zero, we must consider the overall cell voltage
relationship. Namely, in the experiment we apply a voltage, Vcell, between the two electrodes. As
explained above (see also Fig. 2) we assume symmetry in the CDI cell, and thus at time zero we make
a step-change in applied voltage from zero to ½Vcell, which is the voltage between the mid-plane in
the spacer channel and that in the carbon matrix, 1, in one of the electrodes. Note that Vcell has unit of
Volt and must be divided by the thermal voltage, VT, to obtain a dimensionless potential, . In the
carbon matrix, we assume a constant potential 1 and thus we neglect possible electrical resistances
in the carbon; in the current collectors; or in the connecting wires. This assumption is not so common
in EDLC modeling, but note that in desalination the electrolyte salt concentration is typically 5 to
50 mM, much lower than the values of the order of 1 M used in EDLCs. Consequently, in CDI the ionic
resistance is much more prominent than the electrical resistances for electronic charge to distribute
across the electrode.

Electronic Supplementary Information 12
The condition of applied voltage translates directly into a relation for the potential mA at the front-
side of the electrode (where x=0), according to
cellmA sp0
T2x
V
V (S13)
with the voltage drop across half the spacer, sp, obtained from
sp
sp sp
sp
2/ 2
J c p DL
(S14)
where J is the current density (in mol/m2/s). Multiplying by the electrode area and by F we get a
current in Ampere (note the difference between J and Jions). The ions flux, Jions, directed out of the
spacer channel, Eq. S9, is equal to the flux into the electrode
mAions mA
0
2x
cJ p D
x
(S15)
and a similar boundary condition for the current density J is given by
mA mA
0
2x
J p D cx
. (S16)
In our model we consider a number of M=6 sub-cells placed sequentially in the direction of flow
along the electrode, to describe the approximate plug-flow behavior of our system where salt and fluid
are transported convectively downstream. By using a finite number of sub-cells, longitudinal dispersion
is included. Note that in the model each sub-cell’s electrode region is disconnected from neighboring
ones. Transport from one spacer channel sub-cell to the next is described by Eq. S9, with csp the
concentration in sub-cell i and csp,in the concentration in the up-stream sub-cell i-1. The concentration
in the last sub-cell (i=M) is equal to the effluent concentration. The sub-cell volume is equal to the total
cell volume (height x electrode area) divided by the number of sub-cells, M. A small mixing volume
present in the CDI unit before the conductivity sensor, is modeled using Eq. S0, with Vsub-cell replaced
by V “dead volume”, with psp=1 and with the term JionsA set to zero. The current I (in A) in the stack is
calculated from I= F·N/M·iJi, where i is a summation over all sub-cells. Current I can be integrated
over time to obtain the charge. Dividing by electrode mass gives us the charge per gram, F, as
plotted in Fig. 5B, 7B, and 8B.
5.3 Assumptions made in the Modified-Donnan-Based Porous Electrode Theory
The porous transport theory as described in sections 5.1 and 5.2 and used in Fig. 7 and 8 is based
on various assumptions which are listed below:
Ion transport is based on the Nernst-Planck equation for electrodiffusion which assumes ideal
statistics (all activity coefficients equal to one) for ions as point charges moving in a mean electrical
field. We assume the diffusion coefficient to be constant.
Across the spacer channel we assume that concentration gradients are negligible, and thus
the voltage drop across the spacer channel can be described by a simple voltage-current relation.
We describe transport in the spacer channel in longitudinal direction (along the electrodes) by
assuming a series of subsequent stirred-tanks (“sub-cells”). By taking a fairly high number of these
subcells, we approximate plug-flow behavior with superimposed effects of longitudinal dispersion. This
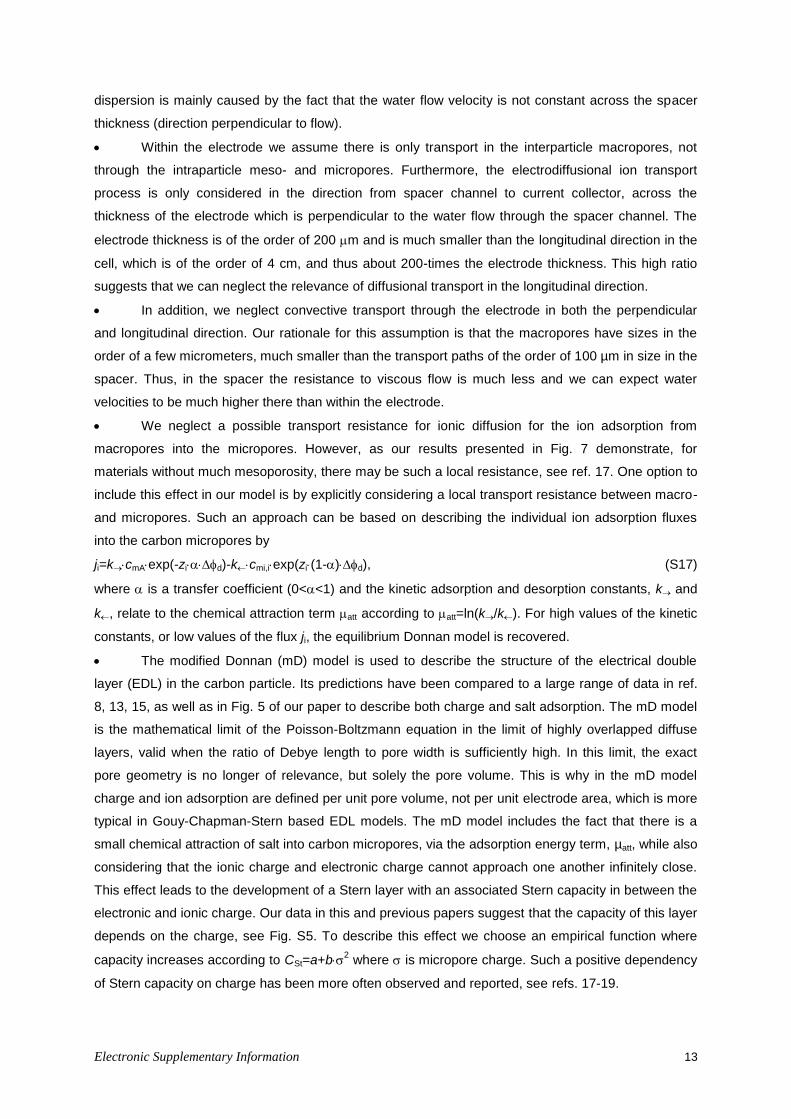
Electronic Supplementary Information 13
dispersion is mainly caused by the fact that the water flow velocity is not constant across the spacer
thickness (direction perpendicular to flow).
Within the electrode we assume there is only transport in the interparticle macropores, not
through the intraparticle meso- and micropores. Furthermore, the electrodiffusional ion transport
process is only considered in the direction from spacer channel to current collector, across the
thickness of the electrode which is perpendicular to the water flow through the spacer channel. The
electrode thickness is of the order of 200 m and is much smaller than the longitudinal direction in the
cell, which is of the order of 4 cm, and thus about 200-times the electrode thickness. This high ratio
suggests that we can neglect the relevance of diffusional transport in the longitudinal direction.
In addition, we neglect convective transport through the electrode in both the perpendicular
and longitudinal direction. Our rationale for this assumption is that the macropores have sizes in the
order of a few micrometers, much smaller than the transport paths of the order of 100 µm in size in the
spacer. Thus, in the spacer the resistance to viscous flow is much less and we can expect water
velocities to be much higher there than within the electrode.
We neglect a possible transport resistance for ionic diffusion for the ion adsorption from
macropores into the micropores. However, as our results presented in Fig. 7 demonstrate, for
materials without much mesoporosity, there may be such a local resistance, see ref. 17. One option to
include this effect in our model is by explicitly considering a local transport resistance between macro-
and micropores. Such an approach can be based on describing the individual ion adsorption fluxes
into the carbon micropores by
ji=kcmAexp(-zid)-kcmi,iexp(zi(1-)d), (S17)
where is a transfer coefficient (0<<1) and the kinetic adsorption and desorption constants, k and
k, relate to the chemical attraction term att according to att=ln(k/k). For high values of the kinetic
constants, or low values of the flux ji, the equilibrium Donnan model is recovered.
The modified Donnan (mD) model is used to describe the structure of the electrical double
layer (EDL) in the carbon particle. Its predictions have been compared to a large range of data in ref.
8, 13, 15, as well as in Fig. 5 of our paper to describe both charge and salt adsorption. The mD model
is the mathematical limit of the Poisson-Boltzmann equation in the limit of highly overlapped diffuse
layers, valid when the ratio of Debye length to pore width is sufficiently high. In this limit, the exact
pore geometry is no longer of relevance, but solely the pore volume. This is why in the mD model
charge and ion adsorption are defined per unit pore volume, not per unit electrode area, which is more
typical in Gouy-Chapman-Stern based EDL models. The mD model includes the fact that there is a
small chemical attraction of salt into carbon micropores, via the adsorption energy term, µatt, while also
considering that the ionic charge and electronic charge cannot approach one another infinitely close.
This effect leads to the development of a Stern layer with an associated Stern capacity in between the
electronic and ionic charge. Our data in this and previous papers suggest that the capacity of this layer
depends on the charge, see Fig. S5. To describe this effect we choose an empirical function where
capacity increases according to CSt=a+b2 where is micropore charge. Such a positive dependency
of Stern capacity on charge has been more often observed and reported, see refs. 17-19.

Electronic Supplementary Information 14
6. Experimental Section
6.1 CDC Materials
Titanium carbide-derived carbon (TiC-CDC) was synthesized according to Ref. 20 (Fig. 3A). In a
quartz tube furnace (diameter: 25 mm, GERO GmbH, Germany), TiC powder (Sigma Aldrich,
Germany, particle size ≈5 µm) was heated to 600 °C in Argon (100 mL/min), then subjected to thermal
treatment at 600 °C in dry chlorine gas (chlorine flow rate: 80 mL/min mixed with 70 mL/min argon) for
6 h. Then, after 1 h at 600°C in flowing argon (150 mL/min), the sample was subjected to hydrogen
treatment (80 mL/min) for 30 minutes to remove residual chlorine and metal chloride species.
Ordered mesoporous silicon carbide derived carbon (OM SiC-CDC) was synthesized according to
the procedure outlined in ref. 20 (Fig. 3B). A SiC polymer precursor, 6.45 g of polycarbosilane
(StarPCSTM
SMP-10, Starfire Systems), and 1.61 mL of para-divinylbenzene (Sigma Aldrich, 80%
mixture of isomers) were drop-wise added to 6.0 g of ordered mesoporous silica (SBA-15, synthesized
according to ref. 21 and thoroughly mixed. Afterwards, the obtained mixture was evacuated over night
at room temperature to obtain a homogeneous and complete pore filling. The pre-ceramic composite
system was then pyrolyzed at 800 °C. Ordered mesoporous silicon carbide was obtained by removing
the silica template via etching with hydrofluoric acid (33% water, 33% ethanol, and 33% of 40 mass%
HF) for 3 h. The resulting OM SiC-CDC was derived after chlorine treatment of the ordered
mesoporous silicon carbide materials at 800 °C. The material was heated in a quartz boat inside a
quartz tube (inner tube diameter: 25 mm) in a horizontal tubular furnace (GERO GmbH) in 70 mL/min
argon flow to the desired temperature (450 K/h). Subsequently, Cl2 gas was introduced for 3 h (80
mL/min flow) while the argon flow was maintained at the same level. After that time, the Cl2 gas flow
was stopped and the sample was cooled down to room temperature in flowing argon. Residual
chlorine and metal chlorides trapped in the carbon pores were subsequently removed in flowing
hydrogen. For that the material was heated in a quartz boat inside quartz tube in horizontal tubular
furnace in 80 mL/min H2 flow to 600 °C for 2 h (300 K/h).
HIPE SiC-CDC was synthesized according to ref. 1 (Fig. 3C). 4.37 g of SMP-10 (Starfire Systems)
was mixed with 1.71 g of divinylbenzene (Sigma Aldrich, 80% mixture of isomers) under mild stirring to
form the organic phase of the high internal phase emulsion (HIPE) with a volume of 6.25 mL including
30 vol% of the crosslinker. The resulting mixture was blended with 2.13 g of the nonionic surfactant
SpanTM
80 (Fluka, Switzerland). After one minute, 346 mg K2S2O8 (Fluka) dissolved in 18.75 mL
distilled water was added drop wise to the organic phase by continuously rising up the stirring rate in
order to ensure a homogeneous commingling of the phases. The resulting emulsion was then treated
at 80 °C for 24 h. The removal of the surfactant was achieved by soxhlet extraction with a mixture of
MeOH/water (30/70) for 24 h resulting in what we refer to as Poly-HIPE. After drying at 80 °C, the
monolithic pieces of the Poly-HIPE were pyrolyzed in a horizontal alumina furnace under flowing argon
at 700 °C for 2 h with a heating rate of 1 K/min. The obtained SiC monoliths were converted to carbon
by thermal chlorine treatment. 2 g of the starting material were placed in a quartz boat inside a quartz
tube in a horizontal tubular furnace and heated up to 700 °C with a rate of 450 K/h under an argon
flow of 150 mL/min. Then, the gas flow was changed to a mixture of 80 mL/min chlorine and 70
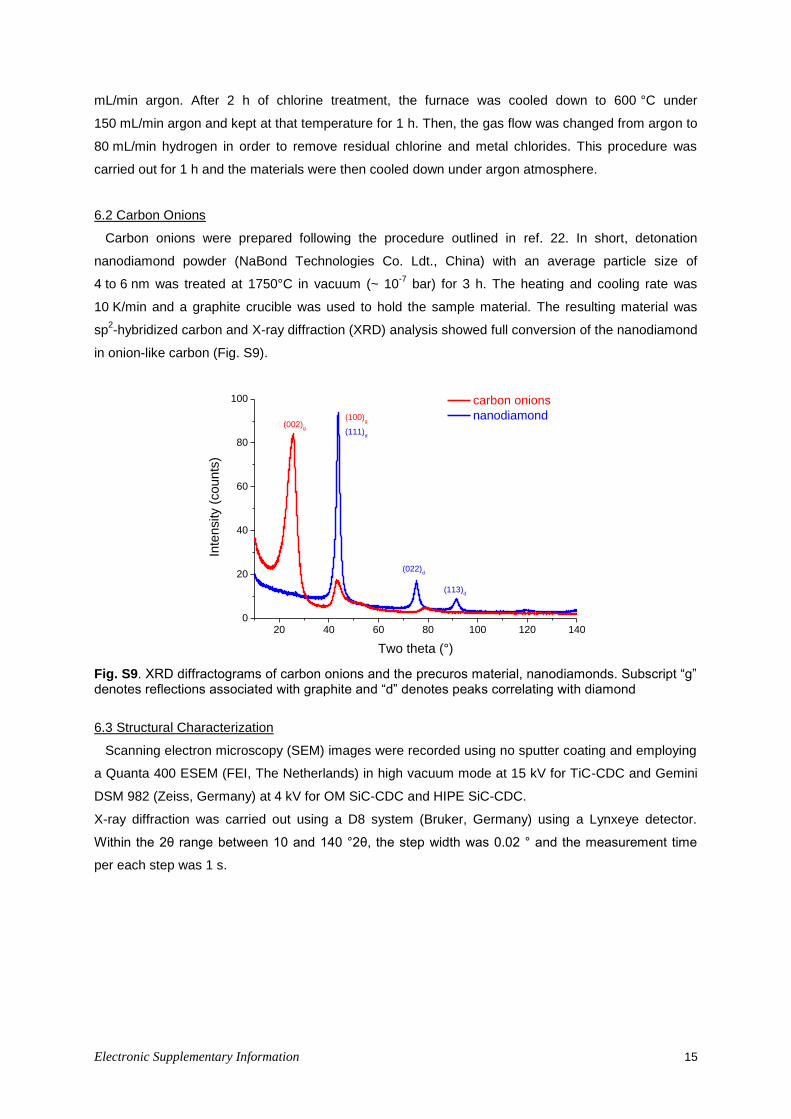
Electronic Supplementary Information 15
mL/min argon. After 2 h of chlorine treatment, the furnace was cooled down to 600 °C under
150 mL/min argon and kept at that temperature for 1 h. Then, the gas flow was changed from argon to
80 mL/min hydrogen in order to remove residual chlorine and metal chlorides. This procedure was
carried out for 1 h and the materials were then cooled down under argon atmosphere.
6.2 Carbon Onions
Carbon onions were prepared following the procedure outlined in ref. 22. In short, detonation
nanodiamond powder (NaBond Technologies Co. Ldt., China) with an average particle size of
4 to 6 nm was treated at 1750°C in vacuum (~ 10-7
bar) for 3 h. The heating and cooling rate was
10 K/min and a graphite crucible was used to hold the sample material. The resulting material was
sp2-hybridized carbon and X-ray diffraction (XRD) analysis showed full conversion of the nanodiamond
in onion-like carbon (Fig. S9).
Fig. S9. XRD diffractograms of carbon onions and the precuros material, nanodiamonds. Subscript “g” denotes reflections associated with graphite and “d” denotes peaks correlating with diamond
6.3 Structural Characterization
Scanning electron microscopy (SEM) images were recorded using no sputter coating and employing
a Quanta 400 ESEM (FEI, The Netherlands) in high vacuum mode at 15 kV for TiC-CDC and Gemini
DSM 982 (Zeiss, Germany) at 4 kV for OM SiC-CDC and HIPE SiC-CDC.
X-ray diffraction was carried out using a D8 system (Bruker, Germany) using a Lynxeye detector.
Within the 2θ range between 10 and 140 °2θ, the step width was 0.02 ° and the measurement time
per each step was 1 s.
20 40 60 80 100 120 1400
20
40
60
80
100
Inte
nsity (
co
un
ts)
Two theta (°)
carbon onions
nanodiamond(002)
g
(100)g
(111)d
(022)d
(113)d
Electronic Supplementary Information 16
Prior to all gas sorption measurements, the samples were kept under vacuum (1 mbar) at 150 °C for
16 h. The porosity was analyzed using N2 gas sorption at -196 °C up to 1 bar using an Autosorb iQ MP
(Quantachrome Instruments, Germany). BET SSA values were calculated using the multipoint-BET
method23
in the linear range from 0.01-0.20 P/P0. Total pore volumes were derived from the
cumulative pore volume using the quenched solid density functional theory (QSDFT), and does not
include the HIPE SiC-CDC macropores.2 For HIPE SiC-CDC, and OM SiC-CDC a mixed model
assuming slit and cylindrical pores was assumed, while for TiC-CDC only slit-shaped pores were
considered. Slit shaped pores were also assumed for the analysis of all activated carbons. For all pore
size distributions (PSDs), only the adsorption branch was used to eliminate the emergence of
desorption-related artifacts.
6.4 Electrode Preparation
Electrodes were prepared following the procedure outlined in ref. 6, except that now the electrodes
were directly coated on the graphite foil current collector. First, a carbon slurry was prepared by mixing
85 mass% of CDC, 5 mass% of carbon black (Vulcan XC72R, Cabot Corp., Boston, MA), and 10
mass% of polyvinylidene fluoride (Kynar HSV 900, Arkema Inc., Philadelphia, PA); the latter had been
dissolved in N-methyl-2-pyrrolidone. To obtain a homogeneous mixture, the slurry was de-aerated and
stored at 50 °C for 1 h. Finally, electrodes were prepared by painting of the carbon slurry directly on
one or both sides of a graphite current collector, taking care that approximately the same mass was
coated on each side. The current-collector/electrode assemblies are then left for drying at room
temperature. Results for thickness and total electrode mass density provided in Table S5. Materials
AC-CWZ-22, AC-S-TE3, AC-S-TE11, and AC-MSP20 were not painted, but prepared by the wet-
casting technique following procedure explained in ref. 6.

Electronic Supplementary Information 17
6.5 CDI Experiments
Experimental details of the CDI test system have been described in ref. 6, 8. In brief, a stack
consisting of N = 3 cells is built from electrodes, current collectors, and spacers. Each current collector
is coated on both sides with a layer of 6x6 cm2 of the carbon electrode and is used in two adjacent
cells (one above, and one below). The two current collectors at the upper and lower end of the stack
only have a single layer of electrode coating. Together with open-meshed porous spacer materials
(Glass fibre prefilter; Millipore, Ireland; thickness sp=350 m) the current collector/electrode layers are
stacked together forming three parallel cells (i.e., one stack). The flow of salt solution through the
stack is kept constant at =10 mL/min. The solution flows first into a housing around the stack, enters
the N spacer layers from all four sides, and leaves via a centrally placed outlet (1.5x1.5 cm2 channel)
to flow along a conductivity meter placed in-line.
Ion electrosorption occurs when applying a voltage Vcell to the cell, defined as the voltage difference
between the positively and negatively polarized electrodes. In our experiments, no reference
electrodes are included. At the end of the salt electrosorption step, the cell voltage is reduced to zero
and ion desorption begins. The electrical current running from the cathode to the anode is measured
online by a potentiostat (Autolab, PGSTST30, The Netherlands) and is integrated over time to provide
a measure for the total charge transferred between the electrodes. This total charge is divided by the
total electrode mass in the stack, mtot, to obtain the charge expressed in C/g, see Figs. 5C, 7A, and
8A.
Parallel to the charge transfer measurements, the electrical conductivity of the effluent is measured
and this value is used to calculate the effluent salt concentration and, thus, the salt removal, salt, see
ref. 6. The latter is calculated by integrating the difference between the inflow (cin) and outflow salt
concentration (ceff) over time, multiplying by the flow rate and dividing by mtot, see Figs. 5D, 7B, and
8B. For each new experiment, the salt electrosorption/desorption cycle was repeated several times
until the differences between cycles became negligible. We like to stress that in this work, the salt
removal data is not obtained from the first cycle after a new condition has been applied, but instead is
obtained when the system has reached the limit cycle, or dynamic equilibrium (DE). This important
condition defines that the same amount of salt was electrosorbed during the adsorption step as was
being removed in the desorption step of the cycle, as will be typical during practical long-term
operation of a CDI system. All experiments were done using a cin = 5 mM NaCl-solution (290 ppm, 550
µS/cm). The pH value of the feed solution was maintained constant at pH 7.5 during testing by
automatic addition of small amounts of 0.1 M hydrochloric acid or 0.1 M sodium hydroxide to the 10 L
storage vessel from which the CDI-stack was fed and to which the effluent was returned. The vessel is
continuously flushed with N2 gas to purge the water from dissolved oxygen. Note that we do not
measure the conductivity decrease in this storage vessel, but in the exit tube right after the water
leaves the stack, before being returned to the storage vessel. This is why after application of a cell
voltage, the salinity first decreases and then goes up again, even though the voltage is still applied.

Electronic Supplementary Information 18
References
1. M. Oschatz, L. Borchardt, M. Thommes, K. A. Cychosz, I. Senkovska, N. Klein, R. Frind, M.
Leistner, V. Presser, Y. Gogotsi and S. Kaskel, Angewandte Chemie International Edition, 2012,
51, 7577-7580.
2. P. I. Ravikovitch and A. V. Neimark, Langmuir, 2006, 22, 11171-11179.
3. K. Dai, L. Shi, J. Fang, D. Zhang and B. Yu, Materials Letters, 2005, 59, 1989-1992.
4. J. Landon, X. Gao, B. Kulengowski, J. K. Neathery and K. Liu, Journal of the Electrochemical
Society, 2012, 159, A1861-A1866.
5. M. E. Suss, T. F. Baumann, W. L. Bourcier, C. M. Spadaccini, K. A. Rose, J. G. Santiago and M.
Stadermann, Energy & Environmental Science, 2012, 5, 9511-9519.
6. S. Porada, L. Weinstein, R. Dash, A. van der Wal, M. Bryjak, Y. Gogotsi and P. M. Biesheuvel,
ACS Applied Materials & Interfaces, 2012, 4, 1194-1199.
7. P. M. Biesheuvel, R. Zhao, S. Porada and A. van der Wal, Journal of Colloid and Interface Science
2011, 360, 239-248.
8. S. Porada, M. Bryjak, A. van der Wal and P. M. Biesheuvel, Electrochimica Acta, 2012, 75, 148-
156.
9. B. Kastening and M. Heins, Electrochimica Acta, 2005, 50, 2487-2498.
10. K. S. W. Sing, D. H. Everett, R. A. V. Haul, L. Moscou, R. A. Pierotti, J. Rouquerol and T.
Siemieniewska, Pure and Applied Chemistry, 1985, 57, 603-619.
11. S. Porada, B. B. Sales, H. V. M. Hamelers and P. M. Biesheuvel, The Journal of Physical
Chemistry Letters, 2012, 3, 1613-1618.
12. R. Zhao, O. Satpradit, H. H. M. Rijnaarts, P. M. Biesheuvel and A. van der Wal, Water Research,
2013, 47, 1941-1952.
13. R. Zhao, M. van Soestbergen, H. H. M. Rijnaarts, A. van der Wal, M. Z. Bazant and P. M.
Biesheuvel, Journal of Colloid and Interface Science, 2012, 384, 38-44.
14. P. M. Biesheuvel, Y. Fu and M. Z. Bazant, Russian Journal of Electrochemistry, 2012, 48, 580-592.
15. R. A. Rica, D. Brogioli, R. Ziano, D. Salerno and F. Mantegazza, The Journal of Physical Chemistry
C, 2012, 116, 16934–16938.
16. R. A. Rica, R. Ziano, D. Salerno, F. Mantegazza, M. Z. Bazant and D. Brogioli, Electrochimica
Acta, 2013, 92, 304– 314.
17. R. K. Kalluri, M. M. Biener, M. E. Suss, M. D. Merrill, M. Stadermann, J. G. Santiago, T. F.
Baumann, J. Biener and A. Striolo, Physical Chemistry Chemical Physics, 2013, 15, 2309-2320.
18. D. C. Grahame, Chemical Reviews, 1947, 41, 441-501.
19. M. Z. Bazant, K. T. Chu and B. J. Bayly, SIAM Journal on Applied Mathematics, 2005, 65, 1463-
1484.
20. E. Kockrick, C. Schrage, L. Borchardt, N. Klein, M. Rose, I. Senkovska and S. Kaskel, Carbon,
2010, 48, 1707-1717.
21. M. Choi, W. Heo, F. Kleitz and R. Ryoo, Chemical Communications, 2003, 1340-1341.
22. J. K. McDonough, A. I. Frolov, V. Presser, J. Niu, C. H. Miller, T. Ubieto, M. V. Fedorov and Y.
Gogotsi, Carbon, 2012, 50, 3298–3309.
23. British Standards, BS ISO 9277 Determination of the specific surface area of solids by gas
adsorption - BET method, 2010.
Related Documents