1034 IEEE TRANSACTIONS ON POWER DELIVERY, VOL. 18, NO. 3, JULY2003 Direct Harmonic Analysis of the Voltage Source Converter Peter W. Lehn, Member, IEEE Abstract—An analytic technique is presented for the calculation of both characteristic and uncharacteristic harmonics in voltage source converter circuits. The proposed technique accounts for all harmonic interaction between the ac and dc sides of the converter, and may thus also be employed for accurate dc side voltage ripple calculations. In contrast to simulation-based approaches or itera- tive methods, the proposed technique offers a closed form solution for the current harmonics, thereby avoiding numerical errors and convergence problems. The technique is applied to the harmonic analysis of a STATCOM. Index Terms—FACTS, harmonic analysis, pulsewidth modula- tion, STATCOM. I. INTRODUCTION T HE INTRODUCTION of VSC-based FACTS equipment to a power system offers the potential to improve con- trol of power flow and enhance system stability. As with any VSC application, converter-based FACTS equipment will act as a source of harmonic current injection to the system and it will also interact with harmonic distortions already present within the system. In order to prevent harmonic instability of the system and to appropriately rate the components of the VSC, an improved understanding of these harmonic interactions must be developed. Two established techniques exist for performing an approxi- mate analysis of the behavior of FACTS components at frequen- cies away from the fundamental. In [1], [2], the modeling of a converter under unbalanced operating conditions is carried out by representing switching functions by their Fourier Spectra. It- erative techniques can then be applied to perform a harmonic balance. This approach has the potential to offer an accurate so- lution, accounting for all harmonics and harmonic interactions within the system; however, the complexity in the approach in- creases rapidly with the number of harmonics being considered. Furthermore, this approach requires an iterative solution tech- nique to be employed, which requires convergence conditions to be met. An alternate type of approach is presented in [3], [4], and [5] where -frame converter models are employed as a basis for analyzing the converter. These techniques are more straight- forward than those which model the switching functions, but they are bandwidth limited and not capable of modeling har- Manuscript received September 25, 2002. The author is with the Department of Electrical and Computer Engi- neering, University of Toronto, Toronto, ON M5S 3G4, Canada (e-mail: [email protected]). Digital Object Identifier 10.1109/TPWRD.2003.813603 Fig. 1. VSC circuit. monic sidebands introduced around the carrier frequency of the pulsewidth modulator. This paper presents a direct analytical method to calculate the harmonics in a VSC circuit. Balanced and unbalanced operating conditions are considered where unbalance may stem from ei- ther system voltage or converter firing unbalance. The presented technique calculates all characteristic and uncharacteristic har- monics of the converter, accounting for all harmonic coupling through the dc link of the converter. The technique may be used to analyze the harmonic response of any VSC-based equip- ment including FACTS components such as the STATCOM and SSSC. Straightforward extensions to the technique permits ap- plication to multiterminal VSC-based FACTS equipment such as the UPFC or IPFC. The paper is divided into five main sections. First, the con- cept of space vector-based harmonic analysis is presented with the help of a simple example, assuming a ripple free dc bus. Second, using space vector concepts, an analytical solution is developed for complete harmonic analysis of a converter, in- cluding all ac-dc side interactions. Next, the proposed technique is validated against PSCAD/EMTDC simulation results and the computational benefits of implementing the technique are as- sessed. Finally, a complete harmonic analysis of a STATCOM is carried out to demonstrate one possible application of the pro- posed theory. II. SPACE VECTOR HARMONIC ANALYSIS Consider the converter of Fig. 1 operating under sinusoidal pulsewidth modulation (SPWM). For proper SPWM operation, the carrier frequency of the modulator is an odd multiple of three times the fundamental system frequency [6]. Thus (1) Fig. 2 shows the phase system voltage and the converter gating signals for the case . For three switching 0885-8977/03$17.00 © 2003 IEEE

Welcome message from author
This document is posted to help you gain knowledge. Please leave a comment to let me know what you think about it! Share it to your friends and learn new things together.
Transcript
1034 IEEE TRANSACTIONS ON POWER DELIVERY, VOL. 18, NO. 3, JULY 2003
Direct Harmonic Analysis of theVoltage Source Converter
Peter W. Lehn, Member, IEEE
Abstract—An analytic technique is presented for the calculationof both characteristic and uncharacteristic harmonics in voltagesource converter circuits. The proposed technique accounts for allharmonic interaction between the ac and dc sides of the converter,and may thus also be employed for accurate dc side voltage ripplecalculations. In contrast to simulation-based approaches or itera-tive methods, the proposed technique offers a closed form solutionfor the current harmonics, thereby avoiding numerical errors andconvergence problems. The technique is applied to the harmonicanalysis of a STATCOM.
Index Terms—FACTS, harmonic analysis, pulsewidth modula-tion, STATCOM.
I. INTRODUCTION
T HE INTRODUCTION of VSC-based FACTS equipmentto a power system offers the potential to improve con-
trol of power flow and enhance system stability. As with anyVSC application, converter-based FACTS equipment will actas a source of harmonic current injection to the system andit will also interact with harmonic distortions already presentwithin the system. In order to prevent harmonic instability of thesystem and to appropriately rate the components of the VSC, animproved understanding of these harmonic interactions must bedeveloped.
Two established techniques exist for performing an approxi-mate analysis of the behavior of FACTS components at frequen-cies away from the fundamental. In [1], [2], the modeling of aconverter under unbalanced operating conditions is carried outby representing switching functions by their Fourier Spectra. It-erative techniques can then be applied to perform a harmonicbalance. This approach has the potential to offer an accurate so-lution, accounting for all harmonics and harmonic interactionswithin the system; however, the complexity in the approach in-creases rapidly with the number of harmonics being considered.Furthermore, this approach requires an iterative solution tech-nique to be employed, which requires convergence conditionsto be met.
An alternate type of approach is presented in [3], [4], and[5] where -frame converter models are employed as a basisfor analyzing the converter. These techniques are more straight-forward than those which model the switching functions, butthey are bandwidth limited and not capable of modeling har-
Manuscript received September 25, 2002.The author is with the Department of Electrical and Computer Engi-
neering, University of Toronto, Toronto, ON M5S 3G4, Canada (e-mail:[email protected]).
Digital Object Identifier 10.1109/TPWRD.2003.813603
Fig. 1. VSC circuit.
monic sidebands introduced around the carrier frequency of thepulsewidth modulator.
This paper presents a direct analytical method to calculate theharmonics in a VSC circuit. Balanced and unbalanced operatingconditions are considered where unbalance may stem from ei-ther system voltage or converter firing unbalance. The presentedtechnique calculates all characteristic and uncharacteristic har-monics of the converter, accounting for all harmonic couplingthrough the dc link of the converter. The technique may beused to analyze the harmonic response of any VSC-based equip-ment including FACTS components such as the STATCOM andSSSC. Straightforward extensions to the technique permits ap-plication to multiterminal VSC-based FACTS equipment suchas the UPFC or IPFC.
The paper is divided into five main sections. First, the con-cept of space vector-based harmonic analysis is presented withthe help of a simple example, assuming a ripple free dc bus.Second, using space vector concepts, an analytical solution isdeveloped for complete harmonic analysis of a converter, in-cluding all ac-dc side interactions. Next, the proposed techniqueis validated against PSCAD/EMTDC simulation results and thecomputational benefits of implementing the technique are as-sessed. Finally, a complete harmonic analysis of a STATCOMis carried out to demonstrate one possible application of the pro-posed theory.
II. SPACE VECTORHARMONIC ANALYSIS
Consider the converter of Fig. 1 operating under sinusoidalpulsewidth modulation (SPWM). For proper SPWM operation,the carrier frequency of the modulator is an odd multiple of threetimes the fundamental system frequency [6]. Thus
(1)
Fig. 2 shows the phase system voltage and the convertergating signals for the case . For three switching
0885-8977/03$17.00 © 2003 IEEE
LEHN: DIRECT HARMONIC ANALYSIS OF THE VOLTAGE SOURCE CONVERTER 1035
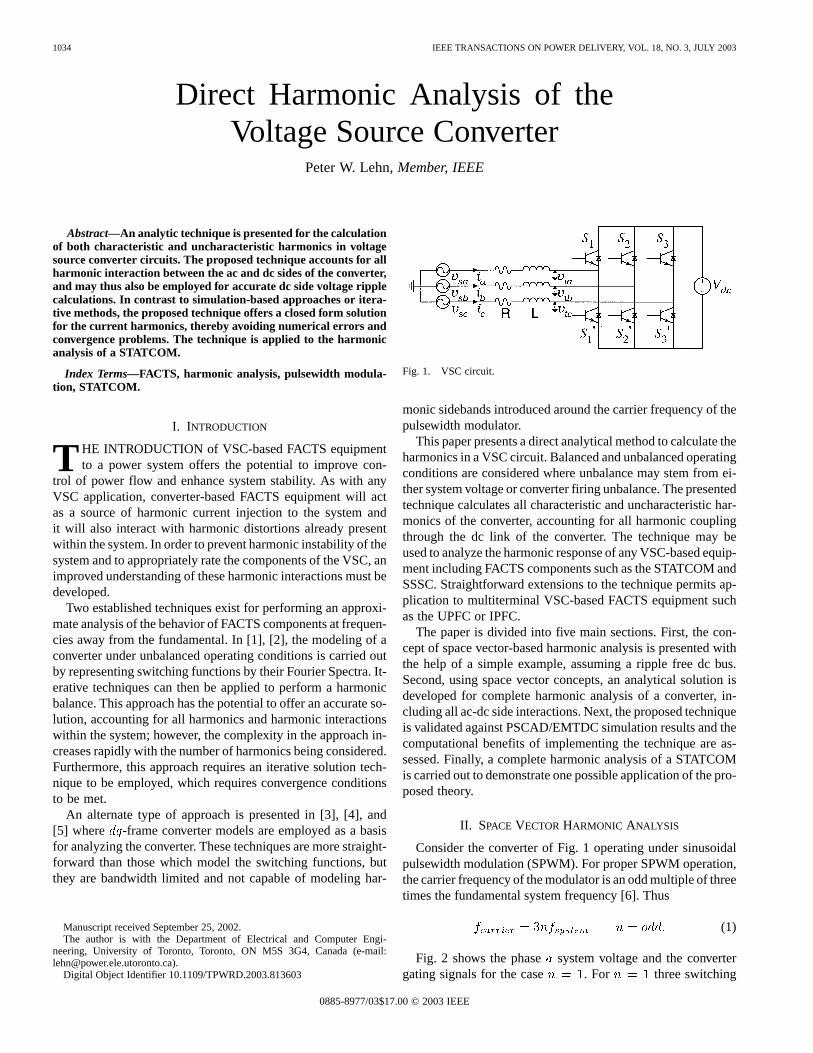
Fig. 2. VSC gating signals.
events ( , , ) may be identified every 60of the funda-mental. In general, switching events will occur every 60.
Balanced three-phase operation of the system implies that thefollowing four conditions are met.
• AC source is balanced.• Interface impedances in the phases are all identical.• Switch-on times are equally spaced throughout the period
(i.e., every 60).• All switch-off times are equally spaced throughout the pe-
riod (i.e., every 60).Under these conditions, 60symmetry will exist in the
voltage and current waveforms.To best exploit this symmetry, analysis of the system is car-
ried out in the reference frame. Voltages, currents, and gatingsignals are all transformed into the -frame through a varia-tion of the Clarke Transform [7], [8]. The transform is appliedto the gating signals according to
(2)
where
(3)
The inverse of the Transform is simply given bywhere the superscript denotes transpose. As shown in
Fig. 2, the -frame gating signals take on a multilevel wave-form.
Assuming the dc voltage is constant, ripple free and of am-plitude , then the terminal voltage of the converter in the
-frame is given by
(4)
where voltages are either given directly in volts, or given in perunit using the base value convention specified in the Appendix.
Space vector-based harmonic analysis of the convertervoltage is then carried out by performing a complex Fourieranalysis on the converter terminal’s complex voltage vector
. The positive sequence fundamental compo-nent of this vector will rotate in a clockwise direction, makinga single complete revolution in one period. On a normalizedtime base, the positive sequence component is thus found from
(5)
From symmetry, this may be reduced to a sixth period anal-ysis. For , the vector takes on four discrete valuesassociated with the four intervals marked in Fig. 2, yielding apositive sequence component which depends on the switchinginstants and the dc voltage
(6)All other characteristic harmonics may also be found from
the sixth period analysis. Let represent the harmonic numberin question, where positive values correspond to positive se-quence harmonics and negativevalues to negative sequenceharmonics. The th harmonic component of the converter ter-minal voltage may thus be found from
(7)for .
The th harmonic current is found via traditional phasor anal-ysis and is given by
(8)
where is the th harmonic component of the system busvoltage.
Since, in this case, the dc voltage is held constant by a dcsource, the converter may be run at an arbitrary modulationindex and delay angle. Fig. 3 shows the complex spectrum ofthe current space vector for a system running with a modulationindex of p.u., a delay angle and a dc voltageof 2.1 p.u. (i.e., 2.1 times the peak line to neutral voltage of theac system). The system parameters are given in the Appendix.
Analysis of the complex space vector yields an asymmetricspectrum, where negative sequence components appear in theleft half plane and positive sequence components appear in theright half plane. The corresponding spectrum obtained from aPSCAD/EMTDC simulation is also shown. The simulated spec-trum is determined by Fourier analysis of the three line currentsfollowed by decomposition into sequence components. If a suf-

1036 IEEE TRANSACTIONS ON POWER DELIVERY, VOL. 18, NO. 3, JULY 2003
Fig. 3. Complex harmonic spectrum of the VSC ac current assuming a fixeddc voltage level forf = 3f .
Fig. 4. VSC with dc storage capacitor.
ficiently small time step is employed for the simulation, resultsare identical.
III. COMPLETE HARMONIC ANALYSIS
In practice, the majority of converters are not run off a con-stant dc voltage source, but are instead designed using a dc sidecapacitor as shown in Fig. 4. The average steady state dc voltagelevel is then a function of the modulation index and delayangle of the SPWM signal. Furthermore, harmonics will nowappear on the dc capacitor voltage, thus it is no longer permis-sible to assume is constant over the entire period as wasdone in the preceding analysis.
To model the ac side converter harmonics for the circuit ofFig. 4, requires the following.
• A true steady state solution must be found which takes intoaccount all harmonic interactions, not just fundamentalfrequency components.
• The current space vector and its harmonics must be deter-mined, taking into account the ripple on the dc capacitorvoltage.
An extensive analysis of the steady state operating character-istics of the converter shown in Fig. 4 is presented in [8]. Usinga similar development, the system equations may be derived inthe -frame
(9)The system voltage has been represented by an ideal oscillator
described by the states and oscillating at a normalized
frequency of p.u. The upper right 2 2 sub-matrixof the system determines how the oscillator is coupled into theVSC differential equations. As shown, the oscillator applies abalanced three-phase voltage to the VSC by applying a cosinewave to the -axis and a sine wave to theaxis. Section III-Cdescribes how this coupling matrix may be adjusted to model anunbalanced system voltage.
The -frame switching functions in (9) are related to theactual switching functions according to (2). Thesame transform also relates voltages and currents inthe -frame to those in the -frame.
At any given instant, the switching functions takeon a fixed set of binary values, and associated with this set isa corresponding gating space vector . Equation (9) isthen written in compact form by either
(10)
or equivalently
(11)
The system is linear, but its matrix is time varying. A steadystate does, however, exist, since the time varying nature ofisperiodic. Applying the steady state solution technique [8] yieldsthe initial condition , associated with a steady state solu-tion.
A. Balanced Operation
Sixth period symmetry is exploited to find the system steadystate and the characteristic voltage and current harmonics of theconverter. Space vectors are used to analyze the harmonic spec-trum of the converter current, since they simultaneously iden-tify harmonic amplitude, phase, and sequence. The integral tobe solved for the th harmonic component of the current is
(12)
where .To solve this equation, the following complex state equation
is augmented to the system equations:
(13)
This equation will be solved with the system equations over asixth period [9]. At the end of the sixth period, the output willbe
(14)
Comparing (12) with (14), it may be seen that the outputwill yield the th harmonic of the converter current if
the following assignments are made:
LEHN: DIRECT HARMONIC ANALYSIS OF THE VOLTAGE SOURCE CONVERTER 1037
Finding the system harmonics is a three stage process. First,the steady state initial condition of the original systemmust be found. Second, the system matrix is augmented withone additional equation for each harmonic of interest. Third, theanalytical solution for the augmented system is found at time
by solution of the augmented state equations. The so-lutions for the augmented states then yield the harmonic com-ponents of interest.
Equating the th harmonic of the converter current requiressolution of the following matrix equation at timestarting from the initial condition vector
(15)
The matrix couples the system waveforms to be analyzedinto the augmented equations, while thematrix simply iden-tifies the harmonic numbers of interest. For extraction of thethcurrent harmonic, the two matrices are given below
(16)
(17)
Expressing (15) as , the solution for theth harmonic of the current, given by , is simply the last
element of the vector
(18)
when .DC voltage harmonics may be found in an analogous fashion,
through further state augmentation.
B. Operation Under Unbalanced Gating
Unbalanced operation may result from either an unbalancedsystem voltage or unbalanced gating of the VSC. These twocases are treated separately, since the mechanisms at workcouple into the system equations in very different ways. Inboth cases, however, uncharacteristic harmonics are createdwhich have only half wave symmetry. Sixth period symmetry istherefore destroyed, increasing the computational burden andcomplexity of the solution technique.
Operation under unbalanced firing with a balanced systemvoltage more closely resembles balanced operation. It willtherefore be analyzed first. Unbalanced gating may resultfrom errors in the gating generation unit, imbalance in signalscoming from the VSC controller, or imbalance in sensor gains.
Unbalanced gating requires a new steady state initial condi-tion to be found for the system over half a period, followed bystate augmentation. Over half a periodswitching events will
occur. From the half period steady state solution, the harmonicsare therefore solved over a half period according to
(19)
when .As may be identified from (19), a nonlinear relation exists
between switching instants and the harmonics, con-tained in last rows of .
It may be concluded that the VSC current harmonics will notvary linearly with imbalance in the gating signals.
C. Operation Under Unbalanced Voltage
Introduction of an unbalanced system voltage may be carriedout by adjusting elements (1,4), (1,5), (2,4), and (2,5) of the
-matrix in (9) and (15).Equation (9) shows a system matrix with elements (1,4)
and (2,5) that couple the ideal oscillator equations to the dy-namic equations of the VSC. The space vector voltage appliedto the VSC is
(20)
where the amplitude is determined by the initial conditionas per [8]. Thus, a cosine of am-
plitude is applied to the -axis VSC equation and a sine ofamplitude is applied to the -axis equation.
Under imbalance, a negative sequence voltage vector is addedto the space vector. This additional vector has amplitude
and phase
(21)
Incorporating these changes into the systemmatrix requiresthe following assignments:
(22)
Using the above modifications to the matrix, the systemsteady state may be found over half a period including the ef-fects of negative sequence system voltage . As in thebalanced case, one stateis then augmented for each harmonicof interest. The steady state solution of the harmonics are thenfound, solving (19) with the correspondingly modifiedma-trices.
IV. V ALIDATION OF ANALYTICAL PROCEDURE
Results are validated by examining the VSC under bothbalanced and unbalanced operating conditions. Validationis carried out by comparing the results obtained from theanalytical method with those obtained from a time domain
1038 IEEE TRANSACTIONS ON POWER DELIVERY, VOL. 18, NO. 3, JULY 2003
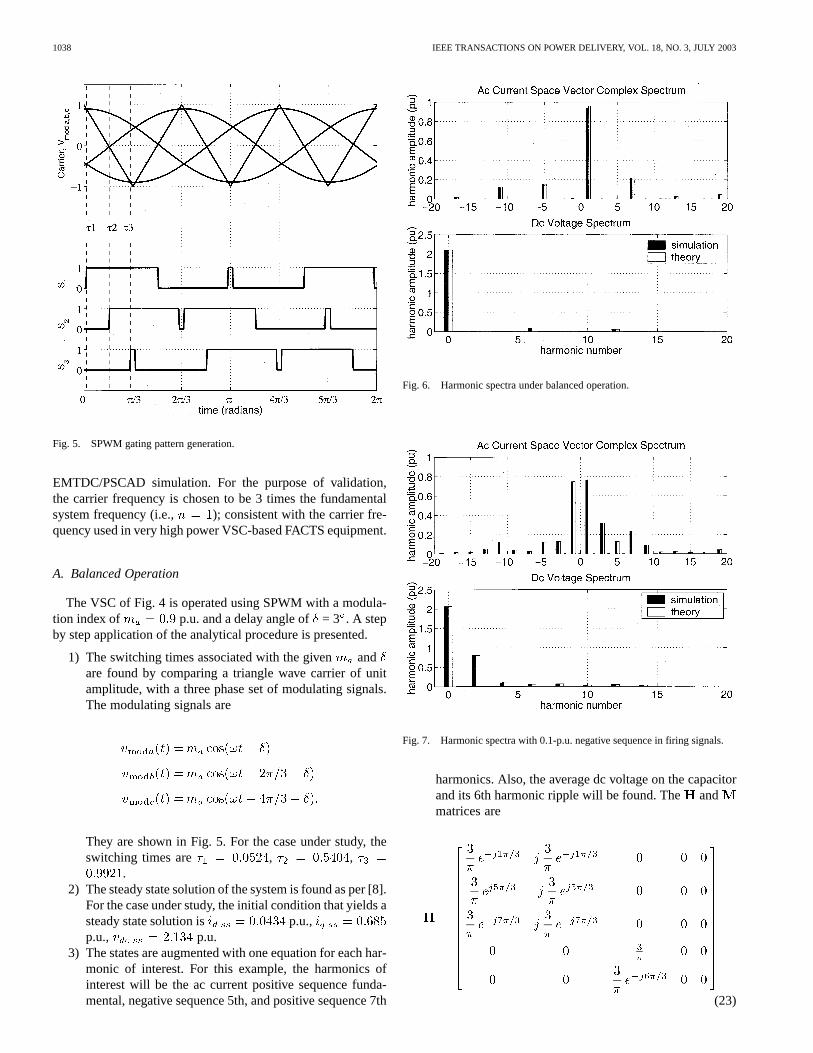
Fig. 5. SPWM gating pattern generation.
EMTDC/PSCAD simulation. For the purpose of validation,the carrier frequency is chosen to be 3 times the fundamentalsystem frequency (i.e., ); consistent with the carrier fre-quency used in very high power VSC-based FACTS equipment.
A. Balanced Operation
The VSC of Fig. 4 is operated using SPWM with a modula-tion index of p.u. and a delay angle of= 3 . A stepby step application of the analytical procedure is presented.
1) The switching times associated with the given andare found by comparing a triangle wave carrier of unitamplitude, with a three phase set of modulating signals.The modulating signals are
They are shown in Fig. 5. For the case under study, theswitching times are , ,
.2) The steady state solution of the system is found as per [8].
For the case under study, the initial condition that yields asteady state solution is p.u.,p.u., p.u.
3) The states are augmented with one equation for each har-monic of interest. For this example, the harmonics ofinterest will be the ac current positive sequence funda-mental, negative sequence 5th, and positive sequence 7th
Fig. 6. Harmonic spectra under balanced operation.
Fig. 7. Harmonic spectra with 0.1-p.u. negative sequence in firing signals.
harmonics. Also, the average dc voltage on the capacitorand its 6th harmonic ripple will be found. The andmatrices are
(23)

LEHN: DIRECT HARMONIC ANALYSIS OF THE VOLTAGE SOURCE CONVERTER 1039
Fig. 8. Harmonic spectra with 0.1-p.u. negative sequence in system voltage.
Fig. 9. Balanced steady state operation of a high switching frequency PWMconverter.
(24)
The last two rows of the and matrices implementsthe dc voltage harmonic calculations. These will calcu-late the coefficient of the dc term and the term inthe complex Fourier series. This positive sideband termcontains all of the information necessary to calculate thesixth harmonic component of the dc voltage.
4) Equation (18) is solved using thevalues found in step1 and the associated initial condition found in step 2. Forthe case under study, the initial condition is
(25)
Fig. 10. Percent of error in the magnitude of fundamental frequency convertercurrent as a function of simulation time step size.
Fig. 11. Percent of error in the magnitude of fundamental frequency convertercurrent as a function of simulation time.
where the system voltage is balanced withwhere and .
The resulting harmonics are p.u.,p.u., p.u., p.u., and
p.u.
The calculated harmonic spectrum of the current is comparedwith results from a PSCAD/EMTDC simulation in Fig. 6. Ex-cellent agreement exists between the proposed analytical tech-nique and simulation. The only perceptible difference occurs atfundamental frequency and stems from simulation error. Simu-lation errors result from the accumulation of integration errorsfrom the trapezoidal algorithm and minor inaccuracies in inter-polation of the switching instants. These errors may be mini-mized through reduction of the simulation time step; however,a corresponding increase in simulation time will result.

1040 IEEE TRANSACTIONS ON POWER DELIVERY, VOL. 18, NO. 3, JULY 2003
(a) (b)
(c) (d)
Fig. 12. Balanced steady state operation. (a) Fundamental ac current. (b) Average dc voltage. (c) THD in ac current. (d) THD in dc voltage.
B. Operation Under Unbalanced Gating
In the previous section, the modulating signals were balancedthree phase signals of 0.9-p.u. amplitude, lagging the systemvoltage by 3 . In this section, a 0.1-p.u. amplitude negativesequence component (of zero phase) is added yielding modu-lating signals of
Analytical and simulation results are compared in Fig. 7.Again, excellent agreement between the proposed theoryand simulation exists. All uncharacteristic harmonics, suchas negative sequence fundamental, and positive and negativesequence third harmonic, are correctly identified. On the dcbus, uncharacteristic harmonics including the second and fourthare also identified.
C. Operation Under Unbalanced Voltage
A 0.1-p.u. negative sequence voltage is superimposed on thesystem voltage, while balanced firing is maintained with a mod-ulation index of 0.9 p.u. and a delay angle of 3. The systemvoltage is therefore given by
Analytical and simulation results are compared in Fig. 8.Comparing the results of this section with those of the pre-
vious section, shows that the VSC steady state solution and har-monics respond quite differently to imbalance in system voltagethan to imbalance in firing. In both cases, a similar 10% nega-tive sequence imbalance was introduced.
V. IMPLEMENTATION EFFICIENCY
Although the proposed analytical procedure offers a closedform solution for the harmonic analysis of a VSC, the number

LEHN: DIRECT HARMONIC ANALYSIS OF THE VOLTAGE SOURCE CONVERTER 1041
of necessary matrix exponential evaluations becomes large if ahigh frequency PWM converter is analyzed. For harmonic anal-ysis of a VSC operating at a carrier frequency oftimes, thesystem fundamental frequency matrix exponentials needto be evaluated: are required for obtaining the steady statesolution, and are required for the harmonic analysis.
To ascertain the computational efficiency of implementingthe proposed technique whenis large, a VSC operating at acarrier frequency of 51 times the system fundamental frequency( ). This represents a switching frequency of 3.06 kHz ona 60-Hz network. The converter is operated with a delay angleof 1 and a modulation index of 0.9 p.u. All other system param-eters are left unchanged, and are given in the Appendix. Char-acteristic harmonics of the ac current and the dc voltage are cal-culated up to the 60th harmonic. The resulting harmonic spectraare given in Fig. 9. Once again, simulation results closely matchthose obtained by implementing the proposed procedure, as-suming a sufficiently small time step is employed and the systemis simulated for a sufficiently long duration to settle into steadystate.
In simulation, a tradeoff exists between desired accuracy andcomputation time, since high accuracy will require use of asmall simulation time step. Fig. 10 plots the percent error in fun-damental frequency ac current magnitude as the time step size isvaried. From the figure, it may be seen that the simulation erroris approximately proportional to the time step size.
Clearly, appropriate initialization of the simulation is requiredif the circuit is to rapidly settle into a steady state. Appropriateinitialization of the dc capacitor voltage on the STATCOM sim-ulation model allows steady state operation to be achieved afterten to 20 cycles of the fundamental. Fig. 11 shows the relationbetween simulation time and the percent error in fundamentalfrequency ac current magnitude. The STATCOM is simulatedfor 15 cycles in PSCAD/EMTDC (on a 1-GHz, Pentium III,Windows 2000 workstation). Notice that the simulation resultsconverge to a slightly erroneous solution with0.65% error.This residual error stems, to a large part, from the fact that ini-tialization transients have not fully decayed to zero in the al-lotted 15 cycles.
Also shown in Fig. 11 is the time required to execute theproposed procedure. The procedure is implemented as anun-compiled MATLAB script which executes in 1.7 s (onthe same 1-GHz, Pentium III, Windows 2000 workstation).As may be observed from Fig. 11, the proposed techniqueoffers significant improvement in accuracy and reduction insimulation time compared with brute force simulation; even ifthe converter switching frequency is high.
The proposed technique achieves a target error below 1% ap-proximately two orders of magnitude faster than brute force sim-ulation. Equally important, in contrast to simulation, accurateresults may be obtained without the need of error analysis, op-timal selection of time step size, or estimation of how many cy-cles must be simulated before steady state is truly reached.
VI. A PPLICATION EXAMPLE
This section employs the proposed procedure to calculate thetotal harmonic distortion current injected into a transmission
(a)
(b)
Fig. 13. Operation with 2% system voltage imbalance. (a) THD in ac current.(b) THD in dc voltage.
system by a STATCOM as a function of operating point. Thevoltage ripple on the dc bus is simultaneously calculated, as itmay be used to rate the dc storage capacitor.
The operating point of the STATCOM is specified in terms ofthe modulation index and phase angleof the SPWM mod-ulating signals. The resulting fundamental frequency ac currentand average dc voltage are shown in Fig. 12(a) and (b). Note thatfor degrees, the ac current is inductive, while fordegrees, the current is capacitive.
The total harmonic current distortion is calculated from thecomplex spectrum
(26)
The total harmonic distortion on the dc voltage is also calcu-lated from the first 30 harmonics. The harmonic distortion onthe current and voltage are shown in Fig. 12(c) and (d).
The harmonic distortions are in line with expectations. DCTHD is low over the entire operating range. AC current THD

1042 IEEE TRANSACTIONS ON POWER DELIVERY, VOL. 18, NO. 3, JULY 2003
TABLE ISYSTEM DATA
become large only if a high average dc voltage level is combinedwith a small modulation index (i.e., when p.u. and
). Since this range of operation is not typically utilizedin any STATCOM application, it is of little concern.
Fig. 13 shows the dc voltage and ac current THD when amodest 2% negative sequence voltage component exists on thesystem. Even this small level of voltage imbalance is seen todrastically alter the THD curves. In particular, an exceptionallyhigh ac and dc THD will now exist if the STATCOM is operatedat a modulation near 0.7 p.u. The local maximum in THD is a re-sult of strong ac-dc side coupling at this modulation index. Thelocal maximum occurs within the range of operation utilized bymost STATCOMs that operate with sinusoidal pulse width mod-ulation.
By comparing Fig. 12 with Fig. 13, it may be concluded thateven very modest system voltage imbalance must be accountedfor when rating the dc capacitor of a STATCOM or when calcu-lating its harmonic injection into the network.
VII. CONCLUSIONS
An analytical method for calculating the ac and dc side har-monics of a VSC is presented. The technique uses a direct so-lution of the steady state followed by a direct solution of the
VSC harmonics, thus avoiding the numerical errors and conver-gence problems associated with iterative methods. Furthermore,the proposed method is capable of calculating all uncharacter-istic harmonics associated with the operation of a VSC underunbalanced system voltage or unbalanced inverter firing condi-tions. Comparison of analytical results with those obtained fromEMTDC/PSCAD validate the proposed method in all cases. Thetechnique is applied to the harmonic analysis of a STATCOM.
APPENDIX
The data used for system parameters are summarized below.Note that the same base values for voltage and current are usedon both the ac and dc sides of the converter as shown in Table I.
REFERENCES
[1] A. Gole, “Steady state frequency response of statcom,”IEEE Trans.Power Delivery, vol. 16, pp. 18–23, Jan. 2001.
[2] M. Madrigal and E. Acha, “Modeling of custom power equipment usingharmonic domain techniques,”, vol. 1, pp. 264–269, 2000.
[3] S. Dong, W. Zhonghong, J. Chen, and Y. Song, “Harmonic resonancephenomena in statcom and relationship to parameter selection of pas-sive components,”IEEE Trans. Power Delivery, vol. 16, pp. 46–52, Jan.2001.
[4] C. Schauder and H. Mehta, “Vector analysis and control of advancedstatic VAR compensators,”Proc. Inst. Elect. Eng., pt. C, vol. 140, pp.299–306, July 1993.
[5] I. Papic and A. Gole, “Steady state frequency response of the unifiedpower flow controller,”, vol. 1, pp. 526–531, 2002.
[6] N. Mohan, T. Undeland, and W. Robbins,Power Electronics, 2nded. New York: Wiley, 1995.
[7] E. Clarke,Circuit Analysis of AC Power Systems. New York: Wiley,1943.
[8] P. Lehn, “Exact modeling of the voltage source converter,”IEEE Trans.Power Delivery, vol. 17, pp. 217–222, Jan. 2002.
[9] H. Visser and P. van den Bosch, “Modeling of periodically switchednetworks,” inIEEE Power Electron. Specialists Conf., 1991, pp. 67–73.
Peter W. Lehn (M’99) received the B.Sc. and M.Sc. degrees in electrical en-gineering from the University of Manitoba, Winnipeg, in 1990 and 1992, re-spectively. He received the Ph.D. degree from the University of Toronto, ON,Canada, in 1999.
Currently, he is an Assistant Professor at the University of Toronto. From1992 to 1994, he was with the Network Planning Group of Siemens AG, Er-langen, Germany.
Related Documents