Direct evidence of overdamped Peierls-coupled modes in TTF-CA temperature-induced phase transition A. Girlando, 1 M. Masino, 1 A. Painelli, 1 N. Drichko, 2, 3 M. Dressel, 2 A. Brillante, 4 R. G. Della Valle, 4 and E. Venuti 4 1 Dipartimento di Chimica Generale ed Inorganica, Chimica Analitica e Chimica Fisica, and INSTM-UdR Parma, Universit` a di Parma, Parco Area delle Scienze, 43100-I Parma, Italy 2 1. Physikalisches Institut, Universit¨ at Stuttgart, Pfaffenwaldring 57, 70550 Stuttgart, Germany 3 Ioffe Physico-Technical Institute Russian Academy of Sciences, Politeknicheskaya 26, 194021 St. Petersburg, Russia 4 Dipartimento di Chimica Fisica e Inorganica, and INSTM-UdR Bologna, Universit` a di Bologna, Viale Risorgimento 4, 40136-I Bologna, Italy In this paper we elucidate the optical response resulting from the interplay of charge distribution (ionicity) and Peierls instability (dimerization) in the neutral-ionic, ferroelectric phase transition of tetrathiafulvalene-chloranil (TTF-CA), a mixed-stack quasi-one-dimensional charge-transfer crystal. We present far-infrared reflectivity measurements down to 5 cm -1 as a function of temperature above the phase transition (300 – 82 K). The coupling between electrons and lattice phonons in the pre- transitional regime is analyzed on the basis of phonon eigenvectors and polarizability calculations of the one-dimensional Peierls-Hubbard model. We find a multi-phonon Peierls coupling, but on approaching the transition the spectral weight and the coupling shift progressively towards the phonons at lower frequencies, resulting in a soft-mode behavior only for the lowest frequency phonon near the transition temperature. Moreover, in the proximity of the phase transition, the lowest- frequency phonon becomes overdamped, due to anharmonicity induced by its coupling to electrons. The implications of these findings for the neutral-ionic transition mechanism is shortly discussed. I. INTRODUCTION In a formulation similar to a student’s exercise, more than fifty year ago Rudolf Peierls pointed out that one- dimensional (1D) metals are intrinsically unstable with respect to lattice distortions opening a gap at the Fermi energy. 1 It did not take long to realize that the quasi-1D electronic structure of organic charge-transfer (CT) con- ductors offers an almost ideal model for the Peierls mech- anism. Extensive investigations in the 1970s revealed that the Peierls instability may occur also in 1D Mott insulators, due to coupling of the lattice to spin (spin- Peierls), 2 or to both electronic and spin degrees of free- dom (“generalized” Peierls instability). 3 At the time, the attention was almost exclusively devoted to segregated- stack CT crystals, where identical electron-donor (D) or acceptor (A) π-molecules are arranged face-to-face along one direction. Mixed stacking (...DADA...) received far less attention, at least until a new kind of phase transition was discovered in these systems: the so-called neutral- ionic phase transition (NIT). 4,5 It is characterized by a change in the ionicity %, i.e. the charge transfer from D to A in the ground state. Temperature T or pressure p may induce a change from a quasi-neutral N, % . 0.5) to a quasi-ionic (I, % & 0.5) ground state. It was early recog- nized that the ionic state is subject to the Peierls insta- bility, yielding a stack dimerization (..DA DA DA..). 6,7 NIT are complex phenomena, resulting from the inter- play between two order parameters, the ionicity % and the dimerization δ, and present a rich and intriguing phenomenology. 8,9 Some of the phenomena occurring on approaching the phase transition, like the dramatic in- crease of the dielectric constant or the observation of diffuse scattering signals in x-ray diffraction, 10,11 have been recently ascribed to charge oscillations associated with the soft mode that yields the stack dimerization, namely, the Peierls mode. 12,13,14 It is then of fundamen- tal importance to identify the Peierls mode in order to confirm the above suggestion and to shed light on the NIT mechanism. At variance with segregated stack crys- tals, the Peierls mode is optically active in mixed stack structures, 6 which offers a rather unique possibility for its optical detection and characterization. Finally, since the dimerized ionic stack is potentially ferroelectric, 15 the Peierls mode is the counterpart of the so-called ferroelec- tric mode of perovskite-type crystals. 16 Direct and clear experimental identification and char- acterization of the Peierls mode and of its role in the NIT has proved to be more difficult than expected. 17,18 One of the reasons is that the phonon structure of molecular crystals is very complex, and several modes are likely cou- pled to CT electrons. Therefore the analysis of the spec- tra requires a detailed and reliable understanding of the lattice-phonon dynamics. We have recently undertaken such analysis for tetrathiafulvalene-chloranil (TTF-CA), which undergoes a first-order temperature induced NIT at 81 K. 8 In a first paper (hereafter Paper I) 19 we pre- sented a quasi harmonic lattice dynamics (QHLD) calcu- lations of TTF-CA lattice phonons above and below the transition temperature, and gave a first partial interpre- tation of the infrared (IR) and Raman spectra. The specific goal and achievement of the present paper is the identification of the Peierls (soft) modes in TTF- CA neutral phase. We present detailed and improved data for single crystals of TTF-CA in the spectral region 5 - 200 cm -1 collected in the temperature range down to arXiv:0712.3267v1 [cond-mat.other] 19 Dec 2007

Welcome message from author
This document is posted to help you gain knowledge. Please leave a comment to let me know what you think about it! Share it to your friends and learn new things together.
Transcript
Direct evidence of overdamped Peierls-coupled modesin TTF-CA temperature-induced phase transition
A. Girlando,1 M. Masino,1 A. Painelli,1 N. Drichko,2, 3 M. Dressel,2 A. Brillante,4 R. G. Della Valle,4 and E. Venuti41Dipartimento di Chimica Generale ed Inorganica,
Chimica Analitica e Chimica Fisica, and INSTM-UdR Parma,Universita di Parma, Parco Area delle Scienze, 43100-I Parma, Italy
21. Physikalisches Institut, Universitat Stuttgart, Pfaffenwaldring 57, 70550 Stuttgart, Germany3Ioffe Physico-Technical Institute Russian Academy of Sciences,
Politeknicheskaya 26, 194021 St. Petersburg, Russia4Dipartimento di Chimica Fisica e Inorganica, and INSTM-UdR Bologna,
Universita di Bologna, Viale Risorgimento 4, 40136-I Bologna, Italy
In this paper we elucidate the optical response resulting from the interplay of charge distribution(ionicity) and Peierls instability (dimerization) in the neutral-ionic, ferroelectric phase transition oftetrathiafulvalene-chloranil (TTF-CA), a mixed-stack quasi-one-dimensional charge-transfer crystal.We present far-infrared reflectivity measurements down to 5 cm−1 as a function of temperature abovethe phase transition (300 – 82 K). The coupling between electrons and lattice phonons in the pre-transitional regime is analyzed on the basis of phonon eigenvectors and polarizability calculationsof the one-dimensional Peierls-Hubbard model. We find a multi-phonon Peierls coupling, but onapproaching the transition the spectral weight and the coupling shift progressively towards thephonons at lower frequencies, resulting in a soft-mode behavior only for the lowest frequency phononnear the transition temperature. Moreover, in the proximity of the phase transition, the lowest-frequency phonon becomes overdamped, due to anharmonicity induced by its coupling to electrons.The implications of these findings for the neutral-ionic transition mechanism is shortly discussed.
I. INTRODUCTION
In a formulation similar to a student’s exercise, morethan fifty year ago Rudolf Peierls pointed out that one-dimensional (1D) metals are intrinsically unstable withrespect to lattice distortions opening a gap at the Fermienergy.1 It did not take long to realize that the quasi-1Delectronic structure of organic charge-transfer (CT) con-ductors offers an almost ideal model for the Peierls mech-anism. Extensive investigations in the 1970s revealedthat the Peierls instability may occur also in 1D Mottinsulators, due to coupling of the lattice to spin (spin-Peierls),2 or to both electronic and spin degrees of free-dom (“generalized” Peierls instability).3 At the time, theattention was almost exclusively devoted to segregated-stack CT crystals, where identical electron-donor (D) oracceptor (A) π-molecules are arranged face-to-face alongone direction. Mixed stacking (...DADA...) received farless attention, at least until a new kind of phase transitionwas discovered in these systems: the so-called neutral-ionic phase transition (NIT).4,5 It is characterized by achange in the ionicity %, i.e. the charge transfer from D toA in the ground state. Temperature T or pressure p mayinduce a change from a quasi-neutral N, % . 0.5) to aquasi-ionic (I, % & 0.5) ground state. It was early recog-nized that the ionic state is subject to the Peierls insta-bility, yielding a stack dimerization (..DA DA DA..).6,7
NIT are complex phenomena, resulting from the inter-play between two order parameters, the ionicity % andthe dimerization δ, and present a rich and intriguingphenomenology.8,9 Some of the phenomena occurring onapproaching the phase transition, like the dramatic in-crease of the dielectric constant or the observation of
diffuse scattering signals in x-ray diffraction,10,11 havebeen recently ascribed to charge oscillations associatedwith the soft mode that yields the stack dimerization,namely, the Peierls mode.12,13,14 It is then of fundamen-tal importance to identify the Peierls mode in order toconfirm the above suggestion and to shed light on theNIT mechanism. At variance with segregated stack crys-tals, the Peierls mode is optically active in mixed stackstructures,6 which offers a rather unique possibility forits optical detection and characterization. Finally, sincethe dimerized ionic stack is potentially ferroelectric,15 thePeierls mode is the counterpart of the so-called ferroelec-tric mode of perovskite-type crystals.16
Direct and clear experimental identification and char-acterization of the Peierls mode and of its role in the NIThas proved to be more difficult than expected.17,18 Oneof the reasons is that the phonon structure of molecularcrystals is very complex, and several modes are likely cou-pled to CT electrons. Therefore the analysis of the spec-tra requires a detailed and reliable understanding of thelattice-phonon dynamics. We have recently undertakensuch analysis for tetrathiafulvalene-chloranil (TTF-CA),which undergoes a first-order temperature induced NITat 81 K.8 In a first paper (hereafter Paper I)19 we pre-sented a quasi harmonic lattice dynamics (QHLD) calcu-lations of TTF-CA lattice phonons above and below thetransition temperature, and gave a first partial interpre-tation of the infrared (IR) and Raman spectra.
The specific goal and achievement of the present paperis the identification of the Peierls (soft) modes in TTF-CA neutral phase. We present detailed and improveddata for single crystals of TTF-CA in the spectral region5−200 cm−1 collected in the temperature range down to
arX
iv:0
712.
3267
v1 [
cond
-mat
.oth
er]
19
Dec
200
7

2
82 K. Particular attention is devoted to the submillimeterspectral range, below 30 cm−1. The experimental dataare analyzed in terms of a multi-mode Peierls model, thatcombines the information on lattice phonon dynamics re-ported in Paper I,19 with that on the electronic struc-ture as obtained from the exact diagonalization of the1D Peierls-Hubbard Hamiltonian in Ref. 13. The modelfully accounts for the experimental data and allows usto demonstrate that mode mixing and overdamping arethe key to explain the changes of the far-IR spectra onapproaching the transition. The effective Peierls modedetected by an analysis of the combination modes in themid-IR region20 is also accounted for. In addition, thedielectric constant anomaly at the transition10 is quanti-tatively reproduced.
II. EXPERIMENTAL METHODS
TTF-CA single crystals were grown by sublimation.Crystals as large as 4 mm × 4 mm allowed for measure-ment down to 5 cm−1. The reflectivity was probed onwell-developed naturally grown ab crystal faces along theoptical axes. The crystals were oriented at room tem-perature according to the known spectra in mid-IR re-gion, using a Hyperion IR microscope attached to BrukerIFS66v Fourier-transform spectrometer. In this paper wepresent the spectra polarized parallel to the a stack axis;only these spectra are relevant to the analysis of Peierlscoupling in the neutral phase.19
The reflectivity spectra were collected by three dif-ferent setups and techniques, depending on the spec-tral region of interest: (i) In the 5 − 30 cm−1 region,we employed a quasi-optical submillimeter spectrome-ter, equipped with backward wave oscillator as coherentand tunable source; a Golay-cell served as a detector.Temperature dependent measurements were conductedin an exchange-gas helium cryostat. The absolute reflec-tivity was obtained by comparing sample reflectance toreflectance of an aluminum mirror fixed on the same aper-ture. The spectral resolution in this range is better than0.01 cm−1. (ii) In the 20 − 150 cm−1 range the reflec-tivity was measured by a Bruker IFS66v with a spectralresolution of 0.5 cm−1. The spectrometer was equippedwith 1.4 K Si bolometer and a CryoVac cold-finger cryo-stat. The sample was fixed on the cold finger by car-bon paste; a good temperature contact was ensured byApiezon paste. To get absolute values of reflectivity, thein-situ gold-evaporation technique was adopted:21 aftermeasuring the temperature dependence of the sample re-flectivity, gold is evaporated onto the sample surface, andused as reference. (iii) Reflectance measurements in the100 − 6000 cm−1 range were done in a Bruker IFS 113vFTIR spectrometer equipped with a 4.2 K Si bolometer,an MCT detector, and an exchange-gas helium cryostat.The absolute reflectivity values of the sample have beenobtained by a comparison to a Au mirror of the samesize. In this spectral range a resolution of 2 cm−1 was
chosen. The reflectivity values agree well with availableliterature data,22 which extend from 3000 to 14 000 cm−1
and thus cover the charge transfer transition. The exten-sion to high wavenumbers is needed to obtain reliableKramers-Kronig transformation (KKT) of the data.
We ensured that good overlap exists between the datameasured in the three spectral regions. In order to matchthe absolute values, the submillimeter data were rescaledto those obtained by the Bruker IFS66v FTIR becausethe in-situ gold-evaporation technique ensures the mostprecise measurements of the absolute reflectivity anddoes not depend on the quality of the sample surface.
In the KKT analysis the data were extrapolated below5 cm−1 to fit the known values of the static dielectric con-stant ε1.10 We also verified that an extrapolation to a con-stant value does not significantly affect the portion of thespectra for which experimental data exist. At frequen-cies above 14 000 cm−1 an extrapolation R(ω) ∝ ω−2 hasbeen used.
III. REFLECTIVITY SPECTRA
A. Spectral data
FIG. 1: (color online) Experimental and calculated (SectionV) reflectivity spectra of TTF-CA at T = 300 K, with thepolarization E ‖ a. The spectral region above 3000 cm−1
(dashed curve) is taken from Ref. 22. Notice the logarithmicfrequency scale.
Fig. 1 shows the room temperature TTF-CA reflec-tivity along the stack axis for the whole measured spec-tral range, with extension to 14 000 cm−1 taken fromRef. 22. The reflectivity is rather low, as expected for anon-metallic compound. The charge transfer electronictransition occurs around 5000 cm−1 and at lower fre-quencies reflectivity gets down to about 0.2, with norelevant feature observed until we encounter the highest

3
frequency out-of-plane intramolecular modes, at 701 and682 cm−1, corresponding to CA and TTF, respectively.23
Below 250 cm−1 we find a couple of other modes of pre-vailing out-of-plane, intramolecular character, and finallythe intermolecular modes we want to discuss in detail inthe present paper.
FIG. 2: (color online) Reflectivity spectra of TTF-CA singlecrystal along the a axis taken at different temperatures T > Tc
above the N – I transition.
The temperature dependence of the low-frequency (5−120 cm−1) reflectivity spectra is presented in Fig. 2. Atroom temperature a group of strong phonon bands is ob-served just below 100 cm−1. At lower frequencies the re-flectivity remains approximately at the level of 0.4 downto the lowest measured data (5 cm−1 ). On cooling thesample from 300 to 82 K, the reflectivity above 120 cm−1
reveals only unimportant changes, and is therefore not re-ported. Instead Fig. 2 shows that dramatic changes occurbelow 100 cm−1, where reflectivity rises by 1.5 times onlowering temperature to 82 K, just before the NIT. Asdemonstrated in Paper I,19 below the transition temper-ature (Tc = 81 K) the reflectivity drops down to valuesbelow those at T = 300 K, and does not change consid-erably on further cooling to 10 K.
A more detailed inspection of Fig. 2 provides evidencethat the strongest increase of reflectivity, from about 0.4to 0.6, occurs on cooling between 300 and 150 K. Some in-crease of reflectivity below approximately 40 cm−1 occurson further cooling, indicating a shift of spectral weightto lower frequencies. The quality of the data in the low-frequency region, essential to appreciate the shift of spec-tral weight, is illustrated in Fig. 3, where the reflectivityat T = 82, 90 and 100 K is normalized to the reflectivityat 110 K. This figure illustrate the good overlap betweensubmillimeter and FIR data, collected with two differentinstrumentations (see Section II). The reflectivity ratioR(T )/R(110 K) for these two spectral regions have in-deed differences smaller than the noise of the measure-
FIG. 3: (color online) Ratio of the of the reflectivity spectra at82, 90, and 100 K to the reflectivity at 110 K. Measurementsin the range below 25 cm−1 performed by using the submil-limeter spectrometer (points), data above 25 cm−1 collectedby using Bruker 66v spectrometer (lines). Note the increaseof reflectance below 25 cm−1 at temperatures close to the N– I transition temperature.
ments. Thus we safely confirm that by lowering T below100 K the reflectivity drops in the range 30-100 cm−1
range and increases below, with a redistribution of theoverall spectral weight.
B. Optical conductivity
Frequency dependent conductivity spectra, obtainedby the KKT of the reflectivity, are presented in Fig. 4.In order to better understand the temperature evolutionof the conductivity spectra, and to gain confidence inthe band assignment, we have also fitted the original re-flectivity data with a set of Lorentzians. The resultingconductivity practically coincides with the KKT conduc-tivity, as exemplified for the 300 and 82 K data in theupper panel of Fig. 5. The individual Lorentzians usedin the deconvolution are also shown. In the bottom panelof the Figure we report an enlarged view of the temper-ature evolution of the KKT conductivity vs. the multi-Lorentzian reflectance fit. The logarithmic scale for thewavenumber axis focus attention on the deconvolution ofthe lowest frequency phonon mode, that we shall discussin detail below.
Six peaks are clearly identified in the spectral regionbelow 100 cm−1. We label them ν1 to ν6 in order of in-creasing frequency, as shown in the upper panel of Fig. 5.The temperature evolution of the ν1 to ν6 peak frequen-cies is reported in Fig. 6. In a group of bands with a broadmaximum around 68 cm−1 at T = 300 K, we resolve threemodes (ν6, ν5 and ν4) at lower temperatures. While the
4
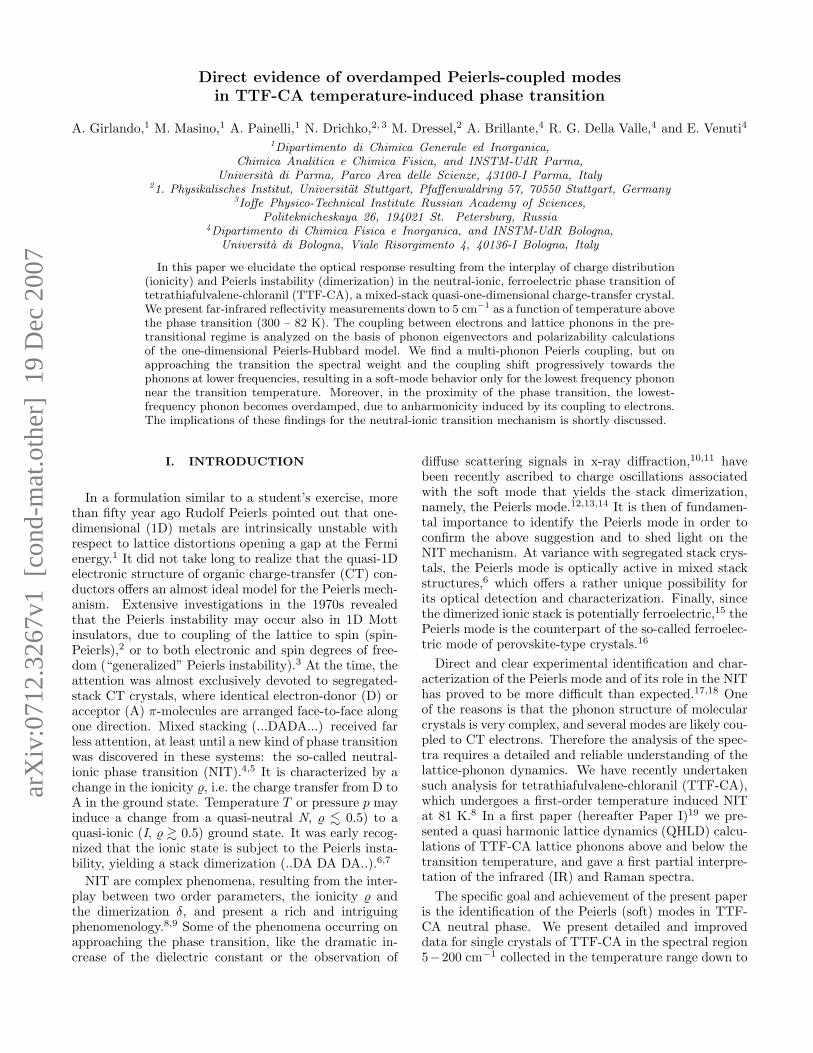
FIG. 4: (color online) Conductivity spectra along the a stackaxis at temperatures above the N – I transition. An errorbar for the absolute values of low frequency conductivity isshown.
high-frequency band shows normal hardening on loweringT , the ν5 and ν4 modes essentially do not change theirpositions. The ν3 band at 47 cm−1 exhibits a very weaksoftening of 2 cm−1 below T = 130 K. The deconvolu-tion of the low frequency region of the room temperaturespectrum suggests the presence of bands around 32 and17 cm−1 (ν2 and ν1), “appended” to the 47 cm−1 band.When going from ambient T to 200 K, the ν1 band shiftsbelow 15 cm−1 and becomes wider. It shifts to even lowerfrequencies and broadens as temperature is reduced, get-ting down to about 5 cm−1 for T = 90 K (Fig. 6), as-suming the shape of a broad background at temperaturesjust above the phase transition (Fig. 5, bottom panel).
The conductivity spectra in Fig. 4 show a huge in-crease of overall intensity by lowering T . A quantitativeestimate of this growth in terms of the spectral weightbetween 0 and 100 cm−1 is shown in Fig. 7a. The inten-sities of the individual bands, estimated by integratingin the relevant spectral region, are reported in the lowerframe. Fig. 7b shows that only some bands gain inten-sity by lowering T : the ν5 and ν4 (estimated as a wholemaximum around 70 cm−1 since the bands are not wellresolved), the ν3 band at 47 cm−1, and the ν1 band. Theintensity of the latter increases only below 100 K.
While the spectral weight increases on cooling, it alsoredistributes towards lower frequency bands. The tem-perature dependence of intensity around 70 cm−1 hassmaller slope below 200 K, whereas the spectral weightof ν3 (47 cm−1) band saturates at temperatures below130 K. At this temperature the intensity of the ν1 bandstarts to rise rapidly. Just above the transition, from 90to 82 K, the ν1 band grows at the expenses of the ν3 one.
With lowering temperature the ν3 and ν1 bands showconsiderable anharmonicity. While at T = 300 K the ν3
band (47 cm−1) can still be fitted with a Lorentzian, it
FIG. 5: (color online) Upper panel: Comparison of the TTF-CA KKT conductivity at 300 K (green line) and 82 K (orangeline) with the fit of reflectivity spectrum by a minimum num-ber of harmonic oscillators. The Lorentzian bands used inthe deconvolution are shown as dashed lines, and the result-ing conductivity as blue lines. Bottom panel: Comparison ofthe KKT conductivity with the multi-Lorentzian fit at twodifferent temperatures. The Lorentz component of the lowestfrequency phonon (ν1) is also shown. Notice the wavenumberlogarithmic scale.
becomes wider and very asymmetric at temperatures be-low 250 K, as its lower frequency wing grows on cooling.The temperature dependence of the full width at halfmaximum (FWHM) of the ν3 band, directly estimatedfrom experimental spectra (Fig. 5, bottom panel), is dis-played in Fig. 8. The same plot shows also the dramaticincrease of the FWHM of the lowest frequency ν1 bandbelow T=100 K, with clear overdamping at temperaturesclose to the transition.
The present analysis of the spectra evidences a veryspecific behavior of ν5, ν4, and especially ν3 and ν1
bands as the temperature approaches the NIT. The bandsclearly correspond to the most strongly coupled Peierlsmodes. By lowering T , they show a huge intensity in-crease, with a concomitant intensity redistribution, and

5
FIG. 6: Temperature dependence of the frequencies of the sixphonons bands observed below 100 cm−1, labeled ν1 to ν6going from the lowest to the highest frequency.
important deviations from Lorentzian bandshape. Below100 K, we also observe appreciable softening and largebroadening for the lowest frequency mode. A quantita-tive explanation of this complex temperature behavior ofthe spectrum is offered by the model discussed in Sec-tion V, while in the next Section we describe the compu-tational methods.
IV. COMPUTATIONAL METHODS
The separation of intramolecular vibrations from in-termolecular, or lattice, phonons is a common and use-ful approximation in dealing with the complex phononspectra of molecular crystals. Thus lattice phonons de-scribe translations and rotations of the rigid molecules(rigid molecule approximation, RMA). In the frameworkof a Hubbard-model description of the electronic struc-ture (see below), the electron-phonon coupling can alsobe separated into two contributions: The totally symmet-ric molecular vibrations are assumed to couple with elec-trons through modulation of on-site energies (electron-molecular vibrational, or Holstein, coupling). On theother hand, lattice phonons and possibly out-of-planemolecular vibrations are expected to modulate the inter-molecular CT integral (Peierls coupling).24
In order to characterize the Peierls coupling in TTF-CA, we have first calculated the lattice phonon frequen-cies and normal coordinates at T = 300 K (N phase) bythe quasi-harmonic lattice dynamic (QHLD) method, asdescribed in paper I.19 The atom-atom potential adoptedin QHLD accounts for van der Waals and Coulomb forces,but does not include the CT interaction. It shouldbe noted that in the calculation we have relaxed theRMA, by actually considering all the phonons below∼ 250 cm−1.
FIG. 7: (color online) (a) Temperature dependence of thespectral weight of the 0− 100 cm−1spectral region (squares),compared with the temperature dependence of (∂P/∂δ)2
(open stars) (Section V). (b) Temperature dependence of thespectral weight of the group of bands around 70 cm−1(ν4 andν5) (rhombs), and of the ν3 (triangles) and ν1 (circles) bands.The lines are a guidance to the eye.
FIG. 8: (color online) Temperature dependence of the fullwidth at half maximum (FWHM) of the ν1 (circles) and ofthe ν3 (triangles) bands in TTF-CA.

6
We describe the strength of Peierls coupling in termsof the linear Peierls-coupling constants:
gi =√
~2ωi
(∂tDA
∂Qi
)eq
(1)
where tDA is the CT integral between adjacent DAmolecules along the stack, and Qi is the normal coordi-nate for the i-th phonon with frequency ωi and wavevec-tor q = 0. The CT integral and its variation with Qi hasbeen calculated by the extended Huckel method, adopt-ing the Wolfsberg and Helmholtz approximation.25 Atthe room-temperature equilibrium geometry, we find t= 0.20 eV, in agreement with current estimates.13 Thegi values, obtained by numerical differentiation, offer areliable indication of the relative magnitude of the cou-pling constants. The Peierls coupling strength of the i-thphonon is given by εi = (g2
i /ωi), and the total couplingstrength, or lattice relaxation energy, is εd =
∑i εi.
The electronic structure of TTF-CA is described interms of a modified Hubbard model with adiabatic cou-pling to molecular and lattice vibrations. Real space di-agonalization of the modified Hubbard Hamiltonian rele-vant to stacks of up to 18 molecules with periodic bound-ary conditions yields reliable information on the groundstate properties.13 The expectation value of the dipolemoment operator and its derivatives are calculated bythe Berry-phase approach.13
V. SPECTRAL MODELING
As discussed in Paper I19 and elsewhere,17,26 in theN phase of TTF-CA the Peierls-coupled phonons trans-form as the Bu species in the C5
2h crystal symmetry, andare IR active with polarization along the stack axis. Weshall therefore restrict our attention to these phonons. InTable I we list the QHLD calculated Bu frequencies forthe equilibrium structure at 300 K,19 and the correspond-ing coupling constants and coupling strength obtained asdescribed in Section IV. The total coupling strength, orlattice relaxation energy, is εd = 0.1 eV. Phonons above250 cm−1 give negligible contribution to εd. As a conse-quence, they are not reported in the Table nor discussedhere. As already mentioned in Section IV, the QHLDinternuclear potential does not include the CT interac-tion, so that values in Table I are the zero-order refer-ence frequencies in the absence of Peierls coupling. Inother words, they correspond to an hypothetical statewith εd = 0 or, equivalently, to a state where the elec-tronic excitations are moved to infinite energy.24 As aconsequence, the frequencies of Table I cannot be di-rectly compared to the experimental frequencies. In fact,phonons with high values of coupling constants are ex-pected to be the most intense in the spectra, and to occurat frequencies lower than the zero-order ones. Thereforewe can for instance anticipate that the ν6 and ν8 modesof Table I correspond to the group of intense bands oc-
TABLE I: Calculated low-frequency Bu phonons of TTF-CAin the N phase. ωi, gi, and εi denote the zero-order frequency,Peierls coupling constant, and coupling strength, respectively.
mode ωi (cm−1) gi (meV) εi (meV)
Bu ν1 27.6 −5.16 7.8
ν2 38.6 8.30 14.4
ν3 55.8 −8.68 10.9
ν4 80.5 −2.16 0.5
ν5 90.5 −9.66 8.3
ν6 99.4 −16.99 23.4
ν7 113.2 −2.27 0.4
ν8 118.5 −20.71 29.2
ν9 134.0 0.08 0.0
ν10 194.3 7.85 2.6
ν11 206.0 −2.43 0.2
ν12 211.3 −2.93 0.3
ν13 250.7 −13.75 6.1
curring around 70 cm−1 (Fig. 4). Incidentally, the eigen-vectors of the ν6 phonon correspond to rigid moleculardisplacements along the stack, whereas the ν8 phononhas a more complex description, being a mixture of TTFtorsional motion and molecular displacement along thestack. Modes above 200 cm−1, on the other hand, arealmost pure intramolecular modes, like for instance theν13 phonon, which essentially corresponds to a TTF out-of-plane motion. Their intensity may then have a signifi-cant “intrinsic” contribution (namely, not due to Peierlscoupling), that is not accounted for in the present modelcalculation.
Both experiment and calculations suggest that severalmodes are appreciably coupled to the CT integral, lead-ing to a multi-mode Peierls coupling. The resulting prob-lem becomes complex because the phonons are mixedthrough their common interaction with the CT electrons.Thus a meaningful comparison with experiment requiresdetailed modeling. The effect of Peierls coupling can bedealt with separately for the phonon frequencies and fortheir IR intensity.13 Accordingly, the analysis will be car-ried out in two steps.
It has been shown that in the presence of Peierlselectron-phonon interaction, the squared perturbed fre-quencies Ω2
j and normal modes coordinates Qj are ob-tained from the diagonalization of the following forceconstant matrix, written in the basis of the reference co-ordinates Qi:27
Fij = ωiωjδij −√ωiωj gigj χb. (2)
In this equation, ωi and gi are the reference frequenciesand coupling constants of Table I, and χb is the electronicresponse to phonon perturbation. The χb values neededto apply Eq. 2 are calculated as described in Ref. 13 bytuning the parameters of the modified Hubbard model asto mimic the behavior of TTF-CA. Since in going from

7
TABLE II: Calculated electronic response χb and squared po-larizability derivative (∂P/∂δ) for different degree of ionicity%. The correspondence between % and T is derived from ex-periment (Ref. 20).
χb (eV−1) (∂P/∂δ)2 % T (K)
5.7971 0.0858 0.197 277
6.1230 0.1034 0.209 247
6.4862 0.1257 0.222 215
6.8944 0.1544 0.236 183
7.3561 0.1919 0.250 153
7.8837 0.2415 0.266 123
8.4927 0.3089 0.282 81
200 to 82 K the TTF-CA ionicity % changes from about0.2 to 0.3;20,23 in the first column of Table II we list theχb values corresponding to different ionicities in this in-terval. By matching the calculated ionicities in the thirdcolumn of the Table with the experimental ones,20 wecan translate the %-dependence of the calculated χb in aT -dependence, as reported in the fourth column of TableII. In this way we can perform a more direct comparisonwith experimental data.
Fig. 9 summarizes the temperature dependence of theperturbed frequencies Ωj below 100 cm−1 calculatedthrough Eq. (2), with the parameters listed in Tables Iand II. The agreement between the calculated frequenciesin Fig. 9 and the experimental ones presented in Fig. 6is very good. First of all, the number of modes below100 cm−1 is the same, namely six. Second, an appre-ciable softening is detected only for the lowest frequencymode, and in the proximity of the phase transition. Theweak softening shown by some higher frequency modes inFig. 9 is likely compensated by the usual frequency hard-ening by lowering T , a factor not included in the model.
The calculations quite naturally explain why – al-though several phonons are coupled to the CT electrons– the red shift of the associated bands on getting closeto the transition is so small. As mentioned above, allthe phonons are coupled together through their commoninteraction with the electronic system. Then, when twophonon frequencies get closer due to a softening of thehigher frequency phonon, there is mixing in the phonondescription, and the softening is “transferred” to thelower frequency phonon. In more precise terms, with low-ering temperature χb increases with % (Table II), leadingto an evolution of the normal modes Qj :
Qj =∑
i
lijQi, (3)
where lij are the eigenvectors obtained, for each tem-perature, by diagonalizing the F matrix of Eq. 2. ThePeierls coupling constants are accordingly modified: Thecoupling constants Gj in the basis of the perturbed nor-mal modes Qj are linear combination of the reference
FIG. 9: Temperature dependence of the Peierls-coupledmodes, calculated by Eq. (2), on the basis of Table I andTable II parameters.
coupling constants:
Gj =∑
i
lijgi
√ωi
~, (4)
and therefore evolve with χb. As a result, on approach-ing the phase transition the coupling strength is progres-sively transferred to the lower frequency modes. Only inclose proximity of the transition all the coupling strengthcollapses to the lowest frequency phonon, yielding sub-stantial softening of this specific mode.
We now turn our attention to the intensity of thephonon bands. For a regular stack (equispaced D andA units along the stack, like N TTF-CA) the IR inten-sity of the Peierls modes is largely dominated by a termaccounting for the charge fluctuations induced by oscilla-tion in the dimerization amplitude δ. For a single Peierlsmode with frequency ωP the total oscillator strength is:13
fP =med
2ω2Pεd
t2
(∂P
∂δ
)2
, (5)
where me is the electronic mass, d the equilibrium dis-tance between D and A molecules, and P the electronicpolarizability per site. The (∂P/∂δ)2 values calculatedfor parameters relevant to N TTF-CA are reported inthe second column of Table II. The temperature depen-dence of the (∂P/∂δ)2 terms compares well with the ex-perimentally determined growth of the spectral weight inthe range of 0-100 cm−1 (Fig. 7).
In the multi-mode Peierls coupling case, the oscilla-tor strength is partitioned among the coupled modes.Specifically, each normal coordinate Qj modulates theCT integral as described by the coupling constants Gj inEq. (4). Using the usual chain-rule, the δ-derivative of Pin Eq. (5) can be rewritten as a sum of Qj derivatives.After some algebra we derive the following expression for

8
the IR oscillator strength of each mode coupled to theelectronic degrees of freedom:
fj =med
2
t2G2
j
(∂P
∂δ
)2
. (6)
We can now use the standard expression for thefrequency-dependent dielectric constant
ε(ω) = ε∞ + 8.96857 · 1010 N
V
∑k
fj
(Ω2j − ω2)− iωΓj
(7)
to calculate the contribution of the Peierls coupled modesto the low-frequency spectra of TTF-CA. The numericalfactor in Eq. (7) refers to N/V (number of molecules perunit-cell volume) expressed in A−3, and the frequenciesΩj , ω, and damping Γj , in cm−1.
The calculated reflectivity is compared to the experi-mental one in Fig. 1 of Section III A. The unperturbedfrequencies and coupling constants needed for the calcu-lation are taken from Tab. I, whereas Γj is set equal to 4.0cm−1 for all the modes. The values of χb = 5.6667 eV−1
and (∂P/∂δ)2 = 0.07922 are obtained from interpolationof the data in Tab. II. In addition, we use d = 3.7 A,N/V = 4.92386 · 103 A−3 (Ref. 26), and t = 0.2 eV.The CT electronic transition is added in the calculationas an extra term in Eq. (7), where fCT, ΩCT and ΓCT
are derived directly from experiment.22 Finally, we putε∞ = 2.5 to account for the high-energy contributions.
Fig. 1 shows a very good agreement between modelcalculation and experiment, considering all the approx-imations involved in the model and in the estimate ofthe parameters, in particular of the gi. The frequen-cies are somewhat off, but well within the usual errors ofQHLD calculations (± 10 cm−1). The calculated oscil-lators strengths for the lower frequency modes are just alittle below the experiment. The agreement for the oscil-lator strength of the phonons at higher frequencies is notexpected to be exact, because these phonons have intra-molecular character and, as discussed above, may have anon-negligible “intrinsic” intensity. The simulation indi-cates that at room temperature the most strongly cou-pled modes cluster around approximately 70− 80 cm−1.
The discussion in Section III puts in evidence a quitecomplex evolution of TTF-CA spectra with temperature.Such behavior is qualitatively reproduced by the calcu-lation. An overall increase of reflectivity by lowering Tis brought in by the increase in (∂P/∂δ)2, and the shiftof spectral weight towards lower frequency is accountedfor by the change in the coupling constants Gj , as dis-cussed after Eq. (4). However, we can gain a better in-sight into the factors affecting the temperature evolutionof the spectra if better agreement between experimentand simulation is achieved. To such aim, Tab. I frequen-cies and coupling constants are used as starting valuesfor a nonlinear fitting procedure based on Eqs. (2) and(4) to (7).
FIG. 10: Experimental (thick line) and calculated (thin line)low-frequency reflectivity spectra of TTF-CA, parallel polar-ization, at three different temperatures.
FIG. 11: (color online) Calculated ratio of reflectance of thespectra below 110 K to the spectrum at 110 K.
The variation of the frequencies and of the oscillatorstrengths with increasing % (lowering T ) is induced inthe model by the corresponding increase in both χb and(∂P/∂δ)2, as detailed in Table II. However, it is clearfrom experiment that also the bandwidths (damping) Γj
change with T . In the model, the bandwidths are addi-tional parameters, but in the fit we choose to correlatethem to the anharmonicity introduced by the electron-

9
phonon coupling. Following Fano,28 we impose the fol-lowing relationship to Γj (in cm−1):
Γj = kG2
j
Ωj+ 2.0 = k ηj + 2.0. (8)
On top of the intrinsic linewidth of 2.0 cm−1, theelectron-phonon coupling gives an additional contribu-tion proportional to ηj = G2
j/Ωj . The proportionalityfactor k adds just one extra adjustable parameter to thefit, and Eq. (8) represents a strong constrain. The fitshows a high sensitivity of spectra on the adjustable pa-rameters. Thus a variation of the unperturbed frequen-cies ωi or of the coupling constants gi by a few per cent,may profoundly alter the shape of the calculated spec-tra, especially in the case of the strongly coupled modeswhich cluster around 70−80 cm−1. For this reason, it is achallenge to obtain a satisfactory fit at all temperatures.
Fig. 10 illustrates the results of the fit of the reflectivityspectra at three temperatures. The fit is restricted to thespectral region below 150 cm−1, so that the CT transitionand its variation with temperature22 is simulated by ε∞.Furthermore, we allow the frequencies ωi to increase bya few wavenumber on lowering T , in order to simulatethe usual hardening due to thermal contraction. Thecoupling constants and the proportionality factor for thedamping, k, are instead kept temperature independent.
Albeit not all details of the spectrum are precisely re-produced, the essential features are caught: By loweringthe temperature the reflectivity increases, with a redistri-bution of the oscillator strengths and of the bandwidthsas the spectral weight shifts towards lower frequencies.The downshift of spectral weight becomes more dramaticjust before the phase transition. This is clearly demon-strated in Fig. 11, which resembles the experimental be-havior reported in Fig. 3. The shift of the spectral weightis accompanied by an increase of the bandwidth of theν1, lowest frequency phonon, which becomes overdampedaround 100 K and below (Fig. 10). The experimentallyobserved overdamping of the ν1 phonon in Fig. 8 is thenexplained by the transfer of the entire electron-phononcoupling strength to this phonon just before the phasetransition, with associated increase of anharmonicity.
VI. DISCUSSION AND CONCLUSIONS
In this paper we have presented temperature depen-dent polarized reflectivity spectra collected down to5 cm−1 for TTF-CA crystals above the NIT. A detailedtheoretical analysis of the data has allowed us to offer thefirst direct identification of the Peierls softening mecha-nism.
An indirect experimental evidence of the softening oflattice vibrations in TTF-CA was offered by the occur-rence of combination (two-phonon) bands in vibrationalspectra collected in the region of the intramolecular vi-brations (mid-IR).20 Several broad bands were found in
FIG. 12: (color online) Experimental (taken from Ref. 20)and calculated frequency (squares) of the effective soft mode.
IR spectra of TTF-CA that could not be assigned to fun-damental modes. These bands, whose intensity increaseson approaching NIT, are symmetrically located at thelow and high frequency side of a Raman band assigned toa totally-symmetric molecular vibration. The two side-bands are then assigned to the sum and difference combi-nations of the totally-symmetric molecular vibration witha lattice phonon. The frequency of this lattice phononlowers from about 70 cm−1 to about 20 cm−1 when go-ing from room temperature to 81 K, as illustrated bythe dots in fig. 12. In the light of the present work, in-dicating a multi-mode Peierls coupling, the soft-phononinferred from the analysis of combination bands must cor-respond to an “effective” Peierls phonon, resulting fromthe weighted contribution of the several Peierls-coupledmodes.
Specifically, the side-bands in the mid-IR region re-sult from the combination of a totally symmetric molec-ular vibration with a superposition of several Bu modes.Thus the apparent peak frequency of the effective softmode, Ωeff , is the weighted average of the frequencies ofthe Peierls phonons. In order to calculate Ωeff from thespectral simulation discussed in the previous Section, weadopt the following expression:
Ωeff =
∑j ηjΩj∑
j ηj, (9)
where each frequency is weighted by ηj , the same factorentering the definition of vibrational linewidth in Eq. (8),and connected to the strength of the Peierls coupling.The computed value of Ωeff is compared with experi-ment in Fig. 12. The very good agreement between theeffective phonon frequency obtained from the analysis ofcombination bands in the mid-IR region and of lattice
10
phonons in the far-IR region strengthen our interpreta-tion of the spectroscopic data in terms of a soft mode.Quite interestingly, the same effective soft mode of TTF-CA quantitatively accounts for the peaks observed in thediffuse X-ray scattering data.14
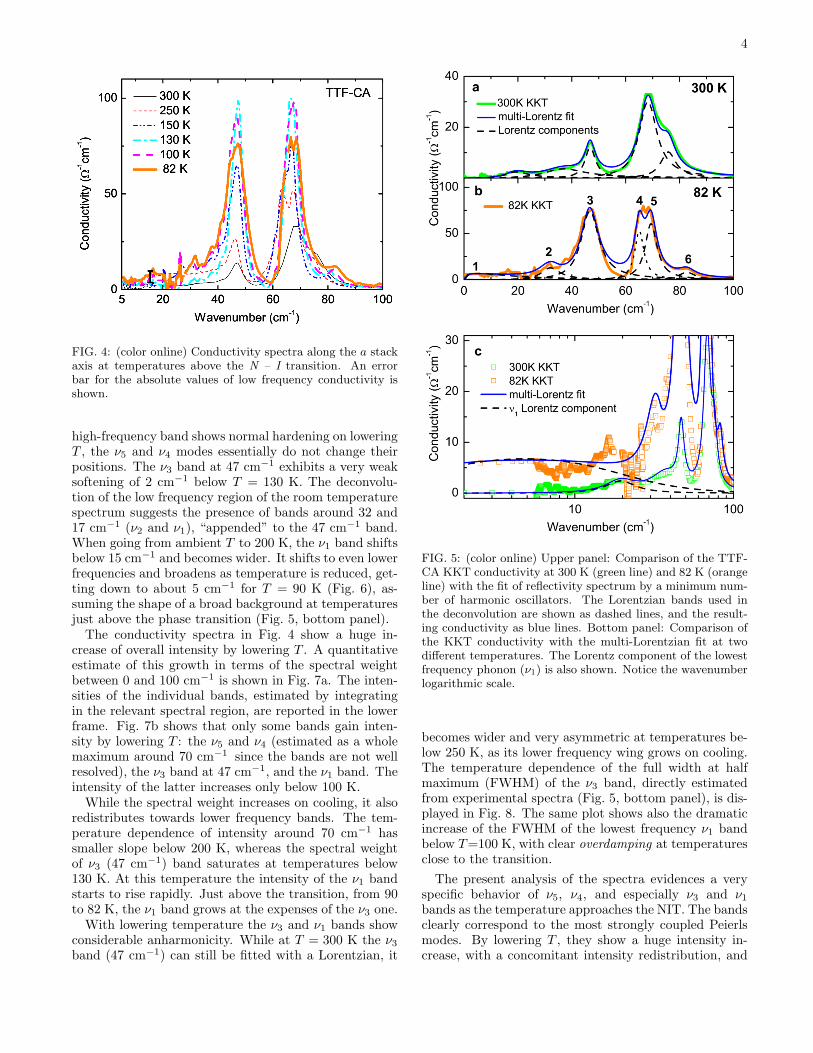
The softening of the lattice phonons, combined withthe increase of their intensity on approaching NIT leadsto very large vibrational contributions to the dielectricconstant.12,13 By using the parameters found in the fitof reflectivity spectra, we can also estimate the tempera-ture evolution of the static dielectric constant, ε1, whichcorresponds to the zero-frequency real part of the dielec-tric constant in Eq. 7. As shown in Fig. 13, the presentestimate of ε1 agrees very well with available experimen-tal data, strongly supporting the vibrational origin of thedielectric anomaly at NIT, as due to the large charge os-cillations associated with the Peierls modes.12,13
Data analogous to the present ones have been previ-ously reported Okimoto et al.,18 who discussed the reflec-tivity spectra along the stack of TTF-QBrCl3 (QBrCl3:2-bromo-3,5,6-trichloro-p-benzoquinone), a CT crystalsimilar to TTF-CA that undergoes the NIT with con-tinuous evolution of ionicity. However, in that work thereflectivity data have been collected only from 650 downto 25 cm−1, so that the subsequent KKT transformationis delicate, and the discussion of conductivity spectra out-side the experimentally accessed region should be takenwith caution. In any case a broad band was enucleatedfrom conductivity spectra which softens, without majorbroadening, from about 60 cm−1 at 293 K to about 10cm−1 just above the critical temperature (71 K). Thisband was not ascribed to a soft mode, but rather to thepinned mode of the so-called neutral-ionic domain walls(NIDW).18 Whereas more extensive measurements arerequired to fully address this issue, our work on TTF-CA sheds doubts on this interpretation.
NIDWs were introduced theoretically by Nagaosa7 ascharged boundaries of I dimerized domains excited in thehost N regular chain. Quite interestingly, they were orig-inally restricted to the close proximity of discontinuousNIT, while the energy of the domains is often too largeto allow for thermal population.29 However, NIDWs havebeen quite often invoked to explain the rich phenomenol-ogy of NIT.8,9 In particular, the above mentioned dielec-tric anomaly and the combination bands in mid-IR spec-tra were initially attributed to NIDWs,30 as well as thepeak in the diffuse X-ray signal.11 As discussed above,this paper gives definitive support to a different picturethat, without invoking exotic excitations, quantitativelyexplains the rich and variegated phenomenology of NITto the increase of the effective Peierls coupling on ap-proaching NIT. In this way different and apparently un-related phenomena are all naturally and quantitativelyexplained in terms of the softening of lattice phononscoupled via a Peierls mechanism to delocalized electrons.
The definitive and unambiguous support to the abovepicture is obtained by a careful analysis of the far-IR
FIG. 13: (color online) Experimental (taken from Ref. 10)and calculated [Eq. (7)] static dielectric constant of TTF-CAas a function of temperature.
spectral region to directly identify the Peierls modes. Theanalysis is non-trivial: apart from the requirement forvery refined experimental data extending down to verylow-frequency, the spectral interpretation is based on amodel for multi-mode Peierls coupling that combines lat-tice dynamics (QHLD) calculations with the modifiedHubbard-model for the electronic structure. In fact, inthe presence of several phonons the multi-mode Peierlssoftening is a complex phenomenon: the mode descrip-tion changes on approaching the transition, with associ-ated mode mixing, intensity redistribution and broaden-ing. In the course of this mixing, the softening “jumps”from one mode to the nearest one below, until in the prox-imity of the phase transition all the softening is trans-ferred to the lowest frequency mode. The mechanism,evident in the simulation presented in Fig. 9, explainsthe softening observed in Fig. 6 and the temperaturebehavior of mode intensities and linewidths in Fig. 7.The increase of the electronic susceptibility as the sys-tem is driven towards the NIT implies an increased effec-tive coupling, and accordingly the spectral weight shiftstowards zero frequency for T < 100 K. Indeed, in thistemperature range the Peierls coupling is almost com-pletely transferred to the lowest-frequency mode. At thesame time, the relevant bandwidth broadens, finally lead-ing to an overdamped behavior. For this reason, in thespectra we just see the reflectivity increase towards zerofrequency (Figs. 2 and 3), without being able to actuallydetect the full absorption. Overdamping has been oftenobserved in ferroelectric phase transitions.16 In the caseof TTF-CA, we are able to provide the microscopic originof this effect.

11
VII. ACKNOWLEDGMENTS
The single crystals were kindly supplied by N.Karl (Universitat Stuttgart). The work in Italywas supported by the Ministero Istruzione, Universita
e Ricerca (MIUR), through FIRB-RBNE01P4JF andPRIN2004033197 002, and in Stuttgart Universityby the Deutsche Forschungsgemeinschaft (DFG). N.D.thanks the Alexander von Humboldt foundation and theScientific schools grant NSH-5596.2006.2 for the support.
1 R. E. Peierls,Quantum Theory of Solids (Oxford, Claren-don, 1955), p. 108.
2 H. M. McConnell and R. J. Lynden-Bell, J. Chem. Phys.36, 2393 (1962); D. D. Thomas, H. J. Keller, and H. M.McConnell, J. Chem. Phys. 39, 2321 (1963).
3 J. W. Bray, L. V. Interrante, I. S. Jacobs, J. C. Bonner,Extended Linear Chain Compounds, Vol. 3, edited by J. S.Miller, (Plenum, New York, 1983).
4 J. B. Torrance, J. E. Vazquez, J. J. Mayerle, and V. Y.Lee, Phys. Rev. Lett. 46 (1981) 253.
5 J. B. Torrance, A. Girlando, J. J. Mayerle, J. I. Crowley,V. Y. Lee, P. Batail, and S. J. LaPlaca, Phys. Rev. Lett.47 (1981) 1747.
6 A. Girlando and A. Painelli, Phys. Rev. B 34, 2131 (1986).7 N. Nagaosa and J. Takimoto, J. Phys. Soc. Japan 55, 2737
(1986).8 A. Girlando, A. Painelli, S. A. Bewick, and Z. G. Soos,
Synth. Metals 141, 129 (2004).9 S. Horiuchi, R. Kumai, Y. Okimoto, and Y. Tokura, Chem.
Phys. 325, 78 (2006).10 S. Horiuchi, Y. Okimoto, R. Kumai, and Y. Tokura, J.
Phys. Soc. Jpn. 69, 1302 (2000).11 M. Buron-Le Cointe, M. H. Lemee-Cailleau, H. Cailleau,
S. Ravy, J. F. Berar, S. Rouziere, E. Elkaim, and E. Collet,Phys. Rev. Lett. 96, 205503 (2006).
12 L. Del Freo, A. Painelli, and Z. G. Soos, Phys. Rev. Lett.89, 027401 (2002).
13 Z. G. Soos, S. A. Bewick, A. Peri, and A. Painelli, J. Chem.Phys. 120, 6712 (2004).
14 G. D’Avino, A. Girlando, A. Painelli, M. H. Lemee-Cailleau, and Z. G. Soos, Phys. Rev. Lett. 99, 156407(2007).
15 Y. Tokura, S. Koshihara, Y. Iwasa, H. Okamoto, T. Ko-matsu, T. Koda, N. Iwasawa, and G. Saito, Phys. Rev.Lett. 63, 2405 (1989).
16 T. Nakamura, J. Phys. Soc. Japan 21, 491 (1966).17 A. Moreac, A. Girard, Y. Dulugeard, and Y. Marqueton,
J. Phys.: Condens. Matter 8, 3553 (1996).18 Y. Okimoto, S. Horiuchi, E. Saitoh, R. Kumai, and Y.
Tokura, Phys. Rev. Lett. 87, 187401 (2001).19 M. Masino, A. Girlando, A. Brillante, R. G. Della Valle,
E. Venuti, N. Drichko, and M. Dressel, Chem Phys. 325,71 (2006).
20 M. Masino, A. Girlando, and Z. G. Soos, Chem. Phys.Lett. 369, 428 (2003).
21 C. C. Homes, M. Reedyk, D. A. Cradles, and T. Timusk,Applied Optics 32, 2976 (1993).
22 C. S. Jacobsen and J. B. Torrance, J. Chem. Phys. 78, 112(1983).
23 A. Girlando, F. Marzola, C. Pecile, J. B. Torrance, J.Chem. Phys. 79, 1075 (1983).
24 A. Girlando and A. Painelli, J. Chem. Phys. 84, 5655(1986); C. Pecile, A. Painelli, and A. Girlando, Mol. Cryst.Liq. Cryst. 171, 69 (1989).
25 A. Landrum and W. V. Glassey, “bind” (ver 3.0), dis-tributed as part of the extended Huckel molecular orbitalpackage (YaHEmop), freely available on the WWW at:http://sourceforge.net/projects/yaehmop/
26 M. Le Cointe, M. H. Lemee-Cailleau, H. Cailleau, B.Toudic, L. Toupet, G. Heger, F. Moussa, P. Schweiss, K.H. Kraft, and N. Karl, Phys. Rev. B 51, 3374 (1995).
27 A. Painelli and A. Girlando, Phys. Rev. B 37, 5748 (1988),and Phys. Rev. B 39, 9663 (1989).
28 U. Fano, Phys. Rev. 124, 1866 (1961).29 Z. G. Soos and A. Painelli, Phys. Rev. B 75, 155119 (2007).30 S. Horiuchi, Y. Okimoto, R. Kumai, and Y. Tokura, J.
Phys. Soc. Japan 69, 1302 (2000), and J. Am. Chem. Soc.123, 665 (2001).
Related Documents

![chapter7 2017 [호환 모드] - HANSUNGkwangho/lectures/EE_Lab/2017/chapter7_2017.pdfcapacitor, and a inductor are connected in series. ... an overdamped oscillator For critically](https://static.cupdf.com/doc/110x72/5e3c2e842a0e9075cf5db01f/chapter7-2017-eeoe-hansung-kwangholectureseelab2017chapter72017pdf.jpg)


![Photoinduced Electron Transfer from a Tetrathiafulvalene- … · 2018-06-29 · S1 Supporting Information for: Photoinduced Electron Transfer from a Tetrathiafulvalene-Calix[4]pyrrole](https://static.cupdf.com/doc/110x72/5f26d02108ff525e716b54bc/photoinduced-electron-transfer-from-a-tetrathiafulvalene-2018-06-29-s1-supporting.jpg)

