2 0 1 3 ESP Working Paper Series 2013 No. 48 Dimensions and Implications of Privatization of Education in Nepal “The Case of Primary and Secondary Schools” Dr. Govind Subedi Madan Gopal Shrestha Raju Maharjan Mukti Suvedi Friends of Sankhu, Kathmandu, Nepal SPECIAL SERIES The Privatisation in Education Research Initiative

Welcome message from author
This document is posted to help you gain knowledge. Please leave a comment to let me know what you think about it! Share it to your friends and learn new things together.
Transcript
2013ESP Working Paper Series
2013 No. 48
Dimensions and Implications of
Privatization of Education in Nepal
“The Case of Primary and Secondary Schools”
Dr. Govind SubediMadan Gopal Shrestha
Raju MaharjanMukti Suvedi
Friends of Sankhu, Kathmandu, Nepal
SPECIAL SERIESThe Privatisation in Education Research Initiative
The Open Society Foundations work to build vibrant and tolerant democracies whose governments are accountable to their citizens. Working in every part of the world, the Open Society Foundations place a high priority on protecting and improving the lives of people in marginalized communities.
www.opensocietyfoundations.org
The Education Support Program and its partners support activism, research, policy, and pratices that promote education justice. Education justice involves the right of nondiscrimination in education access and the unequal distribution of resources to achieve more equal outcomes in education achievement. Central issues and activities include supporting the renewal and rebuilding of education systems in post confl ict countries, promoting equal education and inclusion for marginalized groups, strengthening critical thinking and education quality, and helping civil society play a progressive and engaged role in the education reform process. The program implements its strategies and programs internationally with particular focus given to Africa, Central Asia, the Caucasus, Europe, the Middle East, Russia, and South and South East Asia.
The Education Support Program’s Working Paper series disseminates information about research involving ESP-supported issues to educators, researchers, teachers, and education policy makers. To access other ESP Working Papers, please contact: Piroska Hugyecz [email protected]
The Privatisation in Education Research Initiative (PERI) is a global research and networking initiative seeking to animate an accessible and informed public debate on alternative education provision. In particular, it examines the social justice implications of changes in the coordination, fi nancing and governance of education services.
WORKING PAPER
Dimensions and Implications of
Privatization of Education in Nepal
“The Case of Primary and Secondary Schools”
Dr. Govind SubediMadan Gopal Shrestha
Raju MaharjanMukti Suvedi
Friends of Sankhu, Kathmandu, Nepal
2013 No. 48
SPECIAL SERIES
The Privatisation in Education Research Initiative
The Privatisation in Education Research Initiative (PERI) is a global research and networking initiative seeking to animate an accessible and informed public debate on alternative education provision. In particular, it examines the social justice implications of changes in the coordination, fi nancing and governance of education services.
WORKING PAPER
Dimensions and Implications of Privatization of Education in Nepal2
About the Authors
DR. GOVINDA SUBEDI received his PhD at Jawharlal Nehru University in New Delhi, and currently works as Associate Professor of the Central Department of Population Studies at the Tribhuvan University in Nepal. He has been engaged in research for over 18 years and has worked with a wide variety of organizations including the International Labour Organization (ILO), PLAN Nepal, British Nepal Medical Trust, Adam Smith International, the Danish Church, the Ministry of Population and Environment and the Ministry of Women. He is the Chief Editor of the Population Journal and has published more than a dozen articles in national as well as international journals and books.
MR MANDAN GOPAL SHRESTHA is the founder and president of Friends of Sankhu (FOS) and lecturer at Tribhuvan University, Nepal. He holds an M.Phil Degree in Population Studies and is pursuing his PhD at Lumbini Boudha University, Nepal. Mr. Shrestha has published several articles and continues to work with a number of international partners on rural development projects in Nepal.
MR RAJU MAHARJAN holds a Master Degree in Sociology and LLB from Tribhuvan University, Nepal. He has worked as a researcher and development facilitator since 1995.
MR MUKTI SUVEDI earned his Master Degree in Applied Confl ict Transformation Studies at the Pannasastra University of Cambodia. He has more than twelve years` experience of working with NGOs on peace building. He has been a visiting lecturer of Tribhuvan University and Executive Secretary and Head of the Peace Department at Caritas in Nepal. Mr Suvedi is a training expert on peace building, reconciliation, confl ict transformation, strategy planning and organizational development.
WORKING PAPER
Dimensions and Implications of Privatization of Education in Nepal 3
Abstract
This study aimed to explore the magnitude and dimensions of privatization of school education in Nepal, especially focusing on disparities in attendance and parents’ perception in private schools. This study utilized both primary and secondary information. Secondary information was obtained from government reports and the Nepal Living Standards Survey 2010/11 data. Primary data were collected from a household survey, a school survey, key informant interviews and a workshop. The household and school surveys cover 12 districts with the highest concentration of private schools but and representing all development regions in the country. A total of 1,224 households and 132 schools were surveyed.
The key fi ndings of the study are (1) the share of private schools in Nepal has been increasing over the years; (2) there is disparity in school attendance by gender, social group, economic strata and place of residence; (3) parents’ perceive that private education provides their children with quality education and hence are increasingly inclined to send children to private schools; and (4) private schools have, however, yet to comply with the equity provisions in school education required by the government. The study concludes that private schools in Nepal have evolved at a time when globalization of education has been taking place and private schools have contributed to 20 percent of enrollment in school education in Nepal. At the same time, there is indication that disparity in education prevails. In order to reduce this inequity, there is an urgent need to improve the quality of education in public schools through building effective public-private partnerships. Also necessary is effective monitoring in private schools to make them more accountable to students and to ensure equity in education in Nepal.
WORKING PAPER
Dimensions and Implications of Privatization of Education in Nepal4
Table of Contents
List of Figures and Tables .......................................................................................... 6
1. Introduction .......................................................................................................... 8
1.1 The Research Context .................................................................................. 8
1.2 Objectives of the Research .......................................................................... 9
1.3 Research Methods ....................................................................................... 9
1.3.1 Household Survey .............................................................................. 10
1.4 Sampling Allocation and Determining the Sample Size ............................ 11
1.5 School Surveys ............................................................................................. 12
1.6 Survey Instruments ...................................................................................... 12
1.7 Data Management and Analysis .................................................................. 14
1.8 Organization of the Report .......................................................................... 14
2. The Privatization of Schools in Nepal ................................................................. 15
2.1 Defi ning the Education System in Nepal .................................................... 15
2.1.1 Similarities and Differences between Public and Private Schools ... 16
2.2 Evolution of Private Schools in Nepal: Policies and Legal Context ............ 18
2.3 Regulation Mechanisms of Private Schools ................................................ 19
2.4 Status of Compliance of Legal Requirements in Private Schools .............. 20
2.4.1 Minimum Qualifi cation and Training of Teachers ........................... 20
2.4.2 Salaries and Benefi ts of Private School Teachers ............................. 21
2.4.3 License Holding ................................................................................. 21
2.4.4 School Management Committees (SMCs) ....................................... 21
2.4.5 Curriculum ......................................................................................... 22
2.4.6 Determination of Student Fee Structure ........................................... 22
2.5 Confl ict of Interest between Government, Private Schools and Teachers .. 24
3. Extent and Trends of Private Schools and Teachers and Share in Enrollment Rates .............................................................................................. 27
3.1 Extent of Private Schools ............................................................................. 27
3.2 Proportion of Private School Teachers ........................................................ 28
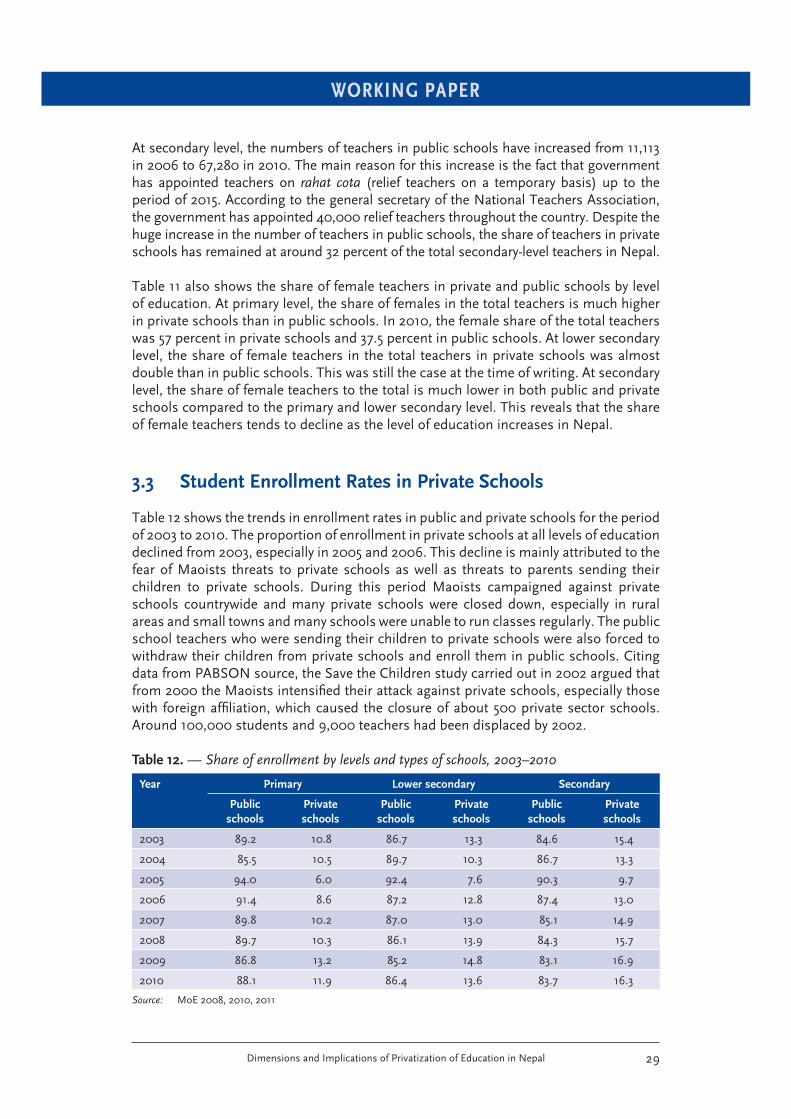
3.3 Student Enrollment Rates in Private Schools ............................................. 29
3.4 Socioeconomic Differentials among Students Attending Public and Private Schools ...................................................................................... 30
3.4.1 Rural/Urban Differentials in School Attendance by Types of Schools ............................................................................................... 30
3.4.2 Gender Variation in School Attendance by Type of School .............. 32
WORKING PAPER
Dimensions and Implications of Privatization of Education in Nepal 5
3.4.3 Income Variation in School Attendance of Types of School ............ 33
3.4.4 Variation in Attendance of Types of School by Social Groups ......... 36
3.4.5 Interface between Social Groups and Consumption Quintal and Type of School Attended .................................................................... 37
3.5 Profi le of Private Schools: The Results of the School Survey ..................... 38
3.5.1 Student–Teacher Ratio ...................................................................... 40
4. People’s Perceptions of Private Schools ............................................................. 42
4.1 Perception of Private Schools ...................................................................... 42
4.2 Perception of Public Schools ....................................................................... 44
4.3 Reasons for Preferring Private Schools to Public Schools ......................... 45
4.3.1 Parents’ Involvement in School Activities by Types of School ......... 46
4.4 Parents’ Perception of Children’s Achievement in Private Schools ........... 48
4.5 Household Expenditure on Education ........................................................ 49
4.6 Education as a Means for Social Mobility and Social Capital .................... 50
5. Implications of Privatization of Education in Nepal ........................................... 52
5.1 Contribution to Achieving MDGs ................................................................ 52
5.2 High Degree of Stratifi cation in Education ................................................. 52
5.3 Social Justice in Education: the Provision of Scholarships ........................ 53
5.4 Good Practices of Private Schools: Can They Be Adopted by Public Schools? ....................................................................................................... 56
6. Discussion and Conclusions ............................................................................... 58
6.1 Summary and Discussion ............................................................................ 58
6.1.1 Understanding Private Schools ......................................................... 58
6.1.2 Extent and Variation in School Attendance at Public and Private Schools ........................................................................... 59
6.1.3 People’s Perceptions of Private Schools ........................................... 60
6.1.4 Implications of Privatization of School Education ........................... 60
6.2 Conclusions .................................................................................................. 61
References ................................................................................................................... 63
Appendices ................................................................................................................. 64
Appendix A: Distribution of private schools as of April 2011, Nepal ................. 64
Appendix B: List of Key Informant Interviews .................................................... 67
Appendix C: Basic criteria for classifi cation of community and private schools as per the Education Regulation 2003, Sub-clause 145 (1) ........... 69
Appendix D: Basic criteria for classifi cation of institutional schools as per the Education Regulation 2003, Sub-clause 145 (1) ............................ 72
WORKING PAPER
Dimensions and Implications of Privatization of Education in Nepal6
List of Boxes, Figures, and Tables
Box 1. Profi le of a C grade private school, Kathmandu Valley ........................... 21
Box 2. Profi le and objectives of private school organizations in Nepal ............ 25
Box 3. Profi le and demands of the Nepal Institutional School Teachers’ Union—Nepal (N-ISTU) .......................................................................... 26
Figure 1. Types of school in Nepal ......................................................................... 15
Table 1. Sample regions and districts ................................................................... 10
Table 2. Sample districts and sampling locations ................................................ 11
Table 3. Sample allocation ..................................................................................... 12
Table 4. List of key informants interviewed .......................................................... 13
Table 5. Similarities and differences between private and public schools in operational modality ............................................................................ 17
Table 6. Percentage of teachers training by training status of public schools, Nepal ........................................................................................................ 20
Table 7. The monthly fee structure of grade C and D schools ............................. 22
Table 8. Additional costs at grade A and B schools ............................................. 22
Table 9. Examples of additional fees charged by private schools ........................ 23
Table 10. Distribution of private schools as of April 2011, Nepal .......................... 27
Table 11. Number of teachers and percentage of total private school teachers ... 28
Table 12. Share of enrollment by levels and types of schools, 2003–2010 ........... 29
Table 13. Percentage share of enrollment in private schools by gender and level of education, Nepal ......................................................................... 30
Table 14. Percentage share of enrollment in private school by rural/urban areas and level of education, Nepal ........................................................ 31
Table 15. Percentage distribution of individuals currently attending school (grades 1 to 10)by place of residence and types of school attendance .. 31
Table 16. Percentage share of enrollment in private schools by gender and level of education, Nepal ......................................................................... 32
Table 17. Percentage distribution of individuals currently attending school (grades 1 to 10) by sex and types of school, Nepal................................. 33
Table 18. Percentage distribution of individuals currently attending school by quintile and types of school, Nepal .................................................... 34
Table 19. Percentage distribution of students currently attending private schools (grades 1 to 10) by consumption quintile according to types of school, Nepal ....................................................................................... 35
WORKING PAPER
Dimensions and Implications of Privatization of Education in Nepal 7
Table 20. Percentage distribution of individuals currently attending school by social groups and types of school, Nepal .......................................... 36
Table 21. Percentage distribution of students currently attending public or private schools (grade 1–10) by social groups and economic strata ..... 38
Table 22. Number of private schools visited by districts/regions, Nepal ............. 39
Table 23. Percentage of private schools (profi t-sharing, not trust schools) with physical facilities and additional human resources, Nepal ............ 40
Table 24. Number of schools, students, teachers and student–teacher ratio, urban Nepal ............................................................................................. 41
Table 25. Main reasons for selecting private schools ............................................ 42
Table 26. Parents’ perception of private schools, according to whether their children attend public or private schools, Nepal .................................... 43
Table 27. Parents’ perception of public schools according to whether their children attend private or public schools ................................................ 44
Table 28. Characteristics of parents’ perceptions of private schools and public schools, Nepal ......................................................................................... 45
Table 29. Participation in school activities.............................................................. 46
Table 30. Parents’ perception on children’s progress in private schools .............. 48
Table 31. Percentage viewing graduates of private schools as better than graduates of the public schools .............................................................. 49
Table 32. Per capita annual education expenditure by level of education, Nepal (in Nepali rupees) ......................................................................... 50
Table 33. Percentage of students provided full or partial scholarship by private schools (Number of schools=132) .......................................................... 54
Table 34. Percentage of students who received scholarships during the last 12 months and types of scholarship received, Nepal ............................. 54
Table 35. Percentage of students who received any type of scholarship during the last 12 months by types of school (grades 1 to 10), Nepal ............... 55
Table 36. Overview of school-leaving certifi cate examination results for regular students, 2011, Nepal .................................................................. 57
WORKING PAPER
Dimensions and Implications of Privatization of Education in Nepal8
1. Introduction
1.1 The Research Context
Research in education in Nepal primarily focuses on the status of education—gross enrollment, net enrollment rates and achievement status. The Department of Education (DoE) publishes a half-yearly Flash Report showing the status of education in Nepal. The report, however, does not analyze and compare the education performance of the private and public schools, the role of the private sector in quality education and the implication of mushrooming private schools in social cohesion in the already highly stratifi ed Nepalese society (in caste, class, gender and regional dimensions). The Nepal Living Standards Survey 2010/11—a nationally representative household survey—has also collected information about current school attendance by types of schools—private or public and others, but it has not been analyzed in detail (CBS 2011). Martha Caddell (2007) discussed how private schools faced challenges due to the political turmoil in Nepal in the early 2000s. Drawing on the qualitative information generated through private school principals, private school organizations and others, she discussed how the Maoist insurgency led to tension among private schools providers, state and citizens. Hundreds of private schools were closed down and thousands of students were withdrawn from the private schools or were shifted to a more secure place. Key demands of the Maoist insurgents were related not only to the high fee structure that the private schools were reportedly charging but also to political issues. The instability and threats led to private schools agreeing on to reduce their fee by 15 to 20 percent and to register schools under the Company Act so that they could be brought under the tax system of the Ministry of Finance. As the government could not provide security to the private school providers, these schools established a link with the global agenda of Education for All and allied with UNICEF’s slogan of “schools as zone of peace,” Caddell’s thesis provides a vivid narrative of how private providers in education survived during the political turmoil in Nepal and how private schools were targeted as a means for achieving political goals. However, she did not discuss in detail how private schools were largely concentrated in more prosperous areas and how relatively better off families were inclined to send their children to private schools.
Thus, there is a research gap in understanding the dynamics of privatization in education in Nepal. It is especially important to challenge two contemporary perspectives related to privatization in education in Nepal. One perspective held by the Maoist party bluntly opposes the privatization of education and argues that it has perpetuated inequality in education and even reinforced prevailing social stratifi cations. The other perspective, held by reformers, is that privatization of school has contributed to enhancing the quality of education in Nepal and also to achieving Education for All by 2015. They also argue that it has contributed to minimizing the capital fl ow abroad as fewer graduates study overseas. These perspectives have been corroborated by robust empirical studies and also appear to provide a partial understanding of the implications of privatization of education.
Education is the great equalizer an unequal distribution of knowledge is or will be the primary source of inequality in Nepalese society (Nepal South Asia Center 1999). Education provides the “cultural capital,” which refers to the forms of knowledge, skills, and any advantages a person has that give him or her a higher status in society.
WORKING PAPER
Dimensions and Implications of Privatization of Education in Nepal 9
While family is the primary agent of socialization, school is where children must learn innovative ideas and discover cultural heritage. Thus, education must provide equal opportunities for all diverse groups including religious and ethnic minorities, linguistic groups, the most deprived, the disabled and the extremely poor (Gramsci in Hoare and Geoffrey 2007).
Private schools in Nepal have emerged with the growth of the middle class, and the increased proportion of people living in urban and semi-urban areas. Currently 22 percent of the population is said to be middle class. The proportion of people living in urban areas increased from merely 10 percent in 1991 to 17 percent in 2011 (CBS 2011a). To some extent, the income level of people has also increased due to the opportunities provided by foreign labor employment and the growth of carpet and garment industries and non-governmental organizations (NGOs) in the country. Nearly 23 percent of the GDP is contributed by foreign employment and 31 percent of the income in Nepalese households comes from remittance (CBS 2011). On the other hand, there is a huge proportion of the population living in the rural areas (83 percent) without adequate food and clothing, which are largely unaware or not able to provide a good education for their children.
1.2 Objectives of the Research
The overall objective of this study is to analyze the magnitude of private education in Nepal and examine the parents’ perception of private education. The specifi c research questions are:
1. What is the management and operation modality of private schools? What are the magnitude and processes of privatization, especially in the less prosperous areas? How do private schools align their interests with government policies?
2. How do people, especially the middle class, view the importance of education for their children? Has education provided a means of social mobility?
3. What, if any, are the good practices in privatization of education that can be adopted by public schools?
1.3 Research Methods
This study is cross-sectional and exploratory. It is cross-sectional as it employs the household survey in one point in time. It is also exploratory as it attempts to explain the dynamics of the privatization in education and community perception of private schools, especially among the middle class people. Both primary and secondary data were used.
The secondary data were reviewed from Flash Reports of the Department of Education (DoE) and raw data from the Nepal Living Standards Survey 2010/11 and other relevant reports were used.
Primary data comprised of quantitative and qualitative data and was generated through 1) a household survey; 2) a school surveys; 3) key informant interviews and 4) a workshop.
WORKING PAPER
Dimensions and Implications of Privatization of Education in Nepal10
1. Note that there are fi ve development regions. Kathmandu Valley lies in the central region but we have made Kathmandu Valley a separate region as a large number of private schools are located there.
2. Note that there are very few private schools in this area that were captured in the survey.
1.3.1 Household Survey While designing the sample, we were aware that the selected sample should contain a suffi cient number of households and schools and that they should be scattered as much as possible throughout the country. We were also aware of the fact that each household in the municipality/village development committee (VDC) should be given a chance to be selected in the sample.
The household survey involved a three-stage sampling procedure:
1) selection of districts;
2) selection of municipality/locations; and
3) selection of households.
In the fi rst stage, 12 districts out of 75 in the country were selected based on the highest concentration of private schools in a region. The sampling frame of private schools was obtained from the DoE. The information provides the number of schools by districts including the location of schools (Appendix A). For the selection of districts, we grouped districts into six regions: eastern, Central (excluding Kathmandu Valley), Kathmandu Valley, Western, Mid-Western and Far-Western. The grouping was made on the basis of the prevailing regions of the country.1
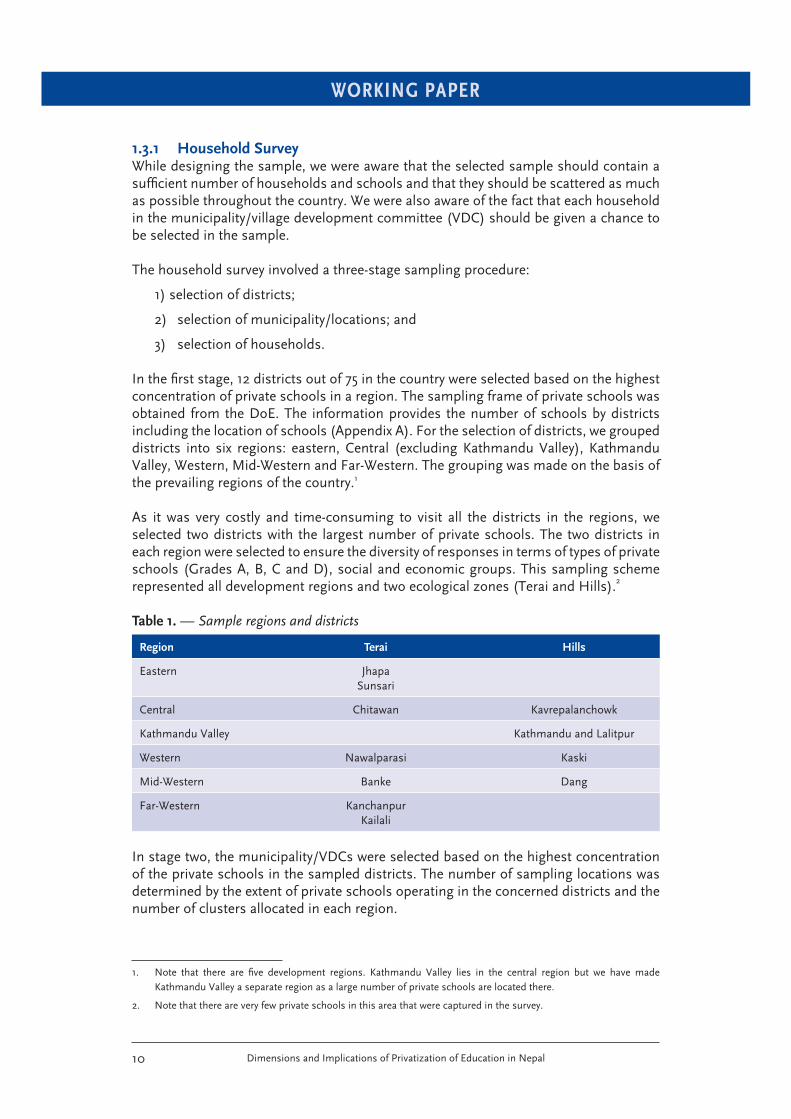
As it was very costly and time-consuming to visit all the districts in the regions, we selected two districts with the largest number of private schools. The two districts in each region were selected to ensure the diversity of responses in terms of types of private schools (Grades A, B, C and D), social and economic groups. This sampling scheme represented all development regions and two ecological zones (Terai and Hills).2
Table 1. — Sample regions and districts
Region Terai Hills
Eastern JhapaSunsari
Central Chitawan Kavrepalanchowk
Kathmandu Valley Kathmandu and Lalitpur
Western Nawalparasi Kaski
Mid-Western Banke Dang
Far-Western KanchanpurKailali
In stage two, the municipality/VDCs were selected based on the highest concentration of the private schools in the sampled districts. The number of sampling locations was determined by the extent of private schools operating in the concerned districts and the number of clusters allocated in each region.
WORKING PAPER
Dimensions and Implications of Privatization of Education in Nepal 11
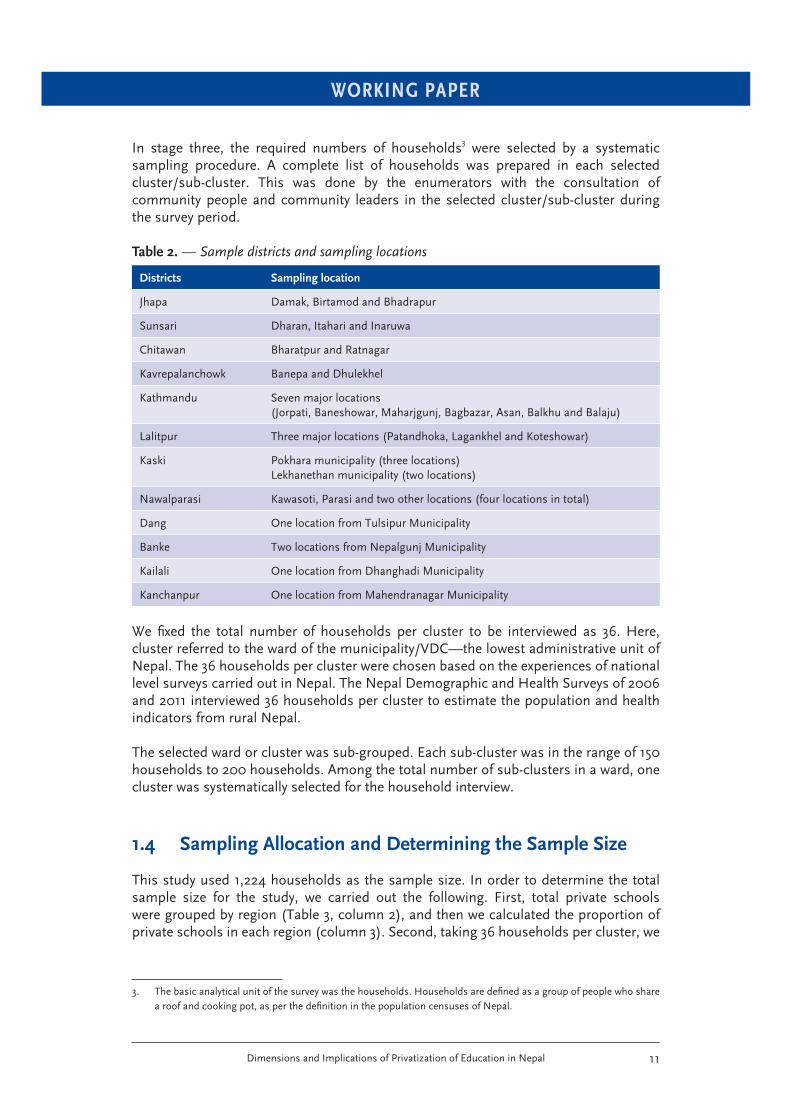
In stage three, the required numbers of households3 were selected by a systematic sampling procedure. A complete list of households was prepared in each selected cluster/sub-cluster. This was done by the enumerators with the consultation of community people and community leaders in the selected cluster/sub-cluster during the survey period.
Table 2. — Sample districts and sampling locations
Districts Sampling location
Jhapa Damak, Birtamod and Bhadrapur
Sunsari Dharan, Itahari and Inaruwa
Chitawan Bharatpur and Ratnagar
Kavrepalanchowk Banepa and Dhulekhel
Kathmandu Seven major locations (Jorpati, Baneshowar, Maharjgunj, Bagbazar, Asan, Balkhu and Balaju)
Lalitpur Three major locations (Patandhoka, Lagankhel and Koteshowar)
Kaski Pokhara municipality (three locations)Lekhanethan municipality (two locations)
Nawalparasi Kawasoti, Parasi and two other locations (four locations in total)
Dang One location from Tulsipur Municipality
Banke Two locations from Nepalgunj Municipality
Kailali One location from Dhanghadi Municipality
Kanchanpur One location from Mahendranagar Municipality
We fi xed the total number of households per cluster to be interviewed as 36. Here, cluster referred to the ward of the municipality/VDC—the lowest administrative unit of Nepal. The 36 households per cluster were chosen based on the experiences of national level surveys carried out in Nepal. The Nepal Demographic and Health Surveys of 2006 and 2011 interviewed 36 households per cluster to estimate the population and health indicators from rural Nepal.
The selected ward or cluster was sub-grouped. Each sub-cluster was in the range of 150 households to 200 households. Among the total number of sub-clusters in a ward, one cluster was systematically selected for the household interview.
1.4 Sampling Allocation and Determining the Sample Size
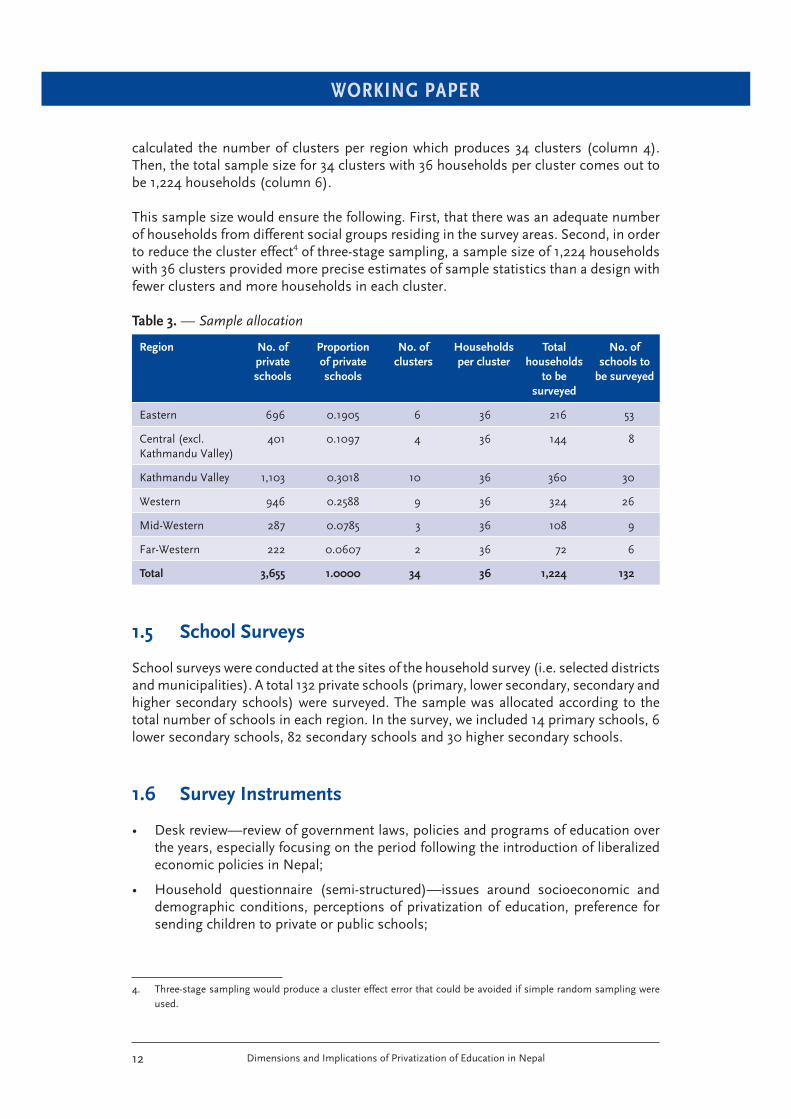
This study used 1,224 households as the sample size. In order to determine the total sample size for the study, we carried out the following. First, total private schools were grouped by region (Table 3, column 2), and then we calculated the proportion of private schools in each region (column 3). Second, taking 36 households per cluster, we
3. The basic analytical unit of the survey was the households. Households are defi ned as a group of people who share a roof and cooking pot, as per the defi nition in the population censuses of Nepal.
WORKING PAPER
Dimensions and Implications of Privatization of Education in Nepal12
calculated the number of clusters per region which produces 34 clusters (column 4). Then, the total sample size for 34 clusters with 36 households per cluster comes out to be 1,224 households (column 6). This sample size would ensure the following. First, that there was an adequate number of households from different social groups residing in the survey areas. Second, in order to reduce the cluster effect4 of three-stage sampling, a sample size of 1,224 households with 36 clusters provided more precise estimates of sample statistics than a design with fewer clusters and more households in each cluster.
Table 3. — Sample allocation
Region No. of
private
schools
Proportion
of private
schools
No. of
clusters
Households
per cluster
Total
households
to be
surveyed
No. of
schools to
be surveyed
Eastern 696 0.1905 6 36 216 53
Central (excl. Kathmandu Valley)
401 0.1097 4 36 144 8
Kathmandu Valley 1,103 0.3018 10 36 360 30
Western 946 0.2588 9 36 324 26
Mid-Western 287 0.0785 3 36 108 9
Far-Western 222 0.0607 2 36 72 6
Total 3,655 1.0000 34 36 1,224 132
1.5 School Surveys
School surveys were conducted at the sites of the household survey (i.e. selected districts and municipalities). A total 132 private schools (primary, lower secondary, secondary and higher secondary schools) were surveyed. The sample was allocated according to the total number of schools in each region. In the survey, we included 14 primary schools, 6 lower secondary schools, 82 secondary schools and 30 higher secondary schools.
1.6 Survey Instruments
• Desk review—review of government laws, policies and programs of education over the years, especially focusing on the period following the introduction of liberalized economic policies in Nepal;
• Household questionnaire (semi-structured)—issues around socioeconomic and demographic conditions, perceptions of privatization of education, preference for sending children to private or public schools;
4. Three-stage sampling would produce a cluster effect error that could be avoided if simple random sampling were used.
WORKING PAPER
Dimensions and Implications of Privatization of Education in Nepal 13
• Survey instrument for schools (semi-structured)—information on physical infra-structure, human resources and quality of education;
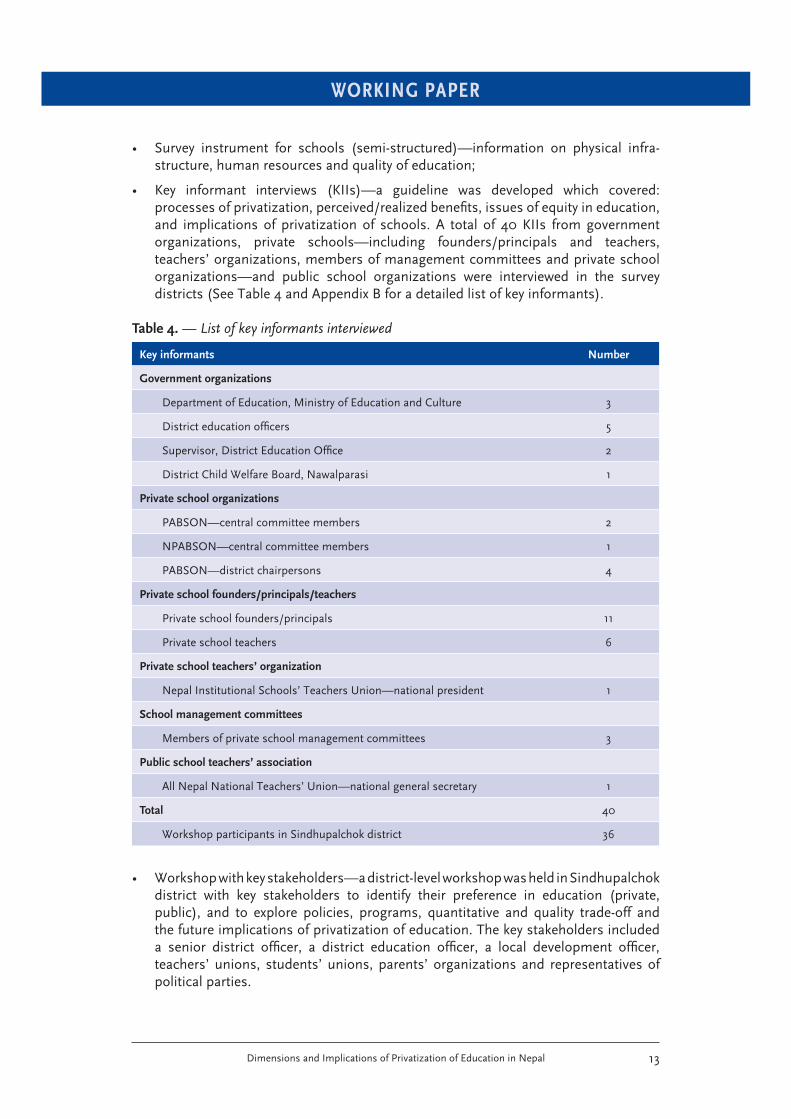
• Key informant interviews (KIIs)—a guideline was developed which covered: processes of privatization, perceived/realized benefi ts, issues of equity in education, and implications of privatization of schools. A total of 40 KIIs from government organizations, private schools—including founders/principals and teachers, teachers’ organizations, members of management committees and private school organizations—and public school organizations were interviewed in the survey districts (See Table 4 and Appendix B for a detailed list of key informants).
Table 4. — List of key informants interviewed
Key informants Number
Government organizations
Department of Education, Ministry of Education and Culture 3
District education offi cers 5
Supervisor, District Education Offi ce 2
District Child Welfare Board, Nawalparasi 1
Private school organizations
PABSON—central committee members 2
NPABSON—central committee members 1
PABSON—district chairpersons 4
Private school founders/principals/teachers
Private school founders/principals 11
Private school teachers 6
Private school teachers’ organization
Nepal Institutional Schools’ Teachers Union—national president 1
School management committees
Members of private school management committees 3
Public school teachers’ association
All Nepal National Teachers’ Union—national general secretary 1
Total 40
Workshop participants in Sindhupalchok district 36
• Workshop with key stakeholders—a district-level workshop was held in Sindhupalchok district with key stakeholders to identify their preference in education (private, public), and to explore policies, programs, quantitative and quality trade-off and the future implications of privatization of education. The key stakeholders included a senior district offi cer, a district education offi cer, a local development offi cer, teachers’ unions, students’ unions, parents’ organizations and representatives of political parties.
WORKING PAPER
Dimensions and Implications of Privatization of Education in Nepal14
• Feedback workshop—the preliminary draft of the report was presented to the regional seminar (representing South Asia and South East Asian countries) organized by PERI in Kathmandu in August 2011. The feedback and comments of the participants as well as the experts was incorporated in the fi nal report.
1.7 Data Management and Analysis
The quantitative data (household and school surveys) were thoroughly edited, recoded and entered in SPSS/PC software. Data were also analyzed by the software. The qualitative data were regrouped and contextualized.
We used simple frequency tables and cross-tabulations. Where relevant, we also used a chi-squared (X2) test to examine the association between two variables of interest.
1.8 Organization of the Report
This report is structured into six chapters. Chapter 1 provides an introduction and discusses the methodology adopted for the study. Chapter 2 deals with the education system in Nepal, with special focus on the evolution and regulation mechanisms of private schools in Nepal. Chapter 3 analyzes the magnitude, levels and trends of private schools, the socioeconomic differentials of students attending private and public schools, the proportion of teachers and enrollment rates. Chapter 4 explores people’s perceptions of privatization of education, particularly with regard to choosing private or public schools. Chapter 5 looks at the implications of the privatization of education. It investigates the positive and negative consequences brought by the privatization of education. Chapter 6 provides a summary of the study and draws conclusions.
WORKING PAPER
Dimensions and Implications of Privatization of Education in Nepal 15
2. The Privatization of Schools in Nepal
This chapter begins by defi ning the education system in Nepal. It goes on to describe public and private schools, and looks at the regulation mechanisms and compliance levels of private schools.
2.1 Defi ning the Education System in Nepal
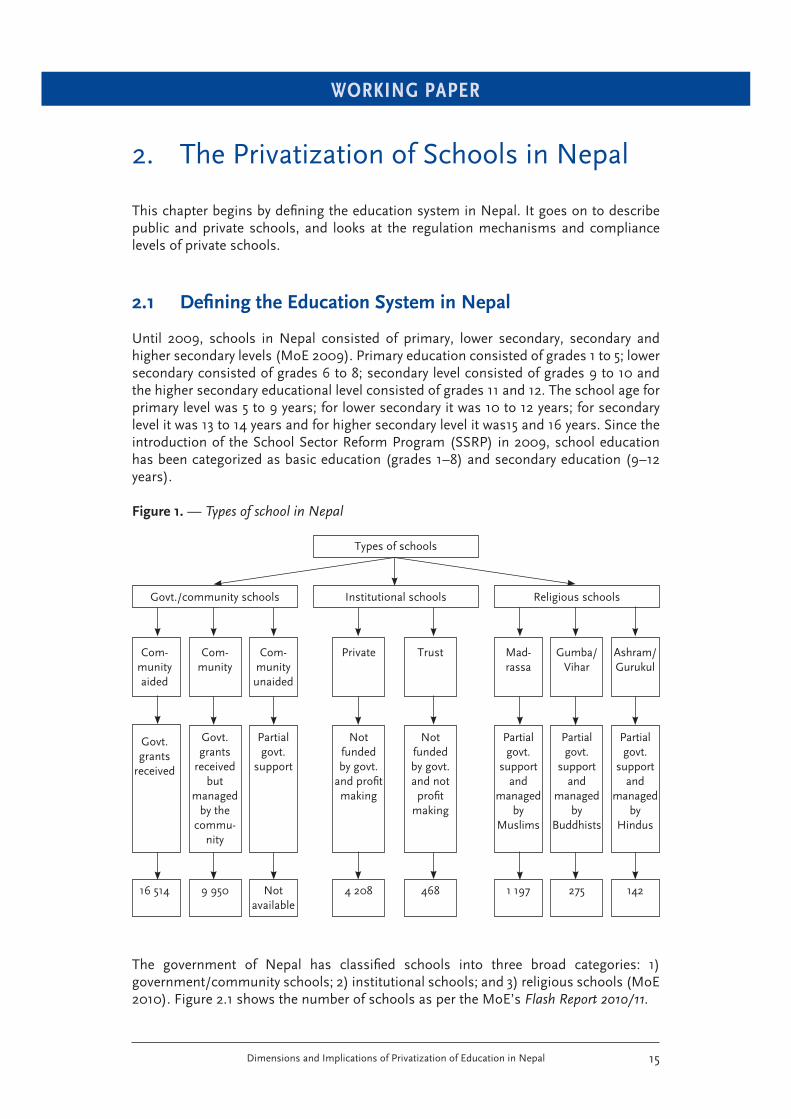
Until 2009, schools in Nepal consisted of primary, lower secondary, secondary and higher secondary levels (MoE 2009). Primary education consisted of grades 1 to 5; lower secondary consisted of grades 6 to 8; secondary level consisted of grades 9 to 10 and the higher secondary educational level consisted of grades 11 and 12. The school age for primary level was 5 to 9 years; for lower secondary it was 10 to 12 years; for secondary level it was 13 to 14 years and for higher secondary level it was15 and 16 years. Since the introduction of the School Sector Reform Program (SSRP) in 2009, school education has been categorized as basic education (grades 1–8) and secondary education (9–12 years).
Figure 1. — Types of school in Nepal
Types of schools
Institutional schoolsGovt./community schools Religious schools
Govt. grants
received
Govt. grants
received but
managed by the
commu-nity
Partial govt.
support
Partial govt.
support and
managed by
Muslims
Partial govt.
support and
managed by
Buddhists
Partial govt.
support and
managed by
Hindus
Not funded by govt.
and profi t making
Not funded by govt. and not profi t
making
Com-munityaided
Com-munity
Com-munityunaided
Mad-rassa
Gumba/Vihar
Ashram/Gurukul
Private Trust
16 514 9 950 Not available
1 197 275 1424 208 468
The government of Nepal has classifi ed schools into three broad categories: 1) government/community schools; 2) institutional schools; and 3) religious schools (MoE 2010). Figure 2.1 shows the number of schools as per the MoE’s Flash Report 2010/11.
WORKING PAPER
Dimensions and Implications of Privatization of Education in Nepal16
There are three types of community schools: 1) community aided schools; 2) community managed schools and 3) community unaided schools. The community aided schools are those schools that receive regular government grants in the form of teachers’ salaries for the approved positions, earmark grants, block grants and incentives grants. The government transfers grants to community aided schools management committees and such schools’ management responsibilities lies to the community, which forms the management committee. Community unaided schools are those schools that do not receive regular government grants but receive fi xed basic teacher salary grants and block grants. In our study, we have categorized these types of school as public schools.
Institutional schools can be categorized as 1) public trust schools, 2) private trust schools and 3) private schools registered under the Company Act. Institutional schools are not funded by the government; they depend on parental support and are managed and owned by individuals or private and public trusts. In the case of public trust schools, the land and building are owned by the government, with other facilities and salaries being provided by the community. In the case of private trust schools, all the physical facilities, building and land are provided by an individual or group of private investors. While they operate as trustees of the school, they cannot make a profi t from it. Further, if they decide to stop operating as a school, then the land and buildings must be handed over to the government. Private schools registered under the Company Act remain the property of the investors. They should be registered under the Company Act and comply with the tax requirements specifi ed by the Ministry of Finance. In addition, registration with the Ministry of Education is required and a tax of 1.5 percent of the school’s income is levied to contribute to a fund to improve rural government schools.
All three types of school charge tuition fees and other expenses to students. For our study, we have grouped all institutional schools as private schools. Within private schools, the Education Regulation 2003 has made four classifi cations, grades A, B, C and D, based on 1) physical facilities; 2) skill of the teachers (human resources); 3) responsibility and transparency; 4) school operating processes; 5) performance and results; and 6) other outcomes. Schools with an overall score of 80 per cent across these six areas are classifi ed as grade A, those scoring 60 to 79 percent as grade B, those scoring 40 to 59 percent as grade C and those with less than or equal to 30 percent as grade C (refer to Appendix 2.1 for details of the criteria). In each academic year, a private school may request to be upgraded by the District Education Offi ce.
There are three types of religious school: madrassas (Islamic education), Gumba/Vihar (Buddhist education), Ashram/Gurukul (Hindu tradition education). These schools receive government grants if they have aligned their curriculum with that of the formal education system.
This study deals with only the private and public schools and has not the religious schools.
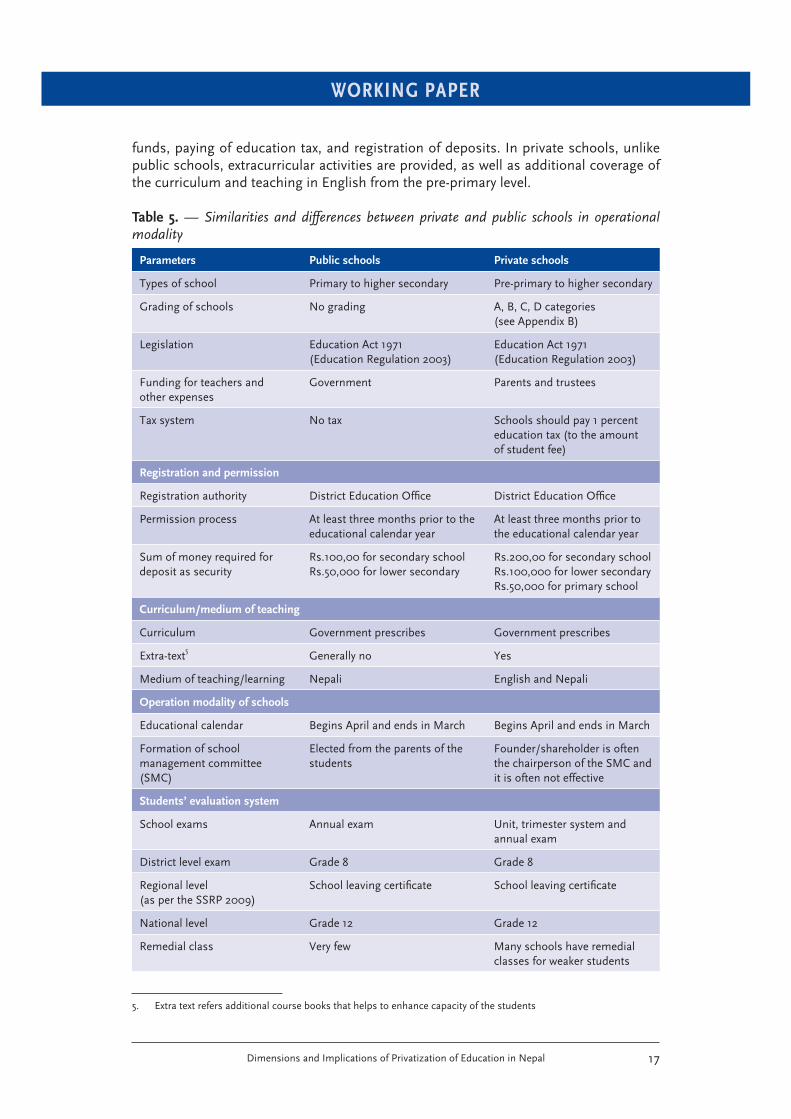
2.1.1 Similarities and Differences between Public and Private SchoolsThere are similarities and differences between the public and private schools (Table 5). Both types of schools are regulated by the Education Act 1971 (Eighth Amendment 2004 and Education Regulation 2003). The school calendar, registration process, students’ evaluation system and required teachers’ qualifi cations are the same for the both types of schools. The key differences are in the grading systems, provision of government
WORKING PAPER
Dimensions and Implications of Privatization of Education in Nepal 17
funds, paying of education tax, and registration of deposits. In private schools, unlike public schools, extracurricular activities are provided, as well as additional coverage of the curriculum and teaching in English from the pre-primary level.
Table 5. — Similarities and differences between private and public schools in operational modality
Parameters Public schools Private schools
Types of school Primary to higher secondary Pre-primary to higher secondary
Grading of schools No grading A, B, C, D categories (see Appendix B)
Legislation Education Act 1971 (Education Regulation 2003)
Education Act 1971 (Education Regulation 2003)
Funding for teachers and other expenses
Government Parents and trustees
Tax system No tax Schools should pay 1 percent education tax (to the amount of student fee)
Registration and permission
Registration authority District Education Offi ce District Education Offi ce
Permission process At least three months prior to the educational calendar year
At least three months prior to the educational calendar year
Sum of money required for deposit as security
Rs.100,00 for secondary schoolRs.50,000 for lower secondary
Rs.200,00 for secondary schoolRs.100,000 for lower secondaryRs.50,000 for primary school
Curriculum/medium of teaching
Curriculum Government prescribes Government prescribes
Extra-text5 Generally no Yes
Medium of teaching/learning Nepali English and Nepali
Operation modality of schools
Educational calendar Begins April and ends in March Begins April and ends in March
Formation of school management committee (SMC)
Elected from the parents of the students
Founder/shareholder is often the chairperson of the SMC and it is often not effective
Students’ evaluation system
School exams Annual exam Unit, trimester system and annual exam
District level exam Grade 8 Grade 8
Regional level (as per the SSRP 2009)
School leaving certifi cate School leaving certifi cate
National level Grade 12 Grade 12
Remedial class Very few Many schools have remedial classes for weaker students
5. Extra text refers additional course books that helps to enhance capacity of the students
WORKING PAPER
Dimensions and Implications of Privatization of Education in Nepal18
Parameters Public schools Private schools
Teachers
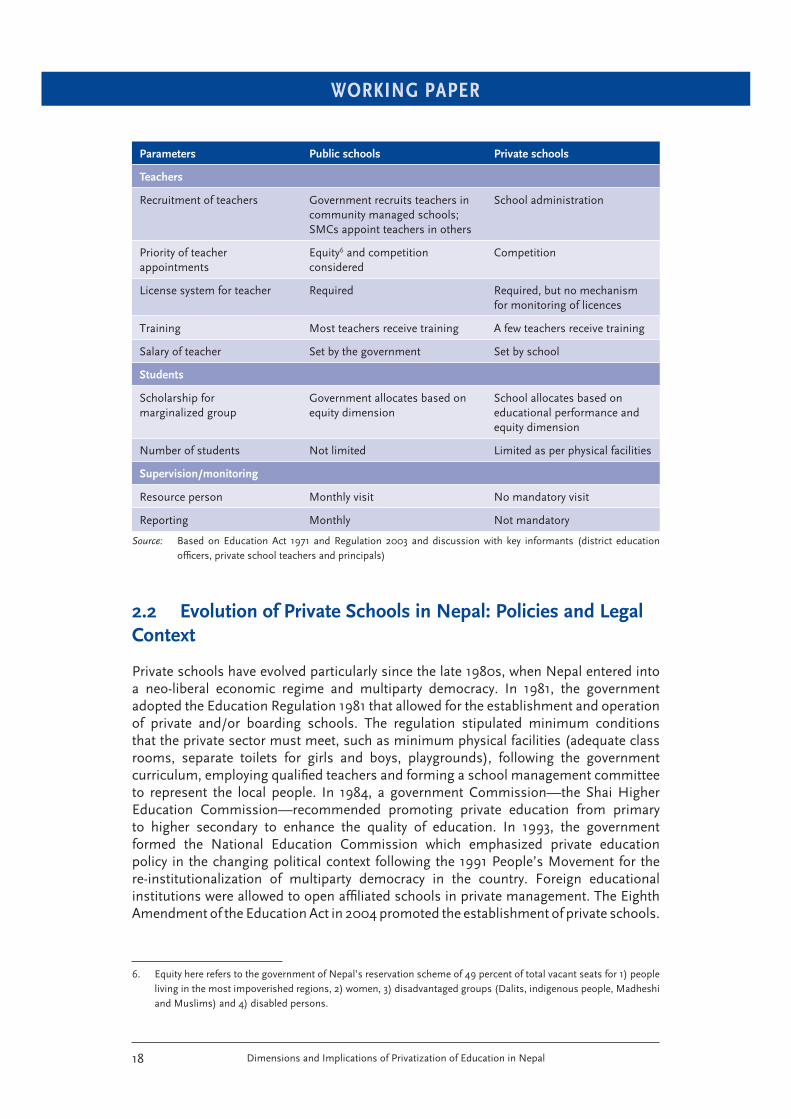
Recruitment of teachers Government recruits teachers in community managed schools; SMCs appoint teachers in others
School administration
Priority of teacher appointments
Equity6 and competition considered
Competition
License system for teacher Required Required, but no mechanism for monitoring of licences
Training Most teachers receive training A few teachers receive training
Salary of teacher Set by the government Set by school
Students
Scholarship for marginalized group
Government allocates based on equity dimension
School allocates based on educational performance and equity dimension
Number of students Not limited Limited as per physical facilities
Supervision/monitoring
Resource person Monthly visit No mandatory visit
Reporting Monthly Not mandatory
Source: Based on Education Act 1971 and Regulation 2003 and discussion with key informants (district education offi cers, private school teachers and principals)
2.2 Evolution of Private Schools in Nepal: Policies and Legal
Context
Private schools have evolved particularly since the late 1980s, when Nepal entered into a neo-liberal economic regime and multiparty democracy. In 1981, the government adopted the Education Regulation 1981 that allowed for the establishment and operation of private and/or boarding schools. The regulation stipulated minimum conditions that the private sector must meet, such as minimum physical facilities (adequate class rooms, separate toilets for girls and boys, playgrounds), following the government curriculum, employing qualifi ed teachers and forming a school management committee to represent the local people. In 1984, a government Commission—the Shai Higher Education Commission—recommended promoting private education from primary to higher secondary to enhance the quality of education. In 1993, the government formed the National Education Commission which emphasized private education policy in the changing political context following the 1991 People’s Movement for the re-institutionalization of multiparty democracy in the country. Foreign educational institutions were allowed to open affi liated schools in private management. The Eighth Amendment of the Education Act in 2004 promoted the establishment of private schools.
6. Equity here refers to the government of Nepal’s reservation scheme of 49 percent of total vacant seats for 1) people living in the most impoverished regions, 2) women, 3) disadvantaged groups (Dalits, indigenous people, Madheshi and Muslims) and 4) disabled persons.
WORKING PAPER
Dimensions and Implications of Privatization of Education in Nepal 19
The Eighth Plan (1992–97) and subsequent plans, including the current Three Year Plan Approach Paper (2010/11–2012/13), emphasize the promotion of private education as a way of meeting the need of basic education. The objectives of the Three Year Plan Approach Paper (2010/11–2012/13) relating to education include the following:
• Ensure access to education for all and provide quality and employment-oriented education.
• Provide free and compulsory basic education (grades 1–8) for all and provide quality education considering inclusiveness and equity at the secondary level (grades 9–12).
• Maintain coordination and build partnerships between public and private schools in order to increase the quality of education in the public schools, and learn from the good practices of each (NPC 2010).
In response to this policy, there was a substantial growth in private schools. Drawing on information from the key informant interviews, especially with private school organizations, it was evident that the deterioration of the quality of education in public schools created the environment for the growth of private schools. Private schools have helped to release the pressure of education demand, not met by public schools, especially in terms of the perceived needs of parents for quality education.
2.3 Regulation Mechanisms of Private Schools
There are no separate laws and regulations for the operation of private and public schools. Both types of school are regulated by Education Act 1971 (the Eighth Amendment 2004) and the Education Regulation 2003. According to the regulation, private schools should comply with the following:
• Ensure that the minimum educational qualifi cations of teachers are not below those of public schools.
• All teachers should be license holders.
• Establish School management committees.
• Offer at least 10 percent of the student scholarships, reserved for students from deprived community, orphans, girls, Dalits, Janajatis and students from remote areas.
• Pay 1 percent service tax to the government.
The district education offi ce (DEO)—a district-level government offi ce—is mandated to monitor the private schools in its jurisdiction. Its role is to provide permission for establishing and registration of the private schools. Although there is provision to monitor the private schools (their fee structure, qualifi cations of teachers and curricula), a well-defi ned regulatory framework and effective implementation mechanism acceptable to both the government and the private providers is lacking.
WORKING PAPER
Dimensions and Implications of Privatization of Education in Nepal20
2.4 Status of Compliance of Legal Requirements in Private
Schools
2.4.1 Minimum Qualifi cation and Training of Teachers The qualifi cations of the teachers in private schools should be the same as the qualifi -cations required for public schools. Our study fi ndings indicate that is not the case in all private schools. In A and B classifi ed schools, the teachers are generally highly qualifi ed while in other schools they have minimal qualifi cations. In the workshop with the teachers, SMCs and government agencies in Sindhupalchok district, it became evident that the majority of teachers were under-qualifi ed and untrained.
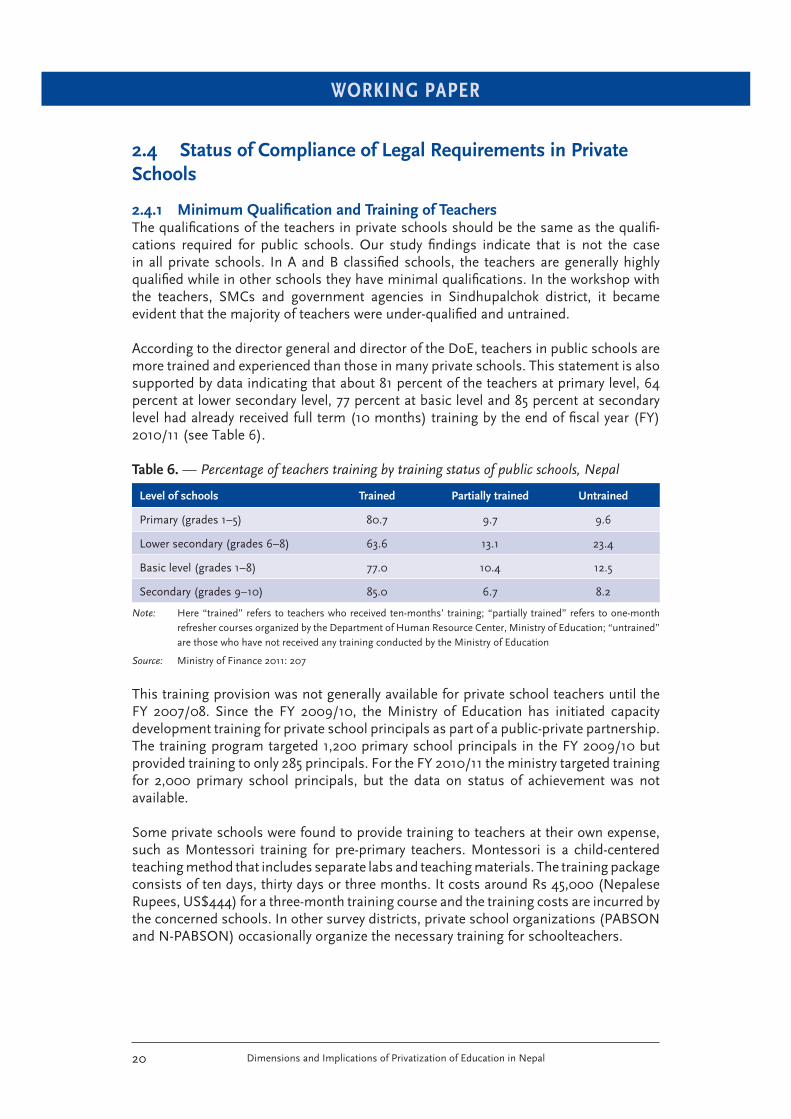
According to the director general and director of the DoE, teachers in public schools are more trained and experienced than those in many private schools. This statement is also supported by data indicating that about 81 percent of the teachers at primary level, 64 percent at lower secondary level, 77 percent at basic level and 85 percent at secondary level had already received full term (10 months) training by the end of fi scal year (FY) 2010/11 (see Table 6). Table 6. — Percentage of teachers training by training status of public schools, Nepal
Level of schools Trained Partially trained Untrained
Primary (grades 1–5) 80.7 9.7 9.6
Lower secondary (grades 6–8) 63.6 13.1 23.4
Basic level (grades 1–8) 77.0 10.4 12.5
Secondary (grades 9–10) 85.0 6.7 8.2
Note: Here “trained” refers to teachers who received ten-months’ training; “partially trained” refers to one-month refresher courses organized by the Department of Human Resource Center, Ministry of Education; “untrained” are those who have not received any training conducted by the Ministry of Education
Source: Ministry of Finance 2011: 207
This training provision was not generally available for private school teachers until the FY 2007/08. Since the FY 2009/10, the Ministry of Education has initiated capacity development training for private school principals as part of a public-private partnership. The training program targeted 1,200 primary school principals in the FY 2009/10 but provided training to only 285 principals. For the FY 2010/11 the ministry targeted training for 2,000 primary school principals, but the data on status of achievement was not available.
Some private schools were found to provide training to teachers at their own expense, such as Montessori training for pre-primary teachers. Montessori is a child-centered teaching method that includes separate labs and teaching materials. The training package consists of ten days, thirty days or three months. It costs around Rs 45,000 (Nepalese Rupees, US$444) for a three-month training course and the training costs are incurred by the concerned schools. In other survey districts, private school organizations (PABSON and N-PABSON) occasionally organize the necessary training for schoolteachers.
WORKING PAPER
Dimensions and Implications of Privatization of Education in Nepal 21
2.4.2 Salaries and Benefi ts of Private School TeachersOur fi ndings indicate that only 20 percent of the total private school teachers receive government-determined salary. In Kathmandu Valley, even in A grade schools, only about 60 percent of the teachers receive a full salary. In the case of C and D grade schools, 20 percent to 30 percent of the teachers receive a full salary. The salary level of schoolteachers also depends on whether or not the schools are able to charge the full monthly fee, as determined by the government, to the students. The majority of C and D grade private schools charge monthly fees far below the maximum student fee set by the government in order to attract lower-income families to their schools (see Box 1 below). In many of the private schools, there are no provident funds, promotion facilities, job security, paid leave or incentives for refresher or orientation training, although these provisions are available in some A and B grade schools.
When the PABSON authorities in Kathmandu were asked about the low salary of the teachers, they reported that they were requesting all member schools to pay government-determined salaries to their teachers. But there was no restriction on the amount paid to highly qualifi ed and experienced teachers.
Box 1. — Profi le of a C grade private school, Kathmandu Valley
The school was established in 1994. Currently, it runs from pre-primary to grade 10. It has 350 students and the school is designated as grade C. There are 22 teachers. The principal of the school has completed a Master of Arts degree. He earns Rs.10,000 (US$99) per month—which is 55 percent of the government-recommended salary. A primary school teacher with intermediate educational level gets Rs.4,500 (US$44) per month, which again is 55 percent of the government-recommended salary.
2.4.3 License Holding According to the president of the Institutional Schools Teacher Union (ISTU—Nepal), only 5 percent of the total teachers in private schools hold licenses for teaching in accordance with the Education Regulation 2003. He reported that SMCs and school administration were not willing to provide appointment letters to the teachers, for two main reasons. First, the SMC avoids paying the full salary to teachers by neglecting to issue appointment letters. Second, even if a teacher agrees to work for a low salary, the SMC may not be willing to provide an appointment letter to the teacher lest the contract agreement should be may be made public. This could affect the credibility of private schools.
It appears that an overwhelming majority of private schools are less concerned with appointing licence-holding teachers than teachers who are able to teach well. Thus, the government’s mandatory provision that private schools should appoint teachers with teaching licences has not been fully implemented by the private schools in Nepal.
2.4.4 School Management Committees (SMCs)Almost all the schools we visited reported that they had formed SMCs. But when we discussed the composition of these committees, it was found that they were not formed according to the provisions set forth in the Education Regulation 2003. Data suggest
WORKING PAPER
Dimensions and Implications of Privatization of Education in Nepal22
that only 5 per cent of 132 private schools surveyed had SMCs as per the Education Regulation 2003. According to the regulation, the SMCs should be composed of owners of the schools, principals, representatives of disadvantaged groups, women, teachers and guardians, including a representative from the District Education Offi ce.
2.4.5 Curriculum The Curriculum Development Center, Ministry of Education, is responsible for designing and approving the curriculum for private and public schools. At the district level, the District Education Offi ce is tasked with monitoring the curriculum. The same curriculum and textbooks are used in private and public schools. However, our fi ndings show almost all the private schools surveyed have introduced additional courses related to English, math and moral studies, as well as extra-curricular activities. As there is a broad exam system7 in grades 5, 8 and 10, the private schools generally use the government curriculum in these grades. In the case of other grades, many private schools have introduced additional textbooks.
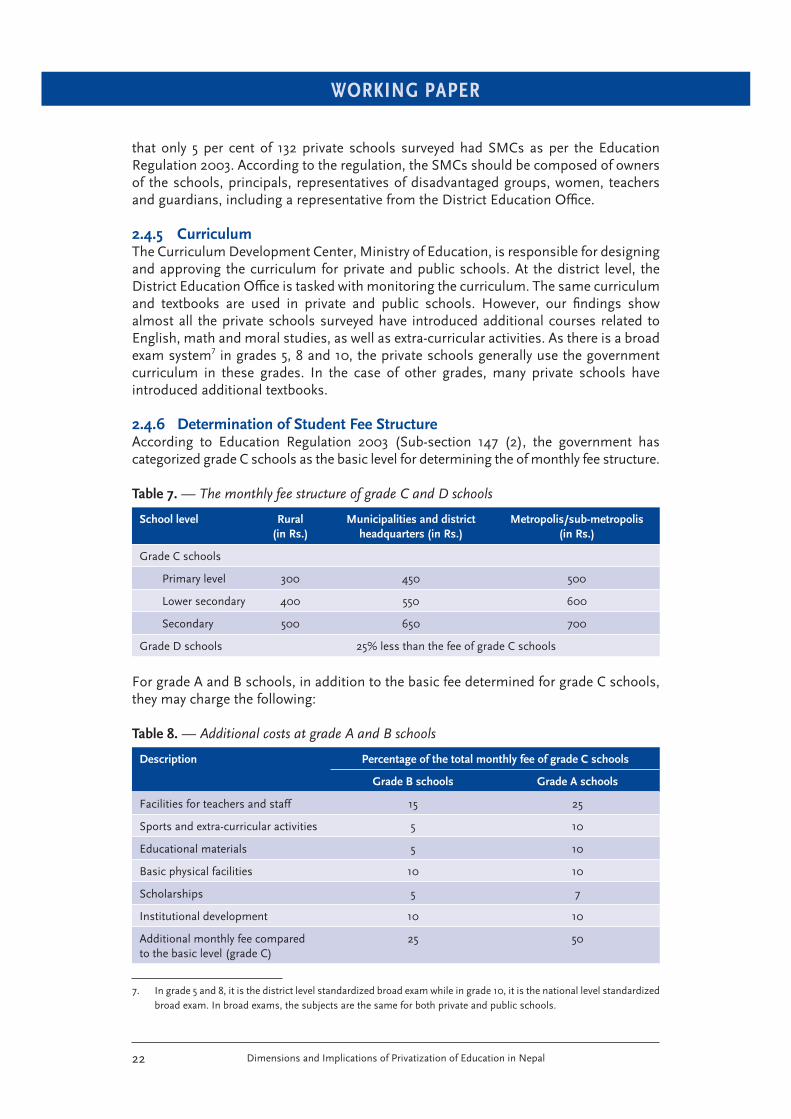
2.4.6 Determination of Student Fee StructureAccording to Education Regulation 2003 (Sub-section 147 (2), the government has categorized grade C schools as the basic level for determining the of monthly fee structure.
Table 7. — The monthly fee structure of grade C and D schools
School level Rural
(in Rs.)
Municipalities and district
headquarters (in Rs.)
Metropolis/sub-metropolis
(in Rs.)
Grade C schools
Primary level 300 450 500
Lower secondary 400 550 600
Secondary 500 650 700
Grade D schools 25% less than the fee of grade C schools
For grade A and B schools, in addition to the basic fee determined for grade C schools, they may charge the following:
Table 8. — Additional costs at grade A and B schools
Description Percentage of the total monthly fee of grade C schools
Grade B schools Grade A schools
Facilities for teachers and staff 15 25
Sports and extra-curricular activities 5 10
Educational materials 5 10
Basic physical facilities 10 10
Scholarships 5 7
Institutional development 10 10
Additional monthly fee compared to the basic level (grade C)
25 50
7. In grade 5 and 8, it is the district level standardized broad exam while in grade 10, it is the national level standardized broad exam. In broad exams, the subjects are the same for both private and public schools.
WORKING PAPER
Dimensions and Implications of Privatization of Education in Nepal 23
The GoN has made provision for the determination and monitoring of fee rates in private schools. At the central level, the Fee Determination and Management and Monitoring Central Committee was formed under the DoE. The committee is composed of 14 persons including representatives from private school organizations (PABSON and N-PABSON) and parents’ organizations. The committee is responsible for revising and monitoring the fee structure, scholarships, and curriculum in the schools. At the district level, a Fee Determination and Management and Monitoring District Committee (FDMMDC) was formed under the District Education Offi ce. In determining fee rates, the SMC proposes the tuition fee rates to the FDMMDC three months before the beginning of the academic year. The FDMMDC, in consultation with the SMC, then decides on the fee rates on the basis of the school’s grading. The agreed fee rates are expected to be implemented by the schools.
From discussion with the deputy director of the DOE, it is apparent that, in practice, monitoring at the central and district level is very weak. In the last academic year, monitoring occurred in some A grade schools in Kathmandu Valley (Graded English Medium School (GEMS), Ratio Bangala and some other schools in Lalitpur), and the monitoring report showed that these schools were not following the fee structure determined by the government.
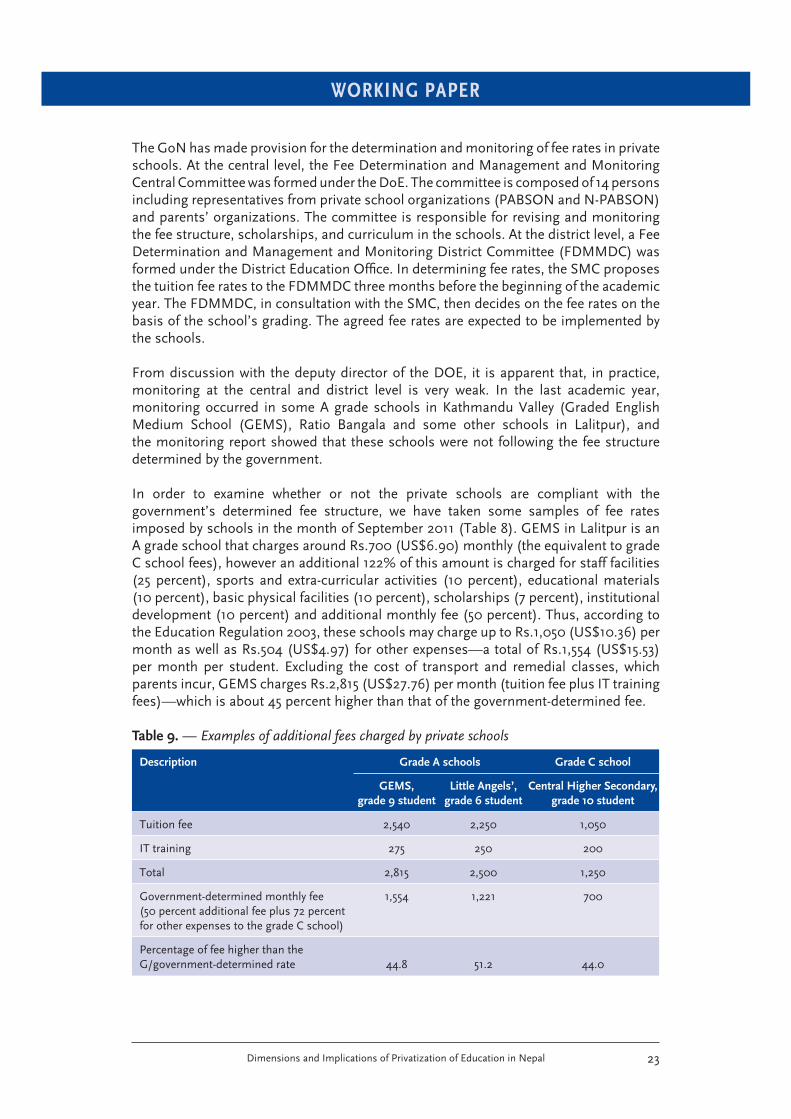
In order to examine whether or not the private schools are compliant with the government’s determined fee structure, we have taken some samples of fee rates imposed by schools in the month of September 2011 (Table 8). GEMS in Lalitpur is an A grade school that charges around Rs.700 (US$6.90) monthly (the equivalent to grade C school fees), however an additional 122% of this amount is charged for staff facilities (25 percent), sports and extra-curricular activities (10 percent), educational materials (10 percent), basic physical facilities (10 percent), scholarships (7 percent), institutional development (10 percent) and additional monthly fee (50 percent). Thus, according to the Education Regulation 2003, these schools may charge up to Rs.1,050 (US$10.36) per month as well as Rs.504 (US$4.97) for other expenses—a total of Rs.1,554 (US$15.53) per month per student. Excluding the cost of transport and remedial classes, which parents incur, GEMS charges Rs.2,815 (US$27.76) per month (tuition fee plus IT training fees)—which is about 45 percent higher than that of the government-determined fee.
Table 9. — Examples of additional fees charged by private schools
Description Grade A schools Grade C school
GEMS,
grade 9 student
Little Angels’,
grade 6 student
Central Higher Secondary,
grade 10 student
Tuition fee 2,540 2,250 1,050
IT training 275 250 200
Total 2,815 2,500 1,250
Government-determined monthly fee (50 percent additional fee plus 72 percent for other expenses to the grade C school)
1,554 1,221 700
Percentage of fee higher than the G/government-determined rate 44.8 51.2 44.0
WORKING PAPER
Dimensions and Implications of Privatization of Education in Nepal24
At Little Angels’ School in Lalitpur (a grade A school), students pay 51 percent more than the government-determined fee.
At Central Higher Secondary a grade C school), students pay 44 per cent more than the government-determined fee.
2.5 Confl ict of Interest between Government, Private Schools
and Teachers
Our study suggests that there has been a confl ict of interest between 1) private school management and government and 2) private school teachers, government and private school management.
Public school education in Nepal is highly politicized. Public schools were the major platforms for political parties before the multiparty democracy of 1990, when all the political parties were banned. They worked as agents to increase political awareness in the rural areas and to protest and resist the rulers. Even after the reinstitution of democracy in 1990, public schools remained political platforms. Actually, SMCs are elected from the respective student’s parents at the school. In most cases, however, SMCs are elected on the basis of political background rather than commitments, expertise and devotion. It is believed that the high politicization of SMCs is due to the fact that there is no elected body at the local level. The government of Nepal has not been able to conduct local level elections since 1998. Furthermore, there is wide criticism that the government appointed about 40,000 temporary teachers (rahat cota) from 2006 to 2008 mainly on the basis of the political affi liation rather than competency i.e. they were not appointed on the basis of free competition in which all qualifi ed can have opportunities to fi ght for. This tendency has been reproduced in private schools too. Individuals or groups of individuals who are directly or indirectly affi liated with a political party have established many private schools. Many political party leaders and members are the founders of or investors or shareholders in private schools. Before 1990, public school teachers who had been fi red due to their political affi liation established some of the private schools in Kathmandu Valley mainly for their employment. Initially, there was only one private school organization but it quickly split along political lines: one faction affi liated with the left (PABSON) and another (N-PABSON) with the democrats. Thus it appears that private school organizations are directly linked to central- and district-level politics.
In this context, private education providers are demanding a separate Act and Regulation for private schools, as the current Act and Regulation do not explicitly incorporate the issues relevant to private schools. As per the current provision, the operation of private schools may be modifi ed by the government at any time. The private school organizations have emerged as effective agencies for the rising demand for and protection of the rights of private sectors (see Box 2).
WORKING PAPER
Dimensions and Implications of Privatization of Education in Nepal 25
Box 2. — Profi le and objectives of private school organizations in Nepal
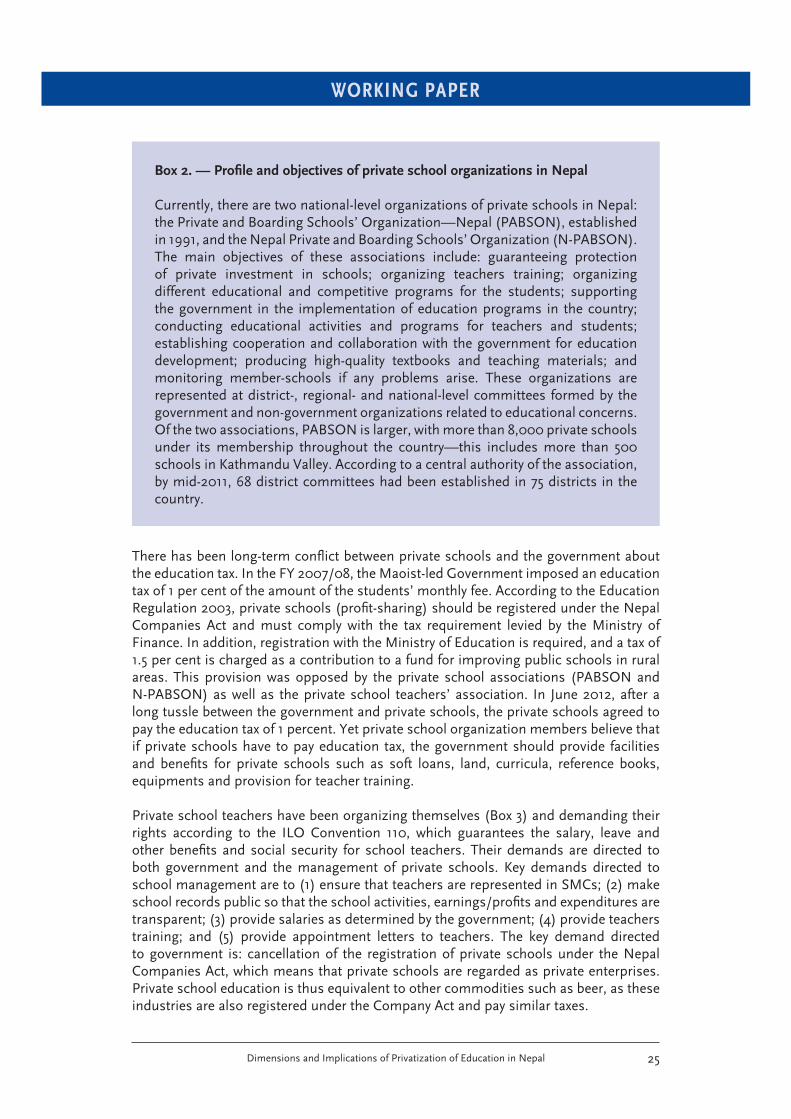
Currently, there are two national-level organizations of private schools in Nepal: the Private and Boarding Schools’ Organization—Nepal (PABSON), established in 1991, and the Nepal Private and Boarding Schools’ Organization (N-PABSON). The main objectives of these associations include: guaranteeing protection of private investment in schools; organizing teachers training; organizing different educational and competitive programs for the students; supporting the government in the implementation of education programs in the country; conducting educational activities and programs for teachers and students; establishing cooperation and collaboration with the government for education development; producing high-quality textbooks and teaching materials; and monitoring member-schools if any problems arise. These organizations are represented at district-, regional- and national-level committees formed by the government and non-government organizations related to educational concerns. Of the two associations, PABSON is larger, with more than 8,000 private schools under its membership throughout the country—this includes more than 500 schools in Kathmandu Valley. According to a central authority of the association, by mid-2011, 68 district committees had been established in 75 districts in the country.
There has been long-term confl ict between private schools and the government about the education tax. In the FY 2007/08, the Maoist-led Government imposed an education tax of 1 per cent of the amount of the students’ monthly fee. According to the Education Regulation 2003, private schools (profi t-sharing) should be registered under the Nepal Companies Act and must comply with the tax requirement levied by the Ministry of Finance. In addition, registration with the Ministry of Education is required, and a tax of 1.5 per cent is charged as a contribution to a fund for improving public schools in rural areas. This provision was opposed by the private school associations (PABSON and N-PABSON) as well as the private school teachers’ association. In June 2012, after a long tussle between the government and private schools, the private schools agreed to pay the education tax of 1 percent. Yet private school organization members believe that if private schools have to pay education tax, the government should provide facilities and benefi ts for private schools such as soft loans, land, curricula, reference books, equipments and provision for teacher training.
Private school teachers have been organizing themselves (Box 3) and demanding their rights according to the ILO Convention 110, which guarantees the salary, leave and other benefi ts and social security for school teachers. Their demands are directed to both government and the management of private schools. Key demands directed to school management are to (1) ensure that teachers are represented in SMCs; (2) make school records public so that the school activities, earnings/profi ts and expenditures are transparent; (3) provide salaries as determined by the government; (4) provide teachers training; and (5) provide appointment letters to teachers. The key demand directed to government is: cancellation of the registration of private schools under the Nepal Companies Act, which means that private schools are regarded as private enterprises. Private school education is thus equivalent to other commodities such as beer, as these industries are also registered under the Company Act and pay similar taxes.
WORKING PAPER
Dimensions and Implications of Privatization of Education in Nepal26
Box 3. — Profi le and demands of the Nepal Institutional School Teachers’ Union—Nepal (N-ISTU)
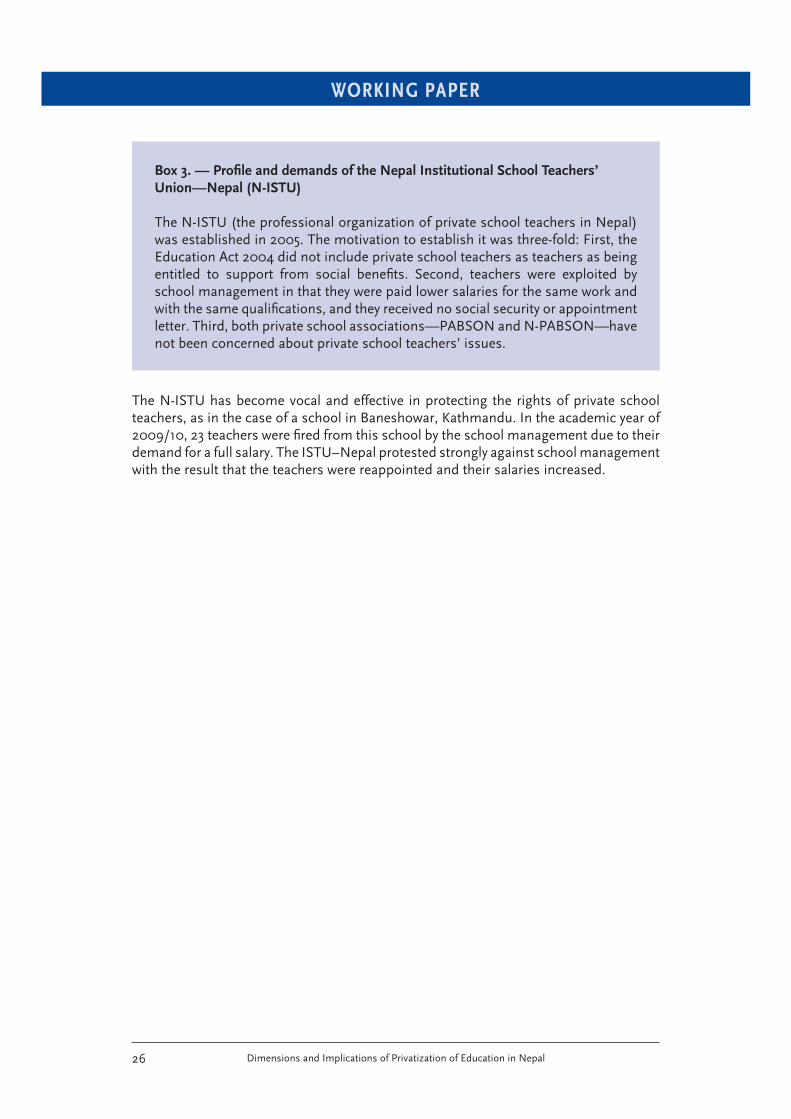
The N-ISTU (the professional organization of private school teachers in Nepal) was established in 2005. The motivation to establish it was three-fold: First, the Education Act 2004 did not include private school teachers as teachers as being entitled to support from social benefi ts. Second, teachers were exploited by school management in that they were paid lower salaries for the same work and with the same qualifi cations, and they received no social security or appointment letter. Third, both private school associations—PABSON and N-PABSON—have not been concerned about private school teachers’ issues.
The N-ISTU has become vocal and effective in protecting the rights of private school teachers, as in the case of a school in Baneshowar, Kathmandu. In the academic year of 2009/10, 23 teachers were fi red from this school by the school management due to their demand for a full salary. The ISTU–Nepal protested strongly against school management with the result that the teachers were reappointed and their salaries increased.
WORKING PAPER
Dimensions and Implications of Privatization of Education in Nepal 27
3. Extent and Trends of Private Schools and Teachers and Share in Enrollment Rates
This chapter analyzes the number and trends of private schools in the country. It goes on to analyze the number of teachers and the proportion of private school enrollment by education levels and discusses the variation in school attendance in private and public schools by gender, rural–urban differences, economic strata and social groups.
3.1 Extent of Private Schools
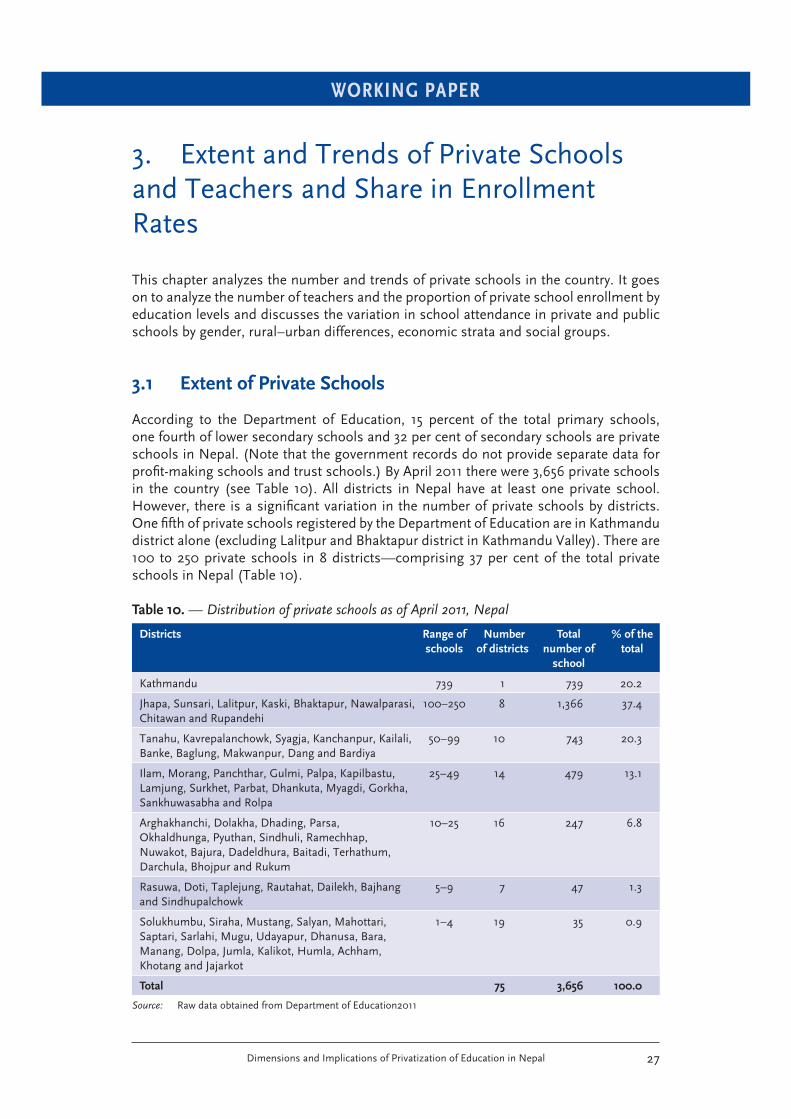
According to the Department of Education, 15 percent of the total primary schools, one fourth of lower secondary schools and 32 per cent of secondary schools are private schools in Nepal. (Note that the government records do not provide separate data for profi t-making schools and trust schools.) By April 2011 there were 3,656 private schools in the country (see Table 10). All districts in Nepal have at least one private school. However, there is a signifi cant variation in the number of private schools by districts. One fi fth of private schools registered by the Department of Education are in Kathmandu district alone (excluding Lalitpur and Bhaktapur district in Kathmandu Valley). There are 100 to 250 private schools in 8 districts—comprising 37 per cent of the total private schools in Nepal (Table 10).
Table 10. — Distribution of private schools as of April 2011, Nepal
Districts Range of
schools
Number
of districts
Total
number of
school
% of the
total
Kathmandu 739 1 739 20.2
Jhapa, Sunsari, Lalitpur, Kaski, Bhaktapur, Nawalparasi, Chitawan and Rupandehi
100–250 8 1,366 37.4
Tanahu, Kavrepalanchowk, Syagja, Kanchanpur, Kailali, Banke, Baglung, Makwanpur, Dang and Bardiya
50–99 10 743 20.3
Ilam, Morang, Panchthar, Gulmi, Palpa, Kapilbastu, Lamjung, Surkhet, Parbat, Dhankuta, Myagdi, Gorkha, Sankhuwasabha and Rolpa
25–49 14 479 13.1
Arghakhanchi, Dolakha, Dhading, Parsa, Okhaldhunga, Pyuthan, Sindhuli, Ramechhap, Nuwakot, Bajura, Dadeldhura, Baitadi, Terhathum, Darchula, Bhojpur and Rukum
10–25 16 247 6.8
Rasuwa, Doti, Taplejung, Rautahat, Dailekh, Bajhang and Sindhupalchowk
5–9 7 47 1.3
Solukhumbu, Siraha, Mustang, Salyan, Mahottari, Saptari, Sarlahi, Mugu, Udayapur, Dhanusa, Bara, Manang, Dolpa, Jumla, Kalikot, Humla, Achham, Khotang and Jajarkot
1–4 19 35 0.9
Total 75 3,656 100.0
Source: Raw data obtained from Department of Education2011
WORKING PAPER
Dimensions and Implications of Privatization of Education in Nepal28
The number of private schools established is largely associated with the income level of the districts (GDP (PPP) per capita in USD)8. The districts with the highest GDP per capita have generally high numbers of private schools. The correlation coeffi cient between them is +0.622, which is signifi cant at 0.01 level. Thus, it can be inferred that the majority of private schools have been established in relatively more prosperous economic areas (See the Appendix A for GDP per district).
3.2 Proportion of Private School Teachers
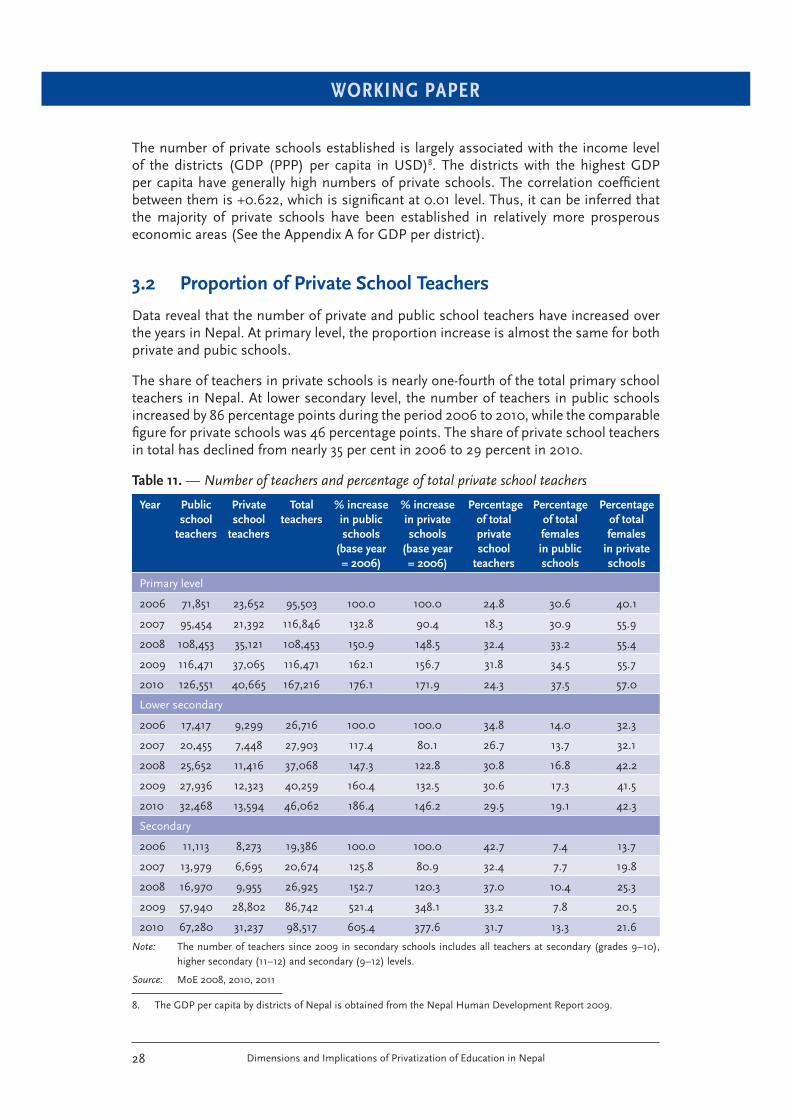
Data reveal that the number of private and public school teachers have increased over the years in Nepal. At primary level, the proportion increase is almost the same for both private and pubic schools.
The share of teachers in private schools is nearly one-fourth of the total primary school teachers in Nepal. At lower secondary level, the number of teachers in public schools increased by 86 percentage points during the period 2006 to 2010, while the comparable fi gure for private schools was 46 percentage points. The share of private school teachers in total has declined from nearly 35 per cent in 2006 to 29 percent in 2010.
Table 11. — Number of teachers and percentage of total private school teachers
Year Public
school
teachers
Private
school
teachers
Total
teachers
% increase
in public
schools
(base year
= 2006)
% increase
in private
schools
(base year
= 2006)
Percentage
of total
private
school
teachers
Percentage
of total
females
in public
schools
Percentage
of total
females
in private
schools
Primary level
2006 71,851 23,652 95,503 100.0 100.0 24.8 30.6 40.1
2007 95,454 21,392 116,846 132.8 90.4 18.3 30.9 55.9
2008 108,453 35,121 108,453 150.9 148.5 32.4 33.2 55.4
2009 116,471 37,065 116,471 162.1 156.7 31.8 34.5 55.7
2010 126,551 40,665 167,216 176.1 171.9 24.3 37.5 57.0
Lower secondary
2006 17,417 9,299 26,716 100.0 100.0 34.8 14.0 32.3
2007 20,455 7,448 27,903 117.4 80.1 26.7 13.7 32.1
2008 25,652 11,416 37,068 147.3 122.8 30.8 16.8 42.2
2009 27,936 12,323 40,259 160.4 132.5 30.6 17.3 41.5
2010 32,468 13,594 46,062 186.4 146.2 29.5 19.1 42.3
Secondary
2006 11,113 8,273 19,386 100.0 100.0 42.7 7.4 13.7
2007 13,979 6,695 20,674 125.8 80.9 32.4 7.7 19.8
2008 16,970 9,955 26,925 152.7 120.3 37.0 10.4 25.3
2009 57,940 28,802 86,742 521.4 348.1 33.2 7.8 20.5
2010 67,280 31,237 98,517 605.4 377.6 31.7 13.3 21.6
Note: The number of teachers since 2009 in secondary schools includes all teachers at secondary (grades 9–10), higher secondary (11–12) and secondary (9–12) levels.
Source: MoE 2008, 2010, 2011
8. The GDP per capita by districts of Nepal is obtained from the Nepal Human Development Report 2009.
WORKING PAPER
Dimensions and Implications of Privatization of Education in Nepal 29
At secondary level, the numbers of teachers in public schools have increased from 11,113 in 2006 to 67,280 in 2010. The main reason for this increase is the fact that government has appointed teachers on rahat cota (relief teachers on a temporary basis) up to the period of 2015. According to the general secretary of the National Teachers Association, the government has appointed 40,000 relief teachers throughout the country. Despite the huge increase in the number of teachers in public schools, the share of teachers in private schools has remained at around 32 percent of the total secondary-level teachers in Nepal.
Table 11 also shows the share of female teachers in private and public schools by level of education. At primary level, the share of females in the total teachers is much higher in private schools than in public schools. In 2010, the female share of the total teachers was 57 percent in private schools and 37.5 percent in public schools. At lower secondary level, the share of female teachers in the total teachers in private schools was almost double than in public schools. This was still the case at the time of writing. At secondary level, the share of female teachers to the total is much lower in both public and private schools compared to the primary and lower secondary level. This reveals that the share of female teachers tends to decline as the level of education increases in Nepal.
3.3 Student Enrollment Rates in Private Schools
Table 12 shows the trends in enrollment rates in public and private schools for the period of 2003 to 2010. The proportion of enrollment in private schools at all levels of education declined from 2003, especially in 2005 and 2006. This decline is mainly attributed to the fear of Maoists threats to private schools as well as threats to parents sending their children to private schools. During this period Maoists campaigned against private schools countrywide and many private schools were closed down, especially in rural areas and small towns and many schools were unable to run classes regularly. The public school teachers who were sending their children to private schools were also forced to withdraw their children from private schools and enroll them in public schools. Citing data from PABSON source, the Save the Children study carried out in 2002 argued that from 2000 the Maoists intensifi ed their attack against private schools, especially those with foreign affi liation, which caused the closure of about 500 private sector schools. Around 100,000 students and 9,000 teachers had been displaced by 2002.
Table 12. — Share of enrollment by levels and types of schools, 2003–2010
Year Primary Lower secondary Secondary
Public
schools
Private
schools
Public
schools
Private
schools
Public
schools
Private
schools
2003 89.2 10.8 86.7 13.3 84.6 15.4
2004 85.5 10.5 89.7 10.3 86.7 13.3
2005 94.0 6.0 92.4 7.6 90.3 9.7
2006 91.4 8.6 87.2 12.8 87.4 13.0
2007 89.8 10.2 87.0 13.0 85.1 14.9
2008 89.7 10.3 86.1 13.9 84.3 15.7
2009 86.8 13.2 85.2 14.8 83.1 16.9
2010 88.1 11.9 86.4 13.6 83.7 16.3
Source: MoE 2008, 2010, 2011
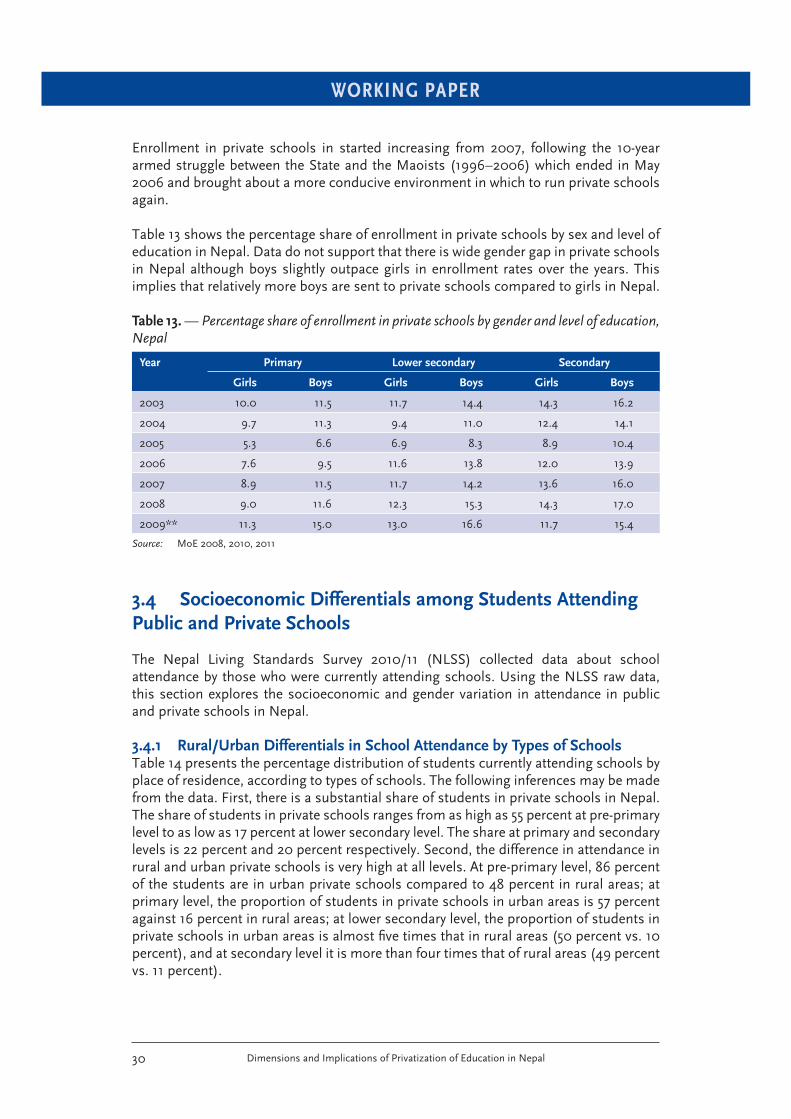
WORKING PAPER
Dimensions and Implications of Privatization of Education in Nepal30
Enrollment in private schools in started increasing from 2007, following the 10-year armed struggle between the State and the Maoists (1996–2006) which ended in May 2006 and brought about a more conducive environment in which to run private schools again.
Table 13 shows the percentage share of enrollment in private schools by sex and level of education in Nepal. Data do not support that there is wide gender gap in private schools in Nepal although boys slightly outpace girls in enrollment rates over the years. This implies that relatively more boys are sent to private schools compared to girls in Nepal. Table 13. — Percentage share of enrollment in private schools by gender and level of education, Nepal
Year Primary Lower secondary Secondary
Girls Boys Girls Boys Girls Boys
2003 10.0 11.5 11.7 14.4 14.3 16.2
2004 9.7 11.3 9.4 11.0 12.4 14.1
2005 5.3 6.6 6.9 8.3 8.9 10.4
2006 7.6 9.5 11.6 13.8 12.0 13.9
2007 8.9 11.5 11.7 14.2 13.6 16.0
2008 9.0 11.6 12.3 15.3 14.3 17.0
2009** 11.3 15.0 13.0 16.6 11.7 15.4
Source: MoE 2008, 2010, 2011
3.4 Socioeconomic Differentials among Students Attending
Public and Private Schools
The Nepal Living Standards Survey 2010/11 (NLSS) collected data about school attendance by those who were currently attending schools. Using the NLSS raw data, this section explores the socioeconomic and gender variation in attendance in public and private schools in Nepal.
3.4.1 Rural/Urban Differentials in School Attendance by Types of SchoolsTable 14 presents the percentage distribution of students currently attending schools by place of residence, according to types of schools. The following inferences may be made from the data. First, there is a substantial share of students in private schools in Nepal. The share of students in private schools ranges from as high as 55 percent at pre-primary level to as low as 17 percent at lower secondary level. The share at primary and secondary levels is 22 percent and 20 percent respectively. Second, the difference in attendance in rural and urban private schools is very high at all levels. At pre-primary level, 86 percent of the students are in urban private schools compared to 48 percent in rural areas; at primary level, the proportion of students in private schools in urban areas is 57 percent against 16 percent in rural areas; at lower secondary level, the proportion of students in private schools in urban areas is almost fi ve times that in rural areas (50 percent vs. 10 percent), and at secondary level it is more than four times that of rural areas (49 percent vs. 11 percent).
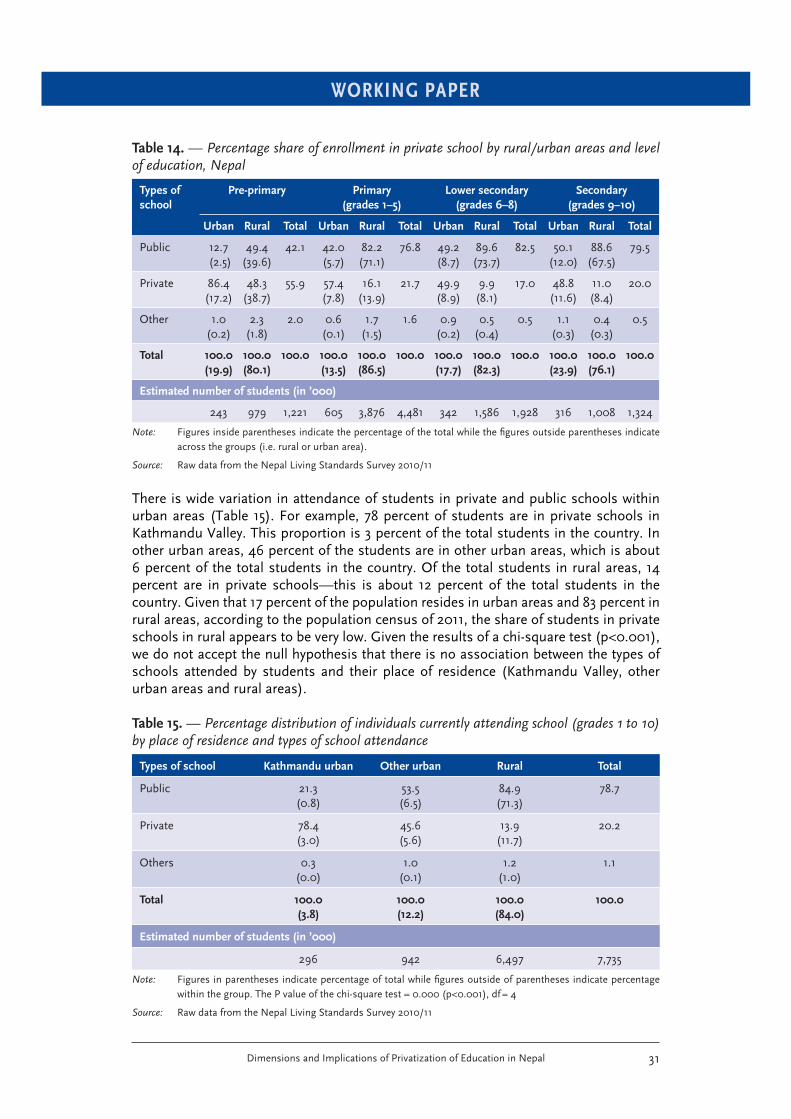
WORKING PAPER
Dimensions and Implications of Privatization of Education in Nepal 31
Table 14. — Percentage share of enrollment in private school by rural/urban areas and level of education, Nepal
Types of
school
Pre-primary Primary
(grades 1–5)
Lower secondary
(grades 6–8)
Secondary
(grades 9–10)
Urban Rural Total Urban Rural Total Urban Rural Total Urban Rural Total
Public 12.7 (2.5)
49.4 (39.6)
42.1
42.0(5.7)
82.2(71.1)
76.8 49.2(8.7)
89.6(73.7)
82.5 50.1(12.0)
88.6(67.5)
79.5
Private 86.4(17.2)
48.3(38.7)
55.9 57.4(7.8)
16.1(13.9)
21.7 49.9(8.9)
9.9(8.1)
17.0 48.8(11.6)
11.0(8.4)
20.0
Other 1.0(0.2)
2.3(1.8)
2.0 0.6(0.1)
1.7(1.5)
1.6 0.9(0.2)
0.5(0.4)
0.5 1.1(0.3)
0.4(0.3)
0.5
Total 100.0
(19.9)
100.0
(80.1)
100.0 100.0
(13.5)
100.0
(86.5)
100.0 100.0
(17.7)
100.0
(82.3)
100.0 100.0
(23.9)
100.0
(76.1)
100.0
Estimated number of students (in ’000)
243 979 1,221 605 3,876 4,481 342 1,586 1,928 316 1,008 1,324
Note: Figures inside parentheses indicate the percentage of the total while the fi gures outside parentheses indicate across the groups (i.e. rural or urban area).
Source: Raw data from the Nepal Living Standards Survey 2010/11
There is wide variation in attendance of students in private and public schools within urban areas (Table 15). For example, 78 percent of students are in private schools in Kathmandu Valley. This proportion is 3 percent of the total students in the country. In other urban areas, 46 percent of the students are in other urban areas, which is about 6 percent of the total students in the country. Of the total students in rural areas, 14 percent are in private schools—this is about 12 percent of the total students in the country. Given that 17 percent of the population resides in urban areas and 83 percent in rural areas, according to the population census of 2011, the share of students in private schools in rural appears to be very low. Given the results of a chi-square test (p<0.001), we do not accept the null hypothesis that there is no association between the types of schools attended by students and their place of residence (Kathmandu Valley, other urban areas and rural areas).
Table 15. — Percentage distribution of individuals currently attending school (grades 1 to 10) by place of residence and types of school attendance
Types of school Kathmandu urban Other urban Rural Total
Public 21.3(0.8)
53.5(6.5)
84.9(71.3)
78.7
Private 78.4(3.0)
45.6(5.6)
13.9(11.7)
20.2
Others 0.3(0.0)
1.0(0.1)
1.2(1.0)
1.1
Total 100.0
(3.8)
100.0
(12.2)
100.0
(84.0)
100.0
Estimated number of students (in ’000)
296 942 6,497 7,735
Note: Figures in parentheses indicate percentage of total while fi gures outside of parentheses indicate percentage within the group. The P value of the chi-square test = 0.000 (p<0.001), df = 4
Source: Raw data from the Nepal Living Standards Survey 2010/11
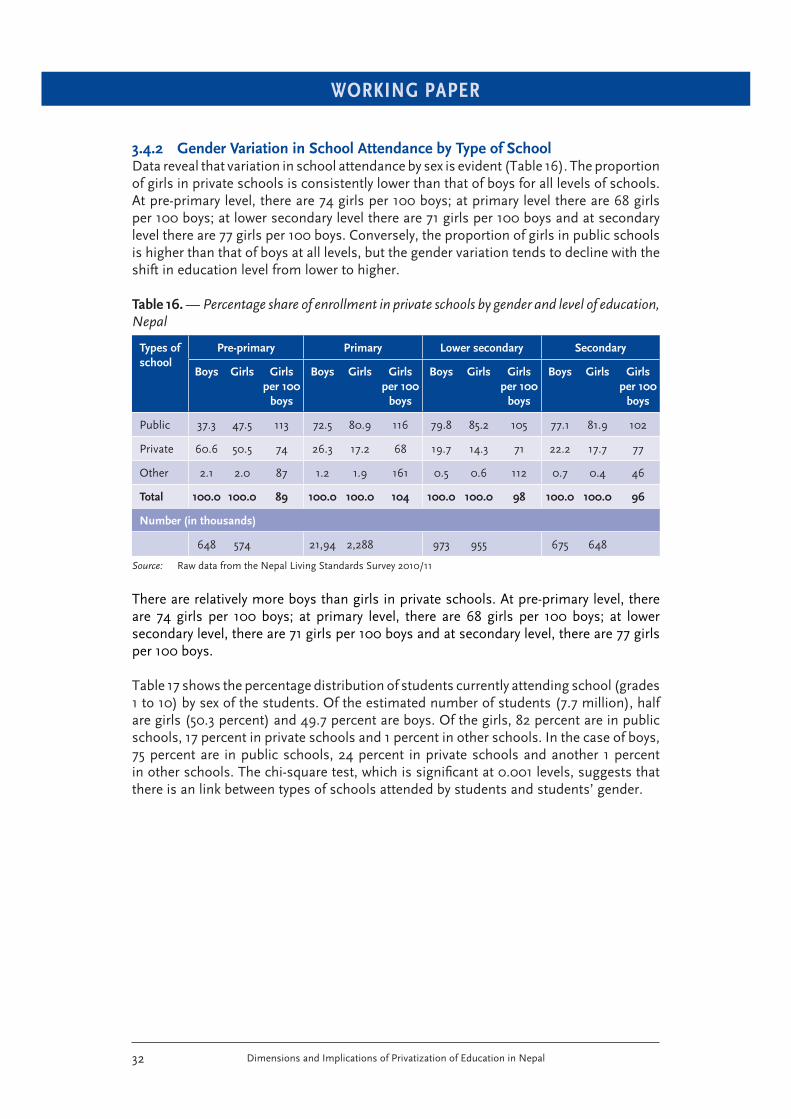
WORKING PAPER
Dimensions and Implications of Privatization of Education in Nepal32
3.4.2 Gender Variation in School Attendance by Type of SchoolData reveal that variation in school attendance by sex is evident (Table 16). The proportion of girls in private schools is consistently lower than that of boys for all levels of schools. At pre-primary level, there are 74 girls per 100 boys; at primary level there are 68 girls per 100 boys; at lower secondary level there are 71 girls per 100 boys and at secondary level there are 77 girls per 100 boys. Conversely, the proportion of girls in public schools is higher than that of boys at all levels, but the gender variation tends to decline with the shift in education level from lower to higher.
Table 16. — Percentage share of enrollment in private schools by gender and level of education, Nepal
Types of
school
Pre-primary Primary Lower secondary Secondary
Boys Girls Girls
per 100
boys
Boys Girls Girls
per 100
boys
Boys Girls Girls
per 100
boys
Boys Girls Girls
per 100
boys
Public 37.3 47.5 113 72.5 80.9 116 79.8 85.2 105 77.1 81.9 102
Private 60.6 50.5 74 26.3 17.2 68 19.7 14.3 71 22.2 17.7 77
Other 2.1 2.0 87 1.2 1.9 161 0.5 0.6 112 0.7 0.4 46
Total 100.0 100.0 89 100.0 100.0 104 100.0 100.0 98 100.0 100.0 96
Number (in thousands)
648 574 21,94 2,288 973 955 675 648
Source: Raw data from the Nepal Living Standards Survey 2010/11
There are relatively more boys than girls in private schools. At pre-primary level, there are 74 girls per 100 boys; at primary level, there are 68 girls per 100 boys; at lower secondary level, there are 71 girls per 100 boys and at secondary level, there are 77 girls per 100 boys.
Table 17 shows the percentage distribution of students currently attending school (grades 1 to 10) by sex of the students. Of the estimated number of students (7.7 million), half are girls (50.3 percent) and 49.7 percent are boys. Of the girls, 82 percent are in public schools, 17 percent in private schools and 1 percent in other schools. In the case of boys, 75 percent are in public schools, 24 percent in private schools and another 1 percent in other schools. The chi-square test, which is signifi cant at 0.001 levels, suggests that there is an link between types of schools attended by students and students’ gender.
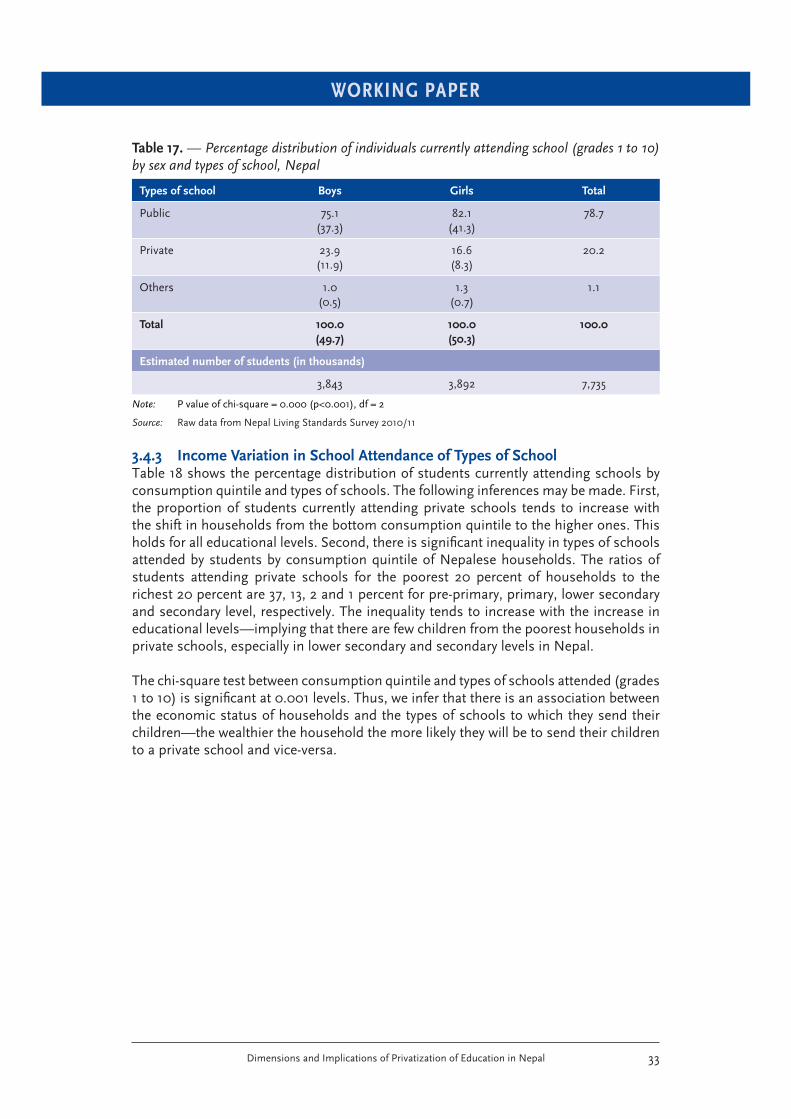
WORKING PAPER
Dimensions and Implications of Privatization of Education in Nepal 33
Table 17. — Percentage distribution of individuals currently attending school (grades 1 to 10) by sex and types of school, Nepal
Types of school Boys Girls Total
Public 75.1(37.3)
82.1(41.3)
78.7
Private 23.9(11.9)
16.6(8.3)
20.2
Others 1.0(0.5)
1.3(0.7)
1.1
Total 100.0
(49.7)
100.0
(50.3)
100.0
Estimated number of students (in thousands)
3,843 3,892 7,735
Note: P value of chi-square = 0.000 (p<0.001), df = 2
Source: Raw data from Nepal Living Standards Survey 2010/11
3.4.3 Income Variation in School Attendance of Types of SchoolTable 18 shows the percentage distribution of students currently attending schools by consumption quintile and types of schools. The following inferences may be made. First, the proportion of students currently attending private schools tends to increase with the shift in households from the bottom consumption quintile to the higher ones. This holds for all educational levels. Second, there is signifi cant inequality in types of schools attended by students by consumption quintile of Nepalese households. The ratios of students attending private schools for the poorest 20 percent of households to the richest 20 percent are 37, 13, 2 and 1 percent for pre-primary, primary, lower secondary and secondary level, respectively. The inequality tends to increase with the increase in educational levels—implying that there are few children from the poorest households in private schools, especially in lower secondary and secondary levels in Nepal.
The chi-square test between consumption quintile and types of schools attended (grades 1 to 10) is signifi cant at 0.001 levels. Thus, we infer that there is an association between the economic status of households and the types of schools to which they send their children—the wealthier the household the more likely they will be to send their children to a private school and vice-versa.
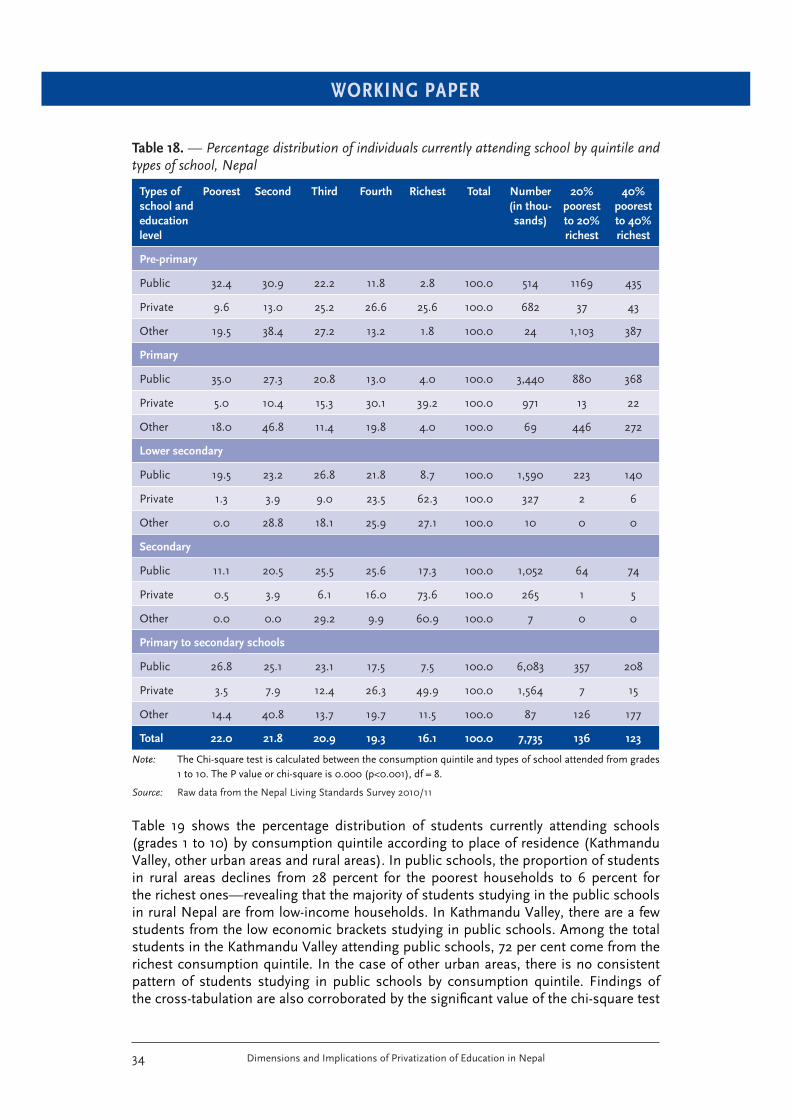
WORKING PAPER
Dimensions and Implications of Privatization of Education in Nepal34
Table 18. — Percentage distribution of individuals currently attending school by quintile and types of school, Nepal
Types of
school and
education
level
Poorest Second Third Fourth Richest Total Number
(in thou-
sands)
20%
poorest
to 20%
richest
40%
poorest
to 40%
richest
Pre-primary
Public 32.4 30.9 22.2 11.8 2.8 100.0 514 1169 435
Private 9.6 13.0 25.2 26.6 25.6 100.0 682 37 43
Other 19.5 38.4 27.2 13.2 1.8 100.0 24 1,103 387
Primary
Public 35.0 27.3 20.8 13.0 4.0 100.0 3,440 880 368
Private 5.0 10.4 15.3 30.1 39.2 100.0 971 13 22
Other 18.0 46.8 11.4 19.8 4.0 100.0 69 446 272
Lower secondary
Public 19.5 23.2 26.8 21.8 8.7 100.0 1,590 223 140
Private 1.3 3.9 9.0 23.5 62.3 100.0 327 2 6
Other 0.0 28.8 18.1 25.9 27.1 100.0 10 0 0
Secondary
Public 11.1 20.5 25.5 25.6 17.3 100.0 1,052 64 74
Private 0.5 3.9 6.1 16.0 73.6 100.0 265 1 5
Other 0.0 0.0 29.2 9.9 60.9 100.0 7 0 0
Primary to secondary schools
Public 26.8 25.1 23.1 17.5 7.5 100.0 6,083 357 208
Private 3.5 7.9 12.4 26.3 49.9 100.0 1,564 7 15
Other 14.4 40.8 13.7 19.7 11.5 100.0 87 126 177
Total 22.0 21.8 20.9 19.3 16.1 100.0 7,735 136 123
Note: The Chi-square test is calculated between the consumption quintile and types of school attended from grades 1 to 10. The P value or chi-square is 0.000 (p<0.001), df = 8.
Source: Raw data from the Nepal Living Standards Survey 2010/11
Table 19 shows the percentage distribution of students currently attending schools (grades 1 to 10) by consumption quintile according to place of residence (Kathmandu Valley, other urban areas and rural areas). In public schools, the proportion of students in rural areas declines from 28 percent for the poorest households to 6 percent for the richest ones—revealing that the majority of students studying in the public schools in rural Nepal are from low-income households. In Kathmandu Valley, there are a few students from the low economic brackets studying in public schools. Among the total students in the Kathmandu Valley attending public schools, 72 per cent come from the richest consumption quintile. In the case of other urban areas, there is no consistent pattern of students studying in public schools by consumption quintile. Findings of the cross-tabulation are also corroborated by the signifi cant value of the chi-square test
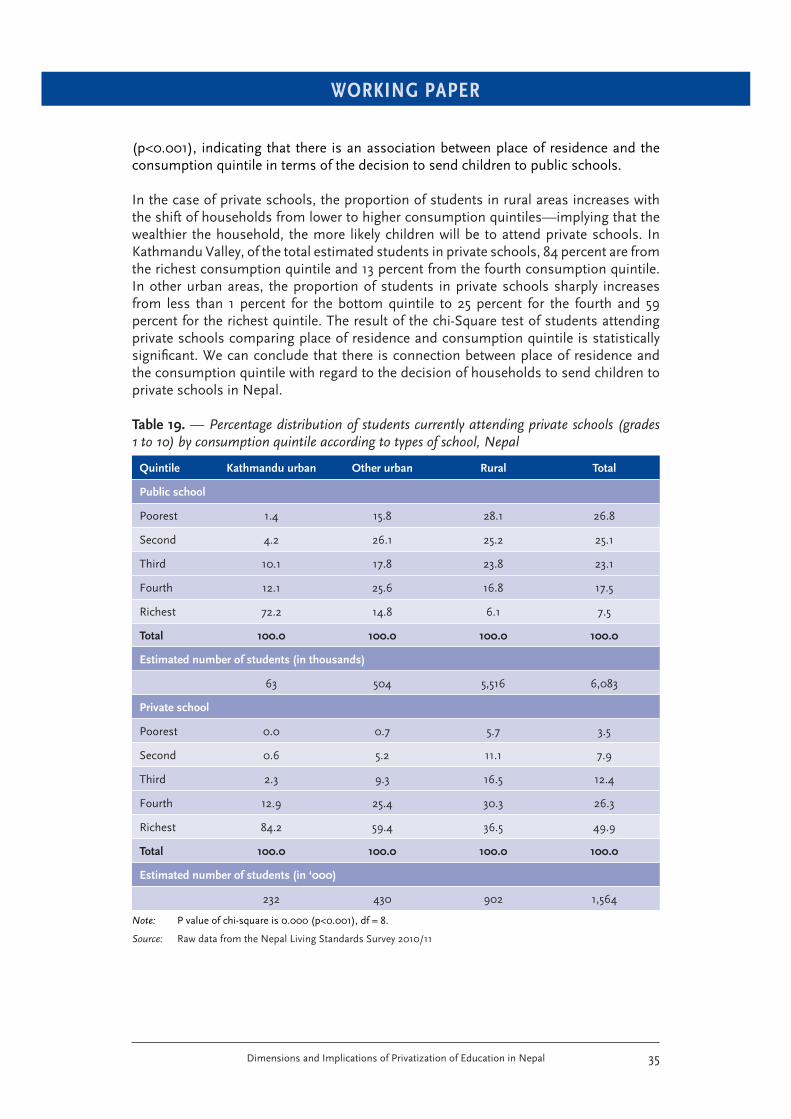
WORKING PAPER
Dimensions and Implications of Privatization of Education in Nepal 35
(p<0.001), indicating that there is an association between place of residence and the consumption quintile in terms of the decision to send children to public schools.
In the case of private schools, the proportion of students in rural areas increases with the shift of households from lower to higher consumption quintiles—implying that the wealthier the household, the more likely children will be to attend private schools. In Kathmandu Valley, of the total estimated students in private schools, 84 percent are from the richest consumption quintile and 13 percent from the fourth consumption quintile. In other urban areas, the proportion of students in private schools sharply increases from less than 1 percent for the bottom quintile to 25 percent for the fourth and 59 percent for the richest quintile. The result of the chi-Square test of students attending private schools comparing place of residence and consumption quintile is statistically signifi cant. We can conclude that there is connection between place of residence and the consumption quintile with regard to the decision of households to send children to private schools in Nepal.
Table 19. — Percentage distribution of students currently attending private schools (grades 1 to 10) by consumption quintile according to types of school, Nepal
Quintile Kathmandu urban Other urban Rural Total
Public school
Poorest 1.4 15.8 28.1 26.8
Second 4.2 26.1 25.2 25.1
Third 10.1 17.8 23.8 23.1
Fourth 12.1 25.6 16.8 17.5
Richest 72.2 14.8 6.1 7.5
Total 100.0 100.0 100.0 100.0
Estimated number of students (in thousands)
63 504 5,516 6,083
Private school
Poorest 0.0 0.7 5.7 3.5
Second 0.6 5.2 11.1 7.9
Third 2.3 9.3 16.5 12.4
Fourth 12.9 25.4 30.3 26.3
Richest 84.2 59.4 36.5 49.9
Total 100.0 100.0 100.0 100.0
Estimated number of students (in ‘000)
232 430 902 1,564
Note: P value of chi-square is 0.000 (p<0.001), df = 8.
Source: Raw data from the Nepal Living Standards Survey 2010/11
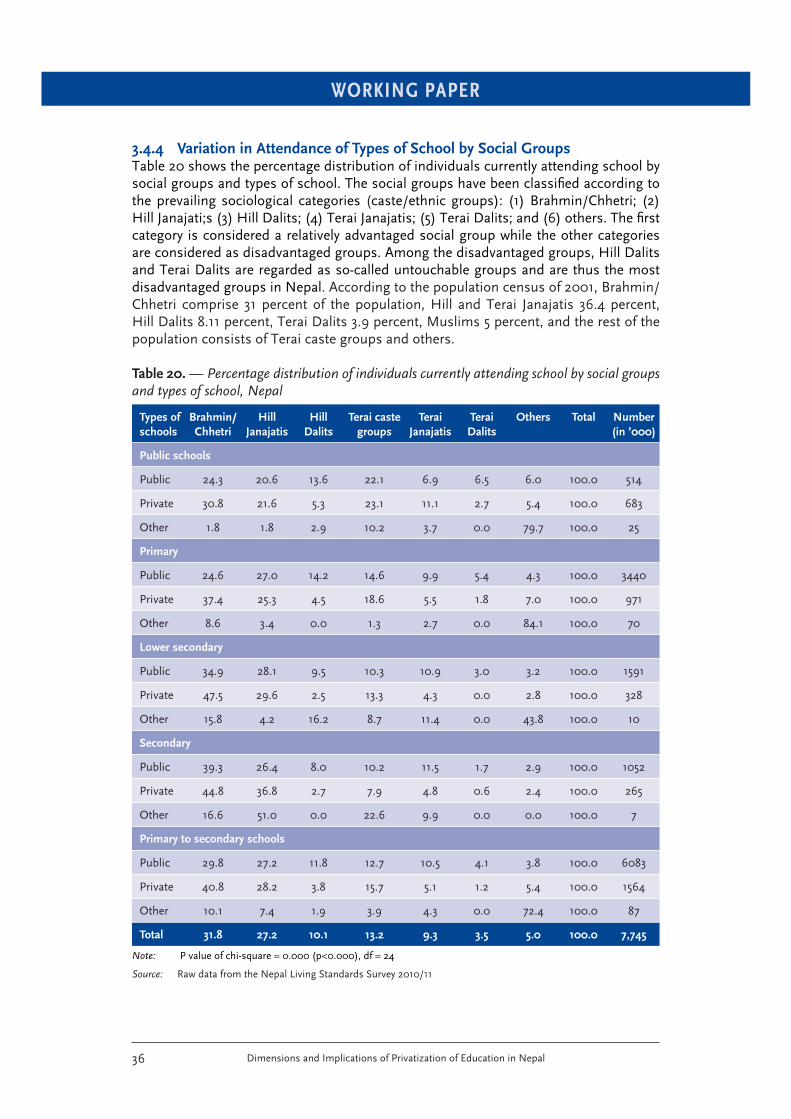
WORKING PAPER
Dimensions and Implications of Privatization of Education in Nepal36
3.4.4 Variation in Attendance of Types of School by Social GroupsTable 20 shows the percentage distribution of individuals currently attending school by social groups and types of school. The social groups have been classifi ed according to the prevailing sociological categories (caste/ethnic groups): (1) Brahmin/Chhetri; (2) Hill Janajati;s (3) Hill Dalits; (4) Terai Janajatis; (5) Terai Dalits; and (6) others. The fi rst category is considered a relatively advantaged social group while the other categories are considered as disadvantaged groups. Among the disadvantaged groups, Hill Dalits and Terai Dalits are regarded as so-called untouchable groups and are thus the most disadvantaged groups in Nepal. According to the population census of 2001, Brahmin/Chhetri comprise 31 percent of the population, Hill and Terai Janajatis 36.4 percent, Hill Dalits 8.11 percent, Terai Dalits 3.9 percent, Muslims 5 percent, and the rest of the population consists of Terai caste groups and others.
Table 20. — Percentage distribution of individuals currently attending school by social groups and types of school, Nepal
Types of
schools
Brahmin/
Chhetri
Hill
Janajatis
Hill
Dalits
Terai caste
groups
Terai
Janajatis
Terai
Dalits
Others Total Number
(in ’000)
Public schools
Public 24.3 20.6 13.6 22.1 6.9 6.5 6.0 100.0 514
Private 30.8 21.6 5.3 23.1 11.1 2.7 5.4 100.0 683
Other 1.8 1.8 2.9 10.2 3.7 0.0 79.7 100.0 25
Primary
Public 24.6 27.0 14.2 14.6 9.9 5.4 4.3 100.0 3440
Private 37.4 25.3 4.5 18.6 5.5 1.8 7.0 100.0 971
Other 8.6 3.4 0.0 1.3 2.7 0.0 84.1 100.0 70
Lower secondary
Public 34.9 28.1 9.5 10.3 10.9 3.0 3.2 100.0 1591
Private 47.5 29.6 2.5 13.3 4.3 0.0 2.8 100.0 328
Other 15.8 4.2 16.2 8.7 11.4 0.0 43.8 100.0 10
Secondary
Public 39.3 26.4 8.0 10.2 11.5 1.7 2.9 100.0 1052
Private 44.8 36.8 2.7 7.9 4.8 0.6 2.4 100.0 265
Other 16.6 51.0 0.0 22.6 9.9 0.0 0.0 100.0 7
Primary to secondary schools
Public 29.8 27.2 11.8 12.7 10.5 4.1 3.8 100.0 6083
Private 40.8 28.2 3.8 15.7 5.1 1.2 5.4 100.0 1564
Other 10.1 7.4 1.9 3.9 4.3 0.0 72.4 100.0 87
Total 31.8 27.2 10.1 13.2 9.3 3.5 5.0 100.0 7,745
Note: P value of chi-square = 0.000 (p<0.000), df = 24
Source: Raw data from the Nepal Living Standards Survey 2010/11
WORKING PAPER
Dimensions and Implications of Privatization of Education in Nepal 37
Among the social groups, Brahmin/Chhetri have the highest proportion of students currently attending school. This is followed by Hill Janajati, the Terai caste groups, Hill Dalits and Terai Dalits. This pattern holds according to types and levels of schools too. The share of Brahmin/Chhetri in private schools (grades 1 to 10) is 41 percent and their share in public schools is about 30 percent. Given the population size of 31 percent, they are overrepresented in private schools while slightly underrepresented in public schools. In the case of Hill Janajatis, their share in private and public schools is 28 and 27 percent respectively. Given their share of 36 percent in the total population of Nepal, they are slightly underrepresented in both types of school. In the case of Hill Dalits, their share in public schools appears to be reasonable, given their proportion of the population, which is about 8 percent while their share in private schools is extremely low (about 4 percent). Among the Terai caste group, their share in public and private schools is estimated to be 13 percent and 16 percent respectively. The Terai Dalits have the lowest share of students in both types of school (4 percent) vis-à-vis their share in the total population, with only 1 percent attending private schools.
The chi-square test of students currently attending schools comparing social groups and types of school is statistically signifi cant (p<0.001). Thus, we cannot accept the null hypothesis that there is no association between social groups and types of school attended by the students in Nepal.
3.4.5 Interface between Social Groups and Consumption Quintal and Type of School Attended Table 21 shows the percentage distribution of students currently attending a public or private school (grades 1–10) by social groups and consumption quintile. The following may be inferred from the data. First, caste/ethnicity is not the only factor that determines attendance of students at private schools. For example, Brahmin/Chhetri children attending private schools come from a range of consumption quintiles, and this is also the case among other disadvantaged groups. Second, the proportion of children attending private schools increases with the shift from lower to higher consumption quintile levels, especially among Brahmin/Chhetri and Hill Janajatis. This relationship suggests that the likelihood of children attending private schools among these social groups tends to increase when the households are wealthier.
Among the Hill Dalits, Terai caste groups, Terai Janajatis and Terai Dalits, the opposite relationship exists between the proportion of children attending private schools and the consumption quintile. This relationship suggests that the share of these groups in private schools is very low, especially in the higher consumption quintile households.
The chi-square test of students attending public schools to compare social groups and consumption quintile is signifi cant at 0.001 levels. The same relationship is observed in the case of private schools.
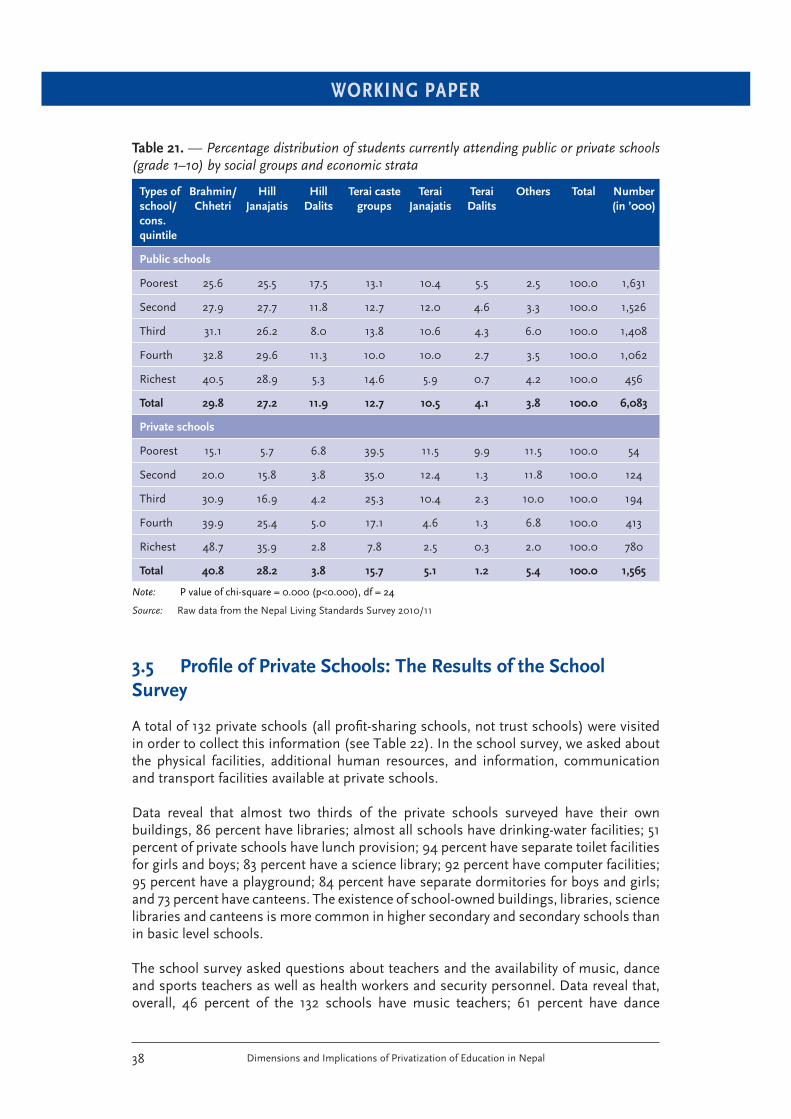
WORKING PAPER
Dimensions and Implications of Privatization of Education in Nepal38
Table 21. — Percentage distribution of students currently attending public or private schools (grade 1–10) by social groups and economic strata
Types of
school/
cons.
quintile
Brahmin/
Chhetri
Hill
Janajatis
Hill
Dalits
Terai caste
groups
Terai
Janajatis
Terai
Dalits
Others Total Number
(in ’000)
Public schools
Poorest 25.6 25.5 17.5 13.1 10.4 5.5 2.5 100.0 1,631
Second 27.9 27.7 11.8 12.7 12.0 4.6 3.3 100.0 1,526
Third 31.1 26.2 8.0 13.8 10.6 4.3 6.0 100.0 1,408
Fourth 32.8 29.6 11.3 10.0 10.0 2.7 3.5 100.0 1,062
Richest 40.5 28.9 5.3 14.6 5.9 0.7 4.2 100.0 456
Total 29.8 27.2 11.9 12.7 10.5 4.1 3.8 100.0 6,083
Private schools
Poorest 15.1 5.7 6.8 39.5 11.5 9.9 11.5 100.0 54
Second 20.0 15.8 3.8 35.0 12.4 1.3 11.8 100.0 124
Third 30.9 16.9 4.2 25.3 10.4 2.3 10.0 100.0 194
Fourth 39.9 25.4 5.0 17.1 4.6 1.3 6.8 100.0 413
Richest 48.7 35.9 2.8 7.8 2.5 0.3 2.0 100.0 780
Total 40.8 28.2 3.8 15.7 5.1 1.2 5.4 100.0 1,565
Note: P value of chi-square = 0.000 (p<0.000), df = 24
Source: Raw data from the Nepal Living Standards Survey 2010/11
3.5 Profi le of Private Schools: The Results of the School
Survey
A total of 132 private schools (all profi t-sharing schools, not trust schools) were visited in order to collect this information (see Table 22). In the school survey, we asked about the physical facilities, additional human resources, and information, communication and transport facilities available at private schools.
Data reveal that almost two thirds of the private schools surveyed have their own buildings, 86 percent have libraries; almost all schools have drinking-water facilities; 51 percent of private schools have lunch provision; 94 percent have separate toilet facilities for girls and boys; 83 percent have a science library; 92 percent have computer facilities; 95 percent have a playground; 84 percent have separate dormitories for boys and girls; and 73 percent have canteens. The existence of school-owned buildings, libraries, science libraries and canteens is more common in higher secondary and secondary schools than in basic level schools.
The school survey asked questions about teachers and the availability of music, dance and sports teachers as well as health workers and security personnel. Data reveal that, overall, 46 percent of the 132 schools have music teachers; 61 percent have dance
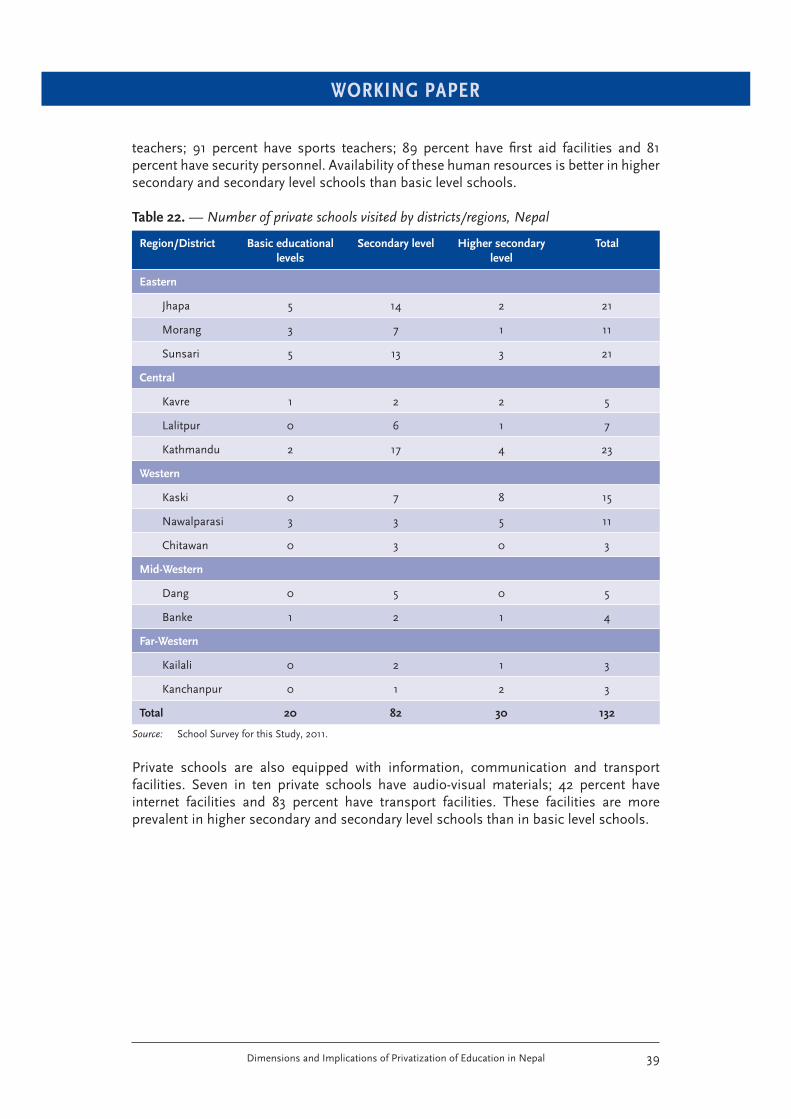
WORKING PAPER
Dimensions and Implications of Privatization of Education in Nepal 39
teachers; 91 percent have sports teachers; 89 percent have fi rst aid facilities and 81 percent have security personnel. Availability of these human resources is better in higher secondary and secondary level schools than basic level schools.
Table 22. — Number of private schools visited by districts/regions, Nepal
Region/District Basic educational
levels
Secondary level Higher secondary
level
Total
Eastern
Jhapa 5 14 2 21
Morang 3 7 1 11
Sunsari 5 13 3 21
Central
Kavre 1 2 2 5
Lalitpur 0 6 1 7
Kathmandu 2 17 4 23
Western
Kaski 0 7 8 15
Nawalparasi 3 3 5 11
Chitawan 0 3 0 3
Mid-Western
Dang 0 5 0 5
Banke 1 2 1 4
Far-Western
Kailali 0 2 1 3
Kanchanpur 0 1 2 3
Total 20 82 30 132
Source: School Survey for this Study, 2011.
Private schools are also equipped with information, communication and transport facilities. Seven in ten private schools have audio-visual materials; 42 percent have internet facilities and 83 percent have transport facilities. These facilities are more prevalent in higher secondary and secondary level schools than in basic level schools.
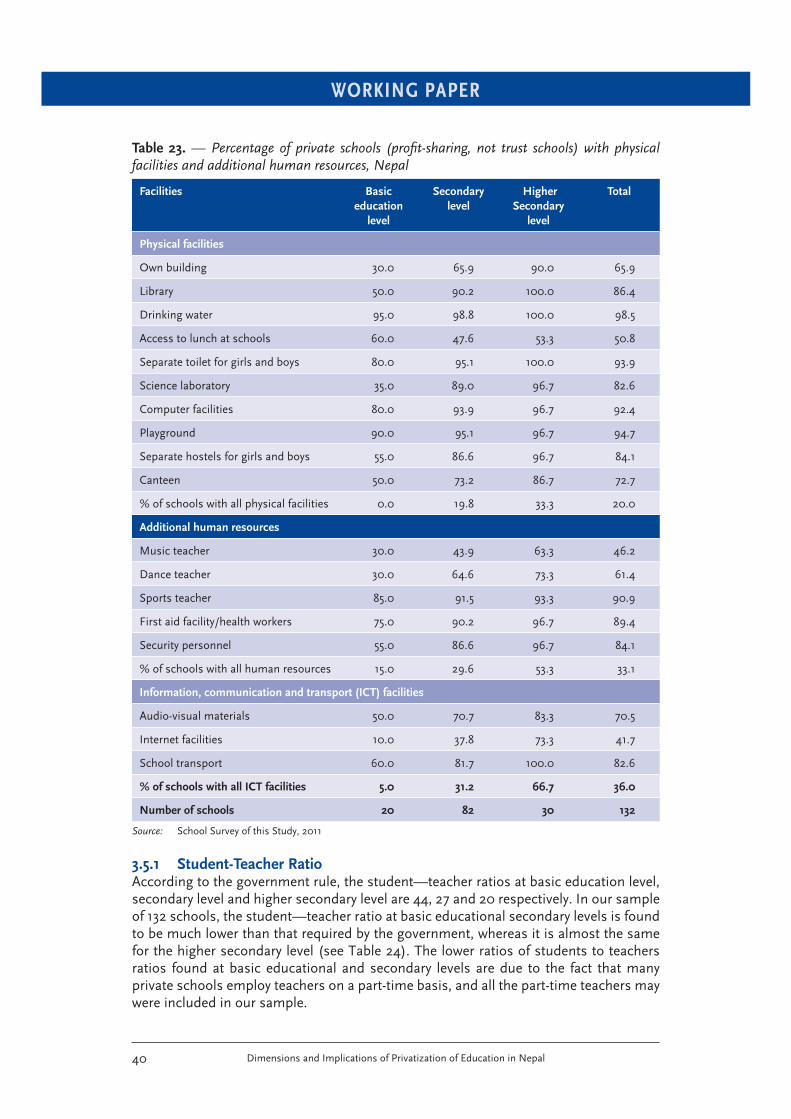
WORKING PAPER
Dimensions and Implications of Privatization of Education in Nepal40
Table 23. — Percentage of private schools (profi t-sharing, not trust schools) with physical facilities and additional human resources, Nepal
Facilities Basic
education
level
Secondary
level
Higher
Secondary
level
Total
Physical facilities
Own building 30.0 65.9 90.0 65.9
Library 50.0 90.2 100.0 86.4
Drinking water 95.0 98.8 100.0 98.5
Access to lunch at schools 60.0 47.6 53.3 50.8
Separate toilet for girls and boys 80.0 95.1 100.0 93.9
Science laboratory 35.0 89.0 96.7 82.6
Computer facilities 80.0 93.9 96.7 92.4
Playground 90.0 95.1 96.7 94.7
Separate hostels for girls and boys 55.0 86.6 96.7 84.1
Canteen 50.0 73.2 86.7 72.7
% of schools with all physical facilities 0.0 19.8 33.3 20.0
Additional human resources
Music teacher 30.0 43.9 63.3 46.2
Dance teacher 30.0 64.6 73.3 61.4
Sports teacher 85.0 91.5 93.3 90.9
First aid facility/health workers 75.0 90.2 96.7 89.4
Security personnel 55.0 86.6 96.7 84.1
% of schools with all human resources 15.0 29.6 53.3 33.1
Information, communication and transport (ICT) facilities
Audio-visual materials 50.0 70.7 83.3 70.5
Internet facilities 10.0 37.8 73.3 41.7
School transport 60.0 81.7 100.0 82.6
% of schools with all ICT facilities 5.0 31.2 66.7 36.0
Number of schools 20 82 30 132
Source: School Survey of this Study, 2011
3.5.1 Student-Teacher RatioAccording to the government rule, the student—teacher ratios at basic education level, secondary level and higher secondary level are 44, 27 and 20 respectively. In our sample of 132 schools, the student—teacher ratio at basic educational secondary levels is found to be much lower than that required by the government, whereas it is almost the same for the higher secondary level (see Table 24). The lower ratios of students to teachers ratios found at basic educational and secondary levels are due to the fact that many private schools employ teachers on a part-time basis, and all the part-time teachers may were included in our sample.
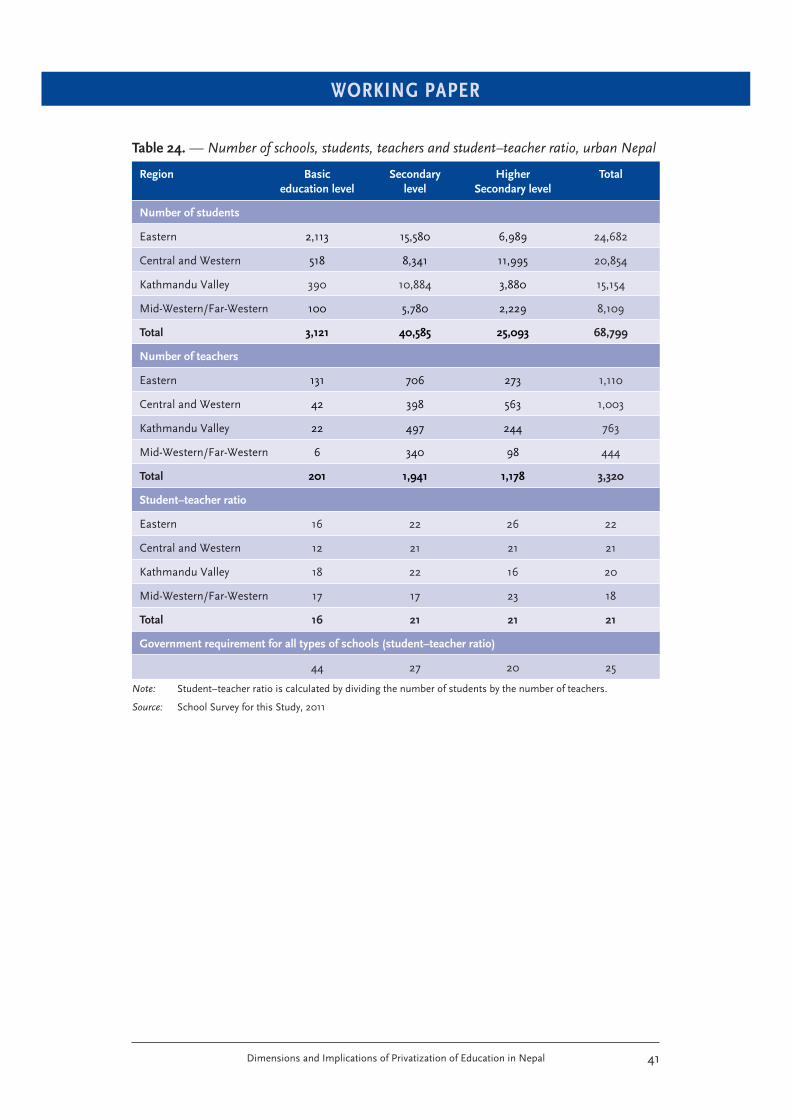
WORKING PAPER
Dimensions and Implications of Privatization of Education in Nepal 41
Table 24. — Number of schools, students, teachers and student–teacher ratio, urban Nepal
Region Basic
education level
Secondary
level
Higher
Secondary level
Total
Number of students
Eastern 2,113 15,580 6,989 24,682
Central and Western 518 8,341 11,995 20,854
Kathmandu Valley 390 10,884 3,880 15,154
Mid-Western/Far-Western 100 5,780 2,229 8,109
Total 3,121 40,585 25,093 68,799
Number of teachers
Eastern 131 706 273 1,110
Central and Western 42 398 563 1,003
Kathmandu Valley 22 497 244 763
Mid-Western/Far-Western 6 340 98 444
Total 201 1,941 1,178 3,320
Student–teacher ratio
Eastern 16 22 26 22
Central and Western 12 21 21 21
Kathmandu Valley 18 22 16 20
Mid-Western/Far-Western 17 17 23 18
Total 16 21 21 21
Government requirement for all types of schools (student–teacher ratio)
44 27 20 25
Note: Student–teacher ratio is calculated by dividing the number of students by the number of teachers.
Source: School Survey for this Study, 2011
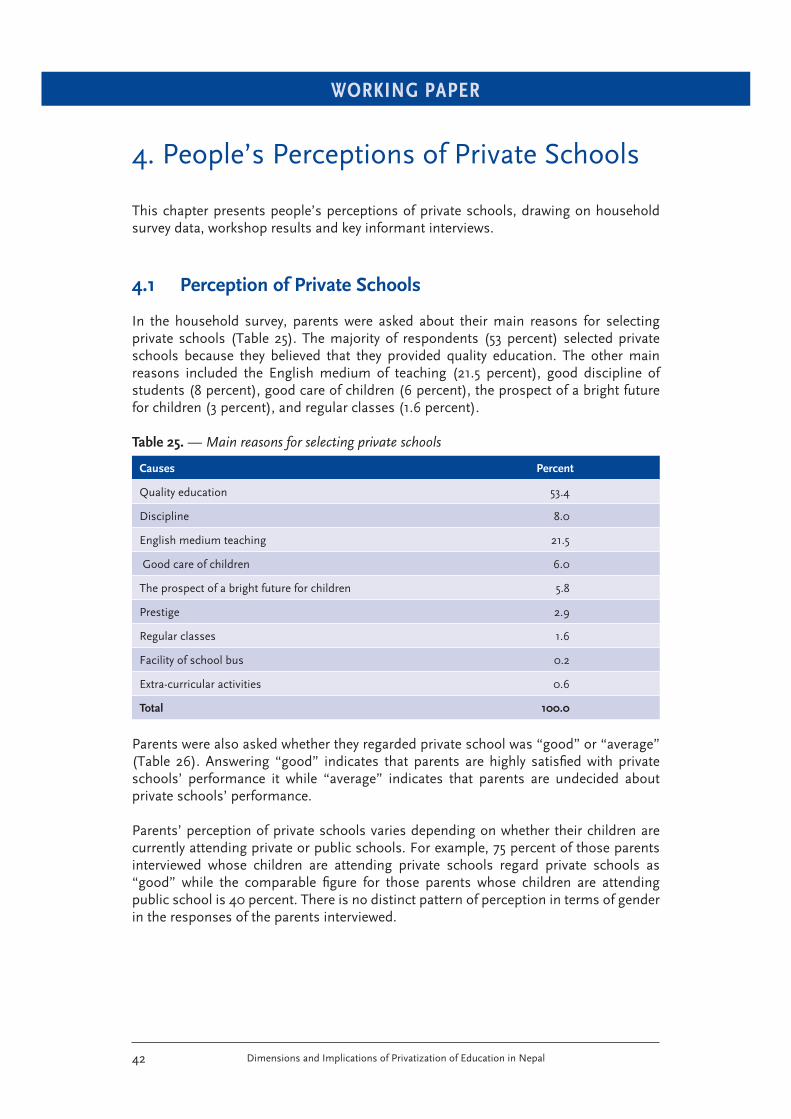
WORKING PAPER
Dimensions and Implications of Privatization of Education in Nepal42
4. People’s Perceptions of Private Schools
This chapter presents people’s perceptions of private schools, drawing on household survey data, workshop results and key informant interviews.
4.1 Perception of Private Schools
In the household survey, parents were asked about their main reasons for selecting private schools (Table 25). The majority of respondents (53 percent) selected private schools because they believed that they provided quality education. The other main reasons included the English medium of teaching (21.5 percent), good discipline of students (8 percent), good care of children (6 percent), the prospect of a bright future for children (3 percent), and regular classes (1.6 percent).
Table 25. — Main reasons for selecting private schools
Causes Percent
Quality education 53.4
Discipline 8.0
English medium teaching 21.5
Good care of children 6.0
The prospect of a bright future for children 5.8
Prestige 2.9
Regular classes 1.6
Facility of school bus 0.2
Extra-curricular activities 0.6
Total 100.0
Parents were also asked whether they regarded private school was “good” or “average” (Table 26). Answering “good” indicates that parents are highly satisfi ed with private schools’ performance it while “average” indicates that parents are undecided about private schools’ performance.
Parents’ perception of private schools varies depending on whether their children are currently attending private or public schools. For example, 75 percent of those parents interviewed whose children are attending private schools regard private schools as “good” while the comparable fi gure for those parents whose children are attending public school is 40 percent. There is no distinct pattern of perception in terms of gender in the responses of the parents interviewed.
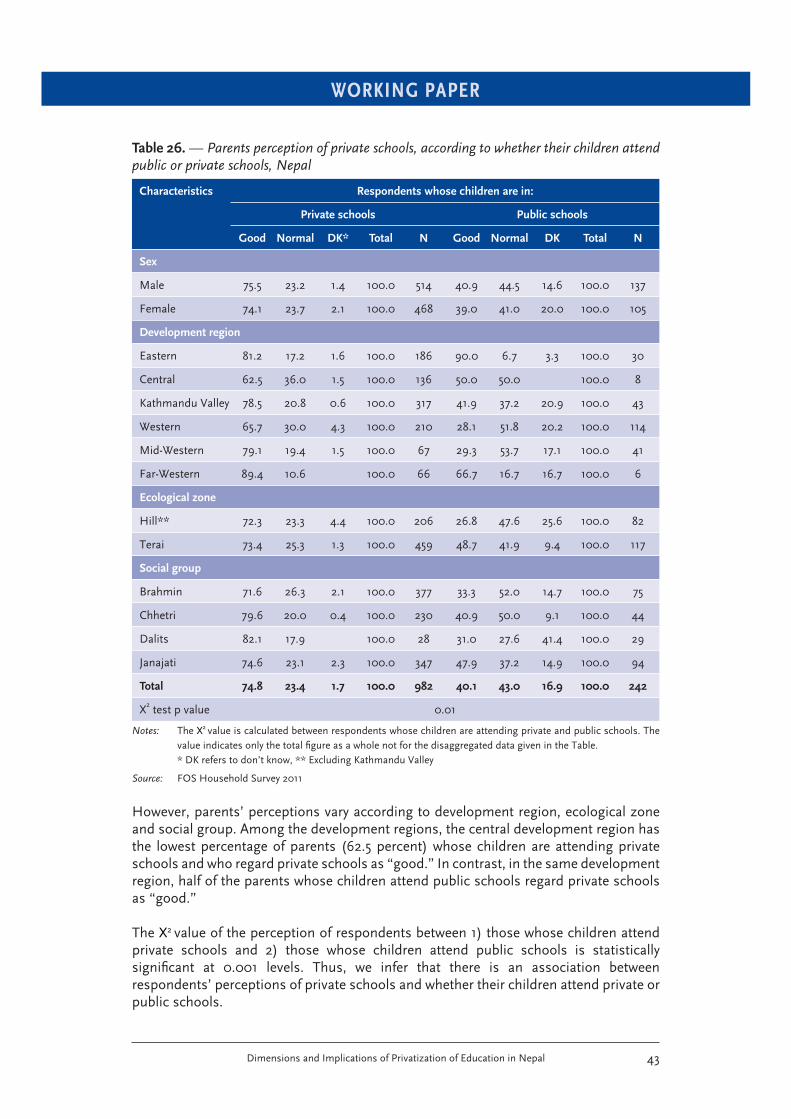
WORKING PAPER
Dimensions and Implications of Privatization of Education in Nepal 43
Table 26. — Parents perception of private schools, according to whether their children attend public or private schools, Nepal
Characteristics Respondents whose children are in:
Private schools Public schools
Good Normal DK* Total N Good Normal DK Total N
Sex
Male 75.5 23.2 1.4 100.0 514 40.9 44.5 14.6 100.0 137
Female 74.1 23.7 2.1 100.0 468 39.0 41.0 20.0 100.0 105
Development region
Eastern 81.2 17.2 1.6 100.0 186 90.0 6.7 3.3 100.0 30
Central 62.5 36.0 1.5 100.0 136 50.0 50.0 100.0 8
Kathmandu Valley 78.5 20.8 0.6 100.0 317 41.9 37.2 20.9 100.0 43
Western 65.7 30.0 4.3 100.0 210 28.1 51.8 20.2 100.0 114
Mid-Western 79.1 19.4 1.5 100.0 67 29.3 53.7 17.1 100.0 41
Far-Western 89.4 10.6 100.0 66 66.7 16.7 16.7 100.0 6
Ecological zone
Hill** 72.3 23.3 4.4 100.0 206 26.8 47.6 25.6 100.0 82
Terai 73.4 25.3 1.3 100.0 459 48.7 41.9 9.4 100.0 117
Social group
Brahmin 71.6 26.3 2.1 100.0 377 33.3 52.0 14.7 100.0 75
Chhetri 79.6 20.0 0.4 100.0 230 40.9 50.0 9.1 100.0 44
Dalits 82.1 17.9 100.0 28 31.0 27.6 41.4 100.0 29
Janajati 74.6 23.1 2.3 100.0 347 47.9 37.2 14.9 100.0 94
Total 74.8 23.4 1.7 100.0 982 40.1 43.0 16.9 100.0 242
X2 test p value 0.01
Notes: The X2 value is calculated between respondents whose children are attending private and public schools. The value indicates only the total fi gure as a whole not for the disaggregated data given in the Table.
* DK refers to don’t know, ** Excluding Kathmandu Valley
Source: FOS Household Survey 2011
However, parents’ perceptions vary according to development region, ecological zone and social group. Among the development regions, the central development region has the lowest percentage of parents (62.5 percent) whose children are attending private schools and who regard private schools as “good.” In contrast, in the same development region, half of the parents whose children attend public schools regard private schools as “good.”
The X2 value of the perception of respondents between 1) those whose children attend private schools and 2) those whose children attend public schools is statistically signifi cant at 0.001 levels. Thus, we infer that there is an association between respondents’ perceptions of private schools and whether their children attend private or public schools.
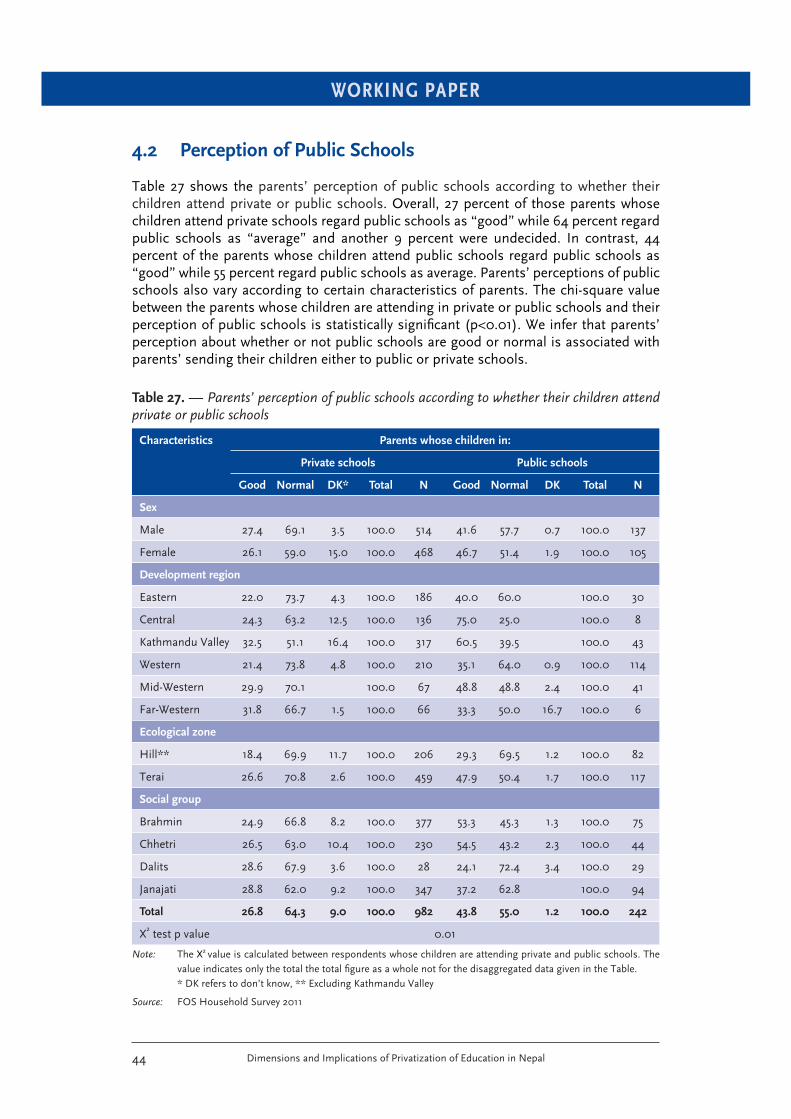
WORKING PAPER
Dimensions and Implications of Privatization of Education in Nepal44
4.2 Perception of Public Schools
Table 27 shows the parents’ perception of public schools according to whether their children attend private or public schools. Overall, 27 percent of those parents whose children attend private schools regard public schools as “good” while 64 percent regard public schools as “average” and another 9 percent were undecided. In contrast, 44 percent of the parents whose children attend public schools regard public schools as “good” while 55 percent regard public schools as average. Parents’ perceptions of public schools also vary according to certain characteristics of parents. The chi-square value between the parents whose children are attending in private or public schools and their perception of public schools is statistically signifi cant (p<0.01). We infer that parents’ perception about whether or not public schools are good or normal is associated with parents’ sending their children either to public or private schools.
Table 27. — Parents’ perception of public schools according to whether their children attend private or public schools
Characteristics Parents whose children in:
Private schools Public schools
Good Normal DK* Total N Good Normal DK Total N
Sex
Male 27.4 69.1 3.5 100.0 514 41.6 57.7 0.7 100.0 137
Female 26.1 59.0 15.0 100.0 468 46.7 51.4 1.9 100.0 105
Development region
Eastern 22.0 73.7 4.3 100.0 186 40.0 60.0 100.0 30
Central 24.3 63.2 12.5 100.0 136 75.0 25.0 100.0 8
Kathmandu Valley 32.5 51.1 16.4 100.0 317 60.5 39.5 100.0 43
Western 21.4 73.8 4.8 100.0 210 35.1 64.0 0.9 100.0 114
Mid-Western 29.9 70.1 100.0 67 48.8 48.8 2.4 100.0 41
Far-Western 31.8 66.7 1.5 100.0 66 33.3 50.0 16.7 100.0 6
Ecological zone
Hill** 18.4 69.9 11.7 100.0 206 29.3 69.5 1.2 100.0 82
Terai 26.6 70.8 2.6 100.0 459 47.9 50.4 1.7 100.0 117
Social group
Brahmin 24.9 66.8 8.2 100.0 377 53.3 45.3 1.3 100.0 75
Chhetri 26.5 63.0 10.4 100.0 230 54.5 43.2 2.3 100.0 44
Dalits 28.6 67.9 3.6 100.0 28 24.1 72.4 3.4 100.0 29
Janajati 28.8 62.0 9.2 100.0 347 37.2 62.8 100.0 94
Total 26.8 64.3 9.0 100.0 982 43.8 55.0 1.2 100.0 242
X2 test p value 0.01
Note: The X2 value is calculated between respondents whose children are attending private and public schools. The value indicates only the total the total fi gure as a whole not for the disaggregated data given in the Table.
* DK refers to don’t know, ** Excluding Kathmandu Valley
Source: FOS Household Survey 2011
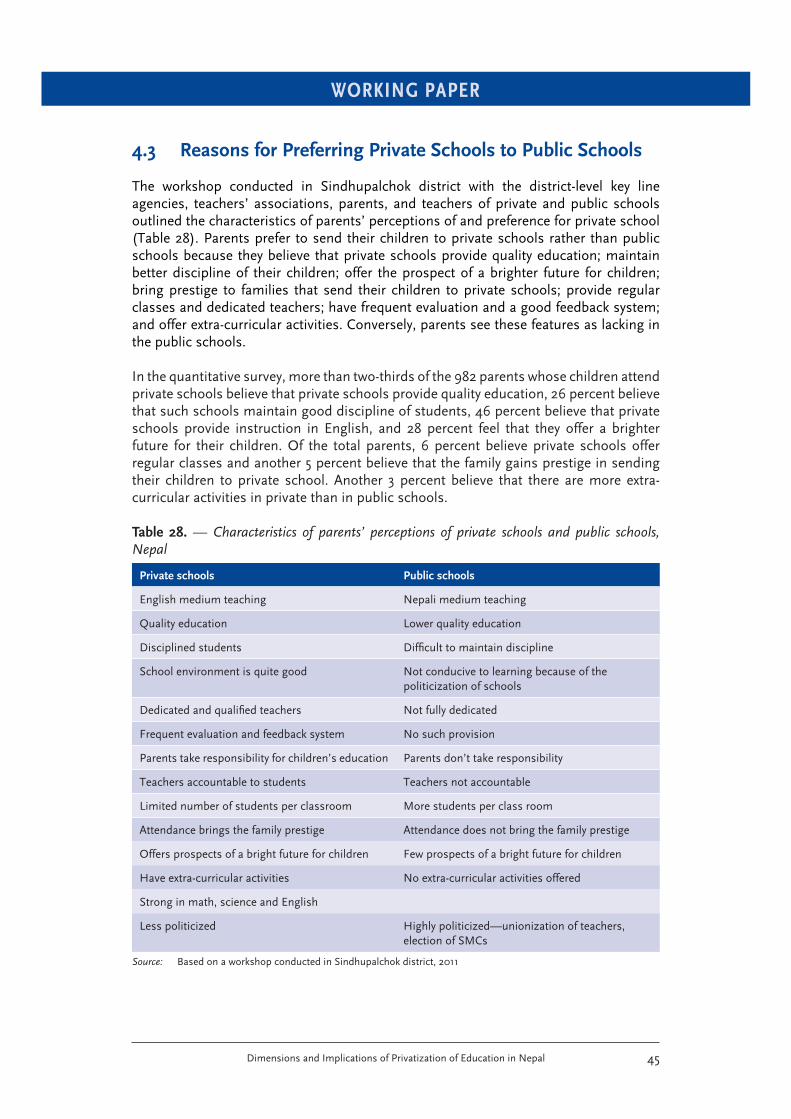
WORKING PAPER
Dimensions and Implications of Privatization of Education in Nepal 45
4.3 Reasons for Preferring Private Schools to Public Schools
The workshop conducted in Sindhupalchok district with the district-level key line agencies, teachers’ associations, parents, and teachers of private and public schools outlined the characteristics of parents’ perceptions of and preference for private school (Table 28). Parents prefer to send their children to private schools rather than public schools because they believe that private schools provide quality education; maintain better discipline of their children; offer the prospect of a brighter future for children; bring prestige to families that send their children to private schools; provide regular classes and dedicated teachers; have frequent evaluation and a good feedback system; and offer extra-curricular activities. Conversely, parents see these features as lacking in the public schools.
In the quantitative survey, more than two-thirds of the 982 parents whose children attend private schools believe that private schools provide quality education, 26 percent believe that such schools maintain good discipline of students, 46 percent believe that private schools provide instruction in English, and 28 percent feel that they offer a brighter future for their children. Of the total parents, 6 percent believe private schools offer regular classes and another 5 percent believe that the family gains prestige in sending their children to private school. Another 3 percent believe that there are more extra-curricular activities in private than in public schools.
Table 28. — Characteristics of parents’ perceptions of private schools and public schools, Nepal
Private schools Public schools
English medium teaching Nepali medium teaching
Quality education Lower quality education
Disciplined students Diffi cult to maintain discipline
School environment is quite good Not conducive to learning because of the politicization of schools
Dedicated and qualifi ed teachers Not fully dedicated
Frequent evaluation and feedback system No such provision
Parents take responsibility for children’s education Parents don’t take responsibility
Teachers accountable to students Teachers not accountable
Limited number of students per classroom More students per class room
Attendance brings the family prestige Attendance does not bring the family prestige
Offers prospects of a bright future for children Few prospects of a bright future for children
Have extra-curricular activities No extra-curricular activities offered
Strong in math, science and English
Less politicized Highly politicized—unionization of teachers, election of SMCs
Source: Based on a workshop conducted in Sindhupalchok district, 2011
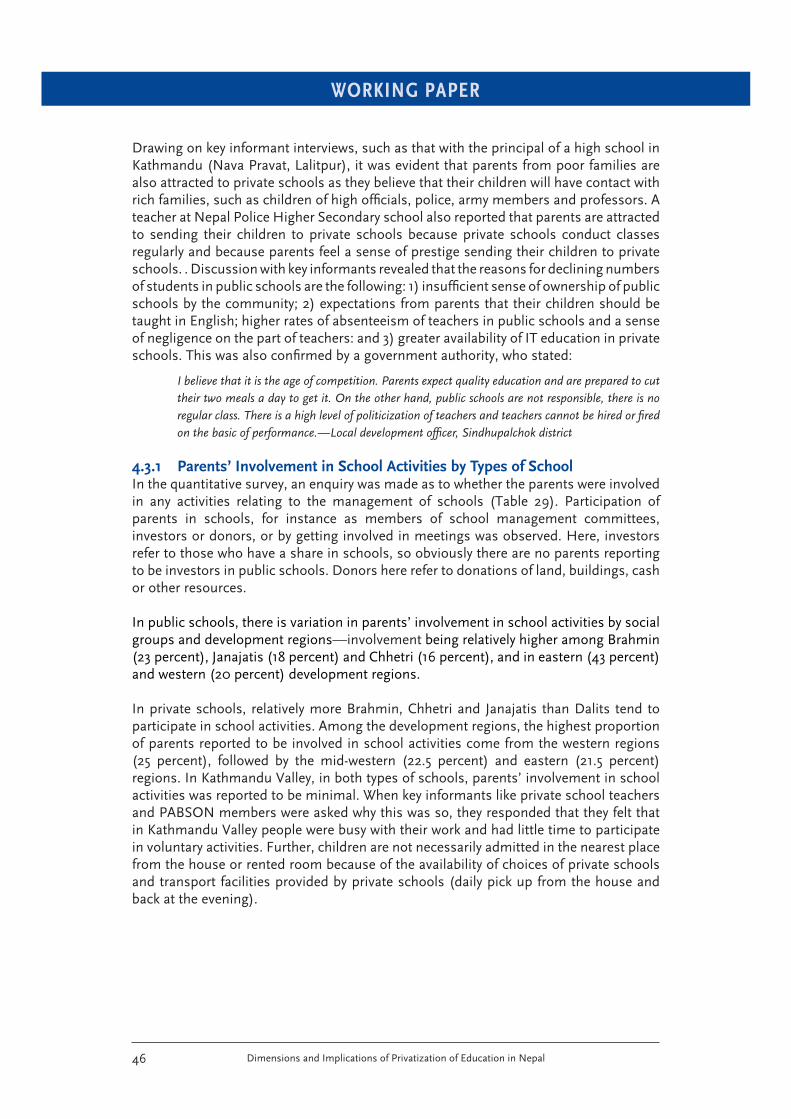
WORKING PAPER
Dimensions and Implications of Privatization of Education in Nepal46
Drawing on key informant interviews, such as that with the principal of a high school in Kathmandu (Nava Pravat, Lalitpur), it was evident that parents from poor families are also attracted to private schools as they believe that their children will have contact with rich families, such as children of high offi cials, police, army members and professors. A teacher at Nepal Police Higher Secondary school also reported that parents are attracted to sending their children to private schools because private schools conduct classes regularly and because parents feel a sense of prestige sending their children to private schools. . Discussion with key informants revealed that the reasons for declining numbers of students in public schools are the following: 1) insuffi cient sense of ownership of public schools by the community; 2) expectations from parents that their children should be taught in English; higher rates of absenteeism of teachers in public schools and a sense of negligence on the part of teachers: and 3) greater availability of IT education in private schools. This was also confi rmed by a government authority, who stated:
I believe that it is the age of competition. Parents expect quality education and are prepared to cut
their two meals a day to get it. On the other hand, public schools are not responsible, there is no
regular class. There is a high level of politicization of teachers and teachers cannot be hired or fi red
on the basic of performance.—Local development offi cer, Sindhupalchok district
4.3.1 Parents’ Involvement in School Activities by Types of SchoolIn the quantitative survey, an enquiry was made as to whether the parents were involved in any activities relating to the management of schools (Table 29). Participation of parents in schools, for instance as members of school management committees, investors or donors, or by getting involved in meetings was observed. Here, investors refer to those who have a share in schools, so obviously there are no parents reporting to be investors in public schools. Donors here refer to donations of land, buildings, cash or other resources.
In public schools, there is variation in parents’ involvement in school activities by social groups and development regions—involvement being relatively higher among Brahmin (23 percent), Janajatis (18 percent) and Chhetri (16 percent), and in eastern (43 percent) and western (20 percent) development regions.
In private schools, relatively more Brahmin, Chhetri and Janajatis than Dalits tend to participate in school activities. Among the development regions, the highest proportion of parents reported to be involved in school activities come from the western regions (25 percent), followed by the mid-western (22.5 percent) and eastern (21.5 percent) regions. In Kathmandu Valley, in both types of schools, parents’ involvement in school activities was reported to be minimal. When key informants like private school teachers and PABSON members were asked why this was so, they responded that they felt that in Kathmandu Valley people were busy with their work and had little time to participate in voluntary activities. Further, children are not necessarily admitted in the nearest place from the house or rented room because of the availability of choices of private schools and transport facilities provided by private schools (daily pick up from the house and back at the evening).
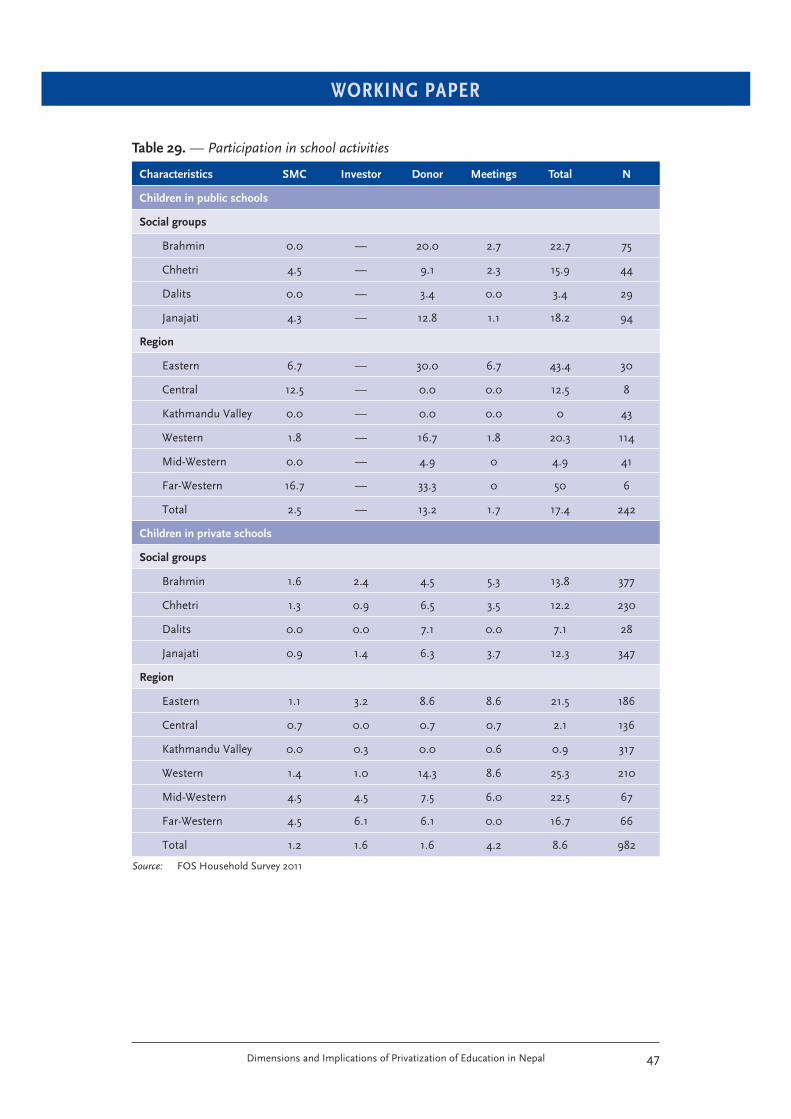
WORKING PAPER
Dimensions and Implications of Privatization of Education in Nepal 47
Table 29. — Participation in school activities
Characteristics SMC Investor Donor Meetings Total N
Children in public schools
Social groups
Brahmin 0.0 — 20.0 2.7 22.7 75
Chhetri 4.5 — 9.1 2.3 15.9 44
Dalits 0.0 — 3.4 0.0 3.4 29
Janajati 4.3 — 12.8 1.1 18.2 94
Region
Eastern 6.7 — 30.0 6.7 43.4 30
Central 12.5 — 0.0 0.0 12.5 8
Kathmandu Valley 0.0 — 0.0 0.0 0 43
Western 1.8 — 16.7 1.8 20.3 114
Mid-Western 0.0 — 4.9 0 4.9 41
Far-Western 16.7 — 33.3 0 50 6
Total 2.5 — 13.2 1.7 17.4 242
Children in private schools
Social groups
Brahmin 1.6 2.4 4.5 5.3 13.8 377
Chhetri 1.3 0.9 6.5 3.5 12.2 230
Dalits 0.0 0.0 7.1 0.0 7.1 28
Janajati 0.9 1.4 6.3 3.7 12.3 347
Region
Eastern 1.1 3.2 8.6 8.6 21.5 186
Central 0.7 0.0 0.7 0.7 2.1 136
Kathmandu Valley 0.0 0.3 0.0 0.6 0.9 317
Western 1.4 1.0 14.3 8.6 25.3 210
Mid-Western 4.5 4.5 7.5 6.0 22.5 67
Far-Western 4.5 6.1 6.1 0.0 16.7 66
Total 1.2 1.6 1.6 4.2 8.6 982
Source: FOS Household Survey 2011
WORKING PAPER
Dimensions and Implications of Privatization of Education in Nepal48
4.4 Parents’ Perception of Children’s Achievement in Private
Schools
In order to examine the satisfaction levels of parents regarding their children’s experiences in private schools, we asked whether were they were satisfi ed with the achievement of their children in schools, and how they viewed the educational activities of the schools and the availability of physical facilities at schools (Table 30).
The majority of parents viewed their children’s educational achievement as “good” (54 percent) or “very good” (11.5 percent). The main criteria for the judgment were: ability to read and write, profi cient in English, good at studying, regular class attendance, intelligence and being top in the class.
Table 30. — Parents’ perception on children’s progress in private schools
Child’s educational
achievement
Education activities
of private school
Physical facilities
of the private school
Very good 11.5 9.0 9.1
Good 54.3 43.7 42.6
Normal 31.8 40.1 39.5
Don’t know 2.4 7.3 9.0
Total 100.0 100.0 100.0
Number of parents 982 982 982
Source: FOS Household Survey 2011
In relation to perceptions of educational activities of private schools, the majority of parents reported them to be “good” (44 percent), or “very good” (9 percent) while another 37 percent reported “average.” The main reasons put forward for good and very good were: regular evaluation system, conduct of meetings with parents, conduct of extra-curricular activities, better rules and regulations, availability of computers and cleanliness.
Similarly, the majority of the parents (43 percent) viewed the physical facilities of their children’s schools as “good” and another 9 percent reported as “very good.” Note that more than one third of the parents reported facilities as “average” (or undecided). In the survey, it was reported by 30 percent of the parents that their children’s schools had a good school environment, 24 percent that reported that the school had its own school building, 23 percent reported well-managed class rooms and 13 percent reported playgrounds. There were also parents who reported that the building was in poor condition, or that drinking water and toilet facilities were lacking.
Respondents were asked whether they viewed graduates of private schools as superior in terms of education performance and the results are presented in Table 31. One can infer the following. First, both types of parents (whether they sent their children to private or public schools) fi rmly believed that graduates of private schools were better than that of public schools. Second, this belief was much stronger among those who sent their children to private schools. Finally, the belief is strongest among men, in far-western Nepal, in the Hills region and among Dalits.
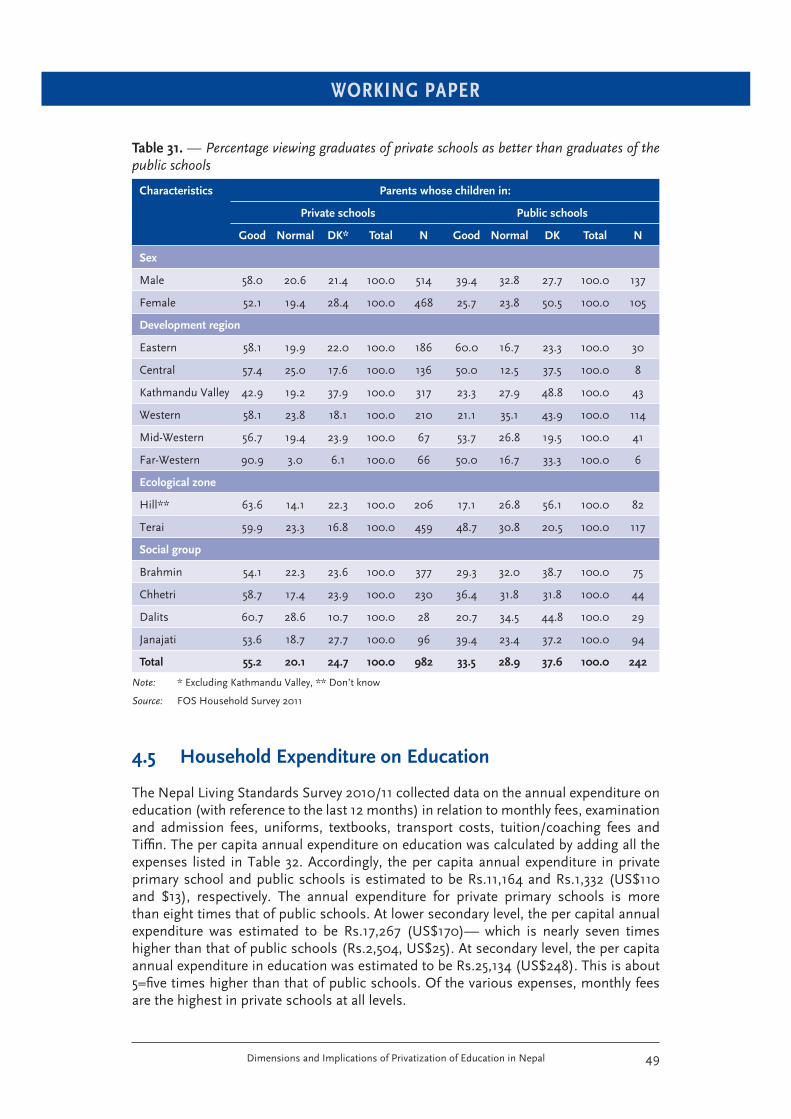
WORKING PAPER
Dimensions and Implications of Privatization of Education in Nepal 49
Table 31. — Percentage viewing graduates of private schools as better than graduates of the public schools
Characteristics Parents whose children in:
Private schools Public schools
Good Normal DK* Total N Good Normal DK Total N
Sex
Male 58.0 20.6 21.4 100.0 514 39.4 32.8 27.7 100.0 137
Female 52.1 19.4 28.4 100.0 468 25.7 23.8 50.5 100.0 105
Development region
Eastern 58.1 19.9 22.0 100.0 186 60.0 16.7 23.3 100.0 30
Central 57.4 25.0 17.6 100.0 136 50.0 12.5 37.5 100.0 8
Kathmandu Valley 42.9 19.2 37.9 100.0 317 23.3 27.9 48.8 100.0 43
Western 58.1 23.8 18.1 100.0 210 21.1 35.1 43.9 100.0 114
Mid-Western 56.7 19.4 23.9 100.0 67 53.7 26.8 19.5 100.0 41
Far-Western 90.9 3.0 6.1 100.0 66 50.0 16.7 33.3 100.0 6
Ecological zone
Hill** 63.6 14.1 22.3 100.0 206 17.1 26.8 56.1 100.0 82
Terai 59.9 23.3 16.8 100.0 459 48.7 30.8 20.5 100.0 117
Social group
Brahmin 54.1 22.3 23.6 100.0 377 29.3 32.0 38.7 100.0 75
Chhetri 58.7 17.4 23.9 100.0 230 36.4 31.8 31.8 100.0 44
Dalits 60.7 28.6 10.7 100.0 28 20.7 34.5 44.8 100.0 29
Janajati 53.6 18.7 27.7 100.0 96 39.4 23.4 37.2 100.0 94
Total 55.2 20.1 24.7 100.0 982 33.5 28.9 37.6 100.0 242
Note: * Excluding Kathmandu Valley, ** Don’t know
Source: FOS Household Survey 2011
4.5 Household Expenditure on Education
The Nepal Living Standards Survey 2010/11 collected data on the annual expenditure on education (with reference to the last 12 months) in relation to monthly fees, examination and admission fees, uniforms, textbooks, transport costs, tuition/coaching fees and Tiffi n. The per capita annual expenditure on education was calculated by adding all the expenses listed in Table 32. Accordingly, the per capita annual expenditure in private primary school and public schools is estimated to be Rs.11,164 and Rs.1,332 (US$110 and $13), respectively. The annual expenditure for private primary schools is more than eight times that of public schools. At lower secondary level, the per capital annual expenditure was estimated to be Rs.17,267 (US$170)— which is nearly seven times higher than that of public schools (Rs.2,504, US$25). At secondary level, the per capita annual expenditure in education was estimated to be Rs.25,134 (US$248). This is about 5=fi ve times higher than that of public schools. Of the various expenses, monthly fees are the highest in private schools at all levels.
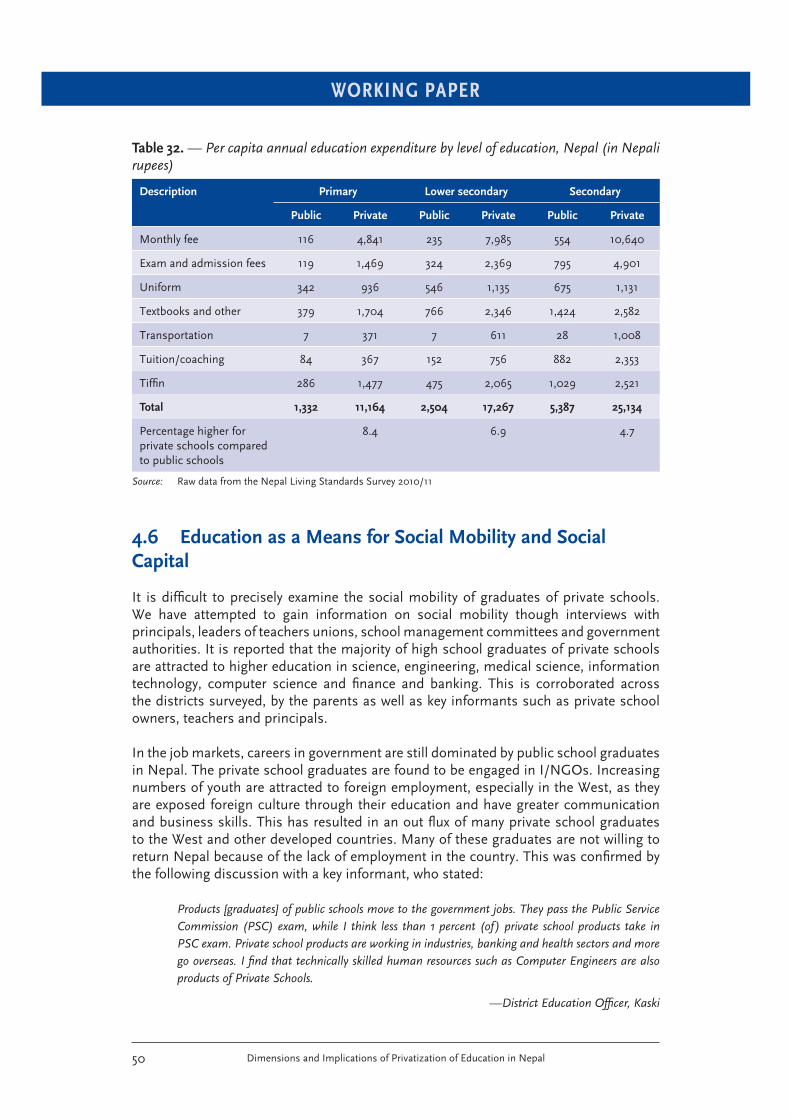
WORKING PAPER
Dimensions and Implications of Privatization of Education in Nepal50
Table 32. — Per capita annual education expenditure by level of education, Nepal (in Nepali rupees)
Description Primary Lower secondary Secondary
Public Private Public Private Public Private
Monthly fee 116 4,841 235 7,985 554 10,640
Exam and admission fees 119 1,469 324 2,369 795 4,901
Uniform 342 936 546 1,135 675 1,131
Textbooks and other 379 1,704 766 2,346 1,424 2,582
Transportation 7 371 7 611 28 1,008
Tuition/coaching 84 367 152 756 882 2,353
Tiffi n 286 1,477 475 2,065 1,029 2,521
Total 1,332 11,164 2,504 17,267 5,387 25,134
Percentage higher for private schools compared to public schools
8.4 6.9 4.7
Source: Raw data from the Nepal Living Standards Survey 2010/11
4.6 Education as a Means for Social Mobility and Social
Capital
It is diffi cult to precisely examine the social mobility of graduates of private schools. We have attempted to gain information on social mobility though interviews with principals, leaders of teachers unions, school management committees and government authorities. It is reported that the majority of high school graduates of private schools are attracted to higher education in science, engineering, medical science, information technology, computer science and fi nance and banking. This is corroborated across the districts surveyed, by the parents as well as key informants such as private school owners, teachers and principals.
In the job markets, careers in government are still dominated by public school graduates in Nepal. The private school graduates are found to be engaged in I/NGOs. Increasing numbers of youth are attracted to foreign employment, especially in the West, as they are exposed foreign culture through their education and have greater communication and business skills. This has resulted in an out fl ux of many private school graduates to the West and other developed countries. Many of these graduates are not willing to return Nepal because of the lack of employment in the country. This was confi rmed by the following discussion with a key informant, who stated:
Products [graduates] of public schools move to the government jobs. They pass the Public Service
Commission (PSC) exam, while I think less than 1 percent (of ) private school products take in
PSC exam. Private school products are working in industries, banking and health sectors and more
go overseas. I fi nd that technically skilled human resources such as Computer Engineers are also
products of Private Schools.
—District Education Offi cer, Kaski
WORKING PAPER
Dimensions and Implications of Privatization of Education in Nepal 51
Almost half of the products of private schools leave the country. What is the use in investing in
private education in the country?
—National President, Institutional Schools Teachers Association-Nepal
Nearly 60 percent of Nepal Police Higher Secondary School, Sanga, Kavre district graduates go
to USA, 5 percent go to UK and 5 percent go to other developed countries including Europe. This
holds for both girls and boys. In terms of jobs, the very limited number of products of this school has
joined in the Nepal Police; some have joined in the Nepal Army, few have joined Management and
almost none has fought for Public Service Commission for civil services in the country.
—a teacher at Nepal Police Higher Secondary School, Sanga, Kavre district
WORKING PAPER
Dimensions and Implications of Privatization of Education in Nepal52
5. Implications of Privatization of Education in Nepal
This chapter analyzes the consequences of the privatization of education. It reveals positive and negative implications.
5.1 Contribution to Achieving Millennium Development Goals
Our study suggests that private schools contributed to increasing the enrollment rates of children in schools. When asked about the contribution of private schools to achieving “Education for All” by 2015, the private school owners claimed that they have been providing education for a large number of children without the government’s fi nancial support. A member of PABSON in Nawalparasi district stated:
Had there been no private sector in education, the Government would have to spend much higher
budget compared to today. This surplus budget should be spent for education in remote, deprived,
marginal and indigenous groups. Private schools are also supporting the poor, marginalized and
talented students which also help to achieve the goal of education for all.
On the other hand, some government offi cers (such as the director of the Department of Education and some district education offi cers in our interviews) did not recognize the role played by private schools in achieving the Millennium Development Goals (MDGs) in Nepal. They seem to think that the role of private schools was negligible and even believed that this sector was involved in propaganda rather than taking constructive action. They claimed that private schools were engaged in business and charging excessive fees. The government authorities’ perception of private schools refl ects the confl ict of interest between government and private schools. Government authorities would like to see private schools under their close surveillance, as in the case of public schools, while this is not the case in many private schools in Nepal.
5.2 High Degree of Stratifi cation in Education
Nepal’s school education system has a high degree of stratifi cation. The high stratifi cation is refl ected in the enrollment rates of students in private and public schools. As discussed in Chapter 3, there are gender, economic and social group and rural—urban differences in enrollment in private and public schools in Nepal. This difference is noticeable and concerning—poor, marginalized and people living in remote areas are mainly excluded from private schools. Furthermore, there are vast differences in terms of quality of education among the private schools. There are some very high-standard schools in terms of physical facilities, human resources, access to information and communication and transport facilities, access to games and sports and even academic results. In contrast, there are private schools that do not meet even the minimum standard of the public schools. Thus, it seems that the differentiated school education system exacerbates the already stratifi ed society and increases inequality.
WORKING PAPER
Dimensions and Implications of Privatization of Education in Nepal 53
In the household survey, the majority of parents interviewed (59 percent) believed that the dual schooling system in Nepal was not conducive to the social cohesion of the country while one fourth of the parents believed that the dual system was acceptable, as the private sector contributes to an increase in the quality of education in the country. A quarter was undecided about the dual education.
Key informant interviewees also revealed that there is debate around the dual education system. The principal of Nava Prabha School, Lalitpur commented:
We are producing unequal citizens. From public school, weak students are produced especially in
English language, but they are relatively independent. In private schools, we produce dependent
students, as they are the readymade product (bookish knowledge rather than creative one); students
are weak in Nepal.
The District Education Offi cer, Sindhupalchok district, felt that education in Nepal was not privatized but rather that new schools have been opening up as private schools over the last 10 to 15 years:
I do not accept that education is privatized. Public schools have not been privatized in Nepal but
new schools are opening up as private schools. The government is focusing on increasing public-
private partnership in the education sector. But I would see that there should not be public-private
partnership at least at the basic education level (grades 1–8). All the responsibility for providing
education should be provided by the government up to the basic education level. I would prefer
public-private partnership after the completion of basic education.
5.3 Social Justice in Education: The Provision of Scholarships
The government of Nepal provides scholarship to girls, Dalits, disadvantaged Janajati, disabled persons, and people living in the Karnali region (a remote and disadvantaged geographical area) in public schools. As per the Rules of Scholarship (First Amendment 2006, 40 percent of the total budget of fellowship of the government should be allocated to the poor, girls, disabled, Janajatis, Dalits and students from remote areas. Of the total reserved fellowship budget, 20 percent is allocated to the poor, 50 percent to girls, 10 percent to the disabled, 15 percent to the Janajatis, 15 percent to Dalits and the remaining 15 percent to students from remote areas. Note that the scholarship is provided on the basis of the attendance of students, however.
In the case of private schools, private schools’ organizations such as PABSON aim to conduct many programs targeting students by establishing various types of private-public partnerships to improve access and quality of education; helping public schools in management/academics; providing educational opportunities to talented students, and victims of confl ict; reaching children from remote areas and girls through the provision of different types of scholarship. However, in the school survey of 132 private schools, it was found that private schools provided scholarships to the students mainly on the basis of three criteria: 1) merit, 2) recommendation from the District Education Offi ce and 3) providing one student with free tuition if there are three or more students from a single family. In our school survey, 10.5 percent of the students in basic education schools, 11 percent in secondary schools and 9 percent in higher educational schools were reported to have been provided either full or partial scholarship by the schools (Table 33).
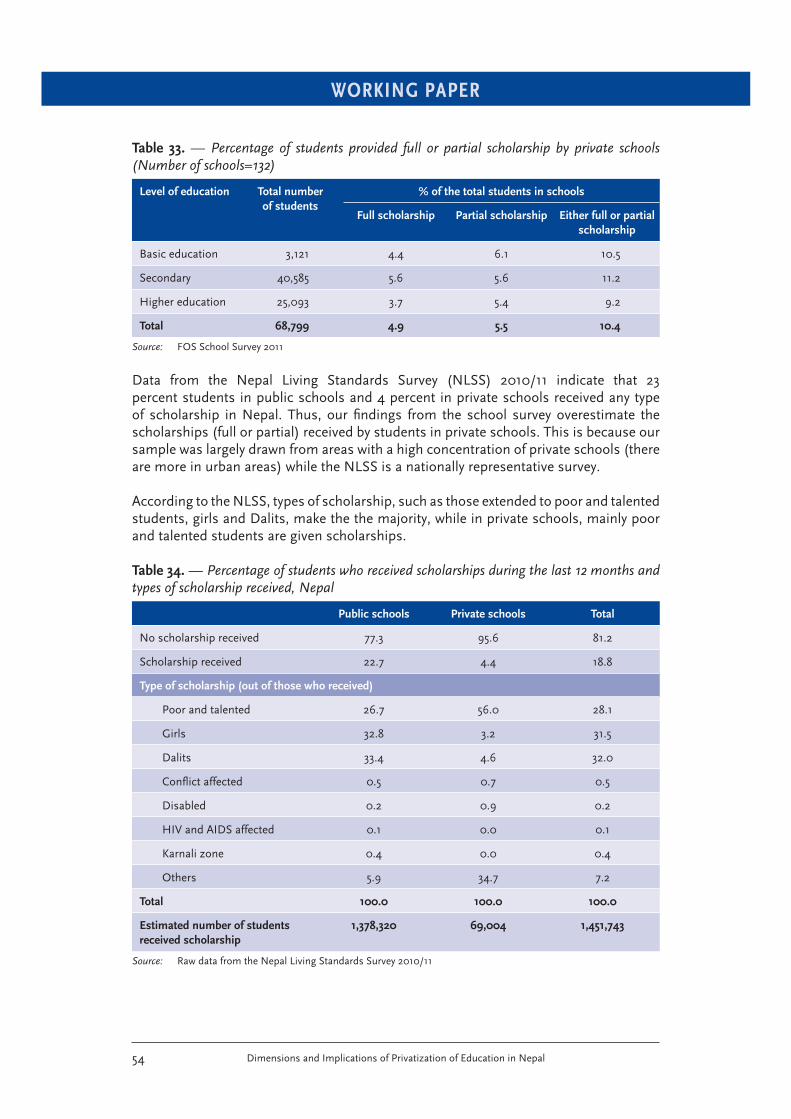
WORKING PAPER
Dimensions and Implications of Privatization of Education in Nepal54
Table 33. — Percentage of students provided full or partial scholarship by private schools (Number of schools=132)
Level of education Total number
of students
% of the total students in schools
Full scholarship Partial scholarship Either full or partial
scholarship
Basic education 3,121 4.4 6.1 10.5
Secondary 40,585 5.6 5.6 11.2
Higher education 25,093 3.7 5.4 9.2
Total 68,799 4.9 5.5 10.4
Source: FOS School Survey 2011
Data from the Nepal Living Standards Survey (NLSS) 2010/11 indicate that 23 percent students in public schools and 4 percent in private schools received any type of scholarship in Nepal. Thus, our fi ndings from the school survey overestimate the scholarships (full or partial) received by students in private schools. This is because our sample was largely drawn from areas with a high concentration of private schools (there are more in urban areas) while the NLSS is a nationally representative survey.
According to the NLSS, types of scholarship, such as those extended to poor and talented students, girls and Dalits, make the the majority, while in private schools, mainly poor and talented students are given scholarships.
Table 34. — Percentage of students who received scholarships during the last 12 months and types of scholarship received, Nepal
Public schools Private schools Total
No scholarship received 77.3 95.6 81.2
Scholarship received 22.7 4.4 18.8
Type of scholarship (out of those who received)
Poor and talented 26.7 56.0 28.1
Girls 32.8 3.2 31.5
Dalits 33.4 4.6 32.0
Confl ict affected 0.5 0.7 0.5
Disabled 0.2 0.9 0.2
HIV and AIDS affected 0.1 0.0 0.1
Karnali zone 0.4 0.0 0.4
Others 5.9 34.7 7.2
Total 100.0 100.0 100.0
Estimated number of students
received scholarship
1,378,320 69,004 1,451,743
Source: Raw data from the Nepal Living Standards Survey 2010/11
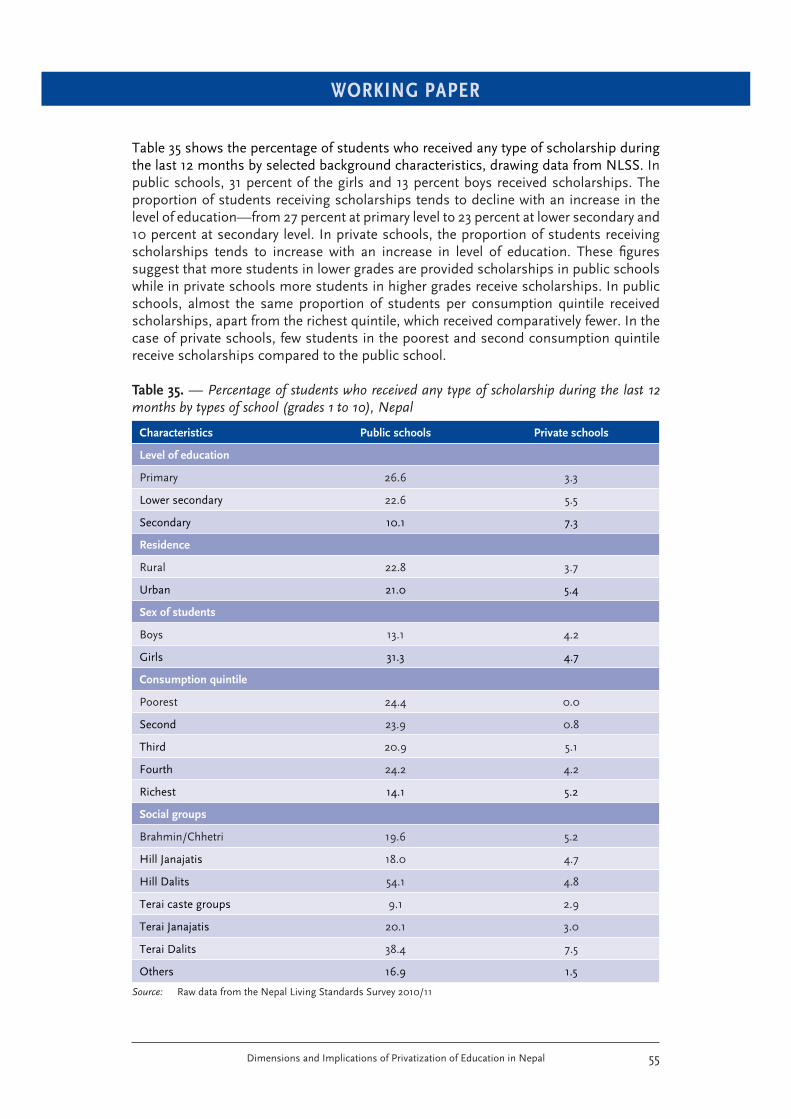
WORKING PAPER
Dimensions and Implications of Privatization of Education in Nepal 55
Table 35 shows the percentage of students who received any type of scholarship during the last 12 months by selected background characteristics, drawing data from NLSS. In public schools, 31 percent of the girls and 13 percent boys received scholarships. The proportion of students receiving scholarships tends to decline with an increase in the level of education—from 27 percent at primary level to 23 percent at lower secondary and 10 percent at secondary level. In private schools, the proportion of students receiving scholarships tends to increase with an increase in level of education. These fi gures suggest that more students in lower grades are provided scholarships in public schools while in private schools more students in higher grades receive scholarships. In public schools, almost the same proportion of students per consumption quintile received scholarships, apart from the richest quintile, which received comparatively fewer. In the case of private schools, few students in the poorest and second consumption quintile receive scholarships compared to the public school.
Table 35. — Percentage of students who received any type of scholarship during the last 12 months by types of school (grades 1 to 10), Nepal
Characteristics Public schools Private schools
Level of education
Primary 26.6 3.3
Lower secondary 22.6 5.5
Secondary 10.1 7.3
Residence
Rural 22.8 3.7
Urban 21.0 5.4
Sex of students
Boys 13.1 4.2
Girls 31.3 4.7
Consumption quintile
Poorest 24.4 0.0
Second 23.9 0.8
Third 20.9 5.1
Fourth 24.2 4.2
Richest 14.1 5.2
Social groups
Brahmin/Chhetri 19.6 5.2
Hill Janajatis 18.0 4.7
Hill Dalits 54.1 4.8
Terai caste groups 9.1 2.9
Terai Janajatis 20.1 3.0
Terai Dalits 38.4 7.5
Others 16.9 1.5
Source: Raw data from the Nepal Living Standards Survey 2010/11
WORKING PAPER
Dimensions and Implications of Privatization of Education in Nepal56
In terms of social groups, 54 percent Hill Dalits and 38 percent Terai Dalits received scholarships from public schools—by the government provision, 100 percent of the students from these groups are entitled to receive scholarships from grades 1 to 10 (Rs.200, US$2 per month per student). This reveals that that even in public schools, a large majority of disadvantaged groups are deprived of scholarship provision. In the case of private schools, the proportion receiving any type of scholarship ranged as low as 3 percent for Terai caste groups and Terai Janajati to about 5 percent for Brahmin/Chhetri, Hill Janajatis and Hill Dalits, and 7.5 percent for Terai Dalits.
According to place of residence, a slightly higher proportion of public school students received scholarships in rural areas compared to urban areas (23 percent vs. 21 percent), while the opposite is true for private schools (5.4 percent in urban areas vs. 3.7 percent in rural areas).
5.4 Good Practices of Private Schools: Can They Be Adopted
by Public Schools?
Drawing on the key informant interviews and workshop fi ndings, it was evident that private schools have adopted some good practices, from which public schools could learn. These include: advertizing the school program, routine monitoring of and feedback to students, and a strong sense of ownership in school management among owners and shareholders.
Many private schools arrange publicity during admission time through local TV, FM radios, posters, pamphlets, banners, and the publication and distribution of brochures and prospectuses. Our schools survey showed that of the 132 schools surveyed, 83 percent had at least one type of advertisement per academic year. This has resulted in increased awareness among parents of the schools and the quality of education provided by the schools. Some A and B grade schools in Kathmandu broadcast advertisements such as “If you get education in our schools, you can dream and access to USA and UK for higher education.” But private schools have also started making rules about advertising to prevent unhealthy competition and unintended messages being relayed, such as in the case of a school in Chitawan district:
Advertisement and publicity are measures to attract the students in private schools. In Chitawan
district, it was reported that PABSON maintained at least minimum discipline for publicity and
advertisement of new admission of students. We have restricted publicity and advertisements through
posters, pamphlets and banners to protect environment. We are encouraging advertisements
through electronic and paper media and we are discouraging the statements like “Day meal free,”
“100% passes” which are produced by some private schools in our district.
Private schools have arrangements where they call the parents time to time to report on the strengths and weaknesses of their children and provide counseling for parents. In every private school we visited, it was reported that they conducted parents’ meeting at least once a year. In some of the high-standard schools in Kathmandu Valley, such as GEMS, DVA, and Little Angels’, they conducted additional meetings among parents of students who were going to take the broad examinations (grades 5, 8 and 10). Some of the A grade schools, such as Rato Bangala, provided education to children through home visits during a long strike in Nepal. Teachers were sent to the students’ homes, provided homework and returned to evaluate the homework.
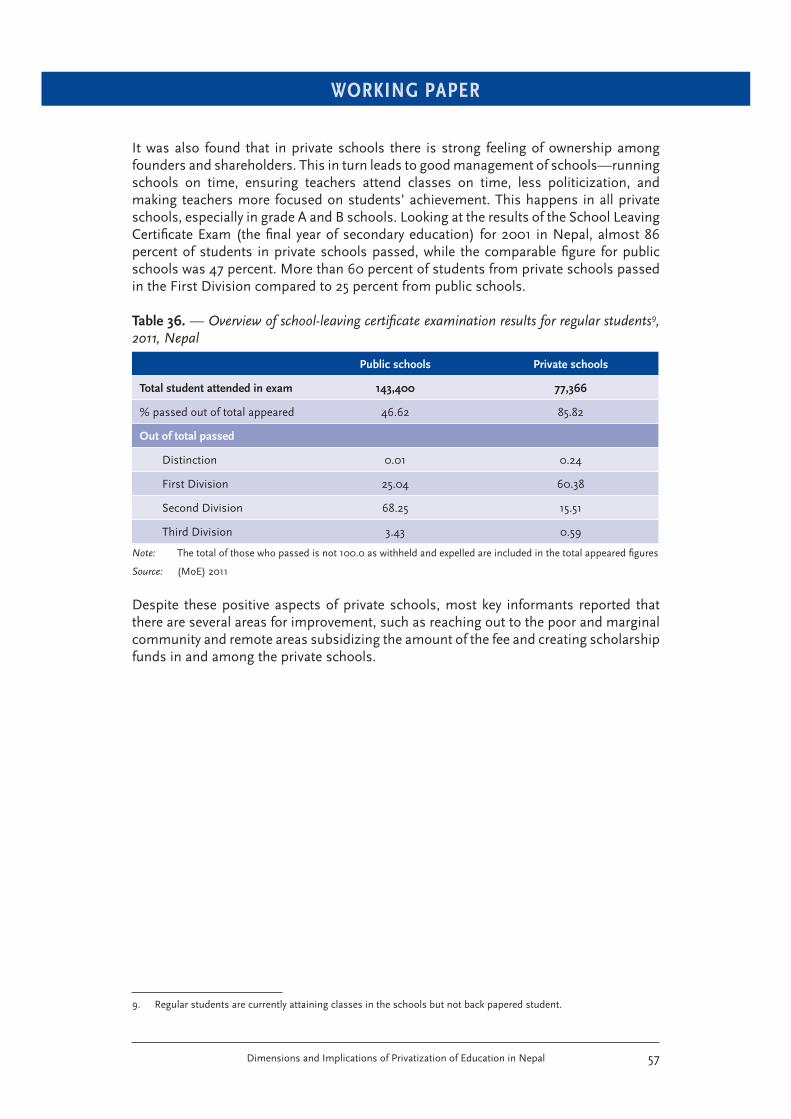
WORKING PAPER
Dimensions and Implications of Privatization of Education in Nepal 57
It was also found that in private schools there is strong feeling of ownership among founders and shareholders. This in turn leads to good management of schools—running schools on time, ensuring teachers attend classes on time, less politicization, and making teachers more focused on students’ achievement. This happens in all private schools, especially in grade A and B schools. Looking at the results of the School Leaving Certifi cate Exam (the fi nal year of secondary education) for 2001 in Nepal, almost 86 percent of students in private schools passed, while the comparable fi gure for public schools was 47 percent. More than 60 percent of students from private schools passed in the First Division compared to 25 percent from public schools.
Table 36. — Overview of school-leaving certifi cate examination results for regular students9, 2011, Nepal
Public schools Private schools
Total student attended in exam 143,400 77,366
% passed out of total appeared 46.62 85.82
Out of total passed
Distinction 0.01 0.24
First Division 25.04 60.38
Second Division 68.25 15.51
Third Division 3.43 0.59
Note: The total of those who passed is not 100.0 as withheld and expelled are included in the total appeared fi gures
Source: (MoE) 2011
Despite these positive aspects of private schools, most key informants reported that there are several areas for improvement, such as reaching out to the poor and marginal community and remote areas subsidizing the amount of the fee and creating scholarship funds in and among the private schools.
9. Regular students are currently attaining classes in the schools but not back papered student.
WORKING PAPER
Dimensions and Implications of Privatization of Education in Nepal58
6. Discussion and Conclusions
This study was carried out during January 2011—December 2011 by Friends of Sankhu with the fi nancial and technical support of PERI. The main aim of the study was to examine the extent of privatization of education in Nepal and the operational modality of private schools, with a special focus on socioeconomic differentials of school attendance between private and public schools and parents’ perception of private schools. The study was based on both secondary and primary information. Secondary data was obtained from government reports and the Nepal Living Standards Survey 2010/11. Primary data was collected though household surveys, school surveys, key informant interviews and a workshop. A total of 1,224 households were surveyed from 12 districts. The districts were selected by considering the highest concentration of private schools and regional representation.10 Interviewees were conducted with key informants, including GOs, offi cials from private school associations, teachers, principals and members of teachers’ unions.
6.1 Summary and Discussion
The key fi ndings of our study are summarized below.
6.1.1 Understanding Private SchoolsThere are similarities and differences between public and private schools. Both types of school are regulated by the Education Act 1971 (Seventh Amendment 2004) and Education Regulation 2003. The key differences are in terms of the grading system, provision of government funds, paying of education tax, and a deposit required for registration.
Private schools have evolved since the late 1980s. The role of private sectors was strongly articulated in the Eighth Five Year Plan (1992–96). The current development plan aims to maintain coordination and build partnership between public and private schools in order to increase the quality of education in the public schools and for each to learn the good practices of the other. In this regard, the government has developed a mechanism to register, supervise and monitor the private schools; however, the mechanism has been reported to be weak. The central Fee Determining and Monitoring Committee (FDMC) is responsible for the overall monitoring of private schools in the country. It is reported that the committee monitors private schools occasionally, not regularly, and implementation of its recommendations is weak.
The GoN has given high priority to education over the last one decade. The budget allocated to the education sector increased from 17.6 percent of the GNP in FY 2001/02 to 21.4 percent in FY 2008/09. The education sector accounts for nearly half of the national budget allocated to the social sectors. However, private schools do not get support from the government.
10. There are fi ve development regions in the country: eastern, central, western, mid-western and far-western. All these regions were covered while selecting the districts.
WORKING PAPER
Dimensions and Implications of Privatization of Education in Nepal 59
Findings indicate that in grade A and B schools, the teachers are generally highly qualifi ed, while in other schools they have low qualifi cations. However, there is a high teacher turnover rate in private school.
It is estimated that 20 percent of private school teachers receive government-determined salaries. A full salary is reported in high-standard schools while in some schools, teachers’ salaries are as low as 50 to 60 percent of the Government-determined. It is estimated that only 5 percent of the total teachers in private schools hold licenses for teaching in accordance with the Education Regulation 2003. Only 5 percent of 132 private schools surveyed have school management committees, as required by the Education Regulation 2003. Many private schools do not comply with government’s determined fee structure—the high standard schools charge much higher monthly fees while many low-standard schools also have a low fee compared to the government-determined monthly fee structure.
Almost all private schools surveyed have introduced additional courses in English, math, moral studies and extra-curricular activities that are not generally found in public schools. This leads to differences in quality of education, especially regarding the learning of English, between graduates of public and private schools.
6.1.2 Extent and Variation in School Attendance at Public and Private SchoolsMore than 20 percent of the students in Nepal are currently attending private schools. Of the total students, 56 percent at pre-primary level, 22 percent at primary, 17 percent at lower secondary and 11 percent at secondary educational level are currently attending private schools.
A wide variation in types of school attendance (private, public and others) by place of residence, gender, economic strata and social groups was evident from the analysis of NLSS data, although all categories of students are found in private schools in Nepal. With regard to rural–urban differences, 78 percent of students in Kathmandu Valley and 46 percent in other urban areas (excluding Kathmandu Valley) are in private schools while compared to merely 14 percent in rural areas.
Our fi ndings suggest that private sector involvement in education has yet to address gender inequality in education. Gender inequality in attendance in private school appears to be high at the primary level and tends to decline with the increase in level of education. For example, there are 68 girls per 100 boys at primary level, 71 girls per 100 boys at lower secondary level and 77 girls per 100 boys at secondary educational level in private schools. This fi nding is supported by earlier studies conducted in South Asia. A study conducted by Save the Children (2002), drawing on cases from Jhapa district, Nepal and Karachi, Pakistan, argued that private sector involvement in education has not redressed gender inequity in Nepal. It is argued that the majority of parents would choose to invest in their sons rather than their daughters when it comes to deciding which children to send to private schools. Parents, especially those in the low-income groups, are in favor of boys attending private schools, as they are regarded as the future breadwinners of a family.
Regarding the economic strata, half of the total students in private schools are from the richest quintile; 26 percent from the fourth; 12 percent from the third; 8 percent from the second; and only 3.5 percent from the bottom consumption quintile. Among
WORKING PAPER
Dimensions and Implications of Privatization of Education in Nepal60
the social groups, 41 percent of the total students in private schools are Brahmin/Chhetri, 28 percent Hill Janajati, 4 percent Hill Dalist, 16 percent Terai, 5 percent Terai Janajatis and 1 percent Terai Dalits. The X2 test shows a signifi cant association between proportion of students attending a type of school (public, private and others) and 1) place of residence (Kathmandu Valley, other urban area and rural areas); 2) gender; 3) consumption quintile; and 4) social groups. However, caste is not the only factor in determining the type of school attendance, as students attending private school come from across the consumption quintile, from relatively advantaged social groups (i.e. Brahmin/Chhetri) to more disadvantaged groups, such as Hill Janajatis.
6.1.3 People’s Perceptions of Private SchoolsOverall, 75 percent of the parents whose children are attending private schools believe that private schools are “good” in terms of providing education to their children, while 40 percent of the parents whose children are attending public schools feel this way. The main reason for preferring private schools is quality education (53 percent) and English medium classes (21.5 percent). The majority of parents whose children are in private schools view their children’s educational achievement as “good” (54 percent) and the physical facilities of their children’s schools as “good” (43 percent). Parents (of both private and public school children fi rmly believe that graduates of private schools are more qualifi ed than graduates of public schools.
The current trends suggest that the majority of parents of the upper and middle classes (relatively privileged social groups, the wealthiest households and those residing in urban areas) prefer to send their children to private schools with the expectation that their children will be competitive in the job market in the country as well as abroad, and capable of self-employment, teaching and learning English. A similar argument was made by Manandar and Shrestha (2003) while analyzing the population census of 2001 and the education status in Nepal, they concluded that the perceived high quality of education in private schools is the main factor for the growth of private sector institutions.
Nepalese households incur eight times higher expenditure in private primary schools compared to public primary schools (the per capita annual expenditure in private primary school is Rs.11, 164 against Rs.1, 332 in public primary schools). Lower secondary education at private schools (Rs. 16,000, US$158) is seven times more costly than that at public schools (Rs. 2,504, US$25) and it is fi ve times more costly at secondary education level (Rs. 25,134, US$248 for private school and Rs.5,387, $53 for public schools).
Findings suggest that the majority of high school graduates of private schools are attracted to higher education in science, engineering, medical science, information technology, computer science and fi nance and banking. Besides, increasing numbers of youth are attracted to foreign employment, especially in West.
6.1.4 Implications of Privatization of School EducationAccording to the Nepal Living Standards Survey 2010/11 data that we analyzed, more than 20 percent of students in Nepal are currently attending private schools (profi t-sharing and trust schools). Thus, private schools have contributed signifi cantly in increasing enrollment rates and thus achieving MDGs of Nepal.
Nevertheless, there is a vast difference in the quality of education. This system tends to increase stratifi cation in the society. Our fi ndings corroborate with the fi ndings of
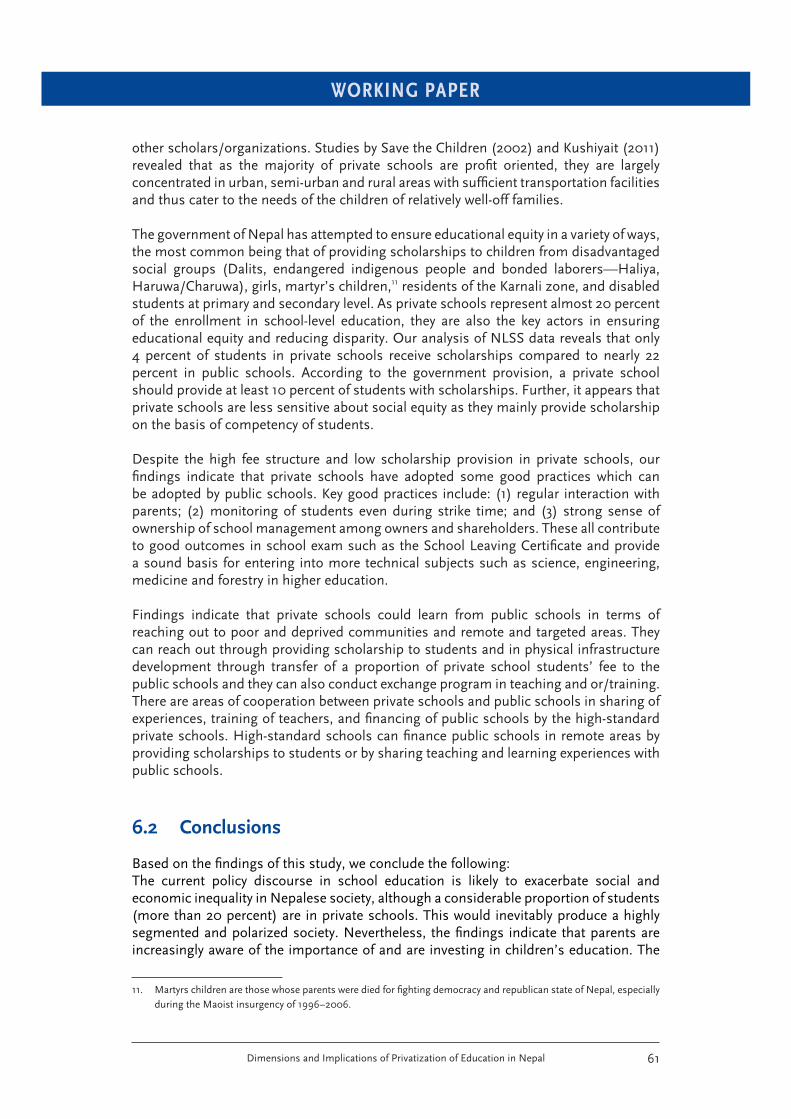
WORKING PAPER
Dimensions and Implications of Privatization of Education in Nepal 61
other scholars/organizations. Studies by Save the Children (2002) and Kushiyait (2011) revealed that as the majority of private schools are profi t oriented, they are largely concentrated in urban, semi-urban and rural areas with suffi cient transportation facilities and thus cater to the needs of the children of relatively well-off families.
The government of Nepal has attempted to ensure educational equity in a variety of ways, the most common being that of providing scholarships to children from disadvantaged social groups (Dalits, endangered indigenous people and bonded laborers—Haliya, Haruwa/Charuwa), girls, martyr’s children,11 residents of the Karnali zone, and disabled students at primary and secondary level. As private schools represent almost 20 percent of the enrollment in school-level education, they are also the key actors in ensuring educational equity and reducing disparity. Our analysis of NLSS data reveals that only 4 percent of students in private schools receive scholarships compared to nearly 22 percent in public schools. According to the government provision, a private school should provide at least 10 percent of students with scholarships. Further, it appears that private schools are less sensitive about social equity as they mainly provide scholarship on the basis of competency of students.
Despite the high fee structure and low scholarship provision in private schools, our fi ndings indicate that private schools have adopted some good practices which can be adopted by public schools. Key good practices include: (1) regular interaction with parents; (2) monitoring of students even during strike time; and (3) strong sense of ownership of school management among owners and shareholders. These all contribute to good outcomes in school exam such as the School Leaving Certifi cate and provide a sound basis for entering into more technical subjects such as science, engineering, medicine and forestry in higher education.
Findings indicate that private schools could learn from public schools in terms of reaching out to poor and deprived communities and remote and targeted areas. They can reach out through providing scholarship to students and in physical infrastructure development through transfer of a proportion of private school students’ fee to the public schools and they can also conduct exchange program in teaching and or/training. There are areas of cooperation between private schools and public schools in sharing of experiences, training of teachers, and fi nancing of public schools by the high-standard private schools. High-standard schools can fi nance public schools in remote areas by providing scholarships to students or by sharing teaching and learning experiences with public schools.
6.2 Conclusions
Based on the fi ndings of this study, we conclude the following:The current policy discourse in school education is likely to exacerbate social and economic inequality in Nepalese society, although a considerable proportion of students (more than 20 percent) are in private schools. This would inevitably produce a highly segmented and polarized society. Nevertheless, the fi ndings indicate that parents are increasingly aware of the importance of and are investing in children’s education. The
11. Martyrs children are those whose parents were died for fi ghting democracy and republican state of Nepal, especially during the Maoist insurgency of 1996–2006.
WORKING PAPER
Dimensions and Implications of Privatization of Education in Nepal62
privatization of education has spread across society—rich, middle and even laborer and peasant classes. The elimination of private schools would not be acceptable for many parents and also would not be possible in the context of increasing globalization. Thus, Nepal has to adopt measures that will follow the good practices of private schools in public schools and thereby reduce inequality in education. In addition, the government of Nepal needs to come up with a clear plan to utilize the 1 percent education tax to the benefi t of the marginalized people. Finally, both the public and private sectors need to build partnerships with the aim of improving the quality of education in public schools. On the basis of our fi ndings, the possible areas for public-private partnership in school education are as follows:
From the government’s side:
1. Formulate separate legislation to regulate private schools.
2. Develop separate institutional mechanisms to provide for the registration and monitoring of private schools.
3. Provide training to private school principals and teachers regularly together with public school teachers.
4. Assist teachers in passing the licencing exam.
From the private schools’ side:
1. Create an exchange program between private and public schools (sharing of administration/management skills, teaching and learning).
2. Increase the allocation of seats for girls, members of marginalized communities and students from remote areas.
3. Initiate selection of best students to enroll in private schools from the countryside from public schools
4. Allocate scholarships to children from public schools in remote and disadvantaged areas.
5. Cover training costs of teachers.
WORKING PAPER
Dimensions and Implications of Privatization of Education in Nepal 63
References
Abraham, F.M. (2006). Contemporary Sociology: An Introduction to Concepts and Theories, Oxford: Oxford University Press.
Caddell, M. (2007). ‘Private Schools and Political Confl ict in Nepal’ in P. Srivastava, and G. Walford (eds.), Private Schooling in Less Economically Developed Countries: Asian and African Perspectives, Didcot, UK: Oxford Studies in Comparative Education, pp. 187—207.
CBS (2011). Nepal Living Standards Survey 2010/11, Kathmandu: Center Bureau of Statistics.
CBS (2011a). Preliminary Findings of Nepal Population Census 2011, Kathmandu: Center Bureau of Statistics.
Kushiyait, Binaya (2011). Social Exclusion in Primary Education in Nepal, Journal of University Campus, Vol. 38, and No. 2 Contributions to Nepalese Studies: July 2011.
Hoare, Q. and G. Nowell Smith (2007, reprint). Selection from the Prison Notebooks of Antonio Gramsci, Chhenai: Orient Longman Private Ltd.
Manandhar and Shrestha (2003). Population Growth and Education in Nepal, Population Monograph of Nepal (Kathmandu: CBS).
Ministry of Finance (2011). Economic Survey, Fiscal Year 2010/11, Kathmandu: Ministry of Finance.
MoE (2008). School Level Educational Statistics of Nepal, Consolidated Report, 2008, Kathmandu: MoE.
MoE (2009). Flash Report 2008/09, Kathmandu: MoE.
MoE (2010). Flash Report 2009/10, Kathmandu: MoE.
MoE (2011). Flash Report 2010/11, Kathmandu: MoE.
Nepal South Asia Center (1999). Nepal Human Development Report 1998, Kathmandu: Nepal South Asia Center and UNDP.
NPC (2010). Three Year Plan Approach Paper (2010/11–2012/13, Kathmandu: National Planning Commission.
Private and Boarding Schools’ Organization (PABSON), 2011.04.12, http://pabson.org.np/.
Save the Children (2002). The Private Sector as Service Provider and its Role in Implementing Child Rights, Save the Children UK, South and Central Asia, available at: http://www.enterprisingschools.com/sites/default/files/library/documents/Private_Sector_Involvement_-_Nepal.pdf. [accessed on 2/08/2012].
Shrestha, S.K. (2010). Public-Private Partnership in Attaining Education and Health Millennium Development Goals in Nepal, available at: http://www.adbi.org/fi les/2010.12.12.cpp.sess5.a1.shrestha.ppp.education.health.mdg.nepal.pdf
UNICEF (2010). Analysis of Basic Social Services in Nepal, Kathmandu: UNICEF.
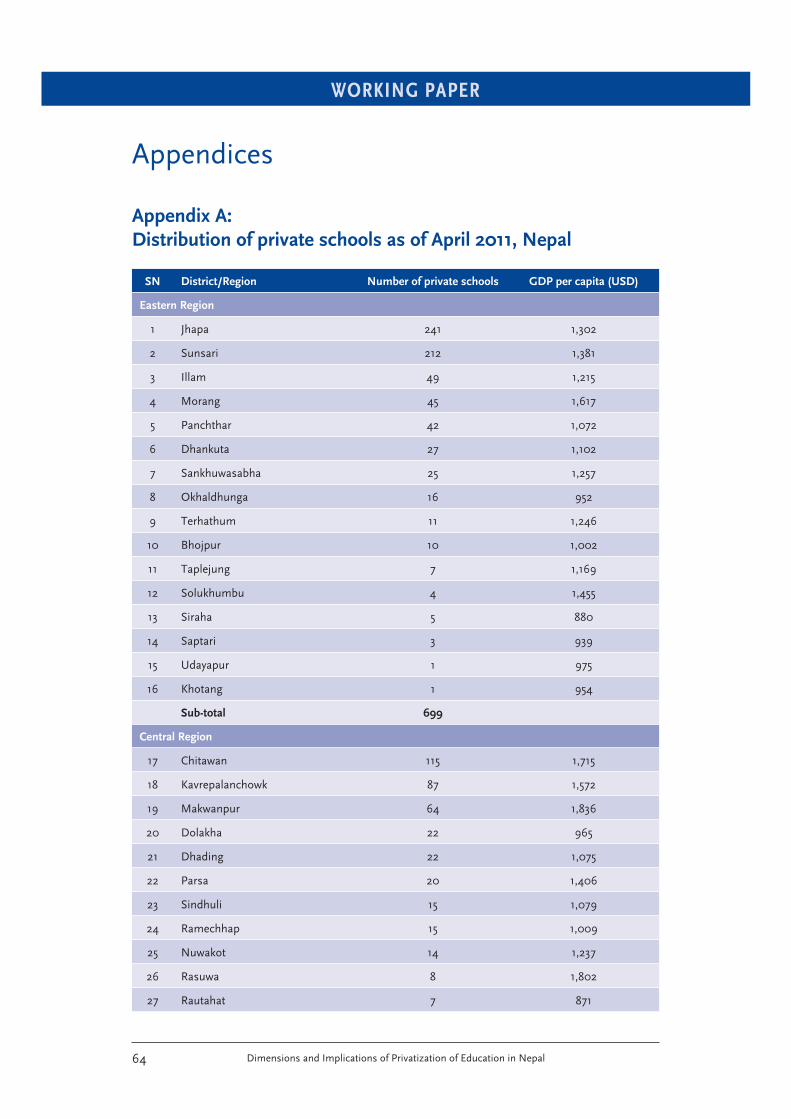
WORKING PAPER
Dimensions and Implications of Privatization of Education in Nepal64
Appendices
Appendix A:
Distribution of private schools as of April 2011, Nepal
SN District/Region Number of private schools GDP per capita (USD)
Eastern Region
1 Jhapa 241 1,302
2 Sunsari 212 1,381
3 Illam 49 1,215
4 Morang 45 1,617
5 Panchthar 42 1,072
6 Dhankuta 27 1,102
7 Sankhuwasabha 25 1,257
8 Okhaldhunga 16 952
9 Terhathum 11 1,246
10 Bhojpur 10 1,002
11 Taplejung 7 1,169
12 Solukhumbu 4 1,455
13 Siraha 5 880
14 Saptari 3 939
15 Udayapur 1 975
16 Khotang 1 954
Sub-total 699
Central Region
17 Chitawan 115 1,715
18 Kavrepalanchowk 87 1,572
19 Makwanpur 64 1,836
20 Dolakha 22 965
21 Dhading 22 1,075
22 Parsa 20 1,406
23 Sindhuli 15 1,079
24 Ramechhap 15 1,009
25 Nuwakot 14 1,237
26 Rasuwa 8 1,802
27 Rautahat 7 871
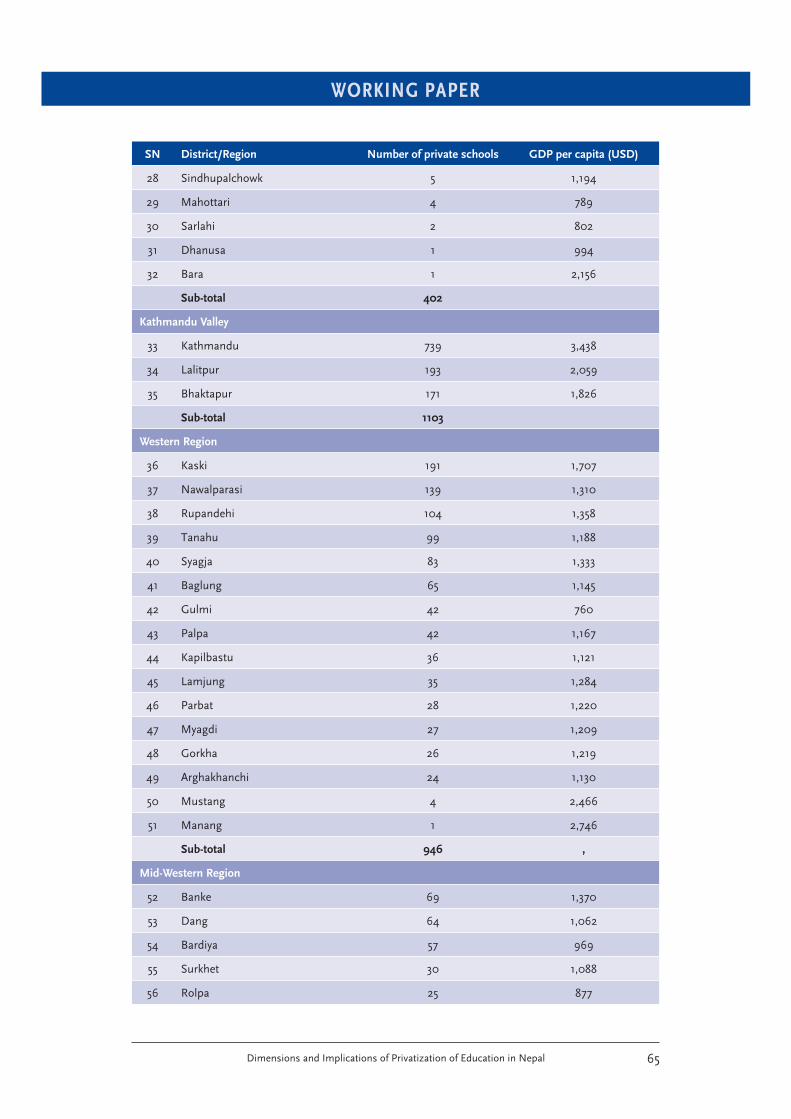
WORKING PAPER
Dimensions and Implications of Privatization of Education in Nepal 65
SN District/Region Number of private schools GDP per capita (USD)
28 Sindhupalchowk 5 1,194
29 Mahottari 4 789
30 Sarlahi 2 802
31 Dhanusa 1 994
32 Bara 1 2,156
Sub-total 402
Kathmandu Valley
33 Kathmandu 739 3,438
34 Lalitpur 193 2,059
35 Bhaktapur 171 1,826
Sub-total 1103
Western Region
36 Kaski 191 1,707
37 Nawalparasi 139 1,310
38 Rupandehi 104 1,358
39 Tanahu 99 1,188
40 Syagja 83 1,333
41 Baglung 65 1,145
42 Gulmi 42 760
43 Palpa 42 1,167
44 Kapilbastu 36 1,121
45 Lamjung 35 1,284
46 Parbat 28 1,220
47 Myagdi 27 1,209
48 Gorkha 26 1,219
49 Arghakhanchi 24 1,130
50 Mustang 4 2,466
51 Manang 1 2,746
Sub-total 946 ,
Mid-Western Region
52 Banke 69 1,370
53 Dang 64 1,062
54 Bardiya 57 969
55 Surkhet 30 1,088
56 Rolpa 25 877
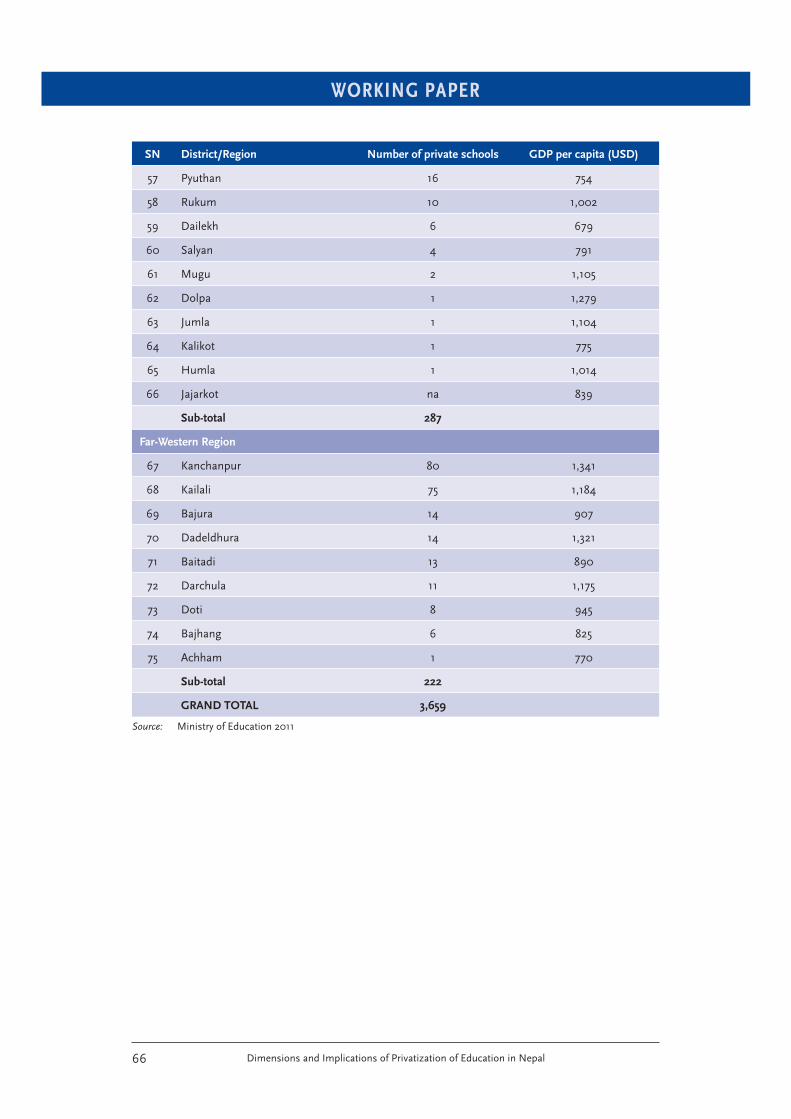
WORKING PAPER
Dimensions and Implications of Privatization of Education in Nepal66
SN District/Region Number of private schools GDP per capita (USD)
57 Pyuthan 16 754
58 Rukum 10 1,002
59 Dailekh 6 679
60 Salyan 4 791
61 Mugu 2 1,105
62 Dolpa 1 1,279
63 Jumla 1 1,104
64 Kalikot 1 775
65 Humla 1 1,014
66 Jajarkot na 839
Sub-total 287
Far-Western Region
67 Kanchanpur 80 1,341
68 Kailali 75 1,184
69 Bajura 14 907
70 Dadeldhura 14 1,321
71 Baitadi 13 890
72 Darchula 11 1,175
73 Doti 8 945
74 Bajhang 6 825
75 Achham 1 770
Sub-total 222
GRAND TOTAL 3,659
Source: Ministry of Education 2011
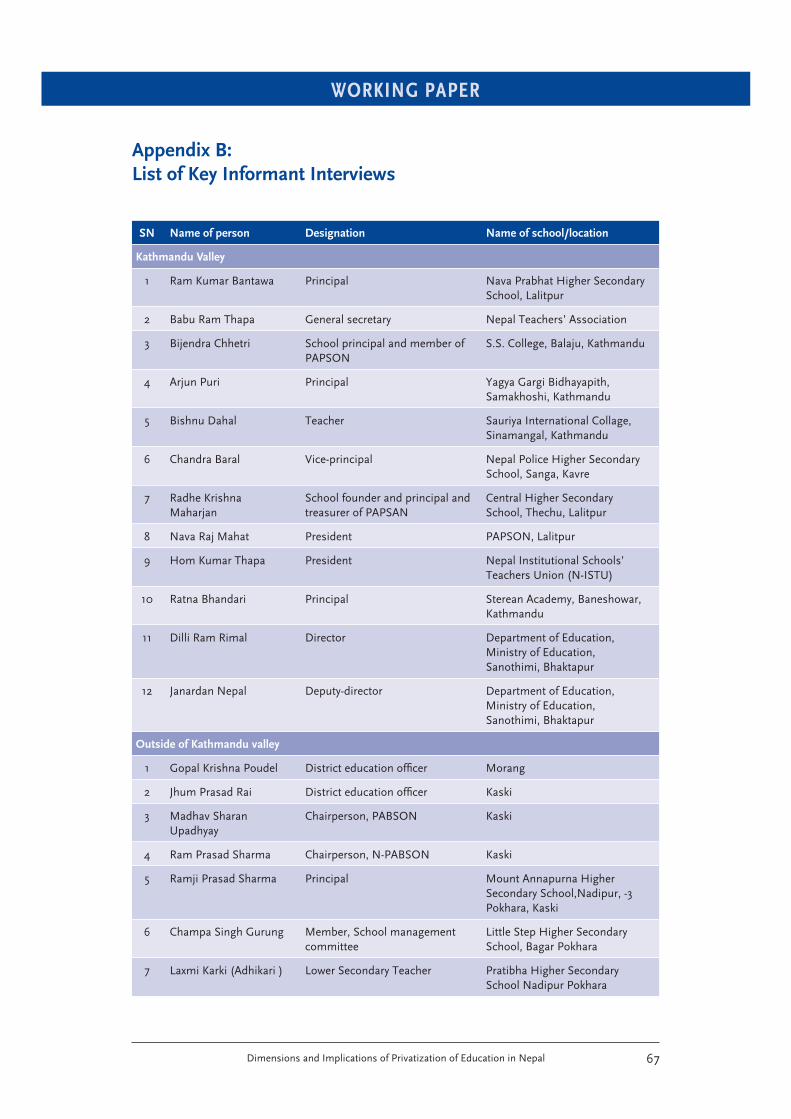
WORKING PAPER
Dimensions and Implications of Privatization of Education in Nepal 67
Appendix B:
List of Key Informant Interviews
SN Name of person Designation Name of school/location
Kathmandu Valley
1 Ram Kumar Bantawa Principal Nava Prabhat Higher Secondary School, Lalitpur
2 Babu Ram Thapa General secretary Nepal Teachers’ Association
3 Bijendra Chhetri School principal and member of PAPSON
S.S. College, Balaju, Kathmandu
4 Arjun Puri Principal Yagya Gargi Bidhayapith, Samakhoshi, Kathmandu
5 Bishnu Dahal Teacher Sauriya International Collage, Sinamangal, Kathmandu
6 Chandra Baral Vice-principal Nepal Police Higher Secondary School, Sanga, Kavre
7 Radhe Krishna Maharjan
School founder and principal and treasurer of PAPSAN
Central Higher Secondary School, Thechu, Lalitpur
8 Nava Raj Mahat President PAPSON, Lalitpur
9 Hom Kumar Thapa President Nepal Institutional Schools’ Teachers Union (N-ISTU)
10 Ratna Bhandari Principal Sterean Academy, Baneshowar, Kathmandu
11 Dilli Ram Rimal Director Department of Education, Ministry of Education, Sanothimi, Bhaktapur
12 Janardan Nepal Deputy-director Department of Education, Ministry of Education, Sanothimi, Bhaktapur
Outside of Kathmandu valley
1 Gopal Krishna Poudel District education offi cer Morang
2 Jhum Prasad Rai District education offi cer Kaski
3 Madhav Sharan Upadhyay
Chairperson, PABSON Kaski
4 Ram Prasad Sharma Chairperson, N-PABSON Kaski
5 Ramji Prasad Sharma Principal Mount Annapurna Higher Secondary School,Nadipur, -3 Pokhara, Kaski
6 Champa Singh Gurung Member, School management committee
Little Step Higher Secondary School, Bagar Pokhara
7 Laxmi Karki (Adhikari ) Lower Secondary Teacher Pratibha Higher Secondary School Nadipur Pokhara
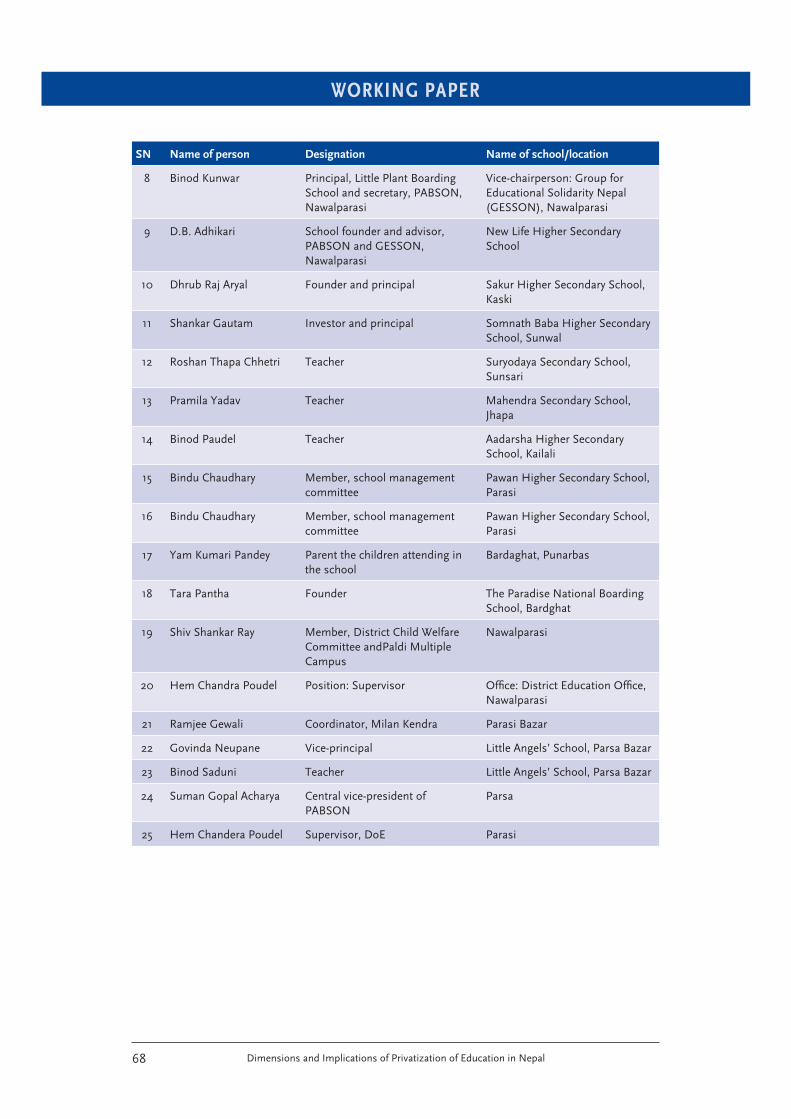
WORKING PAPER
Dimensions and Implications of Privatization of Education in Nepal68
SN Name of person Designation Name of school/location
8 Binod Kunwar Principal, Little Plant Boarding School and secretary, PABSON, Nawalparasi
Vice-chairperson: Group for Educational Solidarity Nepal (GESSON), Nawalparasi
9 D.B. Adhikari School founder and advisor, PABSON and GESSON, Nawalparasi
New Life Higher Secondary School
10 Dhrub Raj Aryal Founder and principal Sakur Higher Secondary School, Kaski
11 Shankar Gautam Investor and principal Somnath Baba Higher Secondary School, Sunwal
12 Roshan Thapa Chhetri Teacher Suryodaya Secondary School, Sunsari
13 Pramila Yadav Teacher Mahendra Secondary School, Jhapa
14 Binod Paudel Teacher Aadarsha Higher Secondary School, Kailali
15 Bindu Chaudhary Member, school management committee
Pawan Higher Secondary School, Parasi
16 Bindu Chaudhary Member, school management committee
Pawan Higher Secondary School, Parasi
17 Yam Kumari Pandey Parent the children attending in the school
Bardaghat, Punarbas
18 Tara Pantha Founder The Paradise National Boarding School, Bardghat
19 Shiv Shankar Ray Member, District Child Welfare Committee andPaldi Multiple Campus
Nawalparasi
20 Hem Chandra Poudel Position: Supervisor Offi ce: District Education Offi ce, Nawalparasi
21 Ramjee Gewali Coordinator, Milan Kendra Parasi Bazar
22 Govinda Neupane Vice-principal Little Angels’ School, Parsa Bazar
23 Binod Saduni Teacher Little Angels’ School, Parsa Bazar
24 Suman Gopal Acharya Central vice-president of PABSON
Parsa
25 Hem Chandera Poudel Supervisor, DoE Parasi
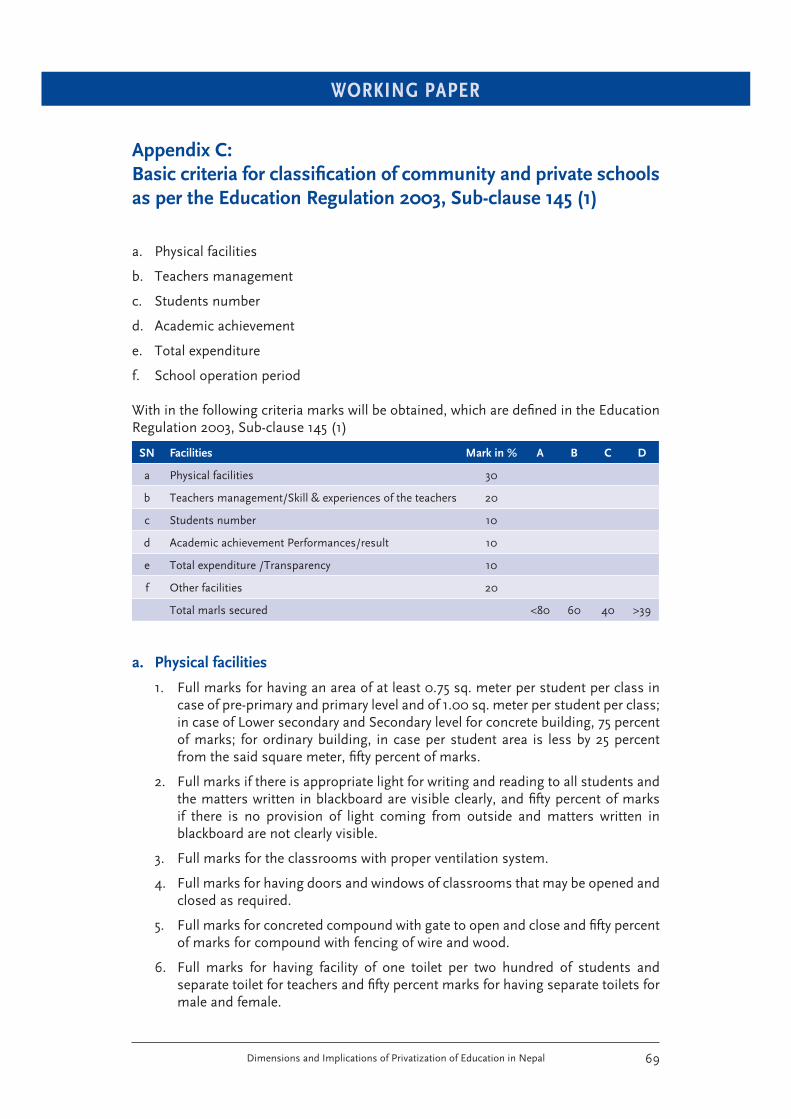
WORKING PAPER
Dimensions and Implications of Privatization of Education in Nepal 69
Appendix C:
Basic criteria for classifi cation of community and private schools
as per the Education Regulation 2003, Sub-clause 145 (1)
a. Physical facilities
b. Teachers management
c. Students number
d. Academic achievement
e. Total expenditure
f. School operation period
With in the following criteria marks will be obtained, which are defi ned in the Education Regulation 2003, Sub-clause 145 (1)
SN Facilities Mark in % A B C D
a Physical facilities 30
b Teachers management/Skill & experiences of the teachers 20
c Students number 10
d Academic achievement Performances/result 10
e Total expenditure /Transparency 10
f Other facilities 20
Total marls secured <80 60 40 >39
a. Physical facilities
1. Full marks for having an area of at least 0.75 sq. meter per student per class in case of pre-primary and primary level and of 1.00 sq. meter per student per class; in case of Lower secondary and Secondary level for concrete building, 75 percent of marks; for ordinary building, in case per student area is less by 25 percent from the said square meter, fi fty percent of marks.
2. Full marks if there is appropriate light for writing and reading to all students and the matters written in blackboard are visible clearly, and fi fty percent of marks if there is no provision of light coming from outside and matters written in blackboard are not clearly visible.
3. Full marks for the classrooms with proper ventilation system.
4. Full marks for having doors and windows of classrooms that may be opened and closed as required.
5. Full marks for concreted compound with gate to open and close and fi fty percent of marks for compound with fencing of wire and wood.
6. Full marks for having facility of one toilet per two hundred of students and separate toilet for teachers and fi fty percent marks for having separate toilets for male and female.
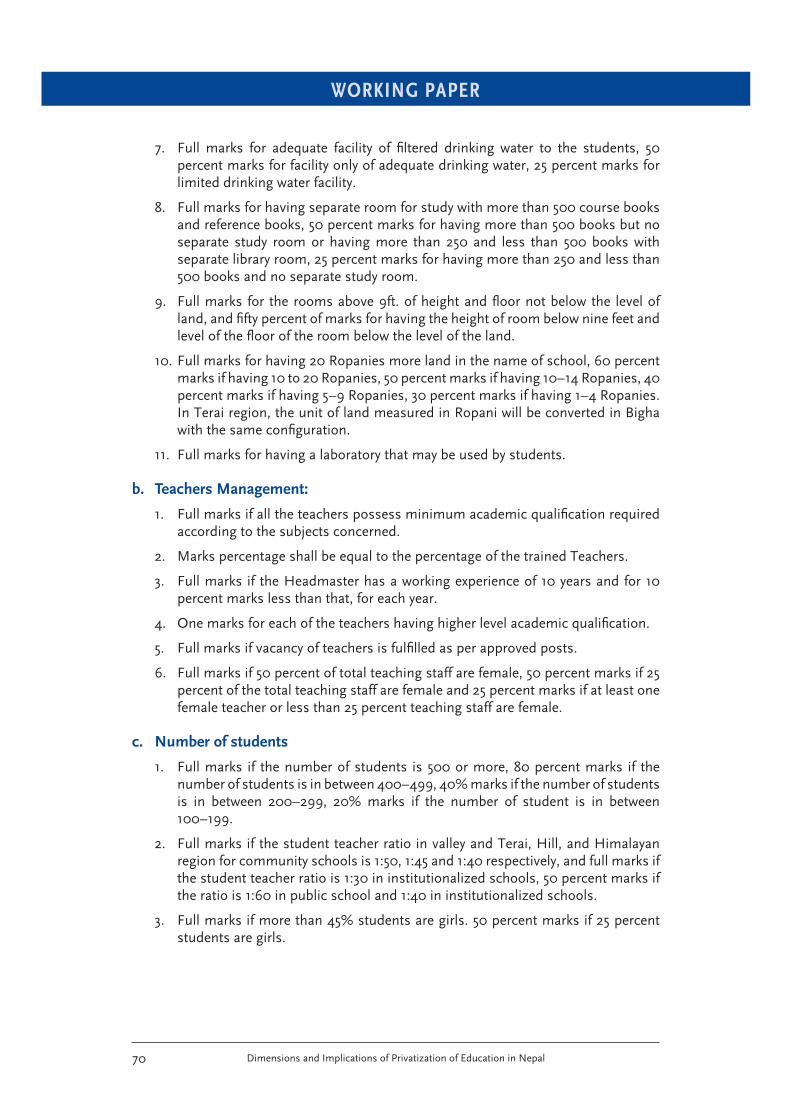
WORKING PAPER
Dimensions and Implications of Privatization of Education in Nepal70
7. Full marks for adequate facility of fi ltered drinking water to the students, 50 percent marks for facility only of adequate drinking water, 25 percent marks for limited drinking water facility.
8. Full marks for having separate room for study with more than 500 course books and reference books, 50 percent marks for having more than 500 books but no separate study room or having more than 250 and less than 500 books with separate library room, 25 percent marks for having more than 250 and less than 500 books and no separate study room.
9. Full marks for the rooms above 9ft. of height and fl oor not below the level of land, and fi fty percent of marks for having the height of room below nine feet and level of the fl oor of the room below the level of the land.
10. Full marks for having 20 Ropanies more land in the name of school, 60 percent marks if having 10 to 20 Ropanies, 50 percent marks if having 10–14 Ropanies, 40 percent marks if having 5–9 Ropanies, 30 percent marks if having 1–4 Ropanies. In Terai region, the unit of land measured in Ropani will be converted in Bigha with the same confi guration.
11. Full marks for having a laboratory that may be used by students.
b. Teachers Management:
1. Full marks if all the teachers possess minimum academic qualifi cation required according to the subjects concerned.
2. Marks percentage shall be equal to the percentage of the trained Teachers.
3. Full marks if the Headmaster has a working experience of 10 years and for 10 percent marks less than that, for each year.
4. One marks for each of the teachers having higher level academic qualifi cation.
5. Full marks if vacancy of teachers is fulfi lled as per approved posts.
6. Full marks if 50 percent of total teaching staff are female, 50 percent marks if 25 percent of the total teaching staff are female and 25 percent marks if at least one female teacher or less than 25 percent teaching staff are female.
c. Number of students
1. Full marks if the number of students is 500 or more, 80 percent marks if the number of students is in between 400–499, 40% marks if the number of students is in between 200–299, 20% marks if the number of student is in between 100–199.
2. Full marks if the student teacher ratio in valley and Terai, Hill, and Himalayan region for community schools is 1:50, 1:45 and 1:40 respectively, and full marks if the student teacher ratio is 1:30 in institutionalized schools, 50 percent marks if the ratio is 1:60 in public school and 1:40 in institutionalized schools.
3. Full marks if more than 45% students are girls. 50 percent marks if 25 percent students are girls.
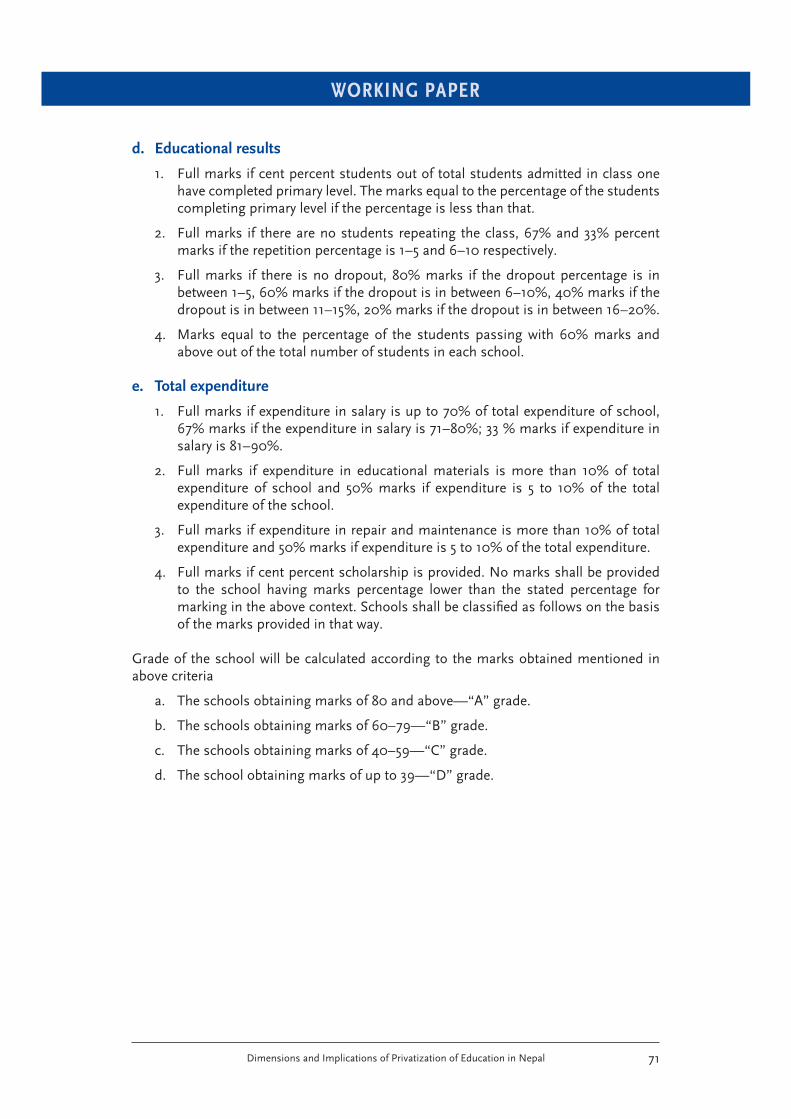
WORKING PAPER
Dimensions and Implications of Privatization of Education in Nepal 71
d. Educational results
1. Full marks if cent percent students out of total students admitted in class one have completed primary level. The marks equal to the percentage of the students completing primary level if the percentage is less than that.
2. Full marks if there are no students repeating the class, 67% and 33% percent marks if the repetition percentage is 1–5 and 6–10 respectively.
3. Full marks if there is no dropout, 80% marks if the dropout percentage is in between 1–5, 60% marks if the dropout is in between 6–10%, 40% marks if the dropout is in between 11–15%, 20% marks if the dropout is in between 16–20%.
4. Marks equal to the percentage of the students passing with 60% marks and above out of the total number of students in each school.
e. Total expenditure
1. Full marks if expenditure in salary is up to 70% of total expenditure of school, 67% marks if the expenditure in salary is 71–80%; 33 % marks if expenditure in salary is 81–90%.
2. Full marks if expenditure in educational materials is more than 10% of total expenditure of school and 50% marks if expenditure is 5 to 10% of the total expenditure of the school.
3. Full marks if expenditure in repair and maintenance is more than 10% of total expenditure and 50% marks if expenditure is 5 to 10% of the total expenditure.
4. Full marks if cent percent scholarship is provided. No marks shall be provided to the school having marks percentage lower than the stated percentage for marking in the above context. Schools shall be classifi ed as follows on the basis of the marks provided in that way.
Grade of the school will be calculated according to the marks obtained mentioned in above criteria
a. The schools obtaining marks of 80 and above—“A” grade.
b. The schools obtaining marks of 60–79—“B” grade.
c. The schools obtaining marks of 40–59—“C” grade.
d. The school obtaining marks of up to 39—“D” grade.
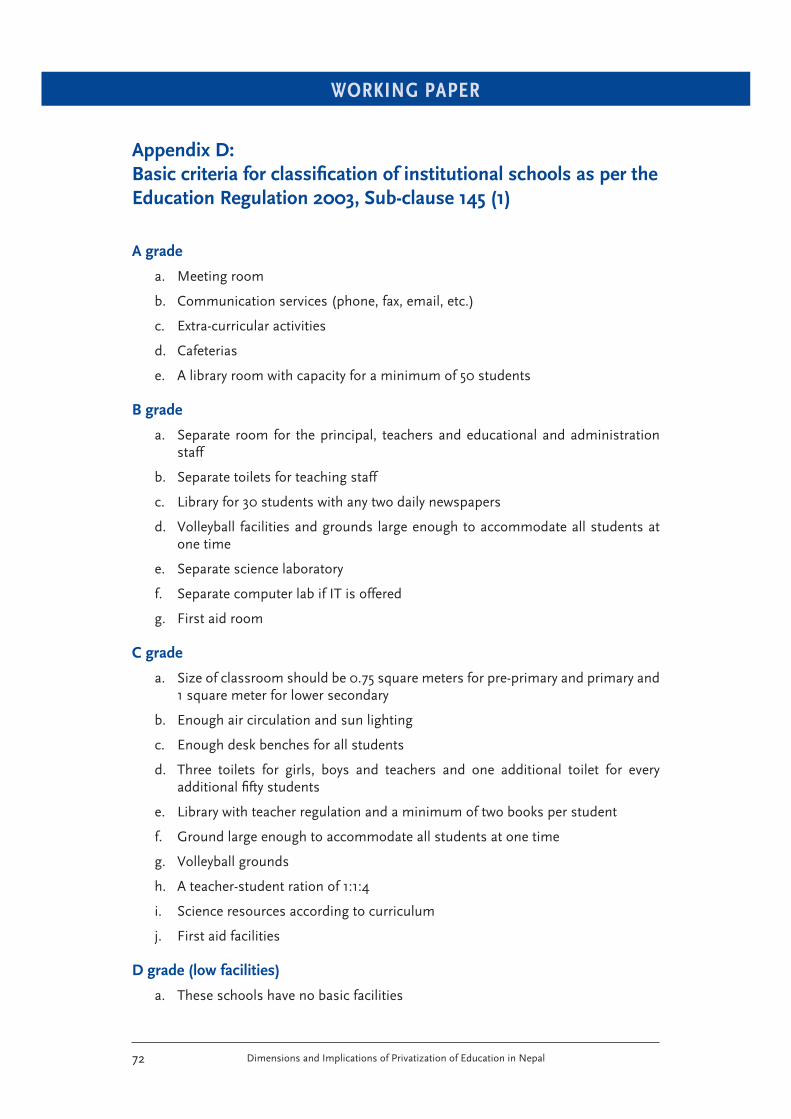
WORKING PAPER
Dimensions and Implications of Privatization of Education in Nepal72
Appendix D:
Basic criteria for classifi cation of institutional schools as per the
Education Regulation 2003, Sub-clause 145 (1)
A grade
a. Meeting room
b. Communication services (phone, fax, email, etc.)
c. Extra-curricular activities
d. Cafeterias
e. A library room with capacity for a minimum of 50 students
B grade
a. Separate room for the principal, teachers and educational and administration staff
b. Separate toilets for teaching staff
c. Library for 30 students with any two daily newspapers
d. Volleyball facilities and grounds large enough to accommodate all students at one time
e. Separate science laboratory
f. Separate computer lab if IT is offered
g. First aid room
C grade
a. Size of classroom should be 0.75 square meters for pre-primary and primary and 1 square meter for lower secondary
b. Enough air circulation and sun lighting
c. Enough desk benches for all students
d. Three toilets for girls, boys and teachers and one additional toilet for every additional fi fty students
e. Library with teacher regulation and a minimum of two books per student
f. Ground large enough to accommodate all students at one time
g. Volleyball grounds
h. A teacher-student ration of 1:1:4
i. Science resources according to curriculum
j. First aid facilities
D grade (low facilities)
a. These schools have no basic facilities
WORKING PAPER
Dimensions and Implications of Privatization of Education in Nepal 73
WORKING PAPER
Dimensions and Implications of Privatization of Education in Nepal74

EDUCATION SUPPORT PROGRAM
Budapest Office
Október 6. u. 12H–1051 Budapest, Hungary
Tel: +36 1 882 3100
London Office
7th Floor Millbank Tower, 21–24 MillbankLondon SW1P 4QP, United Kingdom
Tel: +44(0)20 7031 0200
New York Office
224 West 57th StreetNew York, New York 10019 USA
Tel: +1 212 548 0600
Related Documents