Physics and Chemistry of Glasses: European Journal of Glass Science and Technology Part B Volume 48 Number 4 August 2007 201 1 Corresponding author. Email [email protected] & [email protected] Proceedings of the Eighth International Oo Scho Colloquium, held in Jena, Germany on 23–27 July 2006. 1. Introduction Crystal growth kinetics in glass forming liquids have been extensively studied. (1–11) In stoichiometric systems which undergo glass to crystal transforma- tion without compositional changes, crystal growth should be controlled by reactions at the crystal/melt interface and is normally described by one of three classical phenomenological models: normal (or continuous) growth, screw dislocation growth, and 2D surface nucleated growth. However, for only a few stoichiometric glass forming oxide systems crystal growth rates have been measured in wide temperature ranges, from approximately T g to T m (e.g. SiO 2 , GeO 2 , Na 2 O.2SiO 2 , Li 2 O.2SiO 2 , K 2 O.4B 2 O 3 , diopside, cordierite and perhaps a few others). These few glasses have been the subject of numer- ous investigations. Nevertheless, the crystal growth mechanism is thought to be known for only a few: e.g. GeO 2 , SiO 2 – normal growth; (6,12) Na 2 O⋅2SiO 2 and diopside – screw dislocation; (7,11) and K 2 O.4B 2 O 3 – 2D nucleated growth. (8) In addition, diffusion data for the slowest moving species in such glasses – Si, B, Ge, and O – are scarce and thus the precise mechanism of diffusive transport controlling crystal growth in such glasses and in most of the non-stoichiometric systems remains unknown. Silica (SiO 2 ) is an important mineral from a geological standpoint and is also the most important glass former. In addition, high silica glasses having >99·9% SiO 2 , best known as quartz glass, fused quartz or vitreous silica, have a plethora of important com- mercial applications, such as laboratory glassware, telescopic mirrors, optical filters and fibres. In the existing literature one can find kinetic data: e.g. crystal growth rates, (12–33) viscosities (34–77) and self diffusion coefficients for several silica glass types having distinct impurity levels, as described below. However, most of these previous studies do not cover wide temperature ranges, and comparisons between different silica glass types can be rather difficult and confusing. But we will show below that such difficulties can be overcome. Furthermore, as thermodynamic and kinetic data, such as melting enthalpy and viscosity are available for silica, quan- titative comparisons between crystal growth models and experiments are facilitated. Silica glass manufacturers generally divide the whole spectrum of commercial transparent silica glasses into several types, depending on the starting materials, production method, content and type of impurities, such as alkali and metal ions, OH − and chlorine: (78) Type I – glasses obtained by melting natural or synthetic quartz in electrical furnaces. Such glasses contain about 30 ppm alkali and metal impurities such as Li, Na, K, Al, Fe, Ti, Ca, etc., inherited from the initial raw material, but less than 30 ppm ‘water’. Examples of commercial products are: Infrasil, GE 124, 125, 201 and 204a, KI, KS4V, Puropsil A and B, Pursil, Rotosil, T-2030 and IR Vitreosil. Diffusion processes in vitreous silica revisited Marcio Luis Ferreira Nascimento & Edgar Dutra Zanoo Vitreous Materials Laboratory, Department of Materials Engineering, Federal University of São Carlos 13595-905, São Carlos-SP, Brazil We analysed literature data on crystal growth rate, u, viscosity, η, and diffusivities of silicon and oxygen, between the glass transition, T g , and the melting point, T m , for four types of commercial silica glasses and thin films. The self-diffu- sion coefficients and the viscosity in this network glass are extremely dependent on the impurity level, much more than in multi-component, depolymerised, silicate glasses. Despite this drawback, we have combined such kinetics data in a systematic way and confirmed that normal growth is the operative mechanism of crystal growth. The effective diffusivity for viscous flow, D η , and the controlling activation energy were compared with the activation energies and diffusivities calculated from crystal growth rates, D u , and with those for silicon and oxygen diffusion rates (D Si and D O , respectively). In the whole temperature range D u ≈D η ≈D Si , but oxygen diffusivities are much higher than D u ≈D η ≈D Si . We speculate that this fact can be explained because non-bridging oxygens diffuse much faster than bridging oxygens (more easily measured experimentally); or perhaps Si and bridging oxygen do not diffuse together. There is no sign of decoupling between silicon diffusivity and viscous flow from the melting point down to T g . We thus conclude that silicon controls the transport mechanism involved in crystal growth and viscous flow in this glass. Phys. Chem. Glasses: Eur. J. Glass Sci. Technol. B, August 2007, 48 (4), 201–217

Welcome message from author
This document is posted to help you gain knowledge. Please leave a comment to let me know what you think about it! Share it to your friends and learn new things together.
Transcript
Physics and Chemistry of Glasses European Journal of Glass Science and Technology Part B Volume 48 Number 4 August 2007 201
1 Corresponding author Email pmlfnirisufscarbr amp dedzpowerufscarbr Proceedings of the Eighth International Otto Schott Colloquium held in Jena Germany on 23ndash27 July 2006
1 IntroductionCrystal growth kinetics in glass forming liquids have been extensively studied(1ndash11) In stoichiometric systems which undergo glass to crystal transforma-tion without compositional changes crystal growth should be controlled by reactions at the crystalmelt interface and is normally described by one of three classical phenomenological models normal (or continuous) growth screw dislocation growth and 2D surface nucleated growth However for only a few stoichiometric glass forming oxide systems crystal growth rates have been measured in wide temperature ranges from approximately Tg to Tm (eg SiO2 GeO2 Na2O2SiO2 Li2O2SiO2 K2O4B2O3 diopside cordierite and perhaps a few others) These few glasses have been the subject of numer-ous investigations Nevertheless the crystal growth mechanism is thought to be known for only a few eg GeO2 SiO2 ndash normal growth(612) Na2Osdot2SiO2 and diopside ndash screw dislocation(711) and K2O4B2O3 ndash 2D nucleated growth(8) In addition diffusion data for the slowest moving species in such glasses ndash Si B Ge and O ndash are scarce and thus the precise mechanism of diffusive transport controlling crystal growth in such glasses and in most of the non-stoichiometric systems remains unknown
Silica (SiO2) is an important mineral from a geological standpoint and is also the most important glass former In addition high silica glasses having
gt99middot9 SiO2 best known as quartz glass fused quartz or vitreous silica have a plethora of important com-mercial applications such as laboratory glassware telescopic mirrors optical filters and fibres
In the existing literature one can find kinetic data eg crystal growth rates(12ndash33) viscosities(34ndash77) and self diffusion coefficients for several silica glass types having distinct impurity levels as described below However most of these previous studies do not cover wide temperature ranges and comparisons between different silica glass types can be rather difficult and confusing But we will show below that such difficulties can be overcome Furthermore as thermodynamic and kinetic data such as melting enthalpy and viscosity are available for silica quan-titative comparisons between crystal growth models and experiments are facilitated
Silica glass manufacturers generally divide the whole spectrum of commercial transparent silica glasses into several types depending on the starting materials production method content and type of impurities such as alkali and metal ions OHminus and chlorine(78)
Type I ndash glasses obtained by melting natural or synthetic quartz in electrical furnaces Such glasses contain about 30 ppm alkali and metal impurities such as Li Na K Al Fe Ti Ca etc inherited from the initial raw material but less than 30 ppm lsquowaterrsquo Examples of commercial products are Infrasil GE 124 125 201 and 204a KI KS4V Puropsil A and B Pursil Rotosil T-2030 and IR Vitreosil
Diffusion processes in vitreous silica revisitedMarcio Luis Ferreira Nascimento amp Edgar Dutra ZanottoVitreous Materials Laboratory Department of Materials Engineering Federal University of Satildeo Carlos 13595-905 Satildeo Carlos-SP Brazil
We analysed literature data on crystal growth rate u viscosity η and diffusivities of silicon and oxygen between the glass transition Tg and the melting point Tm for four types of commercial silica glasses and thin films The self-diffu-sion coefficients and the viscosity in this network glass are extremely dependent on the impurity level much more than in multi-component depolymerised silicate glasses Despite this drawback we have combined such kinetics data in a systematic way and confirmed that normal growth is the operative mechanism of crystal growth The effective diffusivity for viscous flow Dη and the controlling activation energy were compared with the activation energies and diffusivities calculated from crystal growth rates Du and with those for silicon and oxygen diffusion rates (DSi and DO respectively) In the whole temperature range DuasympDηasympDSi but oxygen diffusivities are much higher than DuasympDηasympDSi We speculate that this fact can be explained because non-bridging oxygens diffuse much faster than bridging oxygens (more easily measured experimentally) or perhaps Si and bridging oxygen do not diffuse together There is no sign of decoupling between silicon diffusivity and viscous flow from the melting point down to Tg We thus conclude that silicon controls the transport mechanism involved in crystal growth and viscous flow in this glass
Phys Chem Glasses Eur J Glass Sci Technol B August 2007 48 (4) 201ndash217
Zanottoindd 201 10082007 151859
202 Physics and Chemistry of Glasses European Journal of Glass Science and Technology Part B Volume 48 Number 4 August 2007
Type II ndash glasses obtained by melting natural or synthetic quartz in hydrogenndashoxygen or natural gas flames Glasses of this type contain about 30 ppm impurities inherited from the starting quartz grains and several hundred ppm of structural water Exam-ples of commercial products are Ilmasil Armesil T-08 Heralux Herasil Herasil I Homosil KU-2 KV OG Vitreosil Optosil I II and III Ovisil 451 T-1030 T-08 and Ultrasil
Type III ndash glasses obtained by high temperature hy-drolysis of volatile compounds of silicon Such glasses are characterised by very low content of metal impurities (lt1 ppm) but contain a considerable concentration of structural water (1000 ppm) and ~100 ppm chlorine Examples of commercial products are Corning 7940 Dynasil 4000 KU-1 GE151 Spectrosil H and V Suprasil I and II Synsil and T-4040
Type IV ndash glasses obtained by high temperature oxi-dation of SiCl4 Glasses of this type contain very small amount of metal impurities (less than 0middot1 ppm) and only 1 ppm struc-tural water However they contain several hundred ppm of chlorine Examples of commercial products are Corning 7943 KUVI Spectrosil WF Suprasil W W1 and W2
Also a new synthetic silica glass was produced by sintering a sol-gel derived powder into a glass Con-tamination levels of about 0middot1 ppm OHminus and 400 ppm Clminus are typical for this type of silica Unfortunately the nature of the sintering process makes it inappropri-ate for optical uses and especially for large samples production This silica variety and others will not be considered in this work due to scarcity of available data To the best of our knowledge thin film silica glasses have not yet been clearly categorised Table 1 shows some examples of the typical impurity con-tents in the first four types of silica glasses
Several studies have been carried out about the crystallisation kinetics of different types of silica glasses However crystallisation and melting
of cristobalite in a wide range of undercoolings which included the region of maximum growth rate were performed long ago by Wagstaff(12ndash13) As far as we know there is no new crystal growth data for any silica type in such wide range of temperatures We will thus extensively use Wagstaffrsquos data in this article
2 Objectives
Despite the difficulties with its extreme sensitivity to impurities silica glass is in principle a good model system for the type of study proposed here for a number of reasons it undergoes polymorphic crystal-lisation there is plenty of viscosity and crystal growth rate data available as well as thermodynamic proper-ties minus such as melting point and Gibbs free energy of crystallisation (∆G) minus which substantially helps the analysis An important additional motivating factor is that (hard to measure) self diffusion coefficients of oxygen (DO) and particularly of silicon (DSi) the slowest diffusing species in silicate glasses are also available for some silica types
In the present work we collected and combine crystal growth rates viscosity and diffusion data for each distinct silica glass type over a broad tempera-ture range We then estimate the temperature rise in the crystalmelt interface to correct the crystal growth rates and assess the applicability of the classical phenomenological theories of crystal growth As these kinetic properties are extremely dependent on the impurity level much more than in multicompo-nent depolymerised silicate glasses to overcome the problem of analysing data from different authors we compare crystal growth viscosity and self diffusion data for analogous silica glass types having similar impurity contents We use the same strategy pro-posed and tested in Nascimento et al (10) for diopside to infer which ion(s) control the crystal growth kinetics and viscous flow in undercooled liquid silica We first check the crystal growth mechanism and then com-pare the effective diffusion coefficients determined in three distinctive ways ie calculated from crystal growth rates Du estimated through viscosity data Dη (via the Eyring relation) and directly measured
Table 1 Common silica impurity contents used in this paper (approximated values)Type Brand name Tracer elements (ppm) OHminus (ppm) Clminus (ppm)I Puropsil A B Al (25) Ca (1middot0) Fe (0middot5) Li (1middot0) Na (0middot5) Ti (0middot8) K (0middot5) asymp8 - Total asymp29I GE 124 Al (20middot3) Ca (1middot8) Fe (1middot9) Li (1middot0) Mg (0middot5) Mn (0middot1) Na (1middot3) 33 - Ti (1middot4) Zr (2middot4) Total asymp31 I Heraeus Quarzglas Infrasil Al (20) Ca (1middot0) Fe (0middot8) Li (1middot0) Mg (0middot1) Na (1middot0) Ti (1middot0) asymp10 - Cr (0middot1) Cu (0middot1) K (0middot8) Total asymp26II Vitreosil Al (15) Ca (0middot5) Fe (0middot1) Li (0middot2) Zr (1middot3) Na (0middot1) Ti (1middot3) 170 - K (0middot2) Total asymp18middot7III Spectrosil Al (0middot02) Ca (0middot01) Fe (0middot01) Li (0middot01) Mg (0middot01) Na (0middot01) 1000 100 Ti (0middot01) Cr (0middot01) Cu (0middot01) K (0middot01) Total asymp0middot16IV Suprasil W Al (0middot01) Ca (0middot015) Fe (0middot005) Li (0middot001) Mg (0middot005) Na (0middot01) 1 200 Ti (0middot005) Cr (0middot001) Cu (0middot003) K (0middot01) Total asymp0middot065
Proceedings of the eighth international otto schott colloquium Jena germany 23ndash27 July 2006
Zanottoindd 202 10082007 151859
Physics and Chemistry of Glasses European Journal of Glass Science and Technology Part B Volume 48 Number 4 August 2007 203
self diffusion coefficients of silicon and oxygen for each silica glass type Our aim is to assess which ions or lsquomolecular unitsrsquo control viscous flow and crystal-lisation rates Another point we wanted to verify is if the (often used) viscosity coefficient is capable of describing molecular transport at the crystalliquid interface during crystal growth
We thus analyse the transport mechanism that controls crystal growth kinetics and viscous flow in undercooled liquid silica in detail in a wide tempera-ture range using independent reliable experimental data on the thermodynamic driving force viscosity diffusion coefficients and crystal growth rates As the diffusion mechanisms involved in crystal nucleation and growth are unknown for most glasses we go deeper into this question by relating crystal growth kinetics with both viscous flow and directly measured diffusion data Following a previous work that fo-cused only in the diffusion process on type I silica(79) this paper addresses the subsequent question do crystal growth rates diffusivities and viscous flow have different behaviours in the various silica glass types Finally we test the influence of impurities on the oxygen and silicon self diffusion in bulk and thin film silica glasses
3 Theory
Three phenomenological models are frequently used to describe crystal growth kinetics controlled by atomic or molecular rearrangements at the crystal-liquid interface normal growth screw dislocation growth and growth controlled by 2D surface nuclea-tion(1) According to Jacksonrsquos treatment of the inter-face(80) materials with small entropy of fusion such as silica (ΔSm=0middot46R R is the gas constant in Jmol K) are expected to exhibit crystal growth kinetics of the form predicted by the normal growth model
According to the normal model the interface is rough on an atomic or molecular scale Growth takes place at step sites intersecting the interface and the growth rate u may be expressed by
u f D GRT
= - -EcircEumlAacute
ˆmacr
Egrave
IcircIacute
˘
˚˙
u
l1 exp D
(1)
where Du is an effective diffusion coefficient (m2s) of the (unknown) species that controls atomic or molecular attachment at the interface λ is the (un-known) diameter of the diffusing building molecules (m) which is equivalent to the jump distance the lattice parameter or the unit distance advanced by the interface ∆G is the free energy change upon crystallisation (Jmol) T is the absolute temperature (K) and f is the fraction of preferred growth sites on the interface that is close to unity
To interpret experimental data with respect to
the kinetic models described above it is necessary to evaluate the diffusivity Du This parameter can be estimated with the Eyring (or StokesndashEinstein) equa-tion assuming that the molecular motions required for interfacial rearrangements controlling crystal growth is similar to those controlling viscous flow in the bulk liquid DucongDη Hence
D k Th lh
= B (2)
where η is the shear viscosity (Pa s) and kB is the Boltz-mann constant The Eyring (E) and StokesndashEinstein (SE) equations differ only by a factor of 3π The SE expression describes a moving solid sphere with radius r in a viscous liquid Thus for silicate glasses most authors prefer the Eyring equation because the physical meaning of λ the jump distance is most appropriate (Equation (2)) Nevertheless the overall conclusions of this paper would not be altered if we employed the SE equation
It has been a matter of strong discussion if the Eyring equation can be used for calculations of crystal growth kinetics especially at deep undercoolings below 1middot2Tg where it has been suggested that this equation fails (eg see Ref 10 and references cited therein) In this paper the Eyring equation (Equa-tion (2)) is supposed to be valid from near melting to temperatures well below asymp1middot2Tg covering thus a wide temperature range
It is clear from the above discussion that one needs to know the glass viscosity as a function of tempera-ture and other experimental parameters such as ∆Hm (or ∆G) and Tm to compute crystal growth rates to compare theoretical predictions with experimental results The melting enthalpy ∆Hm of silica is ap-proximately 7680 Jmol(12ndash13) The energy barrier ∆G can be estimated in two ways by the Thomson Turnbull (Equation (3a) or Hoffman (Equation (3b)) approximations These give an upper and lower bound to ∆G respectively
DG H T TT
= -( )m m
m (Thomson) (3a)
DG H T T TT
= -( )m m
m2
(Hoffman) (3b)
As previous results(10) of a kinetic analysis obtained by these two approximations (Equations (3andashb)) are almost identical in a wide temperature range here we use only Thomsonrsquos (Equation (3a))
4 Results
41 Available crystal growth rates in the literature Figures 1ndash4 show that the crystal growth rates in silica glasses(12ndash33) are strongly influenced by the
Proceedings of the eighth international otto schott colloquium Jena germany 23ndash27 July 2006
Zanottoindd 203 10082007 151902
204 Physics and Chemistry of Glasses European Journal of Glass Science and Technology Part B Volume 48 Number 4 August 2007
impurity content ie glasses from different sources show widely distinct growth kinetics Fortunately the exact types of silica glasses used here were reported except for three particular cases For the other glasses we inferred the types from the fabrication procedure total impurity content water level or commercial brand name according to Sciglass 50(78)
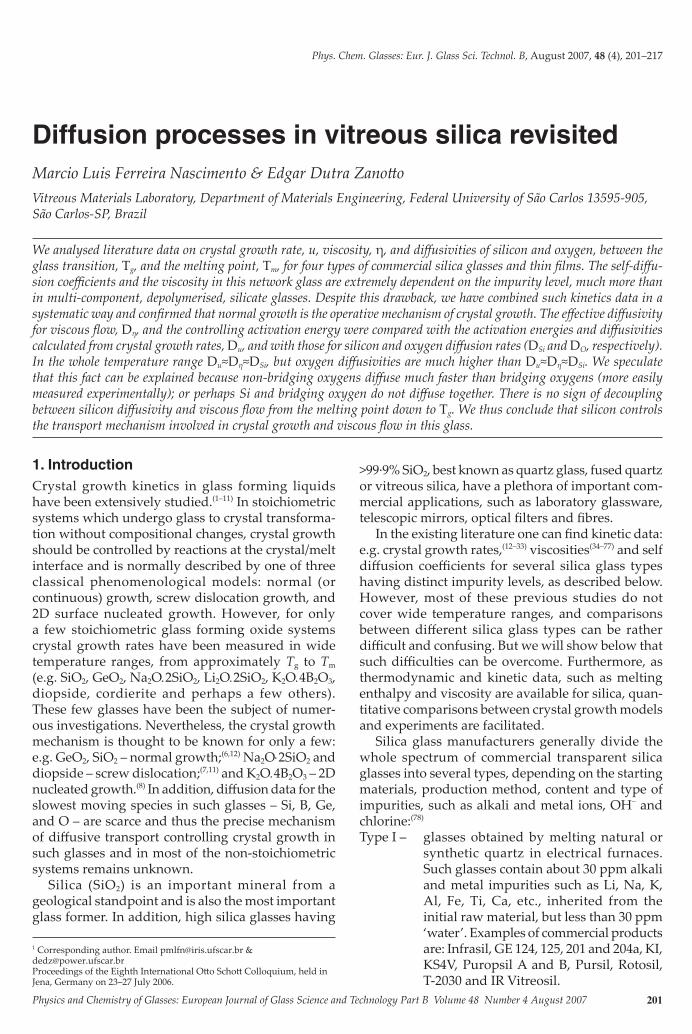
Figure 1 shows two limiting sets of crystal growth rates and an intermediate one for type I silicas Wag-staffrsquos data(1213) which also includes the maximum umax span over two orders of magnitude and show the slowest u among all type I glasses He used a glass with the following impurities in ppm Al2O3 (137)
Fe2O3 (5) TiO2 (3) CaO (8) MgO (4) K2O (2) Na2O (27) and Li2O (0middot7) The OHminus content in type I glass is typically below 30 ppm as demonstrated in Table 1 Wagstaff observed some crystals growing in the glass interior His samples were prepared by cutting cubes from a piece that had been treated for 70 h at 1773 K to develop internal crystallisation centres (which were probably catalysed on solid heterogeneities) The ki-netics of crystal growth and melting were determined by measuring the incremental dimensional change of any selected crystal occurring after further heat treatment This technique required the removal of surface devitrification and polishing of two opposite
Figure 1 Crystal growth rates of type I silica glasses The lines are fitted curves using the normal growth equation with λ=0middot16 and 2 Aring corresponding to two crystal growth regimes fastest (dashed line) and slowest (full line) using the lowest and highest viscosity data for each case respectively ndash see discussion
Figure 2 Crystal growth rates of type II silica glasses The lines are fitted curves using the normal growth model with λ=0middot26 and 0middot15 Aring corresponding to the fastest (dashed line) and slowest (full line) crystal growth rates using the lowest and highest viscosity data for each case respectively ndash see discussion
Proceedings of the eighth international otto schott colloquium Jena germany 23ndash27 July 2006
1300 1400 1500 1600 1700 1800 1900 200010-14
10-13
10-12
10-11
10-10
10-9
10-8
10-7
10-61100 1200 1300 1400 1500 1600 1700
Gro
wth
rate
u (m
s)
Temperature T (K)
Bihuniak et al 14
Boganov et al 15
Dietzel amp Wickert 16
Hlavac amp Vaskova 17
Hlavac amp Vaskova 17
Komarova amp Leko 18
Leko et al 22-23
Leko amp Komarova 19
Leko amp Komarova 20
Leko amp Komarova 21
Leko amp Mazurin 24
Vaskova amp Hlavac 25
Wagstaff 12
Wagstaff 13
SiO2 Type I fast
slow
T (oC)
1300 1400 1500 1600 1700 1800 1900 200010-14
10-13
10-12
10-11
10-10
10-9
10-8
10-7
10-61100 1200 1300 1400 1500 1600 1700
Gro
wth
rate
u (m
s)
Temperature T (K)
Komarova 26
Leko et al 27
Leko et al 27
Leko amp Komarova 28
Leko amp Komarova 28
Leko amp Komarova 28
Leko amp Mazurin 24
Leko amp Mazurin 24
SiO2 Type II
fast
slow
T (oC)
Zanottoindd 204 10082007 151902
Physics and Chemistry of Glasses European Journal of Glass Science and Technology Part B Volume 48 Number 4 August 2007 205
faces before microscopic measurementsFigure 2 refers to type II silica and shows two
different data sets Figure 3 also shows two data sets for type III glass the same as Figure 4 for type IV glass
For type I glasses we used data from the follow-ing sources Bihuniak et al(14) measured the thickness of crystallized layers using an optical microscope at 1623 K Boganov et al(15) used the same technique at 1673 K while Dietzel amp Wickert(16) measured u at 1823 K Hlavac amp Vaskova(17) measured the crystal-line layer in two type I quartz glasses denominated Czechoslovakian and French [] between 1573ndash1773
K Komarova amp Leko(18) used a KI type I glass Leko amp Komarova(19) also used KI glass and two other type I silica glasses(20ndash21) Leko et al(22ndash23) used an unknown type I silica glass Judging from the water content Leko amp Mazurin(24) probably used a type I silica glass Vaskova amp Hlavac(25) measured the growth of the crystal layer between 1573ndash1673 K Wagstaff(12ndash13) used a type I SiO2 glass
Regarding type II SiO2 glass Komarova(26) melted some glasses and studied the crystal growth rates on the sample surfaces Leko et al(27) measured the crystallized thickness in a KU-2 tube and block glass [] Leko amp Komarova(28) also used a KU-2 type
Figure 3 Crystal growth rates of type III silica glasses The lines are fitted curves using the normal growth model with λ=0middot3 and 1 Aring corresponding to fastest (dashed) and slowest (full line) crystal growth regimes In this case we used the general viscosity curve corresponding to this glass type ndash see discussion
Figure 4 Crystal growth rates of type IV silica glass The lines are fitted curves using the normal growth model with λ=0middot77 and 0middot8 Aring corresponding to fastest (dashed) and slowest (full line) crystal growth rates using the lowest and highest viscosity data for each case respectively ndash see discussion
Proceedings of the eighth international otto schott colloquium Jena germany 23ndash27 July 2006
1300 1400 1500 1600 1700 1800 1900 200010-14
10-13
10-12
10-11
10-10
10-9
10-8
10-7
10-61100 1200 1300 1400 1500 1600 1700
SiO2 Type III
Brown amp Kistler 29
Komarova 26
Leko amp Komarova 32
Leko amp Komarova 32
Leko amp Komarova 32
Mazurin et al 30
Pavlova et al 31
Gro
wth
rate
u (m
s)
Temperature T (K)
fastslow
T (oC)
1300 1400 1500 1600 1700 1800 1900 200010-14
10-13
10-12
10-11
10-10
10-9
10-8
10-7
10-61100 1200 1300 1400 1500 1600 1700
SiO2 Type IV
Brown amp Kistler 29
Leko amp Mazurin 24
Leko amp Mazurin 24
Leko amp Mazurin 24
Leko amp Mazurin 24
Leko amp Komarova 27
Gro
wth
rate
u (m
s)
Temperature T (K)
fast
slow
T (oC)
Zanottoindd 205 10082007 151902
206 Physics and Chemistry of Glasses European Journal of Glass Science and Technology Part B Volume 48 Number 4 August 2007
II glass at 1673 K and 1723 K [] and a third type II glass between 1373ndash1673 K [] Leko amp Mazurin(24) measured u between 1273ndash1673 K using two different type II [] silica glasses
Regarding type III SiO2 glass Brown amp Kistler(29) Mazurin et al(30) and Pavlova(31) used Corning 7940 glass Komarova(26) synthesed hers in vapor phase in a hydrogenndashoxygen flame using SiCl4 Leko amp Komarova(32) also used two KU-1 [] and a Corning 7940 glass []
Finally regarding type IV SiO2 glass Leko et al(27) used a KUVI glass made by synthesis in vapor phase in oxygen-containing SiCl4 plasma Leko amp Mazurin(24) measured the crystal layer between 1273ndash1673 K [ ] in four (estimated) type IV silica glasses Brown amp Kistler(29) used a Cab-O-Sil-lsquo0rsquo glass and studied the growth rate of the crystal layer on the glass surface We are not aware of crystal growth measurements in Type V and in silica glass films
42 Viscosity data from the literature
As regards to viscosity data we followed the same procedure used to analyse crystal growth rates For type I glasses we considered data from the following authors Amosov et al(34) used a SiO2 glass Bihuniak(35) used a type I glass estimated according to impurity type and level Doladugina amp Lebedeva(36) used a KS4V glass Hlavac amp Sen(37) used a type I glass melted between 1050ndash1230degC Leko amp Gusakova(38) used a KU-1 glass and measured η at 1130degC Leko amp Meshcheryakova(39) used a KI type I glass Orii et al(40) probably used a type I glass at 1200degC All these au-thors measured the glass viscosity by the beam bend-ing method The fibre elongation method was used by Whitworth et al(41) with a Vitreosil infrared glass at 1139degC by Mackenzie(42) that measured viscosity at 1228 1276 and 1327degC and by Yovanovitch(43) that used a type I SiO2 glass between 1000ndash1200degC Bowen amp Taylor(44) used a GE 124 glass and measured the viscosity by the falling ball method between 2085ndash2310degC Clasen et al(45) performed viscosity measurements by the torsion method between 1480ndash1570degC Donadieu et al(46) measured viscosity between 1000ndash1360degC but these data were not considered here because they were obtained under a compressive stress of about 1 kbar Dunn(47) made measurements by a concentric cylinder viscosimeter with tungsten crucible and spindle between 1810ndash2250degC but did not disclose the specific glass type Gusakova et al(48) used a KI glass melted from artificial quartz (type I) and made viscosity measurements by a rotating viscometer with Mo rotating bodycrucible and also by the beam bending method [] Both techniques were also utilised by Leko et al(75) that used some KI glasses from rock crystal made artificial crystal [] and synthetic cristobalite [] Leko et al(76) also meas-
ured η from natural quartz and other two estimated silica I types [ ] between 1100ndash2000degC Hoffmaier amp Urbain(49) used a type I silica glass by melting in vacuum and performed viscosity measurements by the compression method Kimura(50) used a Vitr-eosil IR type I glass and measured viscosity by the beam bending and fibre elongation methods at 1100 and 1200degC Loryan et al(51) used a type I glass and measured viscosity by penetration rotating methods between 1300ndash2000degC A rotating viscosimeter was employed by Solomin(52) that used a type I glass and measured η between 1720ndash2000degC and by Urbain et al(53) that probably used a type I glass and performed viscosity measurements in vacuum and argon atmos-pheres Toshiba Ceramics Co(54) researchers used a special T-2030 type I glass and measured η between 1097ndash1394degC Weiss(55) used a Vitreosil IR and a GE 214 [] type I glass using the torsion method in a wide temperature range Brebec et al(85) used a commercial Puropsil A type I with impurity content similar to Puropsil B presented at Table 1
For type II SiO2 glass the beam bending technique was applied by Amosov et al(34) using artificial quartz and gas flame by Fontana amp Plummer(56) (Armesil glass) by Mazurin amp Klyuev(57) and by Leko et al(75) that used a KU-2 glass and measured the viscosity between 1100ndash1300degC Aslanova et al(33) probably used a type II (gas flame) and measured viscosity by the counterbalanced method in a Mo crucible Bruck-ner(58) used a Homosil type II glass and the rotating viscosimeter with coaxial Ir cylinders (1686ndash2007degC) Bruisten amp van Dam(59) and Clasen amp Hermann(60) used Herasil III glass and measured η by the fibre elonga-tion and torsion methods Donadieu(61) probably used a type II SiO2 glass Gusakova et al(48) used a KU-2 type II glass and measured viscosity by a rotating viscometer with a Mo rotating body and crucible and also with the beam bending method Leko(62) used a type II silica glass with no indication of the measurement technique Leko amp Meshcheryakova(63) ndash and also in Leko et al(64) ndash probably used two dif-ferent type II silica glasses melted from glass flame and artificial quartz The measurement of viscosity was carried out using the spring extension and beam-bending methods [] between 1090ndash1176degC Loryan et al(51) used a type II glass and measured viscosity by the penetration method between 1100ndash2000degC Mazurin et al(65) probably used type II glasses from artificial quartz and from crystobalite [] melted by glass flame method and measured η by a rotating viscosimeter with Mo rotating body and crucible Pavlova amp Amatuni(66) used a KV type II glass with no indication of experimental procedure Researchers at Toshiba Ceramics Co(54) used a special T-1030 type II glass with no indication of the viscosity measure-ment method used between 1097ndash1394degC Weiss(55) measured Herasil I Vitreosil OG [] and Ovisil 451
Proceedings of the eighth international otto schott colloquium Jena germany 23ndash27 July 2006
Zanottoindd 206 10082007 151903
Physics and Chemistry of Glasses European Journal of Glass Science and Technology Part B Volume 48 Number 4 August 2007 207
[] type II SiO2 glasses using the torsion method in wide temperature ranges
For type III SiO2 glass Brown amp Kistler(29) and Paek et al(67) (Suprasil II between 1895ndash2150degC) used the fi-bre elongation method Hagy(68) (1099ndash1219degC) Maz-urin et al(74) (1015ndash1250degC) Doladugina amp Lebedeva(36) (1050ndash1200degC) Mazurin amp Klyuev(57) (978ndash1125degC) Scherer(69) (1195ndash1275degC) and Schultz(70) (at 986 and 1064degC with a Corning 7940 glass) all applied the beam bending method Gusakova et al(48) used a rotat-ing viscometer using Mo rotating bodycrucible and beam bending methods 1080ndash1850degC and a KU-1 type III glass Kimura(50) used a Spectrosil glass and
beam bendingfibre elongation methods at 1000 1065 and 1100degC Leko et al(75) used a KU-1 glass and beam bending and rotating methods for measurements between 1100ndash2000degC Leko(62) presented no indica-tion viscosity measurements but measured between 1080ndash1940degC Loryan et al(51) utilised the penetration and rotating methods between 1100ndash2000degC Re-searchers at Toshiba Ceramics Co(54) used a specially T-4040 type III glass measured between 1097ndash1394degC Weiss(55) used Suprasil I and Synsil [] type III silica glasses and the torsion method in a wide temperature range
For type IV SiO2 glass Leko(62) and Leko amp Gu-
Figure 5 Viscosity data of type I silica glasses The lines are Arrhenius fits and correspond to the highest (dotted) and lowest viscosities (dashed) see discussion
Figure 6 Viscosity data of type II silica glasses The lines are Arrhenius fits that correspond to highest (dotted) and lowest viscosities (dashed) curves see discussion
Proceedings of the eighth international otto schott colloquium Jena germany 23ndash27 July 2006
40x10-4 50x10-4 60x10-4 70x10-4 80x10-4
2
3
4
5
6
7
8
9
10
11
12
13
14
2700 2400 2100 1800 1500
SiO2 Type I
Leko et al 75
Leko et al 75
Leko et al 76
Leko et al 76
Leko et al 76
Leko amp Meshcheryakova 39
Loryan et al 51
Mackenzie 42
Orii et al 40
Solomin 52
Toshiba Ceramics 54
Urbain et al 53
Weiss 55
Weiss 55
Whitworth et al 41
Yovanovitch 43
log 10
(P
as)
1T (K 1)
high
low
Amosov et al 34
Bihuniak 35
Bowen amp Taylor 44
Brebec et al 85
Brown amp Kistler 29
Clasen et al 45
Doladugina amp Lebedeva 36
Donadieu et al 46
Dunn 47
Gusakova et al 48
Gusakova et al 48
Hlavac amp Sen 37
Hoffmaier amp Urbain 49
Kimura 50
Leko amp Gusakova 38
Leko et al 75
T (K)
40x10-4 50x10-4 60x10-4 70x10-4 80x10-4
2
3
4
5
6
7
8
9
10
11
12
13
14
2750 2500 2250 2000 1750 1500 1250
SiO2 Type II
Amosov et al 34
Aslanova et al 33
Bruckner 58
Bruisten amp van Dam 59
Clasen amp Hermann 60
Donadieu 61
Fontana amp Plummer 56
Gusakova et al 48
Loryan et al 51
Leko et al 75
Leko 62
Leko amp Meshcheryakova 63
Leko amp Meshcheryakova 64
Mazurin amp Klyuev 57
Mazurin et al 65
Mazurin et al 65
Pavlova amp Amatuni 66
Toshiba Ceramics 54
Weiss 55
Weiss 55
Weiss 55
log 10
(Pa
s)
1T (K 1)
high
low
T (K)
Zanottoindd 207 10082007 151903
208 Physics and Chemistry of Glasses European Journal of Glass Science and Technology Part B Volume 48 Number 4 August 2007
sakova(77) probably used type IV silica glasses but did not indicate the measurement procedure The fibre elongation method was used by Ohashi et al(71) between 1295ndash1460degC Shiraki et al(72) used the fibre drawing method 1823ndash1980degC Tajima et al(73) did not indicate the measurement procedure but measured η between 1380ndash1450degC
Figures 5ndash8 show that as for the crystal growth rates the viscosities of the different types of silica glasses(34ndash77) vary significantly and are strongly af-fected by impurities Their effect is very similar in magnitude to that on the crystal growth rates The lines shown on each graph correspond to an Arrhe-nius expression of the type log10η=A+BT with η in Pa s T in K A and B are constants
Figures 5 and 6 show several data sets for type
I and type II silica glasses respectively but in our analysis we only considered the highest and the lowest viscosities For type IV silica glass Figure 8 shows that two data sets can be distinguished Figure 7 shows an almost unique behaviour for all different glasses of type III The variation of viscosity for this glass type is thus much smaller than that for the other silica glass types
5 Discussion
51 Analyses of crystal growth dataFor all types of silica glasses in the temperature range 1374ndash1420degC we observed the following maximum variations of growth rates between the data of dif-ferent authors for type I=230times at T=1410degC for type II=140times at T=1375degC for type III=30times at T=1420degC and for type IV=20times at T=1400degC In other words within each glass family there is a variation of crystal growth rates of one to two orders of magnitude
Since the measurement of crystal growth rates is quite simple and the typical errors should not exceed 10ndash15 this large scatter indicates that for this particular system u is very sensitive to the im-purity content which includes lsquowaterrsquo and chlorine In particular as expected type I silicas (produced by melting of quartz and containing several impuri-ties) presents a higher scatter of crystal growth rates than type III silicas (prepared from the hydrolysis of silicon compounds) or than type IV silicas (produced by SiCl4 oxidation)
On can speculate that crystal growth kinetics are extremely dependent on the impurity level because the purest silica glasses have a fully polymerised network consisting of Q4 unities (in NMR nota-tion) The addition of impurities breaks some of the bridging SindashOndashSi bonds disrupting the continuous network and producing a distribution of Qn (n=1 2
Proceedings of the eighth international otto schott colloquium Jena germany 23ndash27 July 2006
Figure 7 Viscosity data of type III silica glasses The line is an Arrhenius fit corresponding to all experimental data denominated lsquogeneralrsquo
Figure 8 Viscosity data of type IV silica glasses The lines are Arrhenius fits that correspond to the highest (dotted) and lowest viscosities (dashed) data see discussion
40x10-4 50x10-4 60x10-4 70x10-4 80x10-4
2
3
4
5
6
7
8
9
10
11
12
13
14
2750 2500 2250 2000 1750 1500 1250
SiO2 Type III Brown amp Kistler 29
Doladugina amp Lebedeva 36
Gusakova et al 48
Hagy 68
Kimura 50
Leko et al 75
Leko 62
Loryan et al 51
Mazurin amp Klyuev 57
Mazurin et al 74
Paek et al 67
Scherer 69
Schultz 70
Toshiba Ceramics 54
Weiss 55
Weiss 55
log 10
(P
as)
1T (K 1)
general
T (K)
40x10-4 50x10-4 60x10-4 70x10-4 80x10-4
2
3
4
5
6
7
8
9
10
11
12
13
14
2750 2500 2250 2000 1750 1500 1250
SiO2 Type IV
Leko 62
Leko amp Gusakova 77
Ohashi et al 71
Shiraki et al 72
Tajima et al 73
log 10
(P
as)
1T (K 1)
high
low
T (K)
Zanottoindd 208 10082007 151904
Physics and Chemistry of Glasses European Journal of Glass Science and Technology Part B Volume 48 Number 4 August 2007 209
3) units that strongly affect transport phenomena such as those focused here The small concentration of impurities in type I silicas (for instance circa 30 ppm alkali and 8 ppm OHminus in Puropsil B as cited in Table 1) renders it very difficult to experimentally detect the corresponding small concentrations of Q3 and Q2 and possibly of Q1 units However since the total content of (bond breaking) impurities is below asymp0middot1 it is clear that the percentage of Q4 units remains larger than asymp99middot9 for most silica glasses
52 Analyses of viscosity data
Similar differences are observed for viscosity ie a scatter of about two orders of magnitude for silica types I and II and one order of magnitude for silica types III and IV For instance taking T=1270degC and considering all types of silica glasses the following variation of η is observed 430times for type I 100times for type II 5times for type III and 10times for type IV Consid-ering all the different sourcesauthorstechniques there is thus a clear correspondence between the effect of impurities on the crystal growth rates and viscosities It is clear that the glasses that present the slowest crystal growth rates and highest viscosities have fewer impurities
That is why we combined the slowest crystal growth rates with the highest viscosities and vice versa in our kinetic analysis
53 Crystal growth mechanism in silica types
For stoichiometric (polymorphic) crystallisation as in the present case short range molecular diffusion through the crystalmelt interface is expected to govern crystal growth In most theoretical analyses of crystal growth kinetics in undercooled liquids it is assumed that this type of molecular transport is determined by an effective diffusion coefficient which is linked to the viscosity by the Eyring equation (Equation 2) With the assumption Du=Dη to analyse growth rate data one can thus insert Equation (2) into Equation (1) and use experimental values of η(T) and ∆G(T) calculated by the Thomson equation for instance
However the true size l (and the nature) of the diffusing atoms or lsquobuilding moleculesrsquo in Equations (1) and (2) is unknown One can thus leave l as an ad-justable parameter and fit Equation (1) to the growth rate data For example considering Wagstaffrsquos growth rate data Figure 1 shows a fitted growth rate curve using the normal growth equation (Equation 1 with f=1) and Dη from the Eyring equation which resulted in λ=2 Aring (solid line see details below)
In summary each crystal growth curve in Figures 1ndash4 was linked to a given viscosity curve (from Figures 5ndash8) in a such a way that the fastest u(T) was combined with the lowest η(T) and vice versa for
each glass type For type III glass a single viscosity curve (denominated lsquogeneralrsquo) was used for all crystal growth rate data The result is that within some deviations the normal growth mechanism describes the kinetics of the four types of silica glasses shown in Figures 1ndash4
54 Arrhenius behaviour and activation energies for viscosity
Figures 5ndash8 show the viscosities of different silica glasses reported by several authors Arrhenius lines log10 η=A+BT fit quite well the data of Figures 5ndash8 in wide temperature ranges
Details of experimental data used were described above The viscosity curves of the four types of silica glasses show Arrhenius-type behaviour and glasses types I and II (having the lowest OHminus content) present the highest viscosities activation energies of viscous flow Eη and Tg (curves denominated lsquohighrsquo viscosity dotted lines) In fact the highest viscosity data for type I glass gives an activation energy for viscous flow Eη=569plusmn5 kJmol which is close to the experimental activation energy reported by Brebec et al(85) for Puropsil A glass (Type I) Eη=591plusmn10 kJmol The lowest viscosities are associated with the lowest activation energies for viscous flow and Tg The ex-ception is type IV glass where the activation energy Eη of the glass having the highest viscosity is similar to that of the glass of lowest viscosity Table 2 sum-marises the activation energies for viscous flow and Tg (considering log10 η(Tg)=12 [in Pathinsps]) for the four silica glass types
55 Link between viscosity and crystal growth rates
It is obvious that for a given glass type the higher the viscosity the smaller the impurity content highest activation energy for viscous flow Eη and highest Tg Surprisingly however the viscosity of sixteen sam-ples measured by different authors for type III glasses shows a variation of only half order of magnitude As the growth rate u and viscosity η are inversely proportional (Equation (1)) similar findings were
Table 2 Approximate values of activation energies for viscous flow Eη calculated from and estimated Tg for each glass type and viscosity regime according to Figures 5ndash8 Silica glass type Viscosity curve Eη (kJmol) Tg (K)Type I lowest 490plusmn13 1337 highest 570plusmn5 1606Type II lowest 520plusmn4 1426 highest 610plusmn4 1583Type III general 450plusmn2 1345Type IV lowest 530plusmn4 1373 highest 520plusmn10 1438
Proceedings of the eighth international otto schott colloquium Jena germany 23ndash27 July 2006
Zanottoindd 209 10082007 151904
210 Physics and Chemistry of Glasses European Journal of Glass Science and Technology Part B Volume 48 Number 4 August 2007
observed for the crystal growth data of Figures 1ndash4 In fact the influence of impurities on the magnitude of the viscosity is quite similar to that in the crystal growth rates in each glass type The relatively small variations of viscosity for glass types III and IV are because they are made from synthetic chemicals and have the smallest variation of impurities structural water and chlorine
56 Glass transition temperatures of different silica glass types
The glass transition temperatures were measured for different silica glasses by a few authors but unfortu-nately most did not indicate the glass types used It should be stressed that experimental measurements by DSC or DTA are difficult with silica glass due to low variation of Cp For instance Mai et al Tg=1495 K(81) (unknown measurement procedure and glass type) Nassau et al Tg=1433 K(82) (by dilatometric measurement but unknown glass type) Youngman et al Tg=1459 K(83) (unknown type and measurement procedure) Another way to compare Tg was by using viscosity measurements ie searching for the tem-perature where the viscosity is 1012 Pa s The results shown in Table 2 are in agreement with measured Tg values The purer the glass the higher is its Tg Thus taking the highest viscosities types I and II glasses have Tg values between 1583 and 1606 K whereas Tg for types I and III glasses using lowest and general regimes respectively is between 1337 and 1345 K
57 The meltcrystal interface temperature during crystallisation
Crystallisation is an exothermic process and knowl-edge of the meltcrystal interface temperature is es-sential in analysing crystal growth kinetics Attempts to calculate the temperature distribution at the inter-face during crystal growth require many simplifying assumptions to solve this complex problem However from direct measurements for several glasses Herron and Bergeron(84) suggested an empirical equation to estimate the meltcrystal interface temperatures in six borates and one silicate glass (Li2O2SiO2) based on experimental measurements that were supposed to be valid around the maximum growth rate Equation (4) was proposed by Herron amp Bergeron for correct-ing of temperature of the interface at the maximum crystal growth umax
ΔTi=17middot12(umaxΔHm)0middot486 (4)
In Equation (4) ∆Ti is the temperature difference between the melt and the interface (degC) umax is the maximum crystal growth rate (cms) and ∆Hm is the melt enthalpy (calcm3) Equation (4) shows that interface temperature corrections for silica is asymp0middot1degC
Thus because of the low value of maximum crystal growth rate (compared to other oxide glasses) and low melting enthalpy such correction was irrelevant for this particular glass
58 Analysis of experimental results considering the normal growth model
From Equations (1) and (2) the expression for normal growth may be written as
u f k T G RT= - -( )EgraveIcirc ˘B
l h2 1 exp D (5)
We assume fasymp1 and η given by the Arrhenius equa-tions fitted for each glass type (data sets from Figures 5ndash8) The normal growth model can be tested in two ways first using all the available data (Figures 1ndash4) taking some groups for which crystal growth kinet-ics are similar or in fine detail for a relatively small undercooling range ∆Tlt380degC using only Wagstaffrsquos data(12ndash13) Thus from all available crystal growth data from different sources the fitted values of the jump-ing distance λ were approximately 1 Aring It would be ideal to use the crystal growth rates and viscosity from samples obtained from the same batch to avoid the influence of impurities but this was not feasible here It was however possible to use data for same silica types combining the lowest viscosities with the highest growth rates and vice versa
Wagstaff(12) studied the temperature dependence of the fraction of preferred growth sites on the crys-talglass interface f At low undercoolings a plot of uR=uη[1minusexp(minus|ΔG|RT)] versus ∆T should yield a straight line parallel to the x-axis(112) and this indeed was observed Thus this appears to be the operative mechanism in this system This type of analysis us-
Proceedings of the eighth international otto schott colloquium Jena germany 23ndash27 July 2006
Figure 9 Normal growth model adjusted to Wagstaffrsquos data for silica glass type I(12ndash13) using Thomsonrsquos approximation for ∆G and the viscosity of Puropsil A(86) The fitted jump distance is 2 Aring
1600 1700 1800 1900 2000
-10x10-9
00
10x10-9
20x10-9
1400 1500 1600 1700
SiO2 Type I
Gro
wth
rate
u (m
s)
Temperature T (K)
Wagstaff 12
Wagstaff 13
T (oC)
Zanottoindd 210 10082007 151905
Physics and Chemistry of Glasses European Journal of Glass Science and Technology Part B Volume 48 Number 4 August 2007 211
ing uR was performed in almost all previous crystal growth studies because this procedure does not need the use of the jumping distance λ
Figure 9 shows that the normal growth model fits quite well Wagstaffrsquos data Fitting with a Leven-bergndashMarquardt nonlinear algorithm resulted in a correlation factor R2=0middot96 The fitting parameter was the jump distance All the other parameters melting enthalpy ∆Hm melting point Tm and viscosity η(T) were independently measured These values were presented by Wagstaff (∆Hm=7680 Jmol Tmasymp2007 K viscosity from Brebec et al(85) (Puropsil A glass) log10η=minus8middot81166+30193middot77T (η in Pathinsps T in K) The resulting fitted value of λ=2 Aring is close to the average SiminusO bond length (1middot59 Aring) in silicate glasses(86) and about 2middot5 times higher than the ionic Si4+ diameter (0middot8 Aring) but somewhat lower than the O2minus (2middot7 Aring) and is thus an acceptable value We should stress that from such fitting of crystal growth rates one can-not calculate the exact value of the jump distance Therefore only the order of magnitude for the size of the lsquostructural unitsrsquo involved in crystallisation is ob-tained because the fitted λ values carry all the errors related to the uncertainties in the other parameters of the normal crystal growth model
59 Activation energies and diffusivities in bulk silica glasses
In most theoretical analysis of crystal growth kinetics in undercooled melts it is assumed that short range
molecular transport through the crystalmelt inter-face is determined by the diffusivity of the slowest species It is also assumed that the effective diffu-sion coefficient of such species can be calculated via the viscosity η by means of the Eyring expression (Equation (2)) This expression thus relates viscos-ity and diffusivity Dη of the rate determining flow unities However it has been a matter of discussion if Equation (2) could be used for such calculations at deep undercoolings near Tg (eg see discussions in Nascimento et al(10)) Our aim here is to compare diffusion coefficients calculated from crystal growth rate data Du from about Tm to asymp1middot2 Tg with those calculated through viscosity Dη and with directly measured diffusion coefficients of silicon and oxygen (when available) for each glass type
Since we now know the governing growth mechanism in silica glass let us analyse the diffusion coefficients in more detail For normal growth one can isolate an effective diffusion coefficient Du from Equation (1) as shown by Equation (6)
D u GRTu = - -Ecirc
EumlAacuteˆmacr
Egrave
IcircIacute
˘
˚˙
-
l 11
exp D
(6)
This parameter can be estimated using the experi-mental growth rate data and λ from the previous fits for each glass type The combination of the slowest crystal growth rates with the highest viscosities (and vice versa) thus yields Du for each silica glass type
Figures 10ndash13 show a good agreement between Du and Dη for all four glass types In addition the calcu-
Figure 10 Logarithm of effective diffusion coefficients in type I silica glasses Du calculated here from the crystal growth rate data of Wagstaff(1213) Boganov(15) Dietzel amp Wieckert(16) and Bihuniak et al(35) using Equation 6 corresponding to the slowest and fastest bounds of Figure 1 Dη Diffusion coefficients calculated by the Eyring equation (Equation 2) Solid line using the viscosity data for Puropsil A silica(85) with λ=2 Aring These diffusivities correspond to the highest viscosity curve of Figure 5 or lower diffusion limit Dashed line using the lowest viscosity curve of Figure 5 with λ=0middot16 Aring the upper diffusion limit DSi and DO Measured self-diffusion coefficients of Si4+(85) and O2minus(889192) (see respective symbols in the insert) dotted lines corresponds to melting (Tm) - as experimentally observed by Wagstaff(1213) - and Tg temperatures of Puropsil A respectively (see text for more details)
Proceedings of the eighth international otto schott colloquium Jena germany 23ndash27 July 2006
50x10-4 60x10-4 70x10-4 80x10-4 90x10-4
-24
-23
-22
-21
-20
-19
-18
-17
-16
-152200 2000 1800 1600 1400 1200
log 10
D (m
2 s)
1T (K 1)
Du Dietzel amp Wieckert 16
Du Bihuniak et al 14
Du Boganov 15
Du Wagstaff 12-13
D Brebec et al 85
D low viscosity curve
DSi Brebec et al 85
DO Kalen et al 88
DO Haul amp Duumlmbgen 91
DO Sucov 92
SiO2 Type I
upper
lower
Tg = 1451 K
Tm = 2007 K
T (K)
Zanottoindd 211 10082007 151905
212 Physics and Chemistry of Glasses European Journal of Glass Science and Technology Part B Volume 48 Number 4 August 2007
lated solid and dashed lines (Dη) correctly describe the temperature dependence of Du These effective diffusivities Dη calculated via viscosity and Du from crystal growth rates could be seen as upper and lower bounds for each silica type (Figures 10ndash13) with a dif-ference of about one order of magnitude but similar temperature dependences In summary the congru-ence of Du and Dη indicates that whatever the bond breaking and molecular reorientation mechanism required for crystallisation is it is the same as that
required for the atomic transport mechanism that controls viscous flow
510 Silicon and oxygen diffusion in different types of silica glasses
Figure 10 shows experimental values of oxygen (O2minus) and silicon (Si4+) diffusivities of type I silica glass in undercooled liquid silica(8587ndash 93) between 1073 and 1703 K Figures 11ndash12 present oxygen diffusivities
Proceedings of the eighth international otto schott colloquium Jena germany 23ndash27 July 2006
Figure 11 Logarithm of effective diffusion coefficients in type II silica glasses Du calculated from crystal growth rate data of Leko amp Mazurin(2464) Komarova(26) Leko et al(27) and Leko amp Komarova(28) using Equation (6) corresponding to the slower and faster bounds of Figure 2 Dη Diffusion coefficients calculated by the Eyring equation (Equation (2)) Solid line using the highest viscosity data of Figure 6 the lower limit for diffusion Dashed line using the lowest viscosity data of Figure 6 the upper diffusion limit both with λ=0middot26 Aring DO Measured self-diffusion coefficients of O2minus(8990) (see respective symbols in the insert)
Figure 12 Logarithm of diffusion coefficients in type III silica glasses Du calculated from crystal growth rate data of Komarova(26) Leko amp Komarova(28) and Brown amp Kistler(29) via Equation 6 corresponding to the slowest and fastest bounds of Figure 3 Dη Diffusion coefficient calculated by the Eyring equation (Equation 2) Dashed line using the lsquogeneralrsquo viscosity data of Figure 7 with λ=0middot3 Aring that could be due to no impurity influence and indicates an upper limit for diffusion The lower bound refers to Du calculated form data from Komarova e Leko amp Komarova (see symbols) DO Measured self-diffusion coefficient of O2minus(87) (see respective symbol in the insert)
50x10-4 60x10-4 70x10-4 80x10-4 90x10-4
-24
-23
-22
-21
-20
-19
-18
-17
-16
-152200 2000 1800 1600 1400 1200
log 10
D (m
2 s)
1T (K 1)
Du Komarova 26
Du Leko et al 27
Du Leko et al 27
Du Leko amp Komarova 28
Du Leko amp Komarova 28
Du Leko amp Komarova 28
Du Leko amp Mazurin 24
Du Leko amp Mazurin 24
D high viscosity curve D low viscosity curve
DO Muehlenbachs amp Schaeffer 90
DO Williams 89SiO2 Type II
upper
lower
T (K)
50x10-4 60x10-4 70x10-4 80x10-4 90x10-4
-24
-23
-22
-21
-20
-19
-18
-17
-16
-152200 2000 1800 1600 1400 1200
log 10
D (m
2 s)
1T (K 1)
Du Brown amp Kistler 29
Du Komarova 26
Du Leko amp Komarova 28
Du Leko amp Komarova 28
D general viscosity curve
DO Jorgensen amp Norton 87
SiO2 Type III
upper
T (K)
Zanottoindd 212 10082007 151906
Physics and Chemistry of Glasses European Journal of Glass Science and Technology Part B Volume 48 Number 4 August 2007 213
corresponding to glass types II and III respectively As far as we know there are no diffusion measure-ments for type IV silica Figure 13 shows Yinnonrsquos data(93) for oxygen diffusivity in an unknown silica type just for comparison An analysis of oxygen self diffusion in SiO2 glass reveals a large scatter of activation energies and pre-exponential factors (Figures 10ndash13)
For type I silica glass DO clearly differs from Du and Dη (but DSi is equal to Du and Dη) Schaeffer(94) suggested that the activation energy for oxygen self diffusion in silica glass is close to 100 kJmol much less than the single bond strength between silicon and oxygen (465 kJmol) Our review of oxygen tracer diffusion in SiO2 glass reveals a larger scatter of activation energies (100ndash300 kJmol) and pre-exponential factors (according to Table 3) but these values are well below 465 kJmol and confirm Schaefferrsquos findings
By analogy with crystal growth rates and viscosi-ties the most important causes for the differences in oxygen diffusion rates in different samples (shown in Figures 10ndash13) are quite likely variations in impurity content But according to Table 3 even for the same glass (Armesil type II) there are some significant differences in the activation energies obtained from different techniques Thus experimental errors from the different techniques employed in each work may also partially explain these discrepant values On the other hand it is absolutely clear from Figures 10ndash13 that despite the scatter the oxygen diffusion coefficients are several orders of magnitude higher than those of silicon and that their temperature de-
pendence (activation energy) are smaller than that for silicon diffusion
It is not trivial to separately characterise transport of oxygen in different chemical forms However recently Kajihara et al(95) distinguished diffusion of molecular oxygen (O2) from other oxygen species in silica glasses using photoluminescence Their results were compared with the oxygen permeation data of Norton(96) and of Hetherington amp Jack(97) The diffusiv-ity of molecular oxygen from these three sources are more than five orders of magnitude larger than those reported in our Figures 10ndash14 for ionic oxygen These slow diffusivities have been attributed to hopping of oxygen ions belonging to the silica glass lattice On the other hand the structure of SiO2 glass is rela-tively open allowing the incorporation of molecular O2 without a significant interaction with the silica lattice and thus oxygen molecules (O2) have much higher diffusivities than oxygen ions We are not dealing with molecular oxygen here but the above discussion indicates that different oxygen types have widely different mobilities An important note is that there is more agreement between molecular oxygen diffusivities from different authors than for the BONBO oxygen diffusivities (and this finding is understandable if one considers varying Qn amounts according to the impurities in each glass as explained below) Therefore impurities do not significantly change molecular oxygen diffusivities but have a strong role on ionic oxygen diffusion and this type of diffusion is of primary interest to this paper
Type I is the unique silica glass for which there are reported data for silicon self diffusion It is ex-
Proceedings of the eighth international otto schott colloquium Jena germany 23ndash27 July 2006
Figure 13 Logarithm of diffusion coefficients in type IV silica glasses Du calculated from Leko amp Mazurin(24) and Leko amp Komarova(27) crystal growth rate data (Equation (6)) corresponding to the slowest and fastest bounds of Figure 4 Dη Diffusion coefficients calculated by the Eyring equation (Equation 2) Solid line using the highest viscosity data of Figure 8 with λ=0middot77 Aring that indicates the lower limit for diffusion Dashed line uses the lowest viscosity data of Figure 8 with λ=0middot8 Aring and indicates the upper limit DO Measured self-diffusion coefficient of O2minus in undetermined silica type(93) (see respective symbols in the insert) nk unidentified vitreous silica type
50x10-4 60x10-4 70x10-4 80x10-4 90x10-4
-24
-23
-22
-21
-20
-19
-18
-17
-16
-152200 2000 1800 1600 1400 1200
log 10
D (m
2 s)
1T (K 1)
Du Leko amp Komarova 27
Du Leko amp Mazurin 24
D high viscosity curve D low viscosity curve
DO Yinnon (nk) 93
SiO2 Type IV
upper
lower
T (K)
Zanottoindd 213 10082007 151906
214 Physics and Chemistry of Glasses European Journal of Glass Science and Technology Part B Volume 48 Number 4 August 2007
tremely difficult to obtain very sluggish diffusion coefficients such as those of Table 3 but Brebec et al(85) managed to measure Si4+ diffusion in silica glass using SIMS (secondary ion mass spectroscopy) The activation energy for Si4+ diffusion in SiO2 glass (Type I Puropsil A) is about 580 kJmol in the temperature range between 1413ndash1683 K According to Figure 10 diffusivity calculated from crystal growth rate (Du) correlates very well with the values calculated from viscosity (Dη) In addition the activation energies for viscous flow (Table 2) are close to the activation energy for silicon diffusion In fact the coincidence of the activation energies for viscous flow and crystal growth with those calculated from self diffusion of silicon but not of oxygen suggests that Si and O do not diffuse together at the same rate during crystal growth
Since silicon and bridging oxygens (BO=SindashOminusSi) are tightly linked one might argue why the diffu-sivities of these two network building species are so different A reasonable explanation is that Si and O do not diffuse together at the same rate or when one measures oxygen diffusivity in silica in reality only the movement of nonbridging oxygens (NBO=SindashOndashM where M refer to impurity elements in the glass) which are not so tightly bound to the silicon tetra-hedra are being measured because NBO can move much faster than BO This proposal is consistent with the conclusions of Kalen et al(88) that considered the scatter shown in Table 3 be qualitatively explained by the existence of at least two mechanisms for oxygen ion diffusion network and interstitial
In an ideal 100 pure silica glass having no impurities only Q4 units should exist In this case one should expect that Si and O would have similar diffusivities For real glasses several diffusivity data
would be ideally compared considering a single glass from the same batch (having exactly same impurity content and consequently the same BONBO frac-tion) as we present in this paper for Puropsil A In Figure 10 the diffusivities and activation energies for silicon diffusion and viscous flow of Puropsil A are indeed quite close
An ideal experiment would be one with the four types of diffusivities determined from the same glass samples and in the same temperature range but un-fortunately such data are not available We were thus careful to choose data for glasses of the same type supposedly having similar impurity contents and the values of Dη Du and DSi are indeed coherent For Puropsil A glass (ie samples from the same batch) viscosity diffusion Dη and Si diffusion DSi agree as shown in Figure 10 up to below Tg (considering the same batch) This finding confirms that viscous flow and crystal growth are controlled by silicon diffusion in undercooled silica
511 Activation energies and diffusivities in thin film silica glasses
For the sake of completeness we also discuss available diffusion data for thin film silica glass although we could not find viscosity and crystal growth data
Figure 14 shows diffusivity measurements of silicon and oxygen in thin film silicas under different conditions One notes that DO and DSi follow different patterns as we previously observed for bulk silica glasses Table 3 also shows the pre-exponentials dif-fusivities and activation energies for these systems The activation energies for Si diffusion are higher than those of oxygen
Mikkelsen(98) compared his results for oxygen dif-
Proceedings of the eighth international otto schott colloquium Jena germany 23ndash27 July 2006
Table 3 Pre-exponential diffusivities (D0) and activation energies (EA) of different vitreous silica types determined by different methods for the glasses shown in Figures 10ndash14 Oxygen data for bulk glasses(87ndash93) silicon data for bulk glass(85) oxygen data for thin films(98ndash102) and silicon data for thin films(103ndash106) In parenthesis we list the commercial brand name (nk not known) [] Jorgensen amp Norton and Costello amp Tresller measured oxygen diffusivities only at one temperature (here established as D0) as indicated ϑGlass type Diffusivity type Method ΔT range (K) D0 (m2s) EA (kJmol)I (nk) Du Wagstaff Equation (6) From crystal growth 1623ndash2007 1middot4times10minus2 547plusmn18I (Puropsil A) Dη Eyring relation Equation (2) From viscosity 1373ndash1673 1middot8times10minus1 591plusmn1I (Puropsil A) DSi Brebec et al SIMS 1383ndash683 1middot3times10minus3 579plusmn14I (GE 124) DO Kalen et al SIMS 1073ndash1473 5middot5times10minus15 143plusmn24I (Heraeus) DO Haul amp Duumlmbgen Rate uptake 1173ndash1523 4middot3times10minus10 234plusmn18I (nk) Sucov Tracer loss 1198ndash1498 1middot5times10minus6 298plusmn22II (Amersil) DO Muehlenbachs amp Schaeffer Rate of exchange 1423ndash1703 4middot4times10minus15 82plusmn17II (Amersil) DO Williams Rate uptake 1123ndash1523 2middot0times10minus13 121plusmn8III (nk) DO Jorgensen amp Norton [] (ni) 1281 3middot5times10minus19 -(nk) DO Yinnon NRA 1088ndash1291 2middot1times10minus14 110Thin film DO Mikkelsen SIMS 1473ndash1673 2middot6times10minus4 454plusmn30Thin film DO Cawley amp Boyce SIMS 1173ndash1473 2middot8times10minus9 280plusmn10Thin film DO Pfeffer amp Ohring Tracer (room air) 673ndash1073 1middot3times10minus16 64middot8plusmn5middot8Thin film DO Costello amp Tresller [] SIMS 1273 4times10minus15 -Thin film DSi Takahashi et al (1 partial pressure) SIMS 1423ndash1573 8times10minus5 502plusmn77Thin film DSi Mathiot et al SIMS 1273ndash1473 3middot2times10minus3 515Thin film DSi Tsoukalas Tsamis amp Stoemenos SIMS 1323ndash1373 3middot7times10minus6 405Thin film DSi Tsoukalas Tsamis amp Normand SIMS 1323ndash1423 1middot2times10minus4 457plusmn24
Zanottoindd 214 10082007 151906
Physics and Chemistry of Glasses European Journal of Glass Science and Technology Part B Volume 48 Number 4 August 2007 215
fusivities in thin films with those determined by Haul and Duumlmbgen(91) for bulk silica and found them to be 10 to 100 times lower (with activation energy of 454 kJmol between 1473ndash1673 K) Obviously considering the previous discussions for bulk silica glasses impu-rity effects should have been considered Mikkelsen(98) assumed that his results represent a limit for the intrinsic network oxygen (bridging oxygen) diffu-sivity in silica glass It is also important to note the comparison of results of Mikkelsen(98) [EO=454plusmn30 kJmol D0=2middot6times10minus4 m2s between 1473ndash1653 K] and Cawley amp Boyle(99) [EO=280plusmn10 kJmol D0=2middot8times10minus9 m2s between 1173ndash1473 K] in Table 3 They used the same technique (SIMS) and observed different results for the diffusivities and activation energies The explanation for such discrepancy probably reflects different impurity contents
Unfortunately the impurity content was not given in most thin film papers Ham amp Helms(100) pointed out that their lsquoslowrsquo diffusion rates for ionic oxygen agree with Mikkelsenrsquos but disagree from Costello amp Tresslerrsquos(101) Oxygen diffusivity measurements of Pfeffer amp Ohring(102) at temperatures below 1423 K in air showed similar results as Costello amp Tresslerrsquos Ham amp Helms believe that this discrepancy in dif-fusivities arises from lsquodrierrsquo conditions Costello amp Tressler(101) did not report the concentration of water in their experiment but a numerical simulation of water exchange during diffusion done by Ham amp Helms suggests that 100 ppm water produced the same profiles what is a typical value for the water content in bulk silica glass type I (Table 1)
From all silicon diffusivities measured in thin films only those of Takahashi et al(103) match the dif-fusivities and activation energies measured by Brebec
et al(85) for bulk silica Data from Mathiot et al(104) lie within one order of magnitude to those of Takahashi et al and those of Brebec et al The diffusivities meas-ured by Takahashi et al did not depend on the oxygen partial pressure (1 or 20) All other silicon results are more than two orders of magnitude higher and almost all refer to non-stoichiometric compositions (unfortunately without chemical analysis more de-tails see Tsoukalas et al(105 106)) This interpretation is supported by the low activation energies found(105106) the difference arising from the defect formation ener-gies of the mediating silicon self diffusion
One could thus consider some of these data(104106) as an upper bound of silicon self diffusion Thus following similar procedure from Figures 10ndash13 the silicon diffusivities of Takahashi et al(103) and Tsoukalas et al(106) in Figure 14 could be viewed as lower and upper limits for silicon diffusion in thin films respectively
One important note is that the oxygen data of Mikkelsen(98) (the smallest values for this anion) are similar to the upper limit of silicon diffusion We speculate here that this result is a mere coincidence because all the several other data for silicon and oxygen indicates that the first diffuses much slower than the second in this glass
In any case it is clear that impurities extremely alter the diffusivity of any ion in a glass former such as silica (in bulk form or thin film) and thus small variations in impurity content could explain the scat-ter of oxygen diffusivities in Figures 10ndash14 even for the same silica type But considering the same silica type experimental data on diffusivities Du Dη and DO (when applicable) are well defined within upper or lower limits in bulk silica or thin films
Proceedings of the eighth international otto schott colloquium Jena germany 23ndash27 July 2006
Figure 14 Self diffusion coefficients of Si and O in thin film silicas Dsi Measured self diffusion coefficients of silicon (closed symbols) Sources Takahashi et al(103) (measurements at 1 and 20 oxygen partial pressure) Mathiot et al(104) and Tsoukalas et al(105106) Do Measured self diffusion coefficients of oxygen (open symbols) Sources Mikkelsen(98) Cawley amp Boyce(99) Costello amp Tressler (101) and Pfeffer amp Ohring(102) Oxygen diffusion is faster than silicon diffusion in all cases except one
50x10-4 60x10-4 70x10-4 80x10-4 90x10-4
-24
-23
-22
-21
-20
-19
-18
-17
-16
-152200 2000 1800 1600 1400 1200
log 10
D (m
2 s)
1T (K 1)
DSi Takahashi et al 1 103
DSi Takahashi et al 20 103
DSi Tsoukalas Tsamis amp Normand 106
DSi Mathiot et al 104
DO Mikkelsen 98
DO Cawley amp Boyce 99
DO Pfeffer amp Ohring 102
DO Costello amp Tressler 101
SiO2 thin film
T (K)
Zanottoindd 215 10082007 151906
216 Physics and Chemistry of Glasses European Journal of Glass Science and Technology Part B Volume 48 Number 4 August 2007
In summary the close similarity of the activation energies and diffusivities determined in three inde-pendent ways silicon self diffusion viscous flow and crystal growth indicates that the required bond breaking and molecular reorientation is comparable for these three kinetic processes In particular it should be emphasized that there is no sign of decou-pling between Dη and DSi down to Tg This similarity ensures that viscosity data may be used to estimate crystal growth rates in silica glasses The present results provide a better understanding of the dynam-ics of transport processes in undercooled silica But it will be important to perform similar analyses from Tm to about Tg for other glass forming silicate liquids to ascertain whether or not the present findings can be generalised
6 Conclusions
To understand the dynamics of several processes in undercooled liquid silica which is an archetypical network glass former has been of long standing interest Here we performed a critical analysis of a plethora of data for silicon and oxygen self-diffusion viscous flow and crystal growth kinetics in different types of commercial silica glasses and thin films in a wide temperature range from circa Tg to Tm which led us to the following conclusionsi Crystal growth rates oxygen self diffusion and viscous flow in this particular system strongly depend on the impurity level much more than in multicomponent silicate glasses For each silica glass type the variations of crystal growth rates between different glass batches (measured by different au-thors) correspond to similar variations observed for viscosity This sensitivity is due to the fact that the purest silica glass has a fully polymerised network (Q4) that is readily disrupted by small amounts of modifier impurity cations ii We confirmed that normal growth is the operative mechanism of crystal growth in the four types of bulk silica glasses analysed in broad temperature ranges The calculated jump distance λ is about 0middot2ndash2middot0 Aring for the different types of silica glasses and these values are of the (expected) order of magnitude of the SindashO distanceiii for type I silica glass the activation energies for viscous flow (590 kJmol) crystal growth (550 kJmol) and silicon self diffusion (580 kJmol) are equal within experimental error But the value for oxygen self dif-fusion is less than half (100ndash300 kJmol) Thus there is no decoupling between Du Dη and DSi and silicon controls the transport mechanism involved in crystal growth and viscous flow in this glassiv The congruence of Du and Dη in all four silica types indicates that the bond breaking and molecular reori-entation mechanism required for crystallisation is the
same required for the atomic transport mechanism that controls viscous flow Then viscosity data can be used to estimate the transport part that controls crystal growth in this glass from the melting point down to Tg
This work with highly polymerised silica glass corroborates a previous analysis carried out for depolymerised diopside glasses and thus provides a step forward in the knowledge of kinetic processes controlling crystal growth in undercooled silicate liquids
Acknowledgements
Special thanks to V M Fokin (Vavilov State Optical Institute Russia) J W P Schmelzer (University of Rostock Germany) and G P Souza (UFSCar Brazil) for reviewing this manuscript Financial support from Brazilian agencies CAPES CNPq and FAPESP are fully appreciated
References 1 Gutzow I In Crystal Growth and Materials Edited by E Kaldis amp H J
Scheel North-Holland Amsterdam 1977 2 Uhlmann D R Uhlmann E V amp Weinberg M C Nucleation and
Crystallisation in Liquids and Glasses The American Ceramic Society Westerville-OH 1993
3 Vogel W Glass Chemistry Springer-Verlag Berlin 1994 4 Gutzow I amp Schmelzer J W P The Vitreous State Springer Berlin
1995 5 Houmllland W amp Beall G Glass Ceramic Technology The American
Ceramic Society Westerville OH 2002 6 Vergano P J amp Uhlmann D R Phys Chem Glasses 1970 11 (2)
39ndash45 7 Meiling G S amp Uhlmann D R Phys Chem Glasses 1967 8 (2)
62ndash3 8 Leedecke C J amp Bergeron C G J Cryst Growth 1976 32 327 9 Burgner L L amp Weinberg M C J Non-Cryst Solids 2001 279 28 10 Nascimento M L F Ferreira E B amp Zanotto E D J Chem Phys
2004 121 8924 11 Reinsch S Muumlller R Nascimento M L F amp Zanotto E D Proc XX
ICG Kyoto 2004 12 Wagstaff F E J Am Ceram Soc 1969 52 650 13 Wagstaff F E J Am Ceram Soc 1968 51 449 14 Bihuniak P P Calabrese A amp Erwin E M J Am Ceram Soc 1983
66 C134 15 Boganov A G Rudenko V S amp Cheremisin I I Proc X Intern Congr
on Glass 1974 Kyoto P 66 16 Dietzel A amp Wickert H Glastech Ber 1956 29 1 17 Hlavac J amp Vaskova L Silikaty 1965 9 237 18 Komarova L A amp Leko V K Elektrotekhn Prom Ser Svetotekhn Izdel
1975 1 2 19 Leko V K amp Komarova L A Neorg Mater 1971 7 2240 20 Leko V K amp Komarova L A Neorg Mater 1975 11 2106 21 Leko V K amp Komarova L A NeorgMater 1975 11 1864 22 Leko V K Komarova L A amp Mazurin O V Neorg Mater 1972 8
1125 23 Leko V K ampKomarova L A Fiz Khim Stekla 1975 1 335 24 Leko V K amp Mazurin O V Svoistva Kvartsevogo Stekla Nauka
Leningrad 1985 25 Vaskova L amp Hlavac J Silikaty 1969 13 211 26 Komarova L A PhD Thesis 1973 Leningrad 27 Leko V K Komarova L A amp Mazurin O V Silikattechnik 1974 25
81 28 Leko V K amp Komarova L A NeorgMater 1974 10 1872 29 Brown S D amp Kistler S S J Am Ceram Soc 1959 42 263 30 Mazurin O V Leko V K amp Komarova L A J Non-Cryst Solids
Proceedings of the eighth international otto schott colloquium Jena germany 23ndash27 July 2006
Zanottoindd 216 10082007 151907
Physics and Chemistry of Glasses European Journal of Glass Science and Technology Part B Volume 48 Number 4 August 2007 217
1975 18 1 31 Pavlova G A Leko V K amp Komarova L A Fiz Khim Stekla 1975
1 149 32 Leko V K amp Komarova L A Neorg Mater 1975 11 1115 33 Aslanova M S Chernov V A amp Kulakov L F Steklo Keram 1974
6 19 34 Amosov A V Leko V K amp Meshcheryakova E V Fiz Khim Stekla
1978 4 416 35 Bihuniak P P J Am Ceram Soc 1983 66 C188 36 Doladugina V S amp Lebedeva R B Fiz Khim Stekla 1993 19 49 37 Hlavac J amp Sen T K Silikaty 1968 12 213 38 Leko V K amp Gusakova N K Fiz Khim Stekla 1977 3 226 39 Leko V K amp Meshcheryakova E V Fiz Khim Stekla 1975 1 264 40 Orii K Hara Y Akiyama T Tsukuma K amp Kikuchi Y Ceram Abstr
1997 76 30 41 Whitworth C R Bunnell L amp Brown S D In Front Glass Sci Technol
Sheffield 1970 P 87 42 Mackenzie J D Phys Chem Glasses 1962 3 (2) 50ndash3 43 Yovanovitch J C R Acad Sci (Compt Rend) 1961 253 853 44 Bowen D W amp Taylor R W Am Ceram Soc Bull 1978 57 818 45 Clasen R Hornfeck M amp Rosenbaum S Proc XVII Int Congr on
Glass Beijing 1995 Vol 5 181 46 Donadieu P Jaoul O amp Kleman M Philos Mag A 1985 52 5 47 Dunn S A Am Ceram Soc Bull 1968 47 554 48 Gusakova N K Leko V K Meshcheryakova E V amp Lebedeva R
B Neorg Mater 1974 10 338 49 Hofmaier G amp Urbain G Sci Ceram 1968 4 25 50 Kimura T Jpn J Appl Phys 1969 8 1397 51 Loryan S G Kostanyan K A Saringyulyan R S Kafyrov V M amp
Bagdasaryan E Kh Elektron Tekh Ser6 Mater 1976 2 53 52 Solomin N V Zh Fiz Khim 1940 14 235 53 Urbain G Bottinga Y amp Richet P Geochim Cosmochim Acta 1982
461061 54 Toshiba Ceramics Co Quartz Glass and Silica Glass 1979 Tokyo 55 Weiss W J Am Ceram Soc 1984 67 213 56 Fontana E H amp Plummer W A Phys Chem Glasses 1966 7 (4)
139ndash46 57 Mazurin O V amp Klyuev V P Neorg Mater 1974 10 1115 58 Bruckner R Glastech Ber 1964 37 413 59 Bruisten P M amp van Dam H B B Proc First Int Conf Fundamentals
of Glass Manufacturing Process Sheffield 1991 P 18 60 Clasen R amp Hermann W Boll Soc Espan Ceram Vidrio Proc XVI Int
Congr on Glass Madrid 1992 Vol 31-c P 233 61 Donnadieu P J Non-Cryst Solids1988 99 113 62 Leko V K Properties of Silica Glasses Institute of Silicate Chemistry
Odoevskogo 242 St Petersburg Russia 63 Leko V K amp Meshcheryakova E V Fiz Khim Stekla 1976 2 317 64 Leko V K amp Meshcheryakova E V Fiz Khim Stekla 1976 2 311 65 Mazurin O V Klyuev V P Leko V K amp Meshcheryakova E V Fiz
Khim Stekla 1975 1 371 66 Pavlova G A amp Amatuni A N Neorg Mater 1975 11 1686 67 Paek U C Schroeder C M and Kurkjian C R Glass Technology 1988
29 (6) 263ndash6 68 Hagy H E J Am Ceram Soc 1963 46 93 69 Scherer G W Glastech Ber 1983 56K 834 70 Schultz P C J Am Ceram Soc 1976 59 214 71 Ohashi M Tateda M Tajima K amp Shiraki K Electron Lett 1992
28 1008 72 Shiraki K Ohashi M Tajima K Tateda M amp Tsujikawa K Electron
Lett 1993 29 1263 73 Tajima K Tateda M amp Ohashi M J Lightwave Technol 1994 12
411 74 Mazurin O V Leko V K amp Komarova L A J Non-Cryst Solids
1975 18 1 75 Leko V K Meshcheryakova E V Gusakova N K amp Lebedeva R B
Opt Mekh Prom 1974 12 42 76 Leko V K Meshcheryakova E V amp Gusakova N K Neorg Mater
1975 11 130 77 Leko V K amp Gusakova N K Fiz Khim Stekla 1977 3 226 78 SciGlass 50 SciGlass Dictionary (1996ndash2002) Scivision 79 Nascimento M L F amp Zanotto E D Phys Rev B 2006 73 024209 80 Jackson K A In Growth and Perfection of Crystals Edited by R H
Doremus B W Roberts amp D Turnbull Wiley New York 1958 81 Mai C Sekkat A Etienne S amp Perez J Proc Second Int Conf Fun-
damentals in Glass Science and Technology 1993 P 447 82 Nassau K Levy R A amp Chadwick D L J Electrochem Soc 1985
132 409 83 Yongman R E Kieffer J Bass J D amp Dufrene L J Non-Cryst Solids
1997 222 190 84 Herron L W amp Bergeron C G Phys Chem Glasses 1978 19 (4)
89ndash94 85 Brebeacutec G Seguin R Sella C Bevenott J amp Martin J C Acta Met
1980 28 327 86 Clark T M Grandinetti P J Florian P amp Stebbins J F Phys Rev B
2004 70 064202 87 Jorgensen P J amp Norton F J Compt Rend VII Congr Intern du Verre
Bruxelles 1965 Vol 2 1965 P 310 88 Kalen J D Boyce R S amp Cawley J D J Am Ceram Soc 1991 74
203 89 Williams E L J Am Ceram Soc 1965 48 190 90 Muehlenbachs K amp Schaeffer H A Canad Mineral 1977 15 179 91 Haul R amp Duumlmbgen G Z Elektrochem 1962 66 636 92 Sucov E J Am Ceram Soc 1963 46 14 93 Yinnon H PhD Thesis 1977 Case Western Reserve University 94 Schaeffer H A J Non-Cryst Solids 1980 38ndash39 545 95 Kajihara K Miura T Kamioka H Hirano M Skuja L amp Hosono H
J Ceram Soc Jpn 2004 112 559 96 Norton F J Nature 1961 191 701 97 Hetherington G amp Jack K H Phys Chem Glasses 1964 5 (5)
147ndash51 98 Mikkelsen J C Appl Phys Lett 1984 45 1187 99 Cawley J D amp Boyce R S Philos Mag A 1988 58 589 100 Ham C J amp Helms C R J Appl Phys 1986 59 1767 101 Costello J A amp Tressler R E J Electrochem Soc 1984 131 1944 102 Pfeffer R amp Ohring M J Appl Phys 1981 52 777 103 Takahashi T Fukatsu S Itoh K M Uematsu M Fujiwara A
Kageshima H Takahashi Y amp Shiraishi K J Appl Phys 2003 93 3674
104 Mathiot D Schunk J P Perego M Fanciulli M Normand P Tsamis C amp Tsoukalas D J Appl Phys 2003 94 2136
105 Tsoukalas D Tsamis C amp Stoemenos J Appl Phys Lett 1993 63 3167
106 Tsoukalas D Tsamis C amp Normand P J Appl Phys 2001 89 7809
Proceedings of the eighth international otto schott colloquium Jena germany 23ndash27 July 2006
Zanottoindd 217 10082007 151907
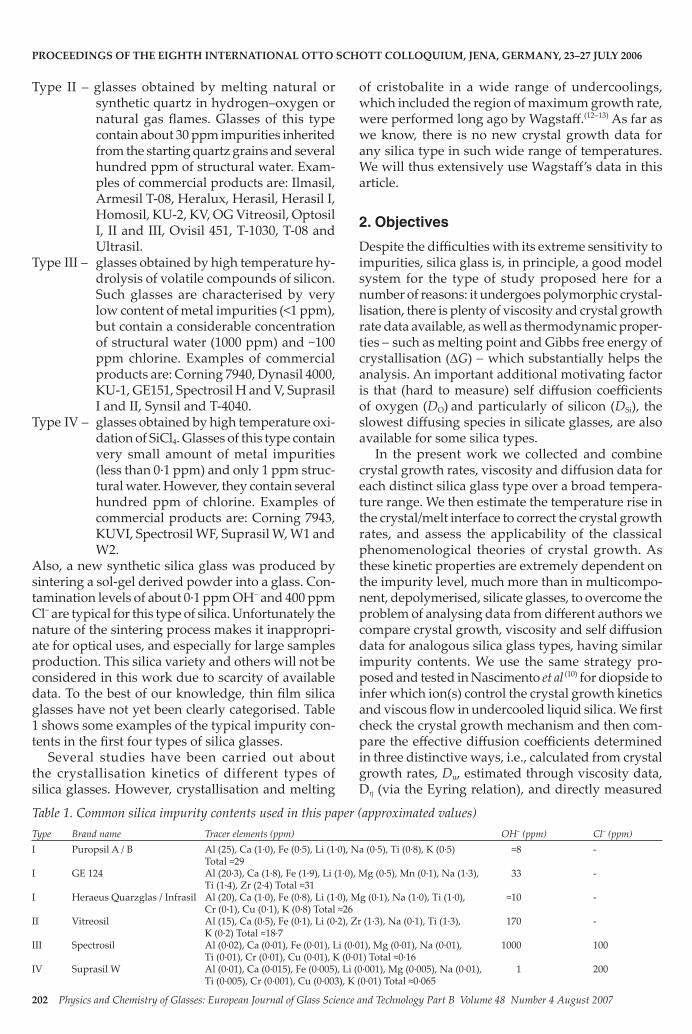
202 Physics and Chemistry of Glasses European Journal of Glass Science and Technology Part B Volume 48 Number 4 August 2007
Type II ndash glasses obtained by melting natural or synthetic quartz in hydrogenndashoxygen or natural gas flames Glasses of this type contain about 30 ppm impurities inherited from the starting quartz grains and several hundred ppm of structural water Exam-ples of commercial products are Ilmasil Armesil T-08 Heralux Herasil Herasil I Homosil KU-2 KV OG Vitreosil Optosil I II and III Ovisil 451 T-1030 T-08 and Ultrasil
Type III ndash glasses obtained by high temperature hy-drolysis of volatile compounds of silicon Such glasses are characterised by very low content of metal impurities (lt1 ppm) but contain a considerable concentration of structural water (1000 ppm) and ~100 ppm chlorine Examples of commercial products are Corning 7940 Dynasil 4000 KU-1 GE151 Spectrosil H and V Suprasil I and II Synsil and T-4040
Type IV ndash glasses obtained by high temperature oxi-dation of SiCl4 Glasses of this type contain very small amount of metal impurities (less than 0middot1 ppm) and only 1 ppm struc-tural water However they contain several hundred ppm of chlorine Examples of commercial products are Corning 7943 KUVI Spectrosil WF Suprasil W W1 and W2
Also a new synthetic silica glass was produced by sintering a sol-gel derived powder into a glass Con-tamination levels of about 0middot1 ppm OHminus and 400 ppm Clminus are typical for this type of silica Unfortunately the nature of the sintering process makes it inappropri-ate for optical uses and especially for large samples production This silica variety and others will not be considered in this work due to scarcity of available data To the best of our knowledge thin film silica glasses have not yet been clearly categorised Table 1 shows some examples of the typical impurity con-tents in the first four types of silica glasses
Several studies have been carried out about the crystallisation kinetics of different types of silica glasses However crystallisation and melting
of cristobalite in a wide range of undercoolings which included the region of maximum growth rate were performed long ago by Wagstaff(12ndash13) As far as we know there is no new crystal growth data for any silica type in such wide range of temperatures We will thus extensively use Wagstaffrsquos data in this article
2 Objectives
Despite the difficulties with its extreme sensitivity to impurities silica glass is in principle a good model system for the type of study proposed here for a number of reasons it undergoes polymorphic crystal-lisation there is plenty of viscosity and crystal growth rate data available as well as thermodynamic proper-ties minus such as melting point and Gibbs free energy of crystallisation (∆G) minus which substantially helps the analysis An important additional motivating factor is that (hard to measure) self diffusion coefficients of oxygen (DO) and particularly of silicon (DSi) the slowest diffusing species in silicate glasses are also available for some silica types
In the present work we collected and combine crystal growth rates viscosity and diffusion data for each distinct silica glass type over a broad tempera-ture range We then estimate the temperature rise in the crystalmelt interface to correct the crystal growth rates and assess the applicability of the classical phenomenological theories of crystal growth As these kinetic properties are extremely dependent on the impurity level much more than in multicompo-nent depolymerised silicate glasses to overcome the problem of analysing data from different authors we compare crystal growth viscosity and self diffusion data for analogous silica glass types having similar impurity contents We use the same strategy pro-posed and tested in Nascimento et al (10) for diopside to infer which ion(s) control the crystal growth kinetics and viscous flow in undercooled liquid silica We first check the crystal growth mechanism and then com-pare the effective diffusion coefficients determined in three distinctive ways ie calculated from crystal growth rates Du estimated through viscosity data Dη (via the Eyring relation) and directly measured
Table 1 Common silica impurity contents used in this paper (approximated values)Type Brand name Tracer elements (ppm) OHminus (ppm) Clminus (ppm)I Puropsil A B Al (25) Ca (1middot0) Fe (0middot5) Li (1middot0) Na (0middot5) Ti (0middot8) K (0middot5) asymp8 - Total asymp29I GE 124 Al (20middot3) Ca (1middot8) Fe (1middot9) Li (1middot0) Mg (0middot5) Mn (0middot1) Na (1middot3) 33 - Ti (1middot4) Zr (2middot4) Total asymp31 I Heraeus Quarzglas Infrasil Al (20) Ca (1middot0) Fe (0middot8) Li (1middot0) Mg (0middot1) Na (1middot0) Ti (1middot0) asymp10 - Cr (0middot1) Cu (0middot1) K (0middot8) Total asymp26II Vitreosil Al (15) Ca (0middot5) Fe (0middot1) Li (0middot2) Zr (1middot3) Na (0middot1) Ti (1middot3) 170 - K (0middot2) Total asymp18middot7III Spectrosil Al (0middot02) Ca (0middot01) Fe (0middot01) Li (0middot01) Mg (0middot01) Na (0middot01) 1000 100 Ti (0middot01) Cr (0middot01) Cu (0middot01) K (0middot01) Total asymp0middot16IV Suprasil W Al (0middot01) Ca (0middot015) Fe (0middot005) Li (0middot001) Mg (0middot005) Na (0middot01) 1 200 Ti (0middot005) Cr (0middot001) Cu (0middot003) K (0middot01) Total asymp0middot065
Proceedings of the eighth international otto schott colloquium Jena germany 23ndash27 July 2006
Zanottoindd 202 10082007 151859
Physics and Chemistry of Glasses European Journal of Glass Science and Technology Part B Volume 48 Number 4 August 2007 203
self diffusion coefficients of silicon and oxygen for each silica glass type Our aim is to assess which ions or lsquomolecular unitsrsquo control viscous flow and crystal-lisation rates Another point we wanted to verify is if the (often used) viscosity coefficient is capable of describing molecular transport at the crystalliquid interface during crystal growth
We thus analyse the transport mechanism that controls crystal growth kinetics and viscous flow in undercooled liquid silica in detail in a wide tempera-ture range using independent reliable experimental data on the thermodynamic driving force viscosity diffusion coefficients and crystal growth rates As the diffusion mechanisms involved in crystal nucleation and growth are unknown for most glasses we go deeper into this question by relating crystal growth kinetics with both viscous flow and directly measured diffusion data Following a previous work that fo-cused only in the diffusion process on type I silica(79) this paper addresses the subsequent question do crystal growth rates diffusivities and viscous flow have different behaviours in the various silica glass types Finally we test the influence of impurities on the oxygen and silicon self diffusion in bulk and thin film silica glasses
3 Theory
Three phenomenological models are frequently used to describe crystal growth kinetics controlled by atomic or molecular rearrangements at the crystal-liquid interface normal growth screw dislocation growth and growth controlled by 2D surface nuclea-tion(1) According to Jacksonrsquos treatment of the inter-face(80) materials with small entropy of fusion such as silica (ΔSm=0middot46R R is the gas constant in Jmol K) are expected to exhibit crystal growth kinetics of the form predicted by the normal growth model
According to the normal model the interface is rough on an atomic or molecular scale Growth takes place at step sites intersecting the interface and the growth rate u may be expressed by
u f D GRT
= - -EcircEumlAacute
ˆmacr
Egrave
IcircIacute
˘
˚˙
u
l1 exp D
(1)
where Du is an effective diffusion coefficient (m2s) of the (unknown) species that controls atomic or molecular attachment at the interface λ is the (un-known) diameter of the diffusing building molecules (m) which is equivalent to the jump distance the lattice parameter or the unit distance advanced by the interface ∆G is the free energy change upon crystallisation (Jmol) T is the absolute temperature (K) and f is the fraction of preferred growth sites on the interface that is close to unity
To interpret experimental data with respect to
the kinetic models described above it is necessary to evaluate the diffusivity Du This parameter can be estimated with the Eyring (or StokesndashEinstein) equa-tion assuming that the molecular motions required for interfacial rearrangements controlling crystal growth is similar to those controlling viscous flow in the bulk liquid DucongDη Hence
D k Th lh
= B (2)
where η is the shear viscosity (Pa s) and kB is the Boltz-mann constant The Eyring (E) and StokesndashEinstein (SE) equations differ only by a factor of 3π The SE expression describes a moving solid sphere with radius r in a viscous liquid Thus for silicate glasses most authors prefer the Eyring equation because the physical meaning of λ the jump distance is most appropriate (Equation (2)) Nevertheless the overall conclusions of this paper would not be altered if we employed the SE equation
It has been a matter of strong discussion if the Eyring equation can be used for calculations of crystal growth kinetics especially at deep undercoolings below 1middot2Tg where it has been suggested that this equation fails (eg see Ref 10 and references cited therein) In this paper the Eyring equation (Equa-tion (2)) is supposed to be valid from near melting to temperatures well below asymp1middot2Tg covering thus a wide temperature range
It is clear from the above discussion that one needs to know the glass viscosity as a function of tempera-ture and other experimental parameters such as ∆Hm (or ∆G) and Tm to compute crystal growth rates to compare theoretical predictions with experimental results The melting enthalpy ∆Hm of silica is ap-proximately 7680 Jmol(12ndash13) The energy barrier ∆G can be estimated in two ways by the Thomson Turnbull (Equation (3a) or Hoffman (Equation (3b)) approximations These give an upper and lower bound to ∆G respectively
DG H T TT
= -( )m m
m (Thomson) (3a)
DG H T T TT
= -( )m m
m2
(Hoffman) (3b)
As previous results(10) of a kinetic analysis obtained by these two approximations (Equations (3andashb)) are almost identical in a wide temperature range here we use only Thomsonrsquos (Equation (3a))
4 Results
41 Available crystal growth rates in the literature Figures 1ndash4 show that the crystal growth rates in silica glasses(12ndash33) are strongly influenced by the
Proceedings of the eighth international otto schott colloquium Jena germany 23ndash27 July 2006
Zanottoindd 203 10082007 151902
204 Physics and Chemistry of Glasses European Journal of Glass Science and Technology Part B Volume 48 Number 4 August 2007
impurity content ie glasses from different sources show widely distinct growth kinetics Fortunately the exact types of silica glasses used here were reported except for three particular cases For the other glasses we inferred the types from the fabrication procedure total impurity content water level or commercial brand name according to Sciglass 50(78)
Figure 1 shows two limiting sets of crystal growth rates and an intermediate one for type I silicas Wag-staffrsquos data(1213) which also includes the maximum umax span over two orders of magnitude and show the slowest u among all type I glasses He used a glass with the following impurities in ppm Al2O3 (137)
Fe2O3 (5) TiO2 (3) CaO (8) MgO (4) K2O (2) Na2O (27) and Li2O (0middot7) The OHminus content in type I glass is typically below 30 ppm as demonstrated in Table 1 Wagstaff observed some crystals growing in the glass interior His samples were prepared by cutting cubes from a piece that had been treated for 70 h at 1773 K to develop internal crystallisation centres (which were probably catalysed on solid heterogeneities) The ki-netics of crystal growth and melting were determined by measuring the incremental dimensional change of any selected crystal occurring after further heat treatment This technique required the removal of surface devitrification and polishing of two opposite
Figure 1 Crystal growth rates of type I silica glasses The lines are fitted curves using the normal growth equation with λ=0middot16 and 2 Aring corresponding to two crystal growth regimes fastest (dashed line) and slowest (full line) using the lowest and highest viscosity data for each case respectively ndash see discussion
Figure 2 Crystal growth rates of type II silica glasses The lines are fitted curves using the normal growth model with λ=0middot26 and 0middot15 Aring corresponding to the fastest (dashed line) and slowest (full line) crystal growth rates using the lowest and highest viscosity data for each case respectively ndash see discussion
Proceedings of the eighth international otto schott colloquium Jena germany 23ndash27 July 2006
1300 1400 1500 1600 1700 1800 1900 200010-14
10-13
10-12
10-11
10-10
10-9
10-8
10-7
10-61100 1200 1300 1400 1500 1600 1700
Gro
wth
rate
u (m
s)
Temperature T (K)
Bihuniak et al 14
Boganov et al 15
Dietzel amp Wickert 16
Hlavac amp Vaskova 17
Hlavac amp Vaskova 17
Komarova amp Leko 18
Leko et al 22-23
Leko amp Komarova 19
Leko amp Komarova 20
Leko amp Komarova 21
Leko amp Mazurin 24
Vaskova amp Hlavac 25
Wagstaff 12
Wagstaff 13
SiO2 Type I fast
slow
T (oC)
1300 1400 1500 1600 1700 1800 1900 200010-14
10-13
10-12
10-11
10-10
10-9
10-8
10-7
10-61100 1200 1300 1400 1500 1600 1700
Gro
wth
rate
u (m
s)
Temperature T (K)
Komarova 26
Leko et al 27
Leko et al 27
Leko amp Komarova 28
Leko amp Komarova 28
Leko amp Komarova 28
Leko amp Mazurin 24
Leko amp Mazurin 24
SiO2 Type II
fast
slow
T (oC)
Zanottoindd 204 10082007 151902
Physics and Chemistry of Glasses European Journal of Glass Science and Technology Part B Volume 48 Number 4 August 2007 205
faces before microscopic measurementsFigure 2 refers to type II silica and shows two
different data sets Figure 3 also shows two data sets for type III glass the same as Figure 4 for type IV glass
For type I glasses we used data from the follow-ing sources Bihuniak et al(14) measured the thickness of crystallized layers using an optical microscope at 1623 K Boganov et al(15) used the same technique at 1673 K while Dietzel amp Wickert(16) measured u at 1823 K Hlavac amp Vaskova(17) measured the crystal-line layer in two type I quartz glasses denominated Czechoslovakian and French [] between 1573ndash1773
K Komarova amp Leko(18) used a KI type I glass Leko amp Komarova(19) also used KI glass and two other type I silica glasses(20ndash21) Leko et al(22ndash23) used an unknown type I silica glass Judging from the water content Leko amp Mazurin(24) probably used a type I silica glass Vaskova amp Hlavac(25) measured the growth of the crystal layer between 1573ndash1673 K Wagstaff(12ndash13) used a type I SiO2 glass
Regarding type II SiO2 glass Komarova(26) melted some glasses and studied the crystal growth rates on the sample surfaces Leko et al(27) measured the crystallized thickness in a KU-2 tube and block glass [] Leko amp Komarova(28) also used a KU-2 type
Figure 3 Crystal growth rates of type III silica glasses The lines are fitted curves using the normal growth model with λ=0middot3 and 1 Aring corresponding to fastest (dashed) and slowest (full line) crystal growth regimes In this case we used the general viscosity curve corresponding to this glass type ndash see discussion
Figure 4 Crystal growth rates of type IV silica glass The lines are fitted curves using the normal growth model with λ=0middot77 and 0middot8 Aring corresponding to fastest (dashed) and slowest (full line) crystal growth rates using the lowest and highest viscosity data for each case respectively ndash see discussion
Proceedings of the eighth international otto schott colloquium Jena germany 23ndash27 July 2006
1300 1400 1500 1600 1700 1800 1900 200010-14
10-13
10-12
10-11
10-10
10-9
10-8
10-7
10-61100 1200 1300 1400 1500 1600 1700
SiO2 Type III
Brown amp Kistler 29
Komarova 26
Leko amp Komarova 32
Leko amp Komarova 32
Leko amp Komarova 32
Mazurin et al 30
Pavlova et al 31
Gro
wth
rate
u (m
s)
Temperature T (K)
fastslow
T (oC)
1300 1400 1500 1600 1700 1800 1900 200010-14
10-13
10-12
10-11
10-10
10-9
10-8
10-7
10-61100 1200 1300 1400 1500 1600 1700
SiO2 Type IV
Brown amp Kistler 29
Leko amp Mazurin 24
Leko amp Mazurin 24
Leko amp Mazurin 24
Leko amp Mazurin 24
Leko amp Komarova 27
Gro
wth
rate
u (m
s)
Temperature T (K)
fast
slow
T (oC)
Zanottoindd 205 10082007 151902
206 Physics and Chemistry of Glasses European Journal of Glass Science and Technology Part B Volume 48 Number 4 August 2007
II glass at 1673 K and 1723 K [] and a third type II glass between 1373ndash1673 K [] Leko amp Mazurin(24) measured u between 1273ndash1673 K using two different type II [] silica glasses
Regarding type III SiO2 glass Brown amp Kistler(29) Mazurin et al(30) and Pavlova(31) used Corning 7940 glass Komarova(26) synthesed hers in vapor phase in a hydrogenndashoxygen flame using SiCl4 Leko amp Komarova(32) also used two KU-1 [] and a Corning 7940 glass []
Finally regarding type IV SiO2 glass Leko et al(27) used a KUVI glass made by synthesis in vapor phase in oxygen-containing SiCl4 plasma Leko amp Mazurin(24) measured the crystal layer between 1273ndash1673 K [ ] in four (estimated) type IV silica glasses Brown amp Kistler(29) used a Cab-O-Sil-lsquo0rsquo glass and studied the growth rate of the crystal layer on the glass surface We are not aware of crystal growth measurements in Type V and in silica glass films
42 Viscosity data from the literature
As regards to viscosity data we followed the same procedure used to analyse crystal growth rates For type I glasses we considered data from the following authors Amosov et al(34) used a SiO2 glass Bihuniak(35) used a type I glass estimated according to impurity type and level Doladugina amp Lebedeva(36) used a KS4V glass Hlavac amp Sen(37) used a type I glass melted between 1050ndash1230degC Leko amp Gusakova(38) used a KU-1 glass and measured η at 1130degC Leko amp Meshcheryakova(39) used a KI type I glass Orii et al(40) probably used a type I glass at 1200degC All these au-thors measured the glass viscosity by the beam bend-ing method The fibre elongation method was used by Whitworth et al(41) with a Vitreosil infrared glass at 1139degC by Mackenzie(42) that measured viscosity at 1228 1276 and 1327degC and by Yovanovitch(43) that used a type I SiO2 glass between 1000ndash1200degC Bowen amp Taylor(44) used a GE 124 glass and measured the viscosity by the falling ball method between 2085ndash2310degC Clasen et al(45) performed viscosity measurements by the torsion method between 1480ndash1570degC Donadieu et al(46) measured viscosity between 1000ndash1360degC but these data were not considered here because they were obtained under a compressive stress of about 1 kbar Dunn(47) made measurements by a concentric cylinder viscosimeter with tungsten crucible and spindle between 1810ndash2250degC but did not disclose the specific glass type Gusakova et al(48) used a KI glass melted from artificial quartz (type I) and made viscosity measurements by a rotating viscometer with Mo rotating bodycrucible and also by the beam bending method [] Both techniques were also utilised by Leko et al(75) that used some KI glasses from rock crystal made artificial crystal [] and synthetic cristobalite [] Leko et al(76) also meas-
ured η from natural quartz and other two estimated silica I types [ ] between 1100ndash2000degC Hoffmaier amp Urbain(49) used a type I silica glass by melting in vacuum and performed viscosity measurements by the compression method Kimura(50) used a Vitr-eosil IR type I glass and measured viscosity by the beam bending and fibre elongation methods at 1100 and 1200degC Loryan et al(51) used a type I glass and measured viscosity by penetration rotating methods between 1300ndash2000degC A rotating viscosimeter was employed by Solomin(52) that used a type I glass and measured η between 1720ndash2000degC and by Urbain et al(53) that probably used a type I glass and performed viscosity measurements in vacuum and argon atmos-pheres Toshiba Ceramics Co(54) researchers used a special T-2030 type I glass and measured η between 1097ndash1394degC Weiss(55) used a Vitreosil IR and a GE 214 [] type I glass using the torsion method in a wide temperature range Brebec et al(85) used a commercial Puropsil A type I with impurity content similar to Puropsil B presented at Table 1
For type II SiO2 glass the beam bending technique was applied by Amosov et al(34) using artificial quartz and gas flame by Fontana amp Plummer(56) (Armesil glass) by Mazurin amp Klyuev(57) and by Leko et al(75) that used a KU-2 glass and measured the viscosity between 1100ndash1300degC Aslanova et al(33) probably used a type II (gas flame) and measured viscosity by the counterbalanced method in a Mo crucible Bruck-ner(58) used a Homosil type II glass and the rotating viscosimeter with coaxial Ir cylinders (1686ndash2007degC) Bruisten amp van Dam(59) and Clasen amp Hermann(60) used Herasil III glass and measured η by the fibre elonga-tion and torsion methods Donadieu(61) probably used a type II SiO2 glass Gusakova et al(48) used a KU-2 type II glass and measured viscosity by a rotating viscometer with a Mo rotating body and crucible and also with the beam bending method Leko(62) used a type II silica glass with no indication of the measurement technique Leko amp Meshcheryakova(63) ndash and also in Leko et al(64) ndash probably used two dif-ferent type II silica glasses melted from glass flame and artificial quartz The measurement of viscosity was carried out using the spring extension and beam-bending methods [] between 1090ndash1176degC Loryan et al(51) used a type II glass and measured viscosity by the penetration method between 1100ndash2000degC Mazurin et al(65) probably used type II glasses from artificial quartz and from crystobalite [] melted by glass flame method and measured η by a rotating viscosimeter with Mo rotating body and crucible Pavlova amp Amatuni(66) used a KV type II glass with no indication of experimental procedure Researchers at Toshiba Ceramics Co(54) used a special T-1030 type II glass with no indication of the viscosity measure-ment method used between 1097ndash1394degC Weiss(55) measured Herasil I Vitreosil OG [] and Ovisil 451
Proceedings of the eighth international otto schott colloquium Jena germany 23ndash27 July 2006
Zanottoindd 206 10082007 151903
Physics and Chemistry of Glasses European Journal of Glass Science and Technology Part B Volume 48 Number 4 August 2007 207
[] type II SiO2 glasses using the torsion method in wide temperature ranges
For type III SiO2 glass Brown amp Kistler(29) and Paek et al(67) (Suprasil II between 1895ndash2150degC) used the fi-bre elongation method Hagy(68) (1099ndash1219degC) Maz-urin et al(74) (1015ndash1250degC) Doladugina amp Lebedeva(36) (1050ndash1200degC) Mazurin amp Klyuev(57) (978ndash1125degC) Scherer(69) (1195ndash1275degC) and Schultz(70) (at 986 and 1064degC with a Corning 7940 glass) all applied the beam bending method Gusakova et al(48) used a rotat-ing viscometer using Mo rotating bodycrucible and beam bending methods 1080ndash1850degC and a KU-1 type III glass Kimura(50) used a Spectrosil glass and
beam bendingfibre elongation methods at 1000 1065 and 1100degC Leko et al(75) used a KU-1 glass and beam bending and rotating methods for measurements between 1100ndash2000degC Leko(62) presented no indica-tion viscosity measurements but measured between 1080ndash1940degC Loryan et al(51) utilised the penetration and rotating methods between 1100ndash2000degC Re-searchers at Toshiba Ceramics Co(54) used a specially T-4040 type III glass measured between 1097ndash1394degC Weiss(55) used Suprasil I and Synsil [] type III silica glasses and the torsion method in a wide temperature range
For type IV SiO2 glass Leko(62) and Leko amp Gu-
Figure 5 Viscosity data of type I silica glasses The lines are Arrhenius fits and correspond to the highest (dotted) and lowest viscosities (dashed) see discussion
Figure 6 Viscosity data of type II silica glasses The lines are Arrhenius fits that correspond to highest (dotted) and lowest viscosities (dashed) curves see discussion
Proceedings of the eighth international otto schott colloquium Jena germany 23ndash27 July 2006
40x10-4 50x10-4 60x10-4 70x10-4 80x10-4
2
3
4
5
6
7
8
9
10
11
12
13
14
2700 2400 2100 1800 1500
SiO2 Type I
Leko et al 75
Leko et al 75
Leko et al 76
Leko et al 76
Leko et al 76
Leko amp Meshcheryakova 39
Loryan et al 51
Mackenzie 42
Orii et al 40
Solomin 52
Toshiba Ceramics 54
Urbain et al 53
Weiss 55
Weiss 55
Whitworth et al 41
Yovanovitch 43
log 10
(P
as)
1T (K 1)
high
low
Amosov et al 34
Bihuniak 35
Bowen amp Taylor 44
Brebec et al 85
Brown amp Kistler 29
Clasen et al 45
Doladugina amp Lebedeva 36
Donadieu et al 46
Dunn 47
Gusakova et al 48
Gusakova et al 48
Hlavac amp Sen 37
Hoffmaier amp Urbain 49
Kimura 50
Leko amp Gusakova 38
Leko et al 75
T (K)
40x10-4 50x10-4 60x10-4 70x10-4 80x10-4
2
3
4
5
6
7
8
9
10
11
12
13
14
2750 2500 2250 2000 1750 1500 1250
SiO2 Type II
Amosov et al 34
Aslanova et al 33
Bruckner 58
Bruisten amp van Dam 59
Clasen amp Hermann 60
Donadieu 61
Fontana amp Plummer 56
Gusakova et al 48
Loryan et al 51
Leko et al 75
Leko 62
Leko amp Meshcheryakova 63
Leko amp Meshcheryakova 64
Mazurin amp Klyuev 57
Mazurin et al 65
Mazurin et al 65
Pavlova amp Amatuni 66
Toshiba Ceramics 54
Weiss 55
Weiss 55
Weiss 55
log 10
(Pa
s)
1T (K 1)
high
low
T (K)
Zanottoindd 207 10082007 151903
208 Physics and Chemistry of Glasses European Journal of Glass Science and Technology Part B Volume 48 Number 4 August 2007
sakova(77) probably used type IV silica glasses but did not indicate the measurement procedure The fibre elongation method was used by Ohashi et al(71) between 1295ndash1460degC Shiraki et al(72) used the fibre drawing method 1823ndash1980degC Tajima et al(73) did not indicate the measurement procedure but measured η between 1380ndash1450degC
Figures 5ndash8 show that as for the crystal growth rates the viscosities of the different types of silica glasses(34ndash77) vary significantly and are strongly af-fected by impurities Their effect is very similar in magnitude to that on the crystal growth rates The lines shown on each graph correspond to an Arrhe-nius expression of the type log10η=A+BT with η in Pa s T in K A and B are constants
Figures 5 and 6 show several data sets for type
I and type II silica glasses respectively but in our analysis we only considered the highest and the lowest viscosities For type IV silica glass Figure 8 shows that two data sets can be distinguished Figure 7 shows an almost unique behaviour for all different glasses of type III The variation of viscosity for this glass type is thus much smaller than that for the other silica glass types
5 Discussion
51 Analyses of crystal growth dataFor all types of silica glasses in the temperature range 1374ndash1420degC we observed the following maximum variations of growth rates between the data of dif-ferent authors for type I=230times at T=1410degC for type II=140times at T=1375degC for type III=30times at T=1420degC and for type IV=20times at T=1400degC In other words within each glass family there is a variation of crystal growth rates of one to two orders of magnitude
Since the measurement of crystal growth rates is quite simple and the typical errors should not exceed 10ndash15 this large scatter indicates that for this particular system u is very sensitive to the im-purity content which includes lsquowaterrsquo and chlorine In particular as expected type I silicas (produced by melting of quartz and containing several impuri-ties) presents a higher scatter of crystal growth rates than type III silicas (prepared from the hydrolysis of silicon compounds) or than type IV silicas (produced by SiCl4 oxidation)
On can speculate that crystal growth kinetics are extremely dependent on the impurity level because the purest silica glasses have a fully polymerised network consisting of Q4 unities (in NMR nota-tion) The addition of impurities breaks some of the bridging SindashOndashSi bonds disrupting the continuous network and producing a distribution of Qn (n=1 2
Proceedings of the eighth international otto schott colloquium Jena germany 23ndash27 July 2006
Figure 7 Viscosity data of type III silica glasses The line is an Arrhenius fit corresponding to all experimental data denominated lsquogeneralrsquo
Figure 8 Viscosity data of type IV silica glasses The lines are Arrhenius fits that correspond to the highest (dotted) and lowest viscosities (dashed) data see discussion
40x10-4 50x10-4 60x10-4 70x10-4 80x10-4
2
3
4
5
6
7
8
9
10
11
12
13
14
2750 2500 2250 2000 1750 1500 1250
SiO2 Type III Brown amp Kistler 29
Doladugina amp Lebedeva 36
Gusakova et al 48
Hagy 68
Kimura 50
Leko et al 75
Leko 62
Loryan et al 51
Mazurin amp Klyuev 57
Mazurin et al 74
Paek et al 67
Scherer 69
Schultz 70
Toshiba Ceramics 54
Weiss 55
Weiss 55
log 10
(P
as)
1T (K 1)
general
T (K)
40x10-4 50x10-4 60x10-4 70x10-4 80x10-4
2
3
4
5
6
7
8
9
10
11
12
13
14
2750 2500 2250 2000 1750 1500 1250
SiO2 Type IV
Leko 62
Leko amp Gusakova 77
Ohashi et al 71
Shiraki et al 72
Tajima et al 73
log 10
(P
as)
1T (K 1)
high
low
T (K)
Zanottoindd 208 10082007 151904
Physics and Chemistry of Glasses European Journal of Glass Science and Technology Part B Volume 48 Number 4 August 2007 209
3) units that strongly affect transport phenomena such as those focused here The small concentration of impurities in type I silicas (for instance circa 30 ppm alkali and 8 ppm OHminus in Puropsil B as cited in Table 1) renders it very difficult to experimentally detect the corresponding small concentrations of Q3 and Q2 and possibly of Q1 units However since the total content of (bond breaking) impurities is below asymp0middot1 it is clear that the percentage of Q4 units remains larger than asymp99middot9 for most silica glasses
52 Analyses of viscosity data
Similar differences are observed for viscosity ie a scatter of about two orders of magnitude for silica types I and II and one order of magnitude for silica types III and IV For instance taking T=1270degC and considering all types of silica glasses the following variation of η is observed 430times for type I 100times for type II 5times for type III and 10times for type IV Consid-ering all the different sourcesauthorstechniques there is thus a clear correspondence between the effect of impurities on the crystal growth rates and viscosities It is clear that the glasses that present the slowest crystal growth rates and highest viscosities have fewer impurities
That is why we combined the slowest crystal growth rates with the highest viscosities and vice versa in our kinetic analysis
53 Crystal growth mechanism in silica types
For stoichiometric (polymorphic) crystallisation as in the present case short range molecular diffusion through the crystalmelt interface is expected to govern crystal growth In most theoretical analyses of crystal growth kinetics in undercooled liquids it is assumed that this type of molecular transport is determined by an effective diffusion coefficient which is linked to the viscosity by the Eyring equation (Equation 2) With the assumption Du=Dη to analyse growth rate data one can thus insert Equation (2) into Equation (1) and use experimental values of η(T) and ∆G(T) calculated by the Thomson equation for instance
However the true size l (and the nature) of the diffusing atoms or lsquobuilding moleculesrsquo in Equations (1) and (2) is unknown One can thus leave l as an ad-justable parameter and fit Equation (1) to the growth rate data For example considering Wagstaffrsquos growth rate data Figure 1 shows a fitted growth rate curve using the normal growth equation (Equation 1 with f=1) and Dη from the Eyring equation which resulted in λ=2 Aring (solid line see details below)
In summary each crystal growth curve in Figures 1ndash4 was linked to a given viscosity curve (from Figures 5ndash8) in a such a way that the fastest u(T) was combined with the lowest η(T) and vice versa for
each glass type For type III glass a single viscosity curve (denominated lsquogeneralrsquo) was used for all crystal growth rate data The result is that within some deviations the normal growth mechanism describes the kinetics of the four types of silica glasses shown in Figures 1ndash4
54 Arrhenius behaviour and activation energies for viscosity
Figures 5ndash8 show the viscosities of different silica glasses reported by several authors Arrhenius lines log10 η=A+BT fit quite well the data of Figures 5ndash8 in wide temperature ranges
Details of experimental data used were described above The viscosity curves of the four types of silica glasses show Arrhenius-type behaviour and glasses types I and II (having the lowest OHminus content) present the highest viscosities activation energies of viscous flow Eη and Tg (curves denominated lsquohighrsquo viscosity dotted lines) In fact the highest viscosity data for type I glass gives an activation energy for viscous flow Eη=569plusmn5 kJmol which is close to the experimental activation energy reported by Brebec et al(85) for Puropsil A glass (Type I) Eη=591plusmn10 kJmol The lowest viscosities are associated with the lowest activation energies for viscous flow and Tg The ex-ception is type IV glass where the activation energy Eη of the glass having the highest viscosity is similar to that of the glass of lowest viscosity Table 2 sum-marises the activation energies for viscous flow and Tg (considering log10 η(Tg)=12 [in Pathinsps]) for the four silica glass types
55 Link between viscosity and crystal growth rates
It is obvious that for a given glass type the higher the viscosity the smaller the impurity content highest activation energy for viscous flow Eη and highest Tg Surprisingly however the viscosity of sixteen sam-ples measured by different authors for type III glasses shows a variation of only half order of magnitude As the growth rate u and viscosity η are inversely proportional (Equation (1)) similar findings were
Table 2 Approximate values of activation energies for viscous flow Eη calculated from and estimated Tg for each glass type and viscosity regime according to Figures 5ndash8 Silica glass type Viscosity curve Eη (kJmol) Tg (K)Type I lowest 490plusmn13 1337 highest 570plusmn5 1606Type II lowest 520plusmn4 1426 highest 610plusmn4 1583Type III general 450plusmn2 1345Type IV lowest 530plusmn4 1373 highest 520plusmn10 1438
Proceedings of the eighth international otto schott colloquium Jena germany 23ndash27 July 2006
Zanottoindd 209 10082007 151904
210 Physics and Chemistry of Glasses European Journal of Glass Science and Technology Part B Volume 48 Number 4 August 2007
observed for the crystal growth data of Figures 1ndash4 In fact the influence of impurities on the magnitude of the viscosity is quite similar to that in the crystal growth rates in each glass type The relatively small variations of viscosity for glass types III and IV are because they are made from synthetic chemicals and have the smallest variation of impurities structural water and chlorine
56 Glass transition temperatures of different silica glass types
The glass transition temperatures were measured for different silica glasses by a few authors but unfortu-nately most did not indicate the glass types used It should be stressed that experimental measurements by DSC or DTA are difficult with silica glass due to low variation of Cp For instance Mai et al Tg=1495 K(81) (unknown measurement procedure and glass type) Nassau et al Tg=1433 K(82) (by dilatometric measurement but unknown glass type) Youngman et al Tg=1459 K(83) (unknown type and measurement procedure) Another way to compare Tg was by using viscosity measurements ie searching for the tem-perature where the viscosity is 1012 Pa s The results shown in Table 2 are in agreement with measured Tg values The purer the glass the higher is its Tg Thus taking the highest viscosities types I and II glasses have Tg values between 1583 and 1606 K whereas Tg for types I and III glasses using lowest and general regimes respectively is between 1337 and 1345 K
57 The meltcrystal interface temperature during crystallisation
Crystallisation is an exothermic process and knowl-edge of the meltcrystal interface temperature is es-sential in analysing crystal growth kinetics Attempts to calculate the temperature distribution at the inter-face during crystal growth require many simplifying assumptions to solve this complex problem However from direct measurements for several glasses Herron and Bergeron(84) suggested an empirical equation to estimate the meltcrystal interface temperatures in six borates and one silicate glass (Li2O2SiO2) based on experimental measurements that were supposed to be valid around the maximum growth rate Equation (4) was proposed by Herron amp Bergeron for correct-ing of temperature of the interface at the maximum crystal growth umax
ΔTi=17middot12(umaxΔHm)0middot486 (4)
In Equation (4) ∆Ti is the temperature difference between the melt and the interface (degC) umax is the maximum crystal growth rate (cms) and ∆Hm is the melt enthalpy (calcm3) Equation (4) shows that interface temperature corrections for silica is asymp0middot1degC
Thus because of the low value of maximum crystal growth rate (compared to other oxide glasses) and low melting enthalpy such correction was irrelevant for this particular glass
58 Analysis of experimental results considering the normal growth model
From Equations (1) and (2) the expression for normal growth may be written as
u f k T G RT= - -( )EgraveIcirc ˘B
l h2 1 exp D (5)
We assume fasymp1 and η given by the Arrhenius equa-tions fitted for each glass type (data sets from Figures 5ndash8) The normal growth model can be tested in two ways first using all the available data (Figures 1ndash4) taking some groups for which crystal growth kinet-ics are similar or in fine detail for a relatively small undercooling range ∆Tlt380degC using only Wagstaffrsquos data(12ndash13) Thus from all available crystal growth data from different sources the fitted values of the jump-ing distance λ were approximately 1 Aring It would be ideal to use the crystal growth rates and viscosity from samples obtained from the same batch to avoid the influence of impurities but this was not feasible here It was however possible to use data for same silica types combining the lowest viscosities with the highest growth rates and vice versa
Wagstaff(12) studied the temperature dependence of the fraction of preferred growth sites on the crys-talglass interface f At low undercoolings a plot of uR=uη[1minusexp(minus|ΔG|RT)] versus ∆T should yield a straight line parallel to the x-axis(112) and this indeed was observed Thus this appears to be the operative mechanism in this system This type of analysis us-
Proceedings of the eighth international otto schott colloquium Jena germany 23ndash27 July 2006
Figure 9 Normal growth model adjusted to Wagstaffrsquos data for silica glass type I(12ndash13) using Thomsonrsquos approximation for ∆G and the viscosity of Puropsil A(86) The fitted jump distance is 2 Aring
1600 1700 1800 1900 2000
-10x10-9
00
10x10-9
20x10-9
1400 1500 1600 1700
SiO2 Type I
Gro
wth
rate
u (m
s)
Temperature T (K)
Wagstaff 12
Wagstaff 13
T (oC)
Zanottoindd 210 10082007 151905
Physics and Chemistry of Glasses European Journal of Glass Science and Technology Part B Volume 48 Number 4 August 2007 211
ing uR was performed in almost all previous crystal growth studies because this procedure does not need the use of the jumping distance λ
Figure 9 shows that the normal growth model fits quite well Wagstaffrsquos data Fitting with a Leven-bergndashMarquardt nonlinear algorithm resulted in a correlation factor R2=0middot96 The fitting parameter was the jump distance All the other parameters melting enthalpy ∆Hm melting point Tm and viscosity η(T) were independently measured These values were presented by Wagstaff (∆Hm=7680 Jmol Tmasymp2007 K viscosity from Brebec et al(85) (Puropsil A glass) log10η=minus8middot81166+30193middot77T (η in Pathinsps T in K) The resulting fitted value of λ=2 Aring is close to the average SiminusO bond length (1middot59 Aring) in silicate glasses(86) and about 2middot5 times higher than the ionic Si4+ diameter (0middot8 Aring) but somewhat lower than the O2minus (2middot7 Aring) and is thus an acceptable value We should stress that from such fitting of crystal growth rates one can-not calculate the exact value of the jump distance Therefore only the order of magnitude for the size of the lsquostructural unitsrsquo involved in crystallisation is ob-tained because the fitted λ values carry all the errors related to the uncertainties in the other parameters of the normal crystal growth model
59 Activation energies and diffusivities in bulk silica glasses
In most theoretical analysis of crystal growth kinetics in undercooled melts it is assumed that short range
molecular transport through the crystalmelt inter-face is determined by the diffusivity of the slowest species It is also assumed that the effective diffu-sion coefficient of such species can be calculated via the viscosity η by means of the Eyring expression (Equation (2)) This expression thus relates viscos-ity and diffusivity Dη of the rate determining flow unities However it has been a matter of discussion if Equation (2) could be used for such calculations at deep undercoolings near Tg (eg see discussions in Nascimento et al(10)) Our aim here is to compare diffusion coefficients calculated from crystal growth rate data Du from about Tm to asymp1middot2 Tg with those calculated through viscosity Dη and with directly measured diffusion coefficients of silicon and oxygen (when available) for each glass type
Since we now know the governing growth mechanism in silica glass let us analyse the diffusion coefficients in more detail For normal growth one can isolate an effective diffusion coefficient Du from Equation (1) as shown by Equation (6)
D u GRTu = - -Ecirc
EumlAacuteˆmacr
Egrave
IcircIacute
˘
˚˙
-
l 11
exp D
(6)
This parameter can be estimated using the experi-mental growth rate data and λ from the previous fits for each glass type The combination of the slowest crystal growth rates with the highest viscosities (and vice versa) thus yields Du for each silica glass type
Figures 10ndash13 show a good agreement between Du and Dη for all four glass types In addition the calcu-
Figure 10 Logarithm of effective diffusion coefficients in type I silica glasses Du calculated here from the crystal growth rate data of Wagstaff(1213) Boganov(15) Dietzel amp Wieckert(16) and Bihuniak et al(35) using Equation 6 corresponding to the slowest and fastest bounds of Figure 1 Dη Diffusion coefficients calculated by the Eyring equation (Equation 2) Solid line using the viscosity data for Puropsil A silica(85) with λ=2 Aring These diffusivities correspond to the highest viscosity curve of Figure 5 or lower diffusion limit Dashed line using the lowest viscosity curve of Figure 5 with λ=0middot16 Aring the upper diffusion limit DSi and DO Measured self-diffusion coefficients of Si4+(85) and O2minus(889192) (see respective symbols in the insert) dotted lines corresponds to melting (Tm) - as experimentally observed by Wagstaff(1213) - and Tg temperatures of Puropsil A respectively (see text for more details)
Proceedings of the eighth international otto schott colloquium Jena germany 23ndash27 July 2006
50x10-4 60x10-4 70x10-4 80x10-4 90x10-4
-24
-23
-22
-21
-20
-19
-18
-17
-16
-152200 2000 1800 1600 1400 1200
log 10
D (m
2 s)
1T (K 1)
Du Dietzel amp Wieckert 16
Du Bihuniak et al 14
Du Boganov 15
Du Wagstaff 12-13
D Brebec et al 85
D low viscosity curve
DSi Brebec et al 85
DO Kalen et al 88
DO Haul amp Duumlmbgen 91
DO Sucov 92
SiO2 Type I
upper
lower
Tg = 1451 K
Tm = 2007 K
T (K)
Zanottoindd 211 10082007 151905
212 Physics and Chemistry of Glasses European Journal of Glass Science and Technology Part B Volume 48 Number 4 August 2007
lated solid and dashed lines (Dη) correctly describe the temperature dependence of Du These effective diffusivities Dη calculated via viscosity and Du from crystal growth rates could be seen as upper and lower bounds for each silica type (Figures 10ndash13) with a dif-ference of about one order of magnitude but similar temperature dependences In summary the congru-ence of Du and Dη indicates that whatever the bond breaking and molecular reorientation mechanism required for crystallisation is it is the same as that
required for the atomic transport mechanism that controls viscous flow
510 Silicon and oxygen diffusion in different types of silica glasses
Figure 10 shows experimental values of oxygen (O2minus) and silicon (Si4+) diffusivities of type I silica glass in undercooled liquid silica(8587ndash 93) between 1073 and 1703 K Figures 11ndash12 present oxygen diffusivities
Proceedings of the eighth international otto schott colloquium Jena germany 23ndash27 July 2006
Figure 11 Logarithm of effective diffusion coefficients in type II silica glasses Du calculated from crystal growth rate data of Leko amp Mazurin(2464) Komarova(26) Leko et al(27) and Leko amp Komarova(28) using Equation (6) corresponding to the slower and faster bounds of Figure 2 Dη Diffusion coefficients calculated by the Eyring equation (Equation (2)) Solid line using the highest viscosity data of Figure 6 the lower limit for diffusion Dashed line using the lowest viscosity data of Figure 6 the upper diffusion limit both with λ=0middot26 Aring DO Measured self-diffusion coefficients of O2minus(8990) (see respective symbols in the insert)
Figure 12 Logarithm of diffusion coefficients in type III silica glasses Du calculated from crystal growth rate data of Komarova(26) Leko amp Komarova(28) and Brown amp Kistler(29) via Equation 6 corresponding to the slowest and fastest bounds of Figure 3 Dη Diffusion coefficient calculated by the Eyring equation (Equation 2) Dashed line using the lsquogeneralrsquo viscosity data of Figure 7 with λ=0middot3 Aring that could be due to no impurity influence and indicates an upper limit for diffusion The lower bound refers to Du calculated form data from Komarova e Leko amp Komarova (see symbols) DO Measured self-diffusion coefficient of O2minus(87) (see respective symbol in the insert)
50x10-4 60x10-4 70x10-4 80x10-4 90x10-4
-24
-23
-22
-21
-20
-19
-18
-17
-16
-152200 2000 1800 1600 1400 1200
log 10
D (m
2 s)
1T (K 1)
Du Komarova 26
Du Leko et al 27
Du Leko et al 27
Du Leko amp Komarova 28
Du Leko amp Komarova 28
Du Leko amp Komarova 28
Du Leko amp Mazurin 24
Du Leko amp Mazurin 24
D high viscosity curve D low viscosity curve
DO Muehlenbachs amp Schaeffer 90
DO Williams 89SiO2 Type II
upper
lower
T (K)
50x10-4 60x10-4 70x10-4 80x10-4 90x10-4
-24
-23
-22
-21
-20
-19
-18
-17
-16
-152200 2000 1800 1600 1400 1200
log 10
D (m
2 s)
1T (K 1)
Du Brown amp Kistler 29
Du Komarova 26
Du Leko amp Komarova 28
Du Leko amp Komarova 28
D general viscosity curve
DO Jorgensen amp Norton 87
SiO2 Type III
upper
T (K)
Zanottoindd 212 10082007 151906
Physics and Chemistry of Glasses European Journal of Glass Science and Technology Part B Volume 48 Number 4 August 2007 213
corresponding to glass types II and III respectively As far as we know there are no diffusion measure-ments for type IV silica Figure 13 shows Yinnonrsquos data(93) for oxygen diffusivity in an unknown silica type just for comparison An analysis of oxygen self diffusion in SiO2 glass reveals a large scatter of activation energies and pre-exponential factors (Figures 10ndash13)
For type I silica glass DO clearly differs from Du and Dη (but DSi is equal to Du and Dη) Schaeffer(94) suggested that the activation energy for oxygen self diffusion in silica glass is close to 100 kJmol much less than the single bond strength between silicon and oxygen (465 kJmol) Our review of oxygen tracer diffusion in SiO2 glass reveals a larger scatter of activation energies (100ndash300 kJmol) and pre-exponential factors (according to Table 3) but these values are well below 465 kJmol and confirm Schaefferrsquos findings
By analogy with crystal growth rates and viscosi-ties the most important causes for the differences in oxygen diffusion rates in different samples (shown in Figures 10ndash13) are quite likely variations in impurity content But according to Table 3 even for the same glass (Armesil type II) there are some significant differences in the activation energies obtained from different techniques Thus experimental errors from the different techniques employed in each work may also partially explain these discrepant values On the other hand it is absolutely clear from Figures 10ndash13 that despite the scatter the oxygen diffusion coefficients are several orders of magnitude higher than those of silicon and that their temperature de-
pendence (activation energy) are smaller than that for silicon diffusion
It is not trivial to separately characterise transport of oxygen in different chemical forms However recently Kajihara et al(95) distinguished diffusion of molecular oxygen (O2) from other oxygen species in silica glasses using photoluminescence Their results were compared with the oxygen permeation data of Norton(96) and of Hetherington amp Jack(97) The diffusiv-ity of molecular oxygen from these three sources are more than five orders of magnitude larger than those reported in our Figures 10ndash14 for ionic oxygen These slow diffusivities have been attributed to hopping of oxygen ions belonging to the silica glass lattice On the other hand the structure of SiO2 glass is rela-tively open allowing the incorporation of molecular O2 without a significant interaction with the silica lattice and thus oxygen molecules (O2) have much higher diffusivities than oxygen ions We are not dealing with molecular oxygen here but the above discussion indicates that different oxygen types have widely different mobilities An important note is that there is more agreement between molecular oxygen diffusivities from different authors than for the BONBO oxygen diffusivities (and this finding is understandable if one considers varying Qn amounts according to the impurities in each glass as explained below) Therefore impurities do not significantly change molecular oxygen diffusivities but have a strong role on ionic oxygen diffusion and this type of diffusion is of primary interest to this paper
Type I is the unique silica glass for which there are reported data for silicon self diffusion It is ex-
Proceedings of the eighth international otto schott colloquium Jena germany 23ndash27 July 2006
Figure 13 Logarithm of diffusion coefficients in type IV silica glasses Du calculated from Leko amp Mazurin(24) and Leko amp Komarova(27) crystal growth rate data (Equation (6)) corresponding to the slowest and fastest bounds of Figure 4 Dη Diffusion coefficients calculated by the Eyring equation (Equation 2) Solid line using the highest viscosity data of Figure 8 with λ=0middot77 Aring that indicates the lower limit for diffusion Dashed line uses the lowest viscosity data of Figure 8 with λ=0middot8 Aring and indicates the upper limit DO Measured self-diffusion coefficient of O2minus in undetermined silica type(93) (see respective symbols in the insert) nk unidentified vitreous silica type
50x10-4 60x10-4 70x10-4 80x10-4 90x10-4
-24
-23
-22
-21
-20
-19
-18
-17
-16
-152200 2000 1800 1600 1400 1200
log 10
D (m
2 s)
1T (K 1)
Du Leko amp Komarova 27
Du Leko amp Mazurin 24
D high viscosity curve D low viscosity curve
DO Yinnon (nk) 93
SiO2 Type IV
upper
lower
T (K)
Zanottoindd 213 10082007 151906
214 Physics and Chemistry of Glasses European Journal of Glass Science and Technology Part B Volume 48 Number 4 August 2007
tremely difficult to obtain very sluggish diffusion coefficients such as those of Table 3 but Brebec et al(85) managed to measure Si4+ diffusion in silica glass using SIMS (secondary ion mass spectroscopy) The activation energy for Si4+ diffusion in SiO2 glass (Type I Puropsil A) is about 580 kJmol in the temperature range between 1413ndash1683 K According to Figure 10 diffusivity calculated from crystal growth rate (Du) correlates very well with the values calculated from viscosity (Dη) In addition the activation energies for viscous flow (Table 2) are close to the activation energy for silicon diffusion In fact the coincidence of the activation energies for viscous flow and crystal growth with those calculated from self diffusion of silicon but not of oxygen suggests that Si and O do not diffuse together at the same rate during crystal growth
Since silicon and bridging oxygens (BO=SindashOminusSi) are tightly linked one might argue why the diffu-sivities of these two network building species are so different A reasonable explanation is that Si and O do not diffuse together at the same rate or when one measures oxygen diffusivity in silica in reality only the movement of nonbridging oxygens (NBO=SindashOndashM where M refer to impurity elements in the glass) which are not so tightly bound to the silicon tetra-hedra are being measured because NBO can move much faster than BO This proposal is consistent with the conclusions of Kalen et al(88) that considered the scatter shown in Table 3 be qualitatively explained by the existence of at least two mechanisms for oxygen ion diffusion network and interstitial
In an ideal 100 pure silica glass having no impurities only Q4 units should exist In this case one should expect that Si and O would have similar diffusivities For real glasses several diffusivity data
would be ideally compared considering a single glass from the same batch (having exactly same impurity content and consequently the same BONBO frac-tion) as we present in this paper for Puropsil A In Figure 10 the diffusivities and activation energies for silicon diffusion and viscous flow of Puropsil A are indeed quite close
An ideal experiment would be one with the four types of diffusivities determined from the same glass samples and in the same temperature range but un-fortunately such data are not available We were thus careful to choose data for glasses of the same type supposedly having similar impurity contents and the values of Dη Du and DSi are indeed coherent For Puropsil A glass (ie samples from the same batch) viscosity diffusion Dη and Si diffusion DSi agree as shown in Figure 10 up to below Tg (considering the same batch) This finding confirms that viscous flow and crystal growth are controlled by silicon diffusion in undercooled silica
511 Activation energies and diffusivities in thin film silica glasses
For the sake of completeness we also discuss available diffusion data for thin film silica glass although we could not find viscosity and crystal growth data
Figure 14 shows diffusivity measurements of silicon and oxygen in thin film silicas under different conditions One notes that DO and DSi follow different patterns as we previously observed for bulk silica glasses Table 3 also shows the pre-exponentials dif-fusivities and activation energies for these systems The activation energies for Si diffusion are higher than those of oxygen
Mikkelsen(98) compared his results for oxygen dif-
Proceedings of the eighth international otto schott colloquium Jena germany 23ndash27 July 2006
Table 3 Pre-exponential diffusivities (D0) and activation energies (EA) of different vitreous silica types determined by different methods for the glasses shown in Figures 10ndash14 Oxygen data for bulk glasses(87ndash93) silicon data for bulk glass(85) oxygen data for thin films(98ndash102) and silicon data for thin films(103ndash106) In parenthesis we list the commercial brand name (nk not known) [] Jorgensen amp Norton and Costello amp Tresller measured oxygen diffusivities only at one temperature (here established as D0) as indicated ϑGlass type Diffusivity type Method ΔT range (K) D0 (m2s) EA (kJmol)I (nk) Du Wagstaff Equation (6) From crystal growth 1623ndash2007 1middot4times10minus2 547plusmn18I (Puropsil A) Dη Eyring relation Equation (2) From viscosity 1373ndash1673 1middot8times10minus1 591plusmn1I (Puropsil A) DSi Brebec et al SIMS 1383ndash683 1middot3times10minus3 579plusmn14I (GE 124) DO Kalen et al SIMS 1073ndash1473 5middot5times10minus15 143plusmn24I (Heraeus) DO Haul amp Duumlmbgen Rate uptake 1173ndash1523 4middot3times10minus10 234plusmn18I (nk) Sucov Tracer loss 1198ndash1498 1middot5times10minus6 298plusmn22II (Amersil) DO Muehlenbachs amp Schaeffer Rate of exchange 1423ndash1703 4middot4times10minus15 82plusmn17II (Amersil) DO Williams Rate uptake 1123ndash1523 2middot0times10minus13 121plusmn8III (nk) DO Jorgensen amp Norton [] (ni) 1281 3middot5times10minus19 -(nk) DO Yinnon NRA 1088ndash1291 2middot1times10minus14 110Thin film DO Mikkelsen SIMS 1473ndash1673 2middot6times10minus4 454plusmn30Thin film DO Cawley amp Boyce SIMS 1173ndash1473 2middot8times10minus9 280plusmn10Thin film DO Pfeffer amp Ohring Tracer (room air) 673ndash1073 1middot3times10minus16 64middot8plusmn5middot8Thin film DO Costello amp Tresller [] SIMS 1273 4times10minus15 -Thin film DSi Takahashi et al (1 partial pressure) SIMS 1423ndash1573 8times10minus5 502plusmn77Thin film DSi Mathiot et al SIMS 1273ndash1473 3middot2times10minus3 515Thin film DSi Tsoukalas Tsamis amp Stoemenos SIMS 1323ndash1373 3middot7times10minus6 405Thin film DSi Tsoukalas Tsamis amp Normand SIMS 1323ndash1423 1middot2times10minus4 457plusmn24
Zanottoindd 214 10082007 151906
Physics and Chemistry of Glasses European Journal of Glass Science and Technology Part B Volume 48 Number 4 August 2007 215
fusivities in thin films with those determined by Haul and Duumlmbgen(91) for bulk silica and found them to be 10 to 100 times lower (with activation energy of 454 kJmol between 1473ndash1673 K) Obviously considering the previous discussions for bulk silica glasses impu-rity effects should have been considered Mikkelsen(98) assumed that his results represent a limit for the intrinsic network oxygen (bridging oxygen) diffu-sivity in silica glass It is also important to note the comparison of results of Mikkelsen(98) [EO=454plusmn30 kJmol D0=2middot6times10minus4 m2s between 1473ndash1653 K] and Cawley amp Boyle(99) [EO=280plusmn10 kJmol D0=2middot8times10minus9 m2s between 1173ndash1473 K] in Table 3 They used the same technique (SIMS) and observed different results for the diffusivities and activation energies The explanation for such discrepancy probably reflects different impurity contents
Unfortunately the impurity content was not given in most thin film papers Ham amp Helms(100) pointed out that their lsquoslowrsquo diffusion rates for ionic oxygen agree with Mikkelsenrsquos but disagree from Costello amp Tresslerrsquos(101) Oxygen diffusivity measurements of Pfeffer amp Ohring(102) at temperatures below 1423 K in air showed similar results as Costello amp Tresslerrsquos Ham amp Helms believe that this discrepancy in dif-fusivities arises from lsquodrierrsquo conditions Costello amp Tressler(101) did not report the concentration of water in their experiment but a numerical simulation of water exchange during diffusion done by Ham amp Helms suggests that 100 ppm water produced the same profiles what is a typical value for the water content in bulk silica glass type I (Table 1)
From all silicon diffusivities measured in thin films only those of Takahashi et al(103) match the dif-fusivities and activation energies measured by Brebec
et al(85) for bulk silica Data from Mathiot et al(104) lie within one order of magnitude to those of Takahashi et al and those of Brebec et al The diffusivities meas-ured by Takahashi et al did not depend on the oxygen partial pressure (1 or 20) All other silicon results are more than two orders of magnitude higher and almost all refer to non-stoichiometric compositions (unfortunately without chemical analysis more de-tails see Tsoukalas et al(105 106)) This interpretation is supported by the low activation energies found(105106) the difference arising from the defect formation ener-gies of the mediating silicon self diffusion
One could thus consider some of these data(104106) as an upper bound of silicon self diffusion Thus following similar procedure from Figures 10ndash13 the silicon diffusivities of Takahashi et al(103) and Tsoukalas et al(106) in Figure 14 could be viewed as lower and upper limits for silicon diffusion in thin films respectively
One important note is that the oxygen data of Mikkelsen(98) (the smallest values for this anion) are similar to the upper limit of silicon diffusion We speculate here that this result is a mere coincidence because all the several other data for silicon and oxygen indicates that the first diffuses much slower than the second in this glass
In any case it is clear that impurities extremely alter the diffusivity of any ion in a glass former such as silica (in bulk form or thin film) and thus small variations in impurity content could explain the scat-ter of oxygen diffusivities in Figures 10ndash14 even for the same silica type But considering the same silica type experimental data on diffusivities Du Dη and DO (when applicable) are well defined within upper or lower limits in bulk silica or thin films
Proceedings of the eighth international otto schott colloquium Jena germany 23ndash27 July 2006
Figure 14 Self diffusion coefficients of Si and O in thin film silicas Dsi Measured self diffusion coefficients of silicon (closed symbols) Sources Takahashi et al(103) (measurements at 1 and 20 oxygen partial pressure) Mathiot et al(104) and Tsoukalas et al(105106) Do Measured self diffusion coefficients of oxygen (open symbols) Sources Mikkelsen(98) Cawley amp Boyce(99) Costello amp Tressler (101) and Pfeffer amp Ohring(102) Oxygen diffusion is faster than silicon diffusion in all cases except one
50x10-4 60x10-4 70x10-4 80x10-4 90x10-4
-24
-23
-22
-21
-20
-19
-18
-17
-16
-152200 2000 1800 1600 1400 1200
log 10
D (m
2 s)
1T (K 1)
DSi Takahashi et al 1 103
DSi Takahashi et al 20 103
DSi Tsoukalas Tsamis amp Normand 106
DSi Mathiot et al 104
DO Mikkelsen 98
DO Cawley amp Boyce 99
DO Pfeffer amp Ohring 102
DO Costello amp Tressler 101
SiO2 thin film
T (K)
Zanottoindd 215 10082007 151906
216 Physics and Chemistry of Glasses European Journal of Glass Science and Technology Part B Volume 48 Number 4 August 2007
In summary the close similarity of the activation energies and diffusivities determined in three inde-pendent ways silicon self diffusion viscous flow and crystal growth indicates that the required bond breaking and molecular reorientation is comparable for these three kinetic processes In particular it should be emphasized that there is no sign of decou-pling between Dη and DSi down to Tg This similarity ensures that viscosity data may be used to estimate crystal growth rates in silica glasses The present results provide a better understanding of the dynam-ics of transport processes in undercooled silica But it will be important to perform similar analyses from Tm to about Tg for other glass forming silicate liquids to ascertain whether or not the present findings can be generalised
6 Conclusions
To understand the dynamics of several processes in undercooled liquid silica which is an archetypical network glass former has been of long standing interest Here we performed a critical analysis of a plethora of data for silicon and oxygen self-diffusion viscous flow and crystal growth kinetics in different types of commercial silica glasses and thin films in a wide temperature range from circa Tg to Tm which led us to the following conclusionsi Crystal growth rates oxygen self diffusion and viscous flow in this particular system strongly depend on the impurity level much more than in multicomponent silicate glasses For each silica glass type the variations of crystal growth rates between different glass batches (measured by different au-thors) correspond to similar variations observed for viscosity This sensitivity is due to the fact that the purest silica glass has a fully polymerised network (Q4) that is readily disrupted by small amounts of modifier impurity cations ii We confirmed that normal growth is the operative mechanism of crystal growth in the four types of bulk silica glasses analysed in broad temperature ranges The calculated jump distance λ is about 0middot2ndash2middot0 Aring for the different types of silica glasses and these values are of the (expected) order of magnitude of the SindashO distanceiii for type I silica glass the activation energies for viscous flow (590 kJmol) crystal growth (550 kJmol) and silicon self diffusion (580 kJmol) are equal within experimental error But the value for oxygen self dif-fusion is less than half (100ndash300 kJmol) Thus there is no decoupling between Du Dη and DSi and silicon controls the transport mechanism involved in crystal growth and viscous flow in this glassiv The congruence of Du and Dη in all four silica types indicates that the bond breaking and molecular reori-entation mechanism required for crystallisation is the
same required for the atomic transport mechanism that controls viscous flow Then viscosity data can be used to estimate the transport part that controls crystal growth in this glass from the melting point down to Tg
This work with highly polymerised silica glass corroborates a previous analysis carried out for depolymerised diopside glasses and thus provides a step forward in the knowledge of kinetic processes controlling crystal growth in undercooled silicate liquids
Acknowledgements
Special thanks to V M Fokin (Vavilov State Optical Institute Russia) J W P Schmelzer (University of Rostock Germany) and G P Souza (UFSCar Brazil) for reviewing this manuscript Financial support from Brazilian agencies CAPES CNPq and FAPESP are fully appreciated
References 1 Gutzow I In Crystal Growth and Materials Edited by E Kaldis amp H J
Scheel North-Holland Amsterdam 1977 2 Uhlmann D R Uhlmann E V amp Weinberg M C Nucleation and
Crystallisation in Liquids and Glasses The American Ceramic Society Westerville-OH 1993
3 Vogel W Glass Chemistry Springer-Verlag Berlin 1994 4 Gutzow I amp Schmelzer J W P The Vitreous State Springer Berlin
1995 5 Houmllland W amp Beall G Glass Ceramic Technology The American
Ceramic Society Westerville OH 2002 6 Vergano P J amp Uhlmann D R Phys Chem Glasses 1970 11 (2)
39ndash45 7 Meiling G S amp Uhlmann D R Phys Chem Glasses 1967 8 (2)
62ndash3 8 Leedecke C J amp Bergeron C G J Cryst Growth 1976 32 327 9 Burgner L L amp Weinberg M C J Non-Cryst Solids 2001 279 28 10 Nascimento M L F Ferreira E B amp Zanotto E D J Chem Phys
2004 121 8924 11 Reinsch S Muumlller R Nascimento M L F amp Zanotto E D Proc XX
ICG Kyoto 2004 12 Wagstaff F E J Am Ceram Soc 1969 52 650 13 Wagstaff F E J Am Ceram Soc 1968 51 449 14 Bihuniak P P Calabrese A amp Erwin E M J Am Ceram Soc 1983
66 C134 15 Boganov A G Rudenko V S amp Cheremisin I I Proc X Intern Congr
on Glass 1974 Kyoto P 66 16 Dietzel A amp Wickert H Glastech Ber 1956 29 1 17 Hlavac J amp Vaskova L Silikaty 1965 9 237 18 Komarova L A amp Leko V K Elektrotekhn Prom Ser Svetotekhn Izdel
1975 1 2 19 Leko V K amp Komarova L A Neorg Mater 1971 7 2240 20 Leko V K amp Komarova L A Neorg Mater 1975 11 2106 21 Leko V K amp Komarova L A NeorgMater 1975 11 1864 22 Leko V K Komarova L A amp Mazurin O V Neorg Mater 1972 8
1125 23 Leko V K ampKomarova L A Fiz Khim Stekla 1975 1 335 24 Leko V K amp Mazurin O V Svoistva Kvartsevogo Stekla Nauka
Leningrad 1985 25 Vaskova L amp Hlavac J Silikaty 1969 13 211 26 Komarova L A PhD Thesis 1973 Leningrad 27 Leko V K Komarova L A amp Mazurin O V Silikattechnik 1974 25
81 28 Leko V K amp Komarova L A NeorgMater 1974 10 1872 29 Brown S D amp Kistler S S J Am Ceram Soc 1959 42 263 30 Mazurin O V Leko V K amp Komarova L A J Non-Cryst Solids
Proceedings of the eighth international otto schott colloquium Jena germany 23ndash27 July 2006
Zanottoindd 216 10082007 151907
Physics and Chemistry of Glasses European Journal of Glass Science and Technology Part B Volume 48 Number 4 August 2007 217
1975 18 1 31 Pavlova G A Leko V K amp Komarova L A Fiz Khim Stekla 1975
1 149 32 Leko V K amp Komarova L A Neorg Mater 1975 11 1115 33 Aslanova M S Chernov V A amp Kulakov L F Steklo Keram 1974
6 19 34 Amosov A V Leko V K amp Meshcheryakova E V Fiz Khim Stekla
1978 4 416 35 Bihuniak P P J Am Ceram Soc 1983 66 C188 36 Doladugina V S amp Lebedeva R B Fiz Khim Stekla 1993 19 49 37 Hlavac J amp Sen T K Silikaty 1968 12 213 38 Leko V K amp Gusakova N K Fiz Khim Stekla 1977 3 226 39 Leko V K amp Meshcheryakova E V Fiz Khim Stekla 1975 1 264 40 Orii K Hara Y Akiyama T Tsukuma K amp Kikuchi Y Ceram Abstr
1997 76 30 41 Whitworth C R Bunnell L amp Brown S D In Front Glass Sci Technol
Sheffield 1970 P 87 42 Mackenzie J D Phys Chem Glasses 1962 3 (2) 50ndash3 43 Yovanovitch J C R Acad Sci (Compt Rend) 1961 253 853 44 Bowen D W amp Taylor R W Am Ceram Soc Bull 1978 57 818 45 Clasen R Hornfeck M amp Rosenbaum S Proc XVII Int Congr on
Glass Beijing 1995 Vol 5 181 46 Donadieu P Jaoul O amp Kleman M Philos Mag A 1985 52 5 47 Dunn S A Am Ceram Soc Bull 1968 47 554 48 Gusakova N K Leko V K Meshcheryakova E V amp Lebedeva R
B Neorg Mater 1974 10 338 49 Hofmaier G amp Urbain G Sci Ceram 1968 4 25 50 Kimura T Jpn J Appl Phys 1969 8 1397 51 Loryan S G Kostanyan K A Saringyulyan R S Kafyrov V M amp
Bagdasaryan E Kh Elektron Tekh Ser6 Mater 1976 2 53 52 Solomin N V Zh Fiz Khim 1940 14 235 53 Urbain G Bottinga Y amp Richet P Geochim Cosmochim Acta 1982
461061 54 Toshiba Ceramics Co Quartz Glass and Silica Glass 1979 Tokyo 55 Weiss W J Am Ceram Soc 1984 67 213 56 Fontana E H amp Plummer W A Phys Chem Glasses 1966 7 (4)
139ndash46 57 Mazurin O V amp Klyuev V P Neorg Mater 1974 10 1115 58 Bruckner R Glastech Ber 1964 37 413 59 Bruisten P M amp van Dam H B B Proc First Int Conf Fundamentals
of Glass Manufacturing Process Sheffield 1991 P 18 60 Clasen R amp Hermann W Boll Soc Espan Ceram Vidrio Proc XVI Int
Congr on Glass Madrid 1992 Vol 31-c P 233 61 Donnadieu P J Non-Cryst Solids1988 99 113 62 Leko V K Properties of Silica Glasses Institute of Silicate Chemistry
Odoevskogo 242 St Petersburg Russia 63 Leko V K amp Meshcheryakova E V Fiz Khim Stekla 1976 2 317 64 Leko V K amp Meshcheryakova E V Fiz Khim Stekla 1976 2 311 65 Mazurin O V Klyuev V P Leko V K amp Meshcheryakova E V Fiz
Khim Stekla 1975 1 371 66 Pavlova G A amp Amatuni A N Neorg Mater 1975 11 1686 67 Paek U C Schroeder C M and Kurkjian C R Glass Technology 1988
29 (6) 263ndash6 68 Hagy H E J Am Ceram Soc 1963 46 93 69 Scherer G W Glastech Ber 1983 56K 834 70 Schultz P C J Am Ceram Soc 1976 59 214 71 Ohashi M Tateda M Tajima K amp Shiraki K Electron Lett 1992
28 1008 72 Shiraki K Ohashi M Tajima K Tateda M amp Tsujikawa K Electron
Lett 1993 29 1263 73 Tajima K Tateda M amp Ohashi M J Lightwave Technol 1994 12
411 74 Mazurin O V Leko V K amp Komarova L A J Non-Cryst Solids
1975 18 1 75 Leko V K Meshcheryakova E V Gusakova N K amp Lebedeva R B
Opt Mekh Prom 1974 12 42 76 Leko V K Meshcheryakova E V amp Gusakova N K Neorg Mater
1975 11 130 77 Leko V K amp Gusakova N K Fiz Khim Stekla 1977 3 226 78 SciGlass 50 SciGlass Dictionary (1996ndash2002) Scivision 79 Nascimento M L F amp Zanotto E D Phys Rev B 2006 73 024209 80 Jackson K A In Growth and Perfection of Crystals Edited by R H
Doremus B W Roberts amp D Turnbull Wiley New York 1958 81 Mai C Sekkat A Etienne S amp Perez J Proc Second Int Conf Fun-
damentals in Glass Science and Technology 1993 P 447 82 Nassau K Levy R A amp Chadwick D L J Electrochem Soc 1985
132 409 83 Yongman R E Kieffer J Bass J D amp Dufrene L J Non-Cryst Solids
1997 222 190 84 Herron L W amp Bergeron C G Phys Chem Glasses 1978 19 (4)
89ndash94 85 Brebeacutec G Seguin R Sella C Bevenott J amp Martin J C Acta Met
1980 28 327 86 Clark T M Grandinetti P J Florian P amp Stebbins J F Phys Rev B
2004 70 064202 87 Jorgensen P J amp Norton F J Compt Rend VII Congr Intern du Verre
Bruxelles 1965 Vol 2 1965 P 310 88 Kalen J D Boyce R S amp Cawley J D J Am Ceram Soc 1991 74
203 89 Williams E L J Am Ceram Soc 1965 48 190 90 Muehlenbachs K amp Schaeffer H A Canad Mineral 1977 15 179 91 Haul R amp Duumlmbgen G Z Elektrochem 1962 66 636 92 Sucov E J Am Ceram Soc 1963 46 14 93 Yinnon H PhD Thesis 1977 Case Western Reserve University 94 Schaeffer H A J Non-Cryst Solids 1980 38ndash39 545 95 Kajihara K Miura T Kamioka H Hirano M Skuja L amp Hosono H
J Ceram Soc Jpn 2004 112 559 96 Norton F J Nature 1961 191 701 97 Hetherington G amp Jack K H Phys Chem Glasses 1964 5 (5)
147ndash51 98 Mikkelsen J C Appl Phys Lett 1984 45 1187 99 Cawley J D amp Boyce R S Philos Mag A 1988 58 589 100 Ham C J amp Helms C R J Appl Phys 1986 59 1767 101 Costello J A amp Tressler R E J Electrochem Soc 1984 131 1944 102 Pfeffer R amp Ohring M J Appl Phys 1981 52 777 103 Takahashi T Fukatsu S Itoh K M Uematsu M Fujiwara A
Kageshima H Takahashi Y amp Shiraishi K J Appl Phys 2003 93 3674
104 Mathiot D Schunk J P Perego M Fanciulli M Normand P Tsamis C amp Tsoukalas D J Appl Phys 2003 94 2136
105 Tsoukalas D Tsamis C amp Stoemenos J Appl Phys Lett 1993 63 3167
106 Tsoukalas D Tsamis C amp Normand P J Appl Phys 2001 89 7809
Proceedings of the eighth international otto schott colloquium Jena germany 23ndash27 July 2006
Zanottoindd 217 10082007 151907
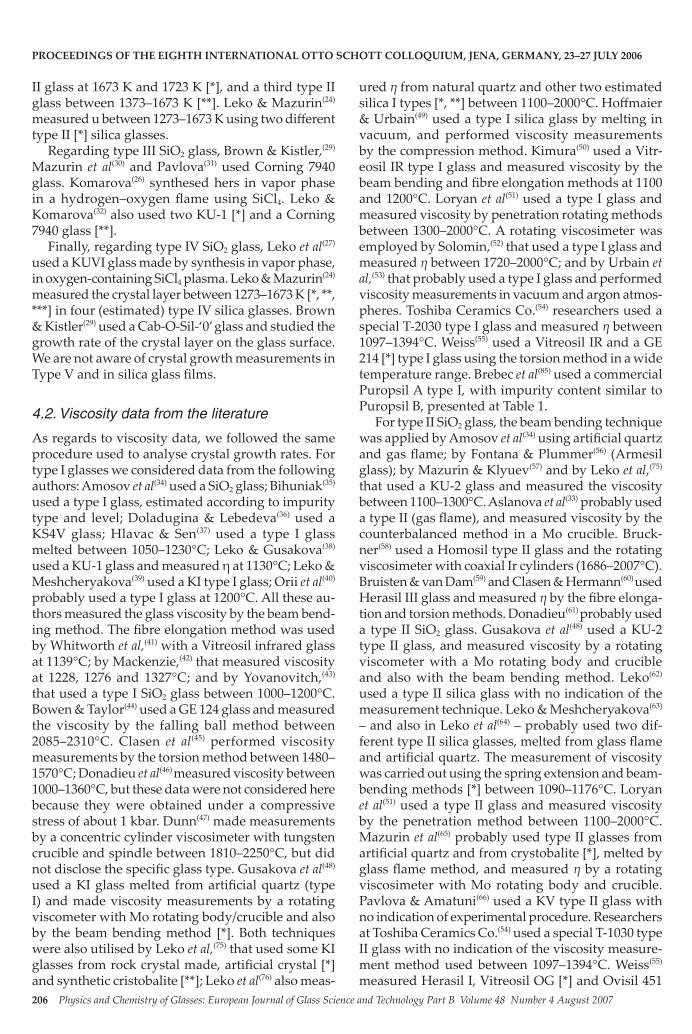
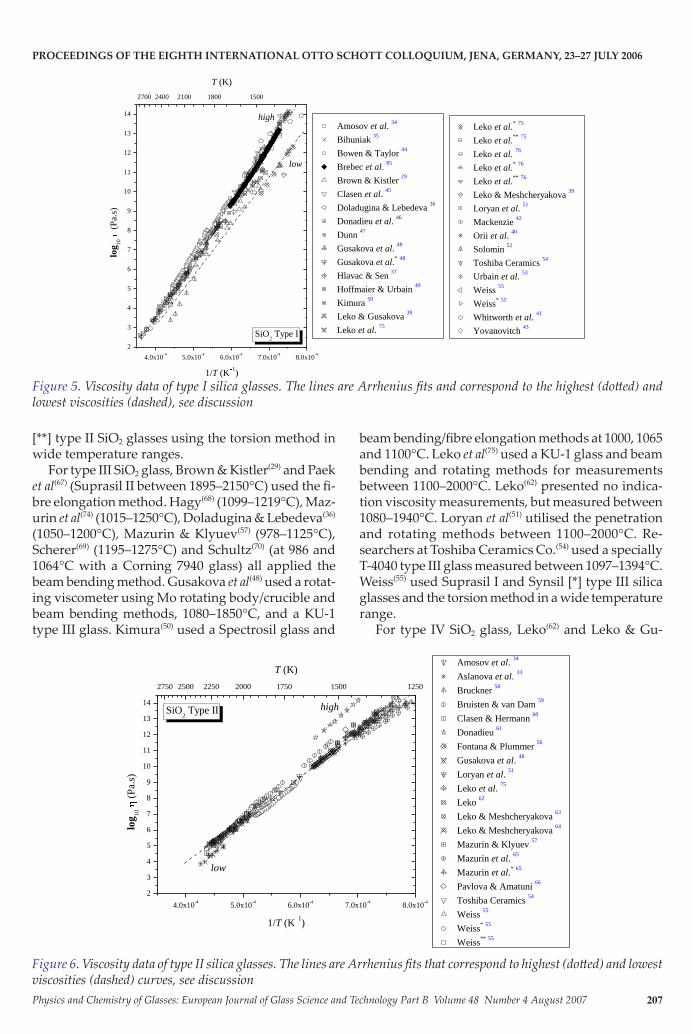
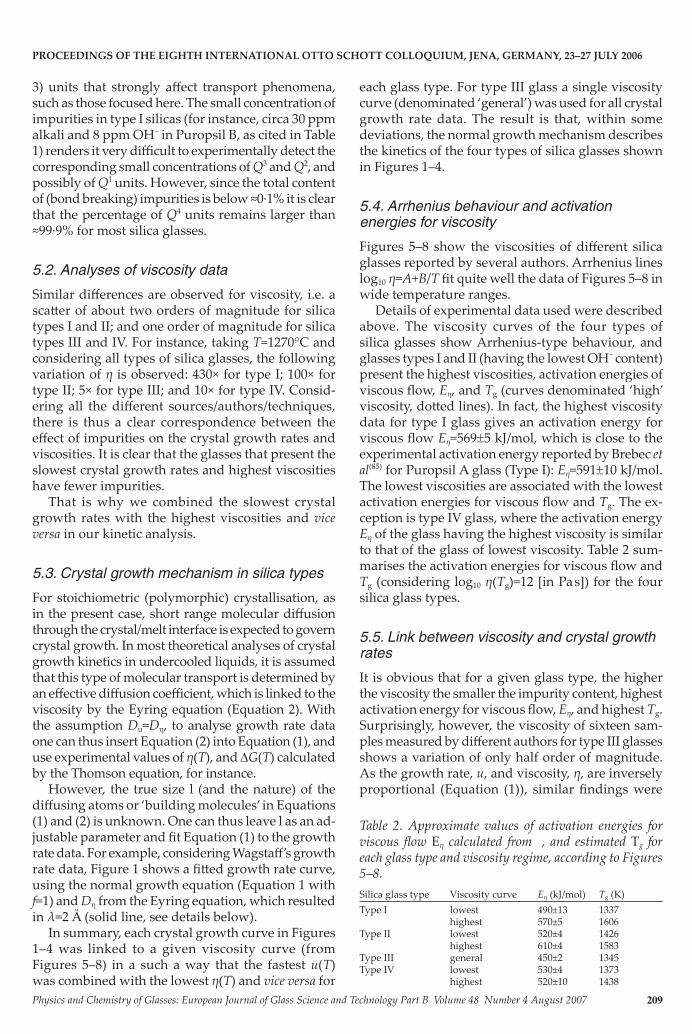
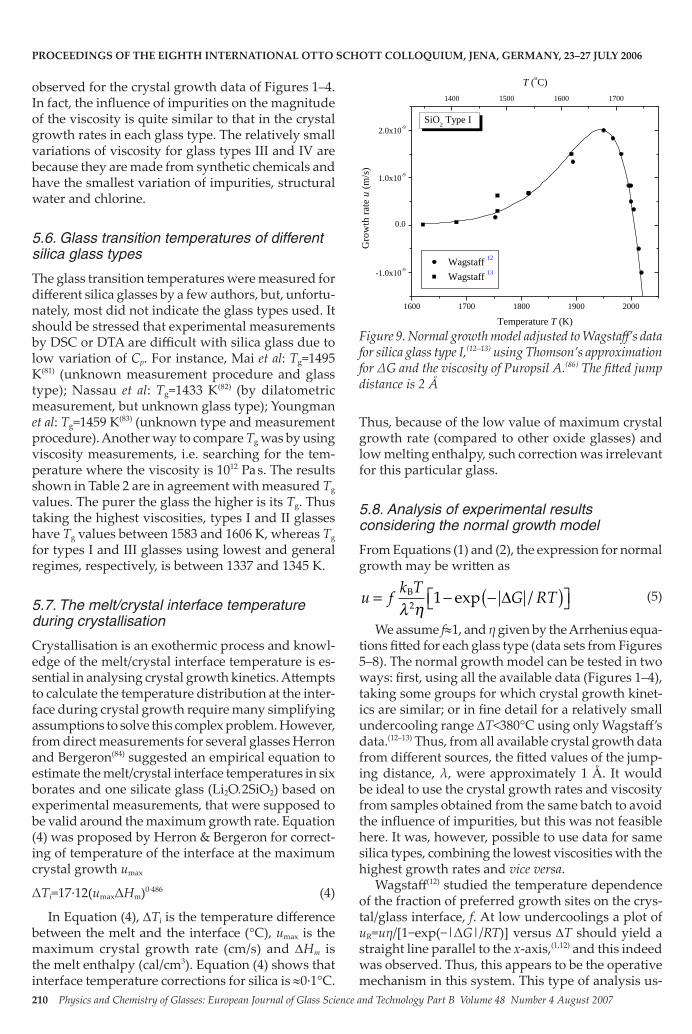
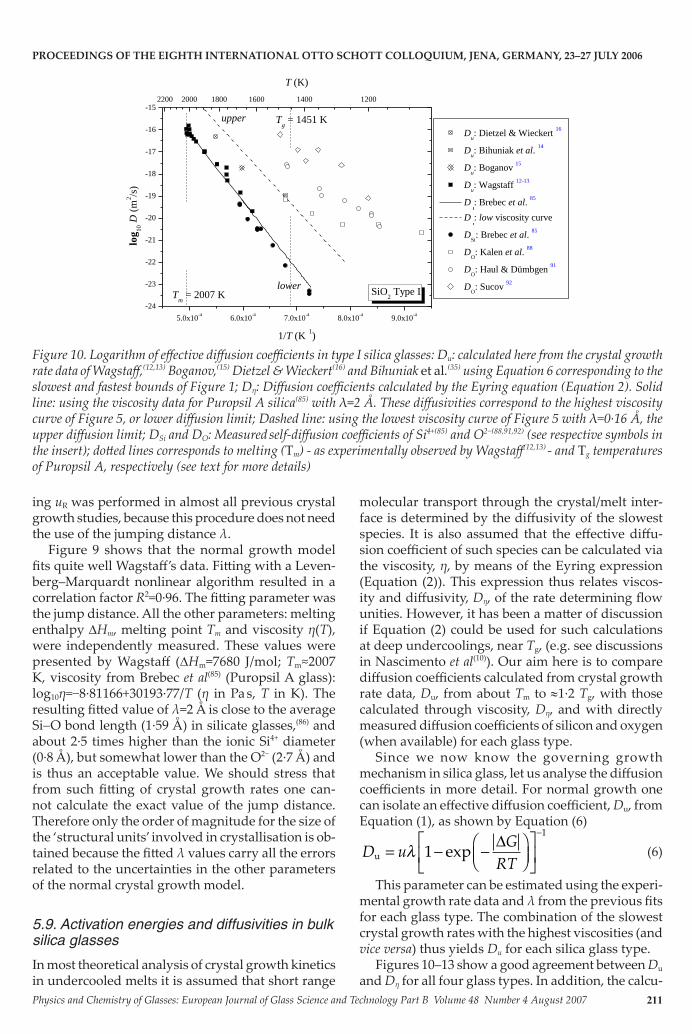
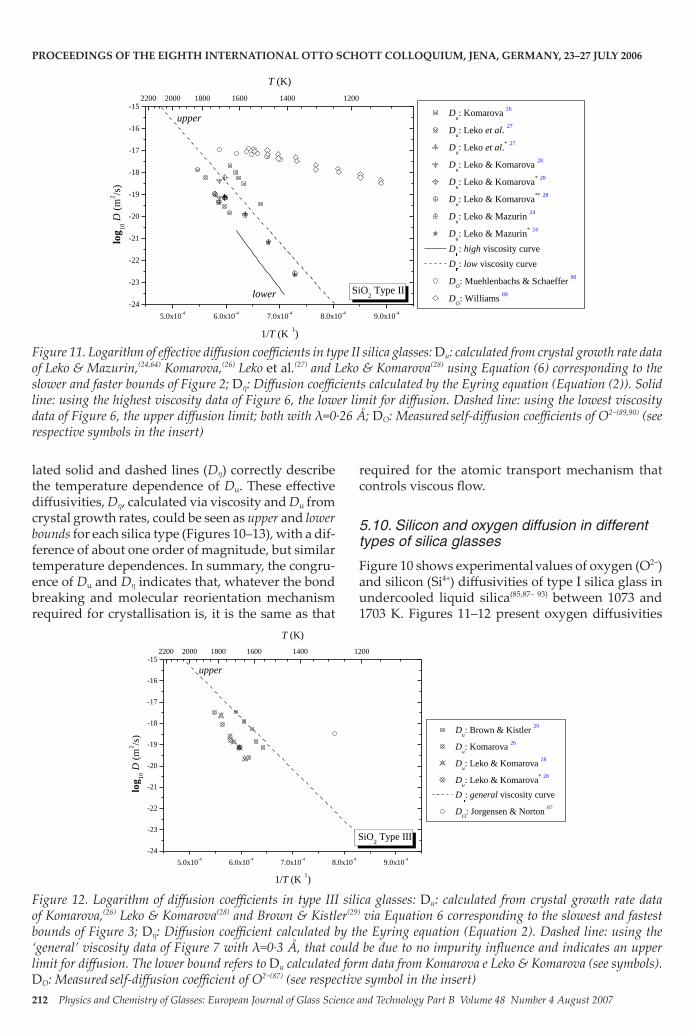
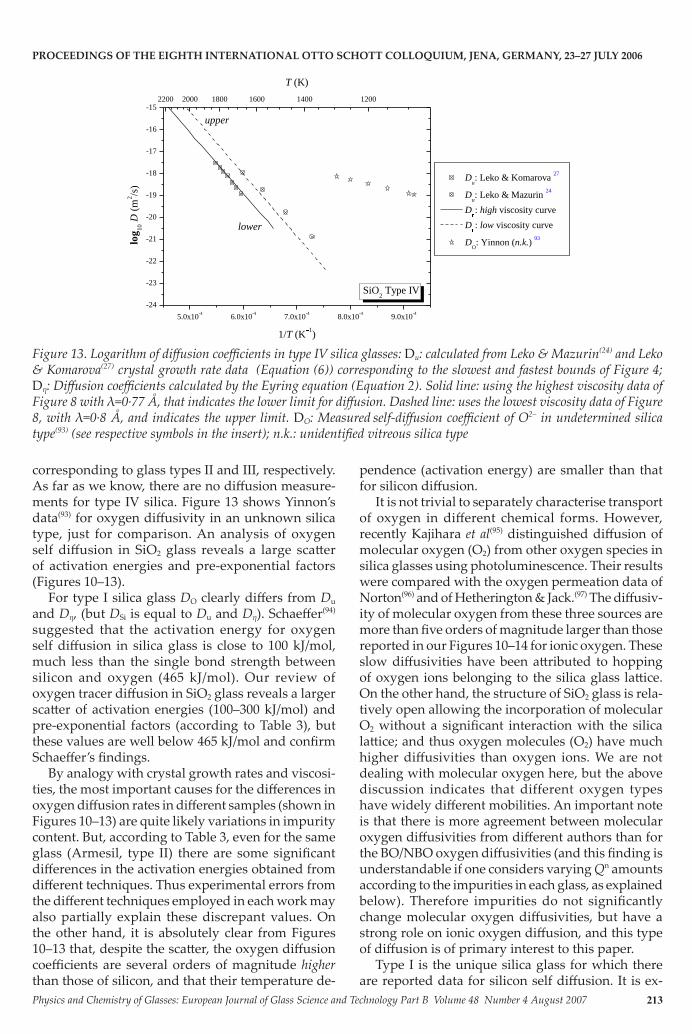
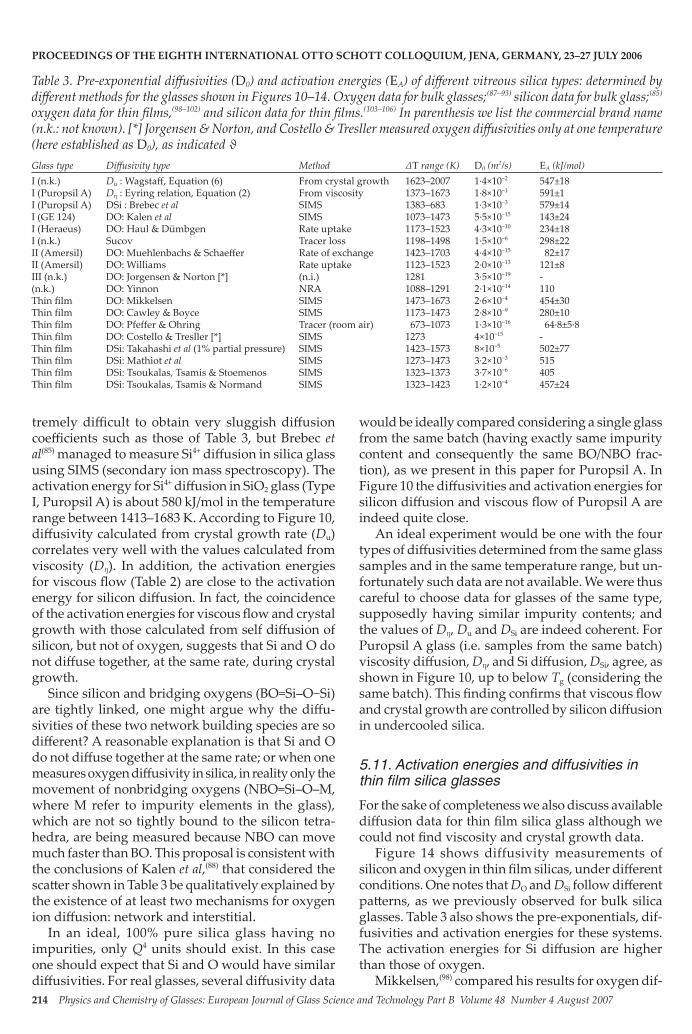
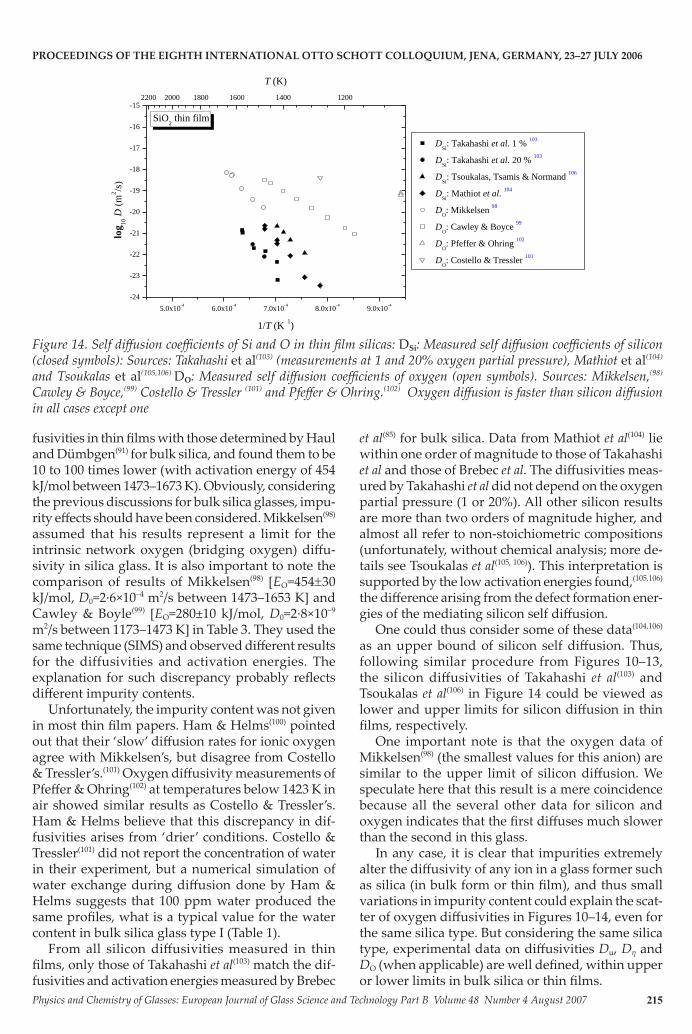
Related Documents


