Diffusion of myelin oligodendrocyte glycoprotein in living OLN-93 cells investigated by raster-scanning image correlation spectroscopy (RICS) Ellen Gielen, 1,2¥ Nick Smisdom, 2¥ Ben De Clercq, 2,3 Martin vandeVen, 2 Rik Gijsbers, 4 Zeger Debyser, 4 Jean-Michel Rigo, 2 Johan Hofkens, 5 Yves Engelborghs, 1 Marcel Ameloot 2* (1) Laboratory for Biomolecular Dynamics, Catholic University Leuven, Celestijnenlaan 200G, B-3001 Heverlee, Belgium (2) Laboratory for Cell Physiology, Biomedical Research Institute, Hasselt University and transnationale Universiteit Limburg, Agoralaan, Bldg D, B- 3590 Diepenbeek, Belgium (3) Department of Applied Physics, Eindhoven University of Technology, Den Dolech 2, P.O.Box 513, 5600 MB Eindhoven, The Netherlands (4) Laboratory for Molecular Virology and Gene Therapy, Catholic University Leuven, Kapucijnenvoer 33 block i, B-3000 Leuven, Belgium (5) Laboratory of Photochemistry and Spectroscopy, Catholic University Leuven, Celestijnenlaan 200F, B-3001 Heverlee, Belgium Running head: Myelin-specific protein diffusion studied by means of RICS *Correspondence to: Marcel Ameloot, Hasselt University, Biomedical Research Institute, Laboratory of Cell Physiology, Agoralaan, Bldg D, B-3590 Diepenbeek, Belgium Tel.: 00-32-11-26.85.46 Fax: 00-32-11-26.85.99 E-mail: [email protected] ¥ Ellen Gielen and Nick Smisdom contributed equally to this work 1

Welcome message from author
This document is posted to help you gain knowledge. Please leave a comment to let me know what you think about it! Share it to your friends and learn new things together.
Transcript

Diffusion of myelin oligodendrocyte glycoprotein in living OLN-93 cells
investigated by raster-scanning image correlation spectroscopy (RICS)
Ellen Gielen,1,2¥ Nick Smisdom,2¥ Ben De Clercq,2,3 Martin vandeVen,2 Rik Gijsbers,4
Zeger Debyser,4 Jean-Michel Rigo,2 Johan Hofkens,5 Yves Engelborghs,1 Marcel
Ameloot2*
(1) Laboratory for Biomolecular Dynamics, Catholic University Leuven,
Celestijnenlaan 200G, B-3001 Heverlee, Belgium
(2) Laboratory for Cell Physiology, Biomedical Research Institute, Hasselt
University and transnationale Universiteit Limburg, Agoralaan, Bldg D, B-
3590 Diepenbeek, Belgium
(3) Department of Applied Physics, Eindhoven University of Technology, Den
Dolech 2, P.O.Box 513, 5600 MB Eindhoven, The Netherlands
(4) Laboratory for Molecular Virology and Gene Therapy, Catholic University
Leuven, Kapucijnenvoer 33 block i, B-3000 Leuven, Belgium
(5) Laboratory of Photochemistry and Spectroscopy, Catholic University Leuven,
Celestijnenlaan 200F, B-3001 Heverlee, Belgium
Running head: Myelin-specific protein diffusion studied by means of RICS
*Correspondence to: Marcel Ameloot, Hasselt University, Biomedical Research
Institute, Laboratory of Cell Physiology, Agoralaan, Bldg D, B-3590 Diepenbeek,
Belgium
Tel.: 00-32-11-26.85.46
Fax: 00-32-11-26.85.99
E-mail: [email protected]
¥ Ellen Gielen and Nick Smisdom contributed equally to this work
1

ABSTRACT
Many membrane proteins and lipids are partially confined in substructures ranging
from tens of nanometers to micrometers in size. Evidence for heterogeneities in the
membrane of oligodendrocytes, i.e. the myelin-producing cells of the central nervous
system, is almost exclusively based on detergent methods. However, as application of
detergents can alter the membrane phase behaviour, it is important to investigate
membrane heterogeneities in living cells. Here, we report on the first investigations of
the diffusion behavior of the myelin-specific protein MOG (myelin oligodendrocyte
glycoprotein) in OLN-93 as studied by the recently developed RICS (raster-scanning
image correlation spectroscopy) technique. We implemented RICS on a standard
confocal laser-scanning microscope with one-photon excitation and analog detection.
Measurements on FITC-dextran were used to evaluate the performance of the system
and the data analysis procedure.
Keywords: Raster-scanning image correlation spectroscopy
Myelin oligodendrocyte glycoprotein
OLN-93
Diffusion
Lipid rafts
2

INTRODUCTION
The plasma membrane of various mammalian cell types is heterogeneous in
structure and may contain microdomains, which can impose constraints on the lateral
diffusion of its constituents. One type of membrane inhomogeneities consists of the
so-called lipid rafts, built mainly of cholesterol and saturated lipids [1]. These liquid-
ordered microdomains attract a lot of interest as they are thought to provide dynamic
platforms that are involved in a variety of processes, such as signal transduction and
protein and lipid sorting [2].
Oligodendrocytes (OLGs) are the myelin-producing cells of the central
nervous system. Mature OLGs provide the ensheathment of axons with myelin, which
is essential for the fast saltatory conduction of action potentials. Abnormalities in
myelin development or disturbance and destruction of its structure lead to severe
neurological symptoms observed in diseases such as multiple sclerosis (MS) [3-5].
Maintenance of the functional myelin sheath requires a carefully regulated balance of
myelin synthesis and turnover, requiring precise sorting and targeting mechanisms.
The formation of lipid rafts in OLGs may be important for membrane subdomain
organization, compartmentalization of signalling molecules and sorting of myelin
components [6].
Most of the experimental evidence concerning the membrane heterogeneity in
oligodendroglial membranes is based on biochemical studies [6], which show that
some membrane constituents are resistant to solubilization by nonionic detergents at
low temperature [7]. The amount of proteins and lipids, however, as well as the
sucrose gradient buoyancy of the detergent-resistant membrane complexes, was
reported to vary substantially among the detergents and extraction procedure used [8-
9]. Application of a detergent alters the membrane phase behavior [10-11]. In
3
addition, the exact relationship between rafts and detergent-resistant membranes is
unclear [12]. Therefore, it is important to investigate actual membrane heterogeneities
in living OLGs. This can be accomplished by using microfluorimetric methods for
monitoring the diffusion of molecules in the plane of the membrane [13].
One method that can be used to investigate the dynamic properties of molecules
diffusing in the plasma membrane of living cells is fluorescence correlation
spectroscopy (FCS) in its various modalities. In FCS small fluctuations in the
fluorescence signal from a femtoliter stationary or scanned observation volume are
measured over a short period of time [14-15]. These fluctuations arise from
fluorescently labeled molecules diffusing in and out of this observation volume,
which is spatially defined by the laser focus. The corresponding autocorrelation
function (ACF) contains information about the average number of molecules in the
observation volume (N) and their characteristic diffusion time [16]. Recently we have
been able to demonstrate using Z-scan FCS that the lipid probe DiD (1,1’-
dioctadecyl-3,3,3’,3’-tetramethylindodicarbocyanine perchlorate) exhibits hindered
diffusive motion in the plasma membrane of the OLN-93 oligodendroglial cell line
[17]. In the current work we elaborate on the mobility of the transmembrane protein
MOG (myelin oligodendrocyte glycoprotein) in living OLN-93 cells.
MOG is an integral myelin-specific protein, which is localized in the outer
lamella of the myelin sheath and therefore exposed to the extracellular environment.
Although MOG is only a minor component of the myelin membrane (0.01-0.05 % of
the total myelin protein content), it induces severe experimental autoimmune
encephalitis, i.e. the animal model of MS, after administration to both rodents and
primates [18-19]. Furthermore, injection of monoclonal antibodies against MOG into
rodents causes extensive myelin destruction in situ [20]. The association of MOG
4

with Triton X-100 insoluble lipids is thought to activate signalling pathways related to
stress response and cytoskeletal instability, inducing the retraction of OLG processes
[21-22] and thus demyelination.
In this work, control measurements on FITC-dextran (fluorescein
isothiocyanate-dextran) were performed to validate the RICS (raster-scanning image
correlation spectroscopy) method and the in-house software for data analysis. RICS
was then applied to monitor the diffusion of MOG in a stable OLN-93
oligodendroglial cell line [23] expressing MOG-eGFP (enhanced green fluorescent
protein, with eGFP linked to the intracellular C-terminus of MOG).
THEORETICAL BACKGROUND
RICS has been introduced by Digman et al. [24-25] and the principles are
briefly reiterated here for the convenience of the reader. RICS operates on a temporal
series of images obtained with a laser-scanning microscope (raster-scan mode). Each
raster-scan image in this series contains temporal information as it is formed pixel by
pixel and line by line (Fig. 1A). Adjacent pixels along a single (horizontal) line are a
few microseconds (pixel dwell time, τp) apart, while pixels over successive (vertical)
lines and frames are respectively a few milliseconds (line time, τl) and seconds-to-
minutes apart. Hence, the spatial correlation of the image yields information on
molecular dynamics over a broad time window. RICS allows combination of the
temporal scales of single-point FCS with the spatial information obtained from ICS
(image correlation spectroscopy) [26-27].
The overall normalized two-dimensional fluorescence intensity fluctuation
spatial ACF (GS(ξ,ψ)) is defined as:
5
( )( ) ( )
( )( ) ( ψξψξ=
ψ+ξ+δδ=ψξ ,,
,
,,, 2
,
, SGyxI
yxIyxIG
yx
yxS ) (1)
where I(x,y) is the detected fluorescence intensity at each pixel and δI(x,y) = I(x,y) -
<I(x,y)> are the fluorescence intensity fluctuations around the mean intensity of the
image <I(x,y)>.
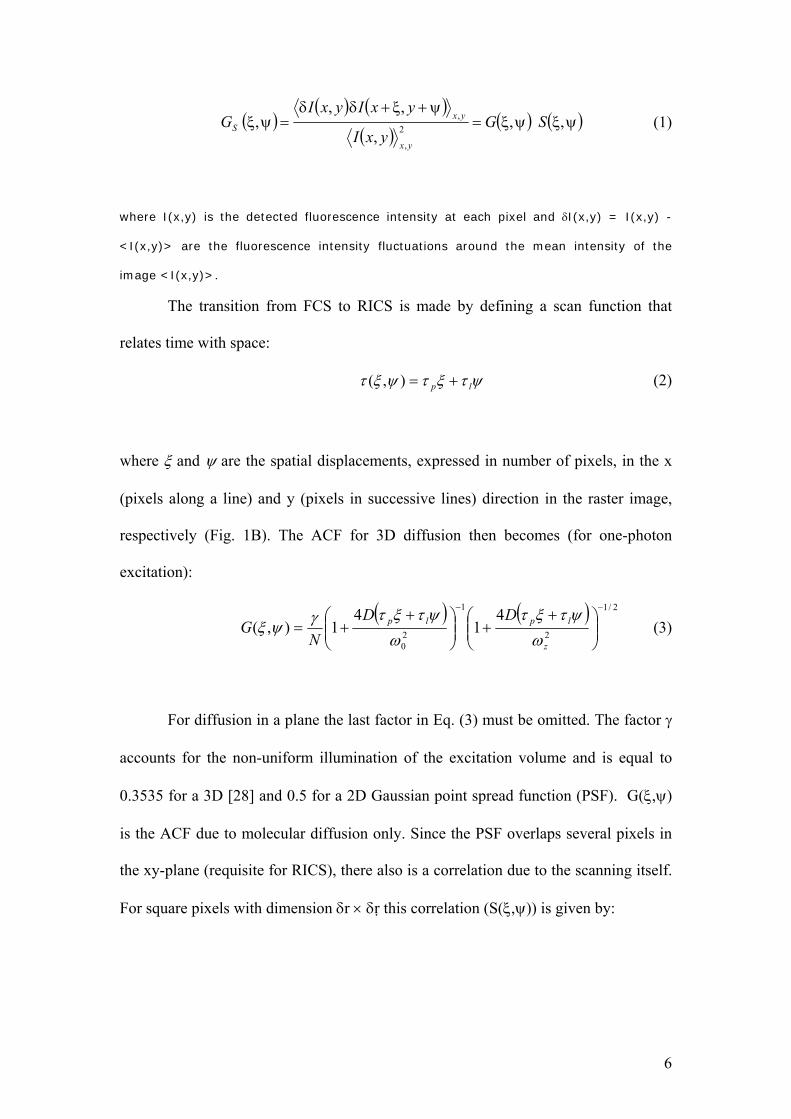
The transition from FCS to RICS is made by defining a scan function that
relates time with space:
ψτξτψξτ lp +=),( (2)
where ξ and ψ are the spatial displacements, expressed in number of pixels, in the x
(pixels along a line) and y (pixels in successive lines) direction in the raster image,
respectively (Fig. 1B). The ACF for 3D diffusion then becomes (for one-photon
excitation):
( ) ( ) 2/1
2
1
20
41
41),(
−−
⎟⎟⎠
⎞⎜⎜⎝
⎛ ++⎟⎟
⎠
⎞⎜⎜⎝
⎛ ++=
z
lplp DDN
Gω
ψτξτω
ψτξτγψξ (3)
For diffusion in a plane the last factor in Eq. (3) must be omitted. The factor γ
accounts for the non-uniform illumination of the excitation volume and is equal to
0.3535 for a 3D [28] and 0.5 for a 2D Gaussian point spread function (PSF). G(ξ,ψ)
is the ACF due to molecular diffusion only. Since the PSF overlaps several pixels in
the xy-plane (requisite for RICS), there also is a correlation due to the scanning itself.
For square pixels with dimension δr × δr this correlation (S(ξ,ψ)) is given by:
6

( )⎟⎟⎟⎟⎟⎟
⎠
⎞
⎜⎜⎜⎜⎜⎜
⎝
⎛
++
⎥⎥⎦
⎤
⎢⎢⎣
⎡⎟⎟⎠
⎞⎜⎜⎝
⎛+⎟⎟
⎠
⎞⎜⎜⎝
⎛
−=
20
2
0
2
0
41
exp),(
ωψτξτ
ωψδ
ωξδ
ψξlpD
rr
S (4)
It is clear from Eq. (3) that the spatial ACF in RICS behaves in approximately
the same way as the temporal ACF in FCS. As for FCS, the amplitude of the spatial
autocorrelation curve is inversely proportional to the particle concentration [29]. In
addition, the correlation curve will broaden when the diffusion becomes slower. One
of the main advantages of RICS over FCS is that kinetic information can be spatially
mapped allowing for the detection of heterogeneities in diffusion [24].
7

MATERIALS AND METHODS
Chemicals
FITC-dextran with a molecular weight of 2000 kDa (FD2000S) and a hydrodynamic
radius of 32.8 nm [30] was purchased from Sigma-Aldrich NV (Bornem, Belgium).
Dilutions of FD2000S were made in Tris buffer pH 10 and in HEPES-buffered
medium without phenol red (MWPR; Gibco BRL, supplied by Invitrogen, Merelbeke,
Belgium), respectively. To perform RICS measurements, the fluorescent solutions
were “sandwiched” between a microscope slide and a coverslip, sealed by an adhesive
spacer of 120 µm thickness in between (Secure-seal spacer, Molecular Probes,
supplied by Invitrogen). The generated microscopic chamber is small enough to
eliminate any flow or currents in the solution while retaining a 3D sample
environment [31]. Measurements were performed at 28°C (Tris buffer pH 10),
respectively 23°C (MWPR).
Cell culture
The OLN-93 cell line was kindly provided by Prof. Dr. Christiane Richter-Landsberg
(University of Oldenburg, Germany). A stable MOG-eGFP-expressing OLN-93 cell
line was generated by means of lentiviral vector technology. The cell line was further
modified into a stable galactosylceramide and sulfatide-expressing (GS) MOG-eGFP
OLN-93 cell line by Dr. Wia Baron (lab of Prof. Dr. Dick Hoekstra; laboratory for
membrane cell biology, University Medical Centre Groningen, University of
Groningen, The Netherlands). OLN-93 GS cells expressing MOG-eGFP were
cultured on 24 mm ∅ coverslips in DMEM (Gibco BRL, cat. no. 41965-039)
supplemented with 10% foetal bovine serum (Sigma-Aldrich), 100 U/ml penicillin,
8

100 µg/ml streptomycin (Gibco BRL), 1 µg/ml puromycin and 2 mg/ml geneticin
(Sigma-Aldrich) in a humidified 10% CO2 incubator at 37°C. For RICS
measurements, cells were mounted in a homemade bath chamber and the cell culture
medium was replaced by MWPR. Measurements were performed at the membrane
facing the glass coverslip. For fixation, cells were put in 4% paraformaldehyde (PFA)
at 4°C. After 10 min of incubation, PFA was replaced by MWPR.
Viscosity Determination
The viscosities of TRIS buffer pH 10 and MWPR were determined with a model AR
G-2 rheometer (Tain Instruments Corp., div. of Waters NV/SA, Zellik, Belgium) at
various temperatures (23°C and 28°C). The instrument was calibrated before every
measurement and care was taken to avoid the introduction of air bubbles. Each
sample (1 ml, filtered through a 0.22 μm Sterivex filter, Millipore Corporation,
supplied by VWR International Europe BVBA, Leuven, Belgium) was allowed to
equilibrate for at least 10 minutes before measurements were started.
Instrumental set-up
RICS images were collected with a Zeiss LSM 510 META one-photon confocal laser-
scanning microscope (Jena, Germany) on an Axiovert200M motorized frame. An
analog photomultiplier tube (proprietary Zeiss information) was used for detection.
Samples were excited with the 488 nm line (selected by a 488 ± 10 nm interference-
based laser cleanup filter) of the 20 mW air-cooled argon ion laser (set at 70% of its
maximum power) under the control of an AOTF (set at 1% transmission; ~ 10 µW at
the sample position). The excitation light was directed to the sample via a dichroic
9
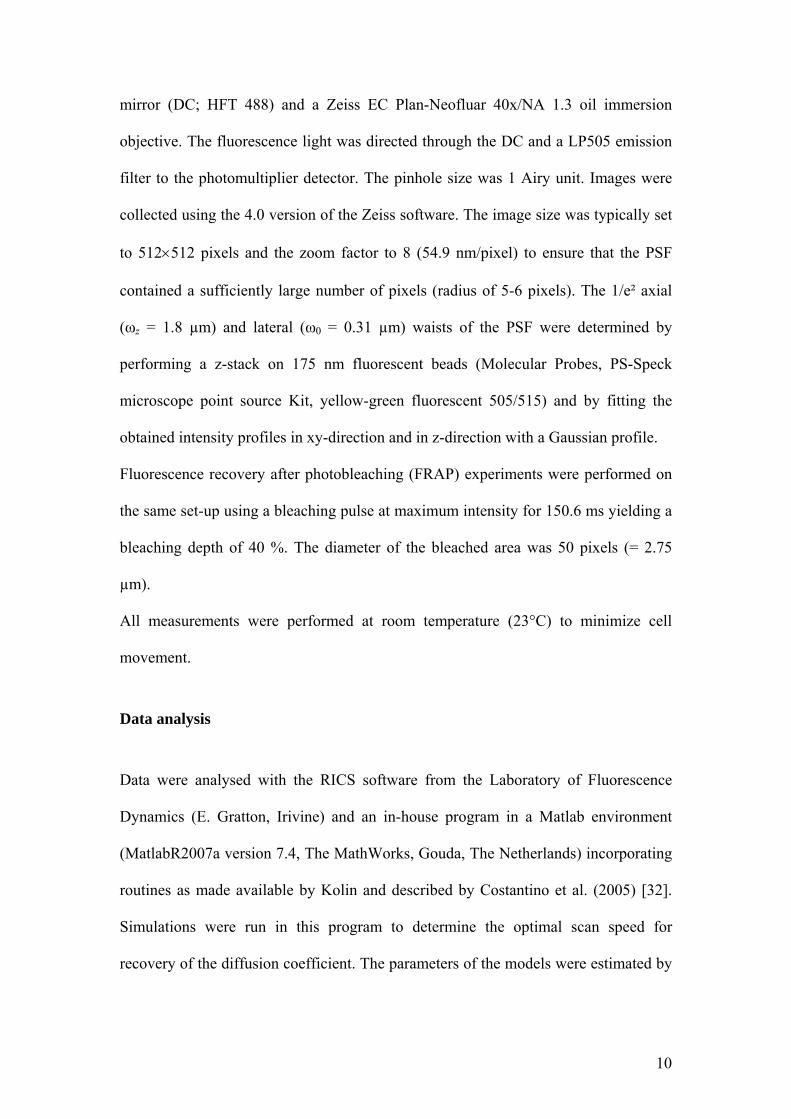
mirror (DC; HFT 488) and a Zeiss EC Plan-Neofluar 40x/NA 1.3 oil immersion
objective. The fluorescence light was directed through the DC and a LP505 emission
filter to the photomultiplier detector. The pinhole size was 1 Airy unit. Images were
collected using the 4.0 version of the Zeiss software. The image size was typically set
to 512×512 pixels and the zoom factor to 8 (54.9 nm/pixel) to ensure that the PSF
contained a sufficiently large number of pixels (radius of 5-6 pixels). The 1/e² axial
(ωz = 1.8 µm) and lateral (ω0 = 0.31 µm) waists of the PSF were determined by
performing a z-stack on 175 nm fluorescent beads (Molecular Probes, PS-Speck
microscope point source Kit, yellow-green fluorescent 505/515) and by fitting the
obtained intensity profiles in xy-direction and in z-direction with a Gaussian profile.
Fluorescence recovery after photobleaching (FRAP) experiments were performed on
the same set-up using a bleaching pulse at maximum intensity for 150.6 ms yielding a
bleaching depth of 40 %. The diameter of the bleached area was 50 pixels (= 2.75
µm).
All measurements were performed at room temperature (23°C) to minimize cell
movement.
Data analysis
Data were analysed with the RICS software from the Laboratory of Fluorescence
Dynamics (E. Gratton, Irivine) and an in-house program in a Matlab environment
(MatlabR2007a version 7.4, The MathWorks, Gouda, The Netherlands) incorporating
routines as made available by Kolin and described by Costantino et al. (2005) [32].
Simulations were run in this program to determine the optimal scan speed for
recovery of the diffusion coefficient. The parameters of the models were estimated by
10

weighted least squares, with weights calculated from the standard deviations (σ) of
the set of autocorrelation functions determined from the images of the series.
Analysis of FRAP experiments was performed according to Soumpasis [33]. A
control region was collected simultaneously with the bleached area to correct for
readout bleaching.
Uncertainties are reported as standard deviations.
11

RESULTS
3D diffusion measurements in isotropic solution
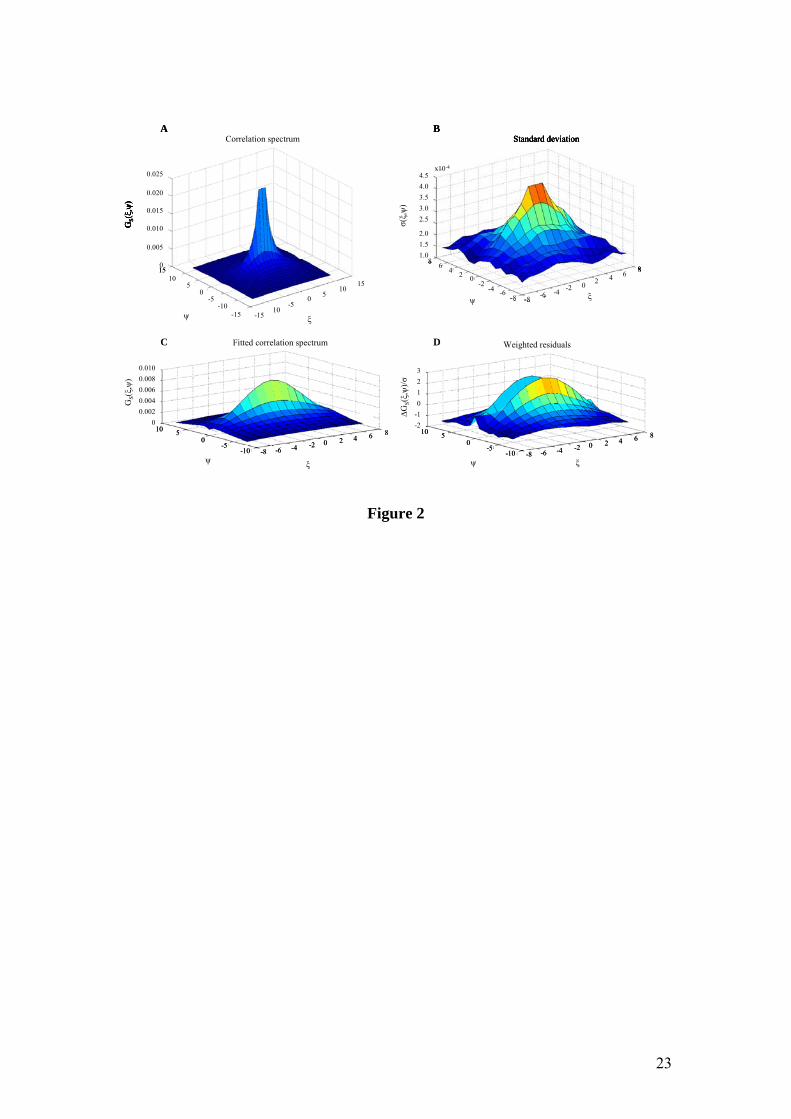
Fig. 2 shows the autocorrelation spectrum for FD2000S diffusing freely in Tris buffer
pH 10, after subtraction of the background (scan speed 9: τp = 1.6 µs/pixel; series with
100 images). Due to the rather high scan speed, the correlated detector noise is clearly
visible in the spectrum. By omitting any influence of (un)correlated noise, the quality
and accuracy of the fit is optimal. The ψ = 0 line was therefore omitted. Cropping the
autocorrelation spectrum to a 16×16 region and fitting with a 3D free diffusion model
yields a diffusion coefficient D = 8.5 ± 0.2 µm2/s. Very similar values were obtained
by varying crop size. It is clear, by comparing the measured spectrum with the fitted
spectrum, that the effective value of G(0,0) is lower than the noise-containing
spectrum might suggest. Measurements performed in MWPR yield a diffusion
coefficient D = 6.7 ± 0.4 µm2/s. Parameter values are summarized in Table I.
2D diffusion measurements in cell membrane
A scanned image (scan speed 2: τp = 102.4 µs/pixel) of a single OLN-93 GS cell
expressing MOG-eGFP is shown in Fig. 3A. The image series contained 65 images.
The regions of interest (ROIs) for RICS analysis were selected on the basis of
apparent homogeneity and were taken at some distance from the cell borders. Seven
64x64 ROIs with a relative horizontal shift of 32 pixels were analyzed for simple 2D
diffusion. For clarity, only four of the seven ROIs are shown in Fig. 3A. The average
diffusion coefficient is 0.10 ± 0.01 µm2/s. Fig. 3C and 3D show the fitted spectrum
and corresponding residuals for ROI 3 depicted in Fig. 3A.
12

A set of three FRAP experiments using a bleached area with a diameter of 50 pixels
(= 2.75 µm) yielded an average diffusion coefficient D = 0.19 ± 0.04 µm2/s. The
immobile fraction was 0.67 ± 0.12.
Negative control experiments were performed on fixed cells. The value of the
diffusion coefficient recovered by FRAP experiments was on the order of 2x10⁻⁴
µm2/s. In the RICS experiments (scan speed 2, 75 images), various 64x64 regions
were considered and formally analyzed for 2D diffusion. The values for the diffusion
coefficients at convergence during the least squares search exhibited very strong
dependence on the initial guess. The sum of the weighted squared residuals (SWSR)
is within a very broad range essentially independent on the value of the diffusion
coefficient when fixed in the analysis and equals the value of the SWSR obtained
when the diffusion coefficient is fixed to zero. This is in contrast with the dependence
of the SWSR on the value of the diffusion coefficient when fixed in the analysis of the
RICS data obtained on living cells. A similar pattern was found for analyses of
corresponding simulations.
13

DISCUSSION AND CONCLUSIONS
RICS is a non-invasive fluorimetric technique that can be performed on any
standard laser-scanning microscope. We implemented RICS on a Zeiss LSM510
META confocal laser-scanning microscope with one-photon excitation and analog
detection. Control measurements on FD2000S in isotropic solution were performed to
validate the method and the in-house software for data analysis. Table I shows that the
measured and expected (Stokes-Einstein) values for the diffusion coefficient are quite
similar.
RICS characterization of the 2D membrane diffusion of MOG-eGFP yields
values for the diffusion coefficient in agreement with values reported for other
transmembrane proteins [34-37]. The average value of the diffusion coefficient is of
the same order as the value obtained with FRAP. However, comparison between
FRAP and RICS results cannot directly be made, even when the region of interest is
of comparable size. In a FRAP experiment, the mobility of the fluorescent molecules
in the non-bleached area is indirectly sampled as well, so that the recovered diffusion
coefficient is an average over a much wider area than the bleached spot. The value of
the diffusion coefficient obtained in RICS is more locally defined. RICS is more
appropriate for detecting different molecular mobilities in spatially different areas of
the cell membrane. This allows for mapping of the diffusion coefficient over the cell
membrane. The current implementation of RICS does not allow for determination of
immobile fractions. According to our knowledge, this is the first time that RICS has
been applied to study the membrane diffusion in living oligodendroglial cells.
14

So far, we have only considered simple 2D diffusion models. Future
experiments will be designed in order to find out about possible hindered diffusion of
MOG-eGFP in the plasma membrane of OLN-93 GS cells. Measurements at 37°C
and spatial mapping of diffusion coefficients over the cell surface under varying
conditions (e.g. cholesterol depletion) are in progress. Further studies will comprise
the inherent dimerization properties of the MOG molecule [38] and the possible
interference of the eGFP moieties [39] on this will be explored.
ACKNOWLEDGEMENTS We sincerely thank Prof. C. Richter-Landsberg for the generous gift of the OLN-93
oligodendroglial cells, Dr. W. Baron and Prof. D. Hoekstra for adapting the OLN-93
MOG-eGFP cell line, Prof. E. Gratton and Dr. M. Digman, Laboratory for
Fluorescence Dynamics, University of Irvine, USA, for their help with RICS training
and data analysis, Drs. K. Weisshart and M. Marx, Zeiss, Jena, Germany, for tracking
scan parameter information, and Mrs. H. Penxten for performing viscosity
measurements. This work was funded by the Research Council of the UHhasselt, tUL,
the K.U.Leuven (GOA/2006/02) and by a Ph.D grant of the Institute for the
Promotion of Innovation through Science and Technology in Flanders
(IWT-Vlaanderen). Support by the project IAP Functional Supramolecular Systems is
gratefully acknowledged.
15

REFERENCE LIST
1. A. Kusumi, I. Koyama-Honda, and K. Suzuki, (2004), Molecular dynamics and
interactions for creation of stimulation-induced stabilized rafts from small unstable
steady-state rafts, Traffic 5(4), 213-230.
2. K. Simons, and E. Ikonen, (1997), Functional rafts in cell membranes, Nature
387(6633), 569-572.
3. P.F. Bartlett, and I.R. Mackay, (1983), The oligodendroglial cell: biology and
immunology and relationship to multiple sclerosis, J. Clin. Lab. Immunol. 11(1), 1-
7.
4. N. Baumann, and D. Pham-Dinh, (2001), Biology of oligodendrocyte and myelin in
the mammalian central nervous system, Physiol Rev. 81(2), 871-927.
5. H. de Vries, and D. Hoekstra, (2000), On the biogenesis of the myelin sheath:
cognate polarized trafficking pathways in oligodendrocytes, Glycoconj.J. 17(3-4),
181-190.
6. E. Gielen, W. Baron, M. vandeVen, P. Steels, D. Hoekstra, and M. Ameloot,
(2006), Rafts in oligodendrocytes: evidence and structure-function relationship,
Glia 54(6), 499-512.
7. D.A. Brown, and J.K. Rose, (1992), Sorting of GPI-anchored proteins to glycolipid-
enriched membrane subdomains during transport to the apical cell surface, Cell
68(3), 533-544.
8. L.S. DeBruin, J.D. Haines, L.A. Wellhauser, G. Radeva, V. Schonmann, D. Bienzle,
and G. Harauz, (2005), Developmental partitioning of myelin basic protein into
16

membrane microdomains, J Neurosci Res 80(2), 211-225.
9. C.M. Taylor, T. Coetzee, and S.E. Pfeiffer, (2002), Detergent-insoluble
glycosphingolipid/cholesterol microdomains of the myelin membrane, J Neurochem
81(5): 993-1004.
10. H. Heerklotz, (2002), Triton promotes domain formation in lipid raft mixtures,
Biophys J 83(5), 2693-2701.
11. H. Heerklotz, H. Szadkowska, T. Anderson, and J. Seelig, (2003), The sensitivity of
lipid domains to small perturbations demonstrated by the effect of Triton, J Mol
Biol 329(4), 793-799.
12. H. Shogomori, and D.A. Brown, (2003), Use of detergents to study membrane rafts:
the good, the bad, and the ugly, Biol Chem 384(9), 1259-1263.
13. D. Marguet, P.F. Lenne, H. Rigneault, and H.T. He, (2006), Dynamics in the
plasma membrane: how to combine fluidity and order, EMBO J 25(15), 3446-3457.
14. R. Rigler, and E.S. Elson (2001) Fluorescence Correlation Spectroscopy: Theory
and Applications, Springer, New York.
15. K. Bacia, and P. Schwille, (2003), A dynamic view of cellular processes by in vivo
fluorescence auto- and cross-correlation spectroscopy, Methods 29(1), 74-85.
16. E. Haustein, and P. Schwille, (2004), Single-molecule spectroscopic methods, Curr
Opin Struct Biol 14(5), 531-540.
17. J. Humpolikova, E. Gielen, A. Benda, V. Fagulova, J. Vercammen, M. vandeVen,
M. Hof, M. Ameloot, and Y. Engelborghs, (2006), Probing diffusion laws within
cellular membranes by Z-scan fluorescence correlation spectroscopy, Biophys J
17
91(3), L23-25.
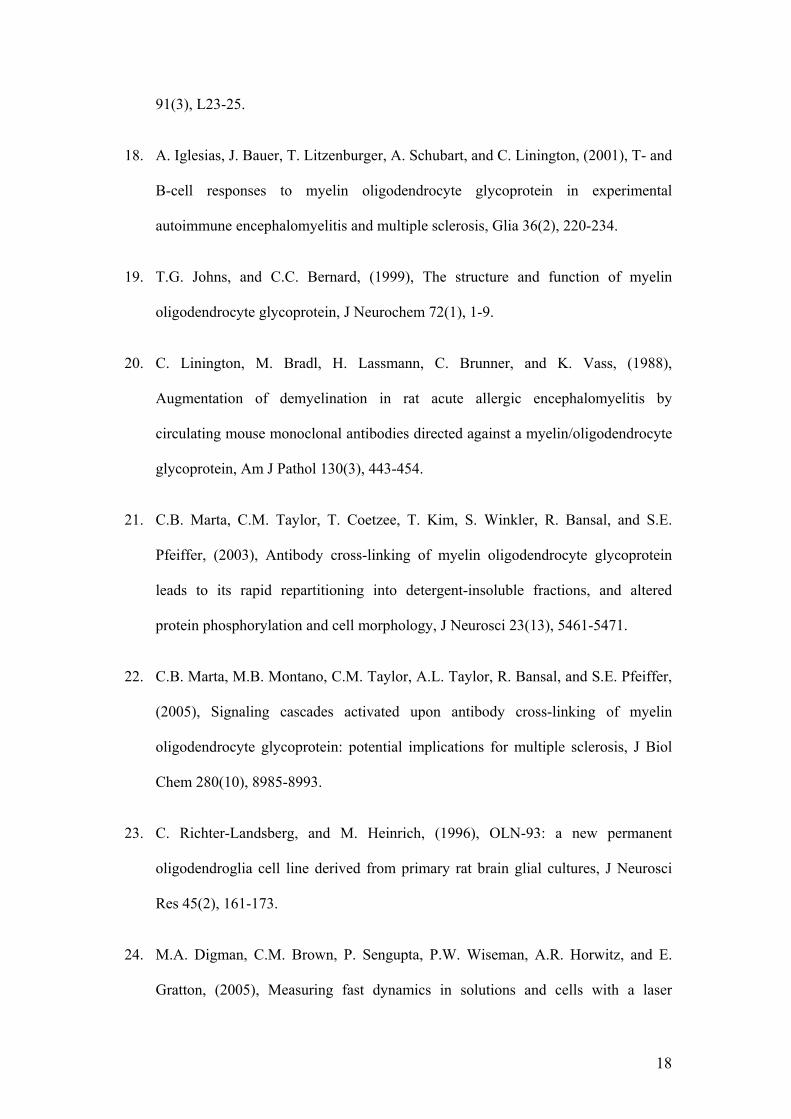
18. A. Iglesias, J. Bauer, T. Litzenburger, A. Schubart, and C. Linington, (2001), T- and
B-cell responses to myelin oligodendrocyte glycoprotein in experimental
autoimmune encephalomyelitis and multiple sclerosis, Glia 36(2), 220-234.
19. T.G. Johns, and C.C. Bernard, (1999), The structure and function of myelin
oligodendrocyte glycoprotein, J Neurochem 72(1), 1-9.
20. C. Linington, M. Bradl, H. Lassmann, C. Brunner, and K. Vass, (1988),
Augmentation of demyelination in rat acute allergic encephalomyelitis by
circulating mouse monoclonal antibodies directed against a myelin/oligodendrocyte
glycoprotein, Am J Pathol 130(3), 443-454.
21. C.B. Marta, C.M. Taylor, T. Coetzee, T. Kim, S. Winkler, R. Bansal, and S.E.
Pfeiffer, (2003), Antibody cross-linking of myelin oligodendrocyte glycoprotein
leads to its rapid repartitioning into detergent-insoluble fractions, and altered
protein phosphorylation and cell morphology, J Neurosci 23(13), 5461-5471.
22. C.B. Marta, M.B. Montano, C.M. Taylor, A.L. Taylor, R. Bansal, and S.E. Pfeiffer,
(2005), Signaling cascades activated upon antibody cross-linking of myelin
oligodendrocyte glycoprotein: potential implications for multiple sclerosis, J Biol
Chem 280(10), 8985-8993.
23. C. Richter-Landsberg, and M. Heinrich, (1996), OLN-93: a new permanent
oligodendroglia cell line derived from primary rat brain glial cultures, J Neurosci
Res 45(2), 161-173.
24. M.A. Digman, C.M. Brown, P. Sengupta, P.W. Wiseman, A.R. Horwitz, and E.
Gratton, (2005), Measuring fast dynamics in solutions and cells with a laser
18
scanning microscope, Biophys J 89(2), 1317-1327.
25. M.A. Digman, P. Sengupta, P.W. Wiseman, C.M. Brown, A.R. Horwitz, and E.
Gratton, (2005), Fluctuation correlation spectroscopy with a laser-scanning
microscope: exploiting the hidden time structure, Biophys J 88(5), L33-36.
26. N.O. Petersen, P.L. Hoddelius, P.W. Wiseman, O. Seger, and K.E. Magnusson,
(1993), Quantitation of membrane receptor distributions by image correlation
spectroscopy: concept and application, Biophys J 65(3), 1135-1146.
27. B. Hebert, S. Costantino, and P.W. Wiseman, (2005), Spatiotemporal image
correlation spectroscopy (STICS) theory, verification, and application to protein
velocity mapping in living CHO cells, Biophys J 88(5), 3601-3614.
28. B.K. Muller, E. Zaychikov, C. Brauchle, and D.C. Lamb, (2005), Pulsed interleaved
excitation, Biophys J 89(5), 3508-3522.
29. N.O. Petersen, (1986), Scanning fluorescence correlation spectroscopy. I. Theory
and simulation of aggregation measurements, Biophys J 49(4), 809-815.
30. K. Braeckmans, L. Peeters, N.N. Sanders, S.C. De Smedt, and J. Demeester, (2003),
Three-dimensional fluorescence recovery after photobleaching with the confocal
scanning laser microscope, Biophys J 85(4), 2240-2252.
31. K. Braeckmans, K. Remaut, R.E. Vandenbroucke, B. Lucas, S.C. De Smedt, and J.
Demeester, (2007), Line FRAP with the confocal laser scanning microscope for
diffusion measurements in small regions of 3-D samples, Biophys J 92(6), 2172-
2183.
32. S. Costantino, S.J.W. Comeau, D.L. Kolin, and P.W. Wiseman, (2005), Accuracy
and dynamic range of spatial image correlation and
19

cross-correlation spectroscopy, Biophys J 89(2), 1251-1260. (http://wiseman-
group.mcgill.ca/colin.php)
33. D.M. Soumpasis, (1983), Theoretical analysis of fluorescence photobleaching
recovery experiments, Biophys J 41(1): 95-97.
34. W.W. Webb, L.S. Barak, D.W. Tank, and E.S. Wu, (1981), Molecular mobility on
the cell surface, Biochem Soc Symp (46), 191-205.
35. M. Srivastava, and N.O. Petersen, (1998), Diffusion of transferrin receptor clusters,
Biophys Chem 75(3), 201-211.
36. P.W. Wiseman, J.A. Squier, M.H. Ellisman, and K.R. Wilson, (2000), Two-photon
image correlation spectroscopy and image cross-correlation spectroscopy, J Microsc
200(Pt1), 14-25.
37. A.K. Kenworthy, B.J. Nichols, C.L. Remmert, G.M. Hendrix, M. Kumar, J.
Zimmerberg, and J. Lippincott-Schwartz, (2004), Dynamics of putative raft-
associated proteins at the cell surface, J Cell Biol 165(5), 735-746.
38. P. Hjelsmström, J.E. Penzotti, R.M. Henne, and T.P. Lybrand, (1998), A molecular
model of myelin oligodendrocyte glycoprotein, J Neurochem 71, 1742-1749.
39. R.Y. Tsien, (1998), The green fluorescent protein, Annu Rev Biochem 67: 509- 544.
20

FIGURE LEGENDS Figure 1 (A) Raster-scan images contain temporal information because pixels are
recorded sequentially. Note that RICS analysis requires oversampling of the PSF, i.e.
δr has to be substantially smaller than the width of the PSF. (B) Graphical
representation of the 2D spatial correlation of a raster-scan image obtained by shifting
a duplicate of the picture (depicted in dashed lines) over ξ and ψ, respectively, the
horizontal and vertical directions. The corresponding mathematical expression is
given in Eq. (4).
Figure 2 (A) Measured correlation spectrum (truncated along the GS(ξ,ψ) axis for
display purposes); (B) standard deviation plot; (C) fitted correlation spectrum (3D
free diffusion model) and (D) corresponding weighted residuals of FD2000S diffusing
freely in TRIS buffer pH 10. 100 images were collected at scan speed 9. τp = 1.6
µs/pixel; τl = 1.92 ms; T = 28°C. Parameter values are summarized in Table I.
Figure 3 (A) Fluorescence image of a single OLN-93 MOG-eGFP GS cell; (B)
standard deviation plot; (C) fitted autocorrelation curve (2D free diffusion model) and
(D) corresponding weighted residuals of ROI 3 (64x64 pixels; total area of 12.4 µm²)
depicted in (A). 65 images were collected at scan speed 2. τp = 102.4 µs/pixel; τl =
122.9 ms; T = 23°C.
21

FIGURES
Figure 1
22
GS(ξ,ψ)
Correlation spectrum
0.025
0.020
0.015
0.010
0.005
0
155
-10-5
0 510
10
-15-15
15
-10-5
0
ψ ξ
0.0100.0080.0060.0040.002
0
ψ ξ
8
-10 -8 -6-5
0 05
4-4 -2 2 6
10
GS(ξ,ψ)
Fitted correlation spectrum Weighted residuals
3210
-1-2
ψ ξ
8
-10 -8 -6-5
0 05
4-4 -2 2 6
10
∆GS(ξ,ψ)
/σ
4.54.03.53.02.5
2.01.51.0
σ(ξ,ψ)
Standard deviation
ψ ξ
8
-8 -8 -6-6
00
6
4
-4 -22
6
8
-4-2
24
x10-4
A B
C D
GS(ξ,ψ)
Correlation spectrum
0.025
0.020
0.015
0.010
0.005
0
155
-10-5
0 510
10
-15-15
15
-10-5
0
ψ ξ
0.0100.0080.0060.0040.002
0
ψ ξ
8
-10 -8 -6-5
0 05
4-4 -2 2 6
10
GS(ξ,ψ)
Fitted correlation spectrum Weighted residuals
3210
-1-2
ψ ξ
8
-10 -8 -6-5
0 05
4-4 -2 2 6
10
∆GS(ξ,ψ)
/σ
4.54.03.53.02.5
2.01.51.0
σ(ξ,ψ)
Standard deviation
ψ ξ
8
-8 -8 -6-6
00
6
4
-4 -22
6
8
-4-2
24
x10-4
GS(ξ,ψ)
Correlation spectrum
0.025
0.020
0.015
0.010
0.005
0
155
-10-5
0 510
10
-15-15
15
-10-5
0
ψ ξ
0.0100.0080.0060.0040.002
0
ψ ξ
8
-10 -8 -6-5
0 05
4-4 -2 2 6
10
GS(ξ,ψ)
Fitted correlation spectrum
GS(ξ,ψ)
Correlation spectrum
0.025
0.020
0.015
0.010
0.005
0
155
-10-5
0 510
10
-15-15
15
-10-5
0
ψ ξ
GS(ξ,ψ)
Correlation spectrum
0.025
0.020
0.015
0.010
0.005
0
155
-10-5
0 510
10
-15-15
15
-10-5
0
ψ ξ
155
-10-5
0 510
10
-15-15
15
-10-5
0
ψ ξ
0.0100.0080.0060.0040.002
0
ψ ξ
8
-10 -8 -6-5
0 05
4-4 -2 2 6
10
GS(ξ,ψ)
Fitted correlation spectrum
0.0100.0080.0060.0040.002
0
ψ ξ
8
-10 -8 -6-5
0 05
4-4 -2 2 6
10
ψ ξ
8
-10 -8 -6-5
0 05
4-4 -2 2 6
10
GS(ξ,ψ)
Fitted correlation spectrum Weighted residuals
3210
-1-2
ψ ξ
8
-10 -8 -6-5
0 05
4-4 -2 2 6
10
∆GS(ξ,ψ)
/σ
Weighted residuals
3210
-1-2
ψ ξ
8
-10 -8 -6-5
0 05
4-4 -2 2 6
10
ψ ξ
8
-10 -8 -6-5
0 05
4-4 -2 2 6
10
∆GS(ξ,ψ)
/σ
4.54.03.53.02.5
2.01.51.0
σ(ξ,ψ)
Standard deviation
ψ ξ
8
-8 -8 -6-6
00
6
4
-4 -22
6
8
-4-2
24
x10-4
4.54.03.53.02.5
2.01.51.0
σ(ξ,ψ)
Standard deviation
ψ ξ
8
-8 -8 -6-6
00
6
4
-4 -22
6
8
-4-2
24
x10-4
A B
C D
Figure 2
23

A
1 2 3 4
C
GS(ξ,ψ)
Fitted correlation spectrum
ψ ξ
0.010
0.005
0
-102020
-20 -20 -10 0 10010
Weighted residuals
1
0
-1ΔGS(ξ,ψ)
/σ
-102020
-20 -20 -10 0 10010
ψ ξ
D
ψ ξ-20 -20
Standard deviation
0.010
0.005
0
σ(ξ,ψ)
-102020
-10 0 10010
BA
1 2 3 4
C
GS(ξ,ψ)
Fitted correlation spectrum
ψ ξ
0.010
0.005
0
-102020
-20 -20 -10 0 10010
Weighted residuals
1
0
-1ΔGS(ξ,ψ)
/σ
-102020
-20 -20 -10 0 10010
ψ ξ
D
ψ ξ-20 -20
Standard deviation
0.010
0.005
0
σ(ξ,ψ)
-102020
-10 0 10010
BA
1 2 3 4
C
GS(ξ,ψ)
Fitted correlation spectrum
ψ ξ
0.010
0.005
0
-102020
-20 -20 -10 0 10010
A
1 2 3 4
A
1 2 3 41 2 3 41 2 3 4
C
GS(ξ,ψ)
Fitted correlation spectrum
ψ ξ
0.010
0.005
0
-102020
-20 -20 -10 0 10010
C
GS(ξ,ψ)
Fitted correlation spectrum
ψ ξ
0.010
0.005
0
-102020
-20 -20 -10 0 10010
GS(ξ,ψ)
Fitted correlation spectrum
ψ ξψ ξ
0.010
0.005
0
-102020
-20-20 -20-20 -10-10 00 1010010
Weighted residuals
1
0
-1ΔGS(ξ,ψ)
/σ
-102020
-20 -20 -10 0 10010
ψ ξ
D Weighted residuals
1
0
-1ΔGS(ξ,ψ)
/σ
-102020
-20-20 -20-20 -10-10 00 1010010
ψ ξψ ξ
D
ψ ξψ ξ-20-20 -20-20
Standard deviation
0.010
0.005
0
σ(ξ,ψ)
-102020
-10-10 00 1010010
B
Figure 3
24

Table I Summary of 3D diffusion measurements on FD2000S in isotropic solution
Solution Viscosity (mPa.s)
T (°C)
τp (µs)
τl (ms) D (µm²/s) Dexpected (Stokes-
Einstein) (µm²/s) Tris buffer 0.78 28 0.91 1.09 8.5 ± 0.2* 8.6
MWPR 0.92 23 0.91 1.09 6.7 ± 0.4* 7.2 *Uncertainties are reported as standard deviations.
25
Related Documents


![Myelin oligodendrocyte glycoprotein-specific antibodies from ......protein (MBP)] used to induce experimental autoimmune encephalomyelitis (EAE) in rodent models through induction](https://static.cupdf.com/doc/110x72/60ff0b7639f1f130b4007123/myelin-oligodendrocyte-glycoprotein-specific-antibodies-from-protein-mbp.jpg)