Differential target gene activation by TBX2 and TBX2VP16: evidence for activation domain-dependent modulation of gene target specificity Nataliya V. Butz, Christine E. Campbell, Richard M. Gronostajski * Department of Biochemistry, School of Medicine and Biomedical Sciences, State University of New York at Buffalo, 140 Farber Hall, 3435 Main St., Buffalo, NY 14214, USA Received 7 April 2004; received in revised form 6 July 2004; accepted 26 July 2004 Available online 21 September 2004 Received by A.J. van Wijnen Abstract The determinants of in vivo target site selectivity by transcription factors are poorly understood. To find targets for the developmentally regulated transcription factor TBX2, we generated stable transfectants of human embryonic kidney cells (293) that express a TBX2-ecdysone receptor (EcR) chimeric protein. While constitutive expression of TBX2 is toxic to 293 cells, clones expressing TBX2EcR are viable in the absence of an EcR ligand. Using cDNA arrays and quantitative PCR, we discovered nine genes whose expression was increased, but no genes whose expression was reduced, following 24 h of induction with Ponasterone A (PonA), a ligand for EcR. Since TBX2 was reported previously to be a transcriptional repressor, we also generated cell lines expressing a TBX2VP16EcR protein which we showed was a potent conditional transcriptional activator in transient transfection assays. Treatment of these cells with PonA induced the expression of five genes, none of which were affected in TBX2EcR-expressing cells. This discordance between TBX2- and TBX2VP16-regulated genes strongly suggests that specific transactivation domains can be a major determinant of gene target site selectivity by transcription factors that possess the same DNA-binding domain. D 2004 Elsevier B.V. All rights reserved. Keywords: T-box; Transactivation; Selectivity; Transcription; Lethality 1. Introduction TBX2 is a member of the highly conserved T-box family of transcription factors. Multiple T-box genes are present in all metazoa examined but have not been found in bacteria, yeast or plants. Members of this gene family are essential for normal embryonic development in a variety of organisms including nematodes, fruitflies, frogs, zebrafish and mammals (Smith, 1999). Mutations have been generated in nine murine T-box genes including T (Stott et al., 1993), Tbx1 (Jerome and Papaioannou, 2001), Tbx3 (Davenport et al., 2003), Tbx4 (Naiche and Papaioannou, 2003) and others. In all cases, inactivating mutations lead to developmental abnormalities in a subset of the tissues in which the gene is normally expressed. Mutations in TBX3 , TBX5 , TPIT and TBX22 are found in patients with ulnar mammary syndrome (Bamshad et al., 1997), Holt Oram sydrome (Li et al., 1997), adrenocorti- cotrophin deficiency (Pulichino et al., 2003) and cleft palate with ankyloglossia (Braybrook et al., 2001), respectively. Mutations in several T-box genes, including Tbx1, TBX3 and TBX5 , have phenotypes in the hetero- zygous state, suggesting that gene function is highly dose- dependent. Since T-box genes play essential roles in a variety of developmental processes, determination of the mechanism of target gene selectivity by T-box proteins is an important goal. 0378-1119/$ - see front matter D 2004 Elsevier B.V. All rights reserved. doi:10.1016/j.gene.2004.07.024 Abbreviations: aa, amino acids; hGal, h-galactosidase; CMV, cytome- galovirus; Cy-3, -5, cyanine-3, -5; EcR, ecdysone receptor; HA, hemag- glutinin; HSV, Herpes simplex virus; LBD, ligand binding domain; Luc, luciferase; PonA, Ponasterone A; QPCR, quantitative polymerase chain reaction; ROS, reactive oxygen species; VP16, Herpes simplex virus protein 16. * Corresponding author. Tel.: +1 716 829 3471; fax: +1 716 829 2725. E-mail address: [email protected] (R.M. Gronostajski). Gene 342 (2004) 67 – 76 www.elsevier.com/locate/gene

Welcome message from author
This document is posted to help you gain knowledge. Please leave a comment to let me know what you think about it! Share it to your friends and learn new things together.
Transcript
www.elsevier.com/locate/gene
Gene 342 (200
Differential target gene activation by TBX2 and TBX2VP16: evidence for
activation domain-dependent modulation of gene target specificity
Nataliya V. Butz, Christine E. Campbell, Richard M. Gronostajski*
Department of Biochemistry, School of Medicine and Biomedical Sciences, State University of New York at Buffalo, 140 Farber Hall, 3435 Main St.,
Buffalo, NY 14214, USA
Received 7 April 2004; received in revised form 6 July 2004; accepted 26 July 2004
Available online 21 September 2004
Received by A.J. van Wijnen
Abstract
The determinants of in vivo target site selectivity by transcription factors are poorly understood. To find targets for the developmentally
regulated transcription factor TBX2, we generated stable transfectants of human embryonic kidney cells (293) that express a TBX2-ecdysone
receptor (EcR) chimeric protein. While constitutive expression of TBX2 is toxic to 293 cells, clones expressing TBX2EcR are viable in the
absence of an EcR ligand. Using cDNA arrays and quantitative PCR, we discovered nine genes whose expression was increased, but no
genes whose expression was reduced, following 24 h of induction with Ponasterone A (PonA), a ligand for EcR. Since TBX2 was reported
previously to be a transcriptional repressor, we also generated cell lines expressing a TBX2VP16EcR protein which we showed was a potent
conditional transcriptional activator in transient transfection assays. Treatment of these cells with PonA induced the expression of five genes,
none of which were affected in TBX2EcR-expressing cells. This discordance between TBX2- and TBX2VP16-regulated genes strongly
suggests that specific transactivation domains can be a major determinant of gene target site selectivity by transcription factors that possess
the same DNA-binding domain.
D 2004 Elsevier B.V. All rights reserved.
Keywords: T-box; Transactivation; Selectivity; Transcription; Lethality
1. Introduction
TBX2 is a member of the highly conserved T-box
family of transcription factors. Multiple T-box genes are
present in all metazoa examined but have not been found
in bacteria, yeast or plants. Members of this gene family
are essential for normal embryonic development in a
variety of organisms including nematodes, fruitflies, frogs,
zebrafish and mammals (Smith, 1999). Mutations have
0378-1119/$ - see front matter D 2004 Elsevier B.V. All rights reserved.
doi:10.1016/j.gene.2004.07.024
Abbreviations: aa, amino acids; hGal, h-galactosidase; CMV, cytome-
galovirus; Cy-3, -5, cyanine-3, -5; EcR, ecdysone receptor; HA, hemag-
glutinin; HSV, Herpes simplex virus; LBD, ligand binding domain; Luc,
luciferase; PonA, Ponasterone A; QPCR, quantitative polymerase chain
reaction; ROS, reactive oxygen species; VP16, Herpes simplex virus
protein 16.
* Corresponding author. Tel.: +1 716 829 3471; fax: +1 716 829 2725.
E-mail address: [email protected] (R.M. Gronostajski).
been generated in nine murine T-box genes including T
(Stott et al., 1993), Tbx1 (Jerome and Papaioannou, 2001),
Tbx3 (Davenport et al., 2003), Tbx4 (Naiche and
Papaioannou, 2003) and others. In all cases, inactivating
mutations lead to developmental abnormalities in a subset
of the tissues in which the gene is normally expressed.
Mutations in TBX3, TBX5, TPIT and TBX22 are found in
patients with ulnar mammary syndrome (Bamshad et al.,
1997), Holt Oram sydrome (Li et al., 1997), adrenocorti-
cotrophin deficiency (Pulichino et al., 2003) and cleft
palate with ankyloglossia (Braybrook et al., 2001),
respectively. Mutations in several T-box genes, including
Tbx1, TBX3 and TBX5, have phenotypes in the hetero-
zygous state, suggesting that gene function is highly dose-
dependent. Since T-box genes play essential roles in a
variety of developmental processes, determination of the
mechanism of target gene selectivity by T-box proteins is
an important goal.
4) 67–76

N.V. Butz et al. / Gene 342 (2004) 67–7668
Although it was among the first mammalian T-box genes
identified, there has yet to be a report of a mouse or a human
disorder associated with mutations in the TBX2 gene.
However, studies on mis-expression of Tbx2 in developing
chick limbs suggest that both Tbx2 and the highly related
Tbx3 genes are involved in specifying digit identity (Suzuki
et al., 2004). Tbx2 is expressed in a number of other
locations during murine embryonic development including
the otic vesicle, lungs, heart, kidneys and mammary glands
(Chapman et al., 1996). Tbx2 is also expressed in adult mice
and humans in lungs, kidneys, heart and placenta (Campbell
et al., 1995) and likely plays important roles in the
development of one or more of these tissues.
While all members of the T-box family of proteins
possess a highly conserved T-box DNA-binding domain, the
downstream target specificity of various family members
likely differ. We showed previously that differences in DNA
binding and transcriptional regulatory activity between
single T-box proteins can be detected on a simple chimeric
promoter (Sinha et al., 2000); however, the situation is
likely to be more complex on endogenous promoters. To
determine whether the T-box DNA-binding domain was the
major determinant for gene target specificity of TBX2 in
293 cells, we asked whether two proteins with the same
DNA-binding domain but different transcriptional modu-
lation domains affected the same target genes. Surprisingly,
TBX2EcR and TBX2VP16EcR activated the expression of
completely distinct sets of genes in 293 cells. These data
indicate that the DNA-binding domain of TBX2, while
essential for transcriptional regulation, is strongly influ-
enced by cis-acting transcriptional modulation domains in
determining its specificity for target genes.
2. Methods
2.1. Vector constructs
The TBX2-EcR fusion construct was made by cloning
the sequence encoding residues 321–878 of the Drosophila
ecdysone receptor ligand binding domain (EcR LBD) in
frame and downstream of the entire TBX2 coding sequence
in HA-TBX2 (Sinha et al., 2000). The construct directing
the expression of the TBX2VP16-EcR fusion protein was
made by fusing fragments encoding residues 3–80 of the
transactivation domain from the Herpes simplex virus
protein 16 (VP16) and residues 321–878 of the EcR to the
sequence encoding residues 1–411 of TBX2 in HA-TBX2.
The R122A mutants had an alanine replacing arginine 122
of TBX2 and have no detectable DNA-binding activity
(Sinha et al., 2000).
2.2. Cell culture and stable transfection assay
293 cells were maintained in a-Minimum Essential
Medium (Invitrogen) containing 10% fetal calf serum and
antibiotics (penicillin–streptomycin) at 37 8C/5% CO2.
These cells were chosen for analysis because TBX2 is
expressed in embryonic kidney and preliminary data
showed low levels of TBX2 in 293 cells by DNA-binding
assays and supershifting with antiTbx2 antibodies (not
shown). The role of Tbx2 in kidney is unknown. Twenty-
four hours prior to transfection, cells were seeded in
duplicate in 35-mm dishes at a density of 2�105 cells per
dish. Cells were co-transfected with a puromycin-select-
able plasmid and the TBX2EcR or TBX2VP16EcR
expression vectors using lipofectamine reagent (Invitro-
gen). Two days following the DNA transfection, each 35-
mm dish was split into two 100-mm dishes and puromycin
(1 Ag/ml) was added to the medium the following day.
Stable clones were isolated after 10–14 days and main-
tained in medium containing puromycin. Based on West-
ern blots, approximately 50% of the clones expressed
proteins of the expected size. The levels of TBX2EcR and
TBX2EcRVP16 expressed in the transfectants was ~10
times the levels of endogenous TBX2 in 293 cells and
was equal to that seen in some breast cancer cell lines
including MCF7 (not shown). Where indicated, cells were
treated with PonA (Invitrogen) in EtOH (final concen-
tration, 15 AM) or EtOH alone for the times given in the
figure legends.
2.3. Transient transfection assay
Twenty-four hours before transfection, cells were
seeded in duplicate in 35-mm dishes at a density
2�105 cells per dish. To assess the transcriptional
modulatory properties of TBX2EcR, cells were trans-
fected using lipofectamine (Invitrogen) with the indicated
amounts of a vector expressing TBX2EcR, 1 Ag of
p14ARF-642Luc reporter plasmid (gift from Dr. D.
Holzschu) and 50 ng CMVhGal (MacGregor and
Caskey, 1989) to normalize for transfection efficiency.
To test the function of stably expressed TBX2VP16EcR,
cells were transiently transfected with 1 Ag 4xT/
2HSVtkLuc reporter (Sinha et al., 2000) and 50 ng
CMVhGal. Transfected cells were treated with PonA or
EtOH for 24 h and extracts were prepared and assayed
using the Luciferase Assay system Kit (Promega) as
instructed by the manufacturer. Luciferase values were
normalized to h-galactosidase activity levels. Transfections
were performed in duplicate in at least two independent
experiments.
2.4. Long-term growth inhibition assay
Cells were seeded in 6 well dishes at a density 2�104
cells/well and grown for 20 days (split 1:20 on day 10).
PonA (or EtOH) was added on days 1, 4, 7 and 10 to a
final concentration 10 AM. On day 20, the plates were
stained with Coomassie blue to visualize the differences
in growth.
N.V. Butz et al. / Gene 342 (2004) 67–76 69
2.5. Microarray studies
Total RNA was isolated 24 h after PonA (or EtOH)
addition. In initial studies, probes were labeled with Cy-3
and Cy-5 fluorescent dyes and hybridized to microarrays
containing oligonucleotides for ~21,000 human mRNAs (U.
Cincinnati Array Facility). In later studies, labeled probes
were hybridized to cDNA microarrays representing ~2500
human genes and ESTs (Roswell Park Cancer Institute).
Hybridizations were performed in triplicate with RNA from
three independent experiments using two different clones of
each stable cell line.
2.6. RNA extraction, cDNA synthesis and QPCR
Cells were harvested in Trizol (Invitrogen) at specific
times after PonA addition and total RNA was isolated
according to the manufacturer’s instructions. Total RNA (5
Ag) was reverse-transcribed at 42 8C for 50 min in the
presence of random hexamers and SuperScript II Reverse
Transcriptase (Invitrogen). mRNA expression levels were
measured by quantitative real-time PCR (QPCR). All
genes were amplified using the appropriate specific
primers (sequences available upon request). QPCR was
carried out with the SYBR Green QPCR Kit (Applied
Biosystems) using the Real-Time PCR instrument (Bio-
Rad) according to the manufacturer’s instructions. In each
reaction, gene expression levels were assayed in triplicate
and normalized to the level of h2-microglobulin. All
analyses were performed multiple times using RNA from
at least two independent experiments and two independent
clones.
2.7. Statistical analysis
Values representing fold change in transcript levels and
luciferase activity/h-galactosidase activity were analyzed
by calculation of the mean and standard deviation.
Statistical significance was evaluated using one-tailed, one-
sample t-test.
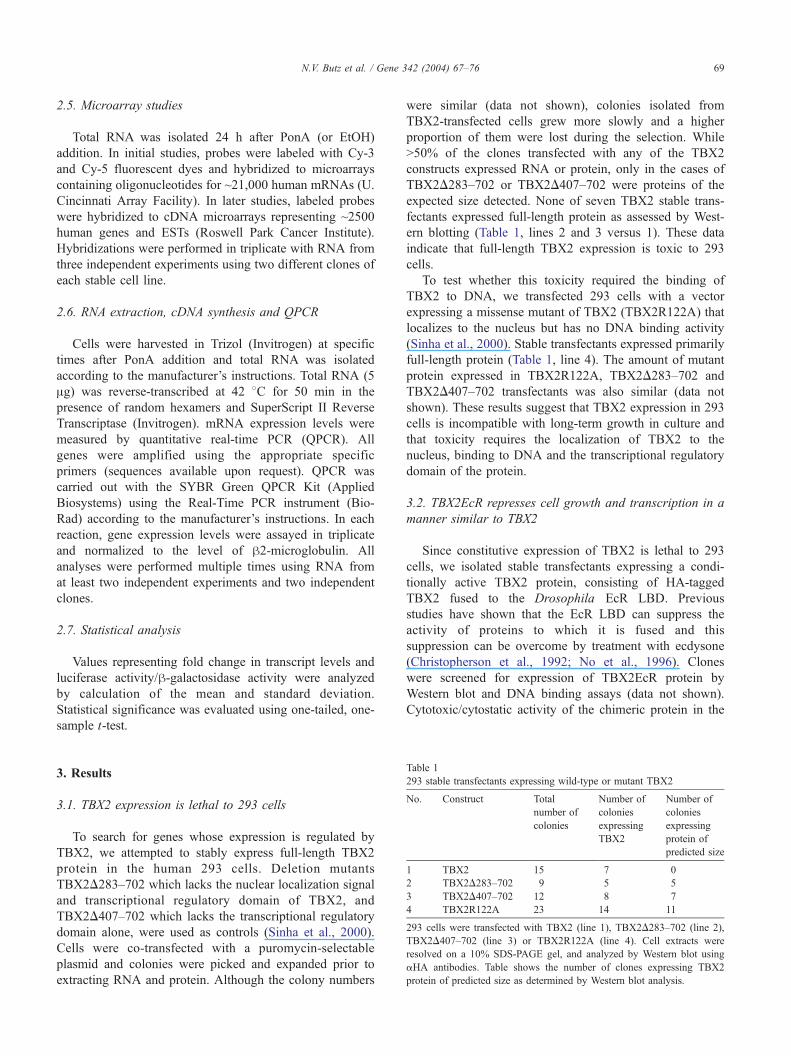
Table 1
293 stable transfectants expressing wild-type or mutant TBX2
No. Construct Total
number of
colonies
Number of
colonies
expressing
TBX2
Number of
colonies
expressing
protein of
predicted size
1 TBX2 15 7 0
2 TBX2D283–702 9 5 5
3 TBX2D407–702 12 8 7
4 TBX2R122A 23 14 11
293 cells were transfected with TBX2 (line 1), TBX2D283–702 (line 2),
TBX2D407–702 (line 3) or TBX2R122A (line 4). Cell extracts were
resolved on a 10% SDS-PAGE gel, and analyzed by Western blot using
aHA antibodies. Table shows the number of clones expressing TBX2
protein of predicted size as determined by Western blot analysis.
3. Results
3.1. TBX2 expression is lethal to 293 cells
To search for genes whose expression is regulated by
TBX2, we attempted to stably express full-length TBX2
protein in the human 293 cells. Deletion mutants
TBX2D283–702 which lacks the nuclear localization signal
and transcriptional regulatory domain of TBX2, and
TBX2D407–702 which lacks the transcriptional regulatory
domain alone, were used as controls (Sinha et al., 2000).
Cells were co-transfected with a puromycin-selectable
plasmid and colonies were picked and expanded prior to
extracting RNA and protein. Although the colony numbers
were similar (data not shown), colonies isolated from
TBX2-transfected cells grew more slowly and a higher
proportion of them were lost during the selection. While
N50% of the clones transfected with any of the TBX2
constructs expressed RNA or protein, only in the cases of
TBX2D283–702 or TBX2D407–702 were proteins of the
expected size detected. None of seven TBX2 stable trans-
fectants expressed full-length protein as assessed by West-
ern blotting (Table 1, lines 2 and 3 versus 1). These data
indicate that full-length TBX2 expression is toxic to 293
cells.
To test whether this toxicity required the binding of
TBX2 to DNA, we transfected 293 cells with a vector
expressing a missense mutant of TBX2 (TBX2R122A) that
localizes to the nucleus but has no DNA binding activity
(Sinha et al., 2000). Stable transfectants expressed primarily
full-length protein (Table 1, line 4). The amount of mutant
protein expressed in TBX2R122A, TBX2D283–702 and
TBX2D407–702 transfectants was also similar (data not
shown). These results suggest that TBX2 expression in 293
cells is incompatible with long-term growth in culture and
that toxicity requires the localization of TBX2 to the
nucleus, binding to DNA and the transcriptional regulatory
domain of the protein.
3.2. TBX2EcR represses cell growth and transcription in a
manner similar to TBX2
Since constitutive expression of TBX2 is lethal to 293
cells, we isolated stable transfectants expressing a condi-
tionally active TBX2 protein, consisting of HA-tagged
TBX2 fused to the Drosophila EcR LBD. Previous
studies have shown that the EcR LBD can suppress the
activity of proteins to which it is fused and this
suppression can be overcome by treatment with ecdysone
(Christopherson et al., 1992; No et al., 1996). Clones
were screened for expression of TBX2EcR protein by
Western blot and DNA binding assays (data not shown).
Cytotoxic/cytostatic activity of the chimeric protein in the

Fig. 1. TBX2EcR induces cell lethality in a manner similar to TBX2. Cells
stably expressing TBX2EcR were grown for 20 days as described inSection
2.4. PonA (line 3) or EtOH (line 2) were added in final concentration 10
AM. Plates were stained with Coomassie blue to determine the extent in
growth. A clone isolated from the puromycin selection but not expressing
TBX2EcR was used as a control.
N.V. Butz et al. / Gene 342 (2004) 67–7670
absence and presence of the ecdysone analog PonA was
assessed by a long-term growth inhibition assay. PonA
treatment of TBX2EcR-expressing clones resulted in
greatly reduced cell number compared to clones treated
with EtOH or non-treated (Fig. 1, column 3 versus
columns 2 and 1). No such differences were detected in
control cells which do not express TBX2EcR. These data
indicate that TBX2EcR likely induces cell lethality in a
manner similar to TBX2.
It has been reported previously that TBX2 represses the
transcription from the cell cycle inhibitor p19/p14ARF
Fig. 2. TBX2EcR represses transcription from p14ARF promoter in a manner sim
(Luc) activity as described in Section 2.3. The figure shows the luciferase activity f
activity (CMVhgal, 50 ng) in the presence of the indicated amounts (in microgram
(A, bar 3), TBX2EcR (B, bars 1–6) or TBX2R122AEcR (B, bars 7–12). TBX2EcR
for 24 h. Each construct was tested in duplicate. Values are the meanFS.D of th
promoter (Jacobs et al., 2000). We therefore used a
p14ARF-responsive reporter plasmid (p14ARF-642Luc) to
assess the transcriptional modulatory properties of
TBX2EcR. As expected, TBX2 represses p14ARF-642Luc
expression (Fig. 2A, bar 2 versus 1) while the DNA-binding
deficient mutant TBX2R122A represses to a much lesser
extent (Fig. 2A bar 3 versus 2). TBX2EcR also represses
p14ARF-642Luc in the presence of PonA, although more
weakly than TBX2 (Fig. 2B, bar 2 versus 1; bar 4 versus 3;
bar 6 versus 5). This somewhat weaker repression is
consistent with results we have obtained using other T-
box/EcR fusion proteins, where the addition of the EcR
LBD reduces to some degree the transcriptional modulatory
activity of the protein (unpublished data). The slight
repression by TBX2EcR in the presence of EtOH (Fig.
2B, bars 1, 3 and 5) may be due to proteolysis of TBX2EcR
generating low levels of TBX2 activity. As expected, the
TBX2EcR protein containing a mutation that abolishes
DNA binding caused little or no repression of p14ARF
expression (Fig. 2B, bars 7–12). These findings indicate that
TBX2EcR in the presence of PonA has similar biological
activities as native TBX2 and could be used for the
identification of genes whose expression is regulated by
TBX2.
3.3. Identification of TBX2 downstream target genes
To identify downstream target genes responsible for the
lethality seen in TBX2-expressing cells, we analyzed
global gene expression using long oligonucleotide and
cDNA microarrays. To distinguish early TBX2-induced
ilar to TBX2. (A, B) 293 cells were transfected and analyzed for luciferase
or p14ARF-642Luc (1 Ag) relative to control co-transfected h-galactosidases) of vectors expressing no TBX2 (A, bar 1), TBX2 (A, bar 2), TBX2R122A
and TBX2R122AEcR transfectants were treated with 15 AM PonA or EtOH
e luciferase activity divided by the h-galactosidase activity.

Fig. 3. Histogram is derived from microarray results and shows the range of
gene expression changes in TBX2EcR-expressing cells treated with 15 AMPonA for 24 h versus cells treated with EtOH (control).
N.V. Butz et al. / Gene 342 (2004) 67–76 71
changes from later alterations due to cell death, we
assessed gene expression changes in TBX2EcR cells after
24 h of PonA treatment. This time was chosen because
trypan blue exclusion studies indicated that little or no cell
death was occurring after 24 h of PonA treatment (data not
shown).
Our analysis showed that TBX2 does not have large
(5- to 10-fold) effects on transcript levels over the time
period analyzed. Only relatively small changes (V2–3fold) in gene expression were observed in TBX2EcR-
expressing cells treated with PonA (Fig. 3). To confirm
the microarray data, we assessed the gene transcript
Fig. 4. Genes up-regulated in TBX2EcR-expressing cells. Data represent fold chan
non-transfected 293 cells (diagonal bars) and TBX20EcR cells (dotted bars) treat
EtOH-treated cells were set to 1 (line). At 24 h after PonA addition, RNAwas coll
as described in Section 2.6. All reactions were performed multiple times using RNA
(n=2–17) QPCRsFS.D. ***pb0.0005, **pb0.005, *pb0.025.
levels in PonA-treated TBX2EcR cells using QPCR.
Sixty-five percent of the genes identified as up-regulated
in PonA-treated cells on the arrays showed reproducible
induction (9 of 14), whereas QPCR failed to confirm any
TBX2EcR-repressed genes (0 of 6 tested). We identified
nine genes, whose expression levels are induced 2- to 3-
fold in TBX2EcR cells treated with PonA compared to
EtOH-treated cells (Fig. 4, black bars versus line).
Results were confirmed using multiple RNA preparations
from two independently isolated TBX2EcR-expressing
clones.
Two other controls were used to confirm the specificity
of induction of gene expression in PonA-treated TBX2EcR
cells. There was no increase in expression levels of the
identified genes in non-transfected 293 cells treated with
PonA (Fig. 4, diagonal bars versus line), nor in 293 cells
stably expressing a TBX20EcR fusion construct (Fig. 4,
dotted bars versus line). Unlike TBX2, TBX20 expression is
not toxic to 293 cells although both proteins act as weak
repressors in transient transfection assays with a reporter
construct (data not shown).
We next used QPCR to determine the time course of
TBX2EcR-mediated gene activation. The nine genes up-
regulated upon TBX2 activation fall into two groups with
different expression patterns. Genes of the first set (PIG3,
TP53INP1, p21, ACTA2 and MMP2) exhibit maximal
expression at 24 h of PonA treatment with a subsequent
decrease (Fig. 5A). In contrast, CTGF, IER3, EGR1 and
DUSP6 are expressed more highly at 48 h than at 24 h
(Fig. 5B). Interestingly, CTGF expression drastically
increases at 48 h of TBX2 activation and maintains almost
the same level at 96 h. IER3 and MMP2 also maintain
high levels of induction at 96 h. While IER3, EGR1 and
CTGF expression levels begin to increase by 17 h after
PonA addition, none of the genes are induced at 6 h. Such
ges in expression levels of indicated genes in TBX2EcR cells (black bars),
ed with 15 AM PonA compared to EtOH-treated cells. Expression levels in
ected, reverse-transcribed and subjected to QPCR for mRNA quantification
from at least two independent experiments. Values are the mean of multiple

Fig. 6. TBX2VP16EcR activates TBX2-responsive reporter gene. Cells
stably expressing TBX2VP16EcR (bars 3–4) were transfected with 1 Ag of
4xT/2HSVtkLuc reporter plasmid and 50 ng CMVhgal, treated with 15 AMPonA or EtOH for 24 h and analyzed for luciferase and h-galactosidaseactivity as described in Section 2.3. A matched stable transfectant not
expressing TBX2VP16EcR protein was used as a negative control (bars 1–
2). Transfections were performed in duplicate in two independent experi-
ments. Values are the meanFS.D of the luciferase activity divided by the h-galactosidase activity.
Fig. 5. Time-dependent expression profiles of TBX2EcR-activated genes.
(A, B) Data represent fold induction in transcript levels in TBX2EcR-
expressing cells treated with PonA (15 AM) versus EtOH at different time
points. RNA was harvested at indicated time points of PonA treatment and
analyzed as in Fig. 4. Values are the meanFS.D.
N.V. Butz et al. / Gene 342 (2004) 67–7672
a slow time course of induction suggests that some or all
of the genes may be indirect rather than direct targets of
TBX2 (see Discussion).
3.4. Transcriptional modulatory domain affects the selec-
tivity of the target genes regulated by the TBX2 DNA-
binding domain
Since TBX2 had previously been shown to function as a
transcriptional repressor, it was somewhat surprising that we
did not identify any TBX2-repressed genes. In an effort to
generate a more potent modulator of TBX2-responsive genes
and to test whether TBX2 target gene specificity resides
solely in the DNA-binding domain, we made stable cell lines
expressing a chimeric TBX2 protein where the C-terminus of
TBX2 was replaced with the VP16 transactivation domain,
followed by the EcR LBD.
We assessed the activity of this chimeric protein in vivo
using the previously characterized TBX2-responsive
reporter construct 4xT/2HSVtkLuc (Sinha et al., 2000).
Native TBX2 represses the expression of this reporter gene
(Sinha et al., 2000). PonA treatment of cells expressing
TBX2VP16EcR resulted in an ~10-fold increase of lucifer-
ase activity from 4xT/2HSVtkLuc compared to EtOH-
treated cells (Fig. 6, bar 4 versus 3). No such increase
was seen in cells not expressing TBX2VP16EcR protein
(Fig. 6, bar 2 versus 1). These data indicate that
TBXVP16EcR can effectively activate the same TBX2-
responsive promoter that is repressed by TBX2.
Given the strong transcriptional activation by
TBX2VP16EcR, we examined the expression levels of the
previously determined TBX2EcR target genes in PonA-
treated TBX2VP16EcR-expressing cells by QPCR. Surpris-
ingly, genes activated in TBX2EcR cells treated with PonA
show little, if any, effect upon PonA treatment of
TBX2VP16EcR-expressing cells (Table 2). Of the nine
genes, only PIG3 expression level was reduced in
TBX2VP16EcR cells upon PonA treatment. Thus the
expression of most of the TBX2EcR-activated genes was
unaffected in PonA-treated TBX2VP16EcR cells.
To identify TBX2VP16EcR-responsive genes, we ini-
tially assessed gene expression changes using cDNA
microarrays and confirmed putative targets using QPCR.
Use of QPCR confirmed 2- to 3-fold activation of five genes
in TBX2VP16EcR cells treated with PonA versus EtOH
(Fig. 7, black bars versus line), whereas no differences were
detected in non-transfected PonA-treated 293 cells (Fig. 7,
diagonal bars versus line). As was seen above, the
expression of these TBX2VP16EcR-activated genes was
not altered in PonA-treated TBX2EcR cells (Table 3). Since
different genes are regulated by TBX2EcR and
TBX2VP16EcR, these data strongly suggest that the tran-
scriptional modulatory domain associated with a T-box
DNA-binding domain may influence target gene specificity

Table 3
Gene expression changes in TBX2VP16EcR and TBX2EcR
Gene symbol Gene name Fold change
TBX2VP16EcR
Fold change
TBX2EcR
SHB (Src homology 2
domain containing)
adaptor protein B
2.3F0.1**** 1.0F0.2
n=3 n=3
CYP1B1 Cytochrome P450,
family 1, subfamily
B, polypeptide 1
2.1F0.1* 0.8F0.1
n=2 n=2
ID2 Inhibitor of DNA
binding 2, dominant
negative helix-loop-
helix protein
2.4F0.6*** 0.9F0.0
n=4 n=2
ENC1 Ectodermal-neural
cortex (with
BTB-like domain)
1.9F0.4** 1.3F0.4
n=4 n=4
RGS16 Regulator of
G-protein
signalling 16
2.4F0.8* 1.1F0.3
n=3 n=2
QPCR results representing fold changes in expression levels of indicated
genes in TBX2VP16EcR- and in TBX2EcR-expressing cells treated with
15 AM PonA for 24 h versus cells treated with EtOH. Values are the mean
of multiple (n=2–4) QPCRsFS.D.
* pb0.05.
** pb0.025.
*** pb0.01.
**** pb0.005.
Table 2
Gene expression changes in TBX2EcR and TBX2VP16EcR cells
Gene symbol Gene name Fold change
TBX2EcR
Fold change
TBX2VP16EcR
PIG3 Quinone
oxidoreductase
homolog
2.6F0.6**** 0.6F0.1*
n=17 n=3
DUSP6 Dual specificity
phosphatase 6
2.1F0.5**** 0.9F0.2
n=14 n=4
CTGF Connective tissue
growth factor
2.1F0.6**** 0.8F0.3
n=11 n=3
TP53INP1 Tumor protein
p53 inducible
nuclear protein 1
2.0F0.5**** 0.7F0.1
n=9 n=2
EGR1 Early growth
response 1
2.1F0.4*** 0.8F0.4
n=4 n=5
IER3 Immediate early
response 3
2.4F0.8*** 0.8F0.3
n=7 n=2
MMP2 Matrix
metalloproteinase 2
2.3F0.6** 0.8F0.2
n=4 n=3
p21 Cyclin-dependent
kinase inhibitor 1A
2.4F0.4*** 0.9F0.3
n=4 n=4
ACTA 2 Actin, alpha 2 2.0F0.2**** 0.7F0.2
n=5 n=2
QPCR results representing fold changes in expression levels of indicated
genes in TBX2EcR- and TBX2VP16EcR-expressing cells treated with 15
AM PonA for 24 h compared to cells treated with EtOH. Values are the
mean of multiple (n=2–17) QPCRsFS.D.
* pb0.05.
** pb0.025.
*** pb0.005.
**** pb0.0005.
N.V. Butz et al. / Gene 342 (2004) 67–76 73
(see Discussion). Consistent with this hypothesis, we found
that TBX2VP16 neither activates nor represses transcription
of the p14ARF reporter construct, although it appears to
Fig. 7. Genes up-regulated in TBX2VP16EcR-expressing cells. Data
represent fold changes in expression levels of indicated genes in
TBX2VP16EcR cells (black bars) and in non-transfected 293 cells
(diagonal bars) treated with 15 AM PonA compared to cells treated with
EtOH. Expression levels in cells treated with EtOH were set to 1 (line). At
24 h after PonA addition, RNA was collected and analyzed as in Fig. 4.
Values are the mean of multiple (n=2–4) QPCRsFS.D. ****pb0.005,
***pb0.01, **pb0.025, *pb0.05.
bind the promoter as indicated by its ability to relieve
TBX2-induced repression (data not shown).
4. Discussion
We have shown that constitutive expression of TBX2 is
lethal to 293 cells and that toxicity requires the localization
of TBX2 in the nucleus, binding to DNA and the
transcriptional regulatory activity of the protein (Fig. 1;
Table 1). Since TBX2 expression appears toxic to 293 cells,
to search for genes regulated by TBX2 we generated
TBX2EcR, which is toxic only in the presence of the
ligand PonA. Using a time point (24 h) at which the cells
are still ~95% viable, we identified nine genes, induced
upon PonA treatment in TBX2EcR cells but not in
TBX2VP16EcR cells (Table 2), and five genes induced in
TBX2VP16EcR cells but not in TBX2EcR cells (Table 3).
This discordance in gene expression changes in the two cell
types suggests that the VP16 activation domain may
strongly influence TBX2 target selectivity.
The genes up-regulated in PonA-treated TBX2EcR-
expressing cells are associated with stress induction and
are involved in the regulation of cell viability, growth,
proliferation and cytoskeleton remodeling. For example, the
ability of EGR1 to stimulate the generation of the reactive
oxygen species (ROS) (Bek et al., 2003), allows us to group
this gene with PIG3, known to generate ROS which damage
mitochondrial components and induce apoptosis (Polyak et
al., 1997). The P21 gene up-regulated in PonA-treated

N.V. Butz et al. / Gene 342 (2004) 67–7674
TBX2EcR-expressing cells can be induced by ROS (Russo
et al., 1995) as well as by EGR1 (Ragione et al., 2003). The
overexpression of IER3 is known to either induce or
suppress apoptosis depending on cellular context (Wu,
2003). The IER3 anti-apoptotic effect is dependent on the
presence of active extracellular signal-regulated kinases
(ERK) (Garcia et al., 2002). In turn, dephosphorylation of
ERK1/2 by DUSP6 has been shown to induce apoptosis via
Bcl-2 proteolysis (Rossig et al., 2002). In light of these data,
overexpression of DUSP6 in TBX2EcR-activated cells may
negatively regulate a number of anti-apoptotic pathways.
The ability of DUSP6 to inactivate ERKs1/2, which are
responsible for the regulation of several signal trans-
duction pathways, links DUSP6 to another group of genes
up-regulated following TBX2 activation. This subset of
genes, involved in extracellular matrix formation and
remodeling, includes CTGF, MMP2 and ACTA2. CTGF
is reported to negatively affect the anti-apoptotic program
in cells by reducing the levels of Bcl2 (Hishikawa et al.,
1999). CTGF has also been implicated in the induction of
MMP2 expression (Fan and Karnovsky, 2002). This
metalloproteinase has been shown to induce apoptosis
via extracellular matrix degradation (Wu and Huang,
2003). Thus our data suggest that TBX2 mediates an
increase in the RNA levels of several genes which may
contribute to cell lethality by affecting cellular apoptotic
pathways. It will be important in future studies to
determine whether one or all of these TBXEcR-induced
genes plays an essential role in the TBX2-mediated
toxicity seen in 293 cells.
We compared our results to previously reported micro-
array analysis of genes differentially expressed in Tbx2-
overexpressing mouse NIH3T3 fibroblasts and rat osteo-
sarcoma cells (Chen et al., 2001). Of the six genes
previously confirmed to be directly or indirectly up-
regulated by Tbx2, none were found to be targets in our
work. These differences may be related to the different
species, cell lines and experimental systems used, or to the
long-term toxicity of TBX2 to 293 cells but not NIH3T3 or
osteosarcoma cells. A few genes have been shown
previously to be directly or indirectly repressed by Tbx2
in other cell lines and tissues including TRP-1 (Carreira et
al., 1998), p19/p14ARF (Jacobs et al., 2000), ANF (Habets
et al., 2002) and Cx43 (Borke et al., 2003); however, none
of these endogenous TBX2 targets were affected in our 293
cell system (data not shown). In addition, Tbx2 has been
shown recently to directly repress p21 expression in B16
and MCF-7 cells by siRNA-mediated down-regulation of
endogenous Tbx2 (Prince et al., 2004). Since we saw an
increase in p21 transcript level in PonA-treated TBX2EcR-
expressing 293 cells (Table 2), these data suggest: (1) that
TBX2 can either activate or repress p21 expression
depending on the cell type used, (2) TBX2EcR activity
differs from that of Tbx2, or (3) activation of p21, and the
other TBX2 targets seen here may be indirect rather than
direct.
In comparison with the TBX2EcR-induced genes
described above, the TBX2VP16EcR-induced genes com-
prise a distinct group with few obvious linkages. SHB is an
SH2 containing adaptor protein involved in cell signaling
(Welsh et al., 1994), CYP1B1 is a cytochrome P450
enzyme (Sutter et al., 1994), ID2 is a dimerization partner
and inhibitor of basic helix-loop-helix transcription factors
(Hacker et al., 2003), ENC1 is a potential beta-catenin target
proposed to play a role in colorectal carcinogenesis (Fujita
et al., 2001), whereas RGS16 is a regulator of G-protein
signaling (Snow et al., 1998). While having no clear
biochemical connections, these genes may affect a number
of cell signaling pathways that could influence cell
proliferation. Perhaps the most interesting feature of this
set of genes is their lack of overlap with the TBX2EcR-
regulated genes identified above. It is the potential
mechanistic connection between these two sets of genes
that we discuss below.
The finding that largely non-overlapping sets of genes
are affected in TBX2EcR- versus TBX2VP16EcR-express-
ing cells has important implications for the mechanisms of
target gene selectivity by T-box proteins. Studies of
transcription factor activation of promoters in transiently
transfected cells have in general focused on the role of
specific cis-acting elements in directing transcription factor
binding, and on the role of defined transcriptional activation
domains on the recruitment of and/or modification of basal
transcription, co-activator/repressor, or chromatin remodel-
ing factors. Much less is known about the mechanisms that
influence the recognition and activation of specific target
genes in their in vivo chromosomal context. For example,
while it is recognized that different transcriptional activation
domains can affect different aspects of the transcription
process (e.g. initiation versus elongation (Blau et al., 1996;
Brown et al., 1998), little is known about the potential role
of transcriptional activation domains on the selectivity of
target genes in vivo.
There are multiple mechanisms by which transcriptional
activation and repression domains could influence target
gene selectivity and modulation in vivo: (1) direct mod-
ification of the DNA-binding specificity or affinity of the
cognate DNA-binding domain, (2) formation of a complex
with other site-specific transcription factors and subsequent
modification of DNA-binding specificity or affinity of the
complex, (3) the ability to function synergistically with
other transcription factors bound independently to a given
target gene, (4) recruitment of co-activators or co-repressors
that differ in their abilities to activate or repress specific
target genes, and others. Some of these mechanisms have
been identified as likely occurring on specific promoters in
transiently transfected cells, but their role in general target
gene selectivity in vivo is still unclear. A major goal of our
future studies is to determine whether these or other
mechanisms are mediating the differential activation of
gene expression seen in TBX2EcR- and TBX2VP16EcR-
expressing cells.

N.V. Butz et al. / Gene 342 (2004) 67–76 75
One important consideration in identifying the mecha-
nism of differential gene activation by TBX2EcR and
TBX2VP16EcR is whether the genes identified here are
direct or indirect targets of these chimeric transcription
factors. If the genes are direct targets of TBX2-binding, then
it should be possible to distinguish between differential
occupancy (mechanisms 1 and 2) and differential activation
(mechanisms 3 and 4) of the target genes in vivo using
chromatin immunoprecipitation. However, if these genes are
indirect targets of the TBX2 and are regulated by
intermediates that are themselves direct targets, then it will
be essential to identify these direct targets in order to
distinguish between the mechanisms. The PonA-inducible
system used here has advantages over other inducible
systems since activation of the transcription factor does
not require ongoing protein synthesis, and we attempted to
assess whether the genes are direct targets by using
cycloheximide to block protein synthesis upon induction
with PonA. Unfortunately, the TBX2EcR proteins used here
appear relatively unstable and in the absence of protein
synthesis are rapidly degraded, precluding a simple com-
parison of induction in the absence and presence of
cycloheximide (data not shown). Reengineering the proteins
for increased stability should overcome these issues.
In addition, it is possible that the different apparent sets
of targets are due to the induction of different cell fates by
the two forms of TBX2 used here. However, both forms of
TBX2 appear lethal to 293 cells (not shown) and thus if they
are inducing different cell fates, then both fates end in the
same process, cell death. We are currently investigating
whether any of the targets identified contribute directly to
293 cell death.
Finally, in an effort to assess whether the genes identified
are direct or indirect targets of TBX2, we searched for
TBX2-binding sites (full consensus and partial matches) in
the 3 kb region upstream of the start site of transcription and
in the 5V UTRs of the putative target genes and several
control genes that were unchanged in the transfectants.
Putative TBX2-binding sites were found at many locations
in both classes of genes, but no increase in the frequency of
TBX2-binding sites was detected in the proposed targets.
Since important control regions of genes can sometimes
extend for hundreds of kilobases around the promoter, it will
likely be necessary to first determine whether the putative
target genes are direct targets, and then perform a more
detailed promoter analysis of these confirmed target genes
using transfection assays and DNA-binding assays.
Irrespective of whether the genes identified here are
direct or indirect targets of TBX2, their lack of overlap and
the differential regulation of their expression within 24 h of
PonA treatment suggest that TBX2EcR and TBX2VP16EcR
regulate distinct sets of genes in 293 cells. This differential
activation of gene expression from proteins containing the
same DNA-binding domain suggests that transcription
factor activation and repression domains, together with
influencing the overall levels of gene expression on specific
promoters, likely affect the selectivity of target genes.
Determining the mechanism of this apparent modulation of
target gene selection remains an important goal.
Acknowledgments
The authors thank the personnel of the U. of Cincinnati
and Roswell Park Microarray facilities for microarray
analyses and D. Holzschu (Ohio U.) for the p14ARF-
642Luc construct. These studies were supported by NIH
grants DK48796 (CEC and RMG) and DK58401 (RMG).
References
Bamshad, M., Lin, R.C., Law, D.J., Watkins, W.C., Krakowiak, P.A.,
Moore, M.E., Franceschini, P., Lala, R., Holmes, L.B., Gebuhr, T.C.,
Bruneau, B.G., Schinzel, A., Seidman, J.G., Seidman, C.E., Jorde,
L.B., 1997. Mutations in human TBX3 alter limb, apocrine and
genital development in ulnar-mammary syndrome. Nat. Genet. 16,
311–315.
Bek, M.J., Reinhardt, H.C., Fischer, K.G., Hirsch, J.R., Hupfer, C., Dayal,
E., Pavenstadt, H., 2003. Up-regulation of early growth response gene-1
via the CXCR3 receptor induces reactive oxygen species and inhibits
Na+/K+-ATPase activity in an immortalized human proximal tubule
cell line. J. Immunol. 170, 931–940.
Blau, J., Xiao, H., McCracken, S., O’Hare, P., Greenblatt, J., Bentley, D.,
1996. Three functional classes of transcriptional activation domain.
Mol. Cell. Biol. 16, 2044–2055.
Borke, J.L., Chen, J.R., Yu, J.C., Bollag, R.J., Orellana, M.F., Isales, C.M.,
2003. Negative transcriptional regulation of connexin 43 by Tbx2 in rat
immature coronal sutures and ROS 17/2.8 cells in culture. Cleft Palate-
Craniofac. J. 40, 284–290.
Braybrook, C., Doudney, K., Marcano, A.C., Arnason, A., Bjornsson, A.,
Patton, M.A., Goodfellow, P.J., Moore, G.E., Stanier, P., 2001. The T-
box transcription factor gene TBX22 is mutated in X-linked cleft palate
and ankyloglossia. Nat. Genet. 29, 179–183.
Brown, S.A., Weirich, C.S., Newton, E.M., Kingston, R.E., 1998.
Transcriptional activation domains stimulate initiation and elongation
at different times and via different residues. EMBO J. 17, 3146–3154.
Campbell, C., Goodrich, K., Casey, G., Beatty, B., 1995. Cloning
and mapping of a human gene (TBX2) sharing a highly
conserved protein motif with the Drosophila omb gene. Genomics
28, 255–260.
Carreira, S., Dexter, T.J., Yavuzer, U., Easty, D.J., Goding, C.R., 1998.
Brachyury-related transcription factor Tbx2 and repression of the
melanocyte-specific TRP-1 promoter. Mol. Cell. Biol. 18, 5099–5108.
Chapman, D.L., Garvey, N., Hancock, S., Alexiou, M., Agulnik, S.I.,
Gibson-Brown, J.J., Cebra-Thomas, J., Bollag, R.J., Silver, L.M.,
Papaioannou, V.E., 1996. Expression of the T-box family genes, Tbx1–
Tbx5, during early mouse development. Dev. Dyn. 206, 379–390.
Chen, J., Zhong, Q., Wang, J., Cameron, R.S., Borke, J.L., Isales, C.M.,
Bollag, R.J., 2001. Microarray analysis of Tbx2-directed gene
expression: a possible role in osteogenesis. Mol. Cell. Endocrinol.
177, 43–54.
Christopherson, K.S., Mark, M.R., Bajaj, V., Godowski, P.J., 1992.
Ecdysteroid-dependent regulation of genes in mammalian cells by a
Drosophila ecdysone receptor and chimeric transactivators. Proc. Natl.
Acad. Sci. U. S. A. 89, 6314–6318.
Davenport, T.G., Jerome-Majewska, L.A., Papaioannou, V.E., 2003.
Mammary gland, limb and yolk sac defects in mice lacking Tbx3, the
gene mutated in human ulnar mammary syndrome. Development 130,
2263–2273.

N.V. Butz et al. / Gene 342 (2004) 67–7676
Fan, W.H., Karnovsky, M.J., 2002. Increased MMP-2 expression in
connective tissue growth factor over-expression vascular smooth
muscle cells. J. Biol. Chem. 277, 9800–9805.
Fujita, M., Furukawa, Y., Tsunoda, T., Tanaka, T., Ogawa, M., Nakamura,
Y., 2001. Up-regulation of the ectodermal-neural cortex 1 (ENC1) gene,
a downstream target of the beta-catenin/T-cell factor complex, in
colorectal carcinomas. Cancer Res. 61, 7722–7726.
Garcia, J., Ye, Y., Arranz, V., Letourneux, C., Pezeron, G., Porteu, F., 2002.
IEX-1: a new ERK substrate involved in both ERK survival activity and
ERK activation. EMBO J. 21, 5151–5163.
Habets, P.E., Moorman, A.F., Clout, D.E., Van Roon, M.A., Lingbeek, M.,
Van Lohuizen, M., Campione, M., Christoffels, V.M., 2002. Cooper-
ative action of Tbx2 and Nkx2.5 inhibits ANF expression in the
atrioventricular canal: implications for cardiac chamber formation.
Genes Dev. 16, 1234–1246.
Hacker, C., Kirsch, R.D., Ju, X.S., Hieronymus, T., Gust, T.C., Kuhl, C.,
Jorgas, T., Kurz, S.M., Rose-John, S., Yokota, Y., Zenke, M., 2003.
Transcriptional profiling identifies Id2 function in dendritic cell
development. Nat. Immunol. 4, 380–386.
Hishikawa, K., Oemar, B.S., Tanner, F.C., Nakaki, T., Luscher, T.F., Fujii,
T., 1999. Connective tissue growth factor induces apoptosis in human
breast cancer cell line MCF-7. J. Biol. Chem. 274, 37461–37466.
Jacobs, J.J., Keblusek, P., Robanus-Maandag, E., Kristel, P., Lingbeek, M.,
Nederlof, P.M., van Welsem, T., van De Vijver, M.J., Koh, E.Y., Daley,
G.Q., van Lohuizen, M., 2000. Senescence bypass screen identifies
TBX2, which represses Cdkn2a (p19ARF) and is amplified in a subset
of human breast cancers. Nat. Genet. 26, 291–299.
Jerome, L.A., Papaioannou, V.E., 2001. DiGeorge syndrome phenotype in
mice mutant for the T-box gene, Tbx1. Nat. Genet. 27, 286–291.
Li, Q.Y., Newbury-Ecob, R.A., Terrett, J.A., Wilson, D.I., Curtis, A.R., Yi,
C.H., Gebuhr, T., Bullen, P.J., Robson, S.C., Strachan, T., Bonnet, D.,
Lyonnet, S., Young, I.D., Raeburn, J.A., Buckler, A.J., Law, D.J., Brook,
J.D., 1997. Holt-Oram syndrome is caused by mutations in TBX5, a
member of the Brachyury (T) gene family. Nat. Genet. 15, 21–29.
MacGregor, G.R., Caskey, C.T., 1989. Construction of plasmids that
express E. coli h-galactosidase in mammalian cells. Nucleic Acids Res.
17, 2365.
Naiche, L.A., Papaioannou, V.E., 2003. Loss of Tbx4 blocks hindlimb
development and affects vascularization and fusion of the allantois.
Development 130, 2681–2693.
No, D., Yao, T.P., Evans, R.M., 1996. Ecdysone-inducible gene expression
in mammalian cells and transgenic mice. Proc. Natl. Acad. Sci. U. S. A.
93, 3346–3351.
Polyak, K., Xia, Y., Zweier, J.L., Kinzler, K.W., Vogelstein, B., 1997. A
model for p53-induced apoptosis. Nature 389, 300–305.
Prince, S., Carreira, S., Vance, K.W., Abrahams, A., Goding, C.R., 2004.
Tbx2 directly represses the expression of the p21(WAF1) cyclin-
dependent kinase inhibitor. Cancer Res. 64, 1669–1674.
Pulichino, A.M., Vallette-Kasic, S., Couture, C., Gauthier, Y., Brue, T.,
David, M., Malpuech, G., Deal, C., Van Vliet, G., De Vroede, M.,
Riepe, F.G., Partsch, C.J., Sippell, W.G., Berberoglu, M., Atasay, B.,
Drouin, J., 2003. Human and mouse TPIT gene mutations cause early
onset pituitary ACTH deficiency. Genes Dev. 17, 711–716.
Ragione, F.D., Cucciolla, V., Criniti, V., Indaco, S., Borriello, A., Zappia,
V., 2003. p21Cip1 gene expression is modulated by Egr1: a novel
regulatory mechanism involved in the resveratrol antiproliferative
effect. J. Biol. Chem. 278, 23360–23368.
Rossig, L., Hermann, C., Haendeler, J., Assmus, B., Zeiher, A.M.,
Dimmeler, S., 2002. Angiotensin II-induced upregulation of MAP
kinase phosphatase-3 mRNA levels mediates endothelial cell apoptosis.
Basic Res. Cardiol. 97, 1–8.
Russo, T., Zambrano, N., Esposito, F., Ammendola, R., Cimino, F.,
Fiscella, M., Jackman, J., O’Connor, P.M., Anderson, C.W.,
Appella, E., 1995. A p53-independent pathway for activation of
WAF1/CIP1 expression following oxidative stress. J. Biol. Chem.
270, 29386–29391.
Sinha, S., Abraham, S., Gronostajski, R.M., Campbell, C.E., 2000.
Differential DNA binding and transcription modulation by three T-
box proteins, T, TBX1 and TBX2. Gene 258, 15–29.
Smith, J., 1999. T-box genes: what they do and how they do it. Trends
Genet. 15, 154–158.
Snow, B.E., Antonio, L., Suggs, S., Siderovski, D.P., 1998. Cloning of a
retinally abundant regulator of G-protein signaling (RGS-r/RGS16):
genomic structure and chromosomal localization of the human gene.
Gene 206, 247–253.
Stott, D., Kispert, A., Herrmann, B.G., 1993. Rescue of the tail defect of
Brachyury mice. Genes Dev. 7, 197–203.
Sutter, T.R., Tang, Y.M., Hayes, C.L., Wo, Y.Y., Jabs, E.W., Li, X., Yin, H.,
Cody, C.W., Greenlee, W.F., 1994. Complete cDNA sequence of a
human dioxin-inducible mRNA identifies a new gene subfamily of
cytochrome P450 that maps to chromosome 2. J. Biol. Chem. 269,
13092–13099.
Suzuki, T., Takeuchi, J., Koshiba-Takeuchi, K., Ogura, T., 2004. Tbx genes
specify posterior digit identity through Shh and BMP signaling. Dev.
Cell 6, 43–53.
Welsh, M., Mares, J., Karlsson, T., Lavergne, C., Breant, B., Claesson-
Welsh, L., 1994. Shb is a ubiquitously expressed Src homology 2
protein. Oncogene 9, 19–27.
Wu, M.X., 2003. Roles of the stress-induced gene IEX-1 in regulation of
cell death and oncogenesis. Apoptosis 8, 11–18.
Wu, W.B., Huang, T.F., 2003. Activation of MMP-2, cleavage of matrix
proteins, and adherens junctions during a snake venom metal-
loproteinase-induced endothelial cell apoptosis. Exp. Cell Res. 288,
143–157.
Related Documents


