HAL Id: inserm-00432097 https://www.hal.inserm.fr/inserm-00432097 Submitted on 13 Nov 2010 HAL is a multi-disciplinary open access archive for the deposit and dissemination of sci- entific research documents, whether they are pub- lished or not. The documents may come from teaching and research institutions in France or abroad, or from public or private research centers. L’archive ouverte pluridisciplinaire HAL, est destinée au dépôt et à la diffusion de documents scientifiques de niveau recherche, publiés ou non, émanant des établissements d’enseignement et de recherche français ou étrangers, des laboratoires publics ou privés. Dietary pattern and depressive symptoms in middle age. Tasnime Akbaraly, Eric Brunner, Jane Ferrie, Michael Marmot, Mika Kivimaki, Archana Singh-Manoux To cite this version: Tasnime Akbaraly, Eric Brunner, Jane Ferrie, Michael Marmot, Mika Kivimaki, et al.. Dietary pattern and depressive symptoms in middle age.. British Journal of Psychiatry, Royal College of Psychiatrists, 2009, 195 (5), pp.408-13. 10.1192/bjp.bp.108.058925. inserm-00432097

Welcome message from author
This document is posted to help you gain knowledge. Please leave a comment to let me know what you think about it! Share it to your friends and learn new things together.
Transcript
HAL Id: inserm-00432097https://www.hal.inserm.fr/inserm-00432097
Submitted on 13 Nov 2010
HAL is a multi-disciplinary open accessarchive for the deposit and dissemination of sci-entific research documents, whether they are pub-lished or not. The documents may come fromteaching and research institutions in France orabroad, or from public or private research centers.
L’archive ouverte pluridisciplinaire HAL, estdestinée au dépôt et à la diffusion de documentsscientifiques de niveau recherche, publiés ou non,émanant des établissements d’enseignement et derecherche français ou étrangers, des laboratoirespublics ou privés.
Dietary pattern and depressive symptoms in middle age.Tasnime Akbaraly, Eric Brunner, Jane Ferrie, Michael Marmot, Mika
Kivimaki, Archana Singh-Manoux
To cite this version:Tasnime Akbaraly, Eric Brunner, Jane Ferrie, Michael Marmot, Mika Kivimaki, et al.. Dietary patternand depressive symptoms in middle age.. British Journal of Psychiatry, Royal College of Psychiatrists,2009, 195 (5), pp.408-13. �10.1192/bjp.bp.108.058925�. �inserm-00432097�

Dietary pattern and depressive symptoms in middle age: the Whitehall II study
Tasnime N. Akbaraly; Eric J. Brunner ; Jane E. Ferrie; Michael G. Marmot; Mika
Kivimaki; Archana Singh-Manoux
Running Title: Diet and depressive symptoms
This is an author-produced electronic version of an article accepted for publication in the British Journal of Psychiatry. The definitive publisher-authenticated version is available online at http://bjp.rcpsych.org

ABSTRACT
Background: Studies on diet and depression have focused primarily on individual
nutrients. This paper examines the association between dietary patterns and depression
using an overall diet approach.
Method : Analyses were carried on 3486 participants (26.2% women, mean age 55.6
years) from the Whitehall II prospective cohort, in which two dietary patterns were
identified: “whole food” (vegetables/fruits/fish) and “processed food” pattern (eg
sweetened desserts/fried food/processed meat/refined grains/ high fat dairy products).
Self-reported depression was assessed five years later using the CES-D scale.
Results: After adjusting for potential confounders, participants in the highest tertile of the
“whole food” pattern had lower odds of CES-D depression [Odds Ratio=0.74 (95%
CI:0.56-0.99)] than those in the lowest tertile. In contrast, high consumption of
“processed food” was associated with an increased odds of CES-D depression [Odds
Ratio=1.58 (95% CI:1.11-2.23)].
Conclusion: In middle-aged participants, a “processed food” dietary pattern is a risk
factor for CES-D depression five years later, while a “whole food” pattern is protective.
Declaration of interest: none
2

Research on the association between diet and depression has focused primarily on
nutrients such as fatty acids (1-4) and nutrients involved in the homocysteine pathway,
e.g. vitamin B6, B9 and B12 (2, 5-7), but the results have been inconclusive. Recent years
have seen a move away from analyzing associations between isolated nutrients and health
to consideration of the effects of dietary patterns (8). For example, a meta-analysis
published in 2008 showed that a greater adherence to a Mediterranean dietary pattern
(high intake of fruits, vegetable, and fish and low intake of meat and dairy product) was
associated with a lower incidence of Parkinson’s and Alzheimer’s disease (9). However,
the health outcomes of that meta-analysis did not include depression and, to the best of
our knowledge, no previous prospective study has investigated the association between
dietary patterns and the occurrence of depressive symptoms. Thus, the objective of this
study was to examine the association between dietary patterns derived from a food
frequency questionnaire using factor analysis and depression using the CES-D scale in a
large British middle aged population, the Whitehall II study. We were able to control for
a large range of socio-demographic variables, health behaviors and health parameters
including chronic diseases and cognitive functioning.
METHODS
The target population for the Whitehall II study was all London-based office staff,
aged 35–55 years, working in 20 civil service departments (10). Baseline screening
(Phase 1) took place during 1985-1988 (N=10,308), and involved a clinical examination
and a self-administered questionnaire containing sections on demographic characteristics,
health, lifestyle factors, work characteristics, social support and life events. The clinical
3

examination included measures of blood pressure, anthropometry, biochemical
measurements, neuroendocrine function, and subclinical markers of cardiovascular
disease. Subsequent phases of data collection have alternated between postal
questionnaire alone [Phases 2 (1989-1990), 4 (1995-1996), 6 (2001) and 8 (2006)] and
postal questionnaire accompanied by a clinical examination [Phases 3 (1991-1993), 5
(1997-1999) and 7 (2002-2004)]. Analyses reported in this study were restricted to the
3486 white European participants with data on dietary patterns and all covariates at phase
5 and depression at phase 7. Black (n=175) and Asian (n=331) participants were excluded
due to differences in eating patterns.
After complete description of the study to the subjects, written informed consent
was obtained; the University College London ethics committee approved the study.
Dietary assessment at phase 5 and determination of dietary pattern:
A machine-readable Food Frequency Questionnaire (11) based on the one used in
the US Nurses Health Study (12) was sent to the participants. The food list (127 items) in
the FFQ was anglicized, and foods commonly eaten in the UK were added (13). A
common unit or portion size for each food was specified, and participants were asked
how often, on average, they had consumed that amount of the item during the previous
year. Response to all items was on a 9-point scale, ranging from ‘never or less than once
per month’ to ‘six or more times per day’. The selected frequency category for each food
item was converted to a daily intake.
According to nutrient profile and culinary use of food items, the 127 items of the
FFQ were grouped in 37 predefined food groups, (by adding food items within each
4

group) (Appendix 1) (14). Dietary patterns were identified using principal component
analysis of these 37 groups. The factors were rotated by an orthogonal transformation
(Varimax rotation function in SAS; SAS Institute, Cary, NC) to achieve a simple
structure, allowing greater interpretability. Two dietary patterns were identified using
multiple criteria: the diagram of Eigen values, the Scree plot, the interpretability of the
factors and the percentage of variance explained by the factors (Appendix 2). The factor
score for each pattern was calculated by summing intakes of all food groups weighted by
their factor loadings. Factors loadings represent correlation coefficients between the food
groups and the dietary pattern. The first pattern was heavily loaded by high intake of
vegetables, fruits and fish, labelled the “whole food” pattern. The second pattern, labelled
“processed food”, was heavily loaded by high consumption of sweetened desserts,
chocolates, fried food, processed meat, pies, refined grains, high fat dairy products and
condiments. Each participant received a factor score for each identified pattern. Factor
analysis does not group individuals into clusters, instead all individuals contribute to both
factors and it is the homogeneity between food items that defines the factors. The validity
and the reliability of this version of the FFQ in terms of nutrient and food consumption
have been documented in detail in our cohort (11) and in other UK cohort (13). To assess
the validity of the dietary patterns resulting from this “a posteriori” food grouping, we
reran the principal component analyses using the 127 individual food items and the
results obtained were similar.
Center for Epidemiologic Studies Depression Scale (CES-D) measured at phase 7
5
The CES-D scale is a short self-report scale designed to measure depressive
symptoms in the general population. The 20 items of the scale measure symptoms
associated with depression and have been validated against longer scales (15).
Participants were asked to score the frequency of occurrence of specific symptoms during
the previous week on a four point scale (0 = "less than one day", 1 = "1-2 days", 2 = "3-4
days" and 3 = "5-7 days"). These were summed to yield a total score between 0 and 60.
Participants scoring more than 15 were defined as cases of CES-D depression (15).
Covariates at phase 5
Socio-demographic variables consisted of age, gender, marital status, employment
grade and education. The British civil service employment grade, defined on the basis of
salary, social status and level of responsibility, included 3 levels, with grade 1
representing the highest level and grade 3 the lowest. Highest educational attainment was
grouped into five levels (no academic qualification, lower secondary education, higher
secondary education, university degree, higher university degree. Health behaviours
measured were smoking (non smoker, former, current smoker) and physical activity
converted to metabolic equivalent (MET)-scores (16) and categorized as "mildly
energetic" (MET values below 3), "moderately energetic" (MET values ranging from 3 to
6 ) and "vigorous" ( MET values of 6 or above) physical activity. Health status was
ascertained using a number of measures: prevalence of Coronary Heart Disease (CHD),
based on clinically verified events, included non fatal myocardial infarction and definite
angina; self-reported stroke or transient ischemic attack; diabetes (diagnosed according to
the WHO definition); hypertension (systolic or diastolic blood pressure ≥ 140 or ≥ 90 mm
6
Hg respectively or use of hypertensive drugs); use of antidepressants; and cognitive
functioning assessed by the Alice Heim (AH) 4-I, composed of a series of 65 verbal and
mathematical reasoning items of increasing difficulty. Low cognitive score was defined
as performances in the lowest quintile. For sensitivity analyses, we used the General
Health Questionnaire (GHQ) (17), assessed both at phase 3 and phase 5 of the study
which captured common mental disorders and included the 4-item depression subscale.
All items were scored from 0 to 3 and then summed, cut-off points of 4 out of 12 were
used to identify depression cases.
Statistical analysis
Neither natural thresholds nor clinically based thresholds are defined for the factor
score measures of the two dietary patterns. We divided both scores into thirds based on
their distribution in order to allow a robust estimation of self-reported depression across
levels of dietary patterns that was not be driven by extreme values. Logistic regression
was used to model the association between the tertiles of the two dietary patterns and
CES-D depression. In the first model (M1), the analyses were adjusted for age, gender
and energy intake; in the second model (M2) they were also adjusted for employment
grade, educational level, marital status, smoking and physical activity. In the final model
(M3), the analyses were further adjusted for health measures. Interactions between each
dietary pattern and the covariates were tested and were found not to be statistically
significant. To examine whether the association between dietary pattern and CES-D
depression was robust, we ran two sensitivity analyses, the first adjusting for additional
covariates, such as dyslipidemia (LDL cholesterol ≥ 4.1 mmol/L or use of lipid-lowering
drugs) and BMI (calculated from measured high and weight, kg/m2) in a sub sample for
7
whom these data were available and the second excluding individuals on anti-depressive
treatment or who had GHQ-depression at phase 5. All analyses were conducted using the
SAS software, version 9 (SAS Institute).
RESULTS
Compared to the 6943 individuals still alive at Phase 7, the 3486 participants
included in the analyses were more likely to be men (73.8% vs. 66.7%), and less likely to
be in the low occupational grade (8.3% vs. 18.0%) or have no academic qualification
(8.0% vs. 10.0%). 5990 individuals had a CES-D assessment at phase 7, compared to
those excluded from the present analyses, the prevalence of CES-D depression was lower
in our study sample (11.9% vs. 19.2%). Concerning dietary habits, participants included
in analyses were more likely to be in the highest tertile of both “whole food” and
“processed food” dietary patterns. At phase 7, 416 participants were defined as CES-D
cases (score>15). Characteristics of the participants as a function of the presence of CES-
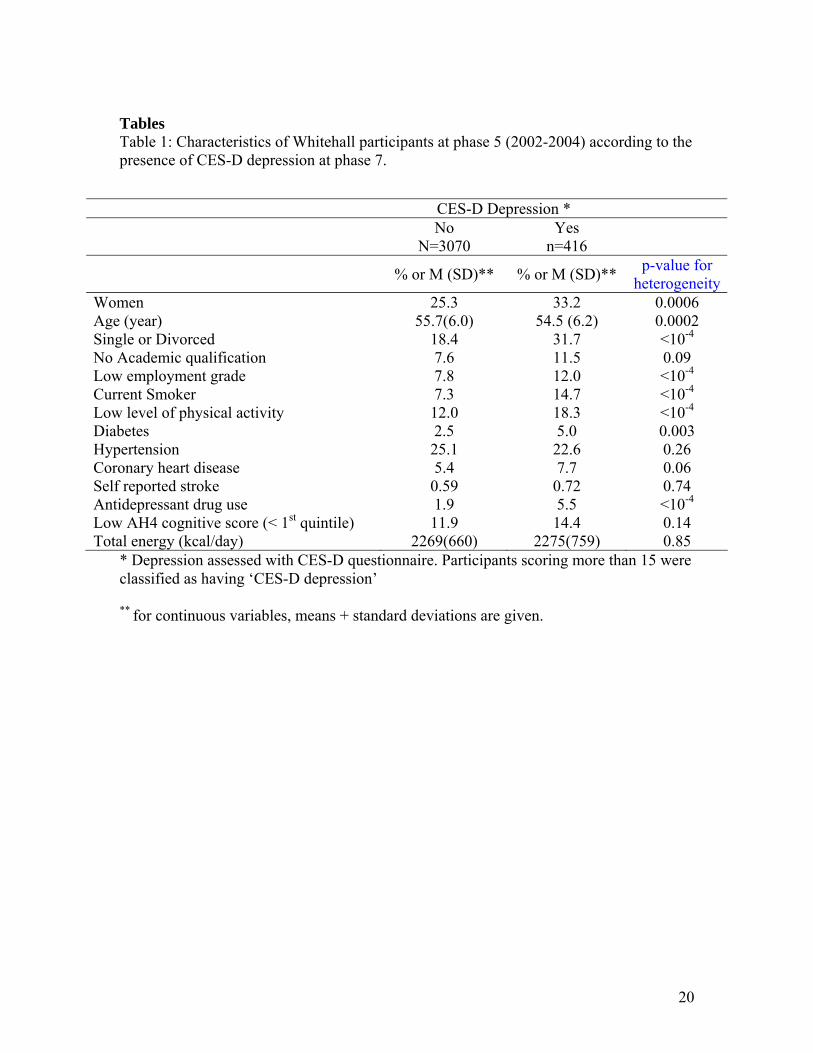
D depression are presented in Table 1.
Please insert Table 1 here
Factors associated with tertiles of the two dietary patterns, “whole food” and
“processed food” at phase 5 are shown in Table 2.
Please insert Table 2 here
8

Table 3 shows the association between the two dietary pattern scores categorised
in tertiles at phase 5 and CES-D depression at phase 7. Participants with the highest
intake of “whole food” were less likely to report CES-D depression (Odds Radio (OR) =
0.64 95% Confidence Interval (CI) = 0.49-0.83 after adjusting for age, gender and energy
intake, Model 1). This association was not much attenuated after adjustment for all
covariates, (OR = 0.74, 95% CI: 0.56-0.99, Model 3 in the upper panel). By contrast, in
the fully adjusted analyses (M3) participants with a high intake of “processed food” had
higher odds of CES-D depression compared to those with the lowest intake (OR = 1.58,
95% CI: 1.11-2.23, Model 3 in the lower panel).
Please insert Table 3 here
Sensitivity analyses
Additional analyses were undertaken on a subsample with data on BMI and
dyslipidemia (n=2702) at phase 5. Among them, 323 participants had CES-D depression
at phase 7. High “whole food” intake at phase 5 remained associated with lower odds of
subsequent CES-D depression at phase 7 (OR= 0.75, 95% CI: 0.54-1.03) while
participants with high “processed food” scores had higher odds of CES-D depression
(OR= 1.76, 95% CI: 1.19-2.62) after adjustment for all potential confounders, including
BMI and dyslipidemia.
In an attempt to elucidate whether the association shown in table 3 was due to an
effect of diet on depression and not the reverse, the analysis was repeated after excluding
9
the 427 participants who identified themselves as depressive at phase 5. As CES-D scale
was unavailable at Phase 5,self-reported depression identified based on a score greater
than or equal to 4 in the GHQ depression subscale (n=374) or reported antidepressant
treatment (n=81). As can be seen in Table 4, among the remaining 3059 individuals of
whom 265 had CES-D depression at phase 7 the results are comparable to those reported
in table 3, reinforcing our original observation that poor diet is a risk factor for self-
reported depression.
A further test of the reverse causality hypothesis examined GHQ depression at
phase 3 (n=397) as a predictor of dietary pattern at phase 5. We found no evidence
(p=0.24 for the “whole food” pattern and p=0.92 for the “processed food” pattern) to
suggest that dietary patterns at phase 5 were worse among those participants who were
GHQ depression cases at phase 3.
Please insert Table 4 here
10

DISCUSSION
We examined associations between two distinct dietary patterns, “whole food” (rich in
fruit, vegetables and fish) and “processed food” (rich in processed meat, chocolates,
sweet desserts, fried food, refined cereals and high fat dairy products) and CES-D
depression 5 years later in a middle aged population. The “whole food” pattern was
associated with lower odds of subsequent CES-D depression and the “processed food”
pattern with higher odds of CES-D depression. These associations were robust to
adjustments for a range of health parameters and behavioural factors.
Previously, dietary patterns have been investigated in relation to many health
outcomes. However, the research on depression has mostly focused on the risk for
depression associated with single nutrients. Our results suggest a protective effect of an
overall diet rich in fruits, vegetables and fish while an overall diet rich in processed meat,
chocolates, sweetened desserts, fried food, refined cereals and high fat dairy products
seemed to be deleterious for depression. These findings are in line with a recent meta-
analysis showing that adherence to a diet characterized by a high intake of fruits,
vegetable, and fish and low intake of meat and dairy product (Mediterranean diet) was
associated with lower overall mortality, mortality from cancer and cardiovascular
diseases and lower incidence of neurodegenerative diseases (9).
There are several plausible mechanisms underlying the association we observed
between the “whole food” pattern and self reported depression. The high amount of
antioxidants in fruits and vegetables (18) could be protective as some studies have shown
higher antioxidant levels to be associated with lower depression risk (19). The potential
11

protective effect of the “whole food" diet could also come from the folate, found in large
amounts in some cruciferous vegetables (broccoli, cabbage, Brussels sprouts), leafy
vegetables (spinach), other green vegetables (asparagus, avocado) and dried legume
(lentil, chick pea) (20). It has been suggested that low levels of folate might increase the
risk of depression and result in reduced availability of S-adenosylmethionine, a universal
methyl donor, which can result in impaired formation of myelin, neurotransmitters and
membrane phospholipids (21). In line with this a large study on Finnish middle aged men
found an increased risk of depression (7) in participants with lower dietary intake of
folate. However, some studies have found no association between folate levels and
depression in elderly populations (6). A further plausible mechanism involves fish
consumption. The “whole food” dietary pattern include a high intake of fish and there is
evidence suggesting an association between high fish consumption and low incidence of
depression (22). This protective effect of fish consumption has been traditionally
attributed to its high long chain omega 3 poly-unsaturated fatty acids content (23). These
are a major component of neuron membranes and have vascular and anti-inflammatory
properties. Evidence of this association has come from observational studies that have
shown an inverse association between n-3 fatty acid levels measured in blood or
estimated from intake and depression (3, 4). Finally, it is also possible that the protective
effect of diet on depression comes from the cumulative and synergic effect of nutrients
from different sources of foods rather than from the effect of one isolated nutrient.
The deleterious effect of “processed food” on self reported depression is a novel
finding. The “processed food” diet in our study was composed of sweet desserts, fried
food, processed food, refined grain products, high fat dairy products and pies. A previous
12

cross sectional study has shown a correlation between sugar consumption and the annual
rate of depression in 6 countries (24). Furthermore the “processed food” diet is very close
to the “Western” pattern defined in the American population (8) which has been shown to
be associated with higher risk of CHD (8) and inflammation (25). Several lines of
investigation have suggested that CHD (26) and inflammation (27) are involved in the
pathogenesis of depression. However, further studies are needed to better understand the
association between “processed food” intake, the inflammation process and depression.
There are several limitations to the present study. First, reverse causation with
depression affecting the dietary pattern rather than the other way around remains an
alternative interpretation to the observed associations. To test this issue, we undertook
sensitivity analyses and found no significant association between previous reports of
depression (phase 3, 1991-93), using the GHQ depression subscale, and dietary patterns
assessed 6 year later. This suggests that depression did not predict dietary behaviour in
our study. Furthermore, we also showed that our main finding - the association between
dietary patterns (phase 5, 1997-99) and CES-D depression at phase 7 (2002-04) - remains
significant after excluding participants who reported depression at phase 5, assessed
using the GHQ depression subscale and report of antidepressant treatment. We were not
able to use the CES-D to exclude prior depression as it was only introduced at phase 7 of
the study. Even if the use of different tools to assess self reported depression may
decrease sensitivity of these analyses, results using the GHQ to exclude participants with
prior depression show that the estimates of the association between dietary patterns and
subsequent CES-D depression were similar to those reported in this paper. Thus, reverse
causation seems an unlikely explanation for our findings.
13
Second, some bias due to selective retention of participants is possible as we
found socio-economic position, depression and dietary patterns to be associated with the
likelihood of being included in the analyses. If anything, this could contribute to an over-
estimation of the association between a “whole food” pattern and self reported depression
on account of the over-representation of individuals who are not depressed and follow a
health conscious diet.
Third, a further limit of the study is the use of a semi-quantitative food
questionnaire that only covers specific foods and is recognized to be less precise than
dietary assessment by diary questionnaire. However, we have shown previously in this
study population that nutrient intake estimated by the FFQ method is well correlated with
biomarker levels and with intake estimates from the generally more accurate 7 day-diary
(11). The factor analyses approach used to identify these patterns involves several
arbitrary decisions such as the consolidation of food items into food groups: the number
of factors extracted the methods of rotation and the labelling of the factors. However, the
two major eating patterns identified – the “whole food” the “processed food “ diet were
similar to the “prudent” and “Western” patterns determined in large American
prospective cohorts (8).
Fourth, the Whitehall II study participants are mainly office-based civil servants,
not fully representative of the British population, and analyses were restricted to “white”
participants which may limit the generalizability of the findings.
Finally, we cannot exclude the possibility of residual confounding in the analysis
due to unmeasured or imprecisely measures factors. It is possible, for example, that a
healthy diet is only one component of an overall healthy lifestyle which affords
14
protection against depression. However, the effects of dietary patterns on depressive
symptoms did not substantially attenuate after adjustment for other indicators of a healthy
lifestyle, such as smoking, physical activity and body mass, and a range of other potential
confounders. This provides evidence against the interpretation that we have found a
spurious association which is simply a by-product of an overall healthy lifestyle.
Despite these limitations, our study is unique in expanding the focus in this field
of research from single nutrients and single foods to overall diet patterns. Our study
provides evidence of a robust association between two dietary patterns - the “whole food
and the “processed food” patterns - and depressive symptoms in a large prospective
Caucasian middle aged British cohort. The results suggest that fruits, vegetables and fish
consumption afford protection against the onset of depressive symptoms five years later,
while a diet rich in processed meat, chocolates, sweet desserts, fried food, refined cereals
and high fat dairy products increased vulnerability. These findings suggest that existing
healthy eating policies will generate additional benefits to health and well-being, and that
diet should be considered as a potential target for the prevention of depressive disorders.
Tasnime N. Akbaraly1,2; Eric J. Brunner1 ; Jane E. Ferrie 1; Michael G. Marmot 1;
Mika Kivimaki1; Archana Singh-Manoux1, 3, 4
1 Department of Epidemiology and Public Health, University College London, WC1E
6BT, UK
15

2 INSERM U888, F-34000 Montpellier, France. - University Montpellier 1, France
3 INSERM U687-IFR69, France
4 Centre de Gérontologie, Hôpital Ste Périne, AP-HP, Paris, France
Acknowledgment
We thank all of the participating civil service departments and their welfare, personnel,
and establishment officers; the British Occupational Health and Safety Agency; the
British Council of Civil Service Unions; all participating civil servants in the Whitehall II
study; and all members of the Whitehall II study team.
Contribution of each author
Conception and design of the study: EJB, AS-M, JEF, MGM & MK
Conducting of analysis interpretation of data: TNA
Drafting the article or revising it critically for important intellectual content: TNA, EJB,
AS-M, JEF, MGM & MK
Final approval of the version to be published: TNA, EJB, AS-M, JEF, MGM & MK
Financial support: TNA is sponsored by the Academy of Finland (projects n° 117604,124
322). AS-M is supported by a “European Young Investigator Award” from the European
Science Foundation. MM is supported by an MRC research professorship. J.E.F. is
supported by the Medical Research Council (Grant number G8802774) and M.K. is
supported by the Academy of Finland. The Whitehall II study has been supported by
16
grants from the British Medical Research Council (MRC); the British Heart Foundation;
the British Health and Safety Executive; the British Department of Health; the National
Heart, Lung, and Blood Institute (grant HL36310); the National Institute on Aging (grant
AG13196); the Agency for Health Care Policy and Research (grant HS06516); and the
John D. and Catherine T. MacArthur Foundation Research Networks on Successful
Midlife Development and Socioeconomic Status and Health. The sponsors did not
participate in the design and conduct of the study; collection, management, analysis, and
interpretation of the data; or preparation, review, or approval of the manuscript.
References
1. Lin PY, Su KP. A meta-analytic review of double-blind, placebo-controlled trials
of antidepressant efficacy of omega-3 fatty acids. J Clin Psychiatry 2007;68(7):1056-61.
2. Murakami K, Mizoue T, Sasaki S, Ohta M, Sato M, Matsushita Y, et al. Dietary intake of folate, other B vitamins, and omega-3 polyunsaturated fatty acids in relation to depressive symptoms in Japanese adults. Nutrition 2008;24(2):140-7.
3. Sanchez-Villegas A, Henriquez P, Figueiras A, Ortuno F, Lahortiga F, Martinez-Gonzalez MA. Long chain omega-3 fatty acids intake, fish consumption and mental disorders in the SUN cohort study. Eur J Nutr 2007;46(6):337-46.
4. Tiemeier H, van Tuijl HR, Hofman A, Kiliaan AJ, Breteler MM. Plasma fatty acid composition and depression are associated in the elderly: the Rotterdam Study. Am J Clin Nutr 2003;78(1):40-6.
5. Gilbody S, Lightfoot T, Sheldon T. Is low folate a risk factor for depression? A meta-analysis and exploration of heterogeneity. J Epidemiol Community Health 2007;61(7):631-7.
6. Kamphuis MH, Geerlings MI, Grobbee DE, Kromhout D. Dietary intake of B(6-9-12) vitamins, serum homocysteine levels and their association with depressive symptoms: the Zutphen Elderly Study. Eur J Clin Nutr 2007.
7. Tolmunen T, Hintikka J, Ruusunen A, Voutilainen S, Tanskanen A, Valkonen VP, et al. Dietary folate and the risk of depression in Finnish middle-aged men. A prospective follow-up study. Psychother Psychosom 2004;73(6):334-9.
17
8. Hu FB. Dietary pattern analysis: a new direction in nutritional epidemiology. Curr Opin Lipidol 2002;13(1):3-9.
9. Sofi F, Cesari F, Abbate R, Gensini GF, Casini A. Adherence to Mediterranean diet and health status: meta-analysis. Bmj 2008;337:a1344.
10. Marmot M, Brunner E. Cohort Profile: the Whitehall II study. Int J Epidemiol 2005;34(2):251-6.
11. Brunner E, Stallone D, Juneja M, Bingham S, Marmot M. Dietary assessment in Whitehall II: comparison of 7 d diet diary and food-frequency questionnaire and validity against biomarkers. Br J Nutr 2001;86(3):405-14.
12. Willett WC, Sampson L, Stampfer MJ, Rosner B, Bain C, Witschi J, et al. Reproducibility and validity of a semiquantitative food frequency questionnaire. Am J Epidemiol 1985;122(1):51-65.
13. Bingham SA, Gill C, Welch A, Cassidy A, Runswick SA, Oakes S, et al. Validation of dietary assessment methods in the UK arm of EPIC using weighed records, and 24-hour urinary nitrogen and potassium and serum vitamin C and carotenoids as biomarkers. Int J Epidemiol 1997;26 Suppl 1:S137-51.
14. Akbaraly TN, Singh-Manoux A, Marmot MG, Brunner EJ. Education attenuates the association between dietary patterns and cognition. Dement Geriatr Cogn Disord 2009;27(2):147-54.
15. Radloff L. The CES-D scale: A self-report depression scale for research in the general population. Appl Psychol Measures 1977;1:385–401.
16. Singh-Manoux A, Hillsdon M, Brunner E, Marmot M. Effects of physical activity on cognitive functioning in middle age: evidence from the Whitehall II prospective cohort study. Am J Public Health 2005;95(12):2252-8.
17. Goldberg D. The Detection of Psychiatric Illness by Questionnaire. London, England: Oxford University Press Inc; 1972.
18. Nutrient Data Laboratory Agriculture Research Service. Oxygen radical absorbance capacity (ORAC) of Selected Foods: US Department of Agriculture; 2007.
19. Sarandol A, Sarandol E, Eker SS, Erdinc S, Vatansever E, Kirli S. Major depressive disorder is accompanied with oxidative stress: short-term antidepressant treatment does not alter oxidative-antioxidative systems. Hum Psychopharmacol 2007;22(2):67-73.
20. Food Standard Agency. The National Diet & Nutrition Survey: adults aged 19 to 64 years. Vitamin and Mineral intake and urinary analytes. London: TSO; 2003.
21. Selhub J, Bagley LC, Miller J, Rosenberg IH. B vitamins, homocysteine, and neurocognitive function in the elderly. Am J Clin Nutr 2000;71(2):614S-620S.
22. Hibbeln JR. Fish consumption and major depression. Lancet 1998;351(9110):1213.
23. Astorg P, Arnault N, Czernichow S, Noisette N, Galan P, Hercberg S. Dietary intakes and food sources of n-6 and n-3 PUFA in French adult men and women. Lipids 2004;39(6):527-35.
24. Westover AN, Marangell LB. A cross-national relationship between sugar consumption and major depression? Depress Anxiety 2002;16(3):118-20.
18

25. Lopez-Garcia E, Schulze MB, Fung TT, Meigs JB, Rifai N, Manson JE, et al. Major dietary patterns are related to plasma concentrations of markers of inflammation and endothelial dysfunction. Am J Clin Nutr 2004;80(4):1029-35.
26. Kamphuis MH. Depressino and Cardiovascular disease: The role of diet, lifestyle and health. Utrechts: University of Utrecht; 2006.
27. Tiemeier H, Hofman A, van Tuijl HR, Kiliaan AJ, Meijer J, Breteler MM. Inflammatory proteins and depression in the elderly. Epidemiology 2003;14(1):103-7.
19
20
Tables Table 1: Characteristics of Whitehall participants at phase 5 (2002-2004) according to the presence of CES-D depression at phase 7.
* Depression assessed with CES-D questionnaire. Participants scoring more than 15 were classified as having ‘CES-D depression’
** for continuous variables, means + standard deviations are given.
CES-D Depression * No
N=3070 Yes
n=416
% or M (SD)** % or M (SD)** p-value for heterogeneity
Women 25.3 33.2 0.0006 Age (year) 55.7(6.0) 54.5 (6.2) 0.0002 Single or Divorced 18.4 31.7 <10-4 No Academic qualification 7.6 11.5 0.09 Low employment grade 7.8 12.0 <10-4 Current Smoker 7.3 14.7 <10-4 Low level of physical activity 12.0 18.3 <10-4 Diabetes 2.5 5.0 0.003 Hypertension 25.1 22.6 0.26 Coronary heart disease 5.4 7.7 0.06 Self reported stroke 0.59 0.72 0.74 Antidepressant drug use 1.9 5.5 Low AH4 cognitive score (< 1st quintile) 11.9 14.4 Total energy (kcal/day) 2269(660) 2275(759)
<10-4 0.14 0.85

21
Table 2: Associations between dietary pattern at phase 5 and covariates at phase 5
* For continuous variable, Mean (M) with its standard deviation are given. † Tertile 1, 2 and 3 represent individuals in the lowest, intermediate and highest thirds of the dietary factor score.
Dietary pattern at phase 5 “Whole food” dietary pattern “Processed food” dietary pattern Variables measures at phase 7 Tertile 1†
n=1162 Tertile 2† n=1162
Tertile 3† n=1162
p-value for trend
Tertile 1† n=1162
Tertile 2† n=1162
Tertile 3† n=1162
p-value for trend
Women 21.6 27.2 30.0 <10-4 39.9 25.4 13.4 <10-4 Age* (year) 54.9(6.0) 55.8(6.0) 56.1(6.1) <10-4 55.6(5.8) 56.0(6.1) 55.5(6.2) 0.005 Single / Divorced 27.5 20.0 20.5 0.0006 26.2 22.8 19.0 <10-4 No academic qualification 9.6 8.3 6.2 <10-4 7.8 8.4 7.9 0.23 Low employment grade 9.2 8.3 7.5 <10-4 8.9 8.9 7.2 0.46 Current Smoker 11.1 8.1 5.4 <10-4 6.6 8.9 9.2 0.10 Low level of physical activity 17.1 11.2 9.9 <10-4 14.6 13.2 10.3 0.005 Diabetes 2.7 2.1 3.4 0.17 3.1 2.7 2.5 0.67 Hypertension 23.7 26.2 24.6 0.34 25.3 25.6 23.7 0.52 Coronary heart diseases 7.1 5.2 4.8 0.04 5.3 5.6 6.1 0.71 Self reported stroke 0.69 0.69 0.43 0.68 0.69 0.60 0.52 0.87 Antidepressant drugs use 3.1 1.6 2.3 0.06 2.6 2.2 2.1 0.77
0.70 Low AH4 Cognitive score 21.9 21.0 16.5 0.002 20.2 19.0 20.2 Total energy * (kcal/day) 1994(569) 2228(571) 2587(729) <10-4 1765(412) 2200(426) 2843(647) <10-4

Table 3: Associations between dietary pattern scores at phase 5 and CES-D depression at phase 7 (n=3486).
Lowest tertile Intermediate tertile Highest tertile
OR OR 95% CI p-value
for trend
OR 95% CI p-value
for trend “Whole food” dietary pattern
Model 1 1 0.62 0.48-0.79 0.0002 0.64 0.49-0.83 0.001
Model 2 1 0.68 0.52-0.89 0.004 0.74 0.56-0.98 0.03
Model 3 1 0.71 0.54-0.92 0.01 0.74 0.56-0.99 0.04
“Processed food” dietary pattern
Model 1 1 1.28 0.97-1.69 0.08 1.75 1.25;2.45 0.001
Model 2 1 1.22 0.92-1.62 0.17 1.58 1.12-2.23 0.009
Model 3 1 1.22 0.92-1.62 0.17 1.58 1.11-2.23
Model 1: Adjusted for gender, age and energy intake
0.01
Model 2: Model 1 + adjustment for marital status, employment grade, education, physical activity and smoking habits Model 3: Model 2 + adjustment for hypertension, diabetes, cardio-vascular diseases, self reported stroke, use of anti-depressive drugs, and cognitive functioning.
22
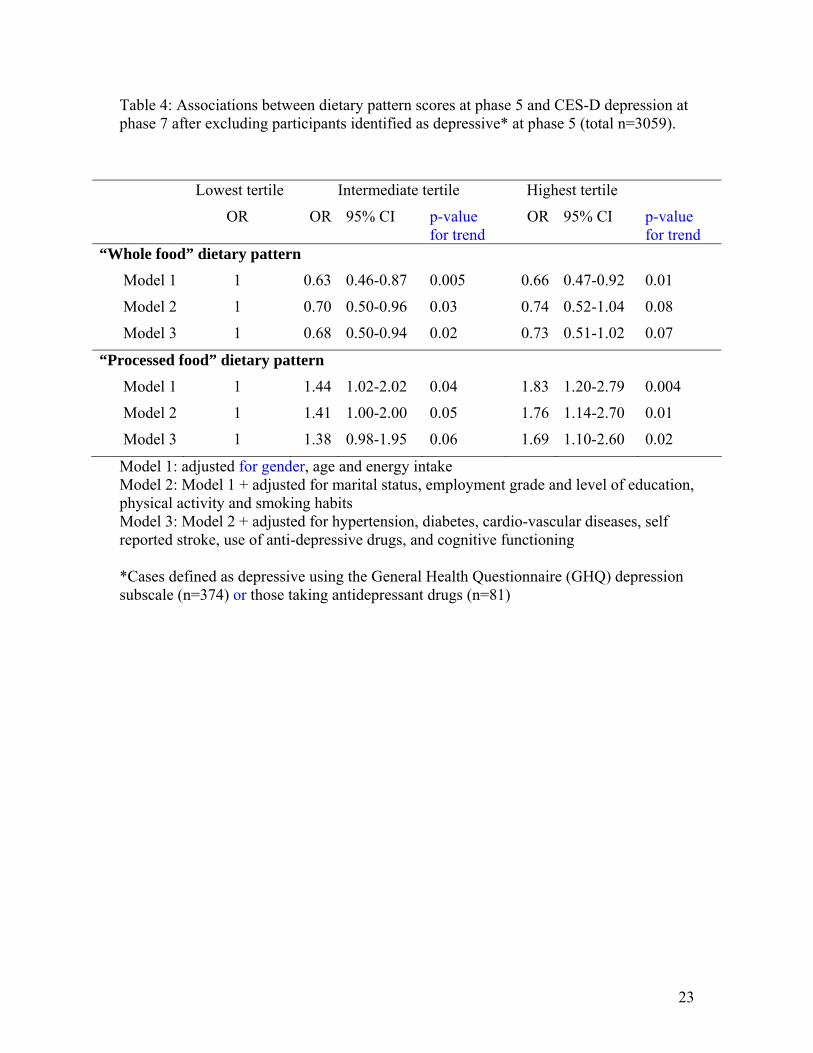
Table 4: Associations between dietary pattern scores at phase 5 and CES-D depression at phase 7 after excluding participants identified as depressive* at phase 5 (total n=3059).
Lowest tertile Intermediate tertile Highest tertile
OR OR 95% CI p-value for trend
OR 95% CI p-value for trend
“Whole food” dietary pattern
Model 1 1 0.63 0.46-0.87 0.005 0.66 0.47-0.92 0.01
Model 2 1 0.70 0.50-0.96 0.03 0.74 0.52-1.04 0.08
Model 3 1 0.68 0.50-0.94 0.02 0.73 0.51-1.02 0.07
“Processed food” dietary pattern
Model 1 1 1.44 1.02-2.02 0.04 1.83 1.20-2.79 0.004
Model 2 1 1.41 1.00-2.00 0.05 1.76 1.14-2.70 0.01
Model 3 1 1.38 0.98-1.95 0.06 1.69 1.10-2.60
Model 1: adjusted for gender, age and energy intake
0.02
Model 2: Model 1 + adjusted for marital status, employment grade and level of education, physical activity and smoking habits Model 3: Model 2 + adjusted for hypertension, diabetes, cardio-vascular diseases, self reported stroke, use of anti-depressive drugs, and cognitive functioning *Cases defined as depressive using the General Health Questionnaire (GHQ) depression subscale (n=374) or those taking antidepressant drugs (n=81)
23
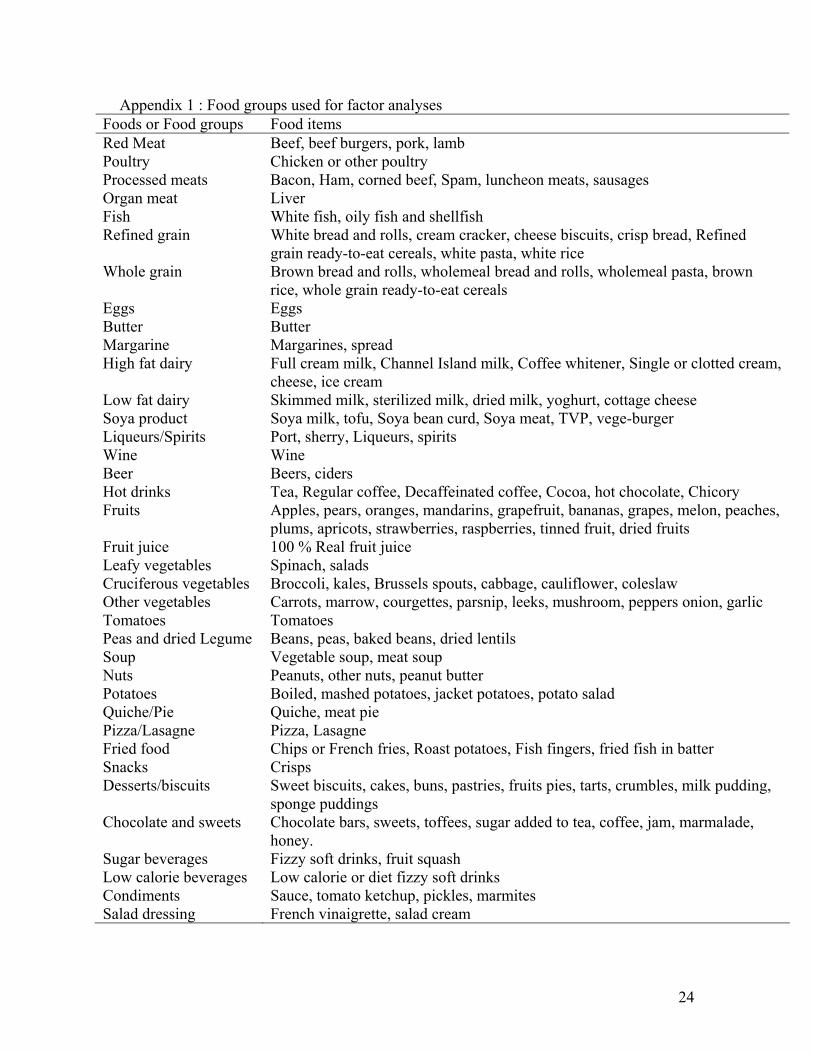
Appendix 1 : Food groups used for factor analyses Foods or Food groups Food items Red Meat Beef, beef burgers, pork, lamb Poultry Chicken or other poultry Processed meats Bacon, Ham, corned beef, Spam, luncheon meats, sausages Organ meat Liver Fish White fish, oily fish and shellfish Refined grain White bread and rolls, cream cracker, cheese biscuits, crisp bread, Refined
grain ready-to-eat cereals, white pasta, white rice Whole grain Brown bread and rolls, wholemeal bread and rolls, wholemeal pasta, brown
rice, whole grain ready-to-eat cereals Eggs Eggs Butter Butter Margarine Margarines, spread High fat dairy Full cream milk, Channel Island milk, Coffee whitener, Single or clotted cream,
cheese, ice cream Low fat dairy Skimmed milk, sterilized milk, dried milk, yoghurt, cottage cheese Soya product Soya milk, tofu, Soya bean curd, Soya meat, TVP, vege-burger Liqueurs/Spirits Port, sherry, Liqueurs, spirits Wine Wine Beer Beers, ciders Hot drinks Tea, Regular coffee, Decaffeinated coffee, Cocoa, hot chocolate, Chicory Fruits Apples, pears, oranges, mandarins, grapefruit, bananas, grapes, melon, peaches,
plums, apricots, strawberries, raspberries, tinned fruit, dried fruits Fruit juice 100 % Real fruit juice Leafy vegetables Spinach, salads Cruciferous vegetables Broccoli, kales, Brussels spouts, cabbage, cauliflower, coleslaw Other vegetables Carrots, marrow, courgettes, parsnip, leeks, mushroom, peppers onion, garlic Tomatoes Tomatoes Peas and dried Legume Beans, peas, baked beans, dried lentils Soup Vegetable soup, meat soup Nuts Peanuts, other nuts, peanut butter Potatoes Boiled, mashed potatoes, jacket potatoes, potato salad Quiche/Pie Quiche, meat pie Pizza/Lasagne Pizza, Lasagne Fried food Chips or French fries, Roast potatoes, Fish fingers, fried fish in batter Snacks Crisps Desserts/biscuits Sweet biscuits, cakes, buns, pastries, fruits pies, tarts, crumbles, milk pudding,
sponge puddings Chocolate and sweets Chocolate bars, sweets, toffees, sugar added to tea, coffee, jam, marmalade,
honey. Sugar beverages Fizzy soft drinks, fruit squash Low calorie beverages Low calorie or diet fizzy soft drinks Condiments Sauce, tomato ketchup, pickles, marmites Salad dressing French vinaigrette, salad cream
24
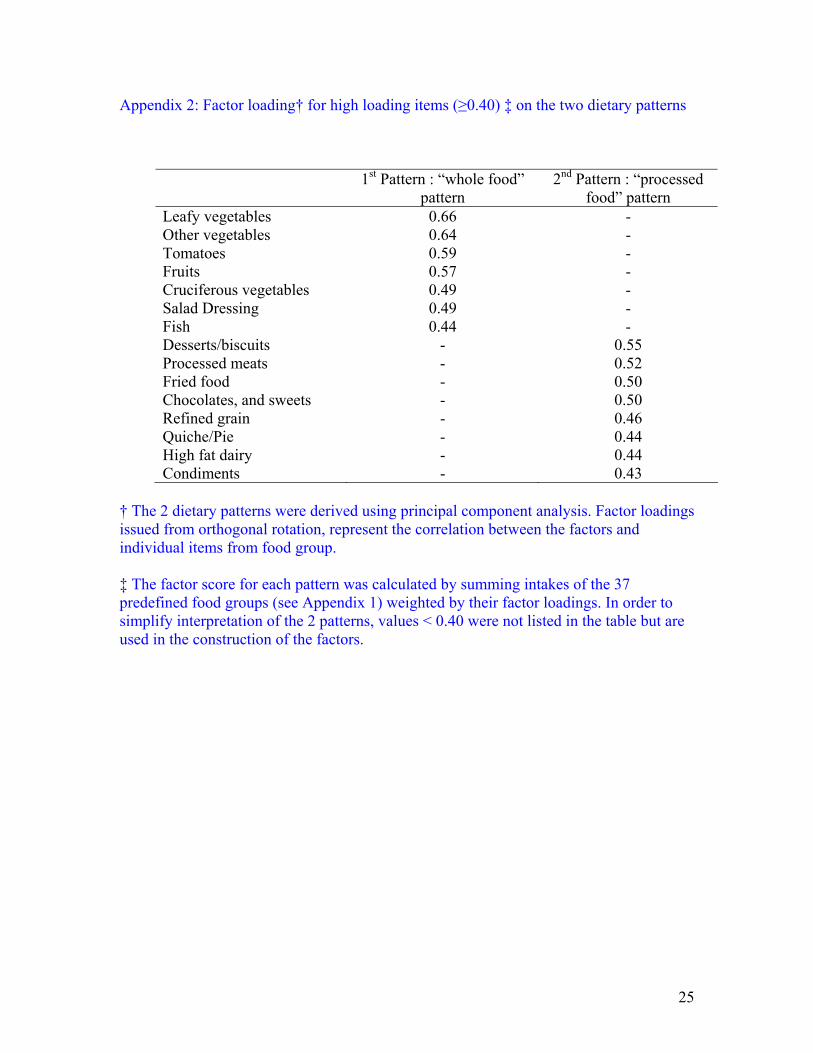
Appendix 2: Factor loading† for high loading items (≥0.40) ‡ on the two dietary patterns
1st Pattern : “whole food” pattern
2nd Pattern : “processed food” pattern
Leafy vegetables 0.66 - Other vegetables 0.64 - Tomatoes 0.59 - Fruits 0.57 - Cruciferous vegetables 0.49 - Salad Dressing 0.49 - Fish 0.44 - Desserts/biscuits - 0.55 Processed meats - 0.52 Fried food - 0.50 Chocolates, and sweets - 0.50 Refined grain - 0.46 Quiche/Pie - 0.44 High fat dairy - 0.44 Condiments - 0.43
† The 2 dietary patterns were derived using principal component analysis. Factor loadings issued from orthogonal rotation, represent the correlation between the factors and individual items from food group. ‡ The factor score for each pattern was calculated by summing intakes of the 37 predefined food groups (see Appendix 1) weighted by their factor loadings. In order to simplify interpretation of the 2 patterns, values < 0.40 were not listed in the table but are used in the construction of the factors.
25
Related Documents


![Effects of supervised exercise on depressive symptoms in hemodialysis … · 2017. 12. 15. · hemodialysis worldwide [1]. Depressive symptoms are common among hemodialysis patients,](https://static.cupdf.com/doc/110x72/612e737f1ecc51586942d268/effects-of-supervised-exercise-on-depressive-symptoms-in-hemodialysis-2017-12.jpg)