Development of qualitative lateral flow paper-based microfluidic devices for D-dimer immunodetection Sónia Cristina Martins Ruivo Thesis to obtain the Master of Science Degree in Biotechnology Supervisor(s): Professor Duarte Miguel de França Teixeira dos Prazeres Professor Ana Margarida Nunes da Mata Pires de Azevedo Examination Committee: Chairperson: Prof. Arsénio do Carmo Sales Mendes Fialho Supervisor: Prof. Duarte Miguel de França Teixeira dos Prazeres Members of the Committee: Gabriel António Amaro Monteiro October 2016

Welcome message from author
This document is posted to help you gain knowledge. Please leave a comment to let me know what you think about it! Share it to your friends and learn new things together.
Transcript

Development of qualitative lateral flow paper-based
microfluidic devices for D-dimer immunodetection
Sónia Cristina Martins Ruivo
Thesis to obtain the Master of Science Degree in
Biotechnology
Supervisor(s):
Professor Duarte Miguel de França Teixeira dos Prazeres
Professor Ana Margarida Nunes da Mata Pires de Azevedo
Examination Committee:
Chairperson: Prof. Arsénio do Carmo Sales Mendes Fialho
Supervisor: Prof. Duarte Miguel de França Teixeira dos Prazeres
Members of the Committee: Gabriel António Amaro Monteiro
October 2016

ii
Acknowledgements
Throughout the duration of this Master’s Degree I knew I had by my side my entire family, mom,
sister, grandparents, and even my father across the world. They were there for everything and more
and I will forever be thankful for that.
Because my life for the past two years was mainly spent in IST, new and strong friendships were
made and because all of them are now my second family. That being said I want to send lots of hugs,
kisses and cakes to Rosarinho, Sofia Salsinha, Ritinha Martins, Inês Correia, Carolina Gonçalves,
Jéssica Nereu and lastly to Catarina Barbeitos because in half a year we became the best of friends. I
was told once that having 10 friends was more than the average person, I couldn’t find a reference to
support it, but if that is true I’m truly a lucky person because besides my second family I made a lot more
friends at IST and I can still count on the ones that have been with me since my childhood.
They are included in my friends but I wanted to give a special thanks to Ana Rosa, Rosarinho,
António Almeida, João Trabuco for being my lab partners and for making lab 7.6.7 a fun and wonderful
place to work on, and also to Isabel Pinto and André Nascimento for always welcoming me on the 8th
floor.
Lastly I would like to thank my supervisors Miguel Prazeres and Ana Azevedo for giving me the
opportunity to work on something I truly love and also for the advice, guidance and inspiration throughout
this past year.
iii
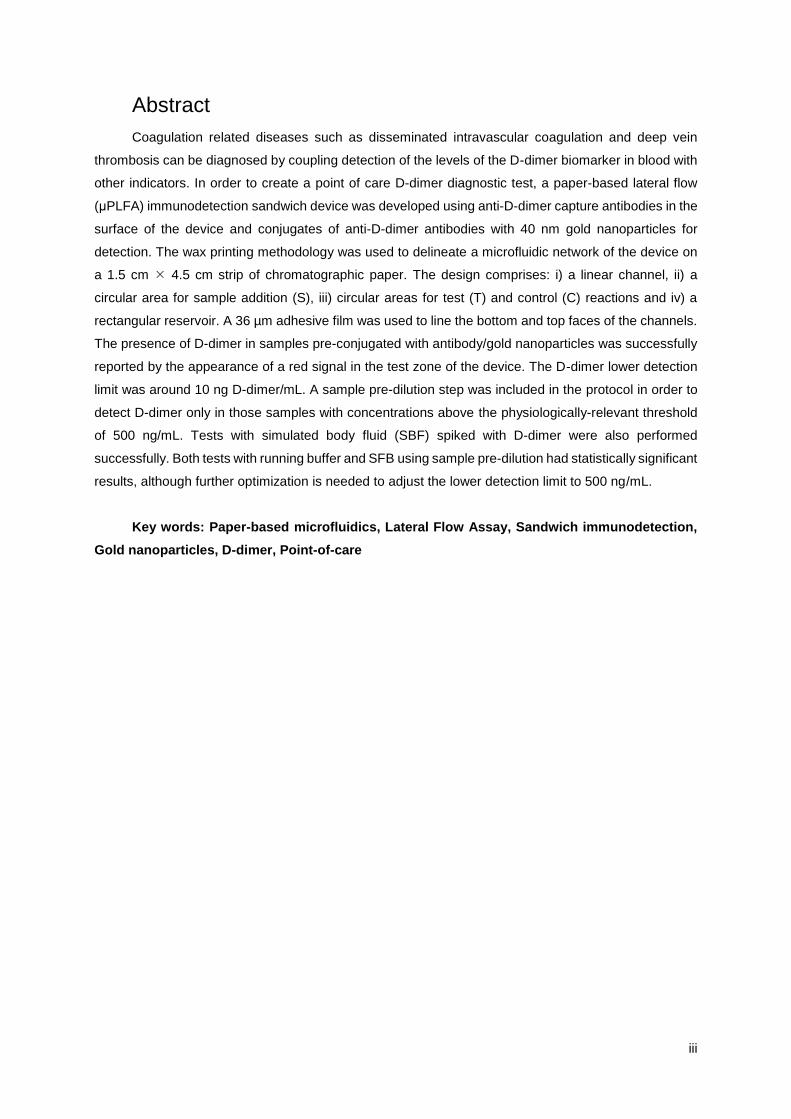
Abstract
Coagulation related diseases such as disseminated intravascular coagulation and deep vein
thrombosis can be diagnosed by coupling detection of the levels of the D-dimer biomarker in blood with
other indicators. In order to create a point of care D-dimer diagnostic test, a paper-based lateral flow
(μPLFA) immunodetection sandwich device was developed using anti-D-dimer capture antibodies in the
surface of the device and conjugates of anti-D-dimer antibodies with 40 nm gold nanoparticles for
detection. The wax printing methodology was used to delineate a microfluidic network of the device on
a 1.5 cm 4.5 cm strip of chromatographic paper. The design comprises: i) a linear channel, ii) a
circular area for sample addition (S), iii) circular areas for test (T) and control (C) reactions and iv) a
rectangular reservoir. A 36 µm adhesive film was used to line the bottom and top faces of the channels.
The presence of D-dimer in samples pre-conjugated with antibody/gold nanoparticles was successfully
reported by the appearance of a red signal in the test zone of the device. The D-dimer lower detection
limit was around 10 ng D-dimer/mL. A sample pre-dilution step was included in the protocol in order to
detect D-dimer only in those samples with concentrations above the physiologically-relevant threshold
of 500 ng/mL. Tests with simulated body fluid (SBF) spiked with D-dimer were also performed
successfully. Both tests with running buffer and SFB using sample pre-dilution had statistically significant
results, although further optimization is needed to adjust the lower detection limit to 500 ng/mL.
Key words: Paper-based microfluidics, Lateral Flow Assay, Sandwich immunodetection,
Gold nanoparticles, D-dimer, Point-of-care

iv
Resumo
Doenças de coagulação como a Coagulação Intravascular Disseminada e a Trombose Venosa
Profunda podem ser diagnosticadas utilizando níveis de D-dímero no sangue em conjunto com outros
indicadores de doença. De modo a criar um teste de diagnóstico “point-of-care”, um dispositivo de
immunodeteção em papel em “lateral flow” (μPLFA) foi desenvolvido utilizando anticorpos anti-d-dímero
como captura na superfície do papel e acoplados a nanopartículas de ouro de 40 nm como sistema de
deteção. O método de “wax printing” foi utilizado para desenhar canais de microfluídica numa tira de
papel cromatográfico com 1.5 cm x 4.5 cm. O design incluí i) um canal linear, ii) uma área circular para
adicionar a amostra, iii) áreas circulares de reações de teste (T) e controlo (C) e iv) um reservatório
retangular. Uma membrana de adesivo com 36 µm foi usada para delinear a face inferior e superior dos
canais. A presença de D-dímero em amostras pré conjugadas com nanopartículas de ouro
funcionalizadas com anticorpos foi bem-sucedida e reportada pela presença de um sinal vermelho nas
zonas de teste do dispositivo. O limite inferior de deteção do D-dímero foi de 10 ng/mL. Foi incluído um
passo de pré-diluição das amostras no protocolo de modo o D-dímero fosse detetado apenas em
amostras com concentração superior a 500 ng/mL. Testes feitos com plasma simulado com D-dímero
também foram bem-sucedidos. Ambos os testes com tampão de corrida e plasma simulado tiveram
resultados estatisticamente significativos, no entanto é necessário otimizar o limite de deteção de 500
ng/mL.
Palavras-chave: Microfluídica em papel, Ensaios Lateral Flow, Immunodeteção sandwich,
Nanopartículas de ouro, D-dímero, Point-of-care

v
Table of Contents
Sumário Acknowledgements ........................................................................................................................ ii
Abstract ......................................................................................................................................... iii
Resumo ......................................................................................................................................... iv
Table of Contents ...........................................................................................................................v
List of tables ................................................................................................................................. vii
List of figures ............................................................................................................................... viii
List of Abbreviation ....................................................................................................................... xii
1. Introduction .......................................................................................................................... 1
1.1. Point of Care –Protein Diagnostics.............................................................................. 1
1.1.1. Immunoassays ......................................................................................................... 1
1.2. Point of care diagnostics ............................................................................................. 4
1.2.1. Types of POC tests.................................................................................................. 5
1.3. D-Dimer and diagnosis of coagulopathies ................................................................... 9
1.3.1. D-Dimer detection and quantification .................................................................... 11
1.4. Paper-Based Microfluidic Devices ............................................................................. 14
1.4.1. Microfluidics technology ........................................................................................ 14
1.4.2. µPADs Manufacturing Process.............................................................................. 15
1.4.3. µPADS surface functionalization ........................................................................... 17
1.4.4. µPADs detection system ....................................................................................... 18
1.4.5. Lateral flow diagnostic tests on paper ................................................................... 20
2. Objectives .......................................................................................................................... 22
3. Materials and Methods ...................................................................................................... 24
3.1. Materials .................................................................................................................... 24
3.1.1. Cellulose paper and adhesive membrane ............................................................. 24
3.1.2. Channel designs (AutoCAD) ................................................................................. 24
3.1.3. μPLFA devices fabrication ..................................................................................... 24
3.1.4. Antibodies and other test components .................................................................. 25
3.2. Methods ..................................................................................................................... 26
3.2.1. Paper preparation .................................................................................................. 26

vi
3.2.2. Conjugation of antibodies with ZZ-CBM64 fusion ................................................. 26
3.2.3. Gold nanoparticles functionalization ...................................................................... 26
3.2.4. Preparation and spiking of simulated body fluid .................................................... 27
3.2.5. Reagents preparation ............................................................................................ 27
3.2.6. Test protocol for the μPLFA tests .......................................................................... 29
3.2.7. Test protocol for the paper-based spot tests ......................................................... 29
3.2.8. Image Scan and Analysis ...................................................................................... 29
4. Results and Discussion ..................................................................................................... 30
4.1. D-dimer immunodetection using ZZ-CBM64 for antibody biochemical coupling on
paper 30
4.2. D-dimer immunodetection with antibody adsorption on paper .................................. 33
4.3. New channels for paper based D-dimer immunodetection ....................................... 35
4.4. Optimization of the D-dimer immunodetection cut-off ............................................... 40
4.5. D-dimer immunodetection with simulated body fluid ................................................. 45
5. Conclusions ....................................................................................................................... 49
6. References ............................................................................................................................i
Annex I .......................................................................................................................................... a

vii
List of tables
Table 1 – FDAs’ definition of a simple diagnostic test. Adapted from Yager et al., (2008). .......... 4
Table 2 – Standard methods for D-dimer detection and quantification. 23 .................................. 12
Table 3 –Summary table with the main fabrication techniques for µPADs.32,35 .......................... 16
Table 4 –Main immobilization methods used for paper surface functionalization 39 ................... 17
Table 5 – List of all the reagents used to produce simulated body fluid. The listed masses where
calculated in order to make 100 mL of solution. 51 ................................................................................ 25
Table 6 – Composition (moles) and volume of solutions used to immobilize antibodies on the test
(ABS-28) and control (Ab-Goat) zones of the μPLFA device. A refers to tests using ZZ-CBM64 and B
refers to tests without said fusion protein. Concentration of stock solutions of ZZ-CBM64, ABS-28 and
Ab-Goat were 5 μM, 6.6 μM and 5 μM, respectively. PBS 1x, pH 7.2 was used to make up the final
volume of solutions. ............................................................................................................................... 28
Table 7 – Volumes of the test and control samples run on the μPLFA devices. Experiments were
made with either 8 μL (i) or 12 μL (ii) of total sample volume. D-dimer standard solutions were prepared
by adding appropriate amounts of D-dimer either to running buffer or SBF. Spiked SBF stands for SBF
solutions with D-dimer. .......................................................................................................................... 28
Table 8 – Overall reagent composition for the spot assays performed. Both the solutions to be
immobilized on the paper and to be tested are displayed here. The control solution, which is the solution
deposited on the spot after surface functionalization without any D-dimer, was equal to all three spots.
a) PBS 1x was used for the solutions for surface functionalization and running buffer was used for the
control solution. ..................................................................................................................................... 28
Table 9 – Statistic analysis of the detection of D-Dimer on μPLFA devices using simulated body
fluid (SBF) samples. Results were obtained with the one-way ANOVA test using 95% confidence
intervals and Dunnett’s test for multiple comparisons. The displayed data relates to the statistical
differences between the different D-dimer concentrations triplicates and the negative control triplicates
and their respective p-value. ................................................................................................................. 48

viii
List of figures
Figure 1 – Schematic representation of an antibody and antibody-antigen complex 5 ................. 2
Figure 2 – Schematic representation of the three types of ELISA 6 .............................................. 3
Figure 3 – Standard constitution of an LFA device. The diagram displays the housing and the
testing strip within it, evidencing each strip component. 15 ...................................................................... 6
Figure 4 - Diagram displaying three of the possible results obtained in POC LFA devices. A:
negative result; B: positive result; C: invalid result. ................................................................................. 7
Figure 5 – Representation of the main stages of the coagulation process: A- wound formation; B-
vessel contraction; C- Platelet plug formation; D- fibrin clot formation. 20 ............................................... 9
Figure 6 – Schematic representation of fibrin formation and dissolution upon clot formation. The
three major steps of D-dimer antigen formation are shown. (i) The fibrinogen molecule is cleaved by
thrombin to produce fibrin monomers. These monomers associate with each other via noncovalent
interactions between the intermolecular D-domain and D-E domains (shown as dotted lines). (ii) Once
fibrin is polymerized, Factor XIIIa covalently attaches D domains and inserts a covalent intermolecular
linkage (diamond-shaped figure). (iii) Plasmin degrades fibrin at multiple sites to release fibrin
degradation products, which then expose the D-dimer antigen epitope. The initial fragments are high-
molecular-weight complexes followed by further degradation to produce the terminal D-dimer–E
complex, which contains the dimer antigen. This is a schematic representation of just one protofibril.
Multiple protofibrils are aligned side by side and undergo branching to make a fibrin gel. 23 ............... 10
Figure 7 – Schematic representation of the different D-dimers configurations formed upon
fibrinolysis and the different antibodies that arise from these varied configurations. 29 ........................ 13
Figure 8 – Overall scheme of the wax printing µPAD fabrication process. First the design of the
µPAD is made in AutoCAD, then wax printed onto a paper, which is then heated prior to utilization to
allow wax melting. The overall configuration of the µPAD has wider edges when compared to the initial
design as a result of molten wax spreading. ......................................................................................... 16
Figure 9 –Schematic representation of the µPLFA device designed for immunodetection of D-
dimer. The device features a linear channel, sample (S), test (T) and control C) zones and a rectangular
reservoir. The molecular events occurring in the T and C are shown. 50 .............................................. 22
Figure 10 – Design and dimensions of both types of μPLFA channels, used for D-dimer
immunodetection. Channels in B are equivalent, differing only in the colour of the ink used for printing.
............................................................................................................................................................... 24
Figure 11 – Schematic representation of a paper strip with (a) no adhesive, (b) adhesive placed
underneath and (c) adhesive on top and underneath. .......................................................................... 26
Figure 12 – Overall detection schemes used in the D-dimer μPLFA tests. The D-dimer capture
antibody on the test zone was either adsorbed (A) or anchored on paper using a ZZ-CBM64 fusion
protein (B). The Ab-Goat antibody was always adsorbed on paper. .................................................... 27
Figure 13 – Expected results for a successfully implemented D-dimer immunodetection test. The
μPLFA on the left displays results after loading a D-dimer-containing sample, whereas the μPLFA on
the right display the result after loading a sample with no D-dimer. These results are expected to be
similar in the two designs used (Figure 10). .......................................................................................... 30
ix
Figure 14 – Schematic representation of μPLFA devices used for D-dimer detection. The capture
antibody is anchored to the surface of the test zones via a ZZ-CBM64 fusion. A: addition of sample at
t=0; B: test completion at t=t. All the test elements are represented on their respective locations....... 30
Figure 15 – D-Dimer detection on μPLFA devices with capture antibody anchored on test zone
via ZZ-CBM64 fusion. Both control (sample with no D-dimer) and test (sample with D-dimer) devices
are displayed. Experiments were performed by supplementing the running buffer (PBS 1x, pH7.2, 0.5%
BSA, 2.5% saccharose) with either 0.01% (A) or 0.08% (B) Tween 20. Experimental conditions: 2 pmol
ZZ-CBM64; 5 pmol ABS28; 5 pmol Ab-goat; 8 μL sample volume; 1x10⁵ ng/mL D-dimer. T: test zone;
C: Control zone. ..................................................................................................................................... 31
Figure 16 – Spot assay results and the respective spot schematic representation. All the symbols
have the same meaning as in Figure 14. A: control solution with AuNp-ABS22 and no D-dimer deposited
on a spot without surface functionalization; B: corresponds to the spot with 1 pmol of ZZ-CBM64; C:
corresponds to the spot with 2 pmol of ZZ-CBM64; D: corresponds to the positive control (Ab-goat).
Spots B C and D where all tested with the same control solution containing AuNp-ABS22 used in spot
A. ........................................................................................................................................................... 32
Figure 17 - Schematic representation of μPLFA devices used for D-dimer detection. The capture
antibody is anchored to the surface of the test zones via adsorption. A: addition of sample at t=0; B: test
completion at t= t. All the test elements are represented on their respective locations. ....................... 33
Figure 18 – D-Dimer detection on μPLFA devices with capture antibody anchored on the test
zone via adsorption. Both control (sample with no D-dimer) and test (sample with D-dimer) devices are
displayed. Experimental conditions: 5 pmol ABS28; 5 pmol Ab-goat; 8 μL sample volume; 1x10⁵ ng/mL
D-dimer. running buffer-PBS 1x with 0.08% tween 20. T: test zone; C: Control zone. ......................... 33
Figure 19 – D-Dimer detection on μPLFA devices with capture antibody anchored on the test
zone via adsorption. Results from the lateral flow test performed with an increased sample volume of
12 μL. Both control and test channels are displayed. Experimental conditions: 5 pmol ABS28; 5 pmol
Ab-goat; 12 μL sample volume; 1x10⁵ ng/mL D-dimer; running buffer-PBS 1x with 0.08% tween 20. T:
test zone; C: Control zone. .................................................................................................................... 34
Figure 20 – Migration of a dye solution through the channels defined on paper. A: Time-lapse of
the channels with dye on both black and yellow ink channels: I – channels with adhesive underneath
(Figure 11 b); II channels with adhesive on both top and underneath (Figure 11 c). B: Paper strips with
the channels printed in black or yellow ink were covered with adhesive on the bottom, or on both top
and bottom faces of the channel. Results are plotted as time t versus the square of the distance travelled,
L2. .......................................................................................................................................................... 35
Figure 21 – Test results of a D-dimer immunodetection tests on yellow ink channels. A: Time-
lapse of the channels: I - channels with adhesive underneath (Figure 11 b); II channels with adhesive
on both top and bottom (Figure 11 c). B: Graphic representation of the fluid velocity on the respective
channels. Results are plotted as time t versus the square of the distance travelled, L2 ....................... 36
Figure 22 - D-Dimer detection on μPLFA devices with capture antibody anchored on the test zone
via adsorption. Results are shown for channels printed in black or yellow. An adhesive layer was used
on the bottom face of the devices. Both control and test channels are displayed. Experimental

x
conditions: 5 pmol ABS28; 5 pmol Ab-goat; 12 μL sample volume; 1x10⁵ ng/mL D-dimer; running buffer-
PBS 1x with 0.08% tween 20. T: test zone; C: Control zone. ............................................................... 37
Figure 23 – Average mean grey intensities of the test and control zones of both test and control
yellow and black ink channels. .............................................................................................................. 37
Figure 24 - D-Dimer detection on μPLFA devices printed in yellow and covered with adhesive on
both top and bottom faces. Both control and test channels are displayed. Experimental conditions: 5
pmol ABS28; 5 pmol Ab-goat; 12 μL sample volume; 1x10⁵ ng/mL D-dimer; running buffer-PBS 1x with
0.08% tween 20. T: test zone; C: Control zone. .................................................................................... 38
Figure 25 – Effect of adhesive layers on D-Dimer detection on μPLFA devices with capture
antibody anchored on test zones via ZZ-CBM64 fusion. Both control and test channels are displayed.
Experimental conditions: 2 pmol ZZ-CBM64; 5 pmol ABS28; 5 pmol Ab-goat; 12 μL sample volume;
1x10⁵ ng/mL D-dimer; running buffer-PBS 1x with 0.08% tween 20. T: test zone; C: Control zone. ... 38
Figure 26 – Calibration of D-Dimer detection on μPLFA devices. The D-dimer concentrations of
samples run in each device are displayed on the left side of each device. Devices were printed in yellow
and covered with adhesive on both faces. Experimental conditions: 5 pmol ABS28; 5 pmol Ab-goat; 12
μL sample volume; running buffer-PBS 1x with 0.08% tween 20. T: test zone; C: Control zone. ........ 40
Figure 27 - Calibration of D-Dimer detection on μPLFA devices. The average mean grey
intensities of signals in the test and control zones of the devices (Figure 26) is plotted as a function of
D-dimer concentration. .......................................................................................................................... 41
Figure 28 – Effect of sample dilution on D-Dimer detection on μPLFA devices. Devices were
covered with adhesive on both faces and D-dimer samples were diluted 25x or 20x. Experimental
conditions: 5 pmol ABS28; 5 pmol Ab-goat; 12 μL sample volume; running buffer-PBS 1x with 0.08%
tween 20. T: test zone; C: Control zone. ............................................................................................... 41
Figure 29 - Commercially available D-dimer detection cassettes. Sample is placed on the lower
region (s) followed by the application of a buffer provided with the test. The result is displayed on the
central opening (T and C). Left cassette: negative result obtained with a sample with a D-dimer
concentration of 250 ng/m – only the control (C) line is visible. Right cassette: positive result obtained
with a sample with a D-dimer concentration of 1000 ng/mL - both test (T) and control (C) lines are visible.
............................................................................................................................................................... 42
Figure 30 – Detection of D-Dimer on μPLFA devices using samples with sub-threshold
concentrations. Devices were covered with adhesive on both faces and D-dimer samples were diluted
25x. Tests were made in triplicate. Experimental conditions: 5 pmol ABS28; 5 pmol Ab-goat; 12 μL
sample volume; running buffer-PBS 1x with 0.08% tween 20. T: test zone; C: Control zone. ............. 43
Figure 31 - Detection of D-Dimer on μPLFA devices using samples with sub-threshold
concentrations. The average mean grey intensities and corresponding error bars of signals in the test
and control zones of the devices (Figure 30) is plotted as a function of D-dimer concentration. Tests
were made in triplicate. .......................................................................................................................... 43
Figure 32 - Detection of D-Dimer on μPLFA devices using simulated body fluid (SBF) samples
with sub-threshold concentrations. Devices were covered with adhesive on both faces. Experimental
xi
conditions: 5 pmol ABS28; 5 pmol Ab-goat; 12 μL sample volume; running buffer-PBS 1x with 0.08%
tween 20. T: test zone; C: Control zone. ............................................................................................... 45
Figure 33 - Detection of D-Dimer on μPLFA devices using simulated body fluid (SBF) samples
with sub-threshold concentrations. The average mean grey intensities of signals in the test and control
zones of the devices (Figure 32) is plotted as a function of D-dimer concentration. ............................ 46
Figure 34 - Detection of D-Dimer on μPLFA devices using simulated body fluid (SBF) samples
with sub-threshold concentrations. Devices were covered with adhesive on both faces and D-dimer
samples were diluted 25x. Tests were made in triplicate. Experimental conditions: 5 pmol ABS28; 5
pmol Ab-goat; 12 μL sample volume; running buffer-PBS 1x with 0.08% tween 20. T: test zone; C:
Control zone. ......................................................................................................................................... 46
Figure 35 - Detection of D-Dimer on μPLFA devices using simulated body fluid (SBF) samples
with sub-threshold concentrations. The average mean grey intensities and respective error bars of
signals in the test and control zones of the devices (Figure 34) is plotted as a function of D-dimer
concentration. Tests were made in triplicate. ........................................................................................ 47

xii
List of Abbreviation
µPADs Microfluidic Paper-Based Analytical Devices
μPLFA Microfluidic Paper-Based Lateral Flow Assay
µTAS Micro Total Analytic Systems
Ab-goat Anti-mouse goat antibody
ABS-22 Detection anti-D-dimer antibody
ABS-28 Capture anti-D-dimer antibody
AKD Alkylketene Dimer
AP Alkaline Phosphatase
aPTT Activated Partial Thrombostatin Time
AuNp Gold nanoparticles
AuNp-ABS22 Gold Nanoparticles coupled to the detection anti-D-dimer antibody
BSA Bovine Serum Albumin
CBM Carbohydrate Binding Module
DIC Disseminated Intravascular Coagulation
DNA Deoxyribonucleic Acid
DVT Deep Vein Thromboembolism
ELISA Enzyme Linked Immunosorbent Assay
FDA Food and Drug Administration
FDP Fibrin Degradation Products
HP Horseradish Peroxidase
LFA Lateral Flow Assay
MEMS Microelectronic mechanical Systems
One-way ANOVA One-way analysis of variance’
PBS Phosphate buffered saline
POC Point of Care
PT Prothrombin Time
RBC Red Blood Cell
RNA Ribonucleic Acid
RPA Reverse Phase Arrays
SBF Simulated Body Fluid
UV-VIS Ultraviolet- Visible
ZZ-CBM Double Z domain coupled to the Carbohydrate Binding Module

1
1. Introduction
1.1. Point of Care –Protein Diagnostics
Proteins are macromolecules found in all living organisms, which have crucial roles in practically
every function performed on living cells. As much as proteins contribute to the normal functioning of life,
they can also have negative impacts on biological processes and ultimately lead to pathologies. The
relevance of proteins when we have a less than normal functioning of a cell or organism is linked to their
ability to either cause that malfunction or, in turn, to be the reporters of said malfunction. This means
that proteins are our best suspects or witnesses when we are studying or trying to interpret a certain
disease. 1
With the end of the Human Genome Sequencing project in 2001, the scientific community began
harnessing and decoding information hosted on the genome to obtain a better understanding of the
molecular basis of human disease. The goal was to use this knowledge to create new medicines,
vaccines and diagnostic tests based on indicators of biological processes (i.e. biomarkers). In its
majority, biomarkers include proteins and DNA/RNA molecules that together make up the proteome and
genome of an individual, respectively. Because proteins and RNA molecules are the effectors of the
genetic information, their study and analysis became very relevant in molecular biology. With the
increasing awareness of the role of proteins in pathologies, health specialists nowadays perform not
only medical diagnosis on patients, looking for signs and symptoms of the disease, but also rely on
molecular diagnosis to look for biomarkers of pathologies to help determine precisely the condition of
patients. 2,3
In order to access the information that proteins provide us as biomarkers we must quantify them.
This means that we must know how to quantify each protein of interest for each case we wish to study.
Protein assays, which include extraction, purification, labelling and lastly analysis steps, are therefore a
process that is integral to several laboratory workflows. When performing this type of analysis we must
look for each protein we have in a sample. However, because the number and diversity of proteins in a
living organism is so high, such assays can be very long and complex. Why is this? Because for each
protein we want to study we may need different tools to do so, including, among others, different
labelling, different extraction methods and different optimal conditions that in all difficult the process.
Nonetheless, the many years of experience that scientists have gathered have led to the improvement
of these protein assays. 4
1.1.1. Immunoassays
The most common assays to perform protein identification and quantification are immunoassays.
Here we take advantage of antibodies to identify specific proteins of interest, or protein biomarkers, in
order to obtain relevant information regarding a certain biological process or pathology. Antibodies are
proteins produced by plasma cells that have binding affinity to specific antigens, which are molecules
capable of triggering a humoral immunologic response. The extraordinary binding affinity and specificity
of antibodies makes them valuable analytical reagents for protein analysis. 4

2
In order to perform this in vivo process in vitro we need to be able to detect the antibody-antigen
binding and the most common way to detect molecular binding is to label fluorescently the antibodies.
In summary, protein immunoassays rely on the antibody-antigen (protein) specific binding to identify a
specific protein of interest in a sample (Figure 1). The labelling of the antibodies provides us with a
measurable signal that can be further used for quantification. 4 The most used immunoassays include
protein microarrays and Enzyme Linked Immunosorbent Assay (ELISA).
Figure 1 – Schematic representation of an antibody and antibody-antigen complex 5
1.1.1.1. Enzyme Linked Immunosorbent Assay (ELISA)
ELISA is an immunoassay that uses enzyme-linked antibodies to detect and quantify small
amounts of proteins in samples. The protocol for this technique includes adsorption of test and reference
antigens directly on a substrate and further washing with a solution of a nonspecific protein. This protein
will block the surface and will prevent the adsorption of proteins introduced in subsequent steps. The
washing is followed by the addition of an enzyme-linked antigen-specific antibody solution (Figure 2).
The detection is performed by providing the enzyme’s substrate that once catalysed will lead to a change
in colour of the solution. Regarding the detection antibodies, depending on the availability of antibodies
and antigens we want to detect, we have two options: either use primary antibodies that bind to the
antigen followed by a secondary enzyme-linked antibody that recognizes the primary antibody, or use
an enzyme-linked primary antibody. The most commonly used enzymes in ELISA are Horseradish
Peroxidase (HRP) and Alkaline Phosphatase (AP).
Other two variations of this technique are the “Sandwich”, or Capture, ELISA and the Anchor
ELISA in which we have the immobilization of the reference and sample antigens in antigen-specific
antibodies or a bridging molecule, respectively (Figure 2). Another variation of ELISA are ELISA-based
assays where the detection antibodies are labelled with fluorophores instead of enzymes, and the
quantification of the analyte is made in terms of fluorescence intensity directly and not substrate
conversion. 4–6

3
Figure 2 – Schematic representation of the three types of ELISA 6
1.1.1.2. Protein Microarrays
Microarrays where initially conceived for DNA analysis, more concretely to allow the simultaneous
measurement of the expression of thousands of genes. The advances in the underlying technologies
and the increasing interest in proteome analysis subsequently led to the development of protein
microarrays. Protein microarrays are based on immunoassays and can be classified into three
categories: analytical microarrays, functional microarrays, and reverse phase microarrays. 2
Analytical microarrays are used to profile proteins in a complex mixture and further measure their
binding affinities, specificities, and expression levels. Functional protein microarrays, on the other hand,
are used to study the biochemical activities, for example signalling pathways, of an entire proteome in
a single experiment. Finally, we have reverse phase protein microarrays (RPA), which are especially
relevant for biomarker discovery or proteomic studies. In a RPA a cell lysate is arrayed and then its
content is probed with protein-specific antibodies. Reference peptides are also printed on the array, to
allow for protein quantification of the sample lysates. Detection is usually performed with
chemiluminescent, fluorescent, or colorimetric assays. These assays allow for the determination of the
presence of specific or altered proteins that may be the result of disease. 7,8
Regardless of the method, nowadays the use of immunoassays is very relevant in biomedical and
biotechnology areas namely in molecular diagnosis because it allows accurate results from specific test
samples that are mainly biological fluids or tissue samples. Although extremely important for protein
analysis, these tests have the downside of being time consuming, requiring specialized knowledge of
the techniques and extensive sample preparation. Considering that immunoassays are, in most cases,
the gold standard for protein analysis, these disadvantages are a driving force to develop new and
improved ways of performing immunoassays. 4,5 One major trend in the last decade, regarding the
improvement of immunoassays and other laboratory tests, is to develop point of care diagnostic tests,
which are simple, easy and fast tests that can obtain accurate assay results, as will be discussed next.

4
1.2. Point of care diagnostics
The first step in treating a medical condition is to diagnose it correctly. Although diagnostic tools
available nowadays are effective and sensitive, most of them are complex, time consuming and difficult
to use as monitoring tools. This makes it hard to expand the use of such tools to the entire world
population. Even with urbanization being a trend, more than half of the world’s population lives in rural
and poverty settings where the diagnostic tools that are standards in urban and developed areas are
not common. With this in mind, efforts are being made to develop simple, low-cost and robust diagnostic
tools that are suitable for on the field quick diagnosis and monitoring/control of medical conditions, i.e.
for a Point-Of-Care (POC) diagnostics. POC should rely on economic and minimally instrumented tests
that are suitable for use in underdeveloped and resource-limited environments as an effort to improve
local medical care. 9,10
As previously mentioned, genome sequencing and high-throughput screening, coupled to
proteomics and transcriptome analysis have led to a better understanding of disease pathogenesis at a
molecular level and to the identification of many pathogen and disease biomarkers. This enlightenment
is in turn a motivation to develop POC technologies capable of working with such data, meaning devices
that are able to easily and rapidly identify and quantify biomarkers such as proteins, DNA or RNA. The
definition of a simple test according to the Food and Drug Administration (FDA) is given in Table 1. The
ideal POC diagnostic test should conform to all the indications listed. 9
Table 1 – FDAs’ definition of a simple diagnostic test. Adapted from Yager et al., (2008).
FDAs’ definition of a simple test
Fully automated instrument or unitized, self-contained test
Uses direct unprocessed specimens: capillary blood (finger-stick), nasal swabs, or urine
Needs only basic, non-technique-dependent specimen manipulation, including any for
decontamination
Needs only basic, non-technique-dependent reagent manipulation (“mix reagent A and reagent B”)
Needs no operator intervention during the analysis steps, no technical or specialized training and no
electronic or mechanical maintenance
Produces results that require no operator calibration, interpretation, or calculations
Produces results that are clear to read, such as positive or negative, a direct readout of numerical
values, the clear presence or absence of a line, or obvious colour gradations
Has test performance comparable to a traceable reference method, as demonstrated by studies in
which intended operators perform the test
Contains a quick reference instruction sheet written at the educational level of the user
5
The fields of microfluidics and nanotechnology are especially relevant to develop simple POC
tests, since they provide solutions to perform sample processing, assays and analyte detection at small
scales. This is achieved mostly by miniaturization of already existing diagnostic techniques and
equipment. 9,10
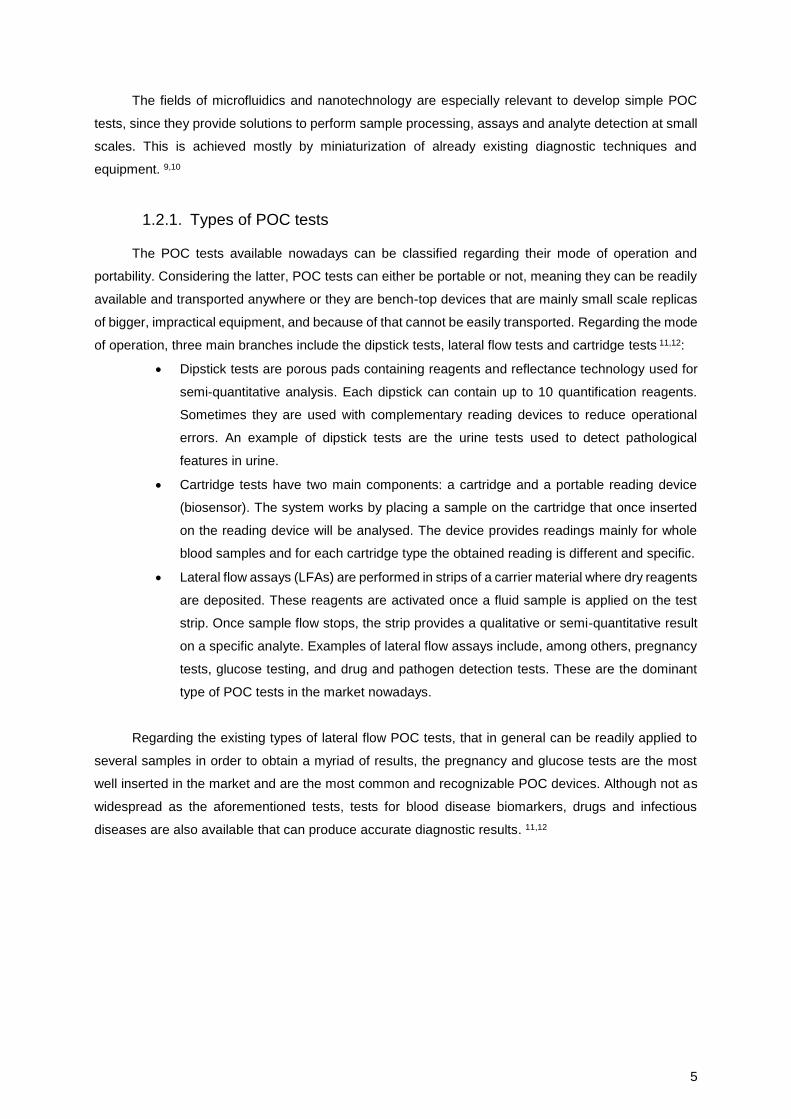
1.2.1. Types of POC tests
The POC tests available nowadays can be classified regarding their mode of operation and
portability. Considering the latter, POC tests can either be portable or not, meaning they can be readily
available and transported anywhere or they are bench-top devices that are mainly small scale replicas
of bigger, impractical equipment, and because of that cannot be easily transported. Regarding the mode
of operation, three main branches include the dipstick tests, lateral flow tests and cartridge tests 11,12:
Dipstick tests are porous pads containing reagents and reflectance technology used for
semi-quantitative analysis. Each dipstick can contain up to 10 quantification reagents.
Sometimes they are used with complementary reading devices to reduce operational
errors. An example of dipstick tests are the urine tests used to detect pathological
features in urine.
Cartridge tests have two main components: a cartridge and a portable reading device
(biosensor). The system works by placing a sample on the cartridge that once inserted
on the reading device will be analysed. The device provides readings mainly for whole
blood samples and for each cartridge type the obtained reading is different and specific.
Lateral flow assays (LFAs) are performed in strips of a carrier material where dry reagents
are deposited. These reagents are activated once a fluid sample is applied on the test
strip. Once sample flow stops, the strip provides a qualitative or semi-quantitative result
on a specific analyte. Examples of lateral flow assays include, among others, pregnancy
tests, glucose testing, and drug and pathogen detection tests. These are the dominant
type of POC tests in the market nowadays.
Regarding the existing types of lateral flow POC tests, that in general can be readily applied to
several samples in order to obtain a myriad of results, the pregnancy and glucose tests are the most
well inserted in the market and are the most common and recognizable POC devices. Although not as
widespread as the aforementioned tests, tests for blood disease biomarkers, drugs and infectious
diseases are also available that can produce accurate diagnostic results. 11,12

6
1.2.1.1. Lateral flow assay diagnostic tests
As previously mentioned, lateral flow assays (LFA) are one of the most popular POC assay
formats currently in use. These lateral flow-based tests are used in human and veterinary medicine,
drug and toxin testing and quality control of consumer goods. The rationale behind such tests is that a
liquid sample flows by capillarity on a test strip, passing through test regions with dried recognition or
capture molecules that allow the positive or negative identification of the target molecule. The most
common substrate to perform these tests is nitrocellulose membrane strips. Figure 3 displays the
standard composition of an LFA. 13–15
Figure 3 – Standard constitution of an LFA device. The diagram displays the housing and the testing strip within it, evidencing each strip component. 15
The common LFA strip is generally encased in a plastic housing structure with two main
apertures, for the strip itself has the following main constituents (Figure 3) 13–15:
The sample pad, that is the region where the test sample is applied; This region is located
under the first housing aperture;
The conjugate pad, that is the structure that contains immobilized detection conjugates
and is placed immediately after the sample pad; The elements present on this pad can
be gold nanoparticles, or other monodisperse magnetic particles, conjugated to detection
molecules such as antibodies or oligonucleotides. The content of this pad is remobilized
as the test sample flows through it allowing the detection molecules to bind to the target
molecule that later will be recognized on the test regions of the nitrocellulose membrane;
The main element of an LFA is the surface layer where the actual test occurs, and is most
commonly a nitrocellulose membrane; this is where the capture molecules are dried in
two main regions, the test line and the control line, that allow for target recognition and
positive control of the test, respectively. Both testing regions are located beneath the
second aperture of the housing;

7
The absorbent pad, that is the region on the end of the test strip that captures the excess
reagents of the test;
All the test strip components described above are assembled with the help of an adhesive
membrane.
The test results obtained from a LFA are either one or two lines, visible on the display window of
the test housing. A conclusive result must always include the positive control line, as it confirms the
reliability of the test (Figure 4). 13–16
A B C
Figure 4 - Diagram displaying three of the possible results obtained in POC LFA devices. A: negative result; B: positive result; C: invalid result.
Test and control signals are due to the binding of the detection conjugates on both testing regions.
On the test line, a positive signal should be due to the binding between the detection conjugate, the
target of interest and the immobilized capture molecules (most commonly antibodies). On the absence
of target there should be no signal visible on the test line. On the control line, a signal should always be
present due to the binding between the detection conjugate and a detection conjugate-specific antibody.
The detection conjugates that originate this control signal are the unbound ones, i.e., the ones that flow
through the test region without being captured, whether on the presence or absence of the target
molecule. Figure 4 displays the three possible results 13–16:
A: Negative Results; the control line is the only line visible;
B: Positive Results; both test and control lines are visible;
C: Invalid results; when only the test line is visible the result is invalid as there is no
assurance that the signal is due to the target molecule recognition by both detection and
capture molecules. If no signal is visible at all (not shown) the test is also inconclusive.

8
The results obtained in LFA can be qualitative or semi-quantitative. Qualitative results imply a
yes/no type of result, where the test simply indicates presence or absence of a target molecule. These
are often naked eye results or results that can be read by optical readers. Semi-quantitative results are
achieved using detection systems like fluorescence or chemiluminescence that allow quantification of
results, meaning that there is a measurable signal intensity that can be quantified using specialized
readers. Depending on the assay to develop, the detection system used greatly influences the types of
results obtained and therefore it should be chosen carefully. 13
In summary, LFA use is widely spread through several scientific areas and the most common
elements of these tests are nitrocellulose membranes functionalized with target specific antibodies and
a detection system that usually provides a coloured result (e.g. via gold nanoparticles). Although
nitrocellulose is the gold standard nowadays, there is a tendency to discover and use alternative
platforms to perform such tests. Paper is a suitable replacement as it has some of the desired
characteristics for these alternative platforms, one in particular is the multiple functionality of paper that
can act as sample application area, reaction surface, and absorbent pad all in one, while being low cost,
biodegradable and easy to handle. This will be discussed further in sub-section 1.4.5. 14,17
9
1.3. D-Dimer and diagnosis of coagulopathies
Blood-based biomarkers are specific disease-related molecules or compounds that circulate in
blood. For example, glucose is a key blood-based biomarker in the context of diabetes. Considering that
simple POC devices for glucose testing are available that are capable of giving fast accurate results,
one may infer that a device with the same characteristics could be made to detect other blood-based
biomarkers. 18–21 Within the big group of blood-based biomarkers, some of them are blood native,
meaning they are the result of blood related diseases, such as coagulopathies, blood cancers,
infections, or genetic disorders.
The major components of the haemostatic system, which function as a team, are (1) platelets and
other formed elements of blood, such as monocytes and erythrocytes; (2) plasma and plasma proteins;
and (3) the vessel wall. 18–21 Human plasma in particular is essentially an aqueous solution of blood
proteins (coagulation and fibrinolytic factors) and other elements, which include nutrients, fatty acids,
and cellular waste. Blood proteins together with platelets constitute the coagulation system of the human
body. Coagulation refers to the action of repairing and closing a lesion or wound in the blood vessel
endothelium, i.e. the cells that constitute the blood vessel wall. This process is the first stage of wound
healing. 18–21
A B C D
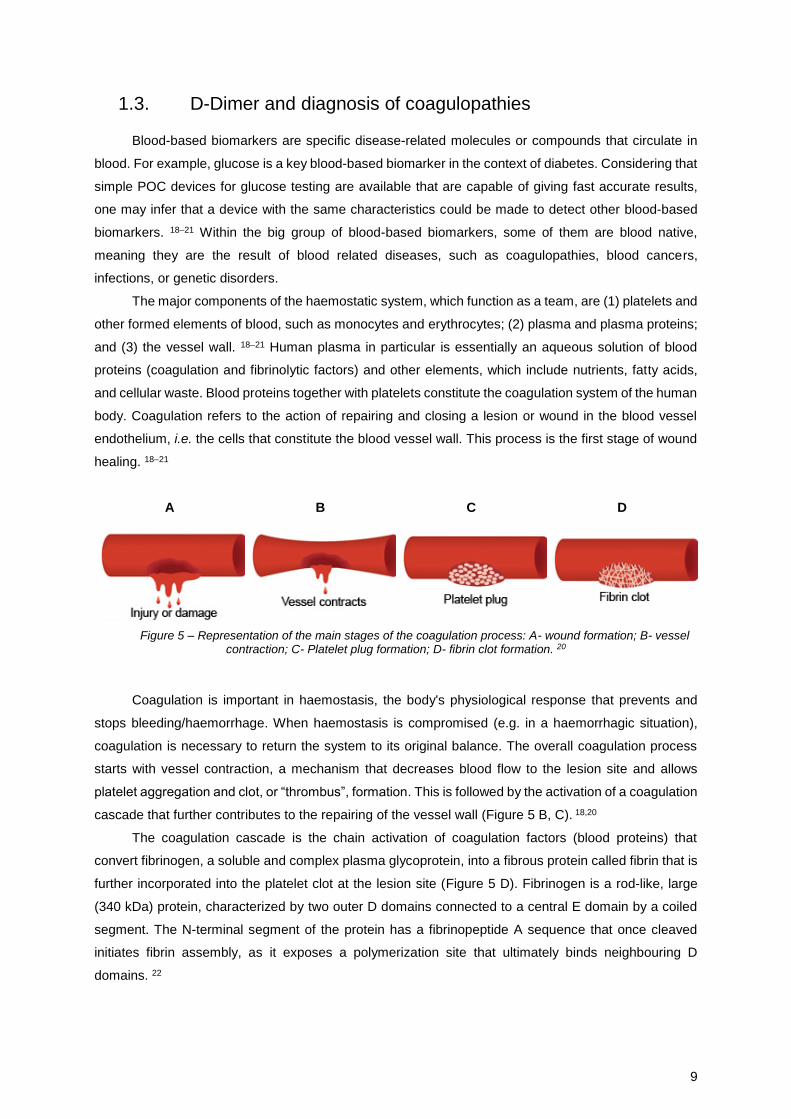
Figure 5 – Representation of the main stages of the coagulation process: A- wound formation; B- vessel contraction; C- Platelet plug formation; D- fibrin clot formation. 20
Coagulation is important in haemostasis, the body's physiological response that prevents and
stops bleeding/haemorrhage. When haemostasis is compromised (e.g. in a haemorrhagic situation),
coagulation is necessary to return the system to its original balance. The overall coagulation process
starts with vessel contraction, a mechanism that decreases blood flow to the lesion site and allows
platelet aggregation and clot, or “thrombus”, formation. This is followed by the activation of a coagulation
cascade that further contributes to the repairing of the vessel wall (Figure 5 B, C). 18,20
The coagulation cascade is the chain activation of coagulation factors (blood proteins) that
convert fibrinogen, a soluble and complex plasma glycoprotein, into a fibrous protein called fibrin that is
further incorporated into the platelet clot at the lesion site (Figure 5 D). Fibrinogen is a rod-like, large
(340 kDa) protein, characterized by two outer D domains connected to a central E domain by a coiled
segment. The N-terminal segment of the protein has a fibrinopeptide A sequence that once cleaved
initiates fibrin assembly, as it exposes a polymerization site that ultimately binds neighbouring D
domains. 22

10
Figure 6 – Schematic representation of fibrin formation and dissolution upon clot formation. The three major steps of D-dimer antigen formation are shown. (i) The fibrinogen molecule is cleaved by thrombin to produce fibrin monomers. These monomers associate with each other via noncovalent interactions between the intermolecular D-domain and D-E domains (shown as dotted lines). (ii) Once fibrin is polymerized, Factor XIIIa covalently attaches D domains and inserts a covalent intermolecular linkage (diamond-shaped figure). (iii) Plasmin degrades fibrin at multiple sites to release fibrin degradation products, which then expose the D-dimer antigen epitope. The initial fragments are high-molecular-weight complexes followed by further degradation to produce the terminal D-dimer–E complex, which contains the dimer antigen. This is a schematic representation of just one protofibril. Multiple protofibrils are aligned side by side and undergo branching to make a fibrin gel. 23
Thrombin is the enzyme responsible for converting soluble plasma fibrinogen into an insoluble
fibrin matrix though the exposure of the polymerisation site. Once fibrin polymerizes and is incorporated
in the clot, factors XIII (fibrin-stabilizing factor) to XIIIa crosslink the polymer on its D=D domains in order
to provide structural stability to the clot (Figure 6). After bleeding is halted, the system remodels the
damaged vessel to restore normal blood flow. 18,20
As soon as the coagulation is over and vascular tissue repair is assured, the degradation of the
formed clots begins to restore haemostasis in the blood vessel. The fibrinolytic system, which has a
parallel activation to the coagulation system, is responsible for this process. 21 More specifically, the
protease plasmin degrades the polymerized fibrin in the clots (i.e. fibrinolysis) by breaking the
crosslinked polymer apart at specific cleavage sites and originating fibrin degradation products (FDP).

11
When plasmin degrades the polymerized fibrin on the covalently cross-linked dimer, D-dimers are
released. D-dimers are therefore small proteins resulting from fibrin degradation that can report on it.
18,19
Since D-dimers are formed every time fibrinolysis occurs, they can be used as a measure of
normality or abnormality of the coagulation system, which includes the coagulation and fibrinolytic
phases 24:
A normal or negative D-dimer result (below a predetermined threshold) means that the
coagulation system is in equilibrium.
A positive D-dimer result (above the threshold) means that there is an abnormal presence
of D-dimer resulting from fibrin degradation. As D-dimer reflects the end of the fibrinolysis
and it is known that this happens in parallel with coagulation, a high amount of D-dimer
indicates that there may be significant coagulation happening. This can be indicative of
an acute stage of coagulation-related diseases or symptoms.
Elevated D-dimer levels can be used as a biomarker with clinical utility in the diagnosis of Deep
Vein Thromboembolism (DVT), Disseminated Intravascular Coagulation, and of diseases whose
symptoms affect the coagulation process. D-dimer levels in clinics can help diagnose certain diseases
when used with other indicators, or can help rule them out. In fact, the exclusion of certain diseases
from a diagnostic as a result of D-dimer levels has nearly 100% accuracy as opposed to the definitive
diagnosis of a disease, that as a certain degree of uncertainty since D-dimer levels can be elevated not
only as a result of disease. D-dimer levels can also be useful to monitor anticoagulant treatment or to
determine risk for thrombosis, i.e. clot formation, in patients predisposed to such. 19,21,25,26
D-dimer as a biomarker is used in combination with other screening assays for haemostatic
function, such as the prothrombin time (PT), activated partial thromboplastin time (aPTT) or platelet
count, to provide important evidence of the degree of coagulation factor consumption and activation. 27
The threshold that deems D-dimer concentrations to be potentially pathological or not is 250 ng/mL.
Some laboratories may establish their own thresholds, but these in general will not differ much from the
250 ng/mL value. It is important to be aware that this concentration of D-dimer is not a definitive value.
For example, pregnant women and elderly people require special D-dimer cut-off values, as their
physiological functioning is not equal to a non-pregnant adult. 28,29 Considering this threshold a cut-off
value of 500 ng/mL is considered adequate to allow users to detect not only low, but also elevated D-
dimer levels. D-dimer testing should have good reproducibility around this cut-off value and the variability
between assays should be less than 10%. 25,26
1.3.1. D-Dimer detection and quantification
Several methods have been used for D-dimer detection and quantification throughout the years.
A summary of the gold standard techniques is presented in Table 2.

12
Table 2 – Standard methods for D-dimer detection and quantification. 23
Method Characteristics
Anti-D-dimer antibody
coated latex beads.
Latex agglutination assays use anti-D-dimer antibody coated latex
beads and rely upon the presence of sufficient bivalent D-dimer antigen
on fibrin degradation products to initiate agglutination of said particles
Automated latex
agglutination assays
Principle is the same as the aforementioned test with the addition of
agglutination rate calculation through specialized analysers
Enzyme-linked
immunosorbent
assay (ELISA)
First developed for research purposes, the ELISA tests for D-dimer
quantification rely upon antibody capture of the D-dimer antigen on the
plate, followed by tagging of the antigen with an antibody-enzyme-
substrate detection system.
The three methods used for D-dimer quantification are assays that rely on the monoclonal
antibody detection of a specific epitope of D-dimer resulting from crosslinked fibrin degradation by
plasmin. This epitope is specific for crosslinked fibrin degradation products but not for fibrinogen
degradation products. Automated determination of rate of agglutination and ELISA tests both have
excellent sensitivity and maintain a good correlation, having both been approved by the FDA. The ELISA
assays in particular, although extremely sensitive, require a long time to perform compared to the other
two detection methods. Because of that they have not been considered for clinical use until recently. 23
As mentioned previously, advances have been made to develop POC tests that allow quick and
easy detection of biomarkers. As a response to the need of having a ready-to-use sensitive D-dimer
test, new ELISA-based assays formats were developed that have the same high detection sensitivity
and specificity as the standard one. These use fluorescence as a detection method and have the added
advantage of speed and a wide linear detection range between 0 and 1000 µg/mL. Besides the ELISA-
based tests, immunofiltration assays that couple physical filtration of sample and antibody recognition
were also developed leading to the shortening of results turnover. These could maintain excellent
sensitivity and specificity when compared to gold standard tests, while yielding results in under 2
minutes. Also POC cartridge type tests using fluorescence have been developed with a dynamic working
range of 50-10000 µg/L. 23,25
The newly developed tests that are mostly in agreement with the POC standards, are prompt in
reporting results and are very useful for clinical management. In their majority, these tests are available
in commercial formats developed by several companies. 23,25
One downside to all available D-dimer diagnostic tests is related to the fact that there is a need
to standardize the D-dimer detection, i. e. there is a lack of references that allow the D-dimer values to
have a significant meaning on the clinic. The need for a reference on D-dimer tests has to do with the
fact that D-dimer does not have just one molecular configuration and composition. In fact, there are
several possible configurations of this fibrin degradation protein, as the only constant feature is the
double D covalent binding on the protein. The remaining structure of the D-dimer may vary according to
the way the polymerized and crosslinked fibrin is degraded by plasmin upon fibrinolysis. This means
that different D-dimer configurations may be recognized by different anti-D-dimer antibodies (Figure 7).

13
Consequently, it may be difficult to compare tests made in laboratories that use monoclonal antibodies
with different specificity and binding affinities to the D-dimer antigen. All this makes it difficult for the
obtained results to have significant meaning when it comes to diagnosis and interpretation of the results
as the antibodies may detect differently the antigen in different clinical samples. 27,29,30
Figure 7 – Schematic representation of the different D-dimers configurations formed upon fibrinolysis and the different antibodies that arise from these varied configurations. 29
Although nowadays the quantification of D-dimer is effective and relies on fast specific and
sensitive devices, the tendency is to keep improving such devices. With this in mind, point-of-care
detection of biomarkers such as D-dimer has been developed since it was first thought of.
14
1.4. Paper-Based Microfluidic Devices
In the past two decades, there has been an increasing interest and development of the
microfluidics field and of micro total analysis systems (µTAS), lab-on-chip (LOC) or microfluidic paper-
based analytical devices (µPADs). Microfluidic technologies, as the name suggests, exploit the small
size of channels to promote the movement of micro quantities of fluids. They have been used for analytic
studies as they offer a number of useful advantages: small amount of samples and reagents required,
low cost and fast, high resolution and sensitive results. 31,32 All these characteristics of microfluidic
technologies will be further described, namely the use of µPADs for POC diagnostics.
1.4.1. Microfluidics technology
The primordial interest and development of microfluidic technologies was focused on four main
areas: molecular analysis, biodefense, molecular biology and microelectronics 31:
1. Micro analytical methods, such as chromatography and capillary electrophoresis, coupled
to laser optical detection have high sensitivity and resolution, while using very small
amounts of sample. These were the first major motivation to develop more versatile and
compact formats of such methods, as well as to look for other methods that could also
be performed in a microscale by means of microfluidic technology.
2. In the 1990s, after the cold war ended, chemical and biological weapons represented a
threat and because of that there was the need to have on-the-field devices for threat
assessment. The microfluidic devices were seen as a way of fulfilling such need.
3. The molecular biology contribution to the development of microfluidics was due to the fact
that with the increasing awareness of genomics and consequentially increasing amounts
of data to be analysed there was a need to generate sensitive and robust results in a
highthroughput manner. Microfluidics technology clearly offered advantages to solve this
need.
4. The final driving force for microfluidic development was the rationale that
photolithography techniques used for microelectronics and microelectronic-mechanical
systems (MEMS), could be applied to this emerging field as well, and so efforts were
made in that direction.
As they have been evolving, microfluidic technologies have been used for a wide range of
practical applications in many research fields. Up to this date, microfluidic devices have been
successfully implemented in biomedical areas for blood analysis, detection and identification of
pathogens, proteins and environmental contaminants, and finally in genetic research and drug industry.
32
Recently, a new major motivational force was introduced to microfluidic development, namely the
functionalization of paper, i.e. the utilization of paper as a substrate to construct microfluidic devices for
use in rapid diagnostic tests. 33 This lead to the creation of µPADs. 32
Excluding the use of filter paper for pH determination, the first reports of µPADs date from 1949 and
refer to the work of Muller and Clegg. 34 However, the demonstration of the first µPADs is attributed to

15
the Whitesides’ Group of Harvard University in 2007. 17 µPADs combine the simple and cost-effective
way of assay realization with the simplicity of already existing POC diagnostic tests. These devices are
in its majority done by patterning hydrophobic boundaries on paper to define microchannels that allow
fluid flow. There are different ways of patterning these channels, as well as different patterning materials
as summarized in Table 3, but overall these devices have the same basic features 33:
Capillary driven fluid motion due to the paper’s porous structure. No need to use pumps;
No need for large amount of reagents and sample volumes. Small volumes of samples
can be used being an important feature when sample size is limited;
Easy disposal and elimination of hazardous waste as paper is biodegradable and easily
disposable by incineration.
Possibility of multiplexing by distribution of a sample into multiple spatially-segregated
regions to enable multiple assays simultaneously (or replicates of an assay) on a single
device;
Fabrication process is simple and affordable due to the low cost, easy manipulation of
paper.
Nowadays µPADs are already spread out amongst several scientific areas as health diagnostics,
biochemical analysis, forensics and food quality control.
1.4.2. µPADs Manufacturing Process
µPADs can be manufactured by different techniques (Table 3). These are mostly based on the
principle of selective hydrophobization of paper through physical or chemical patterning, with the
exception of the cutting paper technique. Delineation of micro-scale channels by paper hydrophobization
can be accomplished in one or two steps: (i) one step hydrophobization refers to the selective use of
physical or chemical agents that readily hydrophobize the paper regions where they are deposited and
(ii) two step hydrophobization refers to the primary hydrophobization of the entire paper surface, followed
by selective dehydrophobization. The cutting technique is an exception to this methodology as it does
not rely on the hydrophilic-hydrophobic contrast and therefore there is no deposition of hydrophobic
agents. The patterning is achieved by cutting the paper with a computer controlled plotter cutter
originating a desired channel configuration. 32,35
Regarding the used patterning agents for each patterning principle we have that physical blocking
of paper pores is usually accomplished with photoresist and PDMS, physical deposition agents include
wax and polystyrene, and finally, chemical surface modification is achieved with AKD, a cellulose
reacting agent used in the paper making industry. Table 3 also lists the patterning agents commonly
used with each patterning technique.32,35

16
Table 3 –Summary table with the main fabrication techniques for µPADs.32,35
Patterning Principle Fabrication technique Patterning Agent Approach
Physical blocking of
paper pores with
patterning agent
Photolithography Photoresist Two-step hydrophobization
Plotting PDMS Selective hydrophobization
Laser Treatment varies Two-step hydrophobization
Physical depositions
of patterning agent
Wax Printing Wax Selective hydrophobization
Flexography Printing Polystyrene Selective hydrophobization
Screen Printing Wax Selective hydrophobization
Ink Jet Etching Polystyrene Two-step hydrophobization
Surface modification
through chemical
treatment
Plasma Treatment AKD Two-step hydrophobization
Ink Jet Printing AKD Selective hydrophobization
Computer controlled
paper shaping Paper Cutting - -
Considering that all the manufacturing techniques and patterning agents are fairly low-cost, the
overall price of a µPAD is estimated to be around 10$/m2. This feature continues to motivate the
development of such tests towards point of care use. 32,35
1.4.2.1. Wax printed µPADs
Wax printing fabrication of µPADs is a quick, inexpensive and simple way of producing large
numbers of µPADs. Wax patterning is accomplished in essentially three steps: design of patterns
(channels/spots), printing of the patterns on to the paper, and finally melting the wax in order for it to
spread through the thickness of the paper and form hydrophobic barriers (Figure 8). These steps require
an adequate computer-aided design software, a wax ink printer and a hot plate. The paper commonly
used for the µPADs is the Whatman chromatography paper because it is hydrophilic, homogeneous,
pure, reproducible, biocompatible, available and also relatively inexpensive. 36,37
Design Print Melt wax Final µPAD
Figure 8 – Overall scheme of the wax printing µPAD fabrication process. First the design of the µPAD is made in AutoCAD, then wax printed onto a paper, which is then heated prior to utilization to allow wax melting. The overall configuration of the µPAD has wider edges when compared to the initial design as a result of molten wax spreading.
17
Regarding the wax melting process, once the printed wax is placed under a heat source, the wax
deposited on the paper will melt and spread laterally and through the thickness of the paper, i.e. the
original design of the µPAD won’t correspond exactly to the obtained channel configurations after
heating as the channel barriers will be increased due to lateral spreading of the wax.
This phenomenon may difficult the designing process of channels as the printed features do not
translate directly onto the final configuration of the device, having lower resolution. From all the available
µPAD fabrication methods listed in Table 3, although wax printing has its downsides, namely low
resolution of device features, it is still a fast, efficient and an inexpensive method of fabrication that
requires minimal know how to readily produce large amounts of µPADs using mostly elementary
laboratory equipment. 36,37
1.4.3. µPADS surface functionalization
µPADs that are used for detection of analytes and biomarkers are now a possibility because paper
surface functionalization is possible. Surface functionalization is what allows detection of molecules at
specific tests. µPADs may be coated with specific detection molecules that capture or react with specific
targets. Once coated with specific molecules the paper is said to be bioactive, and it can be used with
several formats from direct contact between detection molecule and target, to lateral flow assays. The
biorecognition agents, i.e. the molecules used to functionalize the paper surface can be antibodies,
enzymes, aptamers, or even nucleic acids. Four immobilization strategies are used to immobilize
molecules on paper (Table 4). 38,39
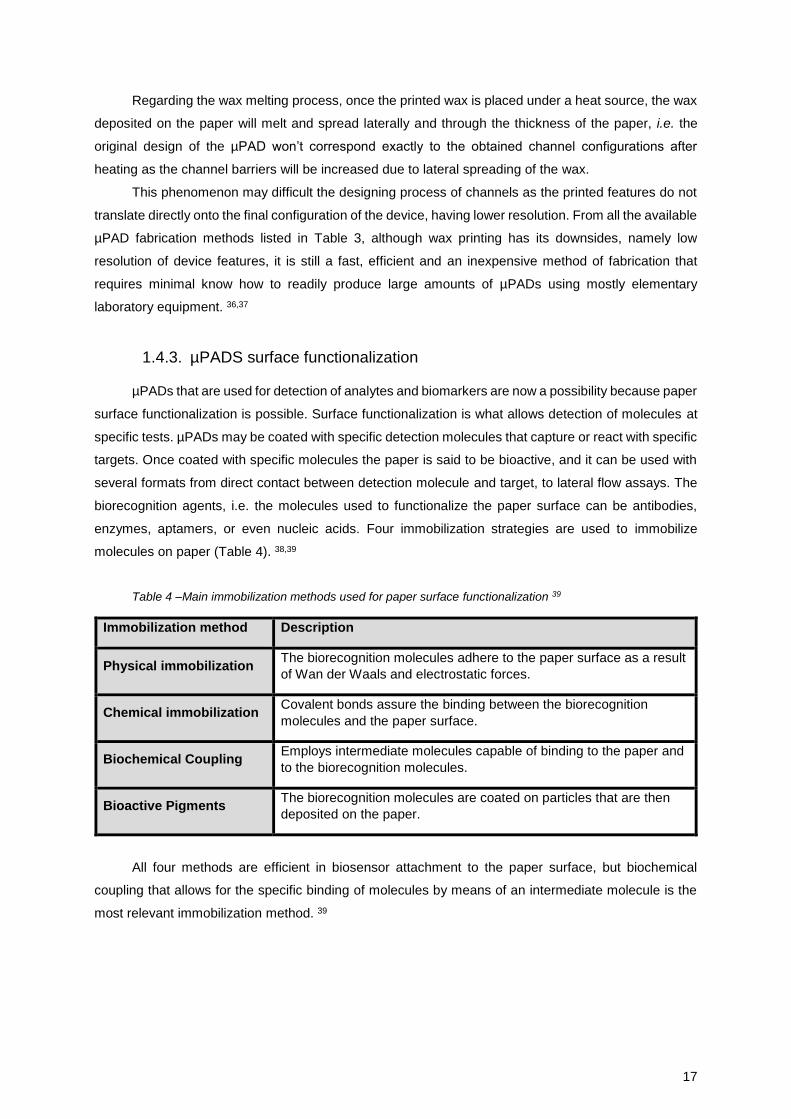
Table 4 –Main immobilization methods used for paper surface functionalization 39
Immobilization method Description
Physical immobilization The biorecognition molecules adhere to the paper surface as a result
of Wan der Waals and electrostatic forces.
Chemical immobilization Covalent bonds assure the binding between the biorecognition
molecules and the paper surface.
Biochemical Coupling Employs intermediate molecules capable of binding to the paper and
to the biorecognition molecules.
Bioactive Pigments The biorecognition molecules are coated on particles that are then
deposited on the paper.
All four methods are efficient in biosensor attachment to the paper surface, but biochemical
coupling that allows for the specific binding of molecules by means of an intermediate molecule is the
most relevant immobilization method. 39

18
1.4.3.1. Carbohydrate Binding Modules for biochemical coupling
The biochemical coupling method of immobilization requires the intervention of an intermediate
molecule to bind the biorecognition molecule to the paper. Common biochemical coupling molecules
are the Carbohydrate Binding Modules (CBM), which are molecules with natural affinity to cellulose.
These molecules attach to the paper’s surface and allow the anchoring of the biorecognition molecules.
This immobilization configuration has one distinct advantage, which is the possibility to correctly orient
the biorecognition molecules on the paper surface. 38–40
Fusion technology has allowed the recombination of CBMs with other proteins, originating
complexes that specifically immobilize antibodies, proteins, bacteriophages, bacteria, among others.
One example is the fusion protein between a CBM molecule and the synthetic double Z domain of the
staphylococcal protein A. This domain has 58 amino acids that are characteristic of the B domain of
staphylococcal Protein A and it has high affinity for the constant, Fc portion of antibodies. The
immobilization of antibodies to the surface of paper through this ZZ-CBM fusion is much more specific
when compared to other immobilization methods. 38–40
1.4.4. µPADs detection system
The use of µPADs for analytic purposes requires the incorporation of a detection system the in
the devices. Most of the conventional detection methods like optical detectors based on UV–Vis light,
chemiluminescence and fluorescence have been successfully integrated or coupled with microfluidic
devices. In µPADs, the tendency is to develop colorimetric and electrochemical detection of analytes.
Nanoparticle-based detection also provides a colorimetric response, even though the detection principle
is not the same as in standard colorimetric detection. 33,41
1.4.4.1. Colorimetric detection
Colorimetric detection methods include the use of molecular or enzymatic dyes. Colour formation
arises from chemical reactions that alter components that were deposited on the µPADs. The detection
result is usually semi-quantitative and the interpretation is done with the help of a calibration chart. The
detection system is incorporated in the µPAD after fabrication (i.e. after wax melting) by spotting
reagents in the detection zones of the device. One of the features of these devices is the possibility of
multiplexing and therefore in the assay format several detection zones can be included. 33,41
One particularity of colorimetric assays is the fact that sometimes the results are time dependent.
This means that the detection of the analyte in the µPADS must occur within a predetermined time
window (usually 10 minutes), or else the results may not be viable. The background noise (colour wise)
of the paper may also influence the final result. In addition, when it comes to result interpretation, as
mentioned, the devices are coupled to a reference chart. However, if the colour developed on the
detection zones is not uniform and perceptible, it may difficult the result readings from the point of view
of the user. Despite all these drawbacks, colorimetric sensing has been the most adopted sensing
mechanism in µPADs. 33,41
19
1.4.4.2. Electrochemical sensing
Electrochemical detection methods, unlike colorimetric methods, do not have colour change as
an output. Instead, electronic signals are generated and converted to numerical values. Electrochemical
sensing systems rely on three electrodes connected to a reaction zone of the µPAD. The electrodes
collect information on the provided samples and transmit it in the form of electronical signals to a µPAD-
coupled electrochemical reading device. Examples of electrochemical sensing include glucose, lactate,
uric acid, cholesterol, tumour markers, dopamine and drugs analysis as well as environmental
monitoring applications for heavy metals.
Comparing colorimetric to electrochemical sensing, the latter one demonstrates faster sensor
response time and higher sensitivities, down to the nM ranges. It is important to note that because the
electrochemical detection is independent of the ambient light, result interpretation is less prone to
interference from the colour/deteriorations of paper, as it happens for colorimetric detection. Although it
has several attractive advantages, electrochemical detection requires the use of specific reading
equipment, which ultimately increases the complexity and the cost per test. 33,41
1.4.4.3. Nanoparticle-based detection
Colloidal gold and monodisperse latex particles are the standard detection reagents for lateral
flow assays. The use of antibody conjugated gold nanoparticles is widely used in commercially available
µTAS devices. Nucleic acids can also be coupled to gold nanoparticles for hybridization assays
detection. 33,41 Moreover, gold nanoparticles have extinction coefficients that are higher than common
organic dyes, meaning the colour arising from analyte detection can prevail longer than other dyes and
their qualitative interpretation does not require a reader. These are motivators that have been extending
the use of nanoparticle-based detection in µPADS. 33,41 Alternatively, in order to provide a detection
result, monodisperse latex particles are often coupled with fluorescent dyes, coloured dyes, and
magnetic or paramagnetic components.
Considering both nanoparticles, colloidal gold particles (20–40 nm) are preferred over
monodisperse latex (100–300 nm) ones because of their relatively small size, and capability of being
dispensed at high densities on the test lines for visual result interpretation. The dense application of gold
nanoparticles helps to assure the homogeneity of colour on the test result, decreasing dubious
interpretations. Also colloidal gold has higher colour intensity compared with coloured latex particles and
higher intensities constitute easier discrimination of weak positive signals, being this another advantage
of gold nanoparticles. 33,41
The synthesis of gold nanoparticles can be achieved through the reduction of a gold precursor
with gold (III) ions, for example chloroauric acid, to metallic gold in the presence of capping agents that
cover the particle’s surface. The purpose of these capping agents is to control particle size, prevent
aggregation and provide colloidal stability. The most common methods to synthesise these metallic
particles are the citrate reduction, Brust-Schiffrin and seeding growth methods. 42

20
Gold nanoparticles can be further functionalized with oligonucleotides or antibodies in order to
appropriately recognize specific target molecules. Some methods used for functionalization include
covalent binding, electrostatic interactions or physical adsorption and affinity binding 42,43:
Covalent binding strategies take advantage of specific chemical groups on both the gold
nanoparticle and the molecule to bind. One example is the covalent binding of thiolated
oligonucleotides or cysteine-containing proteins; 44
Electrostatic interactions allow for molecules to bind to particles with negatively charged
capping agents such as the ones produced by the citrate reduction method. The binding
is based on attractive forces between the negative charge of citrate covered gold
nanoparticles and the positive charge of the ligand, originating a less stable and weaker
bond when compared to the covalent one. The functionalization of gold nanoparticles with
antibodies is an example of this type of functionalization and it relies on the opposite
charges of both elements, and also a pH that promotes said interaction; 45
The last functionalization method is one that originates conjugates with an intermediate
bond with higher stability and strength when compared to the previously mentioned
methods. The affinity binding, as the name implies, relies on affinity between molecules
making the bridge between the gold nanoparticle and molecule conjugate. Examples
include binding through biotin/streptavidin or Protein A/Fc portions of immunoglobulins;
46,47
µPADs with functionalized surfaces and that use nanoparticle-based detection system can be of
use to develop protein immunodetection devices. These assays are performed majorly in lateral flow
devices and can be applied to the detection of any protein.
1.4.5. Lateral flow diagnostic tests on paper
As previously mentioned in chapter 1.2.1.1, paper is a suitable replacement for nitrocellulose
membranes in LFA due to the ease of handling, low cost and sensitive and fast results. Even though
nitrocellulose (pore size 0.45 µm) membranes are commonly used platforms to implement lateral flow
assays their matrix is not ideal. These membranes have high protein binding capacities and capillary
flow properties but they are highly flammable and their mechanical properties difficult their handling and
preparation to use in such tests. On the other hand, cellulose-based paper such as Whatman
chromatography paper (pore size 100 µm) does not have these disadvantages and has more favourable
properties to implement lateral flow assays on. Such microfluidic paper-based lateral flow assay
(μPLFA) devices should have four essential features 33,48:
Distribution of sample through all the regions of the device;
Capillarity driven fluid flow;
Allow the use of small sample and reagent volumes;
Allow easy elimination of hazardous waste;
At a first glance, paper fulfils all four features, with the added advantage that is relatively simple
to assemble a device, especially when using the wax printing method, as the design of the hydrophobic

21
barriers that delineate the hydrophilic channel, followed by printing and melting are mostly
straightforward. 33
When compared to nitrocellulose, paper has the capability to act as the sample application area,
reaction surface, and absorbent pad all in one, meaning that within a µPAD all these functionalities must
be taken into account upon designing the channel features. Nonetheless, these are relatively easy to
map out and translate onto a functional device. The transition and configuration of the device is achieved
by drawing a continuous channel with varying widths as this greatly influences fluid flow and therefore
may contribute to differentiate the different areas of the device, meaning that where there are transitions
in fluid flow due to a change in channel configuration, there are transitions between sample, reaction
and absorbent areas. 49
Besides the ability to act as the aforementioned device sections, paper can also be used, among
other examples, to separate blood into red blood cells (RBC) and plasma. The rationale is that the paper
matrix can work as a blood separator, as it can retain the RBC within the depth of the matrix allowing
the remaining blood components to further elute down the channel. Another method to achieve said
separation is to coat a region of the surface of the paper with RBC agglutinants that, as the name states,
promote RBC agglutination and therefore precipitation onto the paper, allowing for the plasma to be
separated. For devices where plasma elements are being tested, this can be of great use as it may
eliminate a pre-step of blood separation in another equipment. 33
Overall, once the devices are functional, μPLFA can be comparable to the widely spread-out
nitrocellulose strips in terms of specificity of results and sensitivity, as paper allows for the establishment
of defined capture lines in test regions, with relatively low background, and because the capture
molecules used for a nitrocellulose test can also be used in μPLFA. 13,33
All this makes it so that paper is a competitive material to be considered in the LFA world to
develop new and affordable devices to test relevant biomarkers in biological samples, such as blood.
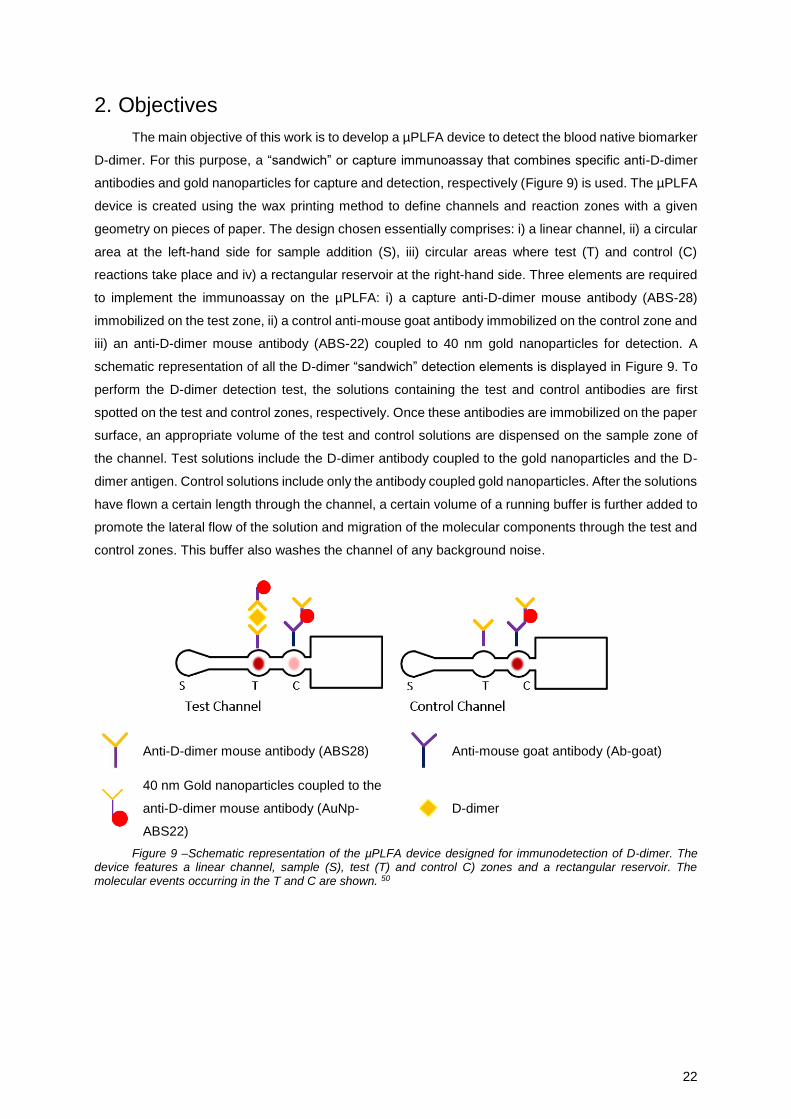
22
2. Objectives
The main objective of this work is to develop a µPLFA device to detect the blood native biomarker
D-dimer. For this purpose, a “sandwich” or capture immunoassay that combines specific anti-D-dimer
antibodies and gold nanoparticles for capture and detection, respectively (Figure 9) is used. The µPLFA
device is created using the wax printing method to define channels and reaction zones with a given
geometry on pieces of paper. The design chosen essentially comprises: i) a linear channel, ii) a circular
area at the left-hand side for sample addition (S), iii) circular areas where test (T) and control (C)
reactions take place and iv) a rectangular reservoir at the right-hand side. Three elements are required
to implement the immunoassay on the µPLFA: i) a capture anti-D-dimer mouse antibody (ABS-28)
immobilized on the test zone, ii) a control anti-mouse goat antibody immobilized on the control zone and
iii) an anti-D-dimer mouse antibody (ABS-22) coupled to 40 nm gold nanoparticles for detection. A
schematic representation of all the D-dimer “sandwich” detection elements is displayed in Figure 9. To
perform the D-dimer detection test, the solutions containing the test and control antibodies are first
spotted on the test and control zones, respectively. Once these antibodies are immobilized on the paper
surface, an appropriate volume of the test and control solutions are dispensed on the sample zone of
the channel. Test solutions include the D-dimer antibody coupled to the gold nanoparticles and the D-
dimer antigen. Control solutions include only the antibody coupled gold nanoparticles. After the solutions
have flown a certain length through the channel, a certain volume of a running buffer is further added to
promote the lateral flow of the solution and migration of the molecular components through the test and
control zones. This buffer also washes the channel of any background noise.
Anti-D-dimer mouse antibody (ABS28)
Anti-mouse goat antibody (Ab-goat)
40 nm Gold nanoparticles coupled to the
anti-D-dimer mouse antibody (AuNp-
ABS22)
D-dimer
Figure 9 –Schematic representation of the µPLFA device designed for immunodetection of D-dimer. The device features a linear channel, sample (S), test (T) and control C) zones and a rectangular reservoir. The molecular events occurring in the T and C are shown. 50

23
The primary goal is to assemble a system that can generate qualitative results that are visible to
the naked eye. The expected results for a positive test are also schematically represented in Figure 9.
A red colour is expected to appear on the Test zone (T) on the presence of D-dimer. This originates
from the accumulation of gold nanoparticles that result from the immune recognition of D-dimer
molecules by the two specific antibodies. Also, the same red colour is expected on the control zone (C)
signalling the capture of the detection antibodies and validating the overall test result.50
Once this is type of result is achieved, the subsequent step is to optimize the test in terms of time,
signal quality, and D-dimer pathophysiological threshold, so that the test is faster, with sharply defined
results only above the 500 ng/mL threshold for D-dimer clinical relevance. Lastly, the µPLFA device will
be tested with a plasma-like solution spiked with different amounts of the target protein, to assess the
feasibility of the test with real biological samples.
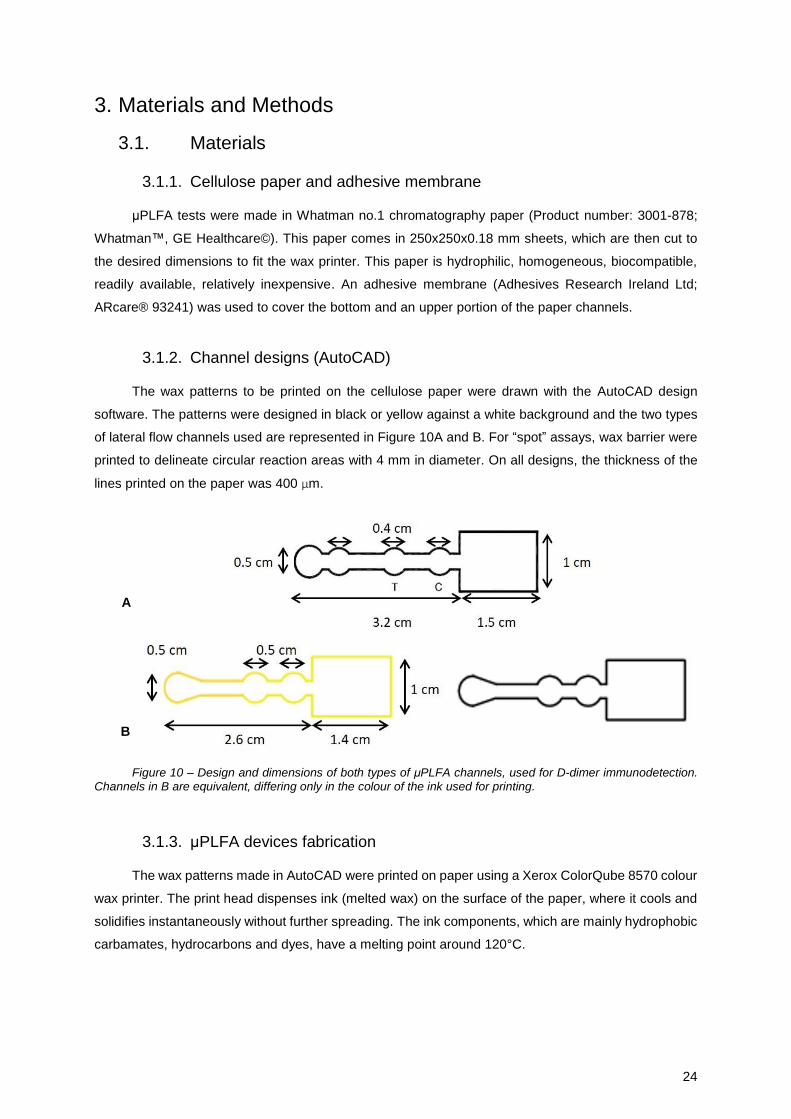
24
3. Materials and Methods
3.1. Materials
3.1.1. Cellulose paper and adhesive membrane
μPLFA tests were made in Whatman no.1 chromatography paper (Product number: 3001-878;
Whatman™, GE Healthcare©). This paper comes in 250x250x0.18 mm sheets, which are then cut to
the desired dimensions to fit the wax printer. This paper is hydrophilic, homogeneous, biocompatible,
readily available, relatively inexpensive. An adhesive membrane (Adhesives Research Ireland Ltd;
ARcare® 93241) was used to cover the bottom and an upper portion of the paper channels.
3.1.2. Channel designs (AutoCAD)
The wax patterns to be printed on the cellulose paper were drawn with the AutoCAD design
software. The patterns were designed in black or yellow against a white background and the two types
of lateral flow channels used are represented in Figure 10A and B. For “spot” assays, wax barrier were
printed to delineate circular reaction areas with 4 mm in diameter. On all designs, the thickness of the
lines printed on the paper was 400 μm.
Figure 10 – Design and dimensions of both types of μPLFA channels, used for D-dimer immunodetection. Channels in B are equivalent, differing only in the colour of the ink used for printing.
3.1.3. μPLFA devices fabrication
The wax patterns made in AutoCAD were printed on paper using a Xerox ColorQube 8570 colour
wax printer. The print head dispenses ink (melted wax) on the surface of the paper, where it cools and
solidifies instantaneously without further spreading. The ink components, which are mainly hydrophobic
carbamates, hydrocarbons and dyes, have a melting point around 120°C.
A
B
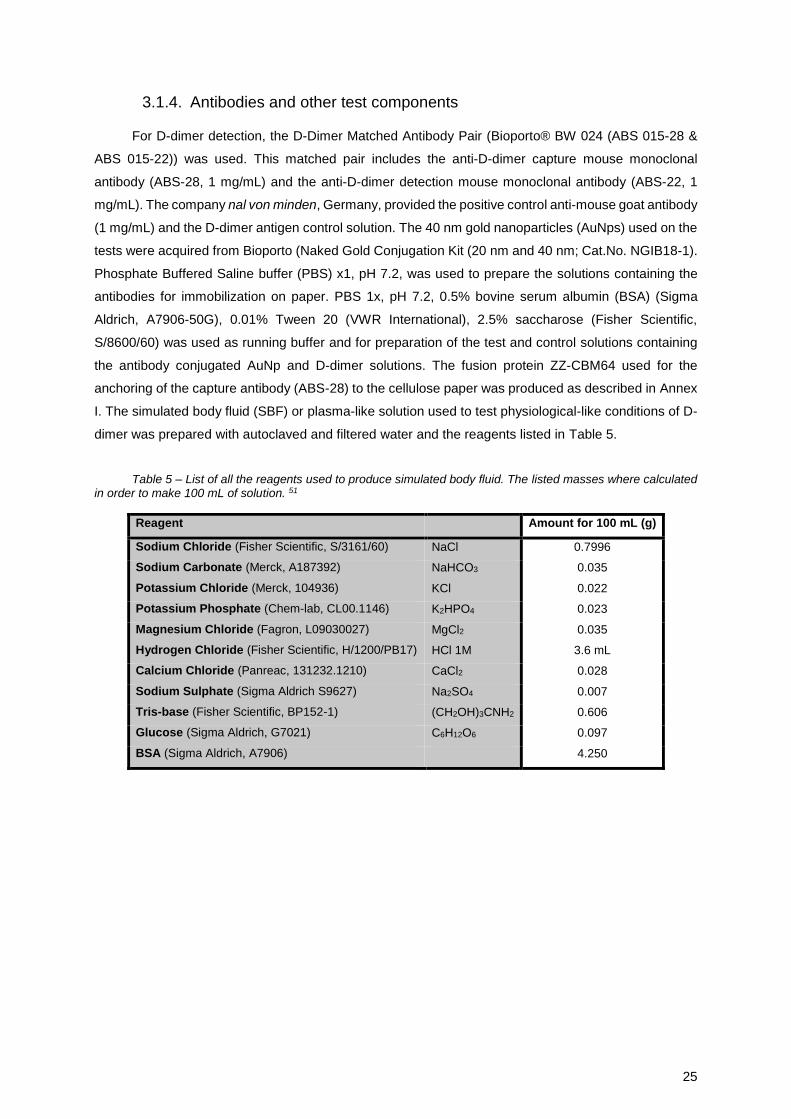
25
3.1.4. Antibodies and other test components
For D-dimer detection, the D-Dimer Matched Antibody Pair (Bioporto® BW 024 (ABS 015-28 &
ABS 015-22)) was used. This matched pair includes the anti-D-dimer capture mouse monoclonal
antibody (ABS-28, 1 mg/mL) and the anti-D-dimer detection mouse monoclonal antibody (ABS-22, 1
mg/mL). The company nal von minden, Germany, provided the positive control anti-mouse goat antibody
(1 mg/mL) and the D-dimer antigen control solution. The 40 nm gold nanoparticles (AuNps) used on the
tests were acquired from Bioporto (Naked Gold Conjugation Kit (20 nm and 40 nm; Cat.No. NGIB18-1).
Phosphate Buffered Saline buffer (PBS) x1, pH 7.2, was used to prepare the solutions containing the
antibodies for immobilization on paper. PBS 1x, pH 7.2, 0.5% bovine serum albumin (BSA) (Sigma
Aldrich, A7906-50G), 0.01% Tween 20 (VWR International), 2.5% saccharose (Fisher Scientific,
S/8600/60) was used as running buffer and for preparation of the test and control solutions containing
the antibody conjugated AuNp and D-dimer solutions. The fusion protein ZZ-CBM64 used for the
anchoring of the capture antibody (ABS-28) to the cellulose paper was produced as described in Annex
I. The simulated body fluid (SBF) or plasma-like solution used to test physiological-like conditions of D-
dimer was prepared with autoclaved and filtered water and the reagents listed in Table 5.
Table 5 – List of all the reagents used to produce simulated body fluid. The listed masses where calculated in order to make 100 mL of solution. 51
Reagent Amount for 100 mL (g)
Sodium Chloride (Fisher Scientific, S/3161/60) NaCl 0.7996
Sodium Carbonate (Merck, A187392) NaHCO3 0.035
Potassium Chloride (Merck, 104936) KCl 0.022
Potassium Phosphate (Chem-lab, CL00.1146) K2HPO4 0.023
Magnesium Chloride (Fagron, L09030027) MgCl2 0.035
Hydrogen Chloride (Fisher Scientific, H/1200/PB17) HCl 1M 3.6 mL
Calcium Chloride (Panreac, 131232.1210) CaCl2 0.028
Sodium Sulphate (Sigma Aldrich S9627) Na2SO4 0.007
Tris-base (Fisher Scientific, BP152-1) (CH2OH)3CNH2 0.606
Glucose (Sigma Aldrich, G7021) C6H12O6 0.097
BSA (Sigma Aldrich, A7906) 4.250

26
3.2. Methods
3.2.1. Paper preparation
To prepare the µPLFA devices, paper with the printed wax patterns is placed facing upwards on
a pre-heated heat plate (MR Hei-Standard, EKT Hei-Con) set at 150°C. The wax is melted for 2 minutes
or until it crosses the entire thickness of the paper uniformly. Next, a strip of adhesive membrane is
placed either underneath the channel, to make it impermeable, or both underneath and on the top of the
channel, for impermeabilization, reduction of evaporation and signal optimization (Figure 11).
Figure 11 – Schematic representation of a paper strip with (a) no adhesive, (b) adhesive placed underneath and (c) adhesive on top and underneath.
3.2.2. Conjugation of antibodies with ZZ-CBM64 fusion
The conjugation of antibodies with ZZ-CBM64 fusions is useful to allow the correct orientation of
the antibody once the complex is immobilized on paper. This conjugation is made using a 2:5 picomole
proportion of ZZ-CBM64 protein with 5 μM and anti-D-dimer mouse antibody with 6.6 μM. 38 The molar
concentration of antibody was calculated assuming an average molecular weight of 150.000 g/mol. 52
The conjugate solution with both the antibody and the ZZ-CBM64 is prepared to a total volume of 2 μL,
which is the amount of solution that is spotted on the test zone of the cellulose paper. The solution is
incubated for 10 minutes before spotting to ensure ZZ-CBM64: antibody binding.
3.2.3. Gold nanoparticles functionalization
The gold nanoparticles used for D-Dimer detection on the μPLFA device were prepared according
to the protocol of the Naked Gold Conjugation Kit (Bioporto). Briefly, 15 µL of anti-D-dimer mouse
antibody (ABS-22) were first mixed with 10 µL of a pH 7.8 solution prepared with buffers supplied with
the kit, and then mixed with 500 µL of 40 nm gold nanoparticles with an OD529nm 15, followed by 10
seconds of vortex mixing. The mixture was left at room temperature for 30 minutes, by the end of which
100 µL of stabilizing buffer was added. The lack of colour change of the solution during and after the
incubation period indicates the functionalization was successful.
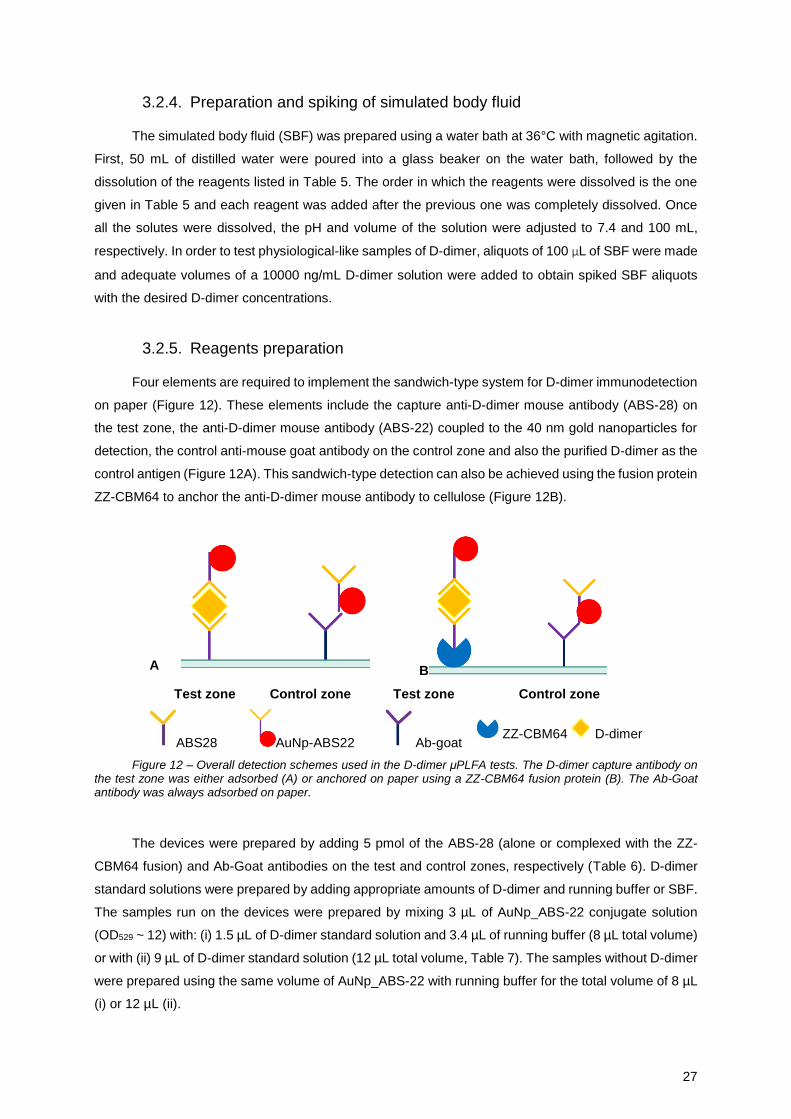
27
3.2.4. Preparation and spiking of simulated body fluid
The simulated body fluid (SBF) was prepared using a water bath at 36°C with magnetic agitation.
First, 50 mL of distilled water were poured into a glass beaker on the water bath, followed by the
dissolution of the reagents listed in Table 5. The order in which the reagents were dissolved is the one
given in Table 5 and each reagent was added after the previous one was completely dissolved. Once
all the solutes were dissolved, the pH and volume of the solution were adjusted to 7.4 and 100 mL,
respectively. In order to test physiological-like samples of D-dimer, aliquots of 100 µL of SBF were made
and adequate volumes of a 10000 ng/mL D-dimer solution were added to obtain spiked SBF aliquots
with the desired D-dimer concentrations.
3.2.5. Reagents preparation
Four elements are required to implement the sandwich-type system for D-dimer immunodetection
on paper (Figure 12). These elements include the capture anti-D-dimer mouse antibody (ABS-28) on
the test zone, the anti-D-dimer mouse antibody (ABS-22) coupled to the 40 nm gold nanoparticles for
detection, the control anti-mouse goat antibody on the control zone and also the purified D-dimer as the
control antigen (Figure 12A). This sandwich-type detection can also be achieved using the fusion protein
ZZ-CBM64 to anchor the anti-D-dimer mouse antibody to cellulose (Figure 12B).
A___ B
Test zone Control zone Test zone Control zone
ABS28 AuNp-ABS22 Ab-goat ZZ-CBM64 D-dimer
Figure 12 – Overall detection schemes used in the D-dimer μPLFA tests. The D-dimer capture antibody on the test zone was either adsorbed (A) or anchored on paper using a ZZ-CBM64 fusion protein (B). The Ab-Goat antibody was always adsorbed on paper.
The devices were prepared by adding 5 pmol of the ABS-28 (alone or complexed with the ZZ-
CBM64 fusion) and Ab-Goat antibodies on the test and control zones, respectively (Table 6). D-dimer
standard solutions were prepared by adding appropriate amounts of D-dimer and running buffer or SBF.
The samples run on the devices were prepared by mixing 3 µL of AuNp_ABS-22 conjugate solution
(OD529 ~ 12) with: (i) 1.5 µL of D-dimer standard solution and 3.4 µL of running buffer (8 µL total volume)
or with (ii) 9 µL of D-dimer standard solution (12 µL total volume, Table 7). The samples without D-dimer
were prepared using the same volume of AuNp_ABS-22 with running buffer for the total volume of 8 µL
(i) or 12 µL (ii).

28
Table 6 – Composition (moles) and volume of solutions used to immobilize antibodies on the test (ABS-28) and control (Ab-Goat) zones of the μPLFA device. A refers to tests using ZZ-CBM64 and B refers to tests without said fusion protein. Concentration of stock solutions of ZZ-CBM64, ABS-28 and Ab-Goat were 5 μM, 6.6 μM and 5 μM, respectively. PBS 1x, pH 7.2 was used to make up the final volume of solutions.
ZZ-CBM64 ABS-28 Ab-Goat PBS 1x Total volume
µL pmol µL pmol µL pmol µL µL
A Test zone 0.4 2 0.76 5 - - 0.84 2
Control zone - - - - 0.76 5 1.68 2
B Test zone - - 0.76 5 - - 0.24 1
Control zone - - - - 0.76 5 0.24 1
Table 7 – Volumes of the test and control samples run on the μPLFA devices. Experiments were made with either 8 μL (i) or 12 μL (ii) of total sample volume. D-dimer standard solutions were prepared by adding appropriate amounts of D-dimer either to running buffer or SBF. Spiked SBF stands for SBF solutions with D-dimer.
D-dimer on running buffer
(µL)
AuNp_ABS-
22 D-dimer
Running
buffer
Total
volume
(i) Test solution 3 1.52 3.44 8
Control solution 3 - 4.96 8
(ii) Test solution 3 9 - 12
Control solution 3 - 9 12
D-dimer on SBF (µL) AuNp_ABS-
22
Spiked
SBF SBF
Total
volume
(ii) Test solution 3 9 - 12
Control solution 3 - 9 12
Besides the lateral flow tests, spot tests were also performed to assess the ZZ-CBM64 role on
the D-dimer immunodetection. The overall composition of the spots is represented in Table 8.
Table 8 – Overall reagent composition for the spot assays performed. Both the solutions to be immobilized on the paper and to be tested are displayed here. The control solution, which is the solution deposited on the spot after surface functionalization without any D-dimer, was equal to all three spots. a) PBS 1x was used for the solutions for surface functionalization and running buffer was used for the control solution.
Volume (µL) AuNp_ABS-22 ZZ-CBM64 Ab-goat PBSa Total volume
2.5 µM ZZ-CBM 64 - 0.4 - 0.6 1
5 µM ZZ-CBM 64 - 0.4 - 0.6 1
Control zone - - 0.76 0.24 1
Control solution 3 - 7 10
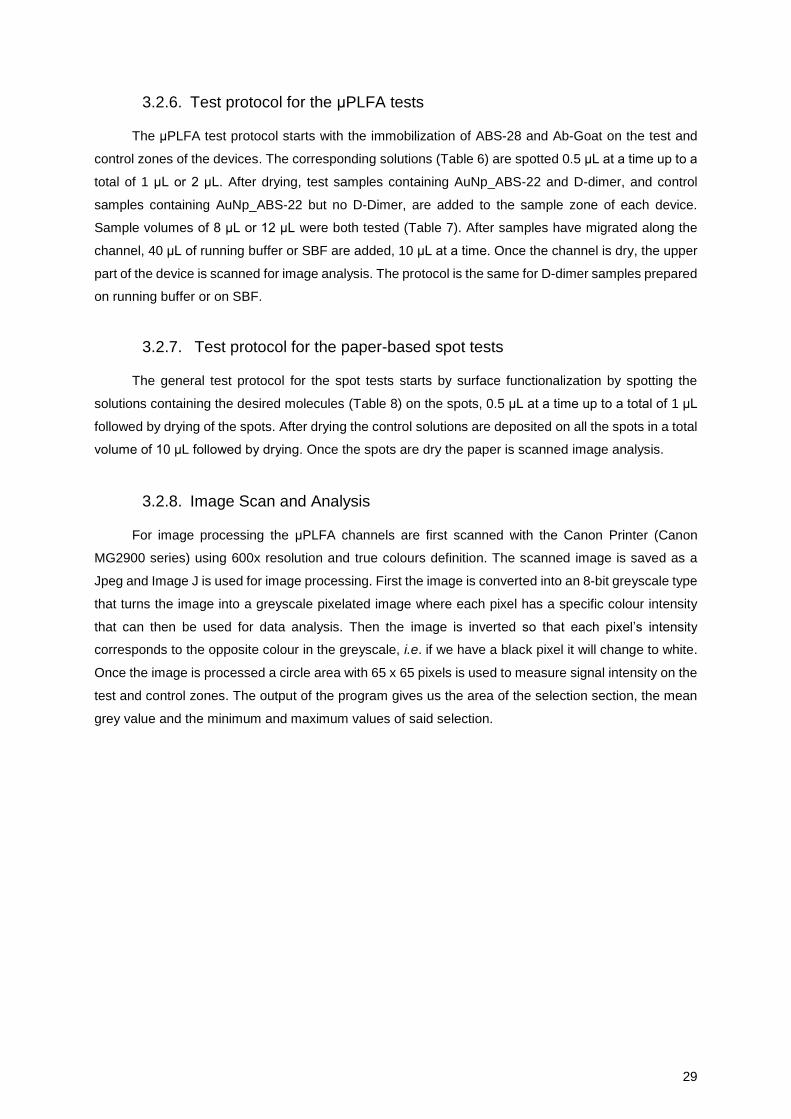
29
3.2.6. Test protocol for the μPLFA tests
The μPLFA test protocol starts with the immobilization of ABS-28 and Ab-Goat on the test and
control zones of the devices. The corresponding solutions (Table 6) are spotted 0.5 μL at a time up to a
total of 1 μL or 2 μL. After drying, test samples containing AuNp_ABS-22 and D-dimer, and control
samples containing AuNp_ABS-22 but no D-Dimer, are added to the sample zone of each device.
Sample volumes of 8 μL or 12 μL were both tested (Table 7). After samples have migrated along the
channel, 40 μL of running buffer or SBF are added, 10 μL at a time. Once the channel is dry, the upper
part of the device is scanned for image analysis. The protocol is the same for D-dimer samples prepared
on running buffer or on SBF.
3.2.7. Test protocol for the paper-based spot tests
The general test protocol for the spot tests starts by surface functionalization by spotting the
solutions containing the desired molecules (Table 8) on the spots, 0.5 μL at a time up to a total of 1 μL
followed by drying of the spots. After drying the control solutions are deposited on all the spots in a total
volume of 10 μL followed by drying. Once the spots are dry the paper is scanned image analysis.
3.2.8. Image Scan and Analysis
For image processing the μPLFA channels are first scanned with the Canon Printer (Canon
MG2900 series) using 600x resolution and true colours definition. The scanned image is saved as a
Jpeg and Image J is used for image processing. First the image is converted into an 8-bit greyscale type
that turns the image into a greyscale pixelated image where each pixel has a specific colour intensity
that can then be used for data analysis. Then the image is inverted so that each pixel’s intensity
corresponds to the opposite colour in the greyscale, i.e. if we have a black pixel it will change to white.
Once the image is processed a circle area with 65 x 65 pixels is used to measure signal intensity on the
test and control zones. The output of the program gives us the area of the selection section, the mean
grey value and the minimum and maximum values of said selection.

30
4. Results and Discussion
4.1. D-dimer immunodetection using ZZ-CBM64 for antibody
biochemical coupling on paper
The expected results for a successfully implemented D-dimer immunodetection test (Figure 12)
are schematically shown in Figure 13. Upon running a D-dimer sample on a μPLFA, a positive signal
should appear in the test zone, indicating D-dimer detection (Figure 13, left). This signal is generated
by the retention of the AuNp as a result of D-dimer immunodetection by both ABS-28 and AuNp_ABS-
22. There should also be a signal on the positive control zone of the device. This particular signal is
generated as a result of the lateral flow nature of the test, i.e. a portion of the AuNp-ABS22 is retained
on the test zone due to D-dimer capture and the remaining unbound AuNp-ABS22 portion is eluted past
that region and captured by the adsorbed Ab-goat, generating the positive control signal.
Figure 13 – Expected results for a successfully implemented D-dimer immunodetection test. The μPLFA on the left displays results after loading a D-dimer-containing sample, whereas the μPLFA on the right display the result after loading a sample with no D-dimer. These results are expected to be similar in the two designs used (Figure 10).
If no D-dimer is present on the sample, the test zone should remain white (Figure 13, right). The
absence of signal here assures that the D-dimer immunodetection is specific and therefore, that in its
absence, the AuNp-ABS22 does not bind to any other immunogens. Similar to the test channel, there
should also be a positive signal on the control zone. This signal, which is generated by the capture of
the unbound AuNp-Abs22 by the Ab-goat, should in theory be more intense than the signal on the control
zone of a device challenged with a D-dimer sample, as no AuNp-ABS22 is bound to the test zone.
A first experiment was made where the fusion ZZ-CBM64 was used to anchor the capture
antibody to paper, according to the scheme in Figure 14.
A B
AuNp_ABS-22 ABS-28 Ab-goat D-dimer ZZ-CBM64
Figure 14 – Schematic representation of μPLFA devices used for D-dimer detection. The capture antibody is anchored to the surface of the test zones via a ZZ-CBM64 fusion. A: addition of sample at t=0; B: test completion at t=t. All the test elements are represented on their respective locations.

31
The results obtained are shown in Figure 15A for test and control channels. Regarding the test
channel, signals appeared in both test and control zones, as expected (Figure 13). The signals are due
to the capture of the AuNp-ABS22 by the D-dimer-ABS28 immunocomplex and by the Ab-goat,
respectively.
Control channel Test channel
A
B
Figure 15 – D-Dimer detection on μPLFA devices with capture antibody anchored on test zone via ZZ-CBM64 fusion. Both control (sample with no D-dimer) and test (sample with D-dimer) devices are displayed. Experiments were performed by supplementing the running buffer (PBS 1x, pH7.2, 0.5% BSA, 2.5% saccharose) with either 0.01% (A) or 0.08% (B) Tween 20. Experimental conditions: 2 pmol ZZ-CBM64; 5 pmol ABS28; 5 pmol Ab-goat; 8 μL sample volume; 1x10⁵ ng/mL D-dimer. T: test zone; C: Control zone.
On the control channel, however, and similarly to the test channel, signals on the test and control
zones were also obtained. The signal on the test zone indicates unspecific binding of the AuNp-ABS22.
Possible explanations for these results include: (i) unspecific binding of some element of the solution
that bridges the immobilized ABS-28 with the AuNP-ABS-22, (ii) unspecific binding of the AuNP-ABS-
22 conjugate to the ZZ-CBM64:ABS-28 complex or (iii) existence of free ZZ-CBM64 molecules on the
paper that have affinity for the mouse Fc portion of the antibody on the AuNp-ABS22 conjugate.
Unspecific binding can be prevented by adding protein blockers to the reagents used in the assay,
to guarantee that the binding between an antibody and an epitope is only possible if the affinity between
both is high, as in the case of an antibody and its specific antigen.53 Two frequently used protein blockers
are Bovine Serum Albumin (BSA) and Tween 20, but these are both already present in the running
buffer used (PBS 1x, pH7.2, 0.5% BSA, 0.01% Tween 20, 2.5% saccharose). In an effort to eliminate
the signal on the test zone of the negative control experiment (Figure 15A, right), similar experiments
were performed using a higher concentration of 0.08% of the protein blocker Tween 20 in the running
buffer. This percentage of Tween 20 was just enough to prevent solubilization of the wax walls of the
μPLFA device.
The results of the test made with this higher concentration of Tween 20 are displayed in Figure
15B. Similar to the previous results, both positive controls are present but, unlike the expected results,
signals where visible on the test zones of both channels, indicating that the non-specific binding was not
eliminated.
As the unspecific signal on the negative control persisted, even with the increased detergent
percentage on the running buffer, spot assays were made to assess the role of the ZZ-CBM64 fusion
protein on the immunodetection. For this assay, two different amounts of ZZ-CBM64 alone were
immobilized on the paper spots (1 pmol and 2 pmol), as well as the anti-mouse goat antibody to serve
as a positive control, followed by addition of the AuNp-ABS22 conjugate on all spots. The reagents were
prepared according to Table 8 and the results and a scheme of the test are shown in Figure 16.
T C
T C T C
T C
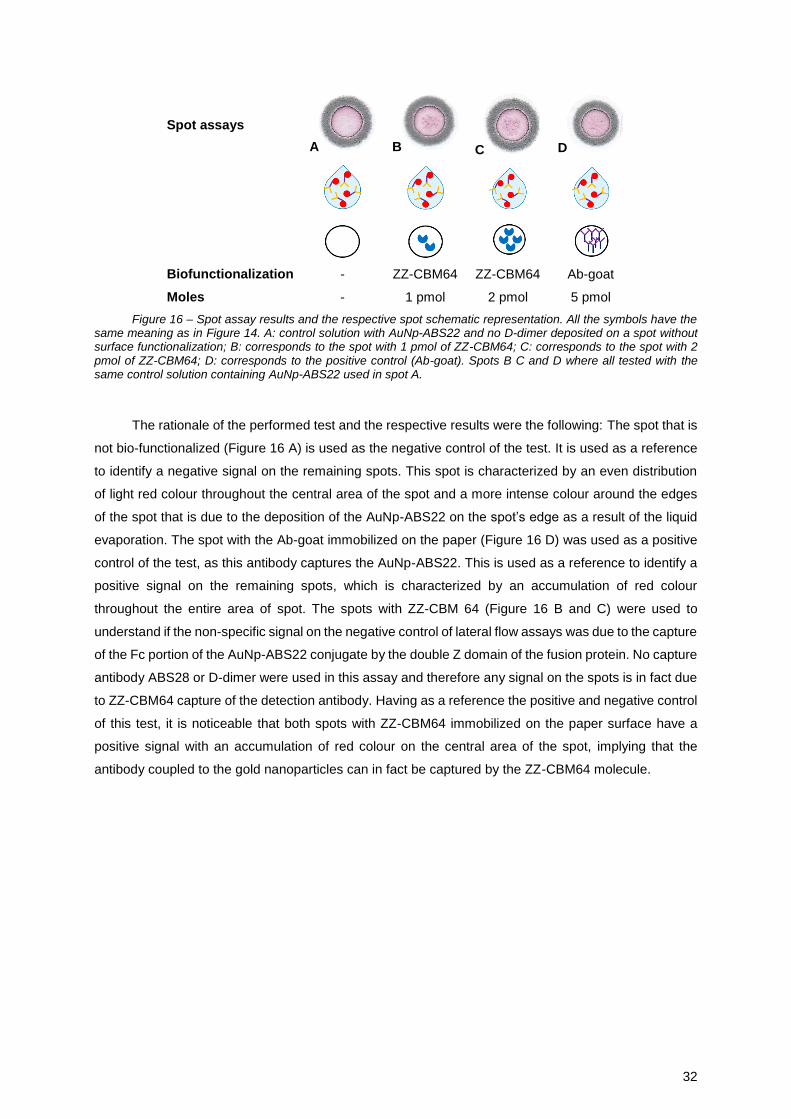
32
Spot assays
A B C D
Biofunctionalization - ZZ-CBM64 ZZ-CBM64 Ab-goat
Moles - 1 pmol 2 pmol 5 pmol
Figure 16 – Spot assay results and the respective spot schematic representation. All the symbols have the same meaning as in Figure 14. A: control solution with AuNp-ABS22 and no D-dimer deposited on a spot without surface functionalization; B: corresponds to the spot with 1 pmol of ZZ-CBM64; C: corresponds to the spot with 2 pmol of ZZ-CBM64; D: corresponds to the positive control (Ab-goat). Spots B C and D where all tested with the same control solution containing AuNp-ABS22 used in spot A.
The rationale of the performed test and the respective results were the following: The spot that is
not bio-functionalized (Figure 16 A) is used as the negative control of the test. It is used as a reference
to identify a negative signal on the remaining spots. This spot is characterized by an even distribution
of light red colour throughout the central area of the spot and a more intense colour around the edges
of the spot that is due to the deposition of the AuNp-ABS22 on the spot’s edge as a result of the liquid
evaporation. The spot with the Ab-goat immobilized on the paper (Figure 16 D) was used as a positive
control of the test, as this antibody captures the AuNp-ABS22. This is used as a reference to identify a
positive signal on the remaining spots, which is characterized by an accumulation of red colour
throughout the entire area of spot. The spots with ZZ-CBM 64 (Figure 16 B and C) were used to
understand if the non-specific signal on the negative control of lateral flow assays was due to the capture
of the Fc portion of the AuNp-ABS22 conjugate by the double Z domain of the fusion protein. No capture
antibody ABS28 or D-dimer were used in this assay and therefore any signal on the spots is in fact due
to ZZ-CBM64 capture of the detection antibody. Having as a reference the positive and negative control
of this test, it is noticeable that both spots with ZZ-CBM64 immobilized on the paper surface have a
positive signal with an accumulation of red colour on the central area of the spot, implying that the
antibody coupled to the gold nanoparticles can in fact be captured by the ZZ-CBM64 molecule.

33
4.2. D-dimer immunodetection with antibody adsorption on paper
The results obtained up to this point suggest that the unspecific signal may in fact be due to the
capture of the AuNp-ABS22 by the ZZ-CBM64 molecules immobilized on the paper. The decision was
made to directly adsorb the capture antibody to the test zone on paper. The overall scheme of the new
test is shown in Figure 17.
A B
AuNp_ABS-22
Ab-goat
ABS-28 D-dimer
Figure 17 - Schematic representation of μPLFA devices used for D-dimer detection. The capture antibody is anchored to the surface of the test zones via adsorption. A: addition of sample at t=0; B: test completion at t= t. All the test elements are represented on their respective locations.
Control channel Test channel
Figure 18 – D-Dimer detection on μPLFA devices with capture antibody anchored on the test zone via adsorption. Both control (sample with no D-dimer) and test (sample with D-dimer) devices are displayed. Experimental conditions: 5 pmol ABS28; 5 pmol Ab-goat; 8 μL sample volume; 1x10⁵ ng/mL D-dimer. running buffer-PBS 1x with 0.08% tween 20. T: test zone; C: Control zone.
The results in Figure 18 show that when a sample with no D-dimer is loaded (left), only the signal
in the control zone is present. The test zone of the μPLFA device no longer displays a signal, which
supports the theory that the non-specific signal in previous tests (Figure 15, left) was due to the capture
of the detection antibody by the ZZ-CBM64 fusion. Two signals on the test and control zones of the
channel were observed when a sample with D-dimer was loaded (right). In other words, this test displays
the expected results for a μPLFA D-dimer immunodetection device, i.e. detection of the D-dimer antigen
on the test zone, signals in the control zone and no signal in the test zone of a negative control (no D-
dimer).
With the overall composition and protocol of the test established, the next steps focused on
optimizing the overall test performance. A first aspect to improve was the consistency of solution
migration through the main channel of the devices. The overall protocol for the lateral flow assay consists
in pipetting samples in the appropriate zone and, after a few minutes, washing the channel four times
with running buffer to help the solution run through the channel and also to sharpen the results obtained
by washing non-bound AuNp-ABS22. The average time for solutions to reach the beginning of the
T C T C
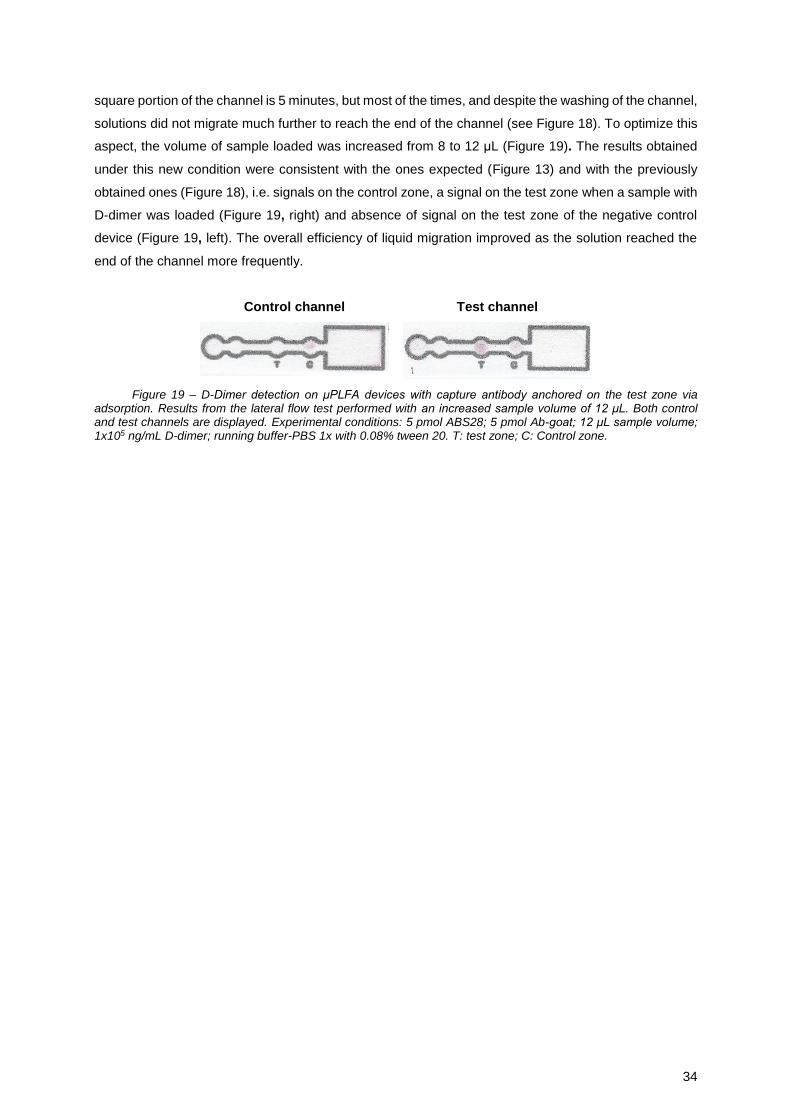
34
square portion of the channel is 5 minutes, but most of the times, and despite the washing of the channel,
solutions did not migrate much further to reach the end of the channel (see Figure 18). To optimize this
aspect, the volume of sample loaded was increased from 8 to 12 μL (Figure 19). The results obtained
under this new condition were consistent with the ones expected (Figure 13) and with the previously
obtained ones (Figure 18), i.e. signals on the control zone, a signal on the test zone when a sample with
D-dimer was loaded (Figure 19, right) and absence of signal on the test zone of the negative control
device (Figure 19, left). The overall efficiency of liquid migration improved as the solution reached the
end of the channel more frequently.
Control channel Test channel
Figure 19 – D-Dimer detection on μPLFA devices with capture antibody anchored on the test zone via adsorption. Results from the lateral flow test performed with an increased sample volume of 12 μL. Both control and test channels are displayed. Experimental conditions: 5 pmol ABS28; 5 pmol Ab-goat; 12 μL sample volume; 1x10⁵ ng/mL D-dimer; running buffer-PBS 1x with 0.08% tween 20. T: test zone; C: Control zone.
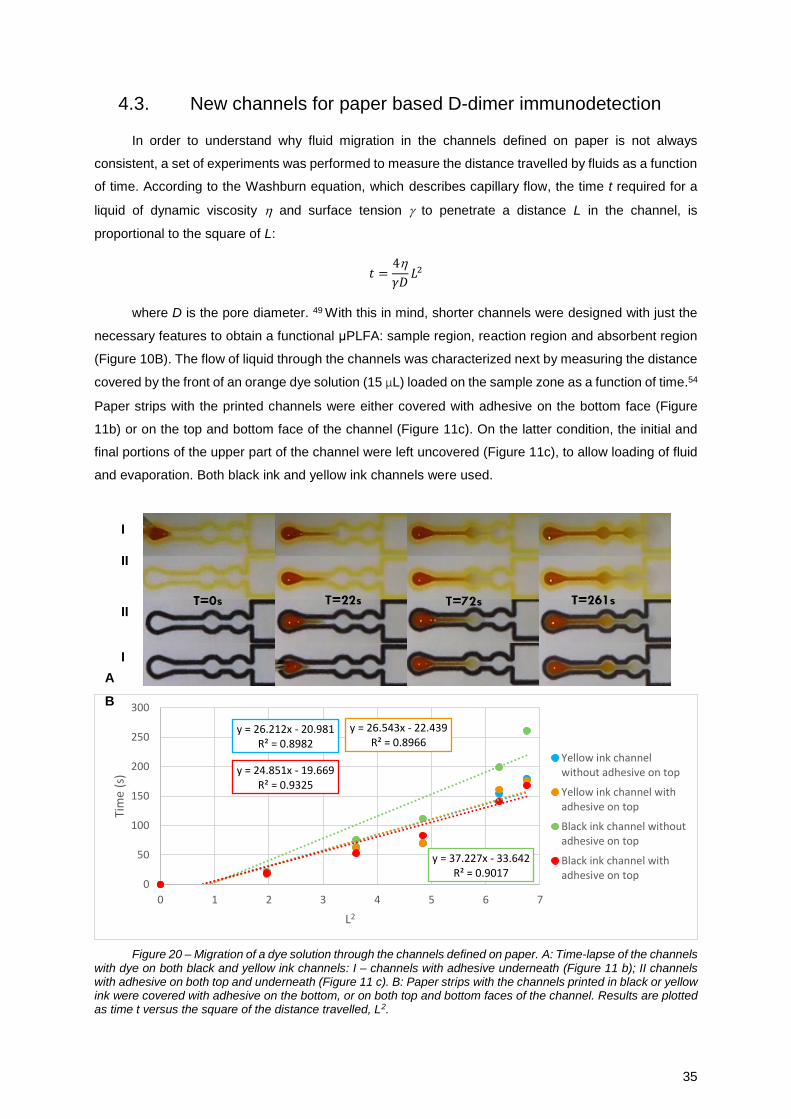
35
4.3. New channels for paper based D-dimer immunodetection
In order to understand why fluid migration in the channels defined on paper is not always
consistent, a set of experiments was performed to measure the distance travelled by fluids as a function
of time. According to the Washburn equation, which describes capillary flow, the time t required for a
liquid of dynamic viscosity and surface tension to penetrate a distance L in the channel, is
proportional to the square of L:
𝑡 =4
𝛾𝐷𝐿2
where D is the pore diameter. 49 With this in mind, shorter channels were designed with just the
necessary features to obtain a functional μPLFA: sample region, reaction region and absorbent region
(Figure 10B). The flow of liquid through the channels was characterized next by measuring the distance
covered by the front of an orange dye solution (15 µL) loaded on the sample zone as a function of time.54
Paper strips with the printed channels were either covered with adhesive on the bottom face (Figure
11b) or on the top and bottom face of the channel (Figure 11c). On the latter condition, the initial and
final portions of the upper part of the channel were left uncovered (Figure 11c), to allow loading of fluid
and evaporation. Both black ink and yellow ink channels were used.
I
II
II
I
Figure 20 – Migration of a dye solution through the channels defined on paper. A: Time-lapse of the channels with dye on both black and yellow ink channels: I – channels with adhesive underneath (Figure 11 b); II channels with adhesive on both top and underneath (Figure 11 c). B: Paper strips with the channels printed in black or yellow ink were covered with adhesive on the bottom, or on both top and bottom faces of the channel. Results are plotted as time t versus the square of the distance travelled, L2.
y = 26.212x - 20.981R² = 0.8982
y = 26.543x - 22.439R² = 0.8966
y = 37.227x - 33.642R² = 0.9017
y = 24.851x - 19.669R² = 0.9325
0
50
100
150
200
250
300
0 1 2 3 4 5 6 7
Tim
e (s
)
L2
Yellow ink channelwithout adhesive on top
Yellow ink channel withadhesive on top
Black ink channel withoutadhesive on top
Black ink channel withadhesive on top
A
B
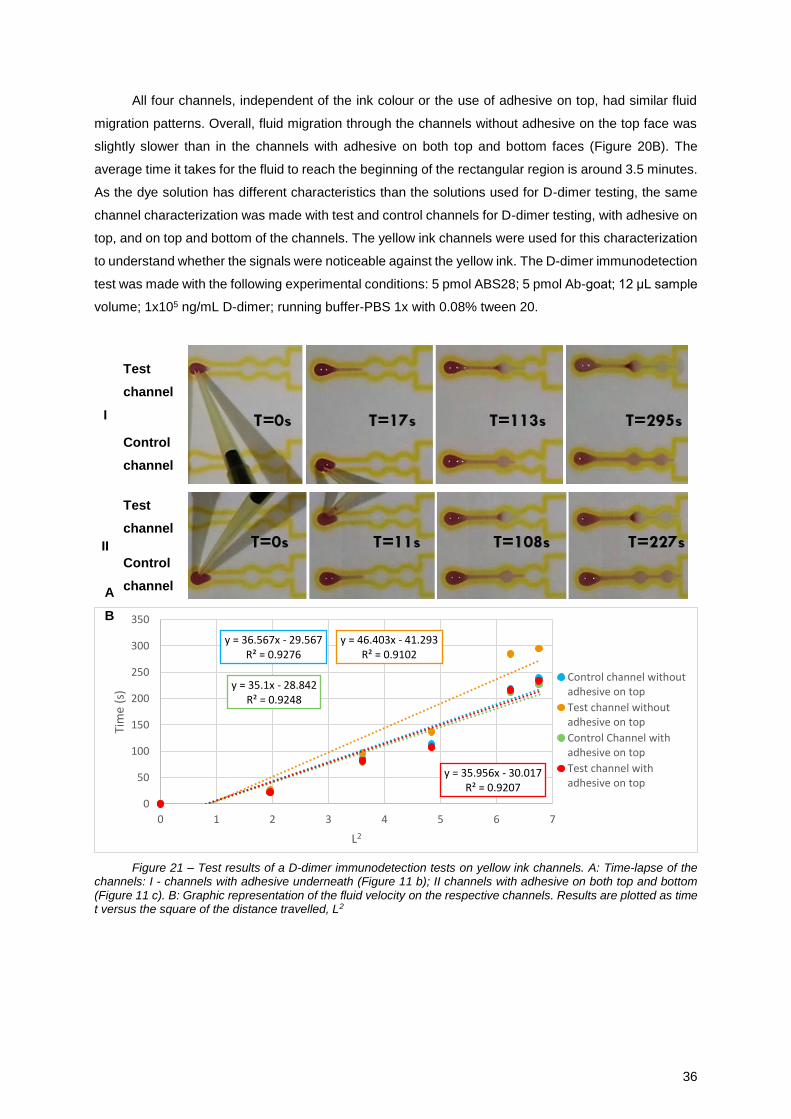
36
All four channels, independent of the ink colour or the use of adhesive on top, had similar fluid
migration patterns. Overall, fluid migration through the channels without adhesive on the top face was
slightly slower than in the channels with adhesive on both top and bottom faces (Figure 20B). The
average time it takes for the fluid to reach the beginning of the rectangular region is around 3.5 minutes.
As the dye solution has different characteristics than the solutions used for D-dimer testing, the same
channel characterization was made with test and control channels for D-dimer testing, with adhesive on
top, and on top and bottom of the channels. The yellow ink channels were used for this characterization
to understand whether the signals were noticeable against the yellow ink. The D-dimer immunodetection
test was made with the following experimental conditions: 5 pmol ABS28; 5 pmol Ab-goat; 12 μL sample
volume; 1x10⁵ ng/mL D-dimer; running buffer-PBS 1x with 0.08% tween 20.
I
Test
channel
Control
channel
II
Test
channel
Control
channel
Figure 21 – Test results of a D-dimer immunodetection tests on yellow ink channels. A: Time-lapse of the channels: I - channels with adhesive underneath (Figure 11 b); II channels with adhesive on both top and bottom (Figure 11 c). B: Graphic representation of the fluid velocity on the respective channels. Results are plotted as time t versus the square of the distance travelled, L2
y = 36.567x - 29.567R² = 0.9276
y = 46.403x - 41.293R² = 0.9102
y = 35.1x - 28.842R² = 0.9248
y = 35.956x - 30.017R² = 0.9207
0
50
100
150
200
250
300
350
0 1 2 3 4 5 6 7
Tim
e (s
)
L2
Control channel withoutadhesive on top
Test channel withoutadhesive on top
Control Channel withadhesive on top
Test channel withadhesive on top
A
B

37
Analysing the results (Figure 21), it is visible that all four channels have a similar migration time
and pattern similar to the previous ones, with the slight exception of the control channel without the
adhesive on top that deviates from the remaining channels towards the final centimetres of the channel.
Nonetheless, the average time to reach the beginning of the absorbent region is around 4 minutes,
which is in agreement with the average time of the previous characterization.
With the new channels characterized, two tests were performed for both the black and yellow ink
channels without the adhesive to compare the obtained signals on both. The conditions were similar to
the ones used on the devices of Figure 19. The results obtained (Figure 22) were the ones expected
and the overall fluid migration performance was improved when compared to the previously used
channels (Figure 10A). A graphic representation of the signal intensity is displayed in Figure 23.
Control channel Test channel
Black channel
Yellow channel
Figure 22 - D-Dimer detection on μPLFA devices with capture antibody anchored on the test zone via adsorption. Results are shown for channels printed in black or yellow. An adhesive layer was used on the bottom face of the devices. Both control and test channels are displayed. Experimental conditions: 5 pmol ABS28; 5 pmol Ab-goat; 12 μL sample volume; 1x10⁵ ng/mL D-dimer; running buffer-PBS 1x with 0.08% tween 20. T: test zone; C: Control zone.
Figure 23 – Average mean grey intensities of the test and control zones of both test and control yellow and black ink channels.
27.4
6.6
2.8
22.5
32.1
12.9
8.1
31.6
Test line Control line Test line Control line
Test channel Control channel
Ave
rage
mea
n g
rey
inte
nsi
ty
Yellow channel Black channel
T C
T C T C
T C

38
Analysing the average mean grey intensities obtained on the test and control zones of both sets
of channels, it is noticeable that the overall intensity of the signal on the black ink channel is higher than
the yellow ink channel intensities. Nonetheless, the signals on the channels printed in yellow are more
readily identifiable because the red colour stands out more against the white and yellow background
than against the white and black background. With this in mind, subsequent tests for D-dimer detection
were made in devices printed in yellow.
The fluid migration experiments described above showed that the presence of an adhesive layer
on both the upper and lower faces of the μPLFA devices improved fluid migration and signal generation
due to the increase in evaporation time brought about by the reduction of the channel area in direct
contact with air. To confirm this, assays were performed using μPLFA devices printed in yellow and
covered with adhesive on both faces. The obtained result (Figure 24) was positive as the expected
results were achieved and the signal was in fact more sharp when compared to a test without the
adhesive on top (Figure 22).
Control channel Test channel
Figure 24 - D-Dimer detection on μPLFA devices printed in yellow and covered with adhesive on both top and bottom faces. Both control and test channels are displayed. Experimental conditions: 5 pmol ABS28; 5 pmol Ab-goat; 12 μL sample volume; 1x10⁵ ng/mL D-dimer; running buffer-PBS 1x with 0.08% tween 20. T: test zone; C: Control zone.
As the new overall protocol for test running and device construction are providing results that are
in line to what was expected, new tests with ZZ-CBM64 used as a biochemical coupling molecule were
performed to confirm that this method to bio-functionalize the paper surface was not compatible with
this specific immunodetection. The tests were made with adhesive on the bottom and also adhesive on
both top and bottom of the channel (Figure 25).
Adhesive Location Underneath the channel Above and underneath the channel
Test Channel
Control Channel
Figure 25 – Effect of adhesive layers on D-Dimer detection on μPLFA devices with capture antibody anchored on test zones via ZZ-CBM64 fusion. Both control and test channels are displayed. Experimental conditions: 2 pmol ZZ-CBM64; 5 pmol ABS28; 5 pmol Ab-goat; 12 μL sample volume; 1x10⁵ ng/mL D-dimer; running buffer-PBS 1x with 0.08% tween 20. T: test zone; C: Control zone.
T C
T C T C
T C
T C T C

39
The signals obtained were similar to the ones obtained previously with ZZ-CBM64 anchoring of
the ABS28 capture antibody, i.e. non-specific signals appear on the test zones when no D-dimer was
present on the loaded sample (Figure 15). These tests confirm that the use of ZZ-CBM64 fusion protein
as an anchoring solution for the capture antibody is not compatible with the correct functioning of this
specific immunodetection sandwich test. One possible solution that could be explored is to use a
detection antibody from a host other than mouse, with less affinity to the ZZ domain of the fusion. This
would decrease the probability of capture of the detection antibody by the free ZZ-CBM64 molecules
immobilized on the paper, allowing the existence of a negative control of the test. Additional conclusions
could be drawn regarding the impact of the presence of the top layer of adhesive on fluid migration and
signal sharpening. When no adhesive was used on the top face of the devices, test and control solutions
never reached the end of the channels, as visible by the presence of a red flow front half way across
the rectangular reservoirs (Figure 25, left). However, and because of the reduction of evaporation, fluids
on devices with a top layer of adhesive were able to reach the end of the channel, as judged by the
absence of the red flow front on these channels (Figure 25, right). Although the time required for fluids
to reach the beginning of the rectangular reservoir was similar in both channels, the top layer of adhesive
helps the fluids to reach the end of the channel allowing for a better channel washing and decreasing
background noise. Also. the signals obtained on the channels with adhesive on top are more intense
colour wise when compared to the ones on the channels without adhesive on top.
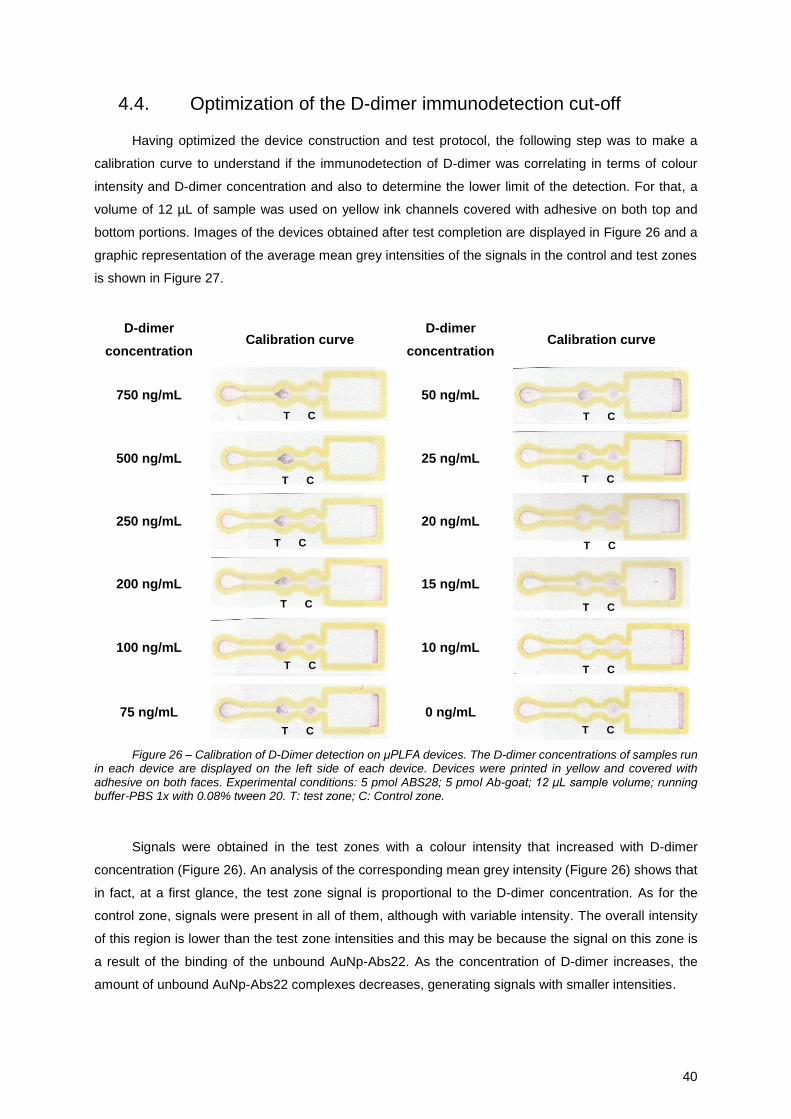
40
4.4. Optimization of the D-dimer immunodetection cut-off
Having optimized the device construction and test protocol, the following step was to make a
calibration curve to understand if the immunodetection of D-dimer was correlating in terms of colour
intensity and D-dimer concentration and also to determine the lower limit of the detection. For that, a
volume of 12 µL of sample was used on yellow ink channels covered with adhesive on both top and
bottom portions. Images of the devices obtained after test completion are displayed in Figure 26 and a
graphic representation of the average mean grey intensities of the signals in the control and test zones
is shown in Figure 27.
D-dimer
concentration Calibration curve
D-dimer
concentration Calibration curve
750 ng/mL
50 ng/mL
500 ng/mL
25 ng/mL
250 ng/mL
20 ng/mL
200 ng/mL
15 ng/mL
100 ng/mL
10 ng/mL
75 ng/mL
0 ng/mL
Figure 26 – Calibration of D-Dimer detection on μPLFA devices. The D-dimer concentrations of samples run in each device are displayed on the left side of each device. Devices were printed in yellow and covered with adhesive on both faces. Experimental conditions: 5 pmol ABS28; 5 pmol Ab-goat; 12 μL sample volume; running buffer-PBS 1x with 0.08% tween 20. T: test zone; C: Control zone.
Signals were obtained in the test zones with a colour intensity that increased with D-dimer
concentration (Figure 26). An analysis of the corresponding mean grey intensity (Figure 26) shows that
in fact, at a first glance, the test zone signal is proportional to the D-dimer concentration. As for the
control zone, signals were present in all of them, although with variable intensity. The overall intensity
of this region is lower than the test zone intensities and this may be because the signal on this zone is
a result of the binding of the unbound AuNp-Abs22. As the concentration of D-dimer increases, the
amount of unbound AuNp-Abs22 complexes decreases, generating signals with smaller intensities.
T C
T C
T C
T C
T C
T C T C
T C
T C
T C
T C
T C

41
Figure 27 - Calibration of D-Dimer detection on μPLFA devices. The average mean grey intensities of signals in the test and control zones of the devices (Figure 26) is plotted as a function of D-dimer concentration.
Focusing now on the lower concentrations used on the calibration curve, although only slightly
visible, there is a detection signal on the test zone on the channel for a sample with 15 ng/mL of D-
dimer. For samples with 10 ng/mL, the signal is practically absent. This indicates that the lower detection
limit of the D-dimer μPLFA device is around 10 ng/mL. This sensitivity is more than enough from the
point of view of the detection of normal physiological concentrations of D-dimer, which can be as high
as 250 ng/mL. In order for the test to provide a positive result only for samples with a D-dimer
concentration above this threshold, samples should be diluted 25x. This would bring samples with the
250 ng/mL threshold concentration down to the 10 ng/ml detection limit. A set of tests were thus made
by diluting D-dimer samples 25x and also 20x (Figure 28).
D-dimer concentration 25x 20x
0 ng/mL
200 ng/mL
250 ng/mL
Figure 28 – Effect of sample dilution on D-Dimer detection on μPLFA devices. Devices were covered with adhesive on both faces and D-dimer samples were diluted 25x or 20x. Experimental conditions: 5 pmol ABS28; 5 pmol Ab-goat; 12 μL sample volume; running buffer-PBS 1x with 0.08% tween 20. T: test zone; C: Control zone.
0
10
20
30
40
50
0 100 200 300 400 500 600 700 800
Ave
rage
Mea
n G
rey
Inte
nsi
ty
D-dimer Concentration (ng/mL)
Test Line Control Line
T C
T C T C
T C
T C
T C
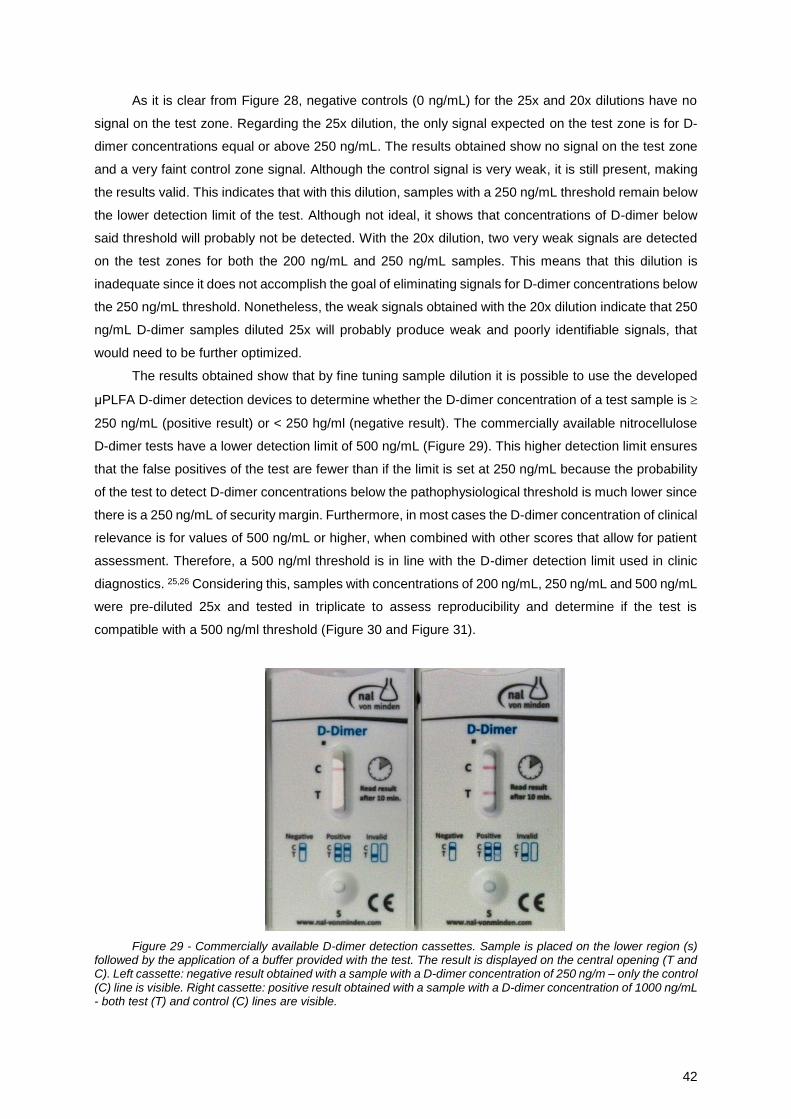
42
As it is clear from Figure 28, negative controls (0 ng/mL) for the 25x and 20x dilutions have no
signal on the test zone. Regarding the 25x dilution, the only signal expected on the test zone is for D-
dimer concentrations equal or above 250 ng/mL. The results obtained show no signal on the test zone
and a very faint control zone signal. Although the control signal is very weak, it is still present, making
the results valid. This indicates that with this dilution, samples with a 250 ng/mL threshold remain below
the lower detection limit of the test. Although not ideal, it shows that concentrations of D-dimer below
said threshold will probably not be detected. With the 20x dilution, two very weak signals are detected
on the test zones for both the 200 ng/mL and 250 ng/mL samples. This means that this dilution is
inadequate since it does not accomplish the goal of eliminating signals for D-dimer concentrations below
the 250 ng/mL threshold. Nonetheless, the weak signals obtained with the 20x dilution indicate that 250
ng/mL D-dimer samples diluted 25x will probably produce weak and poorly identifiable signals, that
would need to be further optimized.
The results obtained show that by fine tuning sample dilution it is possible to use the developed
μPLFA D-dimer detection devices to determine whether the D-dimer concentration of a test sample is
250 ng/mL (positive result) or < 250 hg/ml (negative result). The commercially available nitrocellulose
D-dimer tests have a lower detection limit of 500 ng/mL (Figure 29). This higher detection limit ensures
that the false positives of the test are fewer than if the limit is set at 250 ng/mL because the probability
of the test to detect D-dimer concentrations below the pathophysiological threshold is much lower since
there is a 250 ng/mL of security margin. Furthermore, in most cases the D-dimer concentration of clinical
relevance is for values of 500 ng/mL or higher, when combined with other scores that allow for patient
assessment. Therefore, a 500 ng/ml threshold is in line with the D-dimer detection limit used in clinic
diagnostics. 25,26 Considering this, samples with concentrations of 200 ng/mL, 250 ng/mL and 500 ng/mL
were pre-diluted 25x and tested in triplicate to assess reproducibility and determine if the test is
compatible with a 500 ng/ml threshold (Figure 30 and Figure 31).
Figure 29 - Commercially available D-dimer detection cassettes. Sample is placed on the lower region (s) followed by the application of a buffer provided with the test. The result is displayed on the central opening (T and C). Left cassette: negative result obtained with a sample with a D-dimer concentration of 250 ng/m – only the control (C) line is visible. Right cassette: positive result obtained with a sample with a D-dimer concentration of 1000 ng/mL - both test (T) and control (C) lines are visible.

43
D-dimer Concentration 1 2 3
0 ng/mL
200 ng/mL
250 ng/mL
500 ng/mL
Figure 30 – Detection of D-Dimer on μPLFA devices using samples with sub-threshold concentrations. Devices were covered with adhesive on both faces and D-dimer samples were diluted 25x. Tests were made in triplicate. Experimental conditions: 5 pmol ABS28; 5 pmol Ab-goat; 12 μL sample volume; running buffer-PBS 1x with 0.08% tween 20. T: test zone; C: Control zone.
The expected results were obtained for the negative control devices (0 ng/mL), i.e. signals were
present only on the control zone. Visible signals were also observed on the control zones of devices run
with D-dimer-containing samples, validating the results. When compared to the negative control
channels, there is evidence of a very faint signal on the test zones of channels used to test 200 and 250
ng/ml samples, although this had not been observed in previous tests (Figure 28). This brings attention
to the variability between tests performed with the sample.33
Figure 31 - Detection of D-Dimer on μPLFA devices using samples with sub-threshold concentrations. The average mean grey intensities and corresponding error bars of signals in the test and control zones of the devices (Figure 30) is plotted as a function of D-dimer concentration. Tests were made in triplicate.
0
5
10
15
20
25
30
0 100 200 300 400 500 600
Ave
rage
Mea
n G
rey
Inte
nsi
ty
D-dimer Concentration (ng/mL)
Test Line Control Line
T C
T C
T C
T C T C
T C
T C
T C T C
T C
T C
T C
44
The test zones of the devices used to run the 500 ng/ml sample show a clear signal, despite
differences in the intensities among replicas. This result shows that the test is compatible with a 500
ng/mL lower detection limit. Overall, the results show that there is variability in the intensity of signals in
the control and test zones signal between triplicates (Figure 31), a fact that can be ascribed to the
intrinsic variability of paper-based assays. Regarding the test zone signals, they are either absent, very
faint or with a clear signal, which indicates that in order for this test to be a qualitative one, with a signal
only for D-dimer concentrations equal or higher than 500 ng/mL, further optimization is needed.
To understand if the signal intensity data obtained for the different samples are statistically
different, a one-way analysis of variance (One-way ANOVA) was performed, using 95% confidence
intervals and the Dunnett’s test for multiple comparisons. The ANOVA analysis is the analysis of
differences between 2 or more independent populations (different D-dimer concentrations), and post-
hoc tests such as the Dunnett’s test help identify the differences between each of the populations. This
particular post-hoc test is used to compare several test situations with a single control, which is the
comparison required for channel analysis. 55 The results obtained indicate that collected colour intensity
data is statistically relevant with a p-value of 0.0019 (p value 0.0019 < p value 0.05) and that there are
statistical differences between the negative control and the 500 ng/mL channels (p-value 0.0009). The
differences between the negative control and the two lower D-dimer concentrations are not statistically
relevant (p value > 0.05), indicating that in fact the results are relevant in the context of a test with a 500
ng/mL lower detection limit. Nevertheless, further optimization is needed to eliminate the test zone signal
obtained when running samples with D-dimer concentrations below the cut-off.
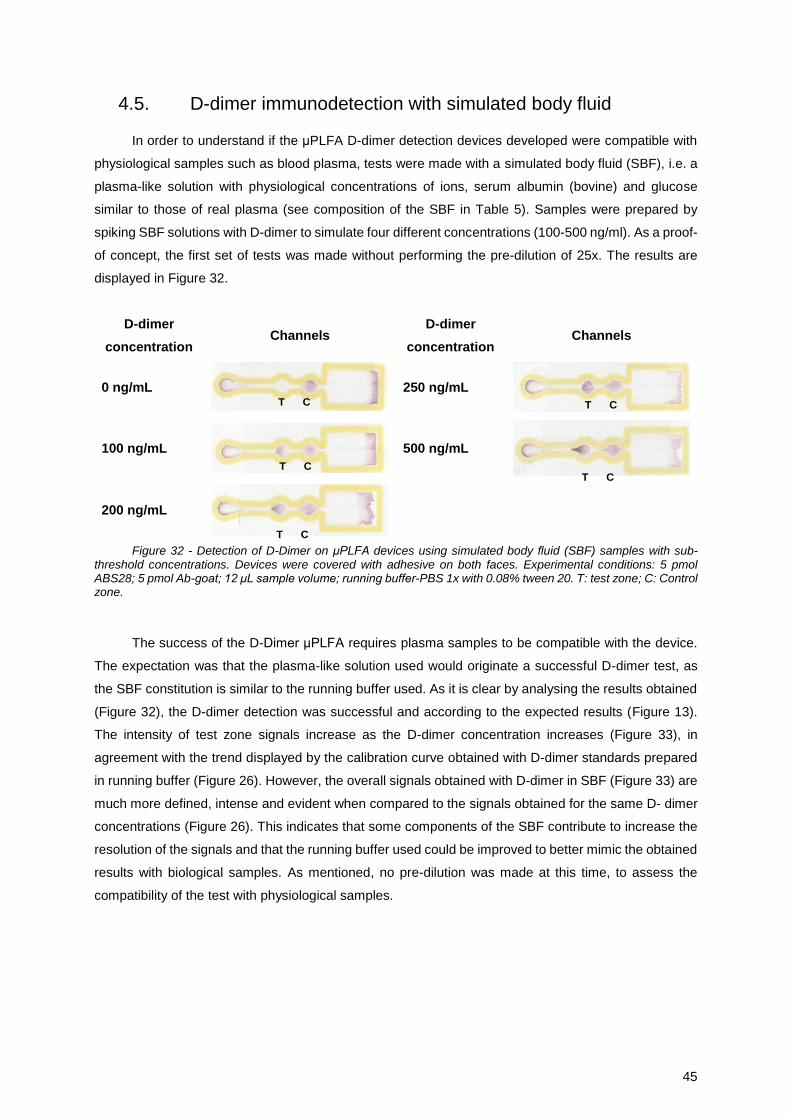
45
4.5. D-dimer immunodetection with simulated body fluid
In order to understand if the μPLFA D-dimer detection devices developed were compatible with
physiological samples such as blood plasma, tests were made with a simulated body fluid (SBF), i.e. a
plasma-like solution with physiological concentrations of ions, serum albumin (bovine) and glucose
similar to those of real plasma (see composition of the SBF in Table 5). Samples were prepared by
spiking SBF solutions with D-dimer to simulate four different concentrations (100-500 ng/ml). As a proof-
of concept, the first set of tests was made without performing the pre-dilution of 25x. The results are
displayed in Figure 32.
D-dimer
concentration Channels
D-dimer
concentration Channels
0 ng/mL
250 ng/mL
100 ng/mL
500 ng/mL
200 ng/mL
Figure 32 - Detection of D-Dimer on μPLFA devices using simulated body fluid (SBF) samples with sub-threshold concentrations. Devices were covered with adhesive on both faces. Experimental conditions: 5 pmol ABS28; 5 pmol Ab-goat; 12 μL sample volume; running buffer-PBS 1x with 0.08% tween 20. T: test zone; C: Control zone.
The success of the D-Dimer μPLFA requires plasma samples to be compatible with the device.
The expectation was that the plasma-like solution used would originate a successful D-dimer test, as
the SBF constitution is similar to the running buffer used. As it is clear by analysing the results obtained
(Figure 32), the D-dimer detection was successful and according to the expected results (Figure 13).
The intensity of test zone signals increase as the D-dimer concentration increases (Figure 33), in
agreement with the trend displayed by the calibration curve obtained with D-dimer standards prepared
in running buffer (Figure 26). However, the overall signals obtained with D-dimer in SBF (Figure 33) are
much more defined, intense and evident when compared to the signals obtained for the same D- dimer
concentrations (Figure 26). This indicates that some components of the SBF contribute to increase the
resolution of the signals and that the running buffer used could be improved to better mimic the obtained
results with biological samples. As mentioned, no pre-dilution was made at this time, to assess the
compatibility of the test with physiological samples.
T C
T C
T C
T C
T C
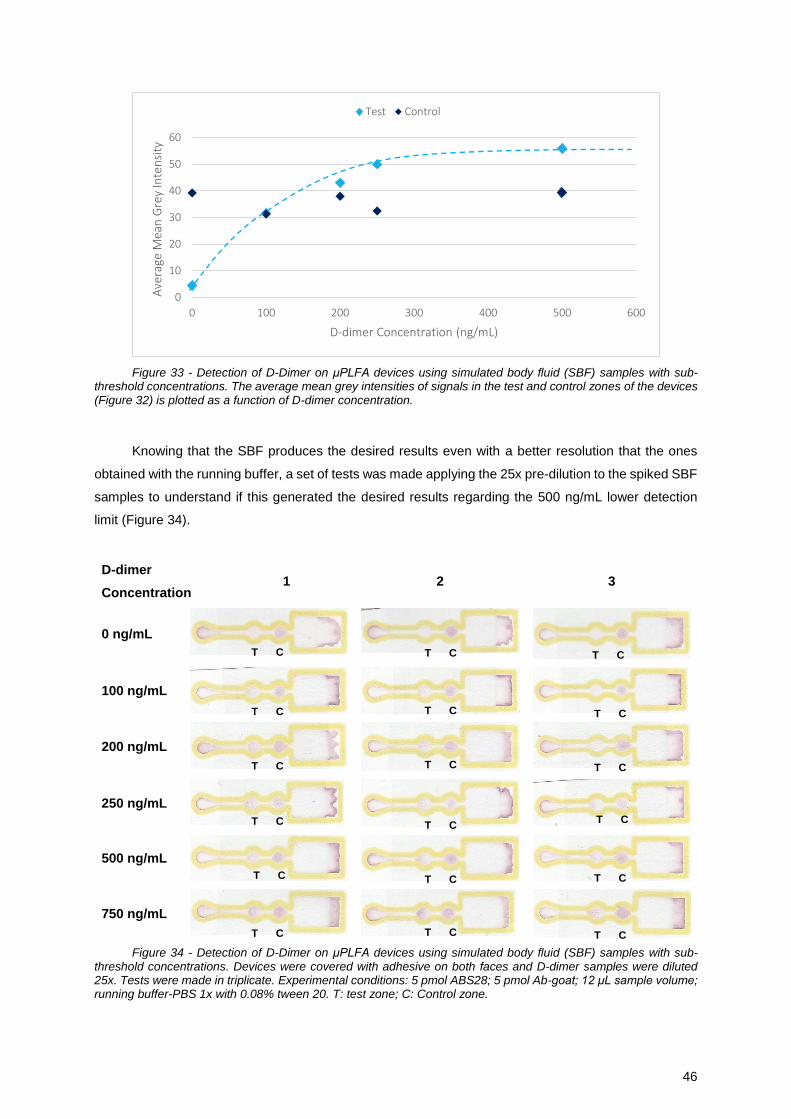
46
Figure 33 - Detection of D-Dimer on μPLFA devices using simulated body fluid (SBF) samples with sub-threshold concentrations. The average mean grey intensities of signals in the test and control zones of the devices (Figure 32) is plotted as a function of D-dimer concentration.
Knowing that the SBF produces the desired results even with a better resolution that the ones
obtained with the running buffer, a set of tests was made applying the 25x pre-dilution to the spiked SBF
samples to understand if this generated the desired results regarding the 500 ng/mL lower detection
limit (Figure 34).
D-dimer
Concentration 1 2 3
0 ng/mL
100 ng/mL
200 ng/mL
250 ng/mL
500 ng/mL
750 ng/mL
Figure 34 - Detection of D-Dimer on μPLFA devices using simulated body fluid (SBF) samples with sub-threshold concentrations. Devices were covered with adhesive on both faces and D-dimer samples were diluted 25x. Tests were made in triplicate. Experimental conditions: 5 pmol ABS28; 5 pmol Ab-goat; 12 μL sample volume; running buffer-PBS 1x with 0.08% tween 20. T: test zone; C: Control zone.
0
10
20
30
40
50
60
0 100 200 300 400 500 600
Ave
rage
Mea
n G
rey
Inte
nsi
ty
D-dimer Concentration (ng/mL)
Test Control
T C
T C
T C
T C T C
T C
T C
T C T C
T C
T C
T C
T C T C T C
T C T C T C
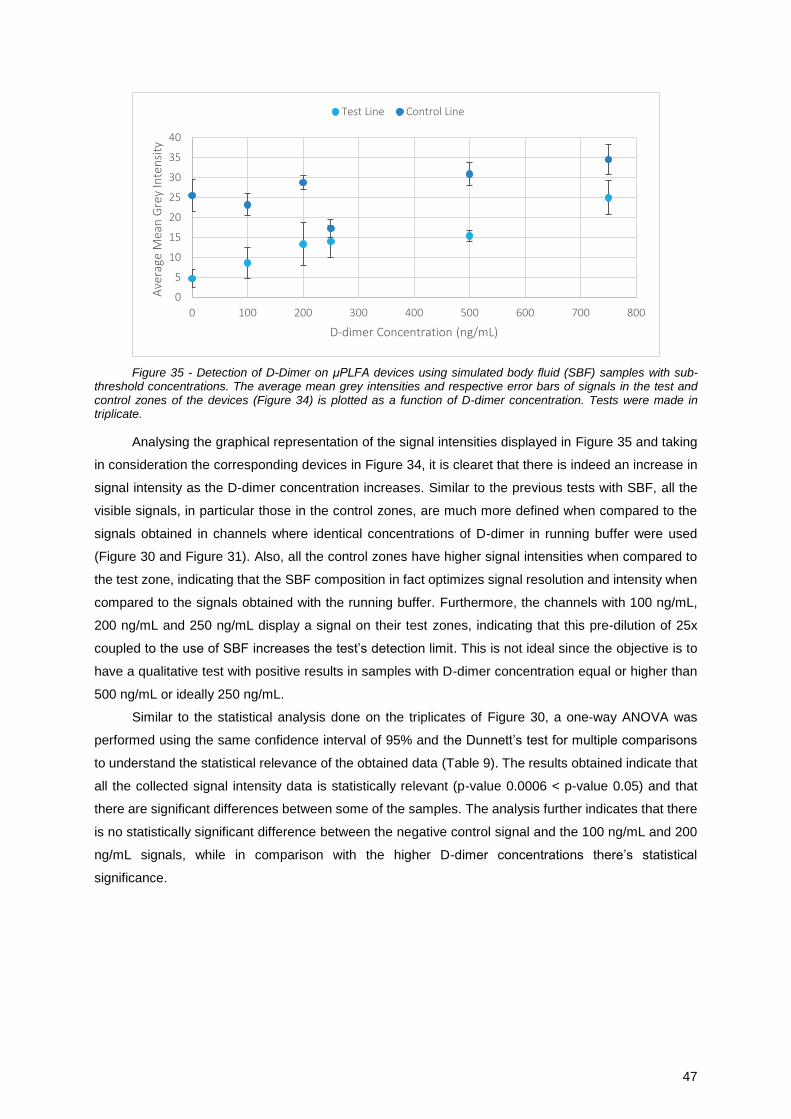
47
Figure 35 - Detection of D-Dimer on μPLFA devices using simulated body fluid (SBF) samples with sub-threshold concentrations. The average mean grey intensities and respective error bars of signals in the test and control zones of the devices (Figure 34) is plotted as a function of D-dimer concentration. Tests were made in triplicate.
Analysing the graphical representation of the signal intensities displayed in Figure 35 and taking
in consideration the corresponding devices in Figure 34, it is clearet that there is indeed an increase in
signal intensity as the D-dimer concentration increases. Similar to the previous tests with SBF, all the
visible signals, in particular those in the control zones, are much more defined when compared to the
signals obtained in channels where identical concentrations of D-dimer in running buffer were used
(Figure 30 and Figure 31). Also, all the control zones have higher signal intensities when compared to
the test zone, indicating that the SBF composition in fact optimizes signal resolution and intensity when
compared to the signals obtained with the running buffer. Furthermore, the channels with 100 ng/mL,
200 ng/mL and 250 ng/mL display a signal on their test zones, indicating that this pre-dilution of 25x
coupled to the use of SBF increases the test’s detection limit. This is not ideal since the objective is to
have a qualitative test with positive results in samples with D-dimer concentration equal or higher than
500 ng/mL or ideally 250 ng/mL.
Similar to the statistical analysis done on the triplicates of Figure 30, a one-way ANOVA was
performed using the same confidence interval of 95% and the Dunnett’s test for multiple comparisons
to understand the statistical relevance of the obtained data (Table 9). The results obtained indicate that
all the collected signal intensity data is statistically relevant (p-value 0.0006 < p-value 0.05) and that
there are significant differences between some of the samples. The analysis further indicates that there
is no statistically significant difference between the negative control signal and the 100 ng/mL and 200
ng/mL signals, while in comparison with the higher D-dimer concentrations there’s statistical
significance.
0
5
10
15
20
25
30
35
40
0 100 200 300 400 500 600 700 800
Ave
rage
Mea
n G
rey
Inte
nsi
ty
D-dimer Concentration (ng/mL)
Test Line Control Line
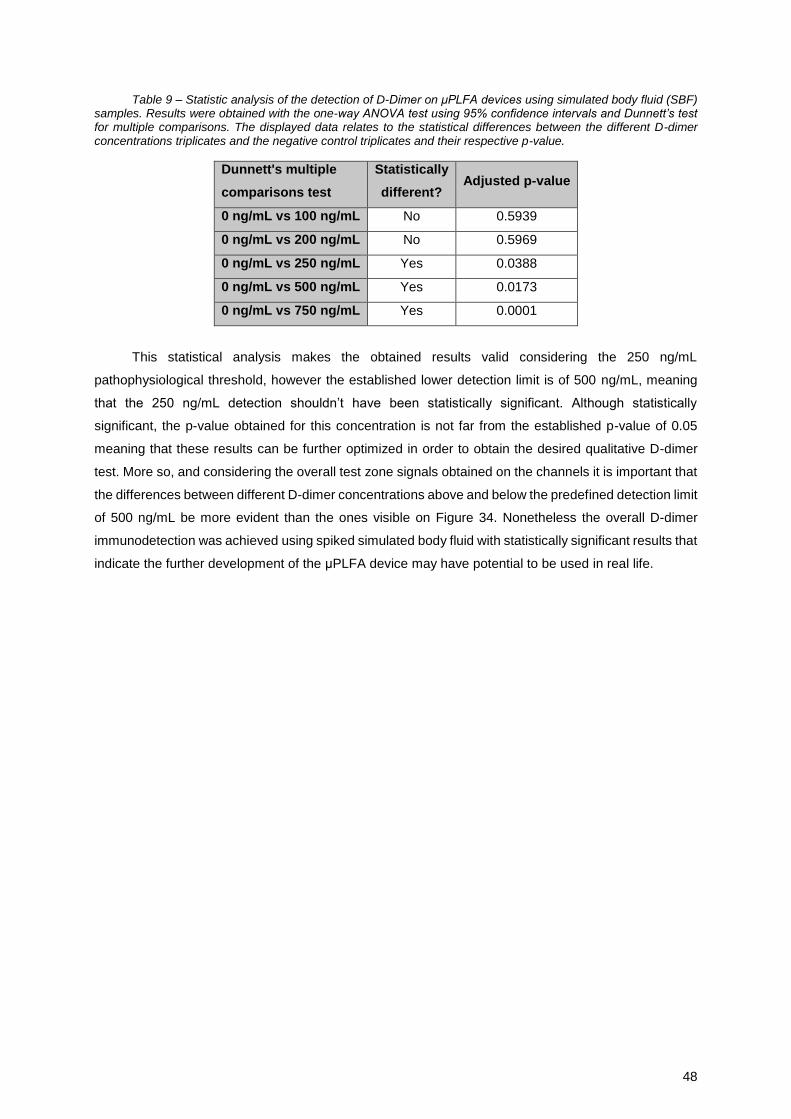
48
Table 9 – Statistic analysis of the detection of D-Dimer on μPLFA devices using simulated body fluid (SBF) samples. Results were obtained with the one-way ANOVA test using 95% confidence intervals and Dunnett’s test for multiple comparisons. The displayed data relates to the statistical differences between the different D-dimer concentrations triplicates and the negative control triplicates and their respective p-value.
Dunnett's multiple
comparisons test
Statistically
different? Adjusted p-value
0 ng/mL vs 100 ng/mL No 0.5939
0 ng/mL vs 200 ng/mL No 0.5969
0 ng/mL vs 250 ng/mL Yes 0.0388
0 ng/mL vs 500 ng/mL Yes 0.0173
0 ng/mL vs 750 ng/mL Yes 0.0001
This statistical analysis makes the obtained results valid considering the 250 ng/mL
pathophysiological threshold, however the established lower detection limit is of 500 ng/mL, meaning
that the 250 ng/mL detection shouldn’t have been statistically significant. Although statistically
significant, the p-value obtained for this concentration is not far from the established p-value of 0.05
meaning that these results can be further optimized in order to obtain the desired qualitative D-dimer
test. More so, and considering the overall test zone signals obtained on the channels it is important that
the differences between different D-dimer concentrations above and below the predefined detection limit
of 500 ng/mL be more evident than the ones visible on Figure 34. Nonetheless the overall D-dimer
immunodetection was achieved using spiked simulated body fluid with statistically significant results that
indicate the further development of the μPLFA device may have potential to be used in real life.
49
5. Conclusions
Molecular diagnostics are becoming extremely important when it comes to correctly and
accurately diagnose diseases. Point-of-care diagnostic tests are new platforms that assure, fast, simple
and sensitive results with small sample volumes. These tests promise a revolution on the way medicine
is carried out, not only in developed countries, but also in low resource development countries, where
medical equipment and personnel is scarce. Important molecular diagnostic tests include
immunoassays for protein identification and quantification, as they are extremely relevant in either
reporting or causing diseases.
Already available POC technologies include microfluidic devices that allow for fast, low-cost and
cost-effective results with small sample volumes. One new tendency of POC technologies and
microfluidics together is to create µPADs, which have the same general characteristics of microfluidic
devices in general and the particularity of being even more cost effective due to the low cost of the paper
matrices used and the relatively simple manufacturing techniques required. Such µPADs can be used
in several scientific areas like health diagnostics, biochemical analysis, forensic and food quality control.
Considering the diagnostics area in general and the D-dimer detection in particular, microfluidic devices
can be used to develop new practical, low-cost and point of care diagnostic tests to detect this biomarker.
Devices like this help improve the diagnostics area but can also be used as monitoring devices capable
of providing quick results that, considering the D-dimer detection, can become very important.
In this work, wax printing was successfully used to quickly assemble of Point-of Care (POC)
μPADs for D-dimer immunodetection. The overall goal of implementing a D-dimer detection assay in a
μPLFA device was achieved. A similar paper-based device with a sandwich type immunodetection has
already been described by Abe et.al. but no identical devices to the one developed for D-dimer in this
work were described.50 It was concluded that the use of a ZZ-CBM fusion protein to anchor capture
antibodies on paper surface was not compatible with the immunodetection sandwich considered, as the
ZZ-CBM64 has high affinity for mouse antibodies and therefore was capturing the mouse-anti-D-dimer
antibody coupled to the gold nanoparticles, generating a non-specific signal on the negative control.
To optimize the μPLFA device, new lateral flow channels were successfully designed with
AutoCAD that improved the overall elution of the test samples on the device. Also, the use of adhesive
membranes on the upper and bottom portion of the channel helped to improve and sharpen the obtained
signals on the tests.
In order to render this qualitative D-dimer immunodetection compatible with its pathophysiological
threshold, a pre-dilution was established in order for the test to only have a positive signal with relevant
D-dimer concentrations above 250 ng/mL and so a lower detection limit of the device was established
at 500 ng/mL and the results obtained were statistically significant.
Simulated body fluid tests were also carried out successfully indicating that this device is most
likely compatible with the use of biological plasma samples. These tests were also able to generate
positive results upon D-dimer detection with more signal resolution, however further optimization
regarding the lower detection limit should be made as the SFB constitution makes the device capable
of detecting D-dimer concentrations below the set detection limit (500 ng/mL) and below the 250 ng/mL
clinical threshold which is not ideal.

50
In terms of future work, the optimization of the device’s detection limit should be made and one
hypothesis would be to use smaller gold nanoparticles (around 20 nm) on the detection system, as these
in theory decrease the lower detection limits to higher antigen concentrations, as is needed.56 Another
possibility is to incorporate ZZ-CBM molecules on to the test as these molecules allow for the generation
of a sharp and centred signal that would make test results interpretation easier. To do so, one option
would be to use on the detection system an anti-D-dimer antibody from another species other than
mouse, to which the ZZ portion of the fusion molecule has less affinity. This way, theoretically there
would be no capture of the gold nanoparticle coupled antibodies by the fusion protein. Another aspect
to test is the use of biological samples with D-dimer levels both above and below the limit of detection
of the developed device to fully assess the compatibility of the with the samples and with the clinical
diagnostic of D-dimer related diseases. A subsequent step would be to develop the device in a way that
allows the direct use of blood samples. As paper can act as a blood separator the possibility to assemble
a device capable of separating blood and providing D-dimer results all in one is not implausible and
therefore it can be studied. 57

i
6. References
1. Vander, A. J., Sherman, J. H. & Luciano, D. S. Human Physiology: The Mechanisms of Body
Function. (McGraw-Hill, 2001).
2. Coleman, W. B. & Tsongalis, G. J. Molecular Diagnostics: For the Clinical Laboratorian. (Springer
Science & Business Media, 2006).
3. Seitz, H. Biomarker Validation Technological, Clinical and Commercial Aspects. (Wiley-VCH, 2015).
4. Nelson, D. L., Lehninger, A. L., Cox, M. M., Osgood, M. & Ocorr, K. Lehninger Principles of
Biochemistry. (W.H. Freeman, 2009).
5. Arosa, F. A., Cardoso, E. M. & Pacheco, F. C. Fundamentos de Imunologia. (Lidel, 2007).
6. Csernok, E. & Moosig, F. Current and emerging techniques for ANCA detection in vasculitis. Nat.
Rev. Rheumatol. 10, 494–501 (2014).
7. Hall, D. A., Ptacek, J. & Snyder, M. Protein Microarray Technology. Mech. Ageing Dev. 128, 161–
167 (2007).
8. Yager, P., Domingo, G. J. & Gerdes, J. Point-of-Care Diagnostics for Global Health. Annu. Rev.
Biomed. Eng. 10, 107–144 (2008).
9. Schumacher, S., Muekusch, S. & Seitz, H. Up-to-Date Applications of Microarrays and Their Way
to Commercialization. Microarrays 4, 196–213 (2015).
10. Issadore, D. & Westervelt, R. M. Point-of-Care Diagnostics on a Chip. (Springer Science & Business
Media, 2013).
11. John, A. S. & Price, C. P. Existing and Emerging Technologies for Point-of-Care Testing. Clin.
Biochem. Rev. 35, 155 (2014).
12. Posthuma-Trumpie, G. A., Korf, J. & Amerongen, A. van. Lateral flow (immuno)assay: its strengths,
weaknesses, opportunities and threats. A literature survey. Anal. Bioanal. Chem. 393, 569–582
(2008).
13. Wild, D. The Immunoassay Handbook: Theory and Applications of Ligand Binding, ELISA and
Related Techniques. (Newnes, 2013).
14. Wong, R. & Tse, H. Lateral Flow Immunoassay. (Springer Science & Business Media, 2008).
15. Milipore Corporation. Rapid Lateral Flow Test Strips.

ii
16. Zhang, D. H. et al. Extract-free immunochromatographic assay for on-site tests of aflatoxin M1 in
milk. Anal. Methods 4, 3307–3313 (2012).
17. Martinez, A. W., Phillips, D. S. T., Butte, D. M. J. & Whitesides, P. G. M. Patterned Paper as a
Platform for Inexpensive, Low Volume, Portable Bioassays. Angew. Chem. Int. Ed Engl. 46, 1318
(2007).
18. Longo, D. et al. Harrison’s Principles of Internal Medicine. (McGraw Hill Professional, 2012).
19. Guyton, A. C. & Hall, J. E. Textbook of Medical Physiology. (Saunders, 2000).
20. World Federation of Hemophilia. The clotting process. World Federation of Hemophilia (2014).
Available at: http://www.wfh.org/en/page.aspx?pid=635.
21. Szigeti, R. G. D-Dimer: Reference Range, Interpretation, Collection and Panels. (2014).
22. Mosesson, M. W. Fibrinogen and fibrin structure and functions. J. Thromb. Haemost. 3, 1894–1904
(2005).
23. Adam, S. S., Key, N. S. & Greenberg, C. S. D-dimer antigen: current concepts and future prospects.
Blood 113, 2878–2887 (2009).
24. American Association for Clinical Chemistry. D-dimer. D-dimer: The Test | D-dimer Test: Fragment
D-dimer; Fibrin Degradation Fragment | Lab Tests Online (2015). Available at:
https://labtestsonline.org/understanding/analytes/d-dimer/tab/test/.
25. Kim, T. K., Oh, S. W., Mok, Y. J. & Choi, E. Y. Fluorescence Immunoassay of Human D‐dimer in
Whole Blood. J. Clin. Lab. Anal. 28, 294–300 (2014).
26. Lippi, G. et al. D-dimer testing for suspected venous thromboembolism in the emergency
department. Consensus document of AcEMC, CISMEL, SIBioC, and SIMeL. Clin. Chem. Lab. Med.
52, 621–628 (2013).
27. Levi, M., Toh, C. H., Thachil, J. & Watson, H. G. Guidelines for the diagnosis and management of
disseminated intravascular coagulation. Br. J. Haematol. 145, 24–33 (2009).
28. Murphy, N. et al. Gestation‐specific D‐dimer reference ranges: a cross‐sectional study. BJOG Int.
J. Obstet. Amp Gynaecol. 122, 395–400 (2015).
29. Longstaff, C. et al. Harmonisation of D-dimer - A call for action. Thromb. Res. 137, 219–220 (2016).
30. Kogan, A. E. et al. Monoclonal antibodies with equal specificity to D-dimer and high-molecular-
weight fibrin degradation products. Blood Coagul. Fibrinolysis 27, 542–550 (2016).
31. Whitesides, G. M. The origins and the future of microfluidics. Nature 442, 368–373 (2006).
iii
32. Lisowski, P. & Zarzycki, P. K. Microfluidic Paper-Based Analytical Devices (μPADs) and Micro Total
Analysis Systems (μTAS): Development, Applications and Future Trends. Chromatographia 76,
1201–1214 (2013).
33. Yetisen, A. K., Akram, M. S. & Lowe, C. R. Paper-based microfluidic point-of-care diagnostic
devices. Lab Chip 13, 2210–2251 (2013).
34. Müller, R. H. & Clegg, D. L. Automatic Paper Chromatography. Ann. N. Y. Acad. Sci. 53, 1108–
1118 (1951).
35. Li, X., Ballerini, D. R. & Shen, W. A perspective on paper-based microfluidics: Current status and
future trends. Biomicrofluidics 6, 11301-11301–13 (2012).
36. Carrilho, E., Martinez, A. W. & Whitesides, G. M. Understanding wax printing: a simple
micropatterning process for paper-based microfluidics. Anal. Chem. 81, 7091–7095 (2009).
37. Lu, Y., Shi, W., Jiang, L., Qin, J. & Lin, B. Rapid prototyping of paper-based microfluidics with wax
for low-cost, portable bioassay. Electrophoresis 30, 1497–1500 (2009).
38. Rosa, A. M. M. et al. Capture and detection of DNA hybrids on paper via the anchoring of antibodies
with fusions of carbohydrate binding modules and ZZ-domains. Anal. Chem. 86, 4340–4347 (2014).
39. Pelton, R. Bioactive paper provides a low-cost platform for diagnostics. TrAC Trends Anal. Chem.
28, 925–942 (2009).
40. Chen, C., Huang, Q.-L., Jiang, S.-H., Pan, X. & Hua, Z.-C. Immobilized protein ZZ, an affinity tool
for immunoglobulin isolation and immunological experimentation. Biotechnol. Appl. Biochem. 45,
87–92 (2006).
41. Cate, D. M., Adkins, J. A., Mettakoonpitak, J. & Henry, C. S. Recent developments in paper-based
microfluidic devices. Anal. Chem. 87, 19–41 (2015).
42. Azzazy, H. M. E., Mansour, M. M. H., Samir, T. M. & Franco, R. Gold nanoparticles in the clinical
laboratory: principles of preparation and applications. Clin. Chem. Lab. Med. 50, 193–209 (2012).
43. Wang, Z. & Ma, L. Gold nanoparticle probes. Coord. Chem. Rev. 253, 1607–1618 (2009).
44. Baptista, P., Doria, G., Henriques, D., Pereira, E. & Franco, R. Colorimetric detection of eukaryotic
gene expression with DNA-derivatized gold nanoparticles. J. Biotechnol. 119, 111–117 (2005).
45. Du, B., Li, Z. & Cheng, Y. Homogeneous immunoassay based on aggregation of antibody-
functionalized gold nanoparticles coupled with light scattering detection. Talanta 75, 959–964
(2008).

iv
46. Niemeyer, C. M. Nanoparticles, Proteins, and Nucleic Acids: Biotechnology Meets Materials
Science. Angew. Chem. Int. Ed. 40, 4128–4158 (2001).
47. Sergeev, B. M., Kiryukhin, M. V., Rubtsova, M. Y. & Prusov, A. N. Synthesis of Protein A Conjugates
with Silver Nanoparticles. Colloid J. 65, 636–638 (2003).
48. Costa, M. N. et al. A low cost, safe, disposable, rapid and self-sustainable paper-based platform for
diagnostic testing: lab-on-paper. Nanotechnology 25, 94006 (2014).
49. Fu, E., Ramsey, S. A., Kauffman, P., Lutz, B. & Yager, P. Transport in two-dimensional paper
networks. Microfluid. Nanofluidics 10, 29–35 (2011).
50. Abe, K., Kotera, K., Suzuki, K. & Citterio, D. Inkjet-printed paperfluidic immuno-chemical sensing
device. Anal. Bioanal. Chem. 398, 885–893 (2010).
51. Protocol for Preparing Simulated Body Fluid (SBF). SBF Available at:
http://www.life.kyutech.ac.jp/~tmiya/SBF-e.html. (Accessed: 9th September 2016)
52. Sigma-Aldrich. Antibody Basics. Sigma-Aldrich Available at:
http://www.sigmaaldrich.com/technical-documents/articles/biology/antibody-basics.html.
(Accessed: 12th October 2016)
53. Steinitz, M. Quantitation of the blocking effect of tween 20 and bovine serum albumin in ELISA
microwells. Anal. Biochem. 282, 232–238 (2000).
54. Almeida, A. Immunodetection in paper-based devices using Carbohydrate Binding Modules fusions
for antibody anchoring and gold nanoparticles for colorimetric reporting. (Instituto Superior Técnico,
Universidade de Lisboa, 2015).
55. Pestana, D. D., Velosa, S. F., Fundação Calouste Gulbenkian & Serviço de Educação e Bolsas
(Lisboa, P. Introdução à probalidade e à estatística. (Fundação Calouste Gulbenkian. Serviço de
Educação e Bolsas, 2002).
56. Safenkova, I., Zherdev, A. & Dzantiev, B. Factors influencing the detection limit of the lateral-flow
sandwich immunoassay: a case study with potato virus X. Anal. Bioanal. Chem. 403, 1595–1605
(2012).
57. Yang, X., Forouzan, O., Brown, T. P. & Shevkoplyas, S. S. Integrated separation of blood plasma
from whole blood for microfluidic paper-based analytical devices. Lab Chip 12, 274–280 (2012).

a
Annex I
Production of ZZ-CBM64
Materials and Methods
ZZ-CBM64 Production
The recombinant protein ZZ-CBM64 was cloned in a plasmid (pET21a(+), Ampicillin resistance;
5443 bp) by Nzytech and produced in Escherichia coli. The protein fusion combines the N-terminus of
the immunoglobin G (IgG) binding double Z-domain of protein A from Staphylococcus aureus and the
C-terminal of a family 64 Carbohydrate Binding Molecule (CBM) of Spirochaeta thermophile separated
by a linker. The genes (Figure_A1) were cloned in the cloning vector pET21a vector using the cutting
sites of NdeI/XhoI enzymes and the final construct contains the ZZ module, followed by a short linker
and by CBM64 and a STOP codon. The sequence of the recombinant protein is displayed in Figure_A
2.
Figure_A1 - Gene sequence >ZZ-CBM64 (630 bp; GC%: 43.17). [1]
Figure_A 2 - Recombinant protein sequence. [1]
For ZZ-CBM64 production, competent cells E.coli DE3 strain BL21 (Novagen) were transformed
with 1 μL of pET21a (+) and left on ice for 30 minutes. After this time the cells were transformed by heat
shock in a water bath (HAAKE DC10) at 42°C for 1 minute followed by 2 minutes in ice. The cells were
then suspended in 1 mL of pre-prepared LB (Luria-Bertani) broth for 1 h at 37°C. Following this
incubation the cells were plated in a culture medium supplemented with ampicillin and left incubating
overnight at 37°C.

b
In order to upscale the cell culture, liquid LB media was prepared using LB broth powder from
Nzytech. Two volumes of LB media were used, 30 mL and 250 mL, which were prepared according to
the manufacturer’s instructions and autoclaved for 10 min, 121°C. After the overnight incubation of the
culture plates, a white transformed cell colony with the pET21a (+) was used to inoculate the 30 mL
liquid medium supplemented with 100 μg/mL of ampicillin.
Cells were cultured overnight at 37 ºC at 260 rpm (rotations per minute). After the incubation the
Optical Density at 600 nm (OD600nm) was measured to determine the amount of culture broth needed to
inoculate the 250 mL culture media to an OD of 0.1. The measured OD600nm was 0.672 with a 1:10
dilution, which corresponds to a 6.72 OD600nm.
A volume of 3.72 μL was then used to inoculate the 250 mL culture medium supplemented with
100 μg/mL of ampicillin. The cell culture was incubated for 1 hour until it reached an OD600nm of 1 and
at that point the fusion protein expression was induced with 200μL IPTG 1M (Fisher Scientific, BPΔ 755-
10). After 6 hours at 37°C, 260 rpm the cell culture was centrifuged at 4770 rpm, 4°C for 40 min (Serial
RCB, rotor SLC 3000). The supernatant was then discarded and the pellet was resuspended in 2 mL of
TST buffer (Tris-saline Tween 20 buffer: 50 mM Tris buffer, pH 7.6, 150 mM NaCl, 0.05% Tween 20).
Cell disruption was achieved by sonication using Banollin-Sonoplus sonicator and a MS72 probe with
30W for 6 minutes with 30 seconds of pulses and 30 seconds of intervals. After cell disruption the
suspension was centrifuged for 8680 rpm, room temperature for 20 min (Serial RCB, Sorval SS34) and
the pellet was discarded to remove cells debris.
ZZ-CBM 64 Purification
The purification of the fusion protein ZZ-CBM64 was achieved by affinity chromatography with an
IgG Sepharose 6 Fast Flow Column (GE Healthcare) in an ÄKTApurifier 10 system (GE Healthcare).
The protocol used was according to manufacturer’s instructions. The column was equilibrated with 5
column volumes of TST buffer and the supernatant was loaded onto the column. The unbound proteins
were eluted with 10 column volumes of TST. The IgG bound fusion protein ZZ-CBM64 was eluted with
0.5 M acetic acid, pH 2.8 and the collected fractions were neutralized using 3.2M Tris buffer, pH11. The
purified ZZ-CBM64 and remaining purification fractions were stored at -20°C.
SDS-PAGE
A Sodium Dodecyl Sulphate Polyacrylamide gel electrophoresis (SDS-PAGE) was performed to
determine protein purity. The SDS-PAGE analysis was performed on polyacrylamide gels with 12% T
(total concentration of both acrylamide and bis-acrylamide), 3.3% C (concentration of cross linker bis-
acrylamide) for the resolving gel and 4% T, 3.3% C for the stacking gel. The samples were prepared by
adding 5 μL of denaturing agent 1 M Dithiothreitol (DDT) (Sigma Aldrich), 25 μL of 2x Laemmli Sample
Buffer (Bio-Rad) prepared according to manufacturer’s instructions and 20 μL of purified sample.
Following preparation, the samples were incubated for 10 minutes in a 100°C water bath and were then
placed in gel.

c
A 10-250 kDa protein ladder (Bio-Rad, Precision Plus Protein Standards) was used as a
molecular mass marker. The gel was run at 90 V until the front of the gel reached the end of the gel
plates. Coomassie Brilliant Blue was used to stain the gels and the destaining was done with a 30%
ethanol and 10% acetic acid solution. Images of SDS-PAGE gels were obtained with a GS-800™
Calibrated Densitometer (Bio-Rad).
ZZ-CBM64 Quantification
To quantify the purified ZZ-CBM64 fusion protein, the BCA (Bicinchoninic Acid) Protein Assay
microplate procedure of Pierce® BCA Protein Assay kit (Thermo Scientific) was used according to
manufacturer’s instructions. The diluent used in the quantification was TST buffer as it was the diluent
of the supernatant containing ZZ-CBM64 before purification.
Results and Discussion
Purification of CBM3-ZZ
The ZZ-CBM64 purification was done in 2 runs using an IgG Sepharose 6 Fast Flow Column in
an ÄKTApurifier 10 system. The chromatogram in Figure_A 3 is representative of both runs.
Figure_A 3 – Affinity chromatography purification of ZZ-CBM64 fusion protein in an IgG Sepharose 6 Fast Flow Column. 3.6 mL of the supernatant containing ZZ-CBM64 were loaded in the column. Unbound proteins were washed away in a single step with 10 column volumes of TST buffer and the bound ZZ-CBM64 was eluted by decreasing the pH with 0.5 M acetic acid, pH 2.8. The elution profile was obtained by reading the absorbance at 280nm. The peak highlighted with the red square corresponds to the elution of the fusion protein.
The rationale for affinity chromatography is the binding affinity of protein in a sample to a specific
ligand in a chromatographic column. For the purification of ZZ-CBM64, an immunoglobulin G (IgG)
column was used due to the fact that the ZZ portion of the fusion protein has a high binding affinity to
the Fc portion of immunoglobulins. Thus, the fusion will bind to the IgG ligands as the sample flows
through the column, while the remaining proteins are washed away. Once the pH is lowered by the
introduction of acetic acid, the fusion protein is eluted.
-20
0
20
40
60
80
100
120
0.00
500.00
1000.00
1500.00
2000.00
2500.00
3000.00
0.00 10.00 20.00
Gra
die
nt
of
Elu
tio
n B
uff
er
Ab
sorb
ance
28
0 n
m
Flow (mL)
Chromatogram of ZZ-CBM64 Purification 1st Run
Abs 280 nm
pH
Gradient

d
In both duplicate runs performed (Figure_A 3, being a representative graph of both runs) two
major protein peaks are visible, as represented by the absorbance at 280 nm. The first peak corresponds
to the flow-through of unbound proteins and the second peak corresponds to the elution of the ZZ-
CBM64 protein (Red square in Figure_A 3) due the lowering of the pH of the eluting solution.
SDS PAGE and Quantification of ZZ-CBM64
In order to evaluate the presence and purity of the ZZ-CBM in the purified fractions an SDS-PAGE
was performed (Figure_A 4).
kDa 1 2 3 4 5 6 7 8 9 10 kDa
250
150
100
75
50
37
25
20
10
250
150
100
75
50
37
25
20
10
Figure_A 4 – Coomassie Blue stained SDS-PAGE of the feed sample and of the fractions collected during the affinity chromatography purification of CBM3-ZZ. Content of each lane: 1) Molecular weight standard (Bio-Rad); 2) Feed sample; 3) Flow through pool run 1 (unbound protein fractions); 4) Run 1 eluted fractions pool; 5) Elution fraction F4; 6) Flow through pool run 2 (unbound protein fractions); 7) Run 2 eluted fractions pool; 8) Elution fraction G6; 9) ZZ-CBM3; 10) Molecular weight standard (Bio-Rad).
Lane 2 in the SDS-PAGE of Figure_A 4 corresponds to the supernatant containing ZZ-CBM64
that was loaded onto the IgG column. The flow through fractions with unbound protein are shown in
Lanes 3 and 6. The purified pools of ZZ-CBM64 obtained in both runs are shown in lanes 4 and 7. The
fusion protein has a molecular weight around 25.2 kDa and was eluted with high purity as was expected.
Lanes 5 and 8 contain single eluted fractions from both runs, F4 and G6 respectively, which correspond
to a small peak in the chromatogram after the fusion protein elution (around 18 mL of flow). From the
SDS-PAGE no bands are observed and therefore no conclusions can be made as to what the peak
corresponds to. Lane 9 contains the fusion protein ZZ-CBM3 with approximately 30 kDa. This lane was
used as a term of size comparison between both ZZ-CBM fusion proteins and as it was expected the
ZZ-CBM64 is smaller than ZZ-CBM3. [2]
The BCA (Bicinchoninic Acid) Protein Assay was used to quantify the purified ZZ-CBM64 by
performing the microplate procedure of the Pierce® BCA Protein Assay kit. An absorbance calibration
curve was traced using known concentrations of Bovine Serum Albumin solutions (Figure_A 5). The
concentration of ZZ-CBM64 was obtained from this curve. The concentration of the ZZ-CBM64 purified
fractions in each run was 482.35 μg/mL and 553.27 μg/mL for the 1st and 2nd run respectively. The
molecular weight of the ZZ-CBM64 is 25.2kDa and therefore each purified portion has 15 μM and 17
μM. In order for the molar concentrations of the ZZ-CBM64 solutions to be more compatible with the ZZ-
CBM-antibody proportions the solutions were diluted to 5µM and 4.25µM, respectively.

e
Figure_A 5 – Calibration curve of the Bovine Serum Albumin standard BCA Protein Assay
References
1. Gene Cloning Report. Estrada do Paço do Lumiar, Campus do Lumiar, Edificio E, R/C, 1649-
038 Lisboa, Portugal: NZYtech Genes and Enzymes; 2016.
2. Rosa A, Louro A, Martins S, Inácio J, Azevedo A, Prazeres D. Capture and Detection of DNA
Hybrids on Paper via the Anchoring of Antibodies with Fusions of Carbohydrate Binding
Modules and ZZ-Domains. Analytical Chemistry. 2014;86(9):4340-4347.
y = 0.0012x + 0.0628R² = 0.9937
0
0.5
1
1.5
2
2.5
3
0 500 1000 1500 2000
Ab
sorb
ance
56
2 n
m
Bovine Serum Albumin Standard Reference [μg/mL]
BCA Protein Assay
Normalized 562 nm Absorbance Absorbance 562 nm
Related Documents


