The Pennsylvania State University The Graduate School Department of Energy and Mineral Engineering DEVELOPMENT OF AN ALGORITHM TO ANALYZE THE INTERRELATIONSHIP AMONG FIVE ELEMENTS INVOLVED IN THE PLANNING, DESIGN AND DRILLING OF EXTENDED REACH AND COMPLEX WELLS A Thesis in Petroleum and Mineral Engineering by Armstrong Lee Agbaji © 2009 Armstrong Lee Agbaji Submitted in Partial Fulfillment of the Requirements for the Degree of Master of Science May 2009

Welcome message from author
This document is posted to help you gain knowledge. Please leave a comment to let me know what you think about it! Share it to your friends and learn new things together.
Transcript

The Pennsylvania State University
The Graduate School
Department of Energy and Mineral Engineering
DEVELOPMENT OF AN ALGORITHM TO ANALYZE THE INTERRELATIONSHIP AMONG
FIVE ELEMENTS INVOLVED IN THE PLANNING, DESIGN AND DRILLING OF EXTENDED
REACH AND COMPLEX WELLS
A Thesis in
Petroleum and Mineral Engineering
by
Armstrong Lee Agbaji
© 2009 Armstrong Lee Agbaji
Submitted in Partial Fulfillment
of the Requirements
for the Degree of
Master of Science
May 2009

The thesis of Armstrong Lee Agbaji was reviewed and approved* by the following:
Robert William Watson Associate Professor Emeritus Petroleum and Natural Gas Engineering Thesis Adviser
R. Larry Grayson Professor of Energy and Mineral Engineering; George H. Jr. and Anne B. Deike Chair in Mining Engineering; Graduate Program Chair of Energy and Mineral Engineering Jose A. Ventura Professor of Industrial and Manufacturing Engineering
*Signatures are on file in the Graduate School.
ii

ABSTRACT
Extended Reach Drilling (ERD) is an integrated methodology for drilling high‐angle well bores
with long horizontal displacements. Typical problems that have come to be associated with
this type of operation include: Directional Well Design, Torque and Drag Limitations,
Hydraulics and Hole Cleaning, Vibration and Wellbore Stability, Equivalent Circulation Density
Management, as well as Mud Rheology and Solids Control.
Given these problems, the drilling operation of ERD wells should be a closed‐loop process that
starts at the pre‐job planning phase, is carried on through the design and execution phase,
and results in the implementation of lessons learned. For high levels of performance
improvement to be achieved, it is essential to analyze the interrelationship among the
elements involved in the entire drilling process. This is because a system that considers the
individual elements of the drilling system in isolation is inadequate to deliver desired
performance improvement.
In this study, an algorithm that sets forth a design for a drilling program that is suitable to drill
an extended reach well was developed using Visual Basic. Although the algorithm touches on
several factors affecting extended reach drilling, the major focus is on the five elements,
which are considered the critical factors. These are: Well Planning and Trajectory Design,
Bottom Hole Assembly (BHA) Design, Drill String Design, Torque and Drag Analysis, as well as
Hydraulics and Hole Cleaning.
iii

The proposed algorithm evaluates the interrelationship among these critical factors and
provides direction on the processes and tasks required at all stages in the design and drilling
of an ERD well to achieve better drilling performance. It also affords both office and field
personnel the capability to identify drilling performance problems and by evaluating results,
identify remedial actions quickly and accurately.
iv

Table of Contents
List of Figures……………………………………………………………………………………………….………………….…..viii
List of Tables…………………………………………………………………………………………………………………..……….x
Acknowledgements………………………………………………………………………………………………………………..xi
Chapter 1. INTRODUCTION.........………………………………………………...............................................1
1.1. Definition of Extended Reach Drilling……………………………………..………………………………………..3
1.2. Extended Reach Drilling: A Historical Perspective……………………………………….……………………7
1.2.1. Horizontal and ERD Wells………………………….………………………………………..…….….…9
1.2.2. Dual Horizontal/ Dual Lateral Wells …………..…………………………………….………….10
1.3. Statement of the Problem………………………………………………………….………………………………….14
1.4. Objective of Study………………………………..…………………………………….……………………….…………15
1.5. Scope of Study……………………………………………………………………………………….………………………15
1.6. Significance of Study and Deliverables……………………………………………………………………..……16
Chapter 2. LITERATURE REVIEW.........……………………………………………….....................................17
2.1. Wellpath Planning…………….……..………………………………………………….…………………………………19
2.2. Torque and Drag…………………………………………………………………….………………………………………20
2.3. Hole Cleaning……………………..….………………………………….……………………………………………….….22
2.4. Cuttings Transport ………………………………..…………………………………………………………….…………24
2.5. Rotary Steerable Drilling Systems……………………………………………………….………………………….28
2.6. Concluding Remarks from Literature………………….…….……………………………………………………31
v

Chapter 3. CRITICAL TECHNOLOGIES FOR SUCCESS OF EXTENDED REACH WELLS……………….33
3.1. What is Different about Extended Reach Drilling?.............................................................34
3.1.1. Torque, Drag and Buckling……….….………………….……………………….…………….….34
3.1.2. Hole Cleaning …………….……………………..…..……………………………………….…………35
3.1.3. Equivalent Circulation Densities……………………………..……………………….…….….35
3.1.4. Rig Capability and Power Requirements ………………………………………….…………36
3.1.5. Wellbore Instability, Differential Sticking and Stuck Pipe.………….……….….….37
3.1.6. Well Control… …………….……………………..…..……………………………………….…………38
3.2. Well Planning and Trajectory Design…………..………………………….………………………………………38
3.2.1. Trajectory Design…………..…..……………………………….………………….…………….….39
3.2.2. Catenary Well Design ………….……………………..………………………………….…………41
3.3. Build Rate………………………………………….……………………………………………….………………………….43
3.3.1. Effect of Build Rate…………..…………….……………………………………….……………….43
3.4. Hole Sizing and Selection………………….……………………………….……………….………………………….44
3.5. Torque and Drag………………….…….…………………………………………………………………………………..45
3.5.1. Torque………………….…….………………………………………………………….…………………..45
3.5.2. Drag………………….…….………………………………….………………………….…………………..48
3.5.3. Frictional Forces….…….………………………………..……..………………….…………………..50
3.5.4. Influence of Friction Factor.…….…………………..…..………………………………………..52
3.5.5. Torque and Drag Reduction Methods……..…………………..……………………………..53
3.6. Equivalent Circulation Density Management….….….……….……………………………………………..55
3.6.1. Effects of ECD.…….………………………....……………..…………………………………………..59
3.6.2. ECD Management and Control..……….…..……………...…………………………………..60
3.7. Drilling Hydraulics and Hole Cleaning……………..……….….….……………………………………………..61
3.7.1. Fundamentals of Hole Cleaning.…….…………………………..….…………………………..62
3.7.2. Factors Affecting Hole Cleaning……………..……………...…………………………………..65
3.7.3. Consequences of Poor Hole Cleaning…………………………………………………………..66
vi

3.7.4. The Clean Hole Concept: What is a Clean Hole?…………………………………………..67
3.7.5. Hole Cleaning Mechanism……………………………….…………………………………………..68
3.8. Wellbore Stability……………………………………….….…….………………………………………………………..72
3.8.1. Vibrations……………………………………………………………………………………………………..72
3.8.2. Wellbore Stability…………………….……….…………………………………………………………..73
3.8.2. Preliminary Wellbore Stability Analysis…………………….……….…………………………..74
Chapter 4. EXTENDED REACH DRILLING ALGORITHM . . . . . . . . . . . . . . . . . . . . …………………… 76
4.1. Algorithm Defined………………….…….………………………………………………………………………………..76
4.2. Visual Basic Algorithm for ERD…………………………………………..…………………………………………..77
4.2.1. Attributes of the Model……………..…….…………………………..….……………………….79
4.3. Analysis of the Individual Modules…………………….…………………………………………………………..82
4.3.1. Well Planning Module……………..…….…………………………..….…………………………..83
4.3.2. Bottom Hole Assembly (BHA) Design Module………….…………………….…………..89
4.3.3. Drill String Design Module……………..…………………………………………………………...92
4.3.4. Torque and Drag Analysis Module……………………………….…………………….………..98
4.3.5. Hydraulics and Hole Cleaning Module…..…………………….…………………….……….101
4.3.6. Equivalent Circulation Density (ECD) Module……………….……………….….……….104
4.4. Sensitivity Analysis – Example Problem……………………………..…….…………………………………106
4.5. Limitations of the Model……………………………..…….……………………………………………………….116
Chapter 5. SUMMARY, CONCLUSIONS AND RECOMMENDATIONS……………………………………117
5.1 General Observations……….………………….…….……………………………………………………………..….117
5.2 Conclusions Drawn from Using the Model…………………………….…….………………………………..118
5.3 Recommendations…………………….…….…………………………………………………………………..……….119
5.4 Concluding Remarks…………………….…….…………………………………………………………………..…….119
5.5 The Future of Extended Reach Drilling………………….…….………………………………………….…….120
5.6 Further Studies………………….…….……………………………………………………………………………………121
Appendix A: Program Code…………………………..…………………………………………………………………….122
Appendix B: Sample Report…………………………..……………………………………………………………………132
Bibliography…………………………………………………………………………………………………………………….…134
vii

List of Figures
Figure 1.1: Industry Extended Reach Drilling Experience…………………………………………………..….4
Figure 1.2: ERD Limit……………………………………………………………………………………………………………….6
Figure 1.3: Limit of Rotary Steerable ERD……………………………………………………………………………….7
Figure 1.4: Evolution of Extended Reach Drilling ………………………………………………………………….12
Figure 3.1: Well Trajectory Profiles……………….……………………………………………………..……………….41 Figure 3.2: Diagrammatic Representation of Torque Generating Forces………………………………46 Figure 3.3: Frictional and Surface‐acting Forces……………………………………………………………………47 Figure 3.4: Drill String Opposing Forces……………………………………………………….………………………. 49 Figure 3.5: Drag and Pick‐Up Forces………………………………………….………………………………………….50 Figure 3.6: Casing Shoe ECD Determination……………….……………………………………..…………..….…58 Figure 3.7: Angular Depiction of Extended Reach Well Trajectory………….…….…..…………….….62 Figure 3.8: Cuttings Transport at Different Inclinations………….……………………..…...……………….63
Figure 4.1: The Continuous Improvement Cycle………….…….…..………………………………………….…78 Figure 4.2: Drilling Design Flow Chart for ERD……….…………………………..…………………………………80 Figure 4.3: Well Planning and Trajectory Design Module………………………………………………………84 Figure 4.4: Interrelationship among ERD Critical Elements………………………………………………..…88 Figure 4.5: Flow Chart for the Design of Bottom Hole Assembly …………………………………………90 Figure 4.6: Bottom Hole Assembly (BHA) Design Module …………………………………………………….91
Figure 4.7: Flow Chart for Drill String Design ………………………………………………………………….…….96
Figure 4.8: Drill String Design Module ………………………………………………………………………………….97
viii

Figure 4.9: Torque and Drag Analysis Module …………………………………………………………………….100
Figure 4.10: Hydraulics and Hole Cleaning Module……………………………………………………………..103
Figure 4.11: Equivalent Circulation Density (ECD) Module…………………………………………………. 105
ix

List of Tables
Table 3.1: Well Trajectory Options, Advantages and Disadvantages . . . . . . . . . . . . .. . . . . . . .40
Table 3.2: Recommended Minimum and Maximum Flow Rates for Different Hole Sizes . . . .71
Table 3.3: Recommended Drill String RPM for Various Hole Sizes…………………………………………71
Table 3.4: Types of Vibration…………………………………………………………………………………………….….73
x

Acknowledgements
I would like to express my sincere gratitude and appreciation to my academic adviser, Dr.
Robert William Watson for his consistent advice, fortitude, and receptiveness to opinions and
ideas while I worked on this project. My appreciation also goes to the other members of my
thesis committee, Dr. Larry Grayson and Dr. Jose Ventura for the unflinching support and
encouragement I got from them in the course of doing this work.
A lot of credit goes to Jim Oberkircher, President and CEO of GF Eagle Corporation who first
gave me the idea and suggestion to conduct research on Extended Reach Drilling. I would
also like to acknowledge the help of individuals and companies in the oil industry that
contributed immensely to the success of this work. Top on the list is Baker Hughes‐INTEQ. I
want to thank Pete Clark who first hired me as an intern and thus started my relationship with
the company. Special thanks also go to Charles van Lammeren who is the brainchild and
initiator of the involvement and partnership of Baker Hughes‐INTEQ in this research. I must
not fail to thank John Fabian and Carl Corson for the immense role they played in ensuring
that I got all the materials I needed to carry out this work. The many meetings and discussions
I had with the Baker Hughes Team greatly ensured that I stayed on course and on message
throughout the duration of this study.
Of course I would like to thank my wife Elma, for staying strong and focused while I was
several miles away, working on this project. It is impossible for me to list all the people that
contributed in one way or the other to the success of this work. To all whose names have
xi

xii
been mentioned and those not mentioned, I say, THANKS is a small word, but it goes a long
way to show how much I appreciate your love care and concern while I worked on this
project.

Chapter One
Introduction
Extended Reach Drilling (ERD) is an integrated methodology for drilling high‐angle well
bores with long horizontal displacements. ERD wells are typically kicked off from the
vertical near the surface and built to an angle of inclination that allows sufficient horizontal
displacement from the surface to the desired target. This inclination is held constant until
the wellbore reaches the zone of interest and is then kicked off near the horizontal and
extended into the reservoir. This technology enables optimization of field development
through the reduction of drilling sites and structures, and allows the operator to reach
portions of the reservoir at a much greater distance than is possible with conventional
directional drilling technology. These efficiencies increase profit margins on projects and
can make the difference whether or not a project is financially viable (Al‐Suwaidi, El‐
Nashar, Allen and Brandao, 2001).
Extended Reach Drilling involves pushing drilling capabilities near their limits, whether it is
to reach reserves far from existing facilities or to expose reservoir sections for production
and reservoir management advantages. As a matter of fact, ERD needs to be viewed not
only as Extended Drilling, but also as Extended Reservoir Drilling, or both Extended Reach
and Reservoir Drilling (Payne, Wilton, and Ramos, 1995). In this perspective, ERD assumes a
critical role in current industry operations.
1

The purpose of drilling extended reach, horizontal and complex design wells is to produce
oil and gas in a field in the most cost effective way. The use of these new techniques can
make old non‐profitable fields profitable, prolong an existing field’s economic life and
make new and uncertain field discoveries technically possible.
Exploitation of ERD procedures could also be made to:
1. Develop offshore reservoirs now considered uneconomical;
2. Drill under shipping lanes or under environmentally sensitive areas;
3. Accelerate production by drilling long sections of nearly horizontal holes in
producing formations;
4. Provide an alternative for some subsea completions and
5. Reduce the number of platforms necessary to develop a large reservoir.
Some of the many advantages of using ERD to access reserves are based on the elimination
of high capital cost items. For example, in Alaska, ERD can reduce the need for costly
drilling and production islands and the inherent logistical problems associated with them
(Nelson, 1997). For offshore drilling, such as in the North Sea and the Gulf of Mexico, ERD
results in a substantial reduction in subsea equipment, including fewer pipelines. This not
only has an impact on economics but also on environmental concerns and even permitting
(Mason and Judzis, 1998).
2

1.1 Definition of Extended Reach Drilling
ERD wells are generally associated with accessing reservoirs at locations remote from a
drill site. Generally, a well is defined as extended reach if it has a Step‐Out Ratio of 2 or
more. Step‐out Ratio is defined as the horizontal displacement (HD) divided by the true
vertical depth (TVD) at total depth.
The definition of what exactly is an extended reach well remains a debatable issue, but as
was mentioned earlier, current consensus says it is a well in which the horizontal
displacement is at least twice the true vertical depth of the well (Economides, Watters, and
Dun‐Norman, 1998). This definition also implies that as the ratio of displacement to TVD
increases, the well difficulty increases. While there is no such thing as an “easy” ERD well,
it is factual to say that with increased displacement comes increased difficulty (Williams,
2008). However, the depth of the reserves to be accessed is also critical – the shallower the
reserves the more difficult it is to access the well using ERD. Therefore, displacement to
TVD ratio provides an effective measure of total difficulty (Williams, 2008). Extended reach
drilling can thus be viewed as an integrated methodology for drilling high‐angle well bores
with long horizontal displacements (Tolle and Dellinger, 2002).
There has been some debate on what exactly determines the difficulty in drilling an
extended reach well. Some authors have used ERD ratio (HD/TVD) or even (MD/TVD) as
measures of difficulty, where MD is the measured depth. Relative difficulty is a function of
both HD/TVD ratio and absolute TVD and it is commonly referred to as Aspect Ratio.
3

Williams (2008) clearly supports the notion that the higher the ratio the more difficult the
well is to drill. But in an earlier study, Mason and Judzis (1998) propounded that this is not
true, as depicted in Figure 1.1.
Source: Baker Hughes‐INTEQ
Figure 1: Industry Extended Reach Drilling Experience Figure 1.1: Industry Extended Reach Drilling Experience
As seen in the figure, the largest step‐out wells have been drilled at the highest ERD ratio.
But this issue is far more complicated than this. For example in deep water fields where
directional work is often not possible until drilling depth is below the sea bed, the total ERD
ratio will normally be less than 1. This is the case even though the element of vertical
depth over which any directional work is carried out would have a very high ERD ratio
(Mason and Judzis, 1998).
4

In spite of these controversies, there is still no standard and generally accepted definition
for an ERD well. Thus, there is the need for the industry to address this issue and come up
with a generally acceptable method for characterizing all well designs.
It should be noted however, that the generally accepted definitions of an ERD well
(Longwell and Seng, 1996) include:
1. Wells having horizontal displacements greater than twice the well’s true vertical
depth, yielding inclination angles in excess of 63.4 degrees;
2. Wells which approach the limits of what has been achieved by the industry in terms
of horizontal displacement;
3. High‐angle directional wells that approach the capabilities of the contracted rig.
Typically, the Extended Reach Drilling limit is reached when one of the following occurs
(Demong, Ruverbank and Mason, 2004):
1. The hole becomes unstable, due either to time exposure, geo‐mechanical
interaction, adverse pressure differential, or drilling fluids interaction (or
incompatibility). The onset of these conditions is usually observed in the sudden
increase of torque and drag in the drill string not related to dog leg severity (DLS) of
the hole or the length of the drilled section.
5

2. The drill string will no longer travel to the bottom of the hole due to excessive drag.
This situation is differentiated from the case above because this effect is not related
to the friction factor which remains unchanged. Instead, it is related to the
cumulative length drilled along with the DLS of the hole as drilled, Figure 1.2.
Source: Demong, K., Riverbank, M., and Mason, D. (2004)
Figure 1.2: ERD Limit ‐ Reached when friction exceeds the force available to push the drill string down the hole
3. When rotation is used to overcome friction and advance the drill string, such as in
rotary steerable application. The limit is reached when you reach the torque
capacity of the tubulars as shown in Figure 1.3.
6

Source: Demong, K., Riverbank, M., and Mason, D. (2004)
Figure 1.3: Limit of Rotary Steerable ERD ‐ Reached when friction exceeds the torque available to turn the drill string
1.2 Extended Reach Drilling: A Historical Perspective
Horizontal well technology and extended reach drilling technology have been implemented
in the industry since 1987. Early efforts of modern‐day horizontal well technology were led
by Atlantic Richfield in the late 1970s, Elf Aquitaine in the early 1980s, and BP Alaska in the
mid 1980s. Estimates by Philip C. Crouse and Associates Incorporated (1995) placed
worldwide implementation of horizontal well technology at over 11,000 horizontal wells
during the period of 1986 through 1996.
7

Following the end of the era of “easy oil” and with major oil fields being situated in deep
waters and difficult terrains, well trajectories being planned had long horizontal departures
and increasingly became more complex. Extended Reach Drilling thus became the means
of expanding production of these aging oil fields and made it possible to drill and produce
hitherto impossible reserves.
The first extended‐reach well with a horizontal reach of more than 5,000m was drilled
from Statfjord Well C‐10 in 1989‐1990 (Rasmussen, Sorheim, Seiffert, Angeltvadt and
Gjedrem, 1991). Statfjord Well C‐3, which was drilled and completed in 1999, holds the
record of being the first well in the industry to exceed 6,000m (Njaerheim and Tjoetta,
1992). It had a horizontal departure of 6.1km. In 1992‐1993, Statoil’s Well C‐2 set new
world records and broke the 7km departure “barrier” for the first time. Well C‐2 achieved
8.7km MD and a departure of 7.3km at the Statfjord reservoir TVD of 2,700m. In 1994,
Norsk Hydro’s Well C‐26 set another world record for well departure. Their Well C‐26
achieved 9.3km MD with a departure of 7.85km at 2,270m TVD.
Since the Statfjord development projects, the industry has recorded breakthroughs in
extended reach drilling. Some major industry achievements that followed the Statfjord
successes are chronicled hereunder:
8

1.2.1 Horizontal and ERD Wells
In September 1991, Cliff Oil & Gas drilled the deepest horizontal well in the North Bayou
Jack field in Louisiana. The well reached TD at 4,675m TVD (Drilling and Production
Yearbook, 1992).
In November 1991, Maersk Oil & Gas completed the world’s longest horizontal well at Tyra
West Bravo field, TWB‐11a in the Danish sector of the North Sea. The horizontal extension
record was 2,500m at a measured depth of 4,770m and a total vertical depth of 2,040m
(Drilling and Production Yearbook, 1992). At about the same period, Unocal had the
greatest horizontal displacement to true vertical depth ratio, HD/TVD of 3.95. This was
achieved in Well C‐29 in the Dos Cuadrea Field offshore Santa Barbara in California. The
well had a measured depth of 1,335m (Drilling and Production Yearbook, 1992). The
company also drilled the longest ERD well in the USA. The well A‐21 was drilled in July 1991
from the Irene platform located in offshore California and has a lateral reach of 4,472m.
About the same period, Woodside Offshore Petroleum drilled a long extended reach gas
well from the North Rankin‐A platform in Australia. The well had a reach of 5,009m and a
MD of 6,180m.
9
1.2.2 Dual Horizontal – Dual Lateral Wells
In 1992, Well A‐36 achieved 5km departure in the shallower GulIfaks reservoir at 2,160m
TVD, resulting in a MD/TVD ratio of 2.79. It was among the highest at the time.
In March 1992, Torch Energy Advisors completed the first Dual Horizontal Well, Basden
1‐H, in Fayette County, Texas (Drilling and Production Yearbook, 1993). After drilling both
horizontal laterals, the two slotted liners were run into opposing horizontal wellbores. The
second liner was run through a window in the first. Each horizontal lateral extended 800m.
In 1993, Petro‐Hunt Corporation used a unique horizontal well design to optimize
development of an irregularly shaped lease in the McDennand Well No. 1 in the Austin
Chalk formation in Texas (Cooney, Stacy and Stephens, 1993). Two medium‐radius
horizontal bores were drilled in opposite directions from one vertical hole to maximize
horizontal displacement in the lease. The two bores had horizontal sections of 825m and
625m, respectively. Underbalanced drilling techniques were used to prevent formation
damage. The high mechanical integrity of the Austin Chalk formation suited an openhole
completion method.
In August‐September 1991, Gemini Exploration Company drilled the longest total
displacement of two lateral wells in the Pearsall field of south Texas (Drilling and
Production Yearbook, 1992). The total combined displacement of the two laterals was
2,687m.
10

As the years went by (especially in the late 1990s), drilling techniques continued to be
developed to push the limit beyond the then maximum 60 degree inclined wells. This was
as a result of a combination of engineering research, application of new technology and
field experience. During this period, BP also drilled wells that stretched 5km (3 miles) then
8km (5 miles) and then 10km (6¼ miles) offshore from the rig site located onshore at their
Wytch Farm development (Williams, 2008). The Wytch Farm project thus broke the
existing record and set a new one. The technical success of this project opened the “flood
gates” and extended reach drilling not only increasingly became the “standard practice” for
expanding production of aging oil fields, it also made it possible to drill and produce
hitherto impossible reserves.
Figure 1.4 is an evolutionary plot, which shows that the most aggressive ERD activities
indeed took place during the early 1990s. The inner envelope describes ERD wells drilled as
of 1992 while the subsequent ones to the right describe the industry achievements over
the years, based on recent industry literature.
11

Pre‐1992 Late 90,s
Current Limit
Source: Oil and Gas Graphics, August (2008)
Figure 1.4: Evolution of Extended Reach Drilling
As a result of improvements in personnel competency and technological advancement, not
only were more ERD wells drilled, these wells continuously pushed the envelope in terms
of lateral reach and geometric complexity in order to access more challenging geological
targets. The complexity of ERD operations has progressed from 2D to complex 3D
trajectories where, for example, an abandoned 2D ERD well has been sidetracked to tap
shallower satellite reserves, requiring a highly complex uphill well profile (Ruszka, 2008).
12

In April 2007, Exxon Mobil Corporation announced that its subsidiary, Exxon Neftegas
Limited (ENL), completed the drilling of the Z‐11 well in the Sakhalin project. It was the
longest measured depth ERD well in the world at the time. Located on Sakhalin Island
offshore Eastern Russia, the record‐setting Z‐11 achieved a total measured depth of
11,282m or over seven miles. The Z‐11 was the 17th ERD producing well to be completed
as part of the Sakhalin‐1 Project. It was drilled in 61 days, more than 15 days ahead of
schedule and below expected cost with no safety or environmental incidents. Since the
first Sakhalin‐1 well was drilled in 2003, the time required to drill these world class wells
has been reduced by more than fifty percent. When compared to industry benchmarks,
Sakhalin‐1 wells are among the world's fastest‐drilled ERD wells.
However, the current world record for the longest ERD well drilled is held by Maersk Oil
Qatar. In June 2008, the company was reported to have drilled the well in the Al‐Shaheen
Field offshore Qatar. This well broke the previous record length by over 610m; reaching a
total depth of 12,289m, with a total step‐out distance from the surface location of
10,902m. In all, the well set 10 records including the longest well ever drilled, the longest
along‐hole departure (11, 569m), the longest 8½‐in section (10,805m), the highest ERD
ratio (AHD/TVD = 10.485), the highest directional difficulty index (DDI = 8.279), the deepest
directional control, the deepest downlink MWD transmission and LWD geosteering (12,
290m), the deepest battery‐less operation, the longest reservoir contact (10,805m.) and
finally the longest open hole (Drilling Contractor Magazine, July/August, 2008).
13

Record‐breaking achievements continue to be made and these tend to demonstrate that it
is indeed possible to exceed the current industry limit of ERD. What is less well understood,
however, are the risks of drilling such wells. Experience has shown that the probability of
encountering significant drilling problems in ERD wells is generally much higher than that
experienced in conventional wells. Driven by a need to minimize environmental impact and
improve recoverable reserves, it is anticipated that ERD activity will continue to increase.
Simultaneously, advances in drilling technology development will continue to lower the
operational risk. As a result, ERD limits will continuously be tested and pushed to new
levels as the growing benefits outweigh the diminishing operational risks (Ruszka, 2008).
1.3 Statement of the Problem
Well profiles have become more challenging as a result of the need to reach new targets,
depths and departures that in the past seemed improbable. Regardless of our current
levels of success, there is the urgency to develop methods and processes that will further
improve drilling efficiency. Well trajectories being planned today have such departures and
complexity that viability, risk and economics are all vital parts of the evaluation process
prior to investing in the project. These in large part are determined by the rig design and
capacity to drill these extreme‐reach well designs.
To reduce operational costs, the entire drilling process must be improved substantially.
Researchers focusing on these challenges have identified the need for system‐based
solutions. Such an approach evaluates all the elements that influence the drilling process.
14

As such, it is imperative that a systematic, logical and quantifiable approach for developing
and implementing technologies in these types of applications be defined. As the industry
continues to move toward the more cost‐effective technologies of computer‐based
instrumentation, power‐handling tools, and automated drilling, there is the need to have a
defined and structured approach for drilling extended reach wells.
1.4 Objectives of Study
The objective of this study is to integrate the parameters involved in the planning, design
and drilling of extended reach and complex wells into a single computer model. The goal is
to develop an algorithm that will evaluate the interrelationship among these parameters
during the planning and design phases of the drilling operation in a technically sound and
feasible way.
1.5 Scope of Study
As was mentioned earlier, the industry has made significant progress in developing
improved technologies especially as it affects the drilling of complex and designer wells.
This study will concentrate on the following areas:
Well Planning of Extended Reach and Complex Wells, and
Drilling Parameter Evaluation in Extended Reach and Complex Wells.
15

Under these two broad headings, the following technologies, which have been found to be
critical to the success of ERD, would be analytically examined:
o Well Planning and Trajectory Design
o Bottom Hole Assembly Design
o Drill String Design
o Torque and Drag
o Hydraulics and Hole Cleaning
o Equivalent Circulation Density Management
1.6 Significance of the Study and Deliverables
At the end of this study, a Visual Basic algorithm will be developed. The model will have
the capability to design the drilling program most suitable to drill an extended reach well. It
will be versatile and flexible such that the components of extended reach drilling can either
be chosen by the user based on availability, or by the program from its library/databank.
Evaluation of these components will result in an output that will produce a viable wellplan
and design for the given ERD well.
16

Chapter Two
Literature Review
Several studies have been carried out on the theory and practice of drilling extended reach
and complex wells. A review of the literature gives us an insight into some of these studies,
the technologies used and how they have impacted the drilling industry.
For any given drilling operation, numerous drilling technologies are typically available to
ensure maximum recovery of the hydrocarbon from the reservoir. Over the years, the
industry has made significant progress in developing improved technologies to tackle the
complexities encountered in drilling extended reach wells. Some of these improvements
are related to real‐time formation evaluation, directional control while drilling, improved
bottomhole assembly (BHA) components, and drilling fluids.
Based on the many lessons learned in recent projects, technologies that have been
identified to be vital to the success of ERD (Payne, Cocking and Hatch, 1994) include:
• Torque and Drag
• Drillstring and Bottom Hole Assembly Design
• Wellbore Stability
• Hydraulics and Hole Cleaning
• Drilling Dynamics
• Rig Sizing
17

From the drilling fluid perspective, some crucial issues that can pose significant challenges
for the operator (Cameron, 2001) include:
Narrow Mud Weight/Fracture Gradient Window
Equivalent Circulation Density (ECD) Management
Lost Circulation
Lubricity
Also related to these are surveying and well profile design. Other technologies of vital
importance are the use of Rotary Steerable Systems (RSS) together with Measurement
While Drilling (MWD) and Logging While Drilling (LWD) tools to geosteer the well into the
geological target (Tribe, Burns, Howell and Cickson, 2001).
It is well known that ERD introduces factors that can compromise well delivery, and the
first challenge prior to drilling an ER well is to identify and minimize risk (Karmaruddin, Lah,
Sering, Good and Khun, 2000). The literature is replete with several experimental and
theoretical studies that have been conducted on extended reach exploration and
development drilling. Researchers have mainly concentrated on the critical factors outlined
above. This literature survey will be carried out by reviewing the studies that have been
made, based on these critical technologies.
18

2.1 Wellpath Planning
Extended Reach Drilling is playing an important role in the economic development of
various oil reserves. For some ER wells, careful well planning and utilizing existing drilling
practices are sufficient to avoid problems such as wellbore instability, lost circulation, and
stuck pipe. However, results from several studies have shown that when well step‐out
ratios increase, some operational practices developed while drilling conventional wells
become inadequate to successfully and cost‐effectively deliver the ER wells. It should be
noted, however, that careful planning alone cannot always prevent drilling problems.
ERD well profile design is not just a simple geometric curve design. It is an integrated
process that requires an optimum wellpath profile with respect to torque and drag. There
are two main principles that should be obeyed when planning an extended reach well
(Shanzhou, Genlu, Jianguo, and Zhiyong, 1998). These are:
• Minimizing Torque and Drag
• Minimizing Well Length
Several papers have been written on this subject. McClendon and Anders (1985) described
the use of the catenary well plan method for directional drilling. Catenary Wellplan is
explained in detail in Chapter 3. A modified version of this method was used with great
success when some of the ERD and horizontal wells on the Statfjord field were drilled. The
method was mainly used to reduce torque and drag by reducing the wall forces in the
19

build‐ up section. This was done in the top part of the hole where the drill pipe tension and
side loads were highest.
2.2 Torque and Drag
The ability to confidently predict that you can reach a reservoir target is probably the
biggest problem when drilling an extended reach well. This makes the accurate prediction
of torque and drag very essential. Drilling torque losses calculated on various plan
trajectories are a good indication of drillability of a well plan. A review of these torque
values and adjustments to the planned trajectory is a way to improve the plan or find the
easiest path to drill. Selecting the appropriate well profile followed by modifying casing
and tubular designs should be the key initial steps in torque reduction measures (Aston,
Hearn and McGhee, 1998). Torque levels in ER wells are generally more dependent on
wellbore length and tortuousity than tangent angle. Yet, higher angle wells do tend to
reduce overall torque levels while drilling since more of the drill string is in compression,
and the tension profile in the build section is reduced. However, higher torque values and
associated problems such as accelerated casing wear and key seats are seen during back‐
reaming operations (Modi, Mason, Tooms and Conran, 1997).
One of the major factors affecting torque and drag in an extended reach well is the
tortuousity of the hole (Banks, Hogg and Thorogood, 1992). High tortuousity results from a
lack of control of toolface and deviation rate. Thus if a steerable motor is hard to orient,
this will result in higher torque and drag, which compounds the original orientation
20

problem. Low build‐up rates, deep kick‐off points, elimination of excessive tortuousity and
optimum hole cleaning are the main factors that will affect the torque and drag values.
Banks et al. (1992) also discussed the effect of excessive tortuousity. They stipulated that
excessive tortuousity can severely limit the drillable depth and the elimination of this
effect is a critical factor in successful ERD operations. They recommend that this should be
used as an objective measure of the directional drilling contractor’s performance.
High drilling torque can pose significant problems in ERD wells. Meader, Allen and Riley,
(2000) investigated methods of torque reduction at the Wytch farm project. The project
had used Barafibre (crushed almond shell) as the prime method of torque relief. But during
the drilling of Well M‐16, a trial of an alternative mud additive was conducted. The product
was Lubraglide (small plastic beads). The trial was conducted by stripping out all the
Barafibre from the system and replacing it with Lubraglide. The initial results were quite
impressive. The results showed that as the Barafibre was stripped from the system, the
torque level rose from ± 40,000 ft‐lbs to the limit of 45,000 ft‐lbs where the top drive
stalled out. As the Lubraglide entered the open hole the torque level dropped to 25,000 ft‐
lbs. This is a dramatic result but unfortunately the torque reduction was not sustained for
the duration of the 8 ½” hole section. The torque was managed for the rest of the well with
a combination of Lubraglide and Barafibre. The reasons why Lubraglide alone could not
consistently reduce the torque are not well understood, and this underlines the need for
extensive data gathering so that thorough post‐well analysis can be conducted.
21

Many operators have reported the use of mechanical and chemical friction reducers to
minimize torque and drag. Rubber element and plastic casing protectors have been
reported to be successful in reducing torque. Some operators, (Ikeda, Takeuchi, and
Crouse, 1996) reported torque reductions of over 25% by using Non‐Rotating Drill Pipe
Protectors (NRDPP). Bi‐directional rollers for both drillpipe and casing have shown the
most encouraging results especially inside casing while running liners and drill pipe
conveyed logging tools. Other torque reduction strategies that are known to have been
implemented by operators include torque reduction subs, beads, and downhole tractor
systems. Experience on previous ER wells have also indicated that the use of fibrous Lost
Circulation Materials (LCM) have a very beneficial effect in improving wellbore cleaning
and reducing both torque and drag (Cocking, Bezant and Tooms, 1997). When torque
values begin to increase in the 8½” section, lost circulation materials are known to have
been used to reduce torque by improving hole cleaning effectiveness.
2.3 Hole Cleaning
ERD wells typically require higher density fluids to maintain stability as compared to
vertical wells. High inclinations also expose more surface area of a particular zone to the
drilling fluid for a greater period, thus increasing the potential for differential sticking or
lost circulation. It has been reported that hole cleaning is critical to the success of
extended reach drilling, especially where the hole inclination is high (Payne et al ,1994;
Ryan, Reynolds and Raitt, 1995; Eck‐Olsen, Sietten, Reynolds and Samuel, 1994; Aarrestad,
and Blikra, 1994; and Ikeda et al. 1996).
22

Poor hole cleaning has resulted in problems of:
1. Inability to transfer weight to the bit
2. Unexplained and unplanned changes in direction
3. Lost mud in the pay zone, which limits ultimate productivity due to formation
damage
4. Stuck pipe problems
Several papers have shown the importance of drillpipe rotation as a means of improving
hole cleaning (Brett, Beckett and Holt, 1989; Guild and Jeffrey, 1994; Sanchez, Azar, and
Martins, 1997). As the drillpipe is rotated, cuttings are agitated into the flowstream and
circulated out of the wellbore. To enhance hole cleaning, drillstring rotation is used while
drilling and backreaming, and with the pipe off the bottom. In another study, Sanchez et
al. (1997) reported that the reduction in cuttings' weight in the annulus could be as high as
80% due to pipe rotation. There are obviously many factors involved in modeling hole
cleaning, such as annular velocity and mud rheology. However, having continuous drill
string rotation is possibly one of the most significant. Deviating the hole by sliding a motor
will also hinder hole cleaning (Warren, 1997; Ikeda et al. 1996).
In reporting Statoil’s experiences in drilling horizontal, extended reach, and complex wells,
Blikra, Drevdal and Aarrestad (1994) propounded that deep kick‐off point and low build‐up
rates will reduce the inclination in the larger diameter hole sections. This generally gives
better hole stability and improves hole cleaning. According to the report, high rotation of
23

the drill string in the region of 150‐180 rpm have been known to improve hole cleaning,
especially while drilling the 12 ¼” and 8 ½” hole sections with oil‐ester‐ or ether‐based
mud systems. They also reported that disturbing the cuttings on the low side of the hole
and creating a turbulent flow pattern around the drill pipe can Iead to improved cuttings
removal. Blikra et al. (1994) also showed that backreaming in open hole and inside
casing/liners at high rotation speed has become standard procedure for ERD wells and has
also resulted in improved cuttings removal. Other factors that have been known to
enhance hole cleaning include high flowrates, tight control of mud properties (especially
mud rheology) and controlled drilling rates.
Additional research is being conducted to address the problem of lost circulation in ERD
wells. The high wellbore inclination presents significant challenges concerning placement
techniques, sufficient coverage of the loss zone, and selection of non‐damaging materials.
Addition of lost circulation materials (LCM) has been found to greatly reduce open‐hole
torques through the formation of a low‐friction bed between the drill string and the
formation. Thus current investigations focus on a better understanding of loss and
propagation mechanisms and the application of crosslink polymers and other fluids that
provide low compressive strength.
2.4 Cuttings Transport
Efficient cuttings transport is one of the primary design considerations for an extended
reach drilling fluid, especially for wells with horizontal and highly inclined sections of more
24

than 6,000m (Guild, Wallace, and Wassenborg, 1995; Gao, and Young, 1995; Schamp,
Estes, and Keller, 2006). Guild et al. (1995) reported that, while being transported from the
hole, cuttings can be ground to finer sand particles, especially when rotary drilling is being
used. Under these conditions, drilling may not be able to proceed if cuttings transport
remains a problem in the hole. As a result of excessive torque and drag caused by small
cuttings settled at the lower side of the horizontal or inclined section, it may not be
possible to run casing in place, even if drilling to the target depth is achievable. Horizontal
and highly inclined wells drilled through unconsolidated sand reservoirs have also been
known to have these same problems.
There is the argument that inefficient transport of small cuttings is the main factor for
excessive torque and drag during extended reach drilling. However, very little is known
about the transport behavior of small cuttings. Experimental observations (Parker, 1987;
Ahmed, 2001) show that small cuttings are more difficult to transport under certain
conditions. Ahmed (2001) also suggested that smaller particles tend to more easily stick to
drill pipe due to their cohesive effects. Above all, it is even more difficult to release the
pipe once it gets stuck by small sand‐sized cuttings. By measuring total annular cuttings
concentration, Parker (1987) observed that smaller cuttings are easier to transport in
vertical wells, but slightly harder to transport in highly inclined wells. This is consistent with
Larsen’s (1990) observation that at high hole inclination angles, smaller cuttings are harder
to clean out. These cuttings need a higher fluid velocity to keep continuous forward
movement.
25

Duan, Miska, Yu, Takach and Ahmed (2006) studied the transport of small cuttings in
extended reach drilling. Their study involved extensive experiments with three sizes of
cuttings in a bid to identify the main factors affecting small cuttings transport. The effects
of cuttings size, drill pipe rotation, fluid rheology, flow rate and hole inclination were also
investigated as part of the study. The results show significant differences in cuttings
transport based on cuttings size. Their study produced some very important conclusions
among which are:
1. In terms of cuttings concentration, smaller cuttings are more difficult to transport
than larger cuttings in the horizontal annulus when tested with water. However,
smaller cuttings are easier to transport than larger cuttings when 0.25 Ibm/bbl of
Polyanionic Cellulose (PAC) solutions were used.
2. Pipe rotation and fluid rheology are key factors affecting small cuttings transport.
Improvement by pipe rotation in the transport efficiency of small cuttings is up to
twice as large as the improvement in large cuttings transport. Compared with
water, PAC solutions significantly improve smaller cuttings transport, while the
transport of larger cuttings is only slightly enhanced.
3. Hole angle has only minor effects on cuttings concentration and bed height within
the range of 70 – 90 degrees from vertical.
26

Duan et al. (2006) concluded this study by recommending that drillpipe rotation combined
with polymeric drilling fluids should be used to efficiently transport small cuttings during
extended reach and horizontal drilling.
The factors that affect cuttings transport have been well described in the literature and
they include:
• Drilling fluid density
• Low shear rate rheology
• Flow rate
• Cutting size and concentration in the annulus
• Drill pipe size
• Rotary speed
• Shape of particles
• Drill string eccentricity in the wellbore
Studies have also been conducted to determine the critical transport fluid velocity
necessary to prevent cuttings bed formation (Larson, Pilehvari and Azar, 1993). However,
cuttings size is not the only factor that affects effective hole cleaning. Sifferman and Becker
(1990) noted that cuttings size in itself only has minor effects on hole cleaning, but its
influence on the effects of other parameters is noteworthy. In a later study, Bassal (1995)
found that the effects of cuttings size on cuttings concentration in a horizontal annulus are
quite dependent on other parameters. With low viscosity mud, smaller cuttings are harder
to transport than larger ones at all pipe rotary speeds and flow rates. However, with
high‐ viscosity mud, the tendency may reverse depending on different flow rates.
27

All the studies that have been conducted on cuttings transport have used different cuttings
sizes. Thus, the conclusions about the effects of cuttings sizes on cuttings transport are
quite varied and, in some cases, contradictory. The experiments upon which most of these
conclusions are based were conducted under separate and un‐equal conditions; therefore,
it cannot be unequivocally stated that smaller cuttings are harder or easier to transport
than larger ones. Any conclusion should thus represent a combination of various drilling
parameters before it can be regarded as definitive.
2.5 Rotary Steerable Drilling Systems
Before the advent of Rotary Steerable Drilling Systems, there were two major means of
directional drilling. The first method was the use of conventional rotary assemblies
designed to give predictable deviation in a certain direction. Typical examples of such
rotary assemblies are pendulum, packed hole and belly assemblies. The second is the use
of a downhole steerable motor. This requires the drillstring to slide along the hole, without
drillstring rotation, to control direction.
Variable‐gauge stabilizers have been used to fine tune control of hole inclination (Odell,
Payne and Cocking, 1995; Bruce, Bezant and Pinnock, 1996), with both of the above
methods, but they have not been known to control azimuth. Steerable rotary drilling gives
control of both inclination and azimuth and has a number of advantages over these
methods (Barr, Clegg and Russell, 1996). Rotary Steerable Systems enhance the
28

penetration rate and increase the reach of ERD wells. This boosts the efficiency and lowers
the overall cost of ERD operations. Using these systems, operators have been able to
optimize hole quality and wellbore placement, achieve faster rates of penetration, and
enhanced reservoir deliverability. Rotary steerable drilling systems were used on several
extended reach wells at the Wytch Farm (Colebrook, Peach, Allen, and Conran, 1998).
One of the biggest advantages of rotary drilling is in applying weight to the bit in extended
reach wells. As departure increases with respect to vertical depth, it becomes increasingly
difficult to apply weight to the bit and subsequently to control that weight, due to axial
friction (Cocking et al. 1997; Warren, 1997; Payne et al. 1994). Drillstring rotation has been
described as a virtual “cure all” for the general reduction of drag (Payne and Abbassian,
1996) and the application of weight to the bit (Modi et al, 1997; Ryan et al, 1995). Use of
rotary steerable systems allows the drilling parameters to be optimized for the bit and
formation. The reactive torque from the bit does not disturb the toolface and so both
weight on bit and rotary speed can be adjusted within wide limits.
It is a statement of fact that Extended Reach Drilling, using rotary steerable systems, has
made it possible to drill and produce hitherto impossible wells. Several very deep wells
would not have been possible to drill without rotary steerable systems because steering
beyond 8,500m was not possible as axial drags were too high to allow the oriented
steerable motor and bit to slide (Colebrook et al. 1998; Meader et al. 2000). In places like
Brazil and Nigeria where major oilfields are located in deep waters, ERD wells might be, in
29

some cases, the only economically viable drilling solution (Cunha, Martins and Fernandez,
2000).
Ikeda et al. (1996) initiated a study that investigated developments, activities, and
philosophies of the larger oil and gas industry in implementing horizontal well and
extended reach technologies. North American and European operators, contractors,
service companies, government agencies and educational institutions were directly
interviewed. Along with the development of data resources, references and industry well
information, significant findings and revelations were reported. Among the many findings
from the investigation is the fact that many operators are now steering their wells with
MWD and LWD tools. According to the report, operators noted that steering a well has
been the best way to maximize pay zone penetration. The report also showed that the
most common failures seen by most operators have been in motor and MWD failures,
which causes downtime. Rotor and stator problems were commonly discussed for motor
failure along with other components, and it was generally agreed that the failure rate for
MWD increased with:
o Increase in temperature
o Increase in pressure
o Rapid temperature increase or severe pressure changes
o Smaller hole size
o Longer hole length
30

In underbalanced drilling situations, motor and MWD problems appeared to be higher.
Operators also pointed out that the biggest improvements over the last couple of years
have been made in MWD and motors, even though they may still contribute to downtime.
Operators cautioned that the limiting boundary for MWD pulsing signals is not currently
well defined by the vendor companies, and they also noted the fact that BHA steering
capabilities are reduced as trajectory increases.
All of the factors indicated above lead to the conclusion that a much‐improved overall ROP
will be achieved while drilling with a rotary steerable drilling assembly than with a
steerable motor. Indeed in certain extended reach or overbalanced drilling applications,
rotary drilling is essential.
2.6 Concluding Remarks from Literature Review
Because long‐term profitability is a primary concern of the oil and gas industry, major
efforts are under way to optimize drilling procedures to make operations more cost
effective. All phases of drilling are being subjected to economic analysis and, now
emerging, is the possibility of obtaining substantial savings by upgrading conventional
directional drilling techniques into advanced procedures for drilling high‐angle, extended‐
reach and designer wells. Such a capability offers a variety of applications with the
potential for significant reductions in cost.
31

Advances in drilling technology now enable the exploration for and development of
offshore oil and gas resources without the installation of facilities and wells in offshore
marine environments. Nowadays, more operators are identifying applications of ERD for
reservoir development that will provide substantial financial benefit. In Alaska, a number
of North Slope fields extend offshore and/or away from existing drill sites and reserves.
These will warrant ERD operations. ExxonMobil and the California State Lands Commission
both endorse ERD development of the South Ellwood Offshore Field using ERD from
onshore sites (Starzer, Mount and Voskanian, 1994). BP is also considering ERD for its
Liberty Project in Alaska. In the Gulf of Mexico, China, South America, the North Sea,
Indonesia, the Middle East and elsewhere, many other ERD opportunities are being
evaluated to optimize development drilling of new major projects (Payne, Wilton and
Ramos, 1995).
This study will take extended reach drilling improvement one step further by integrating all
the critical technologies for success of extended reach drilling into a single model. The
model will design the program most suitable to drill an extended reach well.
32

Chapter Three
Critical Technologies for Success of Extended Reach Wells
The literature has shown that extended reach exploration and development drilling usually
involves some significant issues that can pose significant challenges for the operator. As
has been mentioned severally, technologies that have been found to be vital to the success
of ERD include:
• Well Trajectory Design
• Torque and Drag
• Drillstring Design
• Wellbore Stability
• Hydraulics and Hole Cleaning
• Casing design
• Drilling Dynamics
• Rig Sizing and Selection
• Narrow Mud Weight/Fracture Gradient Window
• Equivalent Circulation Density (ECD) Management
• Lost Circulation
• Lubricity
The following sections will individually and collectively analyze these success factors with a
view to understanding the science and technology behind them. However, before this is
done, it is vital to first discuss the difference between the effects these issues have on
extended reach wells, as compared to conventional wells.
33

3.1 What is Different about Extended Reach Drilling?
There are numerous issues that are different, or more critical for ERD wells when
compared to conventional directional wells. In some cases, the challenges on ERD wells are
the same as those of conventional directional wells, only that in extended reach wells, they
are magnified. In other cases, the issues are specific to the type of ERD well that is being
drilled (K & M Technologies, 2003). There are both general and specific differences in
challenges between ERD and conventional directional wells. Some of the general
differences are outlined hereunder.
3.1.1 Torque, Drag and Bucking
These factors are regularly encountered in ERD wells during both drilling and completion
phases. Torque is generally only a significant limiting factor on long ERD wells or on slim‐
hole ERD wells where small diameter drill pipe is used. It is common to rotate casing liners
strings on ERD wells to ensure that a good cement job is obtained. This is often the critical
torque limitation (K & M Technologies, 2003). In ER wells, torque limits can be reached in a
number of ways including:
• Top drive or rotary table output
• Drill pipe tool joints
• Casing connections
• Combined power usage
34

Axial drag occurs due to the interaction of the drill pipe or casing with the wellbore as it is
run in (slack‐off) or picked up (pick‐up) out of hole (K & M Technologies, 2003). In ER wells,
slack‐off and pick‐up become problems as the well gets deeper and as inclination
increases.
Buckling of drill pipe and casing results from excessive compression loads that build up in
the string due to axial friction. Drill string and completion string buckling are common
problems in ERD wells. This is because, as the length of high angle sections becomes
longer, unconstrained pipe tends to bend in the wellbore. As this situation becomes more
severe, a helix will develop and eventually prevents the pipe from moving within the hole.
3.1.2 Hole Cleaning
Field experience has demonstrated that hole cleaning practices used for vertical or low
angle wells are generally not successful in high angle ERD wells. A thorough understanding
of the dynamics of hole cleaning is therefore critical to the success of ERD wells.
3.1.3 Equivalent Circulation Densities
Extended reach wells generally have higher equivalent circulation density fluctuations than
conventional wells. With the advent of Measurement While Drilling (MWD) based Pressure
While Drilling (PWD) technology, the industry’s understanding of ECD’s has been
challenged (K & M Technologies, 2003). Studies have shown that the magnitude of ECD
35

fluctuations in ERD wells is far greater than previously thought. According to findings by
K & M Technologies, ECD’s are more serious in ERD wells because:
i. The magnitudes of the fluctuations are worse due to longer measured depth (MD)
relative to true vertical depth (TVD).
ii. Wellbore stability, lost circulation and other key effects are generally more severe
and less tolerable in these wells.
iii. Temperature and pressure variations (and their effects on mud properties) are also
more extreme in these wells.
3.1.4 Rig Capability and Power Requirements
Extended reach wells challenge the capabilities of the drilling rig more than a conventional
directional well of the same measured depth – except for pick‐up loads (K & M
Technologies, 2003). The need to use continuous higher flow rates at higher pressures, use
of higher pipe RPM and higher torque and drag forces will also continuously task a rig’s
output capability. Also, power may be limited, especially in a backreaming scenario where
pick‐up, torque and pumps are all operating at/or near their limit. The combined power
usage when deep on a long ERD well may thus become an issue because it is often at this
point that maximum output levels are required from the mud pump, drawworks and the
rotary system. Many of the industry’s rigs that are being utilized for conventional
directional drilling do not have the capability to meet these combined output
requirements.
36

3.1.5 Wellbore Instability, Differential Sticking and Stuck Pipe
Wellbore instability is usually more critical in ERD wells due to:
o The increased wellbore angle
o Increased hole exposure time
o Increased ECD fluctuations and effects
Differential Sticking is also a significant problem in ERD wells because:
o Mud weight is often higher in ERD wells (for wellbore stability at high angles)
o The exposed reservoir intervals are longer in length
o The exposed reservoir intervals are open for a longer period of time
o The drill string and BHA will be on the low side of the hole and at least partially
buried in cuttings throughout the reservoir section
Differential sticking is even more important for wells where torque, drag, or buckling
problems exist, since even minor differential sticking increases friction. Furthermore, the
ability to jar or work the pipe free is reduced on ERD wells. This is as a result of the reduced
ability to get weight or torsion down the BHA.
37

3.1.6 Well Control
This is generally more challenging in ERD wells because kicks are often more difficult to
detect and measure as a result of the geometries of the wells. Not only is kick detection
more difficult in ERD wells, the ability to manage and “kill the well control problem” are
even more difficult as a result of the flow mechanics.
Other issues that have been reported to be, not only different, but more crucial for ERD
wells than for conventional directional wells include: Survey Accuracy and Target
Definition, Logistics, Time and Cost, HSE Issues, and Well Planning. Having established the
differences in the challenges faced in conventional directional wells as compared to
extended reach wells, the following sections will examine the parameters that have the
greatest significance in the success or failure of an ERD project.
3.2 Well Planning and Trajectory Design
As is the case with all drilling operations, detailed engineering preplanning is of critical
importance in successfully drilling ERD wells. To successfully drill an ER well, it is crucial to
be able to accurately predict the following parameters under actual downhole conditions:
1. Static and Dynamic Temperature Profile in the Well
2. Hydraulic Pressures
3. Annular Pressure Loss
4. Equivalent Circulation Density
5. Mud Rheology
38

The operational requirements to drill extreme reach wells start with extensive planning.
Well planning is usually an iterative process to determine the optimal balance among
wellpath, fluid and hydraulic requirements, drillstring design, torque & drag analysis, casing
setting depth etc. The iterative process not only covers the wellpath design, but also the
operations planning as well. The well design has a large impact on the operation and
planning of ER wells and since there are many variables in designing a well, such as Kick off
Point (KOP), Dogleg Severity (DLS), Departure, etc., it becomes an iterative process aimed
at yielding an optimal design which should result in the simplest path while still achieving
all geological targets.
In other to achieve an optimum well path, several factors have to be considered and put
into perspective. Based on reported industry experience gained from earlier wells, and
confirmed during the drilling of more recent wells, the following aspects are considered to
be key factors in well planning:
Well Trajectory
Build Rate
Surveying and Target Sizing
3.2.1 Well Trajectory Design To determine the optimum well trajectory that will achieve directional objectives, the most
critical operations or wellbore characteristics, which are the limiting factors have to be
identified. There are several approaches to trajectory design to achieve long reaches with
the fewest possible limitations on other downhole operations. Table 3.1 is a general
39

comparison of the major options while Figure 3.1 is a representation of the various
trajectory profiles.
Table 3.1: Well Trajectory Options, Advantages and Disadvantages
Option Advantages Disadvantages
Multiple Build Profile: Rate of build increases with depth in several discrete steps to tangent angle, hold constant tangent angle
Very long reach, low torque/drag values, low casing wear
High tangent angle
Build and Hold: Constant build rate to tangent angle, hold constant tangent angle
Simple, long reaches achievable, low tangent angle
Potentially high contact force in build (torque, casing wear)
Double Build: Build‐hold‐build‐hold trajectory, can use two different BURs in the build sections
Very long reaches possible with low contact forces in upper build
May require deep steering, High second tangent angle
Under‐Section: Build and hold with deep KOP
Reducing hanging weight below build section, reduces contact force in build
High tangent angle, shorter reach
Inverted: Tangent angle above horizontal so the wellbore enters the reservoir from underneath
Flexibility for multiple targets, avoids gas cap
Higher axial (buckling) loads to push string uphill, deep steering required
3‐D: Any of the above with significant azimuth changes
Flexibility to handle anti‐collision and multiple target requirements
More curvature means more torque and drag, deep steering may be required, shorter reach
Source: BP Extended Reach Drilling Guidelines, 1996
40

Figure 3.1: Well Trajectory Profiles
3.2.2 Catenary Well Design
Another wellbore profile, which is frequently discussed, is the catenary well design that
was first proposed and patented by Dailey Petroleum Services. In a catenary profile, the
rate of inclination build continuously increases with depth to mimic the shape of a hanging
cable. This design starts with a low build up rate (say 0.5o – 1.0o /100ft), and accelerates to
higher build rates as the angle increases (say up to 4o – 5o /100ft). Theoretically, a catenary
produces very low torque and drag as a result of low contact forces between the string and
the wall of the hole. However, catenaries have not been widely used since creating the
41

catenary shape is impractical and cost‐prohibitive even with the most modern BHA
configurations. One of the downsides of the catenary design is that it considerably
increases both the tangent angle and the overall total depth. This increased angle may
also make wellbore stability more difficult to manage, which in turn can create hole
cleaning problems.
In choosing among these options, a useful concept to keep in mind is the Critical Tangent
Angle. This angle represents the limit beyond which a tool will not slide downhole under its
own weight, meaning that it will have to be pushed from above. The Critical Tangent Angle
is mathematically represented by:
q Cos α = μ q Sin α
Tan α = μ1 (3.1)
Where:
q = Pipe buoyant weight,
μ = Friction factor
α = Critical tangent inclination angle
One approach to optimizing the trajectory is to try to position the Kick off Point (KOP) so
that the tangent inclination equals the critical angle. If possible given other constraints, this
will allow long reaches with reduced sliding problems.
42

3.3 Build Rate
An extended reach well needs optimum well design with respect to torque and drag and
wellbore stability. Utilizing a low build rate is considered to be very important both for
torque and drag at TD, and for wellbore stability in the upper part of the well. Due to its
impact on casing wear and torque and drag, build rate can be viewed as the most
important consideration when designing an extended reach well profile. When compared
to a path having a single build rate, a combination of build rates usually offers a
compromise. A review of record extended reach wells shows that most of the wells began
with a low build rate, then gradually stepping up to a maximum of 1.5°/100 ft. However, in
situations where the TVD of the target is shallow, a single more aggressive build rate may
be the better option. For extended reach wellpath, the industry is gradually moving
toward a catenary design where very low build rates are used and sail angles are at higher
angles as a general trend.
3.3.1 Effect of Build Rate
Build rate may have a marginal effect on torque and drag levels for very high ratio wells.
This is due to the increasing percentage of string weight supported on the low side of the
hole resulting in lower tensile forces at surface. However contact forces may be sufficient
to promote unacceptable casing wear at the higher build rates, especially when well
operations such as extended backreaming are anticipated due to poor primary hole
cleaning. As a guideline, build rates in excess of 2.5o /30m may cause concern with respect
to high contact forces. If higher build rates than this are planned, the difficulty of achieving
43

a smooth build also has to be considered where an increasing percentage of the build will
be performed while sliding and not rotating the assembly. Some other important things to
note about build rate are:
a) High Reach/TVD ratio wells may tolerate high BUR because the string tension in the
curve is low and may even be in mechanical compression.
b) Low Reach/TVD ratio wells do not tolerate high BUR since drill string tension in the
curve is higher.
c) High build rates can cause casing wear problems, especially in high Reach/TVD ratio
wells where there may be high tensile loads through the build section during trips
out of the hole and backreaming.
d) Low BURs result in lower contact forces. This typically means lower casing wear.
e) Low tortuosity is also achievable with low BURs. It tends to be more difficult to
maintain low tortuosity with a high BUR.
f) Generally, with lower build rate, more can be achieved while rotating the assembly
and thus the chances of achieving the desired smooth build will be greatest.
3.4 Hole Sizing and Selection
The majority of ERD wells drilled around the world use a combination of 17½”, 12 ¼”, and
8½” hole sizes (K & M Technologies, 2003). According to K & M Technologies, the reasons
44

for this include the availability of tools and equipment, ability to drill smaller hole sizes,
and simply the depth of experience in these sizes.
However, there are some benefits associated with two‐string well designs and 97/8” hole in
particular. In ERD applications where two casings strings can be reliably used to TD,
consideration may be given to using 13½” and 97/8” hole sizes (as an alternative to the
traditional 17½” x 12 ¼” x 8½” design). The smaller hole sizes require less flow rate to
keep them clean, or they can be cleaned faster with the same flow rate, thereby allowing
for faster penetration rates (97/8” hole has 50% less volume than 12¼” hole). Where
stability is a primary consideration, the smaller hole sizes are also inherently more stable.
The downside of this strategy however, is its inability to affect pipe movement during the
cement job and therefore, limiting the probability for successful zonal isolation. It has
therefore been suggested that when designing an ERD well, “standard” hole sizes that have
been used in the past should not just be automatically selected. This is because, there may
be advantages that might be gained by evaluating different hole sizes and combinations.
3.5 Torque and Drag
3.5.1 Torque
Torque is a rotational force and it can be described as the ability to overcome resistance to
rotation. Its magnitude is measured by multiplying the perpendicular component of the
force applied by the distance between the axis of rotation and the point where the force is
45

applied. In drilling applications this distance would of course be the drill pipe radius. As
depicted by Figure 3.2 below, torque is mathematically represented as:
Torque = Force x Distance
Where: d = Drill pipe OD
Figure 3.2: Diagrammatic Representation of Torque Generating Forces
Torque can also be regarded as a force that produces torsion or rotation. It is generated by
power equipment from surface, as well as by friction working against the pipe rotation.
Drillstring torque is the force required to rotate the pipe. (Unit: Nm (metric), ft‐lbs
(imperial) 1ft‐lbs=1.3558Nm). Figure 3.2 is a representation of the forces responsible for
creating torque.
46

Opposing Force Due to Friction = µM
Figure 3.3: Frictional and Surface‐ acting forces
Rotational Force = M
In drilling operations, the torque at the surface is given by:
TQ @ Surface = TQ @ Bit + TQ along the well bore + Mechanical TQ
Where:
TQ @ Bit or bit torque = the productive component of the torque and it depends on bit
aggressiveness, WOB and bit diameter.
TQ bit = WOB * Bit Diameter * Bit Aggressiveness
TQ along the well bore or frictional string torque = the result of the interaction between
the drill string and the bore hole wall. It increases with increased torsional friction losses as
the drilling progresses and this is a function of friction factor and side forces (axial load,
well profile ...etc.). Mechanical Torque = is generated by cutting beds, stabilizer effects,
liner centralizer etc and is difficult to quantify.
47

Depending on well design and drilling operation, the torque will develop in different ways
along the wellbore. Analysis and projections of torque should recognize that total surface
torque is comprised of:
Total Surface Torque = String torque + Bit torque + Mechanical torque + Dynamic torque
Clearly, separating these torque components allows more accurate definition of friction for
torque projections and for prioritizing measures for torque management. With techniques
available for predicting bit torque, the implications of using different bit types can be
assessed.
3.5.2 Drag Drag is a resistance force to the motion of an object and it acts in the opposite direction of
its axial movement. It is as a force that resists motion along a straight path. In drilling
operations, drag results from contact between drill string components and bore hole wall
or casing as the string moves up or down. It is generated by friction of drill pipe against
hole wall or against inside of casing. Drag will always operate in the opposite direction to
that in which the drill string is being moved. Drag is experienced as an extra load over the
rotating string weight when tripping out of the hole. Unit N (metric), lbsf (imperial) 1 lbsf
= 0.4448 N.
It accumulates mainly when picking up, slacking off or during oriented drilling with motor.
It increases with increased hole inclination and curvature due to the gravity effect and
compression pushing the drill string against the low side of the bore hole and due to drill
48

string tension pulling up the drillstring to the high side of the hole. Drag is the incremental
force required to move the pipe up or down in the hole. Figures 3.3 and 3.4 shows the
forces responsible for causing drag:
Forces to lift drill string = F Opposing Force Due
to Friction = Drag
Figure 3.4: Drill String Opposing Forces
49

Pick Up Force = Drag + Axial Force
Figure 3.5: Drag and Pick‐Up Forces
Drag = Side Force x Friction Factor
Drag while drilling a well is a result of a combination of several factors like wellpath design,
drilling fluid properties (lubricity), wellbore quality, tortuosity, formation type and drill
string buckling.
3.5.3 Friction Forces
The key features of ERD are that horizontal departure is long and inclination is high. These
typically gives rise to considerable torque and drag for drill‐string and casing string, thus
making torque and drag a major limitation for horizontal reach in ERD. This also makes the
effective transmission of drill string weight and rotation to the Bottom Hole Assembly
(BHA), major considerations in the planning of ER wells.
50

A puzzle that still remains un‐answered in extended reach drilling is: What makes high ratio
ERD wells so difficult to drill? The answer, according to Williams (2008) is friction and how
best to overcome it.
Friction is a function of both torque and drag. From the definitions above it can be seen
that torque is the rotational element while drag is the axial element. Torque losses are of
prime importance while drilling, and drag losses are more important while tripping and
running casing strings. In other words: Axial Friction (Drag) acts along the length of the
pipe body (longitudinal axis) in the opposite direction to the direction of pipe travel (POOH,
RIH) while Torsional Friction (Torque) acts along the circumference of the pipe body
opposite to the direction of rotation.
While there are a myriad of challenges in ERD, minimizing torque and drag while drilling,
running casing, and during completions continue to be one of the greatest challenges. As
the length and percentage of any well at high angle increases, friction also increases due to
the increased contact area between any string (drilling or casing) and the wellbore wall.
This is further compounded by the mass of this string at high angle. The meaning and
implication of this is that, when running drillstring in and out of the hole, we get to a point
where enough weight (push) from surface cannot be exerted to move the string. The
conventional approach to solving this problem is to rotate so as to reduce drag. While this
temporarily solves the problem, as drilling progresses, we will reach another point where
enough torque cannot be generated at the surface to turn the string. There is therefore,
51

the need to come up with techniques to reduce torque and drag if we want to reduce
downtime and successfully drill ER wells.
3.5.4 Influence of Friction Factor Friction Factor (FF) also known as friction coefficient, expresses the relationship between
the forces needed to overcome frictional force and the normal force of the element. It is
defined by the interaction between two materials. Since torque and drag can be the
limiting design parameters, the optimum trajectory design depends heavily on our
representation of wellbore friction. We use cased hole and open hole friction factors in our
torque and drag studies, but they are not necessarily reflective of the coefficients of sliding
friction one might measure in a lab. Friction factors should thus be calculated from field
torque and drag data which depend upon a number of conditions including:
o Mud composition
o Hole cleaning (cuttings beds) and cutting type
o Operational procedures and type of operation (e.g. sliding or rotating)
o Wellbore tortuosity
o Formation type
There are several issues that affect friction factor. They include:
• Drill sting interaction with casing or with open hole.
• Type of Drilling Fluid (WBM, OBM, Foam, Air)
• Mud rheology and properties, which might change while drilling particularly in
HTHP applications.
52

By the same token, there are some issues that do not affect Friction Factor. They include:
• Drilling mode (Whether Rotating or Sliding)
• The load applied
It should be noted that Torque and Drag predictions are only as good as the friction factors
applied. Thus, it is recommended that each drilling project at the very beginning establish a
database of local casing and open hole friction factors for the mud type used. Standard
default friction factors have been derived (using commercially available software packages)
from analyses of well data covering normal drilling operations in a range of wells.
3.5.5 Torque and Drag Reduction Methods
There are many ways to reduce torque and drag. Optimization of the well profile is one.
We should select well trajectory that makes torque and drag values as low as possible.
Mud additives and drillstring tools can also be used to reduce torque and drag.
Construction of higher specification rigs capable of generating enough weight and torque
to run strings in and out of the hole and also to rotate the pipe is another torque reduction
method.
Based on field experience and end of well reports from several ERD projects, the following
has been recommended for reducing torque and drag:
53

To reduce Torque:
• Use of a lighter BHA, and reduce the number of HWDP and DC's. Make sure there is
enough WOB available,
• Use a mud system with lower friction factor (semi oil based or oil based),
• Use Non‐Rotating Drill Pipe Protectors (NRDPP) for cased‐hole torque reduction or
bearing sub for open‐hole torque reduction,
• Redesign the well when possible and consider designer wells with catenary curve
build sections (gradual increase in curvature).
To reduce Drag:
• Optimize well trajectory and drill string design
• In horizontal wells use HWDP/DC near the vertical section.
• Use rotary steerable systems
• Use high power motors to increase stalling resistance
• Consider casing flotation.
Mechanical and chemical friction reducers are used by operators to reduce torque and
drag. Rubber element and plastic casing protectors have also been reported to be
successful in reducing torque. Several operators have reported torque reductions of over
25% by using non‐rotating drillpipe protectors. Other torque reduction strategies that have
been mentioned by operators include torque reduction subs, beads, and downhole tractor
systems.
54

Non‐Rotating Drill Pipe Protectors have also been used to reduce casing wear. Although
there is a significant torque reduction with these tools, there is also an increase in drag.
When the drillpipe protectors are used, there must be a compromise based on expected
requirements for rotary or oriented drilling.
Torque and Drag values will increase with the well length up to the point where a rig
equipment upgrade will be required. New techniques will also be required. For example,
running the 95/8” casing in flotation will be necessary beyond a given departure and sailing
angle, where all available weight is absorbed by the drag.
3.6 Equivalent Circulation Density Management
For easy comparison to critical mud density limits, the annulus pressure is often
transformed into a virtual density value called Equivalent Circulating Density (ECD). ECD
can be defined as the additional “mud weight” seen by the hole, due to the circulating
pressure losses of the fluid in the annulus.
ECD is the density a static fluid needs to have in order to create the same pressure the
actual fluid creates while circulating in the annulus at a certain depth. It takes into account
the influence of pressure losses of the fluid flowing up the annulus as well as changes of
the fluid’s average density due to the cuttings load in the annulus.
55

Equivalent Circulation Density can be calculated as follows:
ECD = MW (ppg) + )(*052.0
)(ftTVD
psiPA (3.2)
Where: ECD = Equivalent Circulating Density [ppg]
MW = Mud Weight [ppg]
PA = Measured Annulus Pressure [Psi]
TVD = True Vertical Depth [ft]
The principal variable in this equation is annulus pressure loss. This is affected by the
following factors:
• Drill pipe configuration
• Mud weight
• Mud rheology
• Flow rate
• String RPM
• Hole cleaning efficiency
• Trip speed
• Annular Clearance
During drilling, the mud‐column pressure has to be controlled and regulated. We do this by
comparing it (i.e. the mud‐column pressure) to the:
• Pore Pressure Gradient (PPG)
• Formation Break Gradient (FBG)
• Fracture Pressure Gradient (FPG)
56

We need to control the mud‐column pressure because:
1. We do not want pore fluids to enter the borehole
2. We do not want to fracture the formation
The ECD is used to analyze the relationship of the downhole pressure to the pore pressure
and the fracture pressure and has to be looked at in connection with pore and fracture
pressure gradients. It needs to be inside the “window” created by the difference between
pore and the fracture pressure gradient. If the ECD is lower than the pore pressure
gradient, the well is prone to well control problems. If it is higher than the fracture
pressure gradient, the well is prone to hole stability problems.
A critical ECD issue to look out for when drilling deviated wells is the casing shoe ECD,
which is the pressure at the casing shoe. As previously noted, this is because the formation
pressure and the pore pressure are a function of the TVD and the pressure drop
contributing to the ECD is a function of the measured depth. This is explained in Figure 3.5.
57

Figure 3.6: Casing Shoe ECD Determination
From Figure 3.5, we can see that solving one problem by creating “low” pressure at the bit
will create another problem. We will be in danger of creating a critical low pressure at the
casing shoe as the pressure drop over this long distance (ΔL2) is bigger than the change in
formation pressure over this vertical depth (TVD –ΔL1). From the above, it can be seen that
over a relatively small vertical depth change, i.e. a small formation pressure change, there
is a big ECD change. This could lead to a collapsing hole or incoming pore fluids. The risk of
this happening is most relevant at the casing shoe, since the ECD (mud pressure) is at its
lowest there without being protected by the casing.
58

Some other important facts to note about ECD are:
1. If pipe OD and wellbore ID do not change and inclination is zero, ECD is constant.
2. The ECD increases in the openhole, where the annular clearance is less than in the
casing. If the well is vertical and infinitely long, the ECD will reach a constant value
again.
3. If the wellbore ID does not change, but the drillstring contains drill collars with large
OD, the ECD increases.
4. If the wellbore opens up, or if the drillstring changes to smaller ID’s, the ECD will
decrease.
5. ECD increases with increasing inclination. This is due to the fact that the annular
pressure drop is a function of measured depth while ECD is a function of TVD.
6. In a vertical well, if Pressure Gradient is constant, the ECD will be constant as well.
7. If the openhole has larger ID than the Casing above, the total annular pressure drop
is less, compared to a conventionally drilled well. Therefore, the ECD is also less.
3.6.1 Effects of ECD
ECDs are generally a more significant issue in ERD wells than for conventional wells. This is
as a result of their long measured depth intervals relative to the vertical depths. Also, ERD
wells are generally shallow in nature. This makes them particularly prone to ECD problems
as their formations are often so shallow as to have very little integrity. Other reasons
include the fact that extended reach wells generally use larger diameter drill pipe to
59

combat hydraulics or buckling problems; they require more aggressive parameters (flow
rate and rpm) for hole cleaning; and they have longer exposure times with long intervals.
Some of the effects of ECDs are:
i. High ECDs increase the risk of lost circulation, especially while (a) drilling the 8½” or
smaller diameter hole size, or (b) while running or circulating long casing strings.
Also, if ECDs are not minimized, it could lead to reservoir damage.
ii. The constant flexing and relaxing of the wellbore when the pumps are turned on
and off can lead to wellbore instability. This is particularly true if the formation is
brittle.
iii. Casing collapse can be initiated by ECDs while running buoyancy assisted casing
strings on long deep ERD wells.
3.6.2 ECD Management and Control
Reducing flow rate is generally the first option if ECD becomes an issue while drilling an
extended reach well. It is important that any reduction in flow rate is within the hole
cleaning limitations of the drilling system. The minimum allowable flow rate is dependent
on many factors including mud rheology, RPM, slide frequency, hole size, ROP, and other
practices. As was mentioned earlier, pipe rotation also affects ECDs especially in the 8½”
hole or smaller. As with flow rate above, reducing pipe RPM is also an option to lower
ECDs.
60

3.7 Drilling Hydraulics and Hole Cleaning
Hydraulics calculations are generally carried out to estimate the required rig pumps
capacity to drill the objective well. The drilling hydraulic system is a function of the drilling
fluid characteristics and its ability to deliver efficient drilling and ensure wellbore integrity
and stability. Therefore the required pump pressure must be capable of providing the flow
rate needed to transport the cuttings up and out of the wellbore, as well as overcoming
the accumulated pressure losses associated with the surface equipment, the drill string,
the bit and the annulus.
The hydraulics applications and analyses are based on drilling fluid behavior. This behavior
is governed by rheology and hydraulics studies, which interrelate between each other.
Rheology is the study of how matter (substance) deforms and flows while Hydraulics
describes how fluid flow creates and uses pressures.
Aside from ECD Management, other critical drilling fluid success factors in the planning and
construction of extended reach wells include:
• Borehole Stabilization
• Hole Cleaning
• Lubricity
61

The selection process for ERD drilling fluids must consider a number of critical factors. The
fluid must:
a) Provide a stable wellbore for drilling long open hole intervals at high angles.
b) Maximize lubricity to reduce toque and drag
c) Develop proper rheology for effective cuttings transport
d) Minimize the potential for problems such as differential sticking and lost circulation
e) Minimize formation damage of the production intervals
3.7.1 Fundamentals of Hole Cleaning
Hole angle determines the mechanisms for cutting removal. Figure 3.6 is an angular
depiction of a typical extended reach well trajectory.
Figure 3.7: Angular Depiction of Extended Reach Well Trajectory
62

In deviated wells, cuttings tend to settle on the low side wall and form cuttings beds. These
cuttings are often transported along the low side of the hole either as a continuous moving
bed or in separated beds/dunes.
Hole cleaning can be divided into three categories based on the wellbore inclination. Figure
3.7 below shows the movement of cuttings in the various angular regions of the wellbore.
From the figure, it is obvious that the cuttings transport, and by extension the hole
cleaning strategy, will be different for each inclination range.
Figure 3.8: Cuttings Transport at Different Inclinations
63

Based on the following references [Azar and Okrajni, SPE 14178; Clark and Bickham, SPE
28306; Saasen and Loklingholm, SPE 74558], the cuttings characteristics of the various
inclination angles can be given as:
0 – 35deg: Cuttings do not form
35 – 45deg: Cuttings bed start to form
45 – 65deg: Avalanching starts
y 65 – 90deg: Stable beds
Near vertical Wells (0 – 350): Cutting Beds do not form in this hole section. This is because
transport velocity is greater than slip velocity, thus the cuttings are effectively carried in
suspension. The annular fluid velocity acts to overcome the cuttings settling force and
there is a net upward movement of the cuttings. Hole cleaning is simply provided by the
viscosity and flowrate of the drilling fluid. When the pumps are turned off, cuttings are
suspended by the viscous drilling fluid, although some settling will occur with time.
Intermediate Angles (35 – 650): In this section, there is unstable, moving cuttings bed. This
is because transport is via lifting mechanism. In this inclination range, cuttings begin to
form “dunes”, as the distance for them to fall to the bottom is now very minimal. The
cuttings move up the hole mostly on the low side, but can be easily stirred up in the flow
regime. The most notable feature of this inclination range is that when the pumps are
shut‐off, the “dunes” will begin to slide (or avalanche) downhole. This significantly changes
the hole cleaning strategy with respect to the vertical well scenario. Typically most
64

problems associated with hole cleaning in deviated wells occur in this section. This is
because; it is the region where gravity effects can cause cuttings beds to slump down the
hole.
High Angles (greater than 650): Stationary cuttings bed form instantaneously in this region.
This is because transport is via a rolling mechanism. This presents a different set of
operational circumstances. Here, cuttings will fall to the low side of the hole and form a
long, continuous cuttings bed. All of the drilling fluid will move above the drillpipe, and
mechanical agitation is required to move the cuttings, regardless of the flowrate or
viscosity of the mud.
To a reasonable extent, hole cleaning operation can be remedied by a good combination
of:
1. Appropriate Mud Properties
2. Optimized well profile
3. Standard drilling practices procedures.
However, continuous ECD measurement remains the best method to monitor hole‐
cleaning and minimize lost circulation problems or stuck pipe.
3.7.2 Factors Affecting Hole Cleaning
Perhaps the single most important aspect of ERD well planning is ensuring that the rig’s
pumps, solids control equipment, drillstring components and selected mud system are
65

adequate to keep the hole clean. Hole cleaning is one of the most crucial areas in
successfully drilling an ERD well. The parameters which affect hole cleaning more than any
other (Payne et al, 1994); (Eck‐Olsen et al, 1994) are:
o Flow Rate Determines transport and annular velocity
o Hole Angle Determines mechanism of removal
o Fluid rheology and flow regime
o Mud Density
o Rate of penetration
o Drill pipe rotation
o Geometry
o Eccentricity
o Cuttings Size
o Cuttings Shape
o Cuttings Density
o Formation
3.7.3 Consequences of Poor Hole Cleaning
Cuttings generated while drilling needs to be removed from the hole and transported
through the annulus to the surface. A poorly cleaned hole will lead to a buildup of cutting
beds and a reduction in the annulus area. This may result in many drilling problems such
as:
i. Formation of a stationary cuttings bed
ii. Reduction in rate of penetration
66

iii. High Torque and Drag and Excessive Over‐pull
iv. Difficulty in running casing
v. Fracturing of the formation
vi. Stuck pipe or stabilizer hanging
vii. Mud loss during cement jobs
viii. Increased costs
ix. Possible loss of hole
x. Increase in ECD causing wellbore instability issues
3.7.4 The Clean Hole Concept: What is a Clean Hole?
Every high angle wellbore will certainly have cuttings bed of some thickness and
distribution. Cuttings beds will form in the high angle wellbores, regardless of how the hole
cleaning practices are carried out. From Figure 3.7, it is obvious that the method of cuttings
removal is a function of how the cuttings are distributed in the hole. However, a wellbore
does not have to be 100% clean (or free of cuttings) before is will be considered “clean”.
K & M Technologies defines a “Clean Hole” as: “A wellbore with a cuttings bed height and
distribution such that operations are trouble free”.
It should be noted that a cuttings bed that is “clean” for drilling may not necessarily be the
same as that for tripping a BHA or casing. This is mainly due to the differences in the
67

annular clearance seen in these various operations and also the ability to trip the pipe
through the cuttings bed.
3.7.5 Hole Cleaning Mechanism
There are two main mechanisms for hole cleaning. These are:
• Dispersion
• Mechanical Removal
Dispersion effectively “dissolves” cuttings into the mud, which allows them to be easily
removed from the hole. In general, dispersion only applies in large diameter hole sections
that are drilled with low cost water‐based‐mud.
With mechanical removal, many different parameters work together to clean the hole.
However, by far, the two most important parameters are rotation and flow rate. Rotation
controls the hole cleaning efficiency, while flow rate controls the hole cleaning rate.
Drill Pipe Rotation Rotation is the key parameter in hole cleaning efficiency for the high angle sections, where
the drill pipe and drill cuttings will lie on the low side of the hole. Under these conditions,
movement of the drill pipe (rotation and/or reciprocation) will mechanically disturb
cuttings beds and assist in cleaning the hole. Rotation is more effective since this helps
68

equalize fluid velocities on the low and high side of the hole. The influence of drill pipe
rotation is more pronounced in viscous muds and in smaller holes (less than 17½”). In cases
where the pipe is not rotated (e.g. slide drilling), cuttings beds are more difficult to
remove. Under these special circumstances, increased flow rate or changes in operation
practices may be necessary to improve hole cleaning.
The rotary speed used is also critical for effective hole cleaning. According to K & M
Technologies, there are at least two distinct hurdle rotary speeds at which step
improvements in cuttings return will occur in high angle wellbore. These occur at 100 – 120
RPM and at 150 – 180 RPM. They claim that these speeds have proven to be quite
consistent for different hole sizes and mud types. However, some operators like Baker
Hughes‐INTEQ have a problem with this practice because it essentially ignores the
increased wear, the effects of the vibrations it creates on downhole equipment, as well as
the increased possibility of tool failures and subsequent trips. Baker Hughes‐INTEQ thus
propound that higher RPM may not be necessary to effectively clean the hole. This has
been partly corroborated by other operators as available information shows that several
operators have experimented with rotary speeds of up to 220 RPM. While some benefits
were recorded for RPMs greater than 120, very little benefits were recorded at RPMs over
180.
69

Mud Flow Rate
The mud flow rate is the most important factor for hole cleaning in deviated wells. Simply
put, the faster you pump, the faster you move cuttings out of the hole when coupled with
ample rotary speed. Thus, mud pumps and liner sizes should be selected to ensure a
sufficiently high flow rate when drilling ERD wells. Pump pressure is often the limiting
factor for achieving the required flow rate. Consideration should thus be given to this
during the bottom hole assembly (BHA) design and bit nozzle selection to reduce pump
pressure.
Ideally, maximum available flowrates should be used for every section of an ERD well, up
to the surface pressure or downhole tool limits. As hole angle increases from vertical,
cuttings transport becomes more difficult. The flow rate required to carry cuttings out of
the hole increases rapidly from 0o to 60o. Above 60o the rate of flow rate increase levels
off. Hole angles between 45o and 60o frequently present the most problems because
cuttings tend to slide back down the annulus and pack‐off.
There are several commercially available drilling hydraulics computer programs, which can
be used to determine the achievable drilling circulation rates given the rig pump capacity,
drillstring/wellbore configuration and drilling fluid rheology. These flow rates can then be
evaluated using available hole cleaning models for high angle wellbores, which are capable
of predicting overall hole cleaning effectiveness.
70

However, field experiences as well as various simulations by industry experts have come up
with what can be referred to as recommended practices and typical flow rates to aim for in
ERD wells. Table 2 is the industry recommended minimum and maximum (realistic)
flowrates for different hole sizes.
Table 3.2: Recommended Minimum and Maximum Flow Rates for Different Hole Sizes
Hole Size Desirable Flow Rate (gpm) Minimum Workable Flow Rate
17½” 900 – 1200 800 gpm, with ROP @ 20 m/hr (65’/hr)
12 ¼” 800 ‐ 1100 650 – 700 gpm, with ROP @ 10‐15 m/hr (30‐50’ /hr)
97/8” 700 – 900 500 gpm, with ROP @ 10‐20 m/hr (33‐65’ /hr)
8½” 450 – 600 350‐400 gpm, with ROP @ 10‐20 m/hr (33‐65’ /hr)
Source: Drilling Design and Implementation for Extended Reach and Complex Well, K & M Technology, 3rd Edition, 2003, Pg 86
As was mentioned earlier, flowrate alone is ineffective unless the pipe is being rotated fast
enough to stir the cuttings into the flow regime. Table 3 presents the industry
recommended drillstring RPM for the different hole sizes.
Table 3.3: Recommended Drill String RPM for Various Hole Sizes
Hole Size Desirable RPM Minimum For Effective Hole Cleaning
17½” 120 – 180 rpm 120 rpm
12 ¼” 150 – 180 rpm 120 rpm
97/8” 120 – 150 rpm 100 rpm
8½” 70 – 100 rpm 60 rpm
Source: Drilling Design and Implementation for Extended Reach and Complex Well, K & M Technology, 3rd Edition, 2003, Pg 87
71

3.8 Vibration and Wellbore Stability
3.8.1 Vibrations
Compared to low angle and vertical wells, downhole vibrations are often less severe in ERD
wells. However, they are of particular concern due to their direct and indirect impact on
the overall drilling operation. Some of the effects of downhole vibration are:
1. BHA failures
2. Reduced Bit Life
3. Reduced ROP
4. Reduced Drill String life and Twist‐off’s
5. Poor Hole Condition
6. Longer drilling time and cost
Vibrations can be minimized or eliminated by downhole monitoring, and adjusting drilling
parameters and practices accordingly. It must be emphasized that it is not enough to just
monitor surface vibrations. This is because; it is highly unlikely that what is happening
downhole will be seen at the surface. In order to respond to vibrations and eliminate them,
it is helpful to understand the different types of vibrations and what causes them. Table 4
is a description of the various types of vibrations.
72

Table 3.4: Types of Vibrations
Type of Vibration Description and Symptom
Bit Bounce (Axial) • Often seen as large surface vibrations in short or vertical wells
• Often a result of drilling hard formations
• Bit damage
Bit and BHA Whirl
(Lateral)
• Very complex and destructive
• A major problem with early PDC bits
• Impact damage to bit gauge pads
• Localized tool joint wear
• Erratic surface torque
Stick‐Slip (Torsional) • Cyclic surface torque fluctuations/topdrive stalling
• MWD sensors have shown fluctuations of 0 ‐ 300 rpm downhole
• Over‐torqued tooljoints
Source: Drilling Design and Implementation for Extended Reach and Complex Well, K & M Technology, 3rd Edition, 2003, Pg 133
3.8.2 Wellbore Stability
ERD wells have hole sections of greater inclination than conventional directional wells.
Hence, the risk of instability in an ERD well is greater. The very nature of extending the
reach of wells in a given area will often increase the risk of instability. Therefore, greater
care during the planning and drilling of an ERD well is required.
Hole instability refers to two extremes of Formation Collapse and Formation Breakdown.
Formation Collapse can lead to spalling and/or hole closure. A number of factors can be
responsible for this, but the most common reasons are:
73

o Insufficient support not provided to the wellbore wall as a result of low mud weight
o Incompatibility of the mud chemistry with the formation.
Formation Breakdown on the other hand describes the creation of an induced fracture (or
opening of a natural fracture system) leading to massive mud losses. The primary reason
for formation breakdown is use of too high a mud weight.
3.8.3 Preliminary Wellbore Stability Analysis
To conduct analyses of stress‐induced wellbore instability, the basic information required
includes:
o Strength and deformation response of the formation material to stress changes
imposed by creation of the wellbore; and
o Knowledge of the in‐situ stress regime.
To conduct an analysis of stress‐induced wellbore instability the basic information required
includes:
o Knowledge of the orientation and magnitude of the principal in‐situ stresses and
o Strength and elastic properties of the rock material.
These input data are primarily obtained from geophysical logs and drilling data and are
associated with varying degrees of uncertainty.
74

There are several commercially available software for monitoring vibration and wellbore
instability. Because of the highly technical nature of this analysis, vibration and wellbore
instability will not be discussed any further as they are beyond the scope of this work.
75
Chapter Four Extended Reach Drilling Algorithm
4.1 Algorithm Defined
An algorithm is essentially a finite sequence of instructions. It is an explicit, step‐by‐step
procedure for solving a problem. Technically, an algorithm must reach a result after a finite
number of steps. However, for some, a program is only an algorithm if it eventually stops.
For others, a program is only an algorithm if it stops before a given number of calculation
steps. Thus, the term is also used loosely for any sequence of actions (which may or may
not terminate).
Because an algorithm is a precise list of precise steps, the order of computation will always
be critical to the functioning of the algorithm. Instructions are usually assumed to be listed
explicitly and are described as starting "from the top" and going "down to the bottom."
However, transition from one state to the next is not necessarily deterministic.
In general, the overall challenge of the petroleum industry has been and still is the efficient
recovery of oil and maximization of net present value for the lifetime of the field. For this
to be achieved, it is essential to have a structured approach to the drilling process. This
concept formed the basis for the development of an algorithm that can be used for the
planning, design and drilling of extended reach and complex wells.
76

4.2 The Visual Basic Algorithm for ERD
Several experimental and theoretical studies have been conducted on extended reach
drilling. In the preceding chapters, an extensive review of most of these studies as well the
critical technologies for their success were done. Based on the findings of the review, a
Visual Basic Algorithm that integrates many of the elements of the planning, design and
drilling of ERD wells into one single package has been developed. These elements include:
Well Planning and Trajectory Design, BHA Design, Drill String and Casing Design, Torque
and Drag, Hydraulics and Hole Cleaning, Equivalent Circulation Density, Bit Hydraulics and
Optimization, Rig Sizing and Selection, Stuck Pipe Prevention, Pressure Management, Well
Control, Surveying and Target Sizing, Rotary Steerable Systems Considerations, Vibration
and Wellbore Stability and Well Completion.
Of these five elements, this project will consider five of these factors and evaluate their
interrelationship. The factors are:
1. Well Planning and Trajectory Design
2. BHA Design
3. Drill String Design
4. Torque and Drag Analysis
5. Hydraulics and Hole Cleaning
77

The model is designed in accordance with industry Continuous Improvement Cycle (CIC)
Principles. The continuous improvement cycle for drilling a well consists of three stages
that follow one after another ‐ planning, drilling, and post‐well analysis. This cycle is
represented in Figure 4.1 below. From the figure, it can be seen that the output from one
stage serves as the input to the next, and this is the underlying principle that guided the
development of this model.
Drilling Planning
Analysis
Figure 4.1: The Continuous Improvement Cycle
78
79
4.2.1 Attributes of the Model
The Visual Basic model developed is a highly structured algorithm that provides direction
on processes and tasks required at all stages in the design and drilling of an ERD well to
achieve good drilling performance. The knowledge‐base structure of the algorithm
facilitates examination of the interrelationships of drilling parameters and operating
practices. Figure 4.2 is a flow chart that shows the interrelationship of these drilling
parameters. This figure is the building block for the software.

Figure 4.2: Drilling Design Flow Chart for Extended Reach Drilling
80

The algorithm is divided into modules, each treating a specific issue that comes into play
when drilling an extended reach well. Most of the calculations done in the various modules
overlap each other and there may appear to be some redundancy. This is intentional
because most of these calculations are closely inter‐linked, so it is difficult and
inappropriate to discuss these subjects in isolation.
The model evaluates the drilling process by presenting a structured approach, which
enables office and field personnel to identify drilling performance problems as easily as
possible. By evaluating results, the user can identify drilling problems early and is able to
accurately take remedial actions. As a result of using the program, better and quicker
information is obtained. It is then the user’s discretion to utilize the information and make
informed decisions.
The output from the model is a report that is essentially an implementable Well Plan. This
is made possible because common problems that could be encountered during the well
planning and design phases would be mitigated by the program’s smart engineering
knowledge.
Several flags have also been integrated into the code. These flags will pop up if an
input/output that is incompatible with the pre‐set standards is noticed by the program.
When a flag pops up, the user will need to make the necessary changes so as to rectify the
anomaly. Numerous iterations can be made until a technically feasible scenario is
obtained. This will be noticed when the program user is allowed to proceed without any
flags popping up. In this way, the user can correct his/her mistakes as soon as they are
81

made, instead of waiting for the final report to learn if indeed a mistake or incompatible
selection has been made. If followed sequentially and with appropriate inputs, the model
will be able to produce a workable well plan and design that can be used to drill the well.
4.3 Analysis of the Individual Modules
The model focuses on well design, well planning and implementation both at the office and
field locations. Upon launching the program, a visual interface, which displays 20 tabs, is
presented. Each tab brings a technology to the process that is necessary for success of
extended reach drilling. Each tab is a module in itself and contains enhanced graphics
depicting the parameter that is being analyzed. Each tab performs various calculations. The
results of these calculations are stored and carried forward to the next tab. Depending on
what is being calculated in the succeeding tab, data can either be called into the new tab or
referenced during the calculations. Results obtained from the current tab are internally
referenced to those of previous tabs. If new information that is not technically compatible
with previous information is observed, a flag pops up and notifies the user so that
appropriate adjustments can be made. In this way, the model continually updates the
process until a technically feasible well design is achieved. The following sections describe
the contents of the tabs/modules that have earlier been identified as critical to the success
of extended reach wells.
82

4.3.1 Well Planning Module
An often overlooked area of importance, in ERD wells in particular, is the measurement
process associated with fixing the physical position of the well bore. There are numerous
inherent errors within the measurements used to calculate the bottom hole location (BHL).
These measurements include:
• Depth
• Inclination
• Azimuth
Also of prime importance is the Build‐Up Rate (BUR). Build‐up‐rates are selected to: (a)
limit the fatigue loading on the drill string, and (b) reduce casing and tool joint wear. The
selection of BUR will influence the final inclination, which maximizes production and/or
avoids collision with other existing or planned wells. The build‐up‐rate is related to the
build‐up‐radius in the following equation:
R = π2
360 x
BURticLengthCharateris
(4.1)
Where R = Build Up Radius
Source: Shell Drilling and Transport Handbook, Vol. 2, 1991, Pg. 179
Figure 4.3 is the visual interface design of the Well Planning Module.
83

Figure 4.3: Well Planning and Trajectory Design Module
84
This module shows the most important parameters we need to know from the outset
before a well is planned. It calculates the following:
1. Dogleg Severity: This is given by:
DLS = CL
AC 100× (4.2)
Where: DLS = Dogleg Severity (Deg/100ft) AC = Angle Change (degrees) CL = Course Length (ft)
2. Build Up Rate: This is divided into the Build Section and the Tangent Section.
The Build Section is given by:
BS = xRi360
2π× (4.3)
Where: BS = Build Section (Deg/100ft) i = Inclination Angle (degrees) R = Build Up Radius (ft)
The Tangent Section is given by:
TS = R Sine i Cos i (4.4) Where: TS = Tangent Section (Deg/100ft) R = Radius of Curvature i = Inclination Angle (degrees)
Source: Shell Drilling and Transport Handbook, Vol. 2, 1991, Pg. 181
Source: Shell Drilling and Transport Handbook, Vol. 2, 1991, Pg. 180
85

3. Target Azimuth: This is given by:
At = Tan‐1
NE
ΔΔ
(+1800) (4.5)
Where: At = Target Azimuth (Deg) ΔE= Surface Co‐ordinates (Deg) ΔN= Target Co‐ordinate (Deg) ΔE and ΔN can be Negative South or Negative West
Source: Shell Drilling and Transport Handbook, Vol. 2, 1991, Pg. 169
4. Horizontal Departure: This is given by:
HD = Sine i * Distance from Kick‐off Point to Measured Depth (4.6)
Where: i = Inclination Angle (Degrees)
Source: Formulas and Calculations for Drilling, Production and Workover, Lapeyrouse 2nd Ed., Pg. 200
5. Current True Vertical Depth: This is given by:
Current TVD = (Cos i * Course Length) + Last TVD (4.7)
Where: i = Inclination Angle (Degrees)
Source: Directional and Horizontal Drilling Equations, roughneckcity.com
Having determined the above, projections can thus be made for the following:
1. Build Up Rate Needed to Reach Target: This is given by:
(Sine Desired Angle) – (Sine Current Angle) * 5730 (4.8) (Target TVD) – (Current TVD) Where: TVD = True Vertical Depth (Ft) 5730 = Conversion Factor (Field Units)
Source: Directional and Horizontal Drilling Equations, roughneckcity.com
86

2. Projected Angle Needed to Reach Target: This is given by:
(Target TVD) – (Present TVD) = Arc tan of Angle (4.9) (Usable VS)
Where: VS = Vertical Section Usable VS = Target VS – Present VS If Arc tan of Angle > 900, Add 900
If Arc tan of Angle < 900, Subtract 900
Source: Directional and Horizontal Drilling Equations, roughneckcity.com
3. Projected Measured Depth: This is given by:
(Target Inc) – (Present Inc) (4.10) (DLS)
Where: Inc = Inclination (Degrees) DLS = Dogleg Severity (Degrees)
Source: Directional and Horizontal Drilling Equations, roughneckcity.com
As was mentioned in Chapter 3, Well Planning is a design process, which utilizes a set of
criteria (data and information) to develop an optimum directional well plan. As the prime
critical success factor for ERD wells, well planning is connected to the other critical factors
as shown in figure 4.4.
87

Figure 4.4: Interrelationship among ERD Critical Elements
88

4.3.2 Bottom Hole Assembly (BHA) Design Module
Figure 4.5 is the Bottom Hole Assembly (BHA) Design module. In this module, API Standard
Drill Pipe and Drill Collar Specifications have been pre‐entered. Using the drop down
combo box, the user can simply select the specification that is applicable to the given
project. It also contains a list of downhole tools that are typically used in BHA design. The
check boxes are used to select any particular tool. All other critical BHA calculations are
provided by the operator or Service Company. Values for these calculations are not
calculated by the program, but are simply entered by the user. This is because the
mathematics behind these calculations could not be obtained. Several attempts were
made to get the underlying equations for these parameters but the custodians of the
equations would not release them because they are regarded as proprietary/classified
information. Thus, it is assumed that the user already has them in hand and simply needs
to enter the values in the appropriate spaces. The program will then use these values
during the evaluation process.
BHA design is also an iterative process that involves developing a BHA strategy that
considers the key issues of the overall drilling and hole cleaning process. Figure 4.6 shows
the interrelationship among these key issues and how they are factored into the design of
the bottom hole assembly, while figure 4.7 is the module that implements the flow chart.
89

Figure 4.5: Flow Chart for the Design of Bottom Hole Assembly
90

Figure 4.6: Bottom Hole Assembly (BHA) Design Module
91

4.3.3 Drill String Design Module
The Drill String Design Module calculates all the required parameters for designing the drill
string. Among others, it calculates:
1. The Buoyancy Factor: This is given by:
BF = 65.5 – Mud Weight (ppg) (4.11) 65.5
Where: BF = Buoyancy Factor (Dimensionless)
2. The Length of BHA Necessary for the Required Weight on Bit: This is given by:
Length (ft) = WOB * SF Wdc * BF (4.12)
Where: WOB = Desired Weight on Bit to be used while drilling SF = Safety Factor to place neutral points in drill collars Wdc = Weight of Drill Collar (Ib/ft) BF = Buoyancy Factor
Source: Formulas and Calculations for Drilling, Production and Workover, Lapeyrouse 2nd Ed., Pg. 20
Source: Formulas and Calculations for Drilling, Production and Workover, Lapeyrouse 2nd Ed., Pg. 42
3. The Maximum Allowable Tension in the Drill Pipe: This is given by:
Max Tension (Ib) = (Ym * A ) * 0.85 (4.13)
Where: Ym = Minimum Tensile Yield Strength (psi) A = Cross Sectional Area (in.2) 0.85 = 85% of minimum yield strength of material
Source: Shell Drilling and Transport Handbook, Vol. 2, 1991, Pg. 93
92

4. The Maximum Allowable Torsion in the Drill Pipe: This is given by:
Max Torsion (Ib/ft) = {C * J * Ym } * 0.85 (4.14) D Where: Ym = Minimum Tensile Yield Strength (psi)
J = Polar Moment of Inertia: 32π
(D4 – d4) (in.4)
D = Outside Diameter of Drill Pipe (in.) d = Inside Diameter of Drill Pipe C = 0.096167 (field units) 0.85 = 85% of minimum yield strength of material
Source: Shell Drilling and Transport Handbook, Vol. 2, 1991, Pg. 97
5. Minimum Torsion Yield Strength Under Tension: This is given by:
QT = C * J * ( Y2m ‐ P
2)1/2 (4.15) D A2 Where: QT = Minimum Torsion Yield Strength Under Tension
J = Polar Moment of Inertia: 32π
(D4 – d4) (in.4)
D = Outside Diameter of Drill Pipe (in.) d = Inside Diameter of Drill Pipe (in.) C = 0.096167 (Conversion Factor – Field Units) Ym = Minimum Unit Yield Strength (psi) A = Cross Sectional Area (in.2) P = Minimum Tensile Yield Strength (psi)
Source: Shell Drilling and Transport Handbook, Vol. 2, 1991, Pg. 97
93

6. The Maximum Allowable Dogleg Severity for Avoidance of Drill Pipe Fatigue: This is given by:
C = 432,000 σb tan h KL (4.16) π ED KL
Where: K =EIT
; I = 64π
(D4 – d4) ; tan h KL = ekl – e‐kl
ekl + e‐kl
σt = T/A; A = 4π(D1
2 – d12)
For Grade “E” Drill Pipe;
σb = 19,500 ‐ 6710
σt ‐ 2)670(6.0
[σt – 33,500]2
For Grade “S” Drill Pipe;
σb = 20,000 [1 ‐ σt/145,000]
Where: C = Maximum permissible dogleg severity (deg/100ft) E = Young’s Modulus (psi) D = Drill Pipe OD (in.) d = Drill Pipe ID (in.) L = Half the distance between tool joints (in.) T = Buoyant Weight (including tool joints) suspended below the dogleg (Ib) σb = Maximum permissible bending stress (psi) I = Drill pipe moment of Inertia with respect to its diameter (in.4) Source: Shell Drilling and Transport Handbook, Vol. 2, 1991, Pg. 107
94

7. The Lateral Force for Avoidance of Casing Wear: This is given by:
F (Ib) = π*c *LT 108,000 (4.17)
Where: F = Lateral force C, L and T are as above
Source: Shell Drilling and Transport Handbook, Vol. 2, 1991, Pg. 107 Like Well Planning and BHA design, drill string design is also an iterative process that
involves designing a drill string strategy that considers the key issues relating to Friction
Factors, Torque and Drag, Hole Cleaning and a host of others. Figure 4.8 shows the
interrelationship among these key issues and how they are factored into the design of the
drill string, while figure 4.9 is the module that implements this flow chart.
95

Figure 4.7: Flow Chart for Drill String Design
96

Figure 4.8: Drill String Design Module
97

4.3.4 Torque and Drag Analysis Module
This module performs Torque and Drag Analysis for the well design. Since there is a myriad
of commercially available torque and drag analysis software, it is anticipated that one of
the packages will be used. Examples of available Torque and Drag Analysis software
include: Baker Hughes’ Advantage Torque and Drag, Halliburton’s WellPlan Torque and
Drag, and Petris’ DDRAG – Torque and Drag Analysis Model. These models will provide the
inputs necessary for this software.
However, in addition to the inputs provided by commercially available software, this
module also performs the following calculations:
1. Torque Generated at the Bit: This is given by:
TQ @ Bit = Bit Diameter * Bit Aggressiveness (4.24)
2. Total Surface Torque: This is given by:
TST = String Torque + Mechanical Torque + Dynamic Torque (4.25)
3. Fracture Gradient: There are two principal methods of calculating Fracture
Gradient – Mathews and Kelly and the Ben Eaton method. This model uses the
Mathews and Kelly method which is mathematically represented as:
98

FG = D
KiDP α+ (4.26)
Where: FG = Fracture Gradient (psi/ft) P = Formation pore pressure (psi) α = Matrix stress @ point of interest (psi) D = Depth of interest [TVD] (ft) Ki = Matrix stress coefficient, (Dimensionless)
From the above, Fracture Pressure can be calculated by:
Fracture Pressure (psi) = FG * D (4.27)
Where: FG = Fracture Gradient (psi/ft) D = Depth of Determining Ki
And Maximum Mud Density can be calculated by:
Max. Mud Density = 052.0
FG (4.28)
Where: FG = Fracture Gradient (psi/ft)
Source: Formulas and Calculations for Drilling, Production and Workover, Lapeyrouse 2nd Ed. Pgs. 190‐192
Figure 4.9 is the visual interface design of the Torque and Drag Analysis Module.
99

Figure 4.9: Torque and Drag Analysis Module
100

4.3.5 Hydraulics and Hole Cleaning Module
This module predicts the flow rates and RPMs that are needed to clean the various hole
sections. It was developed for hole sections from 8 ½” to 17 ½”. It is also able to calculate
annular velocity as well as predict the characteristics of the cuttings that will be generated
in the various hole sections. Once a hole section selection is made from the drop down
combo box, the program automatically displays the required flow rate and RPM that will
be required to clean that hole section. The flow rates and RPMs generated upon selection
of a hole size have been adapted from the recommended values in Tables 3.2 and 3.3,
reproduced hereunder:
Recommended Minimum and Maximum Flow Rates for Different Hole Sizes
Hole Size Desirable Flow Rate (gpm) Minimum Workable Flow Rate
17½” 900 – 1200 800 gpm, with ROP @ 20 m/hr (65’/hr)
12 ¼” 800 ‐ 1100 650 – 700 gpm, with ROP @ 10‐15 m/hr (30‐50’ /hr)
97/8” 700 – 900 500 gpm, with ROP @ 10‐20 m/hr (33‐65’ /hr)
8½” 450 – 600 350‐400 gpm, with ROP @ 10‐20 m/hr (33‐65’ /hr)
Source: Drilling Design and Implementation for Extended Reach and Complex Well, K & M Technology, 3rd Edition, 2003, Pg 86 Recommended Drill String RPM for Various Hole Sizes
Hole Size Desirable RPM Minimum For Effective Hole Cleaning
17½” 120 – 180 rpm 120 rpm
12 ¼” 150 – 180 rpm 120 rpm
97/8” 120 – 150 rpm 100 rpm
8½” 70 – 100 rpm 60 rpm
Source: Drilling Design and Implementation for Extended Reach and Complex Well, K & M Technology, 3rd Edition, 2003, Pg 87
101

This module also calculates the Annular Velocity (ft/min), which is another very important
variable in the hole cleaning process. By maintaining the annular velocity at certain rates in
conjunction with the rheological properties (density, viscosity, yield strength, gel strength)
of the drilling fluid, the wellbore is kept clean of the drill cuttings to prevent them from
settling back down to the hole bottom and causing drilling problems.
The Annular Velocity can be calculated using one of the following formulæ:
OR (4.29)
Where: AV = Annular Velocity (ft/min) PObpm = Pump Output (bpm) POgpm = Pump Output (gpm) ID = Inside Diameter of the wellbore or casing (in2) OD = Outside Diameter of the drill pipe or tubing (in2) 1029.4 = Conversion factor (Field Units) 24.5 = Conversion factor (Field Units)
Source: Formulas and Calculations for Drilling, Production and Workover, Lapeyrouse 2nd Ed. Pg. 170
Figure 4.10 is the visual interface design of the Hydraulics and Hole Cleaning Module.
102

Figure 4.10: Hydraulics and Hole Cleaning Module
103

4.3.6 Equivalent Circulation (ECD) Density Module
This module calculates both Equivalent Circulation Density as well as the Equivalent Static
Density. The formula for calculating Equivalent Circulation Density was given in Equation
3.2 on page 57 and is reproduced hereunder:
ECD = MW (ppg) + )(*052.0
)(ftTVD
psiPA (3.2)
The Equivalent Static Density on the other hand is given by:
ESD = PStatic Measured (4.30) g *TVD
Where: ESD = Equivalent Static Density (Dimensionless) g = Acceleration due to gravity (m/s2) TVD = True Vertical Depth (ft)
Based on these two calculations, the model is able to predict the equivalent circulation
density that is needed to clean the hole. It does this by back‐checking it with the pore
pressure gradient, formation break gradient and the fracture pressure gradient that was
earlier calculated by the Torque and Drag Module. It essentially checks to make sure that
ECD is below (and always remains below) the fracture gradient.
Figure 4.11 is the visual interface design of the Equivalent Circulation Density Module.
104

Figure 4.11: Equivalent Circulation Density (ECD) Module
105

While the modules that have been described above are considered critical factors for the
success of ERD wells, it does not in any way mean that the other factors listed among the
tabs, namely: Casing Design, Bit Hydraulics and Optimization, Rig Sizing and Selection,
Stuck Pipe Prevention, Pressure Management, Well Control, Surveying and Target Sizing,
Rotary Steerable Systems (RSS) Considerations, Vibration and Wellbore Stability and Well
Completion; are less important. Information and relevant data associated with these
parameters will be provided by the operating or service Company.
4.4 Sensitivity Analysis – Example Problem
In this section, the sequence of iterations implemented by the algorithm when applied to
different scenarios is presented. The interrelationship among the five identified critical
factors in the planning and design of an extended reach well is seen as changes are
continually made to the original well proposal until a technically feasible well plan and
design is achieved. During the iteration process, various parameters will be tested for the
selected decision variables, among these are:
1. Is proposed BUR achievable?
2. Is the proposed BHA achievable?
3. Is BHA bending limit exceeded?
4. Will the proposed design result in vibration issues?
5. Will the hole be effectively cleaned with the proposed design?
6. Will the proposed design result in components wear?
106

7. Will Torque and Drag values exceed operating limits of the proposed rig?
8. Will drill string material limits be exceeded?
These decision variables will be individually and collectively analyzed and the
interconnectivity between the variables evaluated. In this way, the effects of changes in
these variables and how they affect the final design will be seen. To show how the
algorithm achieves this, let us consider a proposed ERD project in the Gulf of Mexico.
Operator: Armstrong Oil and Gas
Field: La Corona
Well Number: A‐101
Well Type: Extended Reach
Objective Functions:
• To drill an Extended Reach Well from top hole to a measured depth of 2900ft @
1150ft TVD.
• To determine the appropriate wellpath for drilling the well.
• To design the appropriate BHA and Drill String for the given well.
• To determine if the hole can be effectively cleaned with the designed BHA and drill
string.
107

Given the following data:
Proposed Well Plan Inclination Angle 5 Deg Course Length 2,900 ft Build up Radius 3 ft TVD 1150 ft Proposed Wellpath Build and Hold Kick off Point 600 ft
Proposed Drill String Components Drill Pipe Weight = 29.63 Ib/ft HWDP Weight = 70.5 Ib/ft Outer Diameter of Drill Pipe 6 5/8 in. Outer Diameter of HWDP 6 5/8 in. Inner Diameter of Drill Pipe 5.97 in. Inner Diameter of HWDP 4.5 in. Drill Collar Weight = 136.31 Ib/ft Outer Diameter of Drill Collar 7 ¾ in. Inner Diameter of Drill Collar 3 in. Maximum Allowable Hook Load 805.5 psi Drill String Weight in Air 517.6 KIbf
Proposed Bottom Hole Assembly Tools Drilling Bit Near Bit Reamer Steering Unit Modular Stabilizer Non‐Magnetic Drill Collar String Stabilizer Heavy Weight Drill Pipe Shock Sub Jars MWD Tools
Friction Factors Local Friction Factor 0.17 Well Friction Factor 0.22
Proposed Mud Properties Mud Type Oil‐based Mud Weight 13 ppg
Other Relevant Information Annulus Pressure 200 psi Formation Pore Pressure 6,692 psi Stress @ TVD 7309 psi Matrix Stress Coefficient 0.522 psi/ft
108

The information given above is used as inputs in the relevant tabs of the model to perform
the required calculations.
Step 1: Determine Well Planning Parameters
START
Given: Well Path/Trajectory = Build and Hold Kick off Point = 600ft Angle Change = 5 Deg Course Length = 2900 ft Determine:
• Dogleg Severity • Build Up Rate for the Build Section
Dogleg Severity is given by:
DLS = CL
AC 100× (4.2)
Where: DLS = Dogleg Severity (Deg/100ft) AC = Angle Change (degrees) CL = Course Length (ft)
From the given data: DLS = (5 * 100)/2,900 = 0.17 Deg/100 ft
Build Up Rate for Build Section is given by:
BS = xRi360
2π× (4.3)
Where: BS = Build Section (Deg/100ft) i = Angle Change (degrees)
Well Planning
R = Build Up Radius (ft)
109

From the given data, Angle Change = 5 degrees, Build up Radius = 3 ft BUR for Build Section = ((5 * 2π)/360) * 3 = 0.26 Deg/100 ft
Proceed to Step 2: BHA Design
BHA Design
Given the following Downhole Tools:
Drilling Bit Near Bit Reamer Steering Unit Modular Stabilizer Non‐Magnetic Drill Collar String Stabilizer Heavy Weight Drill Pipe Shock Sub Jars MWD Tools
1. Using available industry software (e.g. BHA SysPro), design the BHA with these tools.
From the proposed wellplan data, the build‐up rate has been calculated to be 0.26
deg/100ft.
2. Determine if this is achievable with the BHA designed with the above downhole tools.
Also determine if BHA bending limit is exceeded; if side forces can cause BHA wear and if
the current design will result in BHA vibration.
3. If the BUR is not achievable, consider reducing the BUR by raising the KOP from 600 ft to
500 ft. Re‐calculate the BUR @ KOP of 500 ft and check if this is achievable with the
designed BHA. If not, continue reducing BUR and raising KOP until an achievable BUR is
obtained.
4. If BUR remains unachievable, re‐consider the placement and/or size of the stabilizers or
use flex subs/flex stabs.
110
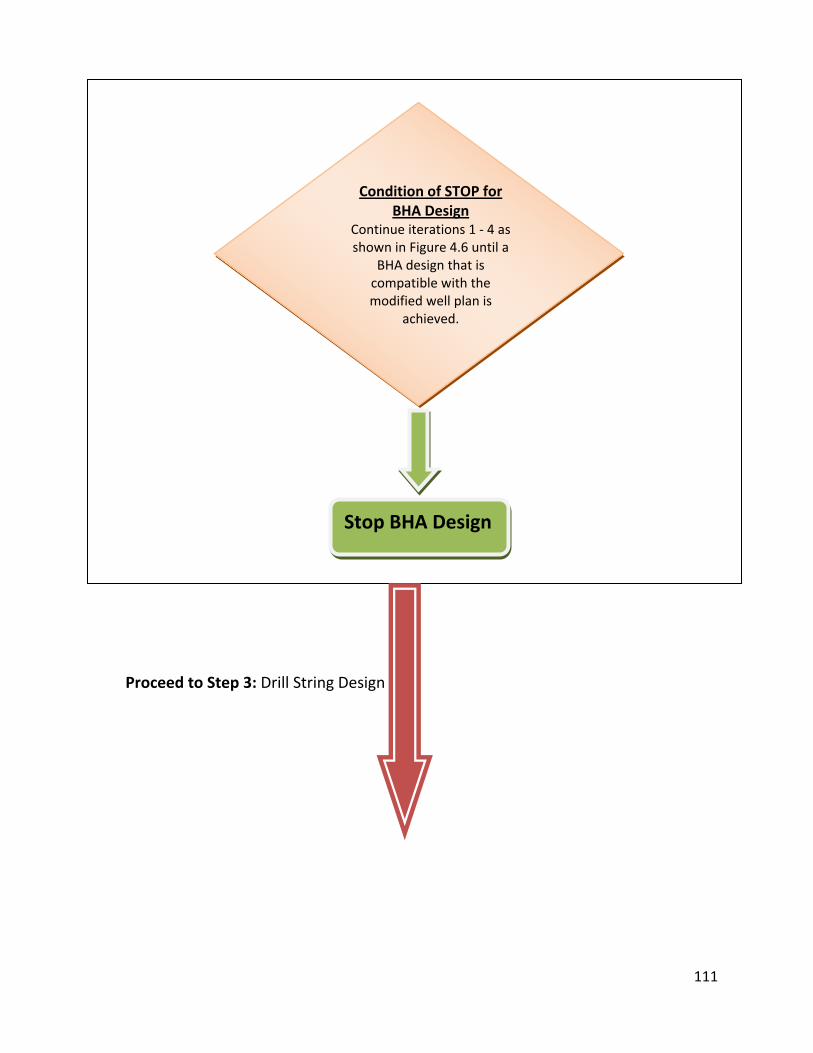
Proceed to Step 3: Drill String Design
Stop BHA Design
Continue iterations 1 ‐ 4 as shown in Figure 4.6 until a
BHA design that is compatible with the modified well plan is
achieved.
Condition of STOP for BHA Design
111

Drill String Design
Given the following:
Local Friction Factor 0.17 Well Friction Factor 0.22 Mud Density 13 ppg Depth of Interest (TVD) 1150 ft Formation Pore Pressure 6692 psi Stress @ Point of Interest 7309 psi Matrix Stress Coefficient 0.522 psi/ft
The following information will be provided by the operator:
• Rig Operating Limit • Drill String Material Limits • Yield Safety Factor • Fatigue Safety Factor • Side Forces
Use Torque and Drag Module to perform Fracture Gradient Calculations:
1. Fracture Gradient Using Ben Eaton Method is given by:
FG = D
KiDP α+ (4.26)
Where: FG = Fracture Gradient (psi/ft) P = Formation pore pressure (psi) α = Matrix stress @ point of interest (psi) D = Depth of interest [TVD] (ft) Ki = Matrix stress coefficient
112

113
Using this equation, the fracture gradient is calculated as follows:
(6692 / 1150) + 0.522 (7309 / 1150) = 9.14 psi/ft
From the above, Fracture Pressure can be calculated by:
Fracture Pressure (psi) = FG * D (4.27)
Where: FG = Fracture Gradient (psi/ft) D = Depth of Determining Ki
Therefore, Fracture Pressure = 9.14 * 1150 = 10511 psi
2. Using the combination of the Toque and Drag Module and industry software (e.g.
Advantage Torque and Drag), determine:
a) If Torque and Drag Values exceed Rig Operating Limits
b) If this leads to Drill String Buckling
c) If Drill String Material Limits are exceeded
d) If all the above are compatible with the modified wellplan and designed BHA.
3. For each of a – d that is determined to be true, go back and re‐design the drill string by:
i. Considering changes in the DC and HWDP number and placement
ii. Considering Surface Equipment Upgrade
iii. Considering higher strength pipes
iv. Considering Rotary Steerable Systems
OR
Go back to the wellplan and consider either:
i. Reducing the BUR and/or Hole Angle
ii. Planning deeper BUR if possible
iii. Changing the wellpath to Catenary Well Profile
4. Calculate the Equivalent Circulation Density using the ECD Module:
Compare the Calculated ECD with fracture gradient. ECD should always remain below
fracture gradient.

Proceed to Step 4: Prepare Well Proposal
Condition of STOP for Drill String Design
Stop Drill String Design
Continue iterations 1 ‐ 4 as shown in Figure 4.8 until a Drill
String design that is compatible with the modified well plan and designed BHA is
achieved.
114

Prepare Well Prop ing the technically
feasible and Wellplan, BHA
Design String Design
osal Show
recommended
and Drill
STOP
END
115

4.5 Limitations of the Model
The most significant limitation of this model is its inability to self‐calculate certain
parameters in the modules. This is because the mathematics behind some of these
parameters could not be obtained. As a result of this, the model had to rely on already
generated inputs from other industry software. In some cases, instead of first providing all
the necessary input values before calculation, the user is simply asked to enter the final
value which has been obtained from some other model. This partially reduces the ability of
the model to independently iterate certain parameters. That notwithstanding, it generates
an output in Excel, in a well report format which gives a re‐evaluated and modified version
of the original proposal. This new version of the proposal is a more technically feasible
design that can be used to drill the well. An example of the report format is shown in
Appendix B.
Another limitation of this model is the inability of the author to secure relevant field data
to carry out further sensitivity analysis. As was mentioned in Section 4.3.2 on page 89, this
is because these data are regarded as proprietary/classified information and therefore,
could not be released. As can be seen, only one set of data was available, as such, only one
run was made; as against several repeated runs. Even though it would have been nice to
have more validation data, the fact that only one data set was used does not significantly
affect the functional efficacy of the model.
116

Chapter Five
Summary, Conclusions and Recommendations
A Visual Basic algorithm that shows the interrelationship among the five critical elements
involved in the planning, design and drilling of extended reach and complex wells has been
developed. The development of the model is based upon information gathered from
several sources, many new ideas from technical publications, along with information and
feedback from field‐based personnel. The ideas, suggestions and recommendations
gathered from all these sources have been incorporated into the model.
Based on findings from the literature and results obtained from using the model, the
following summary, conclusions and recommendations can be made:
5.1 General Observations
1. Well length is different for different types of curve shapes and well profile design is
one of the critical technologies in ERD. We should therefore select a well trajectory
that is as short as possible. This is because significant benefits come from reduction
of footage.
2. Deep kick off point and low build‐up rates will reduce the inclination in the larger
diameter hole sections and this generally gives better hole stability and improves
hole cleaning.
117

3. The principles of planning are making torque and drag as small as possible and
making well length as short as possible.
4. ECD measurement is crucial to ECD management and understanding of the variety
of downhole conditions that affect it.
5. The recognition of hole cleaning problems in the planning phase and the taking of
immediate remedial action when the problems occur on the rig can lead to
successful completion of drilling objectives.
5.2 Conclusions drawn from using the model
While the model that has been developed is not a substitute for an experienced drilling
engineer, it will greatly assist in the well planning and design process by automatically
proposing sound technical solutions and providing a smooth path through the well
planning workflow. The use of the model has also revealed that:
1. The friction factor is one of the most crucial inputs in a Torque and Drag analysis.
2. There is a direct correlation between ECD and Friction Factor. This is as a result of
the fact that both are functions of Hole Cleaning.
118

5.3 Recommendations The testing of the program as well as key lessons learned and success factors identified
from this study has also led to the following recommendations:
1. While using the model, when specifying changes or requesting modifications to a
specific parameter, keep in mind that the systems are not independent and a
change to one system may require a change to another.
2. Determining the best well plan and design is an iterative process. Always consider
the factors affecting critical or marginal components. Determine if your
assumptions were reasonable or overly conservative. Evaluate the well
requirements and design to determine how changes may affect your specifications.
3. The iteration process is based on engineering principles and will yield a quantitative
result based on many assumptions. When making these assumptions it is important
to be aware of the objectives and constraints of the particular ERD project.
5.4 Concluding Remarks
In the light of the foregoing, it is this author’s conclusion that the definition of ERD will
remain dynamic and should be updated as operators expand the ERD envelope. ERD wells
drilled in specific fields and with specific rigs, equipment, personnel, project teams, etc. do
not necessarily imply what may be readily achieved in other areas. Because of the myriad
of variables, which control drilling mechanics and performance, local ERD definitions
119

should be developed in terms of the extent of experience within specific fields and with
specific rigs. Thus, ERD wells should not be treated as “just another well”. Designs must
be fit‐for purpose and specific to the well in question. Time spent on detailed planning
and design will definitely pay off in the operational phase in both performance
improvements and the avoidance of Non‐Productive Time (NPT) and the recording of No
Drilling Surprises (NDS).
5.5 The Future of Extended Reach Drilling
Extended Reach Drilling is increasingly becoming the means of reviving and expanding the
productivity of aging oil and gas fields. The careful application of ERD technology will
provide an opportunity for reservoirs to add value beyond what would ordinarily be
possible through conventional directional drilling. While it looks like we can solve the
problems posed by the other critical technologies for success of ERD wells, torque and
drag, hole cleaning, as well as vibration and wellbore stability will continue to remain a
problem.
However, as drilling technology continues to evolve, and as operators strive to extend the
life of existing structures and reduce the number of such structures on new field
developments, the industry will continue to break drilling records and the limits of
extended reach drilling will continue to be pushed further. And with records being
continually broken, the obvious question will be: How Far Can We Go with Existing
Technology?
120
Reliable rotary steerable tools have had a significant effect on drilling efficiency and
flexibility especially at extreme departures. With the potential of Rotary Steerable Drilling
technology, the limits for extended reach wells may now lie with the ability to complete
and maintain production from a well rather than to drill it. As drilling technology continues
to improve and as the limiting factors identified in this study are gradually overcome, the
final constraint may well be economic rather than technical. Advances in ERD techniques
are a continuous process, thus research on how to optimize ERD operations will be a
continuous process that will be evolving alongside its development.
5.6 Further Studies
Beyond drilling, it is suggested that further studies should be carried out on Extended
Reach Completions, Interventions and other Life Cycle issues that impact on the total value
of Extended Reach Drilling. Studies should also be conducted on Vibration and Wellbore
Stability, Rotary Steerable System Considerations, Stuck pipe prevention, Rig Sizing and
Selection, Pressure Management, as well as Surveying and Target Sizing.
121

Appendix A: Program Code
Option Explicit Dim Pi As Double Private Sub CmdAnnularVelocit'CALCULATING ANNULAR VELOCITY
y_Click()
Dim MFR As Double, IDCH As Double, ODPT As Double, ANV As Double MFR = TxtMFR.Text IDCH = TxtIDCH.Text ODPT = TxtODPT.Text ANV = (24.5 * MFR) / (IDCH ^ 2 - ODPT ^ 2) TxtANV.Text = Round(ANV, 2) End Sub Private Sub CmdBF_Click() 'CALCULATING BUOYANCY FACTOR Dim MW As Double, RBF As Double MW = TxtMW.Text RBF = (65.5 - MW) / 65.5 TxtRBF.Text = Round(RBF, 3) End Sub 'CALCULATING THE BUILD SECTION Dim INCA As Double, RAD As Double, BSEC As Double INCA = TxtINCA.Text RAD = TxtRAD.Text BSEC = ((INCA * 6.285 / 360) * RAD) TxtBSEC.Text = Round(BSEC, 2) End Sub Private Sub cmdCalculateCurrentTVD_Click() Dim LastTVD As Double, CurrentTVD As Double Dim CourseLength As Double, IncAngle As Double LastTVD = Me.txt_Current_LastTVD.Text CourseLength = Me.txt_Current_CourseLenght.Text IncAngle = Me.txt_Current_InclinationAngle.Text CurrentTVD = (Cos(IncAngle * Pi / 180) * CourseLength) + LastTVD Me.txt_Current_CurrentTVD.Text = Round(CurrentTVD, 2) End Sub Private Sub cmdCalculateProjectedAngle_Click() Dim TTVD As Double, PTVD As Double Dim TVS As Double, PVS As Double Dim UVS As Double Dim Res1 As Double Dim Res2 As Double TTVD = Me.txtTargetTVD.Text PTVD = Me.txtPresentTVD.Text TVS = Me.txtTargetVS.Text
122

PVS = Me.txtPresentVS.Text UVS = (TVS - PVS) Res1 = (TTVD - PTVD) / UVS Res2 = Atn(Res1) * 180 / Pi If Res2 > 90 Then Res2 = Res2 + 90 Else Res2 = Res2 - 90 End If txtProjectedAngle.Text = Res2 End Sub 'COMBINED MAXIMUM TENSION AND TORSION IN DRILL PIPE Dim MTYS As Double, IDDP As Double, ODDP As Double, CSAP As Double, CMATT As Double, MAT As Double MTYS = TxtMTYS.Text IDDP = TxtIDDP.Text ODDP = TxtODDP.Text MAT = TxtMAT.Text CSAP = TxtCSAP.Text CMATT = (0.096167 * (0.0981875 * (ODDP ^ 4 - IDDP ^ 4))) * (MTYS ^ 2 - (MAT ^ 2 / CSAP ^ 2)) ^ 0.5 / (ODDP) TxtCMATT.Text = Round(CMATT, 2) End Sub Private Sub CmdDoglegSeverity_Cl'CALCULATION OF DOGLEG SEVERIY'
ick()
Dim AC As Double, CL As Double, DLS As Double AC = TxtAC.Text CL = TxtCL.Text DLS = (AC * 100) / CL TxtDLS.Text = Round(DLS, 2) End Sub Private Sub CmdEquivalentCirculationDensity_'CALCULATING EQUIVALENT CIRCULATION DENSITY
Click()
Dim MWT As Double, ANP As Double, TVD1 As Double, ECD As Double MWT = TxtMWT.Text ANP = TxtANP.Text TVD1 = TxtTVD1.Text ECD = MWT + (ANP / (0.052 * TVD1)) TxtECD.Text = Round(ECD, 2) End Sub Private Sub CmdEquivalentStaticDensity_Click() 'CALCULATING EQUIVALENT STATIC DENSITY Dim MSP As Double, TVD2 As Double, ADG As Double, ESD As Double MSP = TxtMSP.Text TVD2 = TxtTVD2.Text ADG = TxtADG.Text ESD = (MSP / (ADG * TVD2)) TxtESD.Text = Round(ESD, 2)
123

End Sub Private Sub CmdFractureGradient_Click() 'CALCULATING FRACTURE GRADIENT Dim FPP As Double, SPI As Double, DOI As Double, MSC As Double, FRAG As Double FPP = TxtFPP.Text SPI = TxtSPI.Text DOI = TxtDOI.Text MSC = TxtMSC.Text FRAG = (FPP / DOI) + MSC * (SPI / DOI) TxtFRAG.Text = Round(FRAG, 2) End Sub Private Sub CmdFracturePressure'CALCULATING FRACTURE PRESSURE
_Click()
Dim FRAP As Double, FRAG As Double, DOI As Double FRAG = TxtFRAG.Text DOI = TxtDOI.Text FRAP = FRAG * DOI TxtFRAP.Text = Round(FRAP, 2) End Sub Private Sub CmdHorizontalDeparture_Cl'CALCULATION OF HORIZONTAL DEPARTURE
ick()
Dim IA As Double, KOP As Double, HD As Double IA = TxtIA.Text KOP = TxtKOP.Text HD = Sin(IA * Pi / 180) * KOP TxtHD.Text = Round(HD, 3) End Sub 'LENGTH OF BHA NECESSARY FOR REQUIRED WEIGHT ON BIT 'SAFETY FACTOR = 1.15 Dim WOB As Double, WODC As Double, LBHA As Double, RBF As Double WOB = TxtWOB.Text WODC = TxtWODC.Text RBF = TxtRBF.Text LBHA = (WOB * 1.15) / (WODC * RBF) TxtLBHA.Text = Round(LBHA, 2) End Sub Private Sub CmdMaximumAllowableDLS_Click() 'CALCULATING MAXIMUM ALLOWABLE DOGLEG SEVERITY FOR AVOIDANCE OF DRILL PIPE FATIGUE Dim IDDP As Double, ODDP As Double Dim L As Double, MPBS As Double Dim DPMI As Double, T As Double, C As Double Dim E As Double, AngleChange As Double ODDP = TxtODDP.Text L = Me.txtHalfDistance.Text 'Half distance btw tool joint MPBS = Me.txtMPBS.Text 'Maximum permissible bending stress
124

DPMI = Me.txtDPMI.Text 'Drill pipe moment of inertia T = Me.txtBouyantWeight.Text 'Bouyant Weight E = Me.txtYoungModulus.Text 'Young Modulus of Elasticity AngleChange = Me.txtAngleChange.Text 'Angle Change C = (432000 / Pi) * MPBS / (E * ODDP) * AngleChange Me.txtMPDLS = Round(C, 2) 'Maximum Permissible Dog Leg Severity End Sub Private Sub CmdMaxMudDensity_Click() 'CALCULATING MAXIMUM MUD DENSITY Dim MMD As Double, FRAG As Double FRAG = TxtFRAG.Text MMD = FRAG / 0.052 TxtMMD.Text = Round(MMD, 2) End Sub Private Sub CmdMeasuredDepth_Click() 'CALCULATING PROJECTED MEASURED DEPTH Dim TAGI As Double, PRESI As Double, DLS2 As Double, PMD As Double TAGI = TxtTAGI.Text PRESI = TxtPRESI.Text DLS2 = TxtDLS2.Text PMD = (TAGI - PRESI) / DLS2 TxtPMD.Text = Round(PMD, 2) End Sub Private Sub cmdNRTVD_Click() Dim DA As Double, CA As Double Dim TTVD As Double, CTVD As Double Dim Res1 As Double, Res2 As Double DA = Me.TxtDA.Text CA = Me.TxtCA.Text TTVD = Me.TxtTTVD.Text CTVD = Me.TxtCTVD.Text Res1 = Sin(DA * Pi / 180) - Sin(CA * Pi / 180) Res2 = Res1 / (TTVD - CTVD) Me.TxtNRTVD.Text = Round(Res2, 4) End Sub Private Sub cmdOptimize_Click() Dim ECD As Double, PPG As Double Dim FPG As Double, FBG As Double ECD = Me.TxtECD.Text PPG = Me.txtPPG.Text FPG = Me.txtFPG.Text FBG = Me.txtFBG.Text If ECD > FPG Then Me.txtOptimizeECD.Text = "ECD is greater than Fracture Gradient. Check Mud Weight or Annulus Pressure" Else Me.txtOptimizeECD.Text = "ECD is good enough to clean the hole"
125
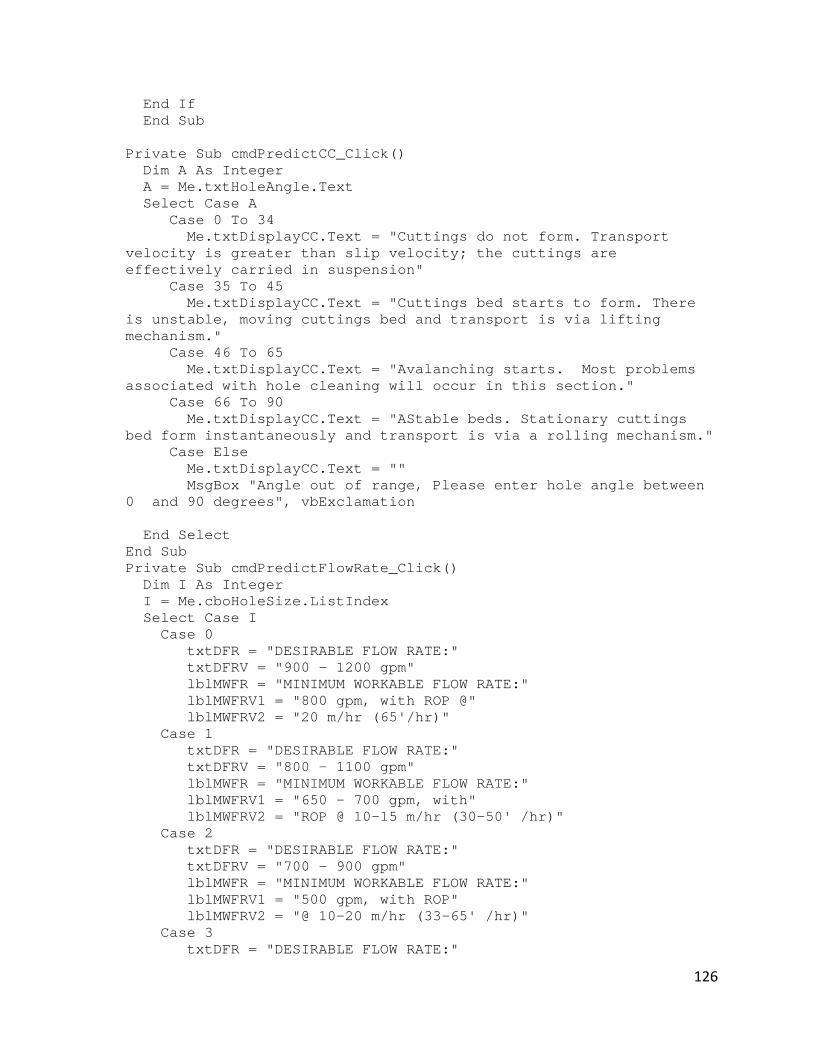
End If End Sub Private Sub cmdPredictCC_Click() Dim A As Integer A = Me.txtHoleAngle.Text Select Case A Case 0 To 34 Me.txtDisplayCC.Text = "Cuttings do not form. Transport velocity is greater than slip velocity; the cuttings are effectively carried in suspension" Case 35 To 45 Me.txtDisplayCC.Text = "Cuttings bed starts to form. There is unstable, moving cuttings bed and transport is via lifting mechanism." Case 46 To 65 Me.txtDisplayCC.Text = "Avalanching starts. Most problems associated with hole cleaning will occur in this section." Case 66 To 90 Me.txtDisplayCC.Text = "AStable beds. Stationary cuttings bed form instantaneously and transport is via a rolling mechanism." Case Else Me.txtDisplayCC.Text = "" MsgBox "Angle out of range, Please enter hole angle between 0 and 90 degrees", vbExclamation End Select End Sub Private Sub cmdPredictFlowRate_Click() Dim I As Integer I = Me.cboHoleSize.ListIndex Select Case I Case 0 txtDFR = "DESIRABLE FLOW RATE:" txtDFRV = "900 - 1200 gpm" lblMWFR = "MINIMUM WORKABLE FLOW RATE:" lblMWFRV1 = "800 gpm, with ROP @" lblMWFRV2 = "20 m/hr (65'/hr)" Case 1 txtDFR = "DESIRABLE FLOW RATE:" txtDFRV = "800 - 1100 gpm" lblMWFR = "MINIMUM WORKABLE FLOW RATE:" lblMWFRV1 = "650 - 700 gpm, with" lblMWFRV2 = "ROP @ 10-15 m/hr (30-50' /hr)" Case 2 txtDFR = "DESIRABLE FLOW RATE:" txtDFRV = "700 - 900 gpm" lblMWFR = "MINIMUM WORKABLE FLOW RATE:" lblMWFRV1 = "500 gpm, with ROP" lblMWFRV2 = "@ 10-20 m/hr (33-65' /hr)" Case 3 txtDFR = "DESIRABLE FLOW RATE:"
126

txtDFRV = "450 - 600 gpm" lblMWFR = "MINIMUM WORKABLE FLOW RATE:" lblMWFRV1 = "350-400 gpm, with" lblMWFRV2 = "ROP @ 10-20 m/hr (33-65' /hr)" End Select End Sub Private Sub cmdPredictRotarySpeed_Click() Dim I As Integer I = Me.cboHoleSize2.ListIndex Select Case I Case 0 txtDFR1 = "DESIRABLE RPM:" txtDFRV1 = "120 - 180 rpm" txtMWFR1 = "MINUMUM FOR EFFECTIVE HOLE CLEANING:" txtMWFRV1 = "120 rpm" Case 1 txtDFR1 = "DESIRABLE RPM:" txtDFRV1 = "150 - 180 rpm" txtMWFR1 = "MINUMUM FOR EFFECTIVE HOLE CLEANING:" txtMWFRV1 = "120 rpm" Case 2 txtDFR1 = "DESIRABLE RPM:" txtDFRV1 = "120 - 150 rpm" txtMWFR1 = "MINUMUM FOR EFFECTIVE HOLE CLEANING:" txtMWFRV1 = "100 rpm" Case 3 txtDFR1 = "DESIRABLE RPM:" txtDFRV1 = "70 - 100 rpm" txtMWFR1 = "MINUMUM FOR EFFECTIVE HOLE CLEANING:" txtMWFRV1 = "60 rpm" End Select End Sub Private Sub CmdPressureLoss1_Click() 'PRESSURE LOSS AT BIT..1 Dim MW1 As Double, FLR As Double, BNZA As Double, BNPL As Double MW1 = TxtMW1.Text FLR = TxtFLR.Text BNZA = TxtBNZA.Text BNPL = (FLR ^ 2 * MW1) / (10858 * BNZA ^ 2) TxtBNPL.Text = Round(BNPL, 1) End Sub 'This sub calculates the length of the tangent section. 'inclination should be in degrees.
127

Private Sub cmdTangentSection_Click() Dim R As Double, IncAngle As Double R = Me.txtTanTVD.Text 'this is the radius but used as TVD because of compactibility 'with earlier naming convention. IncAngle = Me.txtTanIncAngle.Text Dim R_IncAngle As Double 'Inclination angle converted to radians R_IncAngle = IncAngle * Pi / 180 Me.txtTangentSectionResults.Text = Round(R * Sin(R_IncAngle) / Cos(R_IncAngle), 2) End Sub Private Sub cmdTargetAzimuth_Click() 'this sub calculates the Tangent Azimuth. 'Assumption is that the SurfaceCoordinate and TargetCoordinate are in degrees Dim SurfaceCoordinate As Double, TargetCoordinate As Double Dim Pi As Double, X As Double, GetTangentAzimuth As Double Pi = 3.14159265358979 SurfaceCoordinate = Me.txtTargetSurfaceCoordinate.Text TargetCoordinate = Me.txtTargetcoordinate.Text X = Atn(SurfaceCoordinate / TargetCoordinate) * 180 / Pi GetTangentAzimuth = X + 180 Me.txtTargetAzimuth.Text = GetTangentAzimuth End Sub Private Sub CmdTensionInDrillPipe_Click() 'MAXIMUM ALLOWABLE TENSION IN DRILL PIPE Dim MTYS As Double, CSAP As Double, MAT As Double MTYS = TxtMTYS.Text CSAP = TxtCSAP.Text MAT = (MTYS * CSAP) * 0.85 TxtMAT.Text = Round(MAT, 2) End Sub Private Sub Cmd'TORQUE AT BIT
TorqueAtBit_Click()
Dim WOB2 As Double, BD As Double, BAG As Double, TQB As Double WOB2 = TxtWOB2.Text BD = TxtBD.Text BAG = TxtBAG.Text TQB = WOB2 * BD * BAG TxtTQB.Text = Round(TQB, 2) End Sub Private Sub CmdTorsionInDrillPipe_Click() 'MAXIMUM ALLOWABLE TORSION IN DRILL PIPE Dim MTYS As Double, IDDP As Double, ODDP As Double, MTOYS As Double MTYS = TxtMTYS.Text
128

ODDP = TxtODDP.Text IDDP = TxtIDDP.Text MTOYS = ((0.096167 * (0.0981875 * (ODDP ^ 4 - IDDP ^ 4) * MTYS)) / ODDP) * 0.85 TxtMTOYS.Text = Round(MTOYS, 2) End Sub Private Sub CmdTotalDragForces_'CALCULATING TOTAL DRAG FORCES
Click()
Dim STEN As Double, PUW As Double, SOW As Double, OBT As Double, FRT As Double, FRW As Double, TDF As Double STEN = TxtSTEN.Text PUW = TxtPUW.Text SOW = TxtSOW.Text OBT = TxtOBT.Text FRT = TxtFRT.Text FRW = TxtFRW.Text TDF = STEN + PUW + SOW + OBT + FRT + FRW TxtTDF.Text = Round(TDF, 2) End Sub Private Sub CmdTotalSurfaceTorque_Click() 'TOTAL SURFACE TORQUE Dim TQB As Double, STRT As Double, MET As Double, DYT As Double, TSTQ As Double TQB = TxtTQB.Text STRT = TxtSTRT.Text MET = TxtMET.Text DYT = TxtDYT.Text TSTQ = TQB + STRT + MET + DYT TxtTSTQ.Text = Round(TSTQ, 2) End Sub Private Sub cmdTransfer_Click() Me.txtMPDLS2.Text = Me.txtMPDLS.Text Me.txtBouyantWeight2.Text = Me.txtBouyantWeight.Text Me.txtHalfDistance2.Text = Me.txtHalfDistance.Text End Sub Private Sub CmdWeightOnBit_Click() Dim IA As Double, TWOC As Double Dim Res As Double IA = Me.txtInclinationAngle.Text TWOC = Me.txtTWOC.Text Res = TWOC * Cos(IA * Pi / 180) Me.txtAvailableWOB.Text = Round(Res, 2) End Sub Private Sub CmdYSC_Click() 'CALCULATING YIELD STRENGTH COLLAPSE Dim MYS As Double, NWT As Double, ODC As Double, YSC As Double
129

MYS = CboMYS.Text NWT = TxtNWT.Text ODC = TxtODC.Text YSC = (2 * MYS) / ((ODC / (NWT - 1)) / (ODC / NWT) ^ 2) TxtYSC.Text = Round(YSC, 2) End Sub Private Sub Cbo1_Change() Call Display_Data_From_Combo_to_TextBox2 End Sub Private Sub cmdCreateReport_Click() 'Report dog leg severity Sheets("Reports").Range("B11") = Me.TxtDLS 'Report Build up rate Sheets("Reports").Range("B13") = Me.TxtBSEC.Text 'Report tangent section Sheets("Reports").Range("B14") = Me.txtTangentSectionResults.Text MsgBox "Reports Created Successfully" End Sub 'This function calculates the length of the tangent section. 'inclination should be in degrees. Function GetTangentSection(ByVal TVD As Double, ByVal IncAngle As Double) As Double Dim Pi As Double Pi = 3.14159265358979 Dim R_IncAngle As Double 'Inclination angle converted to radians R_IncAngle = IncAngle * Pi / 180 GetTangentSection = TVD / Cos(R_IncAngle) End Function Sub Display_Data_From_Combo_to_TextBox1() Dim I As Integer I = Me.Cbo1.ListIndex Select Case I Case 0 Me.Txt1.Text = "This" Case 1 Me.Txt1.Text = "That" End Select End Sub Sub Display_Data_From_Combo_to_TextBox2() Dim I As Integer I = Me.Cbo1.ListIndex Me.Txt1.Text = Cells(65520 + I, 2) End Sub
130
Private Sub UserForm_Activate() Pi = 3.14159265358979 End Sub Private Sub UserForm_Initialize() Pi = 3.14159265358979 End Sub Private Sub UserForm_MouseMove(ByVal Button As Integer, ByVal Shift As Integer, ByVal X As Single, ByVal Y As Single) Pi = 3.14159265358979
End Sub
131

Appendix B: Report Format
132

133
Bibliography
1. Al‐Suwaidi, A.S., El‐Nashar, R.A., Allen, F., and Brandao, F.J.: “World Class Extended‐
Reach Drilling Performance in Abu Dhabi – A Case Study in How to Beat the
Learning Curve,” paper SPE 72279 presented at the 2001 IADC/SPE Middle East
Drilling Technology, Bahrain, 22‐24 October.
2. Payne, M. L., Wilton, B. S. and Ramos, G. G.: “Recent Advances and Emerging
Technologies for Extended Reach Drilling”, SPE 29920, presented at the
International Meeting on Petroleum Engineering held in Beijing, PR China, 14‐17
November, 1995
3. Nelson, K. “Comparing Push Envelope of the Possible Without Costly New
Technology”. Petroleum News Alaska, pages 7‐8, April 1997.
4. Mason, C.J. and Judzis, A.: “Extended‐Reach Drilling ‐ What is the Limit?,” paper
presented at the at the 1998 SPE Annual Technical Conference and Exhibition, held
in New Orleans, Louisiana, September 27 – 30, 1998
5. Economides, M.J., Watters, L.T., and Dunn‐Norman, S.: Petroleum Well
Construction, John Wiley & Sons Ltd., London (1998).
6. Williams, M.: “Extending the Drilling Horizon” Offshore Magazine, February 2008, pg 132
7. Tolle, G., and Dellinger, T: “Mobil Identifies Extended Reach Drilling Advantages,
Possibilities in North Sea” paper presented at the 2002 SPE International Petroleum
Conference and Exhibition, Villahermosa, Mexico, 10‐12 February
134

8. Longwell, H.J. and Seng, N.K.: “Extended Reach Drilling Experience at Tabu B,”
Paper presentation at the 1996 lADC/SPE Asia Pacific Drilling Technology
Conference held in Kuala Lumpur Malaysia September 9 – 11, 1996.
9. Demong, K., Riverbank, M., and Mason, D.: “Breakthroughs Using Solid Expandable
Tubulars to Construct Extended Reach Wells,” paper presented at the IADC/SPE
Drilling Conference held in Dallas, Texas, March 2‐4, 2004.
10. “Report on Technology and Reported Problem Areas and Operational Practice”,
Philip C. Crouse and Associates Incorporated, Internal Report, February 1995.
11. Rasmussen, B., Sorheim, J.O., Seiffert, E., Angeltvadt, O., and Gjedrem, T.,.: “World
Record in Extended Reach Drilling, Well 33/9‐C10, Statfjord Field, Norway” Paper
SPE 21984 presented at the 1991 SPE/IADC Drilling Conference, March 11‐14.
12. Njaerheim, A and Tjoetta, H: “New Word Record in Extended Reach Drilling From
Platform Statfjord “C,” paper SPE 23849 presented at the 1992 IADC/SPE Drilling
Conference, February 18 – 21.
13. Drilling and Production Yearbook, 1992, Petroleum Engineer International, March
1992 Pg 63 – 41
14. Drilling and Production Yearbook, 1993, Petroleum Engineer International, March
1993 Pg 22 – 23
15. Cooney, M. F., Rogers, C.T., Stacy, E.S., and Stephens R.N.: “Case History of an
Opposed‐Bore Dual Horizontal Well in the Austin Chalk Formation of South Texas,
SPE Drilling & Completion, March 1993
135

16. Ruszka, J.: “Reducing Risk in Extended Reach Drilling: People, Technology Hold
Key,” Offshore Magazine, February 2008, pg 72.
17. Payne, M., Cocking, D.A., and Hatch, A.J.: “Critical Technologies for Success in
Extended Reach Drilling,” paper SPE 28293 presented at the 1994 SPE Annual
Technical Conference and Exhibition, New Orleans, 25‐28 September.
18. Cameron, C.: “Drilling Fluids Design and Management for Extended Reach Drilling,”
paper presented at the IADC/SPE Middle East Drilling Technology Conference held
in Bahrain, October 22 – 24 2001.
19. Tribe, I.R., Burns, L., Howell, P.D., and Cickson, R.: “Precise Well Placement Using
Rotary Steerable Systems and LWD Measurements,” paper SPE 71396 presented at
the 2001 SPE Annual Technical Conference and Exhibition, New Orleans, 30
September–3 October.
20. Kamaruddin, S., Lah, M.Z.C., Sering, L., Good, A., and Khun, L.H.: “Pushing the
Envelope – Extending the Limits of Current Drilling Technology,” paper SPE 64696
presented at the 2000 SPE International Oil and Gas Conference and Exhibition,
Beijing, China, 7‐10 November.
21. Shanzhou, M., Genlu, H., Jianguo, Z., and Zhiyong, H.: “Study on Design of Extended
Reach Well Trajectory,” paper presented at the 1998 SPE International Conference
and Exhibition held in Beijing, China, November 2‐6.
22. McClendon R.T and Anders E.O.: Directional Drilling Using the Catenary Method,
Paper SPE 13478, presented at the SPE/IADC 1985 Drilling Conference
136

23. Aston, M.S., Hearn, P.J. and McGhee, G.: “Techniques for Solving Torque and Drag
Problems in Today’s Drilling Environment”, SPE 48939, New Orleans, September 27‐
30, 1998.
24. Modi, S., Mason, C.J., Tooms, P.J., and Conran, G.: “Meeting the 10km Drilling
Challenge,” paper SPE 38583 presented at the 1997 SPE Annual Technical
Conference and Exhibition held in San Antonio, TX, Oct. 5‐8.
25. Banks, S. M., Hogg, T. W., Thorogood, J. L.: “Increasing Extended‐Reach Capabilities
Through Wellbore Profile Optimization,” paper SPE 23850 presented at the 1992
SPE Drilling Conference held in New Orleans, LA, Feb. 18‐21.
26. Meader, T., Allen, F., and Riley, G.: “To the Limit and Beyond ‐ The Secret of World‐
Class Extended‐Reach Drilling Performance at Wytch Farm,” paper presented at the
2000 IADC/SPE Drilling Conference held in New Orleans, Louisiana, 23‐25 February
2000.
27. Ikeda, S., Takeuchi, T., Crouse, P.C.: “An Investigative Study on Horizontal Well and
Extended Reach Technologies with Reported Problem Areas and Operational
Practice in North America and Europe,” paper SPE 35054 presented at the 1996 SPE
Drilling Conference held in New Orleans, LA, March 12‐15.
28. Cocking, D. A., Bezant, P.N., and Tooms, P. J.: “Pushing the ERD Envelope at Wytch
Farm”, paper SPE 37618 presented at the 1997 SPE Drilling Conference held in
Amsterdam, The Netherlands, March. 4‐6.
29. Ryan, G., Reynolds, J., and Raitt, F.: “Advances in Extended Reach Drilling ‐ An Eye
to 10 km Stepout,” paper SPE 30451 presented at the 1995 SPE Annual Technical
Conference & Exhibition held in Dallas, TX, Oct. 22‐25.
137

30. Eck‐Olsen J. Sietten, H., Reynolds, J. T., and Samuel, J. G. “Recent Advances Increase
Drilling Reach in the North Sea”, World Oil, May 1994, pp. 45‐53.
31. Aarrestad T. V, and Blikra H.: “Torque and Drag – Two Factors in Extended Reach
Drilling”, JPT September 1994, pp. 800‐803.
32. Brett, J.F., Beckett, A.D. and Holt, C.A.: “Uses and Limitations of Drillstring Tension
and Torque Models for Monitoring Hole Conditions, SPE Drilling Engineering, Vol. 4,
No.3, September 1989, pp 223‐229
33. Guild, G.J. and Jeffrey, J.T.: “Drilling Extended‐Reach/High Angle Wells Through
Over‐pressured Shale Formation”, SPE Drilling Engineering, Vol. 9, No.3, September
1994, pp 161‐166.
34. Sanchez, R. A., Azar, J. J., and Martins, A. L.: “The Effect of Drillpipe Rotation on
Hole Cleaning During Directional Well Drilling,” paper SPE 37626 presented at the
1997 SPE Drilling Conference held in Amsterdam, The Netherlands, Mar. 4‐6.
35. Warren, T. M.: “Trends Toward Rotary Steerable Directional Systems,” World Oil,
May 1997 pg. 43‐47.
36. Blikra, H., Drevdal, K.E., and Aarrestad.,” Extended Reach, Horizontal and Complex
Designer Wells: Challenges, Achievements and Cost Benefits, 14th World petroleum
Congress, SPE 28005, 29 May ‐ 1 June 1994.
37. Guild, G.J., Wallace, I.M., and Wassenborg, M.J.: “Hole Cleaning Program for
Extended Reach Wells”, paper SPE 29381 presented at the SPE/IADC Drilling
Conference, held in Amsterdam, The Netherlands, February 28 – March 2, 1995.
138

38. Gao, E. and Young, A.C.: “Hole Cleaning in Extended Reach Wells – Field Experience
and Theoretical Analysis Using a Pesudo‐Oil (Acetal) Based Mud”, paper SPE 29425
presented at the SPE/IADC Drilling Conference, held in Amsterdam, The
Netherlands, February 28 – March 2, 1995.
39. Schamp, J.H., Estes, B.L., and Keller, S.R.: “Torque Reduction Techniques in ERD
Wells”, paper IADC/SPE 98969 presented at the 2006 IADC/SPE Conference, held in
Miami, Florida, February 21 – 23.
40. Parker, D.J.: “An Experimental Study of the Effects of Hole Washout and Cutting Size
on Annular Hole Cleaning in Highly Deviated Wells”, MS Thesis, University of Tulsa,
Tulsa, Oklahoma (1987)
41. Ahmed, R.M.: “Mathematical Modeling and Experimental Investigation on Solids
and Cuttings Transport”, PhD Dissertation, Norwegian University of Science and
Technology, Norway (2001).
42. Larsen, T.I.: “A Study of the Critical Fluid Velocity in Cuttings Transport for Inclined
Wellbores”, MS Thesis, University of Tulsa, Tulsa, Oklahoma, (1990).
43. Duan, M., Miska, S., Yu, M., Takach, N., and Ahmed, R.: “Transport of Small
Cuttings in Extended Reach Drilling,” paper presented at the SPE International Oil
and Gas Conference and Exhibition, held in Beijing, China, December 5 – 7, 2006
44. Larsen. T., Pilehvari, A. A. and Azar, J. J.: “Development of a New Cuttings Transport
Model for High‐Angle Wellbores Including Horizontal Wells” paper SPE 25872
presented at the SPE Rocky Mountain Regional Symposium Denver, April 12‐I‐l.
1993.
139

45. Sifferman, T.R. and Becker T.E.: “Hole Cleaning in Full‐Scale Inclined Wellbores”,
paper SPE 20422 presented at the 1990 SPE Annual Technical Conference and
Exhibition, New Orleans, Louisiana, September 23 – 26.
46. Bassal, A. A.: “The Effects of Drillpipe Rotation on Cuttngs Transport in Inclined
Wellbore”, MS Thesis, University of Tulsa, Tulsa, Oklahoma (1995).
47. Odell II, A. C., Payne M.L., and Cocking, D. A.: “Application of a Highly Variable
Gauge Stabilizer at Wytch Farm to Extend the ERD Envelope,” paper SPE 30462
presented at the SPE Annual Technical Conference and Exhibition held in Dallas, TX,
October. 22‐25 1995.
48. Bruce, S., Bezant, P., and Pinnock, S.: “A Review of Three Years’ Work in Europe and
Africa with an Instrumented Motor,” paper SPE 35053 presented at the 1996 SPE
Drilling Conference held in New Orleans, LA, March, 12‐15.
49. Barr, J. D., Clegg, J. M., and Russell, M. K.: “Steerable Rotary Drilling With an
Experimental System,” Journal of Petroleum Technology, March. 1996, pg. 237‐238.
50. Colebrook, M.A., Peach, S.R., Allen, F.M., and Conran, G.: “Application of Steerable
Rotary Drilling Technology to Drill Extended Reach Wells,” paper SPE 39327
presented at the 1998 IADC/SPE Drilling Conference, Dallas, 3‐6 March.
51. Payne, M.L., Abbassian, F. “Advanced Torque and Drag Considerations in Extended‐
Reach Wells,” paper SPE 35102 presented at the 1996 SPE Drilling Conference held
in New Orleans, LA, Mar. 12‐15.
52. Cunha, J.C., Martins, A.L., Sa, C.H.M., and Dore Fernandes, P.: “Planning Extended
Reach Wells for Deep Water,” paper SPE 74400 presented at the 2002 SPE
140

International Petroleum Conference and Exhibition, Villahermosa, Mexico, 10‐12
February.
53. Kunze, K.R. and Steiger, R.P.: "Extended Leakoff Tests to Measure In‐Situ Stress
During Drilling". Proceedings of the 32nd U.S. Symposium on Rock Mechanics,
(1991), pp. 35‐44.
54. Jeffrey, R.G.: “Hydraulic Fracture Stress Testing” APCRC Unrestricted Report No. 3,
CSIRO Division of Geomechanics, Melbourne, (1992).
55. Stephansson, O., Savilahti, T. and Bjarnason, B.: "Rock Mechanics of the Deep
Borehole at Gravberg, Sweden". Rock at Great Depth, Maury & Fourmaintraux
(eds.), (1989), 863‐870.
56. Rummel, F.: "Stresses and Tectonics of Upper Continental Crust ‐ A Review".
Proceedings of the International Symposium on Rock Stress and Rock Stress
Measurements. O. Stephansson (ed.): 177‐186. Centek Publ. Lulea, (1986).
57. Starzer, M. R., Mount, P. B., and Voskanian M. M.: “Onshore Exploration and
Development of California Offshore Resources Through Extended Reach Drilling”,
SPE/IADC paper 27526, presented at the 1994 SPE/IADC Drilling Conference, 15‐18
February, 1994, Dallas, Texas.
58. Prentice, G., “Extended Reach Wells and their Application West of Shetland”, 8th
Annual Drilling Conference. Aberdeen, Scotland, 22‐23 November 1994.
59. Payne, M. L., Wilton, B. S. and Ramos, G. G.: “Recent Advances and Emerging
Technologies for Extended Reach Drilling”, SPE 29920, presented at the
141

International Meeting on Petroleum Engineering held in Beijing, PR China, 14‐17
November, 1995
60. Eck‐Olsen, J., Sleuen. H., Reynolds, J. T. Jr. and Samuel, J.G.: “North Sea Advances in
Extended Reach Drilling”, SPE/IADC 25750, presented at the 1993 SPE/IADC Drilling
Conference. Amsterdam. 23‐25 February, 1993.
61. Alfsen T. E., Heggen S., Blikra, H., and Jotta, H.: “Pushing the Limits for Extended
Reach Drilling: New World Record from Platform Statfjord C, Well C2”, SPE 26350,
presented at the 68th Annual SPE FalI Conference. 3‐6 October, 1993. Houston
Texas.
62. Sorheim J. O. and Skogseth, O., “Extended Reach and Complex Designer Wells
Demonstrate Innovation”, Petroleum Engineer International, November 1994, pp.
23‐28.
63. Guild, G.J., Jeffrey, J. T. and Carter, J. A.: “Drilling Extended Reach/High‐Angle Wells
Through Over‐Pressured Shale Formation in the Central Graben Basin, Arbroath
Field: Block 22/17. UK North Sea”, SPWIADC 25749, presented at the 1993
SPE/IADC Drilling Conference. Amsterdam, 23‐25 February. 1993.
64. Smith, K. R.: “Maersk Sets Horizontal World Records in Qatar,” Drilling Contractor,
July 1994, pg 19.
65. Reid. P. I. et al: “Reduced Environmental Impact and Improved Drilling Performance
with Water‐Based Muds Containing Glycols” paper SPE 25989 presented at the
1993 SPE/EPA Exploration and Production Environmental Conference, San Antonio.
March 7‐10
142

143
66. Bland, R. G.: “Quality Criteria in Selecting Glycols as Alternatives to Oil‐Based
Drilling Fluid Systems” paper SPE 27141 presented at the Second International
Conference on Health. Safety & Environment, Jakana, January 25‐27, 1994
67. Growcock, F. B., Sinor, L. A., Reece, A. R., Powers, and J. R.: “Innovative Additives
Can Increase the Drilling Rates of Water‐Based Muds,” paper SPE 28708 presented
at the SPE International Petroleum Conference and Exhibition of Mexico. Veracruz,
October 10‐13 1994
68. Andresen, S., Hovda, S and Olsen, T.L.: “Experience With Drilling C‐26A, A World
Record Extended Reach Horizontal Well in the Oseberg Field, North Sea”, paper SPE
30463 presented at the 1995 SPE Annual Technical Conference & Exhibition, Dallas
22‐25 October.
69. Belaskie, J.P., Dunn, M.D. and Choo, D.K., “Distinct Applications of MWD Weight‐
on‐Bit and Torque”, IADC/SPE 19968, Houston, February 27 – March 2, 1990.
70. Eck‐Olsen, J., Drevdal, K.E, Reynolds J.T, and Samuel, J.G.: “Designer Directional
Drilling To Increase Total Recovery and Production Rates,” Paper IADC/SPE 27461,
presented at the IADC/SPE Drilling Conference, February 1994.
71. Drilling Design and Implementation for Extended Reach Wells, K & M Technology
Group, Third Edition, 2003.
72. Production Handbook: Drilling and Transport (Volume 2), Shell Internationale
Petroleum Maatschappij B.V., The Hague, 1999.
73. Lapeyrouse, N.: Formulas and Calculations for Drilling, Production and Workover,
Gulf Professional Publishing, NY, 2002, 2nd Edition.
74. Bourgoyne, A.T., Chenevert, M.E., Millhem, K.K., Young Jr., F.S.: Applied Drilling
Engineering, SPE Textbook Series, Vol.2
Related Documents