THESIS FOR THE DEGREE OF DOCTOR OF PHILOSOPHY Development of a Cohesive Zone Model for Adhesive Joints that Includes Environment Degradation by Guilherme Miranda Silva de Oliveira Viana Supervisor: Lucas Filipe Martins da Silva Co-Supervisor: Mariana Doina Banea January 2018

Welcome message from author
This document is posted to help you gain knowledge. Please leave a comment to let me know what you think about it! Share it to your friends and learn new things together.
Transcript

1
THESIS FOR THE DEGREE OF DOCTOR OF PHILOSOPHY
Development of a Cohesive Zone Model for Adhesive Joints that
Includes Environment Degradation
by
Guilherme Miranda Silva de Oliveira Viana
Supervisor:
Lucas Filipe Martins da Silva
Co-Supervisor:
Mariana Doina Banea
January 2018
2
© Guilherme Miranda Silva de Oliveira Viana
Departamento de Engenharia Mecânica
Faculdade de Engenharia da Universidade do Porto
Rua Dr. Roberto Frias
4200-465 Porto
Portugal

i
ABSTRACT
Adhesives used in transportation industries must operate in various environmental conditions.
These adhesives must maintain the structural integrity of the joint at high moisture
environments and at high and low temperatures. Moisture is absorbed by the adhesive and acts
as a plasticizer, increasing adhesive ductility and decreasing its strength. Moisture may also
attack the interface between the adhesive and the adherend, being responsible for adhesive
failure of the joint. Different temperatures also affect the mechanical properties of the adhesive.
Now-a-days, the design of adhesive joints is a relatively easy task, as there are advanced tools
that allow the engineer to reliably predict the mechanical behaviour of the joint in the short
term. However, in the long term the adhesive joint will degrade, and its properties will
deteriorate. This is arguably the most important disadvantage of adhesive bonding today.
High and low temperatures are one of the environmental factors that affect the performance of
adhesive joints as mechanical properties of the adhesive change with temperature. At higher
temperatures, the adhesive becomes more ductile and more sensitive to strain rate. Moreover,
the performance of the adhesive joint should be assessed under service conditions. In the
automotive industry, for instance, it is important to consider also impact loads, as the adhesive
joint must be able to resist high impact loads such as those that are cause by vehicle crash.
The main objective of this study is to determine the mechanical behaviour of two structural
adhesives used in transportation industries, simultaneously taking into account different levels
of moisture and the range of temperatures typically found in these applications: from -40oC to
80oC. The information generated was used to develop a cohesive zone model that can be used
to predict the mechanical behaviour of any adhesive joint under moisture and temperature
conditions. This will help engineers design more efficient adhesive joints.
The triangular cohesive zone law was used to model the adhesive layer. To define this law, the
determination of three parameters is required: the modulus, strength and toughness of the
adhesive. These properties were determined in this study as a function of environmental
moisture and temperature.
Moisture does not penetrate instantaneously into the adhesive layer. This means that the
adhesive that is closer to the edges of the bondline will attain saturation faster than the adhesive
in the centre of the joint, which will create a gradient also in the mechanical properties of the
adhesive layer.

ii
In this study scaled specimens of a joint used in the railway industry were artificially aged in
high moisture environments and tested at high and low temperatures. Using Fick’s laws, it is
possible to predict the amount of absorbed water at each point of the adhesive layer and
consequently attribute a different set of mechanical properties at each point. The shape of the
cohesive zone law is different at each point of the adhesive layer. A numerical model that
includes a cohesive zone element that is capable of taking into account graded adhesive
properties according to absorbed moisture and environmental temperature was developed. The
results provided by this model correlate well with values obtained experimentally.

iii
RESUMO
Os adesivos estruturais que são utilizados nas indústrias dos transportes em geral têm de ser
capazes de suportar condições ambientais adversas. Estes adesivos têm de manter a integridade
estrutural da junta em condições de humidade elevada e sob altas e baixas temperaturas. A
humidade actua no adesivo como um plasticizante, aumentando a sua ductilidade e diminuindo
a sua resistência. A humidade também pode atacar a interface entre adesivo e substracto,
podendo ser responsável por ruptura adesiva da junta. Altas e baixas temperaturas também
afectam as propriedades mecânicas da junta.
Actualmente, o projecto de juntas adesivas é relativamente simples. Existem ferramentas
avançadas que permitem fazer previsões fiáveis do comportamento mecânico a curto prazo.
No entanto, a longo prazo as propriedades mecânicas da junta degradar-se-ão. Esta é
possivelmente a pior desvantagem das juntas adesivas em relação a outros métodos de ligacão.
Altas e baixas temperaturas afectam as propriedades dos adesivos e, consequentemente, o
comportamento mecânico de juntas adesivas. A temperaturas mais elevadas, o adesivo torna-
se mais dúctil e mais sensível à taxa de deformação, pelo que o desempenho da junta deve ser
determinado à temperatura de serviço. Na indústria automóvel, por exemplo, é importante
considerar também taxas de deformação elevadas porque a junta tem de ser capaz de suportar
cargas de impacto, como aquelas que resultam de colisões entre veículos.
O principal objectivo deste estudo é a determinação das propriedades mecânicas de dois
adesivos estruturais utilizados em indústrias de transportes, considerando diferentes níveis de
humidade e de temperatura simultaneamente. A informação gerada foi utilizada para
desenvolver um elemento coesivo que pode ser utilizado na determinação do comportamento
mecânico de juntas adesivas sujeitas a diferentes condições de humidade e temperatura. Este
elemento pode ajudar engenheiros na previsão do comportamento de juntas adesivas a longo
prazo e no projecto de juntas mais eficientes.
A lei de dano triangular foi utilizada para modelar a camada de adesivo. Para definir esta lei, é
necessária a determinação de três parâmetros: o módulo, a resistência e a tenacidade. Estes três
parâmetros foram determinados em função da humidade e temperatura ambientais.
A humidade não penetra instantaneamente na camada de adesivo. Isto significa que as zonas
de adesivo que estão mais próximas das extremidades da zona de sobreposição absorverão

iv
humidade mais rapidamente. Isto criará um gradiente na humidade do adesivo e,
consequentemente, nas suas propriedades mecânicas.
Neste estudo, provetes de dimensões reduzidas, que imitam um tipo de junta utilizada na
indústria ferroviária, foram expostos a uma diversidade de condições de humidade e
temperatura encontrados neste tipo de indústria. Utilizando as leis de Fick, é possível
determinar a quantidade de água absorvida pelo adesivo em cada ponto da camada de adesivo
e, consequentemente, atribuir diferentes propriedades mecânicas ao adesivo em cada ponto. A
forma da lei coesiva é diferente em cada elemento da camada de adesivo. Um modelo numérico
que inclui um elemento coesivo capaz de tomar em consideração propriedades graduadas do
adesivo, de acordo com o seu nível de humidade e temperatura, foi desenvolvido. Existe boa
correlação entre os resultados do modelo e os valores obtidos experimentalmente.

v
ACKNOWLEDGEMENTS
I would like to express my gratitude to my supervisor, prof. Lucas da Silva for and my co-
supervisor Mariana Banea for their guidance, technical contribution, dedication and writing
review during this work.
I equally wish to thank FEUP’s adhesives group members for their friendship, help and support
during the development of this thesis Ana Loureiro, Ana Queirós, Eduardo Marques, Filipe
Chaves, José Machado, Marcelo Costa, Ricardo Carbas and Rodrigo Avendaño.
Acknowledgements to master students Rodrigo Avendaño (who later joined the group), Daniel
Rosendo and Pedro Fernandes for their contributions to this work.
Special thanks to the Brazilian colleagues and friends Daniel Kawasaki, Júlia Bonaldo, Pedro
Zugliani and Rosemere Lima and for their very important contribution at the last stages of this
study.
Thanks to prof. Raul Campilho for his precious advice and willingness to help whenever it was
needed.
My sincere gratitude to D. Emilia Soares for her help and to members of the workshop Mr.
José Fernando Rocha Almeida, Mr. Albino Alves Calisto Dias, Pedro Miguel Almeida Falcão
Alves and André Alves as well as to members of the testing laboratory Mr. Miguel Figueiredo
and Mr. Rui Silva.
I am very thankful and would like to express my sincere gratitude to my family and friends for
their encouragement, support and affection, without which it would not have been possible to
conclude this work.
An important contribution was given by Nagase Chemtex®, which partially funded and
supplied samples of adhesive for this study.
In last place, I would like to thank the Portuguese Foundation of Technology for partially
financing this work through research grant EXCL/EMS-PRO/0084/2012.

vi
vii
Table of Contents ABSTRACT ............................................................................................................................................. i
RESUMO ............................................................................................................................................... iii
AKNOWLEDGEMENTS ....................................................................................................................... v
LIST OF PUBLICATIONS ................................................................................................................... ix
SUMMARY OF THESIS ....................................................................................................................... 1
1. Introduction ..................................................................................................................................... 1
a. Background ................................................................................................................................. 1
b. Objectives ................................................................................................................................... 3
c. Research methodology ................................................................................................................ 4
d. Outline of the thesis .................................................................................................................... 5
2. Adhesives tested .............................................................................................................................. 9
3. Test methods ................................................................................................................................... 9
3.1 Bulk specimens ................................................................................................................. 10
3.1.1 Water absorption ........................................................................................................... 12
3.1.2 Tensile tests of bulk adhesive ....................................................................................... 13
3.2 Joint specimens ................................................................................................................. 13
3.2.1 Fracture tests ................................................................................................................. 14
3.2.2 Single-lap joints ............................................................................................................ 15
4. Numerical modelling .................................................................................................................... 16
5. Conclusion .................................................................................................................................... 17
6. Future work ................................................................................................................................... 18
6.1 Include the effect of fatigue loads in the developed cohesive element ................................. 18
6.2 Effect of different surface treatments and primers ................................................................ 18
6.3 Rate effects ............................................................................................................................ 18
REFERENCES ..................................................................................................................................... 19
APPENDED PAPERS .......................................................................................................................... 20

viii
ix
LIST OF PUBLICATIONS
1. G. Viana, M. Costa, M.D. Banea, L.F.M da Silva, A review on the temperature and
moisture degradation of adhesive joints, Proceedings of the Institution of Mechanical
Engineers, Part L: Journal of Materials: Design and Applications, 2017, vol. 231, issue
5, pp. 488-501.
2. G. Viana, M. Costa, M.D. Banea, L.F.M da Silva, Behaviour of environmentally
degraded epoxy adhesives as a function of temperature, The Journal of Adhesion,
2017, vol. 93, issue 1-2, pp. 95-112.
3. G. Viana, M. Costa, M.D. Banea, L.F.M da Silva, Water Diffusion in Double
Cantilever Beam Adhesive Joints, Latin American Journal of Solids and Structures,
2017, vol. 14, issue 2, pp. 188-201.
4. G. Viana, M. Costa, M.D. Banea, L.F.M da Silva, Moisture and temperature
degradation of double cantilever beam adhesive joints, Journal of Adhesion Science
and Technology, 2017, vol. 31, issue 16, pp. 1824-1838.
5. G. Viana, J. Machado, R. Carbas, M. Costa, L.F.M. da Silva, M. Vaz, M.D. Banea,
Strain rate dependence of adhesive joints for the automotive industry at low and high
temperatures, Journal of Adhesion Science and Technology, submitted.
6. P. Fernandes, G. Viana, R.J.C. Carbas, M. Costa, L.F.M. da Silva and M.D. Banea,
The Influence of Water on the Fracture Envelope of an Adhesive Joint, Theoretical
and Applied Fracture Mechanics, 2017, vol. 89, pp. 1-15.
7. G. Viana, R.J.C. Carbas, M. Costa, M.D. Banea, L.F.M. da Silva, A new cohesive
element to model environmental degradation of adhesive joints in the rail industry,
International Journal of Adhesion and Adhesives, submitted.

x

1
SUMMARY OF THESIS
1. Introduction
a. Background
Adhesives used in the automotive industry and in the transports industry in general must
operate under a variety of environmental conditions. They need to maintain the structural
integrity of the joint at low and high temperature (roughly between -40oC and 80oC) and, at the
same time, withstand high and low levels of moisture. Adhesives, which are polymeric
materials, show great sensitivity to this kind of conditions [1, 2]. However, some adhesives can
withstand these conditions, particularly epoxy adhesives. “Crash resistant” epoxy adhesives
are an example of adhesives that are increasingly being used mainly in the automotive industry
as they are at the same time relatively strong and ductile, they provide very tough joints, which
is key to have high absorption of energy in case of collision.
The application of adhesive bonding in transportation industries has been steadily growing.
Transportation industries in general are interested in reducing the weight of their vehicles, in
order to improve the performance and reduce fuel consumption and pollutant emissions.
Although its application in these industries has been steadily growing, the use of adhesive
bonding is still limited, as more traditional joining methods, such as riveting or bolting,
continue to be preferred due to their higher reliability. The main factor holding adhesive
bonding back is arguably the uncertainty regarding the adhesive’s mechanical properties in the
long term. Moisture and extreme temperatures are the main factors contributing to the
degradation of adhesive properties.
In order to properly design an adhesive joint that is subjected to environmental degradation, a
good prediction of the mechanical behaviour of the joint must be made. To achieve this
purpose, the temperature and moisture dependent mechanical properties of the adhesive must
be determined [3-7]. Moisture penetrates slowly into the adhesive layer: the edges of the
adhesive layer absorbed more water than center [4, 8]. Figure 1 shows the moisture distribution
in an adhesive layer as calculated using the finite element method (FEM). Consequently, there
will be a gradient in the moisture concentration of the adhesive, meaning that there will also be
a gradient in the mechanical properties of the adhesive [8, 9].

2
Cohesive zone models are often used together with the Finite element method to predict crack
initiation and propagation within the adhesive layer [4, 10, 11]. This allows to the engineer to
accurately predict the mechanical behaviour and the strength of complex adhesive joints. The
cohesive zone model relies on the cohesive zone law to predict crack initiation and propagation.
The simplest and most common cohesive zone law is the triangular zone law, pictured in Figure
2.
The cohesive zone law defines a relationship between the displacement and stress. First the
stress rises linearly until the yield stress of the adhesive is reached. Then, softening initiates.
In the triangular cohesive zone law, softening is linear but in other laws it can be more complex,
such as exponential or trapezoidal. This allows the model to capture the more ductile or fragile
behaviour of the adhesive. The triangular law, on the other hand, is the simplest law and the
easiest to implement.
% Moisture
0
1.18
Figure 1: Moisture distribution in the adhesive layer of an adhesive joint (only a quarter of the adhesive joint shown).
δ
σ
σmax
K
GC
Figure 2: Triangular cohesive zone model.
K: Stiffness
σmax: Strength of the adhesive
GC: Toughness of the adhesive

3
The modulus, yield stress and toughness of the adhesive give the initial stiffness, maximum
stress and area of the cohesive zone law. These three properties are enough to define the
triangular cohesive zone law. However, other laws need more require the determination of
more properties, which add to the complexity of the model.
Absorbed moisture is responsible for plasticization of the adhesive, which means that the
adhesive will become weaker and more ductile. This will change the shape of the cohesive
zone law. As water concentration is not uniform across the width of the adhesive joint, the
shape of the triangle at each element must be different. A cohesive zone element that can
change its properties as a function of local moisture and temperature will allow for more
reliable strength predictions [10].
In order to validate the proposed cohesive zone element, an aluminium rail used in the railway
industry to attach the seats of a train was considered. The possibility of bonding this rail to the
train floor instead of using the currently used mechanical fasteners was studied. Scaled
specimens of this joint were manufactured and environmentally exposed. A finite element
model using the developed cohesive zone element was put forward. Results given by the
numerical model generally matched well with experimental results.
b. Objectives
The main objective of this research was to develop a cohesive zone model that includes two
environmental degradation mechanisms of adhesive joints simultaneously: moisture and
temperature. This cohesive zone model can be used to predict the strength of adhesive joints
that are subjected to simultaneously high/low temperatures and humid environments and was
used in this study to predict the mechanical behaviour of a scaled adhesive joint used in the
railway industry. Two epoxy adhesives were studied.
The specific objectives are listed below:
• to determine the moisture absorption properties of the two adhesives studied;
• to determine the moisture and temperature dependent mechanical properties of both
adhesives studied;
• to experimentally determine the mechanical behaviour of a joint used in the railway
industry;

4
• to develop a cohesive zone model that can help predict the mechanical behaviour of
adhesive joints as a function of environmental moisture and temperature.
c. Research methodology
The following approach was used to complete the objectives of this PhD:
• A literature review on the moisture and temperature degradation of adhesive joints was
done in Paper 1. Techniques used to model adhesive joints under moist environments
were also addressed in this paper.
• The failure strength of the bulk adhesive as a function of environmental moisture and
temperature was determined. The water absorption characteristics of each studied
adhesive was assessed. This information is published in Paper 2.
• Fracture tests were performed in Paper 3 and in Paper 4. In Paper 3, double cantilever
beam specimens were immerged in distilled water salt water and the partially saturated
specimens were tested regularly over a period of time. In Paper 4, the mode I toughness
of both studied adhesives were determined as a function of environmental moisture and
temperature.
• In Paper 5, the effect of strain rate and temperature on the strength of adhesive joints
for the automotive industry is assessed. A finite element model was used to predict the
mechanical behaviour of adhesive joints under quasi-static and impact conditions.
• Paper 6 presents a study about the effect of moisture on the fracture envelop of an
adhesive using the “open-faced technique”. Experimental results obtained by using a
special apparatus that subjects the adhesive to diverse mixed mode ratio were
successfully modelled using the finite element method.
• Scaled specimens of a rail used in the railway industry to attach the seats of a train were
produced and tested at low and high temperatures. Prior to testing, the specimens were
exposed to distilled water and to salt water, so that the adhesive layer was partially
saturated at the time the specimen was tested. A cohesive zone element that includes
moisture and temperature degradation was developed and used to predict the failure
load of the scaled adhesive joint. The results are shown in Paper 7.
5
d. Outline of the thesis
This PhD thesis is constituted by seven papers and a summary. The abstract of each paper is
summarized below:
Paper 1 G. Viana, M. Costa, M.D. Banea, L.F.M. da Silva
Abstract of Paper 1: Despite offering very attractive advantages over traditional joining
methods, one of the setbacks of adhesive bonding is its long term strength in aggressive
environments, such as environments with high moisture and extreme temperatures. With the
rise of new lightweight materials and their recent use in everyday vehicles, transportation
industries have been very interested in determining the long term behaviour of adhesive
joints. The aim is to build durable, lighter vehicles, which consume less energy and emit less
pollution.
The two main factors that affect the strength of vehicle adhesive joints are exposure to moist
environments and high and low temperatures. There are some works concerning the effect
of these two factors separately and some predictive models have been developed, which help
the engineer to design reliable, safe and efficient adhesive joints. However, the combined
effect of temperature and moisture is not yet totally understood.
Paper 2 G. Viana, M. Costa, M.D. Banea, L.F.M. da Silva
Abstract of Paper 2: Structural adhesives are increasingly being used in the aerospace and
automotive industries. They allow for light weight vehicles, fuel savings and reduced
emissions. However, the environmental degradation of adhesive joints is a major setback in
its wide implementation. Moisture degradation of adhesive joints includes plasticization,
attacking of the interface, swelling of the adhesive and consequent creation of residual
stresses. This may lead to reversible and irreversible damage. The main factors affecting the
strength of adhesive joints under high and low temperatures are the degradation of the
adhesive mechanical properties and the creation of residual stresses induced by different
coefficients of thermal expansion (between the adhesive and the adherends). The effect of
the combined effect of moisture and temperature is not yet fully understood. The aim of this
study is to shed light on this subject.
In this work water absorption tests were conducted at different moisture conditions in order
to assess the diffusion coefficient, maximum water uptake and glass transition temperature.
Aged and unaged small dogbone tensile specimens were tested under different temperature

6
conditions. The glass transition temperature of the adhesives as a function of the water uptake
was assessed. The aim is to determine the evolution of the properties of two epoxy adhesives
as a function of two variables (environmental temperature and moisture).
As a consequence of water sorption, the glass transition temperature of the adhesives studied
dropped significantly. This has an effect on the mechanical properties of the adhesives,
especially at high temperature. At lower temperatures, although some plasticization occurs,
its effect is not as significant.
Paper 3 G. Viana, M. Costa, M.D. Banea, L.F.M. da Silva
Abstract of Paper 3: Structural adhesives are increasingly being used in the aerospace and
automotive industries. They allow for light weight vehicles, fuel savings and reduced
emissions. However, the environmental degradation of adhesive joints is a major setback in
its wide implementation. Moisture degradation of adhesive joints includes plasticization,
attacking of the interface, swelling of the adhesive and consequent creation of residual
stresses. This may lead to reversible and irreversible damage.
In this work double cantilever beam (DCB) specimens using two different adhesives for the
automotive industry were subjected to two different ageing environments. They were tested
periodically until the toughness of the adhesives stabilized, which means that they were fully
degraded. An association was made between the toughness of the adhesive and the amount
of water that it had absorbed. This way it was possible to indirectly measure the water uptake
in an adhesive joint taking into account the water uptake properties of the adhesives studied,
which had been determined in another study.
It was found that diffusion of water into the studied adhesive joints was faster than diffusion
through the bulk adhesive alone. A model that takes into account diffusion through the
interface between the adhesive and the adherends was proposed.
Paper 4 G. Viana, M. Costa, M.D. Banea, L.F.M. da Silva
Abstract of Paper 4: In this work, the Double Cantilever Beam (DCB) test is analysed in
order to evaluate the combined effect of temperature and moisture on the mode I fracture
toughness of adhesives used in the automotive industry. Very few studies focus on the
combined effect of temperature and moisture on the mechanical behaviour of adhesive joints.
To the authors’ knowledge, the simultaneous effect of these conditions on the fracture
toughness of adhesive joints has never been determined.

7
Specimens using two different adhesives for the automotive industry were subjected to two
different ageing environments (immersion in distilled water and under 75% of relative
humidity). Once they were fully degraded, they were tested at three different temperatures
(-40oC, 23oC and 80oC), which covers the range of temperature an adhesive for the
automotive industry is required to withstand. The aim is to improve the long term mechanical
behaviour prediction of adhesive joints. The DCB substrates were made of a high strength
aluminium alloy to avoid plastic deformation during test. The substrates received a
phosphoric acid anodisation to improve their long term adhesion to the adhesive.
Results show that even though a phosphoric acid anodization was applied to the adherends,
when the aged specimens were tested at room temperature and at 80oC, they suffered
interfacial rupture. At -40oC, however, cohesive rupture was observed and the fracture
toughness of the aged specimens was higher.
Paper 5 G. Viana, J. Machado, R. Carbas, M. Costa, L.F.M. da Silva, M. Vaz, M.D.
Banea
Abstract of Paper 5: In this study the impact and quasi-static mechanical behaviour of
single lap joints (SLJ) using a new crash resistant epoxy adhesive has been characterized as
a function of temperature. Single lap adhesive joints were tested using a drop weight impact
machine (impact tests) and using an universal test machine. Induction heating and nitrogen
gas cooling was used in order to achieve an homogeneous distribution of temperature along
the overlap of +80oC and -20oC, respectively. Adherends made of mild steel, similar to the
steel used in automobile construction, were chosen in order to study the yielding effect on
the strength of the SLJ. Results showed that at room temperature (RT) and low temperature
(LT), failure was dictated by the adherends due to the high strength of the adhesive. At high
temperature (HT), a decrease was found in the maximum load and energy absorbed by the
joint due to the reduced strength of the adhesive at this temperature. The results were
successfully modelled using the commercially available finite element software Abaqus®.
Good correlation was found between experimental and numerical results, which allows the
reduction of experimental testing.

8
Paper 6 P. Fernandes, G. Viana, R.J.C. Carbas, M. Costa, L.F.M. da Silva, M.D.
Banea
Abstract of Paper 6: This research aims at determining the fracture envelope of an adhesive
as a function of the water content. The fracture toughness of an adhesive joint was
determined under pure mode I, II and mixed mode I+II loadings, in three different
environments: dry, aged in salt water and aged in distilled water. The fracture toughness
under mode I and II were determined using Double Cantilever Beam (DCB) and End-
Notched Flexure (ENF) tests, respectively. The characterization of the fracture toughness
under mixed-mode was done using an apparatus capable of applying a wide range of loadings
that go from pure mode I to almost pure mode II. To accelerate the diffusion process and
obtain a uniform water concentration in the adhesive joint, a modified DCB specimen
(ODCB specimen) was adopted. Finite Element (FE) analysis was used to determine the
gradient of water concentration in both specimens and to validate the use of the modified
DCB specimens, comparing the fracture toughness obtained using DCB and ODCB
specimens. It was found that the toughness of the adhesive changed as a function of the
ageing environment. For the salt water environment, the mechanical properties increased,
while for the distilled water environment, degradation of the mechanical properties was
observed.
Paper 7 G. Viana, R. Carbas, M. Costa, L. F. M. da Silva, M. D. Banea
Abstract of Paper 7: This work addresses the strength of adhesive joints used in the rail
industry. The capability of structural adhesives to bond an aluminium rail used to assemble
the seats inside the train is investigated. Scaled specimens of these joints were mechanically
tested under a wide range of temperatures (from -40oC to 80oC) before and after ageing in
distilled water in order to simulate real life conditions.
A three dimension numerical simulation was carried out to understand the magnitude of
stresses present in the adherends and in the adhesive layer. A new developed cohesive
element was used along with the finite element method to predict the behaviour of an
adhesive joint after environmental degradation.
Results show that even though a phosphoric acid anodization was applied to the adherends,
sopme specimens suffered interfacial rupture. A new cohesive zone element has been
developed and was used to predict cohesive failure of the adhesive. The model gave accurate

9
results and was able to successfully predict cohesive failure of every joint that failed
cohesively in the adhesive layer.
2. Adhesives tested
In this thesis, two different kinds of toughened epoxy adhesive were considered:
• SikaPower 4720, a bi-component that cures at room temperature for 24h and is supplied
by Sika® Portugal (Vila Nova de Gaia)
• Nagase ChemteX XNR6852-1, a single component that cures for 3h at 150oC and is
supplied by Nagase (Osaka, Japan)
Exceptionally, the adhesive used for the single-lap joints under quasi-static and impact loads
in Paper 5 was a more recent version of the adhesive supplied by Nagase ChemteX (XNR6852-
1), which has improved strength under impact conditions.
Tests show that XNR6852-1 performs better than SikaPower 4720: it is stronger, more ductile,
absorbs less water, has a higher Tg, is tougher and is not severely affected by moisture.
SikaPower 4720 has the advantage of being a bi-component, which does not require
conditioning in cold atmosphere and can cure at room temperature.
3. Test methods
In this study, to characterize the mechanical behaviour of the adhesive as a function of
temperature and absorbed moisture, a triangular cohesive zone model was used. This triangle
changes its shape depending on the mentioned environmental factors. To define the triangle at
each temperature and moisture condition, an extensive battery of experimental tests had to be
carried out [12-14].
To determine the effect of moisture on the mechanical properties of the adhesive, it is necessary
to test water saturated adhesive specimens. However, to expose adhesive joints until saturation
takes generally several years. Due to the difficulty in obtaining fully saturated specimens in a
timely manner, two approaches were adopted:

10
1. Smaller specimens were employed. These specimens, due to their small width,
allowed to reduce the time required to saturate the adhesive layer [9, 13, 14];
2. Open faced specimens were used [15]. Instead of exposing the adhesive layer inside
the joint, a very thin adhesive plate of bulk adhesive was manufactured and exposed
outside the joint. Because the exposed area of the bulk adhesive plate is much higher
than the adhesive layer in a joint, saturation is reached in a matter of days. After
saturation, this bulk adhesive plate is bonded to the substrates using a stronger
adhesive. The stronger adhesives ensures that failure can only occur in the exposed
adhesive layer.
Bulk tensile tests were performed to determine the Young’s modulus and Yield stress of each
studied adhesive. The mode I fracture toughness was determined using small double cantilever
beam (DCB) specimens. Open-faced specimens were used to determine the effect of absorbed
moisture on the fracture envelop of the adhesive. Reduced size specimens were preferred to
determine mode I fracture toughness due to a set of advantages:
1. Smaller specimens can be produced easily in larger quantities;
2. They are small enough to be tested at high and low temperatures in the available test
machines
3. These specimens do not need to be environmentally exposed for as long as standard
specimens, as their exposed surface area is greater.
Water absorption tests were performed to determine the speed of water intake of each adhesive.
The moisture dependent Tg of both adhesives was measured using a new method based on
DMA [16] in order to assess the decay of the glass transition temperature with absorbed
moisture. In the following subsections, the experimental methods used in this thesis is
explained with more detail.
3.1 Bulk specimens
Bulk specimens were manufactured from bulk adhesive plates. As the studied adhesives are
relatively stiff, machining of bulk adhesive plates was feasible and the quality of the finish
product was very high. Specimens manufactured with this method include bulk water sorption
specimens, Tg specimens and bulk tensile specimens. In order to manufacture the required bulk
adhesive plate, a mould was used (represented in Figure 3).

11
Figure 3: Exploded view of the mould used to produce bulk adhesive plates.
A silicone rubber frame was used to ensure the required thickness of the adhesive plate. After
the adhesive has been applied, the mould is closed and placed in a hot plates press for the cure
schedule. In the case of adhesives that cure at room temperature, the plate is left under pressure
for 24h and left to cure outside the press for at least 14 days before being tested or subjected to
environmental exposure.
The manufactured bulk adhesive plate must be machined with the shape of the suitable bulk
adhesive specimen, in this case either Tg specimens, water absorption specimens or bulk tensile
specimens, as represented in Figure 4.

12
a b c
Figure 4: Types of bulk adhesive specimens used in this thesis:
a. Small bulk tensile specimens;
b. Water absorption specimens;
c. Tg specimens.
3.1.1 Water absorption
Before exposing the specimens to their aging environment, they must be kept in a dry desiccator
in order to eliminate any water that may have been absorbed from the air. Then, the initial
weight of each water sorption specimen is measured with a high resolution scale and exposed
to the suitable environment. It is important that every face of the specimen is being exposed.
The weight of each specimen must be periodically measured until saturation is attained. The
results are plotted against √𝑡𝑙2⁄ . An example of such a graph is given in Figure 5.
ξ𝒕
𝒍 ቆ
ξ𝒉
𝒎𝒎ቇ
0
0.2
0.4
0.6
0.8
1
1.2
1.4
0 20 40 60 80 100 120
%W
ate
r u
pta
ke
Figure 5: Example of the absorption curve of an epoxy adhesive.

13
In this case (one dimension absorption), the water concentration of at each point of the adhesive
is given by:
𝑐
𝑐∞= 1 −
4
𝜋∑
(−1)𝑛
(2𝑛 + 1)
∞
𝑛=0
𝑒𝑥𝑝 [−𝐷(2𝑛 + 1)2𝜋2𝑡
4𝑙2] × cos [
(2𝑛 + 1)𝜋𝑥
2𝑙]
Eq.1
Where 𝑐∞ is the concentration of water in the surface layers, which is supposed to be attained
instantaneously, 𝑙 is half of the layer’s width, 𝑡 is the time. The center of the adhesive is located
in 𝑥 = 0.
Equation (2) is the integration of equation (1). Instead of giving the water concentration in each
point, which is hard to obtain experimentally, it gives the fractional mass uptake of the entire
specimen [26].
𝑚𝑤𝑡𝑡
𝑚𝑤𝑡∞= 1 −
8
𝜋2∑
1
(2𝑛 + 1)2𝑒𝑥𝑝 [
−𝐷(2𝑛 + 1)2𝜋2𝑡
4𝑙2]
∞
𝑛=0
Eq.2
𝑚𝑤𝑡∞ is the moisture level at equilibrium and 𝑚𝑤𝑡𝑡 is the moisture level at instant t.
3.1.2 Tensile tests of bulk adhesive
Tensile tests of both studied adhesives were determined using tensile bulk specimens produced
from bulk adhesive plates, as described in section 3.1. Tests were carried out at room
temperature, -40oC and 80oC. This range of temperatures was achieved by using a climatic
chamber coupled to a universal testing machine.
At each temperature condition, three kind of specimens were considered: dry specimens,
specimens exposed to a saturated solution of NaCl and specimens exposed to distilled water.
This allowed to study the effect of moisture and temperature degradation in the mechanical
properties of the bulk adhesive simultaneously (see Paper 2).
3.2 Joint specimens
To manufacture high quality adhesive joints, it is necessary to prepare the surfaces to bond.
The surfaces should be rough to increase the surface area and to improve mechanical
interlocking between adherend and adhesive. The maximum amount of contaminants should

14
be removed and sometimes, depending on the application and on the materials to bond, a
surface treatment should be applied.
The surface of each adherend was grit blasted and degreased with acetone prior to the
application of the adhesive. A mould was used to line the adherends in place. This mould was
introduced in a hot plates press to perform the suitable cure schedule according to the adhesive
used.
In the case of environmentally exposed adhesive joints using aluminium adherends, to avoid
corrosion of substrates and consequent loss of joint strength, the surface of the substrate
received a phosphoric acid anodisation, as described in standard ASTM D3933 [17], prior to
application of adhesive. This is proven to improve the wettability of the surface and its
resistance to moist environments [18], This consists in immerging the surfaces to anodise in a
12% concentration phosphoric acid solution while an electric current flows between the
adherends (positive pole) and solution (negative pole). The difference in electric potential
between substrates and solution should be between 14 and 16 Volts.
Specific information about each kind of specimen can be found in the following sub sections.
3.2.1 Fracture tests
To design adhesive joints, the availability of reliable damage models depends on the knowledge
of the fracture toughness of the adhesive. The fracture toughness varies according to the mode
of loading (between modes I, II and III, as explained in Figure 6).
Figure 6: Modes of crack propagation.

15
Mixed mode loadings are also possible as, in adhesive joints, the crack is constrained by the
adherends.
Water penetrates very slowly into the adhesive layer. This means that the saturation of the
adhesive layer in a standard DCB specimen is attained several years after. Numerical
predictions show that the small specimens used in this thesis saturate in a matter of months,
which allows to obtain important information about the toughness of the adhesive in a timely
manner. This technique was used in Paper 3 and Paper 4.
An alternative approach can also be taken. Instead of reducing the dimensions of the specimen,
“open-faced specimens” can be used [18-20]. First a very thin plate of adhesive must be
exposed. The absorption of water is very fast, as it is very thin and has a very surface area.
After, the saturated plate should be bonded to the adherends using a stronger adhesive
(secondary adhesive). As the exposed layer of adhesive is weaker than the secondary adhesive,
the crack propagates through the adhesive that had been exposed. If the crack propagates
through the secondary adhesive, the test cannot be considered valid. This technique was
adopted in Paper 6.
3.2.2 Single-lap joints
Due to its simplicity and capability to provide relatively strong joints, the single lap joint is the
kind of joint that is most commonly used in the industry. It is also often used to assess the
performance of adhesives in real life applications.
Despite being loaded mostly in shear, peel stresses that arise especially at the ends of the
overlap due to load misalignment [21] can compromise the strength of the joint. Shear stress is
also not uniform: it is higher at the ends of the overlap and lower in the middle. Because the
stress in this joint is not uniform, it cannot be used to determine properties of the adhesive but
is a good indicator of the suitability of an adhesive for a given application [22].
Tests were made to assess the quasi-static and impact strength of single-lap joints at low, high
and room temperature using XNR 6852. Details are given in Paper 5.

16
4. Numerical modelling
The Finite element method (FEM) has shown acceptable results in the analysis of adhesive
joints, traditionally by using stress/strain criteria. These criteria are based on the analysis of
stresses and strains of the structures. With the help of the FEM, it is possible to know the stress
and displacement field around a certain point. However, real structures have points where the
stress concentration factor tends to infinite. In these singular points, the solution provided by
the FEM is highly mesh-dependent and not accurate. This kind of problem can be minimized
with the use of the point stress criterion [23], in which the stresses are computed at a pre-
defined distance from the singular point, and with the use of average stress criterion [23], in
which an average stress is computed along a determined path.
Unlike the stress/strain based criteria, fracture mechanics based criteria have the ability to
determine, taking into account the existence of singular points in the structure, when a crack
may start to propagate. However, these methods are difficult to implement in adhesive joints
because, although every material has its defects, their size or location is very difficult to
determine.
Cohesive zone models (CZM) have the advantage of combining the stress/strain based criteria
with fracture mechanics, accurately predicting the behaviour of the materials. CZM can predict
the formation and propagation of cracks [23]. As soon as, in a given node, the strength of the
material is reached, softening initiates. Depending on the properties of the material, several
cohesive laws can be used to simulate the softening of the material. These include triangular,
linear-parabolic, polynomial, exponential and trapezoidal laws. Although cohesive laws can be
adjusted to better fit the behaviour of the material, the triangular CZM, due to its simplicity, is
very widely used and provides good results for most real situations [24][37]. In this thesis,
every simulation was carried out with the use of a triangular cohesive zone model, as described
in Paper 7. The triangular cohesive law has an initial elastic behaviour. After the maximum
stress is achieved, linear softening initiates. When the stress reaches the value of zero, no load
can be transmitted, which is the same as saying that a crack has been created.
The elastic domain is defined by a constitutive matrix [K] containing stiffness parameters.
𝑡 = {𝑡𝑛
𝑡𝑠} = [
𝐾𝑛𝑛 𝐾𝑛𝑠
𝐾𝑛𝑠 𝐾𝑠𝑠] . {
𝜀𝑛
𝜀𝑠} = 𝐾𝑠
Eq.3
17
𝐾𝑎𝑏 are the values attributed to the stiffness matrix [𝐾]. 𝑛 corresponds to mopde I and 𝑠 corresponds
to mode II.
For thin adhesive layers, the following approximations can be used:
𝐾𝑛𝑛 = 𝐸 Eq.4
𝐾𝑠𝑠 = 𝐺 Eq.5
𝐾𝑛𝑠 = 0 Eq.6
For the damage initiation, the quadratic criterion was used:
{⟨𝑡𝑛⟩
𝑡𝑛0 }
2
+ {𝑡𝑠
𝑡𝑠0}
2
= 1 Eq.7
“⟨ ⟩" are the Macaulay brackets, which indicate that compressive loads do no contribute to
damage initiation.
Linear or quadratic energetic criteria can be used:
Linear criterion: 𝐺𝑛
𝐺𝑛𝑐 +
𝐺𝑠
𝐺𝑠𝑐 = 1
Eq.8
Quadratic criterion: (
𝐺𝑛
𝐺𝑛𝑐)
2
+ (𝐺𝑠
𝐺𝑠𝑐)
2
= 1 Eq.9
5. Conclusion
This work focused on the development of a cohesive zone model for adhesive joints that
considers environmental degradation. With this in mind, the moisture and temperature
dependent mechanical properties of two adhesives were determined. In order to predict the
velocity of moisture diffusion into the adhesive joint, the diffusion properties of the adhesive
were measured. With this information, it was possible to attribute a distinct set of properties to
each cohesive element. This results in the accurate prediction of the mechanical behaviour of
adhesive joints subject to moist environments.
Bulk adhesive specimens were used to determine the Young’s modulus and strength of both
adhesives studied as a function of environmental moisture and temperature. Due to the
difficulty in obtaining fully saturated specimens in a timely manner, alternative ways to saturate

18
the adhesive were used. This enabled to measure the mode I toughness of both adhesives as a
function of the environmental conditions addressed in this study.
The strength of single lap adhesive joints as a function of temperature under quasi-static and
impact conditions was also addressed in this study. Taking into account the determined strain
rate dependent properties of adhesive and adherend, a finite element model was created to
predict the strength of adhesive joints under impact loads and high and low temperatures.
The experimental information reunited allowed to create a cohesive zone element that can be
used to predict the mechanical behaviour of adhesive joints under different conditions of
moisture and temperature.
6. Future work
6.1 Include the effect of fatigue loads in the developed cohesive element
It would be very interesting to include the effect of fatigue loads in the developed cohesive element.
The effect of environmental moisture on the fatigue behaviour of the two adhesives analysed in this
thesis was studied by Costa et al. [25]. This would not be as hard as if work had be started from the
very beginning, as most experimental work has already been performed.
6.2 Effect of different surface treatments and primers
In this study, failure of some adhesive joints was dictated by the interface between adhesive
and adherend. This kind of failure results in a significantly lower strength of the joint that is
very hard to predict. To most industries this is not acceptable. The logical way to prevent
adhesive failure from happening is to improve wettability and corrosion resistance of the
substrates. This can be done by choosing a more appropriate surface preparation and applying
a compatible primer to the adherend surface.
6.3 Rate effects
To many transport industries and to the automotive industry in general, adhesive joints are
required to withstand high impact loads. This means that the adhesive is loaded under very

19
high strain rates. It would be very interesting to study the behaviour of the adhesive under these
conditions and include this behaviour into the developed cohesive zone model.
REFERENCES
[1] Zhou, J. M., Lucas, J. P., Polymer 40, 5505-5512 (1999).
[2] Zhang, Y., Adams, R. D., da Silva, L. F. M., J Adhesion 90, 327-345 (2014).
[3] Jurf, R. A., Vinson, J. R., J Mater Sci 20, 2979-2989 (1985).
[4] Han, X., Crocombe, A. D., Anwar, S. N. R., Hu, P., Int J Adhes Adhes 55, 1-11 (2014).
[5] Li, W. D., Ma, M., Han, X., Tang, L. P., Zhao, J. N., Gao, E. P., J Adhesion 92, 916-937 (2016).
[6] Banea, M. D., da Silva, L. F. M., Campilho, R. D. S. G., J Adhes Sci Technol 28, 1367-1381
(2014).
[7] Hu, P., Han, X., da Silva, L. F. M., Li, W. D., Int J Adhes Adhes 41, 6-15 (2013).
[8] Crocombe, A. D., Int J Adhes Adhes 17, 229-238 (1997).
[9] Sugiman, S., Crocombe, A. D., Aschroft, I. A., Int J Adhes Adhes 40, 224-237 (2013).
[10] Sugiman, S., Crocombe, A. D., Aschroft, I. A., Engineering Fracture Mechanics 98, 296-314
(2013).
[11] Banea, M. D., da Silva, L. F. M., Campilho, R. D. S. G., J Adhes Sci Technol 26, 939-953
(2012).
[12] Viana, G., Costa, M., Banea, M. D., da Silva, L. F. M., The Journal of Adhesion 93, 95-112
(2016).
[13] Viana, G., Costa, M., Banea, M. D., Silva, L. F. M. d., J Adhes Sci Technol 31, 1824-1838
(2017).
[14] Viana, G., Costa, M., Banea, M. D., da Silva, L. F. M., Latin American Journal of Solids and
Structures 14, 188-201 (2017).
[15] Fernandes, P., Viana, G., Carbas, R., Costa, M., da Silva, L., Banea, M., Theoretical and Applied
Fracture Mechanics 89, (2017).
[16] Zhang, Y., Adams, R. D., Da Silva, L. F. M., J Adhesion 89, 785-806 (2013).
[17] ASTM. Standard Guide for Preparation of Aluminum Surfaces for Structural Adhesives Bonding
(Phosphoric Acid Anodizing). 2017. p. 5.
[18] Goglio, L., Rezaei, M., J Adhesion 89, 769-784 (2013).
[19] Goglio, L., Rezaei, M., Rossetto, M., J Adhes Sci Technol 28, 1382-1393 (2014).
[20] Wylde, J. W., Spelt, J. K., Int J Adhes Adhes 18, 237-246 (1998).
[21] da Silva, L., das Neves, P., Adams, R. D., Spelt, J. K., Int J Adhes Adhes 29, 310-330 (2009).
[22] da Silva, L. F. M., Dillard, D., Blackman, B., Adams, R. D., Testing adhesive joints - Best
practices, (Wiley, Weinheim, 2012). Chapter,
[23] Advances in Numerical Modelling of Adhesive Joints, Springer Briefs in Computational
Mechanics. 2012.
[24] Liljedahl, C. D. M., Crocombe, A. D., Wahab, M. A., Ashcroft, I. A., International Journal of
Fracture 141, 147-161 (2006).
[25] Costa, M., Viana, G., da Silva, L. F. M., Campilho, R. D. S. G., Materialwissenschaft und
Werkstofftechnik (2016).

20

21
APPENDED PAPERS

PAPER 1


Review article
A review on the temperature andmoisture degradation of adhesive joints
G Viana1, M Costa1, MD Banea2 and LFM da Silva3
Abstract
Despite offering very attractive advantages over traditional joining methods, one of the setbacks of adhesive bonding is
its long-term strength in aggressive environments, such as environments with high moisture and extreme temperatures.
With the rise of new lightweight materials and their recent use in everyday vehicles, transportation industries have been
very interested in determining the long-term behavior of adhesive joints. The aim is to build durable, lighter vehicles,
which consume less energy and emit less pollution. The two main factors that affect the strength of vehicle adhesive
joints are exposure to moist environments and high and low temperatures. There are some works concerning the effect
of these two factors separately and some predictive models have been developed, which help the engineer to design
reliable, safe, and efficient adhesive joints. However, the combined effect of temperature and moisture is not yet totally
understood. This paper presents a review on the temperature and moisture degradation of adhesive joints.
Keywords
Moisture degradation, temperature degradation, environmental degradation, numerical modeling of adhesive joints,
structural adhesive joints
Date received: 7 June 2016; accepted: 6 September 2016
Introduction
Structural adhesives are increasingly being used inseveral industries. Adhesive joints allow for uniformstress distributions, higher fatigue resistance, and forjoining dissimilar materials. The only viable way ofjoining fiber-reinforced plastics is with a structuraladhesive.1,2 This translates into stronger and lighterand fatigue-resistant structures. Adhesive joints areincreasingly being used in civil engineering, particu-larly in timber structures.3,4 Transport industries, inparticular, are very interested in this kind of technol-ogy as it allows higher energy efficiencies and reducedemissions.
The automotive industry, in particular, has beeninvesting in the development of adhesive bonding inrecent years. Automotive manufacturers are inter-ested in reducing the weight of their vehicles inorder to improve their efficiency and reduce emissions.However, vehicles must be able to withstand import-ant loads during their lifetime, probably the mostdemanding for the adhesive joint being impactloads, that are caused when the vehicle crashes.These stresses must be withstood under a great varietyof temperatures (usually between �40 �C and 80 �C)and relative humidity, so that the safety of thepassengers can be assured.
Moisture is absorbed by the adhesive in two differ-ent ways: as free water, which occupies the free spaces
of the adhesive and is responsible for plasticization.Water is also absorbed as bound water, which formssingle or multiple hydrogen bonds with the adhesive’spolymer chain, resulting in swelling of the adhesive,plasticization and consequent decrease of strengthand glass transition temperature (Tg). Usually, if thewater uptake is done at low temperatures, as soon asthe adhesive is dried, its mechanical properties areusually recovered. It is usually, therefore, a reversibleprocess.
High temperatures are also responsible for degrad-ing the adhesive properties. Sometimes for shortexposure times, the adhesive joint’s properties areimproved due to post cure effects. However, aftera certain amount of time, its properties start todecrease.5
1Instituto de Ciencia e Inovacao em Engenharia Mecanica e Engenharia
Industrial (INEGI), Oporto, Portugal2Federal Centre of Technological Education in Rio de Janeiro (CEFET),
Rio de Janeiro, Brazil3Departamento de Engenharia Mecanica, Faculdade de Engenharia da
Universidade do Porto (FEUP), Oporto, Portugal
Corresponding author:
LFM da Silva, Departamento de Engenharia Mecanica, Faculdade de
Engenharia da Universidade do Porto (FEUP), 4200-465 Oporto,
Portugal.
Email: [email protected]
Proc IMechE Part L:
J Materials: Design and Applications
0(0) 1–14
! IMechE 2016
Reprints and permissions:
sagepub.co.uk/journalsPermissions.nav
DOI: 10.1177/1464420716671503
pil.sagepub.com
at UNIV CALGARY LIBRARY on October 3, 2016pil.sagepub.comDownloaded from

The environmental degradation of adhesive jointsis still a major setback in their wide implementation.Studies have been made regarding the moisture andtemperature degradation of adhesives, which includereduction of their mechanical properties, inducedplasticization, and decrease of Tg. The deleteriouseffects are usually greater in adhesive joints due tothe creation of residual stresses between the adhesiveand the adherends and due to the degradation of theinterface between the adhesive and the adherends,which may cause interfacial failure. In order toimprove the strength of the adhesive–adherend inter-face, a suitable surface treatment should be used.
This paper is a review on recent developments onthe effect of environmental conditions on the mech-anical response of adhesive joints and on the methodsused to predict their behavior. The paper is organizedin the following sections: the first section handleson the temperature degradation of adhesive joints(adhesive properties, residual stresses, and its influ-ence in the adhesive joints), followed by a review onthe moisture degradation of adhesive joints. The lastsections are about the combined effect of temperatureand moisture of adhesive joints and about modelingtechniques for aged adhesive joints.
Temperature degradation
Adhesive properties
Generally, adhesive mechanical properties show tem-perature dependence. At high temperatures, the yieldstress and Young’s modulus are usually reduced whileat low temperatures, the adhesive is generally very stiffand strong.6 The ductility has the opposite evolution:high at high temperatures and low at low tem-peratures. A review on low and high temperaturedegradation of adhesive joints was performed byMarques et al.7
Due to their polymeric nature, the capability ofadhesives to support extreme temperatures is limited.Even high temperature adhesives show usually somedegree of degradation above 200 �C. Nonetheless,there are adhesives capable of supporting relativelyhigh temperatures, about 300 �C, such as someceramic adhesives, or low temperatures, down to�100 �C, such as room temperature vulcanizing(RTV) silicon adhesives. However, it is not foresee-able that in the near future a single adhesive will beable to withstand this range of temperatures. In orderto design an adhesive joint for being used under highor low temperatures, a suitable adhesive must bechosen. The capability of an adhesive to supportlow or high temperatures is closely related to its Tg.Below Tg, the adhesive is in a glassy state, it tends tobe stiff, strong, and with limited ductility. On theother hand, above Tg, the adhesive is generally weakand flexible. Therefore, in order to avoid loss of adhe-sive strength, the adhesive should be generally used
below Tg. Adhesives for high temperature use haveusually high Tg while adhesives for low temperatureapplications have usually a low Tg.
Tg depends not only on the kind of adhesive that isused, but also on the cure cycle of the adhesive andon its thermal history,8–10 which will consequentlyinfluence the behavior of the adhesive at hightemperatures.
Banea et al.11 determined the toughness of anepoxy adhesive for the automotive industry as a func-tion of temperature. A significant temperaturedependence was found: above Tg there is a very sig-nificant drop in mode I fracture toughness (GIC) whilebelow it is fairly constant.
Adhesives are polymeric materials and, as a result,they allow mobility of their chains, especially at hightemperatures, where viscoelasticity and creep play animportant role in their mechanical behavior. Creep isa time-dependent deformation that occurs below theyield stress of the adhesive.
In order to model the creep behavior of adhesives,one has to account not only for their elastic deform-ation, but also for their viscous deformation. It isusually done using one or more elements with aspring and a dashpot either in parallel (Maxwell’selement) or in series (Kelvin–Voigh element),12 as illu-strated in Figure 1. The spring accounts for the elas-ticity part of the behavior and the dashpot for theviscous part.
Creep tests are generally expensive and time-consuming. Mizah et al.13 developed a machine that
σ
η1 η2 η3 ηn
E1 E2 E3 En
σ
η1η2ηn
E1E2En
(a)
(b)
Figure 1. Maxwell’s (a) and Kelvin–Voigh’s (b) elements.
2 Proc IMechE Part L: J Materials: Design and Applications 0(0)
at UNIV CALGARY LIBRARY on October 3, 2016pil.sagepub.comDownloaded from

is able to test several specimens at the same time, thusreducing the time and cost.
Thermal stresses
Stresses induced by thermal expansion are usually notnegligible in adhesive joints subjected to high and lowtemperatures. Adhesives and substrates have usuallydifferent coefficients of thermal expansion. As thetemperature rises, the constrained materials tend toaccumulate stresses that can be responsible for thereduction of the joint’s strength.
If the adhesive cures at high temperature, as itcools down after cure, residual thermal stresses aswell as shrinkage stresses arise and, as the molecularmobility is low at this temperature, they do not relaxeasily, which means that residual stresses in adhesivejoints do no occur only at extreme temperatures.However, there is a temperature at which no thermalstresses exist, called the stress-free temperature (TSF),which was first introduced by Hart-Smith.14
Yu et al.15developed a dilatometer to measure theshrinkage of the adhesive during cure.
The magnitude of the thermal stresses depend onmany factors, such as the mechanical properties of theadhesive, the geometry of the joint, the stiffness of theadherends, and the work temperature. It can be eval-uated by the thermal load (DT)
�T ¼ T0 � TSF ð1Þ
where T0 is the operating temperature and TSF is thetemperature at which cure is initiated (slightly belowthe actual cure temperature). Because TSF is very closeto the actual cure temperature, if one assumes thatTSF and the cure temperature are the same, no signifi-cant error is committed. This relationship is only validas long as the adhesive operates below Tg. Above Tg,the adhesive is much more flexible and insensitive toresidual stresses. When the adhesive is cooled downagain, in order to compute DT, one should take intoaccount Tg and not TSF.
16
In order to measure the coefficient of thermalexpansion of adhesives, either the common dilatome-try using strain gages or the bi-material curved beammethod17,18 can be used. This last method consists insubjecting a beam made of two different materials,usually a metal, whose coefficient of thermal expan-sion (CTE) is known and the adhesive whose CTE isto be measured. The beam is subjected to high or lowtemperatures and its deformation, which depends onthe adhesive’s CTE, is measured.
Although thermal stresses always arise in bondedjoints subjected to wide ranges of temperature, thesituation in which they are the most significant iswhen substrates with very dissimilar CTE arebonded. Usually, fiber-reinforced polymers havea very low CTE in the longitudinal direction(CTE¼�0.5E-6 �C�1). When bonding these materials
with metals, particularly with aluminium(CTE¼ 24E-6 �C�1) using stiff adhesives, such asepoxies, usually very significant thermal stresses arise.
Humfeld and Dillard19 studied the behavior ofadhesive joints after subjecting them to temperaturecycles. When loading an adhesive joint at hightemperature, as a result of the viscoelasticity of theadhesive, thermal stresses tend to relax quickly.However, when the joint is cooled down to ambienttemperature, the residual stresses come back. At thislower temperature, there is no significant mobility ofthe polymer’s chains and the stresses are locked in.With each cycle, the stresses tend to increase, leadingto cracking of the adhesive and ultimately to the fail-ure of the adhesive joint.
Adhesive joints at low and high temperaturesand optimization
Real adhesive joints will be subject not only to quasi-static loads, but also to impact loads, especially in theautomotive industry, where impact loads must betaken into account in order to ensure the crashworthi-ness of a vehicle. With this in mind, Avendanoet al.20,21 assessed the impact and quasi-static behav-ior of single-lap joints for the automotive industryas a function of temperature (from �30 �C to 80 �C).They used both an acrylic adhesive and a crash-resis-tant epoxy adhesive and carbon fiber reinforced poly-mer and biopolymer adherends. This material hasbeen used in order to design innovative inner carstructures for being more environmentally friendlythan other materials. The higher the temperature,the higher the ductility of the materials and, therefore,the higher its strain rate dependence, which causes thefailure loads at impact to much higher than failureloads under quasi-static conditions.
As described in the previous section, Tg of theadhesive is one of the factors to take into accountwhen designing an adhesive joint, especially if thejoint is going to be subjected to high or low tempera-tures, as demonstrated by Banea et al.,6 who studiedthe mechanical behavior of single-lap joints under lowand high temperatures (�40 �C to 80 �C) using a poly-urethane and an epoxy adhesive. The strength of theepoxy adhesive joints was maximum at room tem-perature and decreased by 10% and 32% at �40 �Cand 80 �C, respectively. At 80 �C, the reason is the lossof adhesive strength while at �40 �C it is due to theloss of ductility. The specimens tested at room tem-perature have the best compromise between strengthand ductility of the adhesive. The strength of thejoints using the polyurethane adhesive increased asthe temperature decreased. This was because the Tg
of this adhesive was very low (�60 �C).On the other hand, thermal stresses may also play a
very important role in the strength of adhesive joints,especially if the cure temperature of the adhesive isvery high, as reported by Banea et al.,22 who have
Viana et al. 3
at UNIV CALGARY LIBRARY on October 3, 2016pil.sagepub.comDownloaded from

determined the strength of aluminium single-lap jointsunder a wide range of temperatures, from room tem-perature up to 200 �C. The adhesive chosen was a hightemperature, high strength epoxy adhesive, whose Tg
is 155 �C. At room temperature, the joint strength waslower than expected due to the residual stresses cre-ated by a high cure temperature. The strength of thejoint grew with temperature until Tg. Above Tg, thejoint’s strength dropped very quickly due to the lossof adhesive strength.
Hu et al.23 and Li et al.5 studied the temperaturedegradation of unbalanced single-lap and T-jointsrespectively for the automotive industry using mildsteel and an aluminum alloy. They subjected theadhesive joints to thermal cycles between �30 �C23 or�40 �C5 and 80 �C. With the increase in temperature,the strength of both kinds of joint decreased quickly atthe beginning of the exposure and slower at the end.
It is known that adhesive joints often exhibitpeak loads along the overlap length, which may com-promise their load-carrying capability. In order tosolve this problem, and obtain a more uniform loaddistribution and superior joint strength, Hart-Smith14
proposed the use of mixed adhesive joints. In thisjoint, instead of applying only a very stiff and resistantadhesive along the entire overlap length, two adhe-sives are used: a stiff adhesive at the middle of theoverlap and a flexible adhesive at the ends, wherestress concentration exists.
Instead of applying this technique only at roomtemperature, da Silva and Adams24,25 widened theirapplication for low and high temperature use. Theflexible adhesive at the ends of a double-lap joint isnow a low temperature adhesive and the stiff adhesivethat is supposed to be applied in the middle is sub-stituted by a high temperature adhesive. Using carbonfiber reinforced polymer and titanium-bondeddouble-lap joints, they have experimentally proventhat the mixed adhesive joint is a real improvementover joints with only a high temperature adhesive oronly a low temperature adhesive. Later, Marqueset al.7,26 applied the same concept in a joint represen-tative of an aerospace heatshield using a room tem-perature vulcanizing silicon (RTV) and a strong andstiff epoxy adhesive to bond a cordierite heat shield toan aluminum substrate.
The natural evolution of the mixed adhesive joint isa joint with a functionally graded adhesive, a jointwhose adhesive properties vary continuously alongthe overlap length. This was proposed by Carbaset al.,3,27 who invented an apparatus to producesingle-lap joints using differential cure temperature.The temperature of cure was set to provide the max-imum stiffness at the middle of the overlap and min-imum at the ends, so that the stress distribution alongthe overlap length was as uniform as possible.Kawasaki et al.28 obtained mixed adhesive joints bymixing two acrylic adhesives with different ratiosalong the overlap length.
Moisture degradation
Water absorption
Bulk adhesive. Adhesives, like all polymers, due to theirhigh level of molecular mobility are permeable to allgases and liquids. This includes water that is presentin the environment, to which adhesive joints areexposed, for example in the automotive industry.Water only diffuses through the amorphous phaseof the polymer, as the crystalline phase is too tightlypacked to allow the penetration of other molecules.
In order to model the diffusion in an adhesive, sev-eral models have been proposed. The most simple andcommon are the Fickian laws of diffusion.29 Althoughbeing more suitable for modeling the water diffusionin adhesives above their glass transition temperature,the Fickian laws of diffusion are also able to describethe water uptake behavior of most of the adhesives intheir glassy state.
Fick’s first law states that the flux in the x-directionFð Þ is proportional to the gradient of chemical poten-
tial. In order to simplify, as we are only studying onematerial (the adhesive), it is possible to substitute thegradient of chemical potential by the concentrationgradient (dc/dx). The proportionality constant is thediffusion coefficient Dð Þ.
F ¼ �Ddc=dx ð2Þ
Fick’s second law states that the build-up or decayof diffusant is the sum of the fluxes across the six facesof a cube (if Cartesian coordinates are used).
dc=dt ¼ D �2c��x2 þ
�2c��y2 þ
�2c��z2
� �ð3Þ
where t is the time.If a long adhesive layer, which is wide and narrow, or
a plate of bulk adhesive in which the thickness 2Lð Þ isvery small when compared to the remaining directionsare considered, one can assume that the flow of diffusantis one-directional. In that case, the concentration of dif-fusant as a function of the distance to the center of theadhesive is given by the following equation
C=C1¼1� 4=�
� �X1n¼0
�1ð Þn�2nþ1ð Þ
h i
exp �D 2nþ1ð Þ2�t�4L2
h icos 2nþ1ð Þ�x
�2L
h ið4Þ
C1 is the concentration of the diffusant at the border ofthe adhesive, which is in theory attained instantaneously.
The solution to equation (4) gives the massabsorbed Mtð Þ at instant t
Mt=Me¼ 1�
X1n¼0
8 exp �D 2nþ 1ð Þ2�t�l2
� �2nþ 1ð Þ
2�2ð5Þ
4 Proc IMechE Part L: J Materials: Design and Applications 0(0)
at UNIV CALGARY LIBRARY on October 3, 2016pil.sagepub.comDownloaded from

This means that the parameters needed to charac-terize Fickian sorption are the diffusion coefficientand the equilibrium moisture uptake.
The phenomenon of diffusion shares mathematicswith the phenomenon of heat conduction and it is pos-sible to model the moisture uptake of the adhesivesimply as a heat conduction problem. The equivalentparameters to permeability coefficient, diffusion coeffi-cient, and solubility coefficient are thermal conductiv-ity, thermal diffusivity, and heat capacity, respectively.
The water uptake behavior of structural adhesivesdepends greatly on the environmental conditions.Generally, the equilibrium mass uptake increaseswith the environmental moisture.30–34 Someauthors30,35 have measured the equilibrium moistureuptake of epoxy adhesives and have found that itremains constant with environmental temperaturewhile other authors33,36–38 have obtained significantdifferences on the equilibrium moisture uptake whensubjecting the adhesive to warmer environments.
The water uptake behavior of structural adhesivesis also affected by the stress state. Real adhesive jointsin their real application must be able to sustain sig-nificant loads while subjected to moist environments.Liljedahl et al.39 determined the water uptake ofstressed bulk adhesive specimens and found a signifi-cant increase on the diffusion coefficient and on theamount of absorbed water, which has also an impacton the mechanical properties of the adhesive.
Fickian sorption is the most common type of sorp-tion in adhesives.40 It happens when diffusion is muchslower than relaxation and the water uptake is directlyproportional to the square root of exposure time(n¼ 0.5). When the opposite happens, one is in thepresence of case II diffusion. In this case, a fully satu-rated and swollen front advances against the unpene-trated polymer and the water uptake is proportionalto the exposure time (n¼ 1).
mwttmwt1
¼ ktn ð6Þ
Although the single Fickian sorption is the mostcommon type of water sorption in adhesives, othertypes of behavior also exist, in which n is between0.5 and 1. These behaviors are named ‘‘anomalous’’.These anomalous behaviors are often described usinga dual Fickian model. This consists in assuming thatthe diffusion is Fickian but occurs through two differ-ent mechanisms simultaneously and, therefore, inorder to describe the sorption behavior, two differentdiffusion coefficients and water uptakes are necessary.Other types of Fickian-like behavior include thesequential dual Fickian31 and delayed dual Fickian.41
Adhesive may have single Fickian behavior undercertain conditions, and anomalous behavior underother set of conditions.38 Usually non-Fickian behav-ior is promoted by higher temperatures and higherrelative humidity.32
Dual Fickian behavior may also be enhancedby smaller adhesive thickness.32,42 The first stageapparently corresponds to water occupying the freespaces of the adhesive, which happens very quicklyin thin specimens. Afterwards, only bound water(water that strongly couples with some hydrophilicfunctional groups in the polymer) is absorbed,which happens in a slower manner, leading to thesecond stage.32
In some adhesives, at high temperatures, close tothe adhesive’s Tg, mass loss may occur due to chem-ical modification and physical damage of theadhesive.38
There is also evidence that while a bulk adhesivemay have a Fickian diffusion behavior, the sameadhesive in a joint may present a case II diffusionbehavior.43 When in a joint, the adhesive is con-strained by the substrates and when water isabsorbed, residual stresses are created, which leadsto stress-enhanced diffusion that may promote caseII diffusion.
Frequently, if the saturated adhesive is subjected toa very dry environment, it loses all the water that wasabsorbed. However, due to crazes and cracks that arecreated or enlarged during ageing, the speed of diffu-sion sometimes increases.42
The Langmuir model introduces the notion of ‘‘freewater’’ and ‘‘bound water’’.44 Free water is the waterthat, when absorbed, stays in the small crazes andvoids of the adhesive. This kind of absorbed water isresponsible for the change in mechanical properties ofthe adhesive, swelling and change in Tg.
45
In this model, it is assumed that free water mol-ecules can become bound molecules and vice-versa.The probability per unit time of a free water moleculeto become a bound water molecule is � and the prob-ability per unit time of a bound molecule to become afree molecule is �. This way, when saturation isattained, the adhesive is in a state of dynamic equilib-rium, in which
�n1 ¼ �N1 ð7Þ
n1 and N1 are the number of free and bound watermolecules per unit volume at equilibrium, respect-ively. In the one-dimensional case, the molecularnumber densities at position z satisfy the followingequations
D@2n
@z2¼@n
@tþ@N
@tð8Þ
@N
@t¼ �n� �N ð9Þ
For an infinite plate immersed in water, whosethickness (e) is equal to 2d and z¼ 0 is the centralplane, the upper and lower surfaces are defined byz ¼ � and z ¼ ��, respectively.
Viana et al. 5
at UNIV CALGARY LIBRARY on October 3, 2016pil.sagepub.comDownloaded from

The initial boundary conditions are given by
n z, 0ð Þ ¼ N z, 0ð Þ ¼ 0, for zj j5 �
n �, tð Þ ¼ n1 and n ��, tð Þ ¼ n1 for all t
nðz, tÞ ¼ n1 1�1
4
X1n¼0
ð�1Þn
ð2nþ 1Þðrþ2nþ1 � r�2nþ1Þ
"
� rþ2nþ1e�r�
2nþ1 � r�2nþ1e�rþ
2nþ1
� �� cos
�ð2nþ 1Þz
2�
� �
þ n14
��
X1n¼0
ð�1Þn
ð2nþ 1Þðrþ2nþ1 � r�2nþ1Þ
� rþ2nþ1 r�2nþ1
� �e�r
�2nþ1 � e�r
þ
2nþ1
h i� cos
�ð2nþ 1Þz
2�
� �ð10Þ
where
r�2nþ1 ¼1
2k 2nþ 1ð Þ
2þ � þ �
� ��
ffiffiffiffiffiffiffiffiffiffiffiffiffiffiffiffiffiffiffiffiffiffiffiffiffiffiffiffiffiffiffiffiffiffiffiffiffiffiffiffiffiffiffiffik 2nþ 1ð Þ
2þ � þ �
� �2q� 4k� 2nþ 1ð Þ
2
ð11Þ
And
k ¼�2D
4�2ð12Þ
The Langmuir model has proven to be able to suc-cessfully model adhesives that do not follow Fick’slaws.44,46,47
Adhesive–adherend interface. Water can also penetratein the adhesive layer through the interface betweenadhesive and adherend. In fact, some studies suggestthat water can be absorbed by the interface muchfaster than by the bulk adhesive.48,49 Water penetratesin the interface through the process of adsorption.This is the process by which molecules of a substance,in this case H2O, collect on the surface of anothersubstance (the substrates). The molecules areattracted to the surface but do not enter into thesolid’s interior, as in absorption.
Gravimetric methods are usually used in order tomeasure the water uptake of an adhesive.50 This con-sists simply in subjecting a plate of bulk adhesive toan aging environment, such as distilled water, air witha particular relative humidity, or other environmentscompatible with what the adhesive will be subjected inits service life, such as toluene,35 and measuring theweight change over time with a precision scale. Inorder to simulate an environment with a particularrelative humidity, a saturated salt solution can beused. Different kinds of salt can be used depending
on the relative humidity that is required.51
This method is, however, very difficult to use in anadhesive joint, which usually uses a very low amountof adhesive, whose weight change cannot be measuredwith common precision scales. In order to overcomethis difficulty and determine the average wateruptake or the moisture profile in an adhesive joint,other techniques have been used. Among these tech-niques is the Fourier transform infrared spectroscopy,transmission spectroscopy,49 and nuclear reactionanalysis.43
Zanni-Deffarges and Shanahan48 have tested tor-sional joints and bulk tensile and compressive speci-mens after aging them for different amounts of time.The modulus of both the bulk specimens and the tor-sional joints were monitored as a function of the agingtime. Taking the evolution of the Young’s modulus asa function of the aging time into account, approxima-tions to the diffusion coefficients of the joints and thebulk specimens were computed and it was found thatthe diffusion coefficient of the joints was much higherthan the bulk specimens’. Viana et al.52 have taken asimilar approach. They aged adhesively bondeddouble cantilever beam specimens and tested themperiodically. Based on the obtained GIC as a functionof the aging time, the moisture uptake of the joint wasinferred. With this data, a model was made that wasused to compute the diffusion coefficient of the inter-face between the adhesive and the adherends.
Kinloch et al.53 concluded that relatively viscousadhesives may have difficulty penetrating in thepores and gaps of substrates, which may lead to pre-mature rupture of adhesive joints, which are subjectedto moist environments, either due to the hydration ofthe uppermost regions of the oxide layer or due toweakening of the adhesive–adherend interface. If alow viscosity primer is applied prior to bonding ona phosphoric acid anodized surface, the results aremuch improved because the primer will fill in thegaps which would be otherwise filled with water andwould cause hydration of the upper layers of oxide.
Bulk properties of the adhesive
Swelling. Swelling is the volumetric change of an adhe-sive due to its absorbed moisture alone.
Water may be absorbed by the adhesive in twomain ways:
1. As free water, occupying the free spaces of theadhesive, which does not cause any change in thevolume of the adhesive;
2. As bound water, making hydrogen bonds with theadhesive’s molecular chain. As water is a polarmolecule, it can form molecular bonds with thehydroxyl groups, normally present in adhe-sives,46,54 increasing the intersegmental hydrogenbond and, as a consequence, the volume of theadhesive.
6 Proc IMechE Part L: J Materials: Design and Applications 0(0)
at UNIV CALGARY LIBRARY on October 3, 2016pil.sagepub.comDownloaded from

As free water only occupies the free spaces of theadhesive and is very quickly absorbed, only the boundwater is responsible for swelling. This means that thevolumetric change in the adhesive is not proportionalto the change in its mass. The adhesive will becomedenser as water is absorbed.54 This way, one canspeak about ‘‘efficiency of swelling’’.
Figure 2 shows the ratio of change in specimenvolume as a function of the net volume of absorbedwater normalized by the volume of dry adhesive (V0).The bold line in the middle, which has the slope of 1,represents the swelling of the adhesive that would beexpected if the entire volume of absorbed water con-tributed to the change of volume of the adhesive.
Initially, in region I, water starts to occupy the freevolumes of the adhesive (which does not cause anyswelling) as well as making hydrogen bonds with theresin (which causes swelling).46,54 After this stage, inregion II, the process of interchain hydrogen bonddominates, as virtually all the micro cavities of theadhesive are full with free water. The absorption ofwater is made almost entirely by making hydrogenbonds with the adhesive.46,54 Adamson54 postulatedthat there is still a third stage, when water enters thedensely crosslinked structures, which contain somefree volume but do not swell as much, resulting in alower swelling efficiency.
Swelling of the adhesive is responsible for the cre-ation of residual stresses in the adhesive layer, whichmay enhance water diffusion in an adhesive joint.30,43
Some authors state that strains induced by swellingare larger than strains induced by the coefficient ofthermal expansion mismatch.39 However, if thesestrains are taken into account when predicting themechanical behavior of the joint, its strength is under-estimated. This is because the absorbed water tends toenhance the creep behavior of the adhesive, which isresponsible for reducing significantly residual stressesin the adhesive joint.39
Glass transition temperature. Absorbed moisture influ-ences the mobility of the adhesive polymer. This hasan impact both on the glass transition temperatureand on the mechanical properties of the adhesive.However, the impact may be more or less significantdepending on the kind of adhesive. The Tg of a glassy,very crosslinked polymer is higher than that of a moreductile amorphous polymer.
In order to measure the variation of Tg of an adhe-sive before and after aging, usually the dynamic mech-anical analysis technique is used. However, thistechnique requires the adhesive to be kept at relativelyhigh temperature for a considerable amount of time.This may change the results because the adhesive maysuffer post cure and change its Tg while the test isbeing made. Also, water that the adhesive may haveabsorbed will evaporate, at least partially, and theright Tg value will not be read. Adams et al.55 havedeveloped a technique based on the DMA with whichit is possible to determine Tg of an adhesive veryquickly, avoiding significant post cure of the adhesiveand reducing the amount of water that may evapor-ate. This technique has been used successfully byViana et al.56 and by Zhang et al.35 to measure Tg
of moisture degraded adhesives.This method consists in keeping a vibrating beam
with a bolted adhesive plate in its center at resonance.This adhesive plate introduces damping in the speci-men. The beam is supported by two thin stretchedtwines along the direction perpendicular to Figure 3,at each side of the vibrating beam. The temperature ofthe specimen is then raised and the amplitude ofthe vibration is recorded. It is known that, atTg, the adhesive presents its maximum damping.55
From the theory of forced vibration, the dampingis proportional to the inverse of the amplitude.In order words, Tg is the temperature at which theamplitude of the specimen is at its minimum. A sche-matic representation of the test setup is shown inFigure 3.
In this method, it is very important always to keepthe beam at resonance frequency, which changesthroughout the test. With this in mind, the frequencyof the power supply that feeds the driving coil is con-trolled by a feedback system that takes into accountthe frequency read by the pickup coil.
As water penetrates into the epoxy adhesive, somemolecules form single hydrogen bonds mainly hydro-xyl or amine.54,57 This bound water acts as a plasti-cizer and is responsible for the decrease in Tg (type Ibound water).45 However, in some cases waterabsorption can slightly increase Tg.
45 This is due tothe creation of secondary cross linking between themain polymer chain and water molecules. This kindof bound water (type II bound water) poses a higheractivation energy than type I bound water, whichmakes it more difficult to remove. The amount oftype II bound water depends strongly on the tempera-ture and time of exposure.
ΔV/V
0
ΔVwater/V0
I II
Figure 2. Schematic representation of the swelling curve of
an adhesive.
Viana et al. 7
at UNIV CALGARY LIBRARY on October 3, 2016pil.sagepub.comDownloaded from

Viana et al.56 studied the evolution of Tg of twoepoxy adhesives for the automotive industry. Theyfound high Tg under dry conditions; however, whenthe adhesives were degraded in a distilled water envir-onment at 32.5 �C the evolution of their Tg showedvery distinct evolutions: in one case it dropped by asmall amount of 15 �C from 117 �C to 104 �C while Tg
decrease of another adhesive was from 97 �C to 11 �C,which has very significant implications in its strengtheven at room temperature.
The degradation of Tg of epoxy adhesives withwater and toluene absorption was addressed byZhang et al.35 Because toluene is an organic moleculecontaining benzene rings, just like the epoxy, itsuptake was about 30 times greater than the wateruptake. This translates into a lower Tg for the speci-mens that were aged in a toluene environment. Afteraging and drying, the adhesives recovered their Tg
almost entirely.
Mechanical properties. Absorbed water is responsiblefor changing the mechanical properties of adhesives.58
Water causes a reduction on the yield stress and stiff-ness of adhesives56,59,60 and also influences its fatiguebehavior.61,62
The tensile modulus and tensile strength degraderoughly in a linear way as a function of the absorbedmoisture.39,59,63 Sugiman et al.59 obtained higher ten-sile stress degradation (&39%) than the tensile modu-lus degradation (&27%). Lin and Chen42 found themto degrade roughly by the same relative amount(about 29%). Barbosa et al.64 and Lin and Chen,42
who have also studied the moisture sorption–desorp-tion–resorption characteristics of an epoxy adhesive,found that although the strength and tensile modulusof a moisture degraded epoxy adhesive recovered afterdrying, they did not reach the original value, meaningthat moisture degradation of adhesives may not befully reversible.
Viana et al.56 proved that if Tg of an adhesive fallsbelow room temperature after moisture absorption,the mechanical properties of the adhesive suffer ser-ious degradation, including a drastic reduction of ten-sile strength, modulus, and strain to failure.
Liljedahl et al.39 found that the stress relaxation ofdry adhesives was negligible (with initial stresses of 6and 10 MPa), while the relaxation of wet adhesiveswas very rapid, which is a consequence of adhesiveplasticization.65
Moisture degradation of adhesive joints
Moisture degradation techniques. Moisture degradationof adhesive joints includes not only the degradationof the adhesive layer, but also the degradation of theadherends and the adherend–adhesive interface. Inorder to assess the degradation and its effect on themechanical behavior of the adhesive joint, one wouldsimply leave the joint in the aging environment for acertain amount of time and test them when it reachestotal saturation or when it has absorbed a sufficientamount of water. However, if only diffusion throughthe bulk adhesive is considered, most adhesive jointstake very long to saturate. In order to accelerate thedegradation of adhesive joints, it is tempting toincrease the temperature. However, this technique isadmonished by Meiser et al.66 Two other techniquescan be used:
1. Open-faced specimens: This technique consists ofproducing the specimens in two steps. The firstadhesive layer is applied on the face of one ofthe adherends. Then the adhesive is subjected toits aging environment and when the adhesive layeris saturated, a second layer of adhesive is appliedand the second substrate is bonded. The secondlayer of adhesive can be of the same adhesivethat is being tested or other, stronger, adhesive.
Adhesive Bolt and nut
Beam vibra�ng at resonance frequency
Magnet
Driving coil (Excites the beam at its resonance frequency)
Pickup coil (Reads the frequency and amplitude of vibra�on)
Feedback-unit Power amplifier
Osciloscope
Figure 3. Schematic representation of the principle of operation of the DMA type test developed by Adams et al.55
8 Proc IMechE Part L: J Materials: Design and Applications 0(0)
at UNIV CALGARY LIBRARY on October 3, 2016pil.sagepub.comDownloaded from

The most important thing is that failure occurs inthe primary adhesive. With this technique, water isallowed to diffuse through the thickness directionof the adhesive (usually shorter than 1mm)instead of diffusing through its width, whichwould take much longer. Another advantage isthat the moisture uptake is uniform in the entireadhesive layer.Goglio et al.67 found that the strength of unagedopen-faced single-lap joints was reduced by about10% when compared to the strength of closedspecimens.
2. Specimens with reduced thickness: Some authorshave used specimens with smaller width in order toallow for a faster saturation. Viana et al.56 usedreduced DCB specimens while Sugiman et al.59
and Han et al.68 used reduced single-lap joint spe-cimens. Costa et al.69 studied the effect of sizereduction of these specimens. Campilho et al.70
studied the effect of reducing the height of DCBsubstrates.
Moisture degradation of adhesive joints is notonly controlled by the degradation of the adhe-sive layer. If the substrates are made of moisture-sensitive materials, such as reinforced polymers,the absorbed moisture will deteriorate their mech-anical behavior.30 In case metallic adherends areused, moisture may degrade the adhesive–adherendinterface. In order to eliminate or diminish thisdamage, a suitable surface pretreatment shouldbe used.71
The effect of surface treatments. The role of the interfacein the failure mechanism of metallic adhesive joints isalso very important. Most engineering metals are cov-ered with a thin layer of oxide that is also prone todegradation and that must be also taken intoaccount.53,71,72
In order to strengthen the oxide layer and theadhesive–adherend interface, it is common to treatthe surface of the substrates, by either anodizingthem or applying a primer, etching, roughening,degreasing, etc. A review of surface pretreatmentsfor aluminum alloys was made by Critchlow andBrewis71 (Figure 4)
Kinloch et al.53 studied the effect of surface pre-treatments (phosphoric acid anodization (PAA),phosphoric acid anodization followed by applicationof a low viscosity primer (PAAP), and grit blastingfollowed by degreasing (GBD)) on the fatigue resist-ance of aluminum-bonded joints. They concluded thatthe primer-coated phosphoric acid anodized sub-strates yielded the best results despite having obtainedadhesive failure between the adhesive and the primer.According to the authors, GBD joints allowed a highdegree of stress concentration due to poor wetting ofthe surface and due to the presence of microvoids atthe interface. The PAA joints performed slightlybetter; however, the adhesive was apparently notable to penetrate the porous surface of the anodizedsubstrate, leading to a slight hydration of the upper-most regions of the oxide layer. The best results wereobtained with the PAAP joints, as the low viscosityprimer was able to penetrate the porous structure,preventing its hydration.
Goglio and Rezaei72 studied the strength degrad-ation of open-faced single-lap joints as a function ofaging time using different surface treatments. Amongthe pretreatments that were tested, phosphoric acidanodization yielded the best results and was enoughto allow a mostly cohesive failure of the adhesive layer.
Mubashar et al.41 used a surface treatment namedACDC anodizing, which developed an oxide layerwith a needle-like structure. This structure was alsoresponsible for the mechanical interlocking, whichpromotes adhesion between the adhesive and theadherends.
Adhesive Metallic Adherend
Metallic Adherend
Adhesive
Oxide layer
Figure 4. Schematic representation of the adhesive–adherend interface of the metal-bonded substrates.
Viana et al. 9
at UNIV CALGARY LIBRARY on October 3, 2016pil.sagepub.comDownloaded from

Other studies regarding the moisture degradationof adhesive joints show that primer-coated anodizedsubstrates allow for cohesive failure of theadhesive.41,59,73
Generally, phosphoric acid anodized and primer-coated adherends perform better under moist envir-onments. However, other surface treatments such asphosphoric acid anodization alone or ACDC anodi-zation might be enough to avoid interfacial fracture ofthe joint.
Mechanical behavior of moisture degraded adhesive
joints. Adhesive joints made with composite adherendsare especially prone to moisture degradation.Composite adherends are typically made of fibers(e.g. carbon fibers or glass fibers) bonded with a poly-mer matrix. The moisture absorbed by the fibers isgenerally negligible and only the matrix absorbs a sig-nificant amount of water. This means that only thematrix loses its mechanical properties37,74 and swells,which in turn creates residual stresses between thefibers and the matrix. Additionally, absorbed wateris responsible for loss of adhesion between thematrix and the fibers.75 These three effects are respon-sible for the loss of adherend properties.
It is not only water that is absorbed after adhesivecure that influences the mechanical behavior of theadhesive joint. Water present on the adherend surfacewhen the adhesive is applied has also a very significantimpact on joint properties.76
Sugiman et al.59 studied the mechanical behavior ofaged and unaged aluminum monolithic single-lapadhesive joints and laminated doublers loaded inbending. Specimens were tested right after the adhe-sive reached saturation (1 year of aging) and 1 yearafter reaching saturation (2 years of aging) in a 50 �Cdistilled water environment. All specimens failedcohesively at the adhesive and the adherends did notsuffer plastic deformation. The single-lap joints lostroughly the same strength after 1 year and 2 yearsof aging, 22.1% and 24.4% respectively, whichmeans that the properties of the adhesive were mois-ture dependent only and did not change with time.The laminated doublers loaded in bending, on theother hand, lost 14.1% and 20.3% after 1 year and2 years, respectively. This is because these joints werenot saturated even after 2 years of aging.
Mubashar et al.41 studied the sorption–desorptioneffect on ACDC anodized and primer-coated alumi-num single-lap joints. Two different kinds of alumi-num alloy were used: a thermally treated alloy and anontreated alloy, so that in one case the substrateswould deform plastically and in the other wouldnot. Joints were aged in 50 �C water and were testedregularly up to 182 days. Specimens failed mostly in acohesive way, either in the primer layer or in the adhe-sive layer. The fractional area of primer fracture wasmonitored and increased from 0% to 34% in the softaluminum joints and from 19% to 41% in the hard
aluminum joints. The strength of the high strengthaluminum joints decreased from 12 kN to 9.5 kN,while in the soft aluminum joints the decrease wasfrom 8.8 kN to 7.8 kN. After aging, the specimenswere dried and the strength of the joints made withhard aluminum was recovered. However, the strengthof the joints made with soft aluminum was not fullyrecovered.
The strength evolution of adhesively bonded andsingle-lap joints under a salt spray environment wasassessed by Li et al.77 The strength reduced as a func-tion of the aging time until it gradually stabilized.After this stabilization, no further degradation ofthe joint occurred.
Real adhesive joints will be subjected to creep loadsand moisture throughout their life. It is known thatthe moisture uptake of adhesives is stress dependentand greater the absorption of water by an adhesive,the more affected its mechanical properties will be.The work of Han et al.68 focused on this subject.A fully coupled moisture displacement that was ableto predict the strength of single-lap joints was devel-oped based on the moisture and creep displacementobtained with degraded bulk adhesive specimens.
Combined temperature andmoisture degradation
Both the adhesive absorbed moisture and the differ-ence in the coefficients of thermal expansion betweenthe adhesive and the adherends may introduceresidual stresses in the adhesive joint. However, theswelling of the adhesive can also be responsible fordecreasing the thermal stresses originated aftercuring the adhesive at high temperatures, as wasexperimentally proven by Loh et al.32
Despite the separate effect of temperature andmoisture on the mechanical behavior of adhesivejoints being relatively well known, its combinedeffect is not yet very well studied and very few authorshave addressed this subject. One of the earliest studiesregarding this subject was performed by Jurf andVinson78 and addressed the evolution of Tg and thestatic response of single-lap adhesive joints shortlyafter being cured and after being aged under a 63%RH and 95% RH environments. The experimentalmechanical tests were performed between room tem-perature and a temperature above the Tg of eachadhesive. It was concluded that aging the specimenshas the same effect as raising the environmental tem-perature or equivalently lowering Tg.
Viana et al.56 studied the evolution of Tg withabsorbed moisture and the mechanical behavior ofmoisture degraded bulk tensile adhesive specimenswith low and high temperatures. It was concludedthat as water is absorbed by the adhesive, its tensilebehavior is degraded. This phenomenon is especiallysignificant at higher temperatures due to the plasticiz-ing effect of moisture in the adhesive, which is
10 Proc IMechE Part L: J Materials: Design and Applications 0(0)
at UNIV CALGARY LIBRARY on October 3, 2016pil.sagepub.comDownloaded from

responsible for lowering its Tg, which caused thedegraded adhesive specimens to be closer to Tg thanthe dry adhesive specimens. At lower temperatures,the effect of moisture in the mechanical properties ofthe adhesive was not as significant because the adhe-sives were already well below Tg.
Numerical modeling of degradedadhesive joints
When modeling the mechanical behavior of an agedadhesive joint, one must pay attention to the degradedproperties of the adhesive if the failure is cohesivein the adhesive59,60,73,79,80 or, pay attention to thedegraded properties of the interface30,34,39,80 if inter-facial failure occurs. Adhesives generally becomemore ductile and weaker when exposed to moist envir-onments and the interface is prone to lose its tough-ness. In an adhesive joint, this frequently means thatthere is a gradient in the mechanical properties of theadhesive layer and on the interface as the exposedfaces of the adhesive joint always absorb waterfaster than the joint’s center, which will cause theedges of the joint to lose its properties faster than inthe center if the joint is exposed for a limited time andhas not reached saturation yet. As a consequence, thenumerical simulation must be able to simulate a jointwith graded properties. In order to assess the gradi-ent of mechanical properties in the adhesive layer orin the interface, it is necessary to know the amountof water at each point, which means that thewater uptake into the adhesive joint must becomputed, either using an analytical82 or numericalmethod.60,68,79,80
Crocombe82 was the first to make such a simula-tion. The strength of single-lap adhesive joints withand without adhesive fillets was predicted using theadhesive failure strain as a criterion. It was foundthat, after 30 days of immersion in tap water, thejoints were more prone to fail at their center, wherethe adhesive ductility was lower due to the lowerwater uptake. Later, Hua et al.60 made a similar simu-lation. They used the von Mises yielding criterion asthe failure criterion. This critical strain was calculatedusing dry and partially moist mixed-mode flexure tests(MMF). It was found that the critical strain given bybulk specimens was higher than the actual criticalstrain in the adhesive joint. Maybe the wet-adhe-sive–adherend interface was more susceptible to mois-ture degradation.
Carrere et al.83 developed a method for predictingthe mechanical behavior of carbon-epoxy laminatesusing a finite fracture mechanics approach. In thismodel, the damage threshold is influenced by theaging but the kinetics of the crack propagationremains almost constant.
Usually, because water penetrates into the adhesivebondline through two directions, a 3D analysis mustbe undertaken in order to consider the gradient in the
mechanical properties in both dimensions of the adhe-sive layer.60 However, there are two cases in which asimpler 2D analysis may be enough to accurately pre-dict the mechanical behavior of the adhesive joint:
1. A rectangular adhesive layer, in which the lengthis considerably smaller than the width. In this case,the gradient in the width direction will be negli-gible. Only the gradient in the length direction willbe important;
2. When permeable adherends, such as FRP, areused. These adherends allow water to be absorbedthrough its thickness, allowing for a more uniformwater absorption by the adhesive layer.60
Most adhesive joints degrade under service condi-tions. They absorb water while supporting a mechan-ical load. It is known that mechanical loadingenhances degradation and water absorption of adhe-sives.39,68 Some authors have modeled the mechanicalbehavior of adhesive joints using sequentially coupledanalyses. This kind of analysis is normally made intwo steps:
1. Calculating the moisture profile using a diffusionanalysis;
2. Calculating the parameters used in the model,which are a function of the moisture amount inthe adhesive, predicted in the previous step.Graded properties are attributed to the adhesive,as the moisture concentration is usually not con-stant along the entire overlap.
Usually the moisture uptake of the adhesive isdetermined using unstressed bulk specimens.However, some studies state39,68 that the diffusion ofwater into adhesives is affected by the stress state ofthe adhesive. The sequentially coupled analysis doesnot take into account the stress enhanced diffusion.To overcome this setback, fully coupled models73
have been developed. Using these models, the stressstate of the adhesive is influenced by the water uptake,which will in turn be influenced by the stress state ofthe adhesive. In practice, this means that real adhesivejoints, which are usually stressed during its work life,will absorb more water and their properties will bemore degraded.
In order to model the degradation of stressed adhe-sive joints subjected to moisture environments and toobtain their residual strength, Han et al.73 used twosteps:
1. Step 1: Modeling the long-term aging processin the adhesive joint under combined thermal-hygro-mechanical service loading conditions witha fully-coupled methodology, an analogy betweenmoisture diffusion and conduction of heat wasmade and thermal-displacement-coupled elementswere used in the adhesive layer.68 The von Mises
Viana et al. 11
at UNIV CALGARY LIBRARY on October 3, 2016pil.sagepub.comDownloaded from

stress was used to characterize the stressdependence of the moisture uptake. In this step,a constant creep load was applied to the adhesivejoint. The moisture uptake and equivalent creepstrain were defined as field variable and used instep 2.
2. Step 2: Simulation of the quasi-static tensile load-ing process in adhesive joints using cohesive zonemodels that had been previously aged (in step 1).The properties of the adhesive were set to be afunction of the field variables defined in step 1.
When an adhesive is aged under a moist environ-ment, swelling occurs due to the absorbed bond water.However, it has been shown by several authors39,80,84
that in an adhesive joint, no significant residual stres-ses arise due to relaxation of the adhesive and thestrength of the joint remains almost unchanged.39
Conclusion
A literature review on the temperature and moisturedegradation of adhesive joints has been made.Temperature and moisture influence the bulk behav-ior of the adhesive. Moisture-induced plasticization ofthe adhesive lowers its yield stress and stiffness andincreases its strain to failure.
Low temperatures are responsible for the creationof residual stresses in the adhesive joint and this hasan impact on the adhesive joint strength. Residualstresses also arise in adhesive joints subjected tohigh temperatures environments but due to polymerchain relaxation, they do not become very significantunless the joint is subjected to high and low tempera-ture cycles. Moisture creates swelling of the adhesive,which generally does not cause significant residualstresses in the adhesive joint due to its plasticizingeffect. It can, however, help in the reduction of ther-mal stresses.
Moisture is responsible for lowering the adhesive’sTg and this has an influence on the behavior of theadhesive, especially at high temperatures. At lowertemperatures, as the adhesive is already well belowTg, its influence is not as significant. Despite the sep-arate influence of moisture and temperature on theadhesive joint’s mechanical behavior being relativelywell known, its combined effect is not yet well knownas very few authors have addressed this subject.
A review on methodologies used to predict themechanical behavior of aged adhesive joints wasalso made. Generally, a sequentially coupled analysisis made: first the moisture uptake in the adhesive jointis calculated and then the mechanical behavior of thejoint is computed based on the moisture-dependentproperties of the adhesive. However, the moistureuptake of the adhesive is also dependent on its stressstate and real adhesive joints are always subjected tosome kind of stress. This translates into a more com-plex fully coupled analysis, in which the stress state of
the adhesive is influenced by the moisture uptake andvice versa.
Declaration of conflicting interests
The author(s) declared no potential conflicts of interest withrespect to the research, authorship, and/or publication of
this article.
Funding
The author(s) disclosed receipt of the following financialsupport for the research, authorship, and/or publication
of this article: This study was supported by Fundacaopara a Ciencia e Tecnologia through grant EXCL/EMS-PRO/0084/2012.
References
1. Banea MD, da Silva LFM, Campilho RDSG, et al.Smart adhesive joints: An overview of recent develop-ments. J Adhes 2014; 90: 16–40.
2. Banea MD and da Silva LFM. Adhesively bonded
joints in composite materials: An overview. ProcIMechE, Part L: J Materials: Design and Applications2009; 223: 1–18.
3. Carbas RJC, Viana GMSO, da Silva LFM, et al.Functionally graded adhesive patch repairs of woodbeams in civil applications. J Compos Construct 2015;
19.4. Fecht S, Vallee T, Tannert T, et al. Adhesively bonded
hardwood joints under room temperature and elevatedtemperatures. J Adhes 2014; 90: 401–419.
5. Li W, Pang B, Han X, et al. Predicting the strength ofadhesively bonded T-joints under cyclic temperatureusing a cohesive zone model. J Adhes 2015; 92: 892–907.
6. Banea MD and da Silva LFM. The effect of tempera-ture on the mechanical properties of adhesives for theautomotive industry. Proc IMechE, Part L: J Materials:
Design and Applications 2010; 224: 51–62.7. Marques EAS, da Silva LFM and Flaviani M. Testing
and simulation of mixed adhesive joints for aerospace
applications. Compos Part B: Eng 2015; 74: 123–130.8. Carbas RJC, Marques EAS, da Silva LFM, et al. Effect
of cure temperature on the glass transition temperatureand mechanical properties of epoxy adhesives. J Adhes
2014; 90: 104–119.9. Carbas RJC, da Silva LFM, Marques EAS, et al. Effect
of post-cure on the glass transition temperature and
mechanical properties of epoxy adhesives. J Adhes SciTechnol 2013; 27: 2542–2557.
10. Zhang Y, Adams RD and da Silva LFM. Effects of
curing cycle and thermal history on the glass transitiontemperature of adhesives. J Adhes 2014; 90: 327–345.
11. Banea MD, da Silva LFM and Campilho RDSG. ModeI fracture toughness of adhesively bonded joints as a
function of temperature: Experimental and numericalstudy. Int J Adhes Adhes 2011; 31: 273–279.
12. Majda P and Skrodzewicz J. A modified creep model of
epoxy adhesive at ambient temperature. Int J AdhesAdhes 2009; 29: 396–404.
13. Mizah BR, Sekiguchi Y and Sato C. Novel method to
measure the creep strength of adhesively bonded buttjoints subjected to constant loading using a hydro-pneu-matic testing machine. J Adhes 2016; 92: 65–79.
12 Proc IMechE Part L: J Materials: Design and Applications 0(0)
at UNIV CALGARY LIBRARY on October 3, 2016pil.sagepub.comDownloaded from

14. Hart-Smith LJ. Adhesive bonded single lap joints.NASA Contractual Report 1973, NASA CR-112235.
15. Yu H, Adams RD and da Silva LFM. Development ofa dilatometer and measurement of the shrinkage behav-
iour of adhesives during cure. Int J Adhes Adhes 2013;47: 26–34.
16. da Silva LFM and Adams RD. Effect of temperature
on the mechanical and bonding properties of a carbon-reinforced bismaleimide. Proc IMechE, Part L: JMaterials: Design and Applications 2008; 222: 45–52.
17. Yu JH, Guo S and Dillard DA. Bimaterial curvaturemeasurements for the CTE of adhesives: Optimization,modeling, and stability. J Adhes Sci Technol 2003; 17:
149–164.18. da Silva LFM and Adams RD. Stress-free temperature
in a mixed-adhesive joint. J Adhes Sci Technol 2006; 20:1705–1726.
19. Humfeld GR and Dillard DA. Residual stress develop-ment in adhesive joints subjected to thermal cycling.J Adhes 1998; 65: 277–306.
20. Avendano R, Carbas RJC, Marques EAS, et al. Effectof temperature and strain rate on single lap joints withdissimilar lightweight adherends bonded with an acrylic
adhesive. Compos Struct 2016; 152: 34–44.21. Avendano R, Carbas RJC, Chaves F, et al. Impact
loading of single lap joints of dissimilar lightweightadherends bonded with a crash-resistant epoxy adhe-
sive. J Eng Mater Technol 2016.22. Banea MD, da Silva LFM and Campilho RDSG. Effect
of temperature on the shear strength of aluminium
single lap bonded joints for high temperature applica-tions. J Adhes Sci Technol 2014; 28: 1367–1381.
23. Hu P, Han X, Li WD, et al. Research on the static
strength performance of adhesive single lap joints sub-jected to extreme temperature environment for automo-tive industry. Int J Adhes Adhes 2013; 41: 119–126.
24. da Silva LFM and Adams RD. Adhesive joints at highand low temperatures using similar and dissimilaradherends and dual adhesives. Int J Adhes Adhes2007; 27: 216–226.
25. da Silva LFM and Adams RD. Joint strength predic-tions for adhesive joints to be used over a wide tempera-ture range. Int J Adhes Adhes 2007; 27: 362–379.
26. Marques EAS, Magalhaes DNM and da Silva LFM.Experimental study of silicone-epoxy dual adhesivejoints for high temperature aerospace applications.
Materialwiss Werkstoff 2011; 42: 471–477.27. Carbas RJC, da Silva LFM and Critchlow GW.
Adhesively bonded functionally graded joints by induc-tion heating. Int J Adhes Adhes 2014; 48: 110–118.
28. Kawasaki S, Nakajima G, Haraga K, et al.Functionally graded adhesive joints bonded by honey-moon adhesion using two types of second generation
acrylic adhesives of two components. J Adhes 2016;92: 517–534.
29. Aris R. The mathematics of diffusion. Oxford:
Clarendon Press, 1975.30. Liljedahl CDM, Crocombe AD, Wahab MA, et al.
Modelling the environmental degradation of the inter-
face in adhesively bonded joints using a cohesive zoneapproach. J Adhes 2006; 82: 1061–1089.
31. Ameli A, Datla NV, Papini M, et al. Hygrothermalproperties of highly toughened epoxy adhesives.
J Adhes 2010; 86: 698–725.
32. Loh WK, Crocombe AD, Wahab MMA, et al.Modelling anomalous moisture uptake, swelling andthermal characteristics of a rubber toughened epoxyadhesive. Int J Adhes Adhes 2005; 25: 1–12.
33. Vanlandingham MR, Eduljee RF and Gillespie JW.Moisture diffusion in epoxy systems. J Appl PolymSci 1999; 71: 787–798.
34. Crocombe AD, Hua YX, Loh WK, et al. Predicting theresidual strength for environmentally degraded adhe-sive lap joints. Int J Adhes Adhes 2006; 26: 325–336.
35. Zhang Y, Adams RD and da Silva LFM. Absorptionand glass transition temperature of adhesives exposedto water and toluene. Int J Adhes Adhes 2014; 50: 85–92.
36. Chiang MYM and Fernandez-Garcia M. Relation ofswelling and Tg depression to the apparent freevolume of a particle-filled, epoxy-based adhesive.J Appl Polym Sci 2003; 87: 1436–1444.
37. Suh DW, Ku MK, Nam JD, et al. Equilibrium wateruptake of epoxy/carbon fiber composites in hygrother-mal environmental conditions. J Compos Mater 2001;
35: 264–278.38. Zhou JM and Lucas JP. The effects of a water environ-
ment on anomalous absorption behavior in graphite-
epoxy composites. Compos Sci Technol 1995; 53: 57–64.39. Liljedahl CDM, Crocombe AD, Wahab MA, et al. The
effect of residual strains on the progressive damagemodelling of environmentally degraded adhesive
joints. J Adhes Sci Technol 2005; 19: 525–547.40. Pethrick RA. Design and ageing of adhesives for struc-
tural adhesive bonding -A review. Proc IMechE, Part
L: J Materials: Design and Applications 2015; 229:349–379.
41. Mubashar A, Ashcroft IA, Critchlow GW, et al.
Moisture absorption-desorption effects in adhesivejoints. Int J Adhes Adhes 2009; 29: 751–760.
42. Lin YC and Chen X. Moisture sorption-desorption-
resorption characteristics and its effect on the mechan-ical behavior of the epoxy system. Polymer 2005; 46:11994–12003.
43. Liljedahl CDM, Crocombe AD, Gauntlett FE, et al.
Characterising moisture ingress in adhesively bondedjoints using nuclear reaction analysis. Int J AdhesAdhes 2009; 29: 356–360.
44. Popineau S, Rondeau-Mouro C, Sulpice-Gaillet C,et al. Free/bound water absorption in an epoxy adhe-sive. Polymer 2005; 46: 10733–10740.
45. Zhou JM and Lucas JP. Hygrothermal effects of epoxyresin. Part II: Variations of glass transition tempera-ture. Polymer 1999; 40: 5513–5522.
46. Li YM, Miranda J and Sue HJ. Hygrothermal diffusion
behavior in bismaleimide resin. Polymer 2001; 42:7791–7799.
47. Karter HG and Kibler KG. Fundamental and oper-
ational glass transition temperatures of compositeresins and adhesives. J Compos Mater 1978; 12:118–131.
48. Zannideffarges MP and Shanahan MER. Diffusion ofwater into an epoxy adhesive - comparison betweenbulk behavior and adhesive joints. Int J Adhes Adhes
1995; 15: 137–142.49. Wapner K and Grundmeier G. Spatially resolved meas-
urements of the diffusion of water in a model adhesive/silicon lap joint using FTIR-transmission-microscopy.
Int J Adhes Adhes 2004; 24: 193–200.
Viana et al. 13
at UNIV CALGARY LIBRARY on October 3, 2016pil.sagepub.comDownloaded from

50. da Silva LFM, Dillard D, Blackman B, et al. Testingadhesive joints - Best practices. Weinheim: Wiley, 2012.
51. Winston PW and Bates DH. Saturated solutions for thecontrol of humidity in biological-research. Ecology
1960; 41: 232–237.52. Viana G, Costa M, Banea MD, et al. Water diffusion in
double cantilever beam adhesive joints. Latin Am J
Solids Struct 2016.53. Kinloch AJ, Little MSG and Watts JF. The role of the
interphase in the environmental failure of adhesive
joints. Acta Mater 2000; 48: 4543–4553.54. Adamson MJ. Thermal-expansion and swelling of
cured epoxy-resin used in graphite-epoxy composite-
materials. J Mater Sci 1980; 15: 1736–1745.55. Zhang Y, Adams RD and da Silva LFM. A rapid
method of measuring the glass transition temperatureusing a novel dynamic mechanical analysis method.
J Adhes 2013; 89: 785–806.56. Viana G, Costa M, Banea MD, et al. Behaviour of
environmentally degraded epoxy adhesives as a func-
tion of temperature. J Adhes 2016; DOI: 10.1080/00218464.2016.1179118.
57. Moy P and Karasz FE. Epoxy-water interactions.
Polym Eng Sci 1980; 20: 315–319.58. Costa M, Viana G, da Silva LFM, et al. Determination
of the fracture envelope of an adhesive joint as a func-tion moisture. Materialwiss Werkstoff 2016.
59. Sugiman S, Crocombe AD and Aschroft IA.Experimental and numerical investigation of the staticresponse of environmentally aged adhesively bonded
joints. Int J Adhes Adhes 2013; 40: 224–237.60. Hua Y, Crocombe AD, Wahab MA, et al. Modelling
environmental degradation in EA9321-bonded joints
using a progressive damage failure model. J Adhes2006; 82: 135–160.
61. Costa M, Viana G, da Silva LFM, et al. Environmental
effect on the fatigue degradation of adhesive joints:A review. J Adhes 2016; DOI: 10.1080/00218464.2016.1179117.
62. Costa M, Viana G, da Silva LFM, et al. Effect of
humidity on the fatigue behaviour of adhesivelybonded aluminium joints. Latin Am J Solids Struct2016.
63. Loh WK, Crocombe AD, Wahab MMA, et al.Environmental degradation of the interfacial fractureenergy in an adhesively bonded joint. Eng Fract Mech
2002; 69: 2113–2128.64. Barbosa AQ, da Silva LFM and Ochsner A.
Hygrothermal aging of an adhesive reinforced withmicroparticles of cork. J Adhes Sci Technol 2015; 29:
1714–1732.65. da Silva LFM and Sato C. Design of adhesive joints
under humid conditions. Berlin Heidelberg: Springer-
Verlag, 2013.66. Meiser A, Willstrand K and Possart W. Influence of
composition, humidity, and temperature on chemical
aging in epoxies: A local study of the interphase withair. J Adhes 2010; 86: 222–243.
67. Goglio L, Rezaei M and Rossetto M. Moisture degrad-
ation of open-faced single lap joints. J Adhes SciTechnol 2014; 28: 1382–1393.
68. Han X, Crocombe AD, Anwar SNR, et al. The effect ofa hot-wet environment on adhesively bonded jointsunder a sustained load. J Adhes 2014; 90: 420–436.
69. Costa M, Viana G, Canto C, et al. Effect of the size
reduction on the bulk tensile and double cantileverbeam specimens used in cohesive zone models. ProcIMechE, Part L: J Materials: Design and Applications
2015; DOI: 1464420715610248.70. Campilho RDSG, Moura DC, Banea MD, et al.
Adherend thickness effect on the tensile fracture tough-
ness of a structural adhesive using an optical dataacquisition method. Int J Adhes Adhes 2014; 53: 15–22.
71. Critchlow GW and Brewis DM. Review of surface pre-
treatments for aluminium alloys. Int J Adhes Adhes1996; 16: 255–275.
72. Goglio L and Rezaei M. Effect of different substratepre-treatments on the resistance of aluminum joints to
moist environments. J Adhes 2013; 89: 769–784.73. Han X, Crocombe AD, Anwar SNR, et al. The strength
prediction of adhesive single lap joints exposed to long
term loading in a hostile environment. Int J AdhesAdhes 2014; 55: 1–11.
74. Ray BC. Temperature effect during humid ageing on
interfaces of glass and carbon fibers reinforced epoxycomposites. J Colloid Interface Sci 2006; 298: 111–117.
75. Bao LR and Yee AF. Moisture diffusion and hygro-thermal aging in bismaleimide matrix carbon fiber
composites - Part I: Uni-weave composites. ComposSci Technol 2002; 62: 2099–2110.
76. Markatos DN, Tserpes KI, Rau E, et al. Degradation
of mode-I fracture toughness of CFRP bonded jointsdue to release agent and moisture pre-bond contamin-ation. J Adhes 2014; 90: 156–173.
77. Li WD, Ma M, Han X, et al. Strength prediction ofadhesively bonded single lap joints under salt sprayenvironment using a cohesive zone model. J Adhes
2016; 92: 916–937.78. Jurf RA and Vinson JR. Effect of moisture on the static
and viscoelastic shear properties of epoxy adhesives. JMater Sci 1985; 20: 2979–2989.
79. Hua Y, Crocombe AD, Wahab MA, et al. Continuumdamage modelling of environmental degradation injoints bonded with EA9321 epoxy adhesive. Int J
Adhes Adhes 2008; 28: 302–313.80. Sugiman S, Crocombe AD and Aschroft IA. Modelling
the static response of unaged adhesively bonded struc-
tures. Eng Fract Mech 2013; 98: 296–314.81. Loh WK, Crocombe AD, Wahab MMA, et al.
Modelling interfacial degradation using interfacial rup-ture elements. J Adhes 2003; 79: 1135–1160.
82. Crocombe AD. Durability modelling concepts andtools for the cohesive environmental degradation ofbonded structures. Int J Adhes Adhes 1997; 17: 229–238.
83. Carrere N, Tual N, Bonnemains T, et al. Modelling ofthe damage development in carbon/epoxy laminatessubjected to combined seawater ageing and mechanical
loading. Proc IMechE, Part L: J Materials: Design andApplications 2016. DOI: 10.1177/1464420716648353.
84. Reedy ED and Guess TR. Butt joint strength: effect of
residual stress and stress relaxation. J Adhes Sci Technol1996; 10: 33–45.
14 Proc IMechE Part L: J Materials: Design and Applications 0(0)
at UNIV CALGARY LIBRARY on October 3, 2016pil.sagepub.comDownloaded from

PAPER 2


Full Terms & Conditions of access and use can be found athttp://www.tandfonline.com/action/journalInformation?journalCode=gadh20
The Journal of Adhesion
ISSN: 0021-8464 (Print) 1545-5823 (Online) Journal homepage: http://www.tandfonline.com/loi/gadh20
Behaviour of environmentally degraded epoxyadhesives as a function of temperature
G. Viana, M. Costa, M. D. Banea & L. F. M. da Silva
To cite this article: G. Viana, M. Costa, M. D. Banea & L. F. M. da Silva (2017) Behaviour ofenvironmentally degraded epoxy adhesives as a function of temperature, The Journal of Adhesion,93:1-2, 95-112, DOI: 10.1080/00218464.2016.1179118
To link to this article: https://doi.org/10.1080/00218464.2016.1179118
Accepted author version posted online: 21Apr 2016.Published online: 03 Aug 2016.
Submit your article to this journal
Article views: 236
View related articles
View Crossmark data
Citing articles: 7 View citing articles

Behaviour of environmentally degraded epoxy adhesivesas a function of temperatureG. Vianaa, M. Costaa, M. D. Baneab, and L. F. M. da Silvac
aPolo FEUP, Instituto de Ciência e Inovação em Engenharia Mecânica e Engenharia Industrial (INEGI),Oporto, Portugal; bFederal Centre of Technological Education in Rio de Janeiro (CEFET), Rio de Janeiro,Brazil; cDepartamento de Engenharia Mecânica, Faculdade de Engenharia da Universidade do Porto(FEUP), Oporto, Portugal
ABSTRACTStructural adhesives are increasingly being used in the aero-space and automotive industries. They allow for light weightvehicles, fuel savings, and reduced emissions. However, theenvironmental degradation of adhesive joints is a major set-back in its wide implementation. Moisture degradation ofadhesive joints includes plasticization, attacking of the inter-face, swelling of the adhesive and consequent creation ofresidual stresses. This may lead to reversible and irreversibledamage. The main factors affecting the strength of adhesivejoints under high and low temperatures are the degradation ofthe adhesive mechanical properties and the creation of resi-dual stresses induced by different coefficients of thermalexpansion (between the adhesive and the adherends). Theeffect of the combined effect of moisture and temperature isnot yet fully understood. The aim of this study is to shed lighton this subject.
In this work bulk water absorption tests were conducted atdifferent moisture conditions in order to assess the diffusioncoefficient, maximum water uptake, and glass transition tem-perature. Aged and unaged small dogbone tensile specimenswere tested under different temperature conditions. The glasstransition temperature of the adhesives as a function of thewater uptake was assessed. The aim is to determine the evolu-tion of the properties of two epoxy adhesives as a function oftwo variables (environmental temperature and moisture).
ARTICLE HISTORYReceived 17 February 2016Accepted 9 April 2016
KEYWORDSMoisture degradation;temperature tests; tensiletests
1. Introduction
Structural adhesives are increasingly being used in the transport industries.They allow for light weight vehicles, energy savings, and reduced emissions.The main advantages include more uniform load distribution, higher fatigueresistance than other traditional joining methods, and the ability to joindissimilar materials [1]. Also, due to their high vulnerability to stress con-centration, the only viable way to join composite materials, such as fibre
CONTACT L. F. M. da Silva [email protected] Departamento de Engenharia Mecânica, Faculdade deEngenharia da Universidade do Porto (FEUP), Rua Dr. Roberto Frias, 4200-465 Oporto, Portugal.Color versions of one or more of the figures in the article can be found online at www.tandfonline.com/gadh.
THE JOURNAL OF ADHESION2017, VOL. 93, NOS. 1–2, 95–112http://dx.doi.org/10.1080/00218464.2016.1179118
© 2017 Taylor & Francis

reinforced plastic, is with a structural adhesive [2]. However, the environ-mental degradation of adhesive joints is a major setback in their wideimplementation.
Moisture degradation of adhesives includes reduction of their mechanicalproperties, inducing plasticization. The deleterious effects are greater inadhesive joints as the degradation of the adhesive–adherend interface maycause interfacial failure.
The water diffusion in adhesives is frequently controlled by the Fick’s lawsbut non-Fickian diffusion is not uncommon. Other models have beendeveloped, such as the dual Fickian diffusion [3], delayed dual Fickian [4],and the Langmuir model [5]. The rate at which the water is absorbed and themaximum water uptake depends on environmental factors such as therelative humidity and temperature and on the thickness [3,6] and the stressstate of the adhesive [7].
As the water diffuses into the adhesive, some of this moisturebecomes bound water. Bound water generally increases with exposuretime and temperature [8,9]. Unlike the free water that occupies the freespace of the adhesive, this bound water is responsible for the volumetricchanges that are observed in adhesives under high humidity environ-ments, which may cause residual stresses in adhesive joints [10]. Zhouand Lucas [8,9] have found two types of bound water: Type I involveswater molecules forming a single hydrogen bond while Type II resultsfrom water forming multiple hydrogen bonds. Type I bound water actsas a plasticizer, increasing the chains segment mobility. It is responsiblefor decreasing the glass transition temperature (Tg) [8]. If the tempera-ture is high and the exposure time is long, Type II bound water mayalso occur. This type of bound water is responsible for creating second-ary cross-linking [9], which lessens the extent of Tg depression [8].While Type I bound water can be removed at low temperature, inorder to remove Type II bound water, the adhesive must be subjectedto relatively high temperatures [8].
The main factors affecting the strength of adhesive joints under high andlow temperatures are the degradation of the mechanical properties and thecreation of residual stresses induced by different coefficients of thermalexpansion between the adhesive and adherends, especially when the sub-strates are made with different materials. It was found that the residualstresses caused by the shrinkage of the adhesive during cure have not amajor effect on the strength of the joint [11]. Generally, the strength ofadhesive joints decreases with increasing and decreasing temperatures [12–18]. The fracture toughness of adhesives also shows a strong temperaturedependence [19,20]. Banea et al. [16] found that below Tg, the fracturetoughness of an epoxy adhesive changed little, while above Tg, it decreaseddramatically.
96 G. VIANA ET AL.

Although the separate effect of moisture and temperature on the mechan-ical properties of epoxy adhesives is now-a-days relatively well understood,very few studies focus on the mechanical properties of aged adhesives at highand low temperatures. This work aims at shedding light on this subject. Thiswill allow for a more accurate long-term prediction of the mechanicalbehaviour of adhesive joints.
In this study, two different ageing environments were considered: distilledwater, which is the most aggressive environment, and a saturated solution ofNaCl, which is equivalent to exposing the specimens in a 75% relativehumidity environment [21].
Bulk dogbone tensile specimens were aged under these environmentsand tested at three different temperatures: −40°C, 23°C, and 80°C, whichcover the range of temperatures an adhesive for the automotive industrymust be able to withstand. This way it was possible to obtain theproperties of the dry adhesive, the saturated adhesive (aged in distilledwater), and an intermediate state (adhesive aged in salt water) under thethree different temperatures considered. The tests were performed inthree different moments: right after the specimens were dried in a drydesiccator for at least two weeks, after 74 days of ageing, when they werefully saturated with water, and after one year of ageing, so that theinfluence of the ageing time could be assessed.
In order to determine the moisture diffusion behaviour of the adhesives,bulk water sorption tests were made. The diffusion coefficients and max-imum water absorption were measured for each ageing environmentconsidered.
A rapid method based on the dynamic mechanical analysis (DMA) wasused to measure Tg of aged and unaged adhesives. In this method, thespecimen is kept at resonance and the value of Tg is determined by thetemperature at which the maximum damping occurs [22].
2. Materials
2.1 Adhesives
The epoxy adhesive XNR 6852-1 was supplied by NAGASE CHEMTEX®
(Osaka, Japan). This adhesive is a one-part system that cures at 150°C for 3 hr.The epoxy adhesive SikaPower 4720 was supplied by SIKA® (Portugal, Vila
Nova de Gaia). This adhesive is a two-part system that cures at roomtemperature for 24 hr.
These adhesives were developed for the automotive industry and wererecommended by Sika® and Nagase® for this durability study.
THE JOURNAL OF ADHESION 97

2.2 Specimen Fabrication
The bulk specimens were produced by curing the adhesive between steelplates of a mould. (Fig. 1). A silicone rubber frame was used to avoid theadhesive from flowing out and to ensure the thickness of the adhesive plate(1 mm in the water sorption specimens and 2 mm in the bulk tensilespecimens and Tg specimens). Both adhesives were cured under 2 MPahydrostatic pressure in a hotplates press. The temperature of cure was setat 150°C for XNR6851-1 adhesive and at room temperature (23°C) for theSikaPower 4720 adhesive, according to the manufacturer’s specification. Bulktensile specimens (Fig. 2), water absorption specimens (Fig. 2), and Tgspecimens (Fig. 3) were machined from these plates.
The thickness of the water sorption specimens is small compared with theremaining dimensions, so that water sorption along its width and length canbe neglected and simple one-dimensional sorption across the thicknessdirection can be considered without incurring significant error.
Figure 1. Mould used in the manufacture of adhesive bulk plates.
ba
80
28
26
8
12.5
60
60
Figure 2. Dogbone tensile specimen geometry (a) and bulk water sorption specimen (b).Dimensions in millimetres.
98 G. VIANA ET AL.

Small bulk tensile specimens were used, allowing a time efficient produc-tion and easy storage during immersion. Although the selected geometry didnot follow a standard, it was optimized in previous work to provide accurateelastic properties and reduce the amount of adhesive used. More informationabout this specimen geometry can be found in another study [23].
The Tg specimens are a 2-mm thick plate with a hole in its centre that arebolted to an aluminium beam. More information about these specimens canbe found in Section 3.1 and in previous studies [22,24].
3. Experimental Procedure
3.1 DMA Type Test
In order to perform the Tg tests, a method based on the DMA was used [22].This method consists in keeping a vibrating beam with a bolted adhesiveplate in its centre at resonance. This adhesive plate introduces damping inthe specimen. The beam is supported by two thin stretched twines along thedirection perpendicular to Fig. 4, at each side of the vibrating beam. Thetemperature of the specimen is then raised and the amplitude of the vibrationis recorded. It is known that, at Tg, the adhesive presents its maximumdamping [22]. From the theory of forced vibration, the damping is propor-tional to the inverse of the amplitude. In order words, Tg is the temperatureat which the amplitude of the specimen is at its minimum. A schematicrepresentation of the test setup is shown in Fig. 4.
In this method it is very important always to keep the beam atresonance frequency, which changes throughout the test. With this inmind, the frequency of the power supply that feeds the driving coil iscontrolled by a feedback system that takes into account the frequency readby the pickup coil.
Because the measurement of Tg using this method takes so little time(less than 10 minutes), significant post cure of the adhesive is avoided
10
25
Figure 3. Glass transition temperature specimen. Dimensions in millimetres.
THE JOURNAL OF ADHESION 99

[25]. Also, if the test took a long time to perform, such as the standardDMA test, some moisture would evaporate from the aged specimens,giving wrong results.
In this study the Tg of both adhesives as a function of the absorbed waterwas assessed. The specimens were kept immersed in distilled water and asaturated solution of NaCl for at least 75 days, when equilibrium wateruptake had been attained, before being tested.
3.2 Bulk Water Sorption Tests
Before exposing the specimens to their aging environment, they were kept ina dry desiccator for two weeks in order to eliminate any water that may beabsorbed from the air. Then, the initial weight of each water sorption speci-men was measured with a 0.001 g resolution scale and they were placed intwo different environments: a saturated NaCl water solution (referred in thispaper as “salt water”, which is equivalent to a 75% RH environment) anddistilled water at 32.5°C. The specimens remained hanging inside closedcontainers, so that every face could be exposed to the ageing environment.
The weight of each specimen was periodically measured until saturation wasattained.
The results were modelled using simple Fickian diffusion and dual Fickiandiffusion.
For the one-dimensional case, the water concentration at each point of theadhesive, according to the Fick’s laws, was [26]
cc1
¼ 1� 4π
X1n¼0
�1ð Þn2nþ 1ð Þ exp
�D 2nþ 1ð Þ2π2t4l2
" #� cos
2nþ 1ð Þπx2l
� �; (1)
AdhesiveBolt and nut
Beam vibrating at ressonance frequency
Magnet
Driving coil
(Excites the beam at its ressonance frequency)
Pickup coil
(Reads the frequency and amplitude of vibration)
Feedback-unitPower amplifier
Osciloscope
Figure 4. Schematic representation of the principle of operation of the DMA type test used inthis study.
100 G. VIANA ET AL.

where c1 is the concentration of water in the surface layers, which issupposed to be attained instantaneously, l is half of the layer’s width, and t isthe time. The center of the adhesive is located at x ¼ 0.
Equation (2) is the integration of Equation (1). Instead of giving the waterconcentration in each point, which is hard to obtain experimentally, it givesthe fractional mass uptake of the entire specimen [26]:
mwttmwt1
¼ 1� 8π2
X1n¼0
1
2nþ 1ð Þ2 exp�D 2nþ 1ð Þ2π2t
4l2
" #: (2)
mwt1 is the moisture level at equilibrium and mwtt is the moisture level atinstant t.
Throughout this paper the moisture content (mwtt) is expressed in termsof percentage as a function of
ffiffiffiffiffiffit=l2
q.
3.3 Bulk Tensile Tests
Bulk dogbone specimens of both studied adhesives were aged under the sameenvironmental conditions used with the water sorption specimens (75% RHand distilled water). The specimens were tested in three moments: after beingproduced and dried in a dry desiccator, after being aged for 75 days, and afterbeing aged for 12 months, so that the evolution of the adhesive propertieswith time could be assessed. Dry specimens, which were kept in a drycontainer were also tested.
The tensile tests were performed in an INSTRON® model 3367 universaltest machine (Norwood, Massachusetts, USA) with a capacity of 30 kN, at theconstant displacement rate of 1 mm/min. Loads and displacements wererecorded up to failure. Since contact extensometers are not advisable whentesting polymers under high temperatures because they damage the speci-mens, an optic method was used. This optic method consists in taking photosof the specimen every 5 s using a high-resolution digital camera. After thetest, the photos are read by a Matlab® subroutine in which the strain of thespecimen is computed. The strain is computed between two parallel lines thatmust be drawn on the specimen.
A climatic chamber coupled with the universal testing machineallowed the testing at three different temperatures, covering the rangeof temperatures required for adhesives used in the automotive industry:low temperature (−40°C), room temperature (23°C), and high tempera-ture (80°C).
THE JOURNAL OF ADHESION 101

4. Experimental Results and Discussion
4.1 DMA Type Tests
Figure 5 shows the Tg of both adhesives as a function of the ageingenvironment.
The Tg is maximum when the adhesives are dry and tends to lower withan increasingly aggressive environment. This happens due to the bond waterabsorbed by the adhesive, which acts as a plasticizer [8].
The Tg of SikaPower 4720 adhesive is more dependent on the ageingenvironment than that of XNR 6852-1 adhesive, as it changes only 15°Cbetween the specimens aged in distilled water and the dry specimens. The Tgof SikaPower 4720 adhesive is relatively high in the dry state, drops to 76.1°Cwhen aged in salt water and is below room temperature if aged in distilledwater.
4.2 Bulk Water Sorption
Figures 6–8 show the fractional mass uptake of the adhesives studied, as wellas the respective Fickian fit. Both the dual Fickian and simple Fickian modelswere used to characterize the moisture diffusion in the adhesives.
The rate of mass uptake was maximum at the beginning of the exposureand kept diminishing until equilibrium was attained. As it would be expect-able, the final moisture level of the specimens that were kept in salt water waslower than that of the specimens immersed in distilled water.
XNR 6852-1 adhesive shows a dual Fickian behaviour when immersed inboth distilled water and in salt water.
0
20
40
60
80
100
120
140
Tg
(oC
)
Tg
(oC
)
XNR 6852-1
Distilled water Salt water Dry
0
20
40
60
80
100
120
140
SikaPower 4720
Distilled water Salt water Dry
Figure 5. Glass transition temperature of XNR 6852-1 and SikaPower 4720 adhesive as a functionof the ageing environment.
102 G. VIANA ET AL.

When aged in distilled water, SikaPower 4720 adhesive shows a simpleFickian behaviour. Under these conditions, this adhesive shows a very highwater uptake, unusual for an epoxy adhesive. This probably happens becauseunder these ageing conditions the Tg of the adhesive is lower than the tem-perature of the bath. When immersed in salt water the adhesive is above its Tg,
0
0.2
0.4
0.6
0.8
1
1.2
1.4
0 20 40 60 80 100 120
% W
ate
r u
pta
ke
XNR 6852-1 (aged in distilled water)
XNR 6852-1 (aged in salt water)
Figure 6. Water uptake behaviour of the XNR 6852-1 adhesive when aged in salt water anddistilled water and respective dual Fickian fit.
0
5
10
15
20
25
30
35
0 20 40 60 80 100 120
% W
ate
r u
pta
ke
SikaPower 4720 (aged in distilled
water)
Figure 7. Water uptake behaviour of the SikaPower 4720 adhesive when aged in distilled waterand Fickian fit.
THE JOURNAL OF ADHESION 103

shows a more common water uptake, and a clear dual Fickian behaviour.Despite having been aged for more than three months, this adhesive apparentlydid not reach saturation. The diffusion parameters were calculated consideringthat the maximum water uptake is the last that was measured.
The water uptake parameters of both adhesives are summarized in Table 1.
4.3 Bulk Tensile Tests
The bulk tensile tests were made at three different times:
(1) After the adhesives had been dried in a dry desiccator for at least twoweeks;
(2) After the adhesives had been aged and had reached the equilibriumwater uptake (75 days);
(3) After the adhesives had been aged for one year.
In the following subsections representative stress–strain curves of bothadhesives are shown as a function of the ageing environment and test
0
0.5
1
1.5
2
2.5
3
3.5
4
0 20 40 60 80 100 120
% W
ate
r u
pta
ke
SikaPower 4720 (aged in salt
water)
Figure 8. Water uptake behaviour of the SikaPower 4720 adhesive when aged in salt water andFickian fit.
Table 1. Water Sorption Parameters of Both Adhesives.D1 (m
2/s) mwt1 D2 (m2/s) mwt2
XNR 6852-1 Distilled water 6.0E-13 0.0095 8E-14 0.0023Salt water 6.0E-13 0.0080 8E-14 0.0006
SikaPower 4720 Distilled water 1.2E-13 0.325 – –Salt water 2.6E-13 0.020 2.5E-14 0.018
104 G. VIANA ET AL.

temperature. The curves that represent the mechanical behaviour of the agedspecimens and that are shown in following subsections are those obtainedafter one year of ageing, which are not significantly different from thoseobtained after 75 days of ageing.
4.3.1. 23°C Tensile TestsFigure 9 presents the stress–strain curves of the two adhesives tested at 23°Cwith different fractional moisture contents. The ductility increased with theadhesive’s water content. The yield strength and the Young’s modulusdecreased in both adhesives. This effect is more evident in SikaPower 4720adhesive than in XNR 6852-1 adhesive. The ductility of SikaPower 4720adhesive that was aged in distilled water, however, decreased, which maybe a consequence of testing above Tg or an indication that chemical degrada-tion may have occurred. As can be seen in Fig. 10, XNR 6852-1 adhesiveshowed a ductile fracture while SikaPower 4720 showed a brittle fracture.
4.3.2. 40°C Tensile TestsThe yield strength and tensile modulus of both adhesives increased whentested at −40°C. The fractional water uptake had little impact on the proper-ties of SikaPower 4720 adhesive when tested at −40°C and does not seem tohave a significant impact on XNR 6852-1 adhesive (Fig. 11).
From Fig. 12, one can see that both adhesives showed a brittle fracture.
0
5
10
15
20
25
30
35
40
0 0.02 0.04 0.06 0.08
Stre
ss (
MP
a)
Strain
Dry specimens
Specimens aged in salt water
Specimens aged in distilled water
0
10
20
30
40
50
60
70
0 0.1 0.2 0.3
Stre
ss (
MP
a)
Strain
Dry specimens
Specimens aged in salt water
Specimens aged in distilled water
a b
Figure 9. Stress–strain curves of the XNR 6852-1 adhesive (a) and the SikaPower 4720 adhesive(b) as a function of the ageing environment tested at room temperature.
THE JOURNAL OF ADHESION 105

4.3.3. 80°C Tensile TestsDespite having broken close to the grips and not in the necking region, XNR6852-1 adhesive had more than 100% elongation. Before rupturing, XNR6852-1 specimens were already in the plastic region, consequently the yieldstrength of the adhesive could be assessed. It was not possible to determine
a
b
Figure 10. Specimens of the XNR 6852-1 adhesive (a) and of the SikaPower 4720 adhesive (b)after being tested at room temperature.
0
10
20
30
40
50
60
70
0 0.1 0.2 0.3 0.4
Stre
ss (
MP
a)
Strain
Dry specimens
Specimens aged in salt water
Specimens aged in distilled water
0
10
20
30
40
50
60
0 0.01 0.02 0.03 0.04
Stre
ss (
MP
a)
Strain
Dry specimens
Specimens aged in salt water
Specimens aged in distilled water
a b
Figure 11. Stress–strain curves of the XNR 6852-1 adhesive (a) and the SikaPower 4720 adhesive(b) as a function of the ageing environment tested at −40°C.
a
b
Figure 12. Specimens of the XNR 6852-1 adhesive (a) and of the SikaPower 4720 adhesive (b)after being tested at −40°C.
106 G. VIANA ET AL.

how high the ductility is but, as the specimens broke with more than 100% ofstrain, one can be sure that it must be higher than 100%. Figure 13 shows atypical stress–strain curve of the dry adhesive tested at 80°C. In Fig. 14, theentire curves were omitted so that the reader can focus on the elastic part ofthe graph.
The ductility of SikaPower 4720 adhesive also increased when tested athigh temperature. At this temperature, the yield stress and the tensile mod-ulus of the adhesives were strongly moisture dependent.
As can be seen in Fig. 15, the XNR 6852-1 adhesive exhibited a very ductilefracture, while SikaPower 4720 showed a brittle fracture.
0
2
4
6
8
10
12
14
16
18
0 0.2 0.4 0.6 0.8 1 1.2 1.4 1.6
Stre
ss (
MP
a)
Strain
Figure 13. Entire stress–strain curve of a dry XNR 6852-1 specimen tested at 80°C up to failure.
0
2
4
6
8
10
12
0 0.05 0.1
Stre
ss (
MP
a)
Strain
Dry specimens
Specimens aged in salt water
Specimens aged in distilled water
0
1
2
3
4
5
6
7
0 0.2 0.4 0.6
Stre
ss (
MP
a)
Strain
Dry specimens
Specimens aged in salt water
Specimens aged in distilled water
ba
Figure 14. Stress–strain curves of the XNR 6852-1 adhesive (a) and the SikaPower 4720 adhesive(b) as a function of the ageing environment tested at −80°C.
THE JOURNAL OF ADHESION 107

4.3.4. DiscussionAs moisture diffuses into the adhesives, it increases the mobility of itschains. This phenomenon is responsible for lowering Tg of both adhesivesand is clearer in SikaPower4720. As a result of increased chain mobility,the stiffness and yield stress of both adhesives also tend to decrease.However, this effect was not clearly visible when the specimens were testedat −40°C because low temperatures tend to decrease the mobility ofpolymer chains. At this temperature the decrease of polymer chain mobi-lity is much higher than the increase of chain mobility caused by moistureabsorption.
XNR6852-1 shows a very significant moisture dependence when tested at80°C due to its proximity to Tg. At this temperature, the dry specimens areconsiderably away from Tg while the aged specimens are much closer. As aconsequence, the aged specimens show a considerably lower stiffness andyield stress than the dry specimens.
Aged specimens of SikaPower4720 are actually above Tg when tested at80°C, therefore the dry specimens of this adhesive show a considerablyhigher strength and stiffness than those that were aged.
The decrease of the yield strength of the adhesives due to the moistureuptake is more pronounced at 80°C than at −40°C. At this temperature, theeffect of moisture on the yield stress of the adhesive is minimum and at 80°Cmaximum.
The yield stress and the Young’s modulus of both adhesives wereindependent of exposure time and tended to level off toward saturation,as was also concluded in other studies [27]. The moisture and tempera-ture-dependent yield stress and moduli of both adhesives are shown inFigs. 16 and 17 and in Figs. 18 and 19, respectively. The higher thetemperature, the more the yield stress and modulus of the adhesives wasdependent on water uptake.
Results show that the yield strength and stiffness of both adhesives weremore affected by the test temperature than by the moisture uptake. This isillustrated in Figs. 16, 17, 18, and 19.
a
b
Figure 15. Specimens of XNR 6852-1 adhesive (a) and of SikaPower 4720 adhesive (b) after beingtested at 80°C.
108 G. VIANA ET AL.

5. Conclusion
This work focused on the effect of water uptake and testing temperature onthe mechanical behaviour of two epoxy adhesives for the automotive indus-try. The following conclusions could be drawn:
(1) The Tg of both adhesives decreases with moisture uptake. Similarresults have been obtained in numerous studies [8,28].
(2) The Tg of XNR 6852 adhesive is less dependent on the ageing envir-onment than that of SikaPower 4720.
0
20
40
60
80
100
120
0 2 4 6 8 10 12
Yie
ld S
tre
ss (
MP
a)
Time (months)
Tested at -40ºC (aged in
distilled water)
Tested at -40ºC (aged in salt
water)
Tested at 23ºC (aged in
distilled water)
Tested at 23ºC (aged in salt
water)
Tested at 80ºC (aged in
distilled water)
Tested at 80ºC (aged in salt
water)
Figure 16. Evolution of the yield stress of XNR 6852-1 adhesive.
0
10
20
30
40
50
60
70
0 2 4 6 8 10 12
Yie
ld S
tre
ss (
MP
a)
Time (months)
Tested at -40ºC (aged in
distilled water)
Tested at -40ºC (aged in salt
water)
Tested at 23ºC (aged in
distilled water)
Tested at 23ºC (aged in salt
water)
Tested at 80ºC (aged in
distilled water)
Tested at 80ºC (aged in salt
water)
Figure 17. Evolution of the yield stress of XNR 6852-1 adhesive.
THE JOURNAL OF ADHESION 109

(3) The moisture uptake of SikaPower 4720 when aged in distilled water isvery high for an epoxy adhesive. This is probably a result of twophenomena:(a) The Tg of the adhesive is very sensitive to moisture uptake.(b) Once Tg approaches the temperature of the ageing environment,
the adhesive is more prone to establish hydrogen bonds with thewater molecules, further increasing the water uptake and thedrop in Tg.
(4) The Tg of SikaPower 4720 adhesive is lower than room temperaturewhen it is aged in distilled water. This has severe consequences on thetensile properties of the adhesive, especially when tested at 80°C.
0
500
1000
1500
2000
2500
3000
3500
Dry specimens Specimens aged in salt water Specimens aged in distilled water
0
500
1000
1500
2000
2500
3000
3500
0
500
1000
1500
2000
2500
3000
3500
a cb
Figure 18. Young’s modulus of XNR 6852-1 as a function of moisture uptake and test tempera-ture (values in MPa): (a) tested at −40°C, (b) tested at 23°C, and (c) tested at 80°C.
0
500
1000
1500
2000
2500
3000
3500
4000
Dry specimens Specimens aged in salt water Specimens aged in distilled water
0
500
1000
1500
2000
2500
3000
3500
4000
0
10
20
30
40
50
60
70
a b c
Figure 19. Young’s modulus of SikaPower as a function of moisture uptake and test temperature(values in MPa): (a) -tested at −40°C, (b) tested at 23°C, and (c) tested at 80°C.
110 G. VIANA ET AL.

(5) The tensile properties of both adhesives studied were not dependenton the ageing time.
(6) The tensile properties of the adhesives are affected by temperature andmoisture. Moisture causes plasticization in the adhesives, reducingtheir strength, stiffness, and increasing their ductility. Such resultshave been obtained by many researchers at room temperature[27,29,30]. However, the adhesive can be more or less dependent onthis moisture depending on the test temperature:(a) At high temperature XNR 6852-1 aged specimens are very close to
their Tg, which makes their stiffness and strength considerablylower than the unaged specimens. In this situation the effect ofthe moisture uptake is maximum.
(b) At high temperature SikaPower 4720 aged specimens also showsuch behaviour. At this temperature the dry specimens are belowTg, while the aged specimens are above it. This causes a reductionin the strength and stiffness of the aged specimens.
(c) At low temperature, the strength and stiffness of both adhesivesincrease and the ductility decreases. The effect of the moistureuptake is not very significant.
Acknowledgements
The authors would like to thank Sika for supplying the SikaPower 4720 adhesive and NagaseChemtex for supplying the XNR 6852-1 adhesive.
Funding
This study was financed by the Fundação para a Ciência e Tecnologia through grant EXCL/EMS-PRO/0084/2012.
References
[1] Banea, M. D., da Silva, L. F. M., Campilho, R. D. S. G., and Sato, C., J Adhes. 90, 16–40(2014).
[2] Banea, M. D., and da Silva, L. F. M., Proc. Inst. Mech. Eng. Part L: J. Mater. Des. Appl.223, 1–18 (2009).
[3] Loh, W. K., Crocombe, A. D., Wahab, M. M. A., and Ashcroft, I. A., Int. J. Adhes.Adhes. 25, 1–12 (2005).
[4] Mubashar, A., Ashcroft, I. A., Critchlow, G. W., and Crocombe, A. D., Int. J. Adhes.Adhes. 29, 751–760 (2009).
[5] Ameli, A., Datla, N. V., Papini, M., and Spelt, J. K., J. Adhes. 86, 698–725 (2010).[6] Lin, Y. C., and Chen, X., Polymer 46, 11994–12003 (2005).[7] Han X., Crocombe, A. D., Anwar, S. N. R., Hu, P., and Li, W. D., J. Adhes. 90, 420–436
(2014).
THE JOURNAL OF ADHESION 111

[8] Zhou, J. M., and Lucas, J. P., Polymer 40, 5513–5522 (1999).[9] Zhou, J. M., and Lucas, J. P., Polymer 40, 5505–5512 (1999).[10] Adamson, M. J., J. Mater. Sci. 15, 1736–1745 (1980).[11] Adams, R. D., Coppendale, J., Mallick, V., and Al-Hamdan, H., Int. J. Adhes. Adhes. 12,
185–190 (1992).[12] Deb, A., Malvade, I., Biswas, P., and Schroeder, J., Int. J. Adhes. Adhes. 28, 1–15 (2008).[13] Banea, M. D., and Silva, L. F. M., J. Adhes. 85, 261–285 (2009).[14] Srivastava, V. K., Int. J. Adhes. Adhes. 23, 59–67 (2003).[15] Grant, L. D. R., Adams, R. D., and da Silva, L. F. M., Int. J. Adhes. Adhes. 29, 535–542
(2009).[16] Banea, M. D., de Sousa, F. S. M., da Silva, L. F. M., Campilho, R. D. S. G., and Pereira,
A. M. D., J. Adhes. Sci. Technol. 25, 2461–2474 (2011).[17] Marques, E. A. S., da Silva, L. F. M., Banea, M. D., and Carbas, R. J. C., J. Adhes. 91,
556–585 (2015).[18] Banea, M. D., and da Silva, L. F. M., Proc IMechE, Part L: J. Mater.-Des. Appl. 224, 51–
62 (2010).[19] Banea, M. D., da Silva, L. F. M., and Campilho, R. D. S. G., Int. J. Adhes. Adhes. 31,
273–279 (2011).[20] Pethrick, R. A., Proc IMechE, Part L: J. Mater.: Des. Appl. 229, 349–379 (2014).[21] Winston, P. W., and Bates, D. H., Ecology 41, 232–237 (1960).[22] Zhang, Y., Adams, R. D., and da Silva L. F. M., J. Adhes. 89, 785–806 (2013).[23] Costa, M., Viana, G., Canto, C., da Silva, L., Banea, M., Chaves, F., et al., Proc IMechE,
Part L: J. Mater.: Des. Appl. Epub ahead of print 7 October 2015. doi:10.1177/1464420715610248.
[24] Carbas, R. J. C., Marques, E. A. S., da Silva, L. F. M., and Lopes, A. M., J. Adhes. 90,104–119 (2014).
[25] Zhang, Y., Adams, R. D., and da Silva, L. F. M., J. Adhes. 90, 327–345 (2014).[26] Silva, L. F. M. D., and Sato, C., Design of Adhesive Joints under Humid Conditions,
(Springer-Verlag, Berlin, Heidelberg, 2013). Chs. 2–7.[27] Sugiman, S., Crocombe, A. D., and Aschroft, I. A., Int. J. Adhes. Adhes. 40, 224–237
(2013).[28] Zhang, Y., Adams, R. D., and da Silva, L. F. M., Int. J. Adhes. Adhes. 50, 85–92 (2014).[29] Barbosa, A. Q., da Silva, L. F. M., and Öchsner, A., J. Adhes. Sci. Technol. 29, 1714–1732
(2015).[30] Lin, Y. C., and Chen, X., Polymer 46, 11994–12003 (2005).
112 G. VIANA ET AL.


PAPER 3


188
Abstract Structural adhesives are increasingly being used in the aerospace and automotive industries. They allow for light weight vehicles, fuel savings and reduced emissions. However, the environmental degradation of adhesive joints is a major setback in its wide im-plementation. Moisture degradation of adhesive joints includes plasticization, attacking of the interface, swelling of the adhesive and consequent creation of residual stresses. This may lead to reversible and irreversible damage. In this work double cantilever beam (DCB) specimens using two different adhesives for the automotive industry were subjected to two different ageing environments. They were tested periodically until the toughness of the adhesives stabilized, which means that they were fully degraded. An association was made between the toughness of the adhesive and the amount of water that it had absorbed. This way it was possible to indirectly measure the water uptake in an adhesive joint taking into account the water uptake properties of the adhesives studied, which had been determined in another study. It was found that diffusion of water into the studied adhesive joints was faster than diffusion through the bulk adhesive alone. A model that takes into account diffusion through the interface between the adhesive and the adherends was proposed. Keywords Hygrothermal ageing,adhesive joints; moisture degradation, double cantilever beam, diffusion
Water Diffusion in Double Cantilever Beam Adhesive Joints
1 INTRODUCTION
Structural adhesives are increasingly being used in the transport industries. They allow for light weight vehicles, energy savings and reduced emissions. The main advantages include more uniform load distribution, higher fatigue resistance than other traditional joining methods and the ability to
G. Viana a
M.Costa a
M.D. Baneab
L.F.M. da Silvac a Instituto de Ciência e Inovação em Engenharia Mecânica e Engenharia In-dustrial (INEGI), 4200-465 Oporto, Portugal b Federal Centre of Technological Education in Rio de Janeiro (CEFET), Av. Maracanã, 229, Rio de Janeiro, Brazil c Departamento de Engenharia Mecânica, Faculdade de Engenharia da Universida-de do Porto (FEUP), 4200-465 Oporto, Portugal http://dx.doi.org/10.1590/1679-78253040 Received 02.05.2016 Accepted 16.11.2016 Available online 29.11.2016

G. Viana et al. / Water Diffusion in Double Cantilever Beam Adhesive Joints 189
Latin American Journal of Solids and Structures 14 (2017) 188-201
join dissimilar materials (Banea et al. 2014). Also, due to their high vulnerability to stress concen-tration, the only viable way to join composite materials, such as fiber reinforced plastic, is with a structural adhesive (Banea and da Silva 2009). However, the environmental degradation of adhesive joints is a major setback in their wide implementation (Costa et al. 2016d).
Moisture degradation of adhesives include reduction of their mechanical properties, inducing plasticization (Costa et al. 2016a, Costa et al. 2016b, Costa et al. 2016c, Sugiman, Crocombe and Aschroft 2013, Wylde and Spelt 1998). The deleterious effects are greater in adhesive joints as the degradation of the adhesive-adherend interface may cause interfacial failure.
The water diffusion in adhesives is frequently controlled by the Fick’s laws. Fickian sorption happens when the diffusion is much slower than relaxation. In this situation, the uptake will be proportional to the square root of exposure time. When the opposite occurs, one is in the presence of case II diffusion, in which the water uptake is directly proportional to the exposure time. In this case, a fully saturated and swollen front advances against the unpenetrated polymer (2013).
Although fickian diffusion is the most common uptake behavior in adhesives, non-fickian diffu-sion is not uncommon. Other models have been developed, such as the dual fickian diffusion (Loh et al. 2005), delayed dual fickian (Mubashar et al. 2009) and the Langmuir model (Ameli et al. 2010). In many cases the water uptake may be fickian under certain environmental situations and non-fickian under others. Generally non fickian behaviour is more prone to happen at higher tempera-tures (Zhou and Lucas 1995), higher relative humidity (Ameli et al. 2010, Loh et al. 2005) and smaller thicknesses of the bulk adhesive specimen (Loh et al. 2005). There is also evidence that while a bulk adhesive may have a fickian diffusion behaviour, the same adhesive in a joint may have a case II diffusion behaviour (Liljedahl et al. 2009).
The rate at which the water is absorbed and the maximum water uptake depend on environ-mental factors, such as the relative humidity and temperature and on the thickness (Loh et al. 2005, Y.C. Lin 2005) and the stress state of the adhesive (X. Han 2014).
As the water diffuses into the adhesive, some of this moisture becomes bound water. Bound wa-ter generally increases with exposure time and temperature (Zhou and Lucas 1999a, Zhou and Lucas 1999b). Unlike the free water that occupies the free space of the adhesive, this bound water is responsible for the volumetric changes that are observed in adhesives under high humidity environ-ments, which may cause residual stresses in adhesive joints (Adamson 1980). Zhou and Lucas (Zhou and Lucas 1999a, Zhou and Lucas 1999b) have found two types of bound water: Type I involves water molecules forming a single hydrogen bond while type II results from water forming multiple hydrogen bonds. Type I bound water acts as a plasticizer, increasing the chains segment mobility. It is responsible for decreasing the glass transition temperature (Tg) (Barbosa, da Silva and Ochsner 2015, Zhang, Adams and da Silva 2014, Zhou and Lucas 1999b). If the temperature is high and the exposure time is long, type II bound water may also occur. This type of bound water is responsible for creating secondary cross-linking (Zhou and Lucas 1999a), which lessens the extent of Tg depres-sion (Zhou and Lucas 1999b). While type I bound water can be removed at low temperature, in order to remove type II bound water, the adhesive must be subjected to relatively high tempera-tures (Zhou and Lucas 1999b).
Gravimetric methods are usually used in order to measure the water uptake of an adhesive (2012). This consists simply in subjecting a plate of bulk adhesive to an ageing environment, such

190 G. Viana et al. / Water Diffusion in Double Cantilever Beam Adhesive Joints
Latin American Journal of Solids and Structures 14 (2017) 188-201
as distilled water, a salt solution, air with a particular relative humidity, or other environments compatible with what the adhesive will be subjected in its service life, such as toluene (Zhang et al. 2014), and measuring the weight change over time with a precision scale. This method is, however, very difficult to use in an adhesive joint, which usually uses a very low amount of adhesive, whose weight change cannot be measured with common precision scales. In order to overcome this difficul-ty and determine the average water uptake or the moisture profile in an adhesive joint, other tech-niques have been used. Among these techniques is the FTIR (Fourier transform infrared spectros-copy) -transmission spectroscopy (Wapner and Grundmeier 2004) and nuclear reaction analysis (Liljedahl et al. 2009).
(Zannideffarges and Shanahan 1995) have tested torsional joints and bulk tensile and compres-sive specimens after ageing them for different amounts of time. The modulus of both the bulk spec-imens and the torsional joints were monitored as a function of the ageing time. Taking the evolu-tion of the Young’s modulus into account, approximations to the diffusion coefficients of the joints and the bulk specimens were computed and it was found that the diffusion coefficient of the joints was much higher than the bulk specimens’.
(Kinloch, Little and Watts 2000) have concluded that relatively viscous adhesives may have dif-ficulty penetrating in the pores and gaps of substrates, which may lead to premature rupture of adhesive joints, which are subjected to moist environments, either due to the hydration of the up-permost regions of the oxide layer or due to weakening of the adhesive-adherend interface. If a low viscosity primer is applied prior to bonding on a phosphoric acid anodized surface, the results are much improved because the primer will fill in the gaps which would be otherwise filled with water.
In this study, the toughness of two epoxy adhesives that were subjected to two different ageing environments: distilled water and a saturated water solution of NaCl (referred throughout this pa-per as “salt water” and is equivalent to subjecting the specimens to a 75% RH environment (Winston and Bates 1960)). The specimens were tested periodically until no change in the fracture toughness was perceptible. At this point it was considered that the specimens were fully saturated. It was found that the time it took for the specimens to saturate was shorter than if only the proper-ties of the bulk adhesive were considered. Based on this information, the approximate diffusion coef-ficients of the interfaces were computed. This allows a more accurate prediction of the water diffu-sion in complex adhesive joints, which leads to more accurate predictions of the strength of aged adhesive joints. 2 MATERIALS
2.1 Adhesives
The adhesives, which were developed for the automotive industry and were recommended by Sika® and Nagase® for this durability study are the following:
The epoxy adhesive XNR 6852-1, supplied by NAGASE CHEMTEX® (Osaka, Japan). This adhesive is a one-part system that cures at 150oC for 3 h. It has a high strength and high displacement to failure;

G. Viana et al. / Water Diffusion in Double Cantilever Beam Adhesive Joints 191
Latin American Journal of Solids and Structures 14 (2017) 188-201
The epoxy adhesive SikaPower 4720, supplied by SIKA® (Portugal, Vila Nova de Gaia). This adhesive is a two-part system that has the advantage of curing at room temperature for 24 hours.
The stress-displacement curves of bulk tensile specimens of these adhesives obtained in a previ-ous study (Viana et al. 2016) are shown in Figure 1.
Figure 1: Stress-displacement curves of both adhesives used.
2.1 Substrates
In order to measure the toughness of adhesive joints, DCB specimens were used. To avoid plastic deformation while testing, the substrates were made of the high strength aluminium alloy 6082-T6. In a standard DCB specimen, whose length is much greater than the width, water sorption occurs almost entirely along the width direction (Hua et al. 2006). However, they take very long time to reach saturation. Instead of using this standard specimen geometry, a smaller geometry (shown in Figure 2) was used.
Some studies about the effect of DCB specimen geometry on the fracture energy (GIC) of the adhesive layer have been undertaken (Campilho et al. 2014, Costa et al. 2015). Results show that the geometry of the substrates may have influence on the measured toughness of the adhesive. This suggests that GIC may not be a material parameter, but a geometry-dependent quantity instead. In this study, in order to allow for a fast ingress of water into the adhesive layer, small DCB specimens were used. The results obtained should be compared only between specimens of the same geometry.
Figure 2: Geometry of the DCB specimens (dimensions in mm).
120
40
10

192 G. Viana et al. / Water Diffusion in Double Cantilever Beam Adhesive Joints
Latin American Journal of Solids and Structures 14 (2017) 188-201
3 EXPERIMENTAL PROCEDURE
3.1 Specimen Fabrication
Prior to bonding, the surfaces of the DCB substrates were abraded with a 80 grit CSi sandpaper, cleaned in an ultrasonic acetone bath and received a phosphoric acid anodisation. Less than a day after being anodized, the specimens were bonded and left to cure for 3h at 150oC or for 24h at room temperature, according to the indication of the manufacturer of each adhesive used. After the cure cycle the excess adhesive was removed and the specimens were left to dry for at least 3 weeks in a dry desicator. After this time, the specimens of each adhesive were divided into three groups:
Dry specimens, which were ready to be tested; Specimens to be aged in a saturated solution of NaCl at 32.5oC (refered throughout this pa-
per as “salt water”), which is equivalent to ageing them in a 75% RH environment (Winston and Bates 1960);
Specimens to be aged in distilled water at 32.5oC. In this study, specimens with reduced dimensions were used. This allowed time efficient produc-
tion and ageing. 3.2 Test Procedure
After all specimens had been produced and dried in a dry desicator, they were separated into the three different groups mentioned in the previous section. The dry specimens were immediately test-ed while the specimens to be aged were placed in their respective ageing environment and tested periodically at a displacement rate of 0.5 mm/min until their toughness stabilized, meaning that they were fully degraded by the absorbed water.
The effect of moisture uptake in the adhesives studied tends to be more pronounced at 80oC than at room or lower temperatures (Viana et al. 2016). For this reason, it was decided that the tests should be made at 80oC, as it would be possible to better associate the toughness of the adhe-sive to the moisture that the joint has absorbed. A climatic chamber coupled with an universal test machine (INSTRON® model 3367) allowed to test the specimens at 80oC. Right before testing, the specimens were left inside the climatic chamber at 80oC for 10 minutes to make sure that the tem-perature was exactly 80oC in the entire specimen. 4 EXPERIMENTAL RESULTS
After testing, the fracture surfaces were observed visually. As can be seen in Figure 3, the failure modes were interfacial for every case.
The toughness of the aged specimens was measured regularly. The results were plotted as a function of the ageing time, as can be seen in Figure 4. The longer the specimens were kept im-mersed in water (either distilled water or salt water), the greater the drop in their toughness was, until it starts to level off.

G. Viana et al. / Water Diffusion in Double Cantilever Beam Adhesive Joints 193
Latin American Journal of Solids and Structures 14 (2017) 188-201
a. XNR 6852-1
b. SikaPower 4720
Figure 3: Fracture surfaces of both adhesives used.
Figure 4: Fracture energy of both adhesives studied as a function of ageing time and ageing environment.
The rate of toughness loss was maximum at the beginning of the exposure and kept diminishing
until equilibrium was attained. As it would be expectable, the final toughness of the specimens that were kept in salt water was higher than that of the specimens immersed in distilled water.
Once the toughness reached a plateau, it was considered that the specimens were fully saturat-ed. This way, it is possible to make a correlation between the measured toughness and the water content of the specimen, taking also into account the equilibrium water uptake of the bulk adhesive measured in a previous study (Viana et al. 2016). Although some specimens did not reach a clear plateau, it is perceptible that the toughness of the specimens would not decrease significantly fur-ther, meaning that they were almost fully saturated.
It was considered that these specimens were dry when they were first tested and fully saturated at the time of the last toughness measurement. Considering that the GIC that was measured chang-es linearly with the moisture concentration of the adhesive, using linear interpolation, the moisture concentration as a function of the ageing time was calculated. Figure 5 shows the calculated water uptake of both adhesives as a function of the square root of time.
a
b

194 G. Viana et al. / Water Diffusion in Double Cantilever Beam Adhesive Joints
Latin American Journal of Solids and Structures 14 (2017) 188-201
a. XNR 6852-1 aged in distilled water
b. XNR 6852-1 aged in salt water
c. SikaPower 4720 aged in distilled water
d. SikaPower 4720 aged in salt water
Figure 5: Water uptake of both adhesives used as a function of ageing time and ageing environment.
5 NUMERICAL MODELLING
The water uptake in the adhesive joint was modeled using the Finite element method (FEM). As the bondline is very long, diffusion only in the width direction is enough to predict the water ab-sorption of the adhesive joint (Hua et al. 2006). The adhesive joints reached their maximum mois-ture uptake sooner than expected if only sorption in the bulk adhesive was considered, taking into account the adhesive diffusion properties determined in a previous study (Viana et al. 2016). This is

G. Viana et al. / Water Diffusion in Double Cantilever Beam Adhesive Joints 195
Latin American Journal of Solids and Structures 14 (2017) 188-201
thought to be due to interfacial diffusion of water. In order to model this phenomenon, two types of model were adopted:
1. A one dimensional model, in which the overall water uptake of the joint was modeled. The diffusion along the width of the joint was modeled using unidimensional beam ele-ments. The diffusion coefficient attributed to these elements were fitted so that the numeri-cal prediction would match the moisture uptake that was calculated, taking into account the experimentally measured toughness. This way it was possible to compute the overall diffusion coefficient (Daverage) of the joint through an inverse method;
2. A two dimensional model, in which the water uptake of the bulk adhesive and the water uptake in the adhesive-adherend interface were modeled separately. In this model, the in-crease in the diffusion speed is attributed to capillary diffusion happening at the interface between the adhesive and the adherends. In order to model this phenomenon, two layers were considered (see Figure 6): a. A layer of adhesive, whose diffusion properties were determined in a previous study
(Viana et al. 2016) (see Table 1). Depending on the ageing environment, these adhesives may present Fickian or dual Fickian behavior. For this reason, two diffusion coefficients and two equilibrium moisture uptakes are presented;
b. A very thin layer that represents the interface. The diffusion coefficient of this layer was fitted so that the water uptake of the adhesive would match the water uptake that was calculated from the experimentally measured toughness.
Figure 6: Geometry of the model used to predict interfacial moisture uptake.
Due to the symetry, only the dotted rectangle was modeled.

196 G. Viana et al. / Water Diffusion in Double Cantilever Beam Adhesive Joints
Latin American Journal of Solids and Structures 14 (2017) 188-201
Figure 7: Detail of the mesh used used in the two dimensional model (area contoured in Figure 6).
D1 (m2/s) mwt1 D2 (m2/s) mwt2
XNR 6852-1 Distilled Water 6.0E-13 0.0095 8E-14 0.0023
Salt Water 6.0E-13 0.0080 8E-14 0.0006 SikaPower
4720 Distilled Water 1.2E-13 0.325 - -
Salt Water 2.6E-13 0.020 2.5E-14 0.018 mwt1- Equilibrium moisture content 1 mwt2- Equilibrium moisture content 2
Table 1: Moisture diffusion parameters of both adhesives studied.
Figure 8: Numerical prediction of the moisture profile of XNR 6852-1 after 24 hours of ageing.
The upper bar represents one quarter of the adhesive layer and the lower bar indicates,
through a code of colours, its prediction of moisture uptake.
Ageing
environment
Daverage(m2/s) (Obtained with the 1D model)
Dinterface(m2/s) (Obtained with the 2D model)
XNR 6852-1 Distilled water 1.8E-12 5.5E-11
Salt water 1.5E-12 5.0E-11
SikaPower 4720 Distilled water 4.5E-12 2.2E-10
Salt water 1.6E-12 6.2E-11
Table 2: Moisture diffusion parameters of the joints bonded with both adhesives studied.
1.18% 0%

G. Viana et al. / Water Diffusion in Double Cantilever Beam Adhesive Joints 197
Latin American Journal of Solids and Structures 14 (2017) 188-201
a. XNR 6852-1 aged in distilled water
b. XNR 6852-1 aged in salt water
c. SikaPower 4720 aged in distilled water
d. SikaPower 4720 aged in salt water
Figure 9: Experimental and numerical prediction of the adhesive joints studied.
This way it was possible to compute the diffusion coefficient of the interface (Dinterface) through
an inverse method. As the coefficient of diffusion was set to be higher at the interface, diffusion of water occurs
preferentially in this region, which is then responsible for bringing moisture deeper into the adhesive layer. This moisture is quickly absorbed by the adhesive. Figure 8 shows the computed moisture uptake of XNR 6852-1 adhesive after 24 hours of immersion.

198 G. Viana et al. / Water Diffusion in Double Cantilever Beam Adhesive Joints
Latin American Journal of Solids and Structures 14 (2017) 188-201
The phenomenon of diffusion shares mathematics with the phenomenon of heat conduction and it is possible to model the moisture uptake of the adhesive simply as a heat transfer problem. The equivalent parameters to permeability coefficient, diffusion coefficient and solubility coefficient are thermal conductivity, thermal diffusivity and heat capacity respectively. In both the one dimension-al model and the two dimensional model the heat transfer elements available at the Abaqus® li-brary DC1D2 and DC2D4 for the 1D and 2D analyses, respectively, were used.
Due to the symmetry of the problem, in order to reduce the computation effort and to increase the speed of the analysis only one quarter of the section of the specimens was modelled (see Figure 6). A detail of the mesh is shown in Figure 7. Across line segments [AB], [BC] and [CD], represent-ed in Figure 6, no mass transfer was allowed. In the line segment [AD] equilibrium moisture uptake is attained instantly because it is in contact with the ageing environment.
Using this methodology, both the average diffusion coefficient and the diffusion coefficient of the interface were determined. They are shown in Table 2. The comparison between the experimental diffusion and the numerical predictions are shown in Figure 9. Although there is some dispersion in the results, which is expected given the method used, the numerical prediction fits the experimental results well. 6 DISCUSSION
Experimental results show that the water diffusion in bonded joints was faster than in the bulk adhesive. Other authors have obtained similar results, using different methods (Liljedahl et al. 2009, Wapner and Grundmeier 2004, Zannideffarges and Shanahan 1995). The comparison between the diffusion coefficients obtained in these studies are summarized in Table 3. From the analysis of this table, it is possible to conclude that when in an adhesive joint, the adhesive usually absorbs water faster than when in bulk.
Reference Method D (m2/s) Ageing tem-
perature (Zannideffarges and Shanahan
1995)
Mechanical loading (change in adhesive’s modulus) 5.3E-12 70oC
Gravimetric measurement 1.4E-12
(Wapner and Grundmeier
2004) FTIR-transmission microscopy 1.13E-13
21oC
(Frantzis 1998) Gravimetric measurement 1.0E-13
Present study
Mechanical loading (change in adhe-sive’s toughness)
SikaPower 4720 [1.5-4.6]E-12*
32.5oC XNR 6852-1 [1.5-1.8]E-12*
Gravimetric meas-urement
SikaPower 4720 [1.2-2.6]E-13* XNR 6852-1 6E-13
*These values vary if the adhesive is aged in salt water or distilled water.
Table 3: Comparison between the average diffusion coefficients determined in this work and those found in other studies.

G. Viana et al. / Water Diffusion in Double Cantilever Beam Adhesive Joints 199
Latin American Journal of Solids and Structures 14 (2017) 188-201
This behaviour might be explained by the fact that in an adhesive joint, as the adhesive is con-strained by metallic adherends, the shrinkage due to curing could lead to a less dense structure near the interface and facilitate local water uptake. The orientation of the polymer closer to the sub-strates could be different and enhance diffusion in that region. Water can diffuse at the interface by capillary diffusion through voids that exist between the adhesive and the adherends(Zannideffarges and Shanahan 1995). On the other hand, the presence of these voids allow the rapid ingress of wa-ter and enable pockets of water to be developed along the interface, which may promote diffusion in this region (Kinloch et al. 2000). Another possibility has to do with the creation of stresses due to the swelling of the adhesive. This residual stress may enhance the diffusion and promote case II diffusion, as suggested by Liljedahl et al. (Liljedahl et al. 2009).
The speed of interfacial moisture diffusion depends on the roughness of the substrate and on the capacity of the adhesive to fill in the gaps of the adherends. In order to avoid this problem, maybe if a low viscosity primer capable of filling in the small gaps that exist in the adhesive surface is ap-plied, adsorption of water by the substrates would be reduced (Kinloch et al. 2000) and the water uptake would be slower. 7 CONCLUSION
This work focused on the measurement of the toughness of aged DCB adhesive joints. Tests were made after different ageing times and a strong reduction in the toughness of the adhesive was found. From the variation of toughness of the specimens, the moisture uptake of the adhesive was calculated. The speed of moisture ingress into the adhesive was higher than expected if only the moisture uptake through the bulk adhesive was considered. It is thought that this is due to capil-lary diffusion enhanced by voids that exist at the interface between the adhesive and the adherends. A finite element model was proposed in order to predict the average diffusion coefficient and the diffusion coefficient of the interface. The numerical prediction fits the experimental results well. This information can help predict the moisture uptake of more complex joints.
In order to predict the mechanical behaviour of adhesive joints, it is very important to be able to predict the moisture uptake in each point of the adhesive layer. This study sheds some light on this subject and allows a better prediction of the water uptake in adhesive joints. However, more work is needed in order to assess the influence of the roughness of the substrates and the capability of the adhesive to fill the voids of the substrates on the interfacial diffusion coefficient. Aknowledgements
The authors would like to thank Sika for supplying SikaPower 4720 adhesive and Nagase Chemtex for supplying XNR 6852-1 adhesive. This study was financed by the Fundação para a Ciência e Tecnologia through grant EXCL/EMS-PRO/0084/2012. References
Adamson, M.J. (1980), Thermal-Expansion and Swelling of Cured Epoxy-Resin Used in Graphite-Epoxy Composite-Materials, Journal of Materials Science, 15, 1736-1745.

200 G. Viana et al. / Water Diffusion in Double Cantilever Beam Adhesive Joints
Latin American Journal of Solids and Structures 14 (2017) 188-201
Ameli, A., Datla, N.V., Papini, M., Spelt, J.K. (2010), Hygrothermal Properties of Highly Toughened Epoxy Adhe-sives, Journal of Adhesion, 86, 698-725.
Banea, M.D., Silva, L.F.M. da (2009), Adhesively bonded joints in composite materials: an overview, Proceedings of the Institution of Mechanical Engineers, Part L: Journal of Materials: Design and Applications, 223, 1-18.
Banea, M.D., Silva, L.F.M. da, Campilho, R.D.S.G., Sato, C. (2014), Smart Adhesive Joints: An Overview of Recent Developments, Journal of Adhesion, 90, 16-40.
Barbosa, A.Q., Silva, L.F.M. da, Ochsner, A. (2015), Hygrothermal aging of an adhesive reinforced with microparti-cles of cork, Journal of Adhesion Science and Technology, 29, 1714-1732.
Campilho, R.D.S.G., Moura, D.C., Banea, M.D., Silva, L.F.M. da (2014), Adherend thickness effect on the tensile fracture toughness of a structural adhesive using an optical data acquisition method, International Journal of Adhe-sion and Adhesives, 53, 15-22.
Costa, M., Viana, G., Canto, C., Silva, L. da, Banea, M., Chaves, F., Campilho, R., Fernandes, A. (2015), Effect of the size reduction on the bulk tensile and double cantilever beam specimens used in cohesive zone models, Proc IMechE, Part L: Journal of Materials: Design and Applications, 1-15.
Costa, M., Viana, G., Silva, L.F.M. da, Campilho, R.D.S.G. (2016a), Determination of the fracture envelope of an adhesive joint as a function moisture, Materialwissenschaft und Werkstofftechnik.
Costa, M., Viana, G., Silva, L.F.M. da, Campilho, R.D.S.G. (2016b), Effect of humidity on the fatigue behaviour of adhesively bonded aluminium joints, Latin American Journal of Solids and Structures, 13, 174-187.
Costa, M., Viana, G., Silva, L.F.M. da, Campilho, R.D.S.G. (2016c), Effect of humidity on the mechanical properties of adhesively bonded aluminium joints, Journal of Materials Design and Applications, 1-10.
Costa, M., Viana, G., Silva, L.F.M. da, Campilho, R.D.S.G. (2017), Environmental effect on the fatigue degradation of adhesive joints: a review, The Journal of Adhesion, 93, 127-146.
Frantzis, P. (1998), Environmental Attack on Adhesive Joints: Part I:Test Equipment, International Journal Series A Solid Mechanics and Material Engineering, 41, 231-242.
Hua, Y., Crocombe, A.D., Wahab, M.A., Ashcroft, I.A. (2006), Modelling environmental degradation in EA9321-bonded joints using a progressive damage failure model, Journal of Adhesion, 82, 135-160.
Han, X., Crocombe, A.D., Anwar, S.N.R., Hu, P., Li, W.D. (2014), The Effect of a Hot–Wet Environment on Adhe-sively Bonded Joints Under a Sustained Load, The Journal of Adhesion, 90, 420-436.
Kinloch, A.J., Little, M.S.G., Watts, J.F. (2000), The role of the interphase in the environmental failure of adhesive joints, Acta Materialia, 48, 4543-4553.
Liljedahl, C.D.M., Crocombe, A.D., Gauntlett, F.E., Rihawy, M.S., Clough, A.S. (2009), Characterising moisture ingress in adhesively bonded joints using nuclear reaction analysis, International Journal of Adhesion and Adhesives, 29, 356-360.
Lin, Y.C., Chen, X. (2005), Moisture sorption–desorption–resorption characteristics and its effect on the mechanical behavior of the epoxy system, Polymer, 11994–12003.
Loh, W.K., Crocombe, A.D., Wahab, M.M.A. Ashcroft, I.A. (2005), Modelling anomalous moisture uptake, swelling and thermal characteristics of a rubber toughened epoxy adhesive, International Journal of Adhesion and Adhesives, 25, 1-12.
Mubashar, A., Ashcroft, I.A., Critchlow, G.W., Crocombe, A.D. (2009), Moisture absorption-desorption effects in adhesive joints, International Journal of Adhesion and Adhesives, 29, 751-760.
Silva, L.F.M. da, Dillard, D., Blackman, B. & Adams, R.D. (2012), Testing adhesive joints - Best practices.
Silva, L.F.M. da, Sato, C. (2013), Design of Adhesive Joints under Humid Conditions.
Sugiman, S., Crocombe, A.D., Aschroft, I.A. (2013), Experimental and numerical investigation of the static response of environmentally aged adhesively bonded joints, International Journal of Adhesion and Adhesives, 40, 224-237.

G. Viana et al. / Water Diffusion in Double Cantilever Beam Adhesive Joints 201
Latin American Journal of Solids and Structures 14 (2017) 188-201
Viana, G., Costa, M., Banea, M.D., Silva, L. da (2017), Behaviour of environmentally degraded epoxy adhesives as a function of temperature (2017), The Journal of Adhesion, 93, 95-112.
Wapner, K., Grundmeier, G. (2004), Spatially resolved measurements of the diffusion of water in a model adhe-sive/silicon lap joint using FTIR-transmission-microscopy, International Journal of Adhesion and Adhesives, 24, 193-200.
Winston, P.W., Bates, D.H. (1960), Saturated Solutions for the Control of Humidity in Biological-Research, Ecology, 41, 232-237.
Wylde, J.W., Spelt, J.K. (1998), Measurement of adhesive joint fracture properties as a function of environmental degradation, International Journal of Adhesion and Adhesives, 18, 237-246.
Zannideffarges, M.P., Shanahan, M.E.R. (1995), Diffusion of Water into an Epoxy Adhesive - Comparison between Bulk Behavior and Adhesive Joints, International Journal of Adhesion and Adhesives, 15, 137-142.
Zhang, Y., Adams, R.D., Silva, L.F.M. da (2014), Absorption and glass transition temperature of adhesives exposed to water and toluene, International Journal of Adhesion and Adhesives, 50, 85-92.
Zhou, J.M., Lucas, J.P. (1995), The Effects of a Water Environment on Anomalous Absorption Behavior in Graph-ite-Epoxy Composites, Composites Science and Technology, 53, 57-64.
Zhou, J.M., Lucas, J.P. (1999a), Hygrothermal effects of epoxy resin. Part I: the nature of water in epoxy, Polymer, 40, 5505-5512.
Zhou, J.M., Lucas, J.P. (1999b), Hygrothermal effects of epoxy resin. Part II: variations of glass transition tempera-ture, Polymer, 40, 5513-5522.

PAPER 4


Full Terms & Conditions of access and use can be found athttp://www.tandfonline.com/action/journalInformation?journalCode=tast20
Journal of Adhesion Science and Technology
ISSN: 0169-4243 (Print) 1568-5616 (Online) Journal homepage: http://www.tandfonline.com/loi/tast20
Moisture and temperature degradation of doublecantilever beam adhesive joints
G. Viana, M. Costa, M. D. Banea & L. F. M. da Silva
To cite this article: G. Viana, M. Costa, M. D. Banea & L. F. M. da Silva (2017) Moisture andtemperature degradation of double cantilever beam adhesive joints, Journal of Adhesion Scienceand Technology, 31:16, 1824-1838, DOI: 10.1080/01694243.2017.1284640
To link to this article: https://doi.org/10.1080/01694243.2017.1284640
Published online: 31 Jan 2017.
Submit your article to this journal
Article views: 108
View related articles
View Crossmark data

Journal of adhesion science and Technology, 2017Vol. 31, no. 16, 1824–1838https://doi.org/10.1080/01694243.2017.1284640
Moisture and temperature degradation of double cantilever beam adhesive joints
G. Vianab, M. Costab, M. D. Baneac and L. F. M. da Silvaa adepartamento de engenharia Mecânica, faculdade de engenharia da universidade do Porto (feuP), oporto, Portugal; binstituto de ciência e inovação em engenharia Mecânica e engenharia industrial (inegi), oporto, Portugal; cfederal centre of Technological education in rio de Janeiro (cefeT), rio de Janeiro, Brazil
ABSTRACTIn this work, the double cantilever beam (DCB) test is analysed in order to evaluate the combined effect of temperature and moisture on the mode I fracture toughness of adhesives used in the automotive industry. Very few studies focus on the combined effect of temperature and moisture on the mechanical behaviour of adhesive joints. To the authors’ knowledge, the simultaneous effect of these conditions on the fracture toughness of adhesive joints has never been determined. Specimens using two different adhesives for the automotive industry were subjected to two different ageing environments (immersion in distilled water and under 75% of relative humidity). Once they were fully degraded, they were tested at three different temperatures (−40, 23 and 80 °C), which covers the range of temperature an adhesive for the automotive industry is required to withstand. The aim is to improve the long term mechanical behaviour prediction of adhesive joints. The DCB substrates were made of a high strength aluminium alloy to avoid plastic deformation during test. The substrates received a phosphoric acid anodisation to improve their long term adhesion to the adhesive. Results show that even though a phosphoric acid anodization was applied to the adherends, when the aged specimens were tested at room temperature and at 80 °C, they suffered interfacial rupture. At −40 °C, however, cohesive rupture was observed and the fracture toughness of the aged specimens was higher.
1. Introduction
Adhesive bonding has been substituting more traditional joining techniques such as riveting or welding, particularly in the transport industry. Some of the advantages include higher fatigue resistance and the ability to join dissimilar materials [1]. Adhesive joints provide more uniform stress distribution than riveted or bolted joints and are a good choice when joining fiber reinforced plastic adherends [2], as these materials are very vulnerable to stress concentrations. One of the main disadvantages of adhesive bonding is the prediction of the mechanical behaviour of aged adhesive joints, as structural adhesives are moisture and temperature sensitive.
KEYWORDSMoisture degradation; temperature degradation; fracture toughness
ARTICLE HISTORYreceived 9 november 2016 revised 10 January 2017 accepted 12 January 2017
© 2017 informa uK limited, trading as Taylor & francis group
CONTACT l. f. M. da silva [email protected]

JOURNAL OF ADHESION SCIENCE AND TECHNOLOGY 1825
Moisture degradation of adhesives includes reduction of modulus and strength and increase in ductility [3–7]. The fracture toughness of the adhesive may increase or decrease, depending on the environmental conditions and ageing time [8,9]. However, in adhesive joints the effects may be more severe, as the moisture degradation of the interface between the adhesive and the adherend may cause adhesive failure.
Several models have been developed to predict the water absorption of adhesives. The simplest and most common is the fickian diffusion model, which is valid when water absorption is much slower than the relaxation of the adhesive. Although being the simplest and most common model, other more complex models have been developed to describe anomalous behaviours, such as dual fickian diffusion [10], delayed dual fickian [11] and the Langmuir model [12]. In many cases the water uptake may be fickian under certain environmental situations and non-fickian under others. Generally, non fickian behaviour is more prone to occur at higher temperatures, higher relative humidity and for smaller thick-nesses of bulk adhesive specimens [10]. There is also evidence that while a bulk adhesive may have a fickian diffusion behaviour, the same adhesive in a joint may have a different water uptake behaviour [13].
The rate at which the water is absorbed and the maximum water uptake depend on environmental factors, such as the relative humidity [12,14], temperature [12,15–17], the thickness [10,18] and on the stress state of the adhesive [7,19].
Water diffuses through the adhesive as free water, occupying the free spaces between the polymer chains. Some of this free water will form bridges with the polymer chains and turn into bound water. The amount of bound water increases with higher temperatures and longer exposures [20,21]. Bound water is responsible for the volumetric changes of adhesives that are subjected to moist environments. If, however, the adhesive is constrained (as in an adhesive joint, for example) residual stresses may arise [10,22–24].
Zhou and Lucas [20,21] have found that two kinds of bound water exist:
(1) Type I bound water is responsible for increasing the polymer chains mobility. It acts therefore as a plasticizer: the effects are the decrease of the glass transition temperature of the adhesive (Tg), increase of ductility and decrease of the adhe-sive’s strength;
(2) Type II bound water is water that forms secondary cross-linking between the polymer chains. It has the effect of reducing the extent of the Tg depression.
Type I bound water can be easily removed at relatively low temperatures, while type II bound water requires high temperature to be removed.
When subjecting a structural adhesive joint to extreme temperatures, one must be aware of two different phenomena:
(1) Thermal expansion of adherends and adhesive, which causes residual stresses, especially if the adherends are dissimilar;
(2) Different bulk adhesive properties. Generally, the adhesive gets more ductile and less strong when it is closer to Tg. Banea et al. [25] found that below Tg the tough-ness of structural adhesives remains largely constant, while above Tg it decreases dramatically [26,27].
Generally the strength of adhesive joints decreases with high and low temperatures [25,28–33].

1826 G. VIANA ET AL.
This study aims at determining the moisture and temperature dependent toughness of two epoxy adhesives for the automotive industry. Although the separate effect of moisture and temperature on the mechanical properties of structural adhesive joints is relatively well studied, its combined effect is not yet well known [34,35]. To the authors’ knowledge, there is not any study regarding the combined effect of temperature and moisture on the toughness of structural adhesive joints. This paper aims to shed light on this subject.
In this study, the toughness of two epoxy adhesives that were subjected to two different ageing environments was analysed. After ageing the specimens in distilled water and in a saturated water solution of NaCl (referred throughout this paper as ‘salt water’), they were tested at −40, 23 and 80 °C (covering the range of temperatures required for the automotive industry).
2. Materials
2.1. Adhesives
Two adhesives for the automotive industry which were recommended by Sika® and Nagase® for this durability study were selected:
• The epoxy adhesive XNR 6852-1, supplied by NAGASE CHEMTEX® (Osaka, Japan). This adhesive is a one-part system that cures at 150 °C in 3 h.
• The epoxy adhesive SikaPower 4720 was, supplied by SIKA® (Portugal, Vila Nova de Gaia). This adhesive is a two-part system that cures at room temperature in 24 h.
A very important parameter to take into account when testing adhesive joints, especially when the joint is subjected to high temperatures, is the adhesive’s Tg. This temperature is usually high when the adhesive is dry but normally decreases when the adhesive is exposed to moist environments [20]. The Tg of both adhesives before and after ageing has been determined in a previous study [3]. Results showed the Tg of XNR 6852-1 not to be very moisture sensitive. SikaPower 4720, on the other hand, is very moisture dependent, and when aged in distilled water its Tg is actually lower than room temperature (see Figure 1), which has severe consequences on its strength and modulus as well as in its water uptake (32.5% at 32.5 °C when aged in distilled water vs. only 3.8% when aged in salt water).
Figure 1. Tg of both adhesives studied [3]: (a) Xnr 6852-1, (b) sikaPower 4720.

JOURNAL OF ADHESION SCIENCE AND TECHNOLOGY 1827
2.2. Substrates
In order to measure the toughness of adhesive joints, DCB specimens were used. To avoid plastic deformation while testing, the substrates were made of the 6082-T6 high strength aluminium alloy.
In a standard DCB specimen, which has a length much greater than the width, water sorption occurs almost entirely along the width direction [5]. However, due to its dimen-sions, it takes a very long time to reach saturation. Instead of using this standard specimen geometry, a smaller geometry (shown in Figure 2) was used.
Some studies about the effect of DCB specimen geometry on the fracture energy (GIC) of the adhesive layer have been undertaken [36,37].
3. Experimental procedure
3.1. Specimen fabrication
Prior to bonding, the surfaces of the DCB substrates were abraded with 80 grit SiC sand-paper, cleaned in an ultrasonic acetone bath and received a phosphoric acid anodisation. Less than a day after being anodised, the specimens were bonded and left to cure for 3 h at 150 °C or for 24 h at room temperature, according to the indication of the manufacturer of each used adhesive. After the cure cycle was completed, the excess adhesive was removed and the specimens were left to dry for at least 3 weeks in a dry desiccator. After this time, the specimens of each adhesive were divided into three groups:
• Dry specimens, which were ready to be tested;• Specimens aged in a saturated solution of NaCl at 32.5 °C (referred throughout this
paper as “salt water”), which is equivalent to ageing them in a 75% RH environment [38];• Specimens aged in distilled water at 32.5 °C.
Prior to testing, each specimen was loaded in pure mode I until a small pre-crack was created. This ensures that the crack tip is not blunt.
As explained above, specimens with reduced dimensions were used. This also allowed time efficient production and ageing.
3.2. Test procedure
After all specimens had been produced and dried in a dry desiccator, they were separated into the three different groups mentioned in the previous section. The dry specimens were immediately tested while the specimens to be aged were placed in their respective ageing environment. At least three valid tests were made for each environmental condition.
120
10
40
Figure 2. geometry of the dcB specimens used in this study (dimensions in mm, width = 5 mm).

1828 G. VIANA ET AL.
Some studies report that water diffusion in an adhesive joint is much faster than water diffusion through the bulk adhesive alone either due to stress enhanced diffusion [13] or due to water penetrating through the interface between adhesive and adherend [39]. Often it is very difficult to predict when an adhesive joint is fully saturated because the thin bond-lines do not absorb enough water to be measured by common precision scales. In order to determine when the specimens reached saturation, some specimens of each adhesive were tested periodically until their toughness stabilized. Using this method, it was concluded that the specimens needed 13 weeks to be fully saturated. The results of this study were already previously published by the authors [40].
After saturation had been attained, the toughness of the remaining specimens that were aged in distilled water and in salt water was measured as a function of the test temperature.
A climatic chamber coupled with a universal test machine (INSTRON® model 3367) allowed to test aged and unaged specimens at −40, 23 and 80 °C. Right before testing at −40 or 80 °C, the specimens were left inside the climatic chamber at the test temperature for 10 min to ensure that the temperature was uniform in the entire specimen. The tests were performed at the constant displacement rate of 0.5 mm/min.
After the mechanical tests, the fracture surfaces of the joints were analysed at the CEMUP laboratory (University of Porto, Portugal) using a high resolution (Schottky) Scanning Electron Microscope (SEM) with X-ray Microanalysis and Electron Backscattered Diffraction analysis: Quanta 400 FEG ESEM / EDAX Genesis X4 M. Samples were coated with a Au/Pd thin film, by sputtering, using the SPI Module Sputter Coater equipment.
4. Results and discussion
DCB specimens of each adhesive were tested at −40, 23 and 80 °C. The tests were performed with dry joints, joints aged in distilled water and joints aged in salt water. For each test a load vs displacement (P–δ) curve was recorded so that the toughness could be measured. In order to determine the fracture toughness, the compliance based beam method [41] was used. This method uses the compliance of the specimen during the test to determine an equivalent crack length that takes also into account the length of the fracture process zone. It is therefore not necessary to measure the actual crack length throughout the test. The mode I fracture toughness (GIC) can be computed using equation 1:
where P is the load measured by the load cell, b and h are the dimensions of the substrates (in this case 5 and 10 mm, respectively), Ef is a corrected flexural modulus of the specimen, G is the shear modulus of the adherends and ae is an equivalent crack length that is computed taking into account the compliance of the specimen.
Depending on the temperature and the ageing process, the DCB specimens failed either cohesively in the adhesive layer or in the adhesive-adherend interface, as shown in Figure 3. As will be discussed next, with few exceptions, adhesive failure resulted into low toughness of the specimen.
Results show that at room temperature and at 80 °C water is responsible for shifting the locus of failure from the adhesive to the adhesive-adherend interface, resulting in
(1)GIC=
6P2
b2h3
(
2a2eEf
+h2
5G
)

JOURNAL OF ADHESION SCIENCE AND TECHNOLOGY 1829
low toughness. At −40 °C, however, cohesive fracture occurred in every specimen and high values of toughness were determined.
4.1. 23 °C tests
Figures 4 and 5 present examples of P–δ and R curves of the two adhesives tested at 23 °C in the dry state and in two different moist environments. While the dry specimens suffered cohesive failure in the adhesive layer, the aged specimens suffered adhesive failure. The significant decrease in the toughness of the specimens is due to the low interfacial strength after ageing.
Figure 4. P–δ curve (a) and r-curve (b) of dry and aged Xnr 6852-1 tested at 23 °c.
a1
a2
b1
b2
Pre-crack Direction of crack propagation
Figure 3. example of cohesive and interfacial fracture surfaces of both adhesives studied: a1 – cohesive fracture of Xnr6852-1 (dry specimen tested at room temperature). a2 – cohesive fracture of sikaPower 4720 (distilled water aged specimen tested at −40 °c). b1 – interfacial fracture of Xnr6852-1 (salt water aged specimen tested at room temperature). b2 – interfacial fracture of sikaPower 4720 (dry specimen tested at 80 °c).

1830 G. VIANA ET AL.
For both adhesives, salt water specimens yielded better results than the distilled water specimens.
Despite having failed adhesively, aged XNR 6852-1 joints still hold considerable tough-ness. Distilled water aged SikaPower 4720 joints, on the other hand, have a very low tough-ness. This may be due to the low Tg of the adhesive after ageing in this environment.
Figure 6(a) is SEM image of an example of an aged XNR 6852-1 specimen that failed in the adhesive-adherend interface. It is possible to notice that this adhesive is filled with particles of about 10 μm. This is a common method to improve the toughness of the adhesive [42]. There are also some white particles on top of the adhesive layer. These are salt particles that appear on the joint after the salt water has dried.
Figure 6(b) shows a SEM image of the fracture surface of a dry SikaPower 4720 specimen that was tested at 23 °C. The fracture is cohesive through the adhesive layer and shows that this adhesive is also filled with rubber particles with sizes between 57 and 150 μm.
Figure 5. P–δ curve (a) and r-curve (b) of dry and aged sikaPower 4720 tested at 23 °c.
(a) (b)
Figure 6. seM image of a fracture surface of aged Xnr 6852-1 (a) and dry sikaPower 4720 (b) tested at room temperature.

JOURNAL OF ADHESION SCIENCE AND TECHNOLOGY 1831
4.2. −40 °C tests
Figures 7 and 8 show examples of P–δ curves of XNR 6852-1 and SikaPower 4720 joints respectively, which were tested at −40 °C. Every specimen tested at −40 °C showed cohesive fracture in the adhesive.
At the beginning of crack propagation, XNR 6852-1 suffered cohesive stable crack prop-agation. Later, as the test proceeded, the unstable crack propagation occurred. Results show that dry XNR 6852-1 has a slightly lower toughness at this temperature than at room temperature (see Figure 7(b)). Ageing further lowers the adhesive’s toughness at −40 °C. However, the toughness of the aged specimens when tested at −40 °C is higher than when
Figure 7. P–δ curve (a) and r-curve (b) of dry and aged Xnr 6852-1 tested at −40 °c.
Figure 8. P–δ curve (a) and r-curve (b) of dry and aged sikaPower 4720 tested at −40 °c.

1832 G. VIANA ET AL.
they are tested at 23 °C because, unlike the specimens that were tested at room temperature, these specimens failed cohesively in the adhesive layer.
SikaPower 4720, on the other hand, shows higher moisture dependence when tested at this temperature, as shown in Figure 8. It was not possible to determine the toughness of dry SikaPower 4720 because unstable crack propagation occurred. However, one can assume that it is quite low because they suffered unstable crack propagation within the adhesive layer. It is remarkable that the specimens aged in salt water presented a toughness that is similar to that of the dry room temperature joints. Although the yield stress of this adhesive drops after ageing, its ductility increases as an effect of adhesive plasticization [3], not affecting the fracture toughness significantly. The toughness of SikaPower4720 aged in distilled water was lower than the toughness when the specimens were aged in salt water because ageing this adhesive in distilled water completely degrades its mechanical properties [3].
Figure 9 shows a SEM image of the cohesive fracture obtained from testing both adhe-sives, both in the dry and in the aged state, at −40 °C. Both adhesives show a fragile fracture surface. A glass sphere with 0.2 mm of diameter is visible on the SikaPower 4720 fracture surface. These spheres are mixed with the adhesive and are used to ensure the proper adhesive thickness. Unlike the joints that were tested at 23 °C, these joints showed a brittle fracture, without significant plastic deformation.
4.3. 80 °C tests
Figures 10 and 11 show examples of P–δ curves and R-curves of XNR 6852-1 and SikaPower 4720 respectively. As adhesive failure was obtained in every test performed at 80 °C, one is not measuring the actual toughness of the adhesive, but the toughness of the interface between adhesive and adherend. Nevertheless, the toughness that was measured is higher than the toughness of the adhesive when the joint is tested at 23 °C, which indicates that, although interfacial failure was observed, failure was not due to interfacial degradation. Aged specimens show a considerably lower fracture energy, meaning that these interfaces were degraded by water. In a previous study [3] it was concluded that although the yield stress of dry XNR 6852-1 significantly lowers with temperature, its ductility increases very
(a) (b)
Figure 9. seM image of a fracture surface of a dry specimens of Xnr 6852-1 (a) and sikaPower 4720 (b) tested at −40 °c.

JOURNAL OF ADHESION SCIENCE AND TECHNOLOGY 1833
significantly, being its final deformation higher than 100% when tested at 80 °C. It was there-fore predictable that the toughness of this adhesive would be very high at this temperature, which was experimentally confirmed in this study (see Figure 10). Unlike XNR 6852-1, dry SikaPower 4720 shows lower toughness at 80 °C than at room temperature (see Figure 11). This is a typical consequence of testing the adhesive above Tg [26,43]. The toughness of SikaPower 4720 further decreases after ageing.
The SEM images of the fracture surfaces in Figure 12 show the interfacial failure surfaces of both dry and aged adhesives after testing at 80 °C. Adhesive XNR 6852-1 (Figure 12(a)) shows some plasticity before breaking through the interface. SikaPower 4720, on the other hand, shows a fragile behaviour (Figure 12(b)).
Figure 11. P–δ curve (a) and r-curve (b) of dry and aged sikaPower 4720 tested at 80 °c.
Figure 10. P–δ curve (a) and r-curve (b) of dry and aged Xnr 6852-1 tested at 80 °c.

1834 G. VIANA ET AL.
5. Discussion
Inevitably every specimen presents defects. Because the specimens used in this study are smaller than standard specimens, the effect of each defect is much more visible in the R-curves and the result is an R-curve that may not show a neat plateau. For this reason, only the average toughness was considered as GIC. Figure 13 presents the toughness of both joints made with both adhesives studied as a function of ageing environment and test tem-perature. Despite the application of a surface treatment that has been shown to improve the performance of bonded aluminium joints in the long term [44,45], it is important to bear in mind that not every failure occurred cohesively in the adhesive layer. Every specimen tested at 80 °C, as well as aged specimens tested at 23 °C suffered adhesive failure. In these situations, one is not measuring the actual toughness of the adhesive, but the toughness
(a) (b)
Figure 12. seM image of a fracture surface of distilled water aged Xnr 6852-1 (a) and sikaPower 4720 (b) tested at 80 °c.
Figure 13. fracture toughness of Xnr 6852-1 (a) and sikaPower 4720 (b) as a function of temperature and ageing environment.

JOURNAL OF ADHESION SCIENCE AND TECHNOLOGY 1835
of the adhesive-adherend interface. The fact that in some situations cohesive fracture did not occur allows us, however, to know in what conditions of temperature and moisture interfacial degradation is more likely to happen.
It is known that at low temperature high residual stresses may arise due to mismatch of coefficients of thermal expansion (CTE) between adhesive and adherends [46]. The ductility of the adhesive and modulus of the adhesive is also reduced due to limited chain mobility. As moisture diffuses through the adhesive, it increases the mobility of its chains, increasing its ductility at the expense of some loss of strength.
Usually the toughness of adhesives decreases at low temperature because lower temperatures reduce the mobility of the polymer chains of the adhesive. The result is a stronger but more fragile adhesive [47], with lower toughness [33]. It was found, however, in this study that water can improve the toughness of adhesives at low tem-peratures. Salt water aged SikaPower 4720 tested at −40 °C resulted in higher fracture toughness than the dry adhesive tested at room temperature. This toughness increase may be due to:
• Adhesive swelling, which can balance the residual stresses cause by CTE mismatch.• Increased chain mobility created by absorbed moisture.
The same adhesive aged in distilled water shows a very low toughness because ageing in this environment completely degrades this adhesive, as is demonstrated by its equilibrium water uptake and Tg [3].
As can be seen in Figure 13-a, dry and distilled water aged XNR 6852-1 show similar fracture toughness when tested at −40 °C probably due to the same reasons. Salt water aged XNR 6852-1 has a lower toughness. Apparently, the effect of salt water in this case was not enough to significantly improve the toughness of the adhesive at low temperature.
At room temperature the dry specimens failed cohesively in the adhesive layer while the aged specimens failed adhesively at the adhesive-adherend interface. The higher toughness was measured in the dry specimens, while the specimens that suffered adhesive failure showed a significant loss of toughness.
At 80 °C every specimen had adhesive failure. Unfortunately, as fracture occurred at the adhesive-adherend interface, one is not assessing the actual toughness of the adhesive, but the toughness of the interface instead.
Despite having failed at the interface between adhesive and adherend, dry XNR 6852-1 actually had a higher toughness at 80 °C than at room temperature. This means that the interface was not degraded and that the toughness of the adhesive is higher than the tough-ness of the interface. The interface is therefore the ‘weakest link’ and controls the failure of the joint. It was found in a previous study [3] that at 80 °C the maximum deformation of this adhesive at 80 °C using bulk tensile specimens was very high (higher than 100%), which corroborates the results obtained in this study.
Unlike XNR 6852-1, the toughness of SikaPower 4720 at 80 °C is lower than at room temperature, as can be seen in Figure 13(b). This is because this adhesive is very close to Tg when tested at 80 °C and already shows some of the characteristics of adhesives tested above Tg, such low strength and modulus [3] and, as was found in this study, low toughness.
1836 G. VIANA ET AL.
6. Conclusion
This work focused on the measurement of the toughness of two epoxy adhesives for the automotive industry as a function of environmental temperature and moisture. The fol-lowing conclusions can be drawn:
(1) Fracture occurred either within the adhesive layer or in the adhesive-adherend interface. Aged specimens tested at room temperature, as well as specimens tested at 80 °C tend to fail adhesively. Unaged specimens and specimens tested at −40 °C are more prone to fail cohesively;
(2) The toughness of the dry adhesive is lower at −40 °C probably due to the creation of residual stresses and due to lower mobility of the polymer chains. Water at this temperature improved the toughness of the studied adhesives by decreasing the residual stresses and increasing the mobility of the polymer chains.
(3) At room temperature only the dry specimens failed cohesively. Water degraded the adhesive-adherend interface, decreasing the toughness of the joint.
(4) At 80 °C every specimen suffered adhesive failure. The toughness of dry SikaPower 4720 at 80 °C was lower than at room temperature because the test temperature is close to the adhesive′s Tg. On the other hand, as the test temperature is not close to Tg, the toughness of dry XNR6852-1 joints was higher at 80 °C. This indicates that probably no interfacial degradation had occurred. The toughness of aged specimens tested at 80 °C was very low either due to the decrease of its Tg or due to the degradation of the adhesive-adherend interface.
Acknowledgements
The authors would like to thank Sika for supplying SikaPower 4720 adhesive and Nagase Chemtex for supplying XNR 6852-1 adhesive.
Disclosure statement
No potential conflict of interest was reported by the authors.
Funding
This work was supported by the Fundação para a Ciência e Tecnologia [grant number EXCL/EMS-PRO/0084/2012].
ORCID
M. D. Banea http://orcid.org/0000-0002-8378-2292L. F. M. da Silva http://orcid.org/0000-0003-3272-4591
JOURNAL OF ADHESION SCIENCE AND TECHNOLOGY 1837
References
[1] Banea MD, da Silva LFM, Campilho RDSG, et al. Smart adhesive joints: an overview of recent developments. J Adhes. 2014;90:16–40.
[2] Banea MD, da Silva LFM. Adhesively bonded joints in composite materials: an overview. Proc Inst Mech Eng Part L J Mater Des Appl. 2009;223:1–18.
[3] Costa M, Viana G, da Silva LFM, et al. Environmental effect on the fatigue degradation of adhesive joints: A review. J Adhes. 2016;93:127–146.
[4] Sugiman S, Crocombe AD, Aschroft IA. Experimental and numerical investigation of the static response of environmentally aged adhesively bonded joints. Int J Adhes Adhes. 2013;40:224–237.
[5] Hua Y, Crocombe AD, Wahab MA, et al. Modelling environmental degradation in EA9321-bonded joints using a progressive damage failure model. J Adhes. 2006;82:135–160.
[6] Barbosa AQ, da Silva LFM, Ochsner A. Hygrothermal aging of an adhesive reinforced with microparticles of cork. J Adhes Sci Technol. 2015;29:1714–1732.
[7] Lin YC, Chen X. Moisture sorption-desorption-resorption characteristics and its effect on the mechanical behavior of the epoxy system. Polymer. 2005;46:11994–12003.
[8] Fernandes P, Viana G, Carbas R, et al. The influence of water on the fracture envelope of an adhesive joint. Theor Appl Fract Mech. 2017. Available from http://dx.doi.org/10.1016/j.tafmec.2017.01.001
[9] Costa M, Viana G, da Silva LFM, et al. Determination of the fracture envelope of an adhesive joint as a function moisture. Materialwiss Werkstofftech. Submitted for publication.
[10] Loh WK, Crocombe AD, Wahab MMA, et al. Modelling anomalous moisture uptake, swelling and thermal characteristics of a rubber toughened epoxy adhesive. Int J Adhes Adhes. 2005;25:1–12.
[11] Mubashar A, Ashcroft IA, Critchlow GW, et al. Moisture absorption-desorption effects in adhesive joints. Int J Adhes Adhes. 2009;29:751–760.
[12] Ameli A, Datla NV, Papini M, et al. Hygrothermal properties of highly toughened epoxy adhesives. J Adhes. 2010;86:698–725.
[13] Liljedahl CDM, Crocombe AD, Gauntlett FE, et al. Characterising moisture ingress in adhesively bonded joints using nuclear reaction analysis. Int J Adhes Adhes. 2009;29:356–360.
[14] Vanlandingham MR, Eduljee RF, Gillespie JW. Moisture diffusion in epoxy systems. J Appl Polym Sci. 1999;71:787–798.
[15] Suh DW, Ku MK, Nam JD, et al. Equilibrium water uptake of epoxy/carbon fiber composites in hygrothermal environmental conditions. J Compos Mater. 2001;35:264–278.
[16] Shanahan MER, Auriac Y. Water absorption and leaching effects in cellulose diacetate. Polymer. 1998;39:1155–1164.
[17] Xiao GZ, Shanahan MER. Water absorption and desorption in an epoxy resin with degradation. J Polym Sci Part B Polym Phys. 1997;35:2659–2670.
[18] Lin YC, Chen X. Moisture sorption–desorption–resorption characteristics and its effect on the mechanical behavior of the epoxy system. Polymer. 2005;11994–12003.
[19] Liljedahl CDM, Crocombe AD, Wahab MA, et al. The effect of residual strains on the progressive damage modelling of environmentally degraded adhesive joints. J Adhes Sci Technol. 2005;19:525–547.
[20] Zhou JM, Lucas JP. Hygrothermal effects of epoxy resin. Part II: variations of glass transition temperature. Polymer. 1999;40:5513–5522.
[21] Zhou JM, Lucas JP. Hygrothermal effects of epoxy resin. Part I: the nature of water in epoxy. Polymer. 1999;40:5505–5512.
[22] Adamson MJ. Thermal-expansion and swelling of cured epoxy-resin used in graphite-epoxy composite-materials. J Mater Sci. 1980;15:1736–1745.
[23] Xiao GZ, Shanahan MER. Swelling of DGEBA/DDA epoxy resin during hygrothermal ageing. Polymer. 1998;39:3253–3260.
[24] Chiang MYM, Fernandez-Garcia M. Relation of swelling and Tg depression to the apparent free volume of a particle-filled, epoxy-based adhesive. J Appl Polym Sci. 2003;87:1436–1444.
[25] Banea MD, de Sousa FSM, da Silva LFM, et al. Effects of temperature and loading rate on the mechanical properties of a high temperature epoxy adhesive. J Adhes Sci Technol. 2011;25: 2461–2474.

1838 G. VIANA ET AL.
[26] Banea MD, da Silva LFM, Campilho RDSG. Mode I fracture toughness of adhesively bonded joints as a function of temperature: experimental and numerical study. Int J Adhes Adhes. 2011;31:273–279.
[27] Pethrick RA. Design and ageing of adhesives for structural adhesive bonding – a review. Proc IMechE Part L J Mater Des Appl. 2015;229:349–379.
[28] Deb A, Malvade I, Biswas P, et al. An experimental and analytical study of the mechanical behaviour of adhesively bonded joints for variable extension rates and temperatures. Int J Adhes Adhes. 2008;28:1–15.
[29] Banea MD, Silva LFM. Mechanical characterization of flexible adhesives. J Adhes. 2009;85:261–285.
[30] Srivastava VK. Characterization of adhesive bonded lap joints of C/C-SiC composite and Ti-6Al-4V alloy under varying conditions. Int J Adhes Adhes. 2003;23:59–67.
[31] Grant LDR, Adams RD, da Silva LFM. Effect of the temperature on the strength of adhesively bonded single lap and T joints for the automotive industry. Int J Adhes Adhes. 2009;29:535–542.
[32] Marques EAS, da Silva LFM, Banea MD, et al. Adhesive joints for low- and high-temperature use: an overview. J Adhes. 2015;91:556–585.
[33] Banea MD, da Silva LFM. The effect of temperature on the mechanical properties of adhesives for the automotive industry. Proc IMechE Part L J Mater Des Appl. 2010;224:51–62.
[34] Viana G, Costa M, Banea M. A review on the temperature and moisture degradation of adhesive joints. Proc Inst Mech Eng Part L J Mater Des Appl. 2016. doi:http://dx.doi.org/10.1177/1464420716671503.
[35] Costa M, Viana G, da Silva LFM, et al. Environmental effect on the fatigue degradation of adhesive joints: a review. The Journal of Adhesion. 2016;93:127–146. doi:http://dx.doi.org/10.1080/00218464.2016.1179117.
[36] Campilho RDSG, Moura DC, Banea MD, et al. Adherend thickness effect on the tensile fracture toughness of a structural adhesive using an optical data acquisition method. Int J Adhes Adhes. 2014;53:15–22.
[37] Costa M, Viana G, Canto C, et al. Effect of the size reduction on the bulk tensile and double cantilever beam specimens used in cohesive zone models. Proc Inst Mech Eng Part L J Mater Des Appl. 2016;230:968–982.
[38] Winston PW, Bates DH. Saturated solutions for the control of humidity in biological research. Ecology. 1960;41:232–237.
[39] Zannideffarges MP, Shanahan MER. Diffusion of water into an epoxy adhesive – comparison between bulk behavior and adhesive joints. Int J Adhes Adhes. 1995;15:137–142.
[40] Viana G, Costa M, Banea MD, et al. Water diffusion in double cantilever beam adhesive joints. Lat Am J Solids Struct. 2017;14:188–201.
[41] de Moura MFSF, Campilho RDSG, Goncalves JPM. Crack equivalent concept applied to the fracture characterization of bonded joints under pure mode I loading. Compos Sci Technol. 2008;68:2224–2230.
[42] Barbosa AQ, da Silva LFM, Banea MD, et al. Methods to increase the toughness of structural adhesives with micro particles: an overview with focus on cork particles. Materialwiss Werkstofftech. 2016;47:307–325.
[43] Banea MD, da Silva LFM, Campilho RDSG. Effect of temperature on tensile strength and mode I fracture toughness of a high temperature epoxy adhesive. J Adhes Sci Technol. 2012;26:939–953.
[44] Goglio L, Rezaei M. Effect of different substrate pre-treatments on the resistance of aluminium joints to moist environments. J Adhes. 2013;89:769–784.
[45] Kinloch AJ, Little MSG, Watts JF. The role of the interphase in the environmental failure of adhesive joints. Acta Mater. 2000;48:4543–4553.
[46] Humfeld GR, Dillard DA. Residual stress development in adhesive joints subjected to thermal cycling. J Adhes. 1998;65:277–306.
[47] Kang SG, Kim MG, Kim CG. Evaluation of cryogenic performance of adhesives using composite-aluminum double-lap joints. Compos Struct. 2007;78:440–446.

PAPER 5

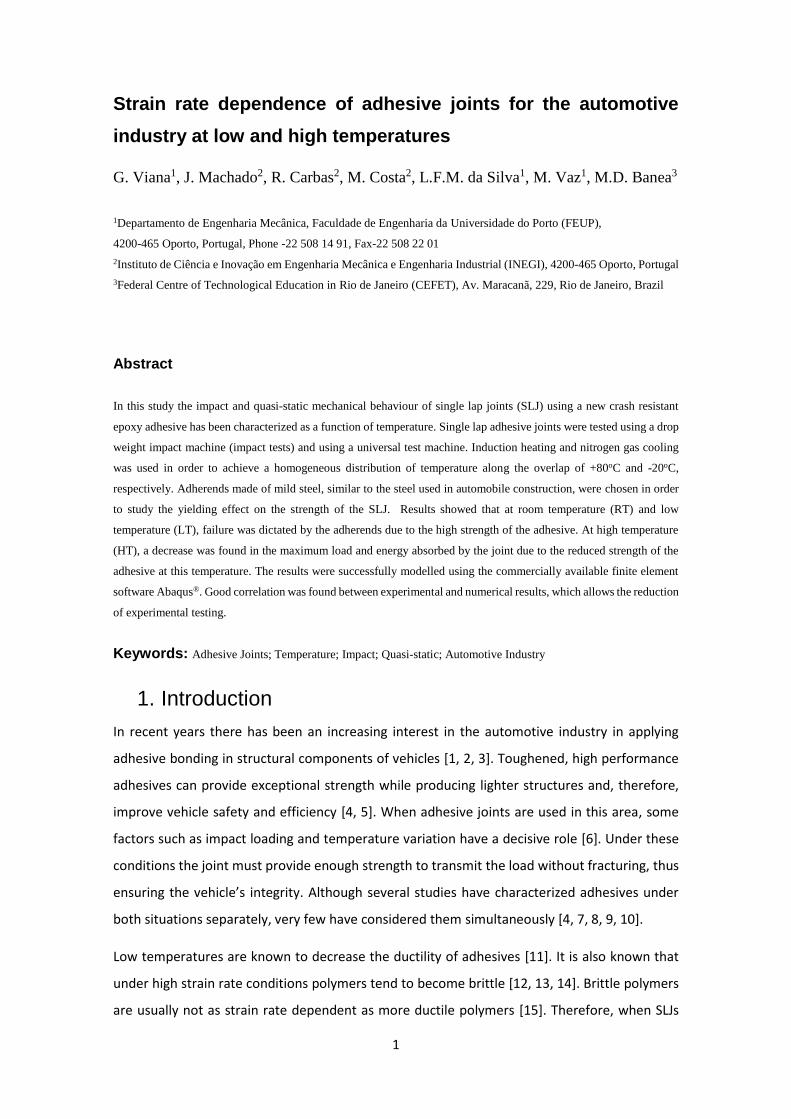
1
Strain rate dependence of adhesive joints for the automotive
industry at low and high temperatures
G. Viana1, J. Machado2, R. Carbas2, M. Costa2, L.F.M. da Silva1, M. Vaz1, M.D. Banea3
1Departamento de Engenharia Mecânica, Faculdade de Engenharia da Universidade do Porto (FEUP),
4200-465 Oporto, Portugal, Phone -22 508 14 91, Fax-22 508 22 01
2Instituto de Ciência e Inovação em Engenharia Mecânica e Engenharia Industrial (INEGI), 4200-465 Oporto, Portugal
3Federal Centre of Technological Education in Rio de Janeiro (CEFET), Av. Maracanã, 229, Rio de Janeiro, Brazil
Abstract
In this study the impact and quasi-static mechanical behaviour of single lap joints (SLJ) using a new crash resistant
epoxy adhesive has been characterized as a function of temperature. Single lap adhesive joints were tested using a drop
weight impact machine (impact tests) and using a universal test machine. Induction heating and nitrogen gas cooling
was used in order to achieve a homogeneous distribution of temperature along the overlap of +80oC and -20oC,
respectively. Adherends made of mild steel, similar to the steel used in automobile construction, were chosen in order
to study the yielding effect on the strength of the SLJ. Results showed that at room temperature (RT) and low
temperature (LT), failure was dictated by the adherends due to the high strength of the adhesive. At high temperature
(HT), a decrease was found in the maximum load and energy absorbed by the joint due to the reduced strength of the
adhesive at this temperature. The results were successfully modelled using the commercially available finite element
software Abaqus®. Good correlation was found between experimental and numerical results, which allows the reduction
of experimental testing.
Keywords: Adhesive Joints; Temperature; Impact; Quasi-static; Automotive Industry
1. Introduction
In recent years there has been an increasing interest in the automotive industry in applying
adhesive bonding in structural components of vehicles [1, 2, 3]. Toughened, high performance
adhesives can provide exceptional strength while producing lighter structures and, therefore,
improve vehicle safety and efficiency [4, 5]. When adhesive joints are used in this area, some
factors such as impact loading and temperature variation have a decisive role [6]. Under these
conditions the joint must provide enough strength to transmit the load without fracturing, thus
ensuring the vehicle’s integrity. Although several studies have characterized adhesives under
both situations separately, very few have considered them simultaneously [4, 7, 8, 9, 10].
Low temperatures are known to decrease the ductility of adhesives [11]. It is also known that
under high strain rate conditions polymers tend to become brittle [12, 13, 14]. Brittle polymers
are usually not as strain rate dependent as more ductile polymers [15]. Therefore, when SLJs

2
using epoxy adhesives are loaded at low temperatures, different strain rates are not expected
to give significantly different results at failure [10, 16]. On the other hand, at high temperatures,
adhesive ductility increases due to its proximity to the glass transition temperature (Tg), which
leads to much higher strain rate dependence.
Though above Tg, the toughness of structural adhesives is usually very low, below Tg it is
normally high and independent of temperature, as demonstrated by Banea et al. [17] It is
therefore very important to keep the adhesive always below Tg, otherwise the adhesive joint
may not be capable of resisting to any impact [18].
However, the strength of a SLJ is not just a function of temperature and strain rate. There are
many factors in the joint’s design that are involved. Many studies have been done on the
influence of the selection of different geometries and materials for the components [19, 20].
Failure load has been demonstrated to be strongly dependent on parameters such as the
overlap’s length or the thickness of the adhesive layer [21]. The combination of different
adherends and adhesives with different ductility has also been proved to be critical in the SLJ
performance, especially when loaded in tension [4, 22]. The joint’s design chosen for this study
tried to mirror real applications in the automotive industry.
The energy that is absorbed by the adhesive joint depends mostly on the substrate. High
strength adherends do not allow for high energy absorption during impact. In order to absorb
high impact energy, mild steel or other ductile materials should be used because they allow for
very high deformation before failure, as demonstrated by Harris and Adams [23].
In this study, mild steel bonded SLJs with a prototype of a crash resistant adhesive for the
automotive industry were tested under quasi-static and impact conditions at low (-20oC), high
(80oC) and room temperature. Mechanical properties of the adhesive at high and low
temperature were obtained using bulk adhesive specimens at different strain rates in previous
studies [18, 24], which allowed numerical modelling of the performed mechanical tests using a
cohesive zone model (CZM).
The adhesives used in this study were a crash resistant toughened epoxy prototype under
development, XNR 6852E-3 manufactured by NAGASE CHEMTEX (Osaka, Japan). Results showed
that failure was dictated either by failure of the mild steel adherends due to the high strength
of the adhesive or due to yielding of the adherends at the edges of the overlap.

3
This paper presents a numerical model to describe the mechanical behaviour of adhesive joints
for the automotive industry. Previous experimental results using a similar adhesive were
presented in a conference paper [25].
2. Experimental Procedure
2.1 Materials
2.1.1 Adhesive
The epoxy adhesive XNR 6852E-3, supplied by NAGASE CHEMTEX® (Osaka, Japan) was used in
this study. This adhesive is a one-part system that cures at 150oC for 3 h. A representative stress-
strain curve of this adhesive, which was obtained using bulk tensile specimens and tested at
room temperature at the constant displacement rate of 1mm/min is shown in Figure 1.
Figure 1: Stress-strain curve of the adhesive used in this study.
A very important parameter to take into account when testing adhesive joints, especially when
the joint is subjected to high temperatures, is the adhesive’s Tg. Banea et al. [17, 26] have shown
that the fracture toughness of adhesives is not very temperature dependent if the adhesive is
loaded below its Tg. On the other hand, if the temperature is above Tg, the fracture toughness
of the adhesive is very low and this may lead to premature failure of the adhesive joint.
This adhesive has a relatively high Tg (132°C), well above its maximum service temperature
(80oC), which was measured using a rapid method [27].
Bulk dogbone adhesive specimens were used to determine the yield stress and Young’s modulus
of the adhesive as a function of temperature at 1 mm/min and at 100 mm/min [28]. Mode I
0
10
20
30
40
50
60
0 1 2 3 4 5 6
Stre
ss (
MP
a)
Strain (%)

4
toughness of the adhesive was determined in a previous study and was considered to be largely
independent on temperature and strain rate. This assumption has given good results in previous
studies [18, 24].
The key properties of this adhesive are shown in Table 1.
Table 1: Key properties of the adhesive used in this study.
Property Value Unit
Young’s modulus 1728 MPa
Tensile strength 51.5 MPa
Mode I fracture toughness 6.37 N/mm
2.1.2 Adherends
The substrates used to manufacture SLJs were made of 1 mm thick mild steel plates, since this
is a very common structural material used in the automotive industry to improve the
crashworthiness of vehicles.
In case of impact in vehicles, in order to ensure the safety of the passengers, the energy of
impact must be absorbed by the adhesive joint. Unlike hard steel or other more fragile materials,
mild steel is capable of absorbing high amounts of energy and is used in vehicles to improve
their crashworthiness.
The mild steel used as adherends was characterised using tensile loaded dogbone specimens
under 1 mm/min, 10 mm/min and 100 mm/min, following standard ASTM E 8M. The true stress-
strain curve that was obtained was used in the finite element model.
The key properties of the substrate material are shown in Table 2.
Table 2: Key properties of the steel alloy used in this study.
Property Value Unit
Young’s modulus 210 GPa
Yield stress 160 MPa

5
2.2 Specimen Fabrication
The SLJ consists of two steel plates bonded together, as illustrated in Figure 2. By using a mould,
the SLJs were bonded with the correct alignment. The thickness of the adhesive layer was 0.2
mm and was controlled accurately by using steel spacers. The mould with the SLJs was left for
3h at 150oC under a pressure of 2MPa so that the adhesive could be properly cured.
Before the application of the adhesive, the overlap surfaces of the adherends were sandblasted
and degreased with acetone. The SLJs were extracted from the mould and any excess of
adhesive around the overlap was removed. Finally, two steel plates were bonded to the ends of
the substrates using a room temperature curing epoxy adhesive. A hole was drilled at each end
to allow the assembly with the machine holding device.
2.3 Test procedure
2.3.1 Quasi-static tests
The quasi-static tests were performed in a universal test machine INSTRON® model 3367
(Norwood, Massachusetts, USA) with a capacity of 30 kN.
A climatic chamber coupled with the universal test machine was used to perform bulk and SLJ
tensile tests at low temperature (-20oC), room temperature (≈23oC) and high temperature
(80oC). A thermocouple was used to make sure that the specimens were at the right temperature
before starting the test.
2.3.2 Impact tests
The drop-weight impact tests were conducted in a Rosand® Instrumented Falling weight impact
tester, type 5 H.V. (Stourbridge, West Midlands, U.K.). This machine drops a mass (m) from a
predefined height (H) until it impacts on the device that holds the specimen (Figure 3).
12.5 mm
82.5 mm
Figure 2: Dimensions of the single lap joints used in this study. Width=25mm.

6
The tests performed in this study were made by dropping a mass of 30kg from 1.02 m, which
gives a potential energy of 300J. The impact speed (v) is established by the height from where
the mass was dropped, according to Equation 1.
𝑣 = √2𝑔𝐻 1
Where g is the acceleration of gravity.
The energy applied in the impact (E) is given by Equation 2.
𝐸 = 𝑚𝑔𝐻 2
Before the mass is dropped, the specimen must be correctly assembled in the holding device,
which transmits the impact load received to the lower adherend. The upper adherend is fixed
while the lower receives the impact. A vertical guide avoids lateral deviations after the impact
so that the displacement that is measured is aligned with the load. The load is recorded over
time by a load cell attached to the falling mass. The data is then treated by the software of the
machine to give the final load vs displacement curve.
Figure 3: Impact test setup.
In order to perform impact tests at low temperatures, liquid nitrogen was sprayed to the overlap
area of the specimens until the temperature stabilized at -20oC. The high temperature impact
tests were made using a home built induction coil to warm the specimens up to 80oC. The high

7
heat conductivity of the steel adherends allows the temperature to be uniform along the entire
overlap area. The temperature was monitored using a thermocouple and a thermographic
camera.
The impactor was dropped 20 seconds after the test temperature was achieved to make sure
that the entire overlap was at the same temperature.
3. Numerical Details
Impact and quasi-static numerical models were developed to predict the mechanical behaviour
of the adhesive joints analysed in this study. Both are simple models, which diverge only on the
boundary conditions and on the input of properties.
Large deformation in the width direction of steel substrates was observed in the experimentally
tested joints. For this reason, a 3D model, which is able to capture this behaviour was developed,
as well as a simpler 2D model, which cannot predict this kind of deformation. The results
provided by both models are compared in the present paper.
Abaqus®/standard was used to model the quasi-static single lap joints while Abaqus®/explicit
was used to model the impact specimens and decrease computational effort. The mesh was the
same in impact and quasi-static simulation to facilitate comparison between the two models.
Though the explicit solution usually requires a finer mesh, the mesh that was used was enough
to ensure that the model was numerically stable. Table 1 shows the elements available in the
Abaqus® library that were used to model adherends and adhesive.
Table 3: Elements used to model adherend and adhesive behaviour.
Adhesive Adherend
2D COH2D4 CPS4R 3D COH3D8 C3D8
COH2D4 and COH3D8 are 2D and 3D cohesive elements respectively with 4 nodes (2D element)
and 8 nodes (3D element). CPS4R is a reduced integration 4 node 2D element and C3D8 is a full
integration solid element, which was used to avoid hourglass deformations.

8
3.1 Boundary Conditions
3.1.1 Quasi-static model
The tip of one of the arms of the specimen was given a clamped boundary condition, which
means that every degree of freedom is constrained. This simulates the specimen holding device.
A displacement along the length direction of the specimen was attributed to the opposite arm.
The load in the constrained arm and the displacement of the opposite arm were recorded.
3.1.2 Impact model
In the impact model, just like in the quasi-static model, one of the arms of the SLJ was set to not
allow any displacement or rotation. The entire mass of the impactor was attributed to the end
of the opposite arm of specimen. The initial velocity of this volume was set to be 4474 mm/s,
parallel to the length of the steel substrates, which was the velocity of the impactor at the
moment of impact. This velocity decreased until the specimen broke, as the specimen absorbed
the kinetic energy of the impactor.
A scheme of the boundary conditions is shown in Figures 4 and 5. A more detailed view of the
mesh used in the 2D model is shown in Figure 6.
Figure 4: Mesh and boundary conditions used in the 3D model.
Clamped
Velocity= 4474 mm/s

9
Figure 5: Mesh and boundary conditions used in the 2D model.
Figure 6: Detail of the mesh used in the 2D model. Cohesive elements were placed between the upper and bottom substrates, as indicated.
3.2 Modelling the Adherends
The true stress-strain curves obtained under three different strain rates according to the
description in section 2.1.2 were simplified using three approximation points, as can be seen in
Figure 7.
Figure 7: Technique used to model the mild steel adherends. Curve obtained for a cross head speed of 1 mm/min.
0
100
200
300
400
0 0.05 0.1 0.15 0.2
Stre
ss (
MP
a)
Strain
Experimental results Approximation
Clamped Velocity= 4474 mm/s
Cohesive
elements
Point 1
Point 2
Point 3

10
The shape of the stress-strain curve of the mild steel adherends changes with the test rate and,
consequently, the position of the three approximation points. Table 2 shows the coordinates of
each approximation point.
Table 4: Coordinates of each approximation point as a function of test rate.
Strain
Stress (MPa)
1 mm/min 10 mm/min 100 mm/min
Point 1 Strain at the elastic limit 160 175 200
Point 2 0.04 309 315 335
Point 3 Strain at failure 425 447 454
To obtain the properties of the adherends at the test speed at which impact occurred, the stress
at each approximation point was extrapolated using a logarithmic regression. Taking into
account the stress at each approximation point under the test rates of 1 mm/s, 10 mm/s and
100 mm/s of test rate. An example of this regression for approximation point 1 is presented in
Figure 8.
Figure 8: Technique used to determine the approximation points of the steel adherends at high test rates.
The set of properties considered in the numerical model was chosen according to the velocity
at which the test was conducted: extrapolated properties were considered for modelling impact
tests while the properties obtained at 1mm/min were used when modelling quasi-static tests.
y = 8.6859ln(x) + 158.33
0
50
100
150
200
250
300
1 100 10000 1000000
Yie
ld S
tres
s (M
Pa)
Test speed (mm/min)
Experimentaly obtained Extrapolated

11
3.3 Modelling the Adhesive
The adhesive was modelled using triangular cohesive zone models. To model using this method,
it is necessary to introduce the modulus, yield stress and toughness of the adhesive. The
modulus and yield stress of the adhesive were obtained in a previous study [28] as a function of
temperature at the test rates of 1 mm/min and 100 mm/min. Mode I energy release rate of the
used adhesive was obtained at room temperature at 1mm/min. This toughness was considered
to be largely independent on temperature and strain rate. This assumption has given good
results in previous studies [18, 24]. The yield stress and Young’s modulus were extrapolated
using a logarithmic regression. Figure 9 shows the extrapolation of the yield stress of the
adhesive at 23oC.
Figure 9: Technique used to determine the behaviour of the adhesive at high test rates.
4. Experimental results
In the following subsections, representative load-displacement (P-δ) curves obtained in quasi-
static and impact tests are shown as a function of test temperature. At least three valid
specimens were tested at each test condition. Every adherend suffered plastic deformation in
the regions corresponding to the edges of the overlap, including those that were tested at 80oC
and failed at lower loads (see Figure 12). The existence of plastic deformation is an indication
that it is the adherend and not the adhesive that is absorbing most of the impact energy. When
the joint fails through the adhesive layer, it is due to stress concentration at the ends of the
overlap, which is increased by adherend yielding [29].
y = 1.7936ln(x) + 48.44
40
45
50
55
60
65
70
75
1 10 100 1000 10000 100000 1000000
Yie
ld S
tres
s (M
Pa)
Test speed (mm/min)
Experimental results Extrapolation

12
4.1 23oC Tests
Figure 10 shows representative P-δ curves obtained by testing SLJs under quasi-static and impact
conditions.
The adhesive joints that were tested under quasi-static conditions at room temperature failed
cohesively in the adhesive layer. By analysing the adherends after failure, it is apparent that
significant plastic deformation has occurred, which means that failure was controlled by yielding
of the mild steel adherends at the ends of the overlap (see Figure 10-b).
Specimens tested under impact conditions suffered a ductile fracture in one of the adherends,
as can be seen in Figure 10-c. This was responsible for very high energy absorption. Under high
strain rates, both materials, adhesive and adherend, become stronger. Adhesives, as polymers
in general, are significantly more strain rate dependent than most metals such as mild steel.
Under high strain rates, the adhesive becomes much stronger, which explains the high
deformation and failure of the steel substrates.
a b c
Figure 10: Representative P-δ curves of the impact and quasi-static specimens tested at 23oC (a) Failure mode of the quasi-static tests (b) Failure mode of the impact specimens (c)
4.2 -20oC Tests
Quasi-static tested joints failed within the adhesive layer at a displacement and load slightly
higher than joints tested at room temperature due to the higher strength of the adhesive at this
temperature, as can be concluded by analysing Figure 11.
0
2
4
6
8
10
12
14
0 10 20 30
Load
(kN
)
Displacement (mm)
Quasi-static Impact

13
Under impact, the joint suffered a ductile fracture in the mild steel adherends, which resulted
in high energy absorption. However, at lower temperatures, the substrates showed a less ductile
behaviour than the specimens tested at room temperature and were not able to absorb as much
energy as impact room temperature tested specimens.
By comparing Figure 11 and Figure 10, it can be noted that the failure displacement of the quasi-
static specimens is higher at low temperature than at room temperature. Though this may seem
counter intuitive, it makes sense because the displacement that is being measured is the
displacement at failure of the entire joint and not the displacement at failure of the adhesive
alone. The temperature dependence of the steel adherends can, under these conditions, be
neglected. The contribution of the displacement of the adhesive alone is very low when
compared to the contribution of the steel adherends. As the adhesive is stronger at -20oC than
at 23oC, it is natural that the joint can withstand higher displacements at -20oC before it fails in
the adhesive layer.
a b c
Figure 11: Representative P-δ curves of the impact and quasi-static specimens tested at -20oC (a) Failure mode of the quasi static-tests (b) Failure mode of the impact specimens (c)
4.3 80oC Tests
At 80oC both the impact and quasi-static tested specimens failed cohesively in the adhesive
layer, as can be seen in Figure 12. At this temperature, the adhesive is very strain rate
0
2
4
6
8
10
12
14
0 10 20 30
Load
(kN
)
Displacement (mm)
Quasi-static Impact

14
dependent, which caused the adhesive to withstand higher loads when tested at impact. This
led to higher loads being withstood by the joint thus increasing its failure displacement and
improving energy absorption. As in every other test, yielding of the steel adherends at the ends
of the overlap was observed, which means that it is the adherend that controls failure of the
joint. Figure 12 shows representative P-δ curves of the joints tested at 80oC, as well as their
failure mode.
a b c
Figure 12: P-δ curves of the impact and quasi-static specimens tested at 80oC (a) Failure mode of the quasi-static tests (b) Failure mode of the impact specimens (c)
To summarize, at low and room temperature, impact tested specimens failed cohesively in the
mild steel substrates, resulting in high energy absorption. At higher temperatures, the same
specimens did not absorb as much energy due to the reduced strength of the adhesive.
Specimens that were tested under quasi-static conditions were not able to absorb as much
energy as the impact tested specimens due to the reduced strength of the adhesive under low
strain rates.
0
2
4
6
8
10
12
14
0 10 20 30
Load
(kN
)
Displacement (mm)
Quasi-static Impact

15
5. Numerical results
5.1 Quasi-static Simulations
5.1.1 23oC Tests
Figure 13 shows the comparison between the experimental quasi-static P-δ curves and the
corresponding numerical predictions using the 2D and 3D models described previously.
a b c
-20oC 23oC 80oC
Figure 13: Comparison between numerical and experimental results obtained under quasi-static conditions.
The numerical models were able to predict the behaviour of the tested SLJs. Tough the model
over predicted the strength of the joint at -20oC and 23oC, it can be said that a reasonable degree
of concordance exists between the numerical prediction and the experimental value.
The yield stress of the adhesive was calculated by using bulk adhesive specimens. These bulk
specimens may give slightly lower values, especially if there are tested at higher temperatures,
when the adhesive is more strain rate dependent. This is probably the reason why the models
give a slightly lower maximum displacement of the joint.
Generally, the maximum displacement predicted by 3D models is lower than the maximum
displacement given by 2D models because 3D models take into account the stress gradient
across the width of the joint (Figure 14). The exception is when the joints are tested at 80oC
0
2
4
6
8
10
0 5 10 15
Load
(kN
)
Displacement (mm)
0
2
4
6
8
10
0 5 10 15
Load
(kN
)
Displacement (mm)
0
2
4
6
8
10
0 5 10 15
Load
(kN
)
Displacement (mm)
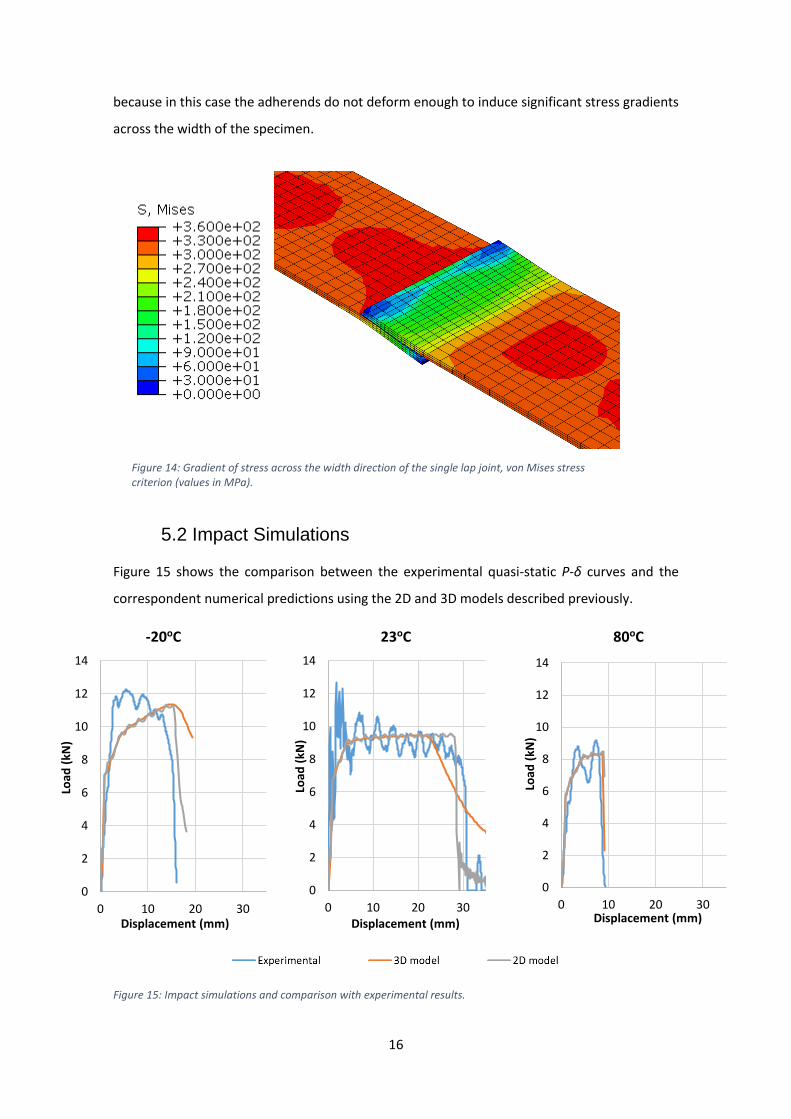
16
because in this case the adherends do not deform enough to induce significant stress gradients
across the width of the specimen.
5.2 Impact Simulations
Figure 15 shows the comparison between the experimental quasi-static P-δ curves and the
correspondent numerical predictions using the 2D and 3D models described previously.
-20oC 23oC 80oC
Figure 15: Impact simulations and comparison with experimental results.
0
2
4
6
8
10
12
14
0 10 20 30
Load
(kN
)
Displacement (mm)
0
2
4
6
8
10
12
14
0 10 20 30
Load
(kN
)
Displacement (mm)
0
2
4
6
8
10
12
14
0 10 20 30
Load
(kN
)
Displacement (mm)
Figure 14: Gradient of stress across the width direction of the single lap joint, von Mises stress criterion (values in MPa).

17
The impact models were able to match the experimental results well. After failure, the 2D model
predicts a sudden drop of load at every situation, which matches the experimental results. The
3D model predicts a soft drop in load because unlike the 2D model, it can predict deformations
in the direction perpendicular to the axis of the specimen.
When failure occurred in the steel adherends (specimens tested under impact and at -20oC and
23oC), the load predicted by the 3D model drops very slowly because the used elements do not
take into account complete failure of the adherends. Instead, it predicts very high plastic
deformation of the substrates (Figure 16).
Figure 16: Deformation of mild steel substrates in the 3D impact model.
6 Discussion
At -20oC and at 23oC, quasi-static tested specimens and impact tested specimens showed
different modes of failure. At low and room temperatures, while quasi-static tested specimens
showed cohesive failure in the adhesive layer, impact tested specimens suffered ductile fracture
in the mild steel adherends. Because the toughness of the steel adherends is higher than the
adhesive’s, the energy that was absorbed by the impact specimens was significantly higher than
the energy absorbed by the quasi-static specimens.
At 80oC, the adhesive failed due to the peel stress at the ends of the overlap in both the quasi-
static specimens and in the impact specimens. However, due to the higher strength of the
adhesive at higher strain rates, the energy absorbed by the impact specimens was higher than
the energy absorbed by the quasi-static specimens.

18
Temperature affected the tested SLJs in different ways:
• Impact tested specimens showed decreasing energy absorption from room temperature
tested specimens to low temperature tested specimens because the toughness of the
steel used as adherends is lower at lower temperatures.
• Quasi-static tested specimens, on the other hand, which fail in the adhesive layer,
showed the opposite trend. These specimens fail due to the peel stress at the ends of
the overlap and, as the strength of the adhesive is higher at low temperature, they can
actually withstand higher loads at -20oC than at 23oC, which translates into higher
energies being absorbed.
The maximum loads that the steel substrates were able to withstand were generally higher in
impact conditions than in quasi-static conditions due to the higher strength of mild steel at
higher strain rates. Adherend properties changed with temperature as well. Higher
temperatures mean softer and more ductile steel. Temperature and strain rate dependence of
the steel substrates also have influence on the mechanical performance of the tested SLJs, as
stronger adherends induce lower peel stresses at the ends of the overlap, consequently
increasing the load and energy absorption of SLJs. Figure 17 makes the comparison between the
energy absorbed by the specimens tested in this study under impact and quasi-static conditions
as a function of temperature.
Figure 17: Energy absorbed by quasi-static and impact tested specimens as a function of test temperature.
The energy absorbed by impact specimens at -20oC and 23oC was significantly higher than the
energy absorbed by impact specimens at 80oC. This is because the strength of the adhesive at
0
50
100
150
200
250
300
-20 23 80
Ab
sorb
ed
En
erg
y (J
)
Temperature (oC)
Quasi-static
Impact

19
80oC is sharply reduced due to proximity to Tg, which caused these specimens to suffer cohesive
failure within the adhesive layer. As failure of impact specimens at -20oC and 23oC occurred in
the mild steel adherends, the higher energy absorption of impact specimens at 23oC is related
to the higher toughness of the mild steel adherends at this temperature.
Figure 18 shows the comparison between experimental static and impact maximum
displacement reached by the specimens and the values given by the numerical models. The
numerical models can predict with little error the maximum displacement reached by the
specimens in every situation. The 3D model can take into consideration deformation in the
direction perpendicular to the loading direction of the specimen and given, therefore higher
values than the 2D model.
Under quasi-static conditions failure happens in the adhesive layer. Because the adhesive is
stronger at lower temperatures, the joint can withstand higher loads and, therefore the
maximum displacement reached by the joint is also higher.
Under impact conditions at -40oC and 23oC the displacement at failure is given by the ductility
of the steel adherends. The maximum displacement of specimens tested at 80oC is much lower
than at lower temperatures because the steel is not allowed to deform significantly, as failure
happens in the adhesive layer due to the reduced strength of the adhesive at higher
temperatures.
Figure 18: Comparison between static and impact maximum displacement reached by the specimens and comparison to numerical results. Standard deviation lower than 1 mm in every case.
0
5
10
15
20
25
30
35
40
-20 0 20 40 60 80
Max
imu
m d
isp
lace
me
nt
(mm
)
Temperature(oC)
Impact experimental
Impact 2D model
Impact 3D model
Static experimental
Static 2D model
Static 3D model
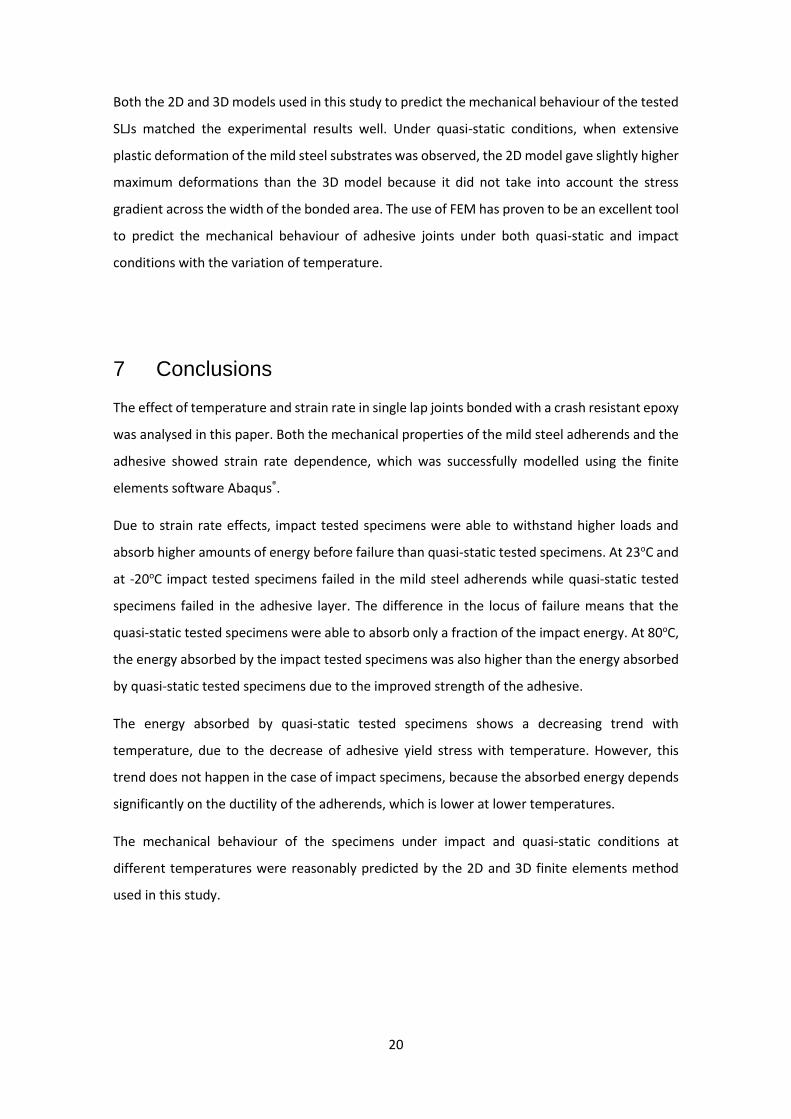
20
Both the 2D and 3D models used in this study to predict the mechanical behaviour of the tested
SLJs matched the experimental results well. Under quasi-static conditions, when extensive
plastic deformation of the mild steel substrates was observed, the 2D model gave slightly higher
maximum deformations than the 3D model because it did not take into account the stress
gradient across the width of the bonded area. The use of FEM has proven to be an excellent tool
to predict the mechanical behaviour of adhesive joints under both quasi-static and impact
conditions with the variation of temperature.
7 Conclusions
The effect of temperature and strain rate in single lap joints bonded with a crash resistant epoxy
was analysed in this paper. Both the mechanical properties of the mild steel adherends and the
adhesive showed strain rate dependence, which was successfully modelled using the finite
elements software Abaqus®.
Due to strain rate effects, impact tested specimens were able to withstand higher loads and
absorb higher amounts of energy before failure than quasi-static tested specimens. At 23oC and
at -20oC impact tested specimens failed in the mild steel adherends while quasi-static tested
specimens failed in the adhesive layer. The difference in the locus of failure means that the
quasi-static tested specimens were able to absorb only a fraction of the impact energy. At 80oC,
the energy absorbed by the impact tested specimens was also higher than the energy absorbed
by quasi-static tested specimens due to the improved strength of the adhesive.
The energy absorbed by quasi-static tested specimens shows a decreasing trend with
temperature, due to the decrease of adhesive yield stress with temperature. However, this
trend does not happen in the case of impact specimens, because the absorbed energy depends
significantly on the ductility of the adherends, which is lower at lower temperatures.
The mechanical behaviour of the specimens under impact and quasi-static conditions at
different temperatures were reasonably predicted by the 2D and 3D finite elements method
used in this study.

21
Acknowledgements
The authors would like to thank Nagase Chemtex for supplying adhesive XNR 6852E-3.
References
1. Da Silva LF, Adams R. Joint strength predictions for adhesive joints to be used over a wide temperature range. International Journal of Adhesion and Adhesives. 2007;27:362-79. 2. Machado J, Marques E, da Silva LF. Adhesives and adhesive joints under impact loadings: An Overview. The Journal of Adhesion. 2017;DOI: 10.1080/00218464.2017.1282349. 3. Viana G, Costa M, Banea M, da Silva L. A review on the temperature and moisture degradation of adhesive joints. Proceedings of the Institution of Mechanical Engineers, Part L: Journal of Materials: Design and Applications. 2017;231:488-501. 4. Banea MD, da Silva LF, Carbas R, Campilho RD. Effect of material on the mechanical behaviour of adhesive joints for the automotive industry. Journal of Adhesion Science and Technology. 2017;31:663-76. 5. May M, Hesebeck O, Marzi S, Böhme W, Lienhard J, Kilchert S, Brede M, Hiermaier S. Rate dependent behavior of crash-optimized adhesives–Experimental characterization, model development, and simulation. Engineering Fracture Mechanics. 2015;133:112-37. 6. Marques E, da Silva L, Banea M, Carbas R. Adhesive joints for low-and high-temperature use: an Overview. The Journal of Adhesion. 2015;91:556-85. 7. Choudhry R, Hassan SF, Li S, Day R. Damage in single lap joints of woven fabric reinforced polymeric composites subjected to transverse impact loading. International Journal of Impact Engineering. 2015;80:76-93. 8. Meschut G., Teutenberg D., Henkel K. Design of low temperature cured adhesive joints in steel-FRPconstructions under crash loads. METC and 2nd ESTAD; 2015. 9. Dean G, Lord G, Duncan B, Comparison of the measured and predicted performance of adhesive joints under impact. National Physical Laboratory, Centre for Materials Measurement and Technology, Great Britain, 1999. 10. Srivastava V. Characterization of adhesive bonded lap joints of C/C–SiC composite and Ti–6Al–4V alloy under varying conditions. International journal of adhesion and adhesives. 2003;23:59-67. 11. Viana G, Costa M, Banea MD, da Silva LFM. Behaviour of environmentally degraded epoxy adhesives as a function of temperature. The Journal of Adhesion. 2016;93:95-112. 12. Bauwens JC. Relation between the compression yield stress and the mechanical loss peak of bisphenol-A-polycarbonate in the β transition range. Journal of Materials Science. 1972;7:577-84. 13. Ree T, Eyring H. Theory of non‐Newtonian flow. I. Solid plastic system. Journal of Applied Physics. 1955;26:793-800. 14. Neumayer J, Kuhn P, Koerber H, Hinterholzl R. Experimental Determination of the Tensile and Shear Behaviour of Adhesives under Impact Loading. J Adhesion. 2016;92:503-16. 15. Bezemer A, Guyt C, Vlot A. New impact specimen for adhesives: optimization of high-speed-loaded adhesive joints. International journal of adhesion and adhesives. 1998;18:255-60. 16. Adamvalli M, Parameswaran V. Dynamic strength of adhesive single lap joints at high temperature. International Journal of Adhesion and Adhesives. 2008;28:321-7.
22
17. Banea MD, da Silva LFM, Campilho RDSG. Effect of Temperature on Tensile Strength and Mode I Fracture Toughness of a High Temperature Epoxy Adhesive. J Adhes Sci Technol. 2012;26:939-53. 18. Avendaño R, Carbas RJC, Marques EAS, da Silva LFM, Fernandes AA. Effect of temperature and strain rate on single lap joints with dissimilar lightweight adherends bonded with an acrylic adhesive. Compos Struct. 2016;152:34-44. 19. Goglio L, Peroni L, Peroni M, Rossetto M. High strain-rate compression and tension behaviour of an epoxy bi-component adhesive. International journal of adhesion and adhesives. 2008;28:329-39. 20. Morin D, Bourel B, Bennani B, Lauro F, Lesueur D. A new cohesive element for structural bonding modelling under dynamic loading. International Journal of Impact Engineering. 2013;53:94-105. 21. Banea MD, Da Silva LFM, Campilho RDSG. The Effect of Adhesive Thickness on the Mechanical Behavior of a Structural Polyurethane Adhesive. J Adhesion. 2015;91:331-46. 22. Thouless M, Adams J, Kafkalidis M, Ward S, Dickie R, Westerbeek G. Determining the toughness of plastically deforming joints. Journal of materials science. 1998;33:189-97. 23. Harris J, Adams R. An assessment of the impact performance of bonded joints for use in high energy absorbing structures. Proceedings of the Institution of Mechanical Engineers, Part C: Journal of Mechanical Engineering Science. 1985;199:121-31. 24. Avendaño R, Carbas RJC, Chaves F, da Silva LFM, Fernandes A. Impact loading of single lap joints of dissimilar lightweight adherends bonded with a crash-resistant epoxy adhesive. Journal of Engineering Materials and Technology. 2016;Accepted for publication. 25. Viana G, Mata R, Costa M, Silva LFMd, Banea MD, Carbas RJC. Impact of adhesive joints for the automotive industry at low and high temperatures. Poster session presented at: AB2015; 2015 Jul 2-3; Porto, Portugal. 26. Banea MD, da Silva LFM, Campilho RDSG. Mode I fracture toughness of adhesively bonded joints as a function of temperature: Experimental and numerical study. Int J Adhes Adhes. 2011;31:273-9. 27. Zhang Y, Adams R, da Silva L. A rapid method of measuring the glass transition temperature using a novel dynamic mechanical analysis method. The Journal of Adhesion. 2013;89:785-806. 28. Araújo H, Machado J, Marques E, da Silva L. Dynamic behaviour of composite adhesive joints for the automotive industry. Composite Structures. 2017;171:549-61. 29. Adams R, Peppiatt N. Stress analysis of adhesive-bonded lap joints. Journal of strain analysis. 1974;9:185-96.

PAPER 6


The influence of water on the fracture envelope of an adhesive joint
P. Fernandes a, G. Viana a, R.J.C. Carbas a,b, M. Costa a, L.F.M. da Silva b,⇑, M.D. Banea c
aDepartment of Mechanical Engineering, Faculty of Engineering, University of Porto, Portugalb Institute of Science and Innovation in Mechanical and Industrial Engineering (INEGI), Faculty of Engineering, University of Porto, Portugalc Federal Center of Technological Education in Rio de Janeiro, CEFET/RJ Rio de Janeiro, Brazil
a r t i c l e i n f o
Article history:Received 3 October 2016Revised 7 December 2016Accepted 8 January 2017Available online 10 January 2017
Keywords:Moisture degradationStructural adhesiveFracture toughnessMixed-mode loadingOpen specimenAccelerated ageing
a b s t r a c t
This research aims at determining the fracture envelope of an adhesive as a function of the watercontent. The fracture toughness of an adhesive joint was determined under pure mode I, II and mixedmode I + II loadings, in three different environments: dry, aged in salt water and aged in distilledwater. The fracture toughness under mode I and II were determined using Double Cantilever Beam(DCB) and End-Notched Flexure (ENF) tests, respectively. The characterization of the fracturetoughness under mixed-mode was done using an apparatus capable of applying a wide range ofloadings that go from pure mode I to almost pure mode II. To accelerate the diffusion process andobtain a uniform water concentration in the adhesive joint, a modified DCB specimen (ODCBspecimen) was adopted. Finite Element (FE) analysis was used to determine the gradient of waterconcentration in both specimens and to validate the use of the modified DCB specimens, comparingthe fracture toughness obtained using DCB and ODCB specimens. It was found that the toughness ofthe adhesive changed as a function of the ageing environment. For the salt water environment, themechanical properties increased, while for the distilled water environment, degradation of themechanical properties was observed.
� 2017 Elsevier Ltd. All rights reserved.
1. Introduction
As an alternative to mechanical joints, the use of adhesive jointshas been increasing since they provide several advantages overconventional methods. This can be seen in aerospace, automotiveand maritime industries as adhesive joints allow for a uniformstress distribution along the width of the bonded area, enhancingthe stiffness, load transmission and fatigue resistance of the struc-ture while reducing the weight and thus the cost [1,2].
This type of joint may be exposed to aggressive environmentssuch as high humidity, extreme temperature or radiation. Whilefracture mechanics characterization tests for adhesive joints mayprovide relevant properties to guide the design process, the infor-mation available to predict the behaviour of the adhesive afterbeing exposed to aggressive environments is scarce. Therefore,the influence of environmental agents on the mechanical proper-ties of the adhesive should be studied [3].
Water may enter the adhesive joint by Comyn [4]: diffusion inbulk adhesive, transport along the interface, capillary actionthrough cracks and crazes or diffusion through the adherend if
permeable. Usually this process can be described with Fick’s lawof diffusion, where the uptake is a function of time, concentrationand thickness [5–9]. However, other models have been developedto describe the diffusion process such as: dual fickian diffusion [8],delayed dual fickian [10] and the Langmuir model [11]. Externalfactors also influence the rate at which water is absorbed and themaximum water uptake, such as temperature [8] and the stressstate of the adhesive [12]. Water can act as a plasticizer, reducingthe interaction forces between molecules and allowing them torearrange themselves more easily. As a result, this water uptakecan lead to changes on the properties of the adhesive due to theplasticization of the adhesive and adherend, which leads to achange of thermal and mechanical properties, involving: lowerrigidity at room temperature, decrease of the glass transitiontemperature (Tg) [5,9,13] and increase of the strain failure atroom temperature [9,14]. However, these changes caused byplasticization can be partially or fully reversed with desorption[9,15]. It has also been reported that the presence of water onthe adhesive leads to a reduction of its fracture toughness[3,16,17]. Nonetheless, in some cases, an initial increase due toplasticization effects is observed, followed by a decrease due todegradation [9,16].
Fracture mechanics tests such as DCB, ENF and mixed-modeloadings can be used to assess the influence of water on the
http://dx.doi.org/10.1016/j.tafmec.2017.01.0010167-8442/� 2017 Elsevier Ltd. All rights reserved.
⇑ Corresponding author.E-mail address: [email protected] (L.F.M. da Silva).
Theoretical and Applied Fracture Mechanics 89 (2017) 1–15
Contents lists available at ScienceDirect
Theoretical and Applied Fracture Mechanics
journal homepage: www.elsevier .com/locate / tafmec
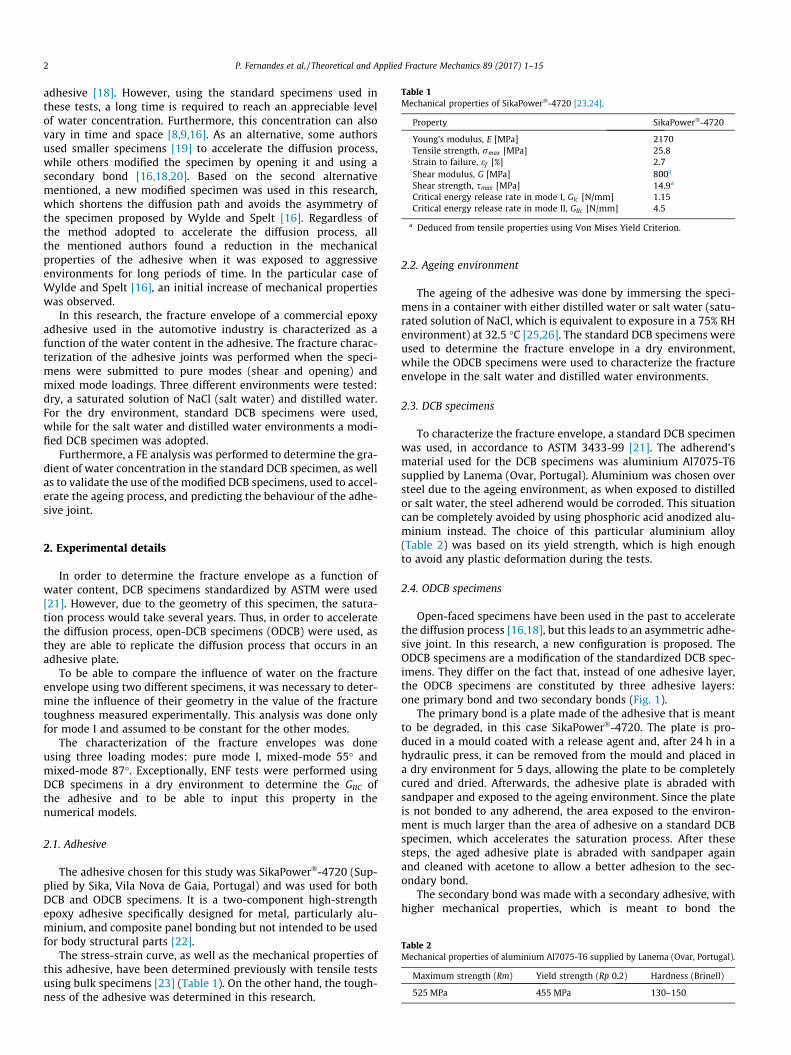
adhesive [18]. However, using the standard specimens used inthese tests, a long time is required to reach an appreciable levelof water concentration. Furthermore, this concentration can alsovary in time and space [8,9,16]. As an alternative, some authorsused smaller specimens [19] to accelerate the diffusion process,while others modified the specimen by opening it and using asecondary bond [16,18,20]. Based on the second alternativementioned, a new modified specimen was used in this research,which shortens the diffusion path and avoids the asymmetry ofthe specimen proposed by Wylde and Spelt [16]. Regardless ofthe method adopted to accelerate the diffusion process, allthe mentioned authors found a reduction in the mechanicalproperties of the adhesive when it was exposed to aggressiveenvironments for long periods of time. In the particular case ofWylde and Spelt [16], an initial increase of mechanical propertieswas observed.
In this research, the fracture envelope of a commercial epoxyadhesive used in the automotive industry is characterized as afunction of the water content in the adhesive. The fracture charac-terization of the adhesive joints was performed when the speci-mens were submitted to pure modes (shear and opening) andmixed mode loadings. Three different environments were tested:dry, a saturated solution of NaCl (salt water) and distilled water.For the dry environment, standard DCB specimens were used,while for the salt water and distilled water environments a modi-fied DCB specimen was adopted.
Furthermore, a FE analysis was performed to determine the gra-dient of water concentration in the standard DCB specimen, as wellas to validate the use of the modified DCB specimens, used to accel-erate the ageing process, and predicting the behaviour of the adhe-sive joint.
2. Experimental details
In order to determine the fracture envelope as a function ofwater content, DCB specimens standardized by ASTM were used[21]. However, due to the geometry of this specimen, the satura-tion process would take several years. Thus, in order to acceleratethe diffusion process, open-DCB specimens (ODCB) were used, asthey are able to replicate the diffusion process that occurs in anadhesive plate.
To be able to compare the influence of water on the fractureenvelope using two different specimens, it was necessary to deter-mine the influence of their geometry in the value of the fracturetoughness measured experimentally. This analysis was done onlyfor mode I and assumed to be constant for the other modes.
The characterization of the fracture envelopes was doneusing three loading modes: pure mode I, mixed-mode 55� andmixed-mode 87�. Exceptionally, ENF tests were performed usingDCB specimens in a dry environment to determine the GIIC ofthe adhesive and to be able to input this property in thenumerical models.
2.1. Adhesive
The adhesive chosen for this study was SikaPower�-4720 (Sup-plied by Sika, Vila Nova de Gaia, Portugal) and was used for bothDCB and ODCB specimens. It is a two-component high-strengthepoxy adhesive specifically designed for metal, particularly alu-minium, and composite panel bonding but not intended to be usedfor body structural parts [22].
The stress-strain curve, as well as the mechanical properties ofthis adhesive, have been determined previously with tensile testsusing bulk specimens [23] (Table 1). On the other hand, the tough-ness of the adhesive was determined in this research.
2.2. Ageing environment
The ageing of the adhesive was done by immersing the speci-mens in a container with either distilled water or salt water (satu-rated solution of NaCl, which is equivalent to exposure in a 75% RHenvironment) at 32.5 �C [25,26]. The standard DCB specimens wereused to determine the fracture envelope in a dry environment,while the ODCB specimens were used to characterize the fractureenvelope in the salt water and distilled water environments.
2.3. DCB specimens
To characterize the fracture envelope, a standard DCB specimenwas used, in accordance to ASTM 3433-99 [21]. The adherend’smaterial used for the DCB specimens was aluminium Al7075-T6supplied by Lanema (Ovar, Portugal). Aluminium was chosen oversteel due to the ageing environment, as when exposed to distilledor salt water, the steel adherend would be corroded. This situationcan be completely avoided by using phosphoric acid anodized alu-minium instead. The choice of this particular aluminium alloy(Table 2) was based on its yield strength, which is high enoughto avoid any plastic deformation during the tests.
2.4. ODCB specimens
Open-faced specimens have been used in the past to acceleratethe diffusion process [16,18], but this leads to an asymmetric adhe-sive joint. In this research, a new configuration is proposed. TheODCB specimens are a modification of the standardized DCB spec-imens. They differ on the fact that, instead of one adhesive layer,the ODCB specimens are constituted by three adhesive layers:one primary bond and two secondary bonds (Fig. 1).
The primary bond is a plate made of the adhesive that is meantto be degraded, in this case SikaPower�-4720. The plate is pro-duced in a mould coated with a release agent and, after 24 h in ahydraulic press, it can be removed from the mould and placed ina dry environment for 5 days, allowing the plate to be completelycured and dried. Afterwards, the adhesive plate is abraded withsandpaper and exposed to the ageing environment. Since the plateis not bonded to any adherend, the area exposed to the environ-ment is much larger than the area of adhesive on a standard DCBspecimen, which accelerates the saturation process. After thesesteps, the aged adhesive plate is abraded with sandpaper againand cleaned with acetone to allow a better adhesion to the sec-ondary bond.
The secondary bond was made with a secondary adhesive, withhigher mechanical properties, which is meant to bond the
Table 1Mechanical properties of SikaPower�-4720 [23,24].
Property SikaPower�-4720
Young’s modulus, E [MPa] 2170Tensile strength, rmax [MPa] 25.8Strain to failure, ef [%] 2.7Shear modulus, G [MPa] 800a
Shear strength, smax [MPa] 14.9a
Critical energy release rate in mode I, GIc [N/mm] 1.15Critical energy release rate in mode II, GIIc [N/mm] 4.5
a Deduced from tensile properties using Von Mises Yield Criterion.
Table 2Mechanical properties of aluminium Al7075-T6 supplied by Lanema (Ovar, Portugal).
Maximum strength (Rm) Yield strength (Rp 0.2) Hardness (Brinell)
525 MPa 455 MPa 130–150
2 P. Fernandes et al. / Theoretical and Applied Fracture Mechanics 89 (2017) 1–15

degraded adhesive plate to the adherends. For this reason, two lay-ers of the secondary adhesive were used, one on each side of theadhesive plate.
During the experimental tests, it was observed that thesecondary bond had no influence in the critical energy releaserate and that any difference observed was caused by thechange of thickness of the adhesive layer. For this reason, itwas possible to choose different secondary bonds for eachenvironment, ensuring that the failure was cohesive in theadhesive plate.
2.4.1. Secondary bond for the salt water environment – Araldite� 420A two component epoxy, room temperature curing paste adhe-
sive of high strength, toughness and moisture resistance was cho-sen as secondary adhesive for the salt water environment. Thisadhesive cured at room temperature for 5 days.
This adhesive was chosen as a secondary bonding for havinghigher mechanical properties in comparison to the primary adhe-sive (Table 3). Also, it has been used in the literature as a secondarybond for a similar process [18].
2.4.2. Secondary bond for the distilled water environment – Araldite�
2021A two component toughened methacrylate adhesive system
that cured at room temperature in 1 day was chosen as secondaryadhesive for distilled water environment.
This adhesive was chosen for its fast cure cycle, which mini-mizes the loss of water during the production of the ODCB speci-mens. It was also chosen for having slightly better mechanicalproperties than the primary adhesive (Table 4). In this environ-ment, it is acceptable for the secondary bond and primary bondto have similar properties, as only the mechanical properties ofthe primary bond will be degraded.
2.5. Test method
2.5.1. DCB testDCB tests were done to determine the GIc of the adhesive, in
accordance to ASTM D3433-99 [21]. To determine this value, threevalid test results were used. During the DCB tests, an opening forceis applied to the specimens. The load and displacements wererecorded by the computers data acquisition system using anInstron� 3367 Universal Testing Machine (Norwood, USA) with aload cell of 30 kN. With the data collected, it is possible to deter-mine the R-curves using the Compliance Based Beam Method(CBBM) [32].
Before testing, a pre-crack was initiated in all specimens toavoid a blunt crack, which could lead to an increase of the energyrequired for the crack to propagate. After the pre-crack was done,the initial crack length was measured. The specimen was thentested at room temperature and at a constant displacement rateof 0.2 mm/min.
Using the CBBM, the value of GIc can be determined according tothe following expression [32]:
GIc ¼ 6P2
b2h3
2a2eEf
þ h2
5G
!ð1Þ
Which depends only on the specimen’s compliance, correctedflexural modulus ðEf Þ, shear modulus of the adherend ðGÞ andequivalent crack length ðaeÞ [32,33]. In this equation, P is the loadapplied and b and h are the width and thickness of the specimen.
2.5.2. ENF testThere are no standards for testing the mode II fracture tough-
ness [32]. The most simple and most common test is the ENF.The equipment and number of specimens used for these testswas the same that was used for the DCB tests.
Fig. 1. Scheme (a) and definition draw (b) of an ODCB specimen (dimensions in mm).
Table 3Mechanical properties of Araldite� 420 A/B [27,28].
Property Araldite� 420 A/B
Young’s modulus, E [MPa] 1800Tensile strength, rmax [MPa] 28.6Shear modulus, G [MPa] 692Shear strength, fmax [MPa] 16.5Critical energy release rate in mode I, GIc [N/mm] 3Critical energy release rate in mode II, GIIc [N/mm] 12.5
Table 4Mechanical properties of Araldite� 2021 [29–31].
Property Araldite� 2021
Young’s modulus, E [MPa] 1130Tensile strength, rmax [MPa] 26.2Shear modulus, G [MPa] 403.6Shear strength, smax [MPa] 18.4Critical energy release rate in mode I, GIc [N/mm] 1.6Critical energy release rate in mode II, GIIc [N/mm] 3.17
P. Fernandes et al. / Theoretical and Applied Fracture Mechanics 89 (2017) 1–15 3

Using the CBBM, the value of GIIc can be determined accordingto the follow expression [32]:
GIIc ¼9P2a2eq
16b2Ef h3 ð2Þ
2.5.3. Mixed-mode testTo perform the mixed-mode tests, a loading jig, described in the
Portuguese patent no 107188 B [34], was used (Fig. 2). This appa-ratus was designed to perform mixed-mode fracture tests, a com-bination of mode I and mode II loadings, on adhesively bonded DCBspecimens. It can be equipped on a universal testing machine andis possible to apply loadings with a wide array of mode combina-tions ranging from pure mode I to almost pure mode II, by adjust-ing the length of the beams supporting the specimenðS1; S2; S3 and S4Þ and the fixation points ðL1 and 2LÞ. A detailedexplanation on how the loading jig works is given in the mentionedpatent. Furthermore, an article that explains the principles, limita-tions and all the details regarding the loading jig and its use will bepublished.
For mixed-mode tests, the fracture ratio can be defined by theangle u according to the following equation [32]:
u ¼ tan�1
ffiffiffiffiffiffiGII
GI
sð3Þ
As a result, u = 0� represents pure mode I, u = 90� pure mode II,and as an example, u = 45� would be a mode where GI = GII.
During this test, 3 variables are recorded:
– The load applied to the apparatus, obtained from an Instron�
3367 Universal Testing Machine (Norwood, USA).– Displacement of the upper and lower adherend, d1 and d2,obtained from two Linear Variable Differential Transformers(LVDT) attached to each beam.
Using this data and applying the CBBM, it is possible to deter-mine the fracture toughness for mode I and II independently fromeach other [35]:
GI ¼ 6P2
b2h3
2a2eIEf
þ h2
5G
!ð4Þ
GII ¼ 9P2a2eII4b2Ef h
3 ð5Þ
Since the fracture toughness for each mode is determined inde-pendently, two different equivalent crack lengths are used, formode I ðaeIÞ and mode II ðaeIIÞ.
It is also important to note that GI and GII determined above aretwo parts of a same toughness, GC for the respective mixed-modetested, and should not be confused with GIC or GIIC , which respec-tively represent the fracture toughness for mode I, obtainedthrough the DCB test, and the fracture toughness for mode II,obtained through the ENF test.
Furthermore, Eqs. (2) and (5), although similar, are deduced fordifferent tests, with slightly different boundary conditions. As aresult, only the denominator differs.
3. Experimental results and discussion
3.1. Validation of the ODCB specimens
Changing from DCB to ODCB specimens may have an influencein the fracture toughness measured experimentally. This change isjustified by the change of thickness of the adhesive layer, whichchanges the shape of the fracture process zone and is known tocause differences in the measured toughness [36], and by theinclusion of a secondary adhesive to bond the adhesive plate tothe adherend (Fig. 3).
Thus, in order to validate the use of the ODCB specimens, a com-parison between the mode I fracture toughness of 3 different spec-imen configurations was done. The first specimen was a DCBspecimen with a 0.2 mm thick adhesive layer. The second, was aDCB specimen with a 0.4 mm thick adhesive layer. The last one,was an ODCB specimen which had an adhesive layer with a totalthickness of 0.4 mm (Fig. 4).
With these three configurations it was possible to isolate theinfluence of the adhesive’s thickness and the influence of the sec-ondary bond. In the end, it was possible to understand if the frac-ture toughness measured was different and what is the cause ofthis change.
Representative load-displacement curves of the 3 types of spec-imens used to validate the influence of the adhesive’s thicknessand of the secondary bond can be seen in Fig. 5. The curve obtainedfor the DCB with a 0.2 mm thick adhesive layer is the reference. Aslight change in the maximum load when the thickness isincreased to 0.4 mm can be seen. However, the results obtainedfor the DCB with 0.4 mm thick adhesive layer and for the ODCBspecimen tested in a dry environment are in agreement with each
Fig. 2. Mixed-mode apparatus. S1, S2, S3, S4, 2L and L1 are the six variables that define the configuration of the equipment and, as a result, the loading mode. d1 and d2 are thedisplacements of the upper and lower adherend of the specimen and F is the force applied to the apparatus by the universal testing machine.
4 P. Fernandes et al. / Theoretical and Applied Fracture Mechanics 89 (2017) 1–15

other, suggesting that the introduction of a secondary bond doesnot affect significantly the obtained properties (Fig. 5).
Analysing the R-curves, a slight increase of GIC is observed whenthe thickness of the adhesive increases, but no difference is seenwith the inclusion of the secondary bond (Fig. 6). As a result, theincrease of the adhesive layer’s thickness lead to an overestimationof the fracture toughness by 0.2 N/mm. However, the inclusion ofthe secondary bond did not have an influence on GIC .
In other modified specimens found in the literature, thatinclude the use of a secondary bonding, the influence of the sec-ondary adhesive has also been reported to be close to null. There-fore, this data is in agreement with the results obtained by otherauthors [16].
This comparison was done using at least 3 valid test results foreach different condition.
3.2. Fracture envelopes
With a minimum of three valid results for each experimentaltests (Table 5) it was possible to define the fracture envelopes forthe three environments studied (Fig. 7). However, it is importantto remark that the experimental validation of the use of ODCBspecimens, used in the salt water and distilled water environ-ments, has not been done for mixed-mode loadings. This methodwas validated for mode I and assumed constant for the other cases.
Fig. 3. Differences between the DCB and ODCB specimens (dimensions in mm).
Fig. 4. Three specimen configurations (DCB with 0.2 and 0.4 mm thick adhesive layer and ODCB specimen) and their differences.
Fig. 5. Representative load-displacement curves of the 3 types of specimens used to validate the influence of the adhesive’s thickness and of the secondary bond.
P. Fernandes et al. / Theoretical and Applied Fracture Mechanics 89 (2017) 1–15 5

3.2.1. Dry environmentIn this envelope, the difference between the values of GII
obtained for the ENF and mixed-mode 87� tests stands out(Table 5). It was expected that the mode II component of the frac-ture toughness measured in the mixed-mode 87� test would belower than the one measured in the ENF test, as the mixed-modetest introduces an opening load. However, the experimental resultsshow otherwise. Three possible situations may justify this differ-ence. First, it is relevant to point out that these two tests were doneusing different equipment, with distinct rigidities, which may helpexplain the difference in the values obtained. To further investigatethis possibility, it would be interesting to apply the arcan test, as itcan reproduce the loadings in question. In second place, this beha-viour is known for composite materials and can be describedthrough the Benzeggagh-Kenane failure criterion [37]. Morerecently, the same behaviour was reported for adhesives, although
the causes of such behaviour are not fully understood [38]. Finally,the third factor to take into account is that the ENF and mixed-mode tests are not standardized and that it is difficult to reproducepure mode II loadings. All these aspects require further investiga-tion to fully understand the difference between the resultsobtained for the mixed-mode 87� and for the ENF test.
Ignoring the data obtained with the ENF test, the fracture envel-ope for the dry environment can be described with a linear func-tion (Eq. (6)).
GI ¼ �0:1658GII þ 1:1576 ð6Þ
3.2.2. Salt water environmentSimilarly to the results of the dry environment, it seems possi-
ble to describe this envelope with a linear function (Eq. (7)). Also,
Fig. 6. Representative R-curves of the 3 types of specimens used to validate the influence of the adhesive’s thickness and of the secondary bond.
Table 5Summary of the fracture toughness for the different loading modes as a function of the relative humidity.
Mode I Mixed-mode 55� Mixed-mode 87� Mode II
Specimen Environment GIC (N/mm) GI (N/mm) GII (N/mm) GI (N/mm) GII (N/mm) GIIC (N/mm)
DCB Dry 1.15 0.92 1.57 0.04 6.60 4.83
ODCB Salt water 1.60 1.35 1.08 0.01 7.26 –Distilled water 0.61 0.55 0.73 0.02 2.84 –
Fig. 7. Fracture envelopes of the specimens tested in a dry, salt water and distilled water environments.
6 P. Fernandes et al. / Theoretical and Applied Fracture Mechanics 89 (2017) 1–15

an increase in the fracture toughness can be observed in compar-ison with the envelope determined in a dry environment.
GI ¼ �0:2188GII þ 1:5946 ð7Þ
3.2.3. Distilled water environmentUnlike previous results, the shape of the fracture envelope
determined in the distilled water environment can be approxi-mated with a quadratic function (Eq. (8)). It can also be seen thatthe fracture toughness was reduced when compared to the dryenvironment.
GI ¼ �0:0658G2II � 0:0125GII þ 0:5989 ð8Þ
In all three environments, the fracture envelope is defined byeither a linear or quadratic function. These two types are the mostcommon found in the literature [35]. Less common cases report aninitial increase in fracture toughness for mixed-modes close topure mode I [38]. This situation is known for composite materialsand is described by the Benzeggagh–Kenane failure criterion [37].
3.3. Influence of water on the fracture envelope
Analysing the three fracture envelopes and considering the dryenvironment as a reference, two changes can be identified (Fig. 8).The first one is the change to the distilled water environment,where the fracture toughness of the adhesive is reduced in all load-ing modes. This behaviour can be explained with the degradationof the adhesive. The second one is the increase of the fracturetoughness in the salt water environment. Such change is explainedby the plasticization of the adhesive, a phenomenon that allowsthe polymeric molecules in the adhesive to rearrange themselvesmore easily, reducing its rigidity and, as a result, increasing itsductility.
In both scenarios, the changes observed can be explained withthe adhesive’s water mass uptake in each environment, as wellas the influence of the ageing environment on the Tg (Fig. 9), whichhas been reported in the literature [39].
Starting with the distilled water environment, the degradationthat occurs can easily be explained with the reduction of theTg to a point below room temperature. It is known that thetoughness of structural adhesives above Tg is very low [40]. As aconsequence, any test done above 10 �C will prove a reduction inproperties. Furthermore, the adhesive’s mass uptake is equal to35%, which leads to a huge concentration of water within theadhesive and explains why the properties were reduced sosignificantly within 4 days. Similar results have been obtained byother authors in the past [16,18,19].
In the salt water environment, the increase of fracture tough-ness can be explained as the result of the interaction between
two opposite factors. On one side, the water absorbed causesa slight degradation, which can be seen in the form of areduction of Tg. However, the degradation that occurs is notenough to overcome the increase of ductility caused by theplasticization of the adhesive. This explanation becomes moreacceptable once it is taken into account that in this environmentthe mass uptake is approximately 6 times lower (6.5%) than inthe distilled water environment. Although not as common, thisinitial increase has also been reported by other authors in thepast [16,19].
4. Numerical modelling
A numerical analysis was carried out to study the timerequired for the ODCB specimens to saturate and to study thedifferences between DCB and ODCB specimens in terms offracture energy obtained. In this section, both fracture anddiffusion models are described, followed by the results obtainedin each case.
4.1. Diffusion models
Two 1D finite element models were built in ABAQUS� to simu-late the diffusion process in the standard DCB joint and in theadhesive plate, used for the ODCB specimens. The objective ofthese models is to determine the concentration of water in theadhesive. In order to do so, an analogy between heat transfer andmoisture diffusion was used [2,41].
In both cases, a 2-node heat transfer link was used(DC1D2). The water sorption parameters of the adhesiveSikaPower�-4720, coefficient of moisture diffusion ðDÞ and massattained at equilibrium ðm1Þ, were obtained in a previous study(Table 6) [39]. A Fickian behaviour is observed in the distilledwater environment, while a sequential dual-fickian behaviouris more suitable for the salt water environment. For this reason,two coefficients of moisture diffusion and two values ofmass attained at equilibrium are required for the salt waterenvironment, as opposed to the distilled water environmentwhich only requires one of each.
4.1.1. Diffusion in the DCB specimenTo simulate the diffusion in the DCB specimen, a 1D finite ele-
ment model representing half the width of the adhesive layerwas used (Fig. 10a). The decision of using a 1D model was basedon two assumptions:Fig. 8. Schematic representation of the three envelopes and their interactions.
Fig. 9. Glass transition temperature of SikaPower�-4720 as a function of the ageingenvironment [39].
P. Fernandes et al. / Theoretical and Applied Fracture Mechanics 89 (2017) 1–15 7

– The water uptake will only occur through the adhesive exposedto the ageing environment. This assumes the inexistence ofempty paths between the adhesive layer and the adherend thatcould accelerate the diffusion process.
– The water uptake perpendicular to the length of the adhesivelayer is much larger than the uptake perpendicular to the width.This assumption is based on the geometry of the DCB specimen,where the length is much longer than the width.
Considering these assumption, a unidirectional diffusion pro-cess through the adhesive’s thickness can be assumed.
4.1.2. Diffusion in the adhesive plateTo simulate the diffusion in the adhesive plate, a 1D finite ele-
ment model representing half the thickness of the adhesive platewas used (Fig. 10b). In this case, the use of a 1D model was basedon the geometry of the adhesive plate. Since the water uptake canoccur through all direction, and given the fact that the length andwidth of the plate are much larger than its thickness, a unidirec-tional diffusion process through the adhesive’s thickness can beassumed.
In total, both models have 500 elements and 501 nodes.
4.1.3. Diffusion model’s resultsConsidering the diffusion parameters mentioned in Table 6 and
the experimental measurements of the adhesive’s plate mass, theresults shown in Fig. 11 were obtained.
The numerical simulations suggested that the adhesive plateswould be saturated after 2 days, in both environments. However,the experimental results show that the diffusion process is slower.The reason behind this difference is that the data used for thenumerical models was determined with a 1 mm thick specimen,5 times larger than the adhesive plates. It was shown in the liter-ature that the diffusion coefficient and the saturation levels changeas a function of the specimen’s thickness [8].
Using the experimental results, the diffusion coefficient and sat-uration level were updated (Table 7) and reintroduced in thenumerical model. The results are shown in Fig. 12.
For the distilled water environment, both experimental andnumerical results show a good agreement. In other words, the sim-ulation done to estimate the saturation time was validated. Thesame can be said for the salt water environment, although the
value of D1 seems to have been overestimated. To accurately deter-mine this value, a thorough diffusion analysis would be requiredduring the first day of ageing.
In the end, it was proven that the adhesive plates are saturatedat the end of 4 days, for both salt water and distilled waterenvironments.
4.2. Fracture models
Numerical models were developed in ABAQUS� to simulate the4 fracture tests (DCB, MM 55�, MM 87� and ENF) for both DCB andODCB specimens. The models used for the DCB specimens considerelastic elements for the adherends and cohesive elements for theadhesive.
Cohesive zone models (CZM) model three different stages of thefailure process: an elastic loading, damage initiation and the prop-agation that occurs due to local failure within the material. Thistype of model establishes a relationship between stresses and rel-ative displacements between nodes, allowing the simulation of anelastic behaviour followed by a softening and gradual degradationof the material properties [42].
For the ODCB specimens, two possible scenarios were modelled(Fig. 13):
(1) The primary adhesive is modelled with a cohesive elementand the secondary adhesive with an elastic element, makinga total of only 1 cohesive layer. This enables the possibility ofanalysing the stress through the thickness of the secondarybond. However, it assumes that the crack will always prop-agate in the primary adhesive.
(2) Both primary and secondary adhesives are modelled using a50% ratio of cohesive elements and elastic elements, makinga total of 3 cohesive layers. This gives the possibility of ana-lysing the degradation of both primary and secondary adhe-sive, as it assumes that the crack can propagate in all threeadhesive bonds.
In all three cases, the elastic elements were modelled using4-node bilinear plane strain quadrilateral elements (CPE4R inABAQUS�), while the cohesive elements used 4-node two-dimensional cohesive elements (COH2D4 in ABAQUS�). Themechanical and cohesive properties used in the simulations are
Table 6Diffusion parameters of the adhesive SikaPower�-4720 [39].
D1 (m2/s) m11 ð%Þ D2 (m2/s) m2
1 ð%ÞSikaPower�-4720 Distilled water 1:2� 10�13 32.5 – –
Salt water 2:6� 10�13 2.0 2:5� 10�14 1.8
Fig. 10. (a) Scheme of a front view of the DCB specimen. The dark blue area represents the 1D element modelled for the diffusion in the DCB specimen; (b) Scheme of a frontview of the adhesive plate. The dark blue area represents the 1D element modelled for the diffusion in the adhesive plate (dimensions in mm). In both cases, the infinitesimalthickness of the element is represented with de. (For interpretation of the references to colour in this figure legend, the reader is referred to the web version of this article.)
8 P. Fernandes et al. / Theoretical and Applied Fracture Mechanics 89 (2017) 1–15

shown in Table 8. A triangular traction-separation law available inABAQUS� was used [43]. This law assumes an elastic behaviour up
to rf or sf . This law approximates the behaviour of the adhesive toa graphic with a shape of a triangle, where the slope of the first
Fig. 11. Experimental and numerical results for the mass uptake of the adhesive plate submerged in distilled water and salt water.
Table 7Corrected diffusion parameters for the adhesive SikaPower�-4720.
D1 (m2/s) m11 ð%Þ D2 (m2/s) m2
1 ð%ÞSikaPower�-4720 Distilled water 0:4� 10�13 35.0 – –
Salt water 3:0� 10�13 4.7 1:5� 10�14 1.5
Fig. 12. Updated numerical and experimental results for the mass uptake of the adhesive plate submerged in distilled water and salt water.
Fig. 13. Pictures of the 3 specimen configurations modelled (not to scale).
P. Fernandes et al. / Theoretical and Applied Fracture Mechanics 89 (2017) 1–15 9

edge is the rigidity, the upper vertex represents rf or sf , and itsarea corresponds to the toughness of the material (GIc and GIIc).The shear maximum relative displacements, correspond to thelength of the lower edge, and is calculated based on the parametersmentioned.
Due to the different thickness of the adhesive layers, the meshapplied to each one of these three model types was different. How-ever, all the different mesh refinements used were based on thesame principle: maximizing the quality of the mesh in the adhesivelayer, where the crack propagates, and applying a less refinedmeshin less critical zones, such as the top and bottom of the specimen(Fig. 14). For the DCB and mixed-mode tests, the mesh’s elementsize changes from 1 mm, in the extremes of the specimen, to0.2 mm or 0.4 mm in the adhesive, depending on the thickness ofthe adhesive layer. For the ODCB specimens, the mesh’s elementsize decreases to 0.05 mm in the adhesive. The reason behind thisrefinement is that the secondary bond was divided in two parti-tions: a 0.05 mm thick layer modelled with elastic elements andanother equal layer modelled with cohesive elements, making atotal of a 0.1 mm thick secondary bond. Any other component usedin these tests, was modelled with a uniform mesh with a 0.2 mmelement size.
4.2.1. Model for mode ITo model this test, a pinned support was applied to the lower
adherend, representing the pin that connects the specimen to thetesting machine, and a vertical displacement was applied to theupper adherend. The boundary conditions used can be seen inFig. 15(a).
In order to validate the influence of the secondary bonding,another Mode I model was developed. The only difference is thethickness of the adhesive layer, which is 0.4 mm in this case.
4.2.2. Models for mixed-mode 55� and mixed-mode 87�In the mixed-mode simulations, part of the apparatus used for
the experimental tests was modelled. It was necessary to include
4 beams, with a rectangular cross section equal to the real equip-ment and modelled with beam elements, which were connectedto each other and to the specimen with pin multi-point constraints.Similarly to the experimental test, the load is applied to the upperbar, causing the other beams to move and create a combination ofboth opening and shear modes (Fig. 15b). For the mixed-mode 87�,the same principle was applied. The only difference being thedimensions of the 4 beams and the points where the boundaryconditions are applied.
4.2.3. Fracture model’s results
Mode I – DCB specimen with 0.2 mm thick adhesive layerThe numerical and experimental R-curves (Fig. 16) show a good
agreement with one another, as both of them tend to the samevalue. Some irregularities can be seen in the experimental curve,which do not appear in the numerical result. This difference isacceptable as the numerical model considers the existence of aperfect adhesive layer and, therefore, no irregularities are shownin the R-curve.
Mode I – DCB specimen with 0.4 mm thick adhesive layer
The comparison between the numerical curve and a representa-tive curve of the experimental tests is shown in Fig. 17. The valueobtained for the GIC is approximately the same in both cases.
Mode I – ODCB specimen
In both numerical models, with either 1 or 3 layers of cohesiveelements, it can be seen that there is an agreement between theexperimental and numerical results regarding the critical energyrelease rate (Fig. 18). In the model it was considered that the adhe-sive plate would cover the whole specimen, which is not true.However, since there is an agreement between the experimentaland numerical results, it can be concluded that the adhesive plateis long enough to reach a constant crack propagation.
Fig. 14. Example of the mesh refinement applied to the specimen. The mesh is refined towards the adhesive layer and then kept constant throughout the length of thespecimen.
Table 8Elastic and cohesive properties [23,24,29–31].
Elastic properties Cohesive properties
E [GPa] m G [MPa] rf [MPa] sf [MPa] GIc [N/mm] GIIc [N/mm]
Aluminium 70 0.33 – – – – –SikaPower�-4720 2.171 0.35 750 25.8 15.5 1.15 4.5Araldite 2021 1.130 0.35 404 26.5 18.4 1.6 3.17
10 P. Fernandes et al. / Theoretical and Applied Fracture Mechanics 89 (2017) 1–15

According to the same numerical simulation, there is no dam-age of the CZM elements in the secondary bond (Fig. 19). The dam-age represented is determined by a reduction of rigidity on each
element. This result suggests that the inclusion of the secondaryadhesive does not influence the fracture toughness determinedexperimentally.
Fig. 15. Assembly and boundary conditions used for the mixed-mode 55� test.
Fig. 16. Numerical and experimental R-curves of the DCB specimens with an adhesive layer of 0.2 mm thickness tested under mode I loading in a dry environment.
Fig. 17. Numerical and experimental R-curves of the DCB specimens with an adhesive layer of 0.4 mm thickness tested under mode I loading in a dry environment.
P. Fernandes et al. / Theoretical and Applied Fracture Mechanics 89 (2017) 1–15 11

Mixed-mode 55�
The critical energy release rates were determined by the valuethe plateau reached in the R-curve. Since the simulation considersa stable crack propagation, a good agreement was found betweenexperimental and numerical results (Fig. 20).
Mixed-mode 87�
The value of GIIC obtained from this experimental tests is higherthan the value obtained from the ENF test (Fig. 21). This situationshould never happen as the mode II critical energy release rate of amixed-mode loading must be lower than the critical energy releaserate of a pure mode II loading. However, the numerical analysisconfirms this increase, which must be caused by the influence ofthe apparatus used to create the mixed-mode loading.
Validation of the ODCB specimens for other loading modes
The influence of this method was studied numerically and theresults have shown that the secondary bonds should not influencethe fracture toughness measured under mixed-mode 55� andmixed-mode 87�. This conclusion is based on 2 results: the inexis-tence of degradation in the secondary bonds (Fig. 22) and the equalfracture toughness obtained in the R-curves (Figs. 23 and 24).Regarding the damage of the secondary bonds, only two partiallydamaged points can be seen at the crack tip, corresponding to amuch reduced length of adhesive that does not compromise theresults obtained.
On the other hand, the R-curves obtained show equivalentresults to what was obtained experimentally for mode I. It can beseen that the increase of the adhesive layer’s thickness changesthe fracture toughness, while the inclusion of the secondary bond
Fig. 18. Numerical and experimental R-curves of the ODCB specimens tested under mode I with a dry adhesive plate.
Fig. 19. Damage of CZM elements of the primary and secondary bonds for the ODCB specimens tested under mode I with a dry adhesive plate.
Fig. 20. Numerical and experimental R-curves for the DCB specimens tested under mixed-mode 55� in a dry environment.
12 P. Fernandes et al. / Theoretical and Applied Fracture Mechanics 89 (2017) 1–15

Fig. 21. Numerical and experimental R-curves for the DCB specimens tested under mixed-mode 87� in a dry environment.
Fig. 22. Damage of the CZM elements of the primary and secondary bonds for the ODCB specimens tested under mixed-mode 55� (a) and mixed-mode 87� (b) with a dryadhesive plate.
Fig. 23. Numerical R-curves for the DCB and ODCB specimens tested under mixed-mode 55�.
P. Fernandes et al. / Theoretical and Applied Fracture Mechanics 89 (2017) 1–15 13

does not influence the result. The numerical simulations using only1 or 3 CZM layers reported the same fracture toughness in bothmixed-modes. For this reason, and in order to make the graphicsmore readable, only the latter is shown.
5. Conclusions
The main objectives of this work were the characterization ofthe three fracture envelopes in a dry, salt saturated solution anddistilled water environments as well as determining the relationbetween them. The fracture envelope in a dry environment hasbeen fully characterized. However, more tests need to be done todefine the fracture toughness of the adhesive in the other two envi-ronments, in order to allow a better characterization of the changescaused by the ODCB specimen under the mixed-mode loadingmodes.
Nonetheless, it was possible to identify a trend between thethree envelopes, where the distilled water environment causesdegradation of the mechanical properties and the salt water envi-ronment leads to a higher fracture toughness due to plasticizationof the adhesive.
To determine the fracture toughness in the salt water and dis-tilled water environments, a modified specimen was used, allow-ing the adhesive to saturate in just 4 days. The analysis done inmode I shows that due to an increase of the adhesive layer’s thick-ness, the fracture toughness is overestimated in approximately0.2 N/mm. This increase is justified with the change of the shapeof the FPZ (Fracture Process Zone) as well as the modification ofthe stress distribution in the adhesive. The inclusion of the sec-ondary bond has proven to have no significant effect on the frac-ture toughness measured.
The numerical simulations developed in this research suggestthat the validation of the ODCB specimens done for mode I canbe extrapolated to other loading modes.
Acknowledgements
The authors would like to thank Sika for supplying theSikaPower 4720 adhesive. This study was financed by theFundação para a Ciência e Tecnologia through grant EXCL/EMS-PRO/0084/2012.
References
[1] L.F.M. da Silva, A. Öchsner, R.D. Adams, Handbook of Adhesion Technology,Springer-Verlag, 2011.
[2] G. Viana, M. Costa, M.D. Banea, L.F.M. da Silva, A review on the temperatureand moisture degradation of adhesive joints, Proc. IMechE Part L: J. Mater.:Des. Appl. (2016).
[3] L.F.M. da Silva, C. Sato, Design of Adhesive Joints Under Humid Conditions,Springer, 2013.
[4] J. Comyn, Kinetics and mechanism of environmental attack, in: Durability ofStructural Adhesives, Applied Science Publishers, 1983, pp. 85–131.
[5] Y. Zhang, R.D. Adams, L.F.M. da Silva, Absorption and glass transitiontemperature of adhesives exposed to water and toluene, Int. J. Adhes. Adhes.50 (2014) 85–92.
[6] J. Crank, The Mathematics of Diffusion, Oxford University Press, 1975.[7] A. Fick, On liquid diffusion, J. Membr. Sci. 100 (1995) 33–38.[8] W.K. Loh, A.D. Crocombe, M.M.A. Wahab, I.A. Ashcroft, Modelling anomalous
moisture uptake, swelling and thermal characteristics of a rubber toughenedepoxy adhesive, Int. J. Adhes. Adhes. 25 (2005) 1–12.
[9] R.A. Pethrick, Design and ageing of adhesives for structural adhesive bonding–a review, Proc. IMechE Part L: J. Mater.: Des. Appl. 229 (2015) 349–379.
[10] A. Mubashar, I.A. Ashcroft, G.W. Critchlow, A.D. Crocombe, Moistureabsorption–desorption effects in adhesive joints, Int. J. Adhes. Adhes. 29(2009) 751–760.
[11] A. Ameli, N.V. Datla, M. Papini, J.K. Spelt, Hygrothermal properties of highlytoughened epoxy adhesives, J. Adhes. 86 (2010) 698–725.
[12] X. Han, A.D. Crocombe, S.N.R. Anwar, P. Hu, W.D. Li, The effect of a hot-wetenvironment on adhesively bonded joints under a sustained load, J. Adhes. 90(2014) 420–436.
[13] W. Li, M. Ma, X. Han, L. Tang, J. Zhao, E. Gao, Strength prediction of adhesivelybonded single lap joints under salt spray environment using a cohesive zonemodel, J. Adhes. 92 (2016) 916–937.
[14] E.H. Immergut, H.F. Mark, Principles of plasticization, Adv. Chem. Ser. 48(1965) 1–26.
[15] A.Q. Barbosa, L.F.M. da Silva, A. Öchsner, Hygrothermal aging of an adhesivereinforced with microparticles of cork, J. Adhes. Sci. Technol. 29 (2015) 1714–1732.
[16] J.W. Wylde, J.K. Spelt, Measurement of adhesive joint fracture properties as afunction of environmental degradation, Int. J. Adhes. Adhes. 18 (1997) 237–246.
[17] A. Ameli, M. Papini, J. Spelt, Fracture R-curve of a toughened epoxy adhesive asa function of irreversible degradation, Mater. Sci. Eng., B 527 (2010) 5105–5114.
[18] W.K. Loh, A.D. Crocombe, M.M.A. Wahab, I.A. Ashcroft, Environmentaldegradation of the interfacial fracture energy in an adhesively bonded joint,Eng. Fract. Mech. 69 (2002) 2113–2128.
[19] M. Costa, G. Viana, L.F.M. da Silva, R.D.S.G. Campilho, Effect of humidity on themechanical properties of adhesively bonded aluminium joints, Proc. IMechEPart L: J. Mater.: Des. Appl. (2016), http://dx.doi.org/10.1177/1464420716645263.
[20] L. Goglio, M. Rezaei, Degradation of epoxy-steel single lap joints immersed inwater, J. Adhes. 91 (2015) 621–636.
[21] D. ASTM, 3433–99, Standard Test Method for Fracture Strength in Cleavage ofAdhesives in Bonded Metal Joints, 2005.
[22] S.A.P. Limited, SikaPower�-4720, in: Sika� (Ed.), 2014.[23] M. Costa, G. Viana, C. Canto, L. da Silva, M. Banea, F. Chaves, R. Campilho,
A. Fernandes, Effect of the size reduction on the bulk tensile and doublecantilever beam specimens used in cohesive zone models, Proc. IMechEPart L: J. Mater.: Des. Appl. (2015), http://dx.doi.org/10.1177/1464420715610248.
[24] J.P.R. Monteiro, R.D.S.G. Campilho, E.A.S. Marques, L.F.M.d. Silva, Experimentalestimation of the mechanical and fracture properties of a new epoxy adhesive,Appl. Adhes. Sci. 3 (2015) 1–17.
[25] L. Greenspan, Humidity fixed-points of binary saturated aqueous-solutions, J.Res. Natl. Bur. Stand. A Phys. Chem. 81 (1977) 89–96.
[26] A. Wexler, S. Hasegawa, Relative humidity-temperature relationships of somesaturated salt solutions in the temperature range 0-degree to 50-degrees-C, J.Res. Natl. Bur. Stand. 53 (1954) 19–26.
[27] D.F.O. Braga, L.M.C. de Sousa, V. Infante, L.F.M. da Silva, P.M.G.P.Moreira, Aluminium friction-stir weld-bonded joints, J. Adhes. 92 (2016)665–678.
[28] D.F.O. Braga, L.F.M. da Silva, P.M.G.P. Moreira, Single lap joints numericalmodelling and comparison with experimental testing, J. Eng. 2 (2016) 11–20.
[29] L.F.M. da Silva, M.J.C.Q. Lopes, Joint strength optimization by the mixed-adhesive technique, Int. J. Adhes. Adhes. 29 (2009) 509–514.
[30] R. Kottner, R. Hynek, T. Kroupa, Identification of parameters of cohesiveelements for modeling of adhesively bonded joints of epoxy composites, Appl.Comput. Mech. 7 (2013) 137–144.
Fig. 24. Numerical R-curves for the specimens tested under mixed-mode 87�.
14 P. Fernandes et al. / Theoretical and Applied Fracture Mechanics 89 (2017) 1–15
[31] L.F.M. da Silva, G.W. Critchlow, M.A.V. Figueiredo, Parametric study ofadhesively bonded single lap joints by the Taguchi method, Int. J. Adhes.Adhes. 22 (2012) 1477–1494.
[32] F.J.P. Chaves, L.F.M. da Silva, M.F.S.F. de Moura, D.A. Dillard, Fracturemechanics tests in adhesively bonded joints: a literature review, J. Adhes. 90(2014) 955–992.
[33] M.F.S.F. de Moura, R.D.S.G. Campilho, J.P.M. Gonçalves, Crack equivalentconcept applied to the fracture characterization of bonded joints under puremode I loading, Compos. Sci. Technol. 68 (2008) 2224–2230.
[34] F.J.P. Chaves, L.F.M. da Silva, M.F.S.F. de Moura, D.A. Dillard, J.O. Fonseca,Apparatus and method for characterization of bonded joints mixed-mode I+IIfracture, in: Provisional Patent Application Portuguese, No. 107188 B, 2013.
[35] F.J.P. Chaves, M.F.S.F. de Moura, L.F.M. da Silva, D.A. Dillard, Numericalvalidation of a crack equivalent method for mixed-mode I plus II fracturecharacterization of bonded joints, Eng. Fract. Mech. 107 (2013) 38–47.
[36] M.D. Banea, L. Da Silva, R. Campilho, The effect of adhesive thickness on themechanical behavior of a structural polyurethane adhesive, J. Adhes. 91 (2015)331–346.
[37] M.L. Benzeggagh, M. Kenane, Measurement of mixed-mode delaminationfracture toughness of unidirectional glass/epoxy composites with mixed-modebending apparatus, Compos. Sci. Technol. 56 (1996) 439–449.
[38] G. Stamoulis, N. Carrere, J.Y. Cognard, P. Davies, C. Badulescu, On theexperimental mixed-mode failure of adhesively bonded metallic joints, Int. J.Adhes. Adhes. 51 (2014) 148–158.
[39] G. Viana, M. Costa, M.D. Banea, L.F.M. da Silva, Behavior of environmentallydegraded epoxy adhesives as a function of temperature, J. Adhes. (2016).
[40] M. Banea, L. Da Silva, R. Campilho, Mode I fracture toughness of adhesivelybonded joints as a function of temperature: experimental and numericalstudy, Int. J. Adhes. Adhes. 31 (2011) 273–279.
[41] S. Sugiman, A. Crocombe, I. Aschroft, Modelling the static response of unagedadhesively bonded structures, Eng. Fract. Mech. 98 (2013) 296–314.
[42] J.A.B.P. Neto, R.D.S.G. Campilho, L.F.M. da Silva, Parametric study of adhesivejoints with composites, Int. J. Adhes. Adhes. 37 (2012) 96–101.
[43] V. ABAQUS, 6.14 Documentation, Dassault Systemes Simulia Corporation,2014.
P. Fernandes et al. / Theoretical and Applied Fracture Mechanics 89 (2017) 1–15 15


PAPER 7


1
A new cohesive element to model environmental degradation of
adhesive joints in the rail industry
G. Viana1, R.J.C. Carbas1,2, M. Costa2, M.D. Banea3, L.F.M. da Silva1,2,*
1Departamento de Engenharia Mecânica, Faculdade de Engenharia da Universidade do Porto (FEUP),
4200-465 Oporto, Portugal, Phone -22 508 14 91, Fax-22 508 22 01
2Instituto de Ciência e Inovação em Engenharia Mecânica e Engenharia Industrial (INEGI), 4200-465 Oporto,
Portugal
3Federal Centre of Technological Education in Rio de Janeiro (CEFET), Av. Maracanã, 229, Rio de Janeiro, Brazil
Abstract
This work addresses the strength of adhesive joints used in the rail industry. The capability of structural
adhesives to bond an aluminium rail used to assemble the seats inside the train is investigated. Scaled
specimens of these joints were mechanically tested under a wide range of temperatures (from -40oC to
80oC) before and after ageing in distilled water in order to simulate real life conditions.
A three dimension numerical simulation was carried out to understand the magnitude of stresses present
in the adherends and in the adhesive layer. A new developed cohesive element was used along with the
finite element method to predict the behaviour of an adhesive joint after environmental degradation.
Results show that even though a phosphoric acid anodization was applied to the adherends, some
specimens suffered interfacial rupture. A new cohesive zone element was developed and was used to
predict cohesive failure of the adhesive. The model gave accurate results and was able to successfully
predict cohesive failure of every joint that failed cohesively in the adhesive layer.
Keywords: moisture degradation; temperature degradation; numerical simulation, cohesive zone models
1. Introduction
Structural adhesives are increasingly being used in the transport industry. They allow for light weight
vehicles, energy savings and reduced emissions. The main advantages include more uniform load
distribution, higher fatigue resistance than other traditional joining methods and the ability to join
dissimilar materials [1]. Also, due to their high vulnerability to stress concentration, the only viable way
to join composite materials, such as fiber reinforced plastic, is with a structural adhesive [2]. However,
moisture and temperature degradation are major setbacks in their wide implementation [3], as these
materials are very moisture and temperature sensitive.
* Corresponding author. Tel.: +351 22 508 17 06; fax: +351 22 508 14 45.
E-mail address: [email protected] (L. F. M. da Silva).

2
Moisture degradation of adhesives includes reduction of modulus and strength and increase in ductility [4,
5, 6, 7, 8]. The deleterious effects are greater in adhesive joints as the degradation of the adhesive-
adherend interface may cause interfacial failure [9]. The fracture toughness of the adhesive may also
increase or decrease, depending on the environmental conditions the adhesive is subjected to [10, 11].
The water diffusion in adhesives is frequently controlled by the Fick’s laws. Fickian sorption happens
when the diffusion is much slower than relaxation. Although fickian diffusion is the most common uptake
behavior in adhesives, non-fickian diffusion is not uncommon. Other models have been developed, such
as the dual fickian diffusion [12], delayed dual fickian [13] and the Langmuir model [14]. In many cases
the water uptake may be fickian under certain environmental situations and non-fickian under others.
Generally non fickian behaviour is more prone to happen at higher temperatures, higher relative humidity
and smaller thicknesses of bulk adhesive specimens. There is also evidence that while a bulk adhesive
may have a fickian diffusion behaviour, the same adhesive in a joint may have a different water uptake
behaviour [15].
The rate at which the water is absorbed and the maximum water uptake depend on environmental factors,
such as the relative humidity [14, 16], temperature [14, 17, 18, 19], the adhesive thickness [12, 20] and
the stress state of the adhesive [21, 22].
As water diffuses into the adhesive, some of this moisture becomes bound water. Bound water generally
increases with exposure time and temperature [23, 24]. Unlike the free water that occupies the free space
of the adhesive, this bound water is responsible for the volumetric changes that are observed in adhesives
under high humidity environments, which may cause residual stresses in adhesive joints [12, 25, 26, 27].
Type I bound water acts as a plasticizer, increasing the chains segment mobility. It is responsible for
decreasing the glass transition temperature (Tg) [23]. If the temperature is high and the exposure time is
long, type II bound water may also occur. This type of bound water is responsible for creating secondary
cross-linking [24], which lessens the extent of Tg depression [23]. While type I bound water can be
removed at low temperature, in order to remove type II bound water, the adhesive must be subjected to
relatively high temperatures [23]. Although moisture degradation of adhesive joints is in most cases
largely reversible, in some cases, where chemical degradation occurs, the adhesive may recover its
original strength after drying [7, 8].
Some studies report that water diffusion in an adhesive joint is much faster than water diffusion through
the bulk adhesive alone either due to stress enhanced diffusion [15] or due to water penetrating through
the interface between the adhesive and the adherend [28]. Often it is very difficult to predict when an
adhesive joint is fully saturated because thin bondlines do not absorb enough water to be measured by
common precision scales. Alternative methods to measure the water diffusing through the adhesive in an
adhesive joint have been proposed [15, 28, 29].
The main factor affecting the strength of adhesive joints under high and low temperatures is the creation
of residual thermal stresses, due to mismatch between the coefficients of thermal expansion (CTE) of
adherends and adhesive. This is even more important if the adherends have very dissimilar CTEs. At
lower temperatures adhesives are normally stronger. However this does not necessarily mean that the

3
adhesive joint should be stronger [30] as the adhesive is normally also less ductile. With less ductility two
problems arise: there are higher thermal stresses, especially if the substrates are made of different
materials and if there is a great mismatch between the CTE of the adhesive and the CTE of the adherends.
At high temperatures the opposite occurs: mismatch between the CTEs of the adhesive and adherends is
not very important as the adhesive is usually very ductile. The adhesive is, however, not very strong,
which results in low strength of the joint.
Tough the strength and ductility of adhesives may vary considerably with temperature, the toughness does
not. Actually, below Tg the toughness of structural adhesives is roughly constant because at low
temperature the lack of ductility is compensated by the increased strength and at high temperature the
opposite occurs. However, above Tg there is a sharp decrease in toughness [31]. Therefore, structural
adhesive joints should not be used when there is the possibility of the service temperature to rise above
Tg.
Although the separate effect of moisture and temperature on the mechanical properties of epoxy
adhesives is now-a-days relatively well understood, very few studies focus on the mechanical properties
of aged adhesives at high and low temperatures [32, 33]. This work aims at shedding light on this subject.
This will allow for a more accurate long term prediction of the mechanical behaviour of adhesive joints.
In this study, the ability of a rail used in the rail industry to withstand peel loads was assessed. This joint
was tested after and before environmental exposure at 40oC, 23oC and 80oC, which covers the range of
temperatures required for the rail industry. A cohesive element that considers moisture and temperature
degradation of the adhesive layer was developed and used to predict the mechanical behaviour of the
studied adhesive joint.
2. Materials
2.1 Adhesives
Two adhesives which were recommended by Sika® and Nagase® for this durability study were selected:
The epoxy adhesive XNR 6852-1, supplied by NAGASE CHEMTEX® (Osaka, Japan). This
adhesive is a one-part system that cures at 150oC for 3 h;
The epoxy adhesive SikaPower 4720 was, supplied by SIKA® (Portugal, Vila Nova de Gaia).
This adhesive is a two-part system that cures at room temperature for 24 hours.
A very important parameter to take into account when testing adhesive joints, especially when the joint is
subjected to high temperatures, is the adhesive’s Tg. This temperature is usually high when the adhesive
is dry but normally decreases when the adhesive is exposed to moist environments [23]. The Tg of both
adhesives before and after ageing was determined in a previous study [4]. Results showed the Tg of XNR
6852-1 not to be very moisture sensitive. SikaPower 4720, on the other hand, is very moisture dependent,
and its Tg when aged in distilled water is actually lower than room temperature (see Figure 1), which

4
brings severe consequences on its strength and modulus as well as in its water uptake (32.5% at 32.5oC
when aged in distilled water versus only 3.8% when aged in salt water).
Figure 1: Tg of both adhesives studied [4]: a- XNR 6852-1 b- SikaPower 4720
2.2 Substrates
The rail that is represented in Figure 2-a is used to assemble the seats of a train to the floor. In order to
attach this rail, bolts or rivets are used. This method, however, introduces stress concentration at the holes
where the fasteners are attached and reduces its fatigue resistance. The ability of using adhesive bonding
instead of mechanical fastening is studied in this paper. This method can reduce the cost of structures, as
it can be more easily automatized.
As this substrate is too large to be tested in common universal test machines, a reduced specimen was
produced (represented in Figure 3) . Because this kind of profile, which is produced by extrusion, is not
available in small dimensions, an alternative profile was made. This was achieved by machining a
rectangular shaped profile. The original profile and the test specimen dimensions and geometry can be
seen in Figure 2-b. A thread was drilled at one end of the reduced specimen to allow assembly with the
test machine. This profile was bonded to a rigid 8 mm thick aluminium plate, which simulates the train
floor.
0
20
40
60
80
100
120
140
Tg (
oC
)
Distilled water Salt water Dry
0
20
40
60
80
100
120
140
Tg (
oC
)
Distilled water Salt water Dry
a b

5
A b
Figure 2: Geometry of a rail used to assemble seats to the train floor (dimensions in millimetres): a-original geometry (length=2000mm) b-reduced geometry (length=40mm)
Figure 3: Isometric view of the reduced specimen used in this study.

6
3. Developed cohesive element
The cohesive element that was developed in this study is based on the element developed by Camanho et
al [34]. This is a three dimensional, eight node, zero thickness element that is capable of simulating pure
and mixed mode decohesion. This element utilises a triangular cohesive zone law (see Figure 4) to model
decohesion between two substrates.
A high initial stiffness (K) is used to hold the top and bottom faces of decohesion element together in the
linear elastic range until the yield stress is reached. After this, softening starts and the load decreases
linearly until zero. The toughness of the adhesive is given by the area of the triangle.
Figure 4: Pure mode cohesive law used in the element proposed in this study.
Modifications were made to this element to make it take into consideration the environmental temperature
and absorbed moisture by the adhesive. The element reads the moisture field of the adhesive layer and
attributes the yield stress and toughness of the adhesive according to the read moisture and environmental
temperature.
The moisture and temperature dependent cohesive properties of the adhesives studied were determined in
previous studies [35, 36]. Empirical formulas were used to fit the toughness and yield stress of the
adhesive as a function of temperature and moisture. Properties of adhesive XNR6852 was approximated
using the following formulas:
𝑇𝑔 = 117.4 − 8.23(𝑀)4 Eq. 1
𝜎𝑦 = −15.4 − 0.75(𝑇 − 𝑇𝑔) Eq. 2
𝐺𝑐 = 8.46 − 2.27 × 10⁻⁴(𝑇 − 𝑇𝑔)2
Eq. 3
The following formulas were used with SikaPower 4720:
𝑇𝑔 = 91.7 − 2.50(𝑇 − 𝑇𝑔) Eq. 4
𝜎𝑦 = 18 − 0.26(𝑇 − 𝑇𝑔) Eq. 5
𝐺𝑐 = 0.22 − 9.7 × 10⁻³(𝑇 − 𝑇𝑔) Eq. 6
δ
σ
σmax
K GC

7
In which 𝜎𝑦 is the yield stress of the adhesive, 𝑇 is the environmental temperature, 𝑇𝑔 is the glass
transition temperature, 𝐺𝑐 is the fracture toughness and 𝑀 is the moisture percentage absorbed by the
adhesive. Figure 5 shows the variation of the properties with 𝑇𝑔 and the comparison with experimental
values. The variation of the adhesives’ Tg and mechanical properties are graphically represented in Figure
5 and Figure 6 respectively.
a b
Figure 5: Variation of Tg with moisture absorbed by the adhesive.
As Figure 5 shows, the evolution of the Tg of NXR6852 with moisture concentration is not linear. In this
study, a polynomial function was used to approximate the Tg of this adhesive as a function of its moisture
absorption. This function matches the experimental values almost perfectly.
However, the evolution of the Tg of SikaPower 4720 with temperature is closer to a straight line. The Tg
of this adhesive after exposure in distilled water is lower than the exposure temperature, which in turn
affects the amount of water that is absorbed by the adhesive. Nevertheless, a straight line was used to
predict the Tg of SikaPower 4720.
100
105
110
115
120
0 0.2 0.4 0.6 0.8 1 1.2
T g(o
C)
Moisture absorption (%)
y = -2.4991x + 91.705
0
20
40
60
80
100
120
0 10 20 30 40
Tg (
oC
)
Moisture absorption (%)

8
Figure 6: Variation of the yield stress and mode I fracture toughness of both adhesives with T-Tg: Column a: Variation of yield stress
Column b: Variation of mode I fracture toughness
Row 1: Joints with adhesive XNR6852
Row 2: Joints with adhesive SikaPower 4720
The properties of the adhesives were assumed to be dependent on the difference between the test
temperature and Tg. Moisture absorbed by the adhesive will have the effect of decreasing the adhesive’s
Tg and indirectly affecting the adhesive’s properties. This is in line with other studies [37]. In this study,
the evolution of the yield stress of both adhesives was considered to be linear, while the evolution of the
fracture toughness was modelled with a fourth degree polynomial equation and with a straight line for
XNR6852 and SikaPower4720 respectively.
a b
1
2
0
20
40
60
80
100
120
140
-180 -130 -80 -30
Yie
ld s
tre
ss (
MP
a)
T-Tg (oC)
0
2
4
6
8
10
-180 -130 -80 -30
GIC
(N/m
m)
T-Tg (oC)
0
10
20
30
40
50
60
-180 -80 20 120
Yie
ld s
tre
ss (
MP
a)
T-Tg (oC)
0.2
0.4
0.6
0.8
1
1.2
1.4
1.6
-150 -100 -50 0
GIC
(N/m
m)
T-Tg (oC)

9
SikaPower 4720 was, under certain environmental conditions, tested above its Tg, which makes the
prediction of its cohesive properties a harder task, as there probably is a discontinuity in the mechanical
properties around Tg.
It is important to notice that the values obtained for the fracture toughness correspond only to cohesive
fracture of the adhesive.
4. Experimental procedure
4.1 Specimen fabrication
Prior to bonding, the surfaces of the substrates were abraded with 80 grit SiC sandpaper, cleaned in an
ultrasonic acetone bath and phosphoric acid anodized. Less than a day after being anodised, the specimens
were bonded and left to cure for 3h at 150oC or for 24h at room temperature, according to the indication of
the manufacturer of each adhesive used. After the cure cycle, the excess adhesive was removed and the
specimens were left to dry for at least 3 weeks in a dry desiccator. After this time, the specimens of each
adhesive were divided into two groups:
Dry specimens, which were ready to be tested;
Specimens aged in a saturated aqueous solution of NaCl at 32.5oC;
Specimens aged in distilled water at 32.5oC.
As explained above, specimens with reduced dimensions were used. This allowed time efficient production
and ageing.
4.2 Test procedure
After all specimens had been produced and dried in a dry desiccator, they were separated into the three
different groups mentioned in the previous section. Each specimen was left to cure for at least two weeks.
After this time, the dry specimens were ready to be tested. Specimens to be aged were placed in their
respective ageing environment for 14 days. This ensured that the bondline was not completely saturated
and a gradient in adhesive moisture was present, as demonstrated in section 6.2.
Some studies report that water diffusion in an adhesive joint is much faster than water diffusion through
the bulk adhesive alone either due to stress enhanced diffusion [15] or due to water penetrating through
the interface between adhesive and adherend [28] or due to stress-enhanced diffusion [15]. Often it is very
difficult to predict when an adhesive joint is fully saturated because the thin bondlines do not absorb
enough water to be measured by common precision scales.
In order to determine when the specimens reached saturation, some DCB specimens of each adhesive
were tested periodically until their toughness stabilized. It was concluded that the specimens needed 13
weeks to be fully saturated. The results of this study were published elsewhere [29].
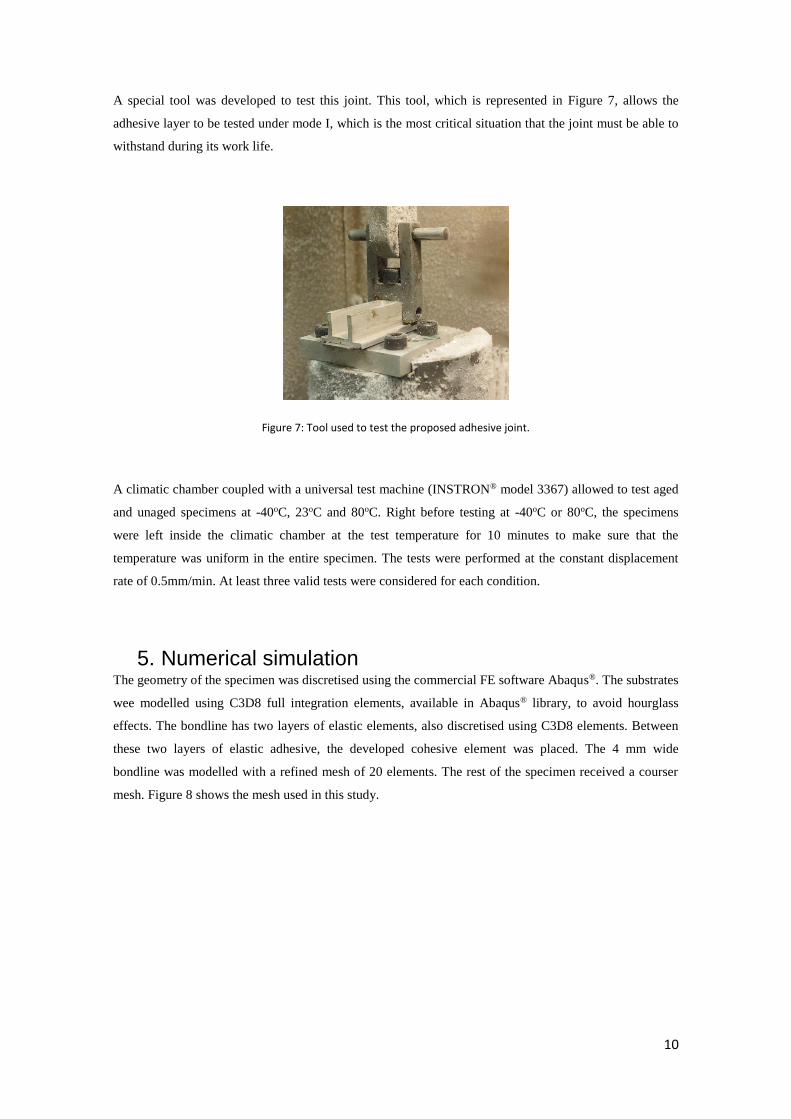
10
A special tool was developed to test this joint. This tool, which is represented in Figure 7, allows the
adhesive layer to be tested under mode I, which is the most critical situation that the joint must be able to
withstand during its work life.
Figure 7: Tool used to test the proposed adhesive joint.
A climatic chamber coupled with a universal test machine (INSTRON® model 3367) allowed to test aged
and unaged specimens at -40oC, 23oC and 80oC. Right before testing at -40oC or 80oC, the specimens
were left inside the climatic chamber at the test temperature for 10 minutes to make sure that the
temperature was uniform in the entire specimen. The tests were performed at the constant displacement
rate of 0.5mm/min. At least three valid tests were considered for each condition.
5. Numerical simulation The geometry of the specimen was discretised using the commercial FE software Abaqus®. The substrates
wee modelled using C3D8 full integration elements, available in Abaqus® library, to avoid hourglass
effects. The bondline has two layers of elastic elements, also discretised using C3D8 elements. Between
these two layers of elastic adhesive, the developed cohesive element was placed. The 4 mm wide
bondline was modelled with a refined mesh of 20 elements. The rest of the specimen received a courser
mesh. Figure 8 shows the mesh used in this study.

11
Figure 8: Mesh used in the model.
Due to the symmetry of the specimen, in order to decrease the computational effort, only half of the
specimen was modelled. The corresponding boundary conditions were:
1. Every displacement in the down substrate was set to zero;
2. A displacement of 0.5 mm was applied to the loading area of the upper substrate;
3. Displacements in the y and x directions of the middle plane were set to zero.
Figure 9: Border condition applied in the FE model.
The numerical prediction of the mechanical behaviour of the tested adhesive joints was made in two
stages:
1. Prediction of the moisture gradient across the width of the adhesive taking into account the
properties of each adhesive, determined in previous studies [29, 35]. The moisture of each
individual element was calculated.
2. Taking into account the moisture of each element calculated in the previous step, the moisture
and temperature dependent properties were attributed to each element. This resulted into each
z
x
y
δ

12
element being assigned a distinct set of properties corresponding to a bondline with graded
properties.
6. Results and discussion
6.1 Experimental results
Two types of failure mode were observed: cohesive failure and adhesive failure. Adhesive failure
occurred in every environmentally exposed specimen, independently of the test temperature. Examples of
failure surfaces of each type of mode of failure can be seen in Figure 10 bellow.
a b
1
2
Figure 10: Mode of failure obtained in this study: Column a: Cohesive failure
Column b: Adhesive failure
Row 1: Joints with adhesive SikaPower 4720
Row 2: Joints with adhesive XNR6852
The average failure load of each kind of specimen is shown in Figure 11 bellow.

13
a
b
Figure 11: Failure load of joints bonded with:
a- XNR6852
b- SikaPower 4720
Bars in lighter shade correspond to adhesive failure of the specimen, while bars with darker shade correspond
to cohesive failure of the adhesive.
0
0.5
1
1.5
2
2.5
3
3.5
4
4.5
5
Join
t st
ren
gth
(kN
)
Experimental
Numerical
0
0.5
1
1.5
2
2.5
3
3.5
Join
t st
ren
gth
(kN
)
Experimental
Numerical

14
Generally, unexposed specimens had higher failure loads than exposed specimens. This is because:
1. Exposed specimens suffered adhesive failure, which typically results into lower failure loads;
2. Due to the plasticizing effect of water, the adhesive becomes weaker, but more ductile, after
exposure.
Higher temperatures were also responsible for decreasing the joint strength due to the lower strength of
adhesives at these temperatures. This was more apparent in SikaPower joints than in XNR6852 joints
probably because SikaPower at 80oC is above or very close to its Tg.
6.2 Prediction of water uptake
The water uptake of each adhesive was computed using the finite element method. Details of the
simulation can be found in a previous study [29]. Because the length of the adhesive layer is much longer
than the width, moisture uptake in the longitudinal direction can be neglected [38, 39]. This results into a
symmetric moisture distribution along the middle of the adhesive layer.
According to the moisture profile that was computed, a different value of absorbed moisture was
attributed to each cohesive element. The moisture absorption was discretised into one value for each
element across the width of the adhesive layer. Due to the symmetry, only half of the adhesive layer was
considered. Results are shown in Figure 12 and Figure 13.
Figure 12: Moisture distribution in the XNR specimens after exposure.
0.4
0.5
0.6
0.7
0.8
0.9
1
1.1
1.2
0 0.5 1 1.5 2
% W
ate
r u
pta
ke
Distance to the center of the adhesive layer (mm)
Salt water exposure
Distiled water exposure
Distilled water exposure(discretisation)
Salt water exposure(discretisation)

15
a b
Figure 13: Moisture distribution in SikaPower specimens after exposure.
From Figure 12 and Figure 13 above, it can be noted that water uptake across the width of the adhesive
layer is not constant. This is because the specimens were not exposed long enough to allow full saturation
of the adhesive. Water uptake of distilled water exposed SikaPower 4720 specimens is higher than the
remaining specimens’. This is due to the high moisture dependent Tg of this adhesive. Under high
moisture conditions, the Tg of this adhesive is lower than the exposure temperature, which has a great
effect on this adhesive’s moisture uptake [35].
6.3 Prediction of the mechanical strength of dry and exposed
specimens
Generally, results of the numerical model using the developed cohesive element matched the
experimental results accurately. Figure 14 shows an example of such prediction.
0
5
10
15
20
25
30
35
0 1 2
% W
ate
r u
pta
ke
Distance to the center of the adhesive layer (mm)
0
0.5
1
1.5
2
2.5
3
3.5
4
0 1 2
% W
ate
r u
pta
ke
Distance to the center of the adhesive layer (mm)

16
Figure 14: Comparison between experimental and numerical results of unexposed XNR6852specimen tested at 23oC.
However, because environmentally exposed specimens suffered adhesive failure, the numerical model
could not make a good prediction of these specimens, as it only accounts for cohesive failure. Figure 14
shows the comparison between numerical and experimental results.
From Figure 11, it is possible to understand that the numerical predictions of unexposed specimens
matched well with the experimental results except when the XNR6852 joints were tested at 80oC. This is
due to the mechanical properties attributed to the adhesive at 80oC. Obviously the adhesive in an adhesive
joint is subjected to higher strain rate than a bulk adhesive if similar cross head speeds are applied. This
means that the yield stress of an adhesive determined with a dogbone bulk specimen must be lower than
the actual yield stress of an adhesive in an adhesive joint, especially if the adhesive is very ductile and
strain rate dependent, such as XNR6852 at high temperature [40]. As the yield strength of the adhesives
was determined using bulk dogbone tensile specimens, the strength of the adhesive as calculated by the
model is in average lower than the actual strength of the adhesive in a joint, consequently making very
conservative predictions if the adhesive is highly strain rate dependent. This could be corrected by simply
determining the strength of the adhesive in a joint and adapting the parameters of the equations presented
in section 3.
Numerical predictions for -40oC give roughly the same value for exposed and unexposed conditions. This
is because the adhesive is not as affected by environmental humidity at lower temperatures, as it was
found in a previous study [35].
It is interesting how salt water exposed XNR6852 specimens had a failure load that was lower than
distilled water exposed specimens. Similar behaviour has been witnessed in a previous study [36]. It is
thought that, although distilled water is the most aggressive environment for the adhesive, salt water was
probably responsible for corrosion of the substrate, resulting in lower interfacial strength.
0
1
2
3
4
5
0 0.1 0.2 0.3 0.4 0.5 0.6 0.7
Load
(kN
)
Displacement (mm)
Experimental Numerical

17
It was found in a previous study that at lower temperatures, exposed adhesive bonded joints were less
likely to suffer adhesive failures than at higher temperatures [36].
7. Conclusion
In this study, adhesive joints used in the railway industry were subjected to different temperature and
moisture environments. Results show that generally lower temperatures result into higher strength of the
joint. Moisture is responsible for shifting the locus of failure from the adhesive to the interface between
adhesive and adherend.
A cohesive element that takes into account moisture and temperature degradation of adhesive joints was
developed and used in this study. In the numerical model, the moisture absorption of each cohesive
element is considered to make a prediction of the failure load of the joint. Good correlation between the
failure load of specimens that suffered cohesive failure in the bondline and results provided by the
numerical model was found.
Aknowledgements
The authors would like to thank Sika for supplying the SikaPower 4720 adhesive and Nagase Chemtex
for supplying the XNR 6852-1 adhesive. This study was financed by the Fundação para a Ciência e
Tecnologia through grant EXCL/EMS-PRO/0084/2012.

18
References
1. Banea MD, da Silva LFM, Campilho RDSG, Sato C. Smart Adhesive Joints: An Overview of Recent
Developments. J Adhesion. 2014;90:16-40.
2. Banea MD, da Silva LFM. Adhesively bonded joints in composite materials: an overview. Proceedings of
the Institution of Mechanical Engineers, Part L: Journal of Materials: Design and Applications. 2009;223:1-18.
3. Marques EAS, da Silva LFM, Banea MD, Carbas RJC. Adhesive Joints for Low- and High-Temperature
Use: An Overview. J Adhesion. 2015;91:556-85.
4. Costa M, Viana G, da Silva LFM, Campilho RDSG. Environmental effect on the fatigue degradation of
adhesive joints: A review. The Journal of Adhesion. 2016;93:127-46.
5. Sugiman S, Crocombe AD, Aschroft IA. Experimental and numerical investigation of the static response of
environmentally aged adhesively bonded joints. Int J Adhes Adhes. 2013;40:224-37.
6. Hua Y, Crocombe AD, Wahab MA, Ashcroft IA. Modelling environmental degradation in EA9321-bonded
joints using a progressive damage failure model. J Adhesion. 2006;82:135-60.
7. Barbosa AQ, da Silva LFM, Ochsner A. Hygrothermal aging of an adhesive reinforced with microparticles
of cork. J Adhes Sci Technol. 2015;29:1714-32.
8. Lin YC, Chen X. Moisture sorption-desorption-resorption characteristics and its effect on the mechanical
behavior of the epoxy system. Polymer. 2005;46:11994-2003.
9. Kinloch AJ, Little MSG, Watts JF. The role of the interphase in the environmental failure of adhesive
joints. Acta Mater. 2000;48:4543-53.
10. Fernandes P, Viana G, Carbas R, Costa M, da Silva L, Banea M. The Influence of Water on the Fracture
Envelope of an Adhesive Joint. Theoretical and Applied Fracture Mechanics. 2017;89.
11. Rodrigues T, Chaves F, Silva LFMd, Costa M, Barbosa A. Determination of the fracture envelope of an
adhesive joint as a function moisture. Materialwissenschaft und Werkstofftechnik. 2017;48:1181-90.
12. Loh WK, Crocombe AD, Wahab MMA, Ashcroft IA. Modelling anomalous moisture uptake, swelling and
thermal characteristics of a rubber toughened epoxy adhesive. Int J Adhes Adhes. 2005;25:1-12.
13. Mubashar A, Ashcroft IA, Critchlow GW, Crocombe AD. Moisture absorption-desorption effects in
adhesive joints. Int J Adhes Adhes. 2009;29:751-60.
14. Ameli A, Datla NV, Papini M, Spelt JK. Hygrothermal Properties of Highly Toughened Epoxy Adhesives.
J Adhesion. 2010;86:698-725.
15. Liljedahl CDM, Crocombe AD, Gauntlett FE, Rihawy MS, Clough AS. Characterising moisture ingress in
adhesively bonded joints using nuclear reaction analysis. Int J Adhes Adhes. 2009;29:356-60.
16. Vanlandingham MR, Eduljee RF, Gillespie JW. Moisture diffusion in epoxy systems. J Appl Polym Sci.
1999;71:787-98.
17. Suh DW, Ku MK, Nam JD, Kim BS, Yoon SC. Equilibrium water uptake of epoxy/carbon fiber composites
in hygrothermal environmental conditions. J Compos Mater. 2001;35:264-78.
18. Shanahan MER, Auriac Y. Water absorption and leaching effects in cellulose diacetate. Polymer.
1998;39:1155-64.
19. Xiao GZ, Shanahan MER. Water absorption and desorption in an epoxy resin with degradation. J Polym Sci
Pol Phys. 1997;35:2659-70.
20. Y.C. Lin XC. Moisture sorption–desorption–resorption characteristics and its effect on the mechanical
behavior of the epoxy system. Polymer. 2005:11994–2003.
21. X. Han ADC, S. N. R. Anwar, P. Hu and W. D. Li. The Effect of a Hot–Wet Environment on Adhesively
Bonded Joints Under a Sustained Load. The Journal of Adhesion. 2014;90:420-36.
22. Liljedahl CDM, Crocombe AD, Wahab MA, Ashcroft IA. The effect of residual strains on the progressive
damage modelling of environmentally degraded adhesive joints. J Adhes Sci Technol. 2005;19:525-47.
23. Zhou JM, Lucas JP. Hygrothermal effects of epoxy resin. Part II: variations of glass transition temperature.
Polymer. 1999;40:5513-22.
24. Zhou JM, Lucas JP. Hygrothermal effects of epoxy resin. Part I: the nature of water in epoxy. Polymer.
1999;40:5505-12.
25. Adamson MJ. Thermal-Expansion and Swelling of Cured Epoxy-Resin Used in Graphite-Epoxy
Composite-Materials. J Mater Sci. 1980;15:1736-45.
26. Xiao GZ, Shanahan MER. Swelling of DGEBA/DDA epoxy resin during hygrothermal ageing. Polymer.
1998;39:3253-60.
27. Chiang MYM, Fernandez-Garcia M. Relation of swelling and Tg Depression to the apparent free volume of
a particle-filled, epoxy-based adhesive. J Appl Polym Sci. 2003;87:1436-44.
28. Zannideffarges MP, Shanahan MER. Diffusion of Water into an Epoxy Adhesive - Comparison between
Bulk Behavior and Adhesive Joints. Int J Adhes Adhes. 1995;15:137-42.
29. Viana G, Costa M, Banea MD, da Silva LFM. Water diffusion in double cantilever beam adhesive joints.
Latin American Journal of Solids and Structures. 2017;14:188-201.
30. Banea MD, Silva LFM. Mechanical Characterization of Flexible Adhesives. J Adhesion. 2009;85:261-85.
31. Banea MD, da Silva LFM, Campilho RDSG. Mode I fracture toughness of adhesively bonded joints as a
function of temperature: Experimental and numerical study. Int J Adhes Adhes. 2011;31:273-9.

19
32. Viana G, Costa M, Banea MD, da Silva LFM. A review on the temperature and moisture degradation of
adhesive joints. Proceedings of the Institution of Mechanical Engineers, Part L: Journal of Materials: Design and
Applications. 2016;231:488-501.
33. Costa M, Viana G, da Silva LFM, Campilho RDSG. Environmental effect on the fatigue degradation of
adhesive joints: a review. The Journal of Adhesion. 2016;DOI: 10.1080/00218464.2016.1179117.
34. Camanho PP, Dávila CG, Moura MFd. Numerical Simulation of Mixed-mode Progressive Delamination in
Composite Materials. J Compos Mater. 2003;37:1415 - 38.
35. Viana G, Costa M, Banea MD, da Silva LFM. Behaviour of environmentally degraded epoxy adhesives as a
function of temperature. The Journal of Adhesion. 2016;93:95-112.
36. Viana G, Costa M, Banea MD, Silva LFMd. Moisture and temperature degradation of double cantilever
beam adhesive joints. J Adhes Sci Technol. 2017;31:1824-38.
37. Jurf RA, Vinson JR. Effect of Moisture on the Static and Viscoelastic Shear Properties of Epoxy Adhesives.
J Mater Sci. 1985;20:2979-89.
38. Crocombe AD. Durability modelling concepts and tools for the cohesive environmental degradation of
bonded structures. Int J Adhes Adhes. 1997;17:229-38.
39. Crocombe AD, Hua YX, Loh WK, Wahab MA, Ashcroft IA. Predicting the residual strength for
environmentally degraded adhesive lap joints. Int J Adhes Adhes. 2006;26:325-36.
40. Viana G, Machado J, Carbas R, Costa M, Silva LFMd, Vaz M, Banea MD. Strain rate dependence of adhesive joints for the automotive industry at low and high temperatures. Int J Adhes Adhes. 2018;Submitted.
Related Documents